Elmore County, AL Map & Demographics
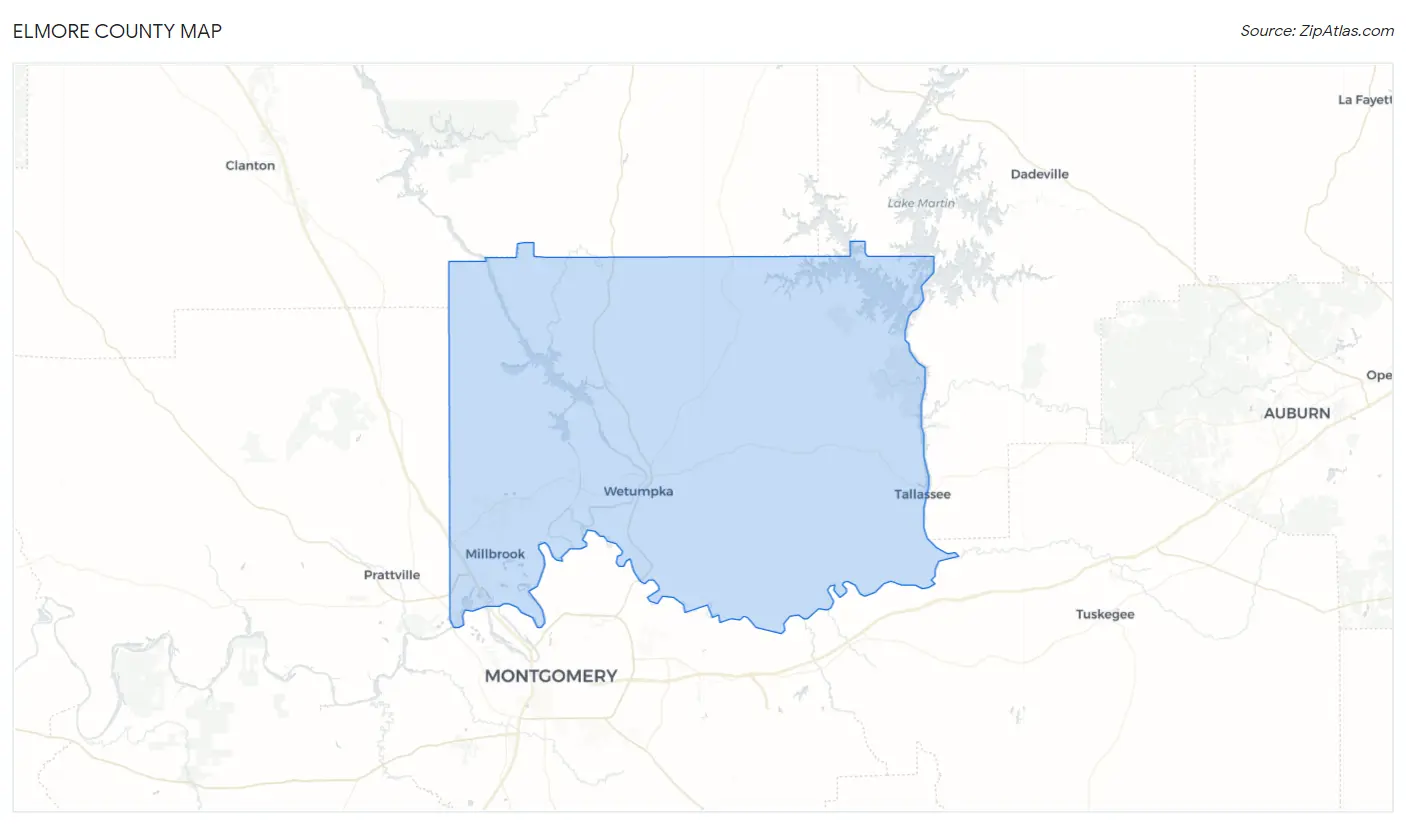
Elmore County Map
Elmore County Overview
$34,152
PER CAPITA INCOME
$84,463
AVG FAMILY INCOME
$73,258
AVG HOUSEHOLD INCOME
26.8%
WAGE / INCOME GAP [ % ]
73.2¢/ $1
WAGE / INCOME GAP [ $ ]
$10,069
FAMILY INCOME DEFICIT
0.42
INEQUALITY / GINI INDEX
87,694
TOTAL POPULATION
42,743
MALE POPULATION
44,951
FEMALE POPULATION
95.09
MALES / 100 FEMALES
105.17
FEMALES / 100 MALES
38.9
MEDIAN AGE
3.1
AVG FAMILY SIZE
2.6
AVG HOUSEHOLD SIZE
41,503
LABOR FORCE [ PEOPLE ]
58.6%
PERCENT IN LABOR FORCE
4.2%
UNEMPLOYMENT RATE
Elmore County Area Codes
Income in Elmore County
Income Overview in Elmore County
Per Capita Income in Elmore County is $34,152, while median incomes of families and households are $84,463 and $73,258 respectively.
| Characteristic | Number | Measure |
| Per Capita Income | 87,694 | $34,152 |
| Median Family Income | 23,733 | $84,463 |
| Mean Family Income | 23,733 | $100,704 |
| Median Household Income | 32,184 | $73,258 |
| Mean Household Income | 32,184 | $90,524 |
| Income Deficit | 23,733 | $10,069 |
| Wage / Income Gap (%) | 87,694 | 26.85% |
| Wage / Income Gap ($) | 87,694 | 73.15¢ per $1 |
| Gini / Inequality Index | 87,694 | 0.42 |
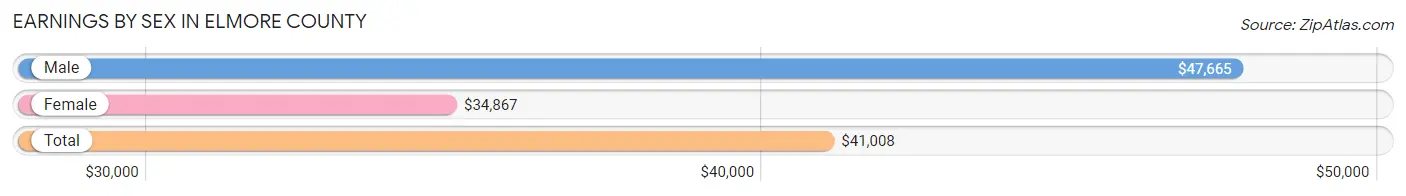
Earnings by Sex in Elmore County
Average Earnings in Elmore County are $41,008, $47,665 for men and $34,867 for women, a difference of 26.9%.
| Sex | Number | Average Earnings |
| Male | 21,048 (49.1%) | $47,665 |
| Female | 21,832 (50.9%) | $34,867 |
| Total | 42,880 (100.0%) | $41,008 |
Earnings by Sex by Income Bracket in Elmore County
The most common earnings brackets in Elmore County are $100,000+ for men (3,272 | 15.5%) and $55,000 to $64,999 for women (1,677 | 7.7%).
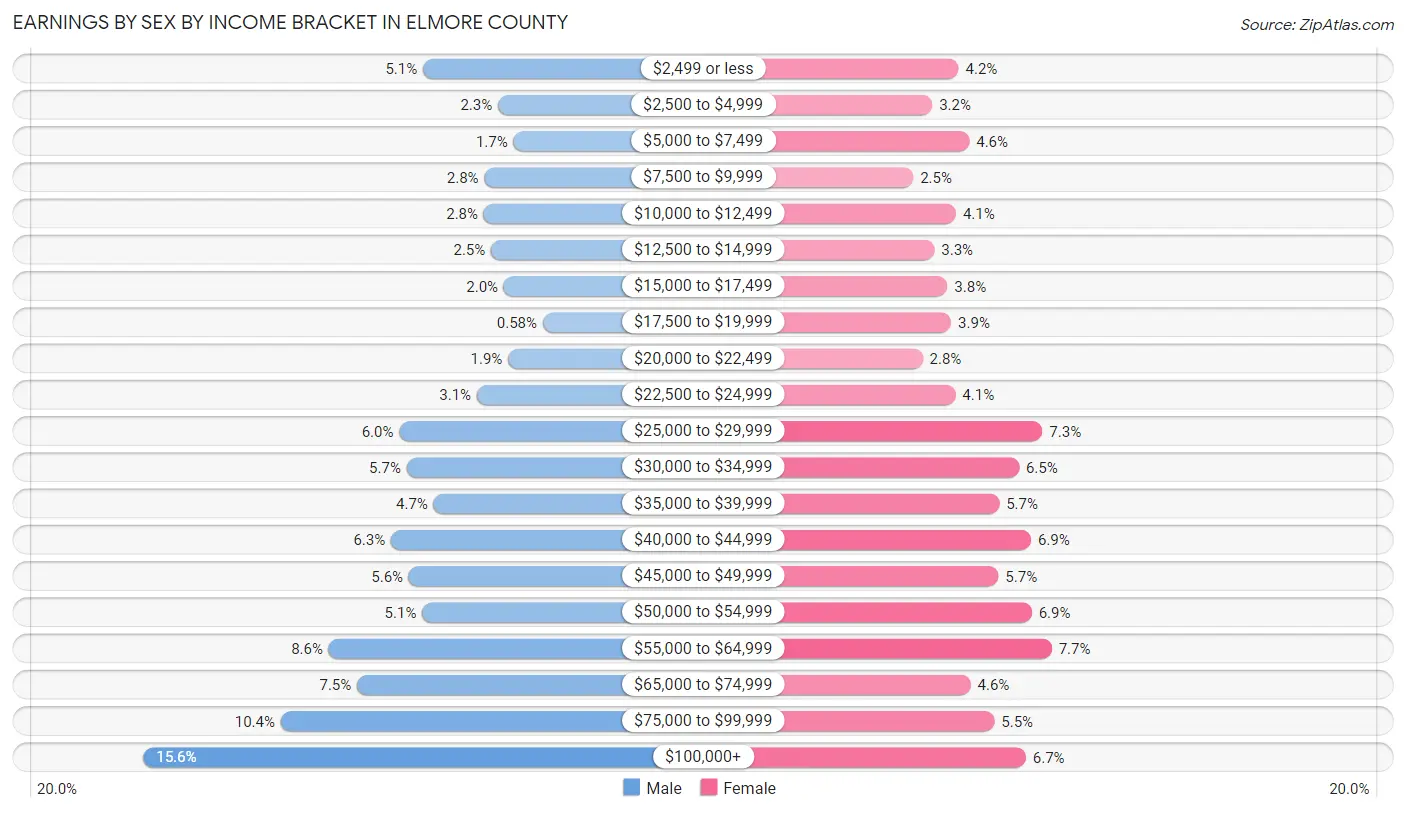
| Income | Male | Female |
| $2,499 or less | 1,067 (5.1%) | 914 (4.2%) |
| $2,500 to $4,999 | 475 (2.3%) | 699 (3.2%) |
| $5,000 to $7,499 | 354 (1.7%) | 1,001 (4.6%) |
| $7,500 to $9,999 | 582 (2.8%) | 543 (2.5%) |
| $10,000 to $12,499 | 588 (2.8%) | 894 (4.1%) |
| $12,500 to $14,999 | 531 (2.5%) | 717 (3.3%) |
| $15,000 to $17,499 | 429 (2.0%) | 822 (3.8%) |
| $17,500 to $19,999 | 123 (0.6%) | 854 (3.9%) |
| $20,000 to $22,499 | 395 (1.9%) | 620 (2.8%) |
| $22,500 to $24,999 | 642 (3.0%) | 889 (4.1%) |
| $25,000 to $29,999 | 1,255 (6.0%) | 1,601 (7.3%) |
| $30,000 to $34,999 | 1,196 (5.7%) | 1,409 (6.5%) |
| $35,000 to $39,999 | 982 (4.7%) | 1,247 (5.7%) |
| $40,000 to $44,999 | 1,320 (6.3%) | 1,506 (6.9%) |
| $45,000 to $49,999 | 1,178 (5.6%) | 1,240 (5.7%) |
| $50,000 to $54,999 | 1,073 (5.1%) | 1,513 (6.9%) |
| $55,000 to $64,999 | 1,810 (8.6%) | 1,677 (7.7%) |
| $65,000 to $74,999 | 1,588 (7.5%) | 1,013 (4.6%) |
| $75,000 to $99,999 | 2,188 (10.4%) | 1,207 (5.5%) |
| $100,000+ | 3,272 (15.5%) | 1,466 (6.7%) |
| Total | 21,048 (100.0%) | 21,832 (100.0%) |
Earnings by Sex by Educational Attainment in Elmore County
Average earnings in Elmore County are $53,768 for men and $40,168 for women, a difference of 25.3%. Men with an educational attainment of graduate degree enjoy the highest average annual earnings of $78,364, while those with less than high school education earn the least with $35,625. Women with an educational attainment of graduate degree earn the most with the average annual earnings of $64,937, while those with less than high school education have the smallest earnings of $21,731.
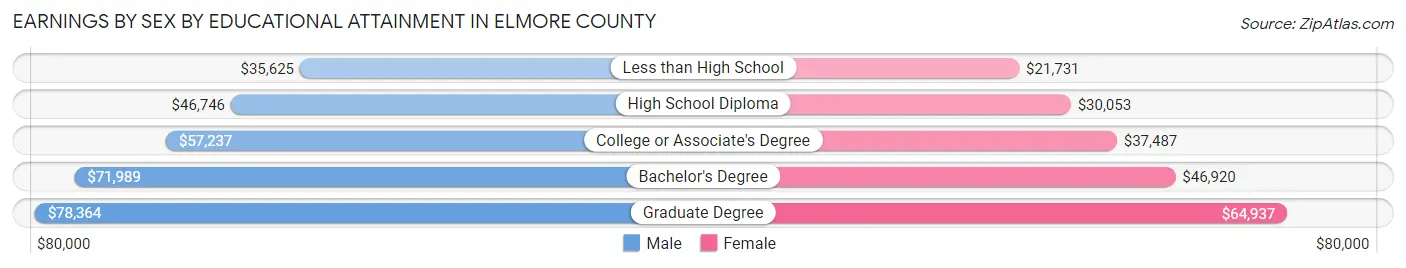
| Educational Attainment | Male Income | Female Income |
| Less than High School | $35,625 | $21,731 |
| High School Diploma | $46,746 | $30,053 |
| College or Associate's Degree | $57,237 | $37,487 |
| Bachelor's Degree | $71,989 | $46,920 |
| Graduate Degree | $78,364 | $64,937 |
| Total | $53,768 | $40,168 |
Family Income in Elmore County
Family Income Brackets in Elmore County
According to the Elmore County family income data, there are 5,292 families falling into the $100,000 to $149,999 income range, which is the most common income bracket and makes up 22.3% of all families. Conversely, the $10,000 to $14,999 income bracket is the least frequent group with only 451 families (1.9%) belonging to this category.
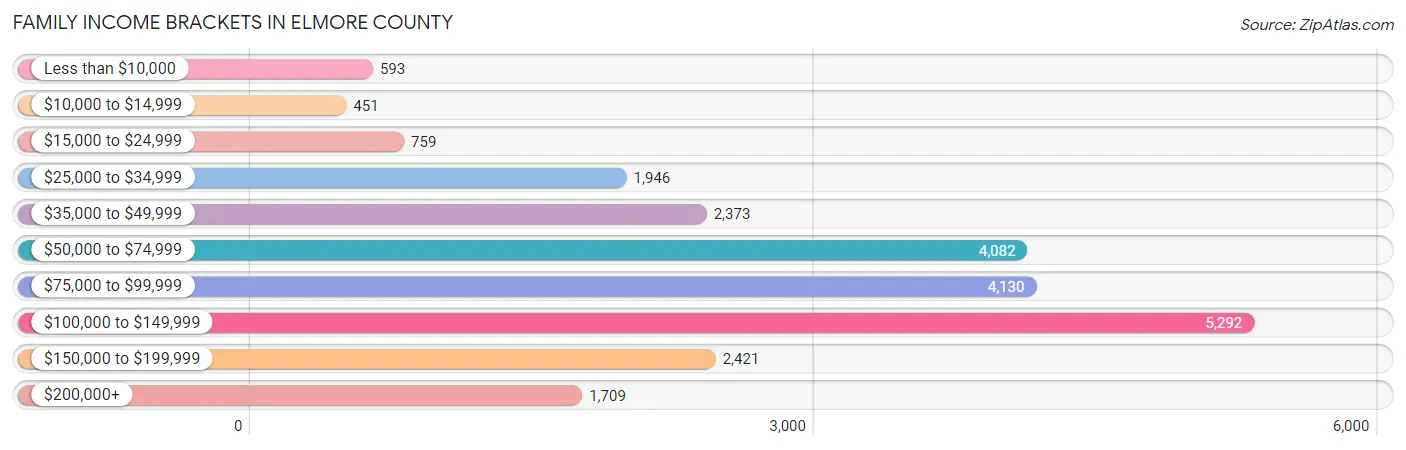
| Income Bracket | # Families | % Families |
| Less than $10,000 | 593 | 2.5% |
| $10,000 to $14,999 | 451 | 1.9% |
| $15,000 to $24,999 | 759 | 3.2% |
| $25,000 to $34,999 | 1,946 | 8.2% |
| $35,000 to $49,999 | 2,373 | 10.0% |
| $50,000 to $74,999 | 4,082 | 17.2% |
| $75,000 to $99,999 | 4,130 | 17.4% |
| $100,000 to $149,999 | 5,292 | 22.3% |
| $150,000 to $199,999 | 2,421 | 10.2% |
| $200,000+ | 1,709 | 7.2% |
Family Income by Famaliy Size in Elmore County
7+ person families (251 | 1.1%) account for the highest median family income in Elmore County with $115,375 per family, while 2-person families (11,348 | 47.8%) have the highest median income of $40,854 per family member.
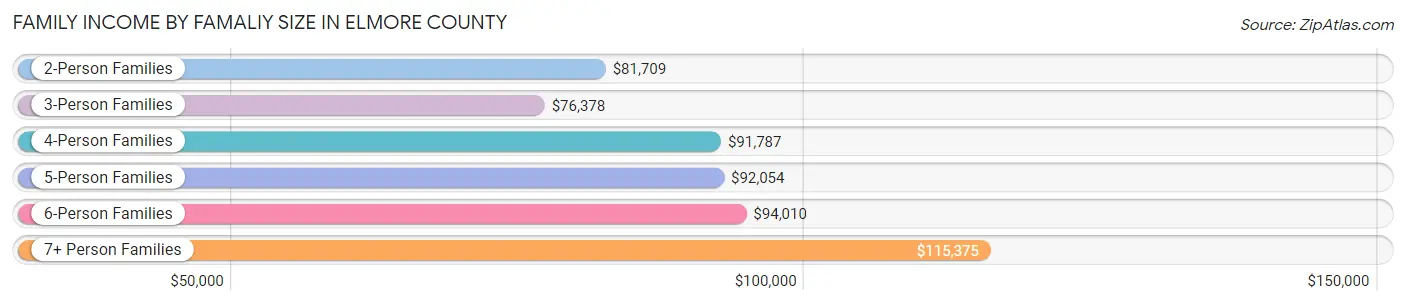
| Income Bracket | # Families | Median Income |
| 2-Person Families | 11,348 (47.8%) | $81,709 |
| 3-Person Families | 5,392 (22.7%) | $76,378 |
| 4-Person Families | 4,641 (19.6%) | $91,787 |
| 5-Person Families | 1,590 (6.7%) | $92,054 |
| 6-Person Families | 511 (2.1%) | $94,010 |
| 7+ Person Families | 251 (1.1%) | $115,375 |
| Total | 23,733 (100.0%) | $84,463 |
Family Income by Number of Earners in Elmore County
The median family income in Elmore County is $84,463, with families comprising 3+ earners (2,192) having the highest median family income of $152,902, while families with no earners (3,988) have the lowest median family income of $52,437, accounting for 9.2% and 16.8% of families, respectively.
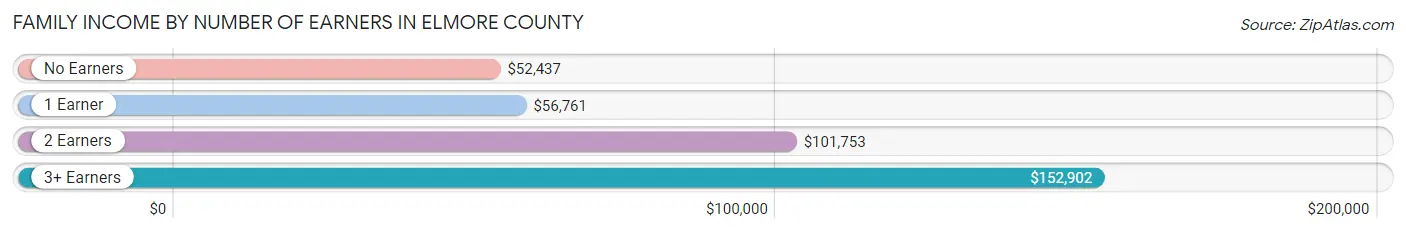
| Number of Earners | # Families | Median Income |
| No Earners | 3,988 (16.8%) | $52,437 |
| 1 Earner | 7,486 (31.5%) | $56,761 |
| 2 Earners | 10,067 (42.4%) | $101,753 |
| 3+ Earners | 2,192 (9.2%) | $152,902 |
| Total | 23,733 (100.0%) | $84,463 |
Household Income in Elmore County
Household Income Brackets in Elmore County
With 5,857 households falling in the category, the $100,000 to $149,999 income range is the most frequent in Elmore County, accounting for 18.2% of all households. In contrast, only 772 households (2.4%) fall into the $10,000 to $14,999 income bracket, making it the least populous group.
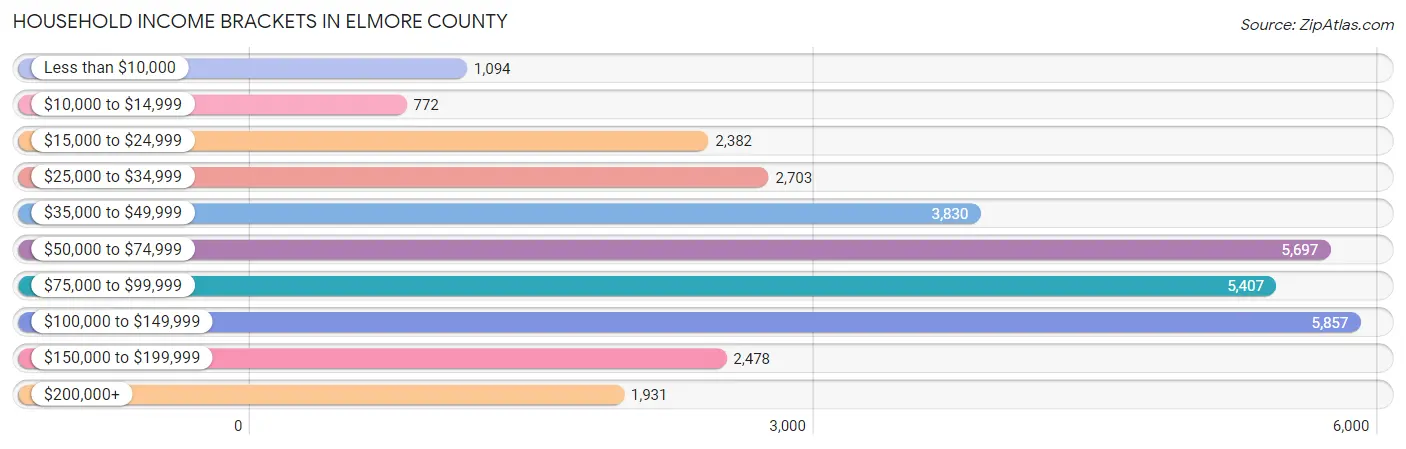
| Income Bracket | # Households | % Households |
| Less than $10,000 | 1,094 | 3.4% |
| $10,000 to $14,999 | 772 | 2.4% |
| $15,000 to $24,999 | 2,382 | 7.4% |
| $25,000 to $34,999 | 2,703 | 8.4% |
| $35,000 to $49,999 | 3,830 | 11.9% |
| $50,000 to $74,999 | 5,697 | 17.7% |
| $75,000 to $99,999 | 5,407 | 16.8% |
| $100,000 to $149,999 | 5,857 | 18.2% |
| $150,000 to $199,999 | 2,478 | 7.7% |
| $200,000+ | 1,931 | 6.0% |
Household Income by Householder Age in Elmore County
The median household income in Elmore County is $73,258, with the highest median household income of $87,746 found in the 45 to 64 years age bracket for the primary householder. A total of 12,223 households (38.0%) fall into this category. Meanwhile, the 15 to 24 years age bracket for the primary householder has the lowest median household income of $36,292, with 641 households (2.0%) in this group.
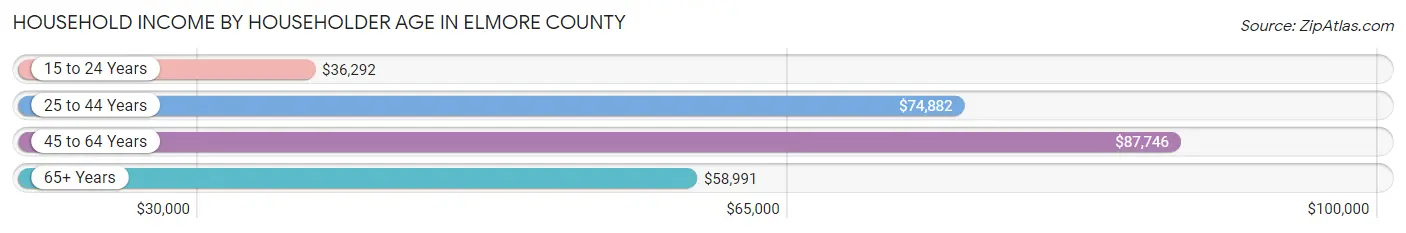
| Income Bracket | # Households | Median Income |
| 15 to 24 Years | 641 (2.0%) | $36,292 |
| 25 to 44 Years | 10,624 (33.0%) | $74,882 |
| 45 to 64 Years | 12,223 (38.0%) | $87,746 |
| 65+ Years | 8,696 (27.0%) | $58,991 |
| Total | 32,184 (100.0%) | $73,258 |
Poverty in Elmore County
Income Below Poverty by Sex and Age in Elmore County
With 8.4% poverty level for males and 10.7% for females among the residents of Elmore County, 5 year old males and 15 year old females are the most vulnerable to poverty, with 129 males (20.5%) and 128 females (19.3%) in their respective age groups living below the poverty level.
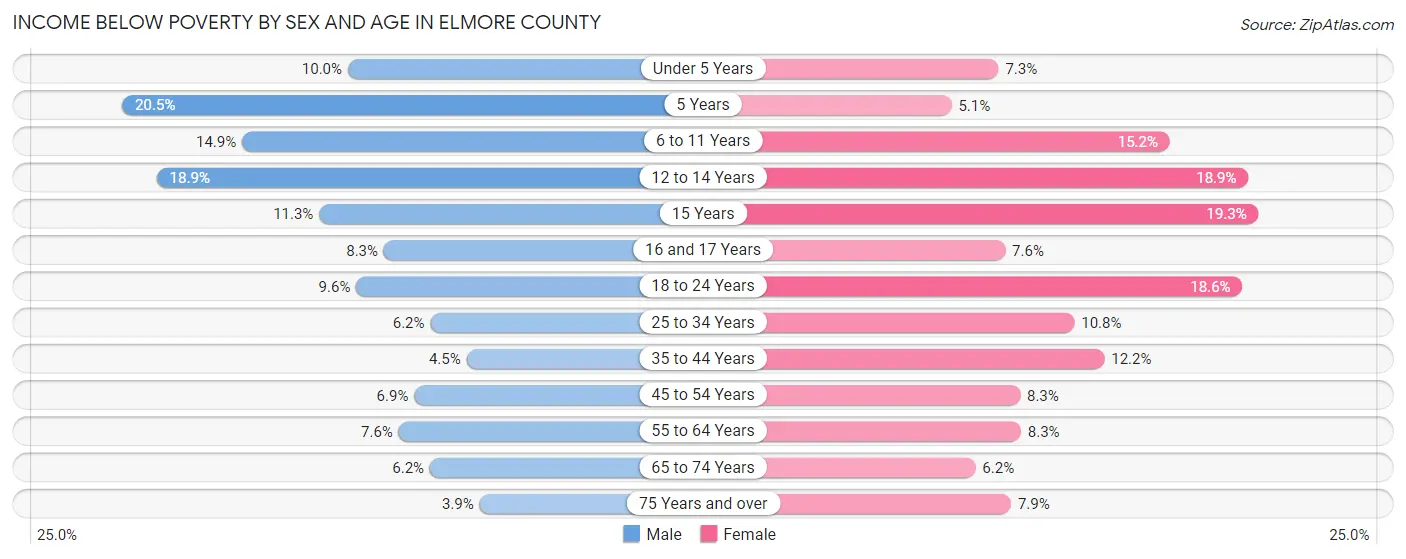
| Age Bracket | Male | Female |
| Under 5 Years | 239 (10.0%) | 174 (7.3%) |
| 5 Years | 129 (20.5%) | 17 (5.1%) |
| 6 to 11 Years | 484 (14.9%) | 456 (15.2%) |
| 12 to 14 Years | 311 (18.9%) | 307 (18.9%) |
| 15 Years | 81 (11.3%) | 128 (19.3%) |
| 16 and 17 Years | 90 (8.3%) | 84 (7.6%) |
| 18 to 24 Years | 372 (9.6%) | 664 (18.6%) |
| 25 to 34 Years | 319 (6.2%) | 673 (10.8%) |
| 35 to 44 Years | 189 (4.5%) | 705 (12.2%) |
| 45 to 54 Years | 338 (6.9%) | 500 (8.3%) |
| 55 to 64 Years | 399 (7.6%) | 498 (8.3%) |
| 65 to 74 Years | 238 (6.2%) | 268 (6.2%) |
| 75 Years and over | 83 (3.9%) | 240 (7.9%) |
| Total | 3,272 (8.4%) | 4,714 (10.7%) |
Income Above Poverty by Sex and Age in Elmore County
According to the poverty statistics in Elmore County, males aged 75 years and over and females aged 5 years are the age groups that are most secure financially, with 96.1% of males and 94.9% of females in these age groups living above the poverty line.
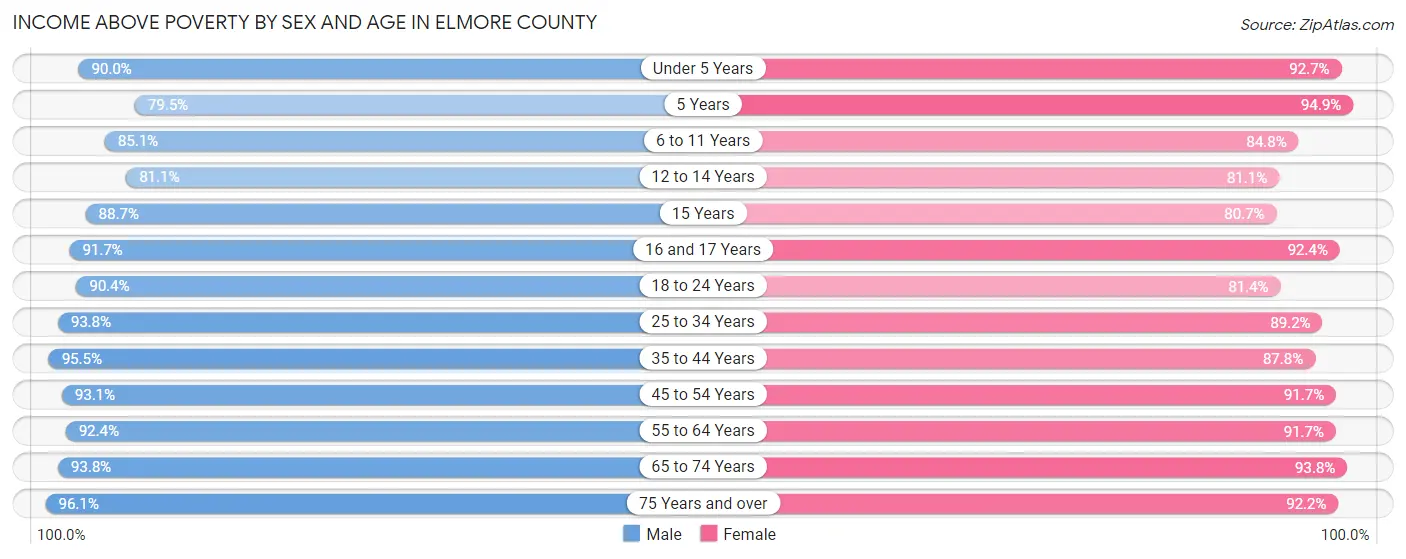
| Age Bracket | Male | Female |
| Under 5 Years | 2,151 (90.0%) | 2,221 (92.7%) |
| 5 Years | 501 (79.5%) | 317 (94.9%) |
| 6 to 11 Years | 2,763 (85.1%) | 2,540 (84.8%) |
| 12 to 14 Years | 1,337 (81.1%) | 1,321 (81.1%) |
| 15 Years | 634 (88.7%) | 534 (80.7%) |
| 16 and 17 Years | 991 (91.7%) | 1,024 (92.4%) |
| 18 to 24 Years | 3,498 (90.4%) | 2,908 (81.4%) |
| 25 to 34 Years | 4,852 (93.8%) | 5,566 (89.2%) |
| 35 to 44 Years | 4,023 (95.5%) | 5,081 (87.8%) |
| 45 to 54 Years | 4,546 (93.1%) | 5,548 (91.7%) |
| 55 to 64 Years | 4,822 (92.4%) | 5,494 (91.7%) |
| 65 to 74 Years | 3,608 (93.8%) | 4,054 (93.8%) |
| 75 Years and over | 2,049 (96.1%) | 2,816 (92.1%) |
| Total | 35,775 (91.6%) | 39,424 (89.3%) |
Income Below Poverty Among Married-Couple Families in Elmore County
The poverty statistics for married-couple families in Elmore County show that 3.8% or 650 of the total 17,276 families live below the poverty line. Families with 3 or 4 children have the highest poverty rate of 9.9%, comprising of 120 families. On the other hand, families with no children have the lowest poverty rate of 2.6%, which includes 264 families.
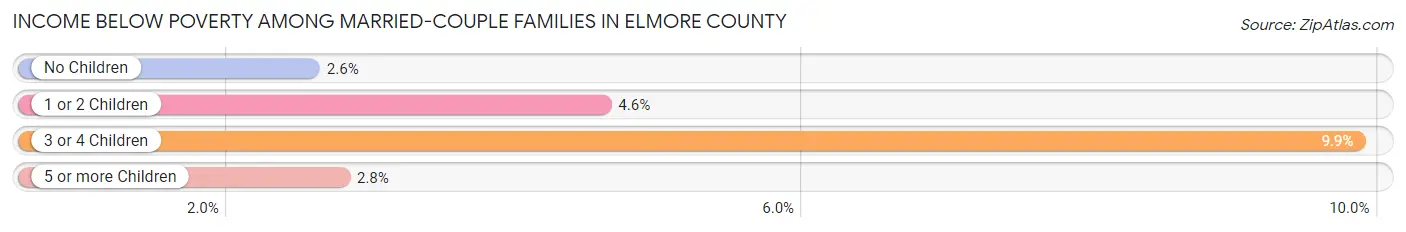
| Children | Above Poverty | Below Poverty |
| No Children | 9,989 (97.4%) | 264 (2.6%) |
| 1 or 2 Children | 5,469 (95.4%) | 264 (4.6%) |
| 3 or 4 Children | 1,098 (90.1%) | 120 (9.9%) |
| 5 or more Children | 70 (97.2%) | 2 (2.8%) |
| Total | 16,626 (96.2%) | 650 (3.8%) |
Income Below Poverty Among Single-Parent Households in Elmore County
According to the poverty data in Elmore County, 8.2% or 120 single-father households and 23.1% or 1,153 single-mother households are living below the poverty line. Among single-father households, those with 3 or 4 children have the highest poverty rate, with 15 households (36.6%) experiencing poverty. Likewise, among single-mother households, those with 3 or 4 children have the highest poverty rate, with 294 households (68.7%) falling below the poverty line.
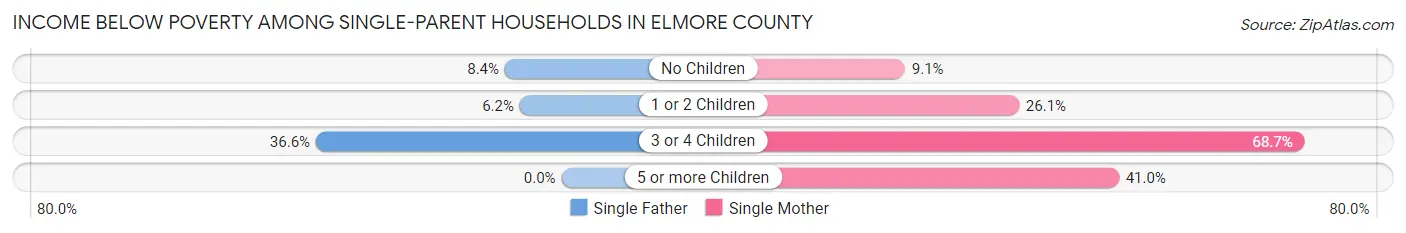
| Children | Single Father | Single Mother |
| No Children | 64 (8.4%) | 184 (9.1%) |
| 1 or 2 Children | 41 (6.2%) | 650 (26.1%) |
| 3 or 4 Children | 15 (36.6%) | 294 (68.7%) |
| 5 or more Children | 0 (0.0%) | 25 (41.0%) |
| Total | 120 (8.2%) | 1,153 (23.1%) |
Income Below Poverty Among Married-Couple vs Single-Parent Households in Elmore County
The poverty data for Elmore County shows that 650 of the married-couple family households (3.8%) and 1,273 of the single-parent households (19.7%) are living below the poverty level. Within the married-couple family households, those with 3 or 4 children have the highest poverty rate, with 120 households (9.9%) falling below the poverty line. Among the single-parent households, those with 3 or 4 children have the highest poverty rate, with 309 household (65.9%) living below poverty.
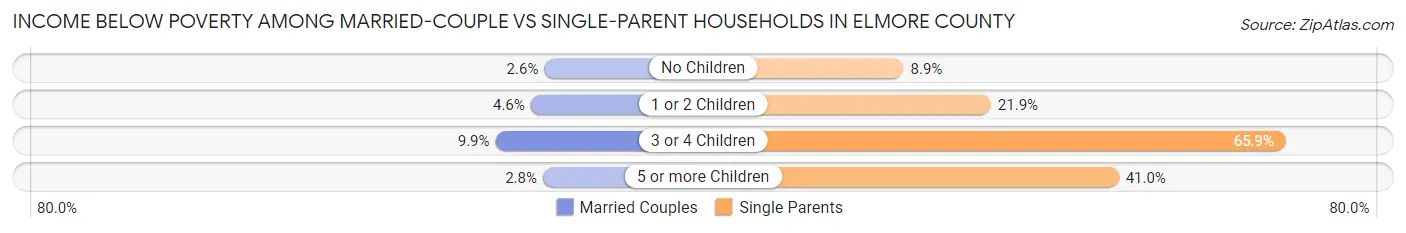
| Children | Married-Couple Families | Single-Parent Households |
| No Children | 264 (2.6%) | 248 (8.9%) |
| 1 or 2 Children | 264 (4.6%) | 691 (21.9%) |
| 3 or 4 Children | 120 (9.9%) | 309 (65.9%) |
| 5 or more Children | 2 (2.8%) | 25 (41.0%) |
| Total | 650 (3.8%) | 1,273 (19.7%) |
Race in Elmore County
The most populous races in Elmore County are White / Caucasian (64,769 | 73.9%), Black / African American (18,276 | 20.8%), and Two or more Races (3,122 | 3.6%).
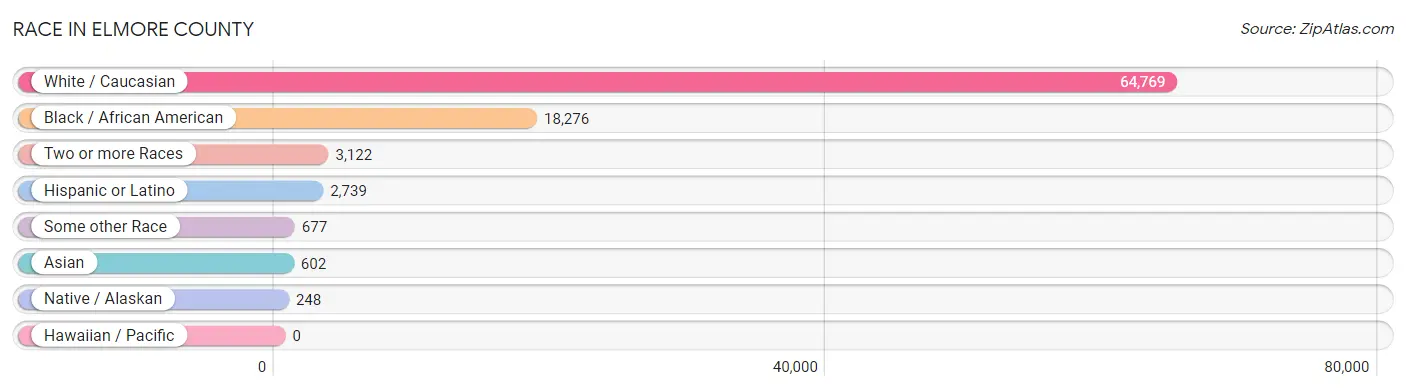
| Race | # Population | % Population |
| Asian | 602 | 0.7% |
| Black / African American | 18,276 | 20.8% |
| Hawaiian / Pacific | 0 | 0.0% |
| Hispanic or Latino | 2,739 | 3.1% |
| Native / Alaskan | 248 | 0.3% |
| White / Caucasian | 64,769 | 73.9% |
| Two or more Races | 3,122 | 3.6% |
| Some other Race | 677 | 0.8% |
| Total | 87,694 | 100.0% |
Ancestry in Elmore County
The most populous ancestries reported in Elmore County are American (13,516 | 15.4%), English (9,557 | 10.9%), Irish (8,449 | 9.6%), German (6,318 | 7.2%), and Mexican (1,958 | 2.2%), together accounting for 45.4% of all Elmore County residents.
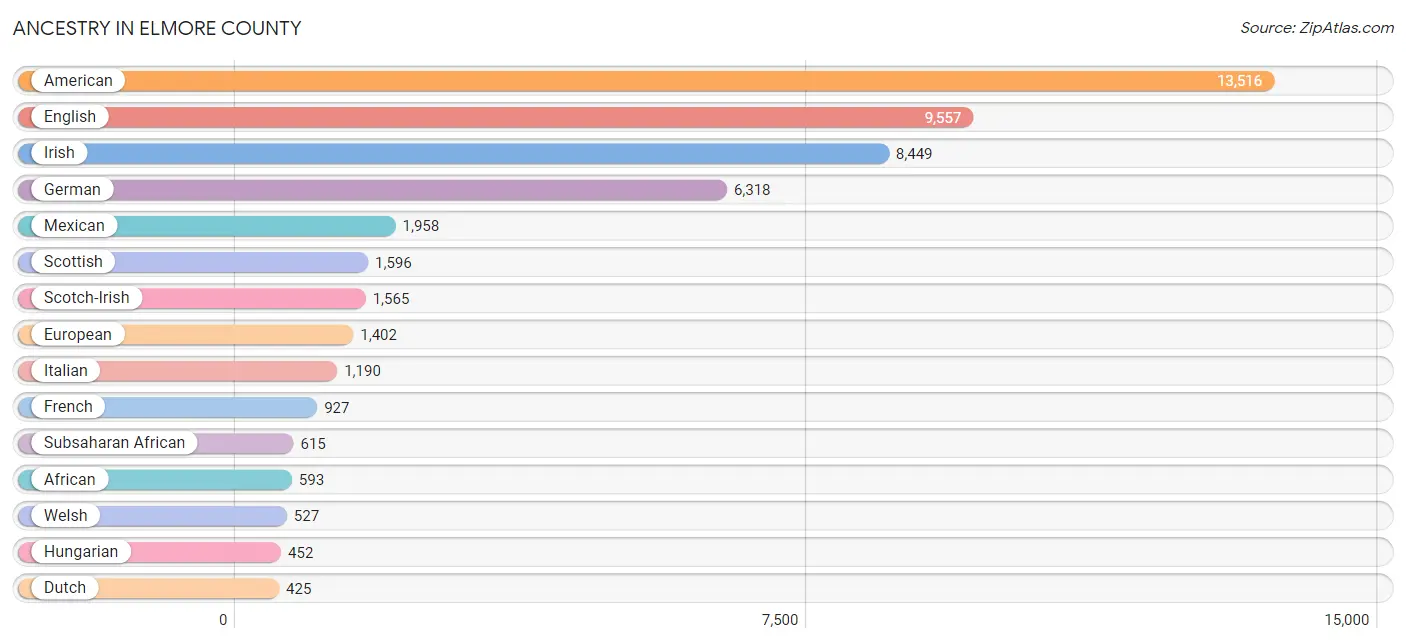
| Ancestry | # Population | % Population |
| Afghan | 188 | 0.2% |
| African | 593 | 0.7% |
| American | 13,516 | 15.4% |
| Apache | 28 | 0.0% |
| Arab | 61 | 0.1% |
| Austrian | 6 | 0.0% |
| Basque | 8 | 0.0% |
| Belizean | 3 | 0.0% |
| Bhutanese | 189 | 0.2% |
| Blackfeet | 10 | 0.0% |
| British | 424 | 0.5% |
| Burmese | 63 | 0.1% |
| Cajun | 18 | 0.0% |
| Canadian | 14 | 0.0% |
| Central American | 229 | 0.3% |
| Central American Indian | 64 | 0.1% |
| Cherokee | 295 | 0.3% |
| Chippewa | 13 | 0.0% |
| Choctaw | 23 | 0.0% |
| Comanche | 17 | 0.0% |
| Costa Rican | 164 | 0.2% |
| Creek | 110 | 0.1% |
| Cuban | 52 | 0.1% |
| Cypriot | 26 | 0.0% |
| Czech | 23 | 0.0% |
| Danish | 158 | 0.2% |
| Dutch | 425 | 0.5% |
| Eastern European | 60 | 0.1% |
| Egyptian | 22 | 0.0% |
| English | 9,557 | 10.9% |
| Estonian | 31 | 0.0% |
| European | 1,402 | 1.6% |
| French | 927 | 1.1% |
| French Canadian | 282 | 0.3% |
| German | 6,318 | 7.2% |
| Greek | 23 | 0.0% |
| Guatemalan | 7 | 0.0% |
| Hmong | 3 | 0.0% |
| Honduran | 45 | 0.1% |
| Hungarian | 452 | 0.5% |
| Indian (Asian) | 38 | 0.0% |
| Iranian | 15 | 0.0% |
| Irish | 8,449 | 9.6% |
| Israeli | 31 | 0.0% |
| Italian | 1,190 | 1.4% |
| Jamaican | 73 | 0.1% |
| Kenyan | 6 | 0.0% |
| Korean | 353 | 0.4% |
| Lebanese | 15 | 0.0% |
| Lithuanian | 12 | 0.0% |
| Mexican | 1,958 | 2.2% |
| Mexican American Indian | 21 | 0.0% |
| Native Hawaiian | 7 | 0.0% |
| Navajo | 15 | 0.0% |
| Nigerian | 16 | 0.0% |
| Northern European | 32 | 0.0% |
| Norwegian | 219 | 0.3% |
| Pakistani | 55 | 0.1% |
| Panamanian | 13 | 0.0% |
| Pennsylvania German | 19 | 0.0% |
| Polish | 246 | 0.3% |
| Portuguese | 107 | 0.1% |
| Puerto Rican | 271 | 0.3% |
| Russian | 2 | 0.0% |
| Scandinavian | 101 | 0.1% |
| Scotch-Irish | 1,565 | 1.8% |
| Scottish | 1,596 | 1.8% |
| Seminole | 47 | 0.1% |
| Sioux | 24 | 0.0% |
| Slavic | 73 | 0.1% |
| Spaniard | 42 | 0.1% |
| Spanish | 77 | 0.1% |
| Subsaharan African | 615 | 0.7% |
| Swedish | 385 | 0.4% |
| Swiss | 52 | 0.1% |
| Thai | 65 | 0.1% |
| Ukrainian | 87 | 0.1% |
| Welsh | 527 | 0.6% |
| West Indian | 12 | 0.0% | View All 79 Rows |
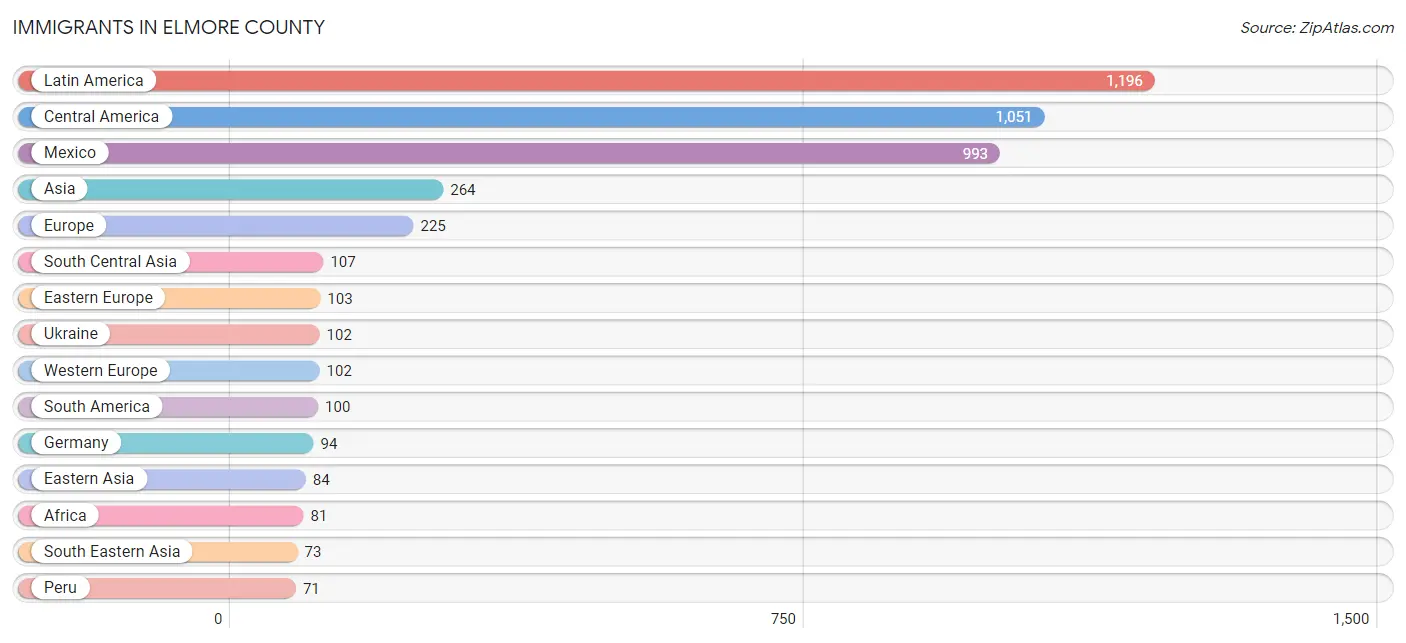
Immigrants in Elmore County
The most numerous immigrant groups reported in Elmore County came from Latin America (1,196 | 1.4%), Central America (1,051 | 1.2%), Mexico (993 | 1.1%), Asia (264 | 0.3%), and Europe (225 | 0.3%), together accounting for 4.2% of all Elmore County residents.
| Immigration Origin | # Population | % Population |
| Afghanistan | 42 | 0.1% |
| Africa | 81 | 0.1% |
| Asia | 264 | 0.3% |
| Brazil | 29 | 0.0% |
| Canada | 42 | 0.1% |
| Caribbean | 45 | 0.1% |
| Central America | 1,051 | 1.2% |
| China | 12 | 0.0% |
| Costa Rica | 15 | 0.0% |
| Cuba | 45 | 0.1% |
| Eastern Africa | 6 | 0.0% |
| Eastern Asia | 84 | 0.1% |
| Eastern Europe | 103 | 0.1% |
| Europe | 225 | 0.3% |
| Germany | 94 | 0.1% |
| Ghana | 37 | 0.0% |
| Guatemala | 10 | 0.0% |
| Honduras | 33 | 0.0% |
| India | 65 | 0.1% |
| Japan | 27 | 0.0% |
| Kenya | 6 | 0.0% |
| Korea | 45 | 0.1% |
| Latin America | 1,196 | 1.4% |
| Mexico | 993 | 1.1% |
| Netherlands | 8 | 0.0% |
| Nigeria | 16 | 0.0% |
| Northern Europe | 20 | 0.0% |
| Peru | 71 | 0.1% |
| Philippines | 35 | 0.0% |
| Russia | 1 | 0.0% |
| Scotland | 3 | 0.0% |
| South Africa | 22 | 0.0% |
| South America | 100 | 0.1% |
| South Central Asia | 107 | 0.1% |
| South Eastern Asia | 73 | 0.1% |
| Thailand | 38 | 0.0% |
| Ukraine | 102 | 0.1% |
| Western Africa | 53 | 0.1% |
| Western Europe | 102 | 0.1% | View All 39 Rows |
Sex and Age in Elmore County
Sex and Age in Elmore County
The most populous age groups in Elmore County are 15 to 19 Years (3,177 | 7.4%) for men and 55 to 59 Years (3,342 | 7.4%) for women.
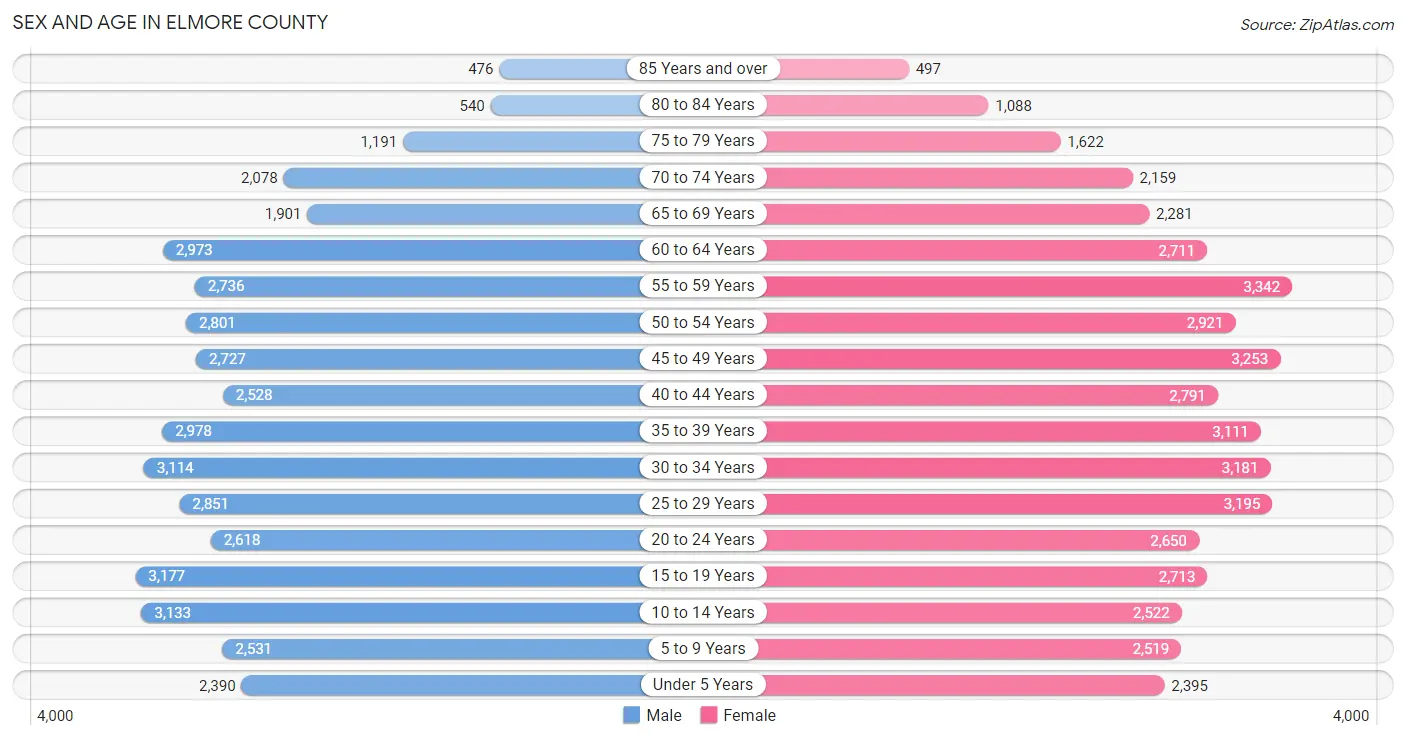
| Age Bracket | Male | Female |
| Under 5 Years | 2,390 (5.6%) | 2,395 (5.3%) |
| 5 to 9 Years | 2,531 (5.9%) | 2,519 (5.6%) |
| 10 to 14 Years | 3,133 (7.3%) | 2,522 (5.6%) |
| 15 to 19 Years | 3,177 (7.4%) | 2,713 (6.0%) |
| 20 to 24 Years | 2,618 (6.1%) | 2,650 (5.9%) |
| 25 to 29 Years | 2,851 (6.7%) | 3,195 (7.1%) |
| 30 to 34 Years | 3,114 (7.3%) | 3,181 (7.1%) |
| 35 to 39 Years | 2,978 (7.0%) | 3,111 (6.9%) |
| 40 to 44 Years | 2,528 (5.9%) | 2,791 (6.2%) |
| 45 to 49 Years | 2,727 (6.4%) | 3,253 (7.2%) |
| 50 to 54 Years | 2,801 (6.6%) | 2,921 (6.5%) |
| 55 to 59 Years | 2,736 (6.4%) | 3,342 (7.4%) |
| 60 to 64 Years | 2,973 (7.0%) | 2,711 (6.0%) |
| 65 to 69 Years | 1,901 (4.4%) | 2,281 (5.1%) |
| 70 to 74 Years | 2,078 (4.9%) | 2,159 (4.8%) |
| 75 to 79 Years | 1,191 (2.8%) | 1,622 (3.6%) |
| 80 to 84 Years | 540 (1.3%) | 1,088 (2.4%) |
| 85 Years and over | 476 (1.1%) | 497 (1.1%) |
| Total | 42,743 (100.0%) | 44,951 (100.0%) |
Families and Households in Elmore County
Median Family Size in Elmore County
The median family size in Elmore County is 3.06 persons per family, with married-couple families (17,276 | 72.8%) accounting for the largest median family size of 3.12 persons per family. On the other hand, single male/father families (1,459 | 6.1%) represent the smallest median family size with 2.88 persons per family.
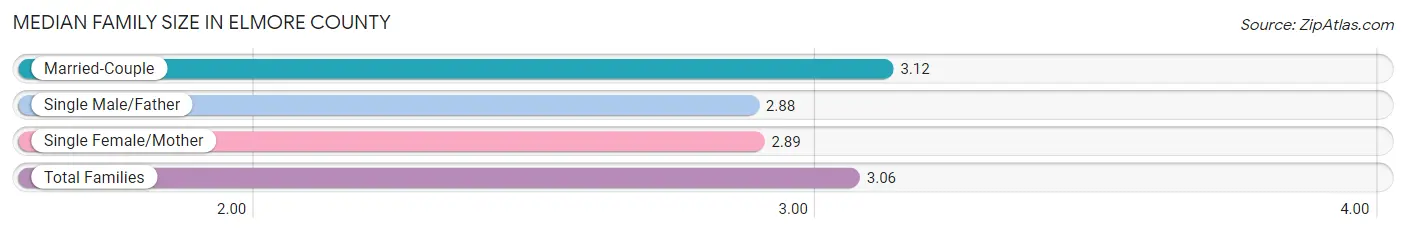
| Family Type | # Families | Family Size |
| Married-Couple | 17,276 (72.8%) | 3.12 |
| Single Male/Father | 1,459 (6.1%) | 2.88 |
| Single Female/Mother | 4,998 (21.1%) | 2.89 |
| Total Families | 23,733 (100.0%) | 3.06 |
Median Household Size in Elmore County
The median household size in Elmore County is 2.59 persons per household, with single male/father households (1,459 | 4.5%) accounting for the largest median household size of 3.27 persons per household. non-family households (8,451 | 26.3%) represent the smallest median household size with 1.11 persons per household.
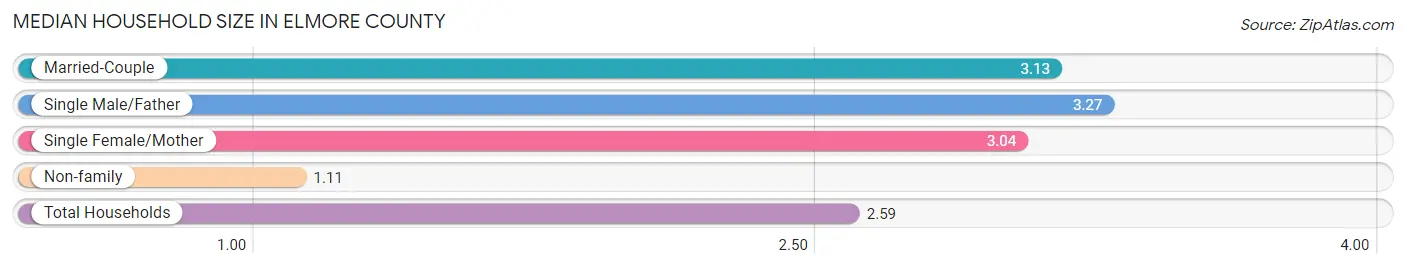
| Household Type | # Households | Household Size |
| Married-Couple | 17,276 (53.7%) | 3.13 |
| Single Male/Father | 1,459 (4.5%) | 3.27 |
| Single Female/Mother | 4,998 (15.5%) | 3.04 |
| Non-family | 8,451 (26.3%) | 1.11 |
| Total Households | 32,184 (100.0%) | 2.59 |
Household Size by Marriage Status in Elmore County
Out of a total of 32,184 households in Elmore County, 23,733 (73.7%) are family households, while 8,451 (26.3%) are nonfamily households. The most numerous type of family households are 2-person households, comprising 10,802, and the most common type of nonfamily households are 1-person households, comprising 7,732.
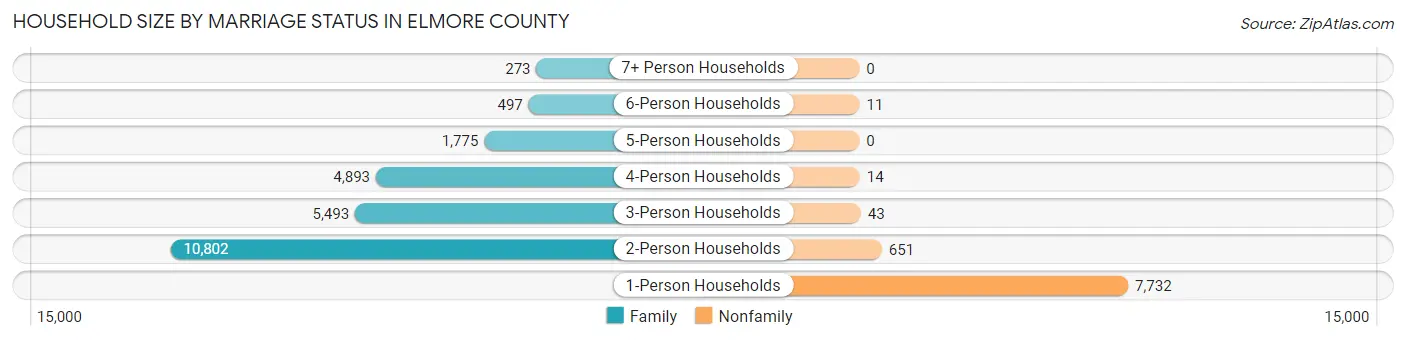
| Household Size | Family Households | Nonfamily Households |
| 1-Person Households | - | 7,732 (24.0%) |
| 2-Person Households | 10,802 (33.6%) | 651 (2.0%) |
| 3-Person Households | 5,493 (17.1%) | 43 (0.1%) |
| 4-Person Households | 4,893 (15.2%) | 14 (0.0%) |
| 5-Person Households | 1,775 (5.5%) | 0 (0.0%) |
| 6-Person Households | 497 (1.5%) | 11 (0.0%) |
| 7+ Person Households | 273 (0.9%) | 0 (0.0%) |
| Total | 23,733 (73.7%) | 8,451 (26.3%) |
Female Fertility in Elmore County
Fertility by Age in Elmore County
Average fertility rate in Elmore County is 54.0 births per 1,000 women. Women in the age bracket of 20 to 34 years have the highest fertility rate with 87.0 births per 1,000 women. Women in the age bracket of 20 to 34 years acount for 67.5% of all women with births.
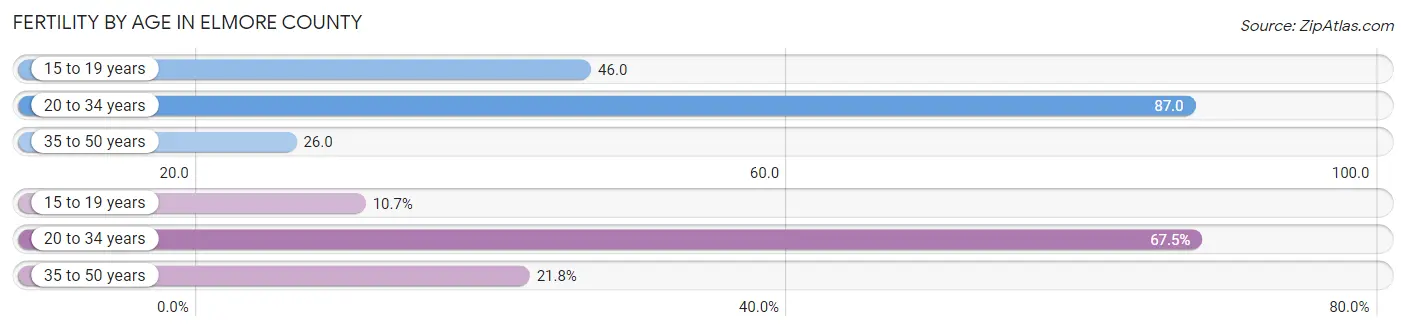
| Age Bracket | Women with Births | Births / 1,000 Women |
| 15 to 19 years | 124 (10.7%) | 46.0 |
| 20 to 34 years | 782 (67.5%) | 87.0 |
| 35 to 50 years | 253 (21.8%) | 26.0 |
| Total | 1,159 (100.0%) | 54.0 |
Fertility by Age by Marriage Status in Elmore County
53.6% of women with births (1,159) in Elmore County are married. The highest percentage of unmarried women with births falls into 15 to 19 years age bracket with 100.0% of them unmarried at the time of birth, while the lowest percentage of unmarried women with births belong to 35 to 50 years age bracket with 0.0% of them unmarried.
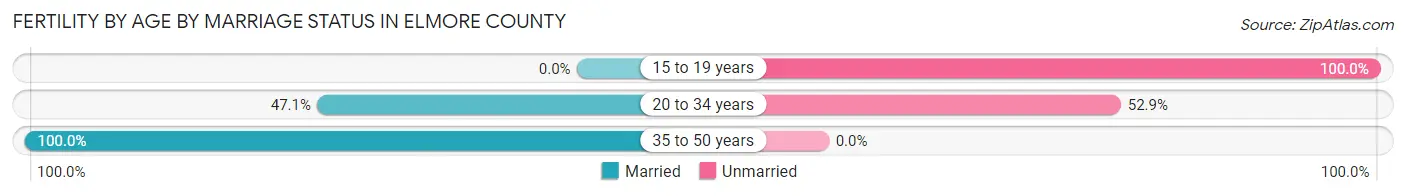
| Age Bracket | Married | Unmarried |
| 15 to 19 years | 0 (0.0%) | 124 (100.0%) |
| 20 to 34 years | 368 (47.1%) | 414 (52.9%) |
| 35 to 50 years | 253 (100.0%) | 0 (0.0%) |
| Total | 621 (53.6%) | 538 (46.4%) |
Fertility by Education in Elmore County
Average fertility rate in Elmore County is 54.0 births per 1,000 women. Women with the education attainment of college or associate's degree have the highest fertility rate of 71.0 births per 1,000 women, while women with the education attainment of bachelor's degree have the lowest fertility at 34.0 births per 1,000 women. Women with the education attainment of college or associate's degree represent 44.2% of all women with births.
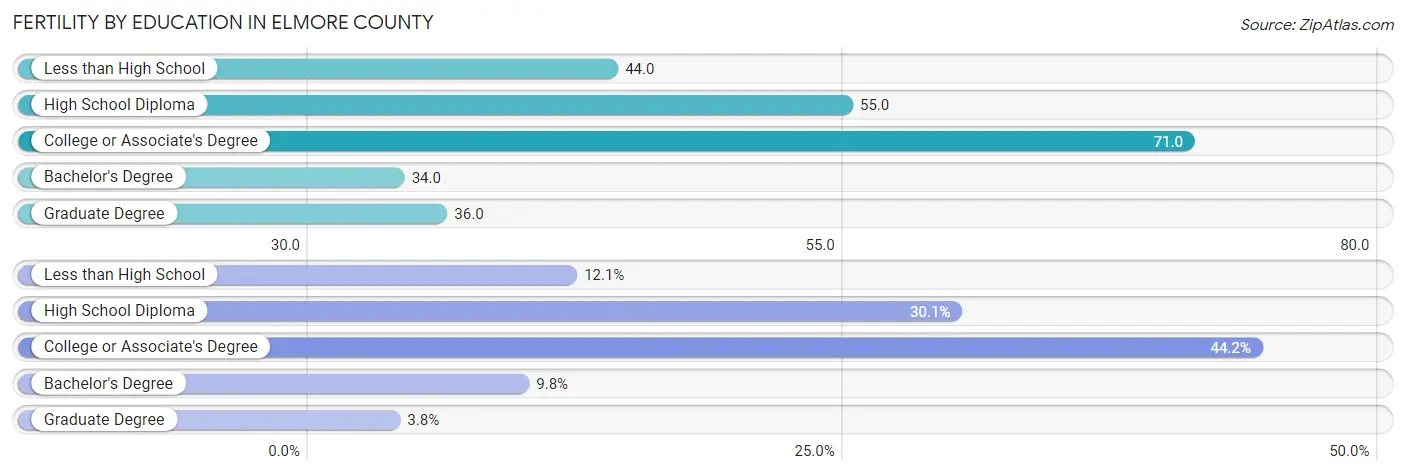
| Educational Attainment | Women with Births | Births / 1,000 Women |
| Less than High School | 140 (12.1%) | 44.0 |
| High School Diploma | 349 (30.1%) | 55.0 |
| College or Associate's Degree | 512 (44.2%) | 71.0 |
| Bachelor's Degree | 114 (9.8%) | 34.0 |
| Graduate Degree | 44 (3.8%) | 36.0 |
| Total | 1,159 (100.0%) | 54.0 |
Fertility by Education by Marriage Status in Elmore County
46.4% of women with births in Elmore County are unmarried. Women with the educational attainment of bachelor's degree are most likely to be married with 100.0% of them married at childbirth, while women with the educational attainment of less than high school are least likely to be married with 92.1% of them unmarried at childbirth.
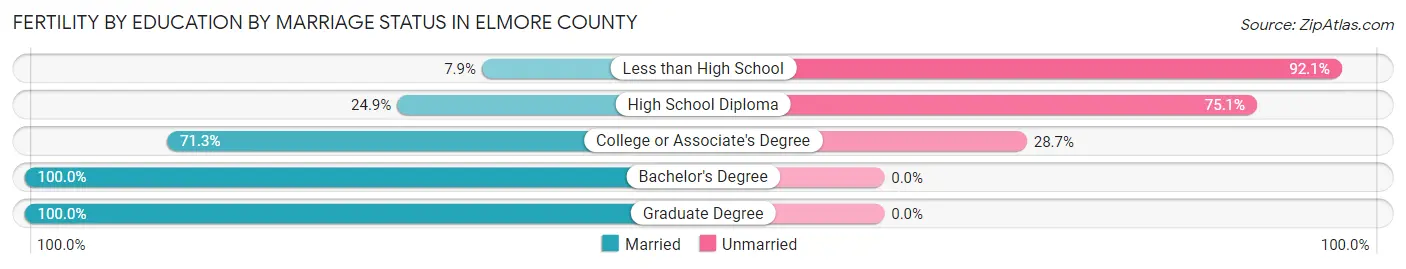
| Educational Attainment | Married | Unmarried |
| Less than High School | 11 (7.9%) | 129 (92.1%) |
| High School Diploma | 87 (24.9%) | 262 (75.1%) |
| College or Associate's Degree | 365 (71.3%) | 147 (28.7%) |
| Bachelor's Degree | 114 (100.0%) | 0 (0.0%) |
| Graduate Degree | 44 (100.0%) | 0 (0.0%) |
| Total | 621 (53.6%) | 538 (46.4%) |
Employment Characteristics in Elmore County
Employment by Class of Employer in Elmore County
Among the 38,872 employed individuals in Elmore County, private company employees (25,005 | 64.3%), state government employees (3,586 | 9.2%), and not-for-profit organizations (2,831 | 7.3%) make up the most common classes of employment.
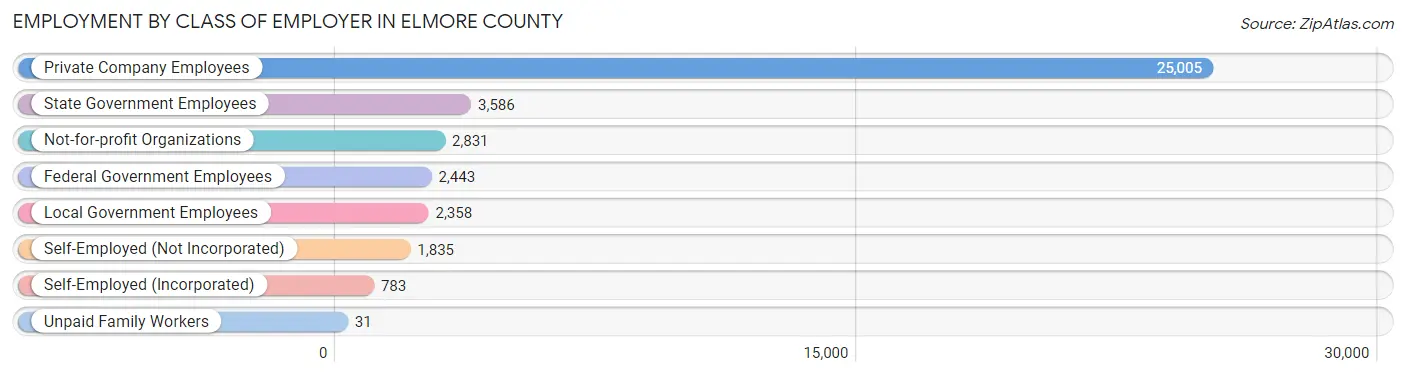
| Employer Class | # Employees | % Employees |
| Private Company Employees | 25,005 | 64.3% |
| Self-Employed (Incorporated) | 783 | 2.0% |
| Self-Employed (Not Incorporated) | 1,835 | 4.7% |
| Not-for-profit Organizations | 2,831 | 7.3% |
| Local Government Employees | 2,358 | 6.1% |
| State Government Employees | 3,586 | 9.2% |
| Federal Government Employees | 2,443 | 6.3% |
| Unpaid Family Workers | 31 | 0.1% |
| Total | 38,872 | 100.0% |
Employment Status by Age in Elmore County
According to the labor force statistics for Elmore County, out of the total population over 16 years of age (70,825), 58.6% or 41,503 individuals are in the labor force, with 4.2% or 1,743 of them unemployed. The age group with the highest labor force participation rate is 30 to 34 years, with 81.4% or 5,124 individuals in the labor force. Within the labor force, the 16 to 19 years age range has the highest percentage of unemployed individuals, with 10.8% or 198 of them being unemployed.
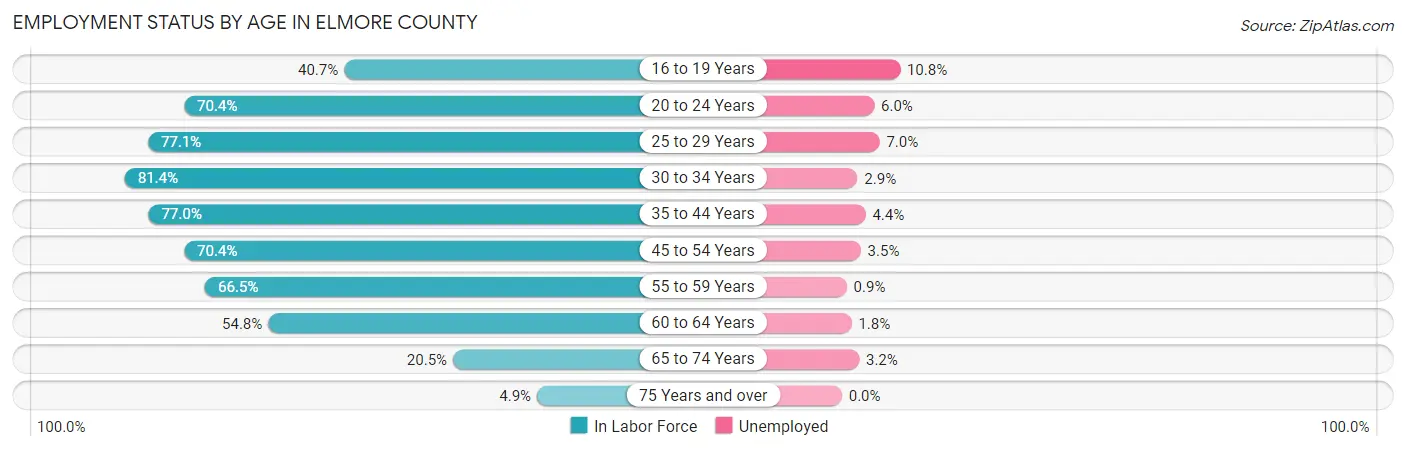
| Age Bracket | In Labor Force | Unemployed |
| 16 to 19 Years | 1,836 (40.7%) | 198 (10.8%) |
| 20 to 24 Years | 3,709 (70.4%) | 223 (6.0%) |
| 25 to 29 Years | 4,661 (77.1%) | 326 (7.0%) |
| 30 to 34 Years | 5,124 (81.4%) | 149 (2.9%) |
| 35 to 44 Years | 8,784 (77.0%) | 386 (4.4%) |
| 45 to 54 Years | 8,238 (70.4%) | 288 (3.5%) |
| 55 to 59 Years | 4,042 (66.5%) | 36 (0.9%) |
| 60 to 64 Years | 3,115 (54.8%) | 56 (1.8%) |
| 65 to 74 Years | 1,726 (20.5%) | 55 (3.2%) |
| 75 Years and over | 265 (4.9%) | 0 (0.0%) |
| Total | 41,503 (58.6%) | 1,743 (4.2%) |
Employment Status by Educational Attainment in Elmore County
According to labor force statistics for Elmore County, 72.0% of individuals (33,993) out of the total population between 25 and 64 years of age (47,213) are in the labor force, with 3.7% or 1,258 of them being unemployed. The group with the highest labor force participation rate are those with the educational attainment of bachelor's degree or higher, with 86.9% or 9,510 individuals in the labor force. Within the labor force, individuals with less than high school education have the highest percentage of unemployment, with 8.0% or 180 of them being unemployed.
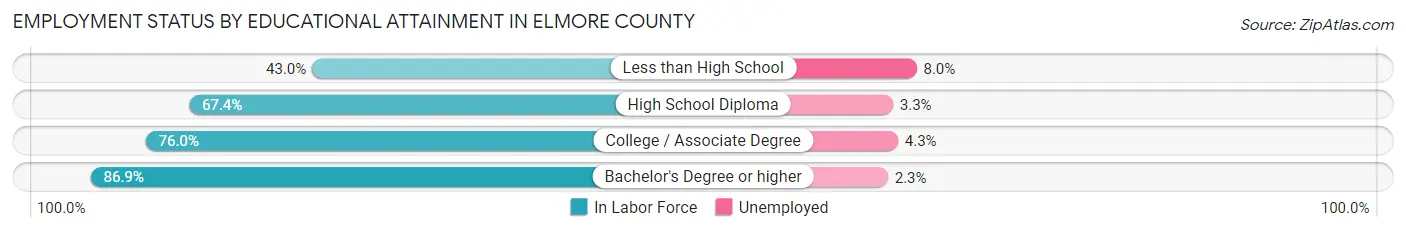
| Educational Attainment | In Labor Force | Unemployed |
| Less than High School | 2,247 (43.0%) | 418 (8.0%) |
| High School Diploma | 10,685 (67.4%) | 523 (3.3%) |
| College / Associate Degree | 11,545 (76.0%) | 653 (4.3%) |
| Bachelor's Degree or higher | 9,510 (86.9%) | 252 (2.3%) |
| Total | 33,993 (72.0%) | 1,747 (3.7%) |
Employment Occupations by Sex in Elmore County
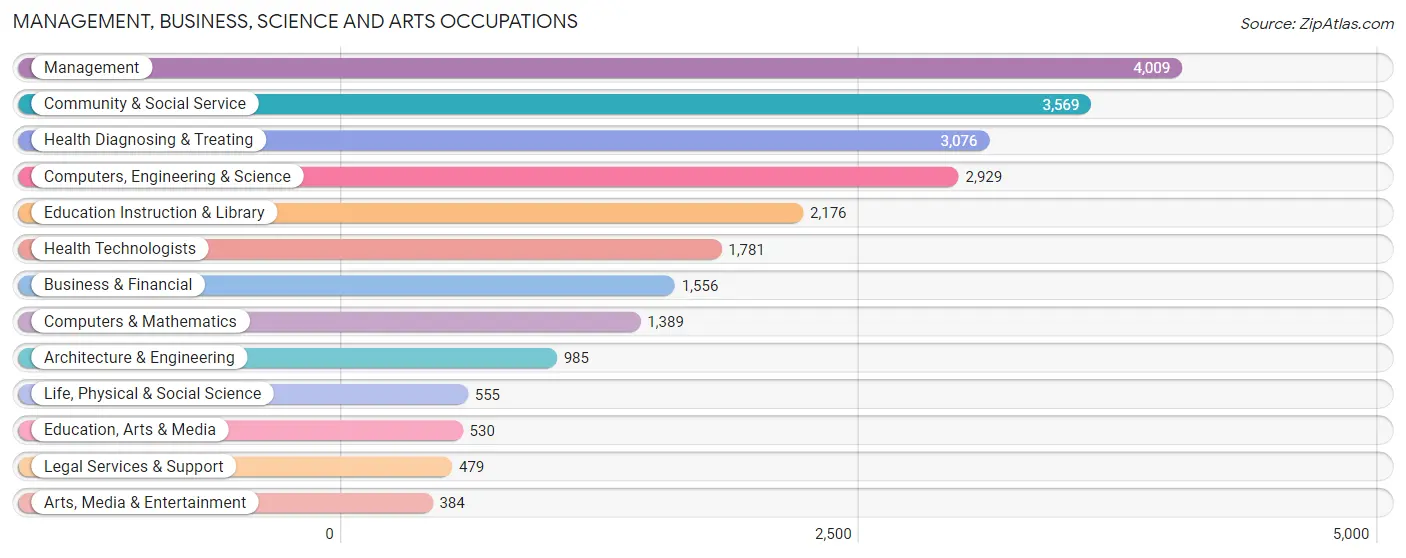
Management, Business, Science and Arts Occupations
The most common Management, Business, Science and Arts occupations in Elmore County are Management (4,009 | 10.2%), Community & Social Service (3,569 | 9.1%), Health Diagnosing & Treating (3,076 | 7.8%), Computers, Engineering & Science (2,929 | 7.5%), and Education Instruction & Library (2,176 | 5.5%).
Management, Business, Science and Arts Occupations by Sex
Within the Management, Business, Science and Arts occupations in Elmore County, the most male-oriented occupations are Computers & Mathematics (76.7%), Architecture & Engineering (74.4%), and Computers, Engineering & Science (71.2%), while the most female-oriented occupations are Health Technologists (78.0%), Education, Arts & Media (77.4%), and Education Instruction & Library (75.7%).
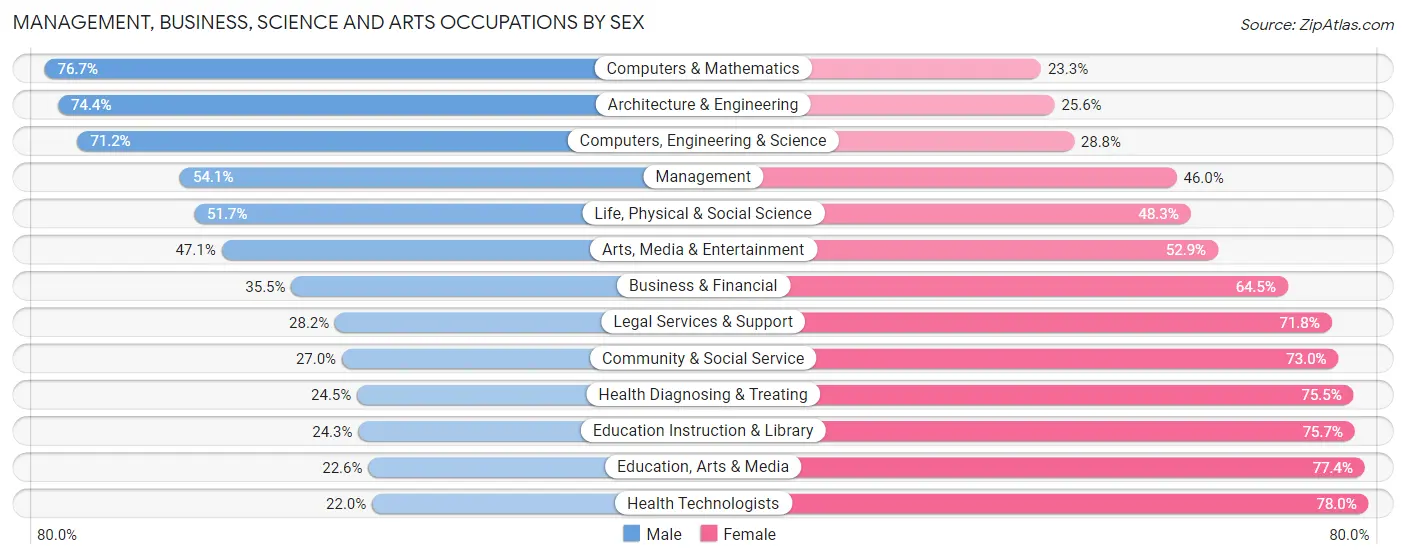
| Occupation | Male | Female |
| Management | 2,167 (54.0%) | 1,842 (46.0%) |
| Business & Financial | 552 (35.5%) | 1,004 (64.5%) |
| Computers, Engineering & Science | 2,085 (71.2%) | 844 (28.8%) |
| Computers & Mathematics | 1,065 (76.7%) | 324 (23.3%) |
| Architecture & Engineering | 733 (74.4%) | 252 (25.6%) |
| Life, Physical & Social Science | 287 (51.7%) | 268 (48.3%) |
| Community & Social Service | 965 (27.0%) | 2,604 (73.0%) |
| Education, Arts & Media | 120 (22.6%) | 410 (77.4%) |
| Legal Services & Support | 135 (28.2%) | 344 (71.8%) |
| Education Instruction & Library | 529 (24.3%) | 1,647 (75.7%) |
| Arts, Media & Entertainment | 181 (47.1%) | 203 (52.9%) |
| Health Diagnosing & Treating | 754 (24.5%) | 2,322 (75.5%) |
| Health Technologists | 392 (22.0%) | 1,389 (78.0%) |
| Total (Category) | 6,523 (43.1%) | 8,616 (56.9%) |
| Total (Overall) | 19,082 (48.6%) | 20,168 (51.4%) |
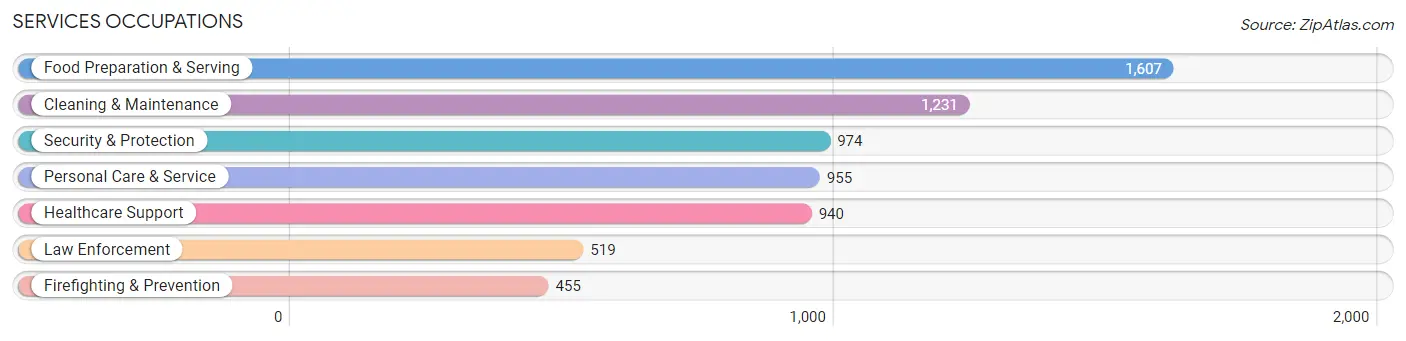
Services Occupations
The most common Services occupations in Elmore County are Food Preparation & Serving (1,607 | 4.1%), Cleaning & Maintenance (1,231 | 3.1%), Security & Protection (974 | 2.5%), Personal Care & Service (955 | 2.4%), and Healthcare Support (940 | 2.4%).
Services Occupations by Sex
Within the Services occupations in Elmore County, the most male-oriented occupations are Law Enforcement (79.4%), Security & Protection (79.4%), and Firefighting & Prevention (79.3%), while the most female-oriented occupations are Personal Care & Service (85.9%), Healthcare Support (77.3%), and Food Preparation & Serving (49.8%).
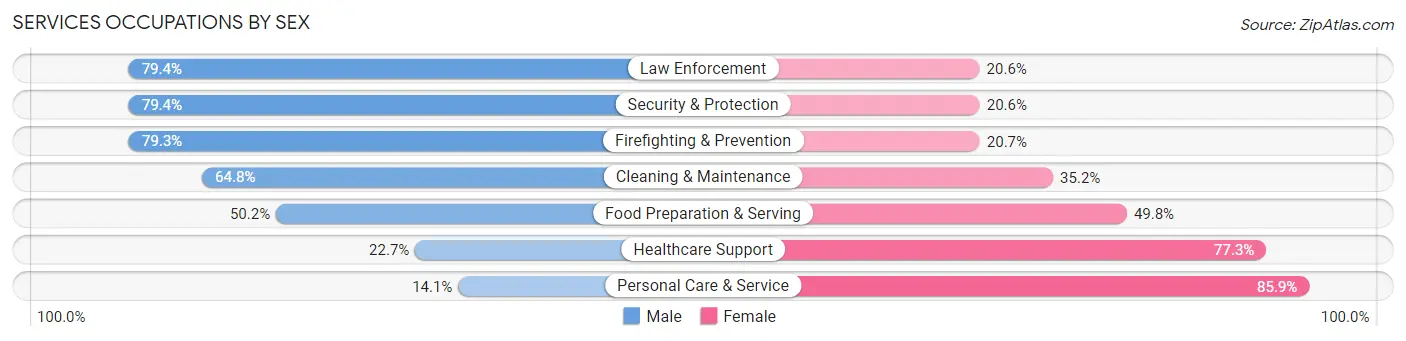
| Occupation | Male | Female |
| Healthcare Support | 213 (22.7%) | 727 (77.3%) |
| Security & Protection | 773 (79.4%) | 201 (20.6%) |
| Firefighting & Prevention | 361 (79.3%) | 94 (20.7%) |
| Law Enforcement | 412 (79.4%) | 107 (20.6%) |
| Food Preparation & Serving | 807 (50.2%) | 800 (49.8%) |
| Cleaning & Maintenance | 798 (64.8%) | 433 (35.2%) |
| Personal Care & Service | 135 (14.1%) | 820 (85.9%) |
| Total (Category) | 2,726 (47.8%) | 2,981 (52.2%) |
| Total (Overall) | 19,082 (48.6%) | 20,168 (51.4%) |
Sales and Office Occupations
The most common Sales and Office occupations in Elmore County are Office & Administration (5,514 | 14.1%), and Sales & Related (3,822 | 9.7%).

Sales and Office Occupations by Sex

| Occupation | Male | Female |
| Sales & Related | 1,559 (40.8%) | 2,263 (59.2%) |
| Office & Administration | 596 (10.8%) | 4,918 (89.2%) |
| Total (Category) | 2,155 (23.1%) | 7,181 (76.9%) |
| Total (Overall) | 19,082 (48.6%) | 20,168 (51.4%) |
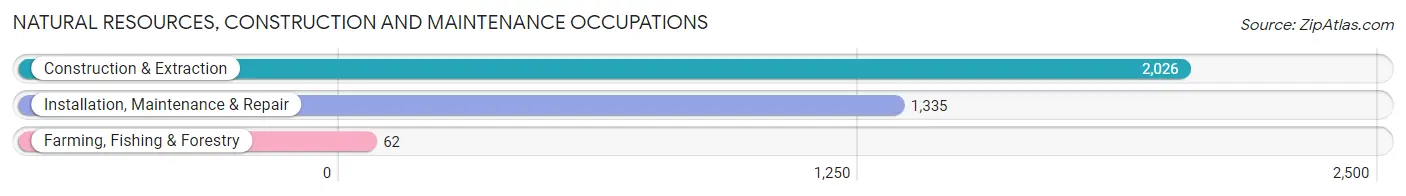
Natural Resources, Construction and Maintenance Occupations
The most common Natural Resources, Construction and Maintenance occupations in Elmore County are Construction & Extraction (2,026 | 5.2%), Installation, Maintenance & Repair (1,335 | 3.4%), and Farming, Fishing & Forestry (62 | 0.2%).
Natural Resources, Construction and Maintenance Occupations by Sex
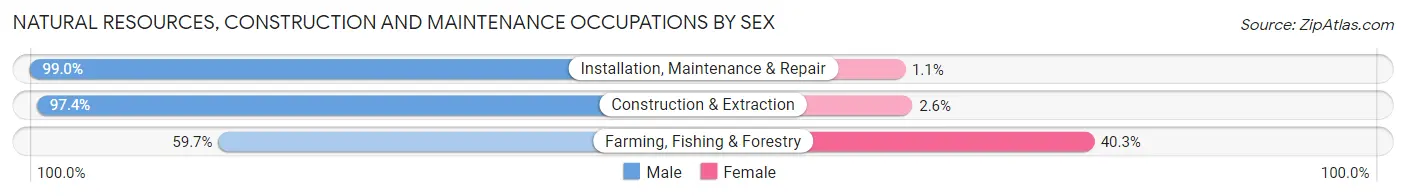
| Occupation | Male | Female |
| Farming, Fishing & Forestry | 37 (59.7%) | 25 (40.3%) |
| Construction & Extraction | 1,974 (97.4%) | 52 (2.6%) |
| Installation, Maintenance & Repair | 1,321 (99.0%) | 14 (1.1%) |
| Total (Category) | 3,332 (97.3%) | 91 (2.7%) |
| Total (Overall) | 19,082 (48.6%) | 20,168 (51.4%) |
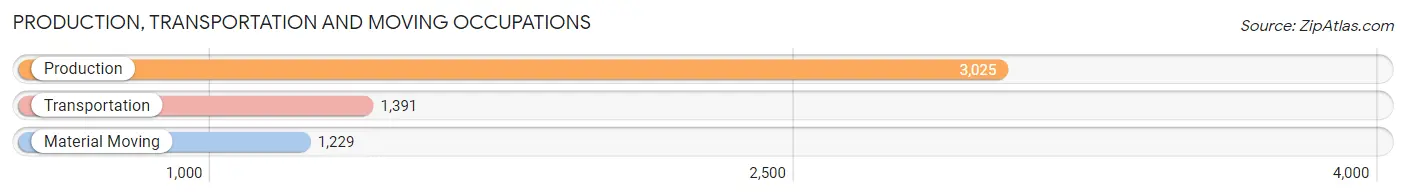
Production, Transportation and Moving Occupations
The most common Production, Transportation and Moving occupations in Elmore County are Production (3,025 | 7.7%), Transportation (1,391 | 3.5%), and Material Moving (1,229 | 3.1%).
Production, Transportation and Moving Occupations by Sex
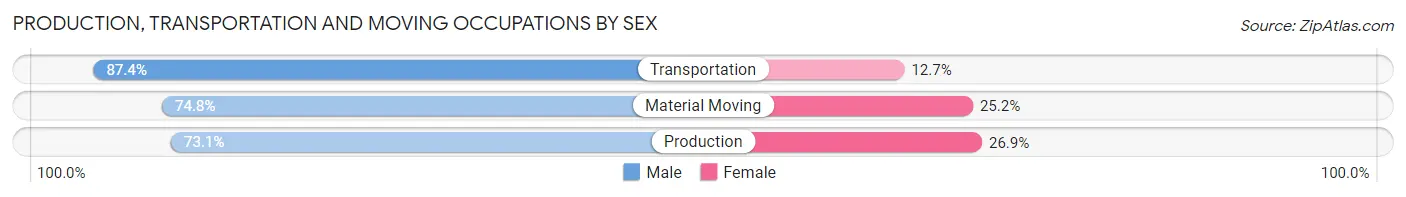
| Occupation | Male | Female |
| Production | 2,212 (73.1%) | 813 (26.9%) |
| Transportation | 1,215 (87.4%) | 176 (12.7%) |
| Material Moving | 919 (74.8%) | 310 (25.2%) |
| Total (Category) | 4,346 (77.0%) | 1,299 (23.0%) |
| Total (Overall) | 19,082 (48.6%) | 20,168 (51.4%) |
Employment Industries by Sex in Elmore County
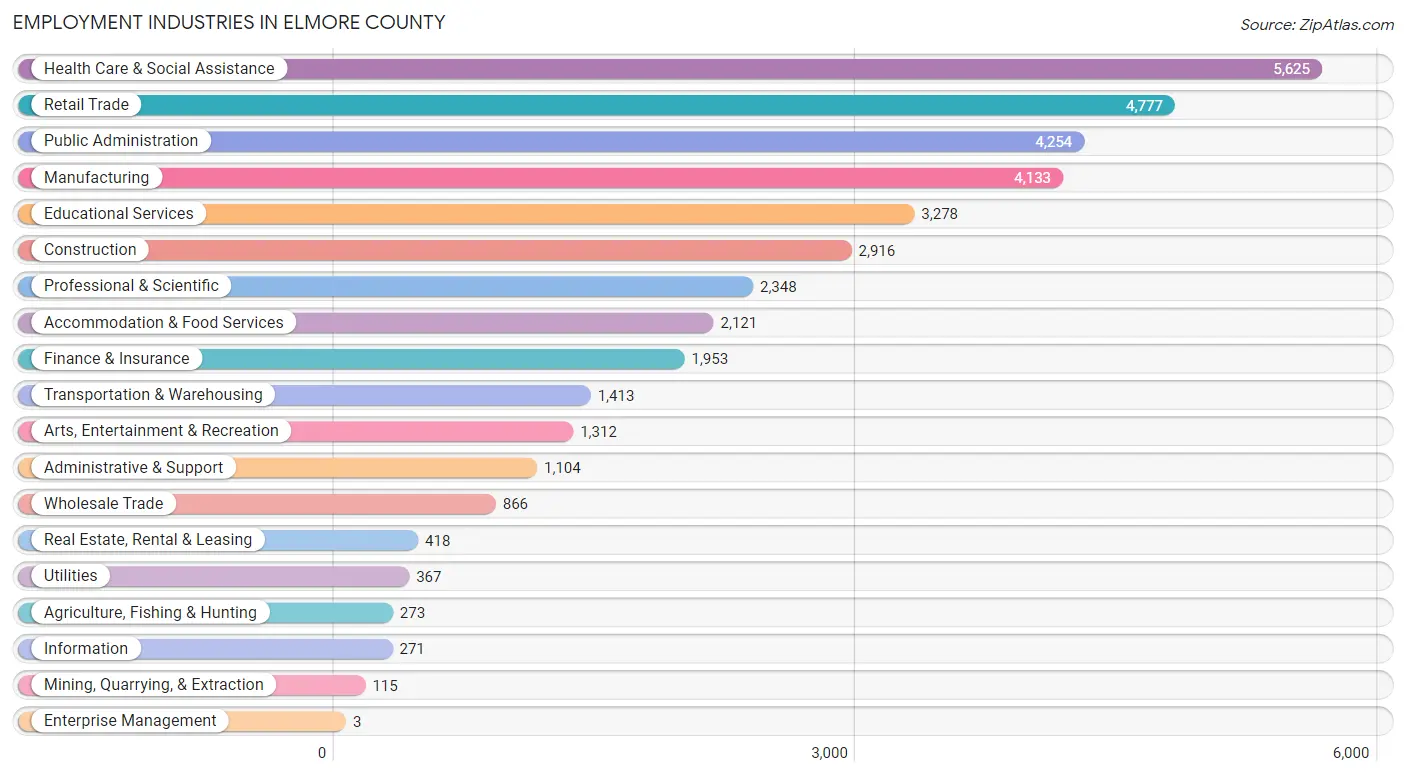
Employment Industries in Elmore County
The major employment industries in Elmore County include Health Care & Social Assistance (5,625 | 14.3%), Retail Trade (4,777 | 12.2%), Public Administration (4,254 | 10.8%), Manufacturing (4,133 | 10.5%), and Educational Services (3,278 | 8.4%).
Employment Industries by Sex in Elmore County
The Elmore County industries that see more men than women are Mining, Quarrying, & Extraction (100.0%), Enterprise Management (100.0%), and Construction (94.1%), whereas the industries that tend to have a higher number of women are Finance & Insurance (84.1%), Educational Services (81.1%), and Health Care & Social Assistance (80.1%).
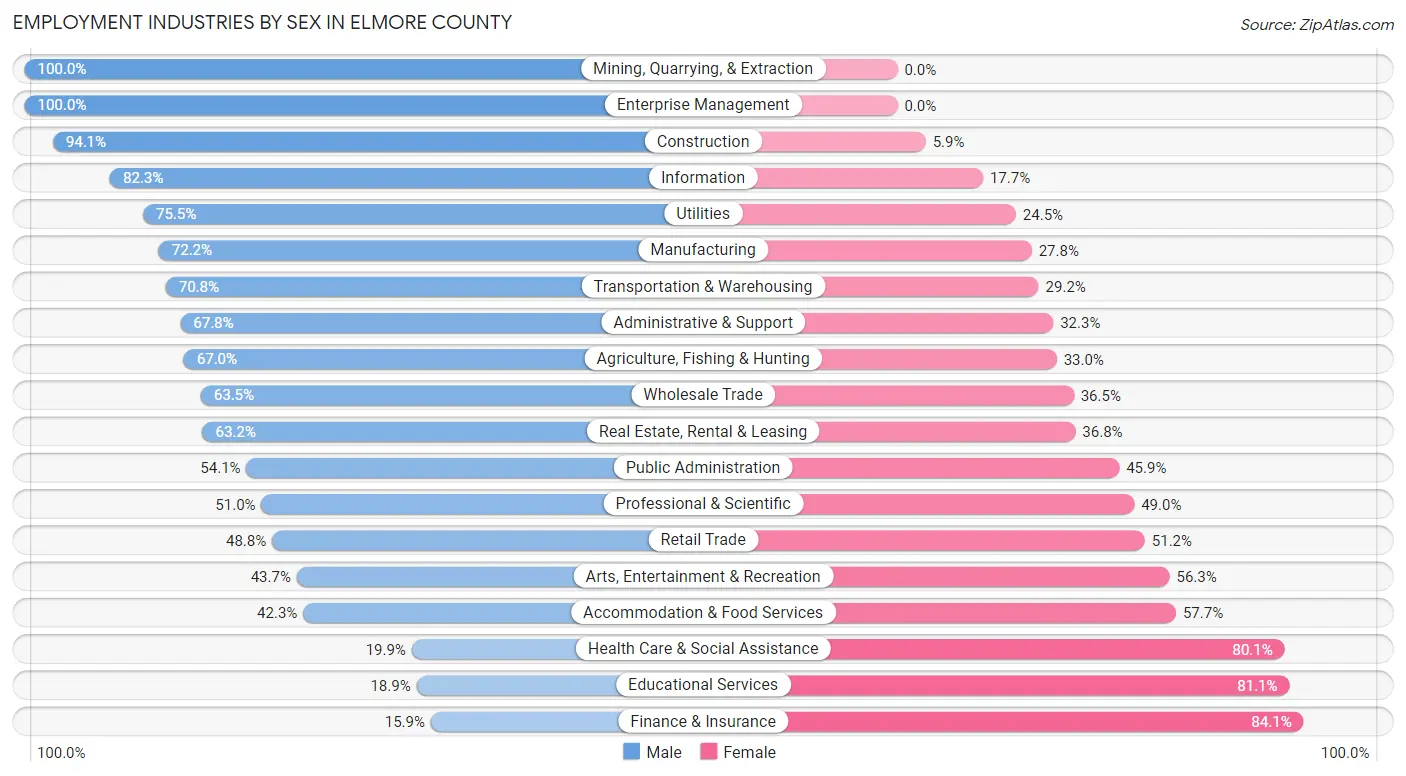
| Industry | Male | Female |
| Agriculture, Fishing & Hunting | 183 (67.0%) | 90 (33.0%) |
| Mining, Quarrying, & Extraction | 115 (100.0%) | 0 (0.0%) |
| Construction | 2,745 (94.1%) | 171 (5.9%) |
| Manufacturing | 2,984 (72.2%) | 1,149 (27.8%) |
| Wholesale Trade | 550 (63.5%) | 316 (36.5%) |
| Retail Trade | 2,330 (48.8%) | 2,447 (51.2%) |
| Transportation & Warehousing | 1,000 (70.8%) | 413 (29.2%) |
| Utilities | 277 (75.5%) | 90 (24.5%) |
| Information | 223 (82.3%) | 48 (17.7%) |
| Finance & Insurance | 311 (15.9%) | 1,642 (84.1%) |
| Real Estate, Rental & Leasing | 264 (63.2%) | 154 (36.8%) |
| Professional & Scientific | 1,197 (51.0%) | 1,151 (49.0%) |
| Enterprise Management | 3 (100.0%) | 0 (0.0%) |
| Administrative & Support | 748 (67.7%) | 356 (32.3%) |
| Educational Services | 619 (18.9%) | 2,659 (81.1%) |
| Health Care & Social Assistance | 1,118 (19.9%) | 4,507 (80.1%) |
| Arts, Entertainment & Recreation | 573 (43.7%) | 739 (56.3%) |
| Accommodation & Food Services | 898 (42.3%) | 1,223 (57.7%) |
| Public Administration | 2,301 (54.1%) | 1,953 (45.9%) |
| Total | 19,082 (48.6%) | 20,168 (51.4%) |
Education in Elmore County
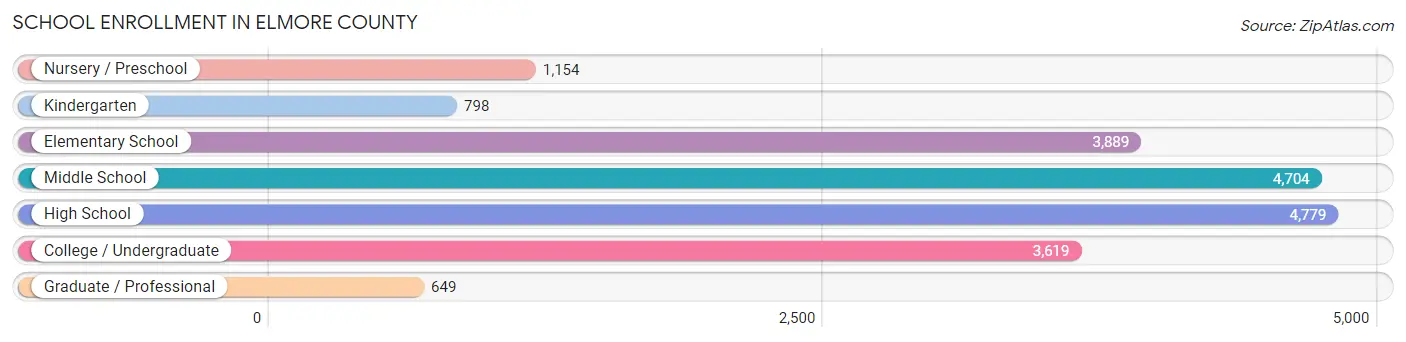
School Enrollment in Elmore County
The most common levels of schooling among the 19,592 students in Elmore County are high school (4,779 | 24.4%), middle school (4,704 | 24.0%), and elementary school (3,889 | 19.9%).
| School Level | # Students | % Students |
| Nursery / Preschool | 1,154 | 5.9% |
| Kindergarten | 798 | 4.1% |
| Elementary School | 3,889 | 19.9% |
| Middle School | 4,704 | 24.0% |
| High School | 4,779 | 24.4% |
| College / Undergraduate | 3,619 | 18.5% |
| Graduate / Professional | 649 | 3.3% |
| Total | 19,592 | 100.0% |
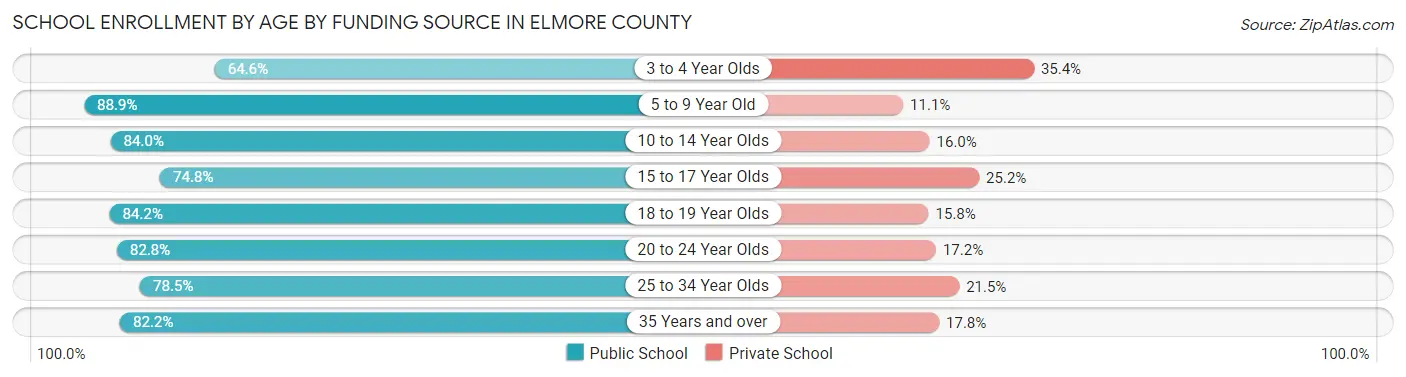
School Enrollment by Age by Funding Source in Elmore County
Out of a total of 19,592 students who are enrolled in schools in Elmore County, 3,487 (17.8%) attend a private institution, while the remaining 16,105 (82.2%) are enrolled in public schools. The age group of 3 to 4 year olds has the highest likelihood of being enrolled in private schools, with 319 (35.4% in the age bracket) enrolled. Conversely, the age group of 5 to 9 year old has the lowest likelihood of being enrolled in a private school, with 4,011 (88.9% in the age bracket) attending a public institution.
| Age Bracket | Public School | Private School |
| 3 to 4 Year Olds | 581 (64.6%) | 319 (35.4%) |
| 5 to 9 Year Old | 4,011 (88.9%) | 500 (11.1%) |
| 10 to 14 Year Olds | 4,689 (84.0%) | 894 (16.0%) |
| 15 to 17 Year Olds | 2,473 (74.8%) | 835 (25.2%) |
| 18 to 19 Year Olds | 1,075 (84.2%) | 202 (15.8%) |
| 20 to 24 Year Olds | 1,758 (82.8%) | 365 (17.2%) |
| 25 to 34 Year Olds | 777 (78.5%) | 213 (21.5%) |
| 35 Years and over | 740 (82.2%) | 160 (17.8%) |
| Total | 16,105 (82.2%) | 3,487 (17.8%) |
Educational Attainment by Field of Study in Elmore County
Business (3,853 | 24.6%), education (2,220 | 14.2%), science & technology (1,744 | 11.1%), bio, nature & agricultural (1,301 | 8.3%), and engineering (992 | 6.3%) are the most common fields of study among 15,670 individuals in Elmore County who have obtained a bachelor's degree or higher.
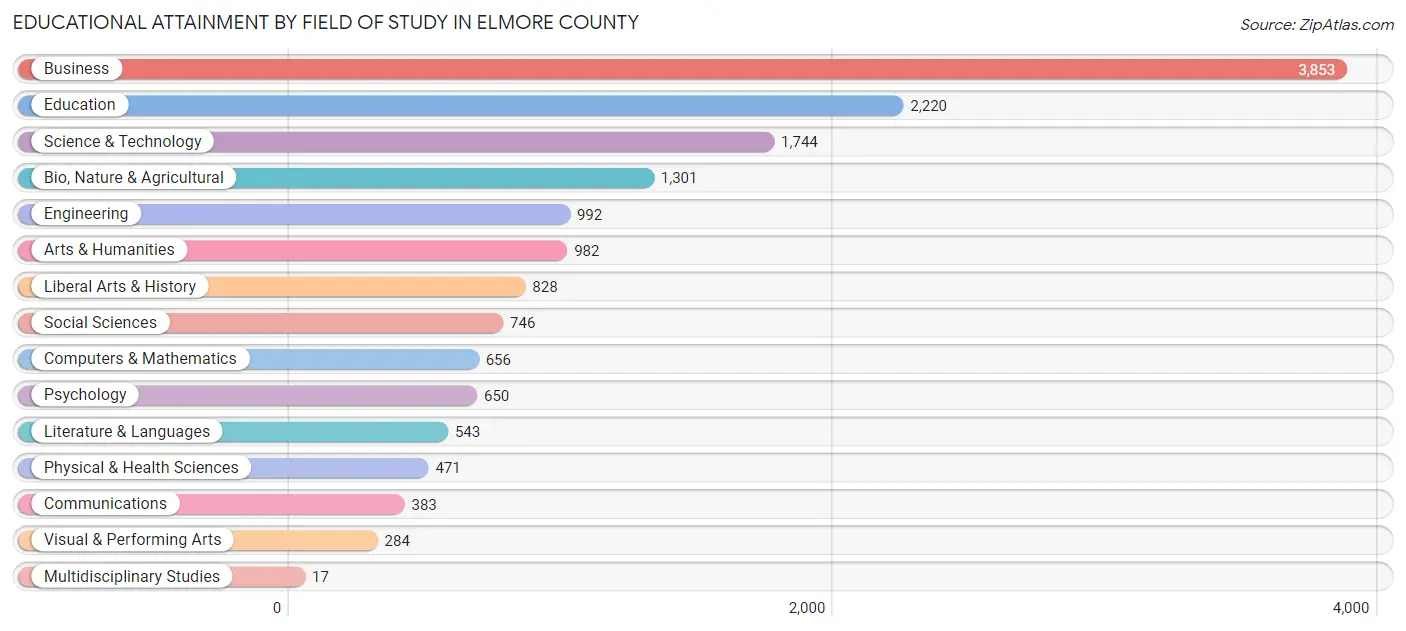
| Field of Study | # Graduates | % Graduates |
| Computers & Mathematics | 656 | 4.2% |
| Bio, Nature & Agricultural | 1,301 | 8.3% |
| Physical & Health Sciences | 471 | 3.0% |
| Psychology | 650 | 4.2% |
| Social Sciences | 746 | 4.8% |
| Engineering | 992 | 6.3% |
| Multidisciplinary Studies | 17 | 0.1% |
| Science & Technology | 1,744 | 11.1% |
| Business | 3,853 | 24.6% |
| Education | 2,220 | 14.2% |
| Literature & Languages | 543 | 3.5% |
| Liberal Arts & History | 828 | 5.3% |
| Visual & Performing Arts | 284 | 1.8% |
| Communications | 383 | 2.4% |
| Arts & Humanities | 982 | 6.3% |
| Total | 15,670 | 100.0% |
Transportation & Commute in Elmore County
Vehicle Availability by Sex in Elmore County
The most prevalent vehicle ownership categories in Elmore County are males with 2 vehicles (7,313, accounting for 38.3%) and females with 2 vehicles (7,031, making up 37.0%).
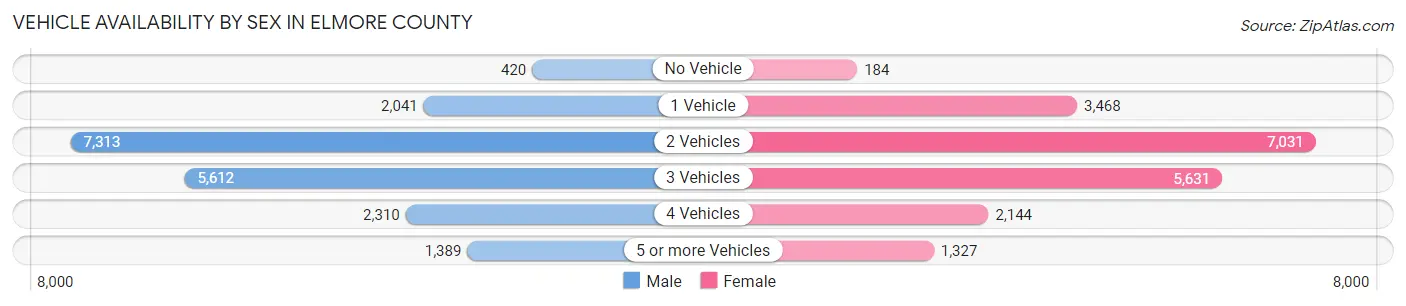
| Vehicles Available | Male | Female |
| No Vehicle | 420 (2.2%) | 184 (0.9%) |
| 1 Vehicle | 2,041 (10.7%) | 3,468 (17.5%) |
| 2 Vehicles | 7,313 (38.3%) | 7,031 (35.5%) |
| 3 Vehicles | 5,612 (29.4%) | 5,631 (28.5%) |
| 4 Vehicles | 2,310 (12.1%) | 2,144 (10.8%) |
| 5 or more Vehicles | 1,389 (7.3%) | 1,327 (6.7%) |
| Total | 19,085 (100.0%) | 19,785 (100.0%) |
Commute Time in Elmore County
The most frequently occuring commute durations in Elmore County are 30 to 34 minutes (7,497 commuters, 20.6%), 20 to 24 minutes (5,441 commuters, 14.9%), and 15 to 19 minutes (4,399 commuters, 12.1%).
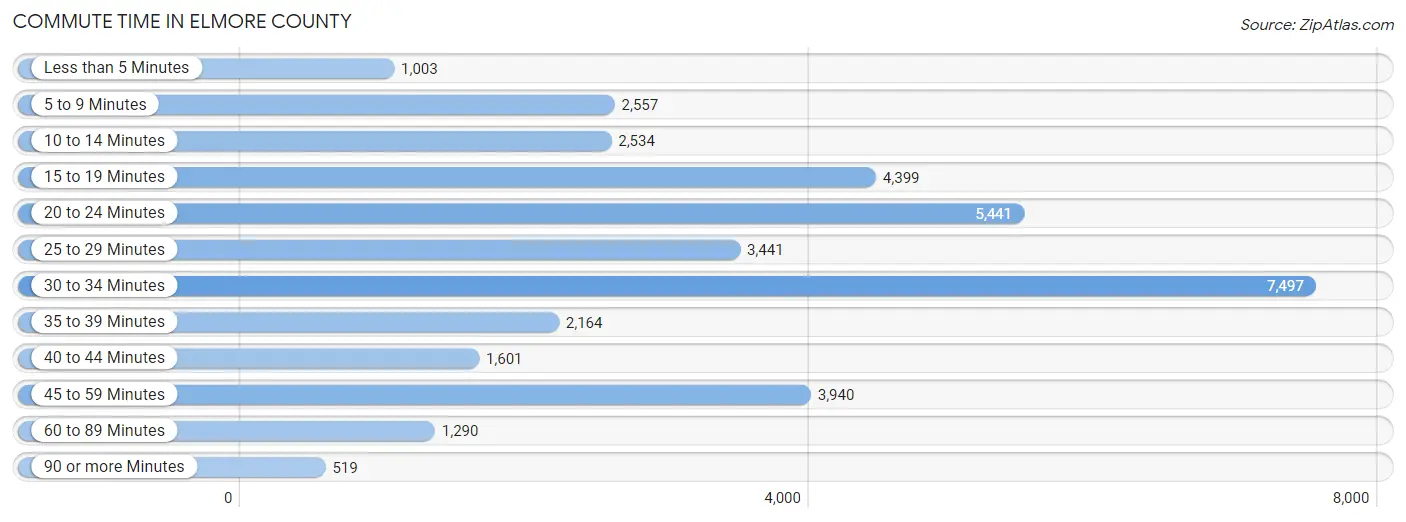
| Commute Time | # Commuters | % Commuters |
| Less than 5 Minutes | 1,003 | 2.8% |
| 5 to 9 Minutes | 2,557 | 7.0% |
| 10 to 14 Minutes | 2,534 | 7.0% |
| 15 to 19 Minutes | 4,399 | 12.1% |
| 20 to 24 Minutes | 5,441 | 14.9% |
| 25 to 29 Minutes | 3,441 | 9.5% |
| 30 to 34 Minutes | 7,497 | 20.6% |
| 35 to 39 Minutes | 2,164 | 5.9% |
| 40 to 44 Minutes | 1,601 | 4.4% |
| 45 to 59 Minutes | 3,940 | 10.8% |
| 60 to 89 Minutes | 1,290 | 3.5% |
| 90 or more Minutes | 519 | 1.4% |
Commute Time by Sex in Elmore County
The most common commute times in Elmore County are 30 to 34 minutes (3,945 commuters, 21.7%) for males and 30 to 34 minutes (3,552 commuters, 19.5%) for females.
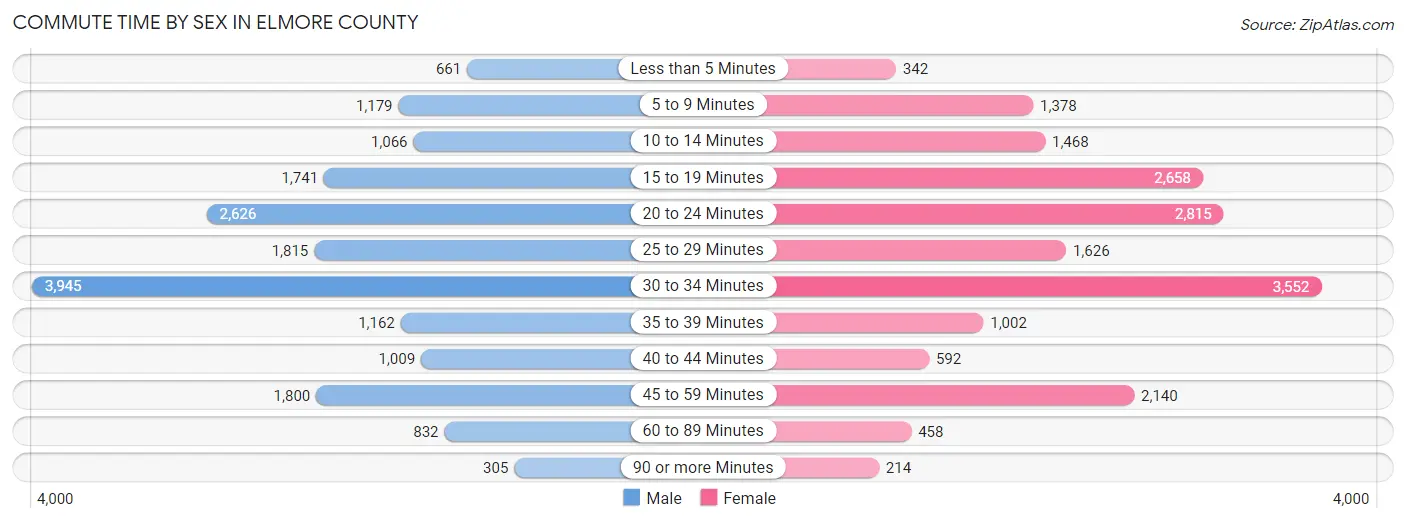
| Commute Time | Male | Female |
| Less than 5 Minutes | 661 (3.6%) | 342 (1.9%) |
| 5 to 9 Minutes | 1,179 (6.5%) | 1,378 (7.5%) |
| 10 to 14 Minutes | 1,066 (5.9%) | 1,468 (8.1%) |
| 15 to 19 Minutes | 1,741 (9.6%) | 2,658 (14.6%) |
| 20 to 24 Minutes | 2,626 (14.5%) | 2,815 (15.4%) |
| 25 to 29 Minutes | 1,815 (10.0%) | 1,626 (8.9%) |
| 30 to 34 Minutes | 3,945 (21.7%) | 3,552 (19.5%) |
| 35 to 39 Minutes | 1,162 (6.4%) | 1,002 (5.5%) |
| 40 to 44 Minutes | 1,009 (5.6%) | 592 (3.2%) |
| 45 to 59 Minutes | 1,800 (9.9%) | 2,140 (11.7%) |
| 60 to 89 Minutes | 832 (4.6%) | 458 (2.5%) |
| 90 or more Minutes | 305 (1.7%) | 214 (1.2%) |
Time of Departure to Work by Sex in Elmore County
The most frequent times of departure to work in Elmore County are 7:00 AM to 7:29 AM (3,880, 21.4%) for males and 7:00 AM to 7:29 AM (4,006, 22.0%) for females.
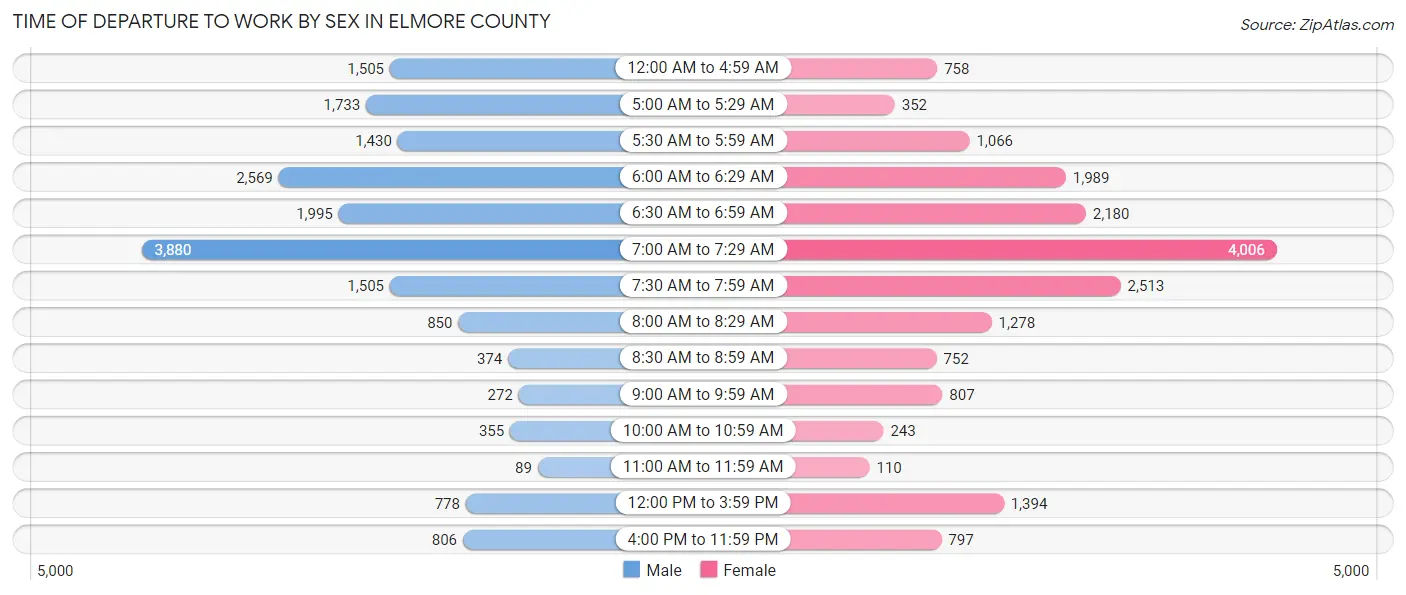
| Time of Departure | Male | Female |
| 12:00 AM to 4:59 AM | 1,505 (8.3%) | 758 (4.2%) |
| 5:00 AM to 5:29 AM | 1,733 (9.6%) | 352 (1.9%) |
| 5:30 AM to 5:59 AM | 1,430 (7.9%) | 1,066 (5.8%) |
| 6:00 AM to 6:29 AM | 2,569 (14.2%) | 1,989 (10.9%) |
| 6:30 AM to 6:59 AM | 1,995 (11.0%) | 2,180 (11.9%) |
| 7:00 AM to 7:29 AM | 3,880 (21.4%) | 4,006 (22.0%) |
| 7:30 AM to 7:59 AM | 1,505 (8.3%) | 2,513 (13.8%) |
| 8:00 AM to 8:29 AM | 850 (4.7%) | 1,278 (7.0%) |
| 8:30 AM to 8:59 AM | 374 (2.1%) | 752 (4.1%) |
| 9:00 AM to 9:59 AM | 272 (1.5%) | 807 (4.4%) |
| 10:00 AM to 10:59 AM | 355 (2.0%) | 243 (1.3%) |
| 11:00 AM to 11:59 AM | 89 (0.5%) | 110 (0.6%) |
| 12:00 PM to 3:59 PM | 778 (4.3%) | 1,394 (7.6%) |
| 4:00 PM to 11:59 PM | 806 (4.4%) | 797 (4.4%) |
| Total | 18,141 (100.0%) | 18,245 (100.0%) |
Housing Occupancy in Elmore County
Occupancy by Ownership in Elmore County
Of the total 32,184 dwellings in Elmore County, owner-occupied units account for 24,812 (77.1%), while renter-occupied units make up 7,372 (22.9%).
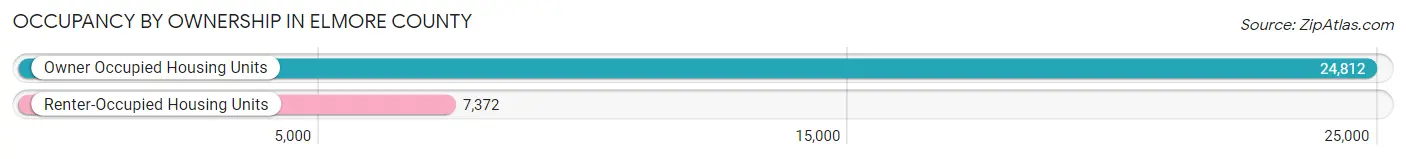
| Occupancy | # Housing Units | % Housing Units |
| Owner Occupied Housing Units | 24,812 | 77.1% |
| Renter-Occupied Housing Units | 7,372 | 22.9% |
| Total Occupied Housing Units | 32,184 | 100.0% |
Occupancy by Household Size in Elmore County
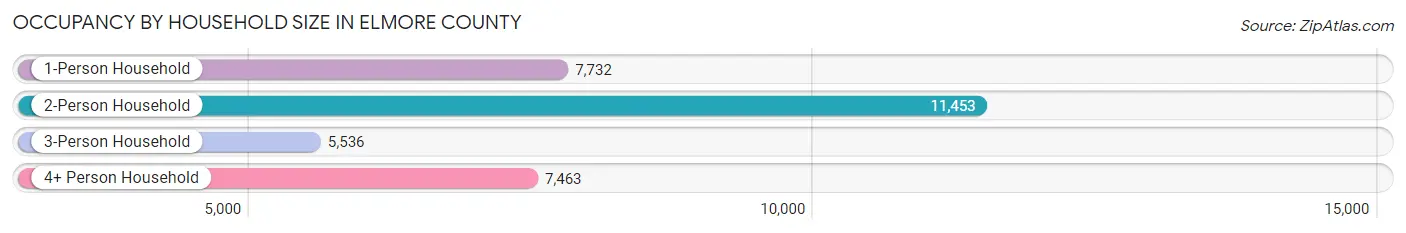
| Household Size | # Housing Units | % Housing Units |
| 1-Person Household | 7,732 | 24.0% |
| 2-Person Household | 11,453 | 35.6% |
| 3-Person Household | 5,536 | 17.2% |
| 4+ Person Household | 7,463 | 23.2% |
| Total Housing Units | 32,184 | 100.0% |
Occupancy by Ownership by Household Size in Elmore County
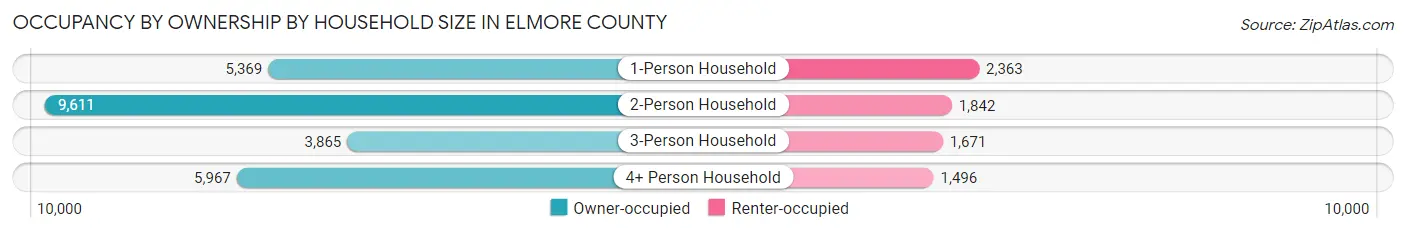
| Household Size | Owner-occupied | Renter-occupied |
| 1-Person Household | 5,369 (69.4%) | 2,363 (30.6%) |
| 2-Person Household | 9,611 (83.9%) | 1,842 (16.1%) |
| 3-Person Household | 3,865 (69.8%) | 1,671 (30.2%) |
| 4+ Person Household | 5,967 (79.9%) | 1,496 (20.1%) |
| Total Housing Units | 24,812 (77.1%) | 7,372 (22.9%) |
Occupancy by Educational Attainment in Elmore County
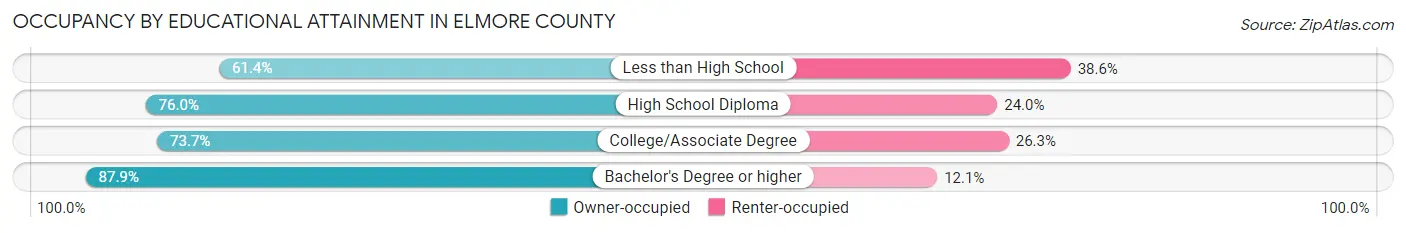
| Household Size | Owner-occupied | Renter-occupied |
| Less than High School | 1,723 (61.4%) | 1,082 (38.6%) |
| High School Diploma | 7,646 (76.0%) | 2,416 (24.0%) |
| College/Associate Degree | 7,978 (73.7%) | 2,846 (26.3%) |
| Bachelor's Degree or higher | 7,465 (87.9%) | 1,028 (12.1%) |
Occupancy by Age of Householder in Elmore County
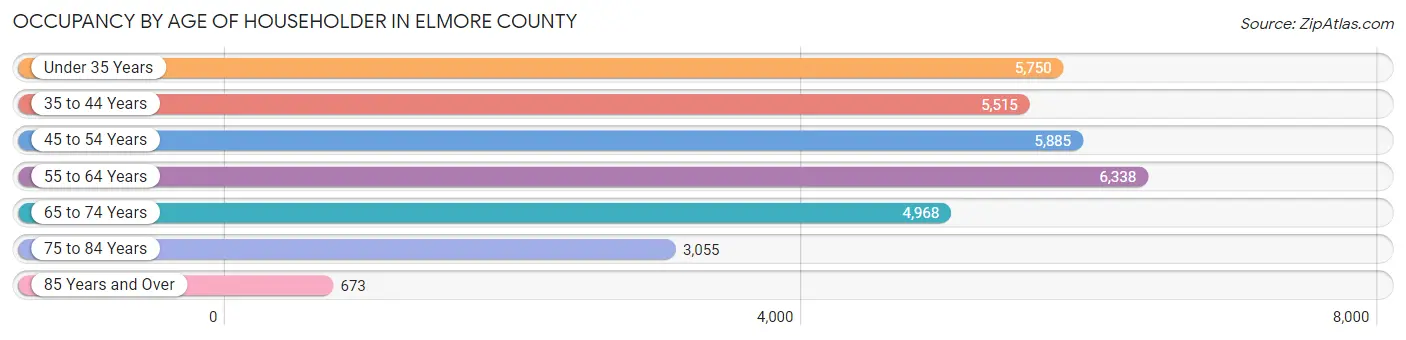
| Age Bracket | # Households | % Households |
| Under 35 Years | 5,750 | 17.9% |
| 35 to 44 Years | 5,515 | 17.1% |
| 45 to 54 Years | 5,885 | 18.3% |
| 55 to 64 Years | 6,338 | 19.7% |
| 65 to 74 Years | 4,968 | 15.4% |
| 75 to 84 Years | 3,055 | 9.5% |
| 85 Years and Over | 673 | 2.1% |
| Total | 32,184 | 100.0% |
Housing Finances in Elmore County
Median Income by Occupancy in Elmore County
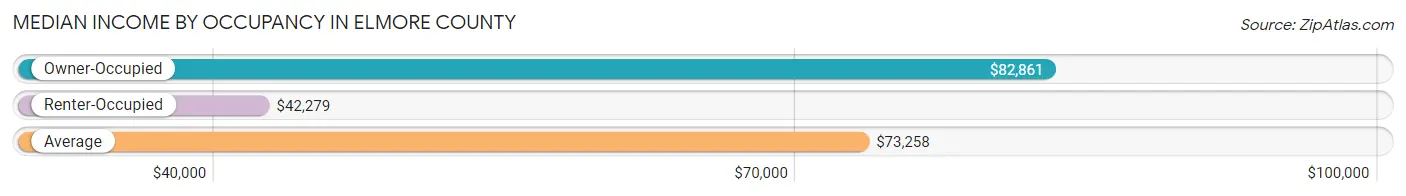
| Occupancy Type | # Households | Median Income |
| Owner-Occupied | 24,812 (77.1%) | $82,861 |
| Renter-Occupied | 7,372 (22.9%) | $42,279 |
| Average | 32,184 (100.0%) | $73,258 |
Occupancy by Householder Income Bracket in Elmore County
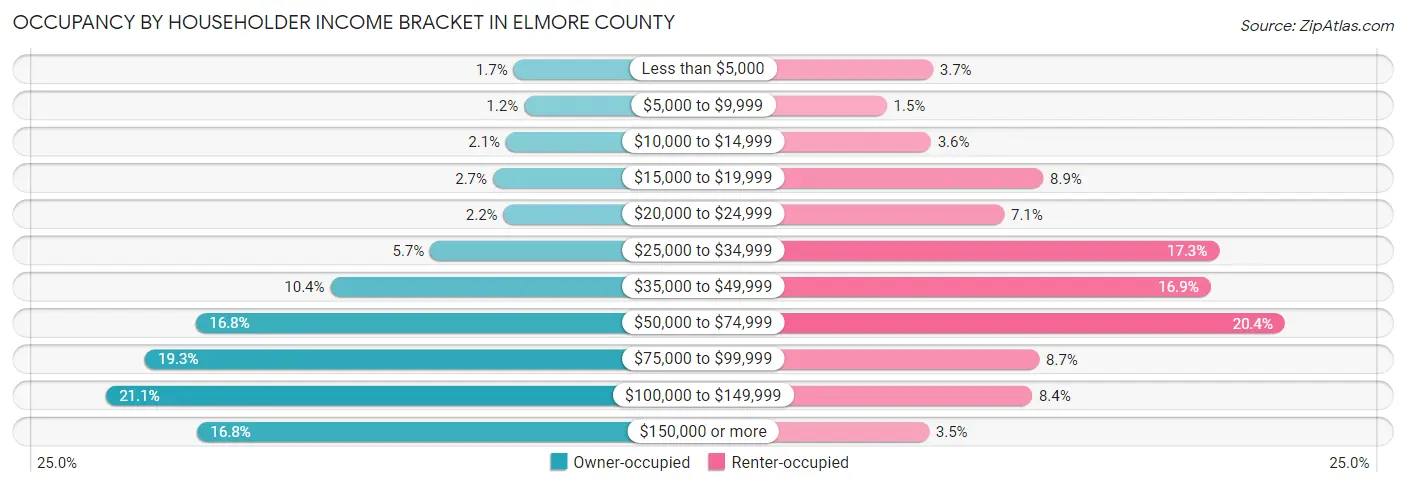
| Income Bracket | Owner-occupied | Renter-occupied |
| Less than $5,000 | 427 (1.7%) | 271 (3.7%) |
| $5,000 to $9,999 | 303 (1.2%) | 109 (1.5%) |
| $10,000 to $14,999 | 515 (2.1%) | 264 (3.6%) |
| $15,000 to $19,999 | 669 (2.7%) | 658 (8.9%) |
| $20,000 to $24,999 | 545 (2.2%) | 521 (7.1%) |
| $25,000 to $34,999 | 1,412 (5.7%) | 1,276 (17.3%) |
| $35,000 to $49,999 | 2,590 (10.4%) | 1,246 (16.9%) |
| $50,000 to $74,999 | 4,174 (16.8%) | 1,507 (20.4%) |
| $75,000 to $99,999 | 4,778 (19.3%) | 644 (8.7%) |
| $100,000 to $149,999 | 5,237 (21.1%) | 619 (8.4%) |
| $150,000 or more | 4,162 (16.8%) | 257 (3.5%) |
| Total | 24,812 (100.0%) | 7,372 (100.0%) |
Monthly Housing Cost Tiers in Elmore County
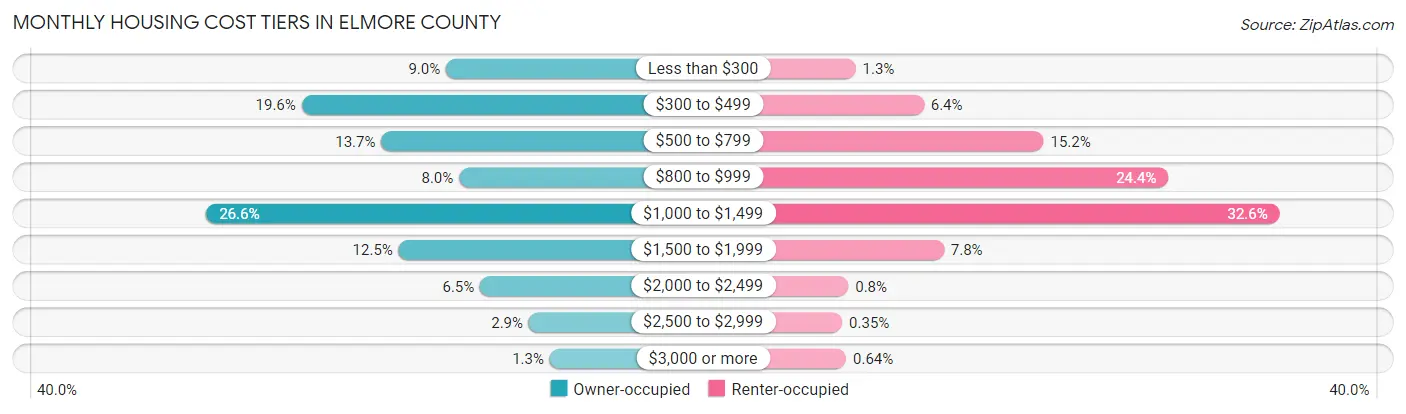
| Monthly Cost | Owner-occupied | Renter-occupied |
| Less than $300 | 2,224 (9.0%) | 99 (1.3%) |
| $300 to $499 | 4,862 (19.6%) | 469 (6.4%) |
| $500 to $799 | 3,407 (13.7%) | 1,119 (15.2%) |
| $800 to $999 | 1,984 (8.0%) | 1,796 (24.4%) |
| $1,000 to $1,499 | 6,606 (26.6%) | 2,400 (32.6%) |
| $1,500 to $1,999 | 3,090 (12.4%) | 578 (7.8%) |
| $2,000 to $2,499 | 1,601 (6.5%) | 59 (0.8%) |
| $2,500 to $2,999 | 710 (2.9%) | 26 (0.4%) |
| $3,000 or more | 328 (1.3%) | 47 (0.6%) |
| Total | 24,812 (100.0%) | 7,372 (100.0%) |
Physical Housing Characteristics in Elmore County
Housing Structures in Elmore County
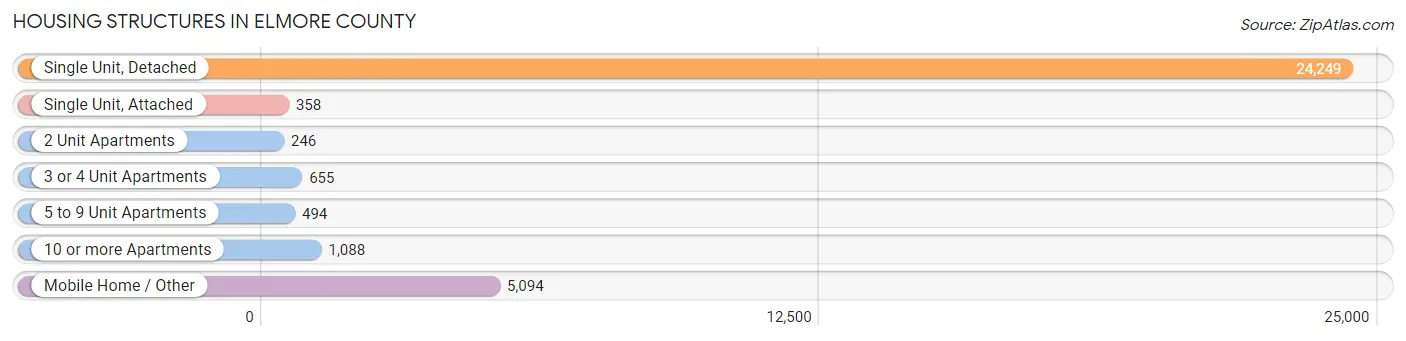
| Structure Type | # Housing Units | % Housing Units |
| Single Unit, Detached | 24,249 | 75.3% |
| Single Unit, Attached | 358 | 1.1% |
| 2 Unit Apartments | 246 | 0.8% |
| 3 or 4 Unit Apartments | 655 | 2.0% |
| 5 to 9 Unit Apartments | 494 | 1.5% |
| 10 or more Apartments | 1,088 | 3.4% |
| Mobile Home / Other | 5,094 | 15.8% |
| Total | 32,184 | 100.0% |
Housing Structures by Occupancy in Elmore County
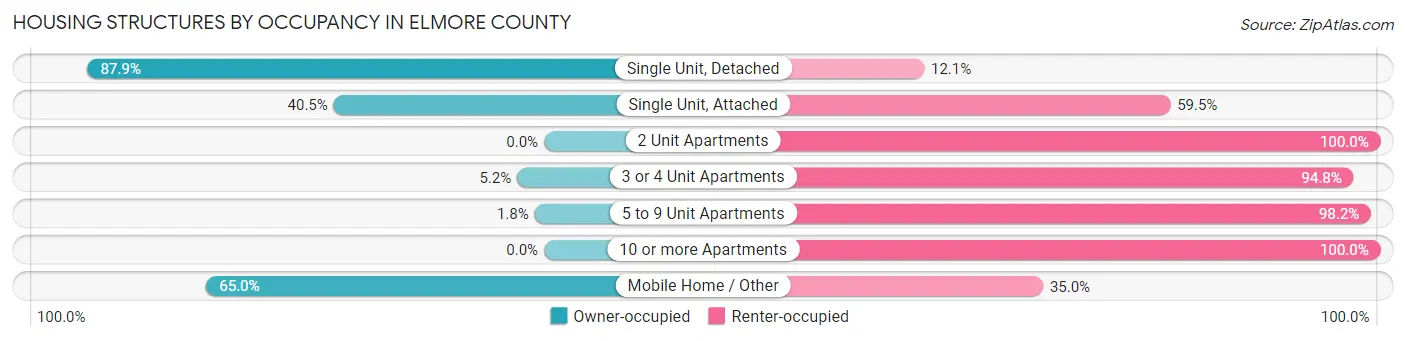
| Structure Type | Owner-occupied | Renter-occupied |
| Single Unit, Detached | 21,313 (87.9%) | 2,936 (12.1%) |
| Single Unit, Attached | 145 (40.5%) | 213 (59.5%) |
| 2 Unit Apartments | 0 (0.0%) | 246 (100.0%) |
| 3 or 4 Unit Apartments | 34 (5.2%) | 621 (94.8%) |
| 5 to 9 Unit Apartments | 9 (1.8%) | 485 (98.2%) |
| 10 or more Apartments | 0 (0.0%) | 1,088 (100.0%) |
| Mobile Home / Other | 3,311 (65.0%) | 1,783 (35.0%) |
| Total | 24,812 (77.1%) | 7,372 (22.9%) |
Housing Structures by Number of Rooms in Elmore County
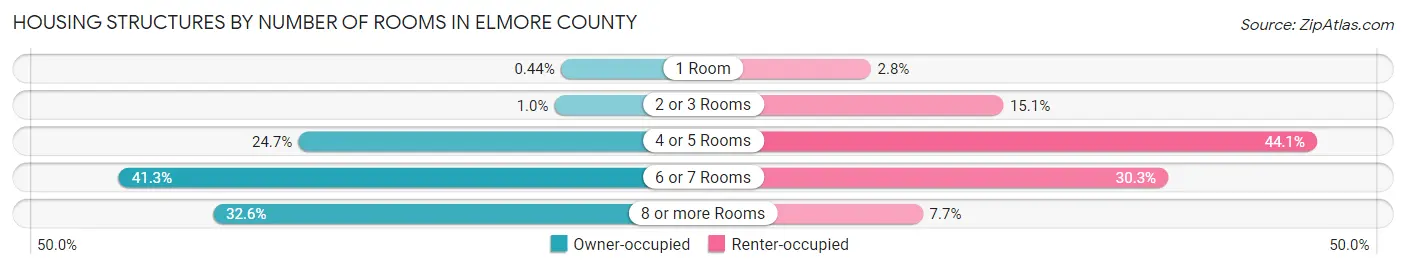
| Number of Rooms | Owner-occupied | Renter-occupied |
| 1 Room | 108 (0.4%) | 209 (2.8%) |
| 2 or 3 Rooms | 250 (1.0%) | 1,112 (15.1%) |
| 4 or 5 Rooms | 6,132 (24.7%) | 3,251 (44.1%) |
| 6 or 7 Rooms | 10,242 (41.3%) | 2,236 (30.3%) |
| 8 or more Rooms | 8,080 (32.6%) | 564 (7.6%) |
| Total | 24,812 (100.0%) | 7,372 (100.0%) |
Housing Structure by Heating Type in Elmore County
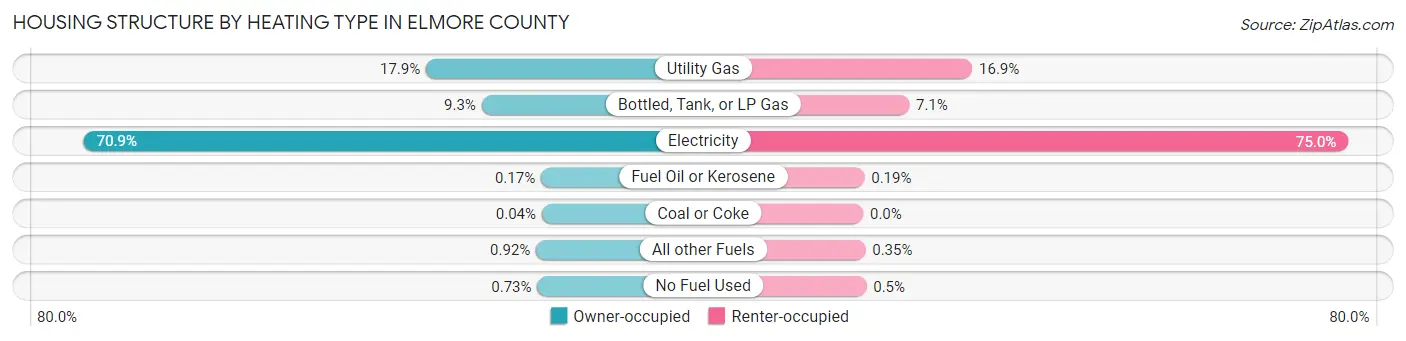
| Heating Type | Owner-occupied | Renter-occupied |
| Utility Gas | 4,451 (17.9%) | 1,243 (16.9%) |
| Bottled, Tank, or LP Gas | 2,317 (9.3%) | 524 (7.1%) |
| Electricity | 17,584 (70.9%) | 5,528 (75.0%) |
| Fuel Oil or Kerosene | 42 (0.2%) | 14 (0.2%) |
| Coal or Coke | 9 (0.0%) | 0 (0.0%) |
| All other Fuels | 229 (0.9%) | 26 (0.4%) |
| No Fuel Used | 180 (0.7%) | 37 (0.5%) |
| Total | 24,812 (100.0%) | 7,372 (100.0%) |
Household Vehicle Usage in Elmore County
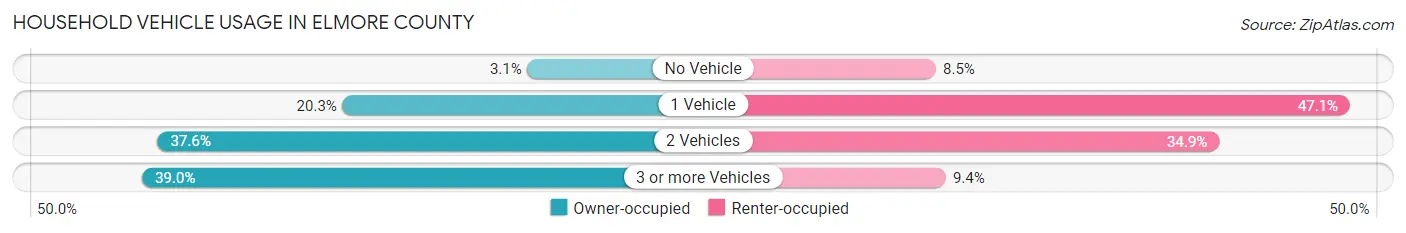
| Vehicles per Household | Owner-occupied | Renter-occupied |
| No Vehicle | 758 (3.0%) | 627 (8.5%) |
| 1 Vehicle | 5,040 (20.3%) | 3,475 (47.1%) |
| 2 Vehicles | 9,327 (37.6%) | 2,575 (34.9%) |
| 3 or more Vehicles | 9,687 (39.0%) | 695 (9.4%) |
| Total | 24,812 (100.0%) | 7,372 (100.0%) |
Real Estate & Mortgages in Elmore County
Real Estate and Mortgage Overview in Elmore County
| Characteristic | Without Mortgage | With Mortgage |
| Housing Units | 9,677 | 15,135 |
| Median Property Value | $170,500 | $213,000 |
| Median Household Income | $59,877 | $3,107 |
| Monthly Housing Costs | $398 | $326 |
| Real Estate Taxes | $432 | $1,501 |
Property Value by Mortgage Status in Elmore County
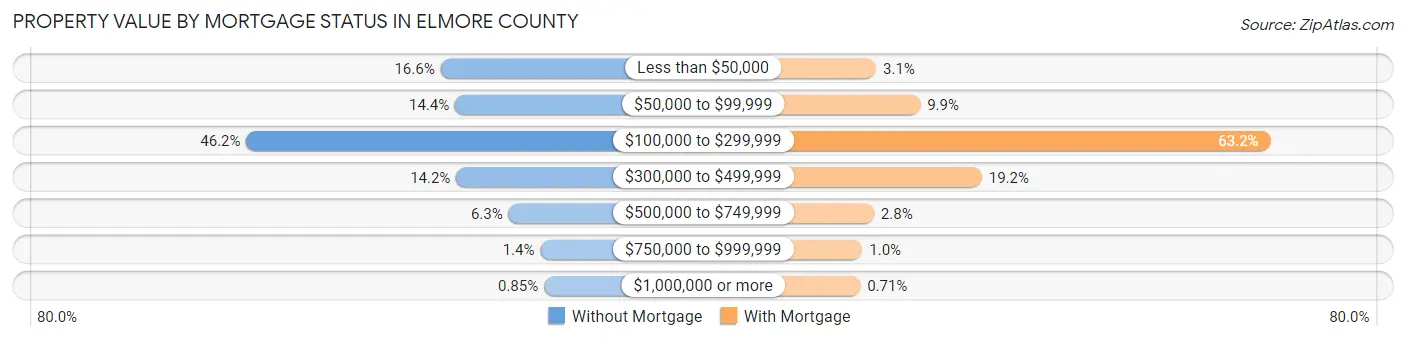
| Property Value | Without Mortgage | With Mortgage |
| Less than $50,000 | 1,609 (16.6%) | 474 (3.1%) |
| $50,000 to $99,999 | 1,394 (14.4%) | 1,493 (9.9%) |
| $100,000 to $299,999 | 4,472 (46.2%) | 9,567 (63.2%) |
| $300,000 to $499,999 | 1,377 (14.2%) | 2,912 (19.2%) |
| $500,000 to $749,999 | 606 (6.3%) | 424 (2.8%) |
| $750,000 to $999,999 | 137 (1.4%) | 157 (1.0%) |
| $1,000,000 or more | 82 (0.9%) | 108 (0.7%) |
| Total | 9,677 (100.0%) | 15,135 (100.0%) |
Household Income by Mortgage Status in Elmore County
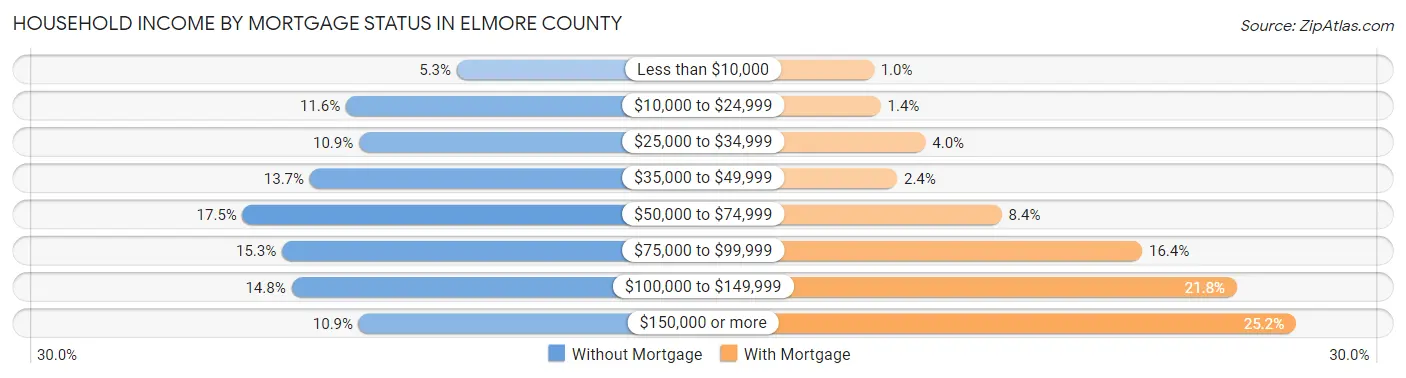
| Household Income | Without Mortgage | With Mortgage |
| Less than $10,000 | 513 (5.3%) | 157 (1.0%) |
| $10,000 to $24,999 | 1,125 (11.6%) | 217 (1.4%) |
| $25,000 to $34,999 | 1,054 (10.9%) | 604 (4.0%) |
| $35,000 to $49,999 | 1,326 (13.7%) | 358 (2.4%) |
| $50,000 to $74,999 | 1,697 (17.5%) | 1,264 (8.4%) |
| $75,000 to $99,999 | 1,480 (15.3%) | 2,477 (16.4%) |
| $100,000 to $149,999 | 1,427 (14.7%) | 3,298 (21.8%) |
| $150,000 or more | 1,055 (10.9%) | 3,810 (25.2%) |
| Total | 9,677 (100.0%) | 15,135 (100.0%) |
Property Value to Household Income Ratio in Elmore County
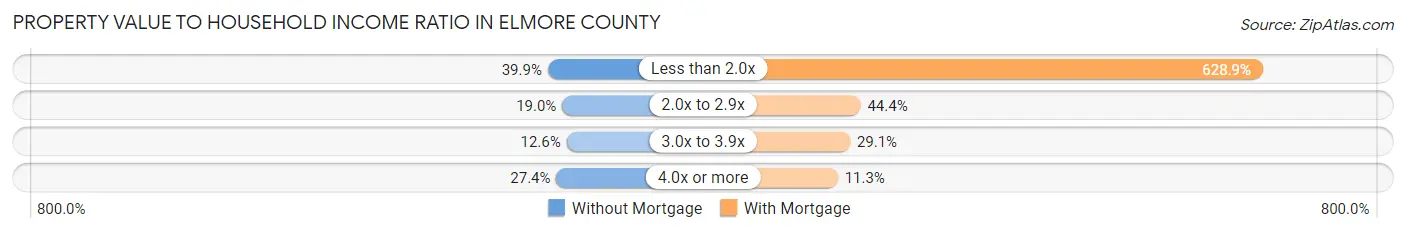
| Value-to-Income Ratio | Without Mortgage | With Mortgage |
| Less than 2.0x | 3,861 (39.9%) | 95,187 (628.9%) |
| 2.0x to 2.9x | 1,834 (19.0%) | 6,722 (44.4%) |
| 3.0x to 3.9x | 1,221 (12.6%) | 4,403 (29.1%) |
| 4.0x or more | 2,653 (27.4%) | 1,706 (11.3%) |
| Total | 9,677 (100.0%) | 15,135 (100.0%) |
Real Estate Taxes by Mortgage Status in Elmore County
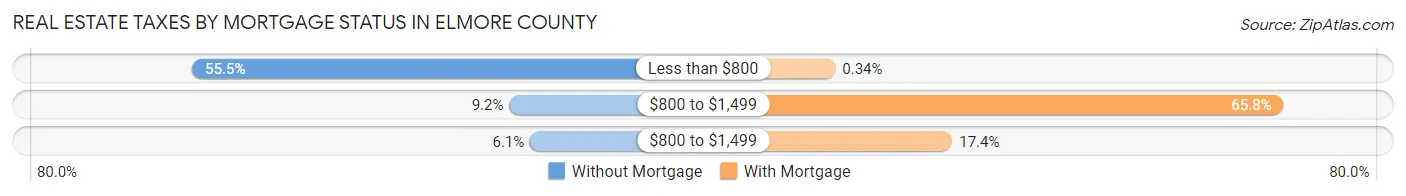
| Property Taxes | Without Mortgage | With Mortgage |
| Less than $800 | 5,374 (55.5%) | 51 (0.3%) |
| $800 to $1,499 | 887 (9.2%) | 9,964 (65.8%) |
| $800 to $1,499 | 593 (6.1%) | 2,638 (17.4%) |
| Total | 9,677 (100.0%) | 15,135 (100.0%) |
Health & Disability in Elmore County
Health Insurance Coverage by Age in Elmore County
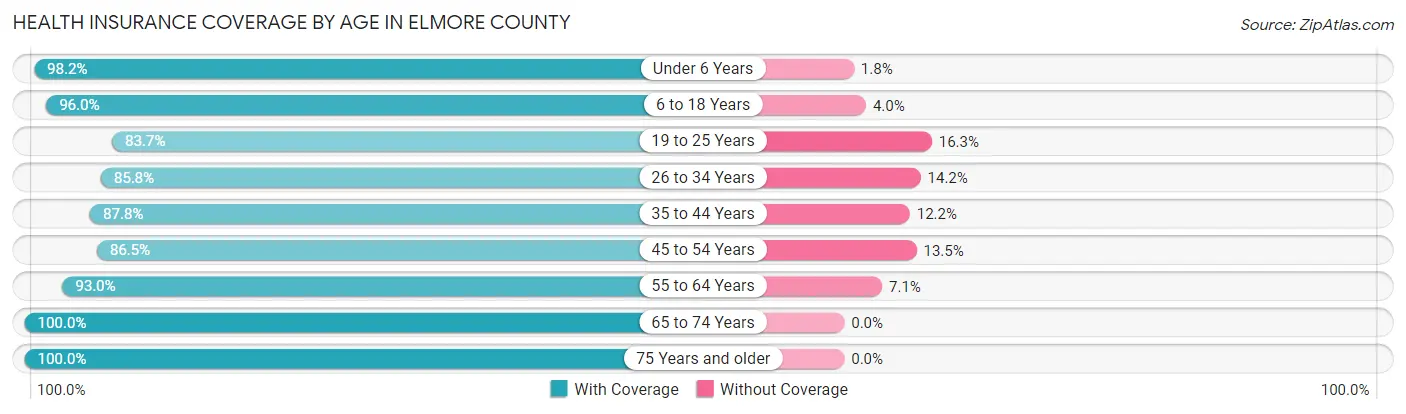
| Age Bracket | With Coverage | Without Coverage |
| Under 6 Years | 5,690 (98.2%) | 104 (1.8%) |
| 6 to 18 Years | 13,578 (96.0%) | 572 (4.0%) |
| 19 to 25 Years | 6,176 (83.7%) | 1,204 (16.3%) |
| 26 to 34 Years | 8,725 (85.8%) | 1,448 (14.2%) |
| 35 to 44 Years | 8,683 (87.8%) | 1,208 (12.2%) |
| 45 to 54 Years | 9,421 (86.5%) | 1,467 (13.5%) |
| 55 to 64 Years | 10,422 (92.9%) | 791 (7.0%) |
| 65 to 74 Years | 8,168 (100.0%) | 0 (0.0%) |
| 75 Years and older | 5,188 (100.0%) | 0 (0.0%) |
| Total | 76,051 (91.8%) | 6,794 (8.2%) |
Health Insurance Coverage by Citizenship Status in Elmore County
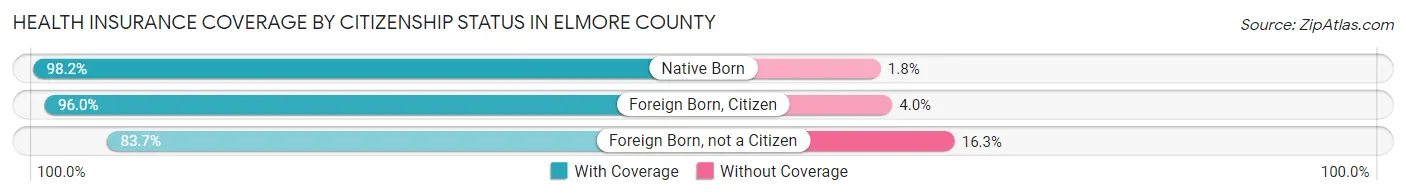
| Citizenship Status | With Coverage | Without Coverage |
| Native Born | 5,690 (98.2%) | 104 (1.8%) |
| Foreign Born, Citizen | 13,578 (96.0%) | 572 (4.0%) |
| Foreign Born, not a Citizen | 6,176 (83.7%) | 1,204 (16.3%) |
Health Insurance Coverage by Household Income in Elmore County
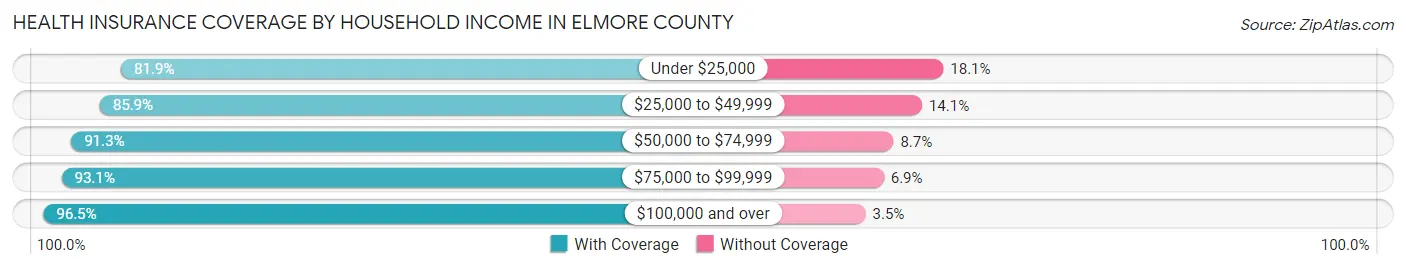
| Household Income | With Coverage | Without Coverage |
| Under $25,000 | 6,107 (81.9%) | 1,349 (18.1%) |
| $25,000 to $49,999 | 13,045 (85.9%) | 2,139 (14.1%) |
| $50,000 to $74,999 | 12,295 (91.3%) | 1,178 (8.7%) |
| $75,000 to $99,999 | 13,203 (93.1%) | 983 (6.9%) |
| $100,000 and over | 31,392 (96.5%) | 1,145 (3.5%) |
Public vs Private Health Insurance Coverage by Age in Elmore County
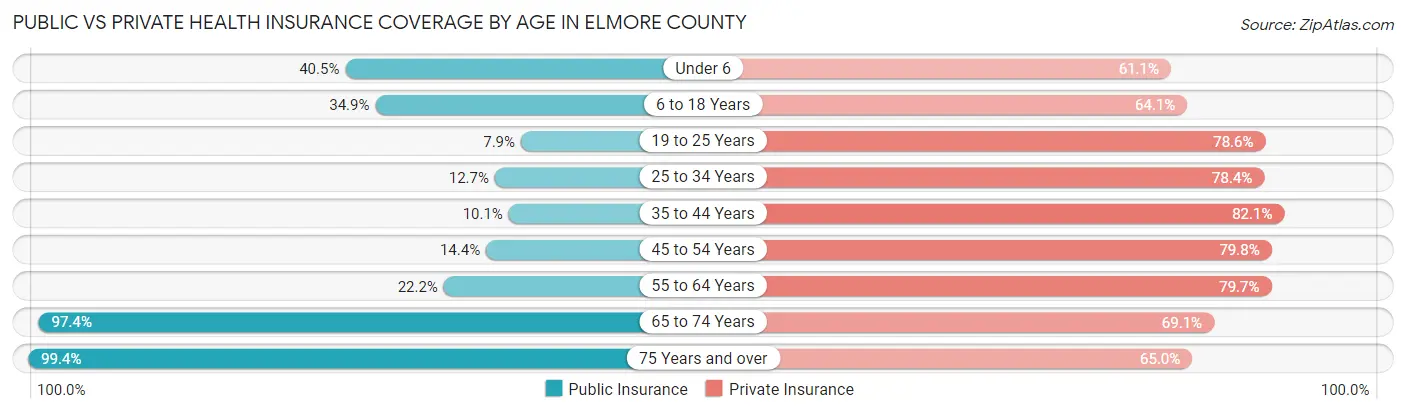
| Age Bracket | Public Insurance | Private Insurance |
| Under 6 | 2,346 (40.5%) | 3,538 (61.1%) |
| 6 to 18 Years | 4,939 (34.9%) | 9,070 (64.1%) |
| 19 to 25 Years | 582 (7.9%) | 5,801 (78.6%) |
| 25 to 34 Years | 1,295 (12.7%) | 7,975 (78.4%) |
| 35 to 44 Years | 1,003 (10.1%) | 8,122 (82.1%) |
| 45 to 54 Years | 1,564 (14.4%) | 8,683 (79.7%) |
| 55 to 64 Years | 2,490 (22.2%) | 8,939 (79.7%) |
| 65 to 74 Years | 7,956 (97.4%) | 5,641 (69.1%) |
| 75 Years and over | 5,155 (99.4%) | 3,373 (65.0%) |
| Total | 27,330 (33.0%) | 61,142 (73.8%) |
Disability Status by Sex by Age in Elmore County
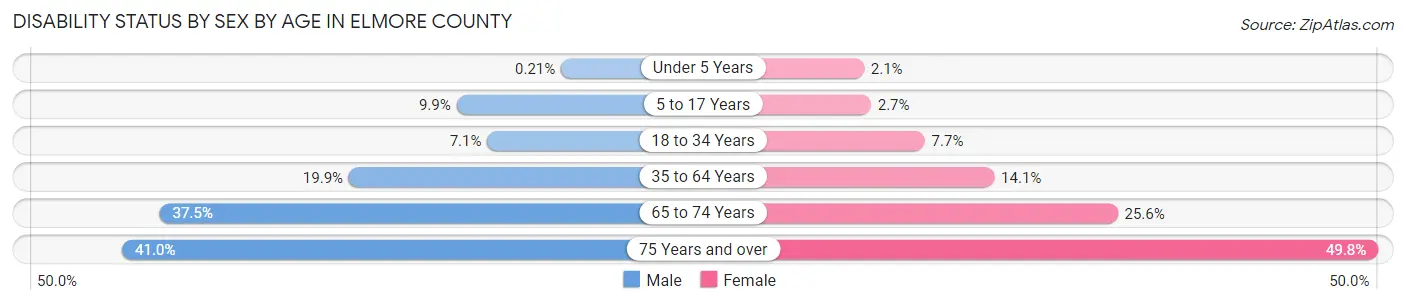
| Age Bracket | Male | Female |
| Under 5 Years | 5 (0.2%) | 49 (2.1%) |
| 5 to 17 Years | 739 (9.9%) | 183 (2.7%) |
| 18 to 34 Years | 621 (7.1%) | 742 (7.7%) |
| 35 to 64 Years | 2,820 (19.9%) | 2,519 (14.1%) |
| 65 to 74 Years | 1,441 (37.5%) | 1,106 (25.6%) |
| 75 Years and over | 873 (40.9%) | 1,521 (49.8%) |
Disability Class by Sex by Age in Elmore County
Disability Class: Hearing Difficulty
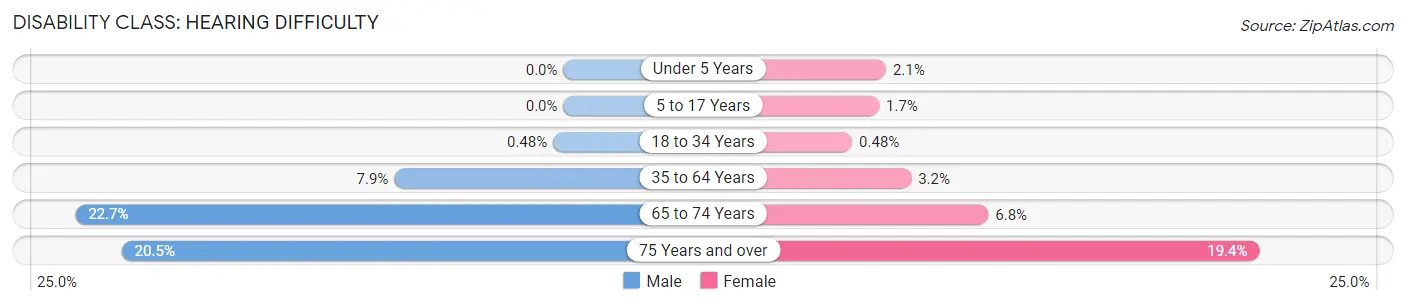
| Age Bracket | Male | Female |
| Under 5 Years | 0 (0.0%) | 49 (2.1%) |
| 5 to 17 Years | 0 (0.0%) | 118 (1.7%) |
| 18 to 34 Years | 42 (0.5%) | 46 (0.5%) |
| 35 to 64 Years | 1,113 (7.9%) | 573 (3.2%) |
| 65 to 74 Years | 871 (22.7%) | 294 (6.8%) |
| 75 Years and over | 437 (20.5%) | 592 (19.4%) |
Disability Class: Vision Difficulty
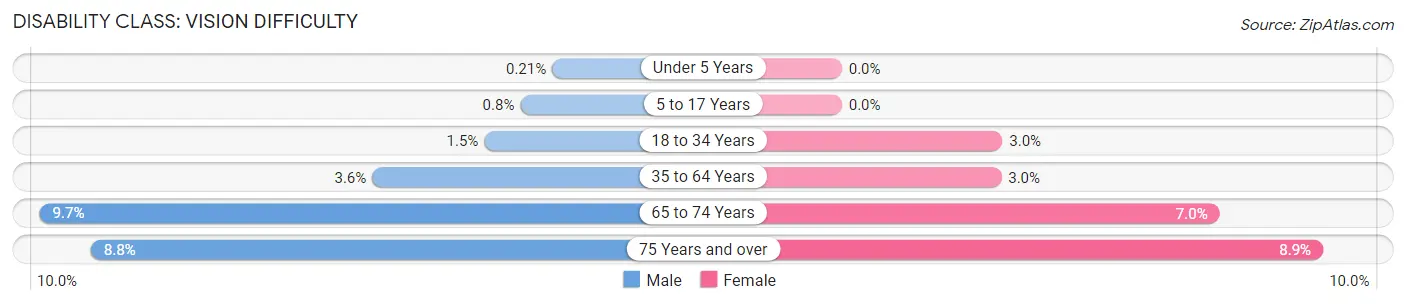
| Age Bracket | Male | Female |
| Under 5 Years | 5 (0.2%) | 0 (0.0%) |
| 5 to 17 Years | 60 (0.8%) | 0 (0.0%) |
| 18 to 34 Years | 129 (1.5%) | 288 (3.0%) |
| 35 to 64 Years | 503 (3.5%) | 528 (3.0%) |
| 65 to 74 Years | 374 (9.7%) | 303 (7.0%) |
| 75 Years and over | 187 (8.8%) | 273 (8.9%) |
Disability Class: Cognitive Difficulty
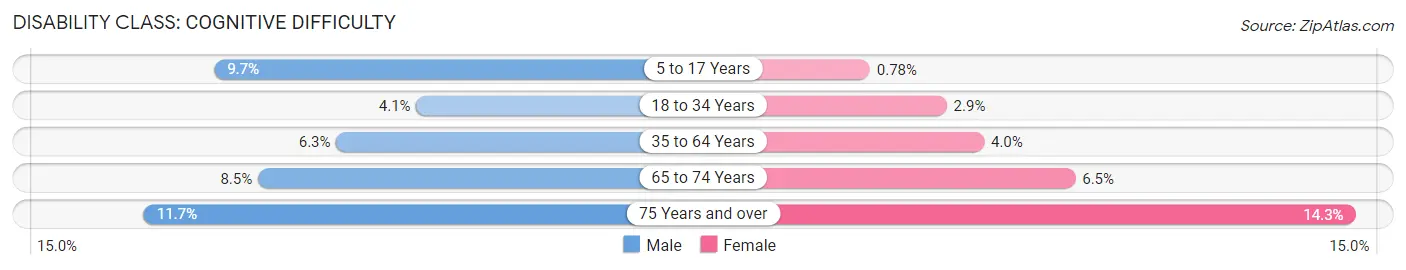
| Age Bracket | Male | Female |
| 5 to 17 Years | 725 (9.7%) | 53 (0.8%) |
| 18 to 34 Years | 360 (4.1%) | 282 (2.9%) |
| 35 to 64 Years | 896 (6.3%) | 705 (4.0%) |
| 65 to 74 Years | 327 (8.5%) | 281 (6.5%) |
| 75 Years and over | 249 (11.7%) | 437 (14.3%) |
Disability Class: Ambulatory Difficulty
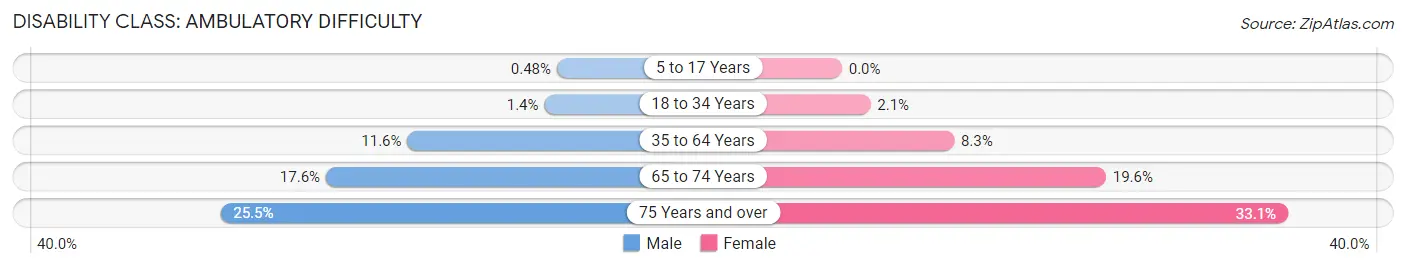
| Age Bracket | Male | Female |
| 5 to 17 Years | 36 (0.5%) | 0 (0.0%) |
| 18 to 34 Years | 124 (1.4%) | 205 (2.1%) |
| 35 to 64 Years | 1,641 (11.6%) | 1,485 (8.3%) |
| 65 to 74 Years | 678 (17.6%) | 847 (19.6%) |
| 75 Years and over | 543 (25.5%) | 1,012 (33.1%) |
Disability Class: Self-Care Difficulty
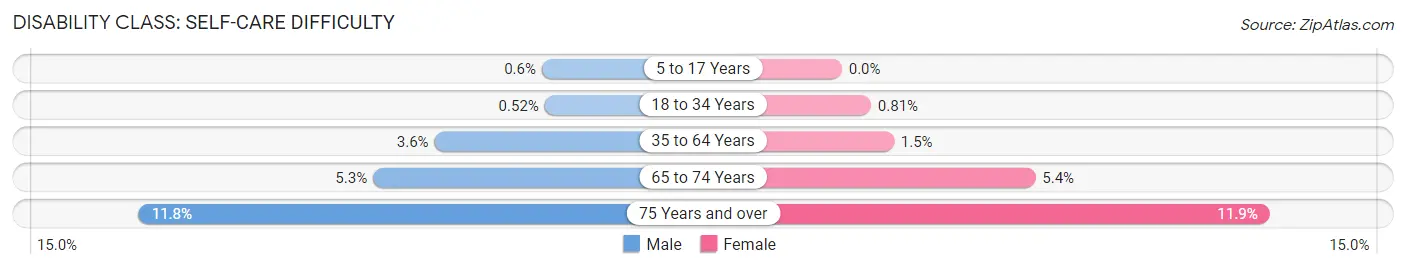
| Age Bracket | Male | Female |
| 5 to 17 Years | 45 (0.6%) | 0 (0.0%) |
| 18 to 34 Years | 46 (0.5%) | 78 (0.8%) |
| 35 to 64 Years | 509 (3.6%) | 259 (1.5%) |
| 65 to 74 Years | 204 (5.3%) | 233 (5.4%) |
| 75 Years and over | 252 (11.8%) | 364 (11.9%) |
Technology Access in Elmore County
Computing Device Access in Elmore County
| Device Type | # Households | % Households |
| Desktop or Laptop | 24,065 | 74.8% |
| Smartphone | 28,482 | 88.5% |
| Tablet | 21,211 | 65.9% |
| No Computing Device | 2,213 | 6.9% |
| Total | 32,184 | 100.0% |
Internet Access in Elmore County
| Internet Type | # Households | % Households |
| Dial-Up Internet | 60 | 0.2% |
| Broadband Home | 23,886 | 74.2% |
| Cellular Data Only | 3,087 | 9.6% |
| Satellite Internet | 1,848 | 5.7% |
| No Internet | 3,763 | 11.7% |
| Total | 32,184 | 100.0% |
Elmore County Summary
Elmore County is located in the central part of the state of Alabama, in the southeastern United States. It is bordered by Autauga County to the north, Montgomery County to the east, Macon County to the south, and Coosa and Tallapoosa counties to the west. The county seat is Wetumpka, and the largest city is Millbrook. As of the 2010 census, the population of Elmore County was 79,303.
History
Elmore County was established on February 15, 1866, from parts of Autauga, Coosa, and Tallapoosa counties. It was named for General John A. Elmore, a Confederate officer who was killed in the Battle of Franklin in 1864. The county was originally part of the Creek Nation, and the Creek Indians were the first inhabitants of the area.
The county was largely rural until the 1950s, when the population began to grow rapidly due to the influx of people from other parts of the state and the country. The growth was fueled by the construction of the Montgomery-to-Atlanta highway, which runs through the county.
Geography
Elmore County covers an area of 602 square miles, of which 599 square miles is land and 3 square miles is water. The county is located in the Piedmont region of the state, and is characterized by rolling hills and valleys. The Tallapoosa River forms the western boundary of the county, and the Coosa River forms the eastern boundary.
The county is home to several state parks, including Chewacla State Park, Lake Martin State Park, and Wind Creek State Park. The county also contains several lakes, including Lake Martin, Lake Jordan, and Lake Tallassee.
Economy
The economy of Elmore County is largely based on agriculture, manufacturing, and tourism. The county is home to several large poultry farms, as well as several large manufacturing plants, including a Honda plant in Lincoln.
Tourism is also an important part of the economy, with several state parks and lakes in the county. The county is also home to several golf courses, as well as the Wetumpka Impact Crater, which is a popular tourist attraction.
Demographics
As of the 2010 census, the population of Elmore County was 79,303, with a population density of 132 people per square mile. The racial makeup of the county was 73.3% White, 22.2% Black or African American, 0.5% Native American, 1.2% Asian, 0.1% Pacific Islander, 1.7% from other races, and 1.2% from two or more races. Hispanic or Latino of any race were 3.3% of the population.
The median income for a household in the county was $45,845, and the median income for a family was $54,845. The per capita income for the county was $22,845. About 11.3% of families and 14.2% of the population were below the poverty line, including 19.2% of those under age 18 and 10.2% of those age 65 or over.
Common Questions
What is Per Capita Income in Elmore County?
Per Capita income in Elmore County is $34,152.
What is the Median Family Income in Elmore County?
Median Family Income in Elmore County is $84,463.
What is the Median Household income in Elmore County?
Median Household Income in Elmore County is $73,258.
What is Income or Wage Gap in Elmore County?
Income or Wage Gap in Elmore County is 26.8%.
Women in Elmore County earn 73.2 cents for every dollar earned by a man.
What is Family Income Deficit in Elmore County?
Family Income Deficit in Elmore County is $10,069.
Families that are below poverty line in Elmore County earn $10,069 less on average than the poverty threshold level.
What is Inequality or Gini Index in Elmore County?
Inequality or Gini Index in Elmore County is 0.42.
What is the Total Population of Elmore County?
Total Population of Elmore County is 87,694.
What is the Total Male Population of Elmore County?
Total Male Population of Elmore County is 42,743.
What is the Total Female Population of Elmore County?
Total Female Population of Elmore County is 44,951.
What is the Ratio of Males per 100 Females in Elmore County?
There are 95.09 Males per 100 Females in Elmore County.
What is the Ratio of Females per 100 Males in Elmore County?
There are 105.17 Females per 100 Males in Elmore County.
What is the Median Population Age in Elmore County?
Median Population Age in Elmore County is 38.9 Years.
What is the Average Family Size in Elmore County
Average Family Size in Elmore County is 3.1 People.
What is the Average Household Size in Elmore County
Average Household Size in Elmore County is 2.6 People.
How Large is the Labor Force in Elmore County?
There are 41,503 People in the Labor Forcein in Elmore County.
What is the Percentage of People in the Labor Force in Elmore County?
58.6% of People are in the Labor Force in Elmore County.
What is the Unemployment Rate in Elmore County?
Unemployment Rate in Elmore County is 4.2%.