Tallapoosa County, AL Map & Demographics
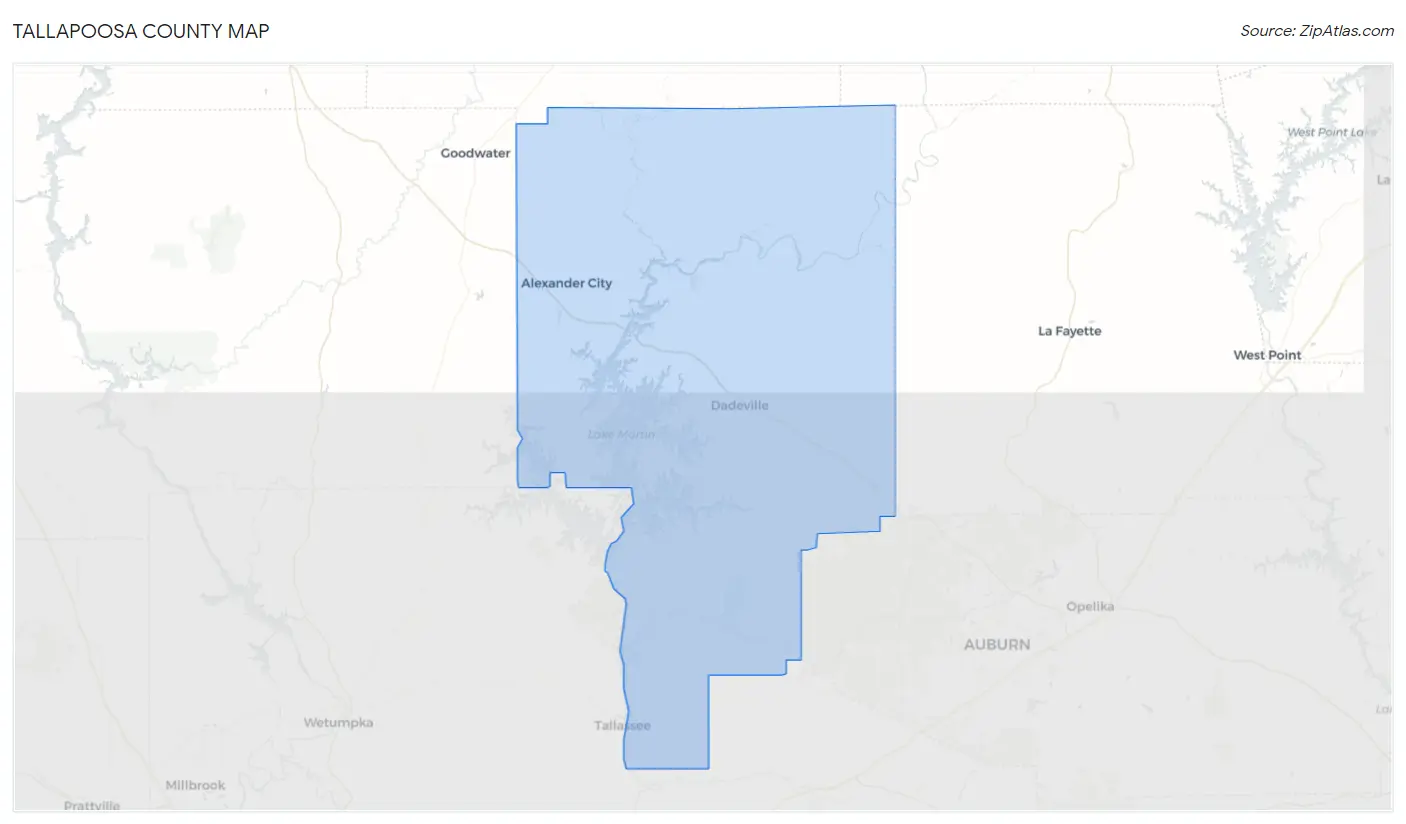
Tallapoosa County Map
Tallapoosa County Overview
$29,682
PER CAPITA INCOME
$63,358
AVG FAMILY INCOME
$53,282
AVG HOUSEHOLD INCOME
32.7%
WAGE / INCOME GAP [ % ]
67.3¢/ $1
WAGE / INCOME GAP [ $ ]
$10,651
FAMILY INCOME DEFICIT
0.49
INEQUALITY / GINI INDEX
41,251
TOTAL POPULATION
20,025
MALE POPULATION
21,226
FEMALE POPULATION
94.34
MALES / 100 FEMALES
106.00
FEMALES / 100 MALES
45.2
MEDIAN AGE
3.1
AVG FAMILY SIZE
2.5
AVG HOUSEHOLD SIZE
17,431
LABOR FORCE [ PEOPLE ]
51.4%
PERCENT IN LABOR FORCE
10.4%
UNEMPLOYMENT RATE
Income in Tallapoosa County
Income Overview in Tallapoosa County
Per Capita Income in Tallapoosa County is $29,682, while median incomes of families and households are $63,358 and $53,282 respectively.
| Characteristic | Number | Measure |
| Per Capita Income | 41,251 | $29,682 |
| Median Family Income | 10,754 | $63,358 |
| Mean Family Income | 10,754 | $83,696 |
| Median Household Income | 16,438 | $53,282 |
| Mean Household Income | 16,438 | $71,359 |
| Income Deficit | 10,754 | $10,651 |
| Wage / Income Gap (%) | 41,251 | 32.74% |
| Wage / Income Gap ($) | 41,251 | 67.26¢ per $1 |
| Gini / Inequality Index | 41,251 | 0.49 |
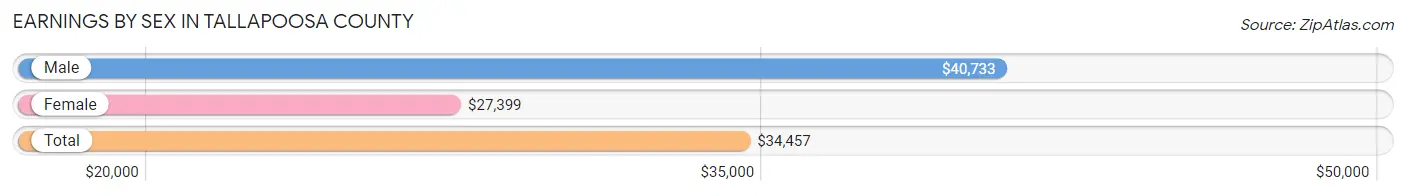
Earnings by Sex in Tallapoosa County
Average Earnings in Tallapoosa County are $34,457, $40,733 for men and $27,399 for women, a difference of 32.7%.
| Sex | Number | Average Earnings |
| Male | 9,273 (52.4%) | $40,733 |
| Female | 8,429 (47.6%) | $27,399 |
| Total | 17,702 (100.0%) | $34,457 |
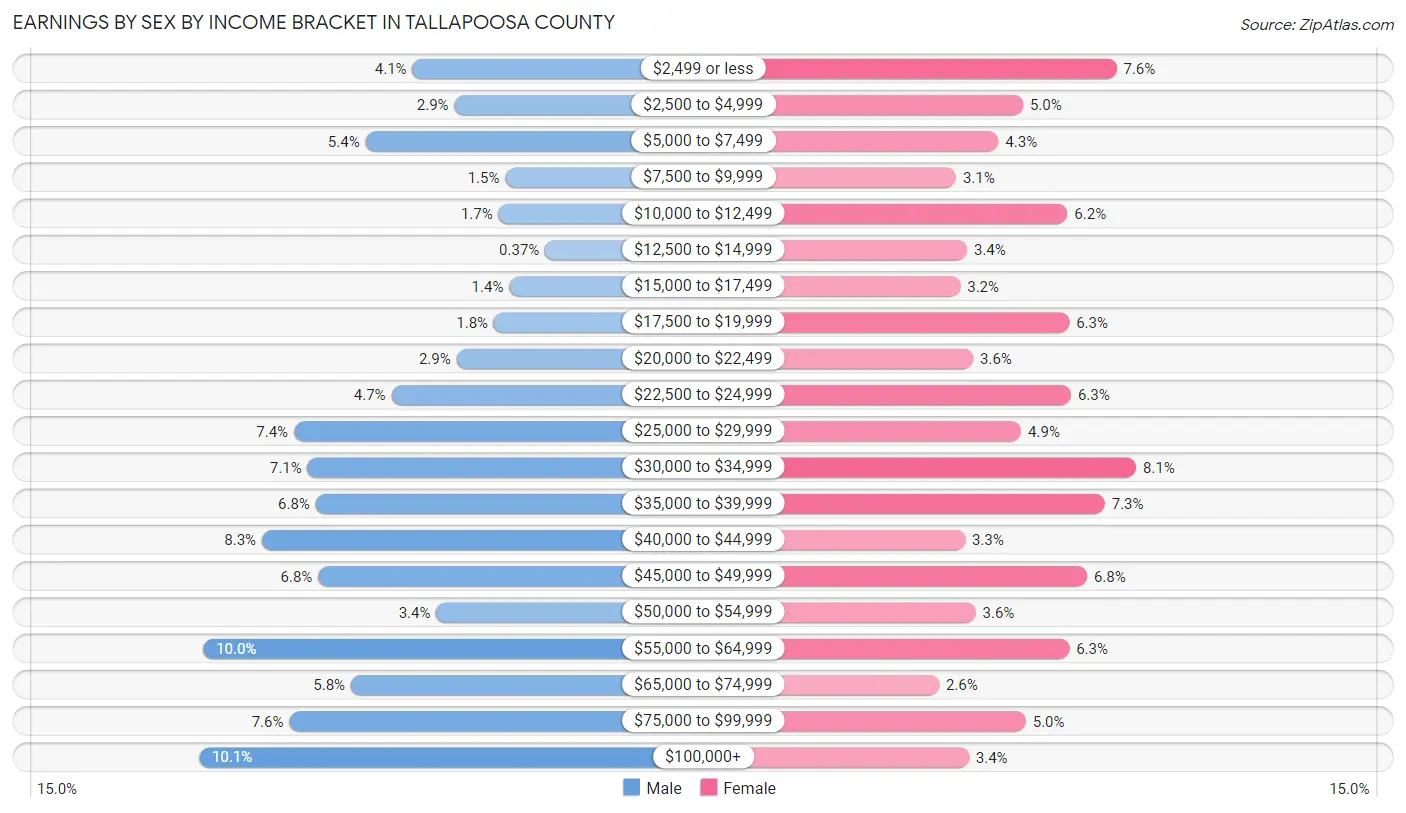
Earnings by Sex by Income Bracket in Tallapoosa County
The most common earnings brackets in Tallapoosa County are $100,000+ for men (937 | 10.1%) and $30,000 to $34,999 for women (685 | 8.1%).
| Income | Male | Female |
| $2,499 or less | 380 (4.1%) | 639 (7.6%) |
| $2,500 to $4,999 | 271 (2.9%) | 417 (5.0%) |
| $5,000 to $7,499 | 503 (5.4%) | 359 (4.3%) |
| $7,500 to $9,999 | 138 (1.5%) | 259 (3.1%) |
| $10,000 to $12,499 | 156 (1.7%) | 523 (6.2%) |
| $12,500 to $14,999 | 34 (0.4%) | 285 (3.4%) |
| $15,000 to $17,499 | 128 (1.4%) | 269 (3.2%) |
| $17,500 to $19,999 | 168 (1.8%) | 527 (6.2%) |
| $20,000 to $22,499 | 265 (2.9%) | 299 (3.5%) |
| $22,500 to $24,999 | 435 (4.7%) | 531 (6.3%) |
| $25,000 to $29,999 | 689 (7.4%) | 413 (4.9%) |
| $30,000 to $34,999 | 654 (7.0%) | 685 (8.1%) |
| $35,000 to $39,999 | 632 (6.8%) | 611 (7.2%) |
| $40,000 to $44,999 | 772 (8.3%) | 280 (3.3%) |
| $45,000 to $49,999 | 626 (6.8%) | 569 (6.8%) |
| $50,000 to $54,999 | 318 (3.4%) | 305 (3.6%) |
| $55,000 to $64,999 | 925 (10.0%) | 527 (6.2%) |
| $65,000 to $74,999 | 541 (5.8%) | 218 (2.6%) |
| $75,000 to $99,999 | 701 (7.6%) | 424 (5.0%) |
| $100,000+ | 937 (10.1%) | 289 (3.4%) |
| Total | 9,273 (100.0%) | 8,429 (100.0%) |
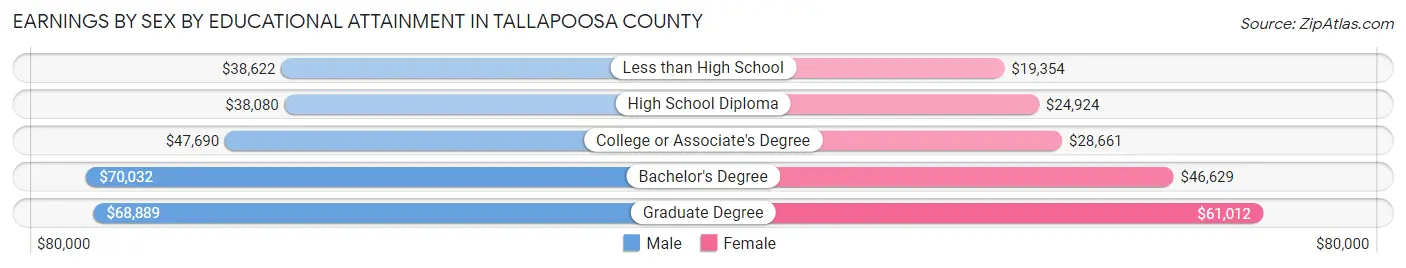
Earnings by Sex by Educational Attainment in Tallapoosa County
Average earnings in Tallapoosa County are $45,055 for men and $30,583 for women, a difference of 32.1%. Men with an educational attainment of bachelor's degree enjoy the highest average annual earnings of $70,032, while those with high school diploma education earn the least with $38,080. Women with an educational attainment of graduate degree earn the most with the average annual earnings of $61,012, while those with less than high school education have the smallest earnings of $19,354.
| Educational Attainment | Male Income | Female Income |
| Less than High School | $38,622 | $19,354 |
| High School Diploma | $38,080 | $24,924 |
| College or Associate's Degree | $47,690 | $28,661 |
| Bachelor's Degree | $70,032 | $46,629 |
| Graduate Degree | $68,889 | $61,012 |
| Total | $45,055 | $30,583 |
Family Income in Tallapoosa County
Family Income Brackets in Tallapoosa County
According to the Tallapoosa County family income data, there are 2,269 families falling into the $50,000 to $74,999 income range, which is the most common income bracket and makes up 21.1% of all families. Conversely, the $10,000 to $14,999 income bracket is the least frequent group with only 462 families (4.3%) belonging to this category.
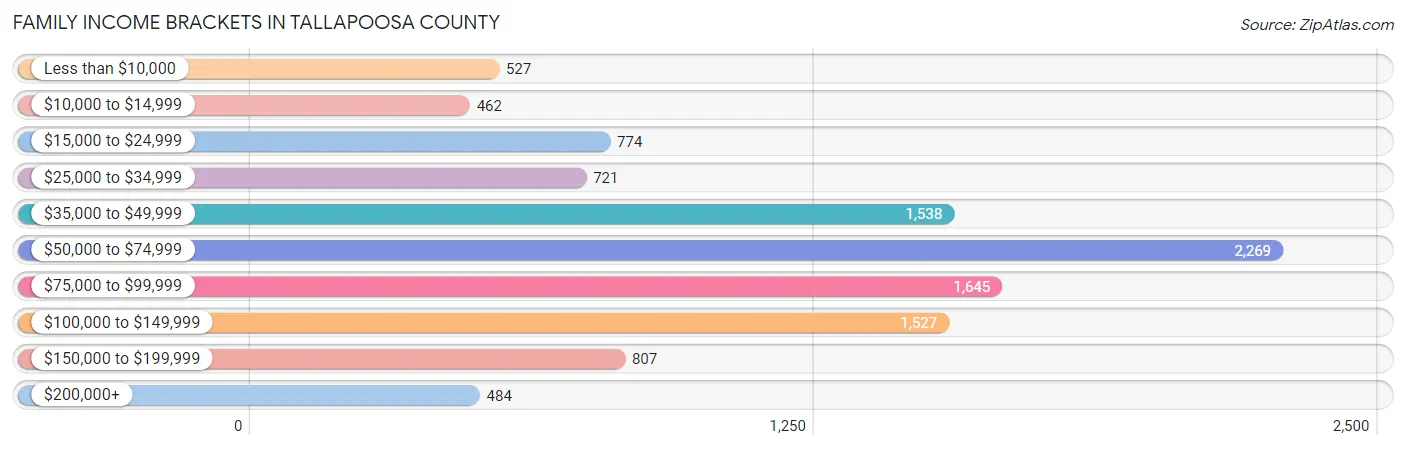
| Income Bracket | # Families | % Families |
| Less than $10,000 | 527 | 4.9% |
| $10,000 to $14,999 | 462 | 4.3% |
| $15,000 to $24,999 | 774 | 7.2% |
| $25,000 to $34,999 | 721 | 6.7% |
| $35,000 to $49,999 | 1,538 | 14.3% |
| $50,000 to $74,999 | 2,269 | 21.1% |
| $75,000 to $99,999 | 1,645 | 15.3% |
| $100,000 to $149,999 | 1,527 | 14.2% |
| $150,000 to $199,999 | 807 | 7.5% |
| $200,000+ | 484 | 4.5% |
Family Income by Famaliy Size in Tallapoosa County
7+ person families (100 | 0.9%) account for the highest median family income in Tallapoosa County with $82,733 per family, while 2-person families (5,916 | 55.0%) have the highest median income of $30,526 per family member.
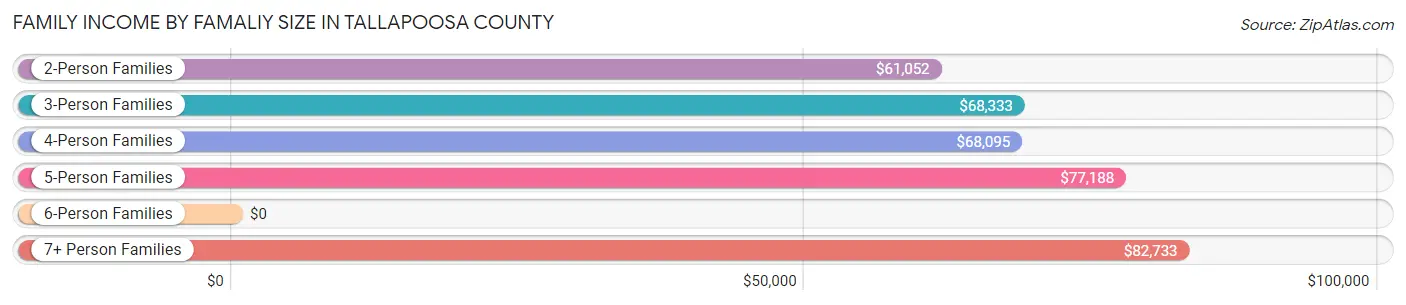
| Income Bracket | # Families | Median Income |
| 2-Person Families | 5,916 (55.0%) | $61,052 |
| 3-Person Families | 2,704 (25.1%) | $68,333 |
| 4-Person Families | 1,454 (13.5%) | $68,095 |
| 5-Person Families | 553 (5.1%) | $77,188 |
| 6-Person Families | 27 (0.3%) | $0 |
| 7+ Person Families | 100 (0.9%) | $82,733 |
| Total | 10,754 (100.0%) | $63,358 |
Family Income by Number of Earners in Tallapoosa County
The median family income in Tallapoosa County is $63,358, with families comprising 3+ earners (718) having the highest median family income of $110,735, while families with no earners (2,831) have the lowest median family income of $42,573, accounting for 6.7% and 26.3% of families, respectively.
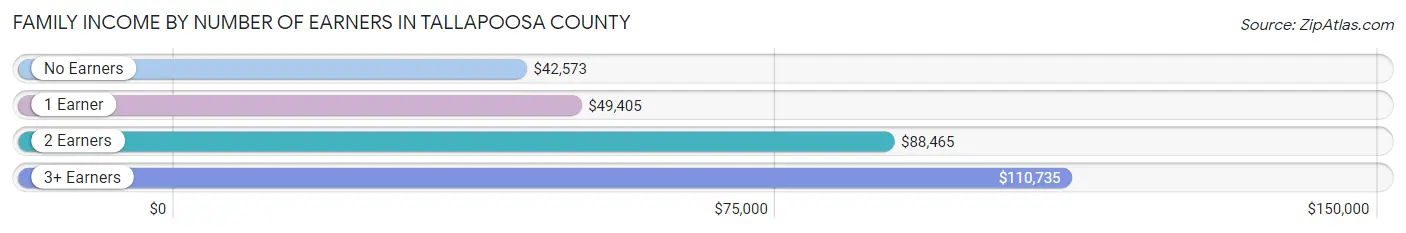
| Number of Earners | # Families | Median Income |
| No Earners | 2,831 (26.3%) | $42,573 |
| 1 Earner | 3,784 (35.2%) | $49,405 |
| 2 Earners | 3,421 (31.8%) | $88,465 |
| 3+ Earners | 718 (6.7%) | $110,735 |
| Total | 10,754 (100.0%) | $63,358 |
Household Income in Tallapoosa County
Household Income Brackets in Tallapoosa County
With 3,205 households falling in the category, the $50,000 to $74,999 income range is the most frequent in Tallapoosa County, accounting for 19.5% of all households. In contrast, only 625 households (3.8%) fall into the $200,000+ income bracket, making it the least populous group.
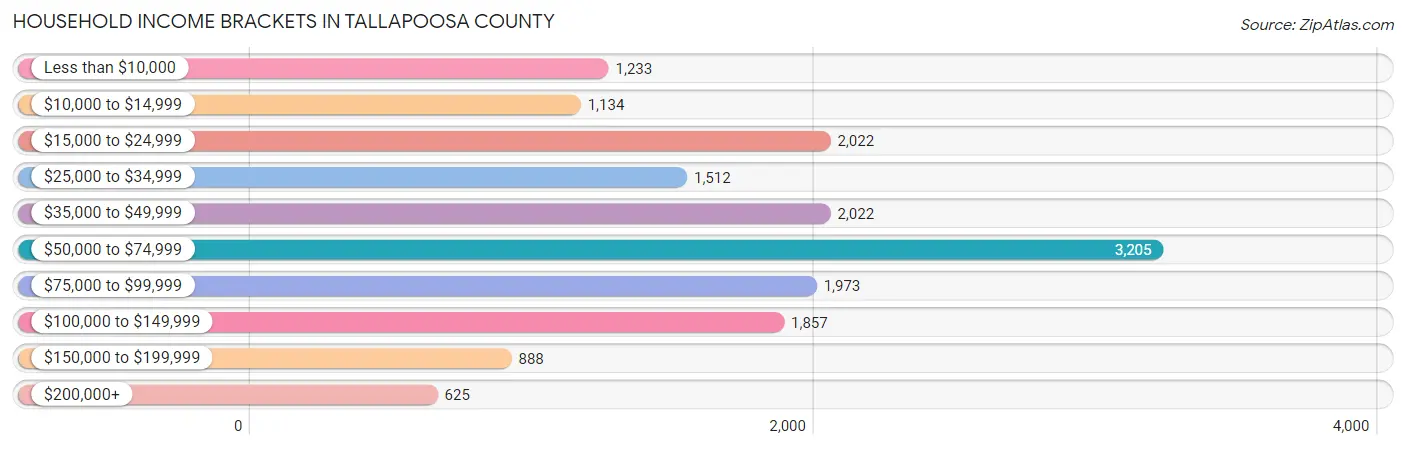
| Income Bracket | # Households | % Households |
| Less than $10,000 | 1,233 | 7.5% |
| $10,000 to $14,999 | 1,134 | 6.9% |
| $15,000 to $24,999 | 2,022 | 12.3% |
| $25,000 to $34,999 | 1,512 | 9.2% |
| $35,000 to $49,999 | 2,022 | 12.3% |
| $50,000 to $74,999 | 3,205 | 19.5% |
| $75,000 to $99,999 | 1,973 | 12.0% |
| $100,000 to $149,999 | 1,857 | 11.3% |
| $150,000 to $199,999 | 888 | 5.4% |
| $200,000+ | 625 | 3.8% |
Household Income by Householder Age in Tallapoosa County
The median household income in Tallapoosa County is $53,282, with the highest median household income of $66,161 found in the 45 to 64 years age bracket for the primary householder. A total of 6,356 households (38.7%) fall into this category. Meanwhile, the 65+ years age bracket for the primary householder has the lowest median household income of $38,429, with 5,640 households (34.3%) in this group.
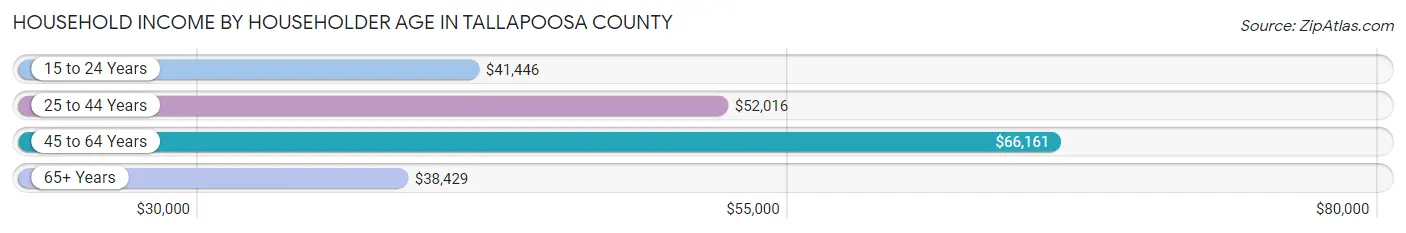
| Income Bracket | # Households | Median Income |
| 15 to 24 Years | 269 (1.6%) | $41,446 |
| 25 to 44 Years | 4,173 (25.4%) | $52,016 |
| 45 to 64 Years | 6,356 (38.7%) | $66,161 |
| 65+ Years | 5,640 (34.3%) | $38,429 |
| Total | 16,438 (100.0%) | $53,282 |
Poverty in Tallapoosa County
Income Below Poverty by Sex and Age in Tallapoosa County
With 14.5% poverty level for males and 19.0% for females among the residents of Tallapoosa County, 6 to 11 year old males and 6 to 11 year old females are the most vulnerable to poverty, with 578 males (39.6%) and 589 females (36.5%) in their respective age groups living below the poverty level.
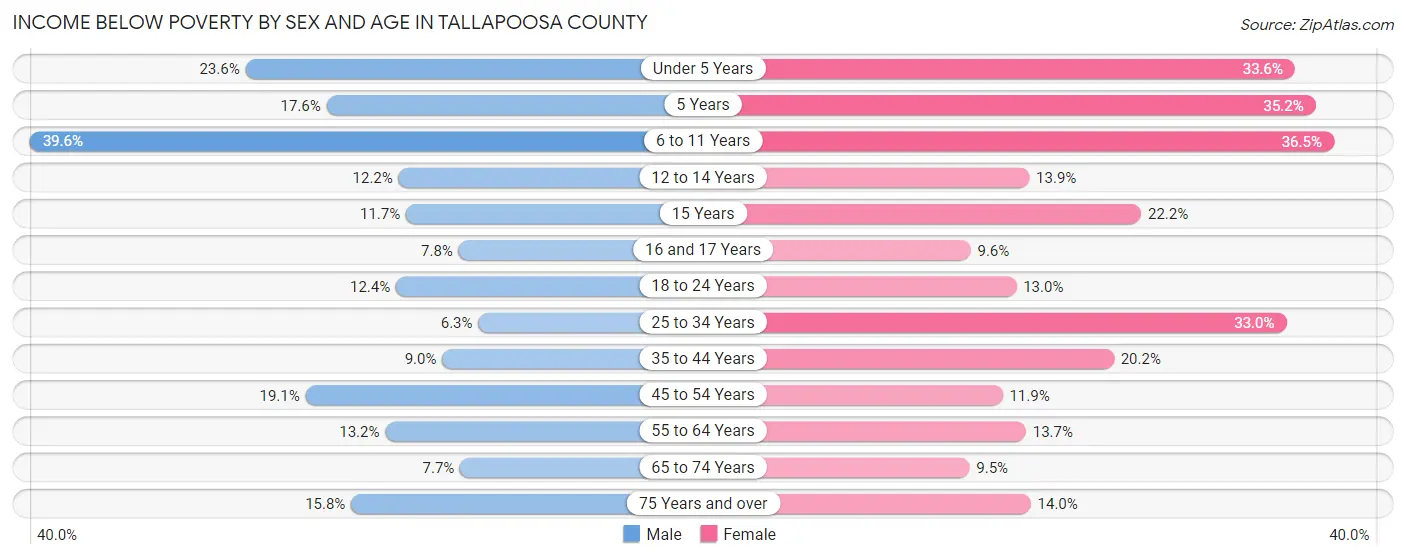
| Age Bracket | Male | Female |
| Under 5 Years | 231 (23.6%) | 416 (33.6%) |
| 5 Years | 29 (17.6%) | 115 (35.2%) |
| 6 to 11 Years | 578 (39.6%) | 589 (36.5%) |
| 12 to 14 Years | 96 (12.2%) | 58 (13.9%) |
| 15 Years | 23 (11.7%) | 28 (22.2%) |
| 16 and 17 Years | 45 (7.8%) | 46 (9.6%) |
| 18 to 24 Years | 212 (12.4%) | 188 (13.0%) |
| 25 to 34 Years | 132 (6.3%) | 818 (33.0%) |
| 35 to 44 Years | 184 (9.0%) | 438 (20.2%) |
| 45 to 54 Years | 473 (19.1%) | 327 (11.9%) |
| 55 to 64 Years | 398 (13.2%) | 436 (13.7%) |
| 65 to 74 Years | 198 (7.7%) | 267 (9.5%) |
| 75 Years and over | 225 (15.8%) | 276 (14.0%) |
| Total | 2,824 (14.5%) | 4,002 (19.0%) |
Income Above Poverty by Sex and Age in Tallapoosa County
According to the poverty statistics in Tallapoosa County, males aged 25 to 34 years and females aged 65 to 74 years are the age groups that are most secure financially, with 93.7% of males and 90.5% of females in these age groups living above the poverty line.
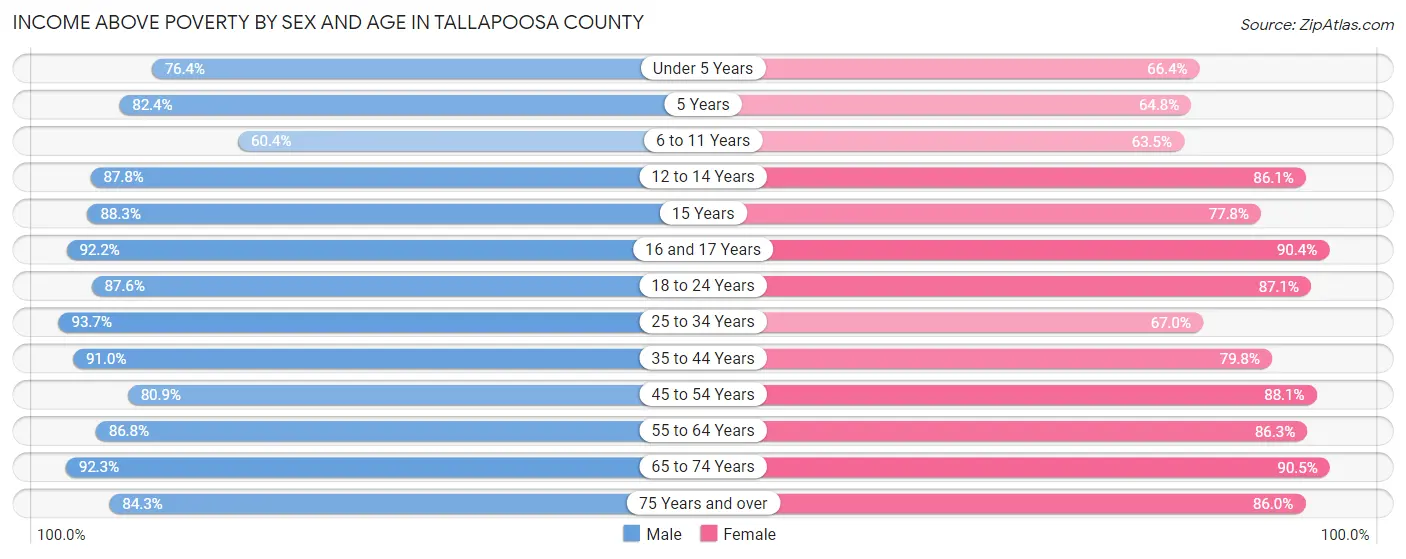
| Age Bracket | Male | Female |
| Under 5 Years | 748 (76.4%) | 821 (66.4%) |
| 5 Years | 136 (82.4%) | 212 (64.8%) |
| 6 to 11 Years | 881 (60.4%) | 1,024 (63.5%) |
| 12 to 14 Years | 689 (87.8%) | 359 (86.1%) |
| 15 Years | 174 (88.3%) | 98 (77.8%) |
| 16 and 17 Years | 534 (92.2%) | 435 (90.4%) |
| 18 to 24 Years | 1,495 (87.6%) | 1,264 (87.1%) |
| 25 to 34 Years | 1,959 (93.7%) | 1,661 (67.0%) |
| 35 to 44 Years | 1,862 (91.0%) | 1,731 (79.8%) |
| 45 to 54 Years | 1,998 (80.9%) | 2,413 (88.1%) |
| 55 to 64 Years | 2,613 (86.8%) | 2,755 (86.3%) |
| 65 to 74 Years | 2,386 (92.3%) | 2,553 (90.5%) |
| 75 Years and over | 1,204 (84.3%) | 1,692 (86.0%) |
| Total | 16,679 (85.5%) | 17,018 (81.0%) |
Income Below Poverty Among Married-Couple Families in Tallapoosa County
The poverty statistics for married-couple families in Tallapoosa County show that 6.6% or 490 of the total 7,399 families live below the poverty line. Families with 3 or 4 children have the highest poverty rate of 11.4%, comprising of 31 families. On the other hand, families with 5 or more children have the lowest poverty rate of 0.0%, which includes 0 families.
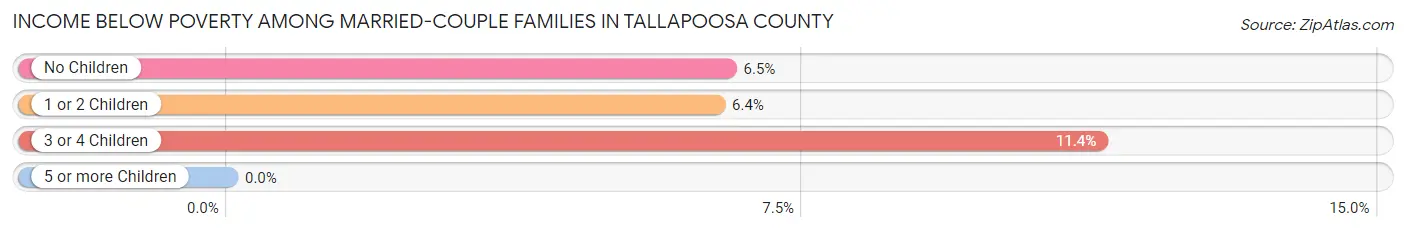
| Children | Above Poverty | Below Poverty |
| No Children | 4,781 (93.5%) | 333 (6.5%) |
| 1 or 2 Children | 1,855 (93.6%) | 126 (6.4%) |
| 3 or 4 Children | 242 (88.6%) | 31 (11.4%) |
| 5 or more Children | 31 (100.0%) | 0 (0.0%) |
| Total | 6,909 (93.4%) | 490 (6.6%) |
Income Below Poverty Among Single-Parent Households in Tallapoosa County
According to the poverty data in Tallapoosa County, 13.4% or 132 single-father households and 39.0% or 926 single-mother households are living below the poverty line. Among single-father households, those with 1 or 2 children have the highest poverty rate, with 104 households (18.0%) experiencing poverty. Likewise, among single-mother households, those with 5 or more children have the highest poverty rate, with 25 households (100.0%) falling below the poverty line.
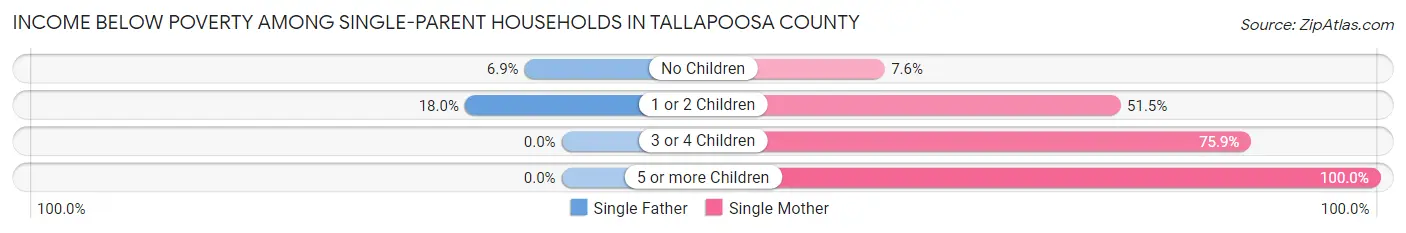
| Children | Single Father | Single Mother |
| No Children | 28 (6.9%) | 61 (7.5%) |
| 1 or 2 Children | 104 (18.0%) | 692 (51.5%) |
| 3 or 4 Children | 0 (0.0%) | 148 (75.9%) |
| 5 or more Children | 0 (0.0%) | 25 (100.0%) |
| Total | 132 (13.4%) | 926 (39.0%) |
Income Below Poverty Among Married-Couple vs Single-Parent Households in Tallapoosa County
The poverty data for Tallapoosa County shows that 490 of the married-couple family households (6.6%) and 1,058 of the single-parent households (31.5%) are living below the poverty level. Within the married-couple family households, those with 3 or 4 children have the highest poverty rate, with 31 households (11.4%) falling below the poverty line. Among the single-parent households, those with 5 or more children have the highest poverty rate, with 25 household (100.0%) living below poverty.
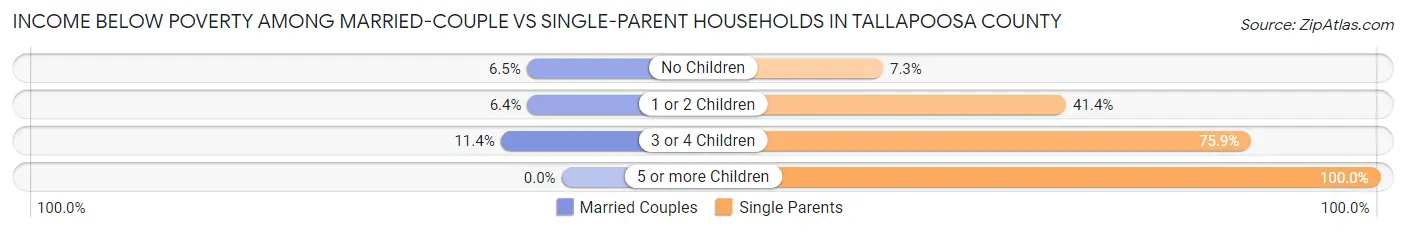
| Children | Married-Couple Families | Single-Parent Households |
| No Children | 333 (6.5%) | 89 (7.3%) |
| 1 or 2 Children | 126 (6.4%) | 796 (41.4%) |
| 3 or 4 Children | 31 (11.4%) | 148 (75.9%) |
| 5 or more Children | 0 (0.0%) | 25 (100.0%) |
| Total | 490 (6.6%) | 1,058 (31.5%) |
Race in Tallapoosa County
The most populous races in Tallapoosa County are White / Caucasian (28,516 | 69.1%), Black / African American (10,957 | 26.6%), and Two or more Races (1,174 | 2.9%).
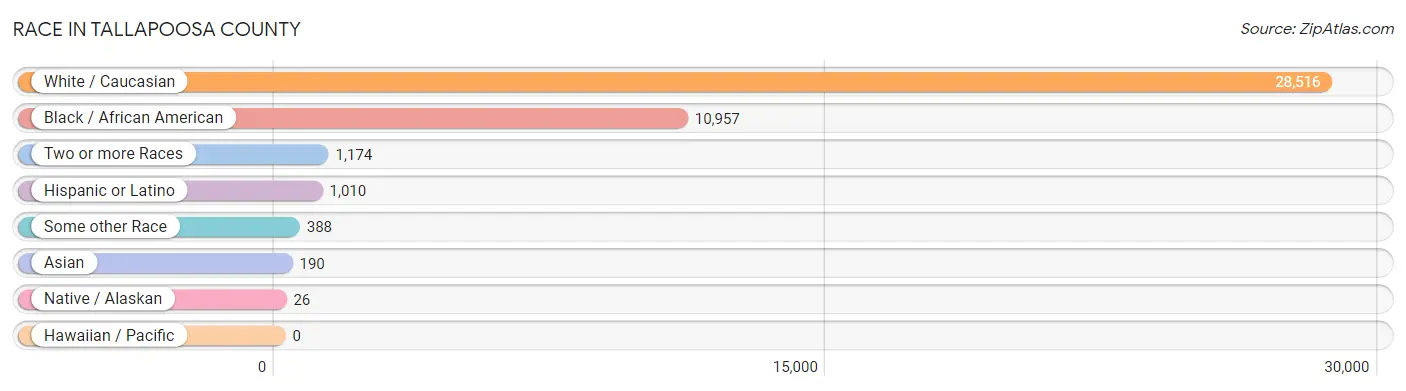
| Race | # Population | % Population |
| Asian | 190 | 0.5% |
| Black / African American | 10,957 | 26.6% |
| Hawaiian / Pacific | 0 | 0.0% |
| Hispanic or Latino | 1,010 | 2.5% |
| Native / Alaskan | 26 | 0.1% |
| White / Caucasian | 28,516 | 69.1% |
| Two or more Races | 1,174 | 2.9% |
| Some other Race | 388 | 0.9% |
| Total | 41,251 | 100.0% |
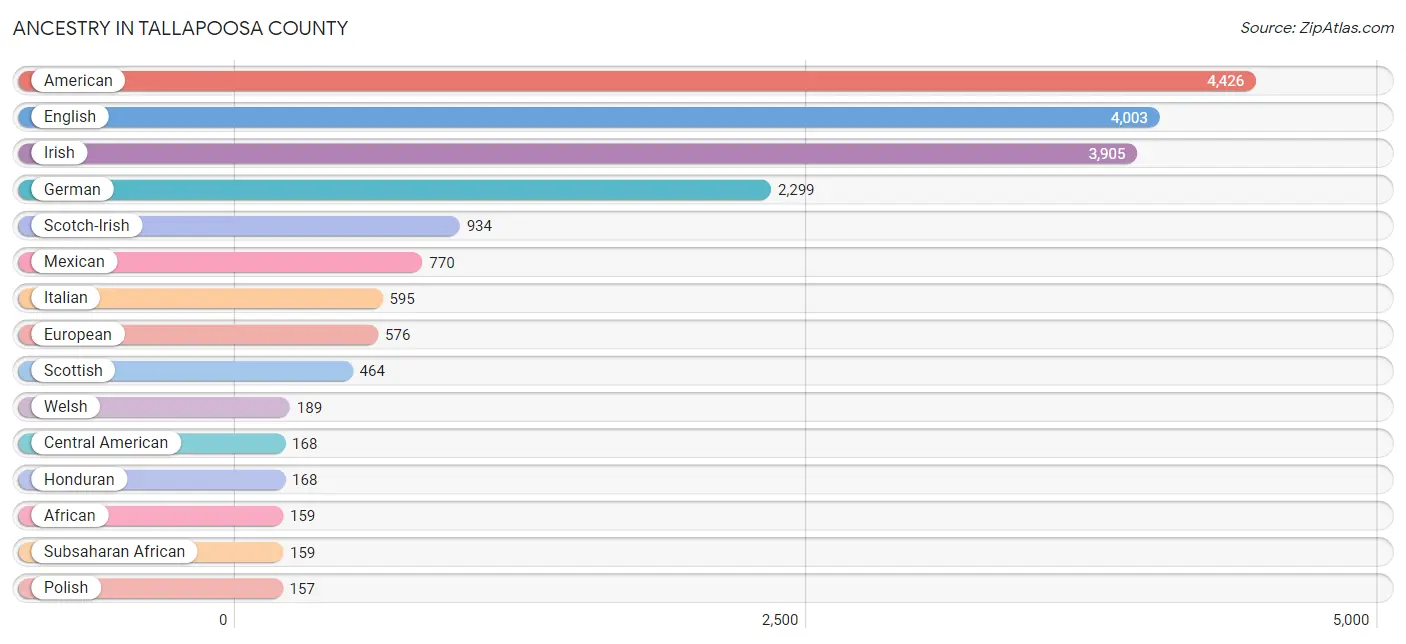
Ancestry in Tallapoosa County
The most populous ancestries reported in Tallapoosa County are American (4,426 | 10.7%), English (4,003 | 9.7%), Irish (3,905 | 9.5%), German (2,299 | 5.6%), and Scotch-Irish (934 | 2.3%), together accounting for 37.7% of all Tallapoosa County residents.
| Ancestry | # Population | % Population |
| African | 159 | 0.4% |
| American | 4,426 | 10.7% |
| Apache | 1 | 0.0% |
| Arab | 25 | 0.1% |
| Austrian | 10 | 0.0% |
| Bahamian | 68 | 0.2% |
| Bhutanese | 11 | 0.0% |
| Blackfeet | 112 | 0.3% |
| British | 141 | 0.3% |
| British West Indian | 4 | 0.0% |
| Bulgarian | 14 | 0.0% |
| Burmese | 116 | 0.3% |
| Canadian | 69 | 0.2% |
| Celtic | 6 | 0.0% |
| Central American | 168 | 0.4% |
| Cherokee | 113 | 0.3% |
| Choctaw | 73 | 0.2% |
| Colombian | 16 | 0.0% |
| Creek | 27 | 0.1% |
| Cuban | 6 | 0.0% |
| Czech | 2 | 0.0% |
| Danish | 5 | 0.0% |
| Dominican | 11 | 0.0% |
| Dutch | 121 | 0.3% |
| Dutch West Indian | 1 | 0.0% |
| Eastern European | 47 | 0.1% |
| English | 4,003 | 9.7% |
| European | 576 | 1.4% |
| French | 115 | 0.3% |
| French Canadian | 38 | 0.1% |
| German | 2,299 | 5.6% |
| Greek | 49 | 0.1% |
| Haitian | 11 | 0.0% |
| Honduran | 168 | 0.4% |
| Hungarian | 50 | 0.1% |
| Indian (Asian) | 47 | 0.1% |
| Irish | 3,905 | 9.5% |
| Iroquois | 1 | 0.0% |
| Italian | 595 | 1.4% |
| Japanese | 2 | 0.0% |
| Korean | 41 | 0.1% |
| Latvian | 11 | 0.0% |
| Lebanese | 25 | 0.1% |
| Lithuanian | 73 | 0.2% |
| Mexican | 770 | 1.9% |
| Northern European | 17 | 0.0% |
| Norwegian | 42 | 0.1% |
| Pennsylvania German | 8 | 0.0% |
| Polish | 157 | 0.4% |
| Portuguese | 14 | 0.0% |
| Puerto Rican | 10 | 0.0% |
| Romanian | 16 | 0.0% |
| Russian | 3 | 0.0% |
| Scandinavian | 56 | 0.1% |
| Scotch-Irish | 934 | 2.3% |
| Scottish | 464 | 1.1% |
| South American | 16 | 0.0% |
| Subsaharan African | 159 | 0.4% |
| Swedish | 82 | 0.2% |
| Swiss | 10 | 0.0% |
| Thai | 67 | 0.2% |
| Ukrainian | 7 | 0.0% |
| Welsh | 189 | 0.5% |
| Yugoslavian | 5 | 0.0% | View All 64 Rows |
Immigrants in Tallapoosa County
The most numerous immigrant groups reported in Tallapoosa County came from Latin America (466 | 1.1%), Central America (350 | 0.9%), Mexico (250 | 0.6%), Europe (121 | 0.3%), and Asia (117 | 0.3%), together accounting for 3.2% of all Tallapoosa County residents.
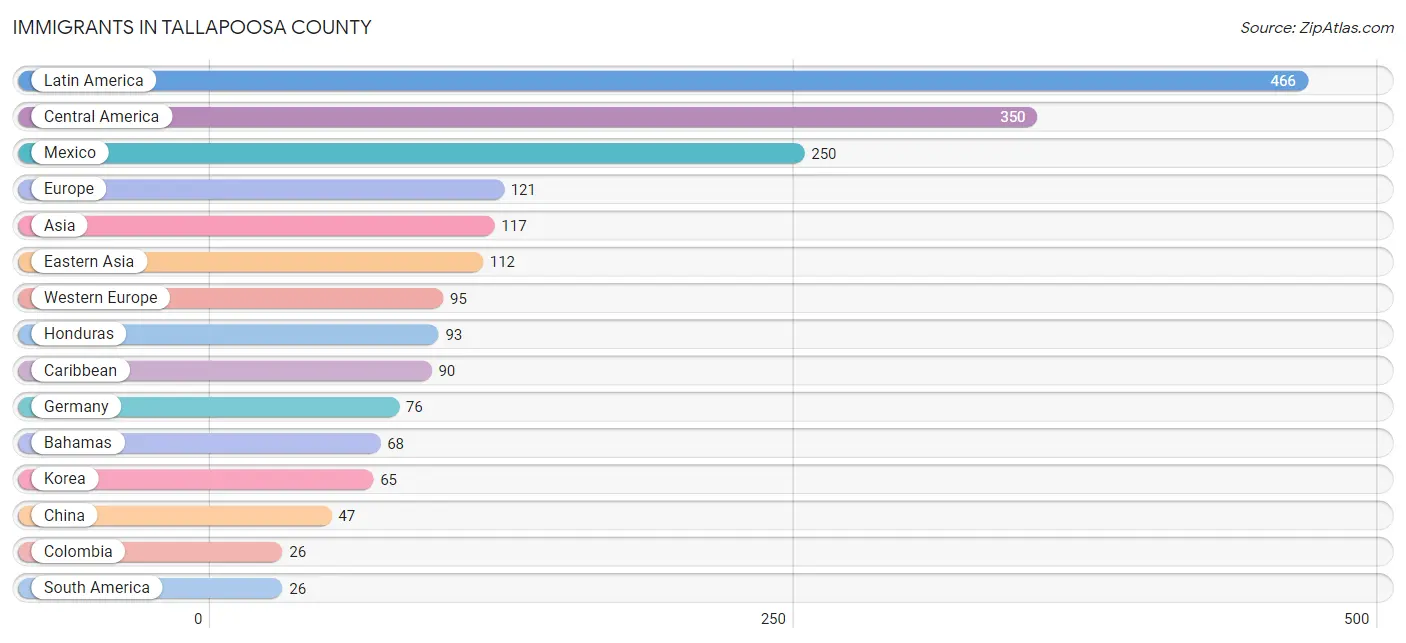
| Immigration Origin | # Population | % Population |
| Asia | 117 | 0.3% |
| Austria | 6 | 0.0% |
| Bahamas | 68 | 0.2% |
| Bulgaria | 14 | 0.0% |
| Cambodia | 2 | 0.0% |
| Caribbean | 90 | 0.2% |
| Central America | 350 | 0.9% |
| China | 47 | 0.1% |
| Colombia | 26 | 0.1% |
| Cuba | 6 | 0.0% |
| Eastern Asia | 112 | 0.3% |
| Eastern Europe | 22 | 0.1% |
| El Salvador | 7 | 0.0% |
| England | 4 | 0.0% |
| Europe | 121 | 0.3% |
| Germany | 76 | 0.2% |
| Honduras | 93 | 0.2% |
| Korea | 65 | 0.2% |
| Latin America | 466 | 1.1% |
| Mexico | 250 | 0.6% |
| Netherlands | 13 | 0.0% |
| Northern Europe | 4 | 0.0% |
| Philippines | 3 | 0.0% |
| South America | 26 | 0.1% |
| South Eastern Asia | 5 | 0.0% |
| Trinidad and Tobago | 16 | 0.0% |
| Ukraine | 8 | 0.0% |
| Western Europe | 95 | 0.2% | View All 28 Rows |
Sex and Age in Tallapoosa County
Sex and Age in Tallapoosa County
The most populous age groups in Tallapoosa County are 55 to 59 Years (1,578 | 7.9%) for men and 55 to 59 Years (1,693 | 8.0%) for women.
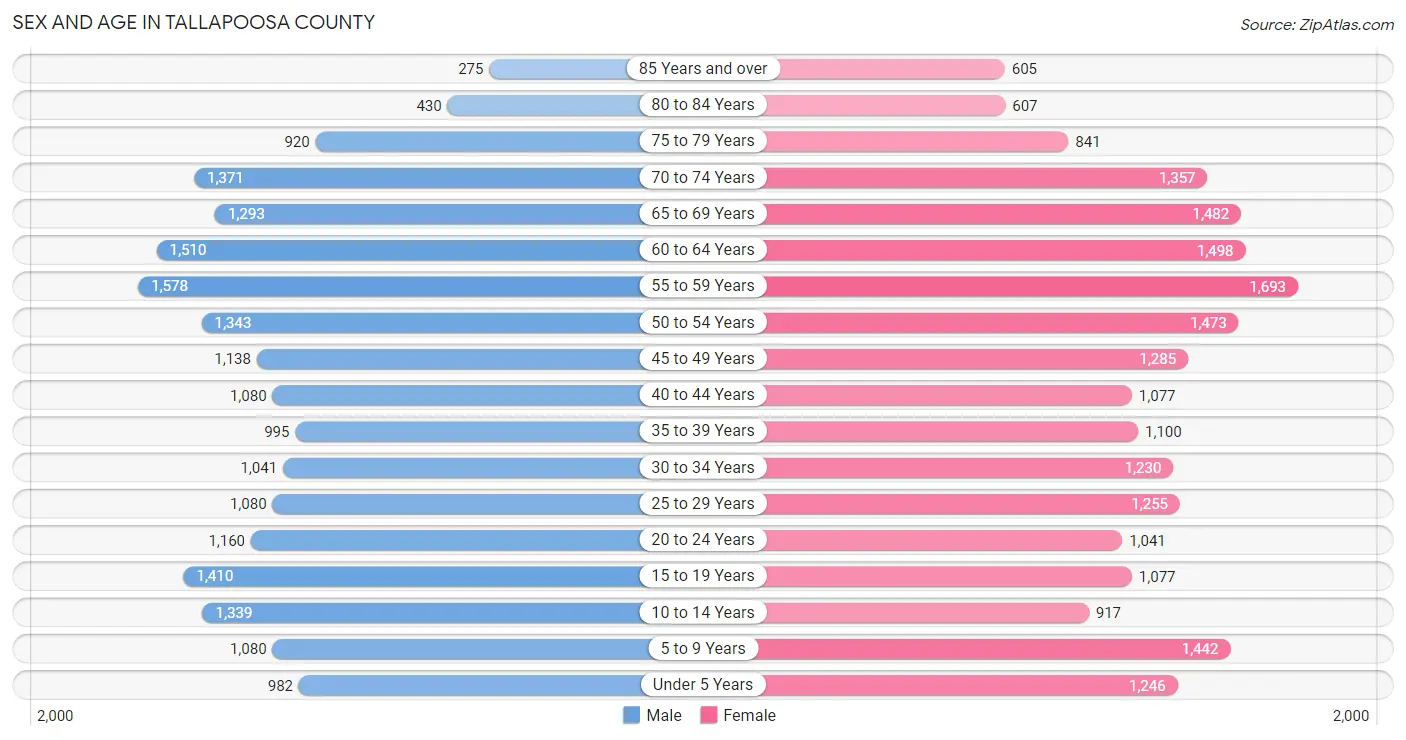
| Age Bracket | Male | Female |
| Under 5 Years | 982 (4.9%) | 1,246 (5.9%) |
| 5 to 9 Years | 1,080 (5.4%) | 1,442 (6.8%) |
| 10 to 14 Years | 1,339 (6.7%) | 917 (4.3%) |
| 15 to 19 Years | 1,410 (7.0%) | 1,077 (5.1%) |
| 20 to 24 Years | 1,160 (5.8%) | 1,041 (4.9%) |
| 25 to 29 Years | 1,080 (5.4%) | 1,255 (5.9%) |
| 30 to 34 Years | 1,041 (5.2%) | 1,230 (5.8%) |
| 35 to 39 Years | 995 (5.0%) | 1,100 (5.2%) |
| 40 to 44 Years | 1,080 (5.4%) | 1,077 (5.1%) |
| 45 to 49 Years | 1,138 (5.7%) | 1,285 (6.0%) |
| 50 to 54 Years | 1,343 (6.7%) | 1,473 (6.9%) |
| 55 to 59 Years | 1,578 (7.9%) | 1,693 (8.0%) |
| 60 to 64 Years | 1,510 (7.5%) | 1,498 (7.1%) |
| 65 to 69 Years | 1,293 (6.5%) | 1,482 (7.0%) |
| 70 to 74 Years | 1,371 (6.9%) | 1,357 (6.4%) |
| 75 to 79 Years | 920 (4.6%) | 841 (4.0%) |
| 80 to 84 Years | 430 (2.1%) | 607 (2.9%) |
| 85 Years and over | 275 (1.4%) | 605 (2.9%) |
| Total | 20,025 (100.0%) | 21,226 (100.0%) |
Families and Households in Tallapoosa County
Median Family Size in Tallapoosa County
The median family size in Tallapoosa County is 3.09 persons per family, with single female/mother families (2,372 | 22.1%) accounting for the largest median family size of 3.43 persons per family. On the other hand, married-couple families (7,399 | 68.8%) represent the smallest median family size with 2.94 persons per family.
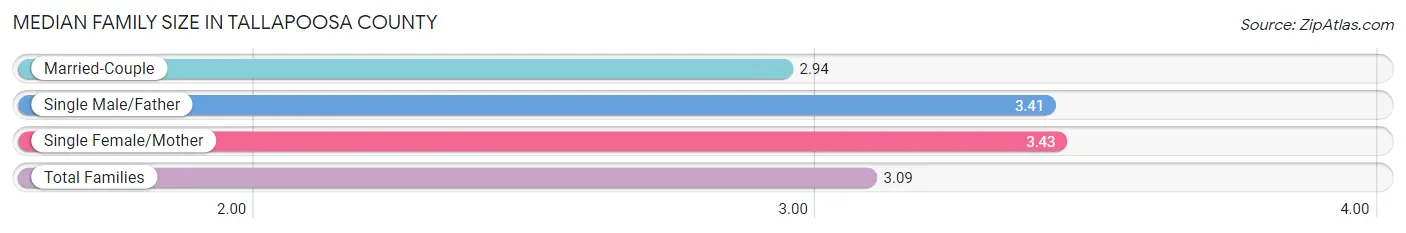
| Family Type | # Families | Family Size |
| Married-Couple | 7,399 (68.8%) | 2.94 |
| Single Male/Father | 983 (9.1%) | 3.41 |
| Single Female/Mother | 2,372 (22.1%) | 3.43 |
| Total Families | 10,754 (100.0%) | 3.09 |
Median Household Size in Tallapoosa County
The median household size in Tallapoosa County is 2.46 persons per household, with single male/father households (983 | 6.0%) accounting for the largest median household size of 3.66 persons per household. non-family households (5,684 | 34.6%) represent the smallest median household size with 1.16 persons per household.
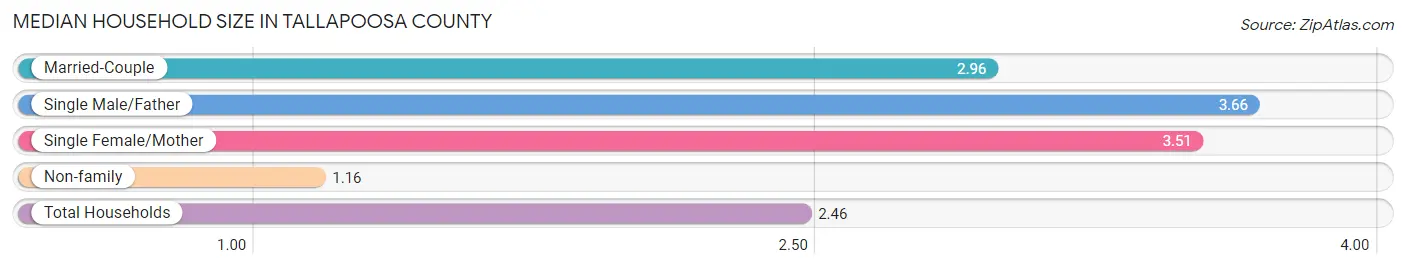
| Household Type | # Households | Household Size |
| Married-Couple | 7,399 (45.0%) | 2.96 |
| Single Male/Father | 983 (6.0%) | 3.66 |
| Single Female/Mother | 2,372 (14.4%) | 3.51 |
| Non-family | 5,684 (34.6%) | 1.16 |
| Total Households | 16,438 (100.0%) | 2.46 |
Household Size by Marriage Status in Tallapoosa County
Out of a total of 16,438 households in Tallapoosa County, 10,754 (65.4%) are family households, while 5,684 (34.6%) are nonfamily households. The most numerous type of family households are 2-person households, comprising 5,802, and the most common type of nonfamily households are 1-person households, comprising 5,042.
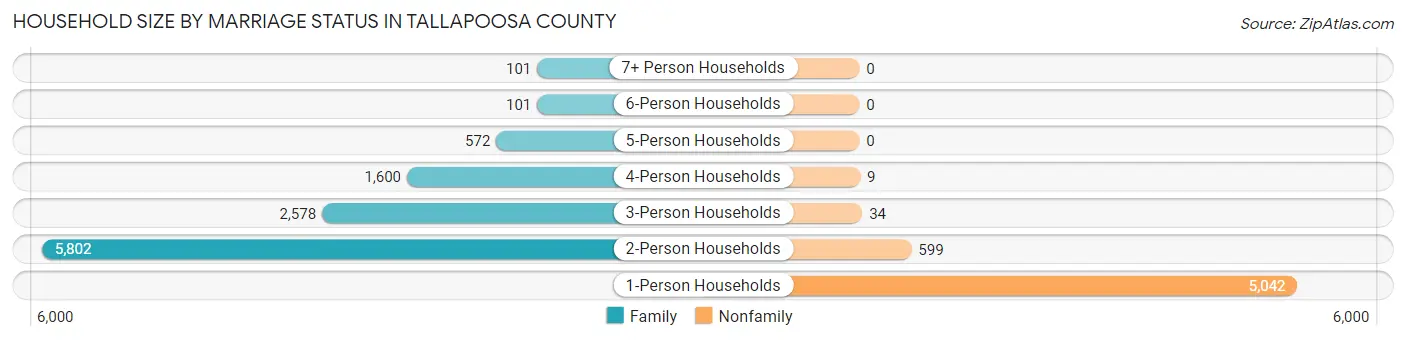
| Household Size | Family Households | Nonfamily Households |
| 1-Person Households | - | 5,042 (30.7%) |
| 2-Person Households | 5,802 (35.3%) | 599 (3.6%) |
| 3-Person Households | 2,578 (15.7%) | 34 (0.2%) |
| 4-Person Households | 1,600 (9.7%) | 9 (0.1%) |
| 5-Person Households | 572 (3.5%) | 0 (0.0%) |
| 6-Person Households | 101 (0.6%) | 0 (0.0%) |
| 7+ Person Households | 101 (0.6%) | 0 (0.0%) |
| Total | 10,754 (65.4%) | 5,684 (34.6%) |
Female Fertility in Tallapoosa County
Fertility by Age in Tallapoosa County
Average fertility rate in Tallapoosa County is 77.0 births per 1,000 women. Women in the age bracket of 20 to 34 years have the highest fertility rate with 139.0 births per 1,000 women. Women in the age bracket of 20 to 34 years acount for 74.3% of all women with births.
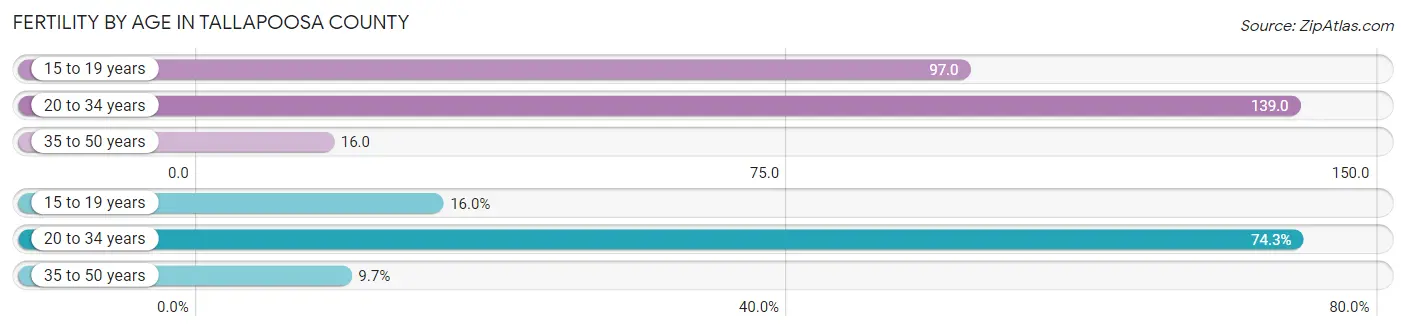
| Age Bracket | Women with Births | Births / 1,000 Women |
| 15 to 19 years | 105 (16.0%) | 97.0 |
| 20 to 34 years | 489 (74.3%) | 139.0 |
| 35 to 50 years | 64 (9.7%) | 16.0 |
| Total | 658 (100.0%) | 77.0 |
Fertility by Age by Marriage Status in Tallapoosa County
44.4% of women with births (658) in Tallapoosa County are married. The highest percentage of unmarried women with births falls into 15 to 19 years age bracket with 73.3% of them unmarried at the time of birth, while the lowest percentage of unmarried women with births belong to 35 to 50 years age bracket with 0.0% of them unmarried.
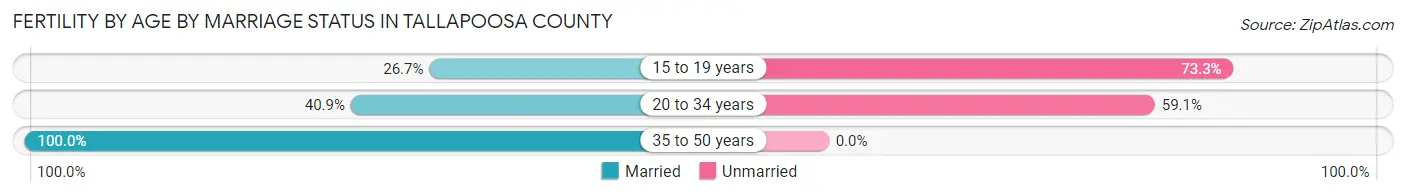
| Age Bracket | Married | Unmarried |
| 15 to 19 years | 28 (26.7%) | 77 (73.3%) |
| 20 to 34 years | 200 (40.9%) | 289 (59.1%) |
| 35 to 50 years | 64 (100.0%) | 0 (0.0%) |
| Total | 292 (44.4%) | 366 (55.6%) |
Fertility by Education in Tallapoosa County
Average fertility rate in Tallapoosa County is 77.0 births per 1,000 women. Women with the education attainment of graduate degree have the highest fertility rate of 109.0 births per 1,000 women, while women with the education attainment of college or associate's degree have the lowest fertility at 52.0 births per 1,000 women. Women with the education attainment of less than high school represent 33.0% of all women with births.
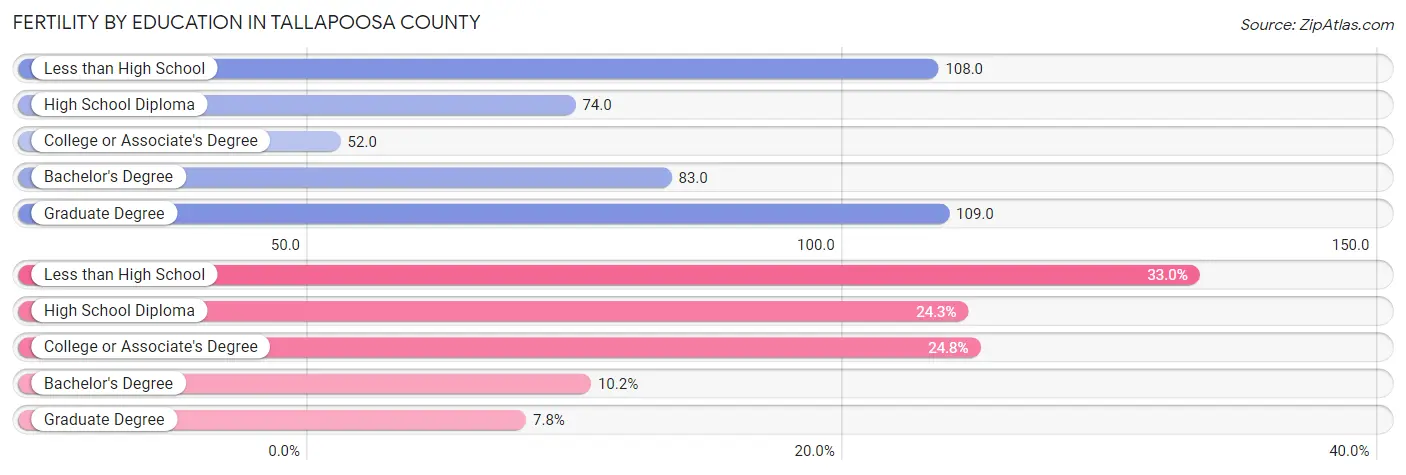
| Educational Attainment | Women with Births | Births / 1,000 Women |
| Less than High School | 217 (33.0%) | 108.0 |
| High School Diploma | 160 (24.3%) | 74.0 |
| College or Associate's Degree | 163 (24.8%) | 52.0 |
| Bachelor's Degree | 67 (10.2%) | 83.0 |
| Graduate Degree | 51 (7.7%) | 109.0 |
| Total | 658 (100.0%) | 77.0 |
Fertility by Education by Marriage Status in Tallapoosa County
55.6% of women with births in Tallapoosa County are unmarried. Women with the educational attainment of bachelor's degree are most likely to be married with 100.0% of them married at childbirth, while women with the educational attainment of less than high school are least likely to be married with 70.1% of them unmarried at childbirth.
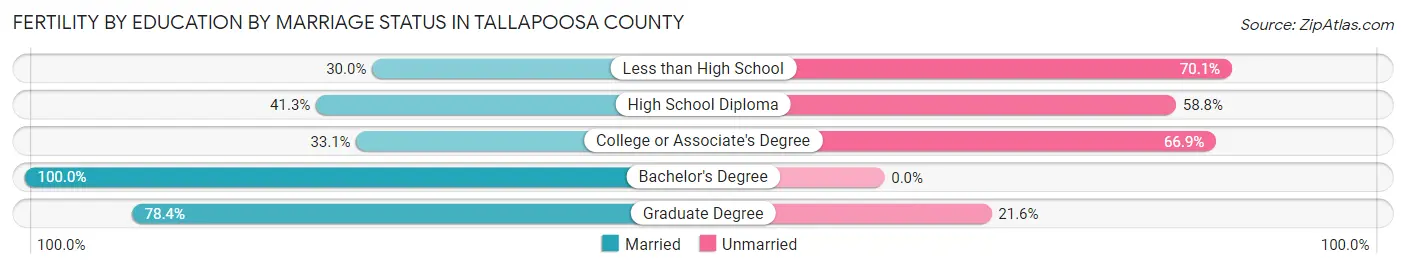
| Educational Attainment | Married | Unmarried |
| Less than High School | 65 (29.9%) | 152 (70.1%) |
| High School Diploma | 66 (41.2%) | 94 (58.8%) |
| College or Associate's Degree | 54 (33.1%) | 109 (66.9%) |
| Bachelor's Degree | 67 (100.0%) | 0 (0.0%) |
| Graduate Degree | 40 (78.4%) | 11 (21.6%) |
| Total | 292 (44.4%) | 366 (55.6%) |
Employment Characteristics in Tallapoosa County
Employment by Class of Employer in Tallapoosa County
Among the 15,388 employed individuals in Tallapoosa County, private company employees (10,814 | 70.3%), local government employees (1,048 | 6.8%), and self-employed (not incorporated) (1,030 | 6.7%) make up the most common classes of employment.
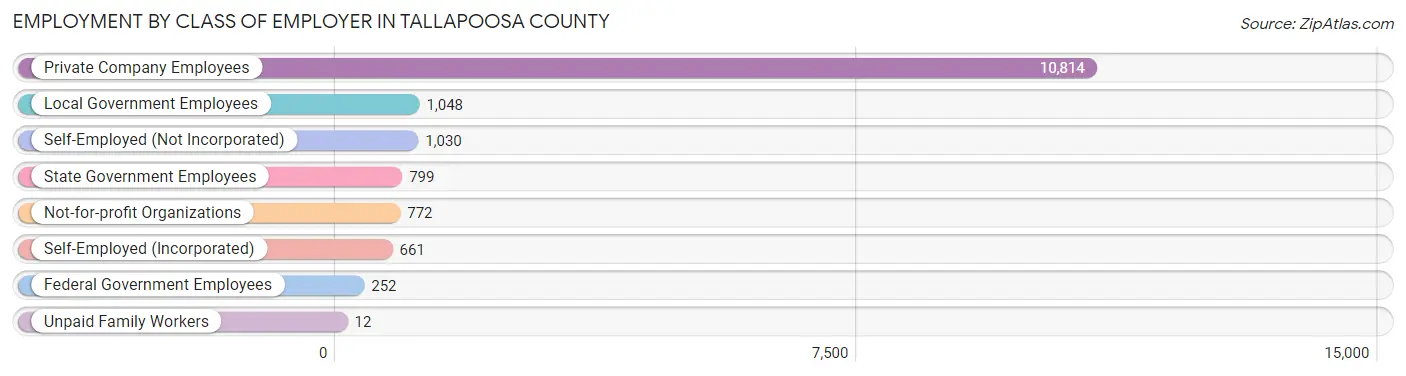
| Employer Class | # Employees | % Employees |
| Private Company Employees | 10,814 | 70.3% |
| Self-Employed (Incorporated) | 661 | 4.3% |
| Self-Employed (Not Incorporated) | 1,030 | 6.7% |
| Not-for-profit Organizations | 772 | 5.0% |
| Local Government Employees | 1,048 | 6.8% |
| State Government Employees | 799 | 5.2% |
| Federal Government Employees | 252 | 1.6% |
| Unpaid Family Workers | 12 | 0.1% |
| Total | 15,388 | 100.0% |
Employment Status by Age in Tallapoosa County
According to the labor force statistics for Tallapoosa County, out of the total population over 16 years of age (33,913), 51.4% or 17,431 individuals are in the labor force, with 10.4% or 1,813 of them unemployed. The age group with the highest labor force participation rate is 20 to 24 years, with 77.2% or 1,699 individuals in the labor force. Within the labor force, the 20 to 24 years age range has the highest percentage of unemployed individuals, with 24.2% or 411 of them being unemployed.
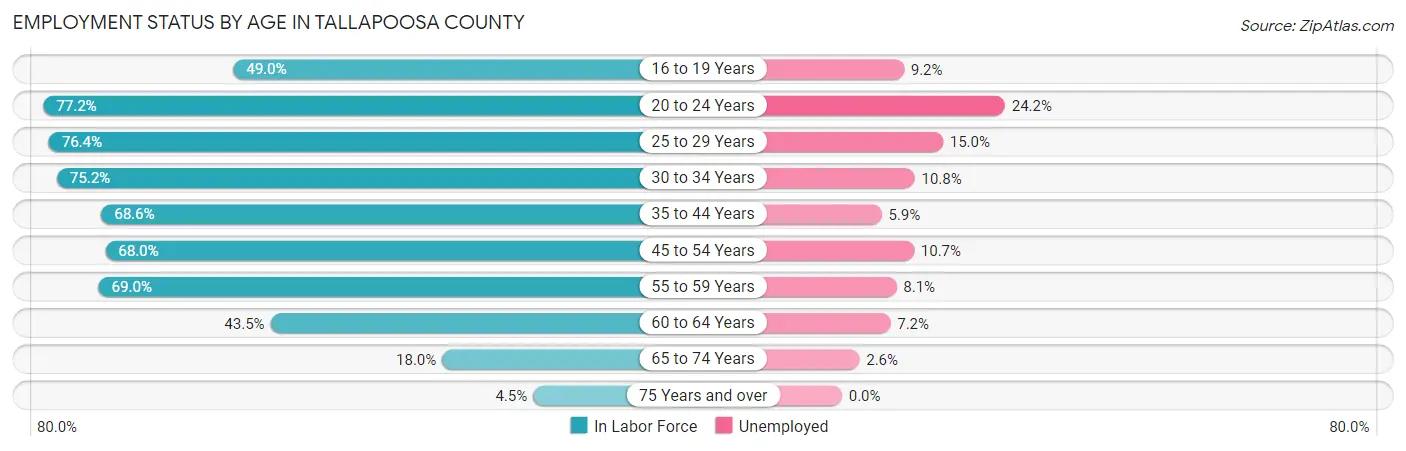
| Age Bracket | In Labor Force | Unemployed |
| 16 to 19 Years | 1,056 (49.0%) | 97 (9.2%) |
| 20 to 24 Years | 1,699 (77.2%) | 411 (24.2%) |
| 25 to 29 Years | 1,784 (76.4%) | 268 (15.0%) |
| 30 to 34 Years | 1,708 (75.2%) | 184 (10.8%) |
| 35 to 44 Years | 2,917 (68.6%) | 172 (5.9%) |
| 45 to 54 Years | 3,563 (68.0%) | 381 (10.7%) |
| 55 to 59 Years | 2,257 (69.0%) | 183 (8.1%) |
| 60 to 64 Years | 1,308 (43.5%) | 94 (7.2%) |
| 65 to 74 Years | 991 (18.0%) | 26 (2.6%) |
| 75 Years and over | 166 (4.5%) | 0 (0.0%) |
| Total | 17,431 (51.4%) | 1,813 (10.4%) |
Employment Status by Educational Attainment in Tallapoosa County
According to labor force statistics for Tallapoosa County, 66.4% of individuals (13,530) out of the total population between 25 and 64 years of age (20,376) are in the labor force, with 9.5% or 1,285 of them being unemployed. The group with the highest labor force participation rate are those with the educational attainment of college / associate degree, with 74.3% or 4,981 individuals in the labor force. Within the labor force, individuals with less than high school education have the highest percentage of unemployment, with 27.1% or 454 of them being unemployed.
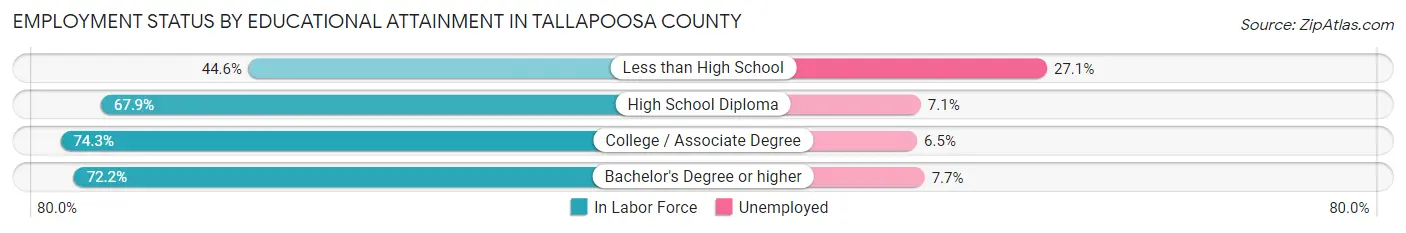
| Educational Attainment | In Labor Force | Unemployed |
| Less than High School | 1,676 (44.6%) | 1,018 (27.1%) |
| High School Diploma | 4,455 (67.9%) | 466 (7.1%) |
| College / Associate Degree | 4,981 (74.3%) | 436 (6.5%) |
| Bachelor's Degree or higher | 2,422 (72.2%) | 258 (7.7%) |
| Total | 13,530 (66.4%) | 1,936 (9.5%) |
Employment Occupations by Sex in Tallapoosa County
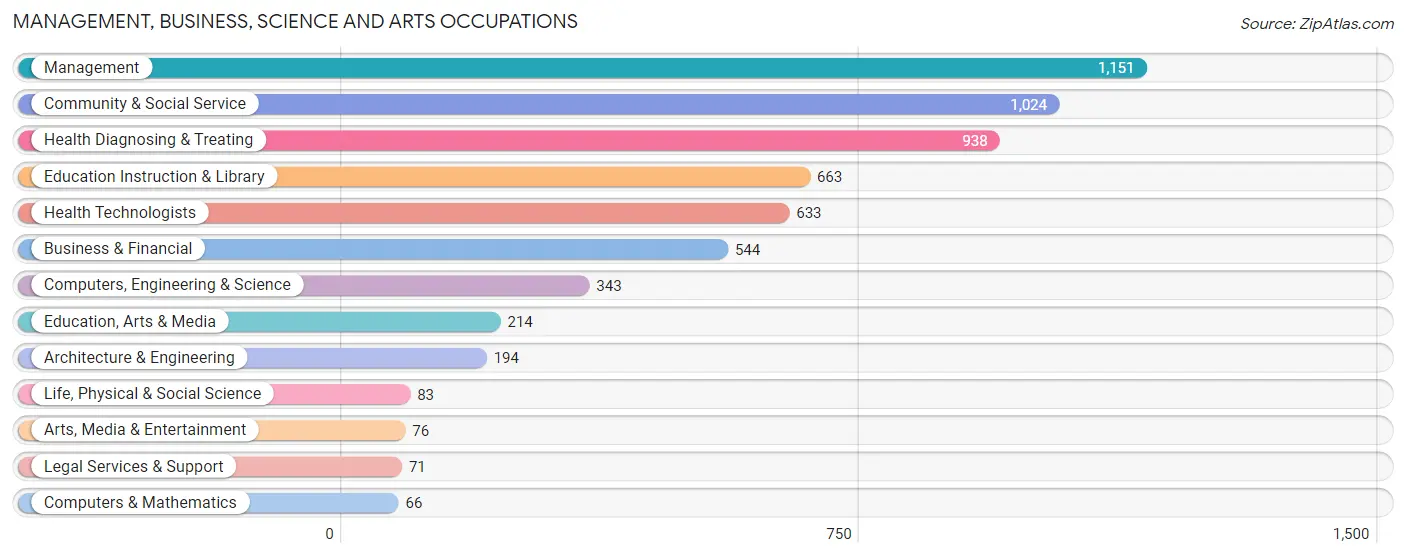
Management, Business, Science and Arts Occupations
The most common Management, Business, Science and Arts occupations in Tallapoosa County are Management (1,151 | 7.4%), Community & Social Service (1,024 | 6.6%), Health Diagnosing & Treating (938 | 6.0%), Education Instruction & Library (663 | 4.3%), and Health Technologists (633 | 4.1%).
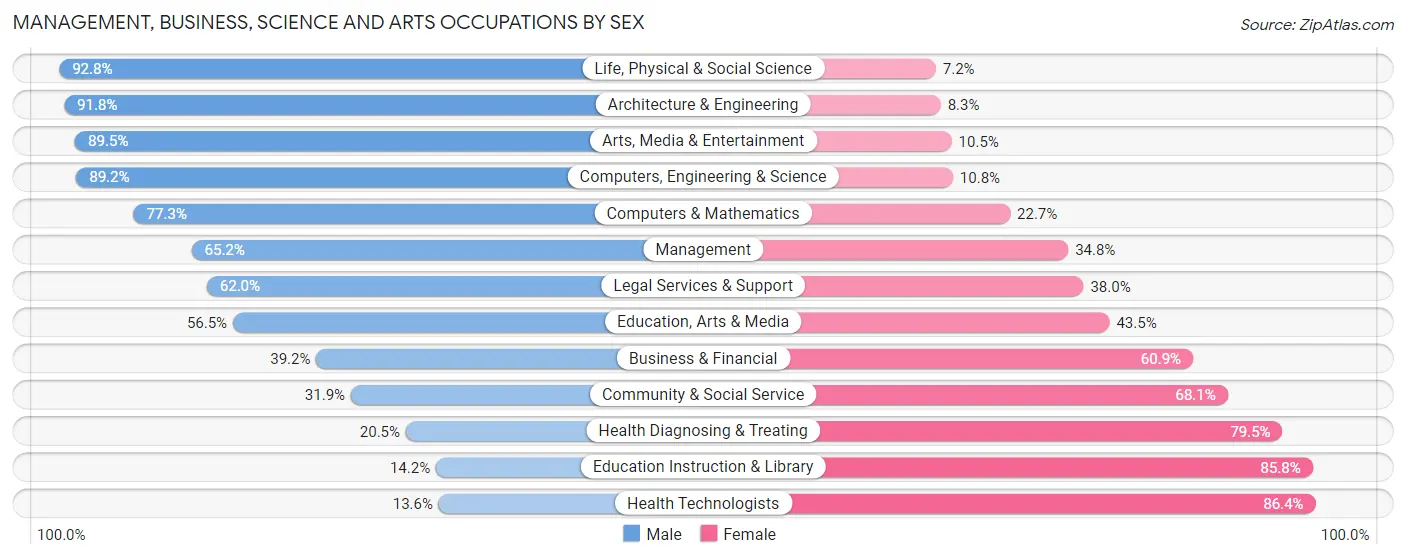
Management, Business, Science and Arts Occupations by Sex
Within the Management, Business, Science and Arts occupations in Tallapoosa County, the most male-oriented occupations are Life, Physical & Social Science (92.8%), Architecture & Engineering (91.7%), and Arts, Media & Entertainment (89.5%), while the most female-oriented occupations are Health Technologists (86.4%), Education Instruction & Library (85.8%), and Health Diagnosing & Treating (79.5%).
| Occupation | Male | Female |
| Management | 750 (65.2%) | 401 (34.8%) |
| Business & Financial | 213 (39.2%) | 331 (60.9%) |
| Computers, Engineering & Science | 306 (89.2%) | 37 (10.8%) |
| Computers & Mathematics | 51 (77.3%) | 15 (22.7%) |
| Architecture & Engineering | 178 (91.7%) | 16 (8.3%) |
| Life, Physical & Social Science | 77 (92.8%) | 6 (7.2%) |
| Community & Social Service | 327 (31.9%) | 697 (68.1%) |
| Education, Arts & Media | 121 (56.5%) | 93 (43.5%) |
| Legal Services & Support | 44 (62.0%) | 27 (38.0%) |
| Education Instruction & Library | 94 (14.2%) | 569 (85.8%) |
| Arts, Media & Entertainment | 68 (89.5%) | 8 (10.5%) |
| Health Diagnosing & Treating | 192 (20.5%) | 746 (79.5%) |
| Health Technologists | 86 (13.6%) | 547 (86.4%) |
| Total (Category) | 1,788 (44.7%) | 2,212 (55.3%) |
| Total (Overall) | 8,618 (55.2%) | 6,982 (44.8%) |
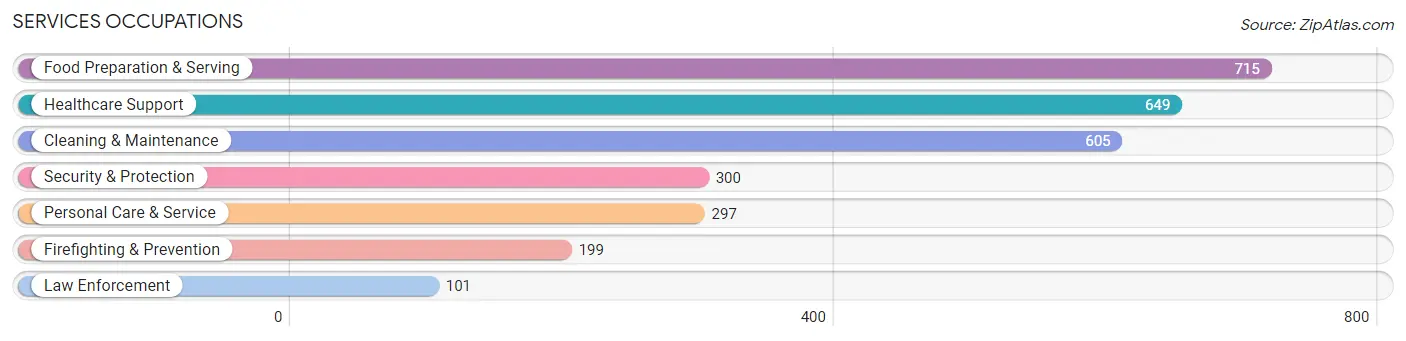
Services Occupations
The most common Services occupations in Tallapoosa County are Food Preparation & Serving (715 | 4.6%), Healthcare Support (649 | 4.2%), Cleaning & Maintenance (605 | 3.9%), Security & Protection (300 | 1.9%), and Personal Care & Service (297 | 1.9%).
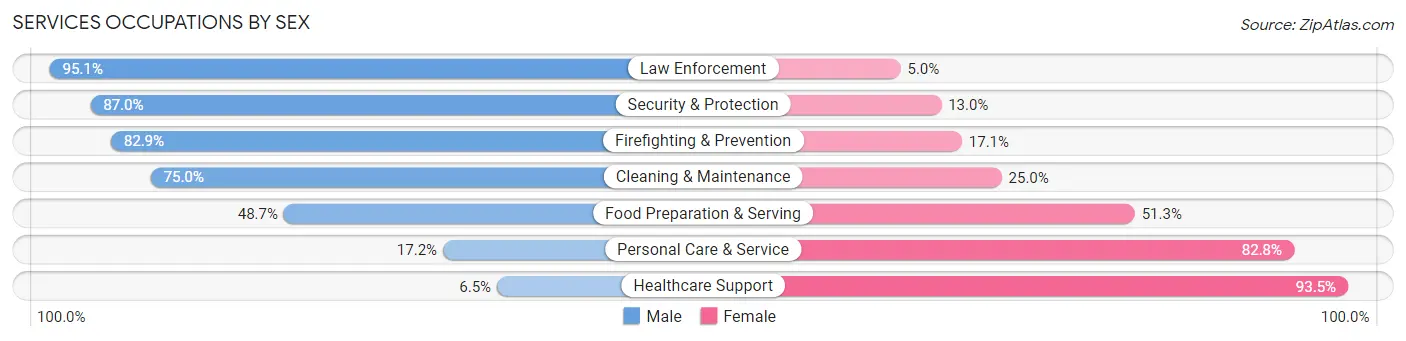
Services Occupations by Sex
Within the Services occupations in Tallapoosa County, the most male-oriented occupations are Law Enforcement (95.1%), Security & Protection (87.0%), and Firefighting & Prevention (82.9%), while the most female-oriented occupations are Healthcare Support (93.5%), Personal Care & Service (82.8%), and Food Preparation & Serving (51.3%).
| Occupation | Male | Female |
| Healthcare Support | 42 (6.5%) | 607 (93.5%) |
| Security & Protection | 261 (87.0%) | 39 (13.0%) |
| Firefighting & Prevention | 165 (82.9%) | 34 (17.1%) |
| Law Enforcement | 96 (95.1%) | 5 (5.0%) |
| Food Preparation & Serving | 348 (48.7%) | 367 (51.3%) |
| Cleaning & Maintenance | 454 (75.0%) | 151 (25.0%) |
| Personal Care & Service | 51 (17.2%) | 246 (82.8%) |
| Total (Category) | 1,156 (45.1%) | 1,410 (54.9%) |
| Total (Overall) | 8,618 (55.2%) | 6,982 (44.8%) |
Sales and Office Occupations
The most common Sales and Office occupations in Tallapoosa County are Office & Administration (1,839 | 11.8%), and Sales & Related (1,806 | 11.6%).
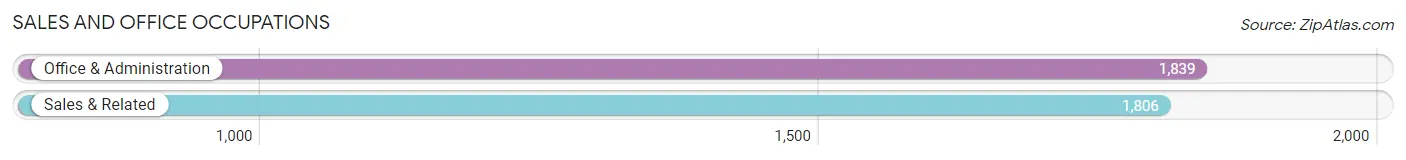
Sales and Office Occupations by Sex

| Occupation | Male | Female |
| Sales & Related | 912 (50.5%) | 894 (49.5%) |
| Office & Administration | 355 (19.3%) | 1,484 (80.7%) |
| Total (Category) | 1,267 (34.8%) | 2,378 (65.2%) |
| Total (Overall) | 8,618 (55.2%) | 6,982 (44.8%) |
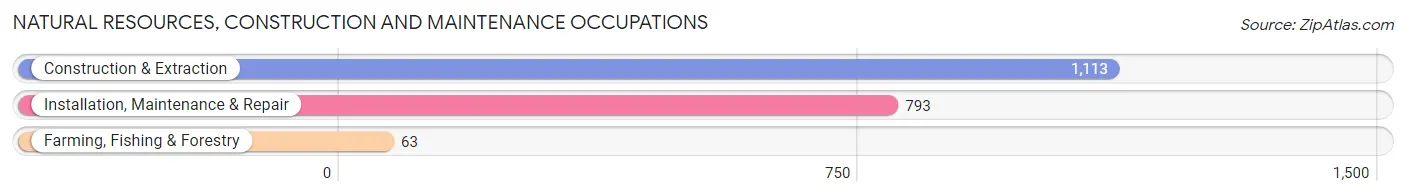
Natural Resources, Construction and Maintenance Occupations
The most common Natural Resources, Construction and Maintenance occupations in Tallapoosa County are Construction & Extraction (1,113 | 7.1%), Installation, Maintenance & Repair (793 | 5.1%), and Farming, Fishing & Forestry (63 | 0.4%).
Natural Resources, Construction and Maintenance Occupations by Sex
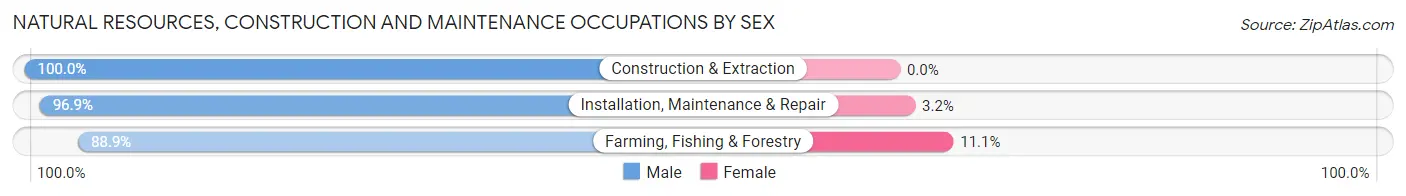
| Occupation | Male | Female |
| Farming, Fishing & Forestry | 56 (88.9%) | 7 (11.1%) |
| Construction & Extraction | 1,113 (100.0%) | 0 (0.0%) |
| Installation, Maintenance & Repair | 768 (96.9%) | 25 (3.2%) |
| Total (Category) | 1,937 (98.4%) | 32 (1.6%) |
| Total (Overall) | 8,618 (55.2%) | 6,982 (44.8%) |
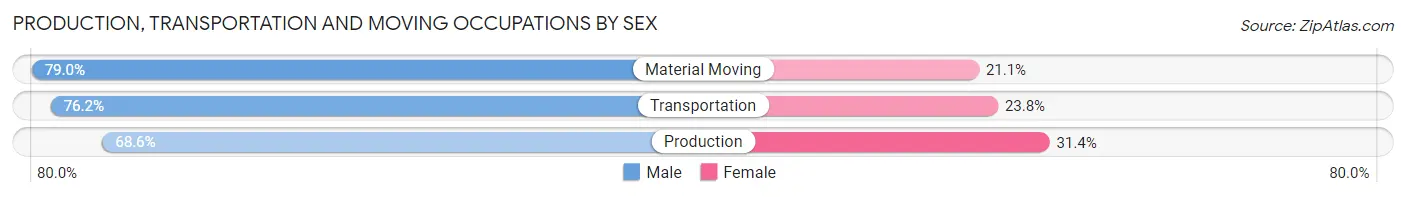
Production, Transportation and Moving Occupations
The most common Production, Transportation and Moving occupations in Tallapoosa County are Production (2,021 | 13.0%), Transportation (734 | 4.7%), and Material Moving (665 | 4.3%).
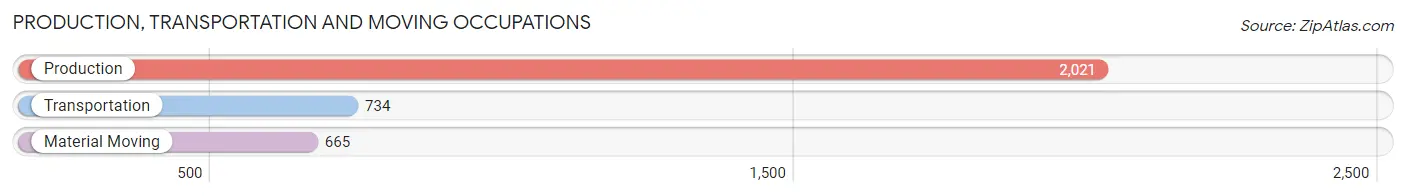
Production, Transportation and Moving Occupations by Sex
| Occupation | Male | Female |
| Production | 1,386 (68.6%) | 635 (31.4%) |
| Transportation | 559 (76.2%) | 175 (23.8%) |
| Material Moving | 525 (78.9%) | 140 (21.0%) |
| Total (Category) | 2,470 (72.2%) | 950 (27.8%) |
| Total (Overall) | 8,618 (55.2%) | 6,982 (44.8%) |
Employment Industries by Sex in Tallapoosa County
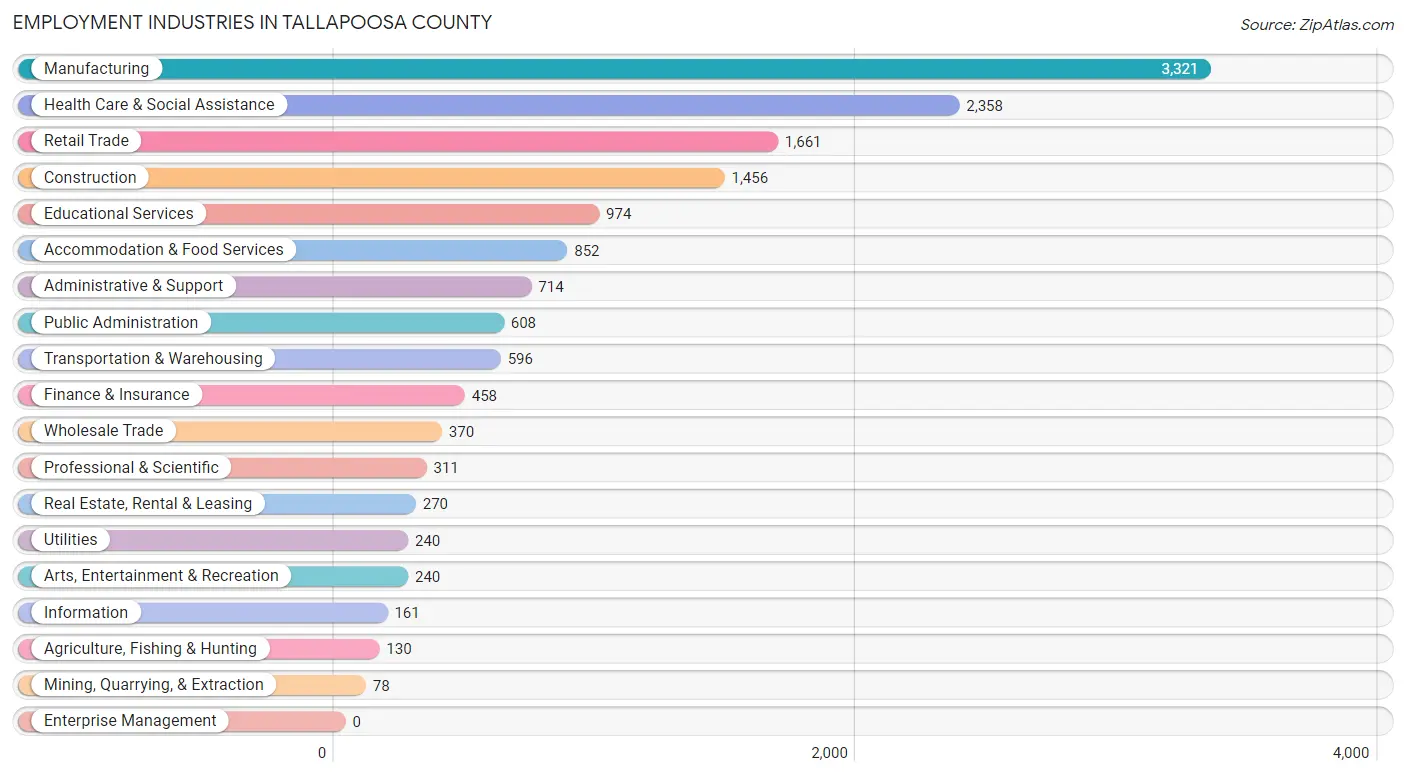
Employment Industries in Tallapoosa County
The major employment industries in Tallapoosa County include Manufacturing (3,321 | 21.3%), Health Care & Social Assistance (2,358 | 15.1%), Retail Trade (1,661 | 10.6%), Construction (1,456 | 9.3%), and Educational Services (974 | 6.2%).
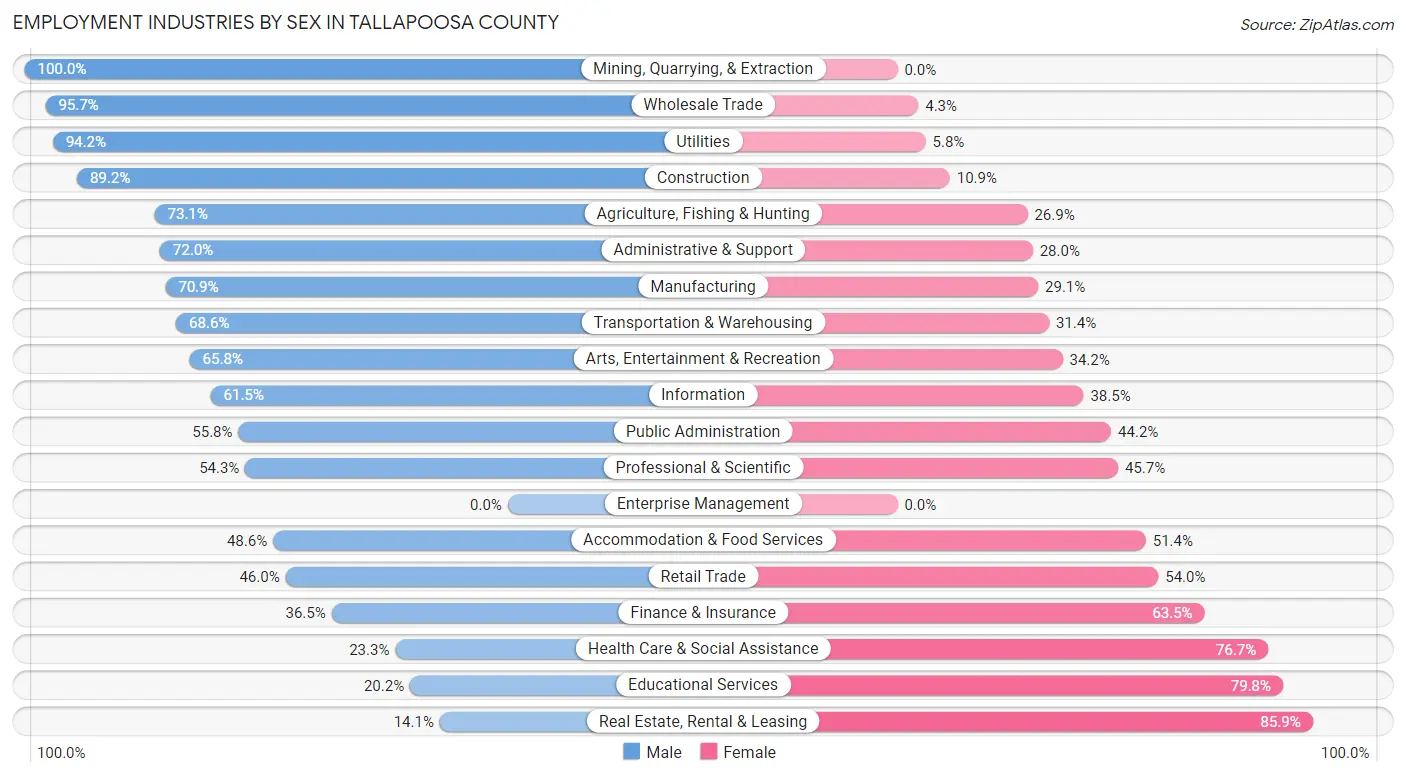
Employment Industries by Sex in Tallapoosa County
The Tallapoosa County industries that see more men than women are Mining, Quarrying, & Extraction (100.0%), Wholesale Trade (95.7%), and Utilities (94.2%), whereas the industries that tend to have a higher number of women are Real Estate, Rental & Leasing (85.9%), Educational Services (79.8%), and Health Care & Social Assistance (76.7%).
| Industry | Male | Female |
| Agriculture, Fishing & Hunting | 95 (73.1%) | 35 (26.9%) |
| Mining, Quarrying, & Extraction | 78 (100.0%) | 0 (0.0%) |
| Construction | 1,298 (89.1%) | 158 (10.8%) |
| Manufacturing | 2,354 (70.9%) | 967 (29.1%) |
| Wholesale Trade | 354 (95.7%) | 16 (4.3%) |
| Retail Trade | 764 (46.0%) | 897 (54.0%) |
| Transportation & Warehousing | 409 (68.6%) | 187 (31.4%) |
| Utilities | 226 (94.2%) | 14 (5.8%) |
| Information | 99 (61.5%) | 62 (38.5%) |
| Finance & Insurance | 167 (36.5%) | 291 (63.5%) |
| Real Estate, Rental & Leasing | 38 (14.1%) | 232 (85.9%) |
| Professional & Scientific | 169 (54.3%) | 142 (45.7%) |
| Enterprise Management | 0 (0.0%) | 0 (0.0%) |
| Administrative & Support | 514 (72.0%) | 200 (28.0%) |
| Educational Services | 197 (20.2%) | 777 (79.8%) |
| Health Care & Social Assistance | 549 (23.3%) | 1,809 (76.7%) |
| Arts, Entertainment & Recreation | 158 (65.8%) | 82 (34.2%) |
| Accommodation & Food Services | 414 (48.6%) | 438 (51.4%) |
| Public Administration | 339 (55.8%) | 269 (44.2%) |
| Total | 8,618 (55.2%) | 6,982 (44.8%) |
Education in Tallapoosa County
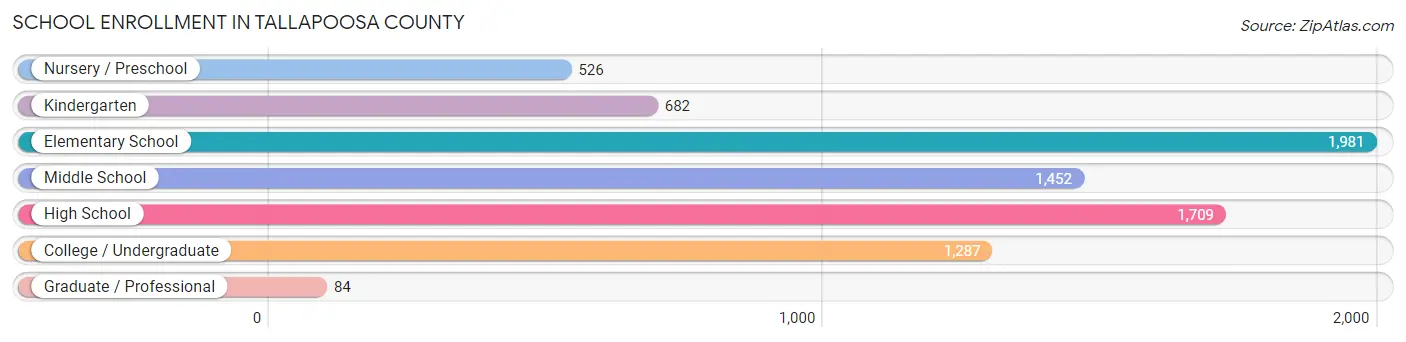
School Enrollment in Tallapoosa County
The most common levels of schooling among the 7,721 students in Tallapoosa County are elementary school (1,981 | 25.7%), high school (1,709 | 22.1%), and middle school (1,452 | 18.8%).
| School Level | # Students | % Students |
| Nursery / Preschool | 526 | 6.8% |
| Kindergarten | 682 | 8.8% |
| Elementary School | 1,981 | 25.7% |
| Middle School | 1,452 | 18.8% |
| High School | 1,709 | 22.1% |
| College / Undergraduate | 1,287 | 16.7% |
| Graduate / Professional | 84 | 1.1% |
| Total | 7,721 | 100.0% |
School Enrollment by Age by Funding Source in Tallapoosa County
Out of a total of 7,721 students who are enrolled in schools in Tallapoosa County, 664 (8.6%) attend a private institution, while the remaining 7,057 (91.4%) are enrolled in public schools. The age group of 3 to 4 year olds has the highest likelihood of being enrolled in private schools, with 89 (21.3% in the age bracket) enrolled. Conversely, the age group of 5 to 9 year old has the lowest likelihood of being enrolled in a private school, with 2,236 (97.2% in the age bracket) attending a public institution.
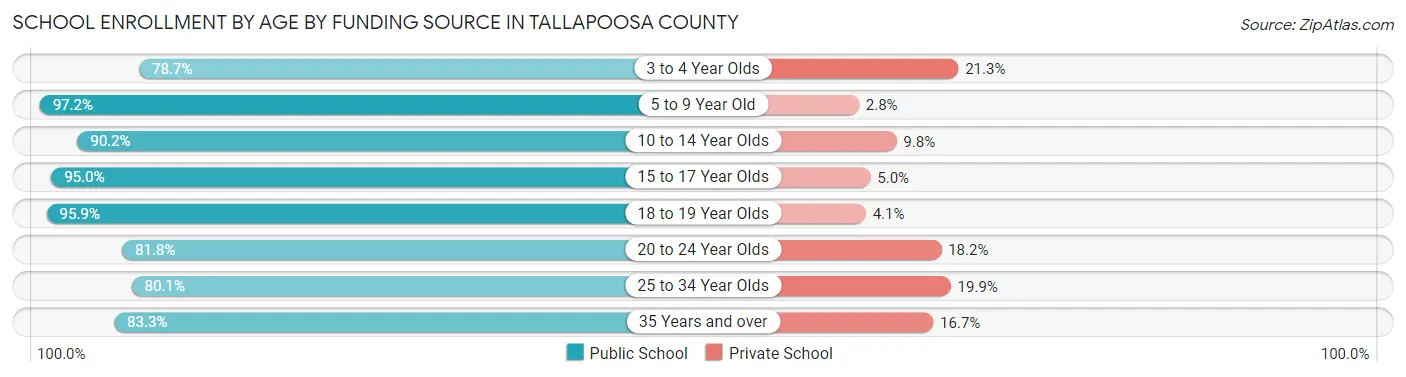
| Age Bracket | Public School | Private School |
| 3 to 4 Year Olds | 328 (78.7%) | 89 (21.3%) |
| 5 to 9 Year Old | 2,236 (97.2%) | 65 (2.8%) |
| 10 to 14 Year Olds | 1,956 (90.2%) | 213 (9.8%) |
| 15 to 17 Year Olds | 1,109 (95.0%) | 58 (5.0%) |
| 18 to 19 Year Olds | 444 (95.9%) | 19 (4.1%) |
| 20 to 24 Year Olds | 599 (81.8%) | 133 (18.2%) |
| 25 to 34 Year Olds | 229 (80.1%) | 57 (19.9%) |
| 35 Years and over | 155 (83.3%) | 31 (16.7%) |
| Total | 7,057 (91.4%) | 664 (8.6%) |
Educational Attainment by Field of Study in Tallapoosa County
Education (1,301 | 22.9%), business (1,128 | 19.8%), science & technology (590 | 10.4%), arts & humanities (467 | 8.2%), and bio, nature & agricultural (377 | 6.6%) are the most common fields of study among 5,688 individuals in Tallapoosa County who have obtained a bachelor's degree or higher.
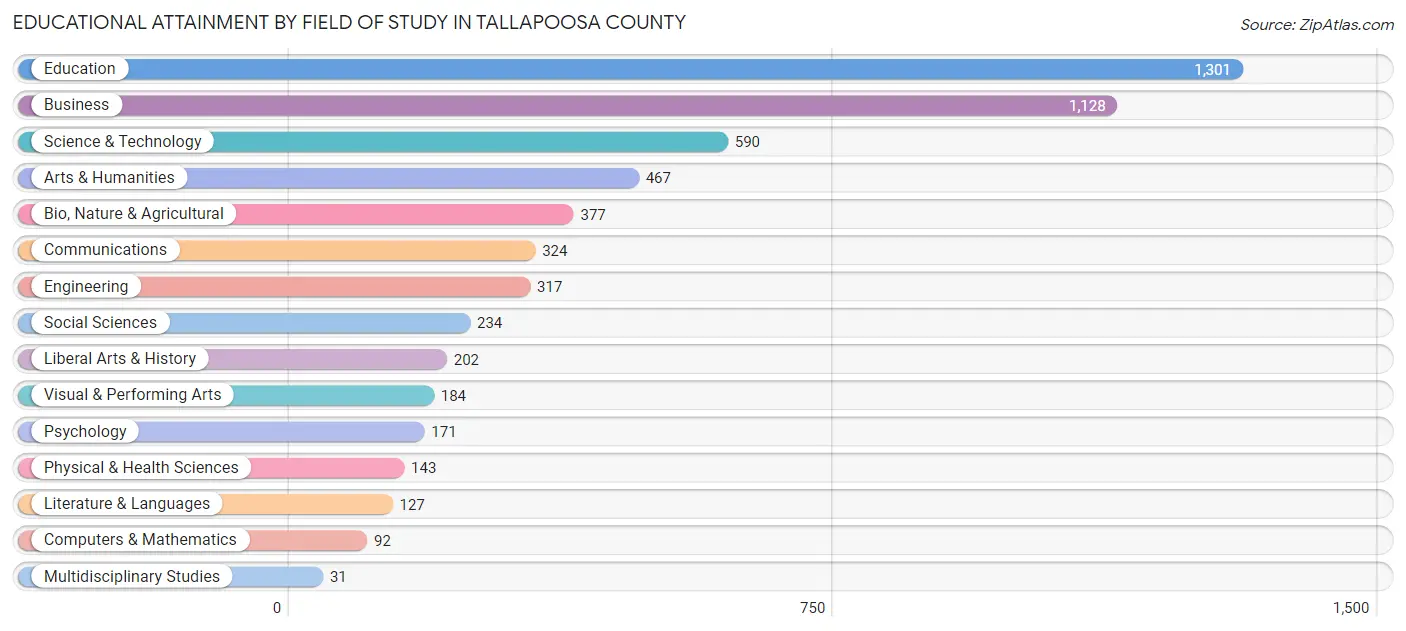
| Field of Study | # Graduates | % Graduates |
| Computers & Mathematics | 92 | 1.6% |
| Bio, Nature & Agricultural | 377 | 6.6% |
| Physical & Health Sciences | 143 | 2.5% |
| Psychology | 171 | 3.0% |
| Social Sciences | 234 | 4.1% |
| Engineering | 317 | 5.6% |
| Multidisciplinary Studies | 31 | 0.5% |
| Science & Technology | 590 | 10.4% |
| Business | 1,128 | 19.8% |
| Education | 1,301 | 22.9% |
| Literature & Languages | 127 | 2.2% |
| Liberal Arts & History | 202 | 3.5% |
| Visual & Performing Arts | 184 | 3.2% |
| Communications | 324 | 5.7% |
| Arts & Humanities | 467 | 8.2% |
| Total | 5,688 | 100.0% |
Transportation & Commute in Tallapoosa County
Vehicle Availability by Sex in Tallapoosa County
The most prevalent vehicle ownership categories in Tallapoosa County are males with 2 vehicles (3,506, accounting for 41.1%) and females with 2 vehicles (2,397, making up 51.5%).
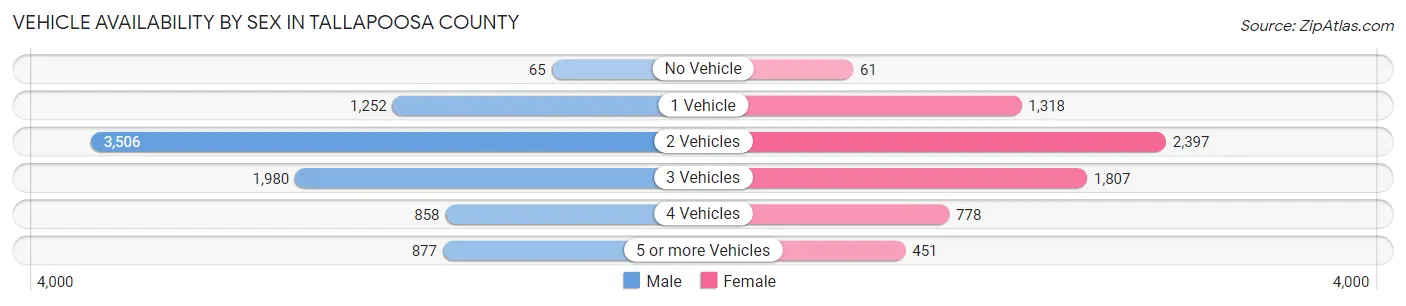
| Vehicles Available | Male | Female |
| No Vehicle | 65 (0.8%) | 61 (0.9%) |
| 1 Vehicle | 1,252 (14.7%) | 1,318 (19.4%) |
| 2 Vehicles | 3,506 (41.1%) | 2,397 (35.2%) |
| 3 Vehicles | 1,980 (23.2%) | 1,807 (26.5%) |
| 4 Vehicles | 858 (10.1%) | 778 (11.4%) |
| 5 or more Vehicles | 877 (10.3%) | 451 (6.6%) |
| Total | 8,538 (100.0%) | 6,812 (100.0%) |
Commute Time in Tallapoosa County
The most frequently occuring commute durations in Tallapoosa County are 10 to 14 minutes (2,263 commuters, 15.3%), 5 to 9 minutes (2,040 commuters, 13.8%), and 15 to 19 minutes (2,001 commuters, 13.5%).
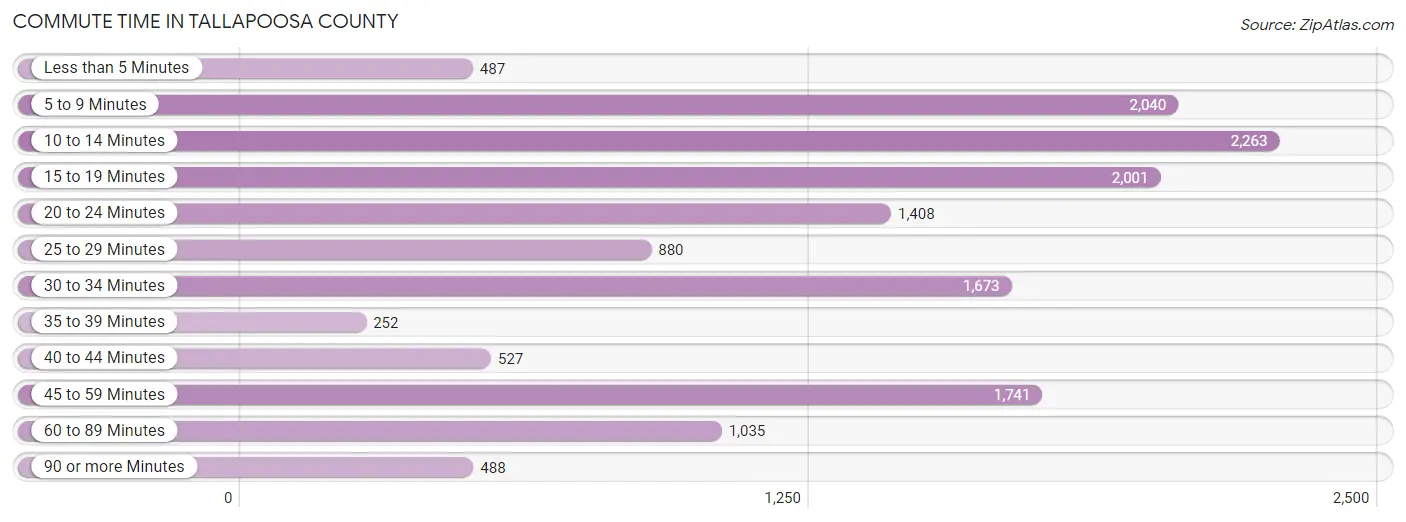
| Commute Time | # Commuters | % Commuters |
| Less than 5 Minutes | 487 | 3.3% |
| 5 to 9 Minutes | 2,040 | 13.8% |
| 10 to 14 Minutes | 2,263 | 15.3% |
| 15 to 19 Minutes | 2,001 | 13.5% |
| 20 to 24 Minutes | 1,408 | 9.5% |
| 25 to 29 Minutes | 880 | 5.9% |
| 30 to 34 Minutes | 1,673 | 11.3% |
| 35 to 39 Minutes | 252 | 1.7% |
| 40 to 44 Minutes | 527 | 3.6% |
| 45 to 59 Minutes | 1,741 | 11.8% |
| 60 to 89 Minutes | 1,035 | 7.0% |
| 90 or more Minutes | 488 | 3.3% |
Commute Time by Sex in Tallapoosa County
The most common commute times in Tallapoosa County are 10 to 14 minutes (1,215 commuters, 14.7%) for males and 10 to 14 minutes (1,048 commuters, 16.0%) for females.
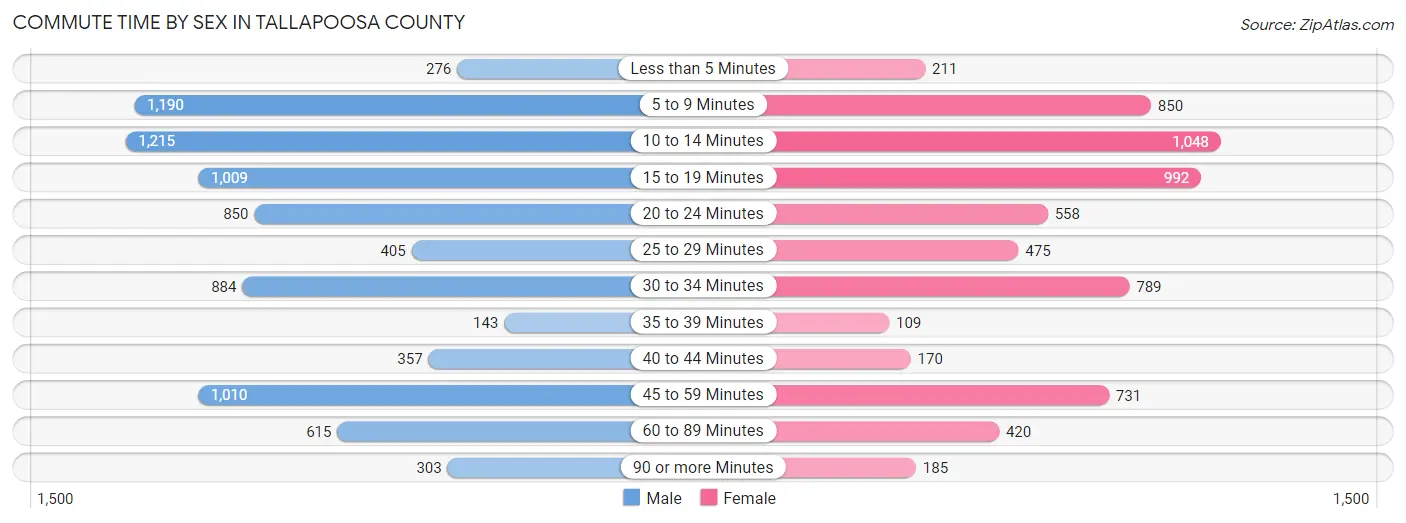
| Commute Time | Male | Female |
| Less than 5 Minutes | 276 (3.3%) | 211 (3.2%) |
| 5 to 9 Minutes | 1,190 (14.4%) | 850 (13.0%) |
| 10 to 14 Minutes | 1,215 (14.7%) | 1,048 (16.0%) |
| 15 to 19 Minutes | 1,009 (12.2%) | 992 (15.2%) |
| 20 to 24 Minutes | 850 (10.3%) | 558 (8.5%) |
| 25 to 29 Minutes | 405 (4.9%) | 475 (7.3%) |
| 30 to 34 Minutes | 884 (10.7%) | 789 (12.1%) |
| 35 to 39 Minutes | 143 (1.7%) | 109 (1.7%) |
| 40 to 44 Minutes | 357 (4.3%) | 170 (2.6%) |
| 45 to 59 Minutes | 1,010 (12.2%) | 731 (11.2%) |
| 60 to 89 Minutes | 615 (7.4%) | 420 (6.4%) |
| 90 or more Minutes | 303 (3.7%) | 185 (2.8%) |
Time of Departure to Work by Sex in Tallapoosa County
The most frequent times of departure to work in Tallapoosa County are 6:00 AM to 6:29 AM (1,067, 12.9%) for males and 7:00 AM to 7:29 AM (1,196, 18.3%) for females.
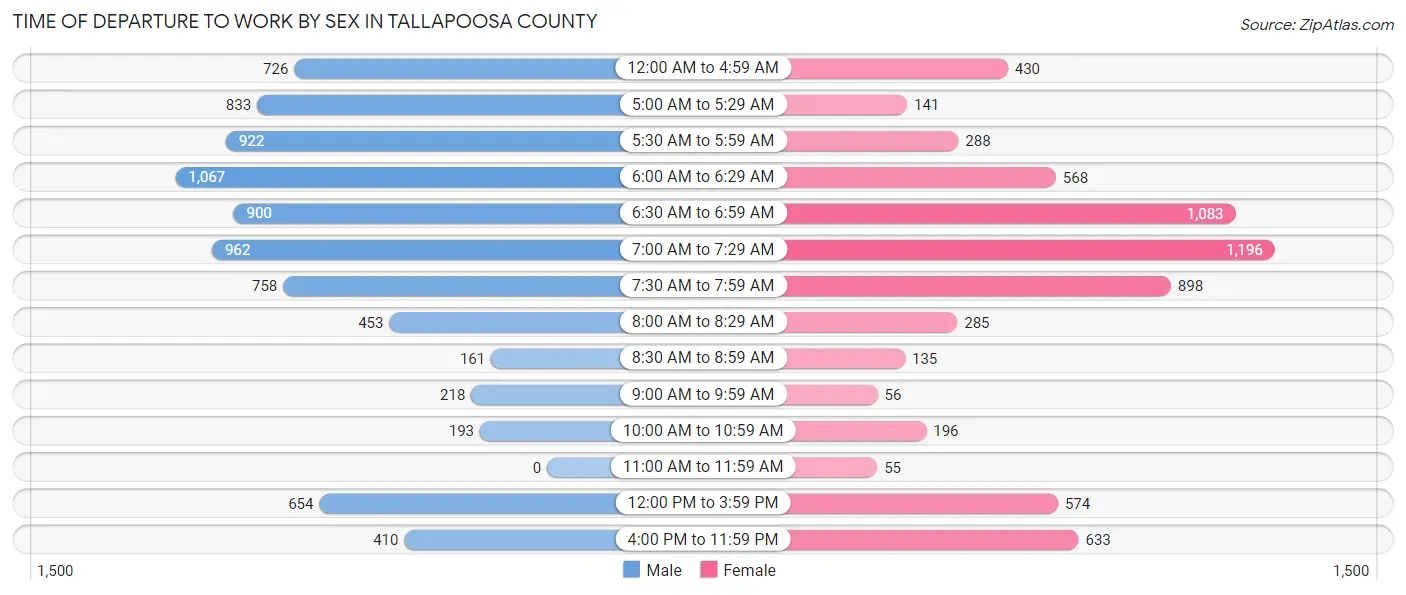
| Time of Departure | Male | Female |
| 12:00 AM to 4:59 AM | 726 (8.8%) | 430 (6.6%) |
| 5:00 AM to 5:29 AM | 833 (10.1%) | 141 (2.2%) |
| 5:30 AM to 5:59 AM | 922 (11.2%) | 288 (4.4%) |
| 6:00 AM to 6:29 AM | 1,067 (12.9%) | 568 (8.7%) |
| 6:30 AM to 6:59 AM | 900 (10.9%) | 1,083 (16.6%) |
| 7:00 AM to 7:29 AM | 962 (11.7%) | 1,196 (18.3%) |
| 7:30 AM to 7:59 AM | 758 (9.2%) | 898 (13.7%) |
| 8:00 AM to 8:29 AM | 453 (5.5%) | 285 (4.4%) |
| 8:30 AM to 8:59 AM | 161 (1.9%) | 135 (2.1%) |
| 9:00 AM to 9:59 AM | 218 (2.6%) | 56 (0.9%) |
| 10:00 AM to 10:59 AM | 193 (2.3%) | 196 (3.0%) |
| 11:00 AM to 11:59 AM | 0 (0.0%) | 55 (0.8%) |
| 12:00 PM to 3:59 PM | 654 (7.9%) | 574 (8.8%) |
| 4:00 PM to 11:59 PM | 410 (5.0%) | 633 (9.7%) |
| Total | 8,257 (100.0%) | 6,538 (100.0%) |
Housing Occupancy in Tallapoosa County
Occupancy by Ownership in Tallapoosa County
Of the total 16,438 dwellings in Tallapoosa County, owner-occupied units account for 12,409 (75.5%), while renter-occupied units make up 4,029 (24.5%).
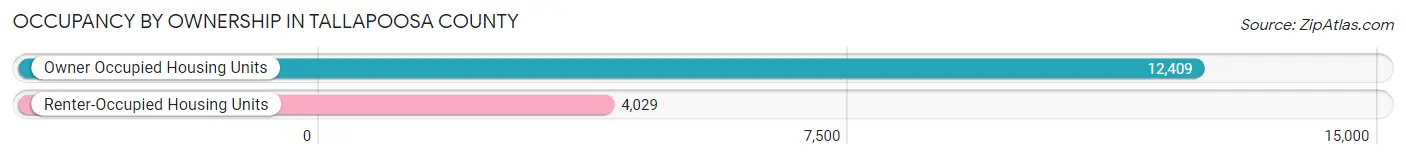
| Occupancy | # Housing Units | % Housing Units |
| Owner Occupied Housing Units | 12,409 | 75.5% |
| Renter-Occupied Housing Units | 4,029 | 24.5% |
| Total Occupied Housing Units | 16,438 | 100.0% |
Occupancy by Household Size in Tallapoosa County
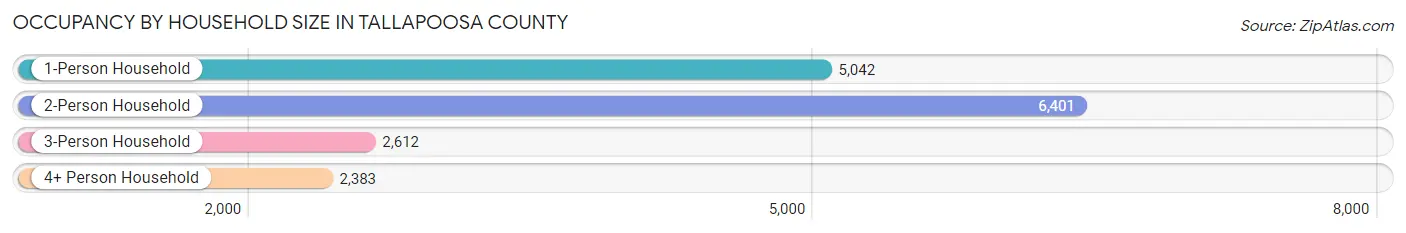
| Household Size | # Housing Units | % Housing Units |
| 1-Person Household | 5,042 | 30.7% |
| 2-Person Household | 6,401 | 38.9% |
| 3-Person Household | 2,612 | 15.9% |
| 4+ Person Household | 2,383 | 14.5% |
| Total Housing Units | 16,438 | 100.0% |
Occupancy by Ownership by Household Size in Tallapoosa County
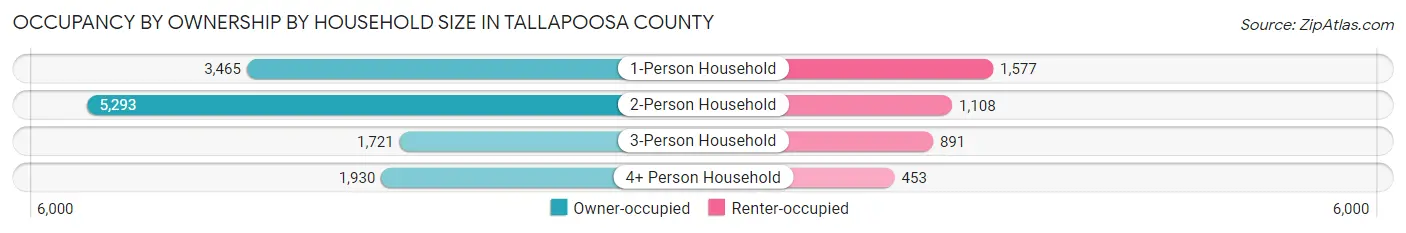
| Household Size | Owner-occupied | Renter-occupied |
| 1-Person Household | 3,465 (68.7%) | 1,577 (31.3%) |
| 2-Person Household | 5,293 (82.7%) | 1,108 (17.3%) |
| 3-Person Household | 1,721 (65.9%) | 891 (34.1%) |
| 4+ Person Household | 1,930 (81.0%) | 453 (19.0%) |
| Total Housing Units | 12,409 (75.5%) | 4,029 (24.5%) |
Occupancy by Educational Attainment in Tallapoosa County
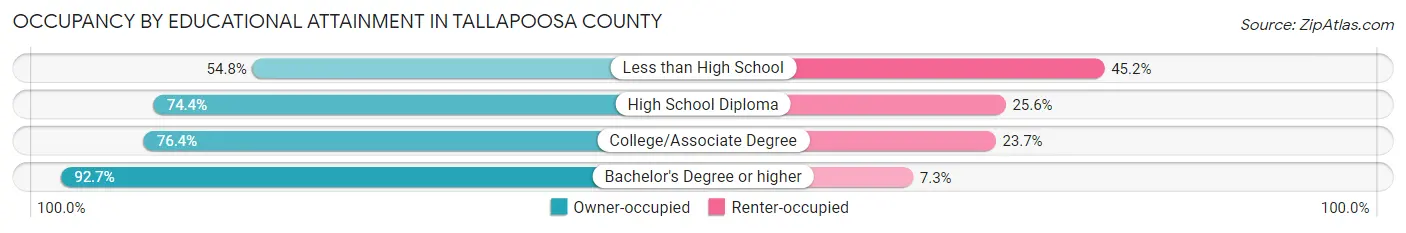
| Household Size | Owner-occupied | Renter-occupied |
| Less than High School | 1,415 (54.8%) | 1,168 (45.2%) |
| High School Diploma | 3,918 (74.4%) | 1,350 (25.6%) |
| College/Associate Degree | 4,132 (76.3%) | 1,280 (23.6%) |
| Bachelor's Degree or higher | 2,944 (92.7%) | 231 (7.3%) |
Occupancy by Age of Householder in Tallapoosa County
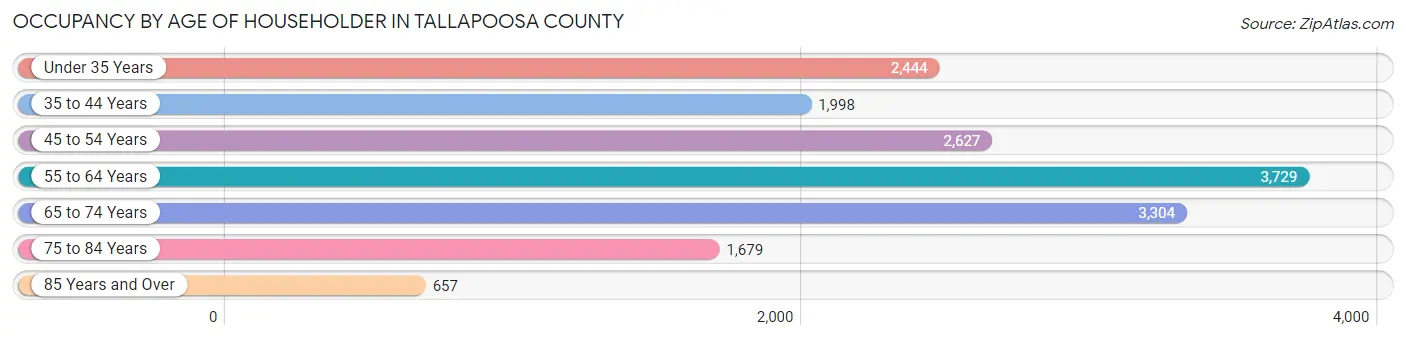
| Age Bracket | # Households | % Households |
| Under 35 Years | 2,444 | 14.9% |
| 35 to 44 Years | 1,998 | 12.1% |
| 45 to 54 Years | 2,627 | 16.0% |
| 55 to 64 Years | 3,729 | 22.7% |
| 65 to 74 Years | 3,304 | 20.1% |
| 75 to 84 Years | 1,679 | 10.2% |
| 85 Years and Over | 657 | 4.0% |
| Total | 16,438 | 100.0% |
Housing Finances in Tallapoosa County
Median Income by Occupancy in Tallapoosa County
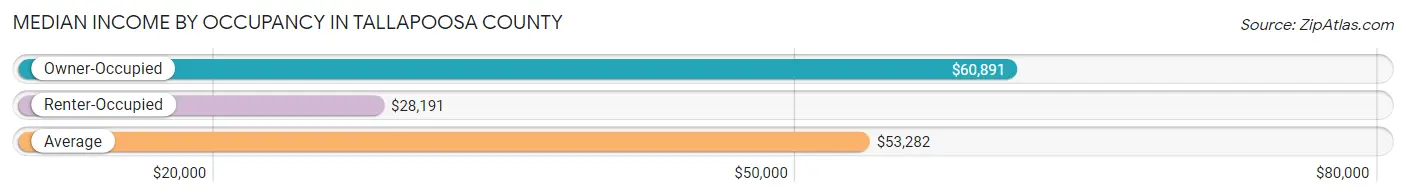
| Occupancy Type | # Households | Median Income |
| Owner-Occupied | 12,409 (75.5%) | $60,891 |
| Renter-Occupied | 4,029 (24.5%) | $28,191 |
| Average | 16,438 (100.0%) | $53,282 |
Occupancy by Householder Income Bracket in Tallapoosa County
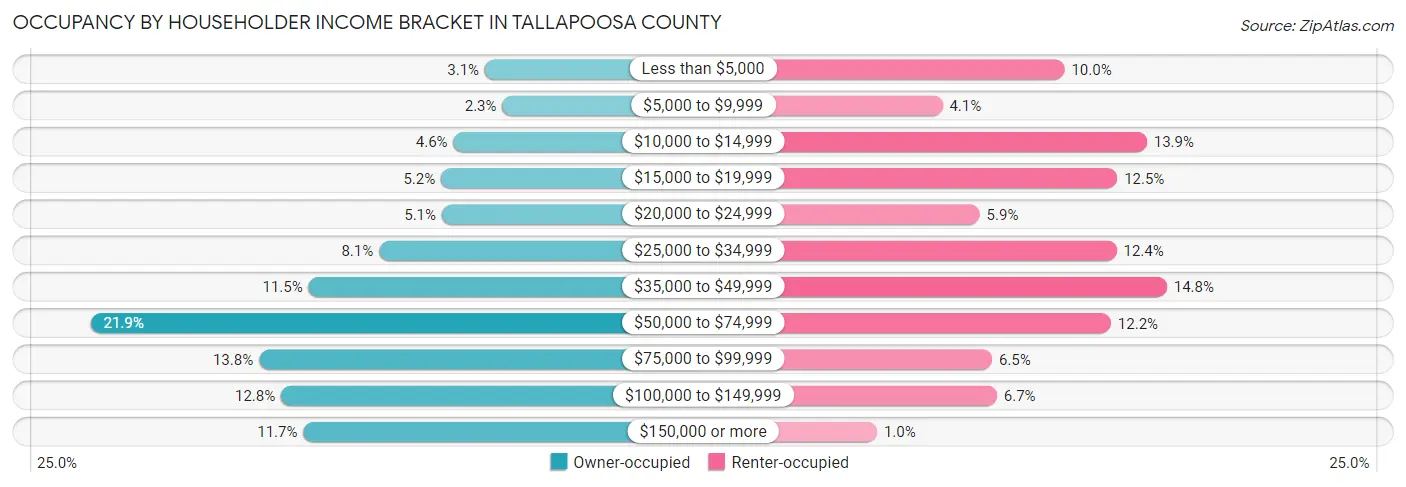
| Income Bracket | Owner-occupied | Renter-occupied |
| Less than $5,000 | 382 (3.1%) | 401 (10.0%) |
| $5,000 to $9,999 | 279 (2.2%) | 167 (4.1%) |
| $10,000 to $14,999 | 568 (4.6%) | 559 (13.9%) |
| $15,000 to $19,999 | 641 (5.2%) | 502 (12.5%) |
| $20,000 to $24,999 | 636 (5.1%) | 238 (5.9%) |
| $25,000 to $34,999 | 1,007 (8.1%) | 501 (12.4%) |
| $35,000 to $49,999 | 1,424 (11.5%) | 597 (14.8%) |
| $50,000 to $74,999 | 2,712 (21.9%) | 490 (12.2%) |
| $75,000 to $99,999 | 1,717 (13.8%) | 262 (6.5%) |
| $100,000 to $149,999 | 1,587 (12.8%) | 271 (6.7%) |
| $150,000 or more | 1,456 (11.7%) | 41 (1.0%) |
| Total | 12,409 (100.0%) | 4,029 (100.0%) |
Monthly Housing Cost Tiers in Tallapoosa County
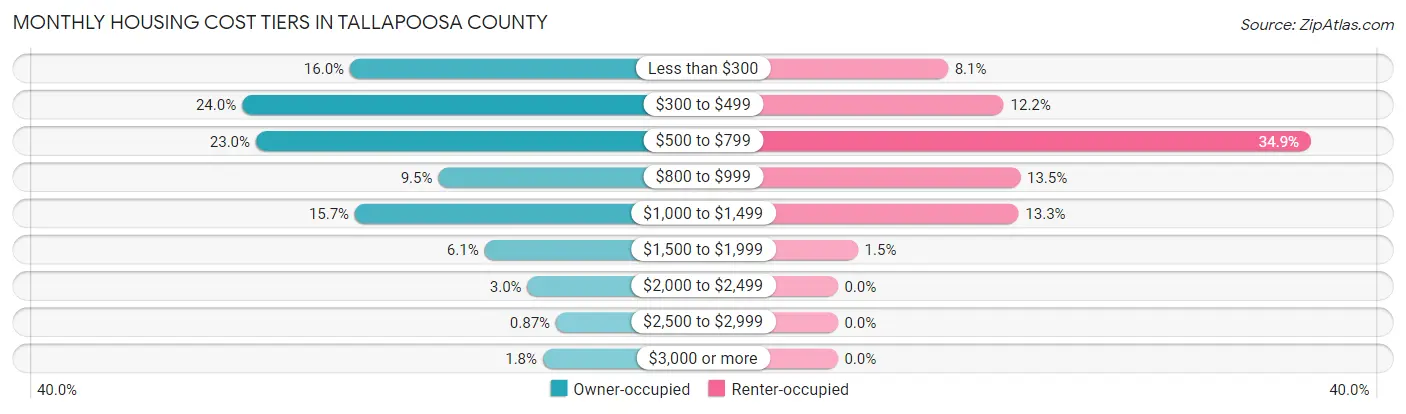
| Monthly Cost | Owner-occupied | Renter-occupied |
| Less than $300 | 1,990 (16.0%) | 327 (8.1%) |
| $300 to $499 | 2,977 (24.0%) | 493 (12.2%) |
| $500 to $799 | 2,850 (23.0%) | 1,405 (34.9%) |
| $800 to $999 | 1,182 (9.5%) | 542 (13.5%) |
| $1,000 to $1,499 | 1,945 (15.7%) | 537 (13.3%) |
| $1,500 to $1,999 | 761 (6.1%) | 60 (1.5%) |
| $2,000 to $2,499 | 369 (3.0%) | 0 (0.0%) |
| $2,500 to $2,999 | 108 (0.9%) | 0 (0.0%) |
| $3,000 or more | 227 (1.8%) | 0 (0.0%) |
| Total | 12,409 (100.0%) | 4,029 (100.0%) |
Physical Housing Characteristics in Tallapoosa County
Housing Structures in Tallapoosa County
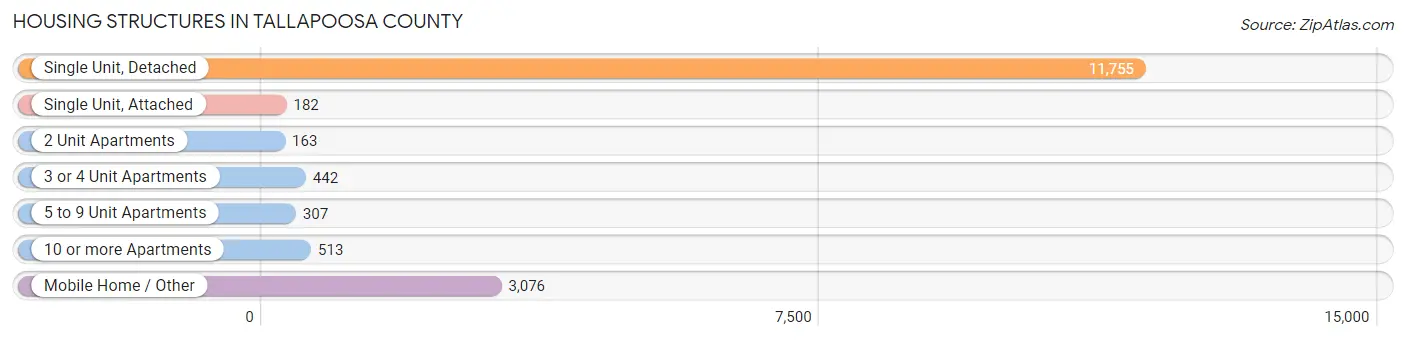
| Structure Type | # Housing Units | % Housing Units |
| Single Unit, Detached | 11,755 | 71.5% |
| Single Unit, Attached | 182 | 1.1% |
| 2 Unit Apartments | 163 | 1.0% |
| 3 or 4 Unit Apartments | 442 | 2.7% |
| 5 to 9 Unit Apartments | 307 | 1.9% |
| 10 or more Apartments | 513 | 3.1% |
| Mobile Home / Other | 3,076 | 18.7% |
| Total | 16,438 | 100.0% |
Housing Structures by Occupancy in Tallapoosa County
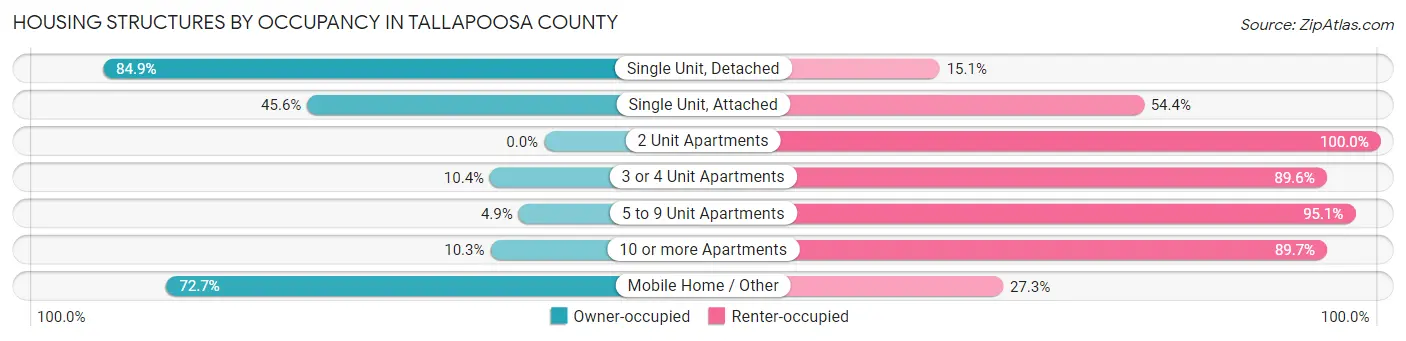
| Structure Type | Owner-occupied | Renter-occupied |
| Single Unit, Detached | 9,976 (84.9%) | 1,779 (15.1%) |
| Single Unit, Attached | 83 (45.6%) | 99 (54.4%) |
| 2 Unit Apartments | 0 (0.0%) | 163 (100.0%) |
| 3 or 4 Unit Apartments | 46 (10.4%) | 396 (89.6%) |
| 5 to 9 Unit Apartments | 15 (4.9%) | 292 (95.1%) |
| 10 or more Apartments | 53 (10.3%) | 460 (89.7%) |
| Mobile Home / Other | 2,236 (72.7%) | 840 (27.3%) |
| Total | 12,409 (75.5%) | 4,029 (24.5%) |
Housing Structures by Number of Rooms in Tallapoosa County
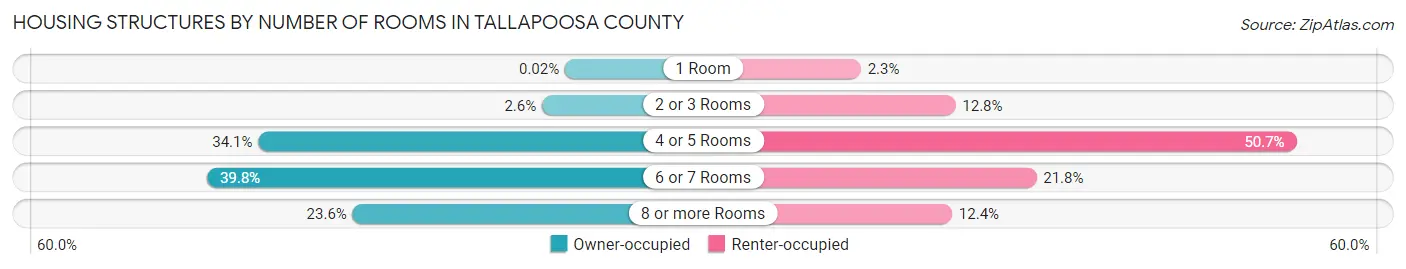
| Number of Rooms | Owner-occupied | Renter-occupied |
| 1 Room | 2 (0.0%) | 93 (2.3%) |
| 2 or 3 Rooms | 319 (2.6%) | 516 (12.8%) |
| 4 or 5 Rooms | 4,227 (34.1%) | 2,041 (50.7%) |
| 6 or 7 Rooms | 4,934 (39.8%) | 878 (21.8%) |
| 8 or more Rooms | 2,927 (23.6%) | 501 (12.4%) |
| Total | 12,409 (100.0%) | 4,029 (100.0%) |
Housing Structure by Heating Type in Tallapoosa County
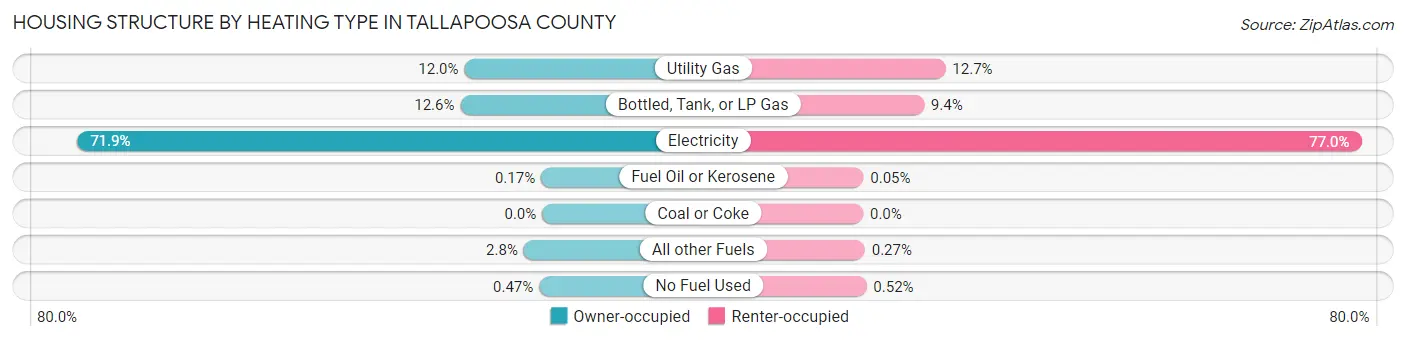
| Heating Type | Owner-occupied | Renter-occupied |
| Utility Gas | 1,492 (12.0%) | 513 (12.7%) |
| Bottled, Tank, or LP Gas | 1,569 (12.6%) | 379 (9.4%) |
| Electricity | 8,917 (71.9%) | 3,103 (77.0%) |
| Fuel Oil or Kerosene | 21 (0.2%) | 2 (0.1%) |
| Coal or Coke | 0 (0.0%) | 0 (0.0%) |
| All other Fuels | 352 (2.8%) | 11 (0.3%) |
| No Fuel Used | 58 (0.5%) | 21 (0.5%) |
| Total | 12,409 (100.0%) | 4,029 (100.0%) |
Household Vehicle Usage in Tallapoosa County
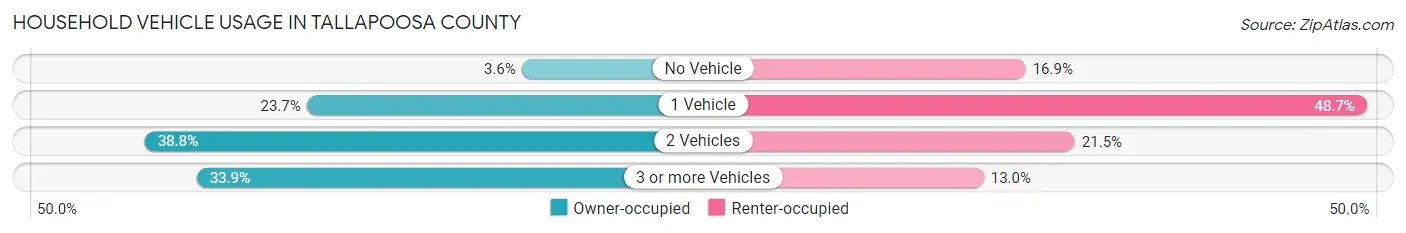
| Vehicles per Household | Owner-occupied | Renter-occupied |
| No Vehicle | 448 (3.6%) | 680 (16.9%) |
| 1 Vehicle | 2,939 (23.7%) | 1,962 (48.7%) |
| 2 Vehicles | 4,812 (38.8%) | 865 (21.5%) |
| 3 or more Vehicles | 4,210 (33.9%) | 522 (13.0%) |
| Total | 12,409 (100.0%) | 4,029 (100.0%) |
Real Estate & Mortgages in Tallapoosa County
Real Estate and Mortgage Overview in Tallapoosa County
| Characteristic | Without Mortgage | With Mortgage |
| Housing Units | 6,597 | 5,812 |
| Median Property Value | $115,800 | $142,100 |
| Median Household Income | $44,781 | $973 |
| Monthly Housing Costs | $405 | $223 |
| Real Estate Taxes | $381 | $988 |
Property Value by Mortgage Status in Tallapoosa County
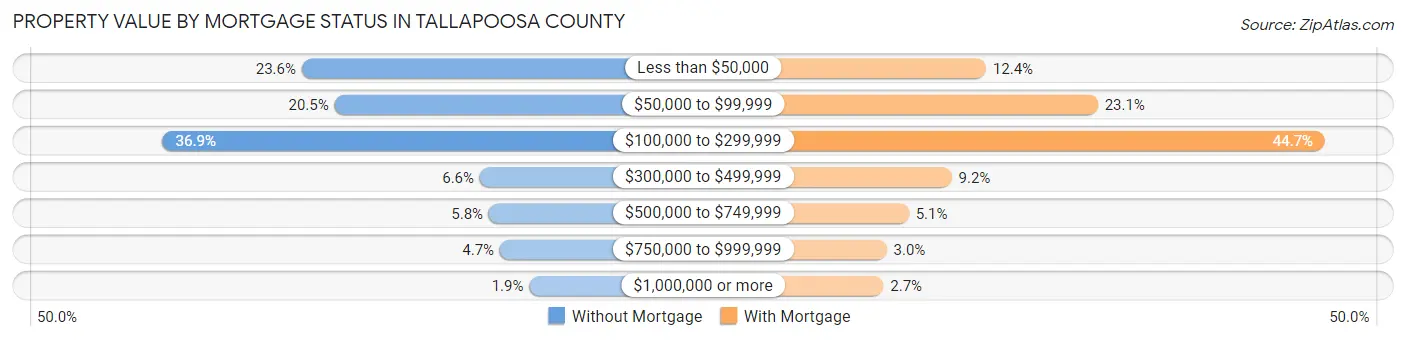
| Property Value | Without Mortgage | With Mortgage |
| Less than $50,000 | 1,557 (23.6%) | 722 (12.4%) |
| $50,000 to $99,999 | 1,351 (20.5%) | 1,340 (23.1%) |
| $100,000 to $299,999 | 2,431 (36.8%) | 2,598 (44.7%) |
| $300,000 to $499,999 | 438 (6.6%) | 532 (9.1%) |
| $500,000 to $749,999 | 381 (5.8%) | 294 (5.1%) |
| $750,000 to $999,999 | 312 (4.7%) | 172 (3.0%) |
| $1,000,000 or more | 127 (1.9%) | 154 (2.6%) |
| Total | 6,597 (100.0%) | 5,812 (100.0%) |
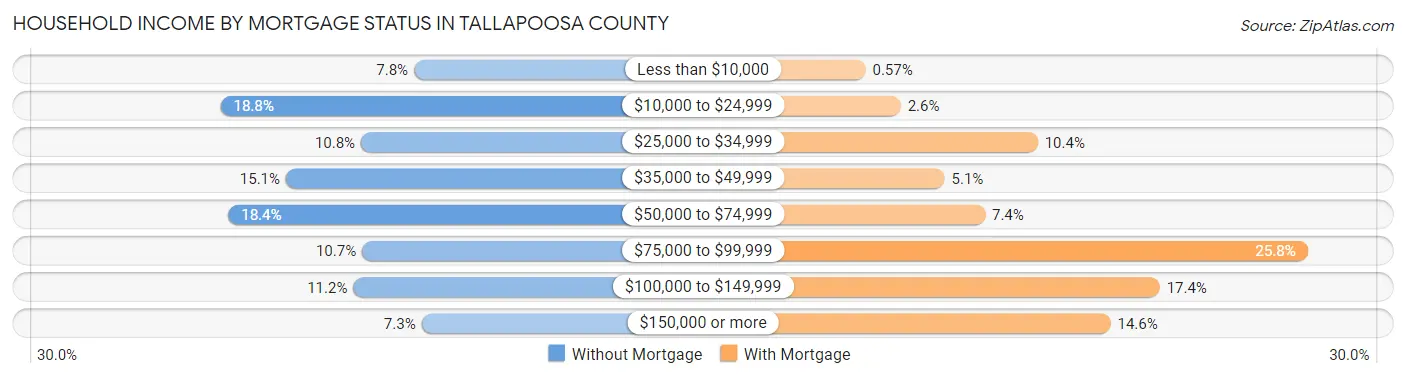
Household Income by Mortgage Status in Tallapoosa County
| Household Income | Without Mortgage | With Mortgage |
| Less than $10,000 | 511 (7.7%) | 33 (0.6%) |
| $10,000 to $24,999 | 1,240 (18.8%) | 150 (2.6%) |
| $25,000 to $34,999 | 711 (10.8%) | 605 (10.4%) |
| $35,000 to $49,999 | 994 (15.1%) | 296 (5.1%) |
| $50,000 to $74,999 | 1,211 (18.4%) | 430 (7.4%) |
| $75,000 to $99,999 | 707 (10.7%) | 1,501 (25.8%) |
| $100,000 to $149,999 | 740 (11.2%) | 1,010 (17.4%) |
| $150,000 or more | 483 (7.3%) | 847 (14.6%) |
| Total | 6,597 (100.0%) | 5,812 (100.0%) |
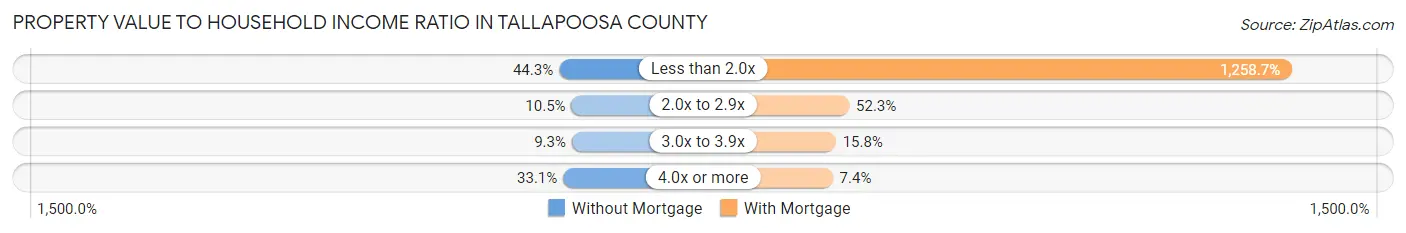
Property Value to Household Income Ratio in Tallapoosa County
| Value-to-Income Ratio | Without Mortgage | With Mortgage |
| Less than 2.0x | 2,921 (44.3%) | 73,155 (1,258.7%) |
| 2.0x to 2.9x | 691 (10.5%) | 3,040 (52.3%) |
| 3.0x to 3.9x | 611 (9.3%) | 916 (15.8%) |
| 4.0x or more | 2,181 (33.1%) | 430 (7.4%) |
| Total | 6,597 (100.0%) | 5,812 (100.0%) |
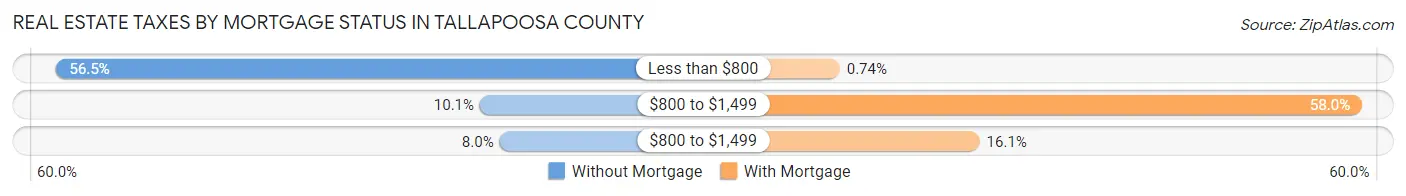
Real Estate Taxes by Mortgage Status in Tallapoosa County
| Property Taxes | Without Mortgage | With Mortgage |
| Less than $800 | 3,728 (56.5%) | 43 (0.7%) |
| $800 to $1,499 | 667 (10.1%) | 3,369 (58.0%) |
| $800 to $1,499 | 525 (8.0%) | 934 (16.1%) |
| Total | 6,597 (100.0%) | 5,812 (100.0%) |
Health & Disability in Tallapoosa County
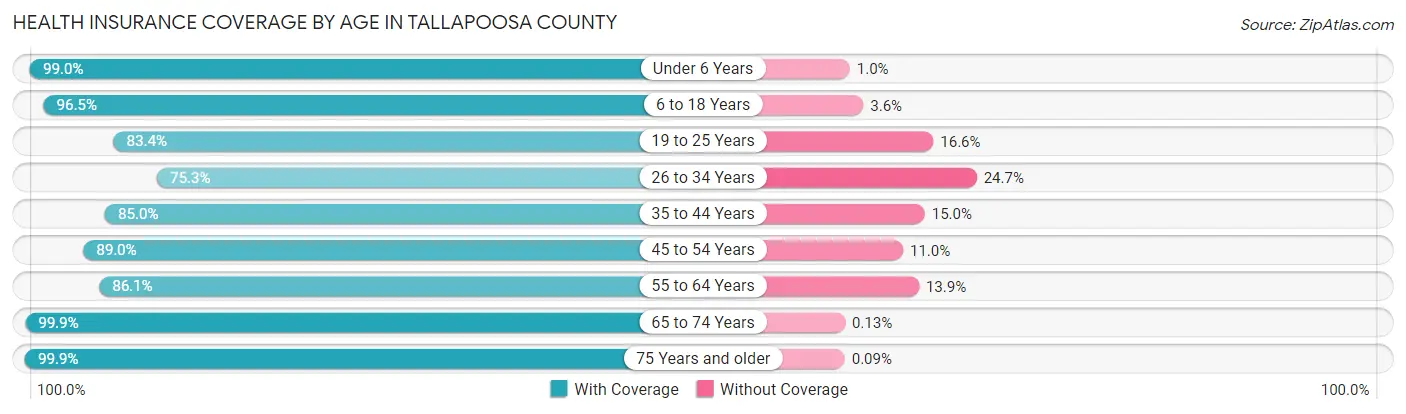
Health Insurance Coverage by Age in Tallapoosa County
| Age Bracket | With Coverage | Without Coverage |
| Under 6 Years | 2,684 (99.0%) | 28 (1.0%) |
| 6 to 18 Years | 5,931 (96.5%) | 218 (3.5%) |
| 19 to 25 Years | 2,621 (83.4%) | 522 (16.6%) |
| 26 to 34 Years | 3,158 (75.3%) | 1,036 (24.7%) |
| 35 to 44 Years | 3,557 (85.0%) | 628 (15.0%) |
| 45 to 54 Years | 4,640 (89.0%) | 571 (11.0%) |
| 55 to 64 Years | 5,338 (86.1%) | 864 (13.9%) |
| 65 to 74 Years | 5,397 (99.9%) | 7 (0.1%) |
| 75 Years and older | 3,394 (99.9%) | 3 (0.1%) |
| Total | 36,720 (90.4%) | 3,877 (9.6%) |
Health Insurance Coverage by Citizenship Status in Tallapoosa County
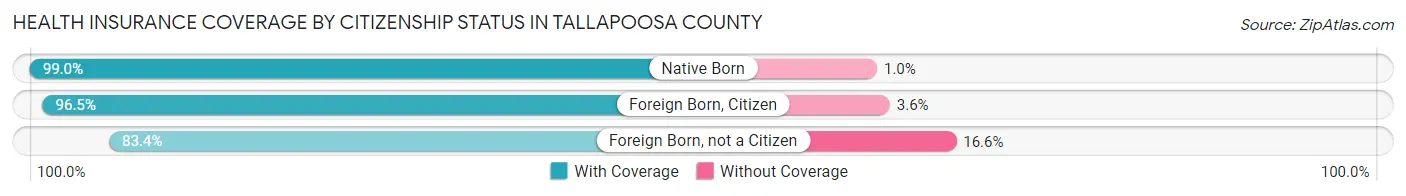
| Citizenship Status | With Coverage | Without Coverage |
| Native Born | 2,684 (99.0%) | 28 (1.0%) |
| Foreign Born, Citizen | 5,931 (96.5%) | 218 (3.5%) |
| Foreign Born, not a Citizen | 2,621 (83.4%) | 522 (16.6%) |
Health Insurance Coverage by Household Income in Tallapoosa County
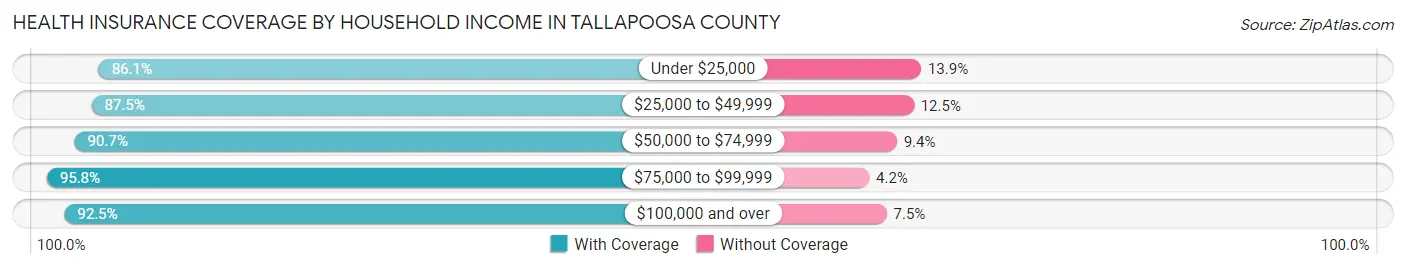
| Household Income | With Coverage | Without Coverage |
| Under $25,000 | 6,619 (86.1%) | 1,069 (13.9%) |
| $25,000 to $49,999 | 7,016 (87.5%) | 1,006 (12.5%) |
| $50,000 to $74,999 | 7,448 (90.6%) | 768 (9.3%) |
| $75,000 to $99,999 | 6,549 (95.8%) | 286 (4.2%) |
| $100,000 and over | 8,938 (92.5%) | 721 (7.5%) |
Public vs Private Health Insurance Coverage by Age in Tallapoosa County
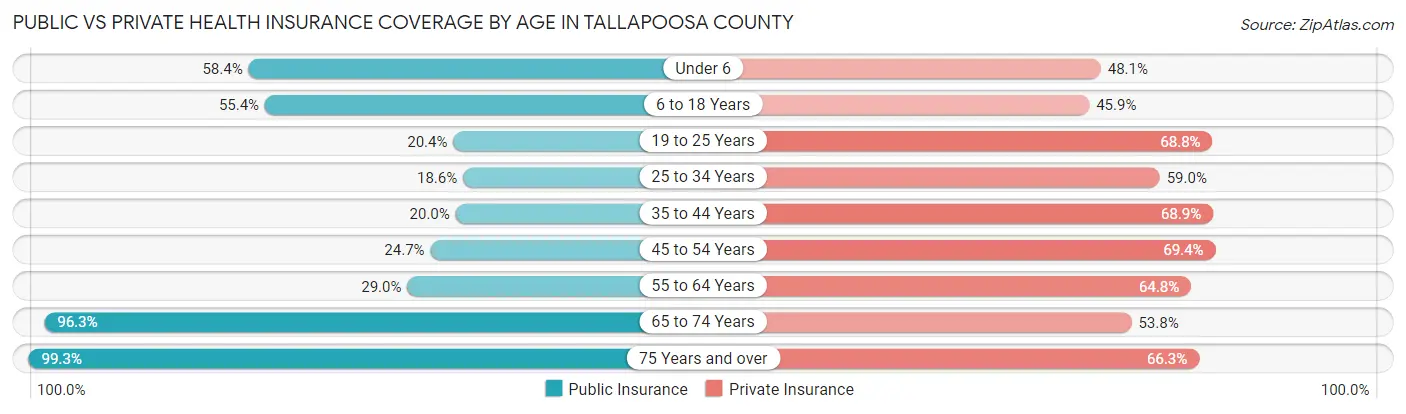
| Age Bracket | Public Insurance | Private Insurance |
| Under 6 | 1,585 (58.4%) | 1,304 (48.1%) |
| 6 to 18 Years | 3,406 (55.4%) | 2,824 (45.9%) |
| 19 to 25 Years | 642 (20.4%) | 2,162 (68.8%) |
| 25 to 34 Years | 781 (18.6%) | 2,475 (59.0%) |
| 35 to 44 Years | 837 (20.0%) | 2,884 (68.9%) |
| 45 to 54 Years | 1,286 (24.7%) | 3,614 (69.4%) |
| 55 to 64 Years | 1,797 (29.0%) | 4,021 (64.8%) |
| 65 to 74 Years | 5,206 (96.3%) | 2,906 (53.8%) |
| 75 Years and over | 3,372 (99.3%) | 2,253 (66.3%) |
| Total | 18,912 (46.6%) | 24,443 (60.2%) |
Disability Status by Sex by Age in Tallapoosa County
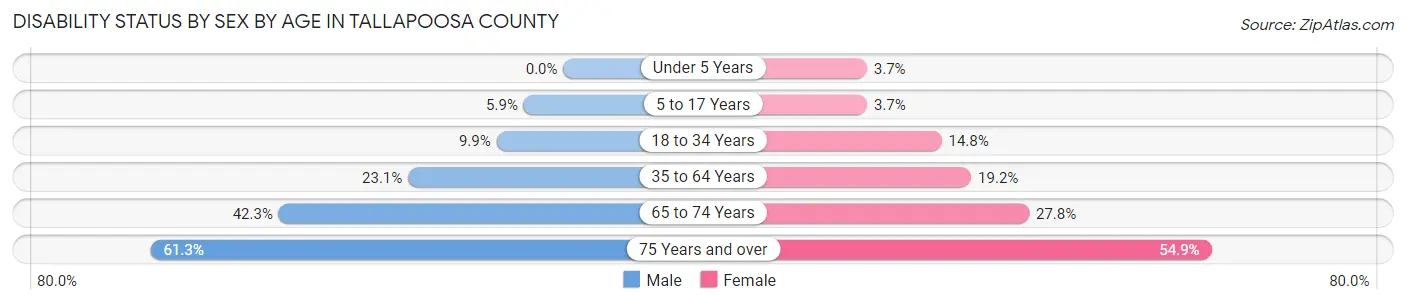
| Age Bracket | Male | Female |
| Under 5 Years | 0 (0.0%) | 46 (3.7%) |
| 5 to 17 Years | 188 (5.9%) | 111 (3.7%) |
| 18 to 34 Years | 381 (9.9%) | 589 (14.8%) |
| 35 to 64 Years | 1,728 (23.1%) | 1,556 (19.2%) |
| 65 to 74 Years | 1,092 (42.3%) | 784 (27.8%) |
| 75 Years and over | 876 (61.3%) | 1,080 (54.9%) |
Disability Class by Sex by Age in Tallapoosa County
Disability Class: Hearing Difficulty
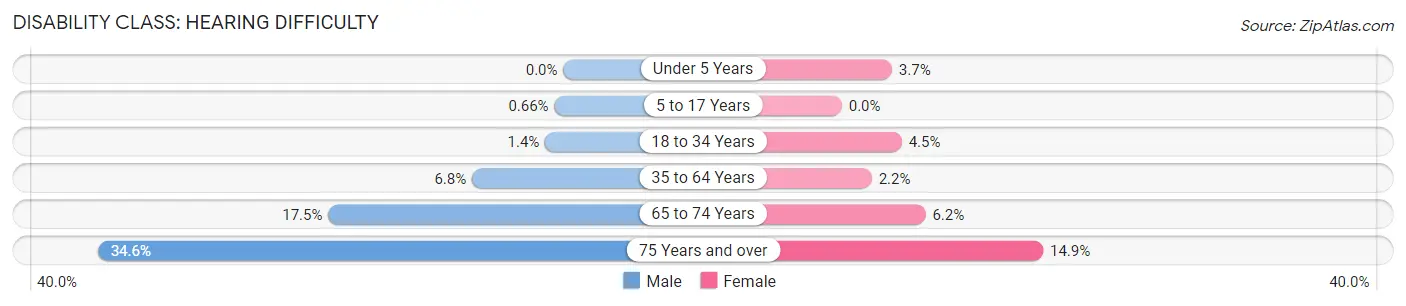
| Age Bracket | Male | Female |
| Under 5 Years | 0 (0.0%) | 46 (3.7%) |
| 5 to 17 Years | 21 (0.7%) | 0 (0.0%) |
| 18 to 34 Years | 52 (1.3%) | 177 (4.4%) |
| 35 to 64 Years | 508 (6.8%) | 180 (2.2%) |
| 65 to 74 Years | 451 (17.4%) | 175 (6.2%) |
| 75 Years and over | 494 (34.6%) | 294 (14.9%) |
Disability Class: Vision Difficulty
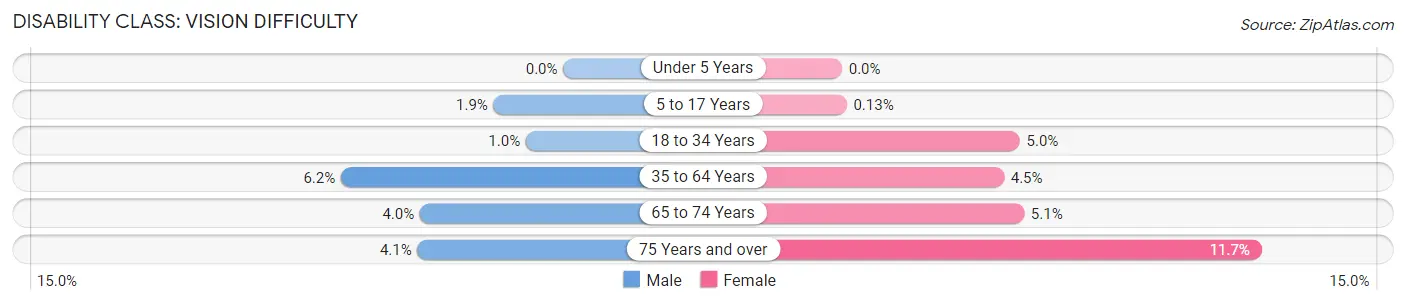
| Age Bracket | Male | Female |
| Under 5 Years | 0 (0.0%) | 0 (0.0%) |
| 5 to 17 Years | 62 (1.9%) | 4 (0.1%) |
| 18 to 34 Years | 40 (1.0%) | 197 (5.0%) |
| 35 to 64 Years | 464 (6.2%) | 365 (4.5%) |
| 65 to 74 Years | 103 (4.0%) | 143 (5.1%) |
| 75 Years and over | 58 (4.1%) | 230 (11.7%) |
Disability Class: Cognitive Difficulty
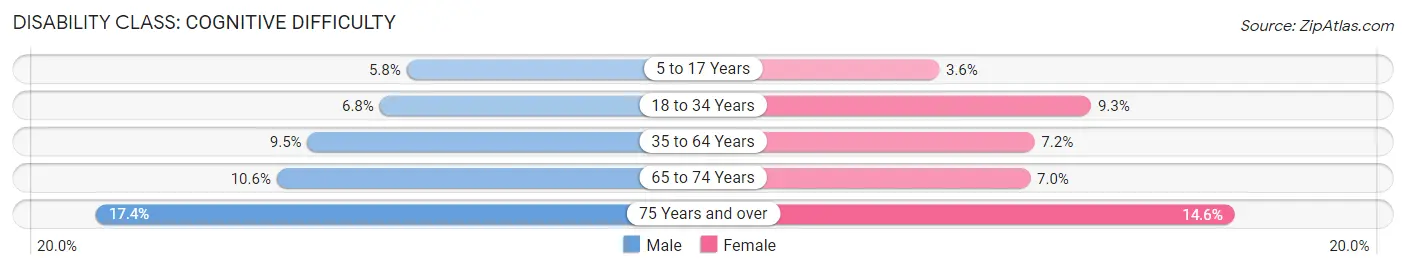
| Age Bracket | Male | Female |
| 5 to 17 Years | 186 (5.8%) | 107 (3.6%) |
| 18 to 34 Years | 262 (6.8%) | 368 (9.2%) |
| 35 to 64 Years | 712 (9.5%) | 579 (7.1%) |
| 65 to 74 Years | 275 (10.6%) | 197 (7.0%) |
| 75 Years and over | 248 (17.3%) | 287 (14.6%) |
Disability Class: Ambulatory Difficulty
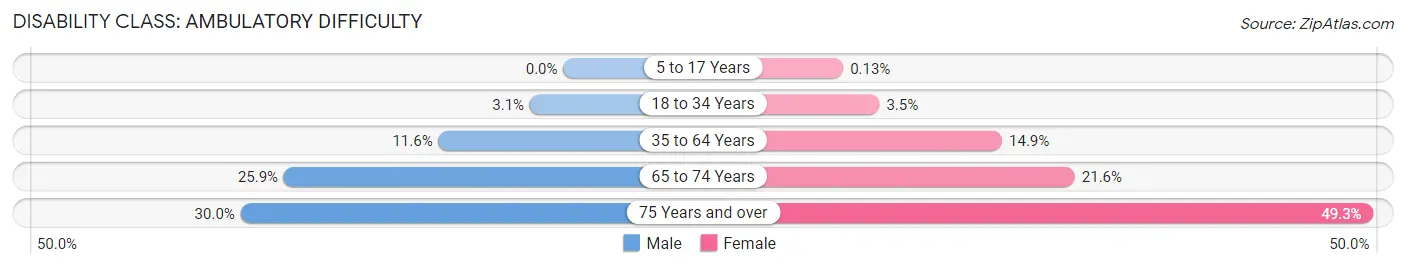
| Age Bracket | Male | Female |
| 5 to 17 Years | 0 (0.0%) | 4 (0.1%) |
| 18 to 34 Years | 119 (3.1%) | 139 (3.5%) |
| 35 to 64 Years | 869 (11.6%) | 1,205 (14.9%) |
| 65 to 74 Years | 670 (25.9%) | 610 (21.6%) |
| 75 Years and over | 428 (29.9%) | 971 (49.3%) |
Disability Class: Self-Care Difficulty
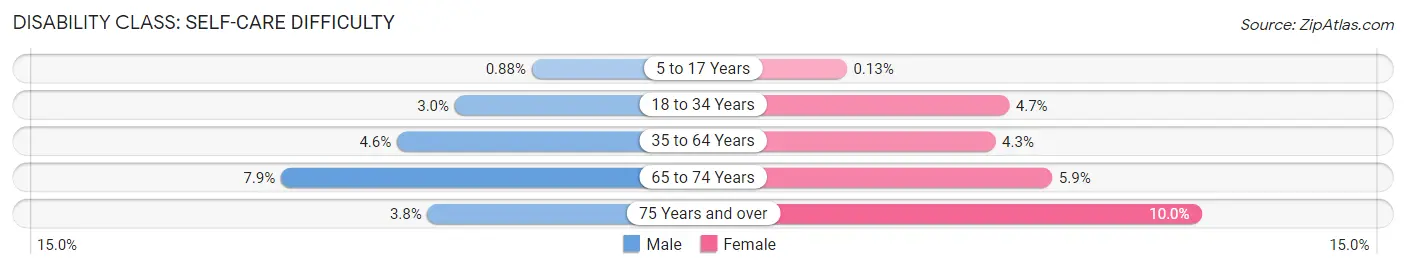
| Age Bracket | Male | Female |
| 5 to 17 Years | 28 (0.9%) | 4 (0.1%) |
| 18 to 34 Years | 116 (3.0%) | 185 (4.6%) |
| 35 to 64 Years | 347 (4.6%) | 346 (4.3%) |
| 65 to 74 Years | 203 (7.9%) | 165 (5.9%) |
| 75 Years and over | 54 (3.8%) | 197 (10.0%) |
Technology Access in Tallapoosa County
Computing Device Access in Tallapoosa County
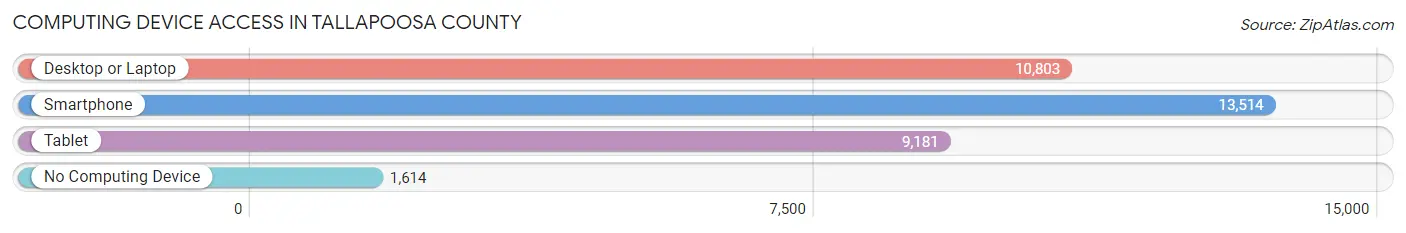
| Device Type | # Households | % Households |
| Desktop or Laptop | 10,803 | 65.7% |
| Smartphone | 13,514 | 82.2% |
| Tablet | 9,181 | 55.8% |
| No Computing Device | 1,614 | 9.8% |
| Total | 16,438 | 100.0% |
Internet Access in Tallapoosa County
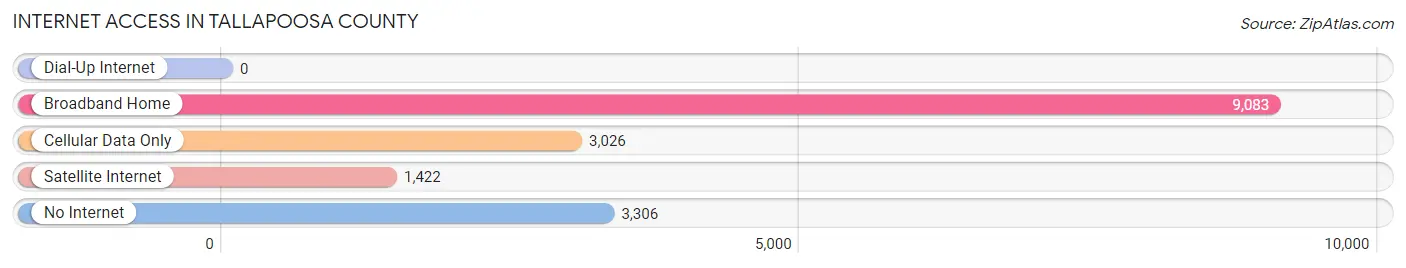
| Internet Type | # Households | % Households |
| Dial-Up Internet | 0 | 0.0% |
| Broadband Home | 9,083 | 55.3% |
| Cellular Data Only | 3,026 | 18.4% |
| Satellite Internet | 1,422 | 8.6% |
| No Internet | 3,306 | 20.1% |
| Total | 16,438 | 100.0% |
Tallapoosa County Summary
Tallapoosa County is located in the east-central part of the state of Alabama, and is part of the Montgomery metropolitan area. The county seat is Dadeville, and the county has a total area of 602 square miles. As of the 2010 census, the population was 41,616.
History
Tallapoosa County was established on December 18, 1832, and was named for the Tallapoosa River, which runs through the county. The county was originally part of the Creek Nation, and was ceded to the United States in the Treaty of Cusseta in 1832. The county was originally part of Macon County, but was split off in 1832.
The county was home to several Native American tribes, including the Creek, Cherokee, Choctaw, and Chickasaw. The county was also home to several early settlers, including the family of William Weatherford, a Creek leader who was known as Red Eagle.
Geography
Tallapoosa County is located in the east-central part of the state of Alabama. The county is bordered by Macon County to the north, Elmore County to the east, Montgomery County to the south, and Chambers County to the west. The county has a total area of 602 square miles, of which 599 square miles is land and 3 square miles is water.
The Tallapoosa River runs through the county, and is the main source of water for the county. The county is also home to several lakes, including Lake Martin, Lake Martin Wildlife Management Area, and Lake Wedowee.
Economy
Tallapoosa County has a diverse economy, with a mix of manufacturing, agriculture, and tourism. The county is home to several large manufacturing companies, including Honda Manufacturing of Alabama, which produces automobiles, and Kia Motors Manufacturing Georgia, which produces automobiles and parts.
Agriculture is also an important part of the county's economy. The county is home to several large farms, and is a major producer of cotton, soybeans, corn, and peanuts.
Tourism is also an important part of the county's economy. The county is home to several popular tourist attractions, including Lake Martin, Lake Martin Wildlife Management Area, and the Tallapoosa River.
Demographics
As of the 2010 census, the population of Tallapoosa County was 41,616. The population was spread out, with 24.3% under the age of 18, 8.2% from 18 to 24, 28.2% from 25 to 44, 24.3% from 45 to 64, and 14.0% who were 65 years of age or older. The median age was 37.4 years.
The racial makeup of the county was 79.2% White, 17.7% Black or African American, 0.4% Native American, 0.3% Asian, 0.1% Pacific Islander, 1.2% from other races, and 1.2% from two or more races. 2.7% of the population were Hispanic or Latino of any race.
The median income for a household in the county was $37,945, and the median income for a family was $45,945. The per capita income for the county was $19,945. About 16.2% of the population were below the poverty line.
Common Questions
What is Per Capita Income in Tallapoosa County?
Per Capita income in Tallapoosa County is $29,682.
What is the Median Family Income in Tallapoosa County?
Median Family Income in Tallapoosa County is $63,358.
What is the Median Household income in Tallapoosa County?
Median Household Income in Tallapoosa County is $53,282.
What is Income or Wage Gap in Tallapoosa County?
Income or Wage Gap in Tallapoosa County is 32.7%.
Women in Tallapoosa County earn 67.3 cents for every dollar earned by a man.
What is Family Income Deficit in Tallapoosa County?
Family Income Deficit in Tallapoosa County is $10,651.
Families that are below poverty line in Tallapoosa County earn $10,651 less on average than the poverty threshold level.
What is Inequality or Gini Index in Tallapoosa County?
Inequality or Gini Index in Tallapoosa County is 0.49.
What is the Total Population of Tallapoosa County?
Total Population of Tallapoosa County is 41,251.
What is the Total Male Population of Tallapoosa County?
Total Male Population of Tallapoosa County is 20,025.
What is the Total Female Population of Tallapoosa County?
Total Female Population of Tallapoosa County is 21,226.
What is the Ratio of Males per 100 Females in Tallapoosa County?
There are 94.34 Males per 100 Females in Tallapoosa County.
What is the Ratio of Females per 100 Males in Tallapoosa County?
There are 106.00 Females per 100 Males in Tallapoosa County.
What is the Median Population Age in Tallapoosa County?
Median Population Age in Tallapoosa County is 45.2 Years.
What is the Average Family Size in Tallapoosa County
Average Family Size in Tallapoosa County is 3.1 People.
What is the Average Household Size in Tallapoosa County
Average Household Size in Tallapoosa County is 2.5 People.
How Large is the Labor Force in Tallapoosa County?
There are 17,431 People in the Labor Forcein in Tallapoosa County.
What is the Percentage of People in the Labor Force in Tallapoosa County?
51.4% of People are in the Labor Force in Tallapoosa County.
What is the Unemployment Rate in Tallapoosa County?
Unemployment Rate in Tallapoosa County is 10.4%.