Athens, AL Map & Demographics
Athens Map
Athens Overview
$35,783
PER CAPITA INCOME
$87,641
AVG FAMILY INCOME
$57,444
AVG HOUSEHOLD INCOME
27.8%
WAGE / INCOME GAP [ % ]
72.2¢/ $1
WAGE / INCOME GAP [ $ ]
$10,791
FAMILY INCOME DEFICIT
0.47
INEQUALITY / GINI INDEX
26,179
TOTAL POPULATION
12,942
MALE POPULATION
13,237
FEMALE POPULATION
97.77
MALES / 100 FEMALES
102.28
FEMALES / 100 MALES
41.3
MEDIAN AGE
3.1
AVG FAMILY SIZE
2.5
AVG HOUSEHOLD SIZE
12,379
LABOR FORCE [ PEOPLE ]
57.5%
PERCENT IN LABOR FORCE
4.3%
UNEMPLOYMENT RATE
Athens Area Codes
Income in Athens
Income Overview in Athens
Per Capita Income in Athens is $35,783, while median incomes of families and households are $87,641 and $57,444 respectively.
| Characteristic | Number | Measure |
| Per Capita Income | 26,179 | $35,783 |
| Median Family Income | 6,800 | $87,641 |
| Mean Family Income | 6,800 | $108,909 |
| Median Household Income | 10,441 | $57,444 |
| Mean Household Income | 10,441 | $86,327 |
| Income Deficit | 6,800 | $10,791 |
| Wage / Income Gap (%) | 26,179 | 27.75% |
| Wage / Income Gap ($) | 26,179 | 72.25¢ per $1 |
| Gini / Inequality Index | 26,179 | 0.47 |
Earnings by Sex in Athens
Average Earnings in Athens are $35,436, $40,045 for men and $28,932 for women, a difference of 27.8%.
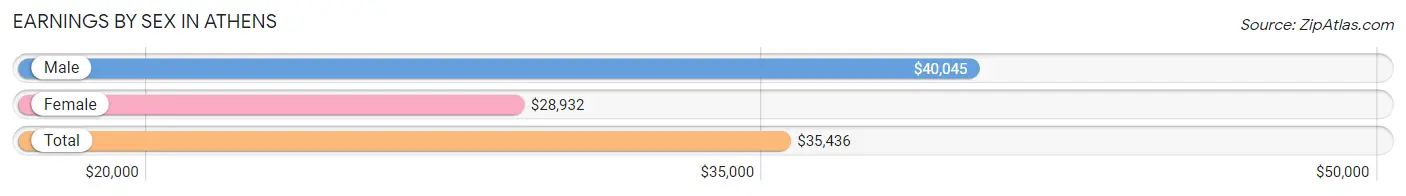
| Sex | Number | Average Earnings |
| Male | 7,530 (56.5%) | $40,045 |
| Female | 5,809 (43.5%) | $28,932 |
| Total | 13,339 (100.0%) | $35,436 |
Earnings by Sex by Income Bracket in Athens
The most common earnings brackets in Athens are $100,000+ for men (1,409 | 18.7%) and $2,499 or less for women (629 | 10.8%).
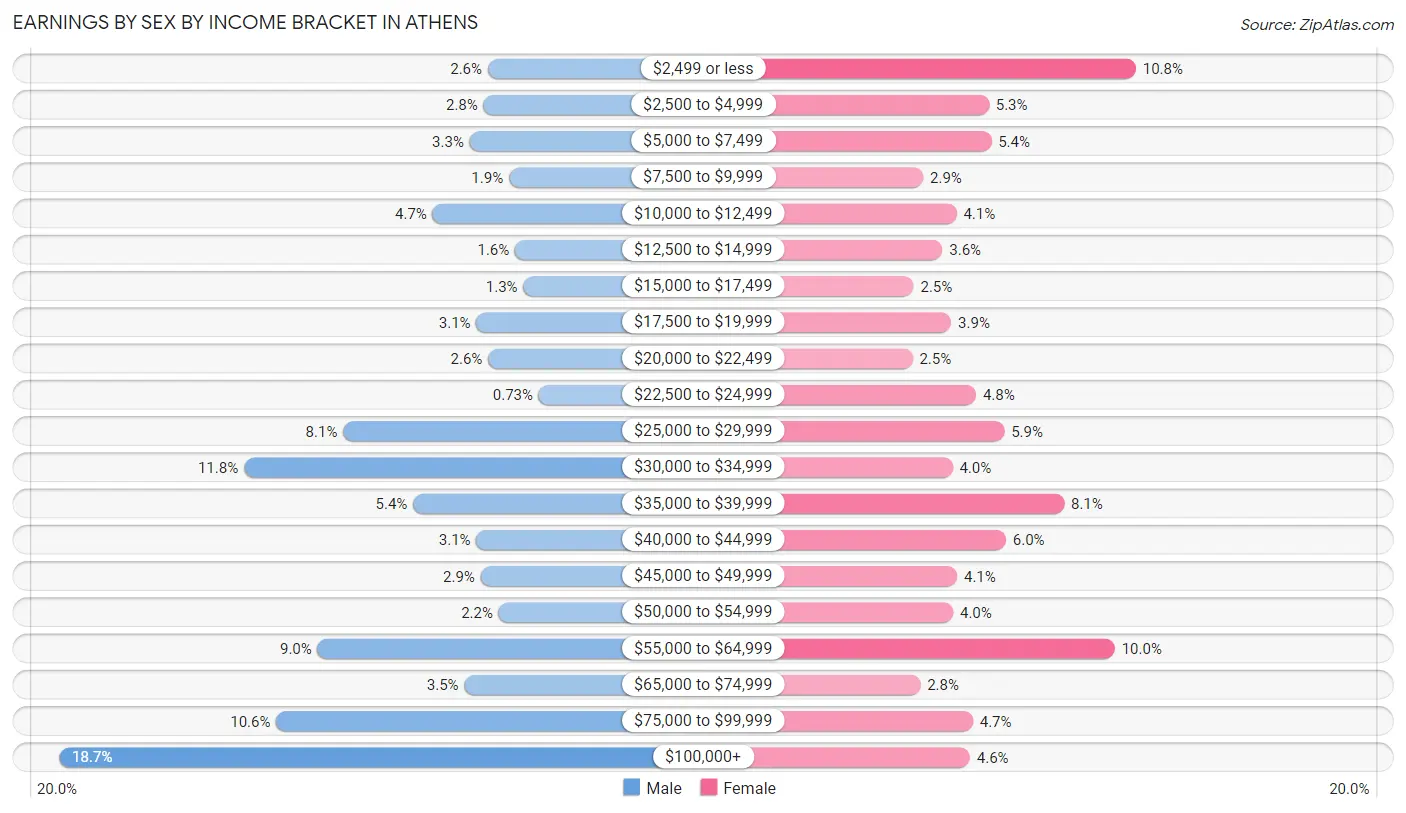
| Income | Male | Female |
| $2,499 or less | 199 (2.6%) | 629 (10.8%) |
| $2,500 to $4,999 | 211 (2.8%) | 309 (5.3%) |
| $5,000 to $7,499 | 250 (3.3%) | 314 (5.4%) |
| $7,500 to $9,999 | 139 (1.8%) | 166 (2.9%) |
| $10,000 to $12,499 | 355 (4.7%) | 239 (4.1%) |
| $12,500 to $14,999 | 122 (1.6%) | 208 (3.6%) |
| $15,000 to $17,499 | 99 (1.3%) | 145 (2.5%) |
| $17,500 to $19,999 | 231 (3.1%) | 227 (3.9%) |
| $20,000 to $22,499 | 198 (2.6%) | 143 (2.5%) |
| $22,500 to $24,999 | 55 (0.7%) | 281 (4.8%) |
| $25,000 to $29,999 | 607 (8.1%) | 343 (5.9%) |
| $30,000 to $34,999 | 887 (11.8%) | 230 (4.0%) |
| $35,000 to $39,999 | 410 (5.4%) | 473 (8.1%) |
| $40,000 to $44,999 | 231 (3.1%) | 346 (6.0%) |
| $45,000 to $49,999 | 219 (2.9%) | 240 (4.1%) |
| $50,000 to $54,999 | 168 (2.2%) | 231 (4.0%) |
| $55,000 to $64,999 | 679 (9.0%) | 583 (10.0%) |
| $65,000 to $74,999 | 265 (3.5%) | 160 (2.8%) |
| $75,000 to $99,999 | 796 (10.6%) | 274 (4.7%) |
| $100,000+ | 1,409 (18.7%) | 268 (4.6%) |
| Total | 7,530 (100.0%) | 5,809 (100.0%) |
Earnings by Sex by Educational Attainment in Athens
Average earnings in Athens are $54,477 for men and $33,153 for women, a difference of 39.1%. Men with an educational attainment of graduate degree enjoy the highest average annual earnings of $135,268, while those with less than high school education earn the least with $33,480. Women with an educational attainment of graduate degree earn the most with the average annual earnings of $62,887, while those with high school diploma education have the smallest earnings of $18,469.
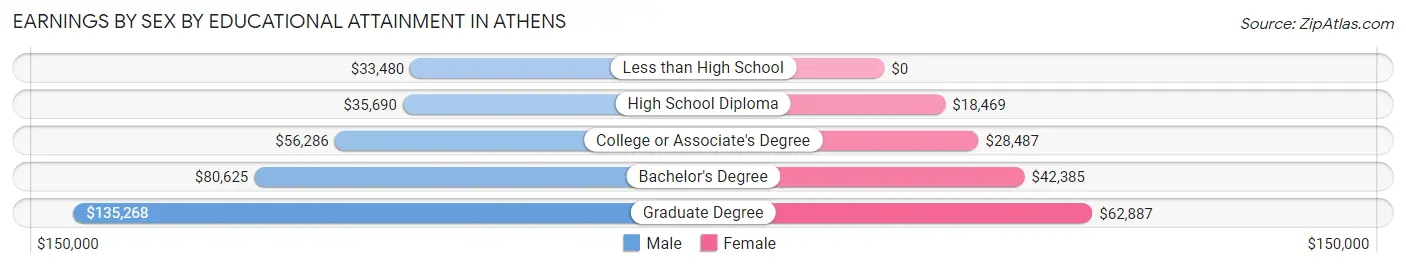
| Educational Attainment | Male Income | Female Income |
| Less than High School | $33,480 | $0 |
| High School Diploma | $35,690 | $18,469 |
| College or Associate's Degree | $56,286 | $28,487 |
| Bachelor's Degree | $80,625 | $42,385 |
| Graduate Degree | $135,268 | $62,887 |
| Total | $54,477 | $33,153 |
Family Income in Athens
Family Income Brackets in Athens
According to the Athens family income data, there are 1,156 families falling into the $100,000 to $149,999 income range, which is the most common income bracket and makes up 17.0% of all families. Conversely, the less than $10,000 income bracket is the least frequent group with only 143 families (2.1%) belonging to this category.
| Income Bracket | # Families | % Families |
| Less than $10,000 | 143 | 2.1% |
| $10,000 to $14,999 | 177 | 2.6% |
| $15,000 to $24,999 | 408 | 6.0% |
| $25,000 to $34,999 | 428 | 6.3% |
| $35,000 to $49,999 | 925 | 13.6% |
| $50,000 to $74,999 | 884 | 13.0% |
| $75,000 to $99,999 | 1,074 | 15.8% |
| $100,000 to $149,999 | 1,156 | 17.0% |
| $150,000 to $199,999 | 836 | 12.3% |
| $200,000+ | 762 | 11.2% |
Family Income by Famaliy Size in Athens
6-person families (118 | 1.7%) account for the highest median family income in Athens with $190,517 per family, while 3-person families (1,297 | 19.1%) have the highest median income of $37,731 per family member.
| Income Bracket | # Families | Median Income |
| 2-Person Families | 3,561 (52.4%) | $73,750 |
| 3-Person Families | 1,297 (19.1%) | $113,194 |
| 4-Person Families | 1,260 (18.5%) | $88,550 |
| 5-Person Families | 546 (8.0%) | $100,115 |
| 6-Person Families | 118 (1.7%) | $190,517 |
| 7+ Person Families | 18 (0.3%) | $0 |
| Total | 6,800 (100.0%) | $87,641 |
Family Income by Number of Earners in Athens
The median family income in Athens is $87,641, with families comprising 3+ earners (640) having the highest median family income of $151,755, while families with no earners (1,193) have the lowest median family income of $46,639, accounting for 9.4% and 17.5% of families, respectively.
| Number of Earners | # Families | Median Income |
| No Earners | 1,193 (17.5%) | $46,639 |
| 1 Earner | 2,329 (34.3%) | $53,673 |
| 2 Earners | 2,638 (38.8%) | $102,857 |
| 3+ Earners | 640 (9.4%) | $151,755 |
| Total | 6,800 (100.0%) | $87,641 |
Household Income in Athens
Household Income Brackets in Athens
With 1,597 households falling in the category, the $50,000 to $74,999 income range is the most frequent in Athens, accounting for 15.3% of all households. In contrast, only 428 households (4.1%) fall into the less than $10,000 income bracket, making it the least populous group.
| Income Bracket | # Households | % Households |
| Less than $10,000 | 428 | 4.1% |
| $10,000 to $14,999 | 543 | 5.2% |
| $15,000 to $24,999 | 1,086 | 10.4% |
| $25,000 to $34,999 | 1,034 | 9.9% |
| $35,000 to $49,999 | 1,347 | 12.9% |
| $50,000 to $74,999 | 1,597 | 15.3% |
| $75,000 to $99,999 | 1,410 | 13.5% |
| $100,000 to $149,999 | 1,326 | 12.7% |
| $150,000 to $199,999 | 867 | 8.3% |
| $200,000+ | 814 | 7.8% |
Household Income by Householder Age in Athens
The median household income in Athens is $57,444, with the highest median household income of $78,864 found in the 45 to 64 years age bracket for the primary householder. A total of 3,608 households (34.6%) fall into this category. Meanwhile, the 15 to 24 years age bracket for the primary householder has the lowest median household income of $34,342, with 377 households (3.6%) in this group.
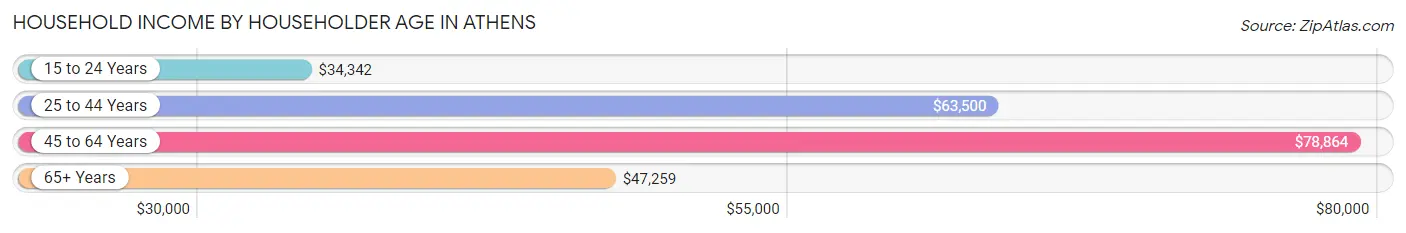
| Income Bracket | # Households | Median Income |
| 15 to 24 Years | 377 (3.6%) | $34,342 |
| 25 to 44 Years | 3,262 (31.2%) | $63,500 |
| 45 to 64 Years | 3,608 (34.6%) | $78,864 |
| 65+ Years | 3,194 (30.6%) | $47,259 |
| Total | 10,441 (100.0%) | $57,444 |
Poverty in Athens
Income Below Poverty by Sex and Age in Athens
With 11.1% poverty level for males and 15.7% for females among the residents of Athens, under 5 year old males and 15 year old females are the most vulnerable to poverty, with 348 males (39.2%) and 55 females (32.5%) in their respective age groups living below the poverty level.
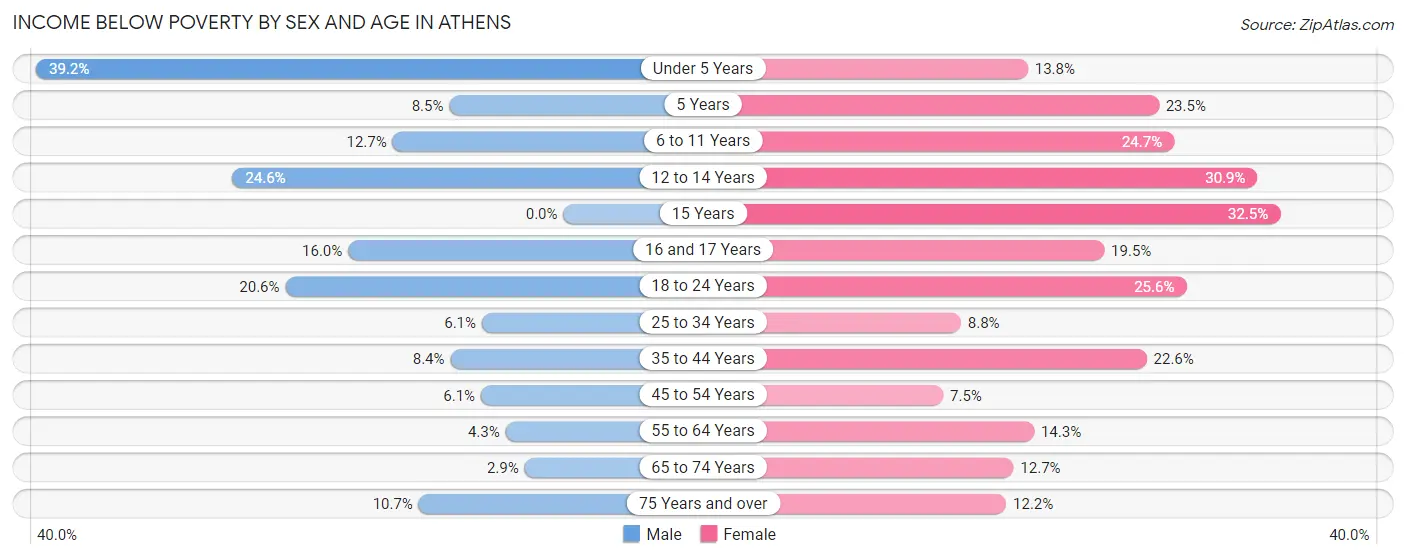
| Age Bracket | Male | Female |
| Under 5 Years | 348 (39.2%) | 92 (13.8%) |
| 5 Years | 15 (8.5%) | 16 (23.5%) |
| 6 to 11 Years | 123 (12.7%) | 202 (24.7%) |
| 12 to 14 Years | 85 (24.6%) | 120 (30.8%) |
| 15 Years | 0 (0.0%) | 55 (32.5%) |
| 16 and 17 Years | 27 (16.0%) | 82 (19.5%) |
| 18 to 24 Years | 269 (20.6%) | 226 (25.6%) |
| 25 to 34 Years | 102 (6.0%) | 162 (8.8%) |
| 35 to 44 Years | 122 (8.4%) | 370 (22.6%) |
| 45 to 54 Years | 94 (6.1%) | 115 (7.5%) |
| 55 to 64 Years | 91 (4.3%) | 253 (14.3%) |
| 65 to 74 Years | 26 (2.9%) | 221 (12.7%) |
| 75 Years and over | 87 (10.7%) | 142 (12.2%) |
| Total | 1,389 (11.1%) | 2,056 (15.7%) |
Income Above Poverty by Sex and Age in Athens
According to the poverty statistics in Athens, males aged 15 years and females aged 45 to 54 years are the age groups that are most secure financially, with 100.0% of males and 92.5% of females in these age groups living above the poverty line.
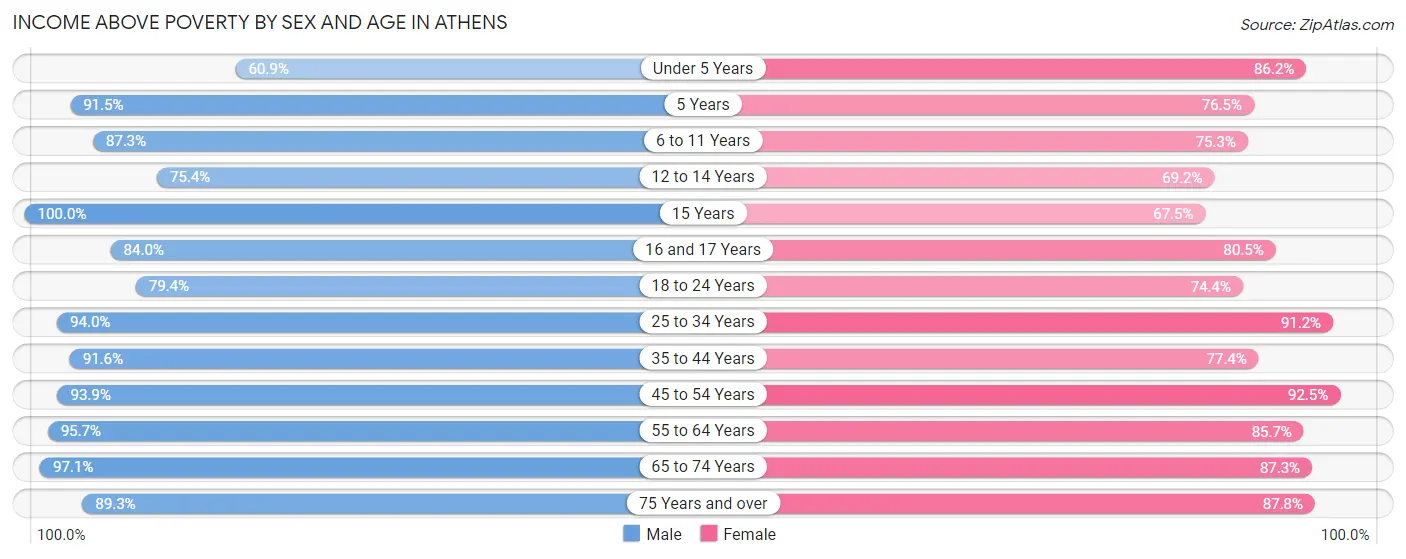
| Age Bracket | Male | Female |
| Under 5 Years | 541 (60.9%) | 574 (86.2%) |
| 5 Years | 162 (91.5%) | 52 (76.5%) |
| 6 to 11 Years | 847 (87.3%) | 617 (75.3%) |
| 12 to 14 Years | 261 (75.4%) | 269 (69.2%) |
| 15 Years | 157 (100.0%) | 114 (67.5%) |
| 16 and 17 Years | 142 (84.0%) | 339 (80.5%) |
| 18 to 24 Years | 1,034 (79.4%) | 658 (74.4%) |
| 25 to 34 Years | 1,584 (94.0%) | 1,671 (91.2%) |
| 35 to 44 Years | 1,332 (91.6%) | 1,265 (77.4%) |
| 45 to 54 Years | 1,441 (93.9%) | 1,414 (92.5%) |
| 55 to 64 Years | 2,032 (95.7%) | 1,520 (85.7%) |
| 65 to 74 Years | 876 (97.1%) | 1,514 (87.3%) |
| 75 Years and over | 723 (89.3%) | 1,022 (87.8%) |
| Total | 11,132 (88.9%) | 11,029 (84.3%) |
Income Below Poverty Among Married-Couple Families in Athens
The poverty statistics for married-couple families in Athens show that 4.6% or 238 of the total 5,119 families live below the poverty line. Families with 3 or 4 children have the highest poverty rate of 13.1%, comprising of 58 families. On the other hand, families with no children have the lowest poverty rate of 2.8%, which includes 89 families.
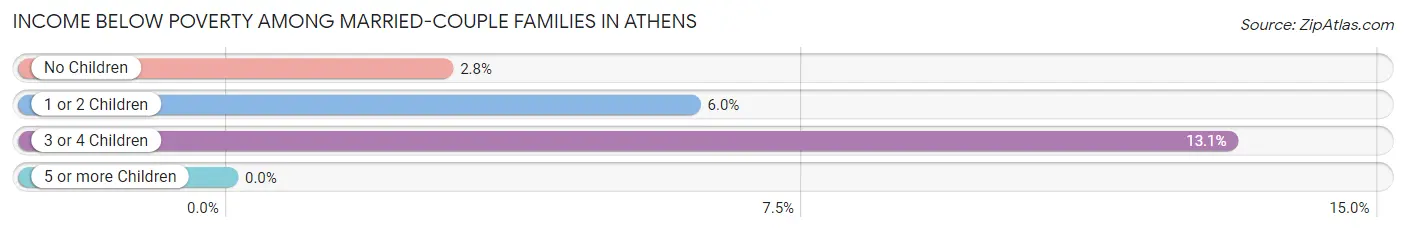
| Children | Above Poverty | Below Poverty |
| No Children | 3,080 (97.2%) | 89 (2.8%) |
| 1 or 2 Children | 1,415 (94.0%) | 91 (6.0%) |
| 3 or 4 Children | 386 (86.9%) | 58 (13.1%) |
| 5 or more Children | 0 (0.0%) | 0 (0.0%) |
| Total | 4,881 (95.4%) | 238 (4.6%) |
Income Below Poverty Among Single-Parent Households in Athens
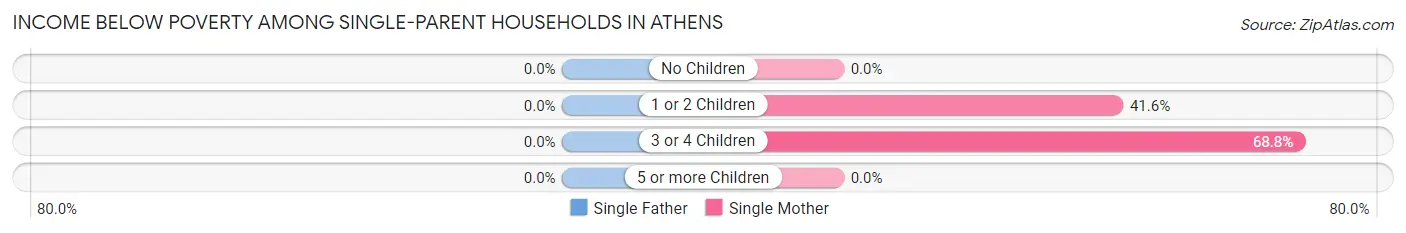
| Children | Single Father | Single Mother |
| No Children | 0 (0.0%) | 0 (0.0%) |
| 1 or 2 Children | 0 (0.0%) | 308 (41.6%) |
| 3 or 4 Children | 0 (0.0%) | 55 (68.8%) |
| 5 or more Children | 0 (0.0%) | 0 (0.0%) |
| Total | 0 (0.0%) | 363 (25.9%) |
Income Below Poverty Among Married-Couple vs Single-Parent Households in Athens
The poverty data for Athens shows that 238 of the married-couple family households (4.6%) and 363 of the single-parent households (21.6%) are living below the poverty level. Within the married-couple family households, those with 3 or 4 children have the highest poverty rate, with 58 households (13.1%) falling below the poverty line. Among the single-parent households, those with 3 or 4 children have the highest poverty rate, with 55 household (47.8%) living below poverty.
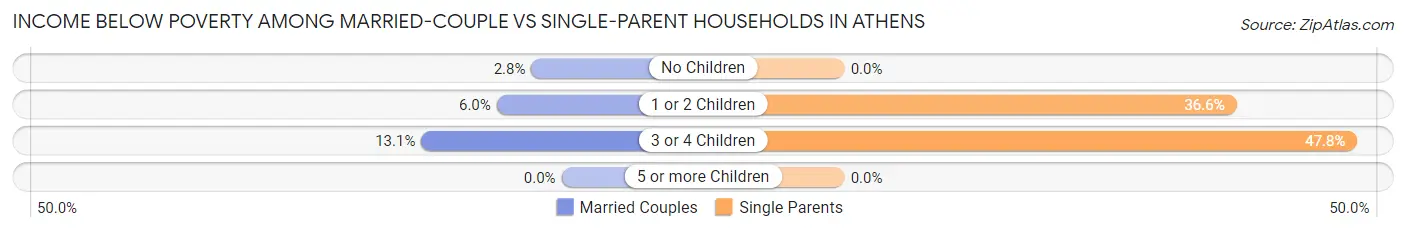
| Children | Married-Couple Families | Single-Parent Households |
| No Children | 89 (2.8%) | 0 (0.0%) |
| 1 or 2 Children | 91 (6.0%) | 308 (36.6%) |
| 3 or 4 Children | 58 (13.1%) | 55 (47.8%) |
| 5 or more Children | 0 (0.0%) | 0 (0.0%) |
| Total | 238 (4.6%) | 363 (21.6%) |
Race in Athens
The most populous races in Athens are White / Caucasian (18,530 | 70.8%), Black / African American (4,692 | 17.9%), and Hispanic or Latino (2,490 | 9.5%).
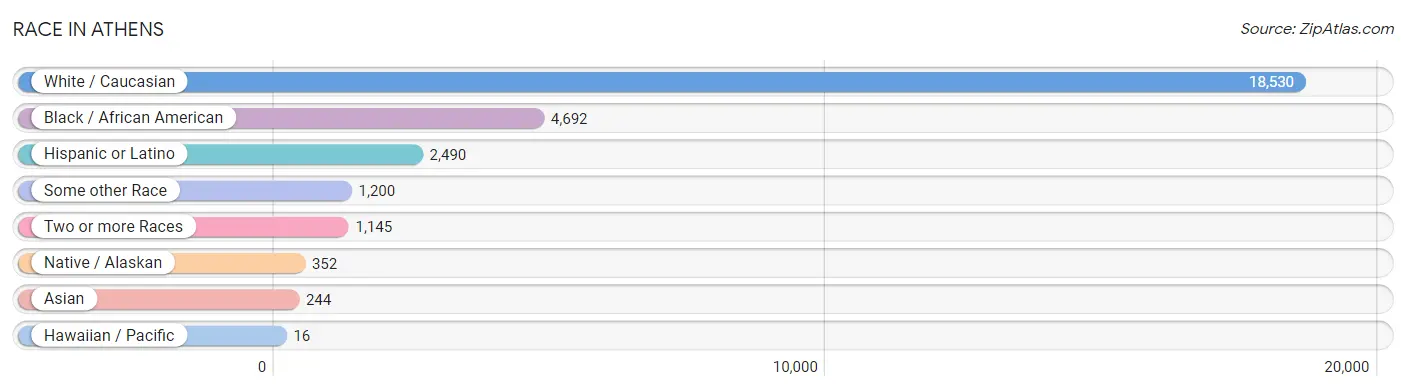
| Race | # Population | % Population |
| Asian | 244 | 0.9% |
| Black / African American | 4,692 | 17.9% |
| Hawaiian / Pacific | 16 | 0.1% |
| Hispanic or Latino | 2,490 | 9.5% |
| Native / Alaskan | 352 | 1.3% |
| White / Caucasian | 18,530 | 70.8% |
| Two or more Races | 1,145 | 4.4% |
| Some other Race | 1,200 | 4.6% |
| Total | 26,179 | 100.0% |
Ancestry in Athens
The most populous ancestries reported in Athens are English (3,778 | 14.4%), American (3,549 | 13.6%), Irish (2,629 | 10.0%), German (1,831 | 7.0%), and Mexican (1,671 | 6.4%), together accounting for 51.4% of all Athens residents.
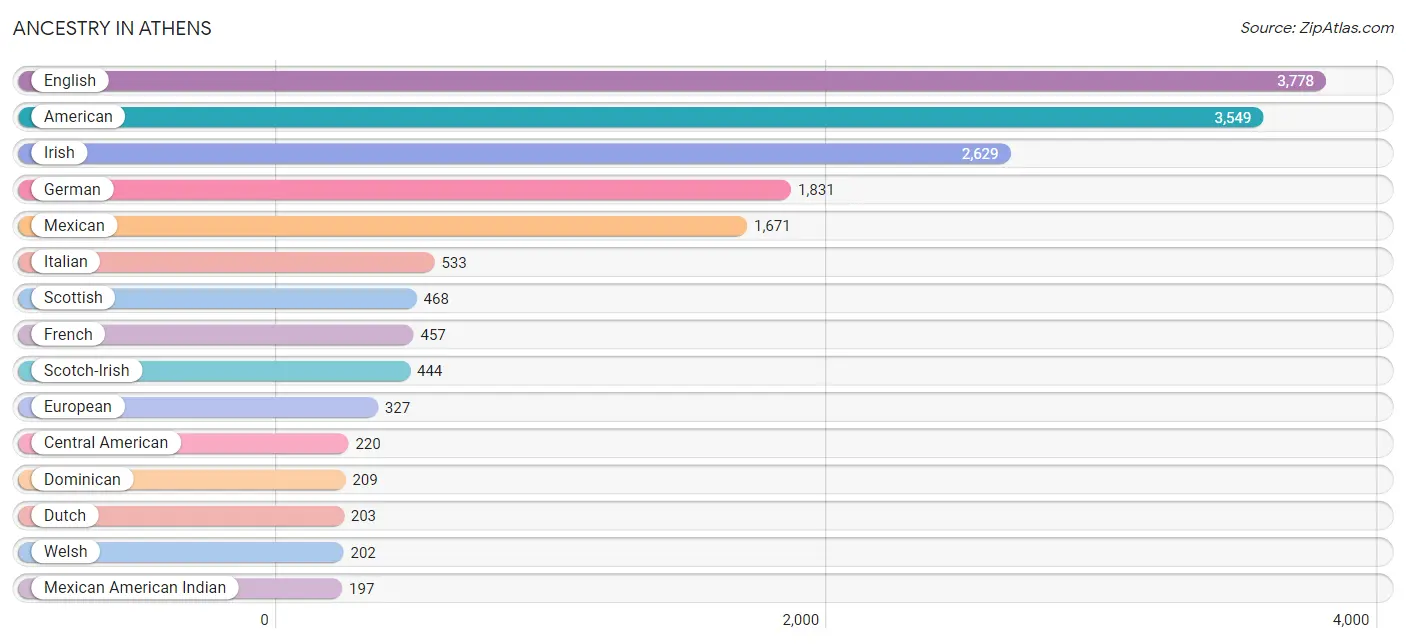
| Ancestry | # Population | % Population |
| African | 28 | 0.1% |
| American | 3,549 | 13.6% |
| Bhutanese | 10 | 0.0% |
| Brazilian | 38 | 0.2% |
| British | 90 | 0.3% |
| Bulgarian | 23 | 0.1% |
| Burmese | 5 | 0.0% |
| Canadian | 30 | 0.1% |
| Central American | 220 | 0.8% |
| Cherokee | 161 | 0.6% |
| Choctaw | 39 | 0.2% |
| Creek | 43 | 0.2% |
| Cuban | 65 | 0.3% |
| Czech | 24 | 0.1% |
| Danish | 62 | 0.2% |
| Dominican | 209 | 0.8% |
| Dutch | 203 | 0.8% |
| Eastern European | 43 | 0.2% |
| English | 3,778 | 14.4% |
| European | 327 | 1.3% |
| French | 457 | 1.8% |
| French Canadian | 68 | 0.3% |
| German | 1,831 | 7.0% |
| Greek | 7 | 0.0% |
| Guatemalan | 160 | 0.6% |
| Haitian | 20 | 0.1% |
| Indian (Asian) | 61 | 0.2% |
| Irish | 2,629 | 10.0% |
| Italian | 533 | 2.0% |
| Japanese | 20 | 0.1% |
| Korean | 16 | 0.1% |
| Latvian | 4 | 0.0% |
| Lithuanian | 24 | 0.1% |
| Mexican | 1,671 | 6.4% |
| Mexican American Indian | 197 | 0.7% |
| Native Hawaiian | 16 | 0.1% |
| Northern European | 46 | 0.2% |
| Norwegian | 159 | 0.6% |
| Ottawa | 21 | 0.1% |
| Panamanian | 47 | 0.2% |
| Polish | 193 | 0.7% |
| Puerto Rican | 67 | 0.3% |
| Russian | 72 | 0.3% |
| Salvadoran | 13 | 0.1% |
| Samoan | 68 | 0.3% |
| Scandinavian | 24 | 0.1% |
| Scotch-Irish | 444 | 1.7% |
| Scottish | 468 | 1.8% |
| Serbian | 11 | 0.0% |
| Sioux | 61 | 0.2% |
| Slovak | 16 | 0.1% |
| Spaniard | 34 | 0.1% |
| Spanish | 18 | 0.1% |
| Sri Lankan | 163 | 0.6% |
| Subsaharan African | 28 | 0.1% |
| Swedish | 24 | 0.1% |
| Ukrainian | 20 | 0.1% |
| Welsh | 202 | 0.8% | View All 58 Rows |
Immigrants in Athens
The most numerous immigrant groups reported in Athens came from Latin America (888 | 3.4%), Central America (730 | 2.8%), Mexico (381 | 1.5%), Guatemala (302 | 1.1%), and Asia (147 | 0.6%), together accounting for 9.3% of all Athens residents.
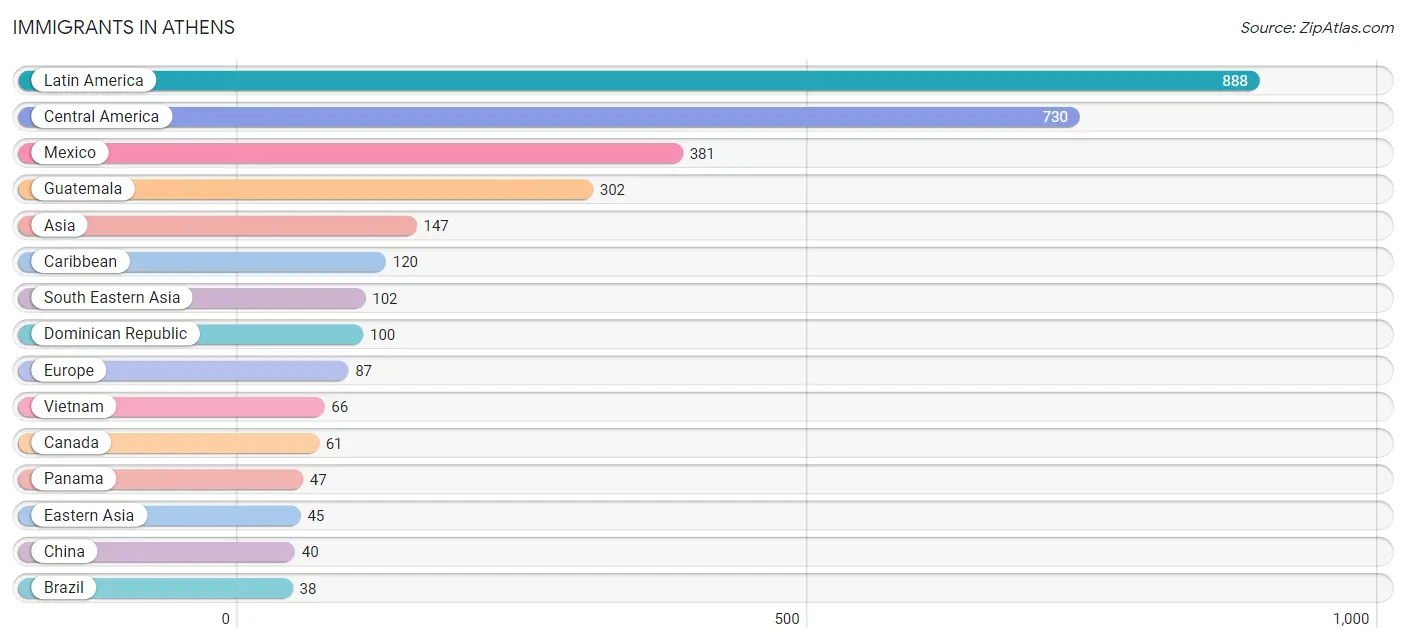
| Immigration Origin | # Population | % Population |
| Asia | 147 | 0.6% |
| Brazil | 38 | 0.2% |
| Bulgaria | 23 | 0.1% |
| Cambodia | 20 | 0.1% |
| Canada | 61 | 0.2% |
| Caribbean | 120 | 0.5% |
| Central America | 730 | 2.8% |
| China | 40 | 0.2% |
| Cuba | 20 | 0.1% |
| Dominican Republic | 100 | 0.4% |
| Eastern Asia | 45 | 0.2% |
| Eastern Europe | 31 | 0.1% |
| England | 10 | 0.0% |
| Europe | 87 | 0.3% |
| Germany | 38 | 0.2% |
| Guatemala | 302 | 1.1% |
| Korea | 5 | 0.0% |
| Latin America | 888 | 3.4% |
| Mexico | 381 | 1.5% |
| Northern Europe | 18 | 0.1% |
| Panama | 47 | 0.2% |
| Philippines | 16 | 0.1% |
| Poland | 8 | 0.0% |
| South America | 38 | 0.2% |
| South Eastern Asia | 102 | 0.4% |
| Vietnam | 66 | 0.3% |
| Western Europe | 38 | 0.2% | View All 27 Rows |
Sex and Age in Athens
Sex and Age in Athens
The most populous age groups in Athens are 55 to 59 Years (1,280 | 9.9%) for men and 30 to 34 Years (1,101 | 8.3%) for women.
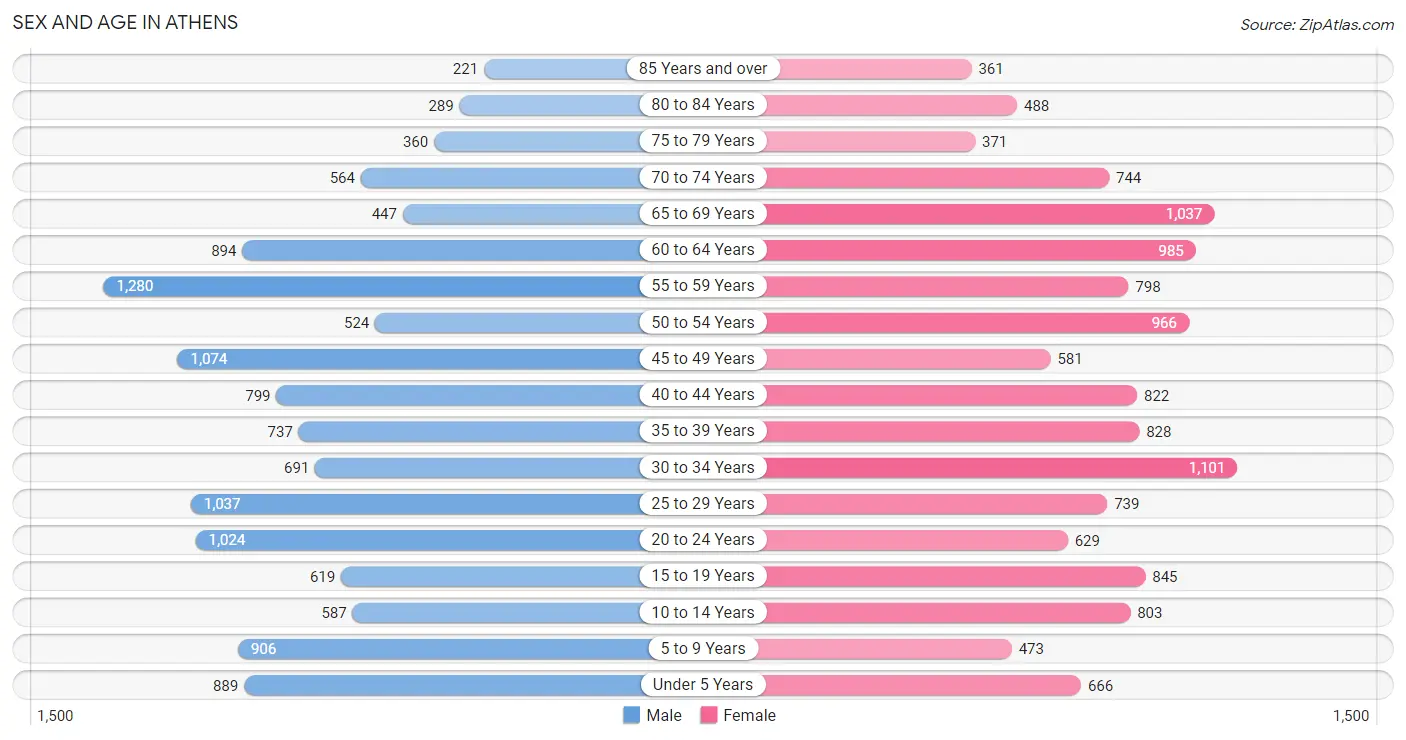
| Age Bracket | Male | Female |
| Under 5 Years | 889 (6.9%) | 666 (5.0%) |
| 5 to 9 Years | 906 (7.0%) | 473 (3.6%) |
| 10 to 14 Years | 587 (4.5%) | 803 (6.1%) |
| 15 to 19 Years | 619 (4.8%) | 845 (6.4%) |
| 20 to 24 Years | 1,024 (7.9%) | 629 (4.8%) |
| 25 to 29 Years | 1,037 (8.0%) | 739 (5.6%) |
| 30 to 34 Years | 691 (5.3%) | 1,101 (8.3%) |
| 35 to 39 Years | 737 (5.7%) | 828 (6.3%) |
| 40 to 44 Years | 799 (6.2%) | 822 (6.2%) |
| 45 to 49 Years | 1,074 (8.3%) | 581 (4.4%) |
| 50 to 54 Years | 524 (4.1%) | 966 (7.3%) |
| 55 to 59 Years | 1,280 (9.9%) | 798 (6.0%) |
| 60 to 64 Years | 894 (6.9%) | 985 (7.4%) |
| 65 to 69 Years | 447 (3.5%) | 1,037 (7.8%) |
| 70 to 74 Years | 564 (4.4%) | 744 (5.6%) |
| 75 to 79 Years | 360 (2.8%) | 371 (2.8%) |
| 80 to 84 Years | 289 (2.2%) | 488 (3.7%) |
| 85 Years and over | 221 (1.7%) | 361 (2.7%) |
| Total | 12,942 (100.0%) | 13,237 (100.0%) |
Families and Households in Athens
Median Family Size in Athens
The median family size in Athens is 3.07 persons per family, with single male/father families (278 | 4.1%) accounting for the largest median family size of 3.27 persons per family. On the other hand, single female/mother families (1,403 | 20.6%) represent the smallest median family size with 2.88 persons per family.
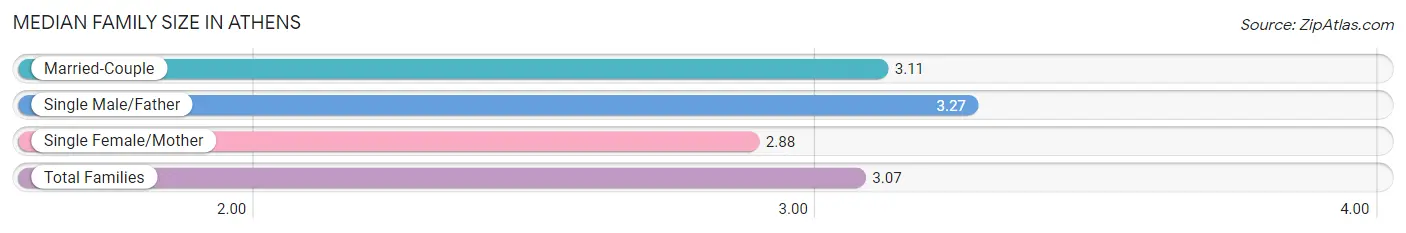
| Family Type | # Families | Family Size |
| Married-Couple | 5,119 (75.3%) | 3.11 |
| Single Male/Father | 278 (4.1%) | 3.27 |
| Single Female/Mother | 1,403 (20.6%) | 2.88 |
| Total Families | 6,800 (100.0%) | 3.07 |
Median Household Size in Athens
The median household size in Athens is 2.45 persons per household, with single male/father households (278 | 2.7%) accounting for the largest median household size of 3.27 persons per household. non-family households (3,641 | 34.9%) represent the smallest median household size with 1.23 persons per household.
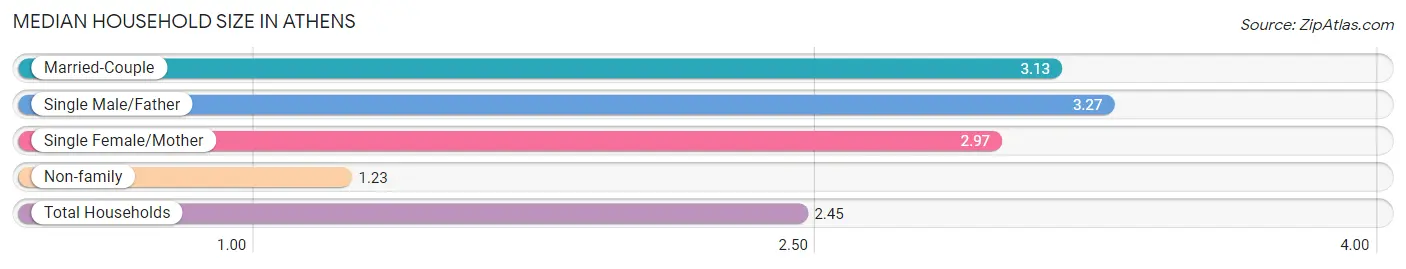
| Household Type | # Households | Household Size |
| Married-Couple | 5,119 (49.0%) | 3.13 |
| Single Male/Father | 278 (2.7%) | 3.27 |
| Single Female/Mother | 1,403 (13.4%) | 2.97 |
| Non-family | 3,641 (34.9%) | 1.23 |
| Total Households | 10,441 (100.0%) | 2.45 |
Household Size by Marriage Status in Athens
Out of a total of 10,441 households in Athens, 6,800 (65.1%) are family households, while 3,641 (34.9%) are nonfamily households. The most numerous type of family households are 2-person households, comprising 3,515, and the most common type of nonfamily households are 1-person households, comprising 3,085.
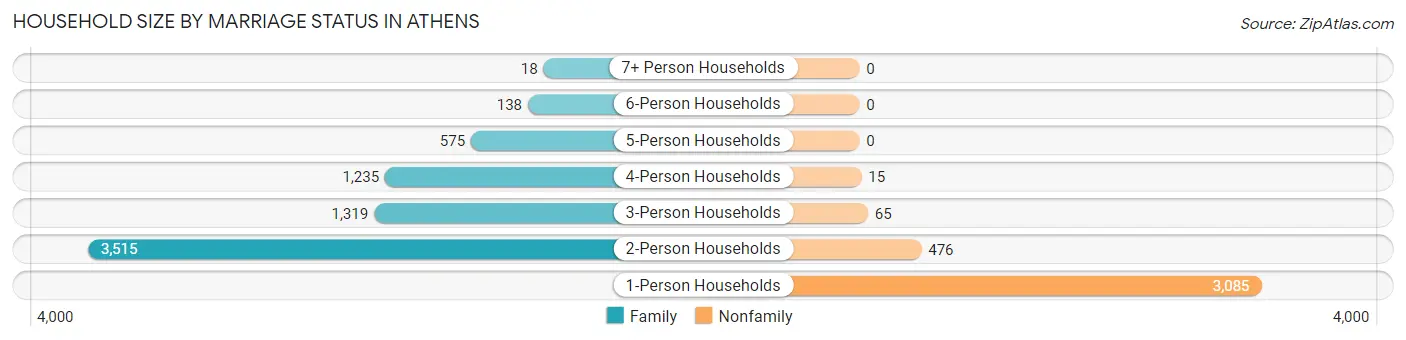
| Household Size | Family Households | Nonfamily Households |
| 1-Person Households | - | 3,085 (29.5%) |
| 2-Person Households | 3,515 (33.7%) | 476 (4.6%) |
| 3-Person Households | 1,319 (12.6%) | 65 (0.6%) |
| 4-Person Households | 1,235 (11.8%) | 15 (0.1%) |
| 5-Person Households | 575 (5.5%) | 0 (0.0%) |
| 6-Person Households | 138 (1.3%) | 0 (0.0%) |
| 7+ Person Households | 18 (0.2%) | 0 (0.0%) |
| Total | 6,800 (65.1%) | 3,641 (34.9%) |
Female Fertility in Athens
Fertility by Age in Athens
Average fertility rate in Athens is 35.0 births per 1,000 women. Women in the age bracket of 20 to 34 years have the highest fertility rate with 58.0 births per 1,000 women. Women in the age bracket of 20 to 34 years acount for 71.9% of all women with births.
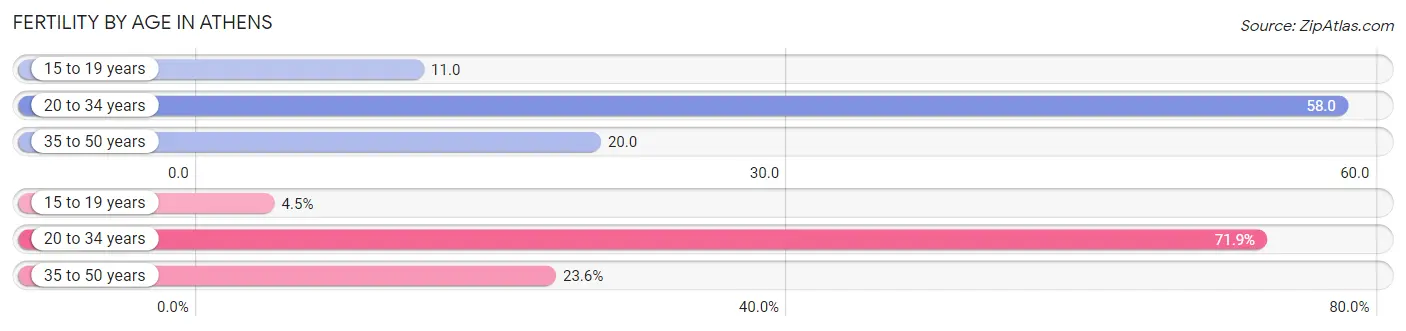
| Age Bracket | Women with Births | Births / 1,000 Women |
| 15 to 19 years | 9 (4.5%) | 11.0 |
| 20 to 34 years | 143 (71.9%) | 58.0 |
| 35 to 50 years | 47 (23.6%) | 20.0 |
| Total | 199 (100.0%) | 35.0 |
Fertility by Age by Marriage Status in Athens
81.4% of women with births (199) in Athens are married. The highest percentage of unmarried women with births falls into 15 to 19 years age bracket with 100.0% of them unmarried at the time of birth, while the lowest percentage of unmarried women with births belong to 35 to 50 years age bracket with 0.0% of them unmarried.
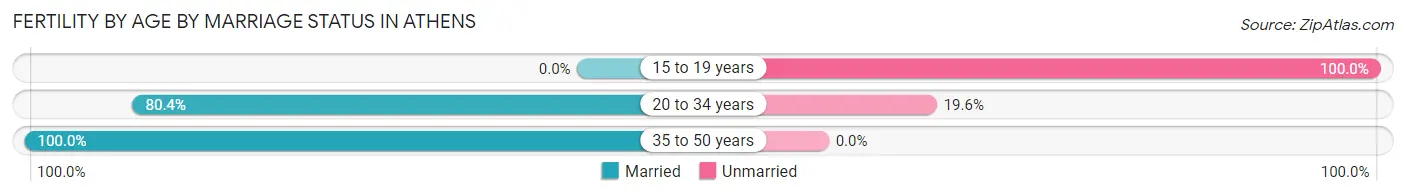
| Age Bracket | Married | Unmarried |
| 15 to 19 years | 0 (0.0%) | 9 (100.0%) |
| 20 to 34 years | 115 (80.4%) | 28 (19.6%) |
| 35 to 50 years | 47 (100.0%) | 0 (0.0%) |
| Total | 162 (81.4%) | 37 (18.6%) |
Fertility by Education in Athens
Average fertility rate in Athens is 35.0 births per 1,000 women. Women with the education attainment of college or associate's degree have the highest fertility rate of 49.0 births per 1,000 women, while women with the education attainment of high school diploma have the lowest fertility at 8.0 births per 1,000 women. Women with the education attainment of college or associate's degree represent 44.2% of all women with births.
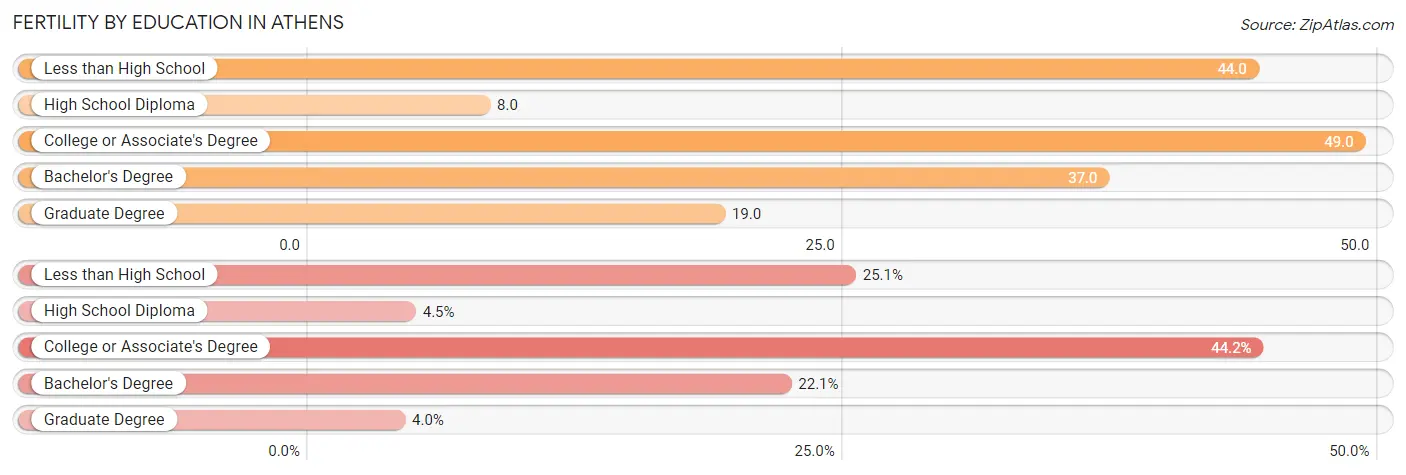
| Educational Attainment | Women with Births | Births / 1,000 Women |
| Less than High School | 50 (25.1%) | 44.0 |
| High School Diploma | 9 (4.5%) | 8.0 |
| College or Associate's Degree | 88 (44.2%) | 49.0 |
| Bachelor's Degree | 44 (22.1%) | 37.0 |
| Graduate Degree | 8 (4.0%) | 19.0 |
| Total | 199 (100.0%) | 35.0 |
Fertility by Education by Marriage Status in Athens
18.6% of women with births in Athens are unmarried. Women with the educational attainment of college or associate's degree are most likely to be married with 100.0% of them married at childbirth, while women with the educational attainment of high school diploma are least likely to be married with 100.0% of them unmarried at childbirth.
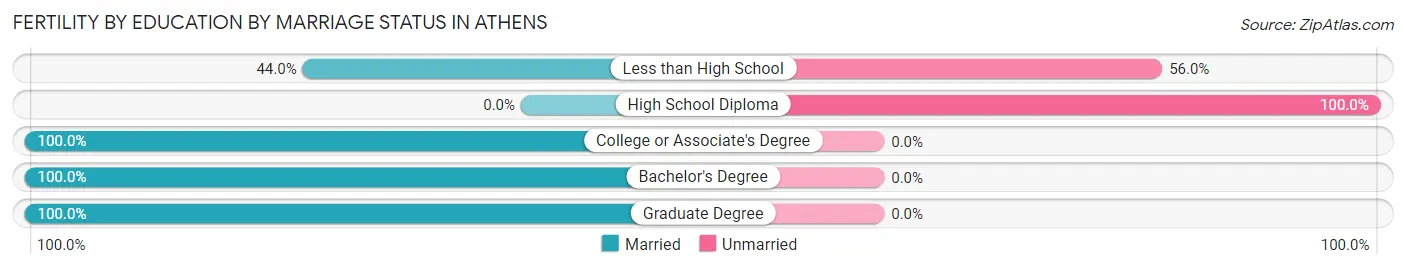
| Educational Attainment | Married | Unmarried |
| Less than High School | 22 (44.0%) | 28 (56.0%) |
| High School Diploma | 0 (0.0%) | 9 (100.0%) |
| College or Associate's Degree | 88 (100.0%) | 0 (0.0%) |
| Bachelor's Degree | 44 (100.0%) | 0 (0.0%) |
| Graduate Degree | 8 (100.0%) | 0 (0.0%) |
| Total | 162 (81.4%) | 37 (18.6%) |
Employment Characteristics in Athens
Employment by Class of Employer in Athens
Among the 11,716 employed individuals in Athens, private company employees (8,410 | 71.8%), not-for-profit organizations (708 | 6.0%), and federal government employees (655 | 5.6%) make up the most common classes of employment.
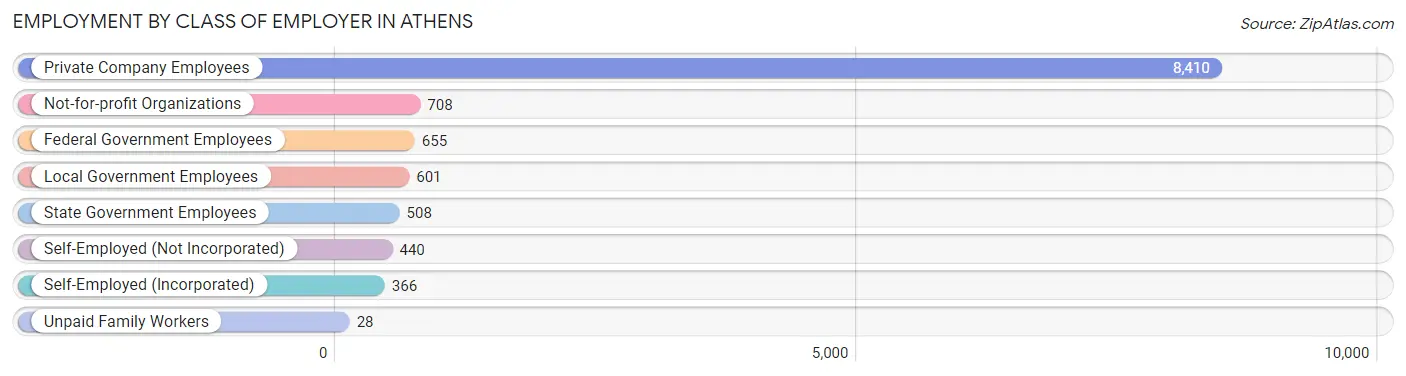
| Employer Class | # Employees | % Employees |
| Private Company Employees | 8,410 | 71.8% |
| Self-Employed (Incorporated) | 366 | 3.1% |
| Self-Employed (Not Incorporated) | 440 | 3.8% |
| Not-for-profit Organizations | 708 | 6.0% |
| Local Government Employees | 601 | 5.1% |
| State Government Employees | 508 | 4.3% |
| Federal Government Employees | 655 | 5.6% |
| Unpaid Family Workers | 28 | 0.2% |
| Total | 11,716 | 100.0% |
Employment Status by Age in Athens
According to the labor force statistics for Athens, out of the total population over 16 years of age (21,529), 57.5% or 12,379 individuals are in the labor force, with 4.3% or 532 of them unemployed. The age group with the highest labor force participation rate is 25 to 29 years, with 91.7% or 1,629 individuals in the labor force. Within the labor force, the 20 to 24 years age range has the highest percentage of unemployed individuals, with 10.4% or 128 of them being unemployed.
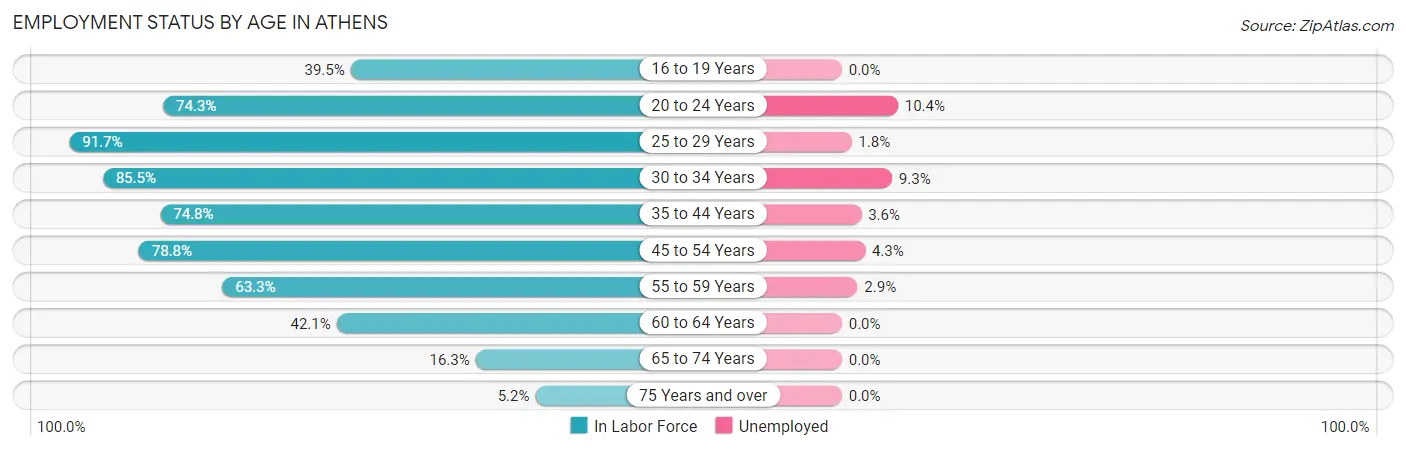
| Age Bracket | In Labor Force | Unemployed |
| 16 to 19 Years | 450 (39.5%) | 0 (0.0%) |
| 20 to 24 Years | 1,228 (74.3%) | 128 (10.4%) |
| 25 to 29 Years | 1,629 (91.7%) | 29 (1.8%) |
| 30 to 34 Years | 1,532 (85.5%) | 142 (9.3%) |
| 35 to 44 Years | 2,383 (74.8%) | 86 (3.6%) |
| 45 to 54 Years | 2,478 (78.8%) | 107 (4.3%) |
| 55 to 59 Years | 1,315 (63.3%) | 38 (2.9%) |
| 60 to 64 Years | 791 (42.1%) | 0 (0.0%) |
| 65 to 74 Years | 455 (16.3%) | 0 (0.0%) |
| 75 Years and over | 109 (5.2%) | 0 (0.0%) |
| Total | 12,379 (57.5%) | 532 (4.3%) |
Employment Status by Educational Attainment in Athens
According to labor force statistics for Athens, 73.1% of individuals (10,129) out of the total population between 25 and 64 years of age (13,856) are in the labor force, with 4.0% or 405 of them being unemployed. The group with the highest labor force participation rate are those with the educational attainment of bachelor's degree or higher, with 82.6% or 3,211 individuals in the labor force. Within the labor force, individuals with less than high school education have the highest percentage of unemployment, with 9.6% or 71 of them being unemployed.
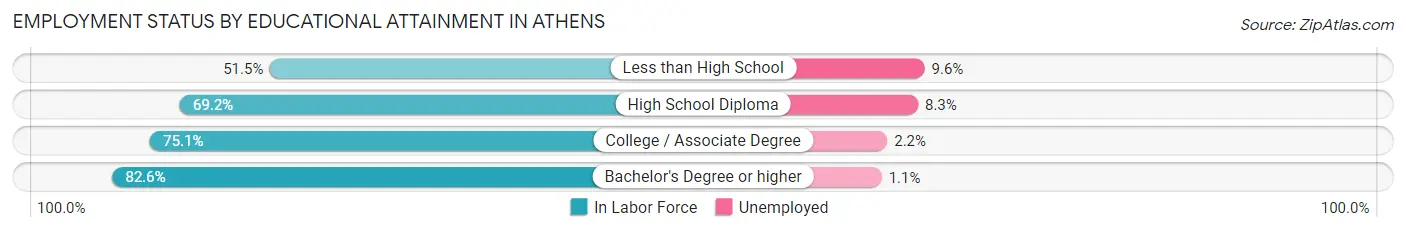
| Educational Attainment | In Labor Force | Unemployed |
| Less than High School | 739 (51.5%) | 138 (9.6%) |
| High School Diploma | 2,632 (69.2%) | 316 (8.3%) |
| College / Associate Degree | 3,552 (75.1%) | 104 (2.2%) |
| Bachelor's Degree or higher | 3,211 (82.6%) | 43 (1.1%) |
| Total | 10,129 (73.1%) | 554 (4.0%) |
Employment Occupations by Sex in Athens
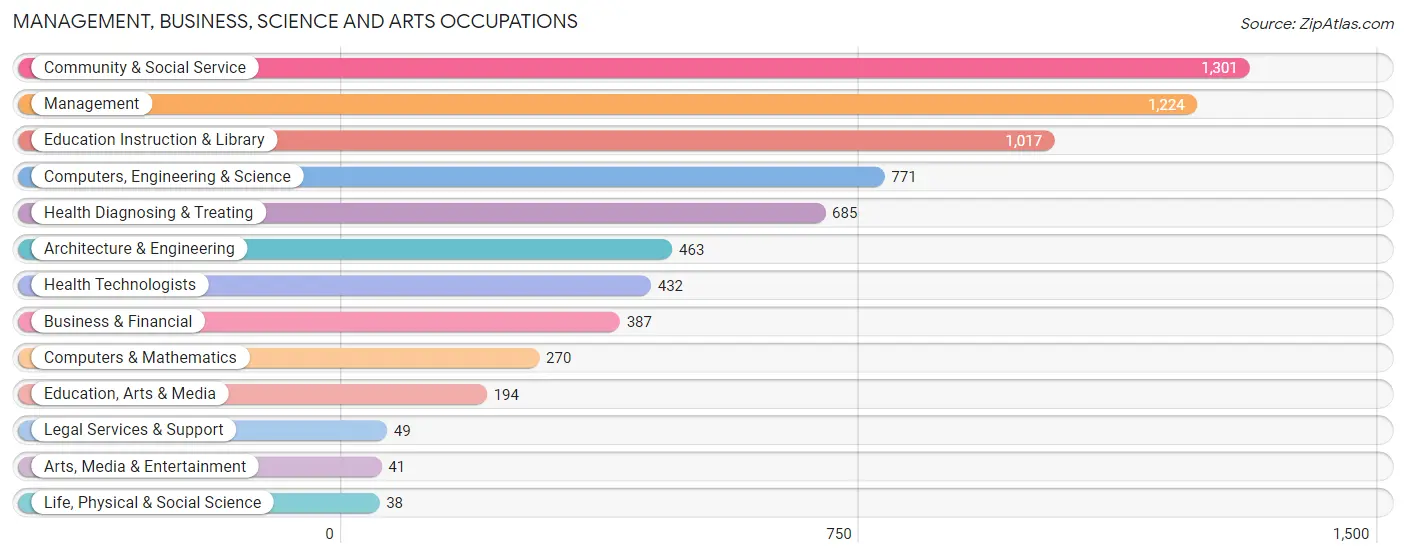
Management, Business, Science and Arts Occupations
The most common Management, Business, Science and Arts occupations in Athens are Community & Social Service (1,301 | 11.0%), Management (1,224 | 10.4%), Education Instruction & Library (1,017 | 8.6%), Computers, Engineering & Science (771 | 6.5%), and Health Diagnosing & Treating (685 | 5.8%).
Management, Business, Science and Arts Occupations by Sex
Within the Management, Business, Science and Arts occupations in Athens, the most male-oriented occupations are Computers & Mathematics (88.1%), Computers, Engineering & Science (83.9%), and Architecture & Engineering (82.3%), while the most female-oriented occupations are Legal Services & Support (91.8%), Education Instruction & Library (80.4%), and Community & Social Service (76.8%).
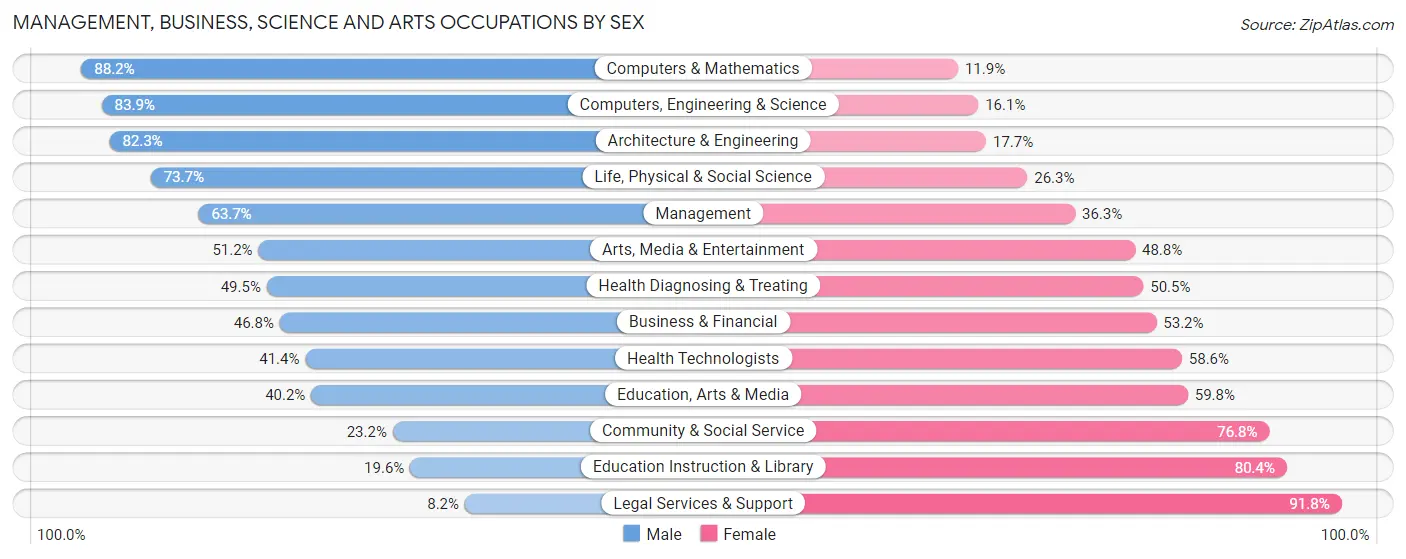
| Occupation | Male | Female |
| Management | 780 (63.7%) | 444 (36.3%) |
| Business & Financial | 181 (46.8%) | 206 (53.2%) |
| Computers, Engineering & Science | 647 (83.9%) | 124 (16.1%) |
| Computers & Mathematics | 238 (88.1%) | 32 (11.8%) |
| Architecture & Engineering | 381 (82.3%) | 82 (17.7%) |
| Life, Physical & Social Science | 28 (73.7%) | 10 (26.3%) |
| Community & Social Service | 302 (23.2%) | 999 (76.8%) |
| Education, Arts & Media | 78 (40.2%) | 116 (59.8%) |
| Legal Services & Support | 4 (8.2%) | 45 (91.8%) |
| Education Instruction & Library | 199 (19.6%) | 818 (80.4%) |
| Arts, Media & Entertainment | 21 (51.2%) | 20 (48.8%) |
| Health Diagnosing & Treating | 339 (49.5%) | 346 (50.5%) |
| Health Technologists | 179 (41.4%) | 253 (58.6%) |
| Total (Category) | 2,249 (51.5%) | 2,119 (48.5%) |
| Total (Overall) | 6,953 (59.0%) | 4,842 (41.0%) |
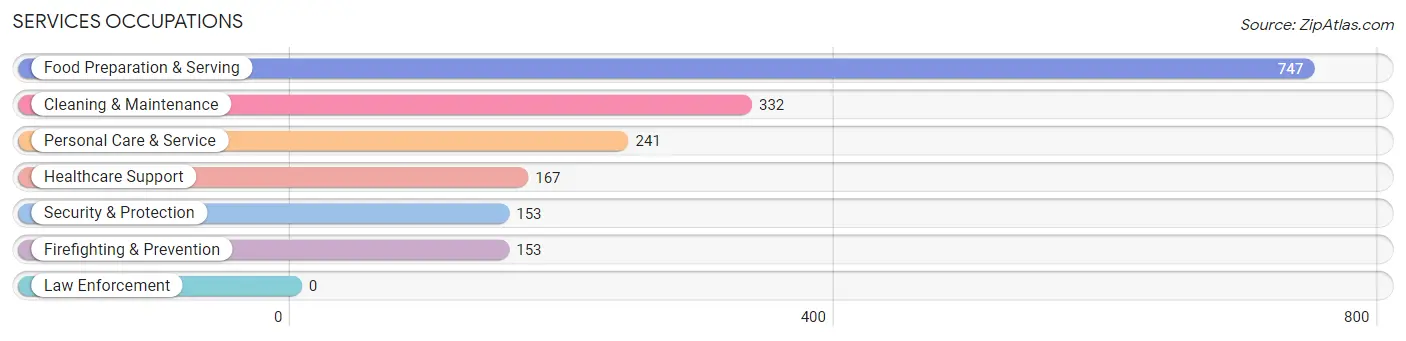
Services Occupations
The most common Services occupations in Athens are Food Preparation & Serving (747 | 6.3%), Cleaning & Maintenance (332 | 2.8%), Personal Care & Service (241 | 2.0%), Healthcare Support (167 | 1.4%), and Security & Protection (153 | 1.3%).
Services Occupations by Sex
Within the Services occupations in Athens, the most male-oriented occupations are Security & Protection (86.9%), Firefighting & Prevention (86.9%), and Food Preparation & Serving (75.1%), while the most female-oriented occupations are Healthcare Support (100.0%), Personal Care & Service (85.5%), and Cleaning & Maintenance (48.8%).
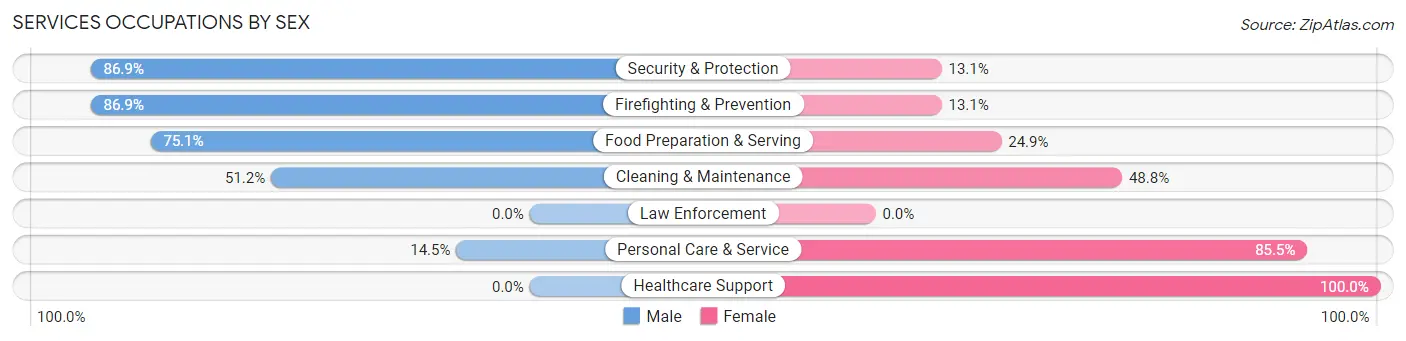
| Occupation | Male | Female |
| Healthcare Support | 0 (0.0%) | 167 (100.0%) |
| Security & Protection | 133 (86.9%) | 20 (13.1%) |
| Firefighting & Prevention | 133 (86.9%) | 20 (13.1%) |
| Law Enforcement | 0 (0.0%) | 0 (0.0%) |
| Food Preparation & Serving | 561 (75.1%) | 186 (24.9%) |
| Cleaning & Maintenance | 170 (51.2%) | 162 (48.8%) |
| Personal Care & Service | 35 (14.5%) | 206 (85.5%) |
| Total (Category) | 899 (54.8%) | 741 (45.2%) |
| Total (Overall) | 6,953 (59.0%) | 4,842 (41.0%) |
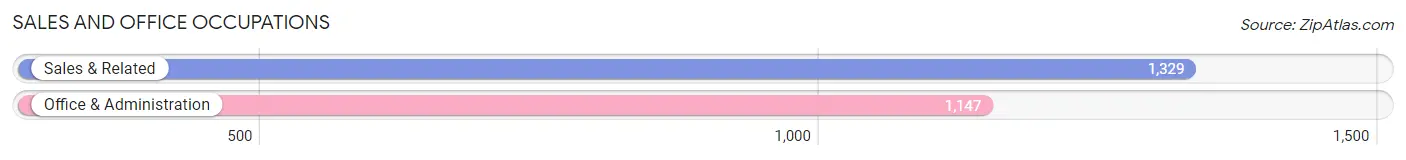
Sales and Office Occupations
The most common Sales and Office occupations in Athens are Sales & Related (1,329 | 11.3%), and Office & Administration (1,147 | 9.7%).
Sales and Office Occupations by Sex
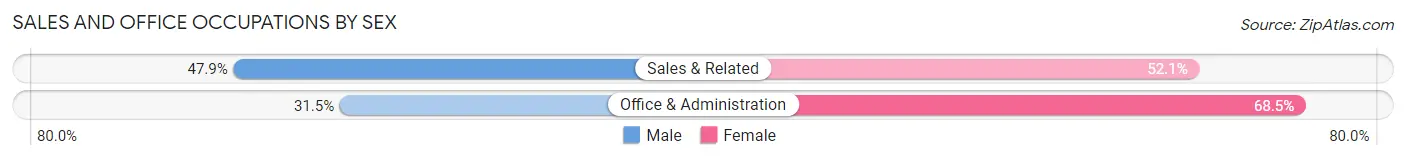
| Occupation | Male | Female |
| Sales & Related | 636 (47.9%) | 693 (52.1%) |
| Office & Administration | 361 (31.5%) | 786 (68.5%) |
| Total (Category) | 997 (40.3%) | 1,479 (59.7%) |
| Total (Overall) | 6,953 (59.0%) | 4,842 (41.0%) |
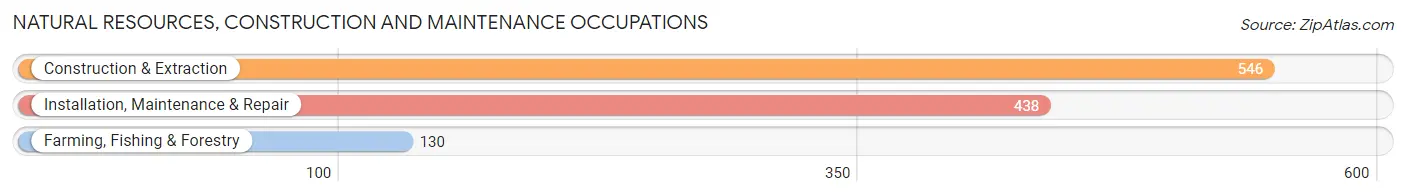
Natural Resources, Construction and Maintenance Occupations
The most common Natural Resources, Construction and Maintenance occupations in Athens are Construction & Extraction (546 | 4.6%), Installation, Maintenance & Repair (438 | 3.7%), and Farming, Fishing & Forestry (130 | 1.1%).
Natural Resources, Construction and Maintenance Occupations by Sex
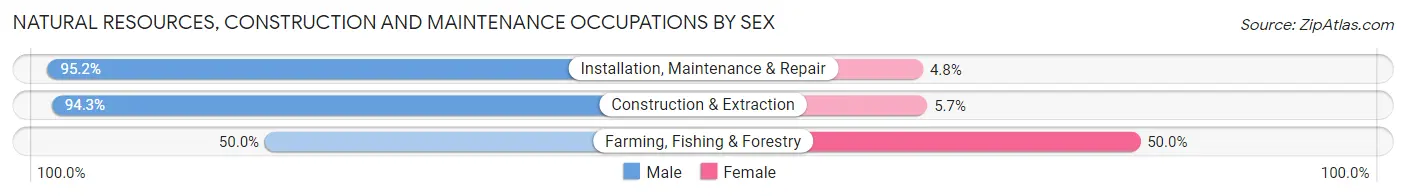
| Occupation | Male | Female |
| Farming, Fishing & Forestry | 65 (50.0%) | 65 (50.0%) |
| Construction & Extraction | 515 (94.3%) | 31 (5.7%) |
| Installation, Maintenance & Repair | 417 (95.2%) | 21 (4.8%) |
| Total (Category) | 997 (89.5%) | 117 (10.5%) |
| Total (Overall) | 6,953 (59.0%) | 4,842 (41.0%) |
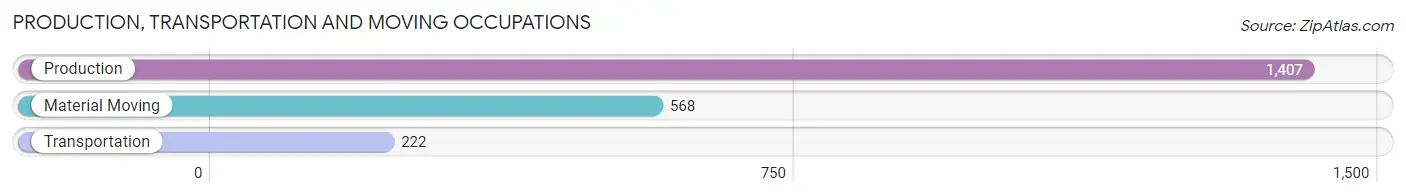
Production, Transportation and Moving Occupations
The most common Production, Transportation and Moving occupations in Athens are Production (1,407 | 11.9%), Material Moving (568 | 4.8%), and Transportation (222 | 1.9%).
Production, Transportation and Moving Occupations by Sex
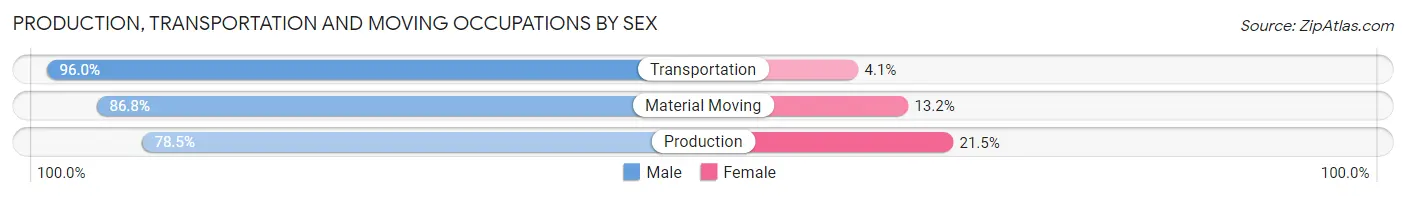
| Occupation | Male | Female |
| Production | 1,105 (78.5%) | 302 (21.5%) |
| Transportation | 213 (96.0%) | 9 (4.1%) |
| Material Moving | 493 (86.8%) | 75 (13.2%) |
| Total (Category) | 1,811 (82.4%) | 386 (17.6%) |
| Total (Overall) | 6,953 (59.0%) | 4,842 (41.0%) |
Employment Industries by Sex in Athens
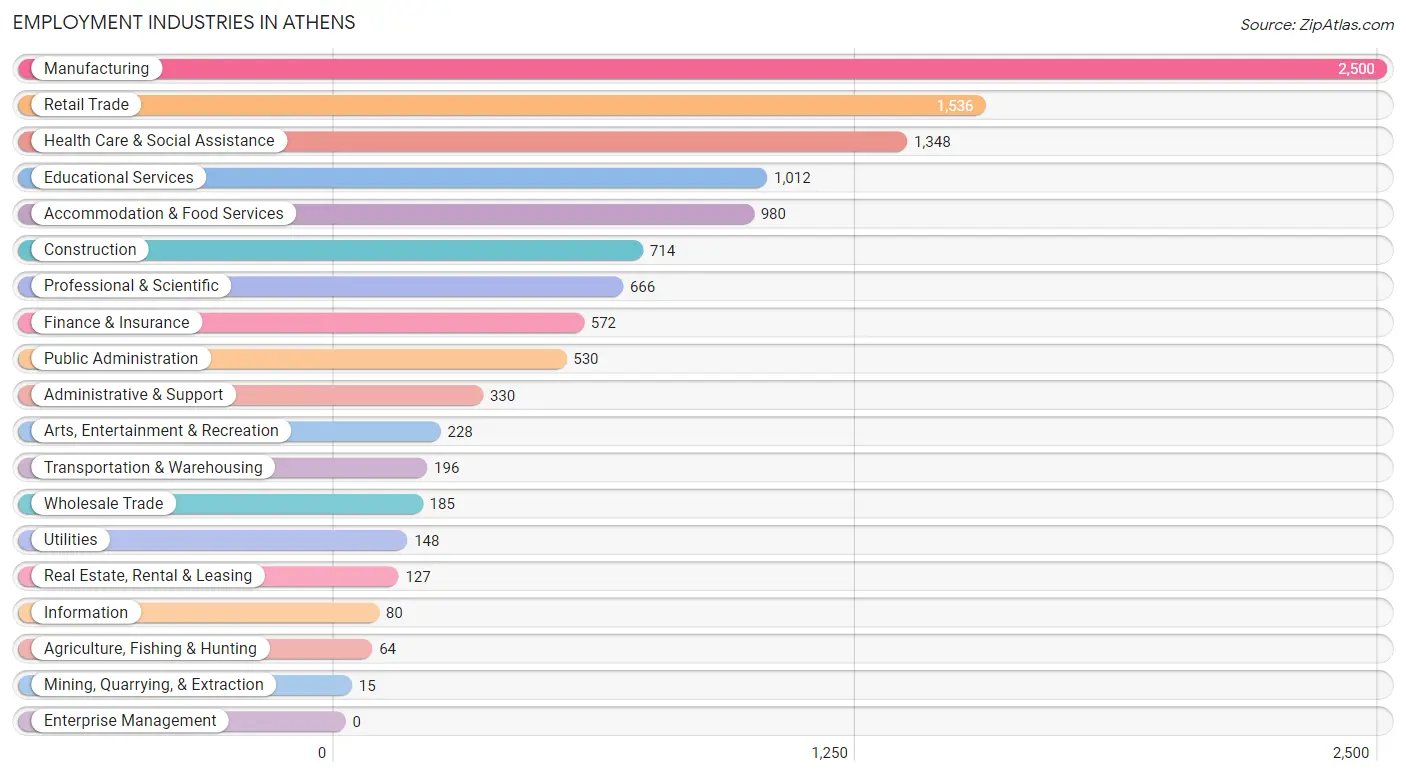
Employment Industries in Athens
The major employment industries in Athens include Manufacturing (2,500 | 21.2%), Retail Trade (1,536 | 13.0%), Health Care & Social Assistance (1,348 | 11.4%), Educational Services (1,012 | 8.6%), and Accommodation & Food Services (980 | 8.3%).
Employment Industries by Sex in Athens
The Athens industries that see more men than women are Mining, Quarrying, & Extraction (100.0%), Utilities (85.1%), and Construction (82.4%), whereas the industries that tend to have a higher number of women are Health Care & Social Assistance (75.4%), Educational Services (74.6%), and Agriculture, Fishing & Hunting (53.1%).
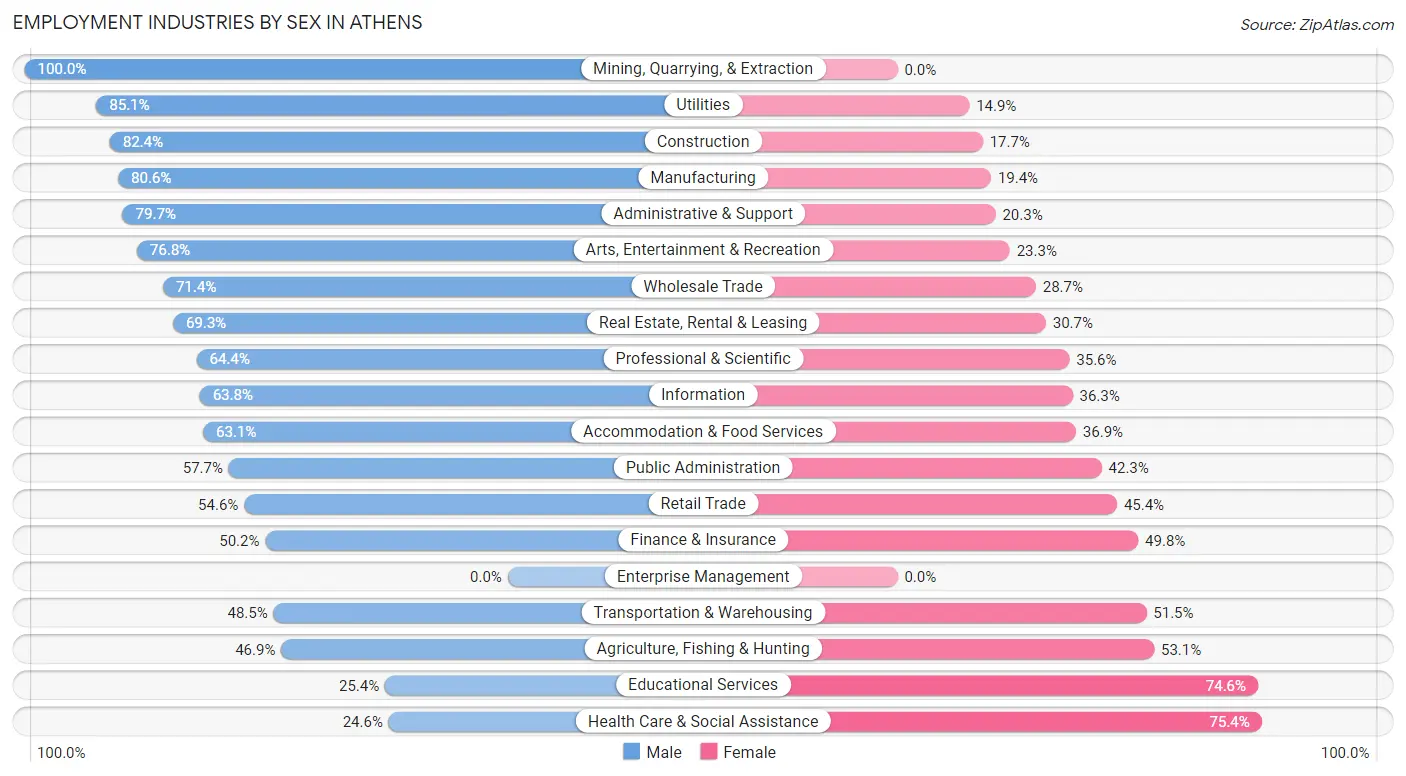
| Industry | Male | Female |
| Agriculture, Fishing & Hunting | 30 (46.9%) | 34 (53.1%) |
| Mining, Quarrying, & Extraction | 15 (100.0%) | 0 (0.0%) |
| Construction | 588 (82.4%) | 126 (17.6%) |
| Manufacturing | 2,016 (80.6%) | 484 (19.4%) |
| Wholesale Trade | 132 (71.4%) | 53 (28.6%) |
| Retail Trade | 838 (54.6%) | 698 (45.4%) |
| Transportation & Warehousing | 95 (48.5%) | 101 (51.5%) |
| Utilities | 126 (85.1%) | 22 (14.9%) |
| Information | 51 (63.7%) | 29 (36.2%) |
| Finance & Insurance | 287 (50.2%) | 285 (49.8%) |
| Real Estate, Rental & Leasing | 88 (69.3%) | 39 (30.7%) |
| Professional & Scientific | 429 (64.4%) | 237 (35.6%) |
| Enterprise Management | 0 (0.0%) | 0 (0.0%) |
| Administrative & Support | 263 (79.7%) | 67 (20.3%) |
| Educational Services | 257 (25.4%) | 755 (74.6%) |
| Health Care & Social Assistance | 332 (24.6%) | 1,016 (75.4%) |
| Arts, Entertainment & Recreation | 175 (76.7%) | 53 (23.3%) |
| Accommodation & Food Services | 618 (63.1%) | 362 (36.9%) |
| Public Administration | 306 (57.7%) | 224 (42.3%) |
| Total | 6,953 (59.0%) | 4,842 (41.0%) |
Education in Athens
School Enrollment in Athens
The most common levels of schooling among the 5,399 students in Athens are high school (1,234 | 22.9%), middle school (1,108 | 20.5%), and elementary school (1,097 | 20.3%).
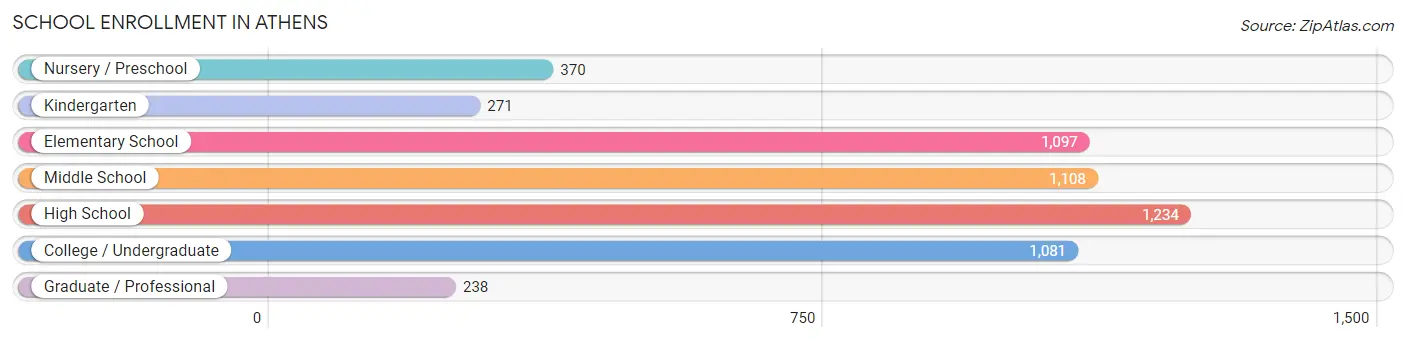
| School Level | # Students | % Students |
| Nursery / Preschool | 370 | 6.9% |
| Kindergarten | 271 | 5.0% |
| Elementary School | 1,097 | 20.3% |
| Middle School | 1,108 | 20.5% |
| High School | 1,234 | 22.9% |
| College / Undergraduate | 1,081 | 20.0% |
| Graduate / Professional | 238 | 4.4% |
| Total | 5,399 | 100.0% |
School Enrollment by Age by Funding Source in Athens
Out of a total of 5,399 students who are enrolled in schools in Athens, 1,042 (19.3%) attend a private institution, while the remaining 4,357 (80.7%) are enrolled in public schools. The age group of 3 to 4 year olds has the highest likelihood of being enrolled in private schools, with 178 (61.0% in the age bracket) enrolled. Conversely, the age group of 20 to 24 year olds has the lowest likelihood of being enrolled in a private school, with 532 (98.7% in the age bracket) attending a public institution.
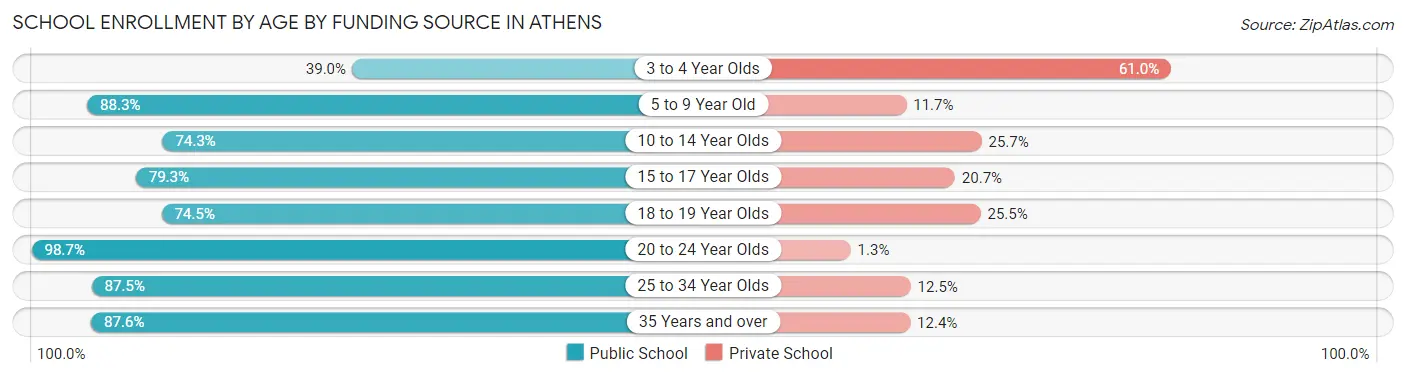
| Age Bracket | Public School | Private School |
| 3 to 4 Year Olds | 114 (39.0%) | 178 (61.0%) |
| 5 to 9 Year Old | 1,121 (88.3%) | 148 (11.7%) |
| 10 to 14 Year Olds | 1,033 (74.3%) | 357 (25.7%) |
| 15 to 17 Year Olds | 704 (79.3%) | 184 (20.7%) |
| 18 to 19 Year Olds | 222 (74.5%) | 76 (25.5%) |
| 20 to 24 Year Olds | 532 (98.7%) | 7 (1.3%) |
| 25 to 34 Year Olds | 456 (87.5%) | 65 (12.5%) |
| 35 Years and over | 177 (87.6%) | 25 (12.4%) |
| Total | 4,357 (80.7%) | 1,042 (19.3%) |
Educational Attainment by Field of Study in Athens
Education (1,251 | 20.8%), business (1,172 | 19.5%), engineering (673 | 11.2%), science & technology (503 | 8.4%), and arts & humanities (470 | 7.8%) are the most common fields of study among 6,005 individuals in Athens who have obtained a bachelor's degree or higher.
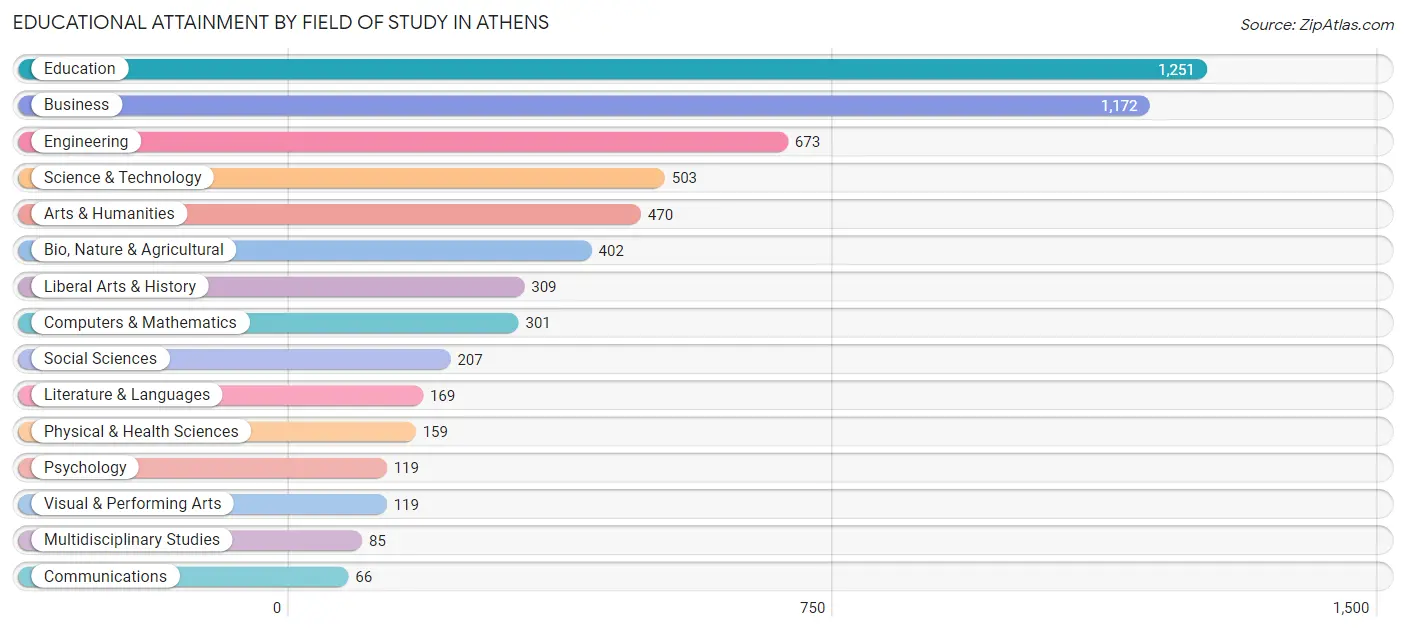
| Field of Study | # Graduates | % Graduates |
| Computers & Mathematics | 301 | 5.0% |
| Bio, Nature & Agricultural | 402 | 6.7% |
| Physical & Health Sciences | 159 | 2.6% |
| Psychology | 119 | 2.0% |
| Social Sciences | 207 | 3.5% |
| Engineering | 673 | 11.2% |
| Multidisciplinary Studies | 85 | 1.4% |
| Science & Technology | 503 | 8.4% |
| Business | 1,172 | 19.5% |
| Education | 1,251 | 20.8% |
| Literature & Languages | 169 | 2.8% |
| Liberal Arts & History | 309 | 5.1% |
| Visual & Performing Arts | 119 | 2.0% |
| Communications | 66 | 1.1% |
| Arts & Humanities | 470 | 7.8% |
| Total | 6,005 | 100.0% |
Transportation & Commute in Athens
Vehicle Availability by Sex in Athens
The most prevalent vehicle ownership categories in Athens are males with 2 vehicles (2,050, accounting for 29.7%) and females with 2 vehicles (1,616, making up 42.7%).
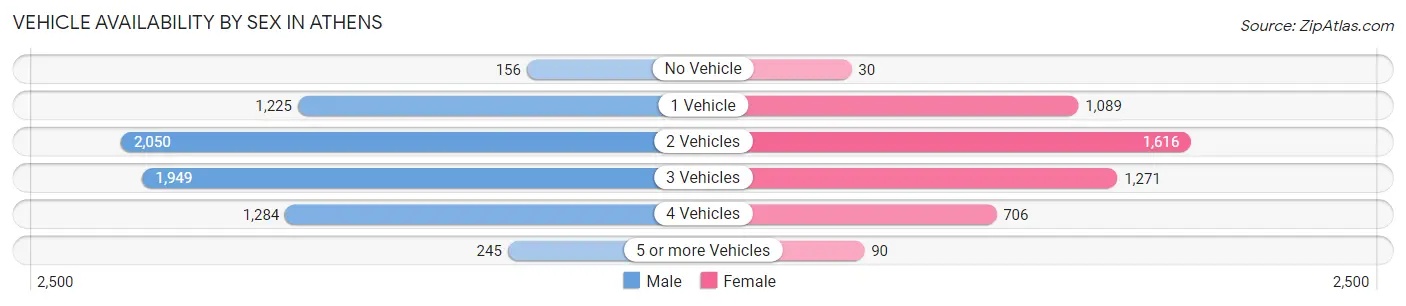
| Vehicles Available | Male | Female |
| No Vehicle | 156 (2.3%) | 30 (0.6%) |
| 1 Vehicle | 1,225 (17.7%) | 1,089 (22.7%) |
| 2 Vehicles | 2,050 (29.7%) | 1,616 (33.7%) |
| 3 Vehicles | 1,949 (28.2%) | 1,271 (26.5%) |
| 4 Vehicles | 1,284 (18.6%) | 706 (14.7%) |
| 5 or more Vehicles | 245 (3.5%) | 90 (1.9%) |
| Total | 6,909 (100.0%) | 4,802 (100.0%) |
Commute Time in Athens
The most frequently occuring commute durations in Athens are 5 to 9 minutes (1,945 commuters, 17.3%), 30 to 34 minutes (1,498 commuters, 13.3%), and 10 to 14 minutes (1,402 commuters, 12.5%).
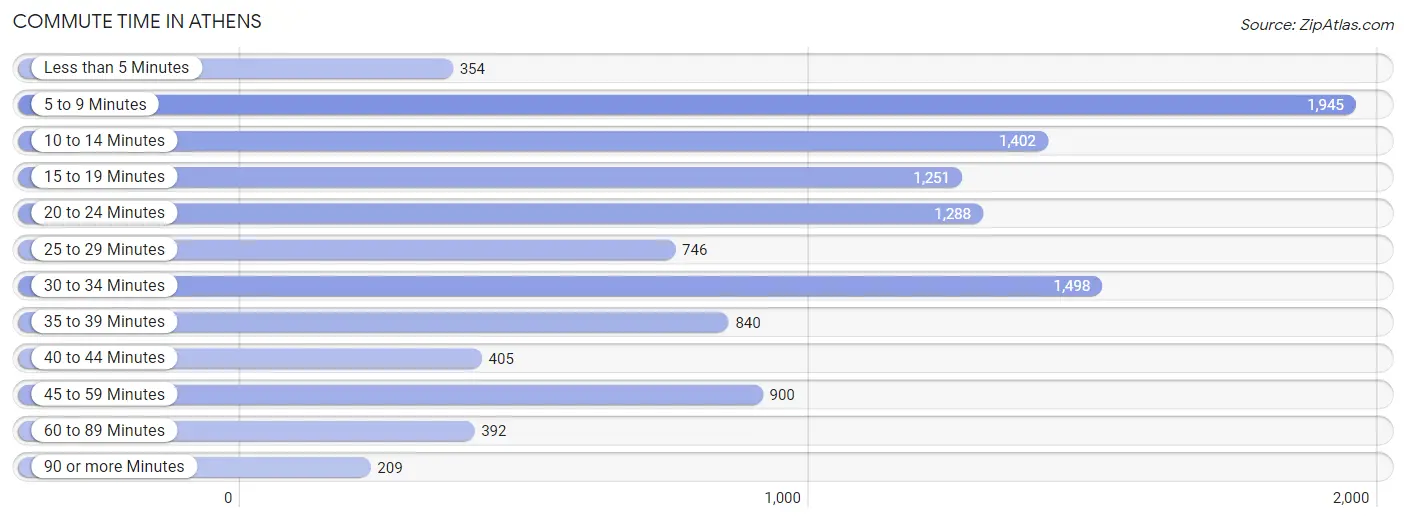
| Commute Time | # Commuters | % Commuters |
| Less than 5 Minutes | 354 | 3.2% |
| 5 to 9 Minutes | 1,945 | 17.3% |
| 10 to 14 Minutes | 1,402 | 12.5% |
| 15 to 19 Minutes | 1,251 | 11.1% |
| 20 to 24 Minutes | 1,288 | 11.5% |
| 25 to 29 Minutes | 746 | 6.6% |
| 30 to 34 Minutes | 1,498 | 13.3% |
| 35 to 39 Minutes | 840 | 7.5% |
| 40 to 44 Minutes | 405 | 3.6% |
| 45 to 59 Minutes | 900 | 8.0% |
| 60 to 89 Minutes | 392 | 3.5% |
| 90 or more Minutes | 209 | 1.9% |
Commute Time by Sex in Athens
The most common commute times in Athens are 5 to 9 minutes (1,075 commuters, 16.3%) for males and 5 to 9 minutes (870 commuters, 18.8%) for females.
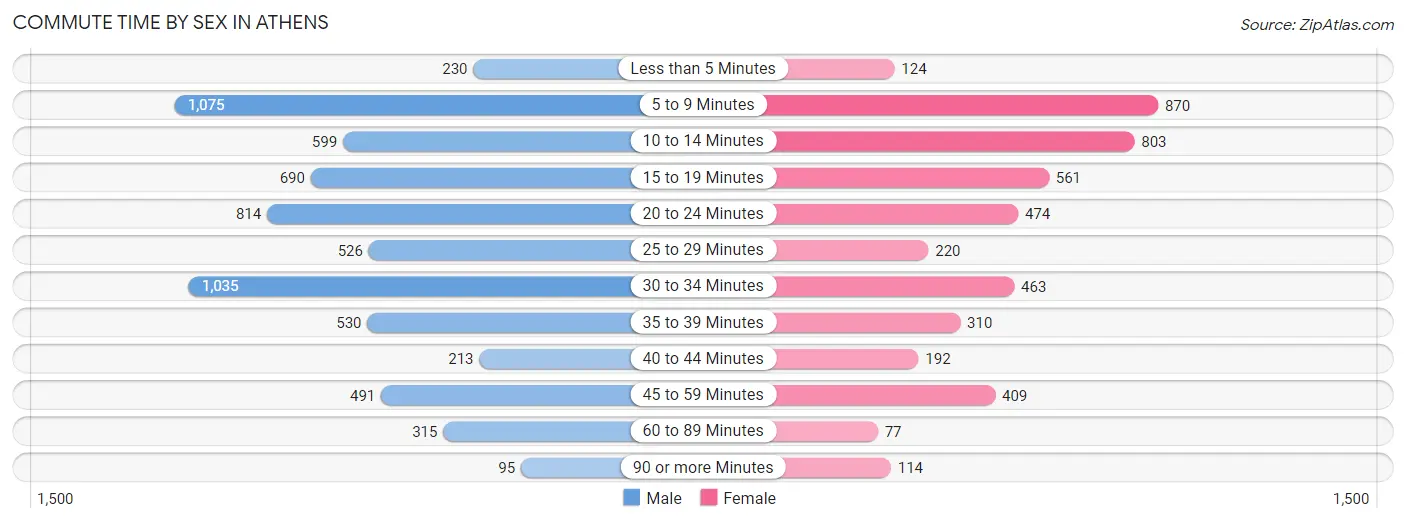
| Commute Time | Male | Female |
| Less than 5 Minutes | 230 (3.5%) | 124 (2.7%) |
| 5 to 9 Minutes | 1,075 (16.3%) | 870 (18.8%) |
| 10 to 14 Minutes | 599 (9.1%) | 803 (17.4%) |
| 15 to 19 Minutes | 690 (10.4%) | 561 (12.1%) |
| 20 to 24 Minutes | 814 (12.3%) | 474 (10.3%) |
| 25 to 29 Minutes | 526 (8.0%) | 220 (4.8%) |
| 30 to 34 Minutes | 1,035 (15.7%) | 463 (10.0%) |
| 35 to 39 Minutes | 530 (8.0%) | 310 (6.7%) |
| 40 to 44 Minutes | 213 (3.2%) | 192 (4.2%) |
| 45 to 59 Minutes | 491 (7.4%) | 409 (8.9%) |
| 60 to 89 Minutes | 315 (4.8%) | 77 (1.7%) |
| 90 or more Minutes | 95 (1.4%) | 114 (2.5%) |
Time of Departure to Work by Sex in Athens
The most frequent times of departure to work in Athens are 6:30 AM to 6:59 AM (1,043, 15.8%) for males and 8:00 AM to 8:29 AM (705, 15.3%) for females.
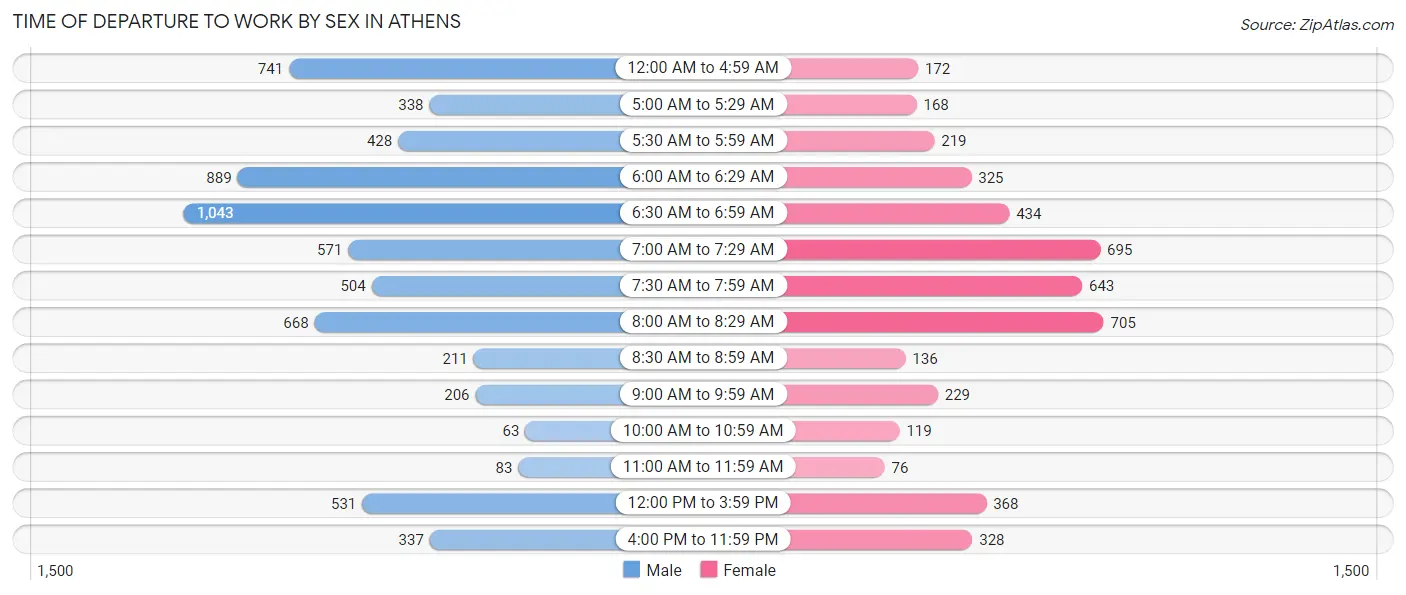
| Time of Departure | Male | Female |
| 12:00 AM to 4:59 AM | 741 (11.2%) | 172 (3.7%) |
| 5:00 AM to 5:29 AM | 338 (5.1%) | 168 (3.6%) |
| 5:30 AM to 5:59 AM | 428 (6.5%) | 219 (4.7%) |
| 6:00 AM to 6:29 AM | 889 (13.4%) | 325 (7.0%) |
| 6:30 AM to 6:59 AM | 1,043 (15.8%) | 434 (9.4%) |
| 7:00 AM to 7:29 AM | 571 (8.6%) | 695 (15.0%) |
| 7:30 AM to 7:59 AM | 504 (7.6%) | 643 (13.9%) |
| 8:00 AM to 8:29 AM | 668 (10.1%) | 705 (15.3%) |
| 8:30 AM to 8:59 AM | 211 (3.2%) | 136 (2.9%) |
| 9:00 AM to 9:59 AM | 206 (3.1%) | 229 (5.0%) |
| 10:00 AM to 10:59 AM | 63 (0.9%) | 119 (2.6%) |
| 11:00 AM to 11:59 AM | 83 (1.3%) | 76 (1.7%) |
| 12:00 PM to 3:59 PM | 531 (8.0%) | 368 (8.0%) |
| 4:00 PM to 11:59 PM | 337 (5.1%) | 328 (7.1%) |
| Total | 6,613 (100.0%) | 4,617 (100.0%) |
Housing Occupancy in Athens
Occupancy by Ownership in Athens
Of the total 10,441 dwellings in Athens, owner-occupied units account for 6,599 (63.2%), while renter-occupied units make up 3,842 (36.8%).
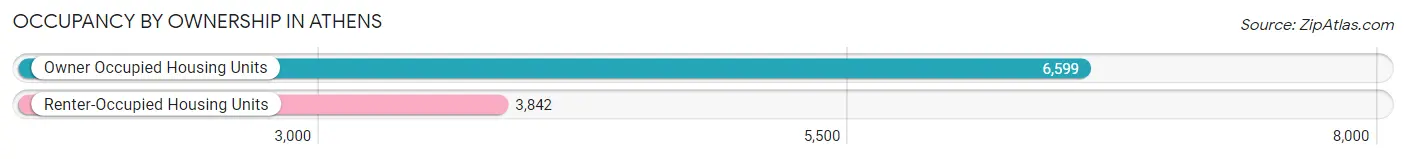
| Occupancy | # Housing Units | % Housing Units |
| Owner Occupied Housing Units | 6,599 | 63.2% |
| Renter-Occupied Housing Units | 3,842 | 36.8% |
| Total Occupied Housing Units | 10,441 | 100.0% |
Occupancy by Household Size in Athens
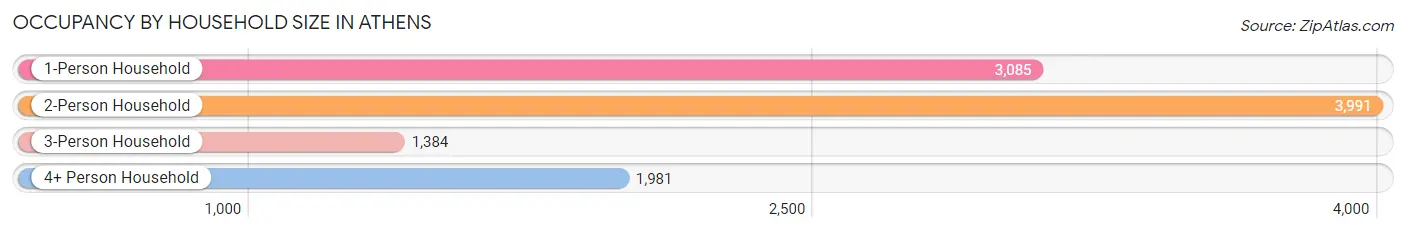
| Household Size | # Housing Units | % Housing Units |
| 1-Person Household | 3,085 | 29.5% |
| 2-Person Household | 3,991 | 38.2% |
| 3-Person Household | 1,384 | 13.3% |
| 4+ Person Household | 1,981 | 19.0% |
| Total Housing Units | 10,441 | 100.0% |
Occupancy by Ownership by Household Size in Athens
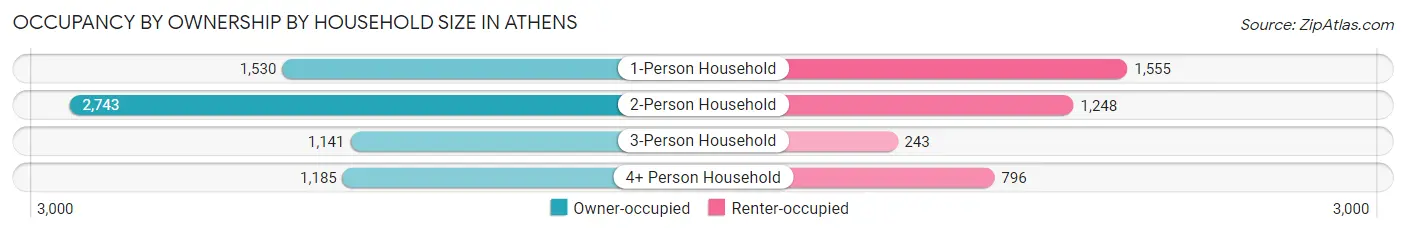
| Household Size | Owner-occupied | Renter-occupied |
| 1-Person Household | 1,530 (49.6%) | 1,555 (50.4%) |
| 2-Person Household | 2,743 (68.7%) | 1,248 (31.3%) |
| 3-Person Household | 1,141 (82.4%) | 243 (17.6%) |
| 4+ Person Household | 1,185 (59.8%) | 796 (40.2%) |
| Total Housing Units | 6,599 (63.2%) | 3,842 (36.8%) |
Occupancy by Educational Attainment in Athens
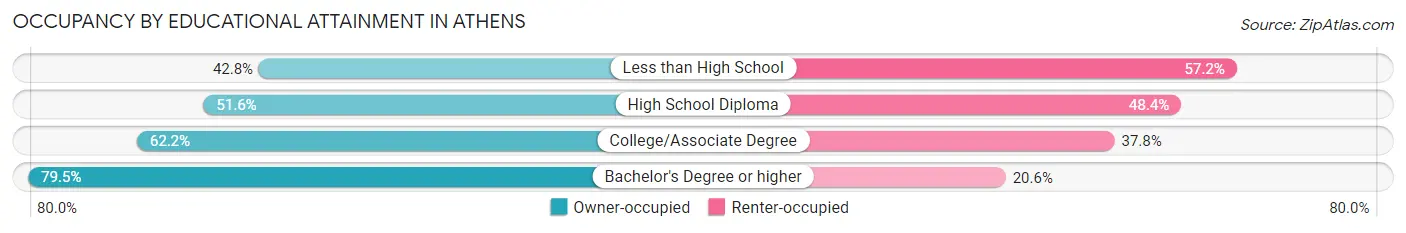
| Household Size | Owner-occupied | Renter-occupied |
| Less than High School | 430 (42.8%) | 574 (57.2%) |
| High School Diploma | 1,364 (51.6%) | 1,278 (48.4%) |
| College/Associate Degree | 2,138 (62.2%) | 1,300 (37.8%) |
| Bachelor's Degree or higher | 2,667 (79.4%) | 690 (20.5%) |
Occupancy by Age of Householder in Athens
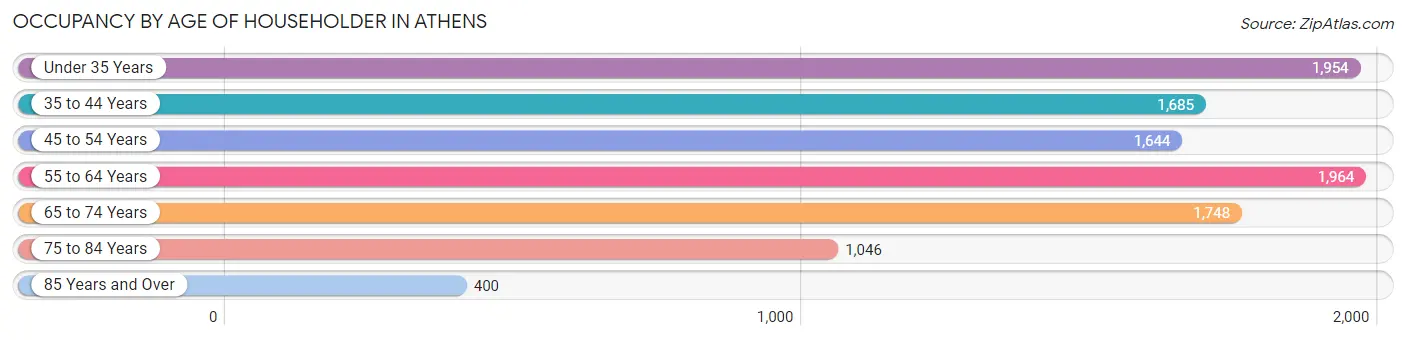
| Age Bracket | # Households | % Households |
| Under 35 Years | 1,954 | 18.7% |
| 35 to 44 Years | 1,685 | 16.1% |
| 45 to 54 Years | 1,644 | 15.8% |
| 55 to 64 Years | 1,964 | 18.8% |
| 65 to 74 Years | 1,748 | 16.7% |
| 75 to 84 Years | 1,046 | 10.0% |
| 85 Years and Over | 400 | 3.8% |
| Total | 10,441 | 100.0% |
Housing Finances in Athens
Median Income by Occupancy in Athens
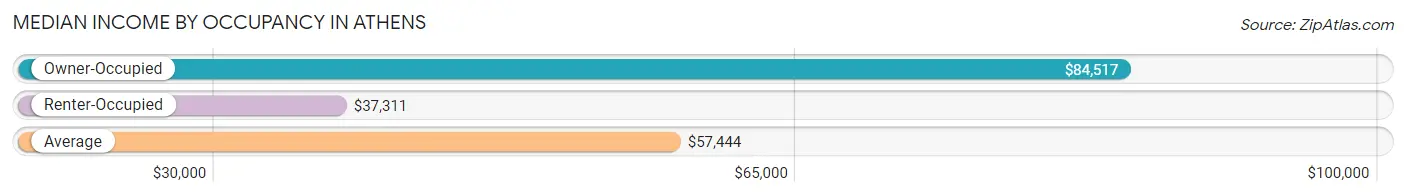
| Occupancy Type | # Households | Median Income |
| Owner-Occupied | 6,599 (63.2%) | $84,517 |
| Renter-Occupied | 3,842 (36.8%) | $37,311 |
| Average | 10,441 (100.0%) | $57,444 |
Occupancy by Householder Income Bracket in Athens
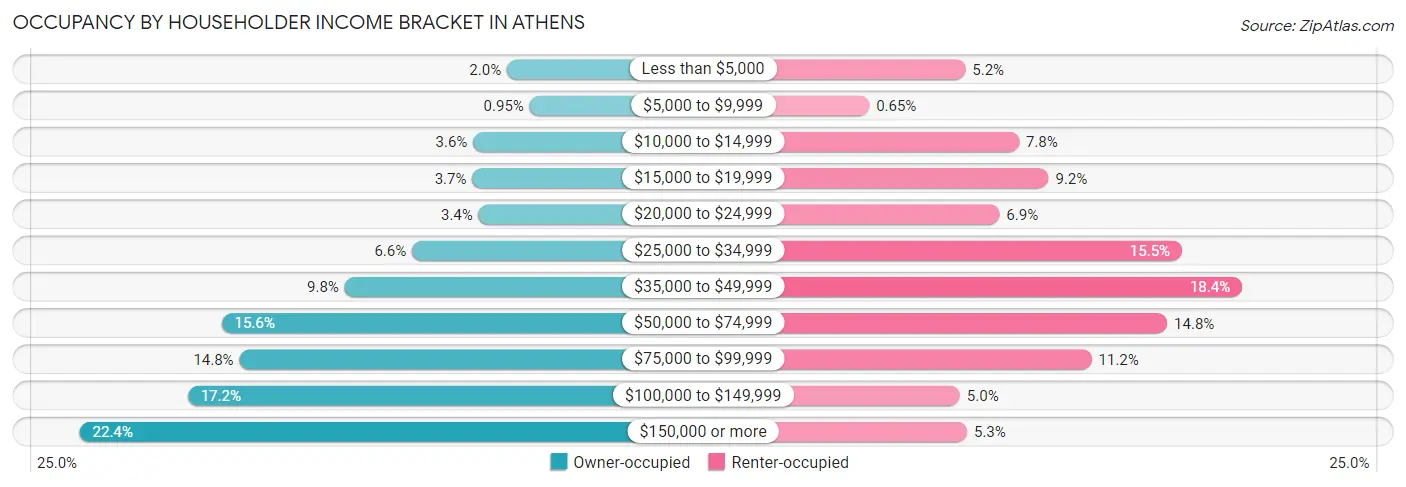
| Income Bracket | Owner-occupied | Renter-occupied |
| Less than $5,000 | 134 (2.0%) | 201 (5.2%) |
| $5,000 to $9,999 | 63 (0.9%) | 25 (0.6%) |
| $10,000 to $14,999 | 240 (3.6%) | 299 (7.8%) |
| $15,000 to $19,999 | 243 (3.7%) | 353 (9.2%) |
| $20,000 to $24,999 | 223 (3.4%) | 263 (6.9%) |
| $25,000 to $34,999 | 432 (6.6%) | 597 (15.5%) |
| $35,000 to $49,999 | 644 (9.8%) | 707 (18.4%) |
| $50,000 to $74,999 | 1,031 (15.6%) | 570 (14.8%) |
| $75,000 to $99,999 | 975 (14.8%) | 432 (11.2%) |
| $100,000 to $149,999 | 1,137 (17.2%) | 191 (5.0%) |
| $150,000 or more | 1,477 (22.4%) | 204 (5.3%) |
| Total | 6,599 (100.0%) | 3,842 (100.0%) |
Monthly Housing Cost Tiers in Athens
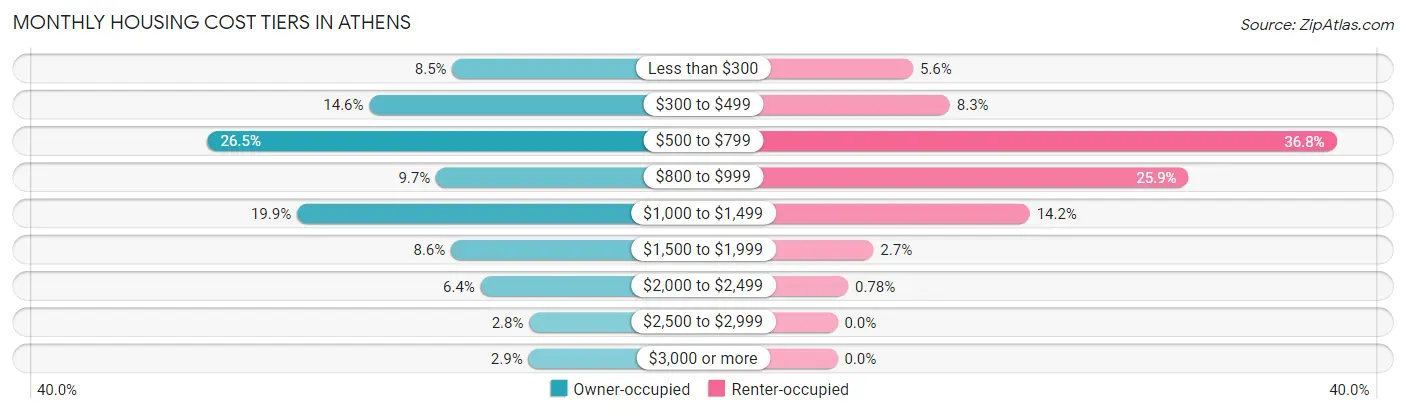
| Monthly Cost | Owner-occupied | Renter-occupied |
| Less than $300 | 560 (8.5%) | 214 (5.6%) |
| $300 to $499 | 964 (14.6%) | 318 (8.3%) |
| $500 to $799 | 1,751 (26.5%) | 1,412 (36.7%) |
| $800 to $999 | 640 (9.7%) | 993 (25.9%) |
| $1,000 to $1,499 | 1,316 (19.9%) | 544 (14.2%) |
| $1,500 to $1,999 | 567 (8.6%) | 102 (2.6%) |
| $2,000 to $2,499 | 423 (6.4%) | 30 (0.8%) |
| $2,500 to $2,999 | 187 (2.8%) | 0 (0.0%) |
| $3,000 or more | 191 (2.9%) | 0 (0.0%) |
| Total | 6,599 (100.0%) | 3,842 (100.0%) |
Physical Housing Characteristics in Athens
Housing Structures in Athens
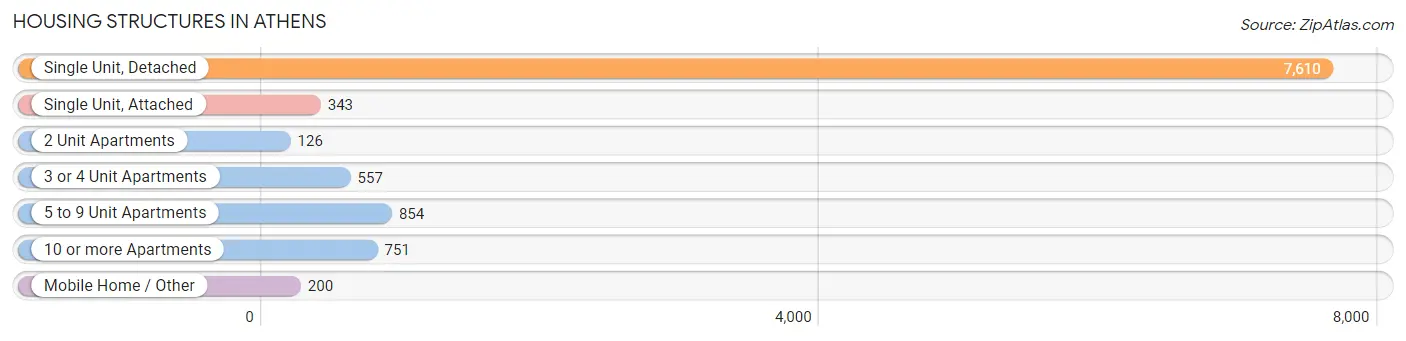
| Structure Type | # Housing Units | % Housing Units |
| Single Unit, Detached | 7,610 | 72.9% |
| Single Unit, Attached | 343 | 3.3% |
| 2 Unit Apartments | 126 | 1.2% |
| 3 or 4 Unit Apartments | 557 | 5.3% |
| 5 to 9 Unit Apartments | 854 | 8.2% |
| 10 or more Apartments | 751 | 7.2% |
| Mobile Home / Other | 200 | 1.9% |
| Total | 10,441 | 100.0% |
Housing Structures by Occupancy in Athens
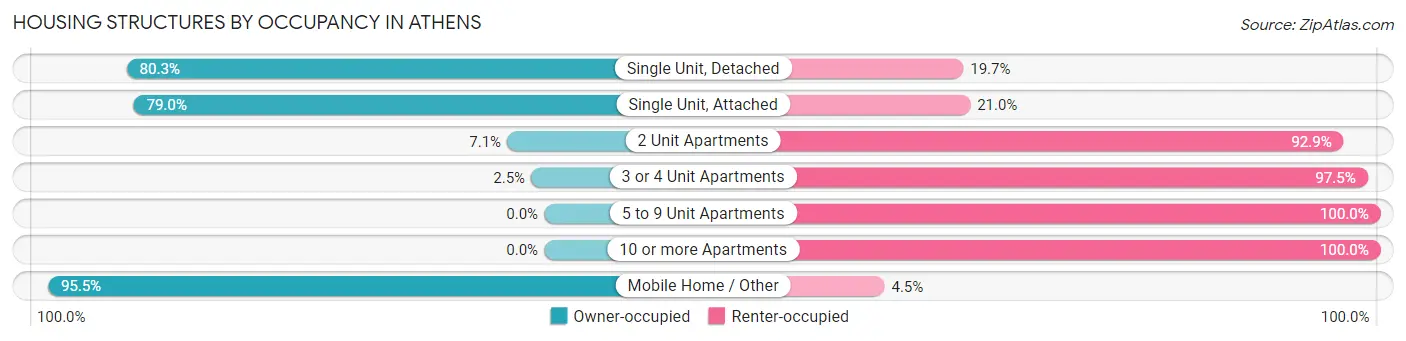
| Structure Type | Owner-occupied | Renter-occupied |
| Single Unit, Detached | 6,114 (80.3%) | 1,496 (19.7%) |
| Single Unit, Attached | 271 (79.0%) | 72 (21.0%) |
| 2 Unit Apartments | 9 (7.1%) | 117 (92.9%) |
| 3 or 4 Unit Apartments | 14 (2.5%) | 543 (97.5%) |
| 5 to 9 Unit Apartments | 0 (0.0%) | 854 (100.0%) |
| 10 or more Apartments | 0 (0.0%) | 751 (100.0%) |
| Mobile Home / Other | 191 (95.5%) | 9 (4.5%) |
| Total | 6,599 (63.2%) | 3,842 (36.8%) |
Housing Structures by Number of Rooms in Athens
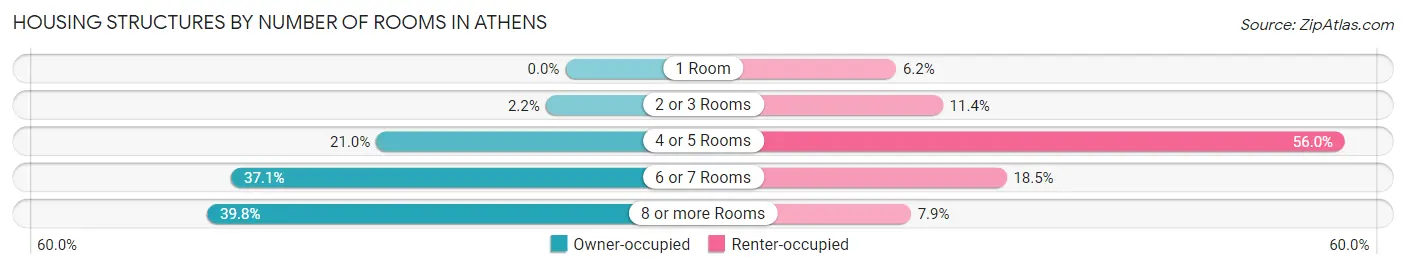
| Number of Rooms | Owner-occupied | Renter-occupied |
| 1 Room | 0 (0.0%) | 239 (6.2%) |
| 2 or 3 Rooms | 144 (2.2%) | 438 (11.4%) |
| 4 or 5 Rooms | 1,385 (21.0%) | 2,153 (56.0%) |
| 6 or 7 Rooms | 2,447 (37.1%) | 710 (18.5%) |
| 8 or more Rooms | 2,623 (39.8%) | 302 (7.9%) |
| Total | 6,599 (100.0%) | 3,842 (100.0%) |
Housing Structure by Heating Type in Athens
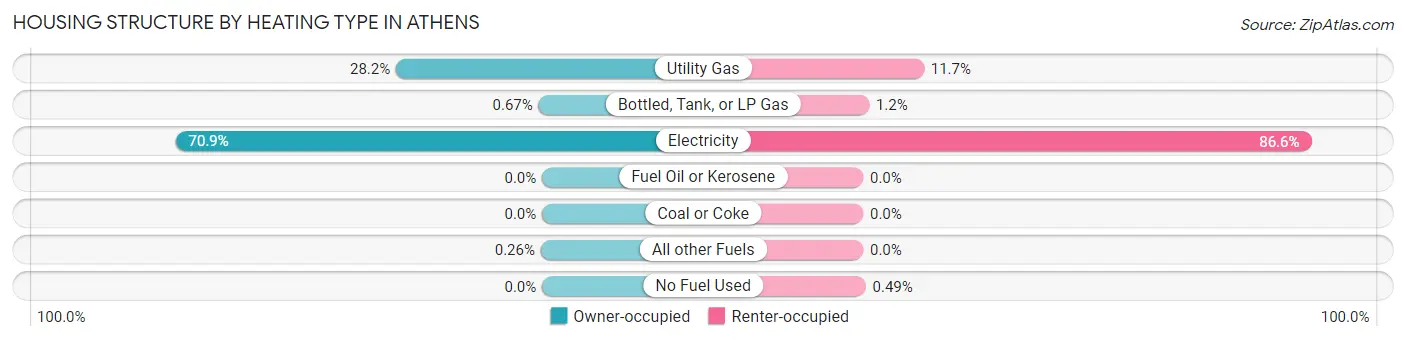
| Heating Type | Owner-occupied | Renter-occupied |
| Utility Gas | 1,862 (28.2%) | 451 (11.7%) |
| Bottled, Tank, or LP Gas | 44 (0.7%) | 44 (1.1%) |
| Electricity | 4,676 (70.9%) | 3,328 (86.6%) |
| Fuel Oil or Kerosene | 0 (0.0%) | 0 (0.0%) |
| Coal or Coke | 0 (0.0%) | 0 (0.0%) |
| All other Fuels | 17 (0.3%) | 0 (0.0%) |
| No Fuel Used | 0 (0.0%) | 19 (0.5%) |
| Total | 6,599 (100.0%) | 3,842 (100.0%) |
Household Vehicle Usage in Athens
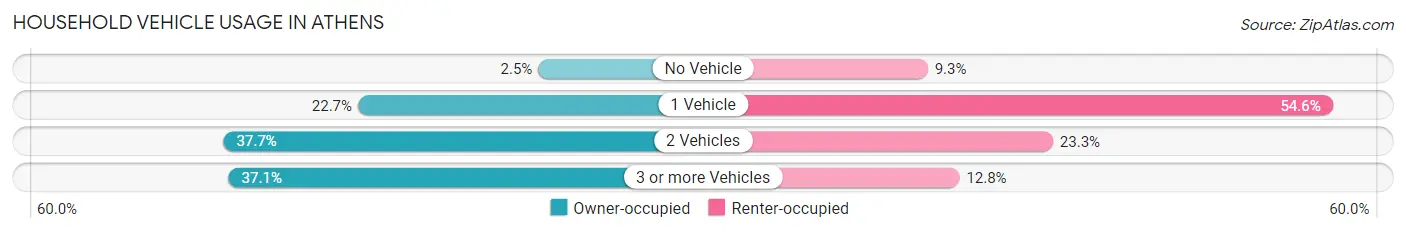
| Vehicles per Household | Owner-occupied | Renter-occupied |
| No Vehicle | 163 (2.5%) | 356 (9.3%) |
| 1 Vehicle | 1,496 (22.7%) | 2,098 (54.6%) |
| 2 Vehicles | 2,489 (37.7%) | 895 (23.3%) |
| 3 or more Vehicles | 2,451 (37.1%) | 493 (12.8%) |
| Total | 6,599 (100.0%) | 3,842 (100.0%) |
Real Estate & Mortgages in Athens
Real Estate and Mortgage Overview in Athens
| Characteristic | Without Mortgage | With Mortgage |
| Housing Units | 2,983 | 3,616 |
| Median Property Value | $224,300 | $224,100 |
| Median Household Income | $53,589 | $1,045 |
| Monthly Housing Costs | $499 | $191 |
| Real Estate Taxes | $806 | $277 |
Property Value by Mortgage Status in Athens
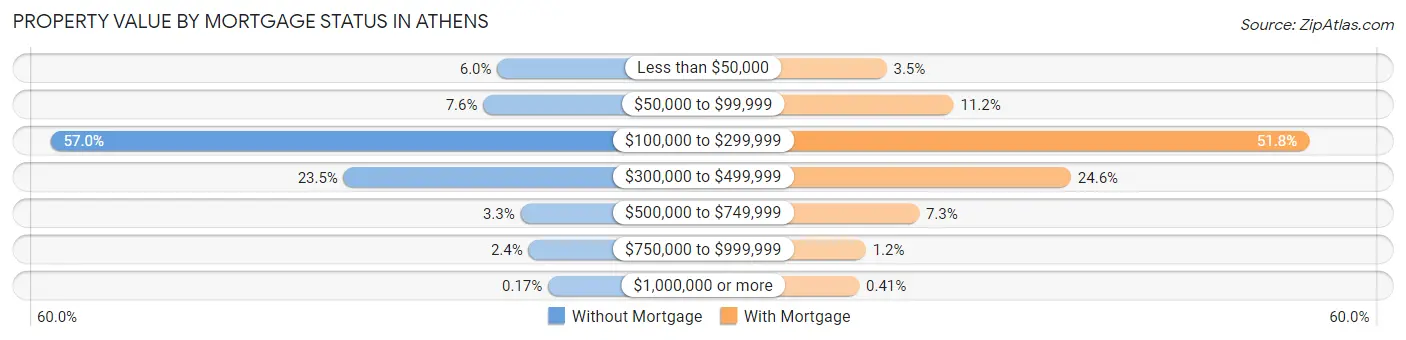
| Property Value | Without Mortgage | With Mortgage |
| Less than $50,000 | 178 (6.0%) | 128 (3.5%) |
| $50,000 to $99,999 | 226 (7.6%) | 405 (11.2%) |
| $100,000 to $299,999 | 1,701 (57.0%) | 1,874 (51.8%) |
| $300,000 to $499,999 | 702 (23.5%) | 890 (24.6%) |
| $500,000 to $749,999 | 99 (3.3%) | 262 (7.2%) |
| $750,000 to $999,999 | 72 (2.4%) | 42 (1.2%) |
| $1,000,000 or more | 5 (0.2%) | 15 (0.4%) |
| Total | 2,983 (100.0%) | 3,616 (100.0%) |
Household Income by Mortgage Status in Athens
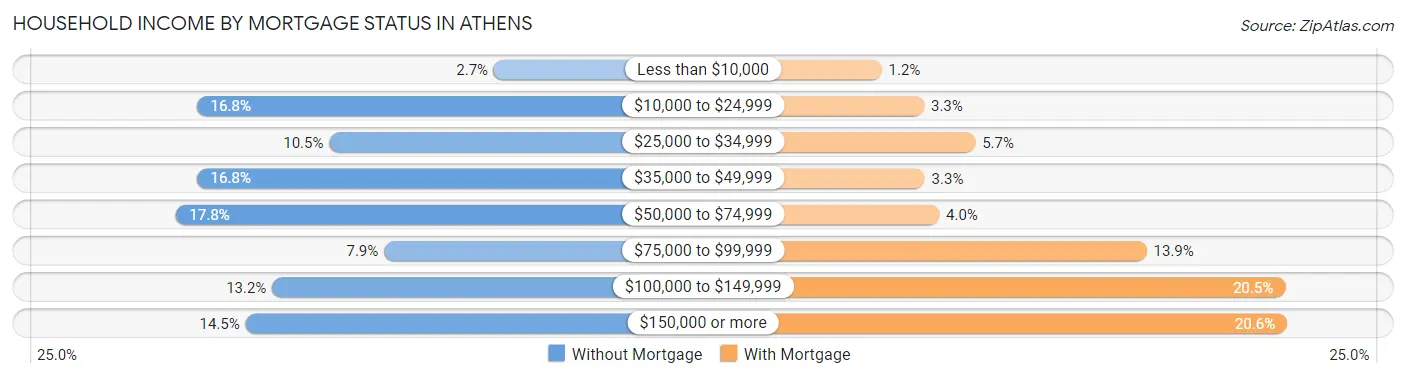
| Household Income | Without Mortgage | With Mortgage |
| Less than $10,000 | 79 (2.6%) | 45 (1.2%) |
| $10,000 to $24,999 | 500 (16.8%) | 118 (3.3%) |
| $25,000 to $34,999 | 313 (10.5%) | 206 (5.7%) |
| $35,000 to $49,999 | 500 (16.8%) | 119 (3.3%) |
| $50,000 to $74,999 | 530 (17.8%) | 144 (4.0%) |
| $75,000 to $99,999 | 235 (7.9%) | 501 (13.9%) |
| $100,000 to $149,999 | 394 (13.2%) | 740 (20.5%) |
| $150,000 or more | 432 (14.5%) | 743 (20.5%) |
| Total | 2,983 (100.0%) | 3,616 (100.0%) |
Property Value to Household Income Ratio in Athens
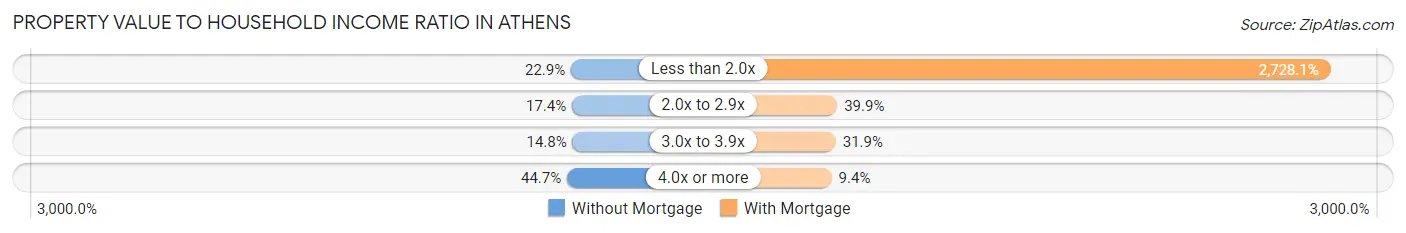
| Value-to-Income Ratio | Without Mortgage | With Mortgage |
| Less than 2.0x | 682 (22.9%) | 98,649 (2,728.1%) |
| 2.0x to 2.9x | 519 (17.4%) | 1,444 (39.9%) |
| 3.0x to 3.9x | 441 (14.8%) | 1,154 (31.9%) |
| 4.0x or more | 1,333 (44.7%) | 340 (9.4%) |
| Total | 2,983 (100.0%) | 3,616 (100.0%) |
Real Estate Taxes by Mortgage Status in Athens
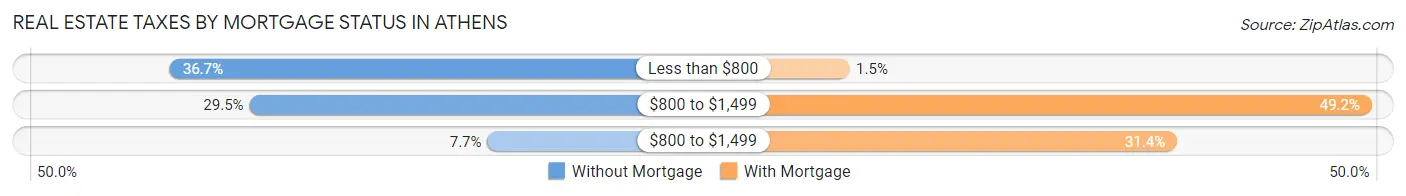
| Property Taxes | Without Mortgage | With Mortgage |
| Less than $800 | 1,096 (36.7%) | 53 (1.5%) |
| $800 to $1,499 | 879 (29.5%) | 1,779 (49.2%) |
| $800 to $1,499 | 231 (7.7%) | 1,136 (31.4%) |
| Total | 2,983 (100.0%) | 3,616 (100.0%) |
Health & Disability in Athens
Health Insurance Coverage by Age in Athens
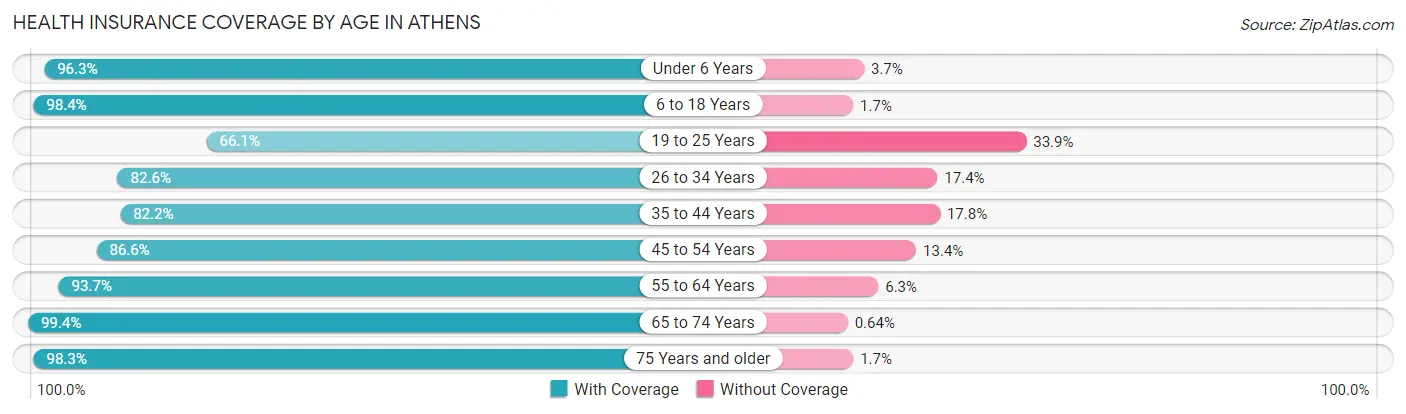
| Age Bracket | With Coverage | Without Coverage |
| Under 6 Years | 1,734 (96.3%) | 66 (3.7%) |
| 6 to 18 Years | 3,627 (98.4%) | 61 (1.7%) |
| 19 to 25 Years | 1,353 (66.1%) | 695 (33.9%) |
| 26 to 34 Years | 2,804 (82.6%) | 589 (17.4%) |
| 35 to 44 Years | 2,514 (82.2%) | 546 (17.8%) |
| 45 to 54 Years | 2,649 (86.6%) | 410 (13.4%) |
| 55 to 64 Years | 3,649 (93.7%) | 247 (6.3%) |
| 65 to 74 Years | 2,620 (99.4%) | 17 (0.6%) |
| 75 Years and older | 1,941 (98.3%) | 33 (1.7%) |
| Total | 22,891 (89.6%) | 2,664 (10.4%) |
Health Insurance Coverage by Citizenship Status in Athens
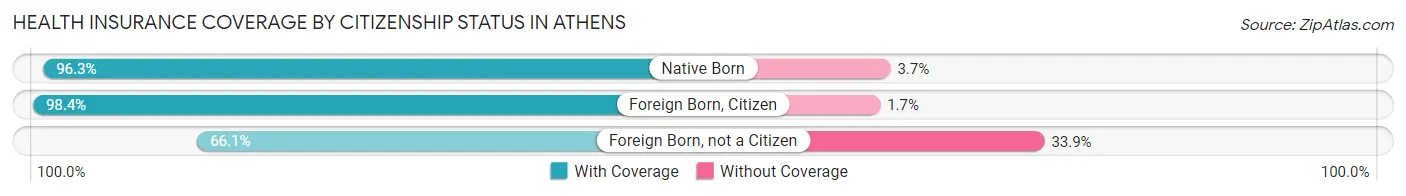
| Citizenship Status | With Coverage | Without Coverage |
| Native Born | 1,734 (96.3%) | 66 (3.7%) |
| Foreign Born, Citizen | 3,627 (98.4%) | 61 (1.7%) |
| Foreign Born, not a Citizen | 1,353 (66.1%) | 695 (33.9%) |
Health Insurance Coverage by Household Income in Athens
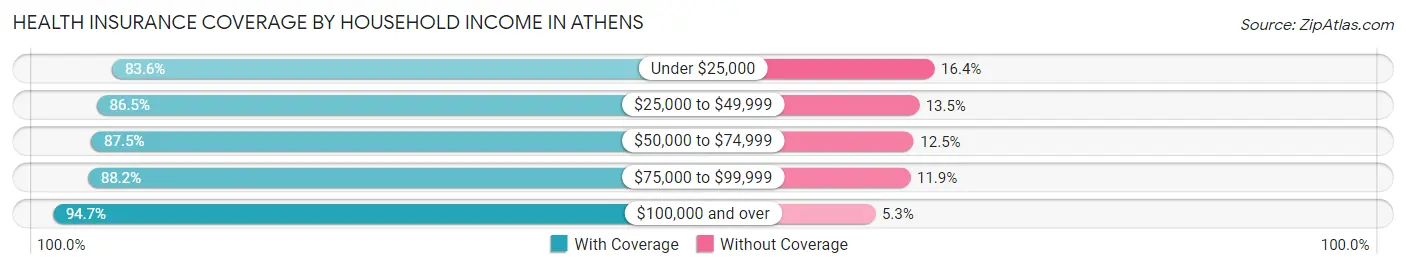
| Household Income | With Coverage | Without Coverage |
| Under $25,000 | 3,049 (83.6%) | 597 (16.4%) |
| $25,000 to $49,999 | 4,161 (86.5%) | 648 (13.5%) |
| $50,000 to $74,999 | 3,331 (87.5%) | 475 (12.5%) |
| $75,000 to $99,999 | 3,296 (88.1%) | 443 (11.8%) |
| $100,000 and over | 9,000 (94.7%) | 501 (5.3%) |
Public vs Private Health Insurance Coverage by Age in Athens
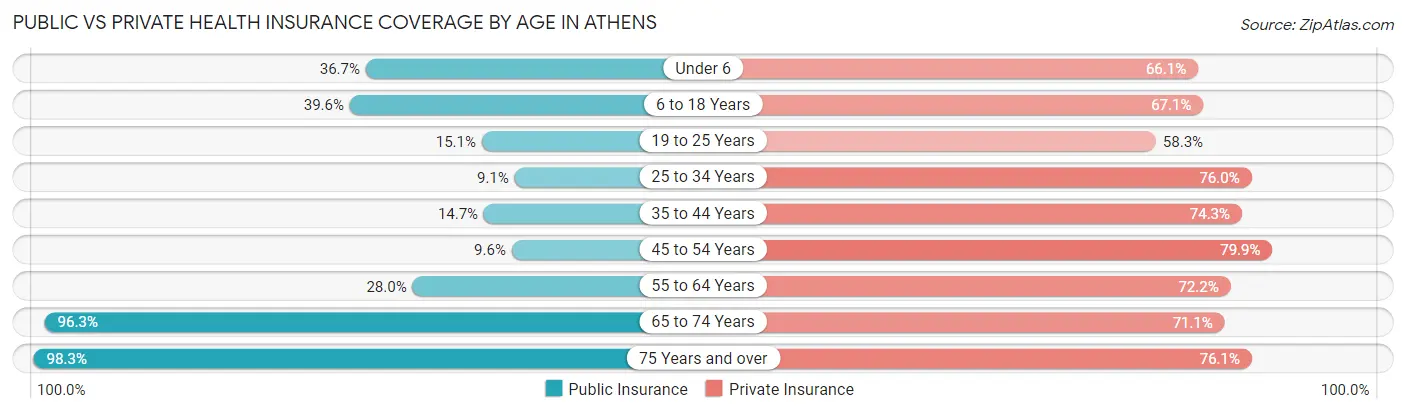
| Age Bracket | Public Insurance | Private Insurance |
| Under 6 | 660 (36.7%) | 1,190 (66.1%) |
| 6 to 18 Years | 1,462 (39.6%) | 2,474 (67.1%) |
| 19 to 25 Years | 310 (15.1%) | 1,194 (58.3%) |
| 25 to 34 Years | 307 (9.0%) | 2,580 (76.0%) |
| 35 to 44 Years | 451 (14.7%) | 2,272 (74.3%) |
| 45 to 54 Years | 293 (9.6%) | 2,444 (79.9%) |
| 55 to 64 Years | 1,091 (28.0%) | 2,811 (72.2%) |
| 65 to 74 Years | 2,539 (96.3%) | 1,874 (71.1%) |
| 75 Years and over | 1,941 (98.3%) | 1,502 (76.1%) |
| Total | 9,054 (35.4%) | 18,341 (71.8%) |
Disability Status by Sex by Age in Athens
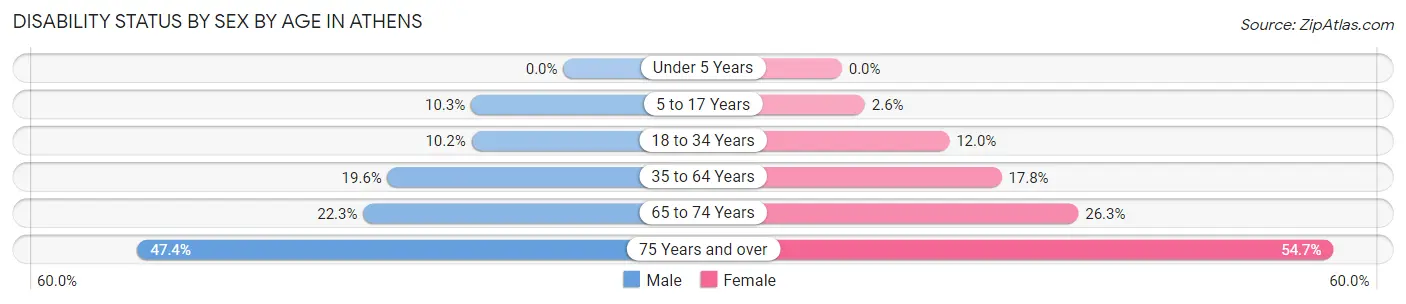
| Age Bracket | Male | Female |
| Under 5 Years | 0 (0.0%) | 0 (0.0%) |
| 5 to 17 Years | 187 (10.3%) | 48 (2.6%) |
| 18 to 34 Years | 304 (10.2%) | 325 (12.0%) |
| 35 to 64 Years | 994 (19.6%) | 878 (17.8%) |
| 65 to 74 Years | 201 (22.3%) | 457 (26.3%) |
| 75 Years and over | 384 (47.4%) | 637 (54.7%) |
Disability Class by Sex by Age in Athens
Disability Class: Hearing Difficulty
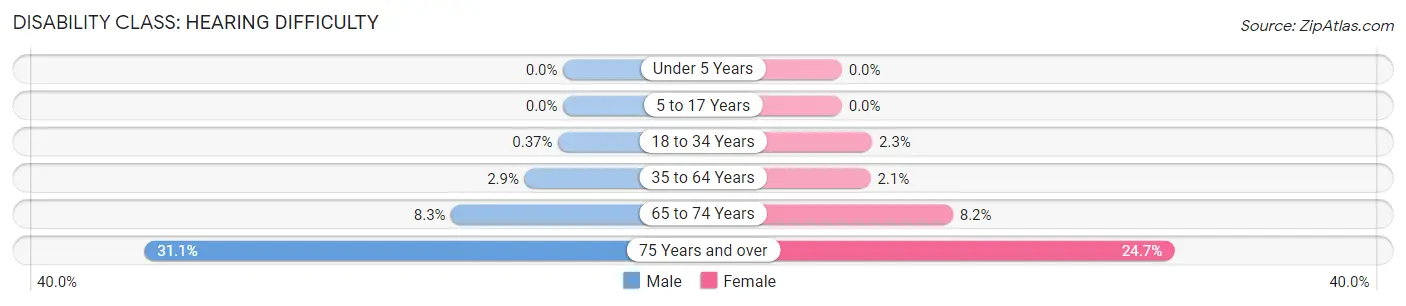
| Age Bracket | Male | Female |
| Under 5 Years | 0 (0.0%) | 0 (0.0%) |
| 5 to 17 Years | 0 (0.0%) | 0 (0.0%) |
| 18 to 34 Years | 11 (0.4%) | 61 (2.2%) |
| 35 to 64 Years | 145 (2.9%) | 105 (2.1%) |
| 65 to 74 Years | 75 (8.3%) | 143 (8.2%) |
| 75 Years and over | 252 (31.1%) | 287 (24.7%) |
Disability Class: Vision Difficulty
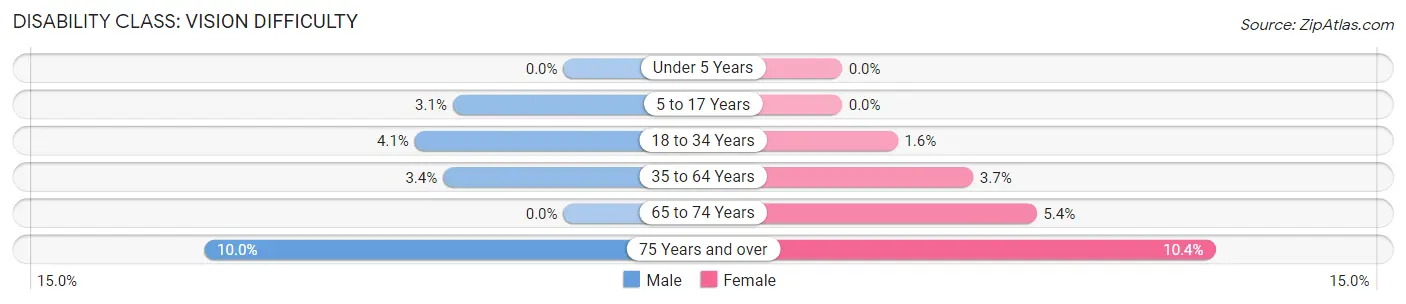
| Age Bracket | Male | Female |
| Under 5 Years | 0 (0.0%) | 0 (0.0%) |
| 5 to 17 Years | 56 (3.1%) | 0 (0.0%) |
| 18 to 34 Years | 123 (4.1%) | 42 (1.5%) |
| 35 to 64 Years | 170 (3.4%) | 180 (3.6%) |
| 65 to 74 Years | 0 (0.0%) | 94 (5.4%) |
| 75 Years and over | 81 (10.0%) | 121 (10.4%) |
Disability Class: Cognitive Difficulty
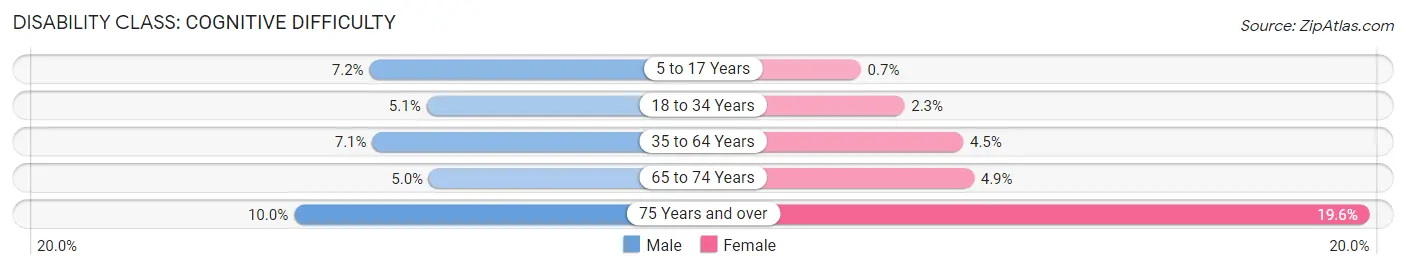
| Age Bracket | Male | Female |
| 5 to 17 Years | 131 (7.2%) | 13 (0.7%) |
| 18 to 34 Years | 151 (5.1%) | 63 (2.3%) |
| 35 to 64 Years | 360 (7.1%) | 222 (4.5%) |
| 65 to 74 Years | 45 (5.0%) | 85 (4.9%) |
| 75 Years and over | 81 (10.0%) | 228 (19.6%) |
Disability Class: Ambulatory Difficulty
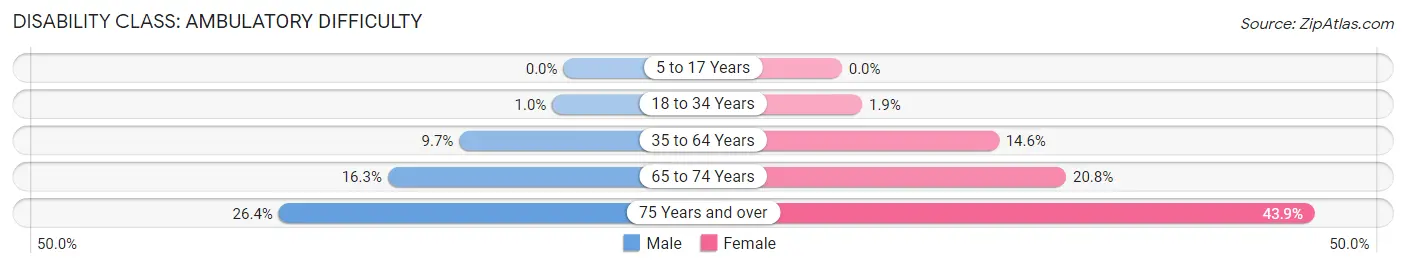
| Age Bracket | Male | Female |
| 5 to 17 Years | 0 (0.0%) | 0 (0.0%) |
| 18 to 34 Years | 31 (1.0%) | 51 (1.9%) |
| 35 to 64 Years | 491 (9.7%) | 719 (14.6%) |
| 65 to 74 Years | 147 (16.3%) | 361 (20.8%) |
| 75 Years and over | 214 (26.4%) | 511 (43.9%) |
Disability Class: Self-Care Difficulty
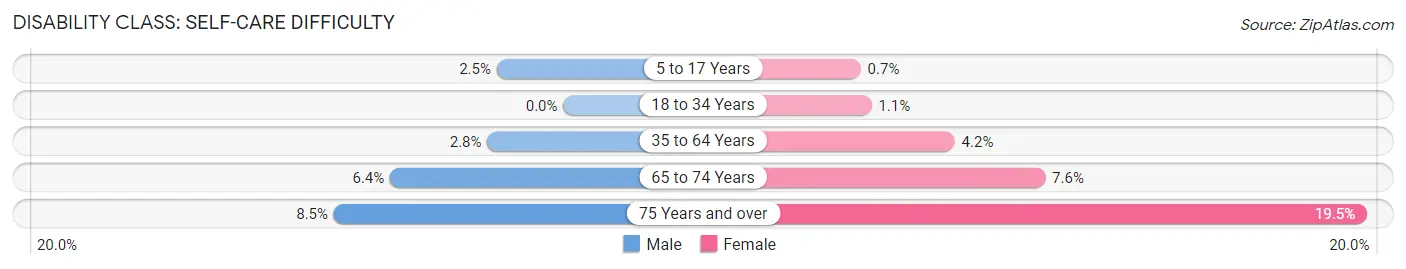
| Age Bracket | Male | Female |
| 5 to 17 Years | 45 (2.5%) | 13 (0.7%) |
| 18 to 34 Years | 0 (0.0%) | 30 (1.1%) |
| 35 to 64 Years | 143 (2.8%) | 207 (4.2%) |
| 65 to 74 Years | 58 (6.4%) | 131 (7.5%) |
| 75 Years and over | 69 (8.5%) | 227 (19.5%) |
Technology Access in Athens
Computing Device Access in Athens
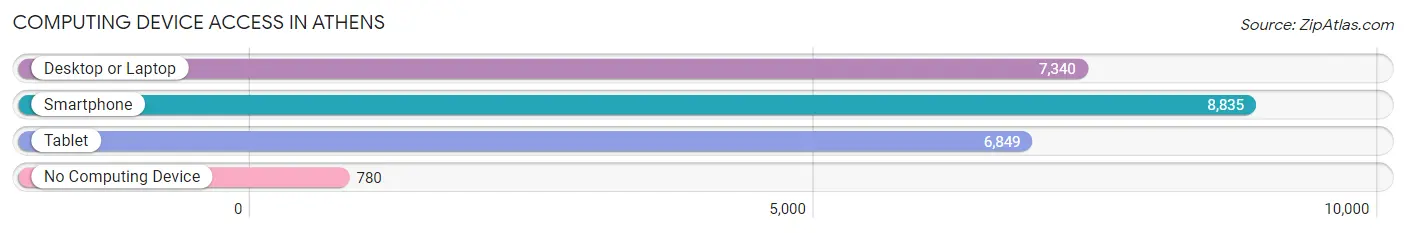
| Device Type | # Households | % Households |
| Desktop or Laptop | 7,340 | 70.3% |
| Smartphone | 8,835 | 84.6% |
| Tablet | 6,849 | 65.6% |
| No Computing Device | 780 | 7.5% |
| Total | 10,441 | 100.0% |
Internet Access in Athens
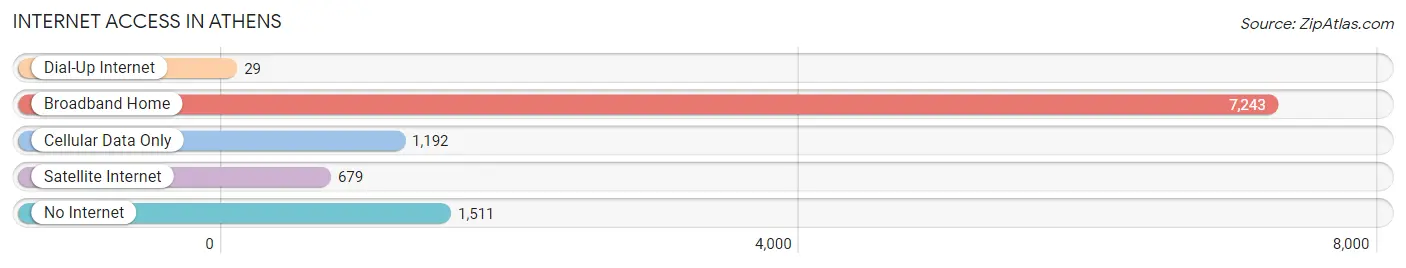
| Internet Type | # Households | % Households |
| Dial-Up Internet | 29 | 0.3% |
| Broadband Home | 7,243 | 69.4% |
| Cellular Data Only | 1,192 | 11.4% |
| Satellite Internet | 679 | 6.5% |
| No Internet | 1,511 | 14.5% |
| Total | 10,441 | 100.0% |
Athens Summary
Athens is a city located in Limestone County, Alabama, United States. It is the county seat of Limestone County and is included in the Huntsville-Decatur Combined Statistical Area. As of the 2010 census, the population of Athens was 21,897, up from 19,694 in 2000.
History
Athens was founded in 1818 by John Coffee, a veteran of the War of 1812. The city was named after the ancient Greek city of Athens. The city was incorporated in 1822 and became the county seat of Limestone County in 1824.
Athens was a center of the cotton trade in the 19th century and was home to several cotton mills. The city was also a major railroad hub, with the Nashville and Decatur Railroad running through the city.
Athens was the site of a major battle during the Civil War. On May 2, 1862, Confederate forces under General Braxton Bragg defeated Union forces under General Ormsby Mitchel in the Battle of Athens.
Geography
Athens is located in northern Alabama at 34°47'N 86°58'W (34.78, -86.97). It is situated in the foothills of the Appalachian Mountains, about 25 miles south of Huntsville and about 50 miles west of Chattanooga, Tennessee.
The city has a total area of 24.2 square miles, of which 24.1 square miles is land and 0.1 square miles is water.
Economy
Athens is a major economic center in northern Alabama. The city is home to several major employers, including the Athens-Limestone Hospital, the Limestone County School System, and the Limestone County Sheriff's Office.
The city is also home to several manufacturing companies, including the Athens Manufacturing Company, which produces automotive parts, and the Athens Textile Company, which produces textiles.
Demographics
As of the 2010 census, there were 21,897 people, 8,717 households, and 5,845 families residing in the city. The population density was 903.2 people per square mile. There were 9,717 housing units at an average density of 402.2 per square mile.
The racial makeup of the city was 73.2% White, 22.3% African American, 0.3% Native American, 1.2% Asian, 0.1% Pacific Islander, 1.2% from other races, and 1.8% from two or more races. Hispanic or Latino of any race were 3.2% of the population.
The median income for a household in the city was $37,945, and the median income for a family was $45,945. Males had a median income of $35,945 versus $25,945 for females. The per capita income for the city was $19,945. About 11.2% of families and 14.2% of the population were below the poverty line, including 19.2% of those under age 18 and 11.2% of those age 65 or over.
Common Questions
What is Per Capita Income in Athens?
Per Capita income in Athens is $35,783.
What is the Median Family Income in Athens?
Median Family Income in Athens is $87,641.
What is the Median Household income in Athens?
Median Household Income in Athens is $57,444.
What is Income or Wage Gap in Athens?
Income or Wage Gap in Athens is 27.8%.
Women in Athens earn 72.2 cents for every dollar earned by a man.
What is Family Income Deficit in Athens?
Family Income Deficit in Athens is $10,791.
Families that are below poverty line in Athens earn $10,791 less on average than the poverty threshold level.
What is Inequality or Gini Index in Athens?
Inequality or Gini Index in Athens is 0.47.
What is the Total Population of Athens?
Total Population of Athens is 26,179.
What is the Total Male Population of Athens?
Total Male Population of Athens is 12,942.
What is the Total Female Population of Athens?
Total Female Population of Athens is 13,237.
What is the Ratio of Males per 100 Females in Athens?
There are 97.77 Males per 100 Females in Athens.
What is the Ratio of Females per 100 Males in Athens?
There are 102.28 Females per 100 Males in Athens.
What is the Median Population Age in Athens?
Median Population Age in Athens is 41.3 Years.
What is the Average Family Size in Athens
Average Family Size in Athens is 3.1 People.
What is the Average Household Size in Athens
Average Household Size in Athens is 2.5 People.
How Large is the Labor Force in Athens?
There are 12,379 People in the Labor Forcein in Athens.
What is the Percentage of People in the Labor Force in Athens?
57.5% of People are in the Labor Force in Athens.
What is the Unemployment Rate in Athens?
Unemployment Rate in Athens is 4.3%.