Lee County, AL Map & Demographics
Lee County Map
Lee County Overview
$33,083
PER CAPITA INCOME
$86,772
AVG FAMILY INCOME
$59,288
AVG HOUSEHOLD INCOME
28.5%
WAGE / INCOME GAP [ % ]
71.5¢/ $1
WAGE / INCOME GAP [ $ ]
$11,094
FAMILY INCOME DEFICIT
0.51
INEQUALITY / GINI INDEX
175,126
TOTAL POPULATION
86,692
MALE POPULATION
88,434
FEMALE POPULATION
98.03
MALES / 100 FEMALES
102.01
FEMALES / 100 MALES
33.0
MEDIAN AGE
3.2
AVG FAMILY SIZE
2.6
AVG HOUSEHOLD SIZE
85,245
LABOR FORCE [ PEOPLE ]
59.6%
PERCENT IN LABOR FORCE
3.8%
UNEMPLOYMENT RATE
Income in Lee County
Income Overview in Lee County
Per Capita Income in Lee County is $33,083, while median incomes of families and households are $86,772 and $59,288 respectively.
| Characteristic | Number | Measure |
| Per Capita Income | 175,126 | $33,083 |
| Median Family Income | 40,425 | $86,772 |
| Mean Family Income | 40,425 | $110,176 |
| Median Household Income | 65,166 | $59,288 |
| Mean Household Income | 65,166 | $84,719 |
| Income Deficit | 40,425 | $11,094 |
| Wage / Income Gap (%) | 175,126 | 28.50% |
| Wage / Income Gap ($) | 175,126 | 71.50¢ per $1 |
| Gini / Inequality Index | 175,126 | 0.51 |
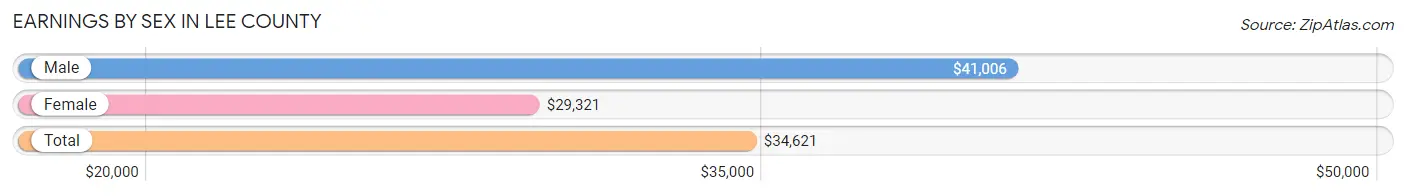
Earnings by Sex in Lee County
Average Earnings in Lee County are $34,621, $41,006 for men and $29,321 for women, a difference of 28.5%.
| Sex | Number | Average Earnings |
| Male | 48,411 (52.2%) | $41,006 |
| Female | 44,343 (47.8%) | $29,321 |
| Total | 92,754 (100.0%) | $34,621 |
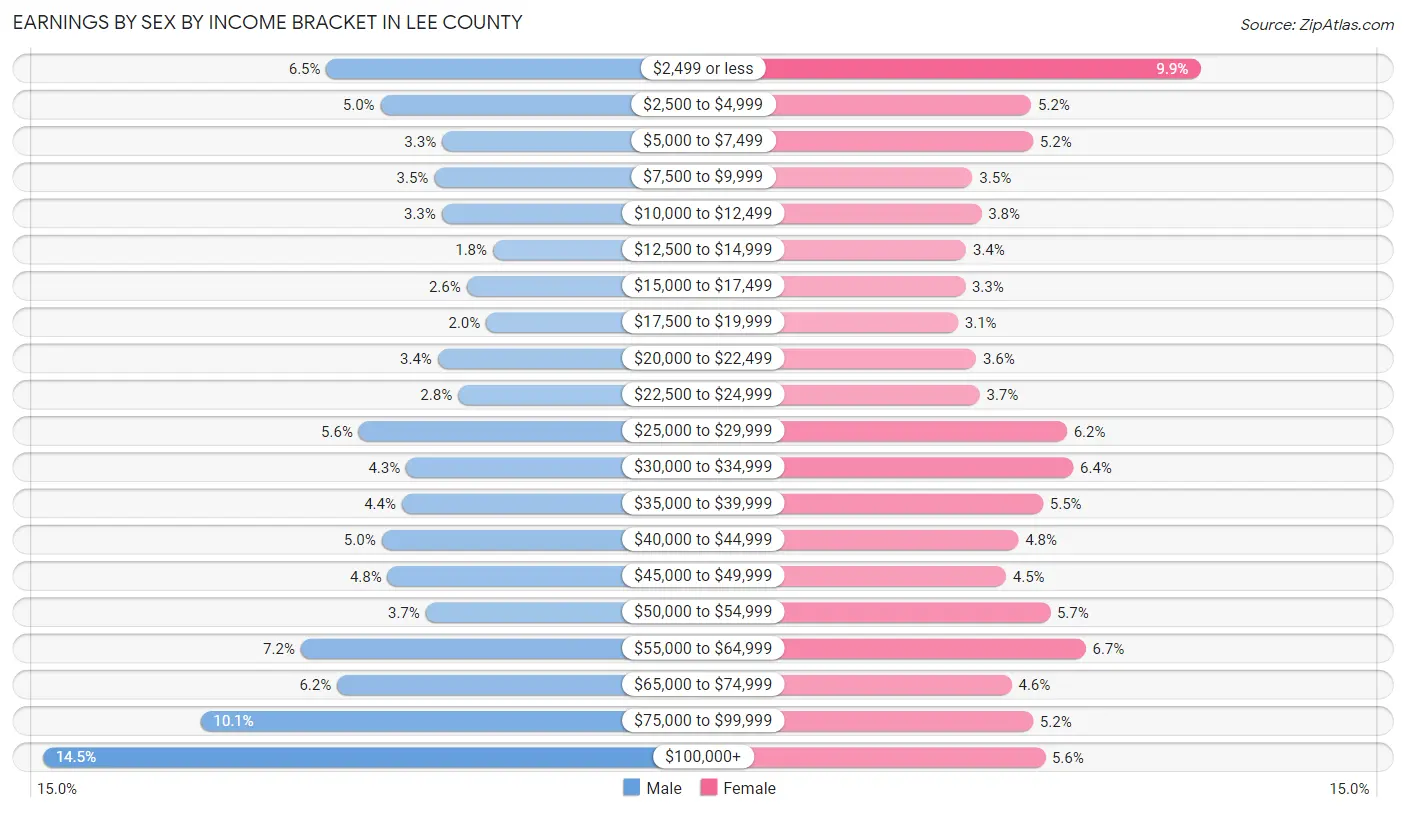
Earnings by Sex by Income Bracket in Lee County
The most common earnings brackets in Lee County are $100,000+ for men (7,013 | 14.5%) and $2,499 or less for women (4,404 | 9.9%).
| Income | Male | Female |
| $2,499 or less | 3,157 (6.5%) | 4,404 (9.9%) |
| $2,500 to $4,999 | 2,421 (5.0%) | 2,297 (5.2%) |
| $5,000 to $7,499 | 1,583 (3.3%) | 2,317 (5.2%) |
| $7,500 to $9,999 | 1,688 (3.5%) | 1,567 (3.5%) |
| $10,000 to $12,499 | 1,588 (3.3%) | 1,677 (3.8%) |
| $12,500 to $14,999 | 890 (1.8%) | 1,487 (3.4%) |
| $15,000 to $17,499 | 1,247 (2.6%) | 1,471 (3.3%) |
| $17,500 to $19,999 | 985 (2.0%) | 1,382 (3.1%) |
| $20,000 to $22,499 | 1,639 (3.4%) | 1,608 (3.6%) |
| $22,500 to $24,999 | 1,366 (2.8%) | 1,653 (3.7%) |
| $25,000 to $29,999 | 2,715 (5.6%) | 2,739 (6.2%) |
| $30,000 to $34,999 | 2,071 (4.3%) | 2,822 (6.4%) |
| $35,000 to $39,999 | 2,128 (4.4%) | 2,445 (5.5%) |
| $40,000 to $44,999 | 2,405 (5.0%) | 2,137 (4.8%) |
| $45,000 to $49,999 | 2,326 (4.8%) | 1,983 (4.5%) |
| $50,000 to $54,999 | 1,804 (3.7%) | 2,531 (5.7%) |
| $55,000 to $64,999 | 3,505 (7.2%) | 2,977 (6.7%) |
| $65,000 to $74,999 | 3,009 (6.2%) | 2,054 (4.6%) |
| $75,000 to $99,999 | 4,871 (10.1%) | 2,320 (5.2%) |
| $100,000+ | 7,013 (14.5%) | 2,472 (5.6%) |
| Total | 48,411 (100.0%) | 44,343 (100.0%) |
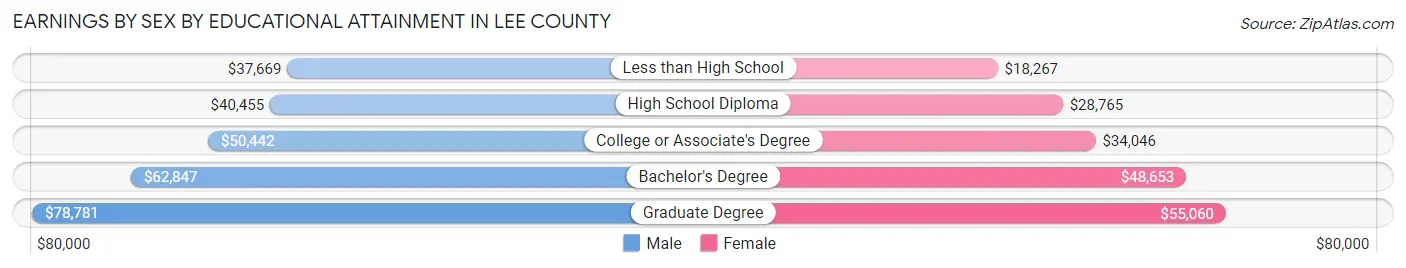
Earnings by Sex by Educational Attainment in Lee County
Average earnings in Lee County are $52,664 for men and $38,792 for women, a difference of 26.3%. Men with an educational attainment of graduate degree enjoy the highest average annual earnings of $78,781, while those with less than high school education earn the least with $37,669. Women with an educational attainment of graduate degree earn the most with the average annual earnings of $55,060, while those with less than high school education have the smallest earnings of $18,267.
| Educational Attainment | Male Income | Female Income |
| Less than High School | $37,669 | $18,267 |
| High School Diploma | $40,455 | $28,765 |
| College or Associate's Degree | $50,442 | $34,046 |
| Bachelor's Degree | $62,847 | $48,653 |
| Graduate Degree | $78,781 | $55,060 |
| Total | $52,664 | $38,792 |
Family Income in Lee County
Family Income Brackets in Lee County
According to the Lee County family income data, there are 8,974 families falling into the $100,000 to $149,999 income range, which is the most common income bracket and makes up 22.2% of all families. Conversely, the $10,000 to $14,999 income bracket is the least frequent group with only 728 families (1.8%) belonging to this category.
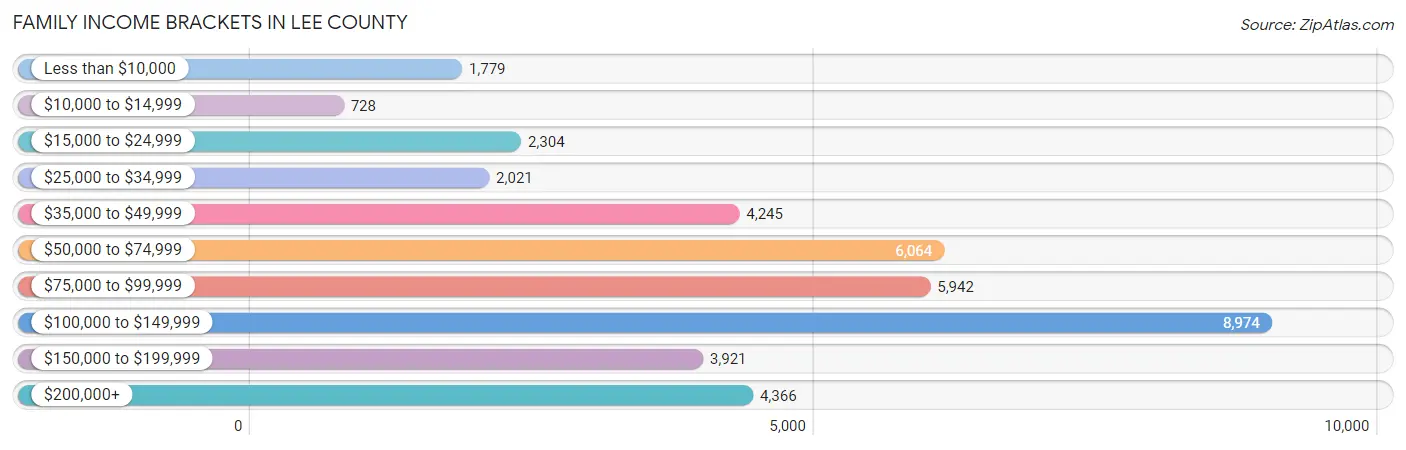
| Income Bracket | # Families | % Families |
| Less than $10,000 | 1,779 | 4.4% |
| $10,000 to $14,999 | 728 | 1.8% |
| $15,000 to $24,999 | 2,304 | 5.7% |
| $25,000 to $34,999 | 2,021 | 5.0% |
| $35,000 to $49,999 | 4,245 | 10.5% |
| $50,000 to $74,999 | 6,064 | 15.0% |
| $75,000 to $99,999 | 5,942 | 14.7% |
| $100,000 to $149,999 | 8,974 | 22.2% |
| $150,000 to $199,999 | 3,921 | 9.7% |
| $200,000+ | 4,366 | 10.8% |
Family Income by Famaliy Size in Lee County
6-person families (624 | 1.5%) account for the highest median family income in Lee County with $136,842 per family, while 2-person families (18,848 | 46.6%) have the highest median income of $36,794 per family member.
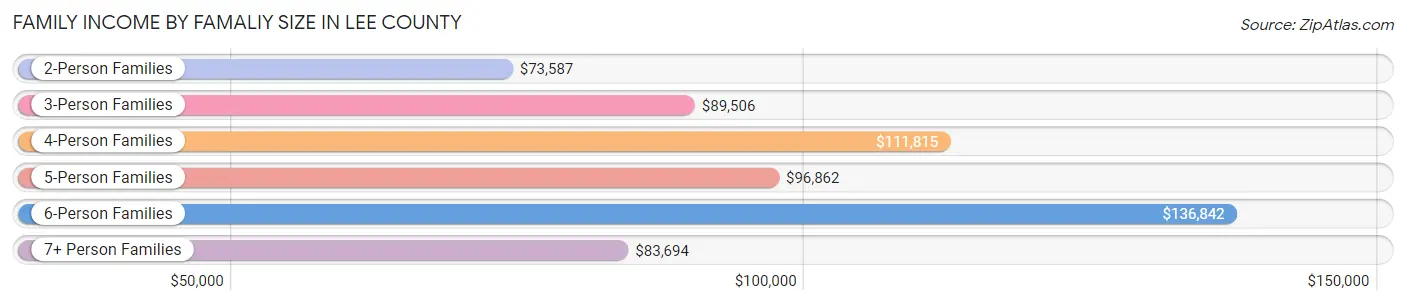
| Income Bracket | # Families | Median Income |
| 2-Person Families | 18,848 (46.6%) | $73,587 |
| 3-Person Families | 9,815 (24.3%) | $89,506 |
| 4-Person Families | 7,653 (18.9%) | $111,815 |
| 5-Person Families | 3,112 (7.7%) | $96,862 |
| 6-Person Families | 624 (1.5%) | $136,842 |
| 7+ Person Families | 373 (0.9%) | $83,694 |
| Total | 40,425 (100.0%) | $86,772 |
Family Income by Number of Earners in Lee County
The median family income in Lee County is $86,772, with families comprising 3+ earners (3,459) having the highest median family income of $135,015, while families with no earners (5,928) have the lowest median family income of $42,549, accounting for 8.6% and 14.7% of families, respectively.
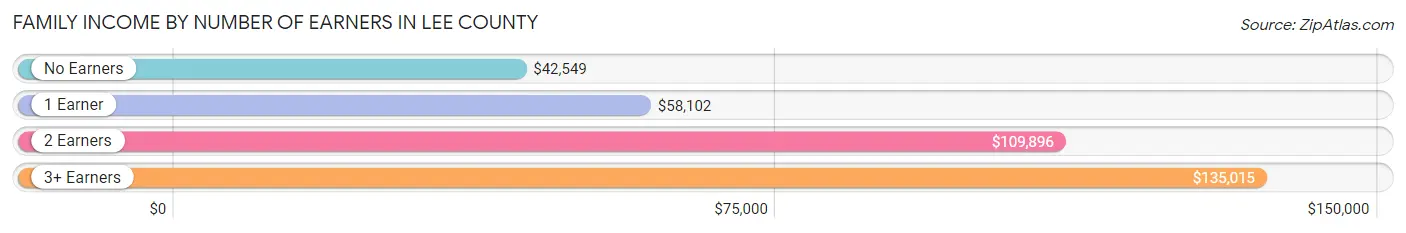
| Number of Earners | # Families | Median Income |
| No Earners | 5,928 (14.7%) | $42,549 |
| 1 Earner | 13,186 (32.6%) | $58,102 |
| 2 Earners | 17,852 (44.2%) | $109,896 |
| 3+ Earners | 3,459 (8.6%) | $135,015 |
| Total | 40,425 (100.0%) | $86,772 |
Household Income in Lee County
Household Income Brackets in Lee County
With 10,296 households falling in the category, the $100,000 to $149,999 income range is the most frequent in Lee County, accounting for 15.8% of all households. In contrast, only 3,128 households (4.8%) fall into the $10,000 to $14,999 income bracket, making it the least populous group.
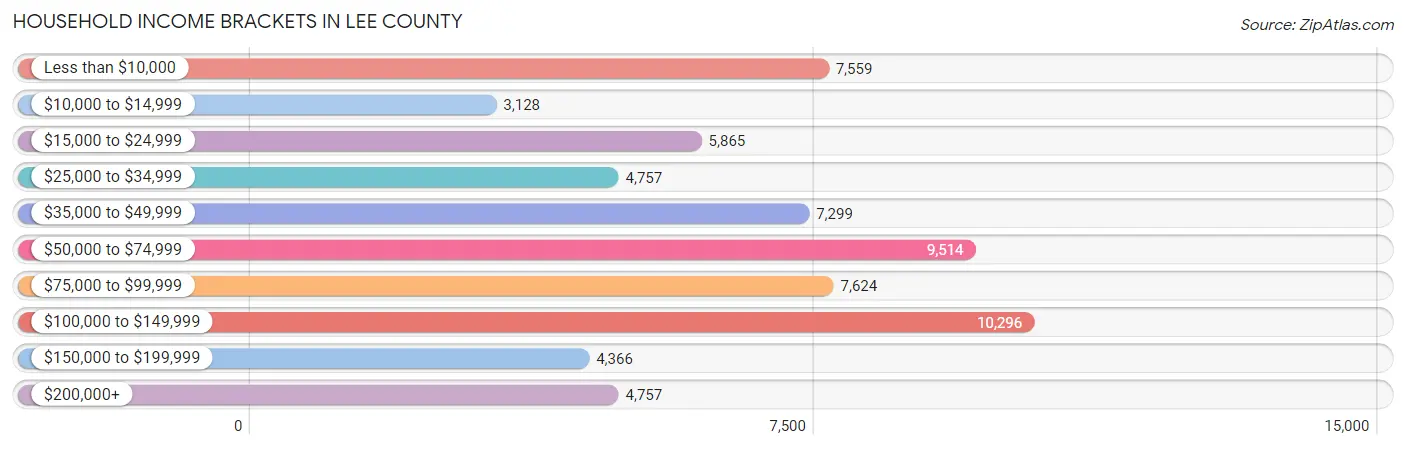
| Income Bracket | # Households | % Households |
| Less than $10,000 | 7,559 | 11.6% |
| $10,000 to $14,999 | 3,128 | 4.8% |
| $15,000 to $24,999 | 5,865 | 9.0% |
| $25,000 to $34,999 | 4,757 | 7.3% |
| $35,000 to $49,999 | 7,299 | 11.2% |
| $50,000 to $74,999 | 9,514 | 14.6% |
| $75,000 to $99,999 | 7,624 | 11.7% |
| $100,000 to $149,999 | 10,296 | 15.8% |
| $150,000 to $199,999 | 4,366 | 6.7% |
| $200,000+ | 4,757 | 7.3% |
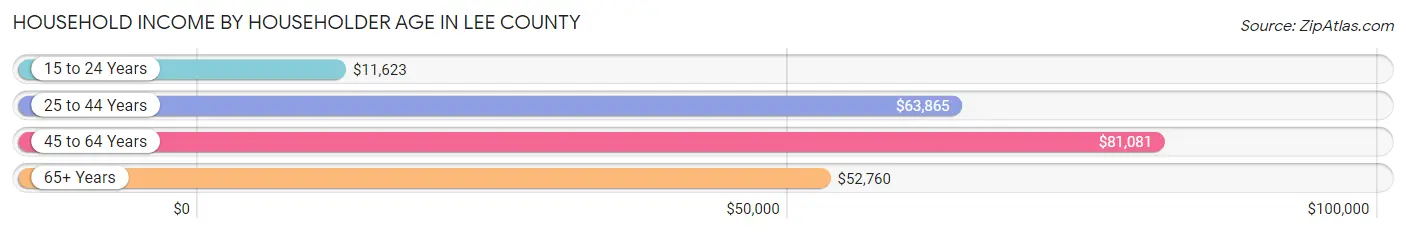
Household Income by Householder Age in Lee County
The median household income in Lee County is $59,288, with the highest median household income of $81,081 found in the 45 to 64 years age bracket for the primary householder. A total of 22,128 households (34.0%) fall into this category. Meanwhile, the 15 to 24 years age bracket for the primary householder has the lowest median household income of $11,623, with 6,930 households (10.6%) in this group.
| Income Bracket | # Households | Median Income |
| 15 to 24 Years | 6,930 (10.6%) | $11,623 |
| 25 to 44 Years | 22,511 (34.5%) | $63,865 |
| 45 to 64 Years | 22,128 (34.0%) | $81,081 |
| 65+ Years | 13,597 (20.9%) | $52,760 |
| Total | 65,166 (100.0%) | $59,288 |
Poverty in Lee County
Income Below Poverty by Sex and Age in Lee County
With 17.2% poverty level for males and 19.8% for females among the residents of Lee County, 18 to 24 year old males and 18 to 24 year old females are the most vulnerable to poverty, with 7,229 males (51.9%) and 5,735 females (52.2%) in their respective age groups living below the poverty level.
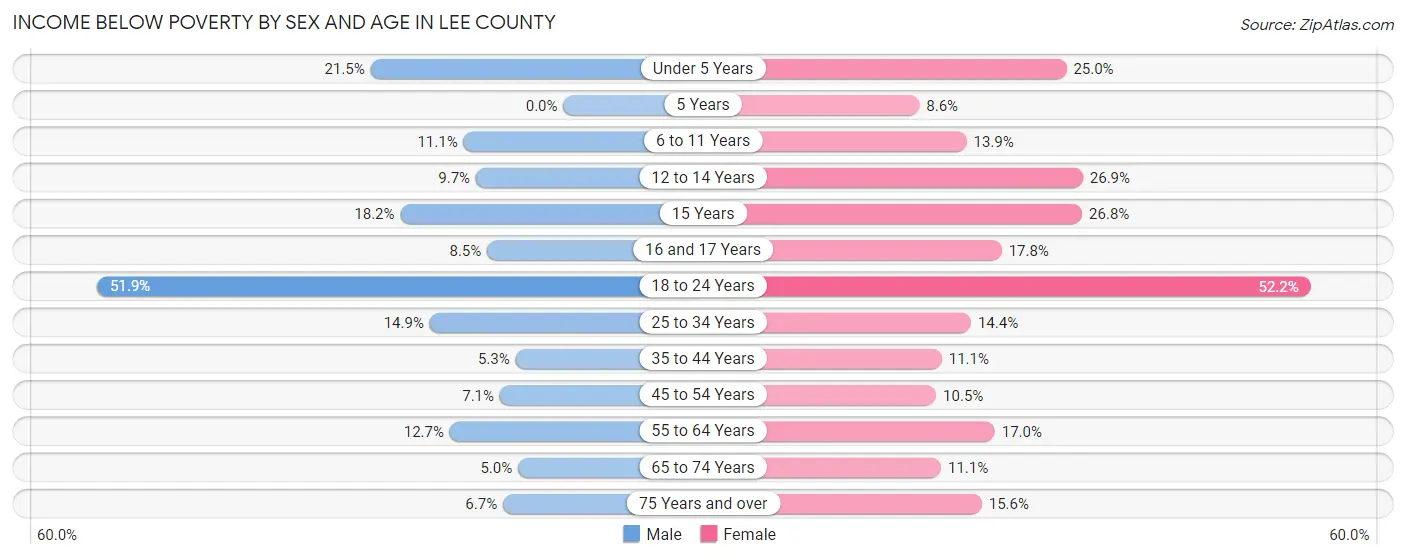
| Age Bracket | Male | Female |
| Under 5 Years | 1,041 (21.5%) | 1,168 (25.0%) |
| 5 Years | 0 (0.0%) | 70 (8.6%) |
| 6 to 11 Years | 693 (11.1%) | 765 (13.9%) |
| 12 to 14 Years | 338 (9.7%) | 989 (26.9%) |
| 15 Years | 179 (18.1%) | 231 (26.8%) |
| 16 and 17 Years | 197 (8.5%) | 368 (17.8%) |
| 18 to 24 Years | 7,229 (51.9%) | 5,735 (52.2%) |
| 25 to 34 Years | 1,772 (14.9%) | 1,712 (14.4%) |
| 35 to 44 Years | 549 (5.3%) | 1,230 (11.1%) |
| 45 to 54 Years | 702 (7.1%) | 1,085 (10.5%) |
| 55 to 64 Years | 1,174 (12.7%) | 1,679 (17.0%) |
| 65 to 74 Years | 326 (5.0%) | 809 (11.1%) |
| 75 Years and over | 233 (6.7%) | 729 (15.6%) |
| Total | 14,433 (17.2%) | 16,570 (19.8%) |
Income Above Poverty by Sex and Age in Lee County
According to the poverty statistics in Lee County, males aged 5 years and females aged 5 years are the age groups that are most secure financially, with 100.0% of males and 91.4% of females in these age groups living above the poverty line.
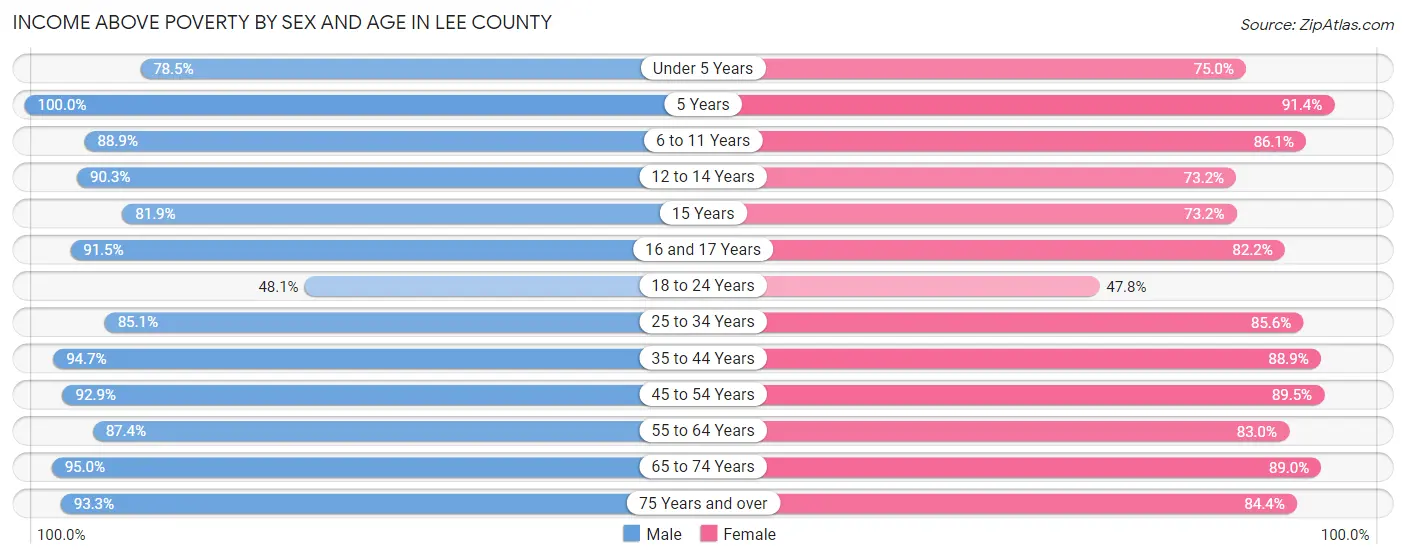
| Age Bracket | Male | Female |
| Under 5 Years | 3,808 (78.5%) | 3,500 (75.0%) |
| 5 Years | 753 (100.0%) | 740 (91.4%) |
| 6 to 11 Years | 5,537 (88.9%) | 4,741 (86.1%) |
| 12 to 14 Years | 3,134 (90.3%) | 2,694 (73.2%) |
| 15 Years | 807 (81.9%) | 632 (73.2%) |
| 16 and 17 Years | 2,124 (91.5%) | 1,698 (82.2%) |
| 18 to 24 Years | 6,688 (48.1%) | 5,250 (47.8%) |
| 25 to 34 Years | 10,136 (85.1%) | 10,186 (85.6%) |
| 35 to 44 Years | 9,778 (94.7%) | 9,812 (88.9%) |
| 45 to 54 Years | 9,221 (92.9%) | 9,242 (89.5%) |
| 55 to 64 Years | 8,103 (87.4%) | 8,172 (83.0%) |
| 65 to 74 Years | 6,142 (95.0%) | 6,513 (88.9%) |
| 75 Years and over | 3,232 (93.3%) | 3,947 (84.4%) |
| Total | 69,463 (82.8%) | 67,127 (80.2%) |
Income Below Poverty Among Married-Couple Families in Lee County
The poverty statistics for married-couple families in Lee County show that 4.5% or 1,392 of the total 30,855 families live below the poverty line. Families with 5 or more children have the highest poverty rate of 65.6%, comprising of 107 families. On the other hand, families with 1 or 2 children have the lowest poverty rate of 3.3%, which includes 361 families.
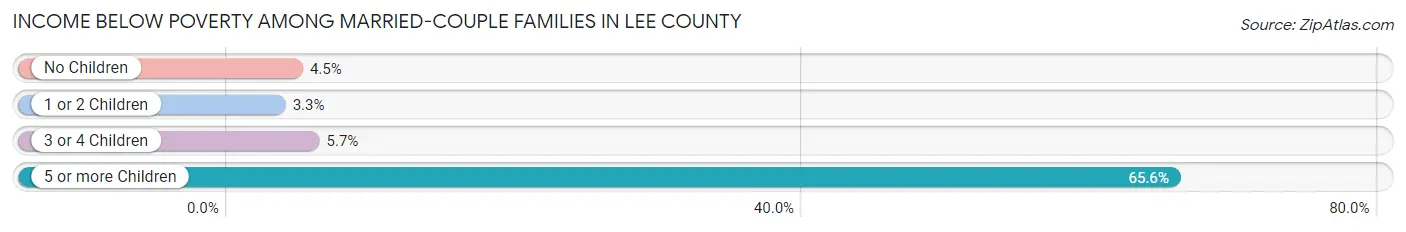
| Children | Above Poverty | Below Poverty |
| No Children | 16,592 (95.5%) | 785 (4.5%) |
| 1 or 2 Children | 10,507 (96.7%) | 361 (3.3%) |
| 3 or 4 Children | 2,308 (94.3%) | 139 (5.7%) |
| 5 or more Children | 56 (34.4%) | 107 (65.6%) |
| Total | 29,463 (95.5%) | 1,392 (4.5%) |
Income Below Poverty Among Single-Parent Households in Lee County
According to the poverty data in Lee County, 12.9% or 280 single-father households and 31.0% or 2,291 single-mother households are living below the poverty line. Among single-father households, those with no children have the highest poverty rate, with 185 households (17.0%) experiencing poverty. Likewise, among single-mother households, those with 3 or 4 children have the highest poverty rate, with 318 households (64.5%) falling below the poverty line.
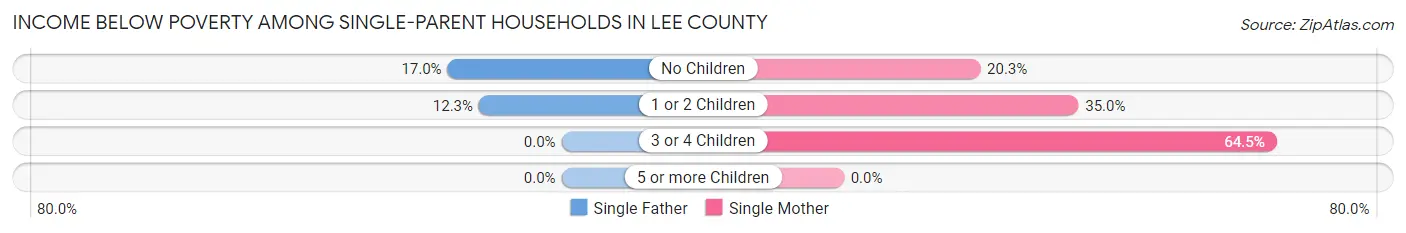
| Children | Single Father | Single Mother |
| No Children | 185 (17.0%) | 612 (20.3%) |
| 1 or 2 Children | 95 (12.3%) | 1,361 (35.0%) |
| 3 or 4 Children | 0 (0.0%) | 318 (64.5%) |
| 5 or more Children | 0 (0.0%) | 0 (0.0%) |
| Total | 280 (12.9%) | 2,291 (31.0%) |
Income Below Poverty Among Married-Couple vs Single-Parent Households in Lee County
The poverty data for Lee County shows that 1,392 of the married-couple family households (4.5%) and 2,571 of the single-parent households (26.9%) are living below the poverty level. Within the married-couple family households, those with 5 or more children have the highest poverty rate, with 107 households (65.6%) falling below the poverty line. Among the single-parent households, those with 3 or 4 children have the highest poverty rate, with 318 household (39.5%) living below poverty.
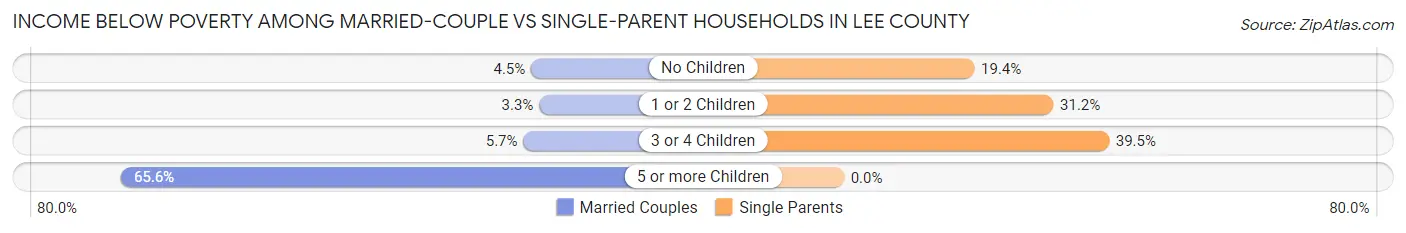
| Children | Married-Couple Families | Single-Parent Households |
| No Children | 785 (4.5%) | 797 (19.4%) |
| 1 or 2 Children | 361 (3.3%) | 1,456 (31.2%) |
| 3 or 4 Children | 139 (5.7%) | 318 (39.5%) |
| 5 or more Children | 107 (65.6%) | 0 (0.0%) |
| Total | 1,392 (4.5%) | 2,571 (26.9%) |
Race in Lee County
The most populous races in Lee County are White / Caucasian (120,255 | 68.7%), Black / African American (39,363 | 22.5%), and Asian (7,614 | 4.3%).
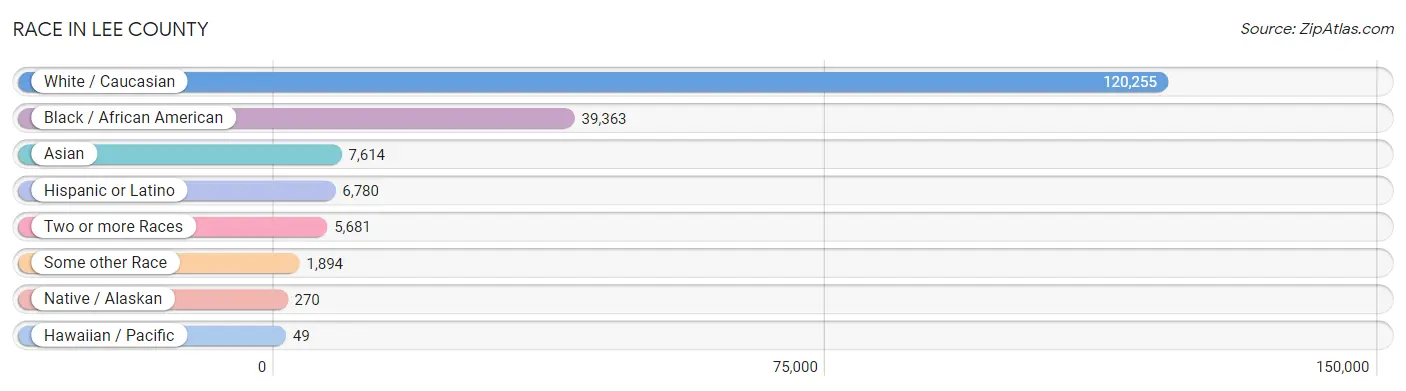
| Race | # Population | % Population |
| Asian | 7,614 | 4.3% |
| Black / African American | 39,363 | 22.5% |
| Hawaiian / Pacific | 49 | 0.0% |
| Hispanic or Latino | 6,780 | 3.9% |
| Native / Alaskan | 270 | 0.2% |
| White / Caucasian | 120,255 | 68.7% |
| Two or more Races | 5,681 | 3.2% |
| Some other Race | 1,894 | 1.1% |
| Total | 175,126 | 100.0% |
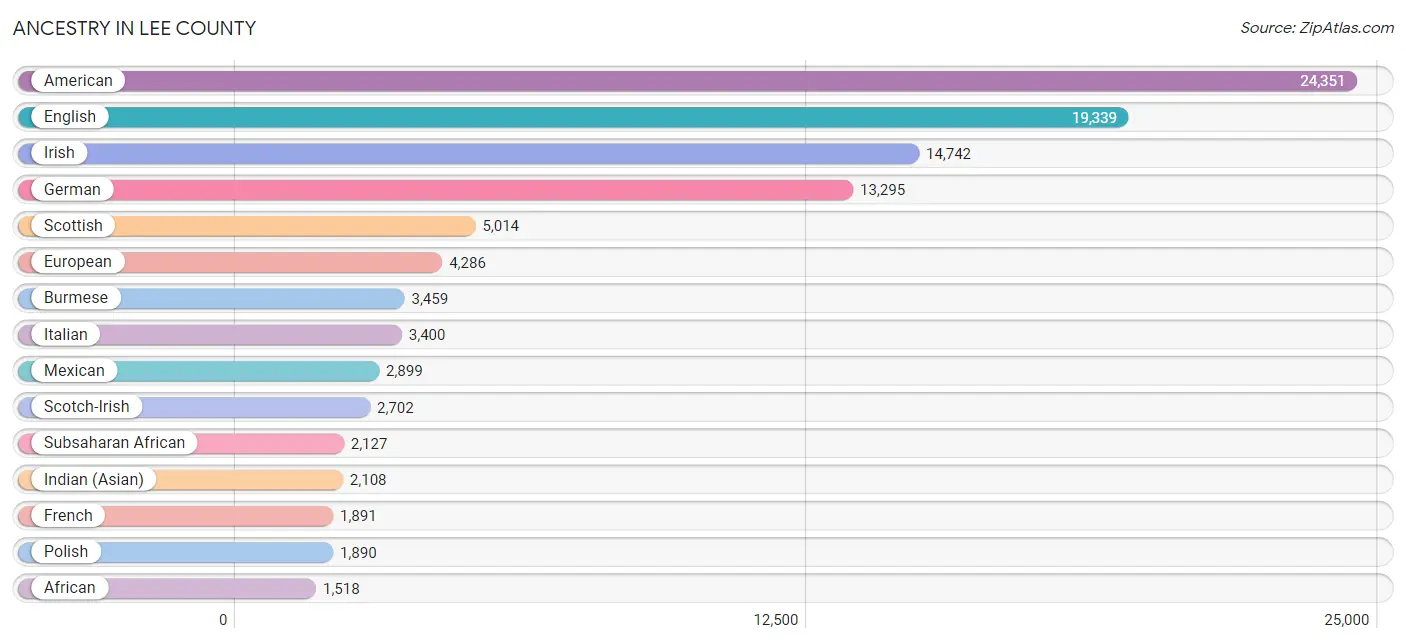
Ancestry in Lee County
The most populous ancestries reported in Lee County are American (24,351 | 13.9%), English (19,339 | 11.0%), Irish (14,742 | 8.4%), German (13,295 | 7.6%), and Scottish (5,014 | 2.9%), together accounting for 43.8% of all Lee County residents.
| Ancestry | # Population | % Population |
| African | 1,518 | 0.9% |
| American | 24,351 | 13.9% |
| Arab | 507 | 0.3% |
| Argentinean | 78 | 0.0% |
| Armenian | 50 | 0.0% |
| Australian | 19 | 0.0% |
| Austrian | 203 | 0.1% |
| Belgian | 16 | 0.0% |
| Bermudan | 18 | 0.0% |
| Bhutanese | 325 | 0.2% |
| Blackfeet | 164 | 0.1% |
| Bolivian | 21 | 0.0% |
| Brazilian | 140 | 0.1% |
| British | 961 | 0.5% |
| Burmese | 3,459 | 2.0% |
| Cajun | 8 | 0.0% |
| Canadian | 283 | 0.2% |
| Central American | 615 | 0.4% |
| Central American Indian | 93 | 0.1% |
| Cherokee | 393 | 0.2% |
| Chilean | 25 | 0.0% |
| Chippewa | 2 | 0.0% |
| Choctaw | 16 | 0.0% |
| Colombian | 281 | 0.2% |
| Costa Rican | 66 | 0.0% |
| Creek | 99 | 0.1% |
| Croatian | 32 | 0.0% |
| Cuban | 425 | 0.2% |
| Czech | 193 | 0.1% |
| Czechoslovakian | 9 | 0.0% |
| Danish | 332 | 0.2% |
| Dominican | 71 | 0.0% |
| Dutch | 1,079 | 0.6% |
| Dutch West Indian | 16 | 0.0% |
| Eastern European | 118 | 0.1% |
| Ecuadorian | 41 | 0.0% |
| Egyptian | 89 | 0.1% |
| English | 19,339 | 11.0% |
| European | 4,286 | 2.5% |
| Filipino | 29 | 0.0% |
| Finnish | 64 | 0.0% |
| French | 1,891 | 1.1% |
| French Canadian | 610 | 0.4% |
| German | 13,295 | 7.6% |
| German Russian | 39 | 0.0% |
| Ghanaian | 53 | 0.0% |
| Greek | 373 | 0.2% |
| Guamanian / Chamorro | 66 | 0.0% |
| Guatemalan | 215 | 0.1% |
| Guyanese | 10 | 0.0% |
| Haitian | 60 | 0.0% |
| Honduran | 82 | 0.1% |
| Hungarian | 227 | 0.1% |
| Indian (Asian) | 2,108 | 1.2% |
| Inupiat | 27 | 0.0% |
| Iranian | 153 | 0.1% |
| Irish | 14,742 | 8.4% |
| Italian | 3,400 | 1.9% |
| Jamaican | 149 | 0.1% |
| Korean | 412 | 0.2% |
| Laotian | 29 | 0.0% |
| Lebanese | 56 | 0.0% |
| Lithuanian | 13 | 0.0% |
| Malaysian | 65 | 0.0% |
| Mexican | 2,899 | 1.7% |
| Mexican American Indian | 7 | 0.0% |
| Mongolian | 5 | 0.0% |
| Moroccan | 14 | 0.0% |
| Native Hawaiian | 80 | 0.1% |
| Nicaraguan | 4 | 0.0% |
| Nigerian | 266 | 0.2% |
| Northern European | 113 | 0.1% |
| Norwegian | 1,131 | 0.6% |
| Ottawa | 1 | 0.0% |
| Pakistani | 93 | 0.1% |
| Panamanian | 141 | 0.1% |
| Peruvian | 357 | 0.2% |
| Polish | 1,890 | 1.1% |
| Portuguese | 191 | 0.1% |
| Puerto Rican | 1,035 | 0.6% |
| Romanian | 20 | 0.0% |
| Russian | 401 | 0.2% |
| Salvadoran | 107 | 0.1% |
| Scandinavian | 444 | 0.3% |
| Scotch-Irish | 2,702 | 1.5% |
| Scottish | 5,014 | 2.9% |
| Seminole | 121 | 0.1% |
| Slavic | 102 | 0.1% |
| Slovak | 287 | 0.2% |
| South American | 827 | 0.5% |
| South American Indian | 56 | 0.0% |
| Spaniard | 64 | 0.0% |
| Spanish | 116 | 0.1% |
| Sri Lankan | 419 | 0.2% |
| Subsaharan African | 2,127 | 1.2% |
| Swedish | 1,077 | 0.6% |
| Swiss | 283 | 0.2% |
| Syrian | 13 | 0.0% |
| Thai | 1,187 | 0.7% |
| Turkish | 220 | 0.1% |
| U.S. Virgin Islander | 22 | 0.0% |
| Ukrainian | 89 | 0.1% |
| Venezuelan | 24 | 0.0% |
| Vietnamese | 105 | 0.1% |
| Welsh | 647 | 0.4% |
| West Indian | 10 | 0.0% | View All 106 Rows |
Immigrants in Lee County
The most numerous immigrant groups reported in Lee County came from Asia (5,973 | 3.4%), Eastern Asia (4,106 | 2.3%), Korea (2,771 | 1.6%), Latin America (2,168 | 1.2%), and Central America (1,245 | 0.7%), together accounting for 9.3% of all Lee County residents.
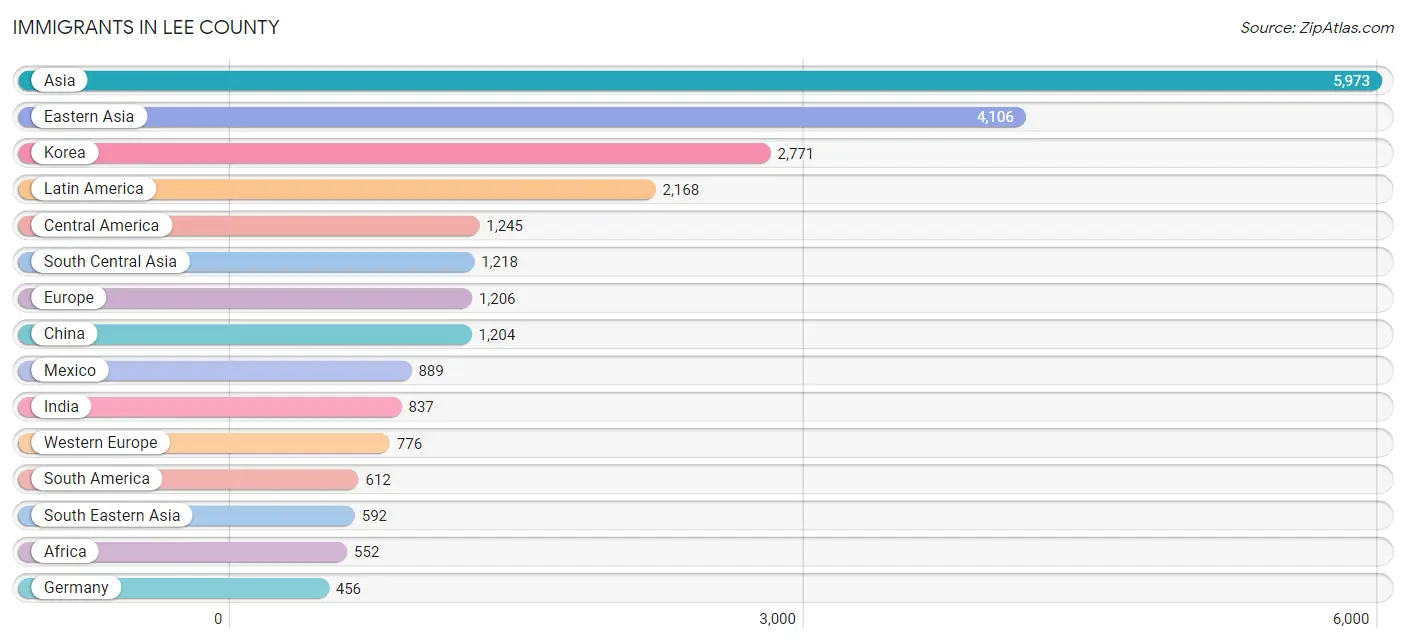
| Immigration Origin | # Population | % Population |
| Africa | 552 | 0.3% |
| Armenia | 19 | 0.0% |
| Asia | 5,973 | 3.4% |
| Austria | 60 | 0.0% |
| Bahamas | 22 | 0.0% |
| Bangladesh | 127 | 0.1% |
| Belize | 9 | 0.0% |
| Bolivia | 2 | 0.0% |
| Brazil | 185 | 0.1% |
| Cameroon | 77 | 0.0% |
| Canada | 85 | 0.1% |
| Caribbean | 311 | 0.2% |
| Central America | 1,245 | 0.7% |
| Chile | 25 | 0.0% |
| China | 1,204 | 0.7% |
| Colombia | 191 | 0.1% |
| Costa Rica | 35 | 0.0% |
| Croatia | 31 | 0.0% |
| Cuba | 23 | 0.0% |
| Czechoslovakia | 13 | 0.0% |
| Dominican Republic | 71 | 0.0% |
| Eastern Africa | 151 | 0.1% |
| Eastern Asia | 4,106 | 2.3% |
| Eastern Europe | 156 | 0.1% |
| Ecuador | 41 | 0.0% |
| Egypt | 54 | 0.0% |
| El Salvador | 56 | 0.0% |
| England | 89 | 0.1% |
| Europe | 1,206 | 0.7% |
| France | 244 | 0.1% |
| Germany | 456 | 0.3% |
| Ghana | 41 | 0.0% |
| Guatemala | 182 | 0.1% |
| Guyana | 24 | 0.0% |
| Honduras | 10 | 0.0% |
| Hong Kong | 22 | 0.0% |
| India | 837 | 0.5% |
| Indonesia | 17 | 0.0% |
| Iran | 111 | 0.1% |
| Italy | 29 | 0.0% |
| Jamaica | 146 | 0.1% |
| Japan | 117 | 0.1% |
| Korea | 2,771 | 1.6% |
| Laos | 19 | 0.0% |
| Latin America | 2,168 | 1.2% |
| Malaysia | 5 | 0.0% |
| Mexico | 889 | 0.5% |
| Middle Africa | 145 | 0.1% |
| Nepal | 48 | 0.0% |
| Netherlands | 16 | 0.0% |
| Nicaragua | 24 | 0.0% |
| Nigeria | 77 | 0.0% |
| Northern Africa | 54 | 0.0% |
| Northern Europe | 214 | 0.1% |
| Pakistan | 85 | 0.1% |
| Panama | 40 | 0.0% |
| Peru | 127 | 0.1% |
| Philippines | 148 | 0.1% |
| Poland | 5 | 0.0% |
| Russia | 95 | 0.1% |
| Saudi Arabia | 38 | 0.0% |
| Scotland | 29 | 0.0% |
| Singapore | 18 | 0.0% |
| South Africa | 40 | 0.0% |
| South America | 612 | 0.4% |
| South Central Asia | 1,218 | 0.7% |
| South Eastern Asia | 592 | 0.3% |
| Southern Europe | 34 | 0.0% |
| Spain | 5 | 0.0% |
| Sri Lanka | 10 | 0.0% |
| Sweden | 10 | 0.0% |
| Taiwan | 41 | 0.0% |
| Thailand | 92 | 0.1% |
| Trinidad and Tobago | 39 | 0.0% |
| Ukraine | 12 | 0.0% |
| Venezuela | 17 | 0.0% |
| Vietnam | 293 | 0.2% |
| Western Africa | 162 | 0.1% |
| Western Asia | 57 | 0.0% |
| Western Europe | 776 | 0.4% |
| Zaire | 68 | 0.0% |
| Zimbabwe | 31 | 0.0% | View All 82 Rows |
Sex and Age in Lee County
Sex and Age in Lee County
The most populous age groups in Lee County are 20 to 24 Years (11,611 | 13.4%) for men and 20 to 24 Years (10,352 | 11.7%) for women.
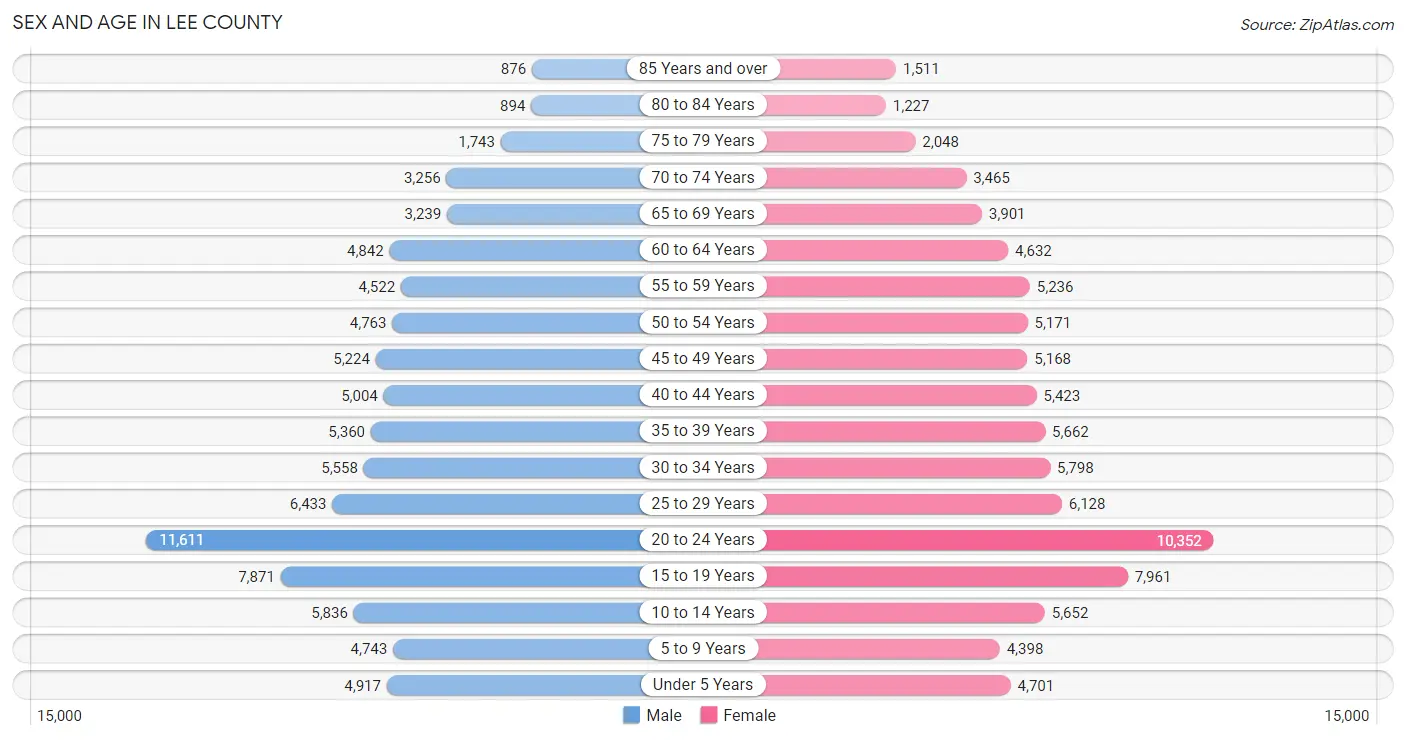
| Age Bracket | Male | Female |
| Under 5 Years | 4,917 (5.7%) | 4,701 (5.3%) |
| 5 to 9 Years | 4,743 (5.5%) | 4,398 (5.0%) |
| 10 to 14 Years | 5,836 (6.7%) | 5,652 (6.4%) |
| 15 to 19 Years | 7,871 (9.1%) | 7,961 (9.0%) |
| 20 to 24 Years | 11,611 (13.4%) | 10,352 (11.7%) |
| 25 to 29 Years | 6,433 (7.4%) | 6,128 (6.9%) |
| 30 to 34 Years | 5,558 (6.4%) | 5,798 (6.6%) |
| 35 to 39 Years | 5,360 (6.2%) | 5,662 (6.4%) |
| 40 to 44 Years | 5,004 (5.8%) | 5,423 (6.1%) |
| 45 to 49 Years | 5,224 (6.0%) | 5,168 (5.8%) |
| 50 to 54 Years | 4,763 (5.5%) | 5,171 (5.9%) |
| 55 to 59 Years | 4,522 (5.2%) | 5,236 (5.9%) |
| 60 to 64 Years | 4,842 (5.6%) | 4,632 (5.2%) |
| 65 to 69 Years | 3,239 (3.7%) | 3,901 (4.4%) |
| 70 to 74 Years | 3,256 (3.8%) | 3,465 (3.9%) |
| 75 to 79 Years | 1,743 (2.0%) | 2,048 (2.3%) |
| 80 to 84 Years | 894 (1.0%) | 1,227 (1.4%) |
| 85 Years and over | 876 (1.0%) | 1,511 (1.7%) |
| Total | 86,692 (100.0%) | 88,434 (100.0%) |
Families and Households in Lee County
Median Family Size in Lee County
The median family size in Lee County is 3.21 persons per family, with single female/mother families (7,397 | 18.3%) accounting for the largest median family size of 3.31 persons per family. On the other hand, single male/father families (2,173 | 5.4%) represent the smallest median family size with 2.91 persons per family.
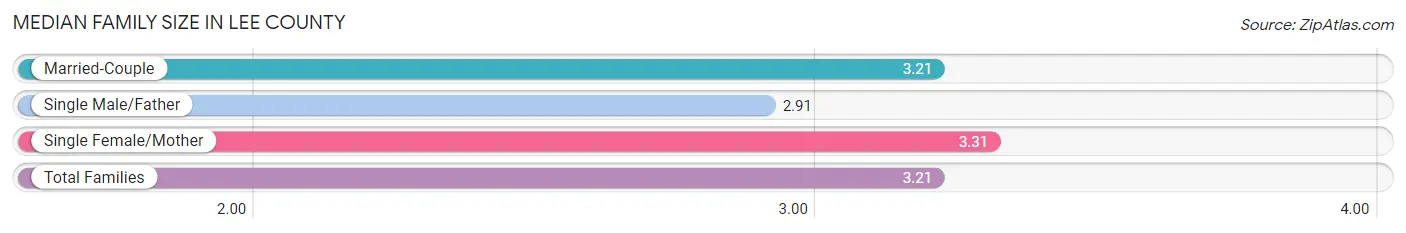
| Family Type | # Families | Family Size |
| Married-Couple | 30,855 (76.3%) | 3.21 |
| Single Male/Father | 2,173 (5.4%) | 2.91 |
| Single Female/Mother | 7,397 (18.3%) | 3.31 |
| Total Families | 40,425 (100.0%) | 3.21 |
Median Household Size in Lee County
The median household size in Lee County is 2.57 persons per household, with single female/mother households (7,397 | 11.4%) accounting for the largest median household size of 3.49 persons per household. non-family households (24,741 | 38.0%) represent the smallest median household size with 1.42 persons per household.
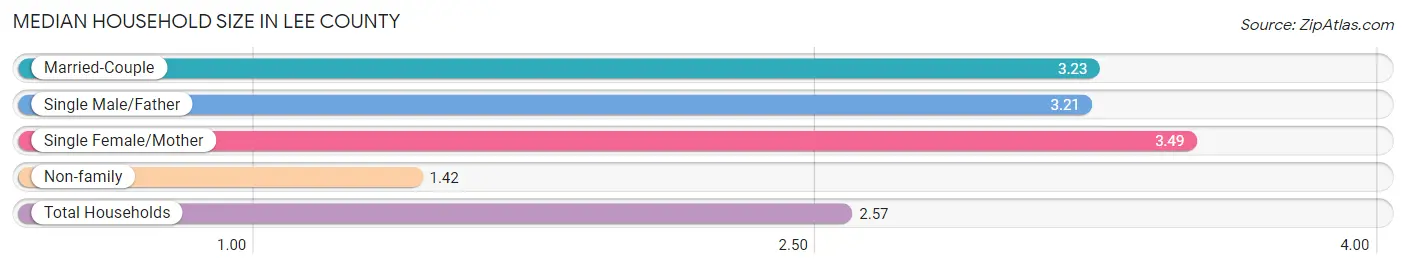
| Household Type | # Households | Household Size |
| Married-Couple | 30,855 (47.3%) | 3.23 |
| Single Male/Father | 2,173 (3.3%) | 3.21 |
| Single Female/Mother | 7,397 (11.4%) | 3.49 |
| Non-family | 24,741 (38.0%) | 1.42 |
| Total Households | 65,166 (100.0%) | 2.57 |
Household Size by Marriage Status in Lee County
Out of a total of 65,166 households in Lee County, 40,425 (62.0%) are family households, while 24,741 (38.0%) are nonfamily households. The most numerous type of family households are 2-person households, comprising 18,032, and the most common type of nonfamily households are 1-person households, comprising 19,408.
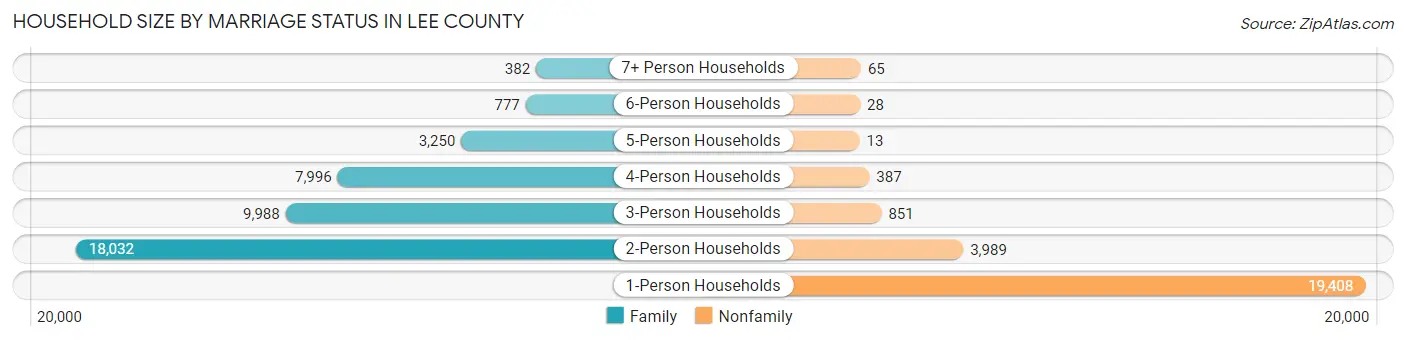
| Household Size | Family Households | Nonfamily Households |
| 1-Person Households | - | 19,408 (29.8%) |
| 2-Person Households | 18,032 (27.7%) | 3,989 (6.1%) |
| 3-Person Households | 9,988 (15.3%) | 851 (1.3%) |
| 4-Person Households | 7,996 (12.3%) | 387 (0.6%) |
| 5-Person Households | 3,250 (5.0%) | 13 (0.0%) |
| 6-Person Households | 777 (1.2%) | 28 (0.0%) |
| 7+ Person Households | 382 (0.6%) | 65 (0.1%) |
| Total | 40,425 (62.0%) | 24,741 (38.0%) |
Female Fertility in Lee County
Fertility by Age in Lee County
Average fertility rate in Lee County is 36.0 births per 1,000 women. Women in the age bracket of 20 to 34 years have the highest fertility rate with 51.0 births per 1,000 women. Women in the age bracket of 20 to 34 years acount for 66.8% of all women with births.
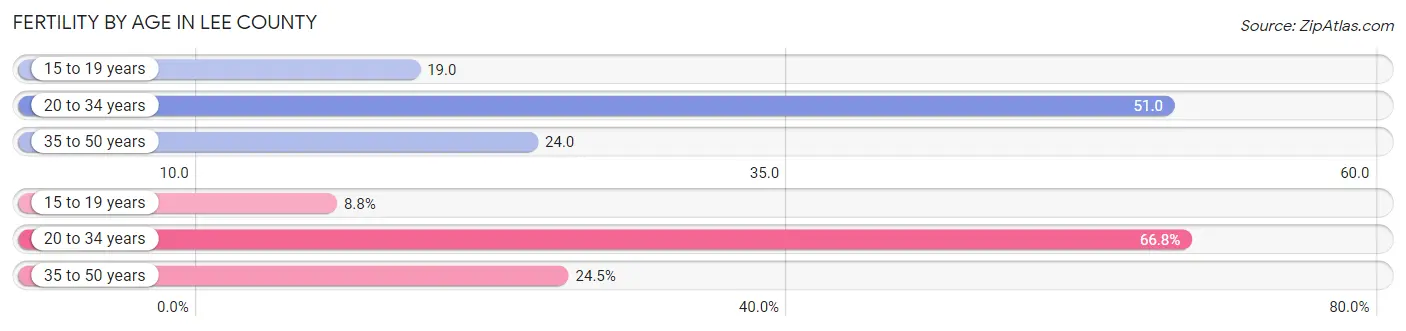
| Age Bracket | Women with Births | Births / 1,000 Women |
| 15 to 19 years | 148 (8.7%) | 19.0 |
| 20 to 34 years | 1,130 (66.8%) | 51.0 |
| 35 to 50 years | 414 (24.5%) | 24.0 |
| Total | 1,692 (100.0%) | 36.0 |
Fertility by Age by Marriage Status in Lee County
71.4% of women with births (1,692) in Lee County are married. The highest percentage of unmarried women with births falls into 15 to 19 years age bracket with 100.0% of them unmarried at the time of birth, while the lowest percentage of unmarried women with births belong to 35 to 50 years age bracket with 2.2% of them unmarried.
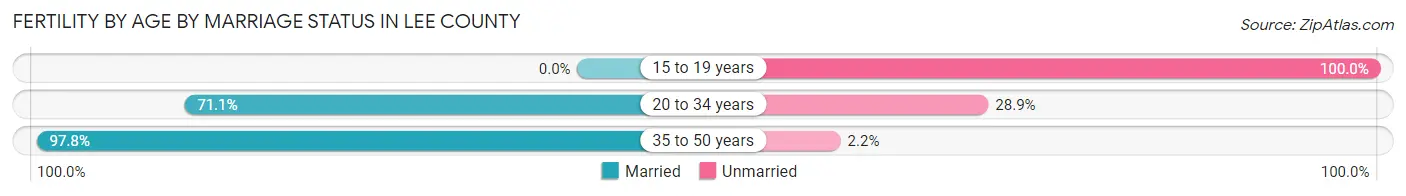
| Age Bracket | Married | Unmarried |
| 15 to 19 years | 0 (0.0%) | 148 (100.0%) |
| 20 to 34 years | 803 (71.1%) | 327 (28.9%) |
| 35 to 50 years | 405 (97.8%) | 9 (2.2%) |
| Total | 1,208 (71.4%) | 484 (28.6%) |
Fertility by Education in Lee County
Average fertility rate in Lee County is 36.0 births per 1,000 women. Women with the education attainment of bachelor's degree have the highest fertility rate of 45.0 births per 1,000 women, while women with the education attainment of high school diploma have the lowest fertility at 21.0 births per 1,000 women. Women with the education attainment of college or associate's degree represent 36.2% of all women with births.
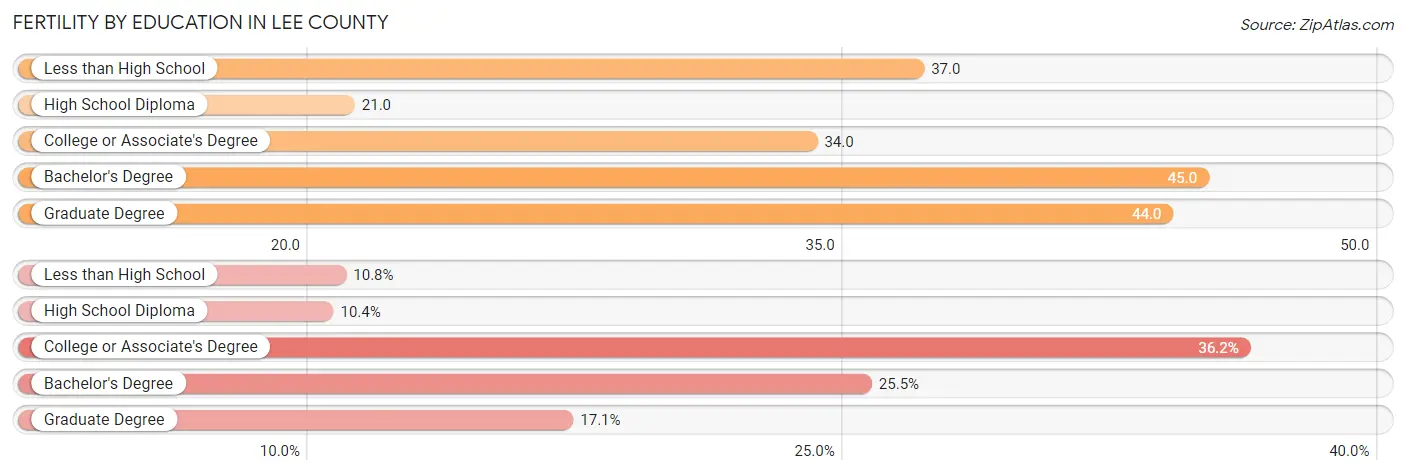
| Educational Attainment | Women with Births | Births / 1,000 Women |
| Less than High School | 182 (10.8%) | 37.0 |
| High School Diploma | 176 (10.4%) | 21.0 |
| College or Associate's Degree | 612 (36.2%) | 34.0 |
| Bachelor's Degree | 432 (25.5%) | 45.0 |
| Graduate Degree | 290 (17.1%) | 44.0 |
| Total | 1,692 (100.0%) | 36.0 |
Fertility by Education by Marriage Status in Lee County
28.6% of women with births in Lee County are unmarried. Women with the educational attainment of graduate degree are most likely to be married with 100.0% of them married at childbirth, while women with the educational attainment of less than high school are least likely to be married with 100.0% of them unmarried at childbirth.
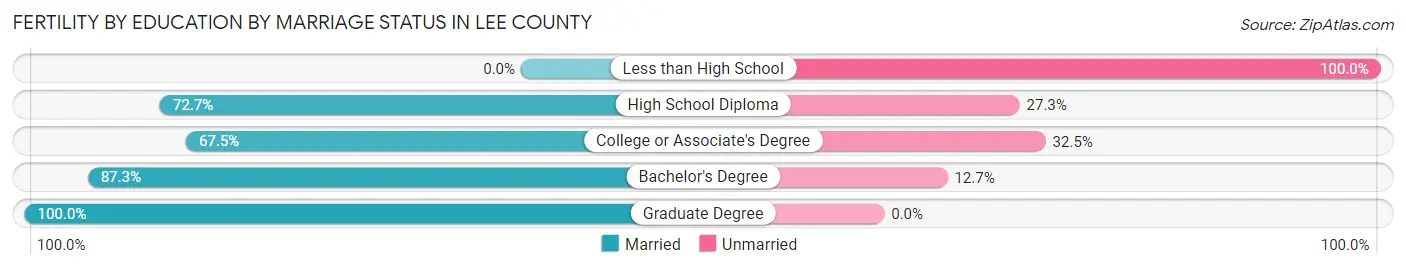
| Educational Attainment | Married | Unmarried |
| Less than High School | 0 (0.0%) | 182 (100.0%) |
| High School Diploma | 128 (72.7%) | 48 (27.3%) |
| College or Associate's Degree | 413 (67.5%) | 199 (32.5%) |
| Bachelor's Degree | 377 (87.3%) | 55 (12.7%) |
| Graduate Degree | 290 (100.0%) | 0 (0.0%) |
| Total | 1,208 (71.4%) | 484 (28.6%) |
Employment Characteristics in Lee County
Employment by Class of Employer in Lee County
Among the 80,729 employed individuals in Lee County, private company employees (51,377 | 63.6%), state government employees (8,268 | 10.2%), and local government employees (6,046 | 7.5%) make up the most common classes of employment.
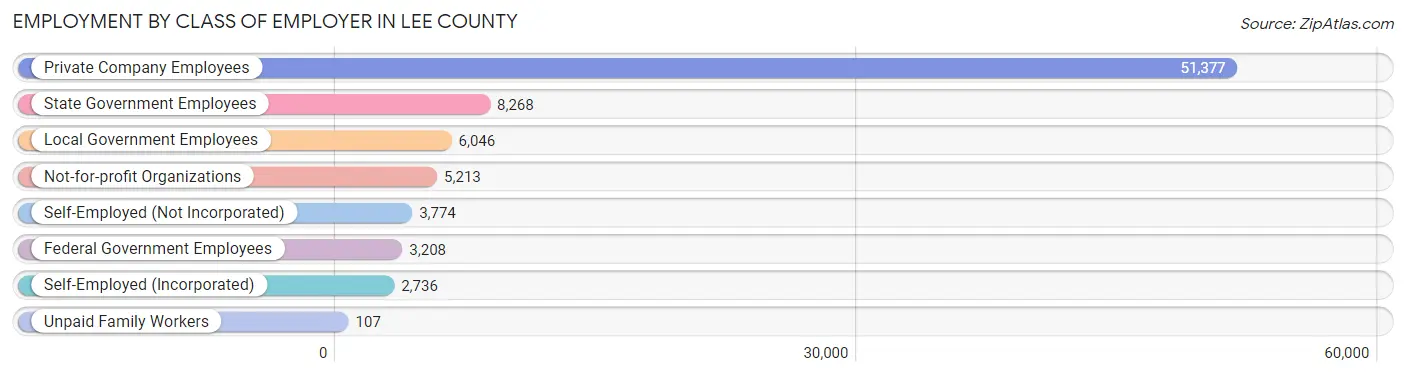
| Employer Class | # Employees | % Employees |
| Private Company Employees | 51,377 | 63.6% |
| Self-Employed (Incorporated) | 2,736 | 3.4% |
| Self-Employed (Not Incorporated) | 3,774 | 4.7% |
| Not-for-profit Organizations | 5,213 | 6.5% |
| Local Government Employees | 6,046 | 7.5% |
| State Government Employees | 8,268 | 10.2% |
| Federal Government Employees | 3,208 | 4.0% |
| Unpaid Family Workers | 107 | 0.1% |
| Total | 80,729 | 100.0% |
Employment Status by Age in Lee County
According to the labor force statistics for Lee County, out of the total population over 16 years of age (143,029), 59.6% or 85,245 individuals are in the labor force, with 3.8% or 3,239 of them unemployed. The age group with the highest labor force participation rate is 30 to 34 years, with 84.6% or 9,607 individuals in the labor force. Within the labor force, the 16 to 19 years age range has the highest percentage of unemployed individuals, with 9.0% or 383 of them being unemployed.
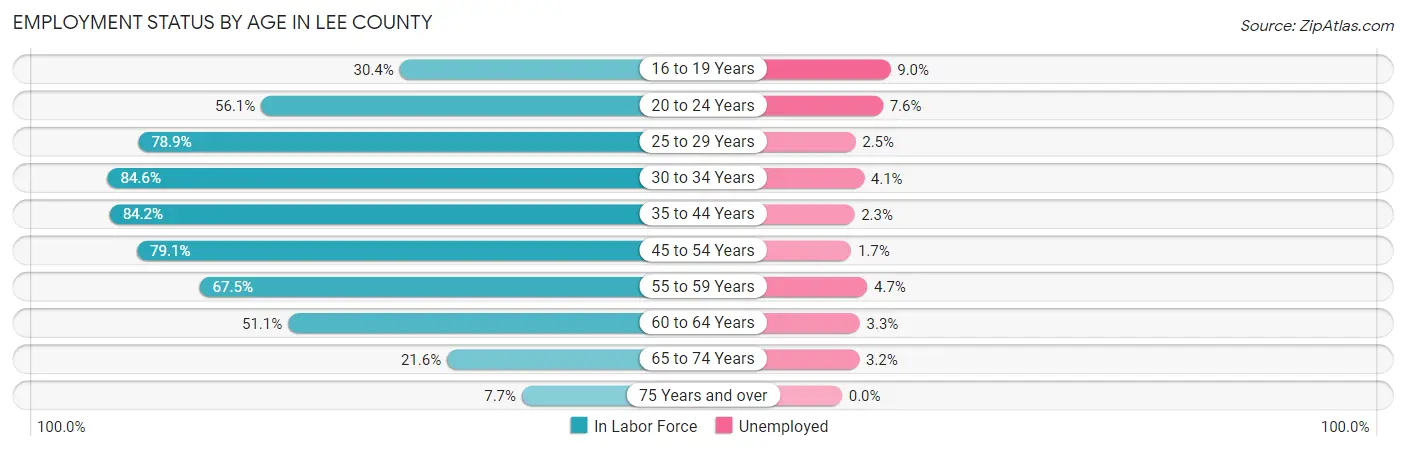
| Age Bracket | In Labor Force | Unemployed |
| 16 to 19 Years | 4,251 (30.4%) | 383 (9.0%) |
| 20 to 24 Years | 12,321 (56.1%) | 936 (7.6%) |
| 25 to 29 Years | 9,911 (78.9%) | 248 (2.5%) |
| 30 to 34 Years | 9,607 (84.6%) | 394 (4.1%) |
| 35 to 44 Years | 18,060 (84.2%) | 415 (2.3%) |
| 45 to 54 Years | 16,078 (79.1%) | 273 (1.7%) |
| 55 to 59 Years | 6,587 (67.5%) | 310 (4.7%) |
| 60 to 64 Years | 4,841 (51.1%) | 160 (3.3%) |
| 65 to 74 Years | 2,994 (21.6%) | 96 (3.2%) |
| 75 Years and over | 639 (7.7%) | 0 (0.0%) |
| Total | 85,245 (59.6%) | 3,239 (3.8%) |
Employment Status by Educational Attainment in Lee County
According to labor force statistics for Lee County, 76.6% of individuals (65,052) out of the total population between 25 and 64 years of age (84,924) are in the labor force, with 2.8% or 1,821 of them being unemployed. The group with the highest labor force participation rate are those with the educational attainment of bachelor's degree or higher, with 85.4% or 30,306 individuals in the labor force. Within the labor force, individuals with less than high school education have the highest percentage of unemployment, with 5.2% or 164 of them being unemployed.
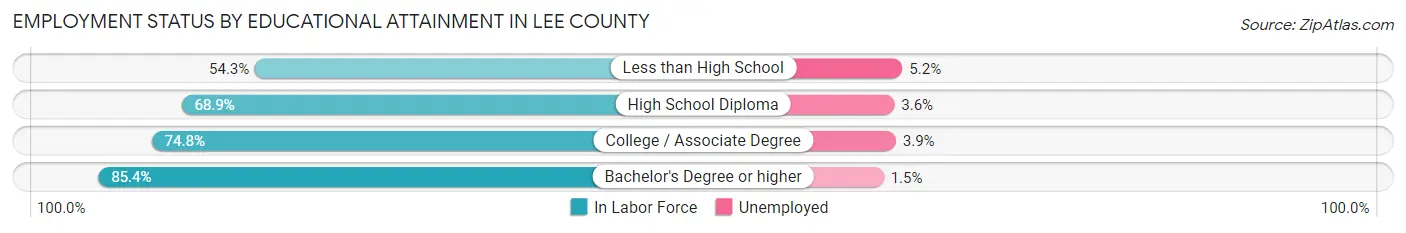
| Educational Attainment | In Labor Force | Unemployed |
| Less than High School | 3,160 (54.3%) | 303 (5.2%) |
| High School Diploma | 11,646 (68.9%) | 609 (3.6%) |
| College / Associate Degree | 19,983 (74.8%) | 1,042 (3.9%) |
| Bachelor's Degree or higher | 30,306 (85.4%) | 532 (1.5%) |
| Total | 65,052 (76.6%) | 2,378 (2.8%) |
Employment Occupations by Sex in Lee County
Management, Business, Science and Arts Occupations
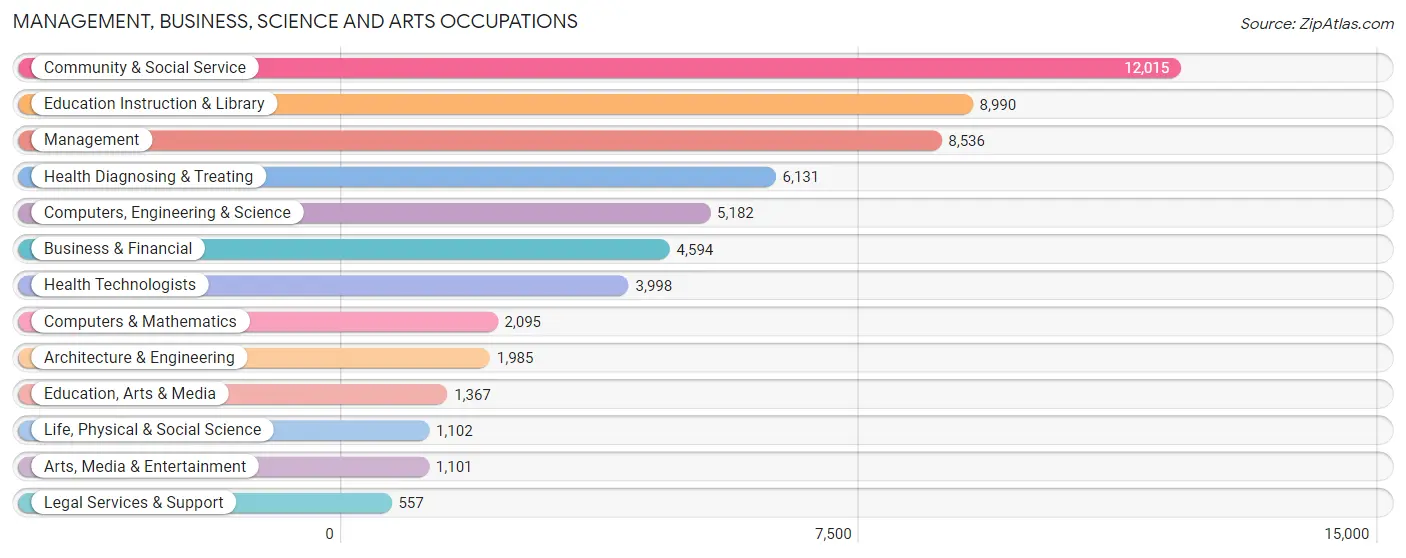
The most common Management, Business, Science and Arts occupations in Lee County are Community & Social Service (12,015 | 14.8%), Education Instruction & Library (8,990 | 11.0%), Management (8,536 | 10.5%), Health Diagnosing & Treating (6,131 | 7.5%), and Computers, Engineering & Science (5,182 | 6.4%).
Management, Business, Science and Arts Occupations by Sex
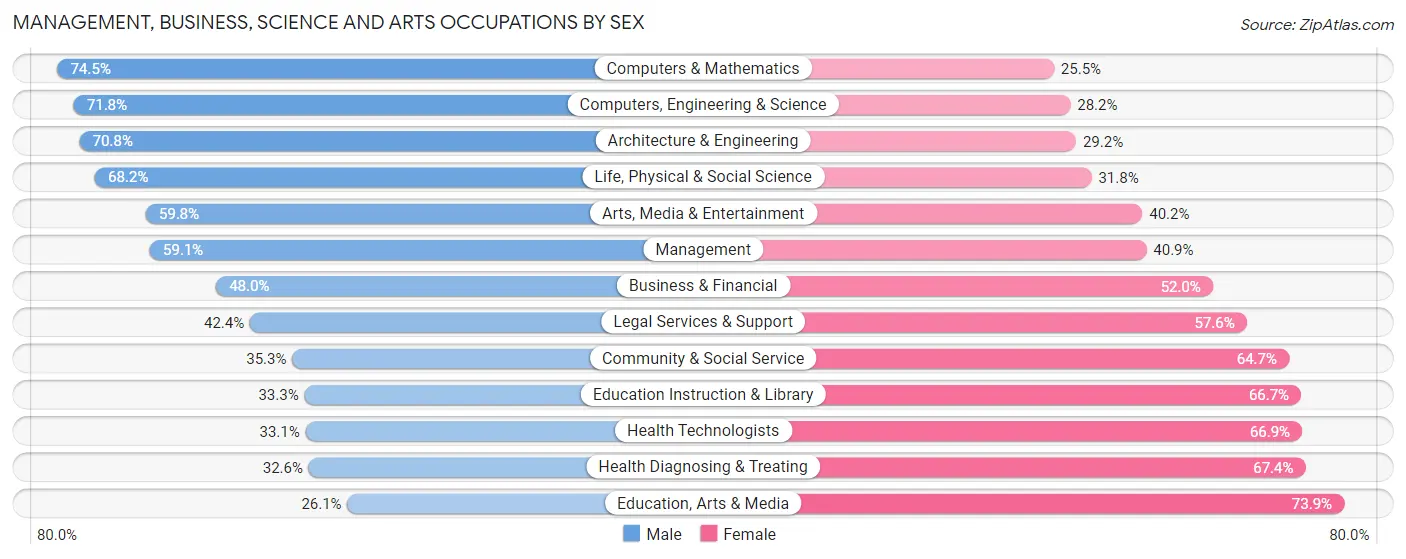
Within the Management, Business, Science and Arts occupations in Lee County, the most male-oriented occupations are Computers & Mathematics (74.5%), Computers, Engineering & Science (71.8%), and Architecture & Engineering (70.8%), while the most female-oriented occupations are Education, Arts & Media (73.9%), Health Diagnosing & Treating (67.4%), and Health Technologists (66.9%).
| Occupation | Male | Female |
| Management | 5,043 (59.1%) | 3,493 (40.9%) |
| Business & Financial | 2,206 (48.0%) | 2,388 (52.0%) |
| Computers, Engineering & Science | 3,719 (71.8%) | 1,463 (28.2%) |
| Computers & Mathematics | 1,561 (74.5%) | 534 (25.5%) |
| Architecture & Engineering | 1,406 (70.8%) | 579 (29.2%) |
| Life, Physical & Social Science | 752 (68.2%) | 350 (31.8%) |
| Community & Social Service | 4,244 (35.3%) | 7,771 (64.7%) |
| Education, Arts & Media | 357 (26.1%) | 1,010 (73.9%) |
| Legal Services & Support | 236 (42.4%) | 321 (57.6%) |
| Education Instruction & Library | 2,993 (33.3%) | 5,997 (66.7%) |
| Arts, Media & Entertainment | 658 (59.8%) | 443 (40.2%) |
| Health Diagnosing & Treating | 1,997 (32.6%) | 4,134 (67.4%) |
| Health Technologists | 1,324 (33.1%) | 2,674 (66.9%) |
| Total (Category) | 17,209 (47.2%) | 19,249 (52.8%) |
| Total (Overall) | 42,660 (52.4%) | 38,749 (47.6%) |
Services Occupations
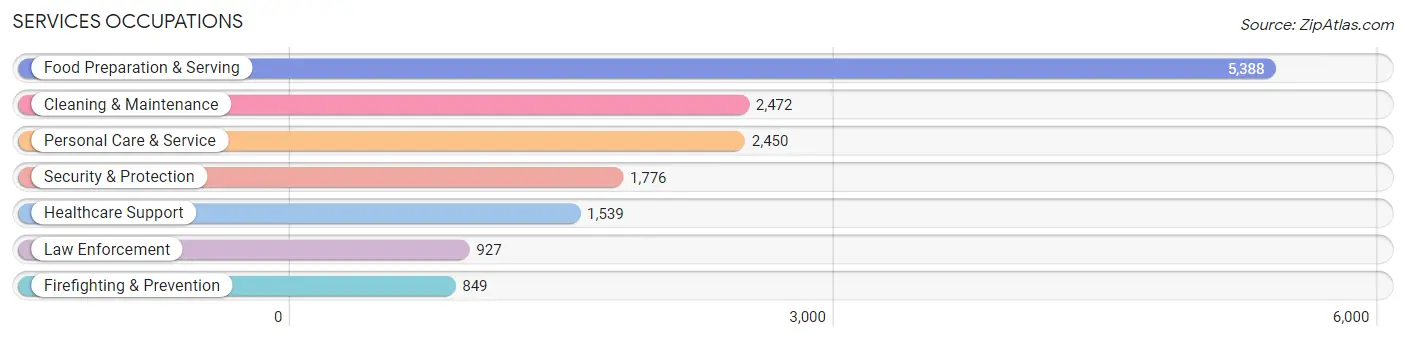
The most common Services occupations in Lee County are Food Preparation & Serving (5,388 | 6.6%), Cleaning & Maintenance (2,472 | 3.0%), Personal Care & Service (2,450 | 3.0%), Security & Protection (1,776 | 2.2%), and Healthcare Support (1,539 | 1.9%).
Services Occupations by Sex
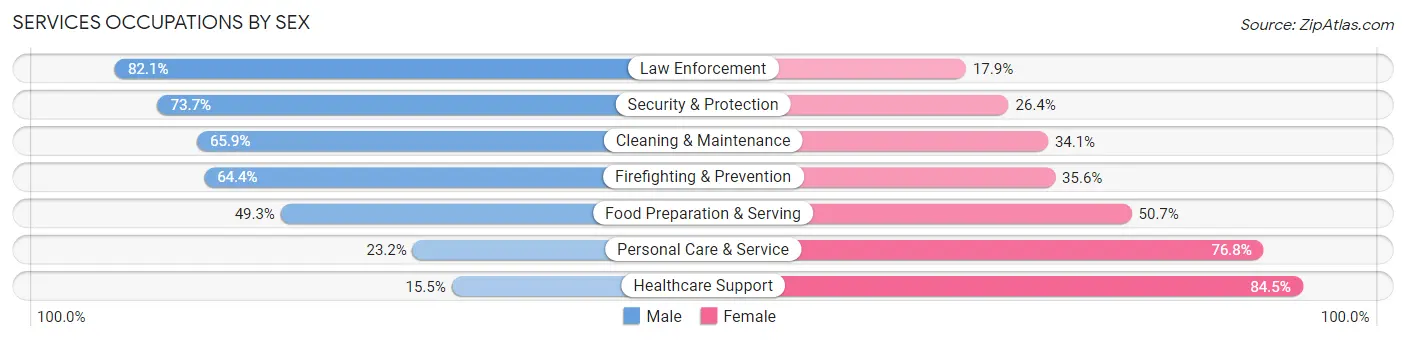
Within the Services occupations in Lee County, the most male-oriented occupations are Law Enforcement (82.1%), Security & Protection (73.7%), and Cleaning & Maintenance (65.9%), while the most female-oriented occupations are Healthcare Support (84.5%), Personal Care & Service (76.8%), and Food Preparation & Serving (50.7%).
| Occupation | Male | Female |
| Healthcare Support | 238 (15.5%) | 1,301 (84.5%) |
| Security & Protection | 1,308 (73.7%) | 468 (26.4%) |
| Firefighting & Prevention | 547 (64.4%) | 302 (35.6%) |
| Law Enforcement | 761 (82.1%) | 166 (17.9%) |
| Food Preparation & Serving | 2,656 (49.3%) | 2,732 (50.7%) |
| Cleaning & Maintenance | 1,628 (65.9%) | 844 (34.1%) |
| Personal Care & Service | 568 (23.2%) | 1,882 (76.8%) |
| Total (Category) | 6,398 (47.0%) | 7,227 (53.0%) |
| Total (Overall) | 42,660 (52.4%) | 38,749 (47.6%) |
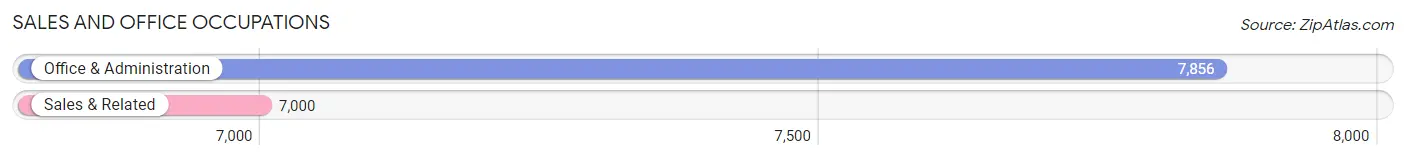
Sales and Office Occupations
The most common Sales and Office occupations in Lee County are Office & Administration (7,856 | 9.7%), and Sales & Related (7,000 | 8.6%).
Sales and Office Occupations by Sex
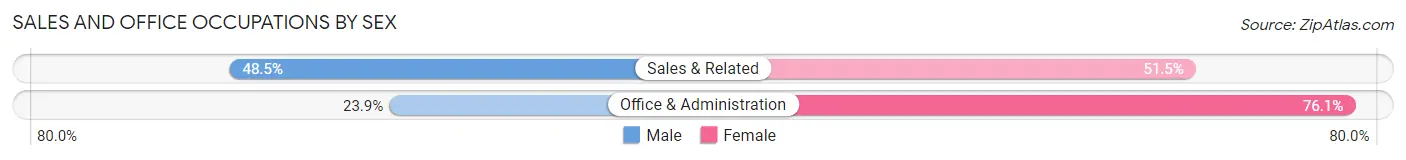
| Occupation | Male | Female |
| Sales & Related | 3,392 (48.5%) | 3,608 (51.5%) |
| Office & Administration | 1,880 (23.9%) | 5,976 (76.1%) |
| Total (Category) | 5,272 (35.5%) | 9,584 (64.5%) |
| Total (Overall) | 42,660 (52.4%) | 38,749 (47.6%) |
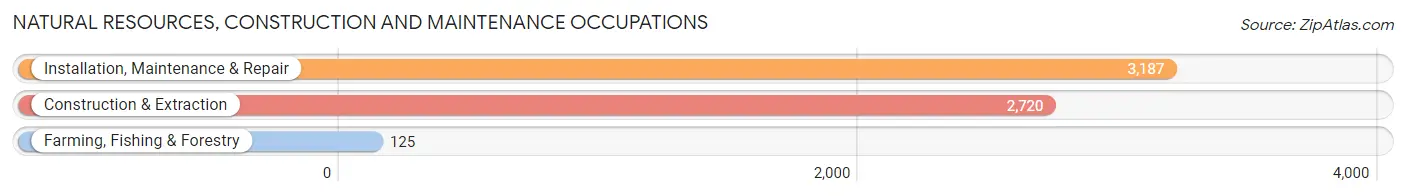
Natural Resources, Construction and Maintenance Occupations
The most common Natural Resources, Construction and Maintenance occupations in Lee County are Installation, Maintenance & Repair (3,187 | 3.9%), Construction & Extraction (2,720 | 3.3%), and Farming, Fishing & Forestry (125 | 0.2%).
Natural Resources, Construction and Maintenance Occupations by Sex
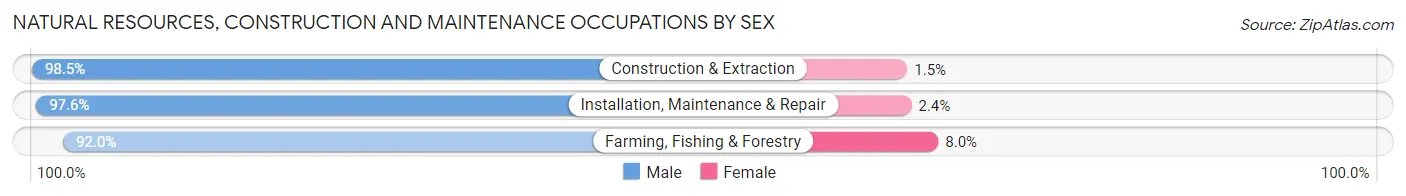
| Occupation | Male | Female |
| Farming, Fishing & Forestry | 115 (92.0%) | 10 (8.0%) |
| Construction & Extraction | 2,678 (98.5%) | 42 (1.5%) |
| Installation, Maintenance & Repair | 3,110 (97.6%) | 77 (2.4%) |
| Total (Category) | 5,903 (97.9%) | 129 (2.1%) |
| Total (Overall) | 42,660 (52.4%) | 38,749 (47.6%) |
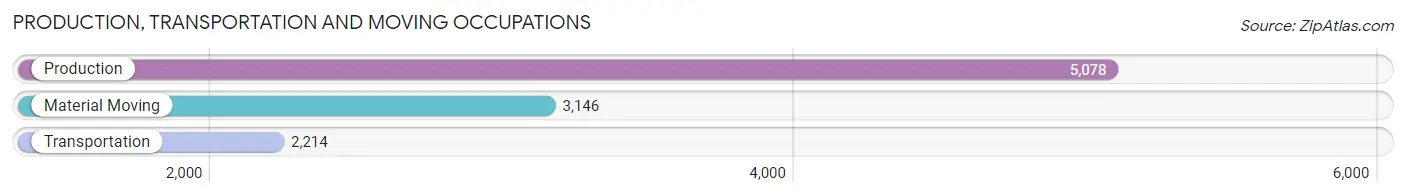
Production, Transportation and Moving Occupations
The most common Production, Transportation and Moving occupations in Lee County are Production (5,078 | 6.2%), Material Moving (3,146 | 3.9%), and Transportation (2,214 | 2.7%).
Production, Transportation and Moving Occupations by Sex

| Occupation | Male | Female |
| Production | 3,631 (71.5%) | 1,447 (28.5%) |
| Transportation | 1,862 (84.1%) | 352 (15.9%) |
| Material Moving | 2,385 (75.8%) | 761 (24.2%) |
| Total (Category) | 7,878 (75.5%) | 2,560 (24.5%) |
| Total (Overall) | 42,660 (52.4%) | 38,749 (47.6%) |
Employment Industries by Sex in Lee County
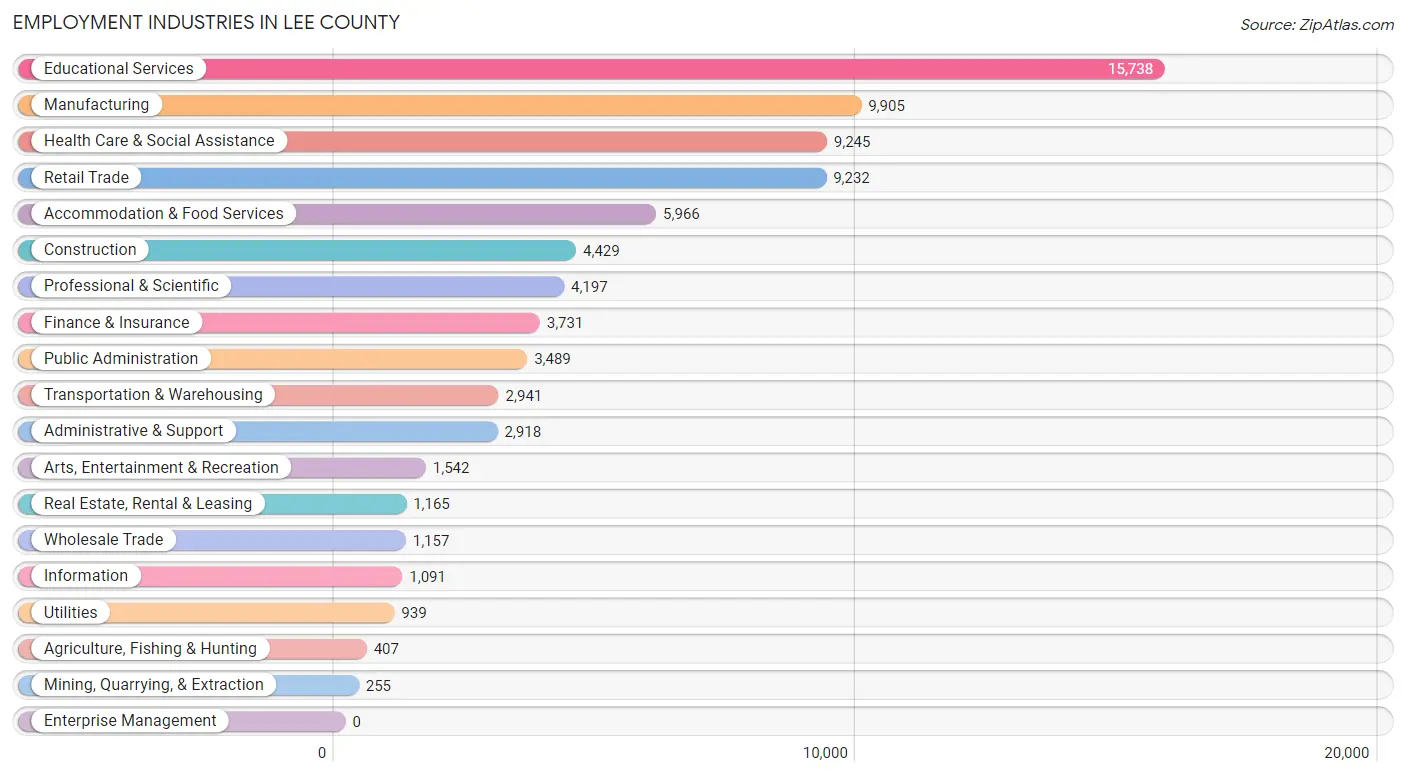
Employment Industries in Lee County
The major employment industries in Lee County include Educational Services (15,738 | 19.3%), Manufacturing (9,905 | 12.2%), Health Care & Social Assistance (9,245 | 11.4%), Retail Trade (9,232 | 11.3%), and Accommodation & Food Services (5,966 | 7.3%).
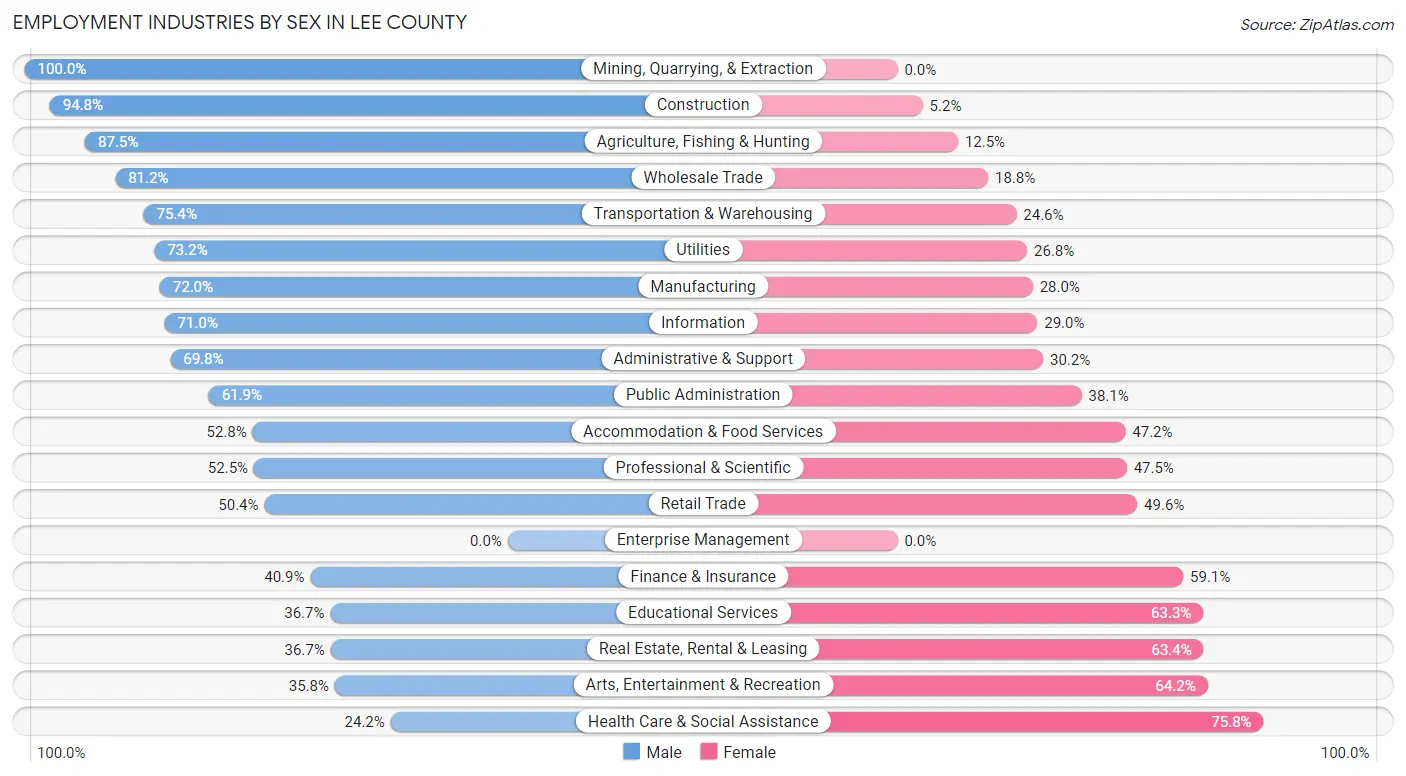
Employment Industries by Sex in Lee County
The Lee County industries that see more men than women are Mining, Quarrying, & Extraction (100.0%), Construction (94.8%), and Agriculture, Fishing & Hunting (87.5%), whereas the industries that tend to have a higher number of women are Health Care & Social Assistance (75.8%), Arts, Entertainment & Recreation (64.2%), and Real Estate, Rental & Leasing (63.3%).
| Industry | Male | Female |
| Agriculture, Fishing & Hunting | 356 (87.5%) | 51 (12.5%) |
| Mining, Quarrying, & Extraction | 255 (100.0%) | 0 (0.0%) |
| Construction | 4,198 (94.8%) | 231 (5.2%) |
| Manufacturing | 7,132 (72.0%) | 2,773 (28.0%) |
| Wholesale Trade | 940 (81.2%) | 217 (18.8%) |
| Retail Trade | 4,651 (50.4%) | 4,581 (49.6%) |
| Transportation & Warehousing | 2,217 (75.4%) | 724 (24.6%) |
| Utilities | 687 (73.2%) | 252 (26.8%) |
| Information | 775 (71.0%) | 316 (29.0%) |
| Finance & Insurance | 1,525 (40.9%) | 2,206 (59.1%) |
| Real Estate, Rental & Leasing | 427 (36.6%) | 738 (63.3%) |
| Professional & Scientific | 2,205 (52.5%) | 1,992 (47.5%) |
| Enterprise Management | 0 (0.0%) | 0 (0.0%) |
| Administrative & Support | 2,038 (69.8%) | 880 (30.2%) |
| Educational Services | 5,779 (36.7%) | 9,959 (63.3%) |
| Health Care & Social Assistance | 2,241 (24.2%) | 7,004 (75.8%) |
| Arts, Entertainment & Recreation | 552 (35.8%) | 990 (64.2%) |
| Accommodation & Food Services | 3,151 (52.8%) | 2,815 (47.2%) |
| Public Administration | 2,159 (61.9%) | 1,330 (38.1%) |
| Total | 42,660 (52.4%) | 38,749 (47.6%) |
Education in Lee County
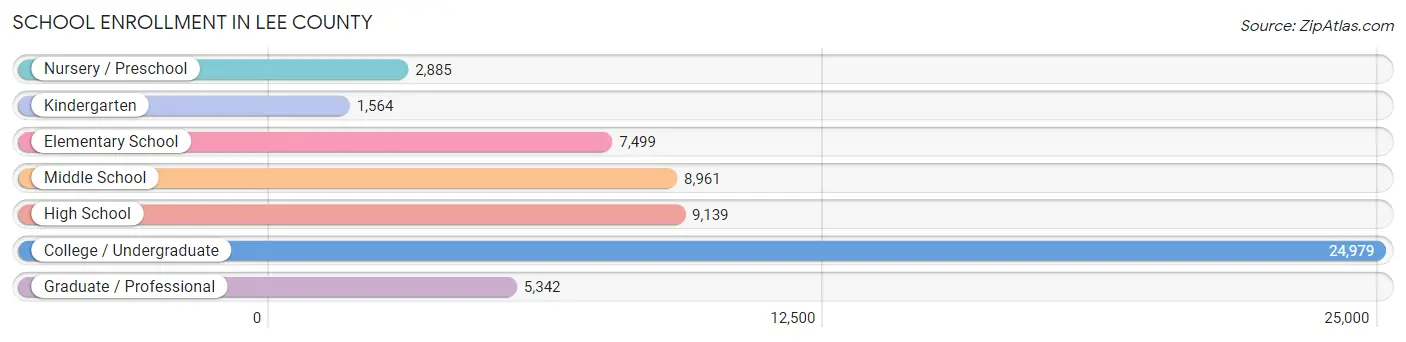
School Enrollment in Lee County
The most common levels of schooling among the 60,369 students in Lee County are college / undergraduate (24,979 | 41.4%), high school (9,139 | 15.1%), and middle school (8,961 | 14.8%).
| School Level | # Students | % Students |
| Nursery / Preschool | 2,885 | 4.8% |
| Kindergarten | 1,564 | 2.6% |
| Elementary School | 7,499 | 12.4% |
| Middle School | 8,961 | 14.8% |
| High School | 9,139 | 15.1% |
| College / Undergraduate | 24,979 | 41.4% |
| Graduate / Professional | 5,342 | 8.8% |
| Total | 60,369 | 100.0% |
School Enrollment by Age by Funding Source in Lee County
Out of a total of 60,369 students who are enrolled in schools in Lee County, 8,814 (14.6%) attend a private institution, while the remaining 51,555 (85.4%) are enrolled in public schools. The age group of 3 to 4 year olds has the highest likelihood of being enrolled in private schools, with 1,282 (52.8% in the age bracket) enrolled. Conversely, the age group of 10 to 14 year olds has the lowest likelihood of being enrolled in a private school, with 10,106 (89.1% in the age bracket) attending a public institution.
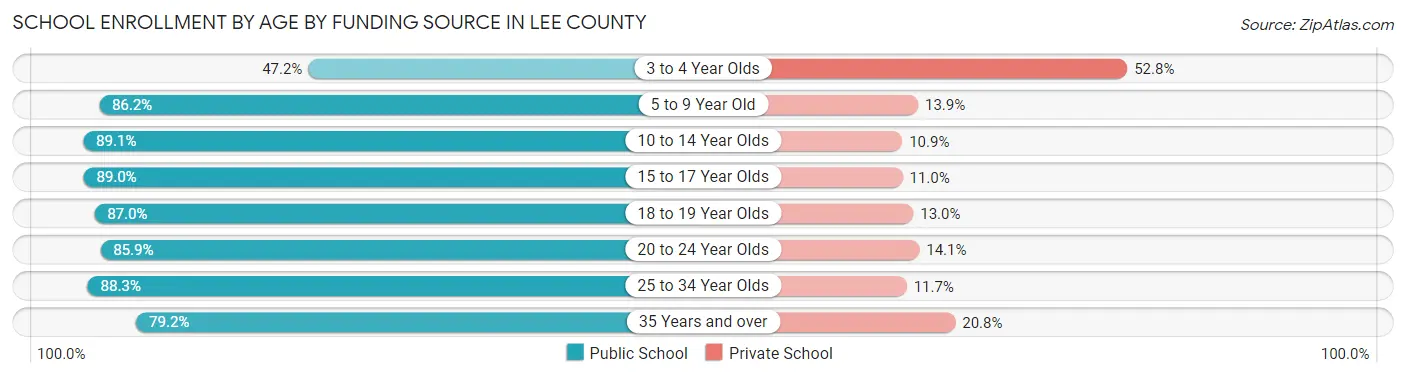
| Age Bracket | Public School | Private School |
| 3 to 4 Year Olds | 1,145 (47.2%) | 1,282 (52.8%) |
| 5 to 9 Year Old | 7,336 (86.2%) | 1,179 (13.9%) |
| 10 to 14 Year Olds | 10,106 (89.1%) | 1,238 (10.9%) |
| 15 to 17 Year Olds | 5,423 (89.0%) | 668 (11.0%) |
| 18 to 19 Year Olds | 7,472 (87.0%) | 1,114 (13.0%) |
| 20 to 24 Year Olds | 13,537 (85.9%) | 2,221 (14.1%) |
| 25 to 34 Year Olds | 4,661 (88.3%) | 620 (11.7%) |
| 35 Years and over | 1,875 (79.2%) | 492 (20.8%) |
| Total | 51,555 (85.4%) | 8,814 (14.6%) |
Educational Attainment by Field of Study in Lee County
Business (8,874 | 19.4%), education (5,838 | 12.8%), science & technology (4,766 | 10.4%), bio, nature & agricultural (4,058 | 8.9%), and engineering (3,911 | 8.5%) are the most common fields of study among 45,805 individuals in Lee County who have obtained a bachelor's degree or higher.
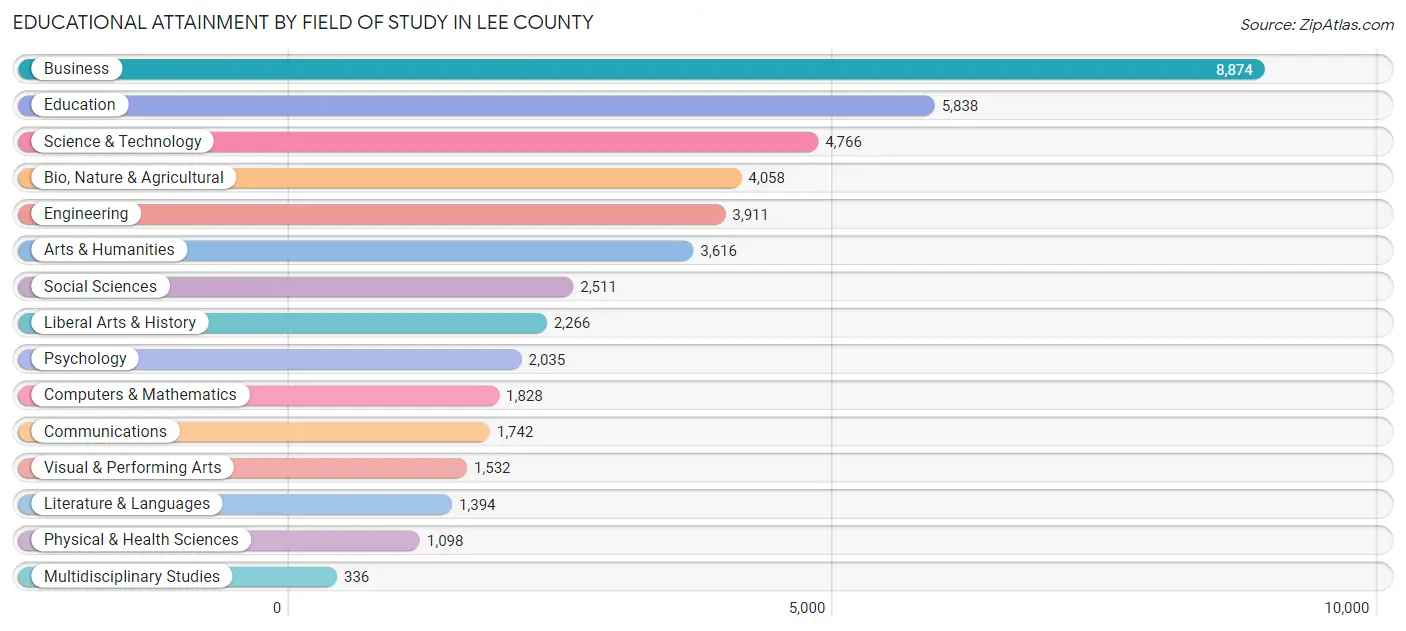
| Field of Study | # Graduates | % Graduates |
| Computers & Mathematics | 1,828 | 4.0% |
| Bio, Nature & Agricultural | 4,058 | 8.9% |
| Physical & Health Sciences | 1,098 | 2.4% |
| Psychology | 2,035 | 4.4% |
| Social Sciences | 2,511 | 5.5% |
| Engineering | 3,911 | 8.5% |
| Multidisciplinary Studies | 336 | 0.7% |
| Science & Technology | 4,766 | 10.4% |
| Business | 8,874 | 19.4% |
| Education | 5,838 | 12.8% |
| Literature & Languages | 1,394 | 3.0% |
| Liberal Arts & History | 2,266 | 5.0% |
| Visual & Performing Arts | 1,532 | 3.3% |
| Communications | 1,742 | 3.8% |
| Arts & Humanities | 3,616 | 7.9% |
| Total | 45,805 | 100.0% |
Transportation & Commute in Lee County
Vehicle Availability by Sex in Lee County
The most prevalent vehicle ownership categories in Lee County are males with 2 vehicles (17,661, accounting for 42.0%) and females with 2 vehicles (15,070, making up 47.7%).
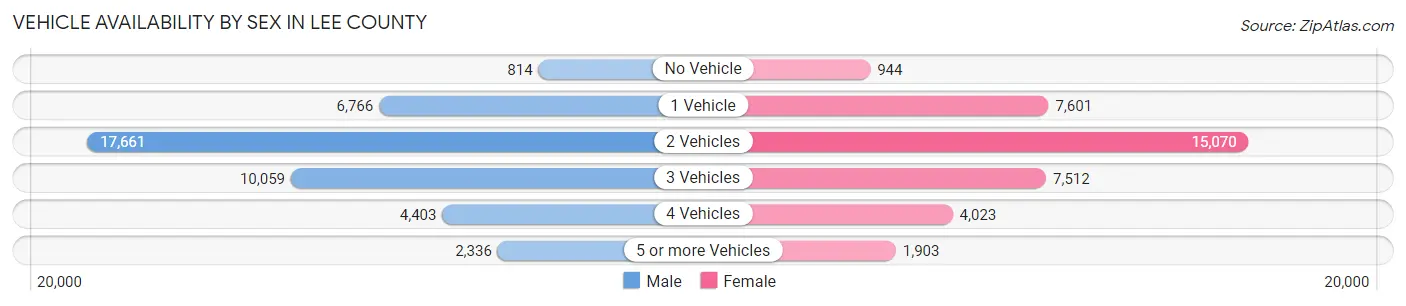
| Vehicles Available | Male | Female |
| No Vehicle | 814 (1.9%) | 944 (2.5%) |
| 1 Vehicle | 6,766 (16.1%) | 7,601 (20.5%) |
| 2 Vehicles | 17,661 (42.0%) | 15,070 (40.7%) |
| 3 Vehicles | 10,059 (23.9%) | 7,512 (20.3%) |
| 4 Vehicles | 4,403 (10.5%) | 4,023 (10.9%) |
| 5 or more Vehicles | 2,336 (5.6%) | 1,903 (5.1%) |
| Total | 42,039 (100.0%) | 37,053 (100.0%) |
Commute Time in Lee County
The most frequently occuring commute durations in Lee County are 15 to 19 minutes (15,319 commuters, 20.4%), 10 to 14 minutes (13,688 commuters, 18.3%), and 20 to 24 minutes (11,162 commuters, 14.9%).
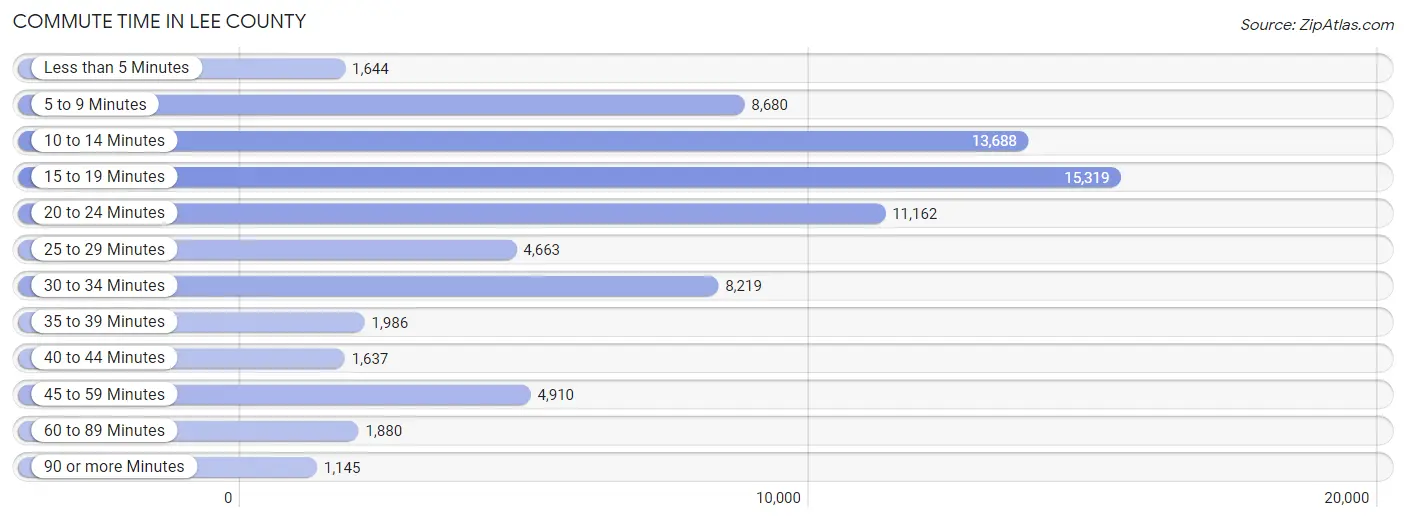
| Commute Time | # Commuters | % Commuters |
| Less than 5 Minutes | 1,644 | 2.2% |
| 5 to 9 Minutes | 8,680 | 11.6% |
| 10 to 14 Minutes | 13,688 | 18.3% |
| 15 to 19 Minutes | 15,319 | 20.4% |
| 20 to 24 Minutes | 11,162 | 14.9% |
| 25 to 29 Minutes | 4,663 | 6.2% |
| 30 to 34 Minutes | 8,219 | 11.0% |
| 35 to 39 Minutes | 1,986 | 2.6% |
| 40 to 44 Minutes | 1,637 | 2.2% |
| 45 to 59 Minutes | 4,910 | 6.6% |
| 60 to 89 Minutes | 1,880 | 2.5% |
| 90 or more Minutes | 1,145 | 1.5% |
Commute Time by Sex in Lee County
The most common commute times in Lee County are 15 to 19 minutes (7,364 commuters, 18.6%) for males and 15 to 19 minutes (7,955 commuters, 22.5%) for females.
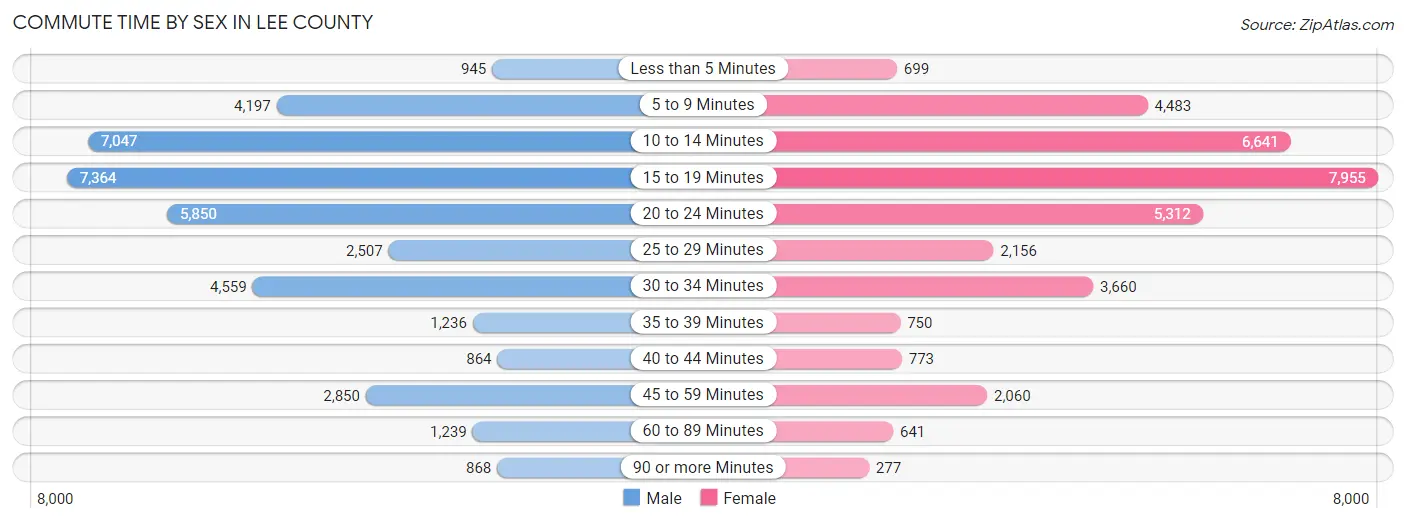
| Commute Time | Male | Female |
| Less than 5 Minutes | 945 (2.4%) | 699 (2.0%) |
| 5 to 9 Minutes | 4,197 (10.6%) | 4,483 (12.7%) |
| 10 to 14 Minutes | 7,047 (17.8%) | 6,641 (18.8%) |
| 15 to 19 Minutes | 7,364 (18.6%) | 7,955 (22.5%) |
| 20 to 24 Minutes | 5,850 (14.8%) | 5,312 (15.0%) |
| 25 to 29 Minutes | 2,507 (6.3%) | 2,156 (6.1%) |
| 30 to 34 Minutes | 4,559 (11.5%) | 3,660 (10.3%) |
| 35 to 39 Minutes | 1,236 (3.1%) | 750 (2.1%) |
| 40 to 44 Minutes | 864 (2.2%) | 773 (2.2%) |
| 45 to 59 Minutes | 2,850 (7.2%) | 2,060 (5.8%) |
| 60 to 89 Minutes | 1,239 (3.1%) | 641 (1.8%) |
| 90 or more Minutes | 868 (2.2%) | 277 (0.8%) |
Time of Departure to Work by Sex in Lee County
The most frequent times of departure to work in Lee County are 7:00 AM to 7:29 AM (7,123, 18.0%) for males and 7:00 AM to 7:29 AM (6,260, 17.7%) for females.
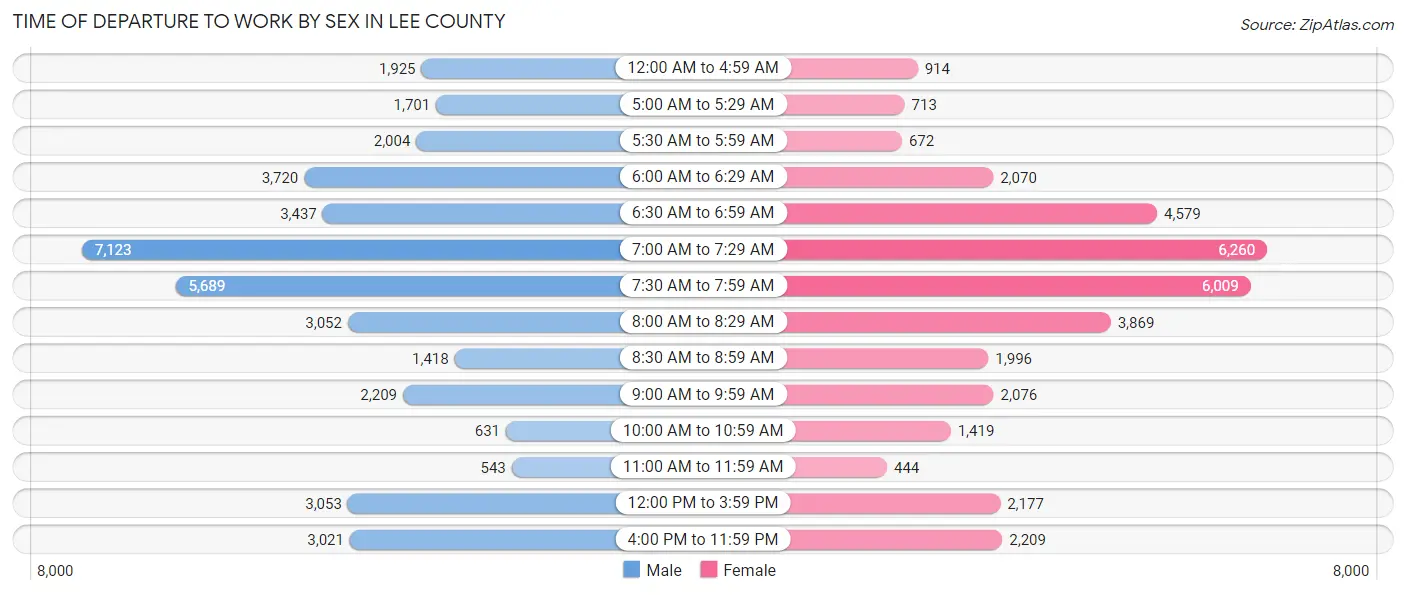
| Time of Departure | Male | Female |
| 12:00 AM to 4:59 AM | 1,925 (4.9%) | 914 (2.6%) |
| 5:00 AM to 5:29 AM | 1,701 (4.3%) | 713 (2.0%) |
| 5:30 AM to 5:59 AM | 2,004 (5.1%) | 672 (1.9%) |
| 6:00 AM to 6:29 AM | 3,720 (9.4%) | 2,070 (5.9%) |
| 6:30 AM to 6:59 AM | 3,437 (8.7%) | 4,579 (12.9%) |
| 7:00 AM to 7:29 AM | 7,123 (18.0%) | 6,260 (17.7%) |
| 7:30 AM to 7:59 AM | 5,689 (14.4%) | 6,009 (17.0%) |
| 8:00 AM to 8:29 AM | 3,052 (7.7%) | 3,869 (10.9%) |
| 8:30 AM to 8:59 AM | 1,418 (3.6%) | 1,996 (5.6%) |
| 9:00 AM to 9:59 AM | 2,209 (5.6%) | 2,076 (5.9%) |
| 10:00 AM to 10:59 AM | 631 (1.6%) | 1,419 (4.0%) |
| 11:00 AM to 11:59 AM | 543 (1.4%) | 444 (1.3%) |
| 12:00 PM to 3:59 PM | 3,053 (7.7%) | 2,177 (6.1%) |
| 4:00 PM to 11:59 PM | 3,021 (7.6%) | 2,209 (6.2%) |
| Total | 39,526 (100.0%) | 35,407 (100.0%) |
Housing Occupancy in Lee County
Occupancy by Ownership in Lee County
Of the total 65,166 dwellings in Lee County, owner-occupied units account for 42,517 (65.2%), while renter-occupied units make up 22,649 (34.8%).
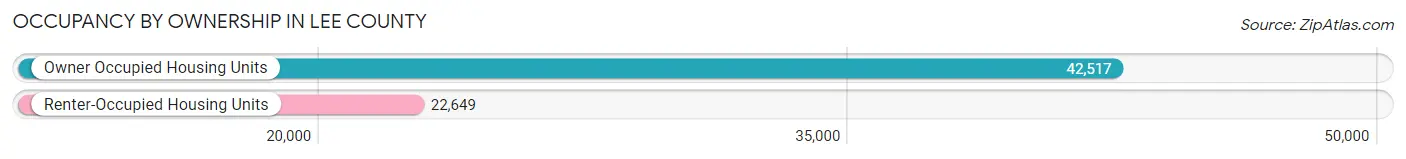
| Occupancy | # Housing Units | % Housing Units |
| Owner Occupied Housing Units | 42,517 | 65.2% |
| Renter-Occupied Housing Units | 22,649 | 34.8% |
| Total Occupied Housing Units | 65,166 | 100.0% |
Occupancy by Household Size in Lee County
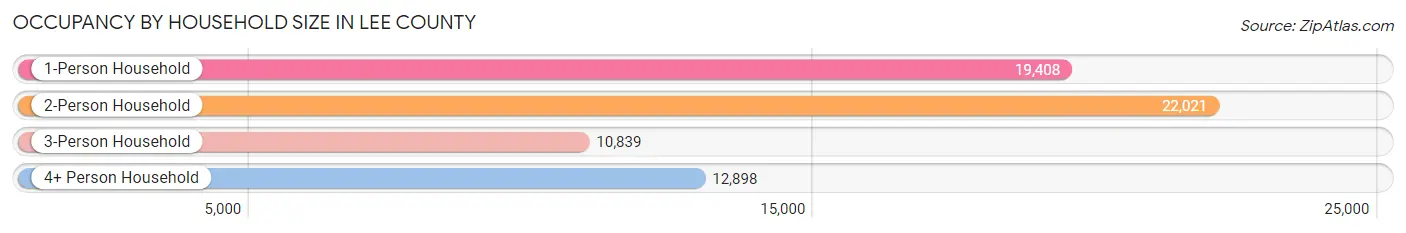
| Household Size | # Housing Units | % Housing Units |
| 1-Person Household | 19,408 | 29.8% |
| 2-Person Household | 22,021 | 33.8% |
| 3-Person Household | 10,839 | 16.6% |
| 4+ Person Household | 12,898 | 19.8% |
| Total Housing Units | 65,166 | 100.0% |
Occupancy by Ownership by Household Size in Lee County
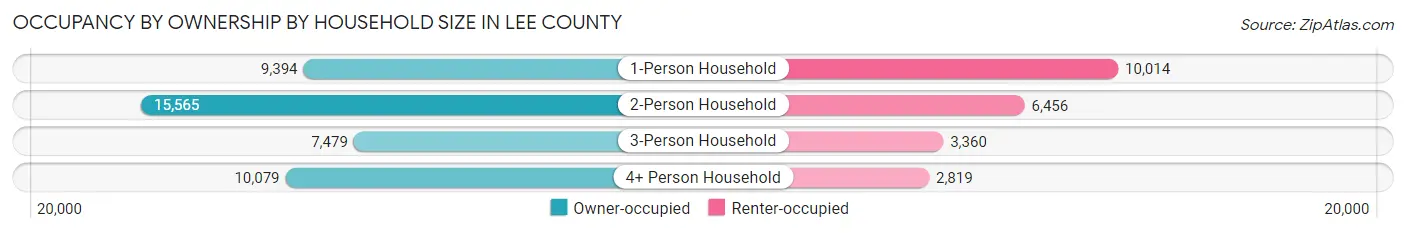
| Household Size | Owner-occupied | Renter-occupied |
| 1-Person Household | 9,394 (48.4%) | 10,014 (51.6%) |
| 2-Person Household | 15,565 (70.7%) | 6,456 (29.3%) |
| 3-Person Household | 7,479 (69.0%) | 3,360 (31.0%) |
| 4+ Person Household | 10,079 (78.1%) | 2,819 (21.9%) |
| Total Housing Units | 42,517 (65.2%) | 22,649 (34.8%) |
Occupancy by Educational Attainment in Lee County
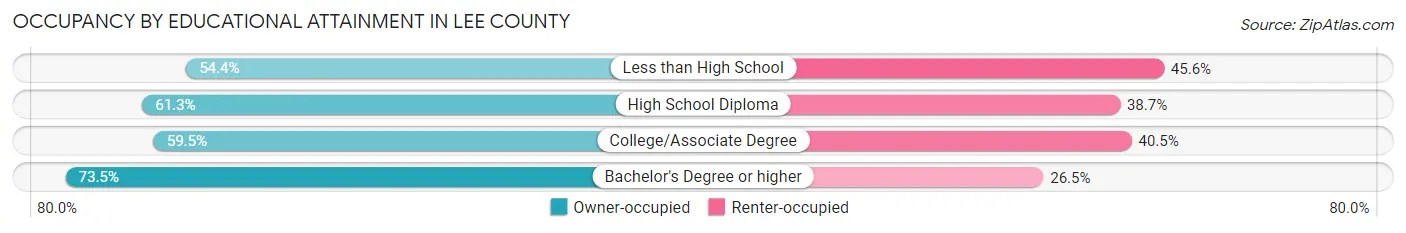
| Household Size | Owner-occupied | Renter-occupied |
| Less than High School | 2,218 (54.4%) | 1,862 (45.6%) |
| High School Diploma | 7,539 (61.3%) | 4,753 (38.7%) |
| College/Associate Degree | 13,178 (59.5%) | 8,969 (40.5%) |
| Bachelor's Degree or higher | 19,582 (73.5%) | 7,065 (26.5%) |
Occupancy by Age of Householder in Lee County
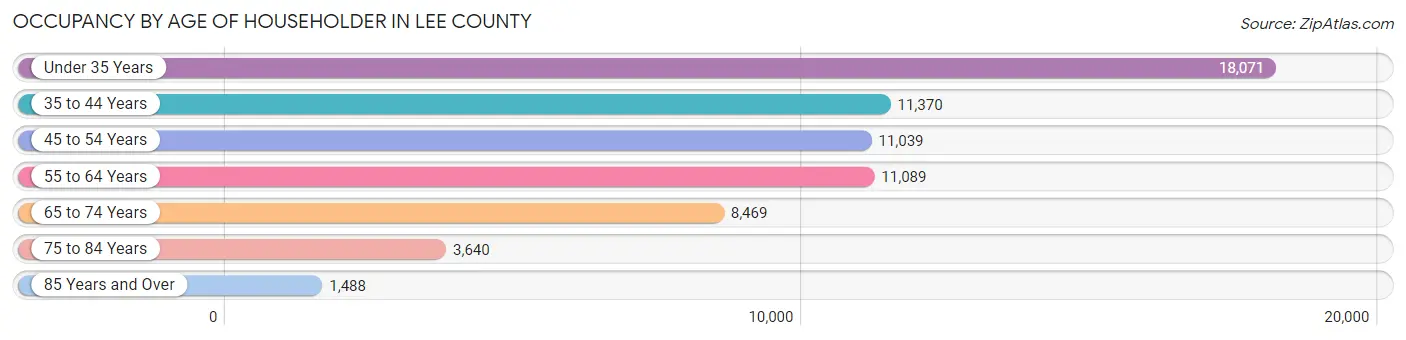
| Age Bracket | # Households | % Households |
| Under 35 Years | 18,071 | 27.7% |
| 35 to 44 Years | 11,370 | 17.4% |
| 45 to 54 Years | 11,039 | 16.9% |
| 55 to 64 Years | 11,089 | 17.0% |
| 65 to 74 Years | 8,469 | 13.0% |
| 75 to 84 Years | 3,640 | 5.6% |
| 85 Years and Over | 1,488 | 2.3% |
| Total | 65,166 | 100.0% |
Housing Finances in Lee County
Median Income by Occupancy in Lee County
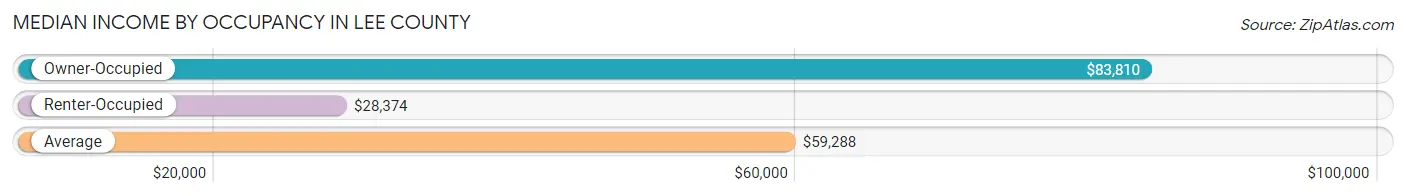
| Occupancy Type | # Households | Median Income |
| Owner-Occupied | 42,517 (65.2%) | $83,810 |
| Renter-Occupied | 22,649 (34.8%) | $28,374 |
| Average | 65,166 (100.0%) | $59,288 |
Occupancy by Householder Income Bracket in Lee County
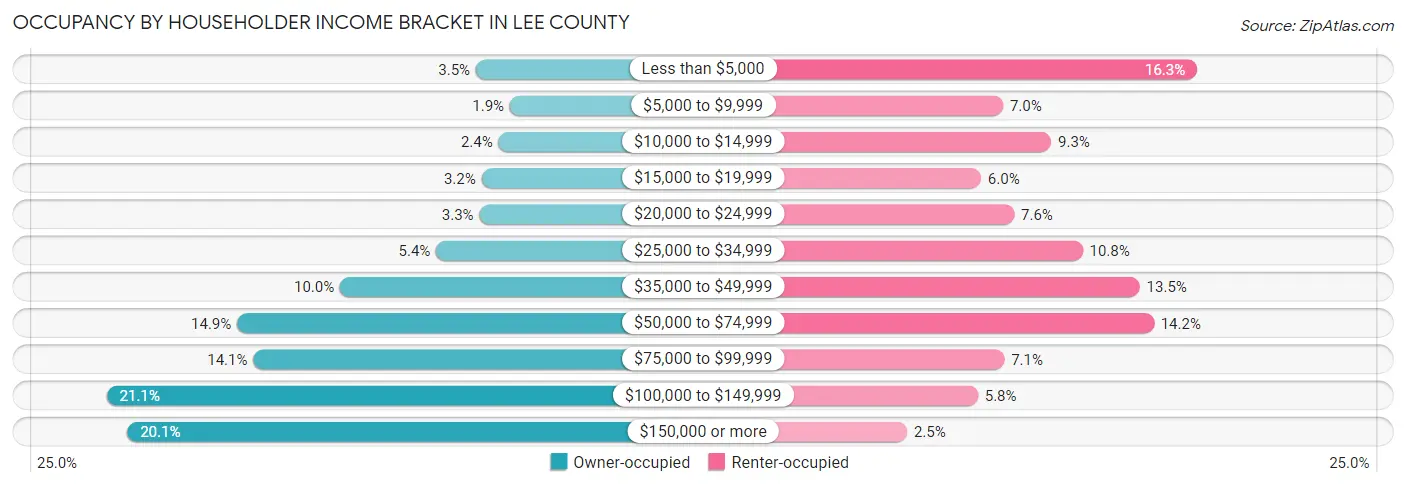
| Income Bracket | Owner-occupied | Renter-occupied |
| Less than $5,000 | 1,494 (3.5%) | 3,683 (16.3%) |
| $5,000 to $9,999 | 803 (1.9%) | 1,589 (7.0%) |
| $10,000 to $14,999 | 1,035 (2.4%) | 2,109 (9.3%) |
| $15,000 to $19,999 | 1,376 (3.2%) | 1,353 (6.0%) |
| $20,000 to $24,999 | 1,420 (3.3%) | 1,710 (7.5%) |
| $25,000 to $34,999 | 2,298 (5.4%) | 2,449 (10.8%) |
| $35,000 to $49,999 | 4,243 (10.0%) | 3,064 (13.5%) |
| $50,000 to $74,999 | 6,327 (14.9%) | 3,217 (14.2%) |
| $75,000 to $99,999 | 5,999 (14.1%) | 1,603 (7.1%) |
| $100,000 to $149,999 | 8,973 (21.1%) | 1,318 (5.8%) |
| $150,000 or more | 8,549 (20.1%) | 554 (2.5%) |
| Total | 42,517 (100.0%) | 22,649 (100.0%) |
Monthly Housing Cost Tiers in Lee County
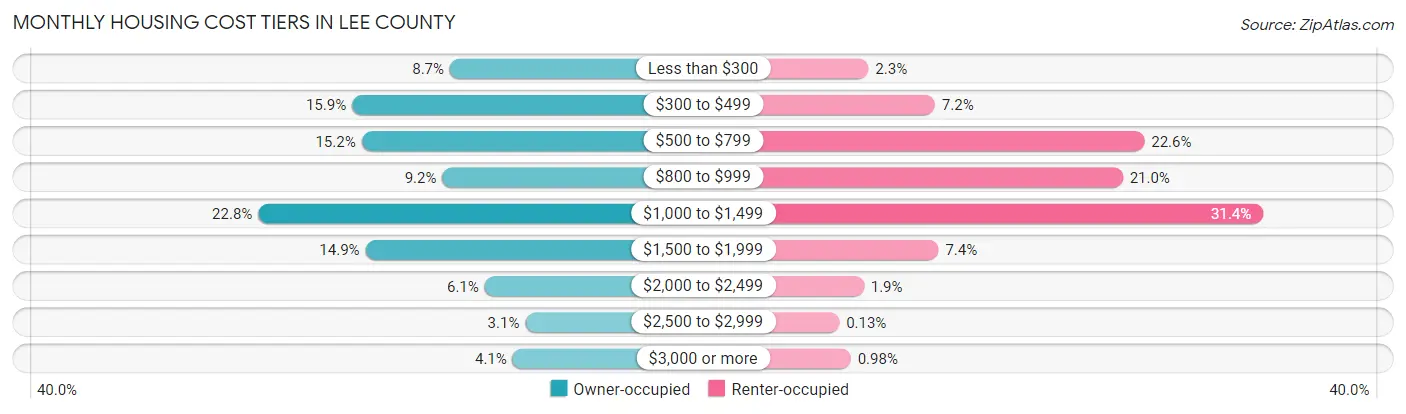
| Monthly Cost | Owner-occupied | Renter-occupied |
| Less than $300 | 3,690 (8.7%) | 516 (2.3%) |
| $300 to $499 | 6,755 (15.9%) | 1,626 (7.2%) |
| $500 to $799 | 6,460 (15.2%) | 5,119 (22.6%) |
| $800 to $999 | 3,927 (9.2%) | 4,759 (21.0%) |
| $1,000 to $1,499 | 9,693 (22.8%) | 7,101 (31.4%) |
| $1,500 to $1,999 | 6,337 (14.9%) | 1,686 (7.4%) |
| $2,000 to $2,499 | 2,600 (6.1%) | 440 (1.9%) |
| $2,500 to $2,999 | 1,329 (3.1%) | 29 (0.1%) |
| $3,000 or more | 1,726 (4.1%) | 221 (1.0%) |
| Total | 42,517 (100.0%) | 22,649 (100.0%) |
Physical Housing Characteristics in Lee County
Housing Structures in Lee County
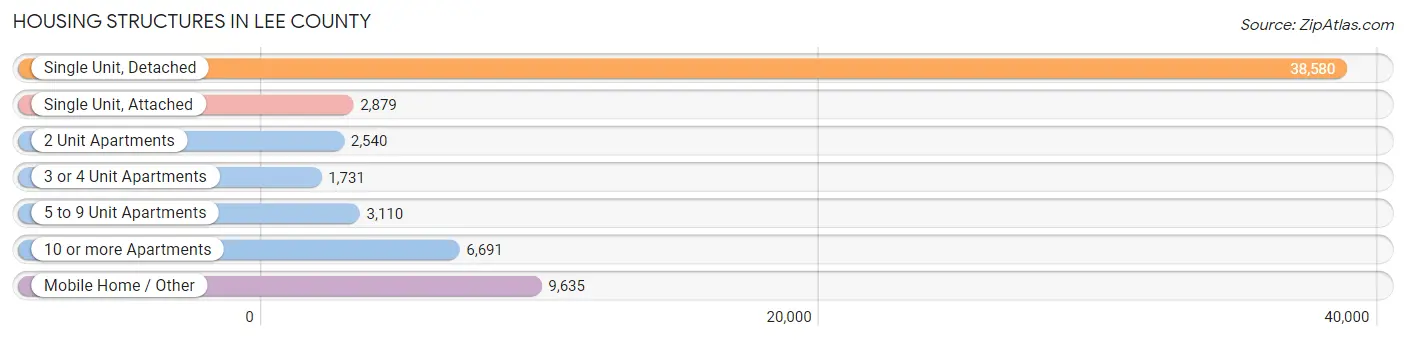
| Structure Type | # Housing Units | % Housing Units |
| Single Unit, Detached | 38,580 | 59.2% |
| Single Unit, Attached | 2,879 | 4.4% |
| 2 Unit Apartments | 2,540 | 3.9% |
| 3 or 4 Unit Apartments | 1,731 | 2.7% |
| 5 to 9 Unit Apartments | 3,110 | 4.8% |
| 10 or more Apartments | 6,691 | 10.3% |
| Mobile Home / Other | 9,635 | 14.8% |
| Total | 65,166 | 100.0% |
Housing Structures by Occupancy in Lee County
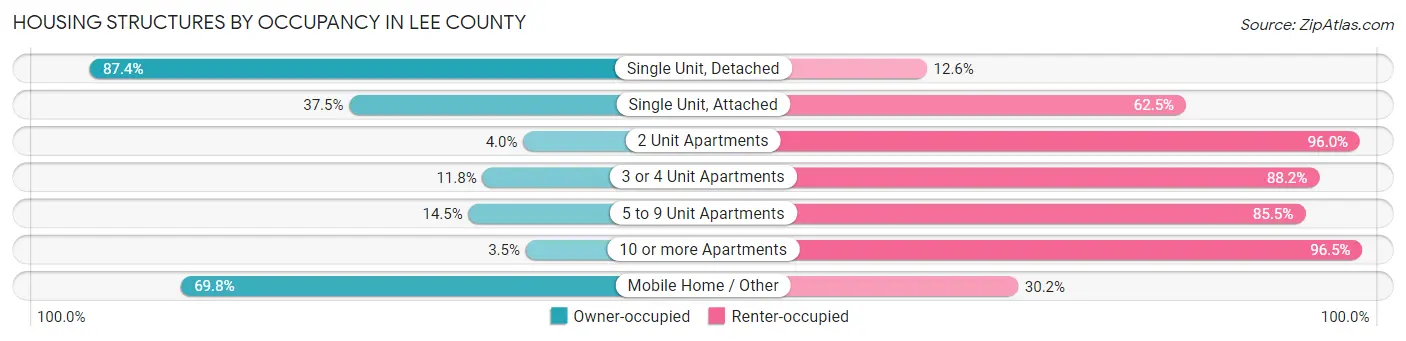
| Structure Type | Owner-occupied | Renter-occupied |
| Single Unit, Detached | 33,718 (87.4%) | 4,862 (12.6%) |
| Single Unit, Attached | 1,079 (37.5%) | 1,800 (62.5%) |
| 2 Unit Apartments | 101 (4.0%) | 2,439 (96.0%) |
| 3 or 4 Unit Apartments | 205 (11.8%) | 1,526 (88.2%) |
| 5 to 9 Unit Apartments | 452 (14.5%) | 2,658 (85.5%) |
| 10 or more Apartments | 234 (3.5%) | 6,457 (96.5%) |
| Mobile Home / Other | 6,728 (69.8%) | 2,907 (30.2%) |
| Total | 42,517 (65.2%) | 22,649 (34.8%) |
Housing Structures by Number of Rooms in Lee County
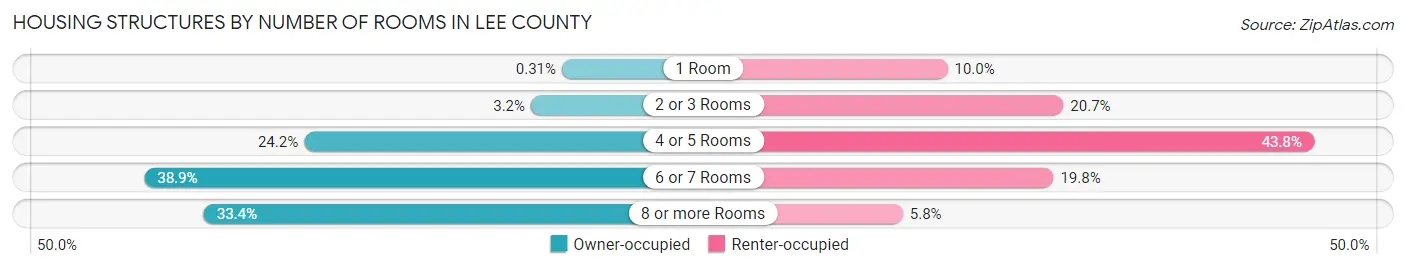
| Number of Rooms | Owner-occupied | Renter-occupied |
| 1 Room | 133 (0.3%) | 2,253 (10.0%) |
| 2 or 3 Rooms | 1,354 (3.2%) | 4,681 (20.7%) |
| 4 or 5 Rooms | 10,271 (24.2%) | 9,924 (43.8%) |
| 6 or 7 Rooms | 16,550 (38.9%) | 4,473 (19.8%) |
| 8 or more Rooms | 14,209 (33.4%) | 1,318 (5.8%) |
| Total | 42,517 (100.0%) | 22,649 (100.0%) |
Housing Structure by Heating Type in Lee County
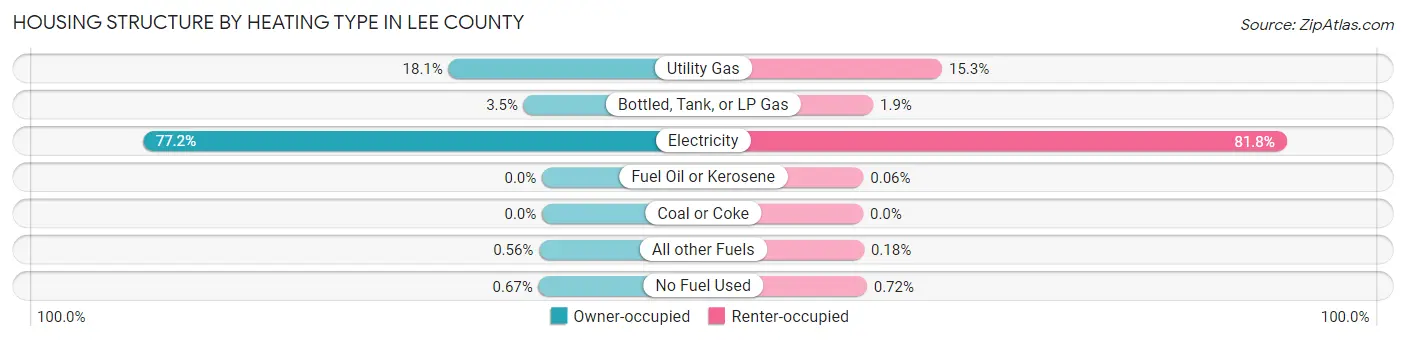
| Heating Type | Owner-occupied | Renter-occupied |
| Utility Gas | 7,682 (18.1%) | 3,458 (15.3%) |
| Bottled, Tank, or LP Gas | 1,502 (3.5%) | 440 (1.9%) |
| Electricity | 32,808 (77.2%) | 18,533 (81.8%) |
| Fuel Oil or Kerosene | 0 (0.0%) | 13 (0.1%) |
| Coal or Coke | 0 (0.0%) | 0 (0.0%) |
| All other Fuels | 239 (0.6%) | 41 (0.2%) |
| No Fuel Used | 286 (0.7%) | 164 (0.7%) |
| Total | 42,517 (100.0%) | 22,649 (100.0%) |
Household Vehicle Usage in Lee County
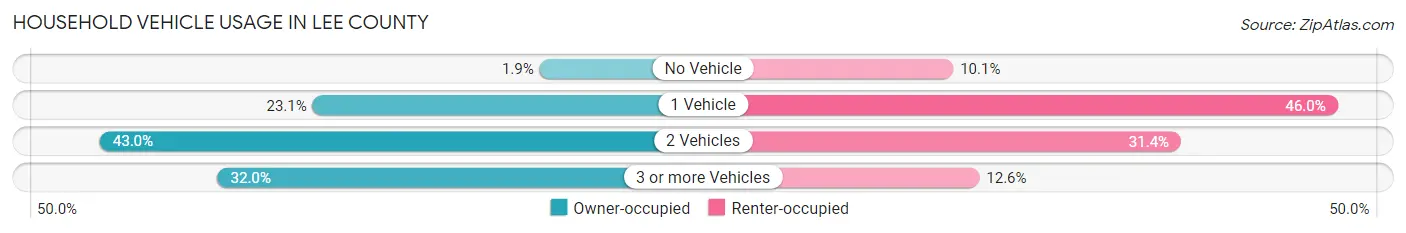
| Vehicles per Household | Owner-occupied | Renter-occupied |
| No Vehicle | 822 (1.9%) | 2,289 (10.1%) |
| 1 Vehicle | 9,830 (23.1%) | 10,414 (46.0%) |
| 2 Vehicles | 18,268 (43.0%) | 7,103 (31.4%) |
| 3 or more Vehicles | 13,597 (32.0%) | 2,843 (12.6%) |
| Total | 42,517 (100.0%) | 22,649 (100.0%) |
Real Estate & Mortgages in Lee County
Real Estate and Mortgage Overview in Lee County
| Characteristic | Without Mortgage | With Mortgage |
| Housing Units | 15,978 | 26,539 |
| Median Property Value | $195,800 | $241,100 |
| Median Household Income | $57,847 | $5,999 |
| Monthly Housing Costs | $432 | $1,712 |
| Real Estate Taxes | $942 | $2,010 |
Property Value by Mortgage Status in Lee County
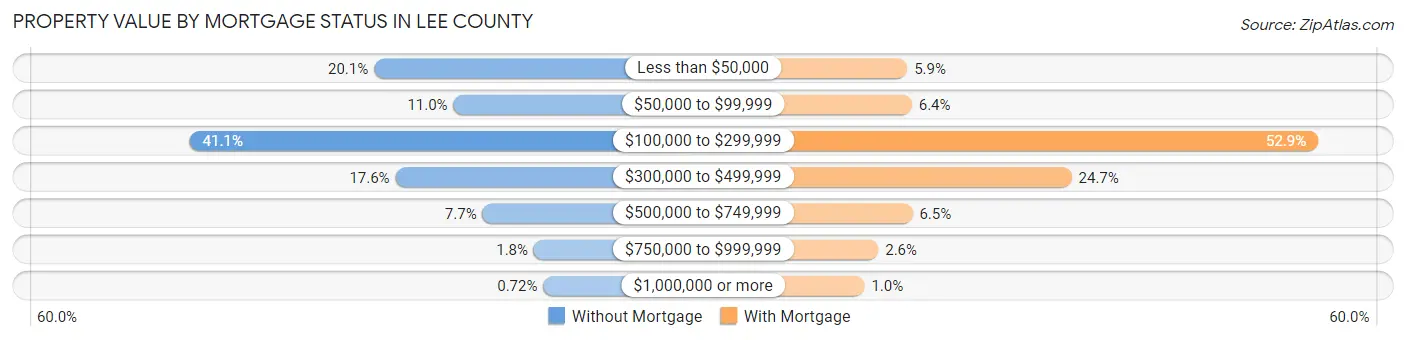
| Property Value | Without Mortgage | With Mortgage |
| Less than $50,000 | 3,205 (20.1%) | 1,568 (5.9%) |
| $50,000 to $99,999 | 1,756 (11.0%) | 1,706 (6.4%) |
| $100,000 to $299,999 | 6,574 (41.1%) | 14,027 (52.8%) |
| $300,000 to $499,999 | 2,816 (17.6%) | 6,552 (24.7%) |
| $500,000 to $749,999 | 1,225 (7.7%) | 1,726 (6.5%) |
| $750,000 to $999,999 | 287 (1.8%) | 689 (2.6%) |
| $1,000,000 or more | 115 (0.7%) | 271 (1.0%) |
| Total | 15,978 (100.0%) | 26,539 (100.0%) |
Household Income by Mortgage Status in Lee County
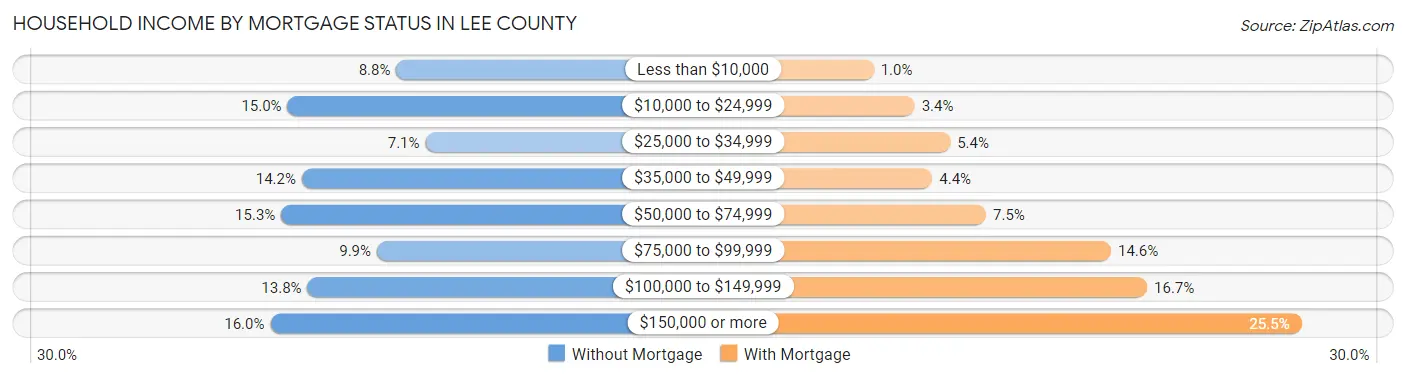
| Household Income | Without Mortgage | With Mortgage |
| Less than $10,000 | 1,399 (8.8%) | 277 (1.0%) |
| $10,000 to $24,999 | 2,394 (15.0%) | 898 (3.4%) |
| $25,000 to $34,999 | 1,134 (7.1%) | 1,437 (5.4%) |
| $35,000 to $49,999 | 2,262 (14.2%) | 1,164 (4.4%) |
| $50,000 to $74,999 | 2,451 (15.3%) | 1,981 (7.5%) |
| $75,000 to $99,999 | 1,577 (9.9%) | 3,876 (14.6%) |
| $100,000 to $149,999 | 2,211 (13.8%) | 4,422 (16.7%) |
| $150,000 or more | 2,550 (16.0%) | 6,762 (25.5%) |
| Total | 15,978 (100.0%) | 26,539 (100.0%) |
Property Value to Household Income Ratio in Lee County
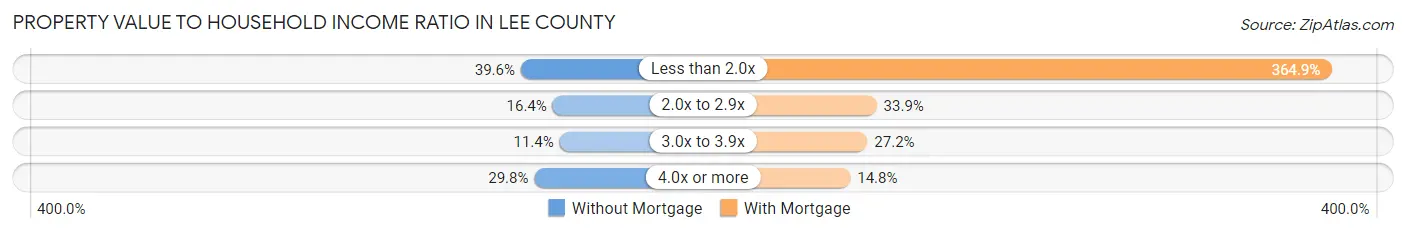
| Value-to-Income Ratio | Without Mortgage | With Mortgage |
| Less than 2.0x | 6,323 (39.6%) | 96,834 (364.9%) |
| 2.0x to 2.9x | 2,627 (16.4%) | 9,007 (33.9%) |
| 3.0x to 3.9x | 1,821 (11.4%) | 7,223 (27.2%) |
| 4.0x or more | 4,753 (29.7%) | 3,928 (14.8%) |
| Total | 15,978 (100.0%) | 26,539 (100.0%) |
Real Estate Taxes by Mortgage Status in Lee County
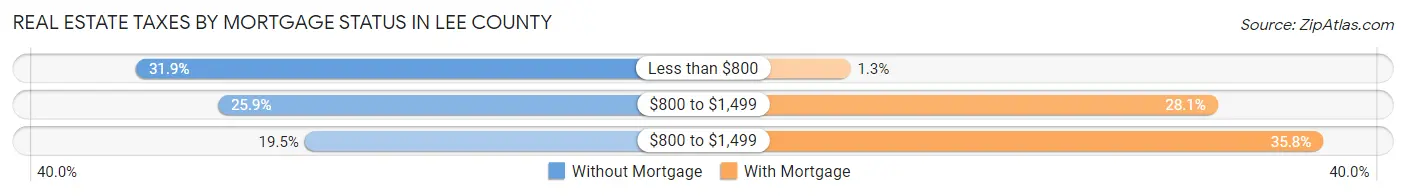
| Property Taxes | Without Mortgage | With Mortgage |
| Less than $800 | 5,090 (31.9%) | 338 (1.3%) |
| $800 to $1,499 | 4,133 (25.9%) | 7,454 (28.1%) |
| $800 to $1,499 | 3,122 (19.5%) | 9,501 (35.8%) |
| Total | 15,978 (100.0%) | 26,539 (100.0%) |
Health & Disability in Lee County
Health Insurance Coverage by Age in Lee County
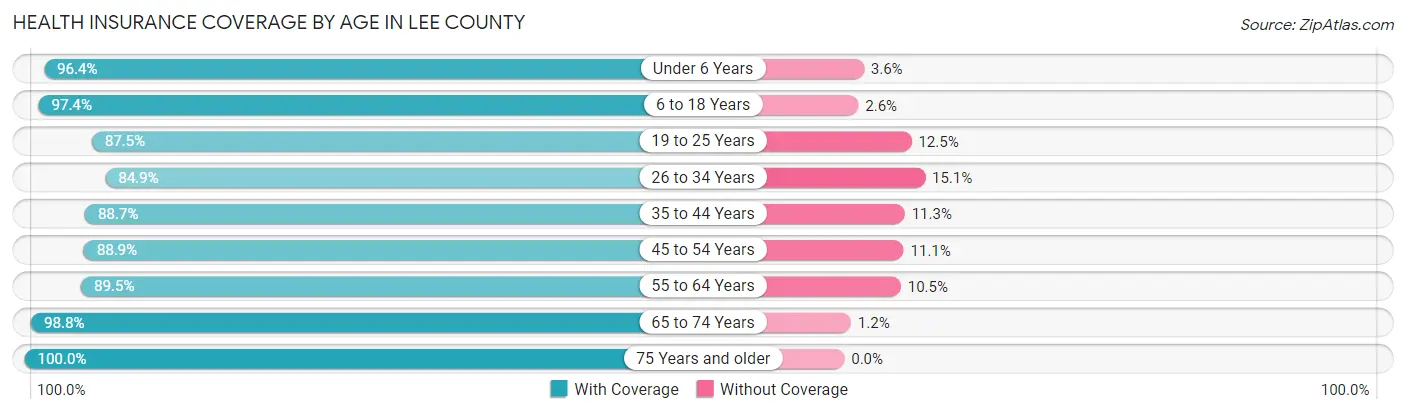
| Age Bracket | With Coverage | Without Coverage |
| Under 6 Years | 10,774 (96.4%) | 407 (3.6%) |
| 6 to 18 Years | 28,749 (97.4%) | 775 (2.6%) |
| 19 to 25 Years | 26,242 (87.5%) | 3,758 (12.5%) |
| 26 to 34 Years | 17,652 (84.9%) | 3,130 (15.1%) |
| 35 to 44 Years | 18,793 (88.7%) | 2,388 (11.3%) |
| 45 to 54 Years | 17,888 (88.9%) | 2,224 (11.1%) |
| 55 to 64 Years | 17,111 (89.5%) | 2,017 (10.5%) |
| 65 to 74 Years | 13,620 (98.8%) | 170 (1.2%) |
| 75 Years and older | 8,141 (100.0%) | 0 (0.0%) |
| Total | 158,970 (91.4%) | 14,869 (8.6%) |
Health Insurance Coverage by Citizenship Status in Lee County
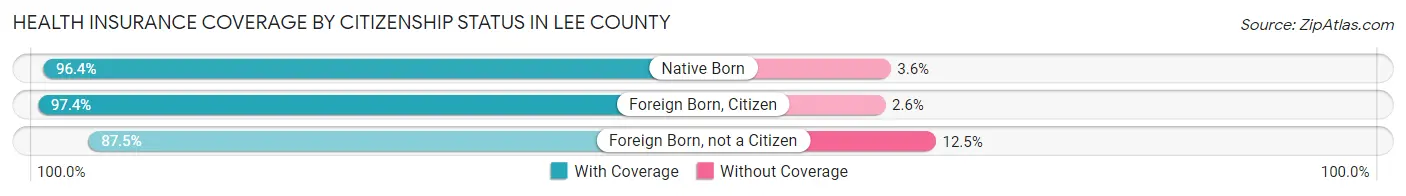
| Citizenship Status | With Coverage | Without Coverage |
| Native Born | 10,774 (96.4%) | 407 (3.6%) |
| Foreign Born, Citizen | 28,749 (97.4%) | 775 (2.6%) |
| Foreign Born, not a Citizen | 26,242 (87.5%) | 3,758 (12.5%) |
Health Insurance Coverage by Household Income in Lee County
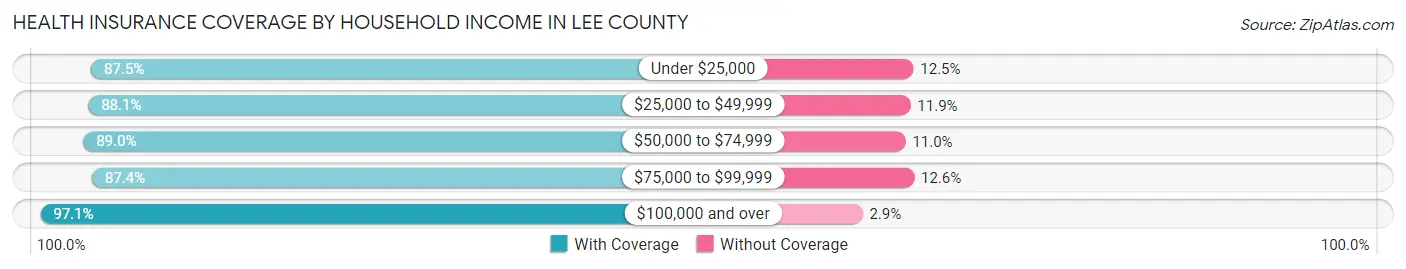
| Household Income | With Coverage | Without Coverage |
| Under $25,000 | 27,162 (87.5%) | 3,869 (12.5%) |
| $25,000 to $49,999 | 24,336 (88.1%) | 3,293 (11.9%) |
| $50,000 to $74,999 | 20,831 (89.0%) | 2,573 (11.0%) |
| $75,000 to $99,999 | 20,336 (87.4%) | 2,932 (12.6%) |
| $100,000 and over | 59,862 (97.1%) | 1,814 (2.9%) |
Public vs Private Health Insurance Coverage by Age in Lee County
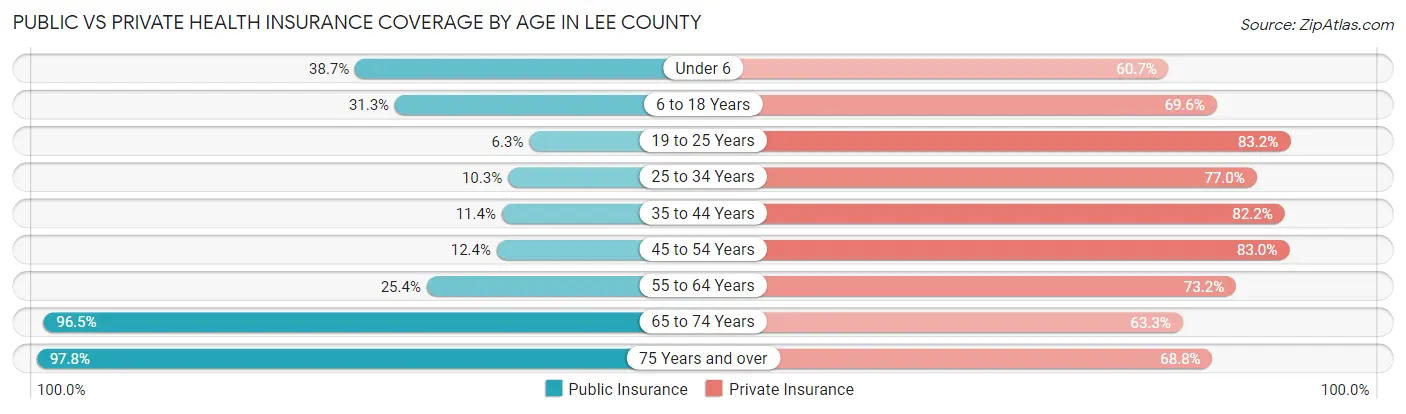
| Age Bracket | Public Insurance | Private Insurance |
| Under 6 | 4,321 (38.7%) | 6,782 (60.7%) |
| 6 to 18 Years | 9,230 (31.3%) | 20,544 (69.6%) |
| 19 to 25 Years | 1,898 (6.3%) | 24,955 (83.2%) |
| 25 to 34 Years | 2,136 (10.3%) | 15,995 (77.0%) |
| 35 to 44 Years | 2,424 (11.4%) | 17,407 (82.2%) |
| 45 to 54 Years | 2,485 (12.4%) | 16,694 (83.0%) |
| 55 to 64 Years | 4,851 (25.4%) | 13,997 (73.2%) |
| 65 to 74 Years | 13,312 (96.5%) | 8,724 (63.3%) |
| 75 Years and over | 7,958 (97.8%) | 5,599 (68.8%) |
| Total | 48,615 (28.0%) | 130,697 (75.2%) |
Disability Status by Sex by Age in Lee County
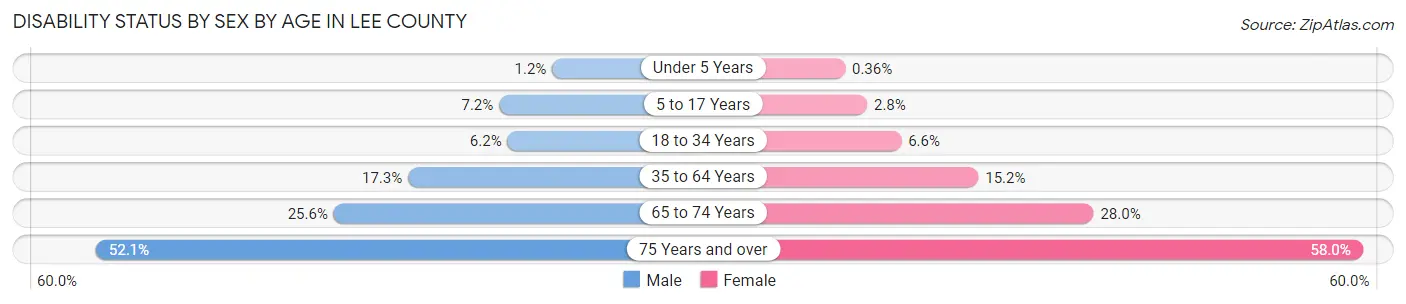
| Age Bracket | Male | Female |
| Under 5 Years | 61 (1.2%) | 17 (0.4%) |
| 5 to 17 Years | 993 (7.1%) | 366 (2.8%) |
| 18 to 34 Years | 1,727 (6.2%) | 1,803 (6.6%) |
| 35 to 64 Years | 5,052 (17.3%) | 4,744 (15.2%) |
| 65 to 74 Years | 1,654 (25.6%) | 2,052 (28.0%) |
| 75 Years and over | 1,804 (52.1%) | 2,712 (58.0%) |
Disability Class by Sex by Age in Lee County
Disability Class: Hearing Difficulty
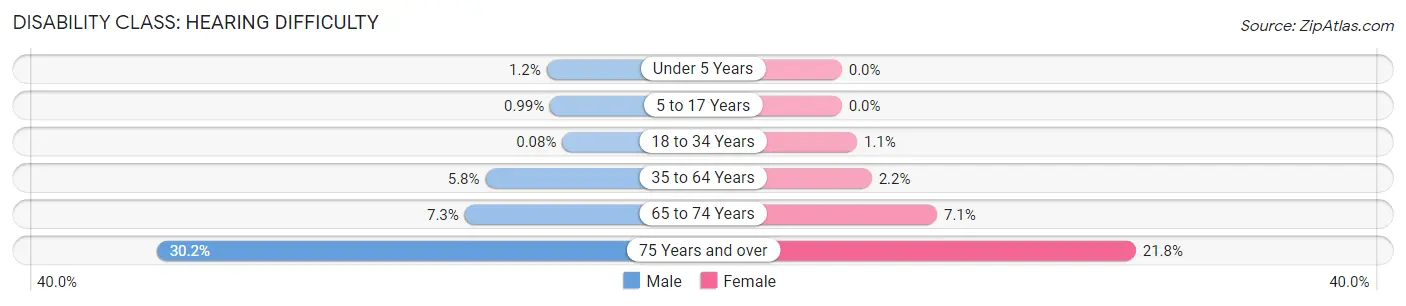
| Age Bracket | Male | Female |
| Under 5 Years | 61 (1.2%) | 0 (0.0%) |
| 5 to 17 Years | 138 (1.0%) | 0 (0.0%) |
| 18 to 34 Years | 21 (0.1%) | 308 (1.1%) |
| 35 to 64 Years | 1,691 (5.8%) | 693 (2.2%) |
| 65 to 74 Years | 474 (7.3%) | 518 (7.1%) |
| 75 Years and over | 1,046 (30.2%) | 1,021 (21.8%) |
Disability Class: Vision Difficulty
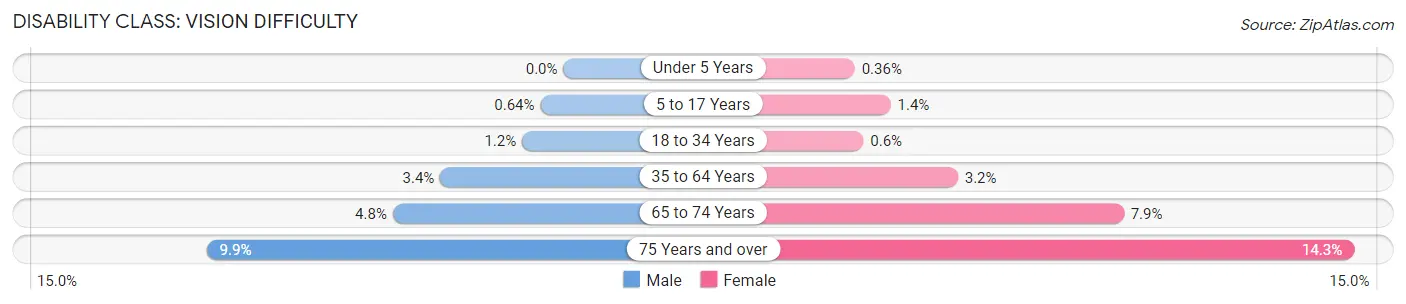
| Age Bracket | Male | Female |
| Under 5 Years | 0 (0.0%) | 17 (0.4%) |
| 5 to 17 Years | 89 (0.6%) | 177 (1.4%) |
| 18 to 34 Years | 319 (1.1%) | 164 (0.6%) |
| 35 to 64 Years | 1,002 (3.4%) | 1,008 (3.2%) |
| 65 to 74 Years | 307 (4.8%) | 575 (7.9%) |
| 75 Years and over | 344 (9.9%) | 667 (14.3%) |
Disability Class: Cognitive Difficulty

| Age Bracket | Male | Female |
| 5 to 17 Years | 822 (5.9%) | 133 (1.0%) |
| 18 to 34 Years | 1,436 (5.2%) | 1,118 (4.1%) |
| 35 to 64 Years | 1,867 (6.4%) | 1,768 (5.7%) |
| 65 to 74 Years | 393 (6.1%) | 456 (6.2%) |
| 75 Years and over | 403 (11.6%) | 882 (18.9%) |
Disability Class: Ambulatory Difficulty
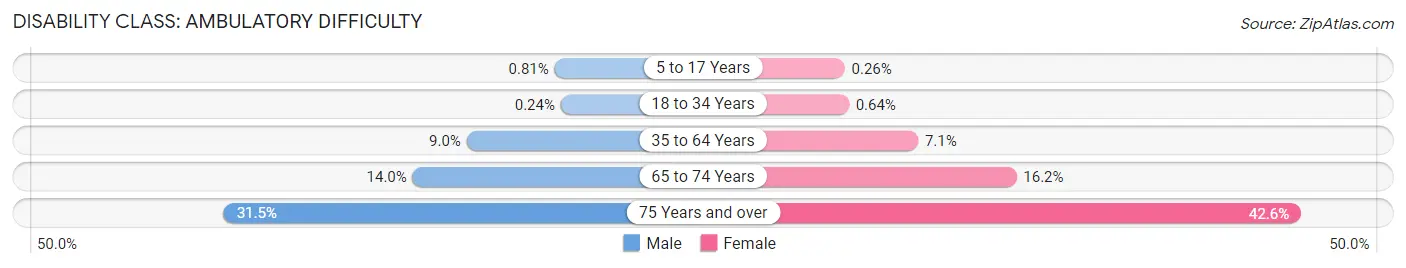
| Age Bracket | Male | Female |
| 5 to 17 Years | 112 (0.8%) | 34 (0.3%) |
| 18 to 34 Years | 67 (0.2%) | 175 (0.6%) |
| 35 to 64 Years | 2,619 (9.0%) | 2,207 (7.1%) |
| 65 to 74 Years | 905 (14.0%) | 1,186 (16.2%) |
| 75 Years and over | 1,092 (31.5%) | 1,993 (42.6%) |
Disability Class: Self-Care Difficulty
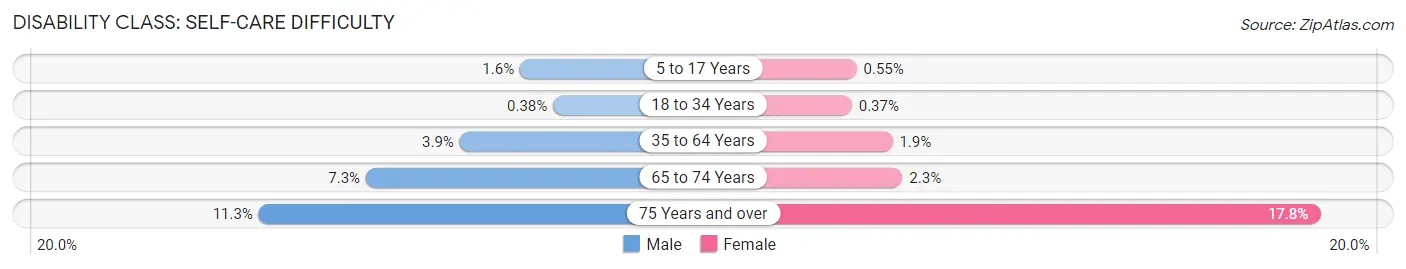
| Age Bracket | Male | Female |
| 5 to 17 Years | 223 (1.6%) | 71 (0.5%) |
| 18 to 34 Years | 105 (0.4%) | 101 (0.4%) |
| 35 to 64 Years | 1,123 (3.8%) | 586 (1.9%) |
| 65 to 74 Years | 474 (7.3%) | 165 (2.2%) |
| 75 Years and over | 392 (11.3%) | 830 (17.7%) |
Technology Access in Lee County
Computing Device Access in Lee County
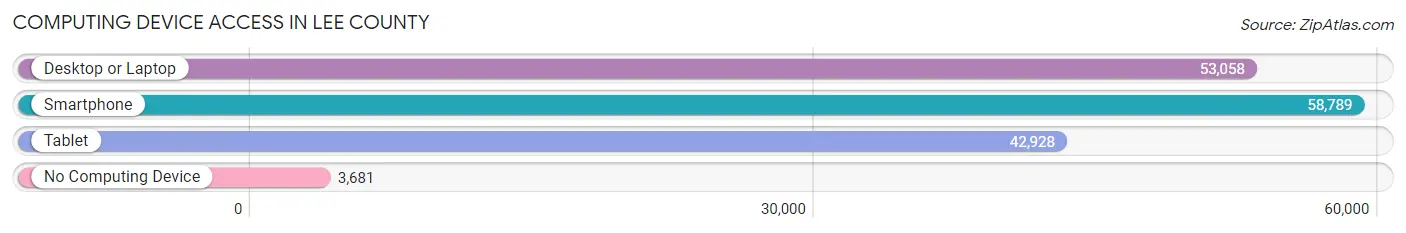
| Device Type | # Households | % Households |
| Desktop or Laptop | 53,058 | 81.4% |
| Smartphone | 58,789 | 90.2% |
| Tablet | 42,928 | 65.9% |
| No Computing Device | 3,681 | 5.7% |
| Total | 65,166 | 100.0% |
Internet Access in Lee County
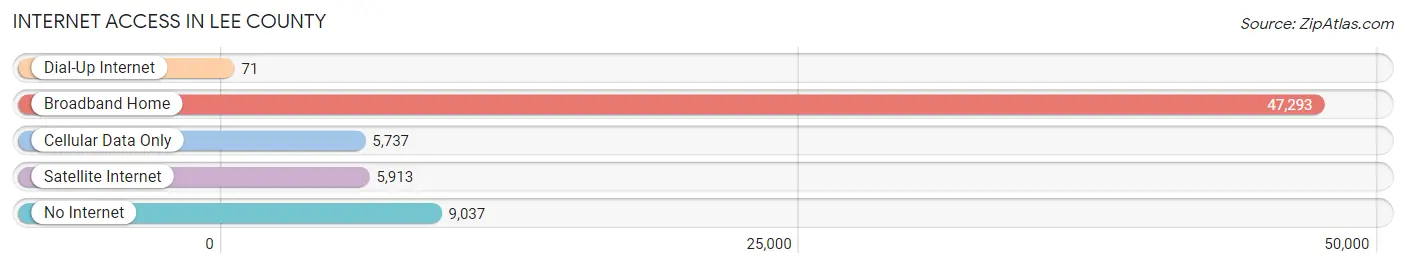
| Internet Type | # Households | % Households |
| Dial-Up Internet | 71 | 0.1% |
| Broadband Home | 47,293 | 72.6% |
| Cellular Data Only | 5,737 | 8.8% |
| Satellite Internet | 5,913 | 9.1% |
| No Internet | 9,037 | 13.9% |
| Total | 65,166 | 100.0% |
Lee County Summary
Lee County, Alabama is located in the east-central part of the state and is part of the Black Belt region. It is bordered by Macon County to the north, Russell County to the east, Chambers County to the south, and Tallapoosa County to the west. The county seat is Opelika, and the largest city is Auburn. The county was established in 1866 and named for Robert E. Lee, the commander of the Confederate Army of Northern Virginia during the American Civil War.
Geography
Lee County covers an area of 645 square miles and is located in the east-central part of the state. It is part of the Black Belt region, which is characterized by its rich, dark soil. The terrain is mostly flat, with some rolling hills in the northern part of the county. The county is drained by the Chattahoochee River, which forms the western boundary of the county. The county is also home to several lakes, including Lake Harding, Lake Martin, and Lake Chewacla.
Climate
Lee County has a humid subtropical climate, with hot, humid summers and mild winters. The average annual temperature is 64°F, and the average annual precipitation is 52 inches.
Demographics
As of the 2010 census, Lee County had a population of 140,247. The racial makeup of the county was 68.3% White, 28.2% Black or African American, 0.4% Native American, 1.7% Asian, 0.1% Pacific Islander, 0.7% from other races, and 2.0% from two or more races. Hispanic or Latino of any race were 2.7% of the population.
Economy
Lee County is home to several major employers, including Auburn University, East Alabama Medical Center, and the Auburn-Opelika Metropolitan Area. The county is also home to several manufacturing companies, including Kia Motors Manufacturing Georgia, which produces vehicles for the Korean automaker. The county is also home to several agricultural operations, including poultry farms, cattle farms, and timber operations.
The county has a strong tourism industry, with several attractions, including Chewacla State Park, the Robert Trent Jones Golf Trail, and the Auburn University Arboretum. The county is also home to several wineries and breweries, as well as several historic sites, including the Auburn-Opelika Historic District and the Old Lee County Courthouse.
Conclusion
Lee County, Alabama is a diverse and vibrant county located in the east-central part of the state. It is home to several major employers, including Auburn University, East Alabama Medical Center, and the Auburn-Opelika Metropolitan Area. The county is also home to several manufacturing companies, agricultural operations, and tourist attractions. Lee County is a great place to live, work, and play.
Common Questions
What is Per Capita Income in Lee County?
Per Capita income in Lee County is $33,083.
What is the Median Family Income in Lee County?
Median Family Income in Lee County is $86,772.
What is the Median Household income in Lee County?
Median Household Income in Lee County is $59,288.
What is Income or Wage Gap in Lee County?
Income or Wage Gap in Lee County is 28.5%.
Women in Lee County earn 71.5 cents for every dollar earned by a man.
What is Family Income Deficit in Lee County?
Family Income Deficit in Lee County is $11,094.
Families that are below poverty line in Lee County earn $11,094 less on average than the poverty threshold level.
What is Inequality or Gini Index in Lee County?
Inequality or Gini Index in Lee County is 0.51.
What is the Total Population of Lee County?
Total Population of Lee County is 175,126.
What is the Total Male Population of Lee County?
Total Male Population of Lee County is 86,692.
What is the Total Female Population of Lee County?
Total Female Population of Lee County is 88,434.
What is the Ratio of Males per 100 Females in Lee County?
There are 98.03 Males per 100 Females in Lee County.
What is the Ratio of Females per 100 Males in Lee County?
There are 102.01 Females per 100 Males in Lee County.
What is the Median Population Age in Lee County?
Median Population Age in Lee County is 33.0 Years.
What is the Average Family Size in Lee County
Average Family Size in Lee County is 3.2 People.
What is the Average Household Size in Lee County
Average Household Size in Lee County is 2.6 People.
How Large is the Labor Force in Lee County?
There are 85,245 People in the Labor Forcein in Lee County.
What is the Percentage of People in the Labor Force in Lee County?
59.6% of People are in the Labor Force in Lee County.
What is the Unemployment Rate in Lee County?
Unemployment Rate in Lee County is 3.8%.