DeKalb County, AL Map & Demographics
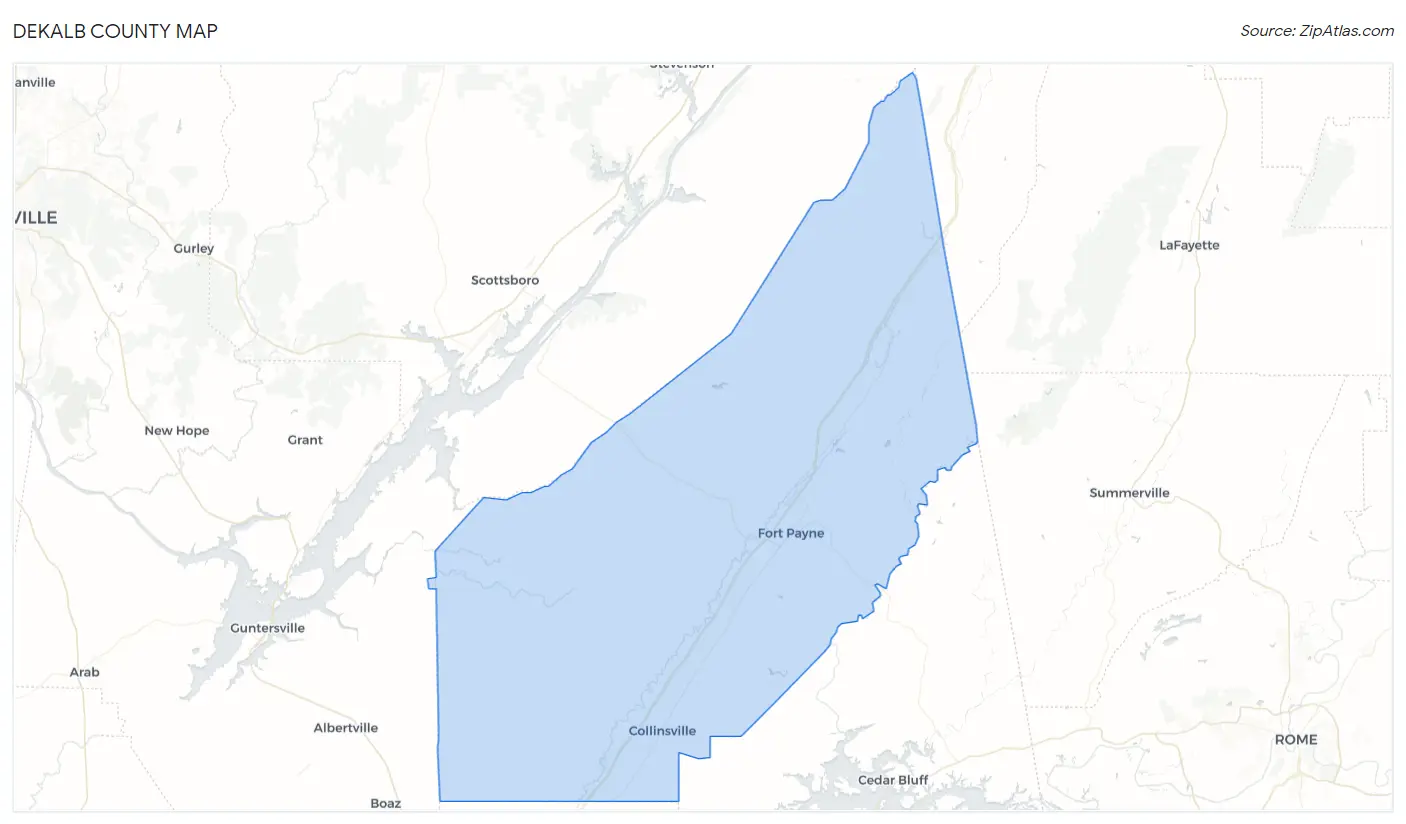
DeKalb County Map
DeKalb County Overview
$24,915
PER CAPITA INCOME
$59,225
AVG FAMILY INCOME
$47,920
AVG HOUSEHOLD INCOME
39.7%
WAGE / INCOME GAP [ % ]
60.3¢/ $1
WAGE / INCOME GAP [ $ ]
$9,959
FAMILY INCOME DEFICIT
0.46
INEQUALITY / GINI INDEX
71,680
TOTAL POPULATION
35,847
MALE POPULATION
35,833
FEMALE POPULATION
100.04
MALES / 100 FEMALES
99.96
FEMALES / 100 MALES
39.6
MEDIAN AGE
3.3
AVG FAMILY SIZE
2.8
AVG HOUSEHOLD SIZE
32,139
LABOR FORCE [ PEOPLE ]
56.5%
PERCENT IN LABOR FORCE
3.9%
UNEMPLOYMENT RATE
DeKalb County Area Codes
Income in DeKalb County
Income Overview in DeKalb County
Per Capita Income in DeKalb County is $24,915, while median incomes of families and households are $59,225 and $47,920 respectively.
| Characteristic | Number | Measure |
| Per Capita Income | 71,680 | $24,915 |
| Median Family Income | 18,137 | $59,225 |
| Mean Family Income | 18,137 | $75,673 |
| Median Household Income | 25,690 | $47,920 |
| Mean Household Income | 25,690 | $64,545 |
| Income Deficit | 18,137 | $9,959 |
| Wage / Income Gap (%) | 71,680 | 39.74% |
| Wage / Income Gap ($) | 71,680 | 60.26¢ per $1 |
| Gini / Inequality Index | 71,680 | 0.46 |
Earnings by Sex in DeKalb County
Average Earnings in DeKalb County are $31,564, $39,862 for men and $24,021 for women, a difference of 39.7%.
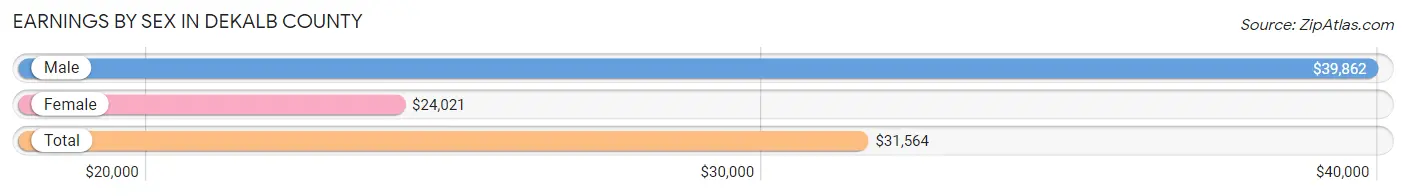
| Sex | Number | Average Earnings |
| Male | 18,649 (56.1%) | $39,862 |
| Female | 14,570 (43.9%) | $24,021 |
| Total | 33,219 (100.0%) | $31,564 |
Earnings by Sex by Income Bracket in DeKalb County
The most common earnings brackets in DeKalb County are $40,000 to $44,999 for men (1,780 | 9.5%) and $22,500 to $24,999 for women (1,349 | 9.3%).
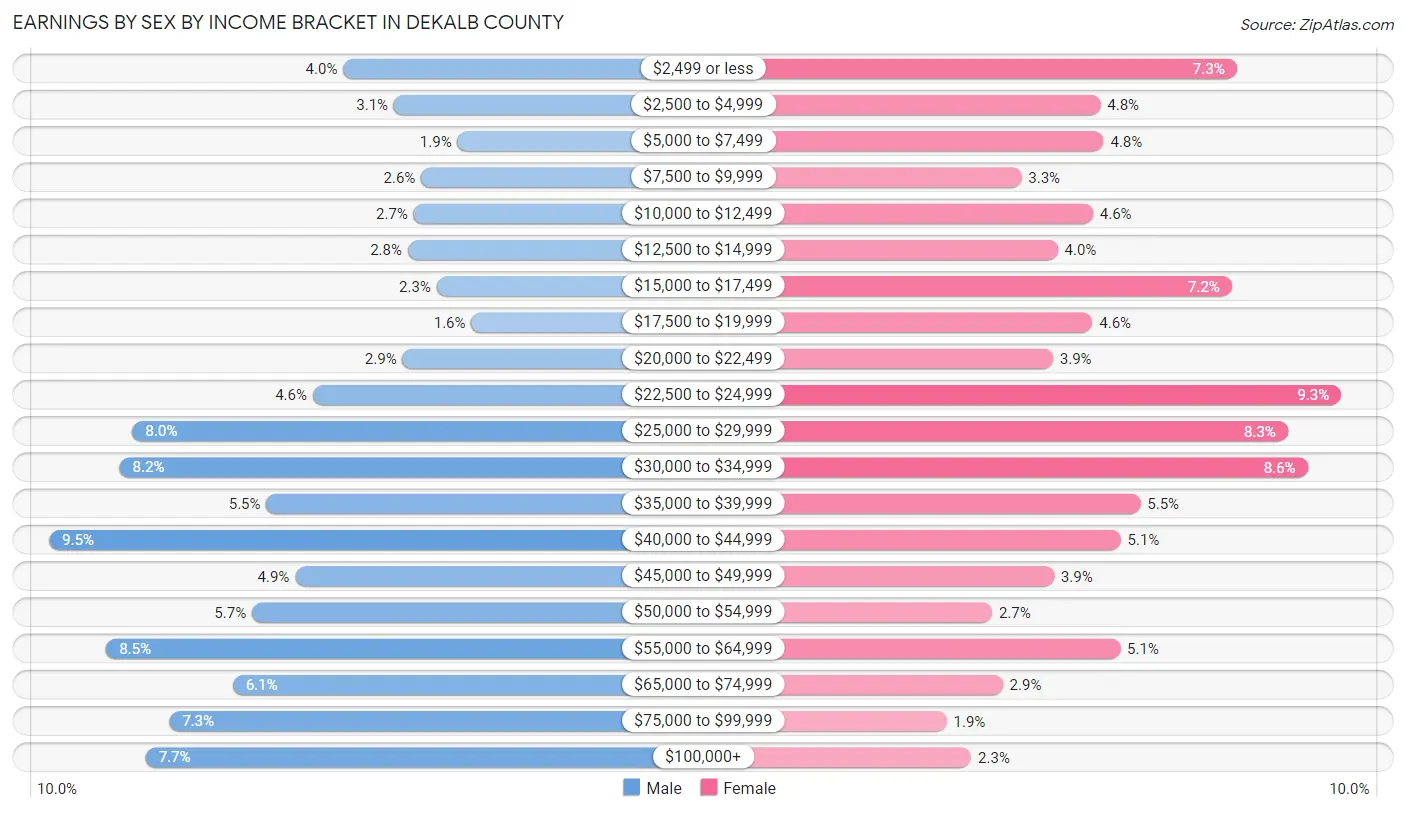
| Income | Male | Female |
| $2,499 or less | 751 (4.0%) | 1,063 (7.3%) |
| $2,500 to $4,999 | 574 (3.1%) | 692 (4.8%) |
| $5,000 to $7,499 | 353 (1.9%) | 701 (4.8%) |
| $7,500 to $9,999 | 480 (2.6%) | 477 (3.3%) |
| $10,000 to $12,499 | 505 (2.7%) | 672 (4.6%) |
| $12,500 to $14,999 | 525 (2.8%) | 576 (4.0%) |
| $15,000 to $17,499 | 425 (2.3%) | 1,050 (7.2%) |
| $17,500 to $19,999 | 304 (1.6%) | 670 (4.6%) |
| $20,000 to $22,499 | 545 (2.9%) | 563 (3.9%) |
| $22,500 to $24,999 | 857 (4.6%) | 1,349 (9.3%) |
| $25,000 to $29,999 | 1,488 (8.0%) | 1,203 (8.3%) |
| $30,000 to $34,999 | 1,533 (8.2%) | 1,257 (8.6%) |
| $35,000 to $39,999 | 1,021 (5.5%) | 801 (5.5%) |
| $40,000 to $44,999 | 1,780 (9.5%) | 748 (5.1%) |
| $45,000 to $49,999 | 920 (4.9%) | 566 (3.9%) |
| $50,000 to $54,999 | 1,071 (5.7%) | 397 (2.7%) |
| $55,000 to $64,999 | 1,579 (8.5%) | 746 (5.1%) |
| $65,000 to $74,999 | 1,137 (6.1%) | 426 (2.9%) |
| $75,000 to $99,999 | 1,360 (7.3%) | 273 (1.9%) |
| $100,000+ | 1,441 (7.7%) | 340 (2.3%) |
| Total | 18,649 (100.0%) | 14,570 (100.0%) |
Earnings by Sex by Educational Attainment in DeKalb County
Average earnings in DeKalb County are $42,249 for men and $26,261 for women, a difference of 37.8%. Men with an educational attainment of graduate degree enjoy the highest average annual earnings of $68,151, while those with less than high school education earn the least with $29,912. Women with an educational attainment of graduate degree earn the most with the average annual earnings of $57,570, while those with high school diploma education have the smallest earnings of $19,900.
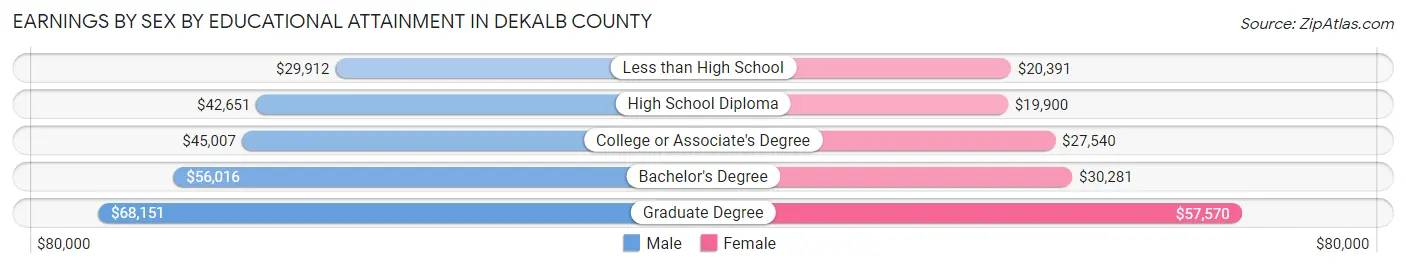
| Educational Attainment | Male Income | Female Income |
| Less than High School | $29,912 | $20,391 |
| High School Diploma | $42,651 | $19,900 |
| College or Associate's Degree | $45,007 | $27,540 |
| Bachelor's Degree | $56,016 | $30,281 |
| Graduate Degree | $68,151 | $57,570 |
| Total | $42,249 | $26,261 |
Family Income in DeKalb County
Family Income Brackets in DeKalb County
According to the DeKalb County family income data, there are 3,736 families falling into the $50,000 to $74,999 income range, which is the most common income bracket and makes up 20.6% of all families. Conversely, the $10,000 to $14,999 income bracket is the least frequent group with only 453 families (2.5%) belonging to this category.
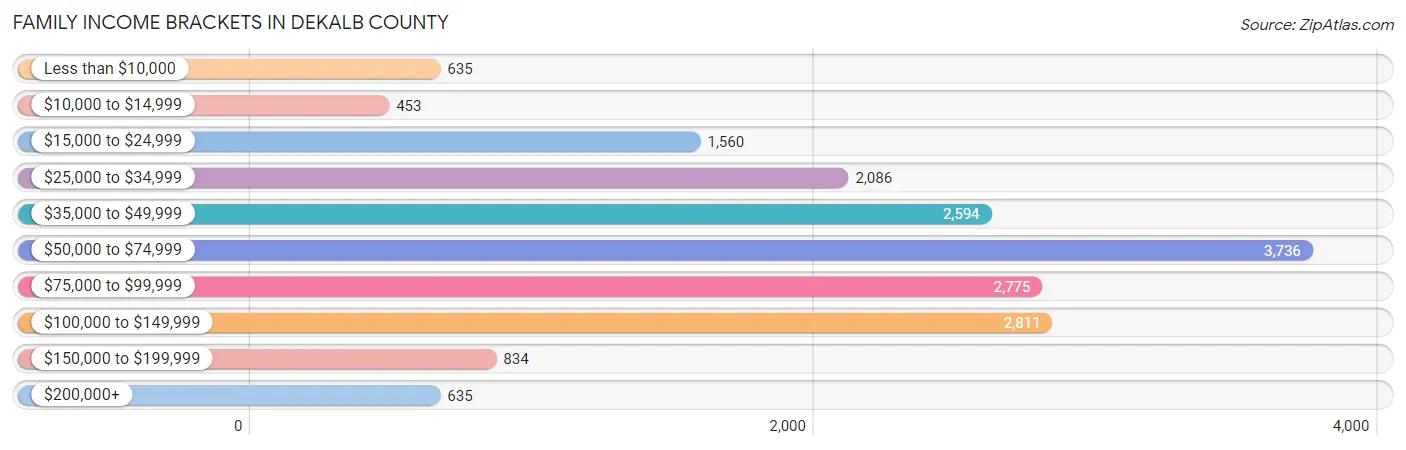
| Income Bracket | # Families | % Families |
| Less than $10,000 | 635 | 3.5% |
| $10,000 to $14,999 | 453 | 2.5% |
| $15,000 to $24,999 | 1,560 | 8.6% |
| $25,000 to $34,999 | 2,086 | 11.5% |
| $35,000 to $49,999 | 2,594 | 14.3% |
| $50,000 to $74,999 | 3,736 | 20.6% |
| $75,000 to $99,999 | 2,775 | 15.3% |
| $100,000 to $149,999 | 2,811 | 15.5% |
| $150,000 to $199,999 | 834 | 4.6% |
| $200,000+ | 635 | 3.5% |
Family Income by Famaliy Size in DeKalb County
6-person families (423 | 2.3%) account for the highest median family income in DeKalb County with $75,625 per family, while 2-person families (8,721 | 48.1%) have the highest median income of $27,786 per family member.
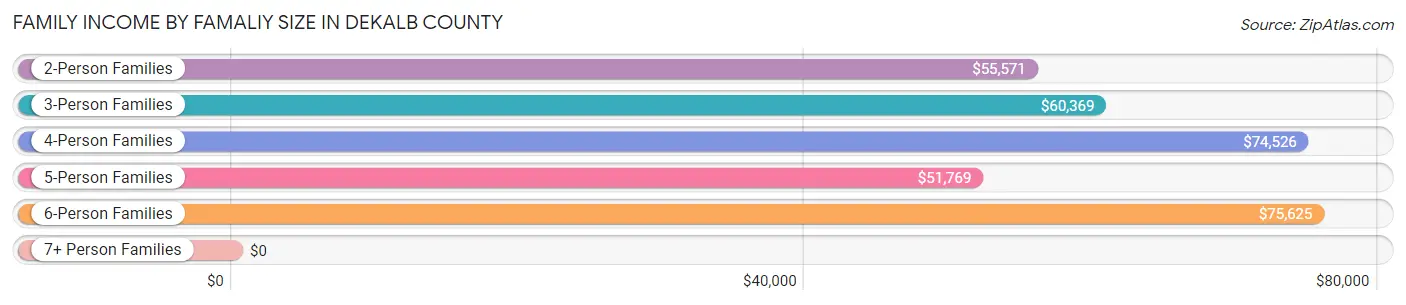
| Income Bracket | # Families | Median Income |
| 2-Person Families | 8,721 (48.1%) | $55,571 |
| 3-Person Families | 3,759 (20.7%) | $60,369 |
| 4-Person Families | 3,058 (16.9%) | $74,526 |
| 5-Person Families | 1,802 (9.9%) | $51,769 |
| 6-Person Families | 423 (2.3%) | $75,625 |
| 7+ Person Families | 374 (2.1%) | $0 |
| Total | 18,137 (100.0%) | $59,225 |
Family Income by Number of Earners in DeKalb County
The median family income in DeKalb County is $59,225, with families comprising 3+ earners (1,899) having the highest median family income of $105,580, while families with no earners (3,595) have the lowest median family income of $31,918, accounting for 10.5% and 19.8% of families, respectively.
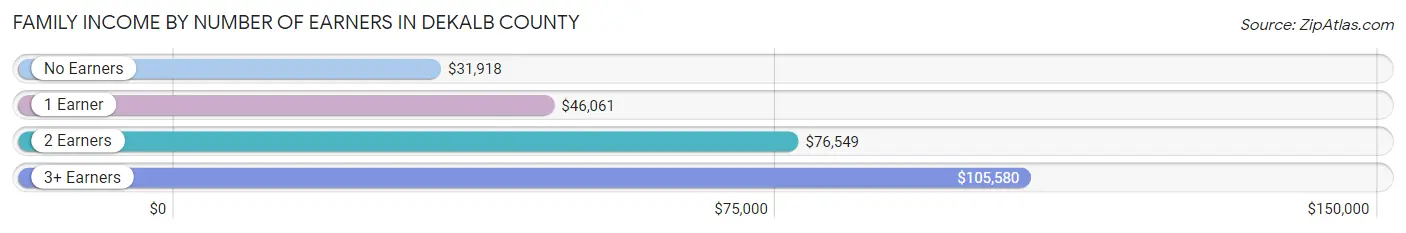
| Number of Earners | # Families | Median Income |
| No Earners | 3,595 (19.8%) | $31,918 |
| 1 Earner | 5,717 (31.5%) | $46,061 |
| 2 Earners | 6,926 (38.2%) | $76,549 |
| 3+ Earners | 1,899 (10.5%) | $105,580 |
| Total | 18,137 (100.0%) | $59,225 |
Household Income in DeKalb County
Household Income Brackets in DeKalb County
With 4,650 households falling in the category, the $50,000 to $74,999 income range is the most frequent in DeKalb County, accounting for 18.1% of all households. In contrast, only 694 households (2.7%) fall into the $200,000+ income bracket, making it the least populous group.
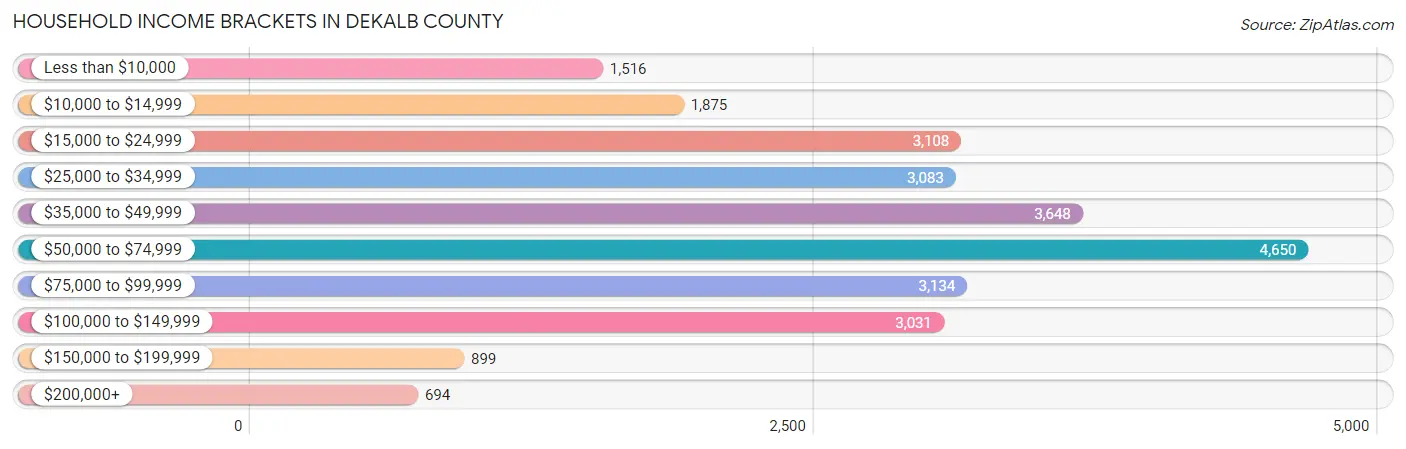
| Income Bracket | # Households | % Households |
| Less than $10,000 | 1,516 | 5.9% |
| $10,000 to $14,999 | 1,875 | 7.3% |
| $15,000 to $24,999 | 3,108 | 12.1% |
| $25,000 to $34,999 | 3,083 | 12.0% |
| $35,000 to $49,999 | 3,648 | 14.2% |
| $50,000 to $74,999 | 4,650 | 18.1% |
| $75,000 to $99,999 | 3,134 | 12.2% |
| $100,000 to $149,999 | 3,031 | 11.8% |
| $150,000 to $199,999 | 899 | 3.5% |
| $200,000+ | 694 | 2.7% |
Household Income by Householder Age in DeKalb County
The median household income in DeKalb County is $47,920, with the highest median household income of $57,990 found in the 25 to 44 years age bracket for the primary householder. A total of 7,766 households (30.2%) fall into this category. Meanwhile, the 65+ years age bracket for the primary householder has the lowest median household income of $33,457, with 7,557 households (29.4%) in this group.
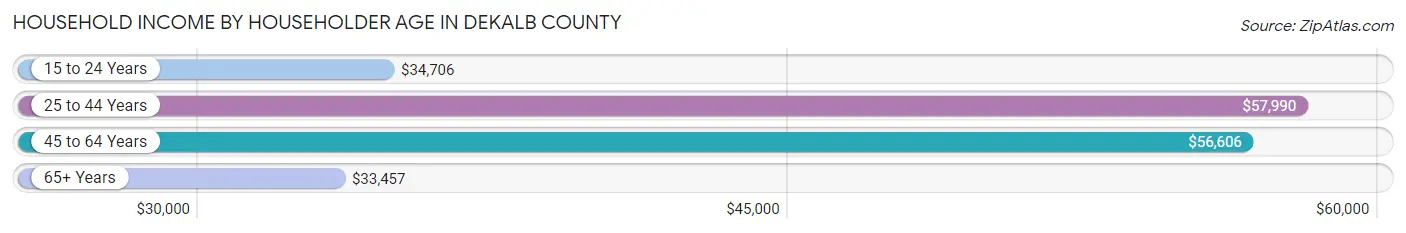
| Income Bracket | # Households | Median Income |
| 15 to 24 Years | 586 (2.3%) | $34,706 |
| 25 to 44 Years | 7,766 (30.2%) | $57,990 |
| 45 to 64 Years | 9,781 (38.1%) | $56,606 |
| 65+ Years | 7,557 (29.4%) | $33,457 |
| Total | 25,690 (100.0%) | $47,920 |
Poverty in DeKalb County
Income Below Poverty by Sex and Age in DeKalb County
With 18.2% poverty level for males and 22.3% for females among the residents of DeKalb County, 15 year old males and 16 and 17 year old females are the most vulnerable to poverty, with 170 males (47.5%) and 486 females (44.6%) in their respective age groups living below the poverty level.
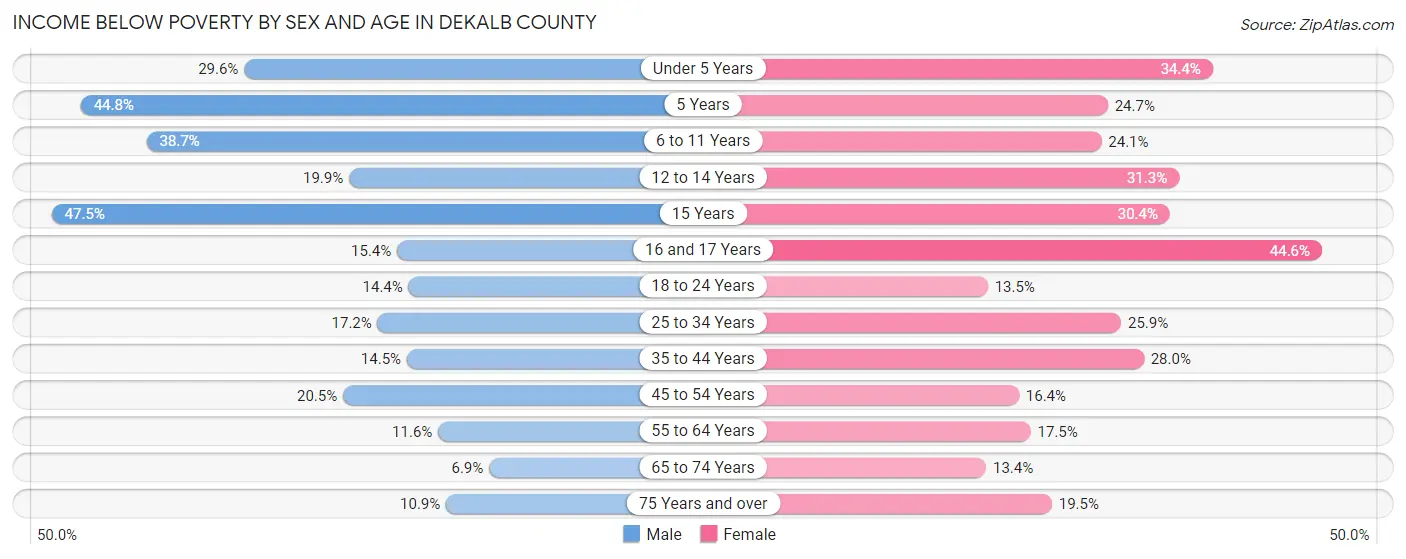
| Age Bracket | Male | Female |
| Under 5 Years | 599 (29.6%) | 666 (34.4%) |
| 5 Years | 189 (44.8%) | 77 (24.7%) |
| 6 to 11 Years | 1,170 (38.7%) | 632 (24.1%) |
| 12 to 14 Years | 292 (19.9%) | 557 (31.3%) |
| 15 Years | 170 (47.5%) | 137 (30.4%) |
| 16 and 17 Years | 194 (15.4%) | 486 (44.6%) |
| 18 to 24 Years | 457 (14.4%) | 392 (13.5%) |
| 25 to 34 Years | 740 (17.2%) | 1,061 (25.9%) |
| 35 to 44 Years | 628 (14.5%) | 1,278 (28.0%) |
| 45 to 54 Years | 952 (20.4%) | 727 (16.4%) |
| 55 to 64 Years | 538 (11.6%) | 828 (17.5%) |
| 65 to 74 Years | 249 (6.9%) | 509 (13.4%) |
| 75 Years and over | 202 (10.9%) | 521 (19.5%) |
| Total | 6,380 (18.2%) | 7,871 (22.3%) |
Income Above Poverty by Sex and Age in DeKalb County
According to the poverty statistics in DeKalb County, males aged 65 to 74 years and females aged 65 to 74 years are the age groups that are most secure financially, with 93.1% of males and 86.6% of females in these age groups living above the poverty line.
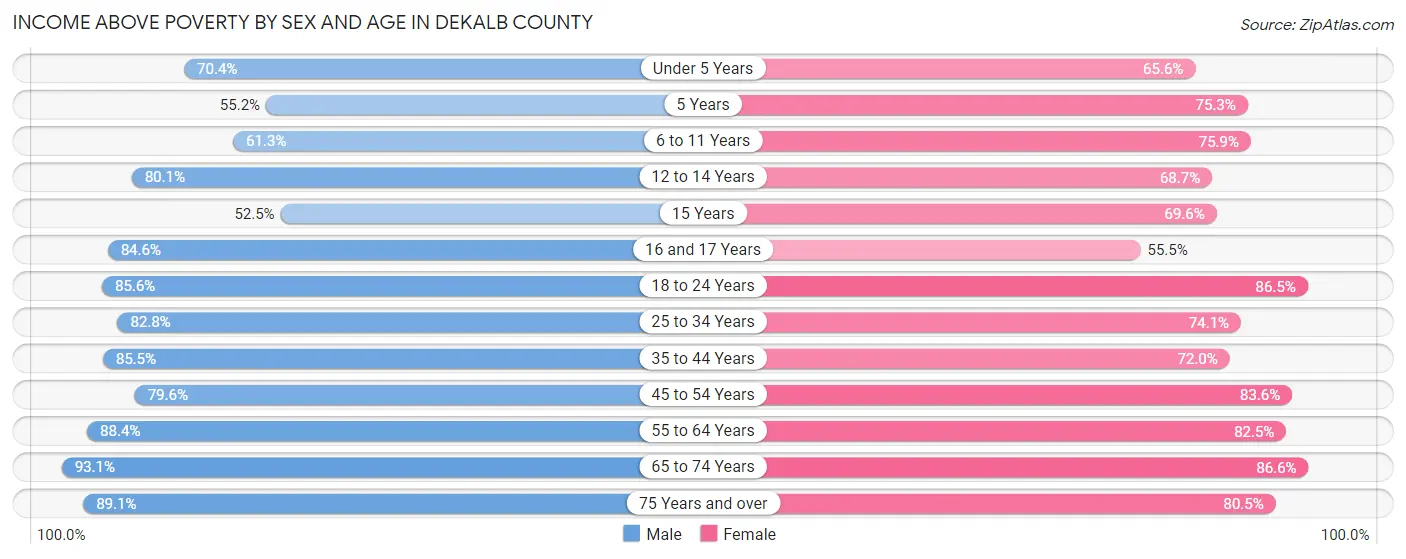
| Age Bracket | Male | Female |
| Under 5 Years | 1,423 (70.4%) | 1,269 (65.6%) |
| 5 Years | 233 (55.2%) | 235 (75.3%) |
| 6 to 11 Years | 1,854 (61.3%) | 1,992 (75.9%) |
| 12 to 14 Years | 1,176 (80.1%) | 1,223 (68.7%) |
| 15 Years | 188 (52.5%) | 313 (69.6%) |
| 16 and 17 Years | 1,063 (84.6%) | 605 (55.4%) |
| 18 to 24 Years | 2,726 (85.6%) | 2,503 (86.5%) |
| 25 to 34 Years | 3,553 (82.8%) | 3,033 (74.1%) |
| 35 to 44 Years | 3,696 (85.5%) | 3,283 (72.0%) |
| 45 to 54 Years | 3,704 (79.5%) | 3,697 (83.6%) |
| 55 to 64 Years | 4,090 (88.4%) | 3,897 (82.5%) |
| 65 to 74 Years | 3,367 (93.1%) | 3,293 (86.6%) |
| 75 Years and over | 1,654 (89.1%) | 2,152 (80.5%) |
| Total | 28,727 (81.8%) | 27,495 (77.7%) |
Income Below Poverty Among Married-Couple Families in DeKalb County
The poverty statistics for married-couple families in DeKalb County show that 10.1% or 1,448 of the total 14,339 families live below the poverty line. Families with 5 or more children have the highest poverty rate of 78.7%, comprising of 155 families. On the other hand, families with no children have the lowest poverty rate of 5.6%, which includes 464 families.
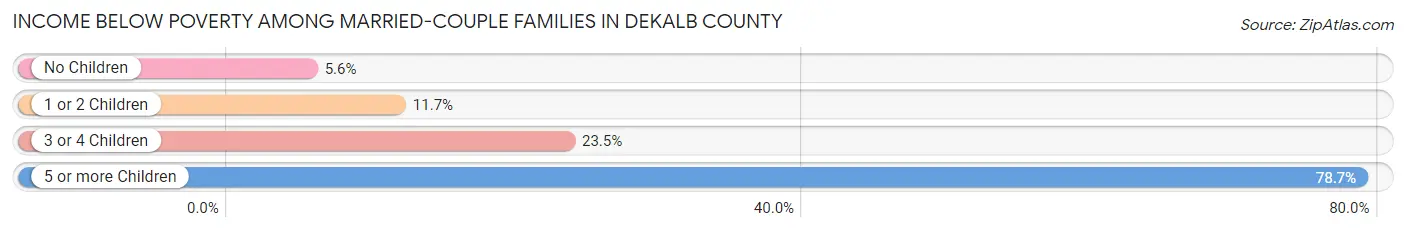
| Children | Above Poverty | Below Poverty |
| No Children | 7,900 (94.5%) | 464 (5.6%) |
| 1 or 2 Children | 3,951 (88.3%) | 523 (11.7%) |
| 3 or 4 Children | 998 (76.5%) | 306 (23.5%) |
| 5 or more Children | 42 (21.3%) | 155 (78.7%) |
| Total | 12,891 (89.9%) | 1,448 (10.1%) |
Income Below Poverty Among Single-Parent Households in DeKalb County
According to the poverty data in DeKalb County, 28.3% or 312 single-father households and 34.7% or 935 single-mother households are living below the poverty line. Among single-father households, those with 3 or 4 children have the highest poverty rate, with 67 households (45.3%) experiencing poverty. Likewise, among single-mother households, those with 3 or 4 children have the highest poverty rate, with 231 households (78.3%) falling below the poverty line.
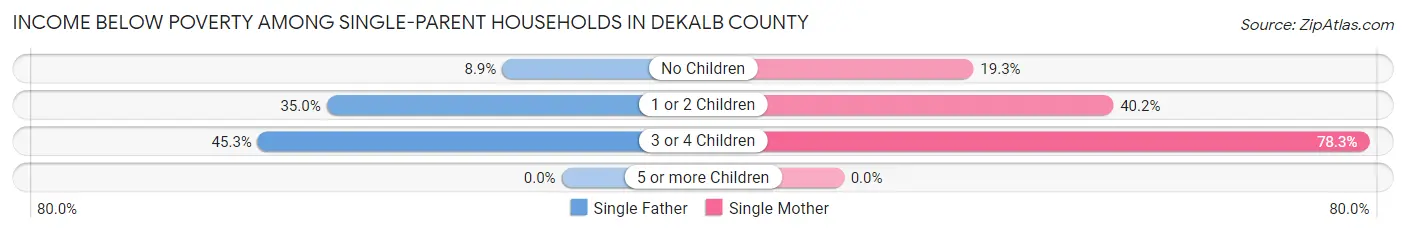
| Children | Single Father | Single Mother |
| No Children | 30 (8.8%) | 242 (19.3%) |
| 1 or 2 Children | 215 (35.0%) | 462 (40.2%) |
| 3 or 4 Children | 67 (45.3%) | 231 (78.3%) |
| 5 or more Children | 0 (0.0%) | 0 (0.0%) |
| Total | 312 (28.3%) | 935 (34.7%) |
Income Below Poverty Among Married-Couple vs Single-Parent Households in DeKalb County
The poverty data for DeKalb County shows that 1,448 of the married-couple family households (10.1%) and 1,247 of the single-parent households (32.8%) are living below the poverty level. Within the married-couple family households, those with 5 or more children have the highest poverty rate, with 155 households (78.7%) falling below the poverty line. Among the single-parent households, those with 3 or 4 children have the highest poverty rate, with 298 household (67.3%) living below poverty.
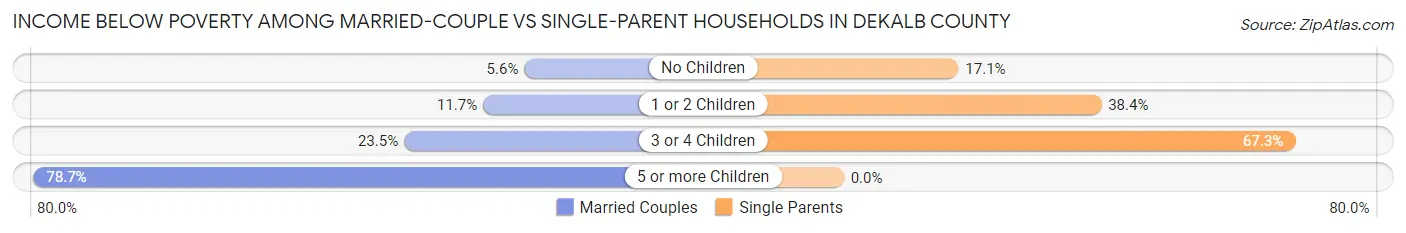
| Children | Married-Couple Families | Single-Parent Households |
| No Children | 464 (5.6%) | 272 (17.1%) |
| 1 or 2 Children | 523 (11.7%) | 677 (38.4%) |
| 3 or 4 Children | 306 (23.5%) | 298 (67.3%) |
| 5 or more Children | 155 (78.7%) | 0 (0.0%) |
| Total | 1,448 (10.1%) | 1,247 (32.8%) |
Race in DeKalb County
The most populous races in DeKalb County are White / Caucasian (59,102 | 82.5%), Hispanic or Latino (11,021 | 15.4%), and Some other Race (6,443 | 9.0%).
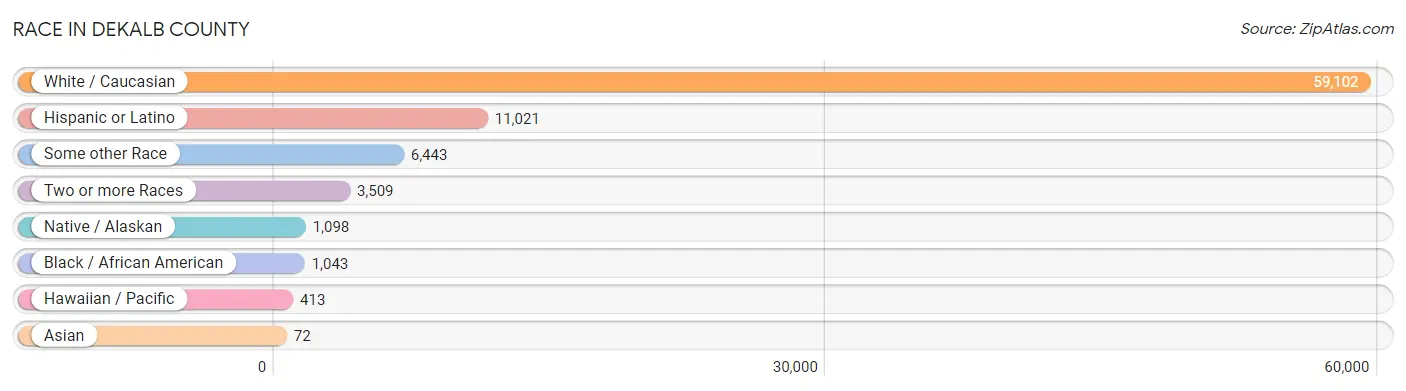
| Race | # Population | % Population |
| Asian | 72 | 0.1% |
| Black / African American | 1,043 | 1.5% |
| Hawaiian / Pacific | 413 | 0.6% |
| Hispanic or Latino | 11,021 | 15.4% |
| Native / Alaskan | 1,098 | 1.5% |
| White / Caucasian | 59,102 | 82.5% |
| Two or more Races | 3,509 | 4.9% |
| Some other Race | 6,443 | 9.0% |
| Total | 71,680 | 100.0% |
Ancestry in DeKalb County
The most populous ancestries reported in DeKalb County are American (10,016 | 14.0%), English (6,969 | 9.7%), Irish (6,364 | 8.9%), Mexican (6,261 | 8.7%), and Central American (4,312 | 6.0%), together accounting for 47.3% of all DeKalb County residents.
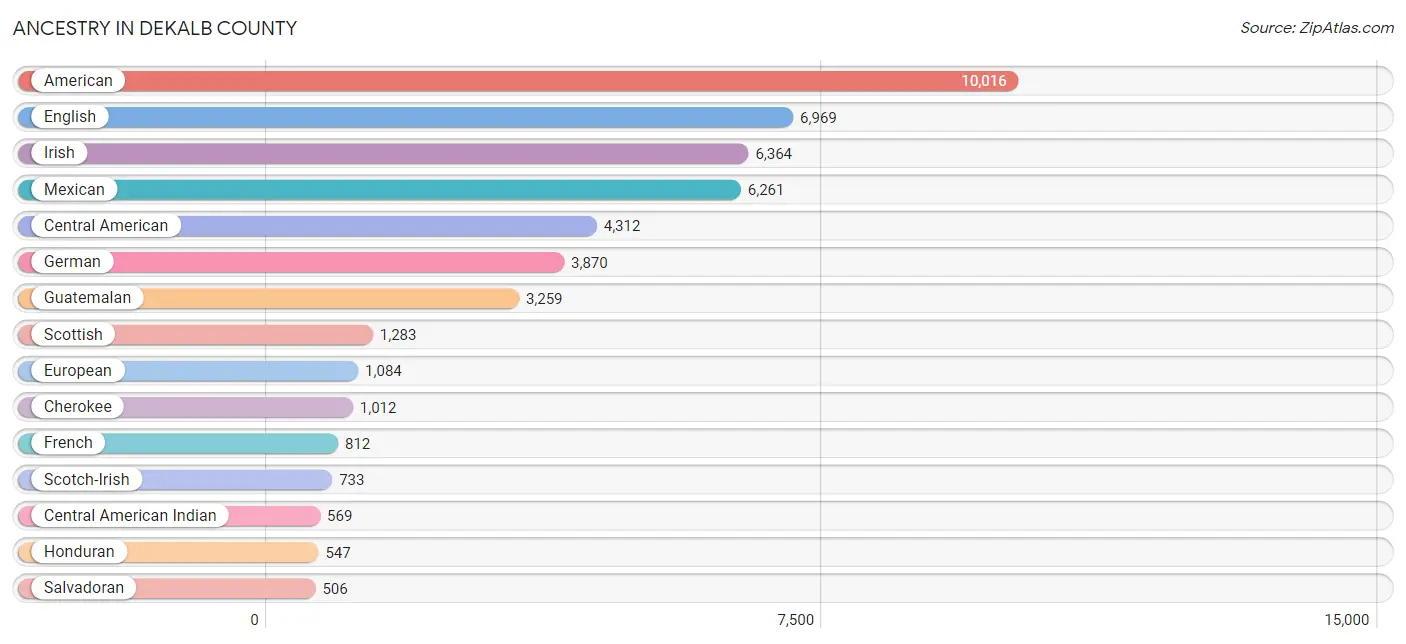
| Ancestry | # Population | % Population |
| African | 284 | 0.4% |
| Alaska Native | 72 | 0.1% |
| American | 10,016 | 14.0% |
| Arab | 25 | 0.0% |
| Armenian | 10 | 0.0% |
| Australian | 17 | 0.0% |
| Austrian | 10 | 0.0% |
| Basque | 19 | 0.0% |
| Belgian | 21 | 0.0% |
| Belizean | 48 | 0.1% |
| Bhutanese | 22 | 0.0% |
| Blackfeet | 66 | 0.1% |
| British | 216 | 0.3% |
| Cajun | 7 | 0.0% |
| Canadian | 11 | 0.0% |
| Central American | 4,312 | 6.0% |
| Central American Indian | 569 | 0.8% |
| Cherokee | 1,012 | 1.4% |
| Chippewa | 42 | 0.1% |
| Colombian | 40 | 0.1% |
| Creek | 88 | 0.1% |
| Cuban | 109 | 0.2% |
| Czech | 42 | 0.1% |
| Czechoslovakian | 3 | 0.0% |
| Danish | 22 | 0.0% |
| Dutch | 448 | 0.6% |
| Eastern European | 44 | 0.1% |
| English | 6,969 | 9.7% |
| European | 1,084 | 1.5% |
| Finnish | 57 | 0.1% |
| French | 812 | 1.1% |
| French Canadian | 14 | 0.0% |
| German | 3,870 | 5.4% |
| Greek | 95 | 0.1% |
| Guamanian / Chamorro | 10 | 0.0% |
| Guatemalan | 3,259 | 4.5% |
| Honduran | 547 | 0.8% |
| Hungarian | 22 | 0.0% |
| Irish | 6,364 | 8.9% |
| Iroquois | 5 | 0.0% |
| Italian | 433 | 0.6% |
| Jamaican | 9 | 0.0% |
| Korean | 111 | 0.2% |
| Latvian | 11 | 0.0% |
| Lebanese | 5 | 0.0% |
| Lithuanian | 1 | 0.0% |
| Mexican | 6,261 | 8.7% |
| Mexican American Indian | 133 | 0.2% |
| Native Hawaiian | 392 | 0.5% |
| Navajo | 1 | 0.0% |
| Northern European | 17 | 0.0% |
| Norwegian | 153 | 0.2% |
| Osage | 17 | 0.0% |
| Peruvian | 87 | 0.1% |
| Polish | 319 | 0.4% |
| Portuguese | 41 | 0.1% |
| Puerto Rican | 39 | 0.1% |
| Russian | 64 | 0.1% |
| Salvadoran | 506 | 0.7% |
| Scandinavian | 178 | 0.3% |
| Scotch-Irish | 733 | 1.0% |
| Scottish | 1,283 | 1.8% |
| South African | 42 | 0.1% |
| South American | 127 | 0.2% |
| South American Indian | 3 | 0.0% |
| Spanish | 13 | 0.0% |
| Spanish American | 27 | 0.0% |
| Subsaharan African | 326 | 0.4% |
| Swedish | 145 | 0.2% |
| Swiss | 5 | 0.0% |
| Syrian | 20 | 0.0% |
| Thai | 3 | 0.0% |
| Ukrainian | 18 | 0.0% |
| Welsh | 149 | 0.2% | View All 74 Rows |
Immigrants in DeKalb County
The most numerous immigrant groups reported in DeKalb County came from Latin America (4,936 | 6.9%), Central America (4,911 | 6.9%), Mexico (2,710 | 3.8%), Guatemala (1,725 | 2.4%), and Honduras (279 | 0.4%), together accounting for 20.3% of all DeKalb County residents.
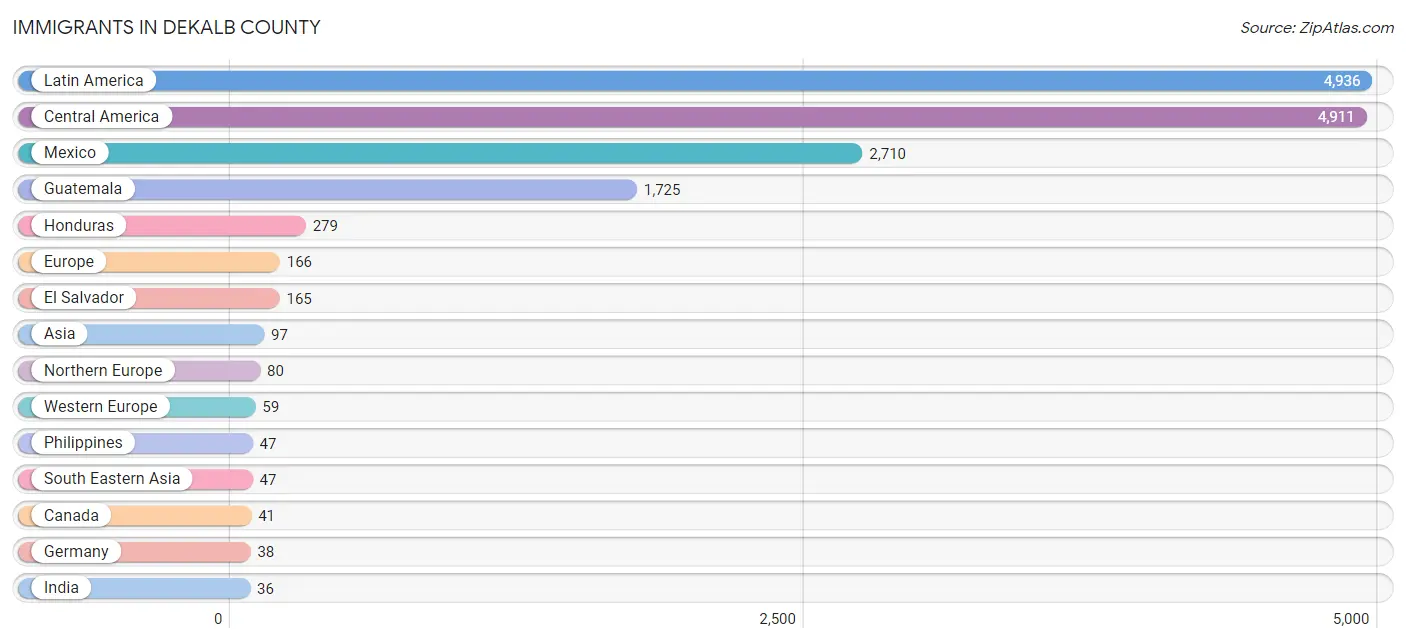
| Immigration Origin | # Population | % Population |
| Africa | 17 | 0.0% |
| Asia | 97 | 0.1% |
| Belgium | 21 | 0.0% |
| Belize | 28 | 0.0% |
| Canada | 41 | 0.1% |
| Central America | 4,911 | 6.9% |
| Colombia | 25 | 0.0% |
| Eastern Asia | 5 | 0.0% |
| Eastern Europe | 27 | 0.0% |
| El Salvador | 165 | 0.2% |
| England | 23 | 0.0% |
| Europe | 166 | 0.2% |
| Germany | 38 | 0.1% |
| Guatemala | 1,725 | 2.4% |
| Honduras | 279 | 0.4% |
| India | 36 | 0.1% |
| Japan | 5 | 0.0% |
| Latin America | 4,936 | 6.9% |
| Mexico | 2,710 | 3.8% |
| Micronesia | 20 | 0.0% |
| Northern Europe | 80 | 0.1% |
| Oceania | 20 | 0.0% |
| Panama | 4 | 0.0% |
| Philippines | 47 | 0.1% |
| Romania | 27 | 0.0% |
| Saudi Arabia | 9 | 0.0% |
| South Africa | 17 | 0.0% |
| South America | 25 | 0.0% |
| South Central Asia | 36 | 0.1% |
| South Eastern Asia | 47 | 0.1% |
| Western Asia | 9 | 0.0% |
| Western Europe | 59 | 0.1% | View All 32 Rows |
Sex and Age in DeKalb County
Sex and Age in DeKalb County
The most populous age groups in DeKalb County are 10 to 14 Years (2,742 | 7.6%) for men and 10 to 14 Years (2,991 | 8.4%) for women.
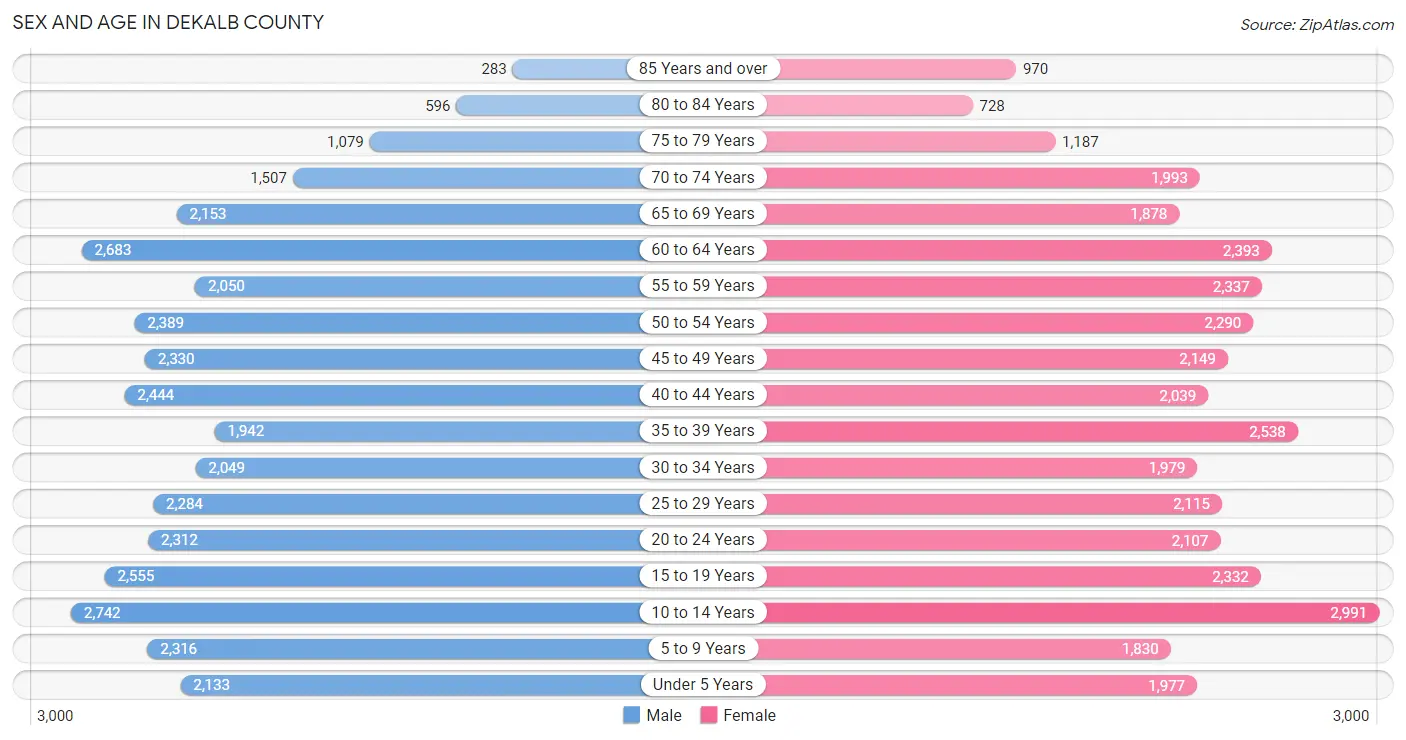
| Age Bracket | Male | Female |
| Under 5 Years | 2,133 (5.9%) | 1,977 (5.5%) |
| 5 to 9 Years | 2,316 (6.5%) | 1,830 (5.1%) |
| 10 to 14 Years | 2,742 (7.6%) | 2,991 (8.4%) |
| 15 to 19 Years | 2,555 (7.1%) | 2,332 (6.5%) |
| 20 to 24 Years | 2,312 (6.5%) | 2,107 (5.9%) |
| 25 to 29 Years | 2,284 (6.4%) | 2,115 (5.9%) |
| 30 to 34 Years | 2,049 (5.7%) | 1,979 (5.5%) |
| 35 to 39 Years | 1,942 (5.4%) | 2,538 (7.1%) |
| 40 to 44 Years | 2,444 (6.8%) | 2,039 (5.7%) |
| 45 to 49 Years | 2,330 (6.5%) | 2,149 (6.0%) |
| 50 to 54 Years | 2,389 (6.7%) | 2,290 (6.4%) |
| 55 to 59 Years | 2,050 (5.7%) | 2,337 (6.5%) |
| 60 to 64 Years | 2,683 (7.5%) | 2,393 (6.7%) |
| 65 to 69 Years | 2,153 (6.0%) | 1,878 (5.2%) |
| 70 to 74 Years | 1,507 (4.2%) | 1,993 (5.6%) |
| 75 to 79 Years | 1,079 (3.0%) | 1,187 (3.3%) |
| 80 to 84 Years | 596 (1.7%) | 728 (2.0%) |
| 85 Years and over | 283 (0.8%) | 970 (2.7%) |
| Total | 35,847 (100.0%) | 35,833 (100.0%) |
Families and Households in DeKalb County
Median Family Size in DeKalb County
The median family size in DeKalb County is 3.32 persons per family, with single male/father families (1,101 | 6.1%) accounting for the largest median family size of 3.44 persons per family. On the other hand, married-couple families (14,339 | 79.1%) represent the smallest median family size with 3.29 persons per family.
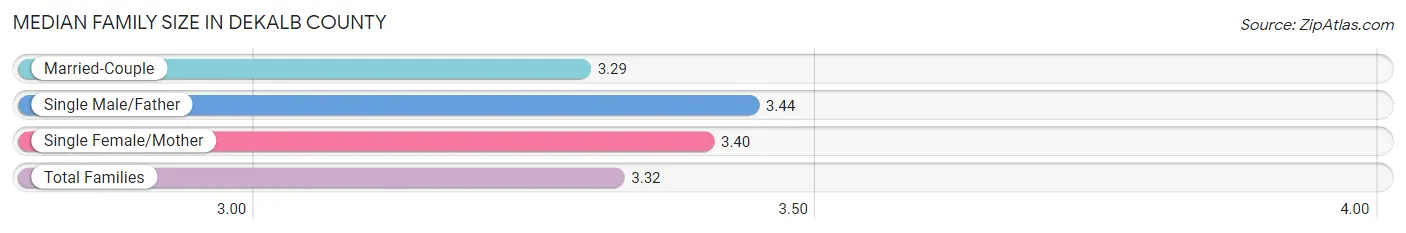
| Family Type | # Families | Family Size |
| Married-Couple | 14,339 (79.1%) | 3.29 |
| Single Male/Father | 1,101 (6.1%) | 3.44 |
| Single Female/Mother | 2,697 (14.9%) | 3.40 |
| Total Families | 18,137 (100.0%) | 3.32 |
Median Household Size in DeKalb County
The median household size in DeKalb County is 2.75 persons per household, with single male/father households (1,101 | 4.3%) accounting for the largest median household size of 3.83 persons per household. non-family households (7,553 | 29.4%) represent the smallest median household size with 1.16 persons per household.
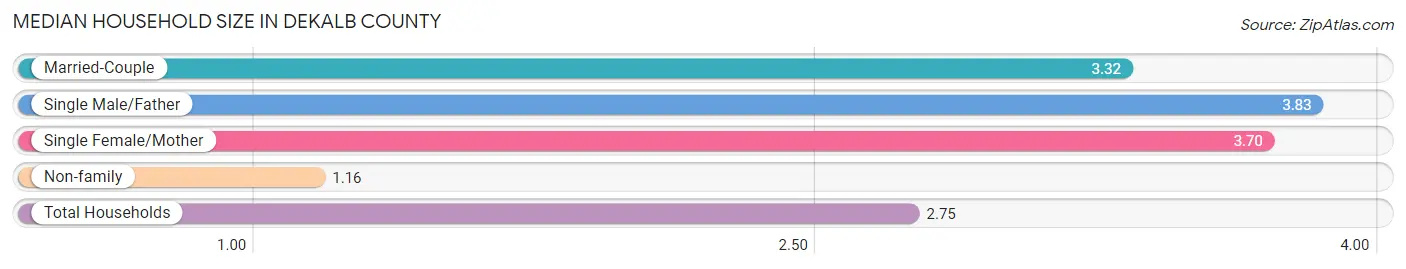
| Household Type | # Households | Household Size |
| Married-Couple | 14,339 (55.8%) | 3.32 |
| Single Male/Father | 1,101 (4.3%) | 3.83 |
| Single Female/Mother | 2,697 (10.5%) | 3.70 |
| Non-family | 7,553 (29.4%) | 1.16 |
| Total Households | 25,690 (100.0%) | 2.75 |
Household Size by Marriage Status in DeKalb County
Out of a total of 25,690 households in DeKalb County, 18,137 (70.6%) are family households, while 7,553 (29.4%) are nonfamily households. The most numerous type of family households are 2-person households, comprising 8,349, and the most common type of nonfamily households are 1-person households, comprising 6,833.
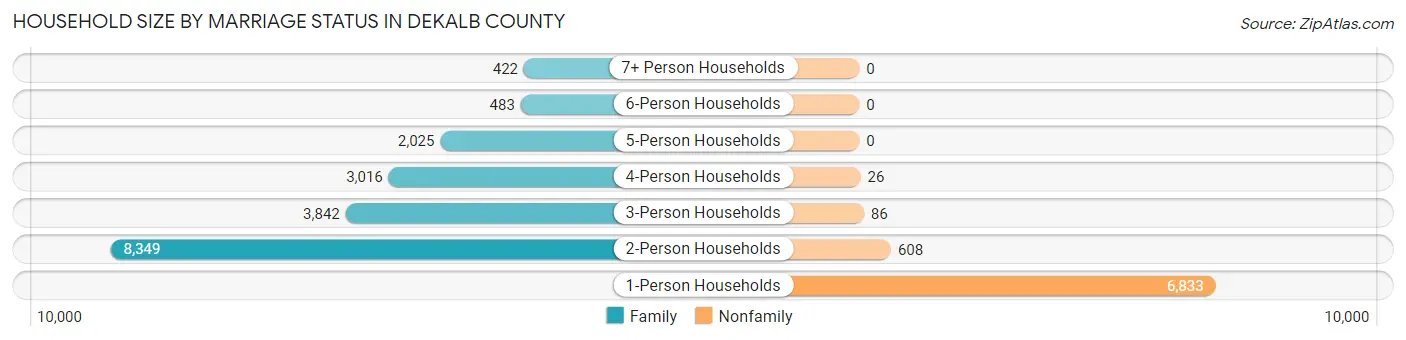
| Household Size | Family Households | Nonfamily Households |
| 1-Person Households | - | 6,833 (26.6%) |
| 2-Person Households | 8,349 (32.5%) | 608 (2.4%) |
| 3-Person Households | 3,842 (15.0%) | 86 (0.3%) |
| 4-Person Households | 3,016 (11.7%) | 26 (0.1%) |
| 5-Person Households | 2,025 (7.9%) | 0 (0.0%) |
| 6-Person Households | 483 (1.9%) | 0 (0.0%) |
| 7+ Person Households | 422 (1.6%) | 0 (0.0%) |
| Total | 18,137 (70.6%) | 7,553 (29.4%) |
Female Fertility in DeKalb County
Fertility by Age in DeKalb County
Average fertility rate in DeKalb County is 63.0 births per 1,000 women. Women in the age bracket of 20 to 34 years have the highest fertility rate with 124.0 births per 1,000 women. Women in the age bracket of 20 to 34 years acount for 77.0% of all women with births.
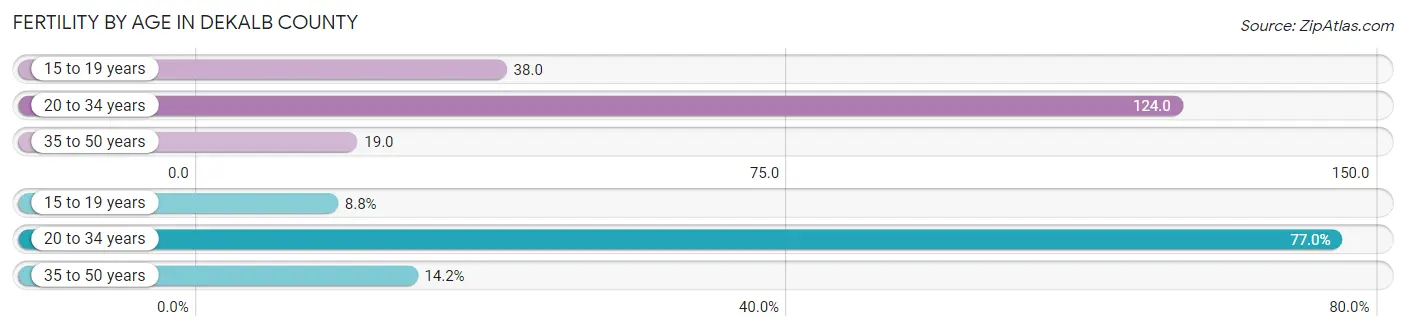
| Age Bracket | Women with Births | Births / 1,000 Women |
| 15 to 19 years | 88 (8.8%) | 38.0 |
| 20 to 34 years | 769 (77.0%) | 124.0 |
| 35 to 50 years | 142 (14.2%) | 19.0 |
| Total | 999 (100.0%) | 63.0 |
Fertility by Age by Marriage Status in DeKalb County
56.9% of women with births (999) in DeKalb County are married. The highest percentage of unmarried women with births falls into 15 to 19 years age bracket with 95.5% of them unmarried at the time of birth, while the lowest percentage of unmarried women with births belong to 35 to 50 years age bracket with 7.0% of them unmarried.
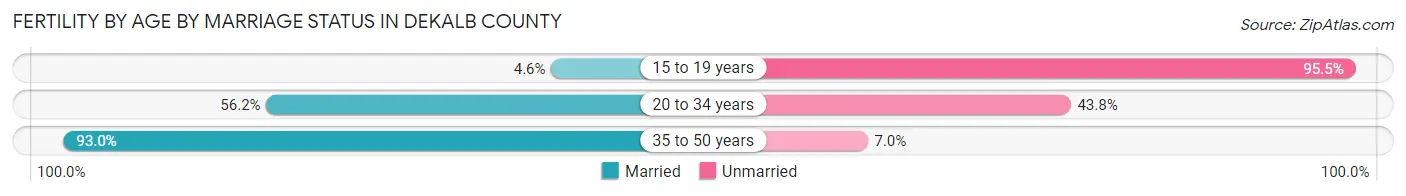
| Age Bracket | Married | Unmarried |
| 15 to 19 years | 4 (4.5%) | 84 (95.5%) |
| 20 to 34 years | 432 (56.2%) | 337 (43.8%) |
| 35 to 50 years | 132 (93.0%) | 10 (7.0%) |
| Total | 568 (56.9%) | 431 (43.1%) |
Fertility by Education in DeKalb County
Average fertility rate in DeKalb County is 63.0 births per 1,000 women. Women with the education attainment of high school diploma have the highest fertility rate of 107.0 births per 1,000 women, while women with the education attainment of college or associate's degree have the lowest fertility at 34.0 births per 1,000 women. Women with the education attainment of high school diploma represent 40.5% of all women with births.
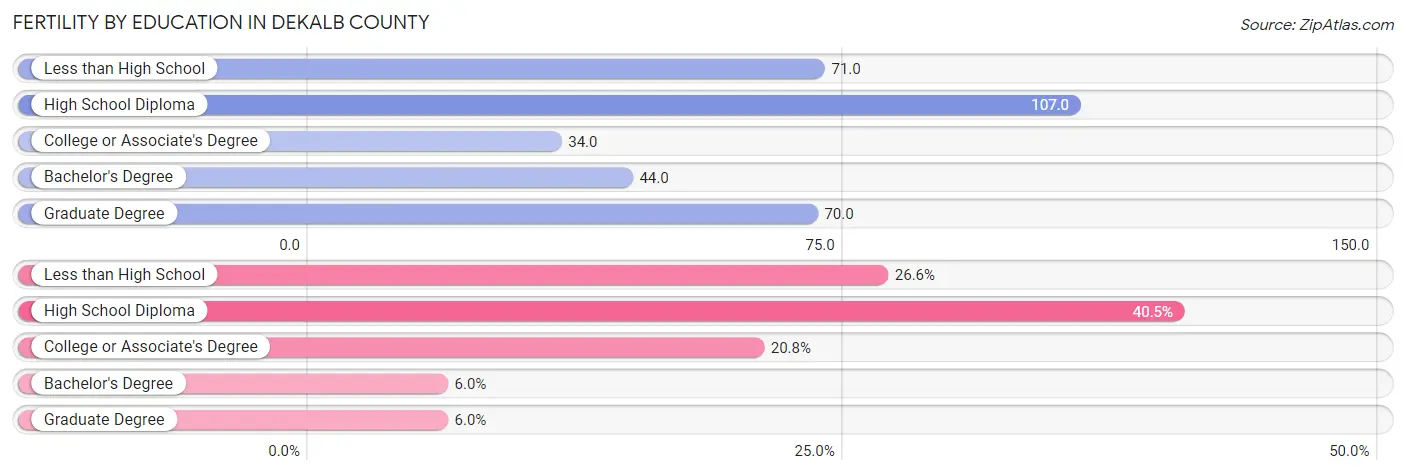
| Educational Attainment | Women with Births | Births / 1,000 Women |
| Less than High School | 266 (26.6%) | 71.0 |
| High School Diploma | 405 (40.5%) | 107.0 |
| College or Associate's Degree | 208 (20.8%) | 34.0 |
| Bachelor's Degree | 60 (6.0%) | 44.0 |
| Graduate Degree | 60 (6.0%) | 70.0 |
| Total | 999 (100.0%) | 63.0 |
Fertility by Education by Marriage Status in DeKalb County
43.1% of women with births in DeKalb County are unmarried. Women with the educational attainment of bachelor's degree are most likely to be married with 100.0% of them married at childbirth, while women with the educational attainment of high school diploma are least likely to be married with 58.8% of them unmarried at childbirth.
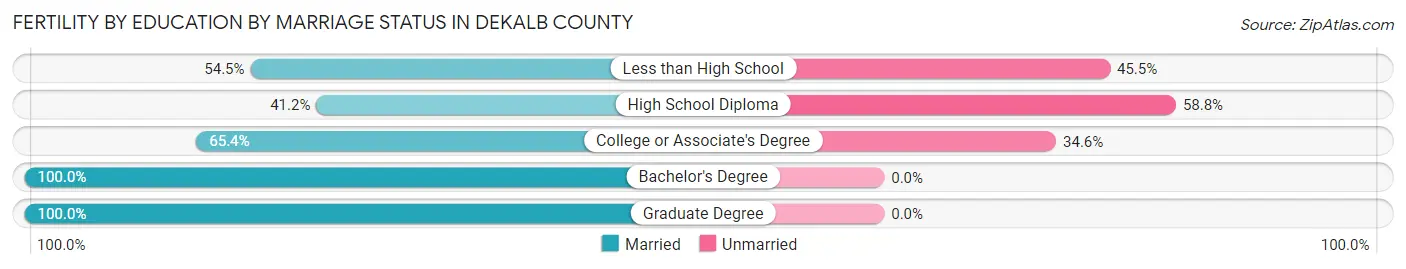
| Educational Attainment | Married | Unmarried |
| Less than High School | 145 (54.5%) | 121 (45.5%) |
| High School Diploma | 167 (41.2%) | 238 (58.8%) |
| College or Associate's Degree | 136 (65.4%) | 72 (34.6%) |
| Bachelor's Degree | 60 (100.0%) | 0 (0.0%) |
| Graduate Degree | 60 (100.0%) | 0 (0.0%) |
| Total | 568 (56.9%) | 431 (43.1%) |
Employment Characteristics in DeKalb County
Employment by Class of Employer in DeKalb County
Among the 30,290 employed individuals in DeKalb County, private company employees (22,126 | 73.1%), self-employed (not incorporated) (2,539 | 8.4%), and local government employees (1,807 | 6.0%) make up the most common classes of employment.
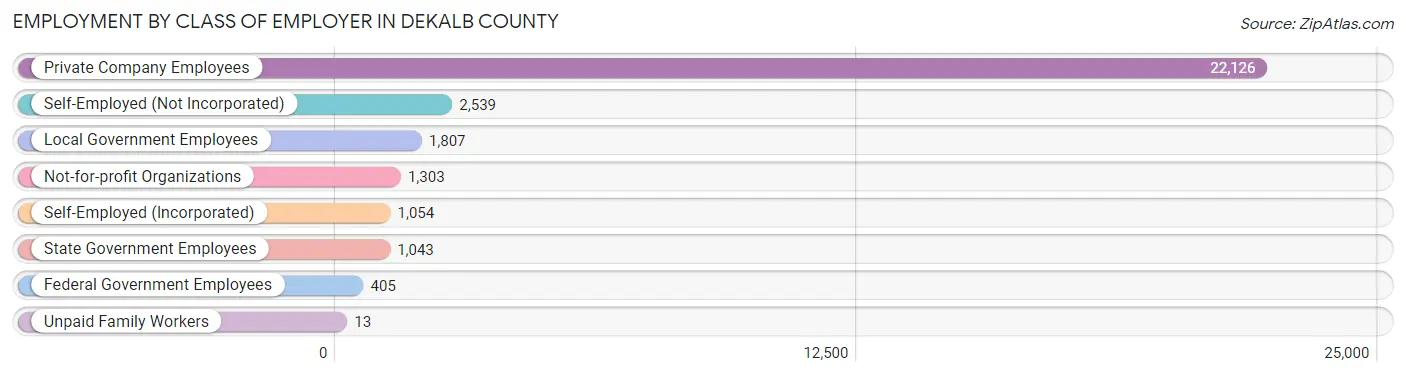
| Employer Class | # Employees | % Employees |
| Private Company Employees | 22,126 | 73.1% |
| Self-Employed (Incorporated) | 1,054 | 3.5% |
| Self-Employed (Not Incorporated) | 2,539 | 8.4% |
| Not-for-profit Organizations | 1,303 | 4.3% |
| Local Government Employees | 1,807 | 6.0% |
| State Government Employees | 1,043 | 3.4% |
| Federal Government Employees | 405 | 1.3% |
| Unpaid Family Workers | 13 | 0.0% |
| Total | 30,290 | 100.0% |
Employment Status by Age in DeKalb County
According to the labor force statistics for DeKalb County, out of the total population over 16 years of age (56,883), 56.5% or 32,139 individuals are in the labor force, with 3.9% or 1,253 of them unemployed. The age group with the highest labor force participation rate is 20 to 24 years, with 83.1% or 3,672 individuals in the labor force. Within the labor force, the 16 to 19 years age range has the highest percentage of unemployed individuals, with 6.7% or 99 of them being unemployed.
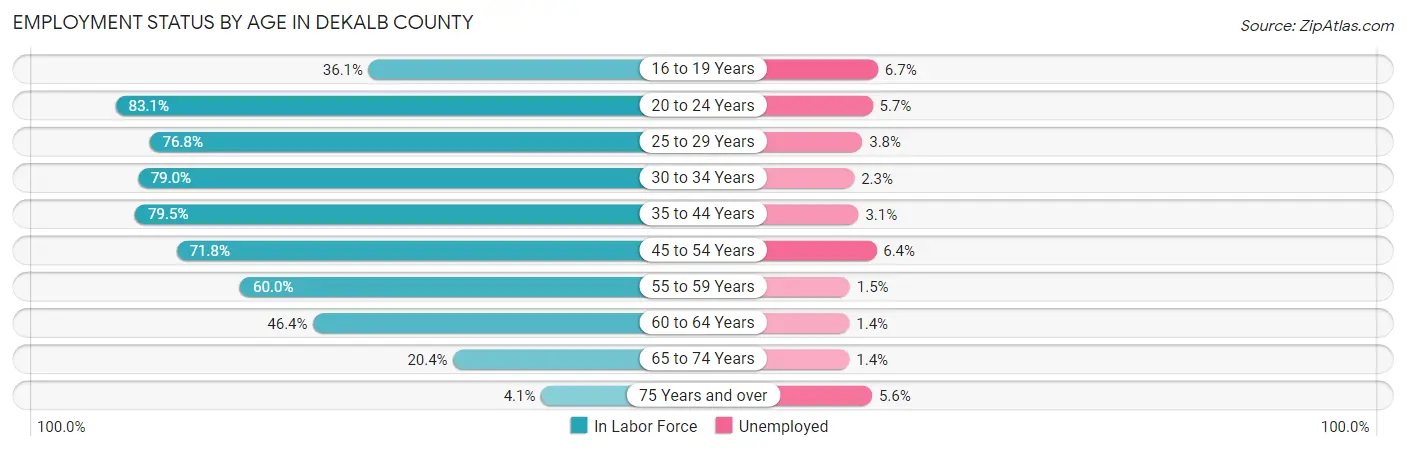
| Age Bracket | In Labor Force | Unemployed |
| 16 to 19 Years | 1,473 (36.1%) | 99 (6.7%) |
| 20 to 24 Years | 3,672 (83.1%) | 209 (5.7%) |
| 25 to 29 Years | 3,378 (76.8%) | 128 (3.8%) |
| 30 to 34 Years | 3,182 (79.0%) | 73 (2.3%) |
| 35 to 44 Years | 7,126 (79.5%) | 221 (3.1%) |
| 45 to 54 Years | 6,575 (71.8%) | 421 (6.4%) |
| 55 to 59 Years | 2,632 (60.0%) | 39 (1.5%) |
| 60 to 64 Years | 2,355 (46.4%) | 33 (1.4%) |
| 65 to 74 Years | 1,536 (20.4%) | 22 (1.4%) |
| 75 Years and over | 199 (4.1%) | 11 (5.6%) |
| Total | 32,139 (56.5%) | 1,253 (3.9%) |
Employment Status by Educational Attainment in DeKalb County
According to labor force statistics for DeKalb County, 70.1% of individuals (25,244) out of the total population between 25 and 64 years of age (36,011) are in the labor force, with 3.6% or 909 of them being unemployed. The group with the highest labor force participation rate are those with the educational attainment of bachelor's degree or higher, with 85.4% or 4,434 individuals in the labor force. Within the labor force, individuals with bachelor's degree or higher education have the highest percentage of unemployment, with 3.9% or 173 of them being unemployed.
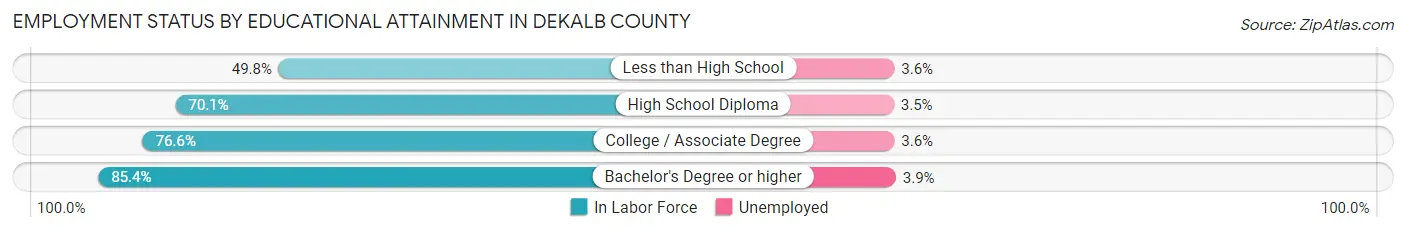
| Educational Attainment | In Labor Force | Unemployed |
| Less than High School | 3,878 (49.8%) | 280 (3.6%) |
| High School Diploma | 7,564 (70.1%) | 378 (3.5%) |
| College / Associate Degree | 9,376 (76.6%) | 441 (3.6%) |
| Bachelor's Degree or higher | 4,434 (85.4%) | 202 (3.9%) |
| Total | 25,244 (70.1%) | 1,296 (3.6%) |
Employment Occupations by Sex in DeKalb County
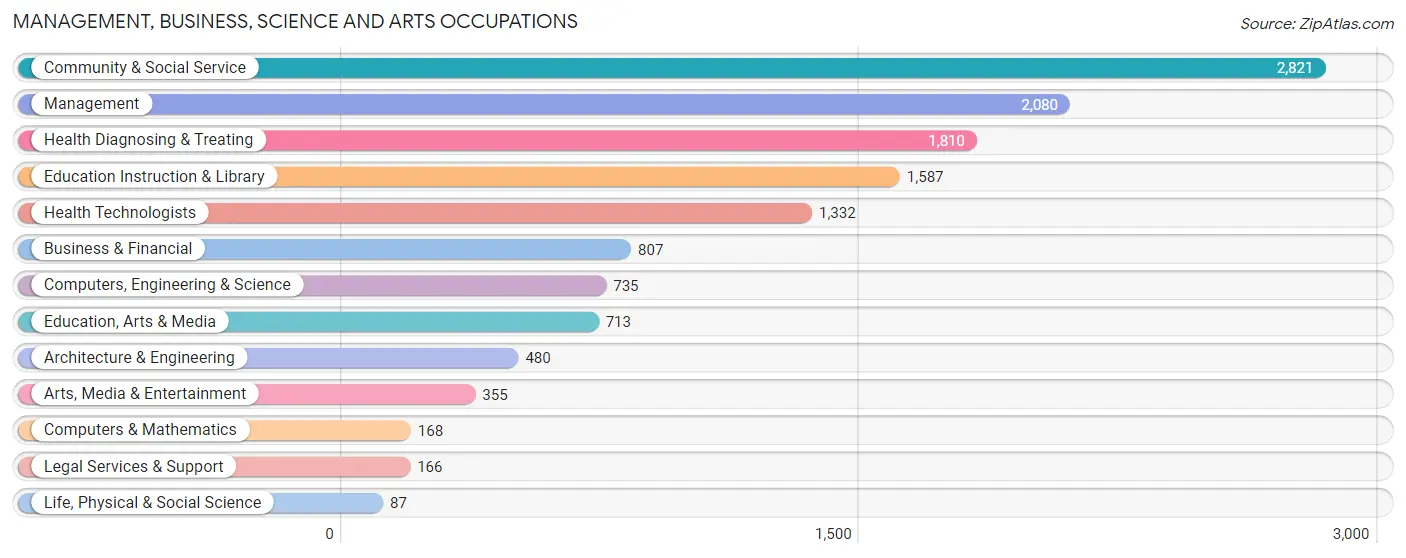
Management, Business, Science and Arts Occupations
The most common Management, Business, Science and Arts occupations in DeKalb County are Community & Social Service (2,821 | 9.1%), Management (2,080 | 6.8%), Health Diagnosing & Treating (1,810 | 5.9%), Education Instruction & Library (1,587 | 5.1%), and Health Technologists (1,332 | 4.3%).
Management, Business, Science and Arts Occupations by Sex
Within the Management, Business, Science and Arts occupations in DeKalb County, the most male-oriented occupations are Architecture & Engineering (89.4%), Computers, Engineering & Science (82.6%), and Computers & Mathematics (73.2%), while the most female-oriented occupations are Arts, Media & Entertainment (93.0%), Health Technologists (81.7%), and Health Diagnosing & Treating (81.5%).
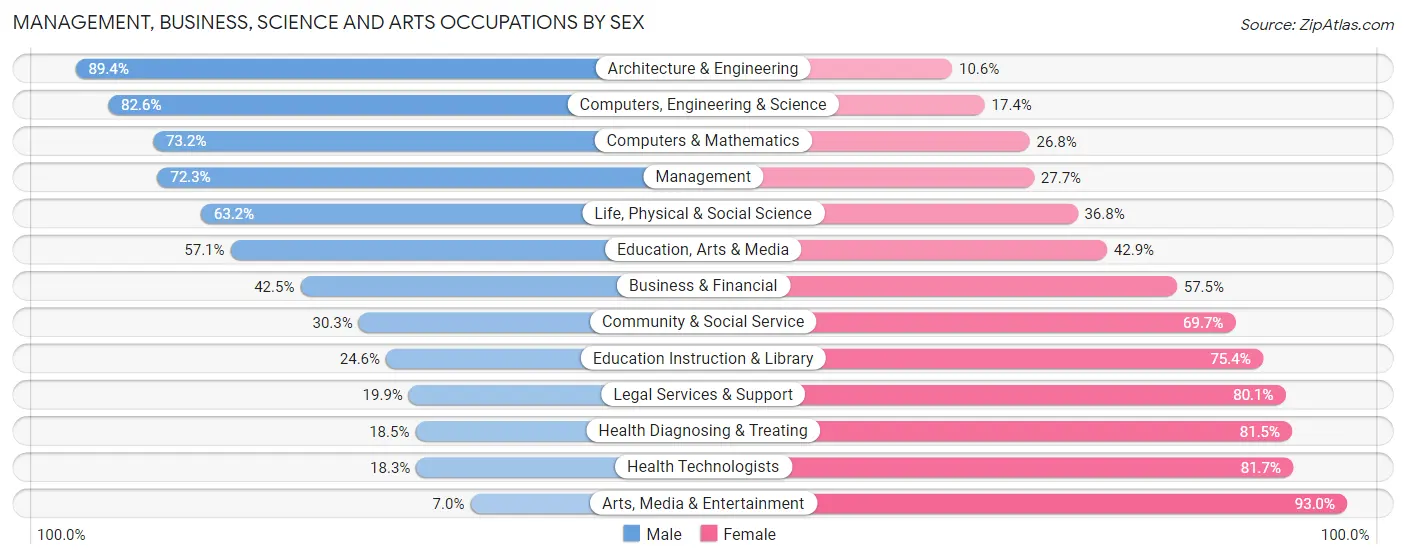
| Occupation | Male | Female |
| Management | 1,504 (72.3%) | 576 (27.7%) |
| Business & Financial | 343 (42.5%) | 464 (57.5%) |
| Computers, Engineering & Science | 607 (82.6%) | 128 (17.4%) |
| Computers & Mathematics | 123 (73.2%) | 45 (26.8%) |
| Architecture & Engineering | 429 (89.4%) | 51 (10.6%) |
| Life, Physical & Social Science | 55 (63.2%) | 32 (36.8%) |
| Community & Social Service | 856 (30.3%) | 1,965 (69.7%) |
| Education, Arts & Media | 407 (57.1%) | 306 (42.9%) |
| Legal Services & Support | 33 (19.9%) | 133 (80.1%) |
| Education Instruction & Library | 391 (24.6%) | 1,196 (75.4%) |
| Arts, Media & Entertainment | 25 (7.0%) | 330 (93.0%) |
| Health Diagnosing & Treating | 335 (18.5%) | 1,475 (81.5%) |
| Health Technologists | 244 (18.3%) | 1,088 (81.7%) |
| Total (Category) | 3,645 (44.2%) | 4,608 (55.8%) |
| Total (Overall) | 17,721 (57.5%) | 13,106 (42.5%) |
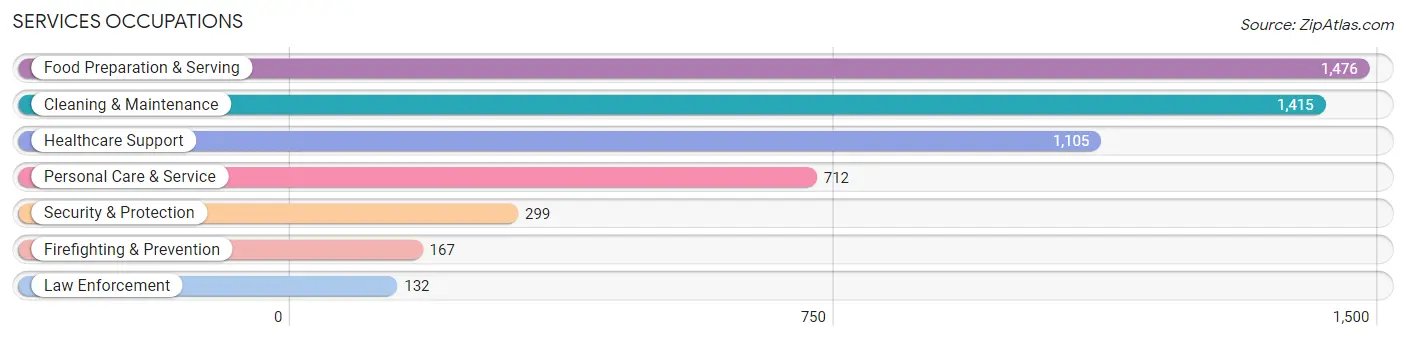
Services Occupations
The most common Services occupations in DeKalb County are Food Preparation & Serving (1,476 | 4.8%), Cleaning & Maintenance (1,415 | 4.6%), Healthcare Support (1,105 | 3.6%), Personal Care & Service (712 | 2.3%), and Security & Protection (299 | 1.0%).
Services Occupations by Sex
Within the Services occupations in DeKalb County, the most male-oriented occupations are Law Enforcement (88.6%), Security & Protection (82.6%), and Firefighting & Prevention (77.8%), while the most female-oriented occupations are Personal Care & Service (83.2%), Healthcare Support (76.1%), and Food Preparation & Serving (67.1%).
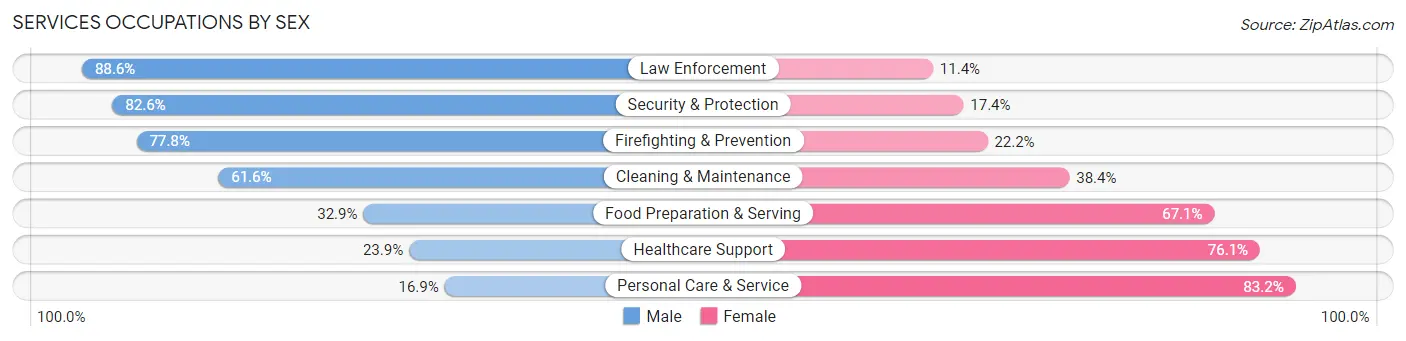
| Occupation | Male | Female |
| Healthcare Support | 264 (23.9%) | 841 (76.1%) |
| Security & Protection | 247 (82.6%) | 52 (17.4%) |
| Firefighting & Prevention | 130 (77.8%) | 37 (22.2%) |
| Law Enforcement | 117 (88.6%) | 15 (11.4%) |
| Food Preparation & Serving | 486 (32.9%) | 990 (67.1%) |
| Cleaning & Maintenance | 872 (61.6%) | 543 (38.4%) |
| Personal Care & Service | 120 (16.9%) | 592 (83.2%) |
| Total (Category) | 1,989 (39.7%) | 3,018 (60.3%) |
| Total (Overall) | 17,721 (57.5%) | 13,106 (42.5%) |
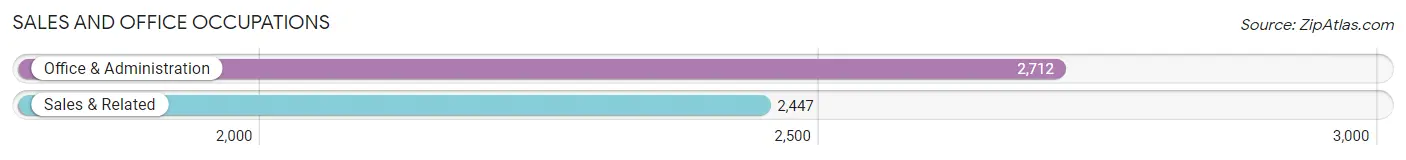
Sales and Office Occupations
The most common Sales and Office occupations in DeKalb County are Office & Administration (2,712 | 8.8%), and Sales & Related (2,447 | 7.9%).
Sales and Office Occupations by Sex
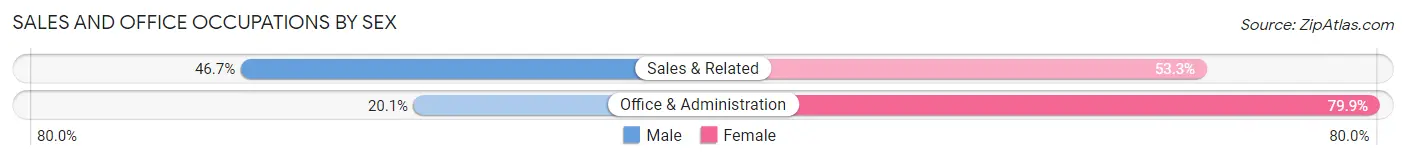
| Occupation | Male | Female |
| Sales & Related | 1,143 (46.7%) | 1,304 (53.3%) |
| Office & Administration | 545 (20.1%) | 2,167 (79.9%) |
| Total (Category) | 1,688 (32.7%) | 3,471 (67.3%) |
| Total (Overall) | 17,721 (57.5%) | 13,106 (42.5%) |
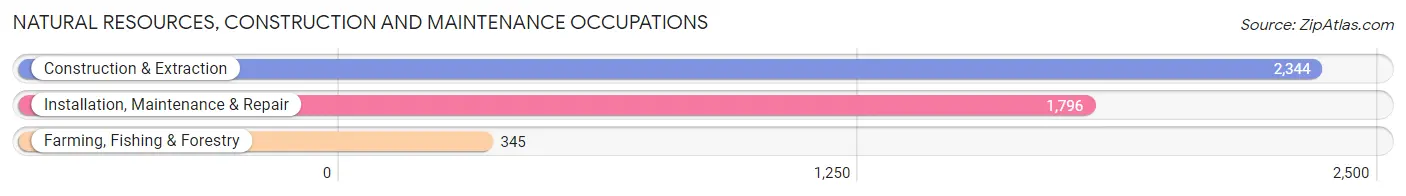
Natural Resources, Construction and Maintenance Occupations
The most common Natural Resources, Construction and Maintenance occupations in DeKalb County are Construction & Extraction (2,344 | 7.6%), Installation, Maintenance & Repair (1,796 | 5.8%), and Farming, Fishing & Forestry (345 | 1.1%).
Natural Resources, Construction and Maintenance Occupations by Sex
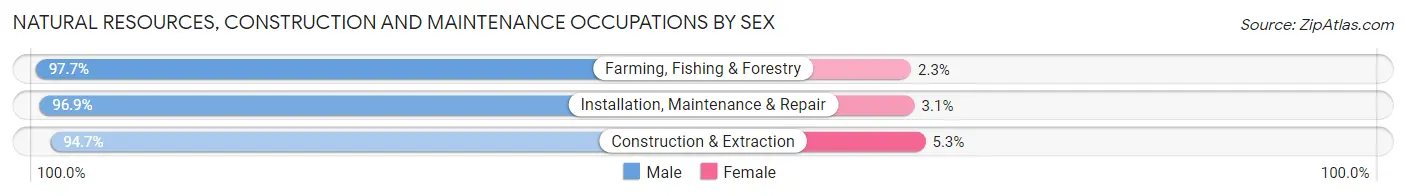
| Occupation | Male | Female |
| Farming, Fishing & Forestry | 337 (97.7%) | 8 (2.3%) |
| Construction & Extraction | 2,219 (94.7%) | 125 (5.3%) |
| Installation, Maintenance & Repair | 1,741 (96.9%) | 55 (3.1%) |
| Total (Category) | 4,297 (95.8%) | 188 (4.2%) |
| Total (Overall) | 17,721 (57.5%) | 13,106 (42.5%) |
Production, Transportation and Moving Occupations
The most common Production, Transportation and Moving occupations in DeKalb County are Production (5,122 | 16.6%), Material Moving (1,647 | 5.3%), and Transportation (1,154 | 3.7%).
Production, Transportation and Moving Occupations by Sex
| Occupation | Male | Female |
| Production | 3,983 (77.8%) | 1,139 (22.2%) |
| Transportation | 936 (81.1%) | 218 (18.9%) |
| Material Moving | 1,183 (71.8%) | 464 (28.2%) |
| Total (Category) | 6,102 (77.0%) | 1,821 (23.0%) |
| Total (Overall) | 17,721 (57.5%) | 13,106 (42.5%) |
Employment Industries by Sex in DeKalb County
Employment Industries in DeKalb County
The major employment industries in DeKalb County include Manufacturing (7,761 | 25.2%), Health Care & Social Assistance (3,911 | 12.7%), Retail Trade (3,106 | 10.1%), Construction (2,654 | 8.6%), and Educational Services (2,058 | 6.7%).
Employment Industries by Sex in DeKalb County
The DeKalb County industries that see more men than women are Construction (93.6%), Utilities (91.6%), and Agriculture, Fishing & Hunting (88.8%), whereas the industries that tend to have a higher number of women are Health Care & Social Assistance (78.4%), Finance & Insurance (77.1%), and Educational Services (70.3%).
| Industry | Male | Female |
| Agriculture, Fishing & Hunting | 633 (88.8%) | 80 (11.2%) |
| Mining, Quarrying, & Extraction | 18 (47.4%) | 20 (52.6%) |
| Construction | 2,484 (93.6%) | 170 (6.4%) |
| Manufacturing | 6,029 (77.7%) | 1,732 (22.3%) |
| Wholesale Trade | 351 (78.9%) | 94 (21.1%) |
| Retail Trade | 1,555 (50.1%) | 1,551 (49.9%) |
| Transportation & Warehousing | 977 (62.3%) | 592 (37.7%) |
| Utilities | 445 (91.6%) | 41 (8.4%) |
| Information | 316 (52.8%) | 282 (47.2%) |
| Finance & Insurance | 211 (22.9%) | 712 (77.1%) |
| Real Estate, Rental & Leasing | 90 (31.5%) | 196 (68.5%) |
| Professional & Scientific | 271 (34.4%) | 517 (65.6%) |
| Enterprise Management | 9 (37.5%) | 15 (62.5%) |
| Administrative & Support | 640 (70.8%) | 264 (29.2%) |
| Educational Services | 612 (29.7%) | 1,446 (70.3%) |
| Health Care & Social Assistance | 845 (21.6%) | 3,066 (78.4%) |
| Arts, Entertainment & Recreation | 76 (75.2%) | 25 (24.7%) |
| Accommodation & Food Services | 763 (40.4%) | 1,127 (59.6%) |
| Public Administration | 332 (49.3%) | 341 (50.7%) |
| Total | 17,721 (57.5%) | 13,106 (42.5%) |
Education in DeKalb County
School Enrollment in DeKalb County
The most common levels of schooling among the 16,469 students in DeKalb County are middle school (4,387 | 26.6%), high school (4,175 | 25.4%), and elementary school (3,644 | 22.1%).
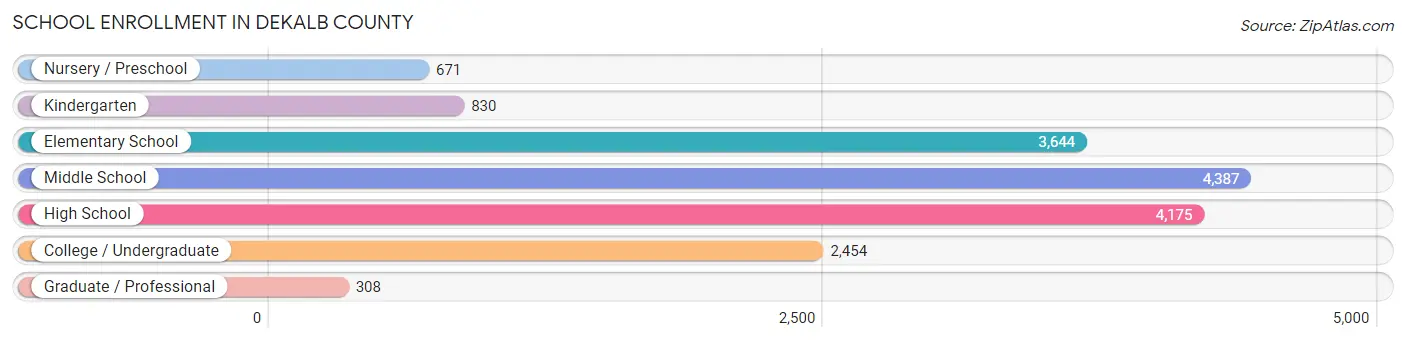
| School Level | # Students | % Students |
| Nursery / Preschool | 671 | 4.1% |
| Kindergarten | 830 | 5.0% |
| Elementary School | 3,644 | 22.1% |
| Middle School | 4,387 | 26.6% |
| High School | 4,175 | 25.4% |
| College / Undergraduate | 2,454 | 14.9% |
| Graduate / Professional | 308 | 1.9% |
| Total | 16,469 | 100.0% |
School Enrollment by Age by Funding Source in DeKalb County
Out of a total of 16,469 students who are enrolled in schools in DeKalb County, 1,614 (9.8%) attend a private institution, while the remaining 14,855 (90.2%) are enrolled in public schools. The age group of 3 to 4 year olds has the highest likelihood of being enrolled in private schools, with 130 (28.9% in the age bracket) enrolled. Conversely, the age group of 18 to 19 year olds has the lowest likelihood of being enrolled in a private school, with 986 (96.1% in the age bracket) attending a public institution.
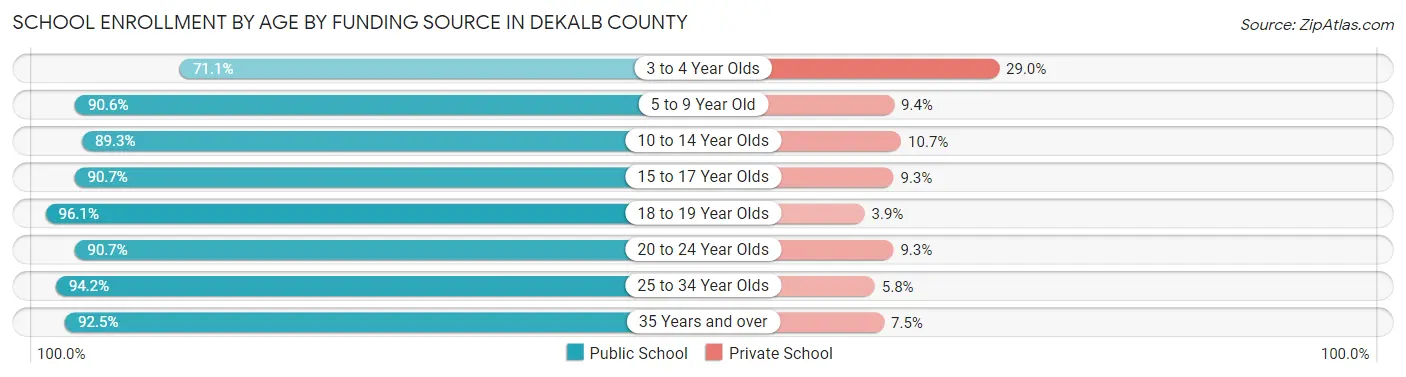
| Age Bracket | Public School | Private School |
| 3 to 4 Year Olds | 319 (71.1%) | 130 (28.9%) |
| 5 to 9 Year Old | 3,603 (90.6%) | 374 (9.4%) |
| 10 to 14 Year Olds | 5,037 (89.3%) | 604 (10.7%) |
| 15 to 17 Year Olds | 2,752 (90.7%) | 282 (9.3%) |
| 18 to 19 Year Olds | 986 (96.1%) | 40 (3.9%) |
| 20 to 24 Year Olds | 899 (90.7%) | 92 (9.3%) |
| 25 to 34 Year Olds | 697 (94.2%) | 43 (5.8%) |
| 35 Years and over | 565 (92.5%) | 46 (7.5%) |
| Total | 14,855 (90.2%) | 1,614 (9.8%) |
Educational Attainment by Field of Study in DeKalb County
Education (2,066 | 28.8%), business (1,269 | 17.7%), science & technology (861 | 12.0%), psychology (452 | 6.3%), and liberal arts & history (430 | 6.0%) are the most common fields of study among 7,176 individuals in DeKalb County who have obtained a bachelor's degree or higher.
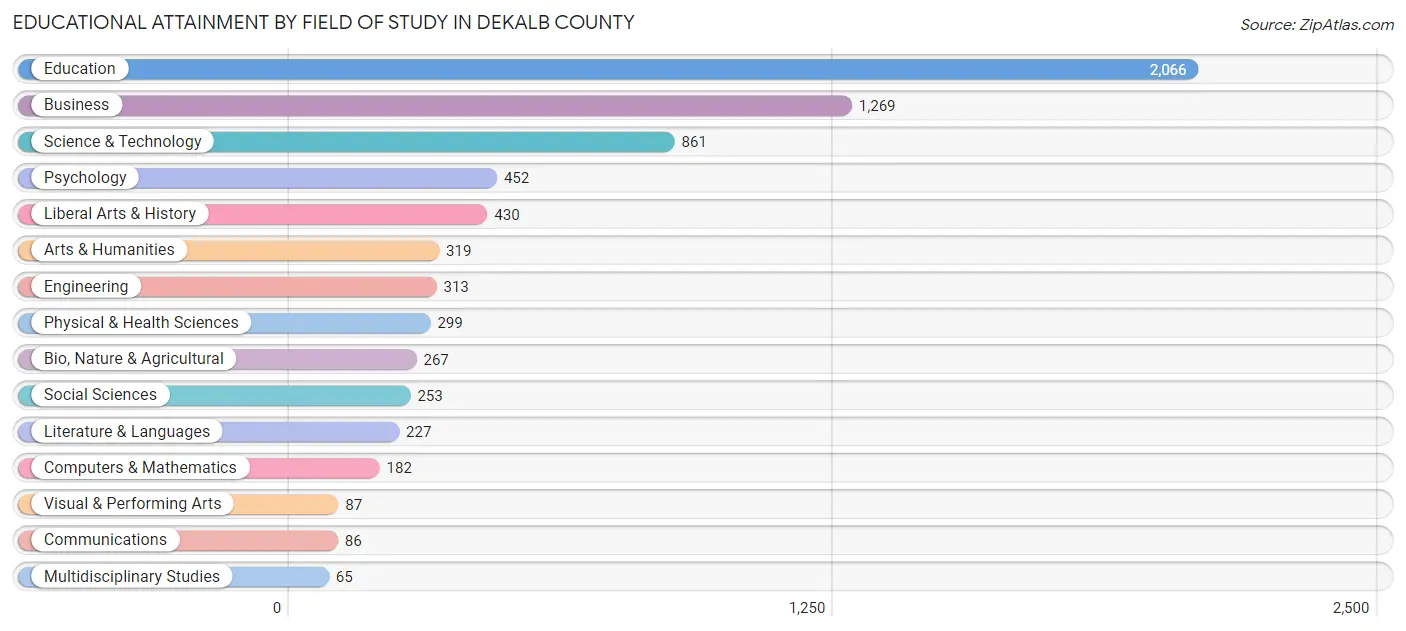
| Field of Study | # Graduates | % Graduates |
| Computers & Mathematics | 182 | 2.5% |
| Bio, Nature & Agricultural | 267 | 3.7% |
| Physical & Health Sciences | 299 | 4.2% |
| Psychology | 452 | 6.3% |
| Social Sciences | 253 | 3.5% |
| Engineering | 313 | 4.4% |
| Multidisciplinary Studies | 65 | 0.9% |
| Science & Technology | 861 | 12.0% |
| Business | 1,269 | 17.7% |
| Education | 2,066 | 28.8% |
| Literature & Languages | 227 | 3.2% |
| Liberal Arts & History | 430 | 6.0% |
| Visual & Performing Arts | 87 | 1.2% |
| Communications | 86 | 1.2% |
| Arts & Humanities | 319 | 4.4% |
| Total | 7,176 | 100.0% |
Transportation & Commute in DeKalb County
Vehicle Availability by Sex in DeKalb County
The most prevalent vehicle ownership categories in DeKalb County are males with 2 vehicles (6,514, accounting for 37.5%) and females with 2 vehicles (4,695, making up 50.5%).
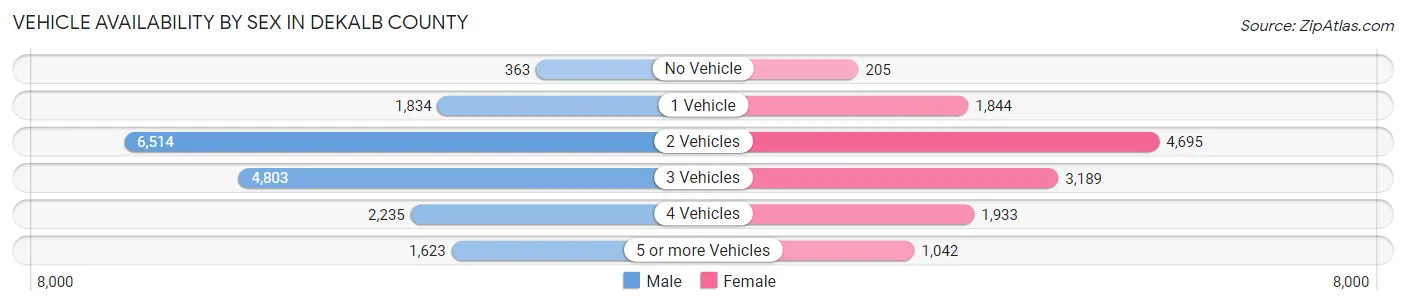
| Vehicles Available | Male | Female |
| No Vehicle | 363 (2.1%) | 205 (1.6%) |
| 1 Vehicle | 1,834 (10.6%) | 1,844 (14.3%) |
| 2 Vehicles | 6,514 (37.5%) | 4,695 (36.4%) |
| 3 Vehicles | 4,803 (27.7%) | 3,189 (24.7%) |
| 4 Vehicles | 2,235 (12.9%) | 1,933 (15.0%) |
| 5 or more Vehicles | 1,623 (9.3%) | 1,042 (8.1%) |
| Total | 17,372 (100.0%) | 12,908 (100.0%) |
Commute Time in DeKalb County
The most frequently occuring commute durations in DeKalb County are 15 to 19 minutes (4,726 commuters, 16.2%), 20 to 24 minutes (4,185 commuters, 14.4%), and 10 to 14 minutes (4,016 commuters, 13.8%).
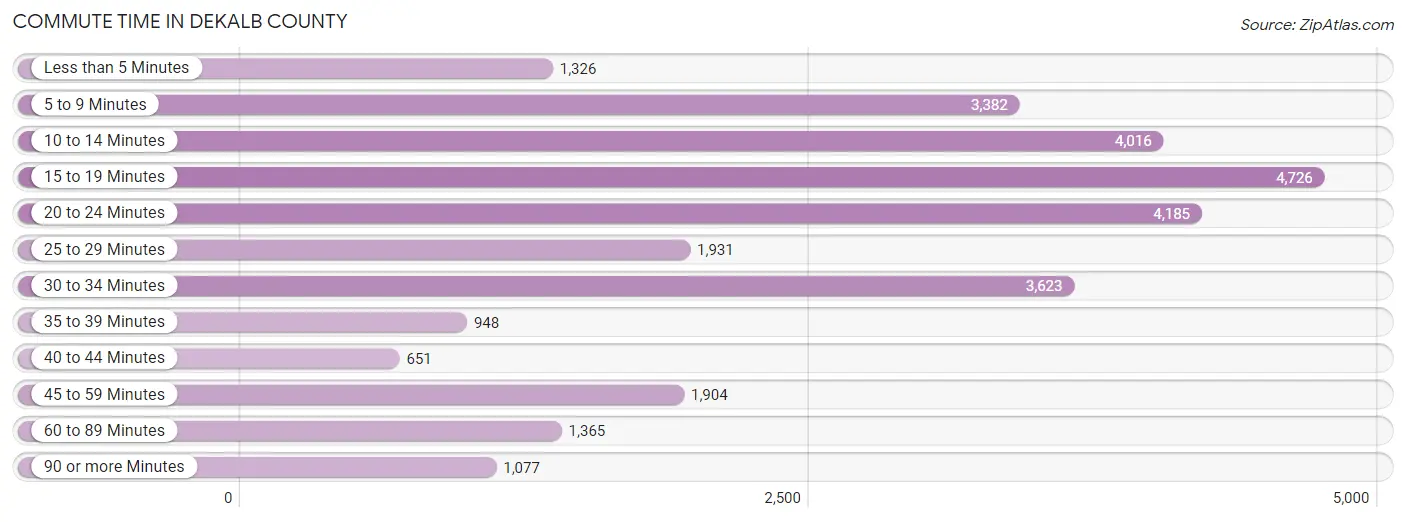
| Commute Time | # Commuters | % Commuters |
| Less than 5 Minutes | 1,326 | 4.5% |
| 5 to 9 Minutes | 3,382 | 11.6% |
| 10 to 14 Minutes | 4,016 | 13.8% |
| 15 to 19 Minutes | 4,726 | 16.2% |
| 20 to 24 Minutes | 4,185 | 14.4% |
| 25 to 29 Minutes | 1,931 | 6.6% |
| 30 to 34 Minutes | 3,623 | 12.4% |
| 35 to 39 Minutes | 948 | 3.3% |
| 40 to 44 Minutes | 651 | 2.2% |
| 45 to 59 Minutes | 1,904 | 6.5% |
| 60 to 89 Minutes | 1,365 | 4.7% |
| 90 or more Minutes | 1,077 | 3.7% |
Commute Time by Sex in DeKalb County
The most common commute times in DeKalb County are 15 to 19 minutes (2,519 commuters, 15.1%) for males and 15 to 19 minutes (2,207 commuters, 17.7%) for females.
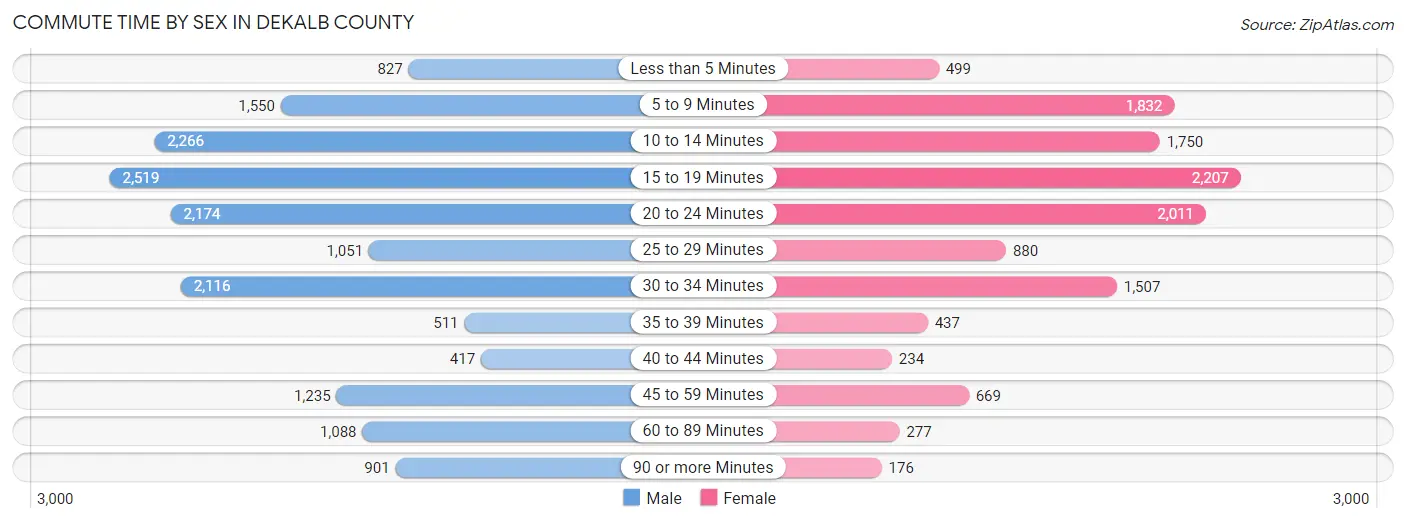
| Commute Time | Male | Female |
| Less than 5 Minutes | 827 (5.0%) | 499 (4.0%) |
| 5 to 9 Minutes | 1,550 (9.3%) | 1,832 (14.7%) |
| 10 to 14 Minutes | 2,266 (13.6%) | 1,750 (14.0%) |
| 15 to 19 Minutes | 2,519 (15.1%) | 2,207 (17.7%) |
| 20 to 24 Minutes | 2,174 (13.1%) | 2,011 (16.1%) |
| 25 to 29 Minutes | 1,051 (6.3%) | 880 (7.0%) |
| 30 to 34 Minutes | 2,116 (12.7%) | 1,507 (12.1%) |
| 35 to 39 Minutes | 511 (3.1%) | 437 (3.5%) |
| 40 to 44 Minutes | 417 (2.5%) | 234 (1.9%) |
| 45 to 59 Minutes | 1,235 (7.4%) | 669 (5.4%) |
| 60 to 89 Minutes | 1,088 (6.5%) | 277 (2.2%) |
| 90 or more Minutes | 901 (5.4%) | 176 (1.4%) |
Time of Departure to Work by Sex in DeKalb County
The most frequent times of departure to work in DeKalb County are 12:00 AM to 4:59 AM (2,605, 15.6%) for males and 7:00 AM to 7:29 AM (2,323, 18.6%) for females.
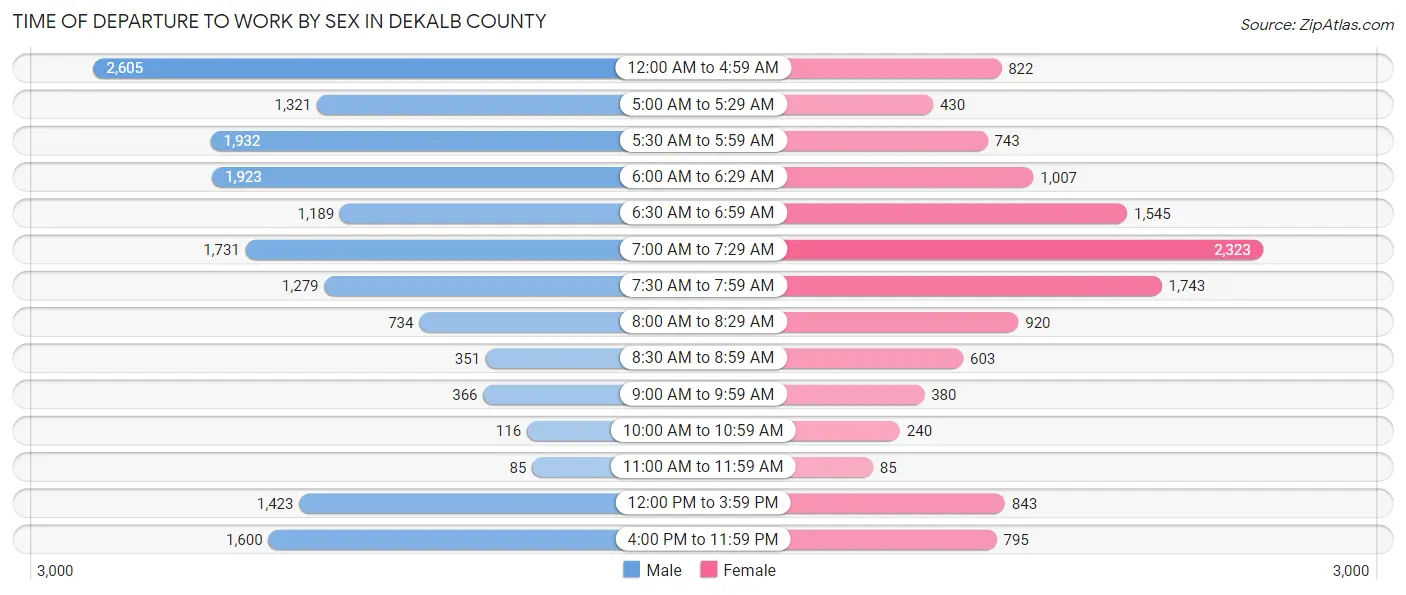
| Time of Departure | Male | Female |
| 12:00 AM to 4:59 AM | 2,605 (15.6%) | 822 (6.6%) |
| 5:00 AM to 5:29 AM | 1,321 (7.9%) | 430 (3.5%) |
| 5:30 AM to 5:59 AM | 1,932 (11.6%) | 743 (5.9%) |
| 6:00 AM to 6:29 AM | 1,923 (11.6%) | 1,007 (8.1%) |
| 6:30 AM to 6:59 AM | 1,189 (7.1%) | 1,545 (12.4%) |
| 7:00 AM to 7:29 AM | 1,731 (10.4%) | 2,323 (18.6%) |
| 7:30 AM to 7:59 AM | 1,279 (7.7%) | 1,743 (14.0%) |
| 8:00 AM to 8:29 AM | 734 (4.4%) | 920 (7.4%) |
| 8:30 AM to 8:59 AM | 351 (2.1%) | 603 (4.8%) |
| 9:00 AM to 9:59 AM | 366 (2.2%) | 380 (3.0%) |
| 10:00 AM to 10:59 AM | 116 (0.7%) | 240 (1.9%) |
| 11:00 AM to 11:59 AM | 85 (0.5%) | 85 (0.7%) |
| 12:00 PM to 3:59 PM | 1,423 (8.5%) | 843 (6.8%) |
| 4:00 PM to 11:59 PM | 1,600 (9.6%) | 795 (6.4%) |
| Total | 16,655 (100.0%) | 12,479 (100.0%) |
Housing Occupancy in DeKalb County
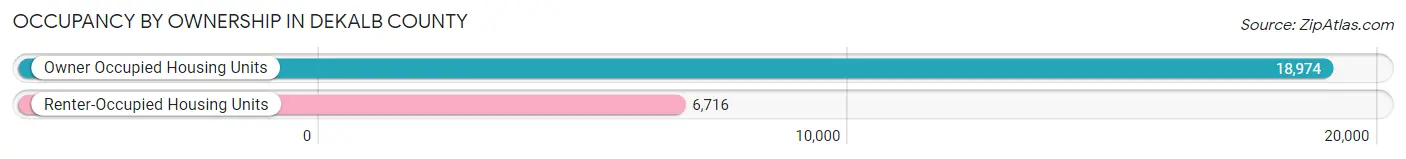
Occupancy by Ownership in DeKalb County
Of the total 25,690 dwellings in DeKalb County, owner-occupied units account for 18,974 (73.9%), while renter-occupied units make up 6,716 (26.1%).
| Occupancy | # Housing Units | % Housing Units |
| Owner Occupied Housing Units | 18,974 | 73.9% |
| Renter-Occupied Housing Units | 6,716 | 26.1% |
| Total Occupied Housing Units | 25,690 | 100.0% |
Occupancy by Household Size in DeKalb County
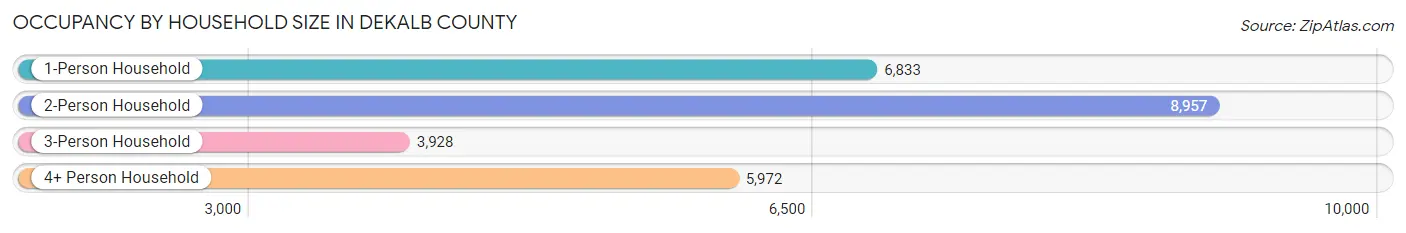
| Household Size | # Housing Units | % Housing Units |
| 1-Person Household | 6,833 | 26.6% |
| 2-Person Household | 8,957 | 34.9% |
| 3-Person Household | 3,928 | 15.3% |
| 4+ Person Household | 5,972 | 23.3% |
| Total Housing Units | 25,690 | 100.0% |
Occupancy by Ownership by Household Size in DeKalb County
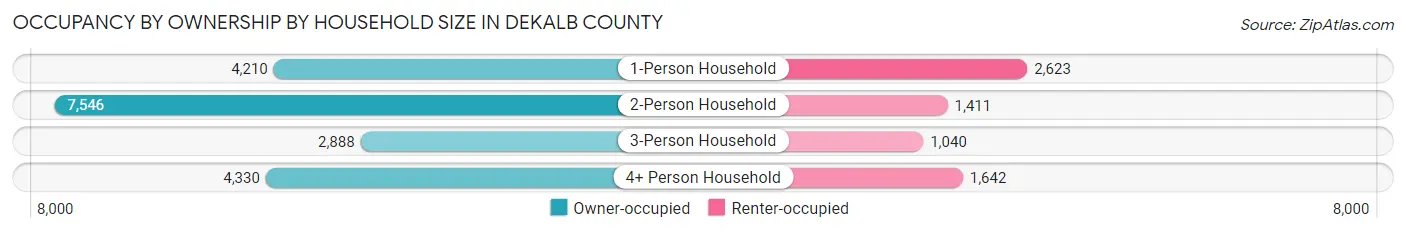
| Household Size | Owner-occupied | Renter-occupied |
| 1-Person Household | 4,210 (61.6%) | 2,623 (38.4%) |
| 2-Person Household | 7,546 (84.3%) | 1,411 (15.8%) |
| 3-Person Household | 2,888 (73.5%) | 1,040 (26.5%) |
| 4+ Person Household | 4,330 (72.5%) | 1,642 (27.5%) |
| Total Housing Units | 18,974 (73.9%) | 6,716 (26.1%) |
Occupancy by Educational Attainment in DeKalb County
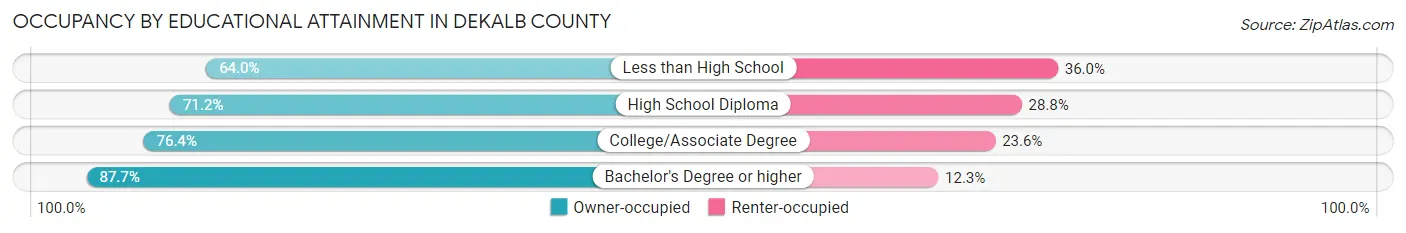
| Household Size | Owner-occupied | Renter-occupied |
| Less than High School | 3,424 (64.0%) | 1,927 (36.0%) |
| High School Diploma | 5,707 (71.2%) | 2,312 (28.8%) |
| College/Associate Degree | 6,506 (76.4%) | 2,010 (23.6%) |
| Bachelor's Degree or higher | 3,337 (87.7%) | 467 (12.3%) |
Occupancy by Age of Householder in DeKalb County
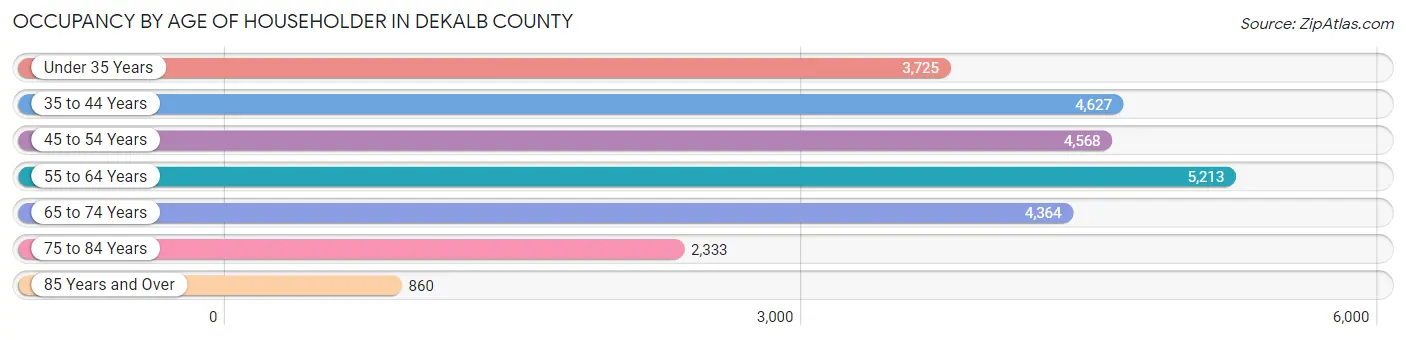
| Age Bracket | # Households | % Households |
| Under 35 Years | 3,725 | 14.5% |
| 35 to 44 Years | 4,627 | 18.0% |
| 45 to 54 Years | 4,568 | 17.8% |
| 55 to 64 Years | 5,213 | 20.3% |
| 65 to 74 Years | 4,364 | 17.0% |
| 75 to 84 Years | 2,333 | 9.1% |
| 85 Years and Over | 860 | 3.4% |
| Total | 25,690 | 100.0% |
Housing Finances in DeKalb County
Median Income by Occupancy in DeKalb County
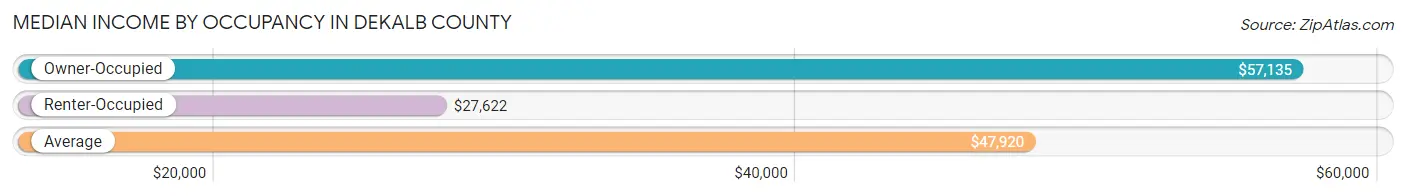
| Occupancy Type | # Households | Median Income |
| Owner-Occupied | 18,974 (73.9%) | $57,135 |
| Renter-Occupied | 6,716 (26.1%) | $27,622 |
| Average | 25,690 (100.0%) | $47,920 |
Occupancy by Householder Income Bracket in DeKalb County
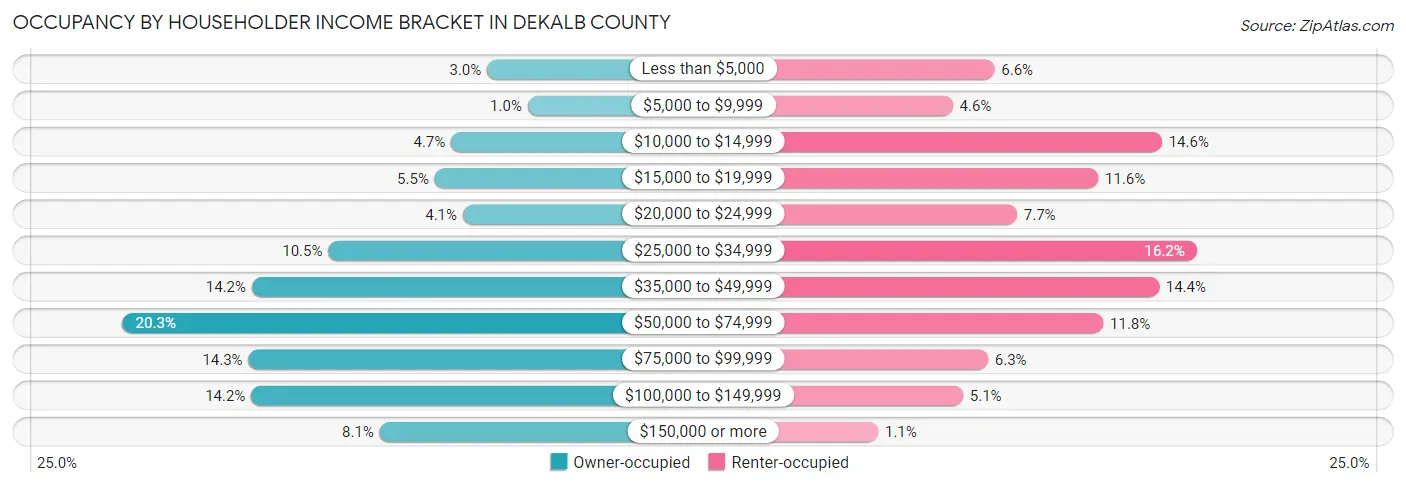
| Income Bracket | Owner-occupied | Renter-occupied |
| Less than $5,000 | 566 (3.0%) | 444 (6.6%) |
| $5,000 to $9,999 | 198 (1.0%) | 310 (4.6%) |
| $10,000 to $14,999 | 889 (4.7%) | 979 (14.6%) |
| $15,000 to $19,999 | 1,038 (5.5%) | 776 (11.6%) |
| $20,000 to $24,999 | 784 (4.1%) | 516 (7.7%) |
| $25,000 to $34,999 | 2,000 (10.5%) | 1,091 (16.2%) |
| $35,000 to $49,999 | 2,690 (14.2%) | 970 (14.4%) |
| $50,000 to $74,999 | 3,857 (20.3%) | 792 (11.8%) |
| $75,000 to $99,999 | 2,720 (14.3%) | 423 (6.3%) |
| $100,000 to $149,999 | 2,697 (14.2%) | 343 (5.1%) |
| $150,000 or more | 1,535 (8.1%) | 72 (1.1%) |
| Total | 18,974 (100.0%) | 6,716 (100.0%) |
Monthly Housing Cost Tiers in DeKalb County
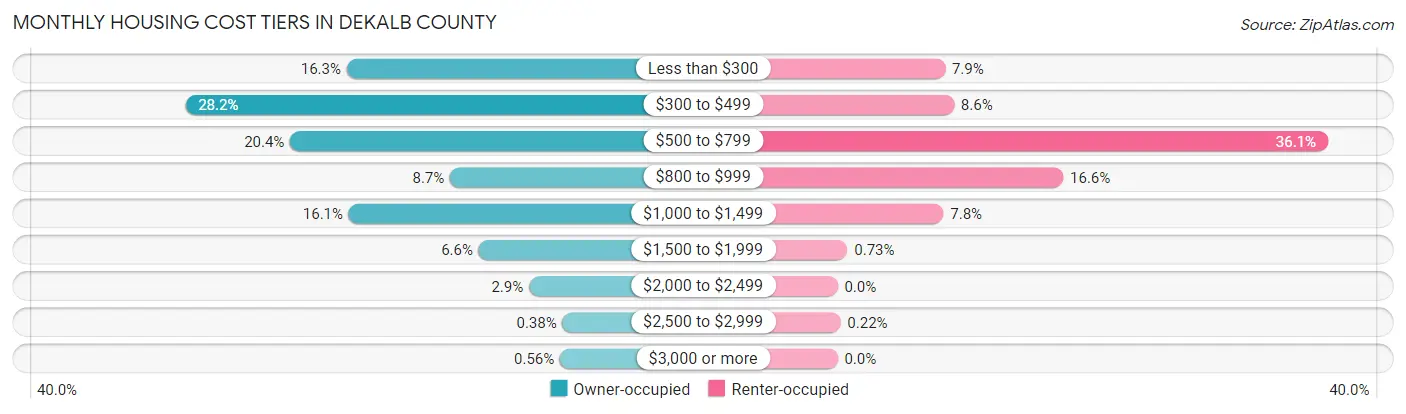
| Monthly Cost | Owner-occupied | Renter-occupied |
| Less than $300 | 3,087 (16.3%) | 532 (7.9%) |
| $300 to $499 | 5,345 (28.2%) | 576 (8.6%) |
| $500 to $799 | 3,878 (20.4%) | 2,426 (36.1%) |
| $800 to $999 | 1,644 (8.7%) | 1,116 (16.6%) |
| $1,000 to $1,499 | 3,059 (16.1%) | 524 (7.8%) |
| $1,500 to $1,999 | 1,242 (6.6%) | 49 (0.7%) |
| $2,000 to $2,499 | 540 (2.9%) | 0 (0.0%) |
| $2,500 to $2,999 | 72 (0.4%) | 15 (0.2%) |
| $3,000 or more | 107 (0.6%) | 0 (0.0%) |
| Total | 18,974 (100.0%) | 6,716 (100.0%) |
Physical Housing Characteristics in DeKalb County
Housing Structures in DeKalb County
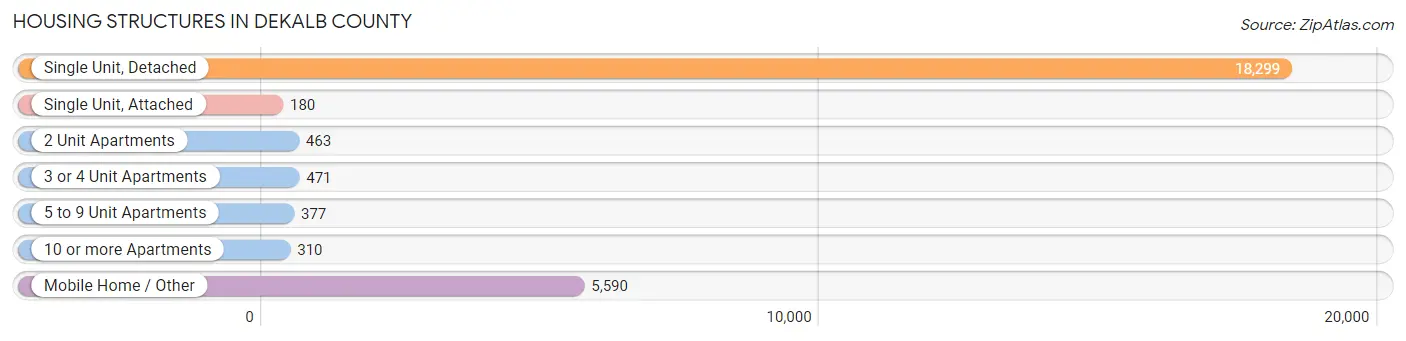
| Structure Type | # Housing Units | % Housing Units |
| Single Unit, Detached | 18,299 | 71.2% |
| Single Unit, Attached | 180 | 0.7% |
| 2 Unit Apartments | 463 | 1.8% |
| 3 or 4 Unit Apartments | 471 | 1.8% |
| 5 to 9 Unit Apartments | 377 | 1.5% |
| 10 or more Apartments | 310 | 1.2% |
| Mobile Home / Other | 5,590 | 21.8% |
| Total | 25,690 | 100.0% |
Housing Structures by Occupancy in DeKalb County
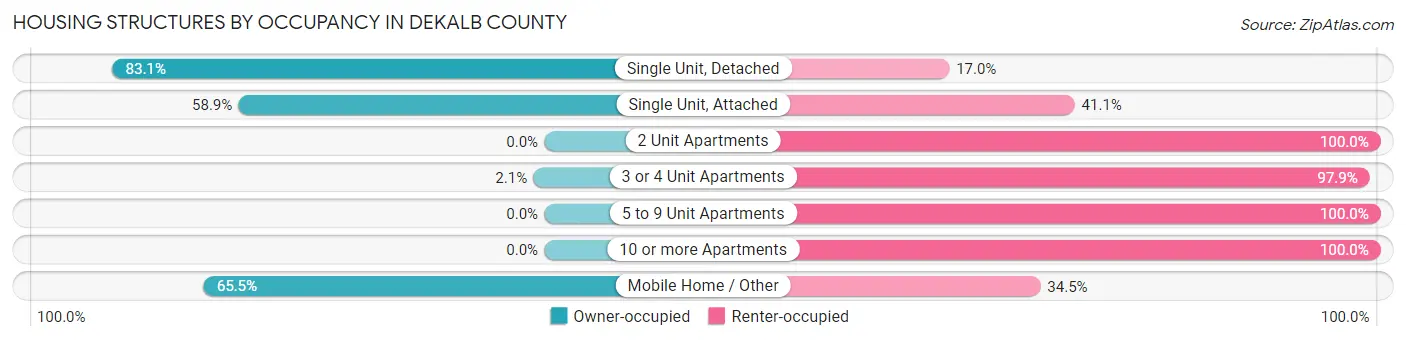
| Structure Type | Owner-occupied | Renter-occupied |
| Single Unit, Detached | 15,197 (83.1%) | 3,102 (17.0%) |
| Single Unit, Attached | 106 (58.9%) | 74 (41.1%) |
| 2 Unit Apartments | 0 (0.0%) | 463 (100.0%) |
| 3 or 4 Unit Apartments | 10 (2.1%) | 461 (97.9%) |
| 5 to 9 Unit Apartments | 0 (0.0%) | 377 (100.0%) |
| 10 or more Apartments | 0 (0.0%) | 310 (100.0%) |
| Mobile Home / Other | 3,661 (65.5%) | 1,929 (34.5%) |
| Total | 18,974 (73.9%) | 6,716 (26.1%) |
Housing Structures by Number of Rooms in DeKalb County
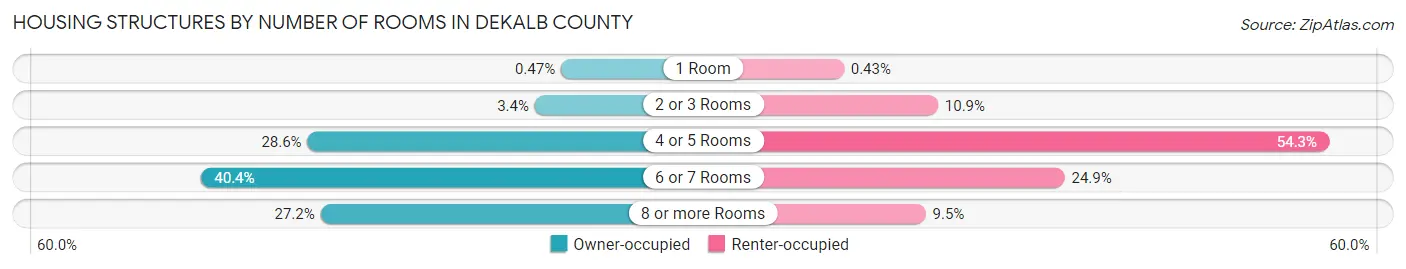
| Number of Rooms | Owner-occupied | Renter-occupied |
| 1 Room | 90 (0.5%) | 29 (0.4%) |
| 2 or 3 Rooms | 641 (3.4%) | 730 (10.9%) |
| 4 or 5 Rooms | 5,428 (28.6%) | 3,644 (54.3%) |
| 6 or 7 Rooms | 7,662 (40.4%) | 1,674 (24.9%) |
| 8 or more Rooms | 5,153 (27.2%) | 639 (9.5%) |
| Total | 18,974 (100.0%) | 6,716 (100.0%) |
Housing Structure by Heating Type in DeKalb County
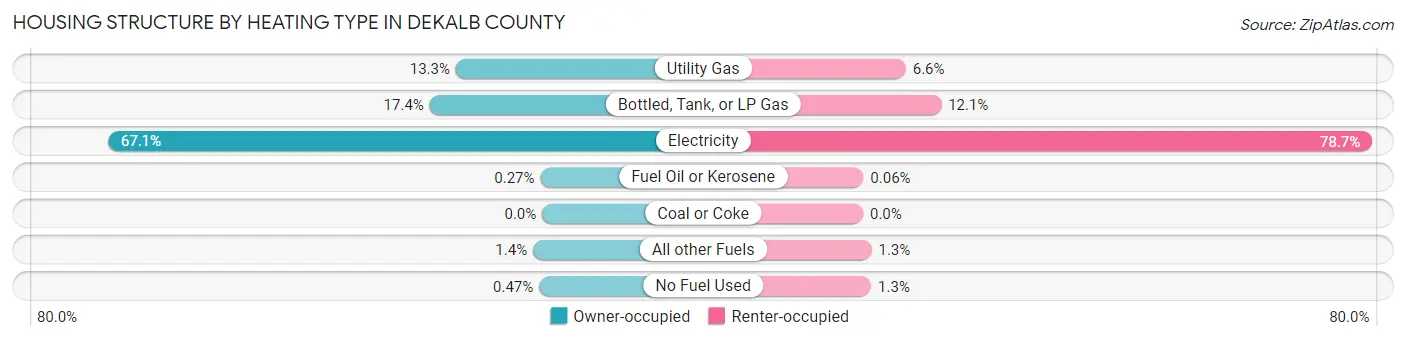
| Heating Type | Owner-occupied | Renter-occupied |
| Utility Gas | 2,532 (13.3%) | 444 (6.6%) |
| Bottled, Tank, or LP Gas | 3,298 (17.4%) | 811 (12.1%) |
| Electricity | 12,736 (67.1%) | 5,285 (78.7%) |
| Fuel Oil or Kerosene | 52 (0.3%) | 4 (0.1%) |
| Coal or Coke | 0 (0.0%) | 0 (0.0%) |
| All other Fuels | 267 (1.4%) | 88 (1.3%) |
| No Fuel Used | 89 (0.5%) | 84 (1.3%) |
| Total | 18,974 (100.0%) | 6,716 (100.0%) |
Household Vehicle Usage in DeKalb County
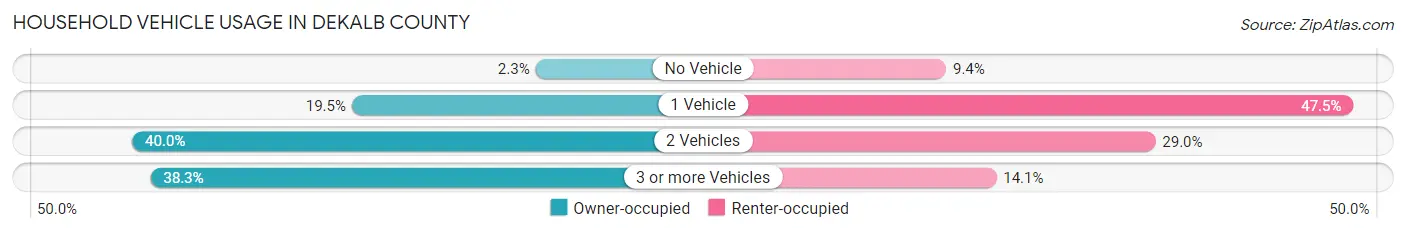
| Vehicles per Household | Owner-occupied | Renter-occupied |
| No Vehicle | 438 (2.3%) | 634 (9.4%) |
| 1 Vehicle | 3,692 (19.5%) | 3,187 (47.4%) |
| 2 Vehicles | 7,584 (40.0%) | 1,946 (29.0%) |
| 3 or more Vehicles | 7,260 (38.3%) | 949 (14.1%) |
| Total | 18,974 (100.0%) | 6,716 (100.0%) |
Real Estate & Mortgages in DeKalb County
Real Estate and Mortgage Overview in DeKalb County
| Characteristic | Without Mortgage | With Mortgage |
| Housing Units | 10,862 | 8,112 |
| Median Property Value | $118,000 | $149,300 |
| Median Household Income | $45,645 | $828 |
| Monthly Housing Costs | $382 | $107 |
| Real Estate Taxes | $391 | $806 |
Property Value by Mortgage Status in DeKalb County
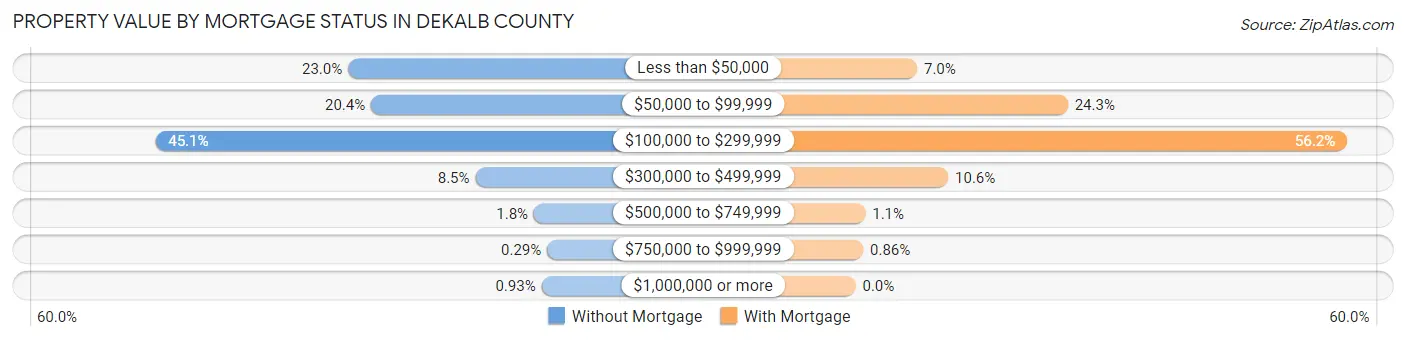
| Property Value | Without Mortgage | With Mortgage |
| Less than $50,000 | 2,503 (23.0%) | 570 (7.0%) |
| $50,000 to $99,999 | 2,217 (20.4%) | 1,967 (24.2%) |
| $100,000 to $299,999 | 4,894 (45.1%) | 4,557 (56.2%) |
| $300,000 to $499,999 | 921 (8.5%) | 858 (10.6%) |
| $500,000 to $749,999 | 194 (1.8%) | 90 (1.1%) |
| $750,000 to $999,999 | 32 (0.3%) | 70 (0.9%) |
| $1,000,000 or more | 101 (0.9%) | 0 (0.0%) |
| Total | 10,862 (100.0%) | 8,112 (100.0%) |
Household Income by Mortgage Status in DeKalb County
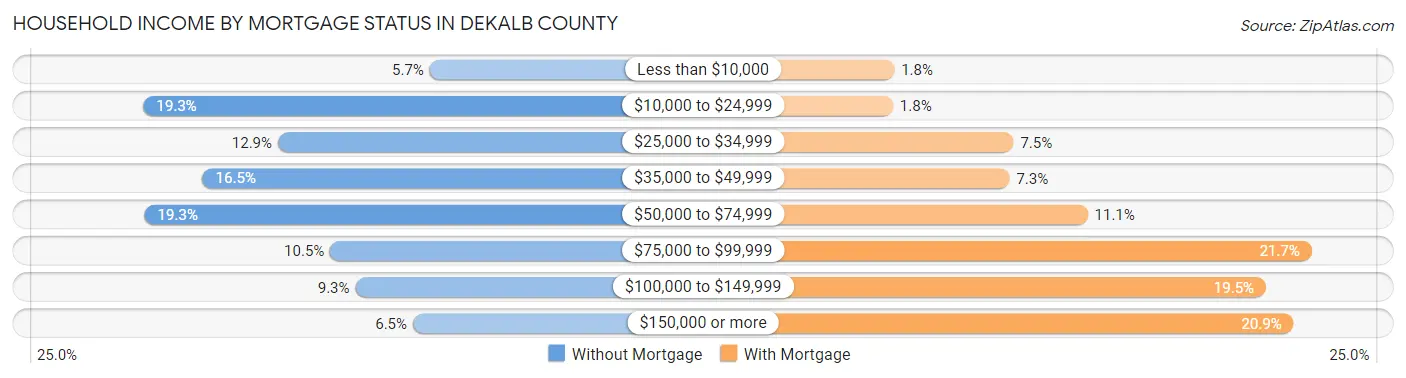
| Household Income | Without Mortgage | With Mortgage |
| Less than $10,000 | 620 (5.7%) | 149 (1.8%) |
| $10,000 to $24,999 | 2,101 (19.3%) | 144 (1.8%) |
| $25,000 to $34,999 | 1,405 (12.9%) | 610 (7.5%) |
| $35,000 to $49,999 | 1,794 (16.5%) | 595 (7.3%) |
| $50,000 to $74,999 | 2,095 (19.3%) | 896 (11.1%) |
| $75,000 to $99,999 | 1,135 (10.4%) | 1,762 (21.7%) |
| $100,000 to $149,999 | 1,005 (9.2%) | 1,585 (19.5%) |
| $150,000 or more | 707 (6.5%) | 1,692 (20.9%) |
| Total | 10,862 (100.0%) | 8,112 (100.0%) |
Property Value to Household Income Ratio in DeKalb County
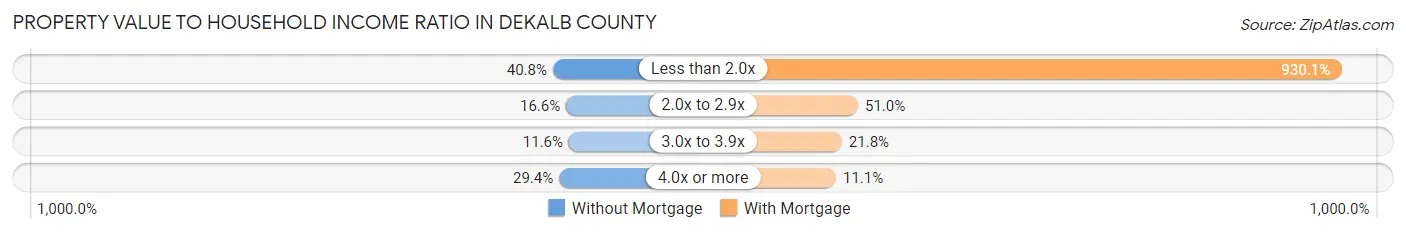
| Value-to-Income Ratio | Without Mortgage | With Mortgage |
| Less than 2.0x | 4,431 (40.8%) | 75,450 (930.1%) |
| 2.0x to 2.9x | 1,806 (16.6%) | 4,139 (51.0%) |
| 3.0x to 3.9x | 1,257 (11.6%) | 1,769 (21.8%) |
| 4.0x or more | 3,189 (29.4%) | 904 (11.1%) |
| Total | 10,862 (100.0%) | 8,112 (100.0%) |
Real Estate Taxes by Mortgage Status in DeKalb County
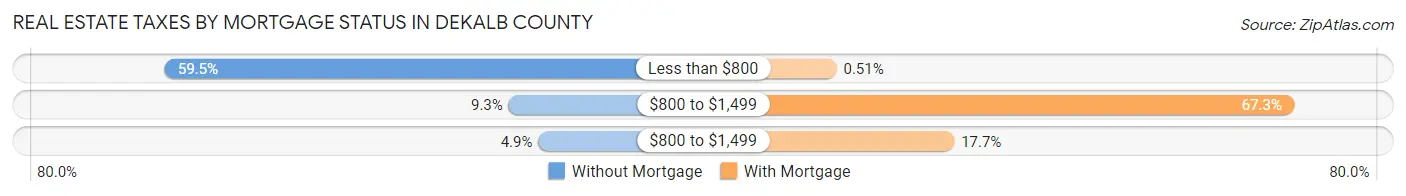
| Property Taxes | Without Mortgage | With Mortgage |
| Less than $800 | 6,464 (59.5%) | 41 (0.5%) |
| $800 to $1,499 | 1,008 (9.3%) | 5,461 (67.3%) |
| $800 to $1,499 | 537 (4.9%) | 1,436 (17.7%) |
| Total | 10,862 (100.0%) | 8,112 (100.0%) |
Health & Disability in DeKalb County
Health Insurance Coverage by Age in DeKalb County
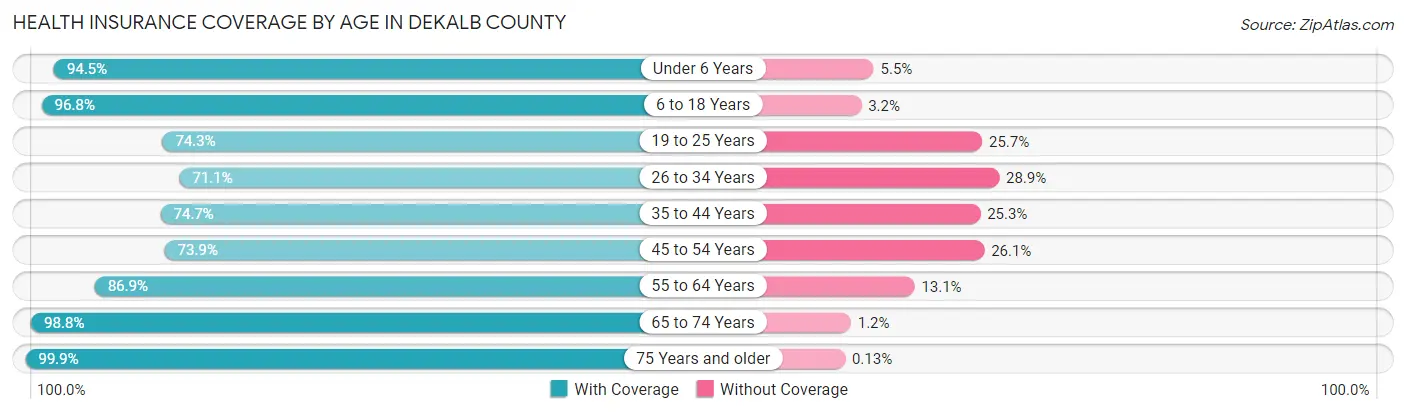
| Age Bracket | With Coverage | Without Coverage |
| Under 6 Years | 4,626 (94.5%) | 267 (5.5%) |
| 6 to 18 Years | 12,763 (96.8%) | 417 (3.2%) |
| 19 to 25 Years | 4,524 (74.3%) | 1,564 (25.7%) |
| 26 to 34 Years | 5,277 (71.1%) | 2,141 (28.9%) |
| 35 to 44 Years | 6,628 (74.7%) | 2,249 (25.3%) |
| 45 to 54 Years | 6,711 (73.9%) | 2,369 (26.1%) |
| 55 to 64 Years | 8,130 (86.9%) | 1,223 (13.1%) |
| 65 to 74 Years | 7,328 (98.8%) | 90 (1.2%) |
| 75 Years and older | 4,523 (99.9%) | 6 (0.1%) |
| Total | 60,510 (85.4%) | 10,326 (14.6%) |
Health Insurance Coverage by Citizenship Status in DeKalb County
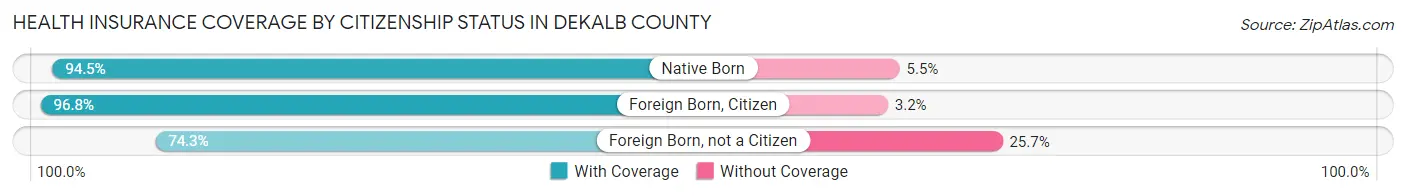
| Citizenship Status | With Coverage | Without Coverage |
| Native Born | 4,626 (94.5%) | 267 (5.5%) |
| Foreign Born, Citizen | 12,763 (96.8%) | 417 (3.2%) |
| Foreign Born, not a Citizen | 4,524 (74.3%) | 1,564 (25.7%) |
Health Insurance Coverage by Household Income in DeKalb County
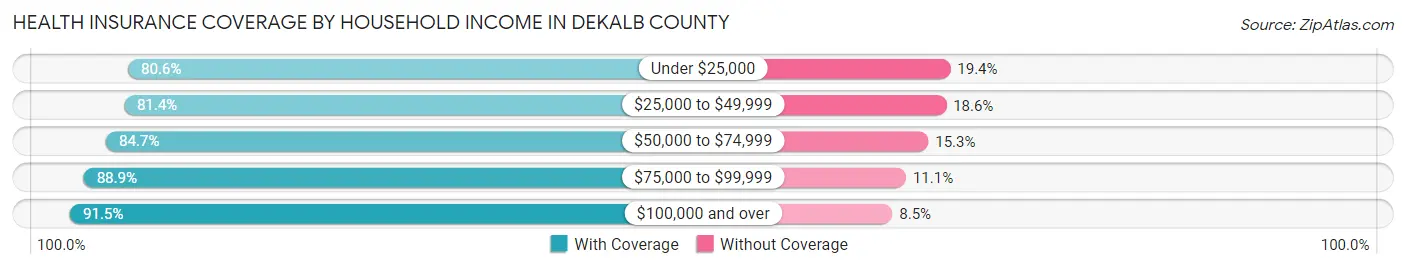
| Household Income | With Coverage | Without Coverage |
| Under $25,000 | 10,333 (80.6%) | 2,487 (19.4%) |
| $25,000 to $49,999 | 13,565 (81.4%) | 3,104 (18.6%) |
| $50,000 to $74,999 | 12,215 (84.7%) | 2,202 (15.3%) |
| $75,000 to $99,999 | 8,775 (88.9%) | 1,095 (11.1%) |
| $100,000 and over | 15,387 (91.5%) | 1,435 (8.5%) |
Public vs Private Health Insurance Coverage by Age in DeKalb County
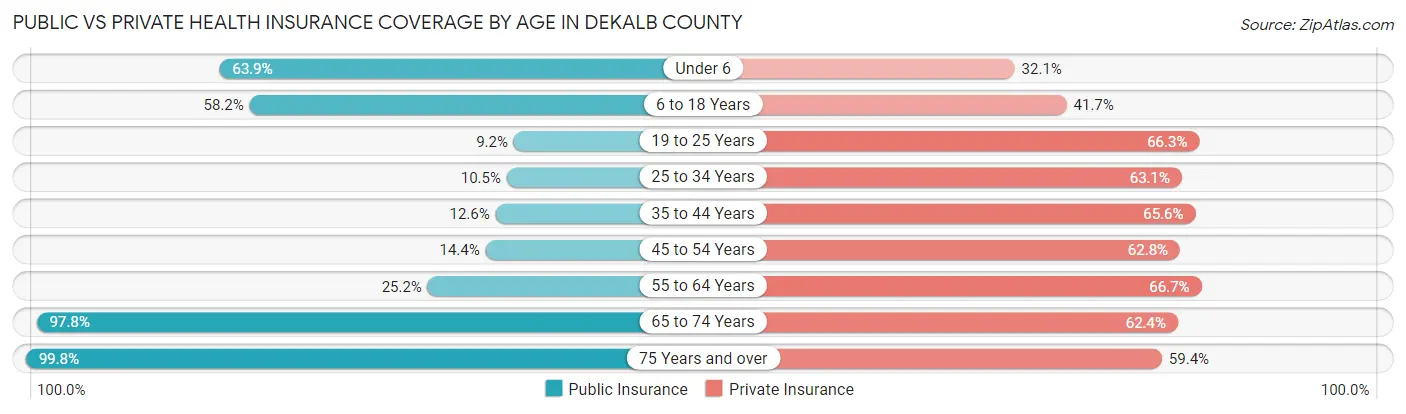
| Age Bracket | Public Insurance | Private Insurance |
| Under 6 | 3,124 (63.8%) | 1,570 (32.1%) |
| 6 to 18 Years | 7,675 (58.2%) | 5,500 (41.7%) |
| 19 to 25 Years | 560 (9.2%) | 4,039 (66.3%) |
| 25 to 34 Years | 779 (10.5%) | 4,681 (63.1%) |
| 35 to 44 Years | 1,117 (12.6%) | 5,824 (65.6%) |
| 45 to 54 Years | 1,311 (14.4%) | 5,698 (62.7%) |
| 55 to 64 Years | 2,355 (25.2%) | 6,242 (66.7%) |
| 65 to 74 Years | 7,254 (97.8%) | 4,626 (62.4%) |
| 75 Years and over | 4,519 (99.8%) | 2,691 (59.4%) |
| Total | 28,694 (40.5%) | 40,871 (57.7%) |
Disability Status by Sex by Age in DeKalb County
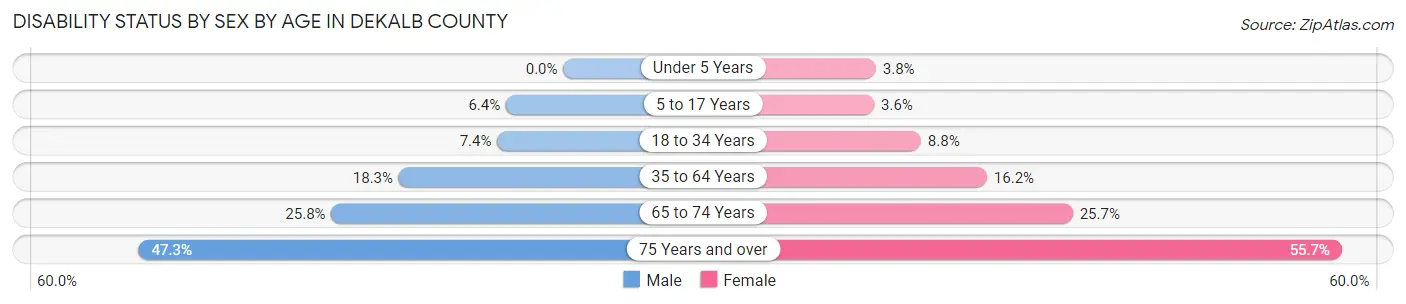
| Age Bracket | Male | Female |
| Under 5 Years | 0 (0.0%) | 75 (3.8%) |
| 5 to 17 Years | 426 (6.4%) | 229 (3.6%) |
| 18 to 34 Years | 548 (7.4%) | 616 (8.8%) |
| 35 to 64 Years | 2,491 (18.3%) | 2,216 (16.2%) |
| 65 to 74 Years | 934 (25.8%) | 978 (25.7%) |
| 75 Years and over | 878 (47.3%) | 1,488 (55.7%) |
Disability Class by Sex by Age in DeKalb County
Disability Class: Hearing Difficulty
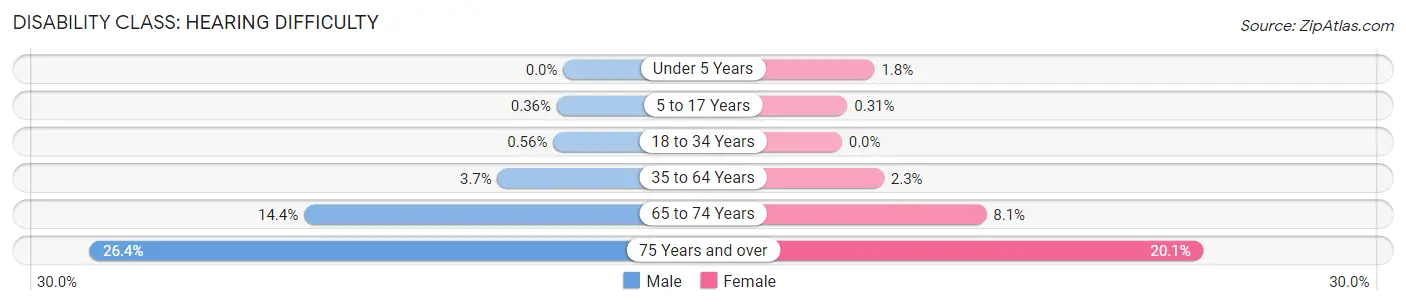
| Age Bracket | Male | Female |
| Under 5 Years | 0 (0.0%) | 36 (1.8%) |
| 5 to 17 Years | 24 (0.4%) | 20 (0.3%) |
| 18 to 34 Years | 42 (0.6%) | 0 (0.0%) |
| 35 to 64 Years | 498 (3.7%) | 321 (2.3%) |
| 65 to 74 Years | 522 (14.4%) | 306 (8.1%) |
| 75 Years and over | 489 (26.4%) | 537 (20.1%) |
Disability Class: Vision Difficulty
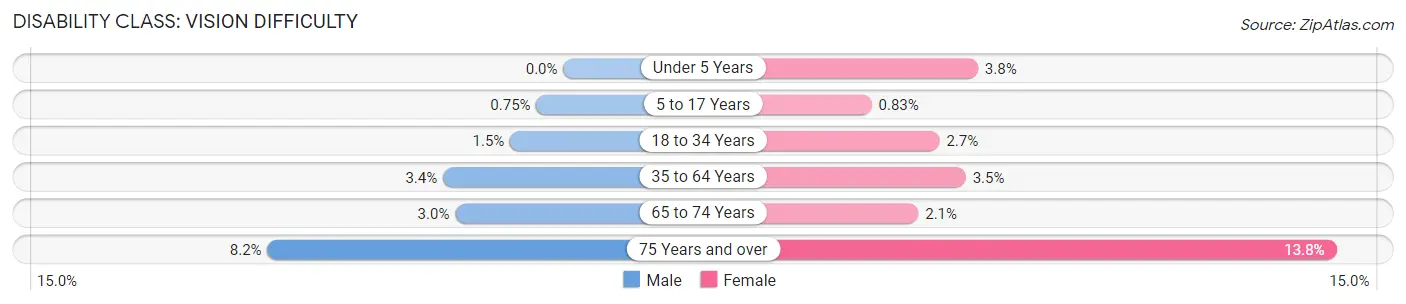
| Age Bracket | Male | Female |
| Under 5 Years | 0 (0.0%) | 75 (3.8%) |
| 5 to 17 Years | 50 (0.7%) | 53 (0.8%) |
| 18 to 34 Years | 110 (1.5%) | 190 (2.7%) |
| 35 to 64 Years | 455 (3.4%) | 473 (3.5%) |
| 65 to 74 Years | 109 (3.0%) | 81 (2.1%) |
| 75 Years and over | 153 (8.2%) | 368 (13.8%) |
Disability Class: Cognitive Difficulty
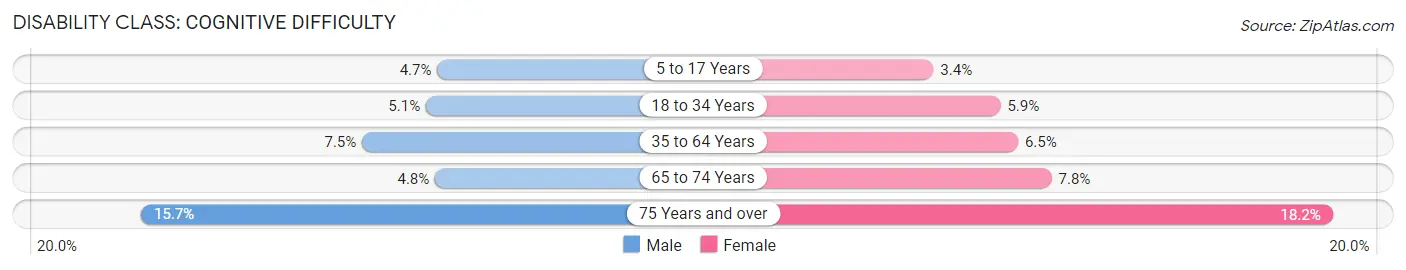
| Age Bracket | Male | Female |
| 5 to 17 Years | 312 (4.7%) | 216 (3.4%) |
| 18 to 34 Years | 380 (5.1%) | 412 (5.9%) |
| 35 to 64 Years | 1,016 (7.5%) | 897 (6.5%) |
| 65 to 74 Years | 172 (4.8%) | 296 (7.8%) |
| 75 Years and over | 291 (15.7%) | 487 (18.2%) |
Disability Class: Ambulatory Difficulty
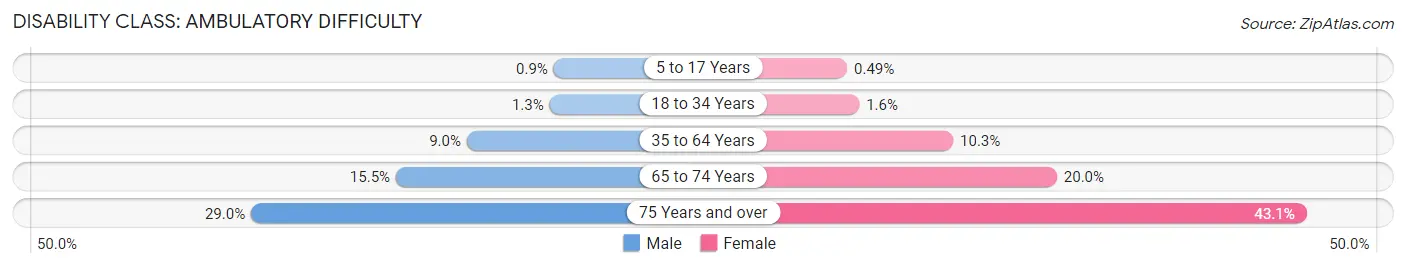
| Age Bracket | Male | Female |
| 5 to 17 Years | 60 (0.9%) | 31 (0.5%) |
| 18 to 34 Years | 95 (1.3%) | 113 (1.6%) |
| 35 to 64 Years | 1,219 (9.0%) | 1,416 (10.3%) |
| 65 to 74 Years | 562 (15.5%) | 759 (20.0%) |
| 75 Years and over | 538 (29.0%) | 1,153 (43.1%) |
Disability Class: Self-Care Difficulty
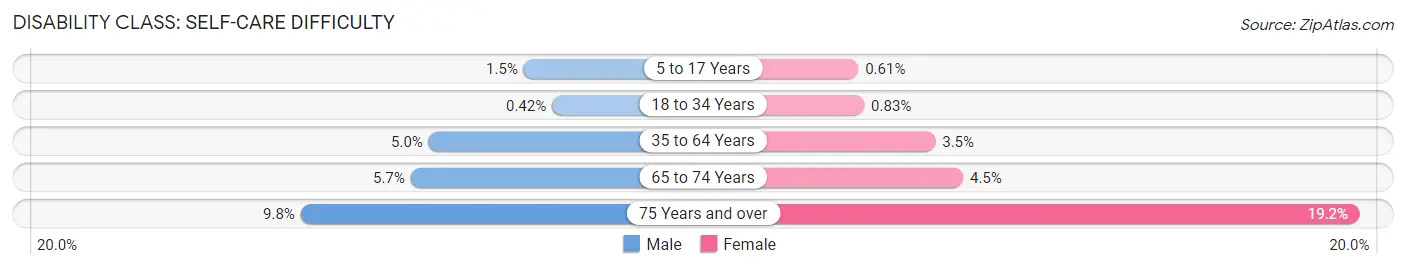
| Age Bracket | Male | Female |
| 5 to 17 Years | 98 (1.5%) | 39 (0.6%) |
| 18 to 34 Years | 31 (0.4%) | 58 (0.8%) |
| 35 to 64 Years | 680 (5.0%) | 476 (3.5%) |
| 65 to 74 Years | 205 (5.7%) | 171 (4.5%) |
| 75 Years and over | 181 (9.8%) | 514 (19.2%) |
Technology Access in DeKalb County
Computing Device Access in DeKalb County
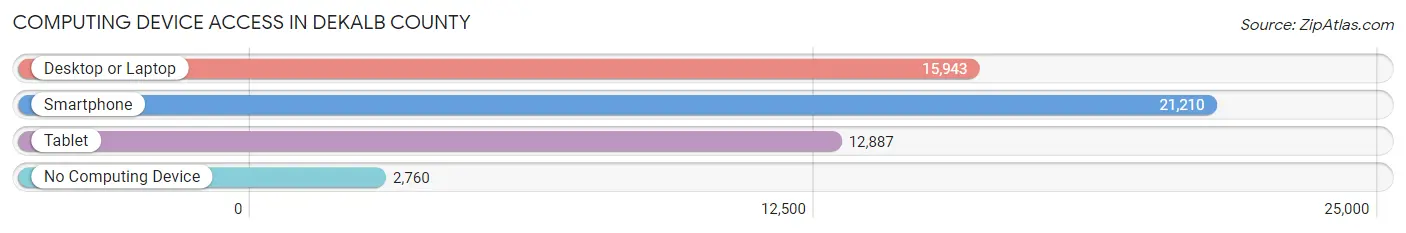
| Device Type | # Households | % Households |
| Desktop or Laptop | 15,943 | 62.1% |
| Smartphone | 21,210 | 82.6% |
| Tablet | 12,887 | 50.2% |
| No Computing Device | 2,760 | 10.7% |
| Total | 25,690 | 100.0% |
Internet Access in DeKalb County
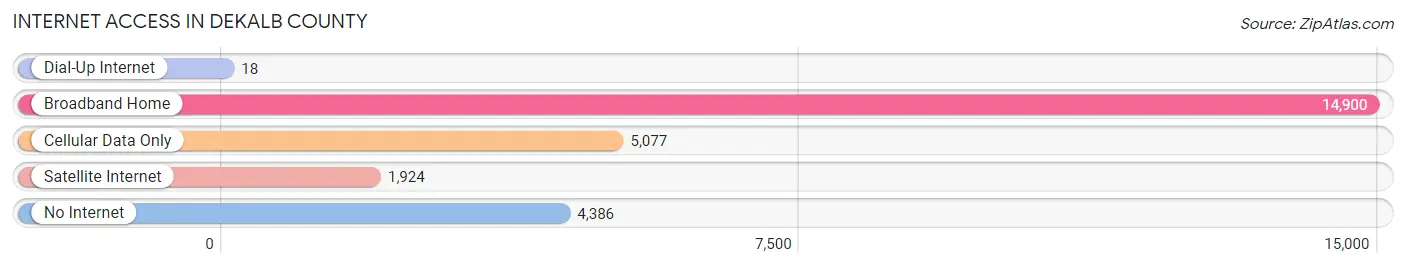
| Internet Type | # Households | % Households |
| Dial-Up Internet | 18 | 0.1% |
| Broadband Home | 14,900 | 58.0% |
| Cellular Data Only | 5,077 | 19.8% |
| Satellite Internet | 1,924 | 7.5% |
| No Internet | 4,386 | 17.1% |
| Total | 25,690 | 100.0% |
DeKalb County Summary
Dekalb County, Alabama is located in the northeastern corner of the state and is part of the Appalachian region. It is bordered by Jackson County to the north, Marshall County to the east, Etowah County to the south, and Cherokee County to the west. The county seat is Fort Payne, and the largest city is Rainsville. The county was established in 1836 and named for Major General Baron Johann de Kalb, a German-born officer who served in the Continental Army during the American Revolutionary War.
Geography
Dekalb County covers an area of 576 square miles and is located in the Appalachian Mountains. The terrain is mostly mountainous, with the highest point being Lookout Mountain at 1,841 feet. The county is drained by the Little River, which flows through the county from north to south. Other major waterways include the Town Creek, the Little Wills Creek, and the Big Wills Creek. The county is mostly forested, with the majority of the land being used for timber production.
Demographics
As of the 2010 census, Dekalb County had a population of 71,109. The racial makeup of the county was 92.3% White, 4.3% Black or African American, 0.4% Native American, 0.3% Asian, 0.1% Pacific Islander, 1.2% from other races, and 1.4% from two or more races. Hispanic or Latino of any race were 2.7% of the population.
The median household income was $35,945 and the median family income was $43,945. The per capita income was $18,845. About 16.2% of the population was below the poverty line.
Economy
Dekalb County’s economy is largely based on agriculture and manufacturing. The county is home to several large poultry processing plants, as well as a number of smaller poultry farms. The county is also home to several large timber companies, which harvest and process timber for use in furniture and other wood products.
The county is also home to several large industrial parks, which are home to a variety of manufacturing companies. These companies produce a variety of products, including automotive parts, textiles, and plastics.
The county is also home to several tourist attractions, including the Little River Canyon National Preserve, the DeSoto State Park, and the DeKalb County Historical Museum.
Conclusion
Dekalb County, Alabama is a rural county located in the Appalachian region of the state. It is home to a diverse economy, with agriculture and manufacturing being the main industries. The county is also home to several tourist attractions, which draw visitors from all over the state and beyond. The county has a population of 71,109, with a median household income of $35,945 and a median family income of $43,945.
Common Questions
What is Per Capita Income in DeKalb County?
Per Capita income in DeKalb County is $24,915.
What is the Median Family Income in DeKalb County?
Median Family Income in DeKalb County is $59,225.
What is the Median Household income in DeKalb County?
Median Household Income in DeKalb County is $47,920.
What is Income or Wage Gap in DeKalb County?
Income or Wage Gap in DeKalb County is 39.7%.
Women in DeKalb County earn 60.3 cents for every dollar earned by a man.
What is Family Income Deficit in DeKalb County?
Family Income Deficit in DeKalb County is $9,959.
Families that are below poverty line in DeKalb County earn $9,959 less on average than the poverty threshold level.
What is Inequality or Gini Index in DeKalb County?
Inequality or Gini Index in DeKalb County is 0.46.
What is the Total Population of DeKalb County?
Total Population of DeKalb County is 71,680.
What is the Total Male Population of DeKalb County?
Total Male Population of DeKalb County is 35,847.
What is the Total Female Population of DeKalb County?
Total Female Population of DeKalb County is 35,833.
What is the Ratio of Males per 100 Females in DeKalb County?
There are 100.04 Males per 100 Females in DeKalb County.
What is the Ratio of Females per 100 Males in DeKalb County?
There are 99.96 Females per 100 Males in DeKalb County.
What is the Median Population Age in DeKalb County?
Median Population Age in DeKalb County is 39.6 Years.
What is the Average Family Size in DeKalb County
Average Family Size in DeKalb County is 3.3 People.
What is the Average Household Size in DeKalb County
Average Household Size in DeKalb County is 2.8 People.
How Large is the Labor Force in DeKalb County?
There are 32,139 People in the Labor Forcein in DeKalb County.
What is the Percentage of People in the Labor Force in DeKalb County?
56.5% of People are in the Labor Force in DeKalb County.
What is the Unemployment Rate in DeKalb County?
Unemployment Rate in DeKalb County is 3.9%.