Talladega County, AL Map & Demographics
Talladega County Map
Talladega County Overview
$29,236
PER CAPITA INCOME
$66,224
AVG FAMILY INCOME
$52,457
AVG HOUSEHOLD INCOME
34.8%
WAGE / INCOME GAP [ % ]
65.2¢/ $1
WAGE / INCOME GAP [ $ ]
$11,757
FAMILY INCOME DEFICIT
0.48
INEQUALITY / GINI INDEX
81,105
TOTAL POPULATION
39,386
MALE POPULATION
41,719
FEMALE POPULATION
94.41
MALES / 100 FEMALES
105.92
FEMALES / 100 MALES
42.1
MEDIAN AGE
2.9
AVG FAMILY SIZE
2.4
AVG HOUSEHOLD SIZE
35,186
LABOR FORCE [ PEOPLE ]
53.1%
PERCENT IN LABOR FORCE
8.4%
UNEMPLOYMENT RATE
Income in Talladega County
Income Overview in Talladega County
Per Capita Income in Talladega County is $29,236, while median incomes of families and households are $66,224 and $52,457 respectively.
| Characteristic | Number | Measure |
| Per Capita Income | 81,105 | $29,236 |
| Median Family Income | 21,944 | $66,224 |
| Mean Family Income | 21,944 | $82,079 |
| Median Household Income | 32,359 | $52,457 |
| Mean Household Income | 32,359 | $70,872 |
| Income Deficit | 21,944 | $11,757 |
| Wage / Income Gap (%) | 81,105 | 34.82% |
| Wage / Income Gap ($) | 81,105 | 65.18¢ per $1 |
| Gini / Inequality Index | 81,105 | 0.48 |
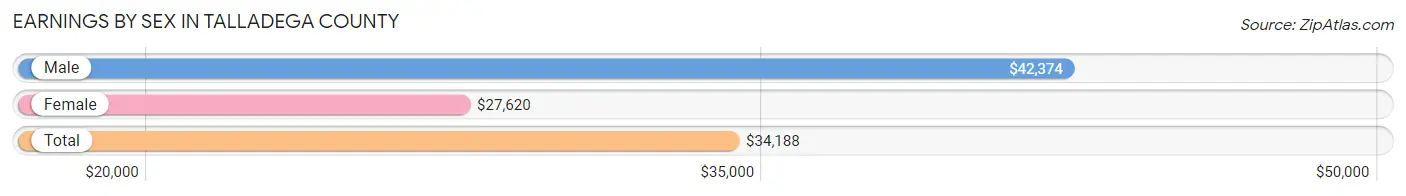
Earnings by Sex in Talladega County
Average Earnings in Talladega County are $34,188, $42,374 for men and $27,620 for women, a difference of 34.8%.
| Sex | Number | Average Earnings |
| Male | 18,824 (50.9%) | $42,374 |
| Female | 18,170 (49.1%) | $27,620 |
| Total | 36,994 (100.0%) | $34,188 |
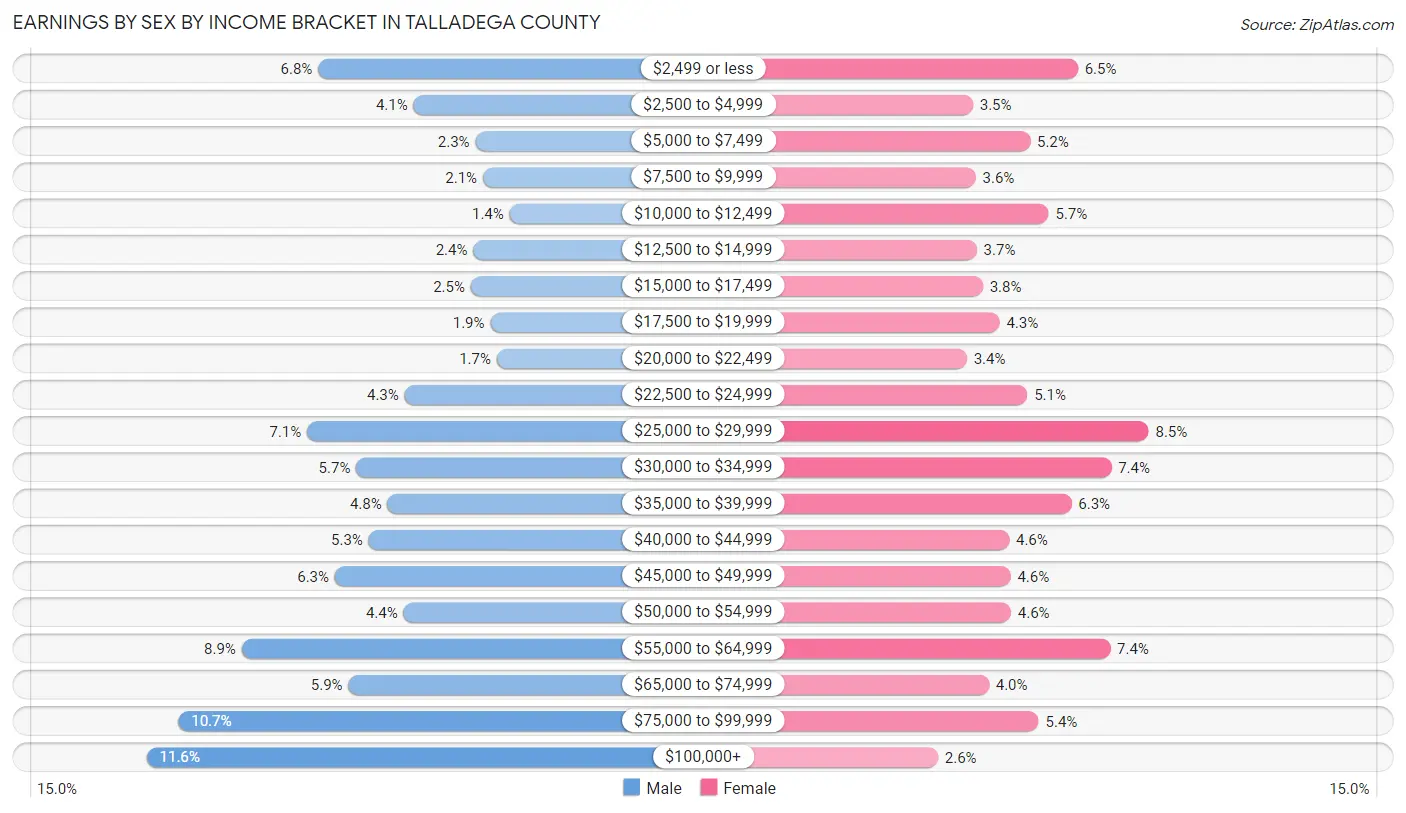
Earnings by Sex by Income Bracket in Talladega County
The most common earnings brackets in Talladega County are $100,000+ for men (2,177 | 11.6%) and $25,000 to $29,999 for women (1,540 | 8.5%).
| Income | Male | Female |
| $2,499 or less | 1,270 (6.8%) | 1,179 (6.5%) |
| $2,500 to $4,999 | 766 (4.1%) | 643 (3.5%) |
| $5,000 to $7,499 | 439 (2.3%) | 936 (5.1%) |
| $7,500 to $9,999 | 399 (2.1%) | 658 (3.6%) |
| $10,000 to $12,499 | 257 (1.4%) | 1,030 (5.7%) |
| $12,500 to $14,999 | 450 (2.4%) | 664 (3.6%) |
| $15,000 to $17,499 | 463 (2.5%) | 695 (3.8%) |
| $17,500 to $19,999 | 359 (1.9%) | 780 (4.3%) |
| $20,000 to $22,499 | 326 (1.7%) | 613 (3.4%) |
| $22,500 to $24,999 | 813 (4.3%) | 921 (5.1%) |
| $25,000 to $29,999 | 1,329 (7.1%) | 1,540 (8.5%) |
| $30,000 to $34,999 | 1,070 (5.7%) | 1,350 (7.4%) |
| $35,000 to $39,999 | 904 (4.8%) | 1,146 (6.3%) |
| $40,000 to $44,999 | 1,004 (5.3%) | 829 (4.6%) |
| $45,000 to $49,999 | 1,183 (6.3%) | 835 (4.6%) |
| $50,000 to $54,999 | 819 (4.3%) | 837 (4.6%) |
| $55,000 to $64,999 | 1,675 (8.9%) | 1,344 (7.4%) |
| $65,000 to $74,999 | 1,111 (5.9%) | 725 (4.0%) |
| $75,000 to $99,999 | 2,010 (10.7%) | 979 (5.4%) |
| $100,000+ | 2,177 (11.6%) | 466 (2.6%) |
| Total | 18,824 (100.0%) | 18,170 (100.0%) |
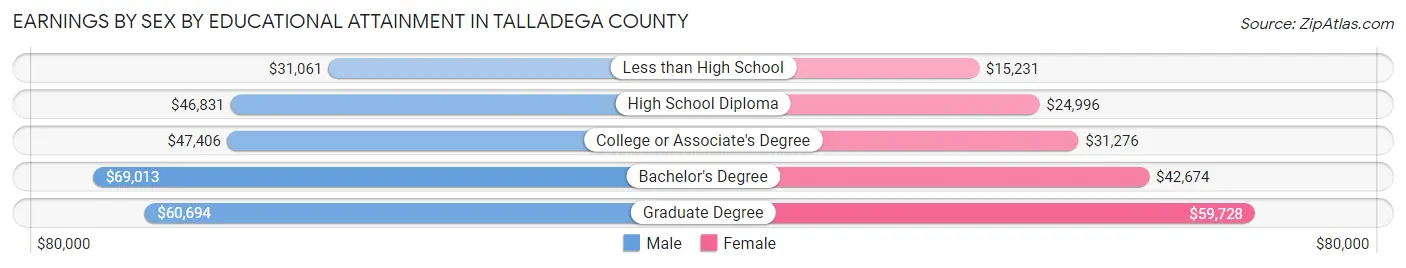
Earnings by Sex by Educational Attainment in Talladega County
Average earnings in Talladega County are $46,707 for men and $31,967 for women, a difference of 31.6%. Men with an educational attainment of bachelor's degree enjoy the highest average annual earnings of $69,013, while those with less than high school education earn the least with $31,061. Women with an educational attainment of graduate degree earn the most with the average annual earnings of $59,728, while those with less than high school education have the smallest earnings of $15,231.
| Educational Attainment | Male Income | Female Income |
| Less than High School | $31,061 | $15,231 |
| High School Diploma | $46,831 | $24,996 |
| College or Associate's Degree | $47,406 | $31,276 |
| Bachelor's Degree | $69,013 | $42,674 |
| Graduate Degree | $60,694 | $59,728 |
| Total | $46,707 | $31,967 |
Family Income in Talladega County
Family Income Brackets in Talladega County
According to the Talladega County family income data, there are 4,367 families falling into the $50,000 to $74,999 income range, which is the most common income bracket and makes up 19.9% of all families. Conversely, the $200,000+ income bracket is the least frequent group with only 987 families (4.5%) belonging to this category.
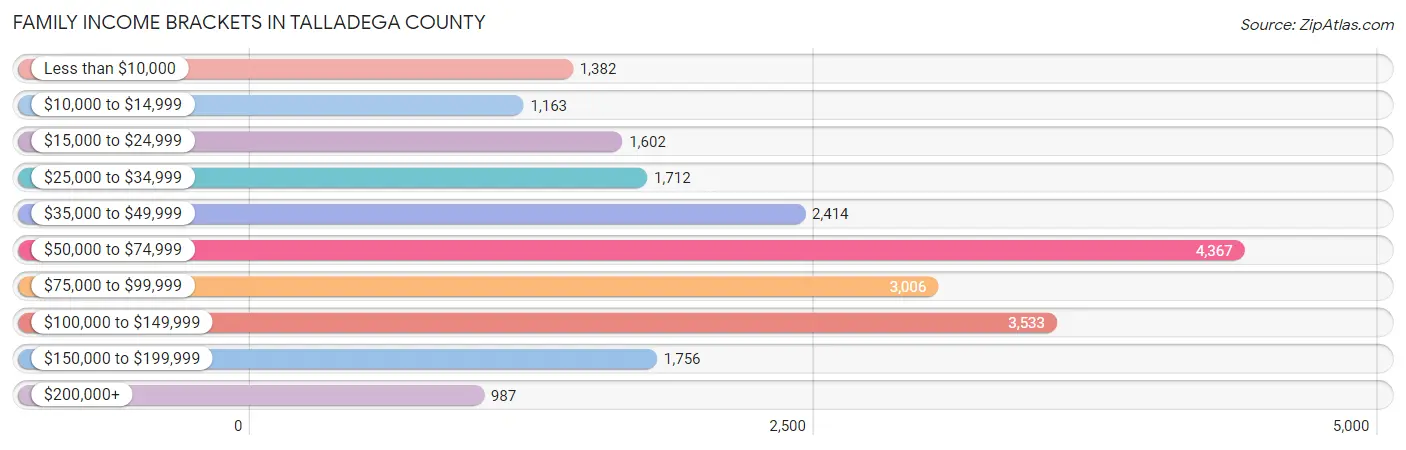
| Income Bracket | # Families | % Families |
| Less than $10,000 | 1,382 | 6.3% |
| $10,000 to $14,999 | 1,163 | 5.3% |
| $15,000 to $24,999 | 1,602 | 7.3% |
| $25,000 to $34,999 | 1,712 | 7.8% |
| $35,000 to $49,999 | 2,414 | 11.0% |
| $50,000 to $74,999 | 4,367 | 19.9% |
| $75,000 to $99,999 | 3,006 | 13.7% |
| $100,000 to $149,999 | 3,533 | 16.1% |
| $150,000 to $199,999 | 1,756 | 8.0% |
| $200,000+ | 987 | 4.5% |
Family Income by Famaliy Size in Talladega County
7+ person families (229 | 1.0%) account for the highest median family income in Talladega County with $91,250 per family, while 2-person families (11,610 | 52.9%) have the highest median income of $29,600 per family member.
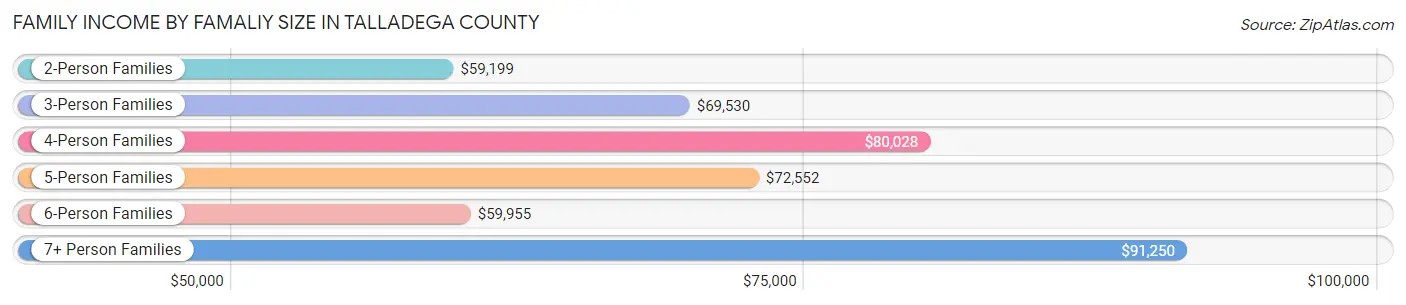
| Income Bracket | # Families | Median Income |
| 2-Person Families | 11,610 (52.9%) | $59,199 |
| 3-Person Families | 5,101 (23.3%) | $69,530 |
| 4-Person Families | 3,234 (14.7%) | $80,028 |
| 5-Person Families | 1,408 (6.4%) | $72,552 |
| 6-Person Families | 362 (1.7%) | $59,955 |
| 7+ Person Families | 229 (1.0%) | $91,250 |
| Total | 21,944 (100.0%) | $66,224 |
Family Income by Number of Earners in Talladega County
The median family income in Talladega County is $66,224, with families comprising 3+ earners (1,551) having the highest median family income of $139,609, while families with no earners (5,392) have the lowest median family income of $34,320, accounting for 7.1% and 24.6% of families, respectively.
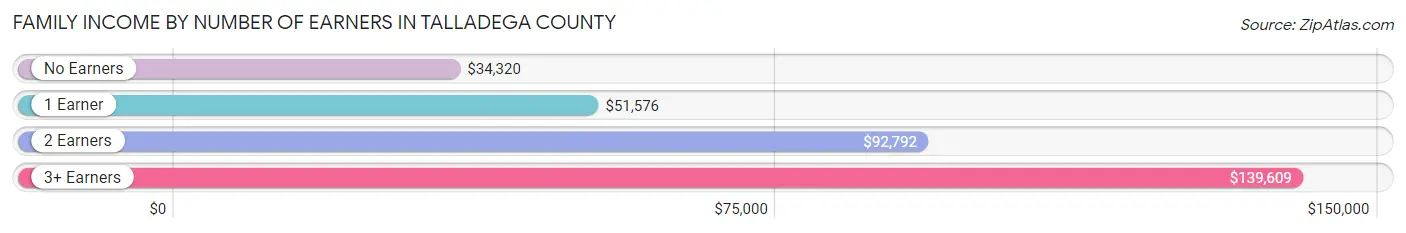
| Number of Earners | # Families | Median Income |
| No Earners | 5,392 (24.6%) | $34,320 |
| 1 Earner | 7,497 (34.2%) | $51,576 |
| 2 Earners | 7,504 (34.2%) | $92,792 |
| 3+ Earners | 1,551 (7.1%) | $139,609 |
| Total | 21,944 (100.0%) | $66,224 |
Household Income in Talladega County
Household Income Brackets in Talladega County
With 5,533 households falling in the category, the $50,000 to $74,999 income range is the most frequent in Talladega County, accounting for 17.1% of all households. In contrast, only 1,100 households (3.4%) fall into the $200,000+ income bracket, making it the least populous group.
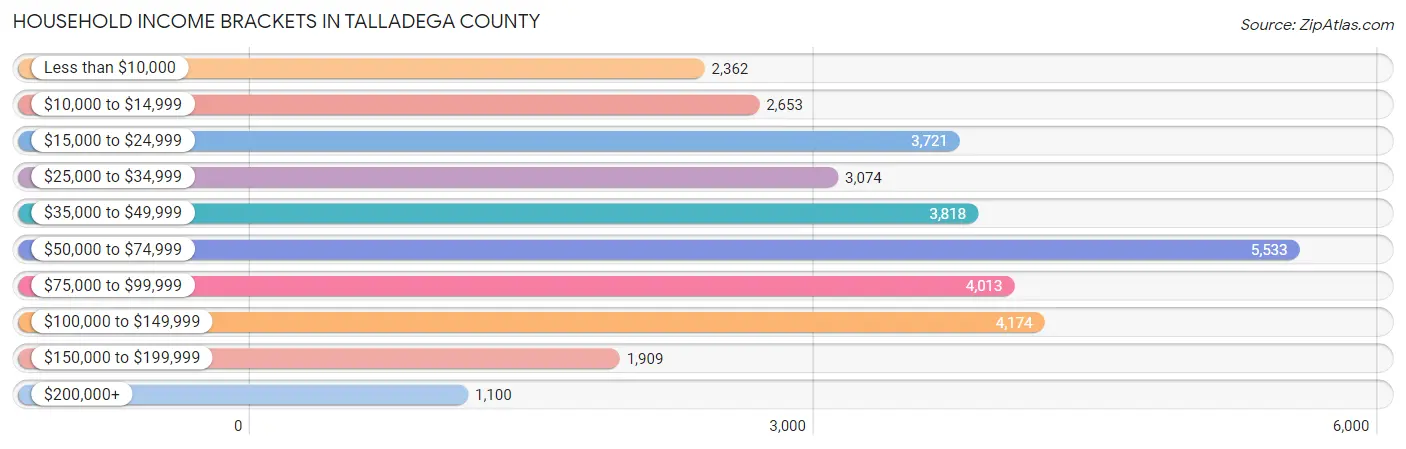
| Income Bracket | # Households | % Households |
| Less than $10,000 | 2,362 | 7.3% |
| $10,000 to $14,999 | 2,653 | 8.2% |
| $15,000 to $24,999 | 3,721 | 11.5% |
| $25,000 to $34,999 | 3,074 | 9.5% |
| $35,000 to $49,999 | 3,818 | 11.8% |
| $50,000 to $74,999 | 5,533 | 17.1% |
| $75,000 to $99,999 | 4,013 | 12.4% |
| $100,000 to $149,999 | 4,174 | 12.9% |
| $150,000 to $199,999 | 1,909 | 5.9% |
| $200,000+ | 1,100 | 3.4% |
Household Income by Householder Age in Talladega County
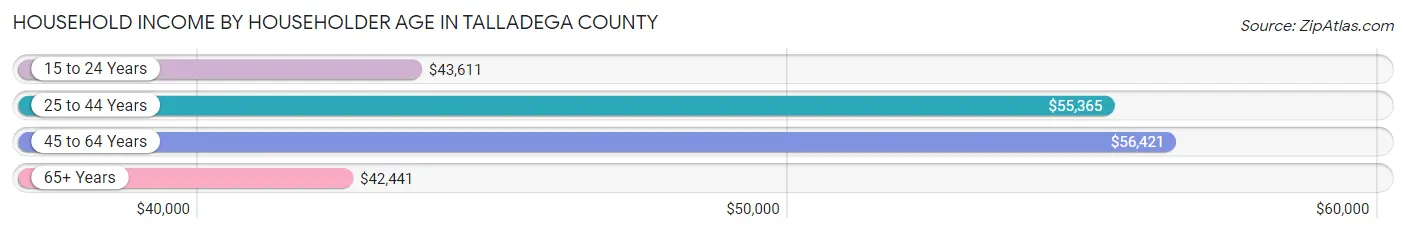
The median household income in Talladega County is $52,457, with the highest median household income of $56,421 found in the 45 to 64 years age bracket for the primary householder. A total of 12,469 households (38.5%) fall into this category. Meanwhile, the 65+ years age bracket for the primary householder has the lowest median household income of $42,441, with 9,675 households (29.9%) in this group.
| Income Bracket | # Households | Median Income |
| 15 to 24 Years | 768 (2.4%) | $43,611 |
| 25 to 44 Years | 9,447 (29.2%) | $55,365 |
| 45 to 64 Years | 12,469 (38.5%) | $56,421 |
| 65+ Years | 9,675 (29.9%) | $42,441 |
| Total | 32,359 (100.0%) | $52,457 |
Poverty in Talladega County
Income Below Poverty by Sex and Age in Talladega County
With 16.4% poverty level for males and 20.7% for females among the residents of Talladega County, 5 year old males and 5 year old females are the most vulnerable to poverty, with 380 males (69.7%) and 236 females (37.2%) in their respective age groups living below the poverty level.
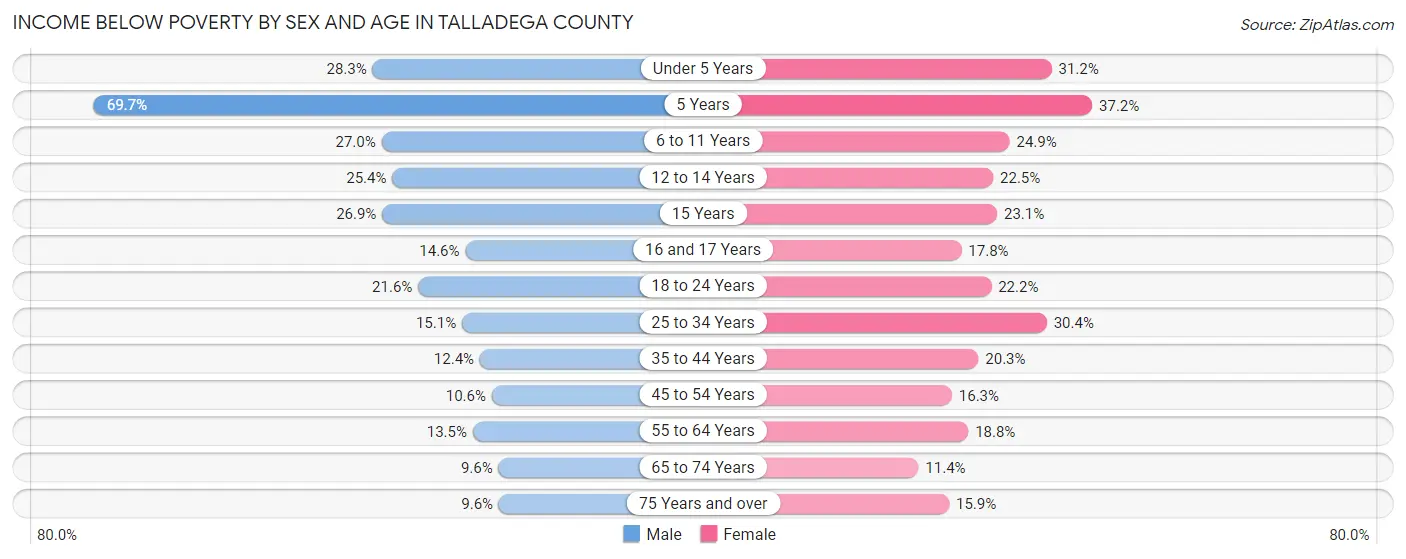
| Age Bracket | Male | Female |
| Under 5 Years | 591 (28.3%) | 628 (31.1%) |
| 5 Years | 380 (69.7%) | 236 (37.2%) |
| 6 to 11 Years | 724 (27.0%) | 681 (24.9%) |
| 12 to 14 Years | 335 (25.4%) | 264 (22.5%) |
| 15 Years | 152 (26.9%) | 112 (23.1%) |
| 16 and 17 Years | 136 (14.5%) | 171 (17.8%) |
| 18 to 24 Years | 619 (21.6%) | 695 (22.2%) |
| 25 to 34 Years | 718 (15.0%) | 1,560 (30.4%) |
| 35 to 44 Years | 504 (12.4%) | 1,020 (20.3%) |
| 45 to 54 Years | 520 (10.6%) | 866 (16.3%) |
| 55 to 64 Years | 711 (13.5%) | 1,115 (18.8%) |
| 65 to 74 Years | 413 (9.6%) | 542 (11.4%) |
| 75 Years and over | 227 (9.6%) | 516 (15.9%) |
| Total | 6,030 (16.4%) | 8,406 (20.7%) |
Income Above Poverty by Sex and Age in Talladega County
According to the poverty statistics in Talladega County, males aged 75 years and over and females aged 65 to 74 years are the age groups that are most secure financially, with 90.4% of males and 88.6% of females in these age groups living above the poverty line.
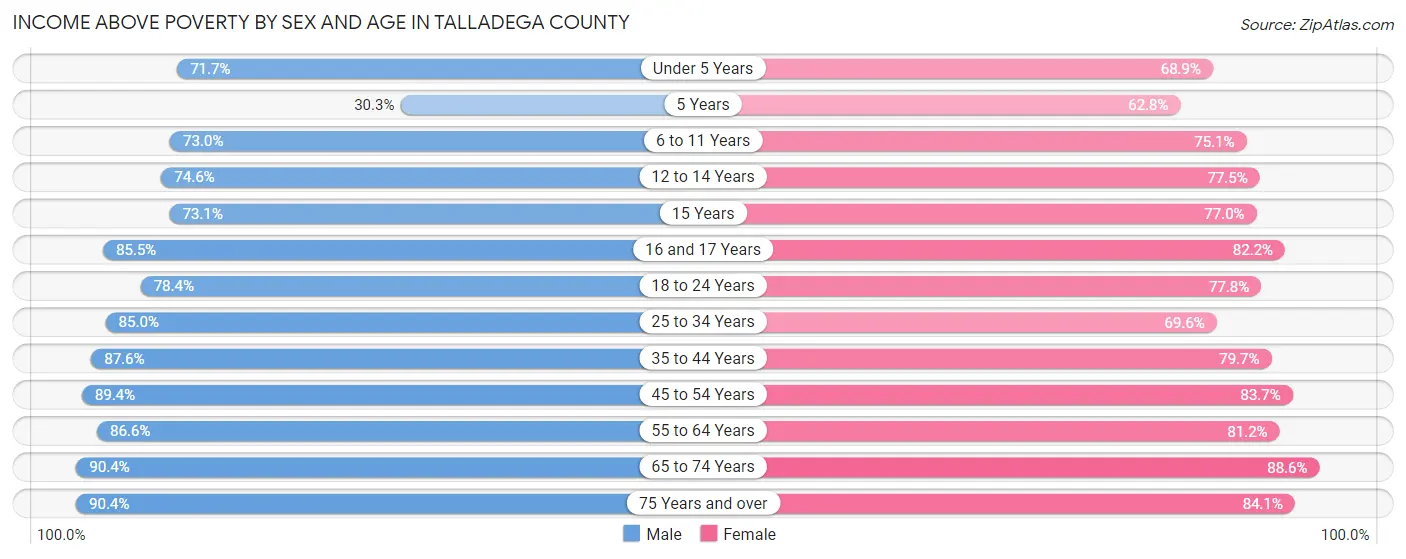
| Age Bracket | Male | Female |
| Under 5 Years | 1,495 (71.7%) | 1,388 (68.9%) |
| 5 Years | 165 (30.3%) | 399 (62.8%) |
| 6 to 11 Years | 1,957 (73.0%) | 2,053 (75.1%) |
| 12 to 14 Years | 984 (74.6%) | 911 (77.5%) |
| 15 Years | 413 (73.1%) | 374 (76.9%) |
| 16 and 17 Years | 799 (85.5%) | 792 (82.2%) |
| 18 to 24 Years | 2,252 (78.4%) | 2,437 (77.8%) |
| 25 to 34 Years | 4,052 (85.0%) | 3,567 (69.6%) |
| 35 to 44 Years | 3,563 (87.6%) | 4,009 (79.7%) |
| 45 to 54 Years | 4,373 (89.4%) | 4,434 (83.7%) |
| 55 to 64 Years | 4,577 (86.6%) | 4,826 (81.2%) |
| 65 to 74 Years | 3,881 (90.4%) | 4,219 (88.6%) |
| 75 Years and over | 2,144 (90.4%) | 2,726 (84.1%) |
| Total | 30,655 (83.6%) | 32,135 (79.3%) |
Income Below Poverty Among Married-Couple Families in Talladega County
The poverty statistics for married-couple families in Talladega County show that 5.8% or 851 of the total 14,684 families live below the poverty line. Families with 5 or more children have the highest poverty rate of 39.0%, comprising of 16 families. On the other hand, families with 3 or 4 children have the lowest poverty rate of 1.6%, which includes 13 families.
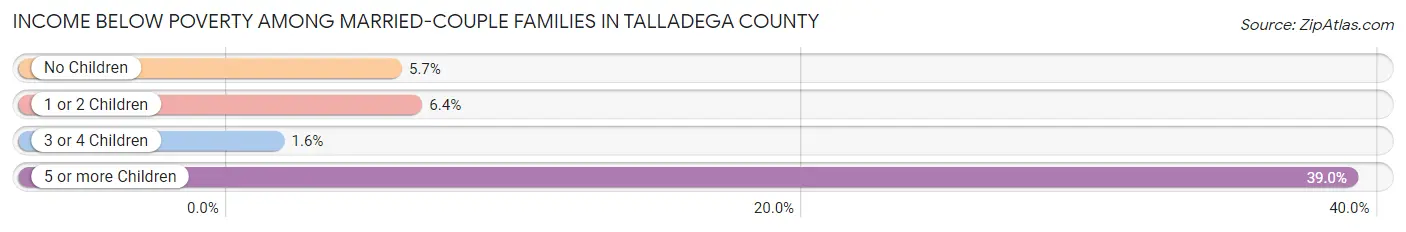
| Children | Above Poverty | Below Poverty |
| No Children | 8,793 (94.3%) | 532 (5.7%) |
| 1 or 2 Children | 4,228 (93.6%) | 290 (6.4%) |
| 3 or 4 Children | 787 (98.4%) | 13 (1.6%) |
| 5 or more Children | 25 (61.0%) | 16 (39.0%) |
| Total | 13,833 (94.2%) | 851 (5.8%) |
Income Below Poverty Among Single-Parent Households in Talladega County
According to the poverty data in Talladega County, 24.9% or 458 single-father households and 43.7% or 2,368 single-mother households are living below the poverty line. Among single-father households, those with 1 or 2 children have the highest poverty rate, with 222 households (28.1%) experiencing poverty. Likewise, among single-mother households, those with 3 or 4 children have the highest poverty rate, with 374 households (82.4%) falling below the poverty line.
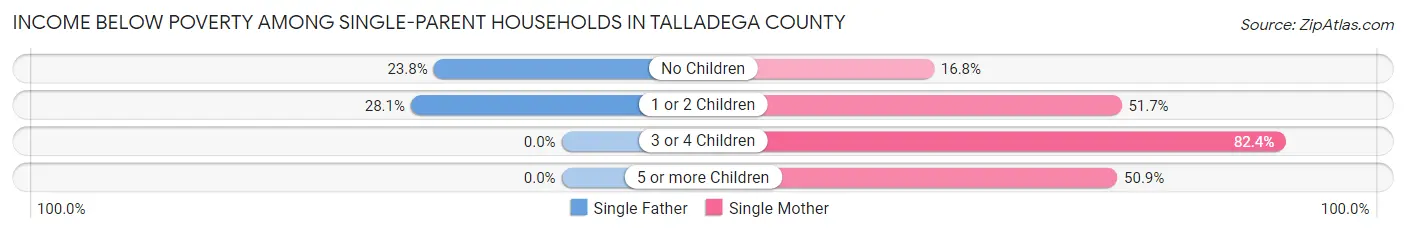
| Children | Single Father | Single Mother |
| No Children | 236 (23.8%) | 276 (16.8%) |
| 1 or 2 Children | 222 (28.1%) | 1,663 (51.7%) |
| 3 or 4 Children | 0 (0.0%) | 374 (82.4%) |
| 5 or more Children | 0 (0.0%) | 55 (50.9%) |
| Total | 458 (24.9%) | 2,368 (43.7%) |
Income Below Poverty Among Married-Couple vs Single-Parent Households in Talladega County
The poverty data for Talladega County shows that 851 of the married-couple family households (5.8%) and 2,826 of the single-parent households (38.9%) are living below the poverty level. Within the married-couple family households, those with 5 or more children have the highest poverty rate, with 16 households (39.0%) falling below the poverty line. Among the single-parent households, those with 3 or 4 children have the highest poverty rate, with 374 household (74.2%) living below poverty.
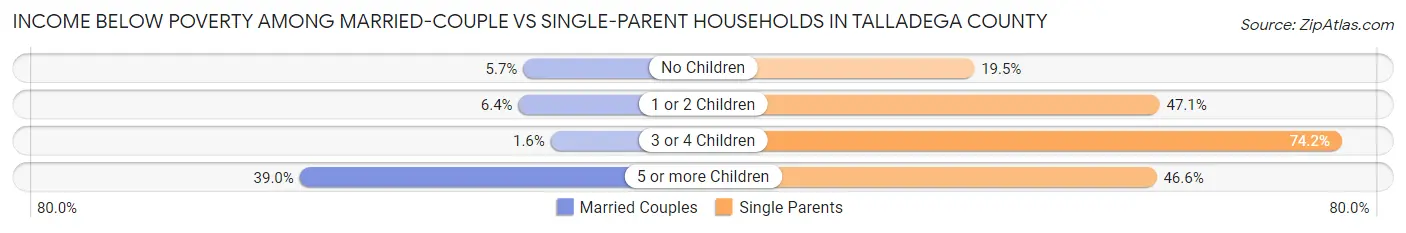
| Children | Married-Couple Families | Single-Parent Households |
| No Children | 532 (5.7%) | 512 (19.5%) |
| 1 or 2 Children | 290 (6.4%) | 1,885 (47.1%) |
| 3 or 4 Children | 13 (1.6%) | 374 (74.2%) |
| 5 or more Children | 16 (39.0%) | 55 (46.6%) |
| Total | 851 (5.8%) | 2,826 (38.9%) |
Race in Talladega County
The most populous races in Talladega County are White / Caucasian (51,186 | 63.1%), Black / African American (25,893 | 31.9%), and Two or more Races (2,523 | 3.1%).
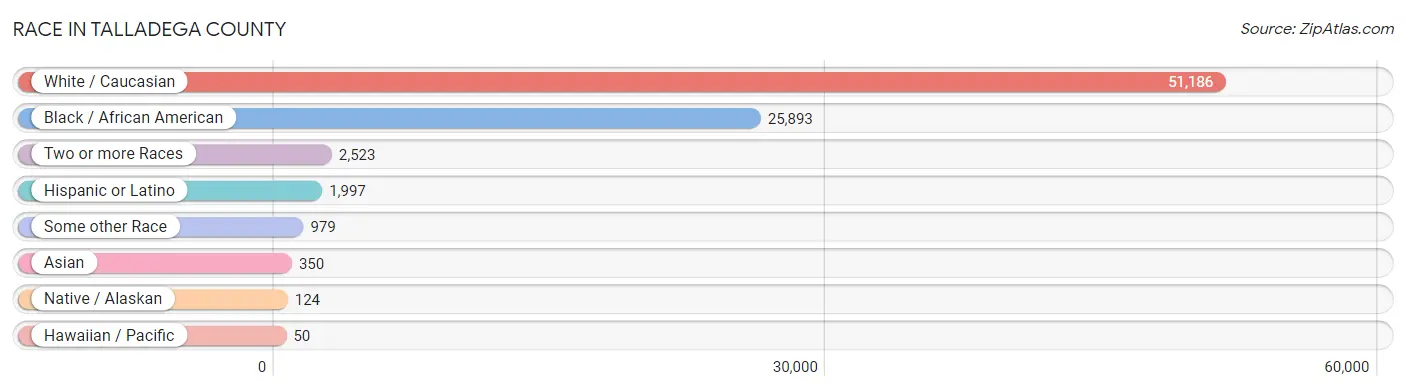
| Race | # Population | % Population |
| Asian | 350 | 0.4% |
| Black / African American | 25,893 | 31.9% |
| Hawaiian / Pacific | 50 | 0.1% |
| Hispanic or Latino | 1,997 | 2.5% |
| Native / Alaskan | 124 | 0.2% |
| White / Caucasian | 51,186 | 63.1% |
| Two or more Races | 2,523 | 3.1% |
| Some other Race | 979 | 1.2% |
| Total | 81,105 | 100.0% |
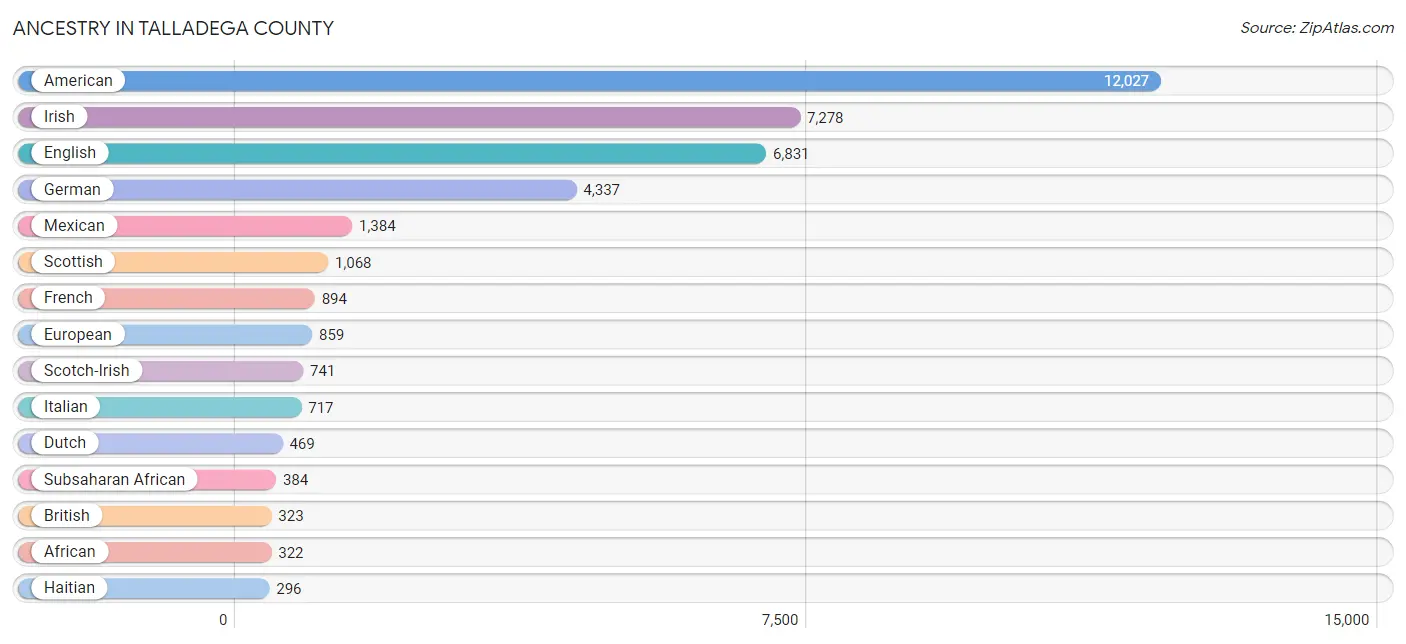
Ancestry in Talladega County
The most populous ancestries reported in Talladega County are American (12,027 | 14.8%), Irish (7,278 | 9.0%), English (6,831 | 8.4%), German (4,337 | 5.3%), and Mexican (1,384 | 1.7%), together accounting for 39.3% of all Talladega County residents.
| Ancestry | # Population | % Population |
| African | 322 | 0.4% |
| American | 12,027 | 14.8% |
| Armenian | 16 | 0.0% |
| Bhutanese | 101 | 0.1% |
| British | 323 | 0.4% |
| Bulgarian | 56 | 0.1% |
| Burmese | 227 | 0.3% |
| Cajun | 9 | 0.0% |
| Canadian | 67 | 0.1% |
| Celtic | 57 | 0.1% |
| Central American | 173 | 0.2% |
| Central American Indian | 25 | 0.0% |
| Cherokee | 238 | 0.3% |
| Cheyenne | 2 | 0.0% |
| Chickasaw | 3 | 0.0% |
| Chippewa | 9 | 0.0% |
| Choctaw | 9 | 0.0% |
| Colombian | 17 | 0.0% |
| Creek | 101 | 0.1% |
| Cuban | 29 | 0.0% |
| Czech | 97 | 0.1% |
| Czechoslovakian | 9 | 0.0% |
| Danish | 97 | 0.1% |
| Dominican | 10 | 0.0% |
| Dutch | 469 | 0.6% |
| Eastern European | 23 | 0.0% |
| Ecuadorian | 40 | 0.1% |
| English | 6,831 | 8.4% |
| European | 859 | 1.1% |
| Fijian | 1 | 0.0% |
| French | 894 | 1.1% |
| French Canadian | 14 | 0.0% |
| German | 4,337 | 5.3% |
| Ghanaian | 8 | 0.0% |
| Greek | 59 | 0.1% |
| Guatemalan | 157 | 0.2% |
| Haitian | 296 | 0.4% |
| Hungarian | 11 | 0.0% |
| Indian (Asian) | 20 | 0.0% |
| Iranian | 30 | 0.0% |
| Irish | 7,278 | 9.0% |
| Israeli | 29 | 0.0% |
| Italian | 717 | 0.9% |
| Jamaican | 56 | 0.1% |
| Korean | 180 | 0.2% |
| Lithuanian | 75 | 0.1% |
| Luxembourger | 18 | 0.0% |
| Mexican | 1,384 | 1.7% |
| Native Hawaiian | 29 | 0.0% |
| Navajo | 6 | 0.0% |
| Nigerian | 7 | 0.0% |
| Northern European | 32 | 0.0% |
| Norwegian | 239 | 0.3% |
| Pakistani | 29 | 0.0% |
| Panamanian | 16 | 0.0% |
| Peruvian | 15 | 0.0% |
| Polish | 231 | 0.3% |
| Portuguese | 37 | 0.1% |
| Puerto Rican | 178 | 0.2% |
| Russian | 60 | 0.1% |
| Samoan | 20 | 0.0% |
| Scandinavian | 50 | 0.1% |
| Scotch-Irish | 741 | 0.9% |
| Scottish | 1,068 | 1.3% |
| Seminole | 6 | 0.0% |
| Slavic | 16 | 0.0% |
| South American | 79 | 0.1% |
| Spaniard | 30 | 0.0% |
| Sri Lankan | 40 | 0.1% |
| Subsaharan African | 384 | 0.5% |
| Swedish | 91 | 0.1% |
| Swiss | 26 | 0.0% |
| Thai | 30 | 0.0% |
| Ukrainian | 105 | 0.1% |
| Venezuelan | 7 | 0.0% |
| Welsh | 257 | 0.3% |
| West Indian | 4 | 0.0% | View All 77 Rows |
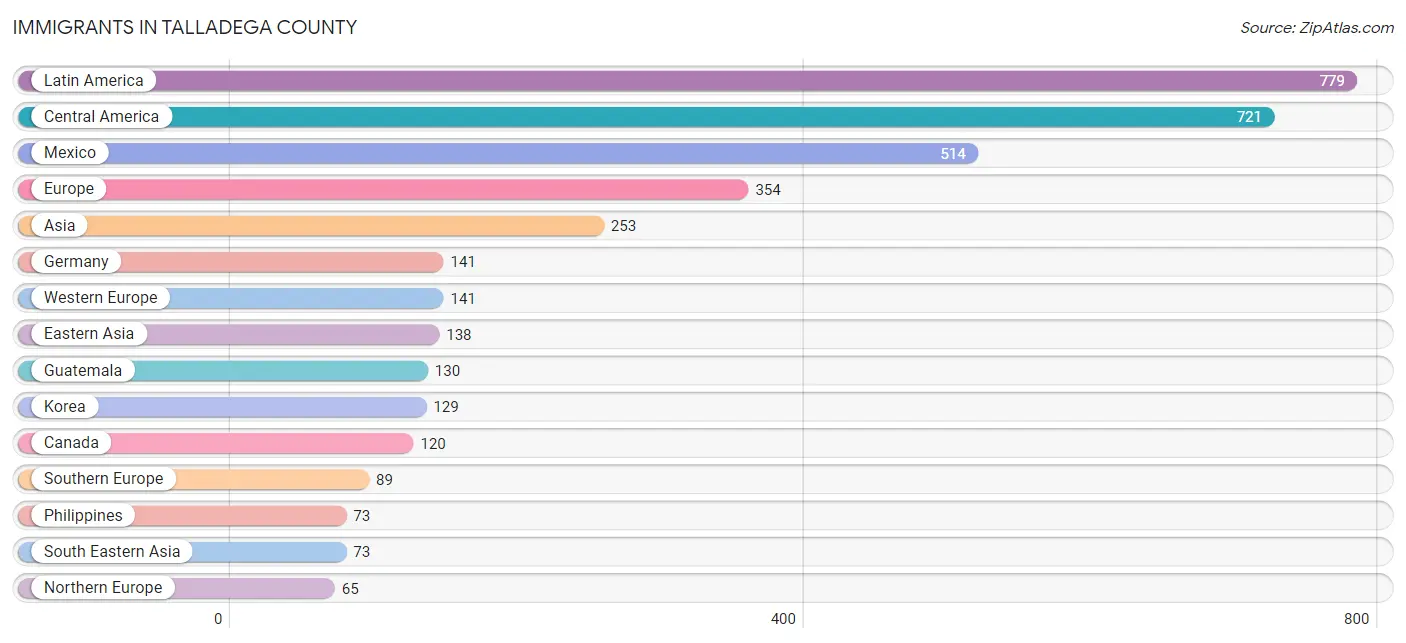
Immigrants in Talladega County
The most numerous immigrant groups reported in Talladega County came from Latin America (779 | 1.0%), Central America (721 | 0.9%), Mexico (514 | 0.6%), Europe (354 | 0.4%), and Asia (253 | 0.3%), together accounting for 3.2% of all Talladega County residents.
| Immigration Origin | # Population | % Population |
| Africa | 8 | 0.0% |
| Asia | 253 | 0.3% |
| Canada | 120 | 0.2% |
| Caribbean | 32 | 0.0% |
| Central America | 721 | 0.9% |
| China | 5 | 0.0% |
| Colombia | 6 | 0.0% |
| Cuba | 9 | 0.0% |
| Eastern Asia | 138 | 0.2% |
| Eastern Europe | 59 | 0.1% |
| Ecuador | 13 | 0.0% |
| El Salvador | 27 | 0.0% |
| Europe | 354 | 0.4% |
| Germany | 141 | 0.2% |
| Ghana | 8 | 0.0% |
| Greece | 37 | 0.1% |
| Guatemala | 130 | 0.2% |
| Haiti | 10 | 0.0% |
| Honduras | 27 | 0.0% |
| India | 42 | 0.1% |
| Italy | 8 | 0.0% |
| Japan | 4 | 0.0% |
| Korea | 129 | 0.2% |
| Latin America | 779 | 1.0% |
| Mexico | 514 | 0.6% |
| Northern Europe | 65 | 0.1% |
| Oceania | 1 | 0.0% |
| Panama | 23 | 0.0% |
| Philippines | 73 | 0.1% |
| Poland | 22 | 0.0% |
| Russia | 37 | 0.1% |
| South America | 26 | 0.0% |
| South Central Asia | 42 | 0.1% |
| South Eastern Asia | 73 | 0.1% |
| Southern Europe | 89 | 0.1% |
| Spain | 44 | 0.1% |
| Sweden | 65 | 0.1% |
| Venezuela | 7 | 0.0% |
| Western Africa | 8 | 0.0% |
| Western Europe | 141 | 0.2% | View All 40 Rows |
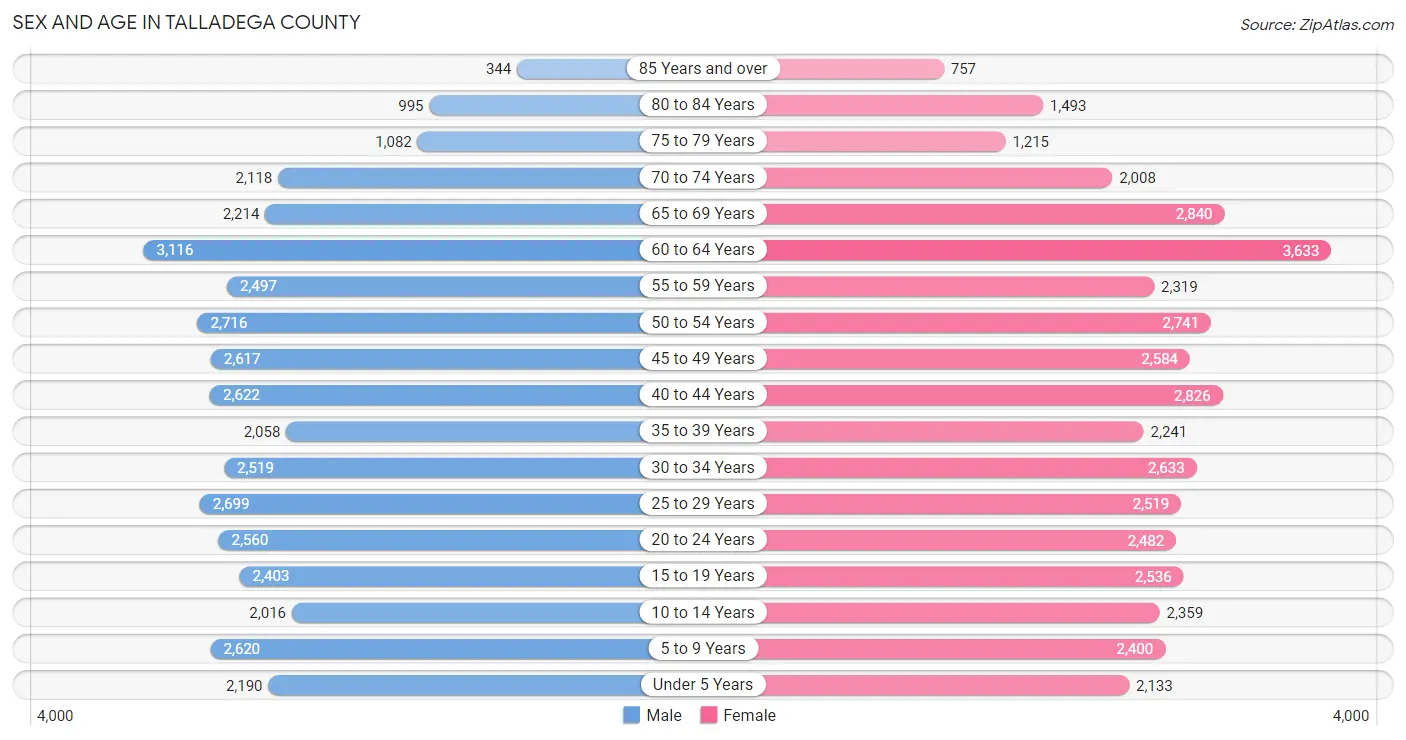
Sex and Age in Talladega County
Sex and Age in Talladega County
The most populous age groups in Talladega County are 60 to 64 Years (3,116 | 7.9%) for men and 60 to 64 Years (3,633 | 8.7%) for women.
| Age Bracket | Male | Female |
| Under 5 Years | 2,190 (5.6%) | 2,133 (5.1%) |
| 5 to 9 Years | 2,620 (6.7%) | 2,400 (5.8%) |
| 10 to 14 Years | 2,016 (5.1%) | 2,359 (5.7%) |
| 15 to 19 Years | 2,403 (6.1%) | 2,536 (6.1%) |
| 20 to 24 Years | 2,560 (6.5%) | 2,482 (5.9%) |
| 25 to 29 Years | 2,699 (6.9%) | 2,519 (6.0%) |
| 30 to 34 Years | 2,519 (6.4%) | 2,633 (6.3%) |
| 35 to 39 Years | 2,058 (5.2%) | 2,241 (5.4%) |
| 40 to 44 Years | 2,622 (6.7%) | 2,826 (6.8%) |
| 45 to 49 Years | 2,617 (6.6%) | 2,584 (6.2%) |
| 50 to 54 Years | 2,716 (6.9%) | 2,741 (6.6%) |
| 55 to 59 Years | 2,497 (6.3%) | 2,319 (5.6%) |
| 60 to 64 Years | 3,116 (7.9%) | 3,633 (8.7%) |
| 65 to 69 Years | 2,214 (5.6%) | 2,840 (6.8%) |
| 70 to 74 Years | 2,118 (5.4%) | 2,008 (4.8%) |
| 75 to 79 Years | 1,082 (2.8%) | 1,215 (2.9%) |
| 80 to 84 Years | 995 (2.5%) | 1,493 (3.6%) |
| 85 Years and over | 344 (0.9%) | 757 (1.8%) |
| Total | 39,386 (100.0%) | 41,719 (100.0%) |
Families and Households in Talladega County
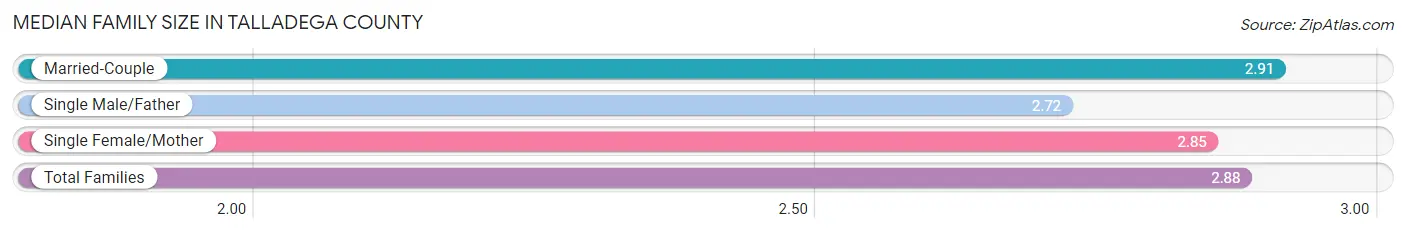
Median Family Size in Talladega County
The median family size in Talladega County is 2.88 persons per family, with married-couple families (14,684 | 66.9%) accounting for the largest median family size of 2.91 persons per family. On the other hand, single male/father families (1,841 | 8.4%) represent the smallest median family size with 2.72 persons per family.
| Family Type | # Families | Family Size |
| Married-Couple | 14,684 (66.9%) | 2.91 |
| Single Male/Father | 1,841 (8.4%) | 2.72 |
| Single Female/Mother | 5,419 (24.7%) | 2.85 |
| Total Families | 21,944 (100.0%) | 2.88 |
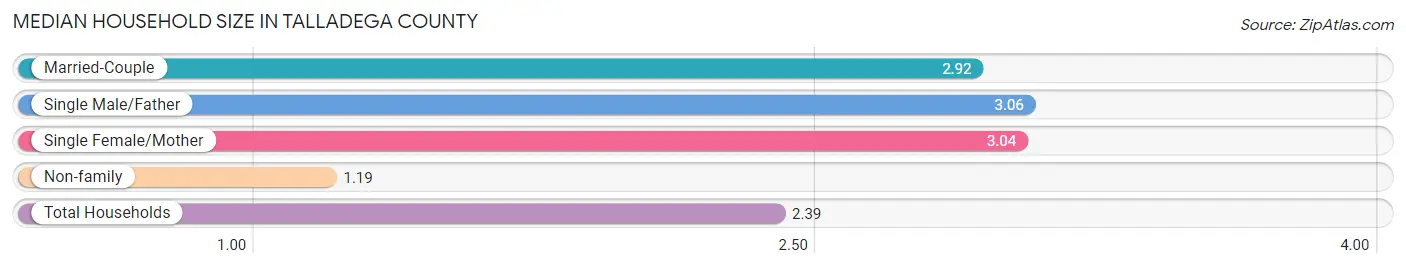
Median Household Size in Talladega County
The median household size in Talladega County is 2.39 persons per household, with single male/father households (1,841 | 5.7%) accounting for the largest median household size of 3.06 persons per household. non-family households (10,415 | 32.2%) represent the smallest median household size with 1.19 persons per household.
| Household Type | # Households | Household Size |
| Married-Couple | 14,684 (45.4%) | 2.92 |
| Single Male/Father | 1,841 (5.7%) | 3.06 |
| Single Female/Mother | 5,419 (16.8%) | 3.04 |
| Non-family | 10,415 (32.2%) | 1.19 |
| Total Households | 32,359 (100.0%) | 2.39 |
Household Size by Marriage Status in Talladega County
Out of a total of 32,359 households in Talladega County, 21,944 (67.8%) are family households, while 10,415 (32.2%) are nonfamily households. The most numerous type of family households are 2-person households, comprising 10,725, and the most common type of nonfamily households are 1-person households, comprising 9,052.
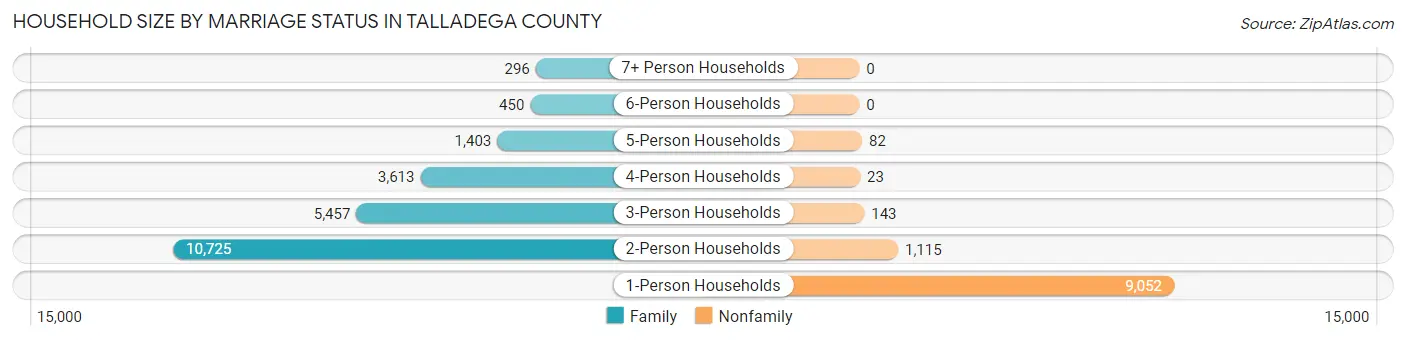
| Household Size | Family Households | Nonfamily Households |
| 1-Person Households | - | 9,052 (28.0%) |
| 2-Person Households | 10,725 (33.1%) | 1,115 (3.5%) |
| 3-Person Households | 5,457 (16.9%) | 143 (0.4%) |
| 4-Person Households | 3,613 (11.2%) | 23 (0.1%) |
| 5-Person Households | 1,403 (4.3%) | 82 (0.3%) |
| 6-Person Households | 450 (1.4%) | 0 (0.0%) |
| 7+ Person Households | 296 (0.9%) | 0 (0.0%) |
| Total | 21,944 (67.8%) | 10,415 (32.2%) |
Female Fertility in Talladega County
Fertility by Age in Talladega County
Average fertility rate in Talladega County is 69.0 births per 1,000 women. Women in the age bracket of 20 to 34 years have the highest fertility rate with 147.0 births per 1,000 women. Women in the age bracket of 20 to 34 years acount for 89.5% of all women with births.
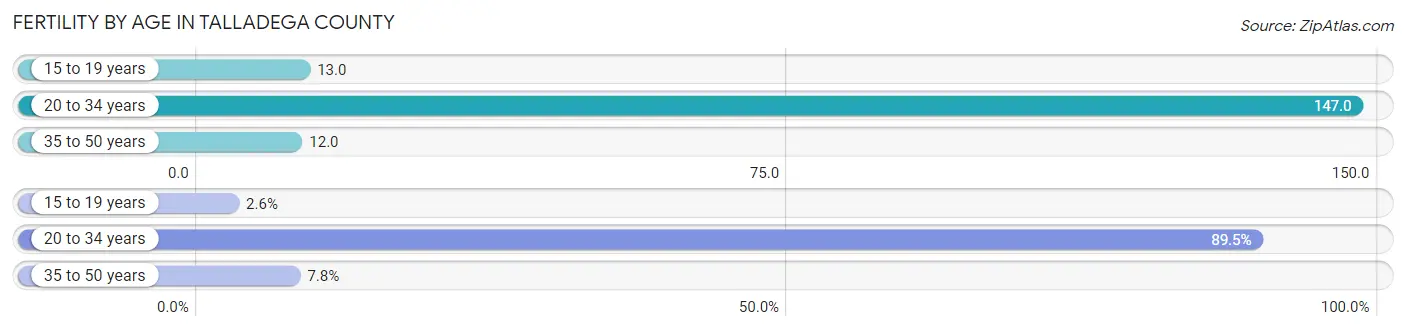
| Age Bracket | Women with Births | Births / 1,000 Women |
| 15 to 19 years | 33 (2.6%) | 13.0 |
| 20 to 34 years | 1,119 (89.5%) | 147.0 |
| 35 to 50 years | 98 (7.8%) | 12.0 |
| Total | 1,250 (100.0%) | 69.0 |
Fertility by Age by Marriage Status in Talladega County
48.5% of women with births (1,250) in Talladega County are married. The highest percentage of unmarried women with births falls into 15 to 19 years age bracket with 100.0% of them unmarried at the time of birth, while the lowest percentage of unmarried women with births belong to 20 to 34 years age bracket with 49.8% of them unmarried.
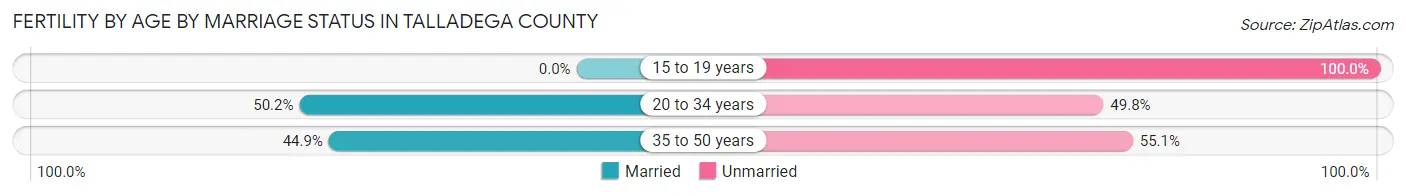
| Age Bracket | Married | Unmarried |
| 15 to 19 years | 0 (0.0%) | 33 (100.0%) |
| 20 to 34 years | 562 (50.2%) | 557 (49.8%) |
| 35 to 50 years | 44 (44.9%) | 54 (55.1%) |
| Total | 606 (48.5%) | 644 (51.5%) |
Fertility by Education in Talladega County
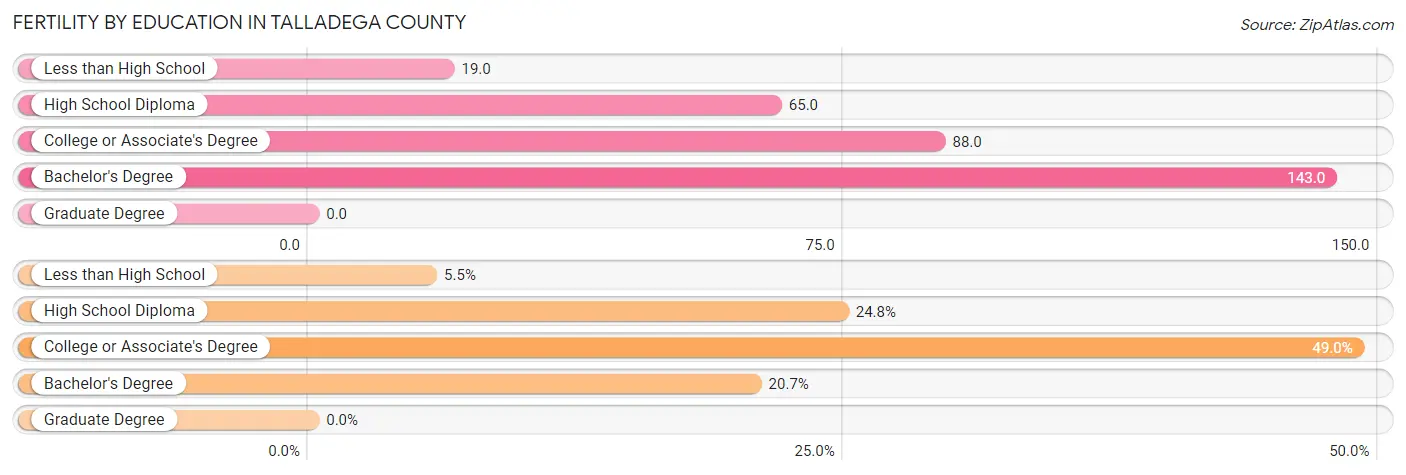
| Educational Attainment | Women with Births | Births / 1,000 Women |
| Less than High School | 69 (5.5%) | 19.0 |
| High School Diploma | 310 (24.8%) | 65.0 |
| College or Associate's Degree | 612 (49.0%) | 88.0 |
| Bachelor's Degree | 259 (20.7%) | 143.0 |
| Graduate Degree | 0 (0.0%) | 0.0 |
| Total | 1,250 (100.0%) | 69.0 |
Fertility by Education by Marriage Status in Talladega County
51.5% of women with births in Talladega County are unmarried. Women with the educational attainment of bachelor's degree are most likely to be married with 78.8% of them married at childbirth, while women with the educational attainment of less than high school are least likely to be married with 94.2% of them unmarried at childbirth.
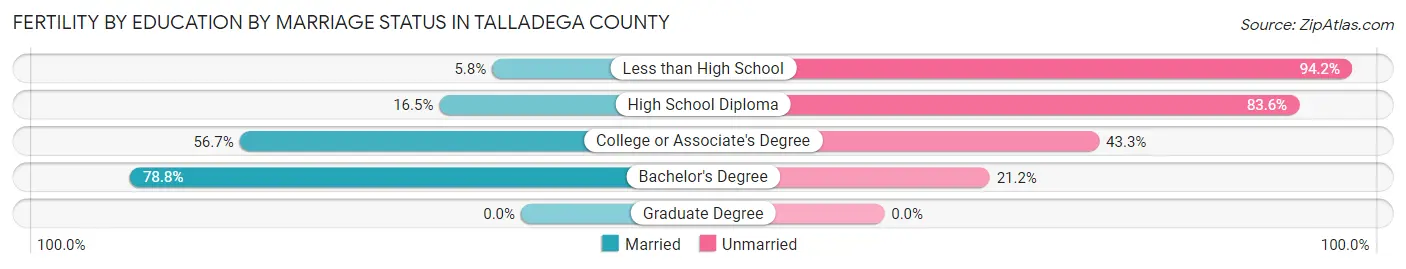
| Educational Attainment | Married | Unmarried |
| Less than High School | 4 (5.8%) | 65 (94.2%) |
| High School Diploma | 51 (16.5%) | 259 (83.6%) |
| College or Associate's Degree | 347 (56.7%) | 265 (43.3%) |
| Bachelor's Degree | 204 (78.8%) | 55 (21.2%) |
| Graduate Degree | 0 (0.0%) | 0 (0.0%) |
| Total | 606 (48.5%) | 644 (51.5%) |
Employment Characteristics in Talladega County
Employment by Class of Employer in Talladega County
Among the 31,194 employed individuals in Talladega County, private company employees (21,553 | 69.1%), not-for-profit organizations (2,189 | 7.0%), and state government employees (2,039 | 6.5%) make up the most common classes of employment.
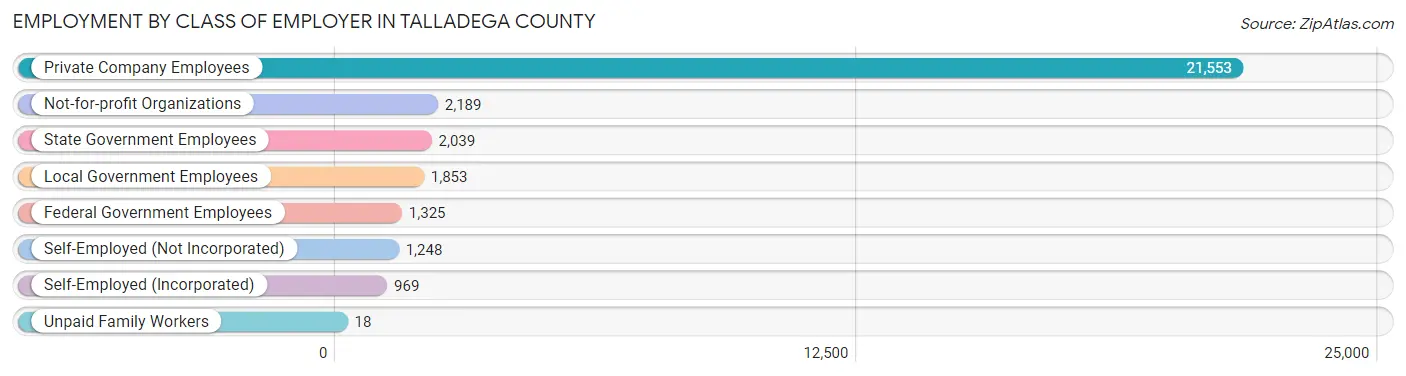
| Employer Class | # Employees | % Employees |
| Private Company Employees | 21,553 | 69.1% |
| Self-Employed (Incorporated) | 969 | 3.1% |
| Self-Employed (Not Incorporated) | 1,248 | 4.0% |
| Not-for-profit Organizations | 2,189 | 7.0% |
| Local Government Employees | 1,853 | 5.9% |
| State Government Employees | 2,039 | 6.5% |
| Federal Government Employees | 1,325 | 4.3% |
| Unpaid Family Workers | 18 | 0.1% |
| Total | 31,194 | 100.0% |
Employment Status by Age in Talladega County
According to the labor force statistics for Talladega County, out of the total population over 16 years of age (66,263), 53.1% or 35,186 individuals are in the labor force, with 8.4% or 2,956 of them unemployed. The age group with the highest labor force participation rate is 25 to 29 years, with 84.6% or 4,414 individuals in the labor force. Within the labor force, the 16 to 19 years age range has the highest percentage of unemployed individuals, with 30.3% or 510 of them being unemployed.
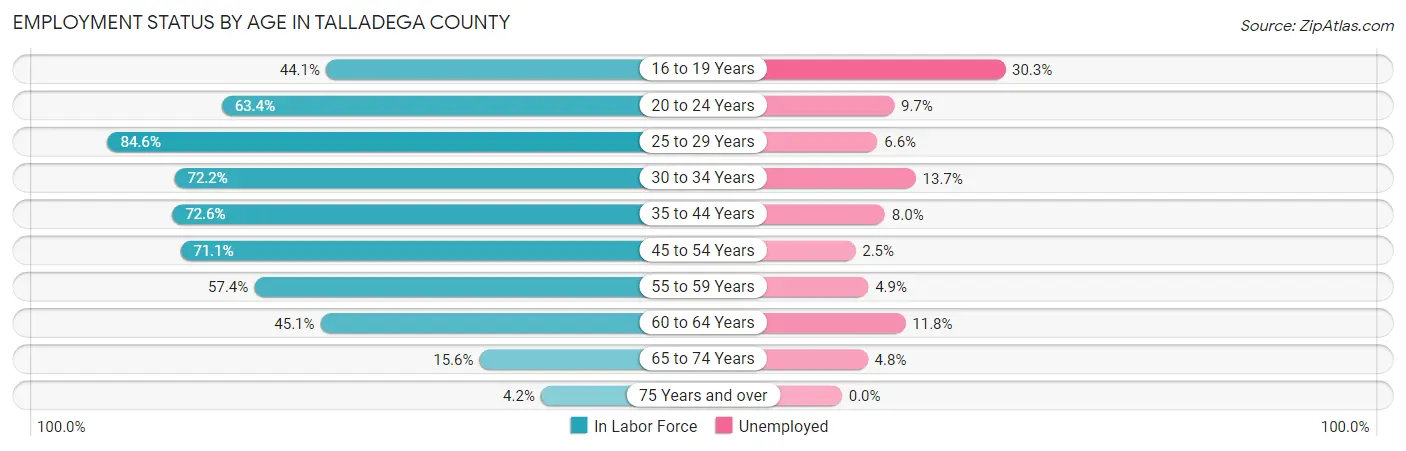
| Age Bracket | In Labor Force | Unemployed |
| 16 to 19 Years | 1,682 (44.1%) | 510 (30.3%) |
| 20 to 24 Years | 3,197 (63.4%) | 310 (9.7%) |
| 25 to 29 Years | 4,414 (84.6%) | 291 (6.6%) |
| 30 to 34 Years | 3,720 (72.2%) | 510 (13.7%) |
| 35 to 44 Years | 7,076 (72.6%) | 566 (8.0%) |
| 45 to 54 Years | 7,578 (71.1%) | 189 (2.5%) |
| 55 to 59 Years | 2,764 (57.4%) | 135 (4.9%) |
| 60 to 64 Years | 3,044 (45.1%) | 359 (11.8%) |
| 65 to 74 Years | 1,432 (15.6%) | 69 (4.8%) |
| 75 Years and over | 247 (4.2%) | 0 (0.0%) |
| Total | 35,186 (53.1%) | 2,956 (8.4%) |
Employment Status by Educational Attainment in Talladega County
According to labor force statistics for Talladega County, 67.6% of individuals (28,622) out of the total population between 25 and 64 years of age (42,340) are in the labor force, with 7.2% or 2,061 of them being unemployed. The group with the highest labor force participation rate are those with the educational attainment of bachelor's degree or higher, with 86.0% or 5,813 individuals in the labor force. Within the labor force, individuals with less than high school education have the highest percentage of unemployment, with 11.9% or 306 of them being unemployed.
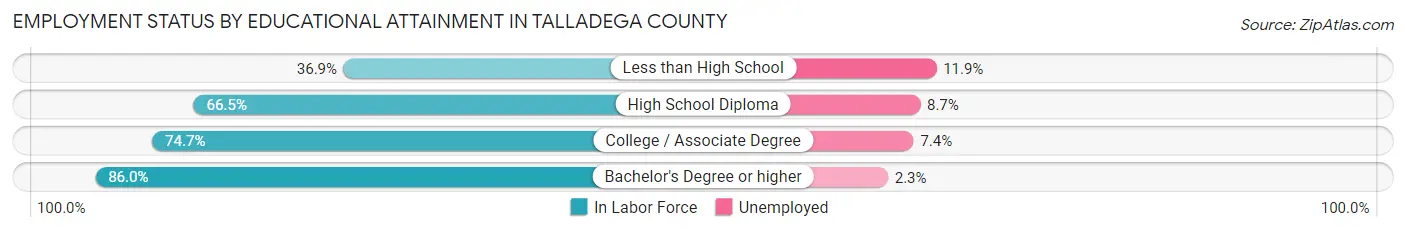
| Educational Attainment | In Labor Force | Unemployed |
| Less than High School | 2,569 (36.9%) | 828 (11.9%) |
| High School Diploma | 9,321 (66.5%) | 1,219 (8.7%) |
| College / Associate Degree | 10,909 (74.7%) | 1,081 (7.4%) |
| Bachelor's Degree or higher | 5,813 (86.0%) | 155 (2.3%) |
| Total | 28,622 (67.6%) | 3,048 (7.2%) |
Employment Occupations by Sex in Talladega County
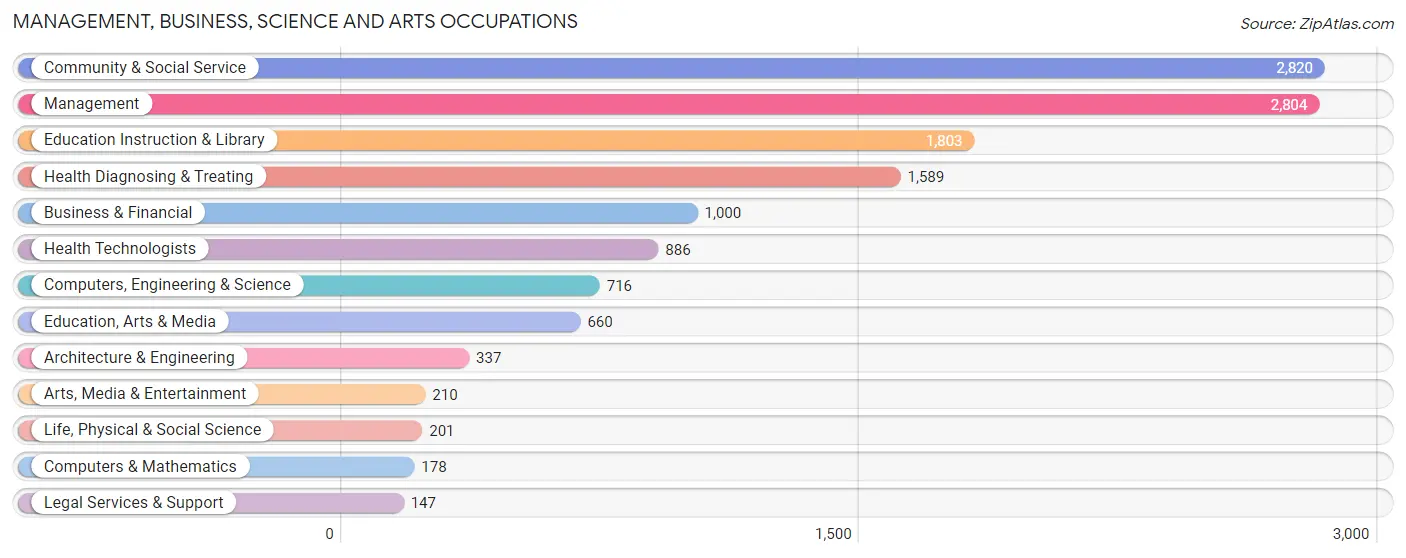
Management, Business, Science and Arts Occupations
The most common Management, Business, Science and Arts occupations in Talladega County are Community & Social Service (2,820 | 8.8%), Management (2,804 | 8.7%), Education Instruction & Library (1,803 | 5.6%), Health Diagnosing & Treating (1,589 | 5.0%), and Business & Financial (1,000 | 3.1%).
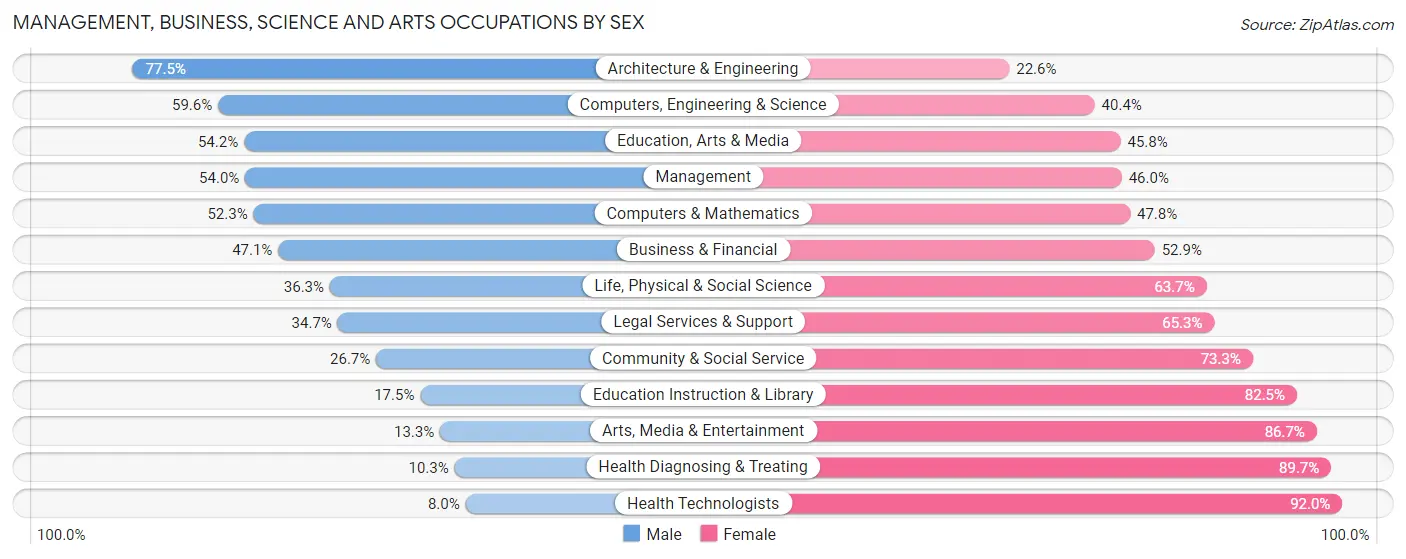
Management, Business, Science and Arts Occupations by Sex
Within the Management, Business, Science and Arts occupations in Talladega County, the most male-oriented occupations are Architecture & Engineering (77.4%), Computers, Engineering & Science (59.6%), and Education, Arts & Media (54.2%), while the most female-oriented occupations are Health Technologists (92.0%), Health Diagnosing & Treating (89.7%), and Arts, Media & Entertainment (86.7%).
| Occupation | Male | Female |
| Management | 1,514 (54.0%) | 1,290 (46.0%) |
| Business & Financial | 471 (47.1%) | 529 (52.9%) |
| Computers, Engineering & Science | 427 (59.6%) | 289 (40.4%) |
| Computers & Mathematics | 93 (52.2%) | 85 (47.7%) |
| Architecture & Engineering | 261 (77.4%) | 76 (22.6%) |
| Life, Physical & Social Science | 73 (36.3%) | 128 (63.7%) |
| Community & Social Service | 752 (26.7%) | 2,068 (73.3%) |
| Education, Arts & Media | 358 (54.2%) | 302 (45.8%) |
| Legal Services & Support | 51 (34.7%) | 96 (65.3%) |
| Education Instruction & Library | 315 (17.5%) | 1,488 (82.5%) |
| Arts, Media & Entertainment | 28 (13.3%) | 182 (86.7%) |
| Health Diagnosing & Treating | 164 (10.3%) | 1,425 (89.7%) |
| Health Technologists | 71 (8.0%) | 815 (92.0%) |
| Total (Category) | 3,328 (37.3%) | 5,601 (62.7%) |
| Total (Overall) | 15,968 (49.8%) | 16,125 (50.2%) |
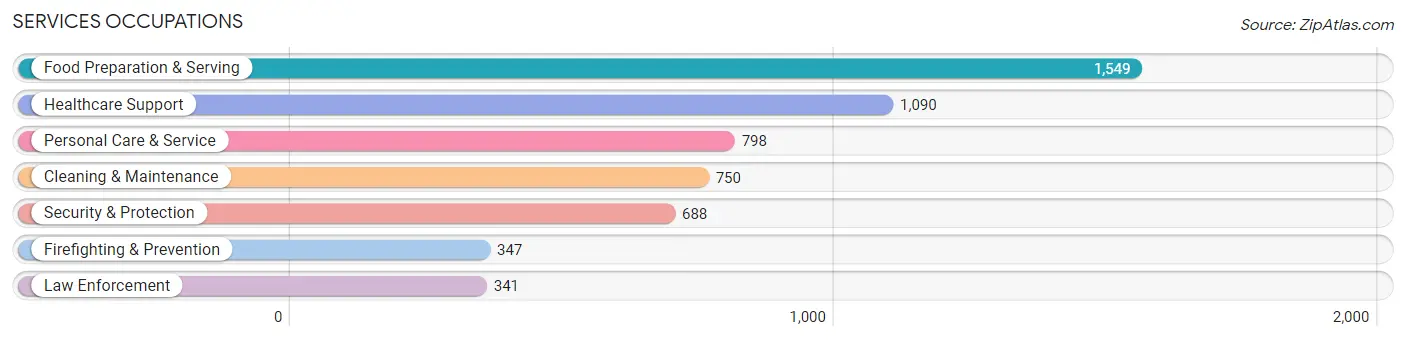
Services Occupations
The most common Services occupations in Talladega County are Food Preparation & Serving (1,549 | 4.8%), Healthcare Support (1,090 | 3.4%), Personal Care & Service (798 | 2.5%), Cleaning & Maintenance (750 | 2.3%), and Security & Protection (688 | 2.1%).
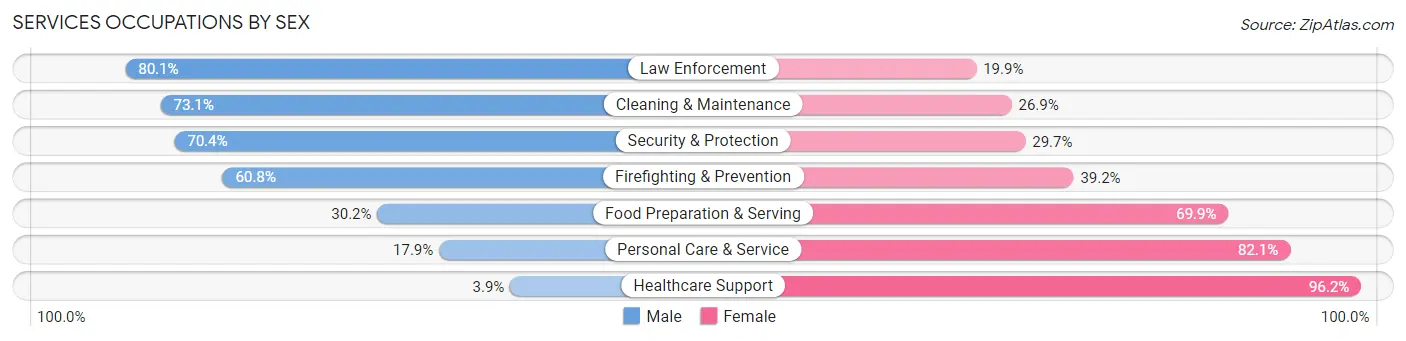
Services Occupations by Sex
Within the Services occupations in Talladega County, the most male-oriented occupations are Law Enforcement (80.1%), Cleaning & Maintenance (73.1%), and Security & Protection (70.4%), while the most female-oriented occupations are Healthcare Support (96.2%), Personal Care & Service (82.1%), and Food Preparation & Serving (69.9%).
| Occupation | Male | Female |
| Healthcare Support | 42 (3.8%) | 1,048 (96.2%) |
| Security & Protection | 484 (70.4%) | 204 (29.6%) |
| Firefighting & Prevention | 211 (60.8%) | 136 (39.2%) |
| Law Enforcement | 273 (80.1%) | 68 (19.9%) |
| Food Preparation & Serving | 467 (30.1%) | 1,082 (69.9%) |
| Cleaning & Maintenance | 548 (73.1%) | 202 (26.9%) |
| Personal Care & Service | 143 (17.9%) | 655 (82.1%) |
| Total (Category) | 1,684 (34.5%) | 3,191 (65.5%) |
| Total (Overall) | 15,968 (49.8%) | 16,125 (50.2%) |
Sales and Office Occupations
The most common Sales and Office occupations in Talladega County are Office & Administration (3,564 | 11.1%), and Sales & Related (2,995 | 9.3%).

Sales and Office Occupations by Sex

| Occupation | Male | Female |
| Sales & Related | 1,246 (41.6%) | 1,749 (58.4%) |
| Office & Administration | 720 (20.2%) | 2,844 (79.8%) |
| Total (Category) | 1,966 (30.0%) | 4,593 (70.0%) |
| Total (Overall) | 15,968 (49.8%) | 16,125 (50.2%) |
Natural Resources, Construction and Maintenance Occupations
The most common Natural Resources, Construction and Maintenance occupations in Talladega County are Installation, Maintenance & Repair (1,846 | 5.8%), Construction & Extraction (1,595 | 5.0%), and Farming, Fishing & Forestry (233 | 0.7%).
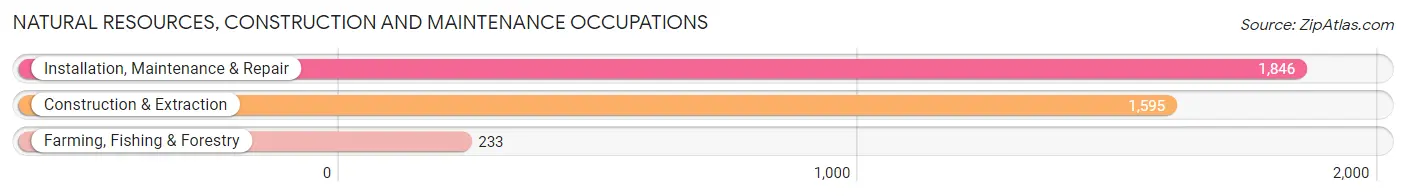
Natural Resources, Construction and Maintenance Occupations by Sex

| Occupation | Male | Female |
| Farming, Fishing & Forestry | 190 (81.6%) | 43 (18.4%) |
| Construction & Extraction | 1,571 (98.5%) | 24 (1.5%) |
| Installation, Maintenance & Repair | 1,653 (89.5%) | 193 (10.5%) |
| Total (Category) | 3,414 (92.9%) | 260 (7.1%) |
| Total (Overall) | 15,968 (49.8%) | 16,125 (50.2%) |
Production, Transportation and Moving Occupations
The most common Production, Transportation and Moving occupations in Talladega County are Production (4,909 | 15.3%), Material Moving (1,674 | 5.2%), and Transportation (1,473 | 4.6%).
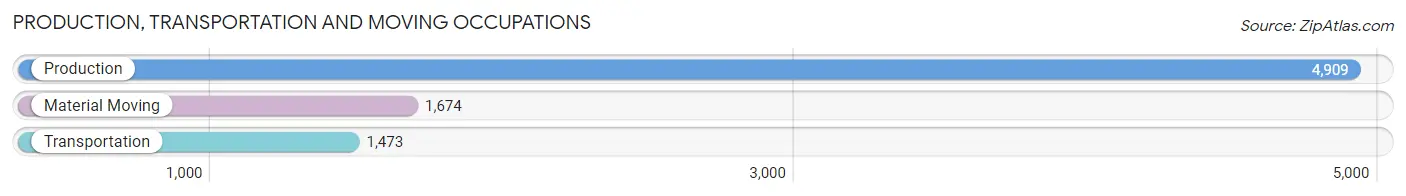
Production, Transportation and Moving Occupations by Sex

| Occupation | Male | Female |
| Production | 3,327 (67.8%) | 1,582 (32.2%) |
| Transportation | 1,236 (83.9%) | 237 (16.1%) |
| Material Moving | 1,013 (60.5%) | 661 (39.5%) |
| Total (Category) | 5,576 (69.2%) | 2,480 (30.8%) |
| Total (Overall) | 15,968 (49.8%) | 16,125 (50.2%) |
Employment Industries by Sex in Talladega County
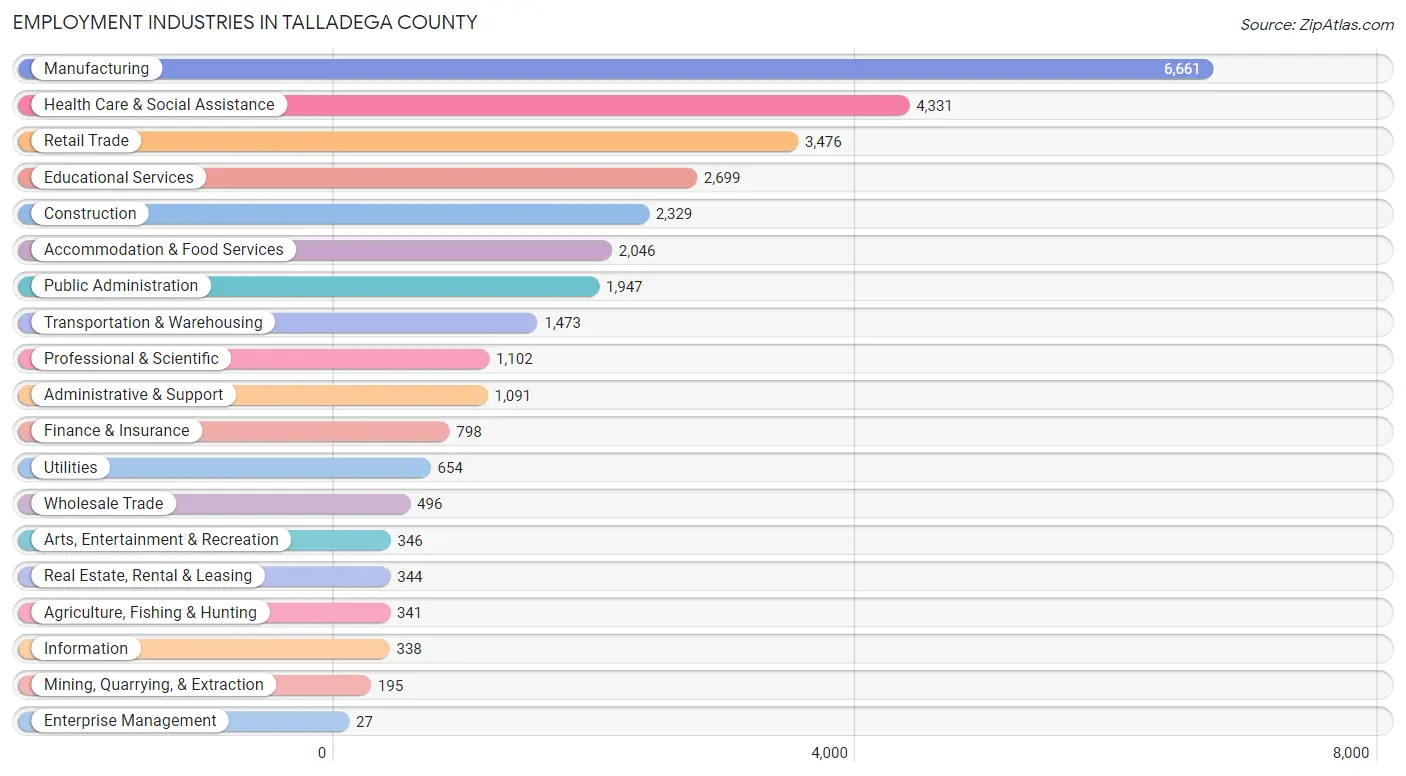
Employment Industries in Talladega County
The major employment industries in Talladega County include Manufacturing (6,661 | 20.8%), Health Care & Social Assistance (4,331 | 13.5%), Retail Trade (3,476 | 10.8%), Educational Services (2,699 | 8.4%), and Construction (2,329 | 7.3%).
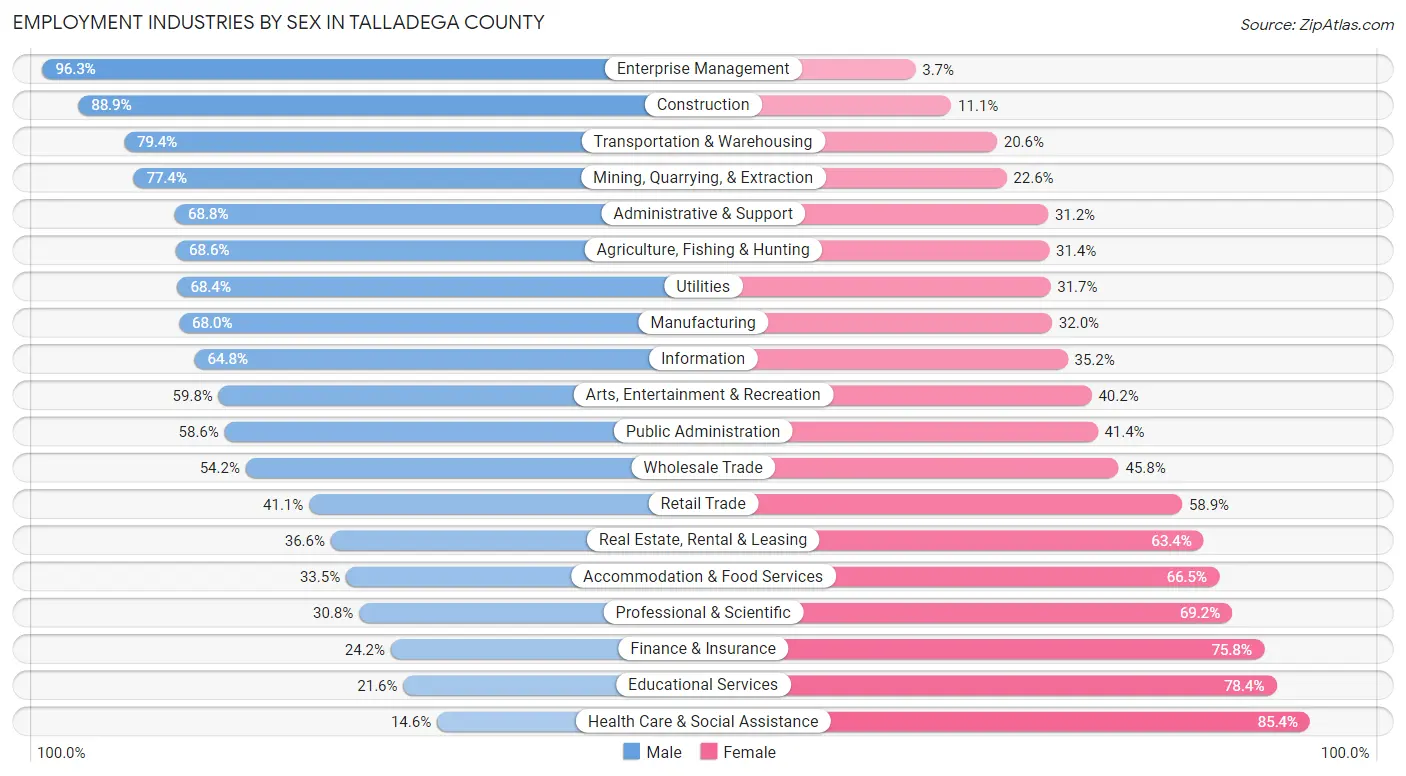
Employment Industries by Sex in Talladega County
The Talladega County industries that see more men than women are Enterprise Management (96.3%), Construction (88.9%), and Transportation & Warehousing (79.4%), whereas the industries that tend to have a higher number of women are Health Care & Social Assistance (85.4%), Educational Services (78.4%), and Finance & Insurance (75.8%).
| Industry | Male | Female |
| Agriculture, Fishing & Hunting | 234 (68.6%) | 107 (31.4%) |
| Mining, Quarrying, & Extraction | 151 (77.4%) | 44 (22.6%) |
| Construction | 2,070 (88.9%) | 259 (11.1%) |
| Manufacturing | 4,531 (68.0%) | 2,130 (32.0%) |
| Wholesale Trade | 269 (54.2%) | 227 (45.8%) |
| Retail Trade | 1,429 (41.1%) | 2,047 (58.9%) |
| Transportation & Warehousing | 1,170 (79.4%) | 303 (20.6%) |
| Utilities | 447 (68.3%) | 207 (31.7%) |
| Information | 219 (64.8%) | 119 (35.2%) |
| Finance & Insurance | 193 (24.2%) | 605 (75.8%) |
| Real Estate, Rental & Leasing | 126 (36.6%) | 218 (63.4%) |
| Professional & Scientific | 339 (30.8%) | 763 (69.2%) |
| Enterprise Management | 26 (96.3%) | 1 (3.7%) |
| Administrative & Support | 751 (68.8%) | 340 (31.2%) |
| Educational Services | 583 (21.6%) | 2,116 (78.4%) |
| Health Care & Social Assistance | 634 (14.6%) | 3,697 (85.4%) |
| Arts, Entertainment & Recreation | 207 (59.8%) | 139 (40.2%) |
| Accommodation & Food Services | 685 (33.5%) | 1,361 (66.5%) |
| Public Administration | 1,141 (58.6%) | 806 (41.4%) |
| Total | 15,968 (49.8%) | 16,125 (50.2%) |
Education in Talladega County
School Enrollment in Talladega County
The most common levels of schooling among the 17,494 students in Talladega County are high school (4,049 | 23.2%), elementary school (3,919 | 22.4%), and college / undergraduate (3,600 | 20.6%).
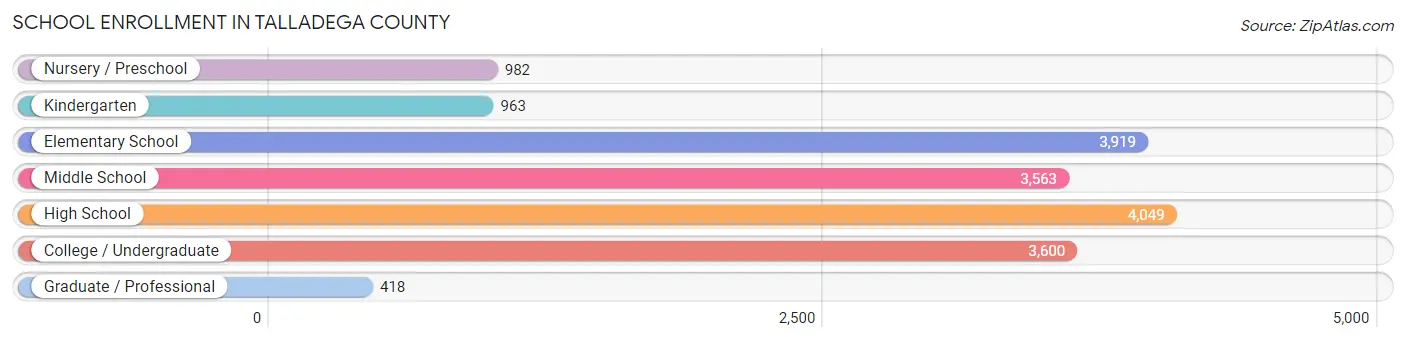
| School Level | # Students | % Students |
| Nursery / Preschool | 982 | 5.6% |
| Kindergarten | 963 | 5.5% |
| Elementary School | 3,919 | 22.4% |
| Middle School | 3,563 | 20.4% |
| High School | 4,049 | 23.2% |
| College / Undergraduate | 3,600 | 20.6% |
| Graduate / Professional | 418 | 2.4% |
| Total | 17,494 | 100.0% |
School Enrollment by Age by Funding Source in Talladega County
Out of a total of 17,494 students who are enrolled in schools in Talladega County, 1,889 (10.8%) attend a private institution, while the remaining 15,605 (89.2%) are enrolled in public schools. The age group of 20 to 24 year olds has the highest likelihood of being enrolled in private schools, with 881 (54.3% in the age bracket) enrolled. Conversely, the age group of 25 to 34 year olds has the lowest likelihood of being enrolled in a private school, with 1,239 (100.0% in the age bracket) attending a public institution.
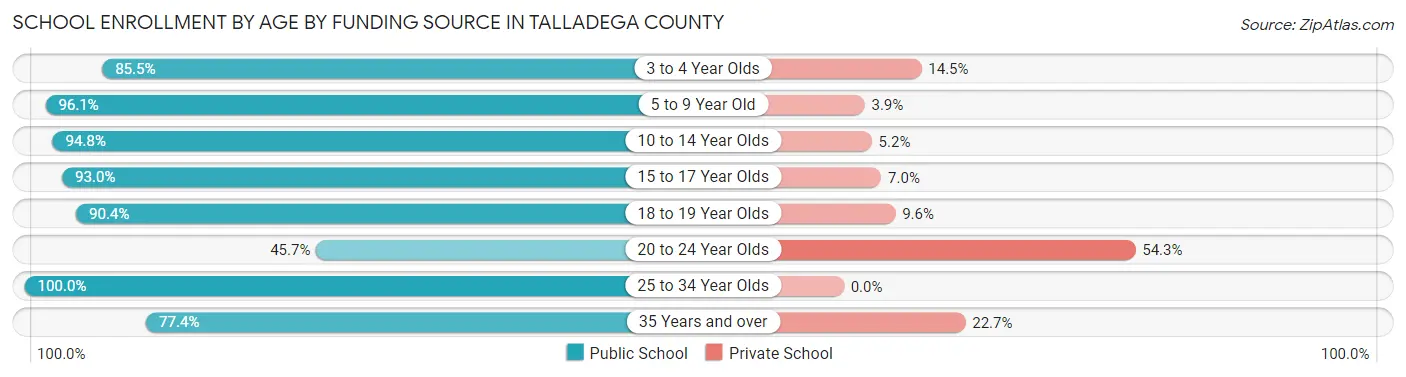
| Age Bracket | Public School | Private School |
| 3 to 4 Year Olds | 473 (85.5%) | 80 (14.5%) |
| 5 to 9 Year Old | 4,619 (96.1%) | 187 (3.9%) |
| 10 to 14 Year Olds | 4,131 (94.8%) | 227 (5.2%) |
| 15 to 17 Year Olds | 2,745 (93.0%) | 206 (7.0%) |
| 18 to 19 Year Olds | 970 (90.4%) | 103 (9.6%) |
| 20 to 24 Year Olds | 741 (45.7%) | 881 (54.3%) |
| 25 to 34 Year Olds | 1,239 (100.0%) | 0 (0.0%) |
| 35 Years and over | 690 (77.3%) | 202 (22.7%) |
| Total | 15,605 (89.2%) | 1,889 (10.8%) |
Educational Attainment by Field of Study in Talladega County
Education (2,368 | 23.4%), business (2,028 | 20.0%), arts & humanities (1,257 | 12.4%), science & technology (960 | 9.5%), and liberal arts & history (594 | 5.9%) are the most common fields of study among 10,129 individuals in Talladega County who have obtained a bachelor's degree or higher.
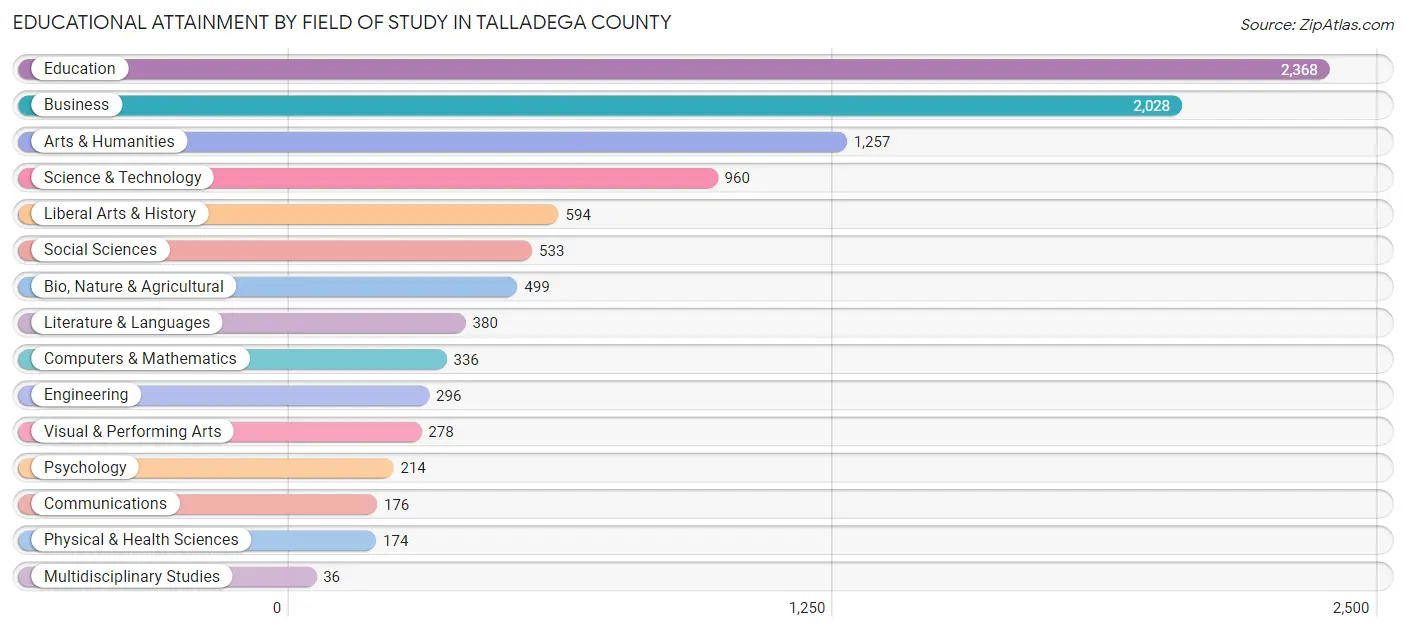
| Field of Study | # Graduates | % Graduates |
| Computers & Mathematics | 336 | 3.3% |
| Bio, Nature & Agricultural | 499 | 4.9% |
| Physical & Health Sciences | 174 | 1.7% |
| Psychology | 214 | 2.1% |
| Social Sciences | 533 | 5.3% |
| Engineering | 296 | 2.9% |
| Multidisciplinary Studies | 36 | 0.4% |
| Science & Technology | 960 | 9.5% |
| Business | 2,028 | 20.0% |
| Education | 2,368 | 23.4% |
| Literature & Languages | 380 | 3.7% |
| Liberal Arts & History | 594 | 5.9% |
| Visual & Performing Arts | 278 | 2.7% |
| Communications | 176 | 1.7% |
| Arts & Humanities | 1,257 | 12.4% |
| Total | 10,129 | 100.0% |
Transportation & Commute in Talladega County
Vehicle Availability by Sex in Talladega County
The most prevalent vehicle ownership categories in Talladega County are males with 2 vehicles (5,619, accounting for 35.7%) and females with 2 vehicles (5,062, making up 36.4%).
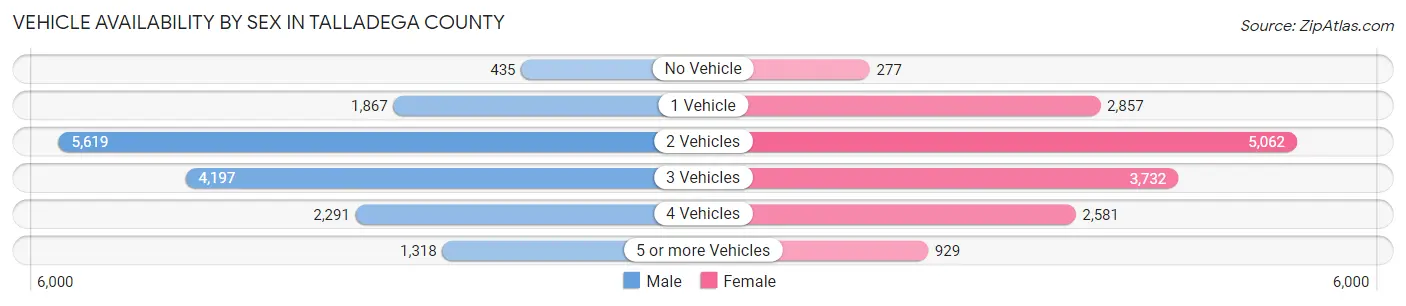
| Vehicles Available | Male | Female |
| No Vehicle | 435 (2.8%) | 277 (1.8%) |
| 1 Vehicle | 1,867 (11.9%) | 2,857 (18.5%) |
| 2 Vehicles | 5,619 (35.7%) | 5,062 (32.8%) |
| 3 Vehicles | 4,197 (26.7%) | 3,732 (24.2%) |
| 4 Vehicles | 2,291 (14.6%) | 2,581 (16.7%) |
| 5 or more Vehicles | 1,318 (8.4%) | 929 (6.0%) |
| Total | 15,727 (100.0%) | 15,438 (100.0%) |
Commute Time in Talladega County
The most frequently occuring commute durations in Talladega County are 15 to 19 minutes (5,076 commuters, 16.8%), 5 to 9 minutes (4,195 commuters, 13.8%), and 10 to 14 minutes (4,174 commuters, 13.8%).
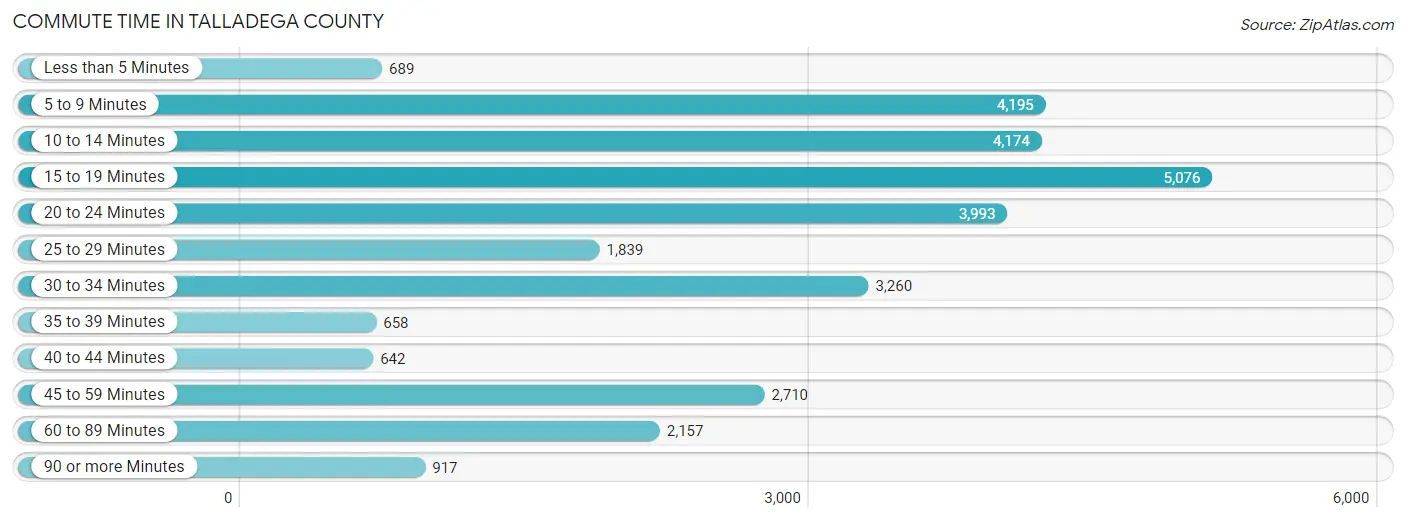
| Commute Time | # Commuters | % Commuters |
| Less than 5 Minutes | 689 | 2.3% |
| 5 to 9 Minutes | 4,195 | 13.8% |
| 10 to 14 Minutes | 4,174 | 13.8% |
| 15 to 19 Minutes | 5,076 | 16.8% |
| 20 to 24 Minutes | 3,993 | 13.2% |
| 25 to 29 Minutes | 1,839 | 6.1% |
| 30 to 34 Minutes | 3,260 | 10.8% |
| 35 to 39 Minutes | 658 | 2.2% |
| 40 to 44 Minutes | 642 | 2.1% |
| 45 to 59 Minutes | 2,710 | 8.9% |
| 60 to 89 Minutes | 2,157 | 7.1% |
| 90 or more Minutes | 917 | 3.0% |
Commute Time by Sex in Talladega County
The most common commute times in Talladega County are 15 to 19 minutes (2,856 commuters, 18.5%) for males and 5 to 9 minutes (2,325 commuters, 15.6%) for females.
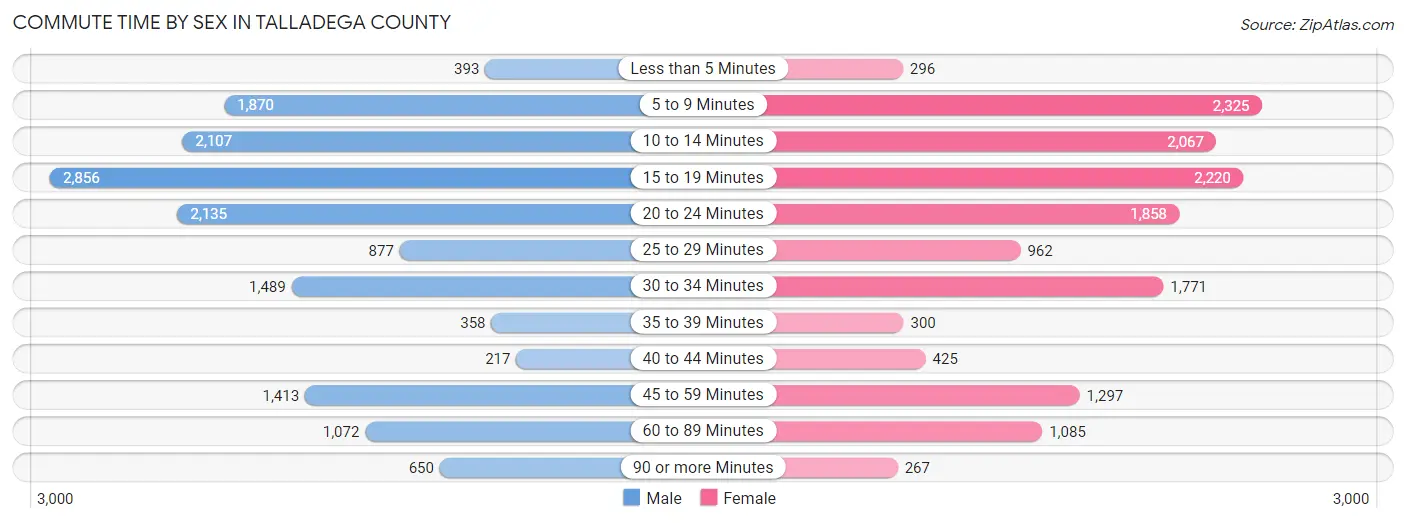
| Commute Time | Male | Female |
| Less than 5 Minutes | 393 (2.5%) | 296 (2.0%) |
| 5 to 9 Minutes | 1,870 (12.1%) | 2,325 (15.6%) |
| 10 to 14 Minutes | 2,107 (13.7%) | 2,067 (13.9%) |
| 15 to 19 Minutes | 2,856 (18.5%) | 2,220 (14.9%) |
| 20 to 24 Minutes | 2,135 (13.8%) | 1,858 (12.5%) |
| 25 to 29 Minutes | 877 (5.7%) | 962 (6.5%) |
| 30 to 34 Minutes | 1,489 (9.7%) | 1,771 (11.9%) |
| 35 to 39 Minutes | 358 (2.3%) | 300 (2.0%) |
| 40 to 44 Minutes | 217 (1.4%) | 425 (2.9%) |
| 45 to 59 Minutes | 1,413 (9.1%) | 1,297 (8.7%) |
| 60 to 89 Minutes | 1,072 (6.9%) | 1,085 (7.3%) |
| 90 or more Minutes | 650 (4.2%) | 267 (1.8%) |
Time of Departure to Work by Sex in Talladega County
The most frequent times of departure to work in Talladega County are 12:00 AM to 4:59 AM (2,184, 14.1%) for males and 7:00 AM to 7:29 AM (3,098, 20.8%) for females.
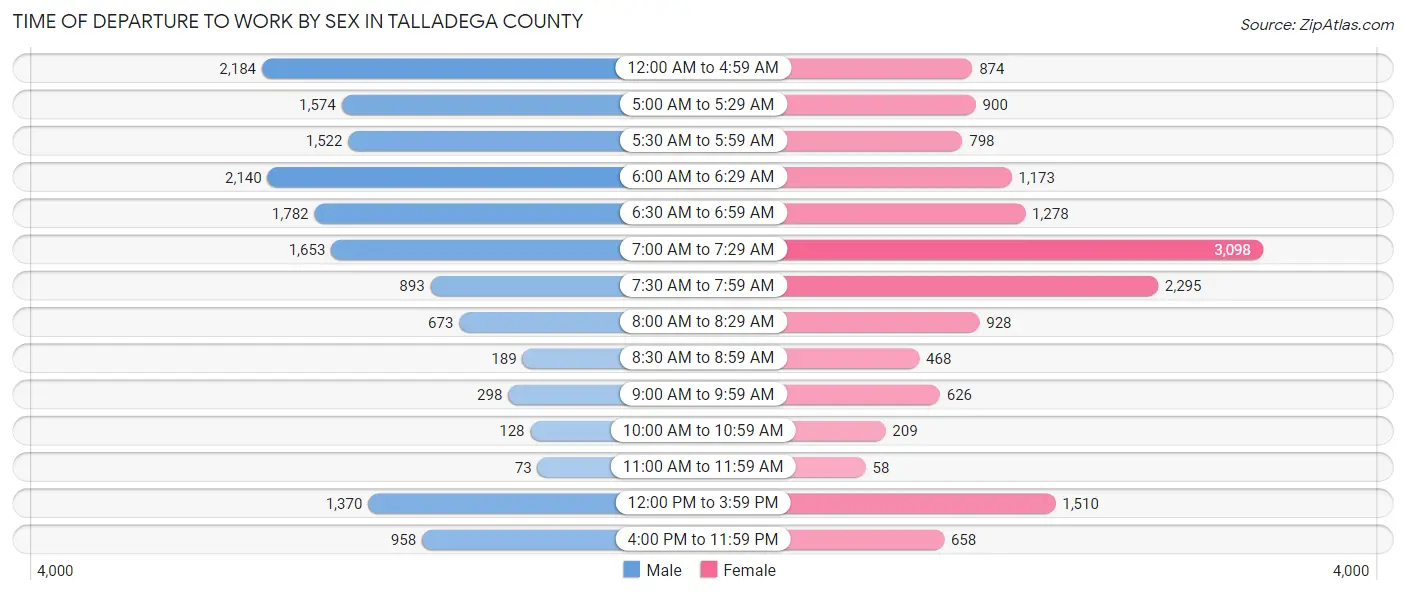
| Time of Departure | Male | Female |
| 12:00 AM to 4:59 AM | 2,184 (14.1%) | 874 (5.9%) |
| 5:00 AM to 5:29 AM | 1,574 (10.2%) | 900 (6.0%) |
| 5:30 AM to 5:59 AM | 1,522 (9.9%) | 798 (5.4%) |
| 6:00 AM to 6:29 AM | 2,140 (13.9%) | 1,173 (7.9%) |
| 6:30 AM to 6:59 AM | 1,782 (11.5%) | 1,278 (8.6%) |
| 7:00 AM to 7:29 AM | 1,653 (10.7%) | 3,098 (20.8%) |
| 7:30 AM to 7:59 AM | 893 (5.8%) | 2,295 (15.4%) |
| 8:00 AM to 8:29 AM | 673 (4.4%) | 928 (6.2%) |
| 8:30 AM to 8:59 AM | 189 (1.2%) | 468 (3.2%) |
| 9:00 AM to 9:59 AM | 298 (1.9%) | 626 (4.2%) |
| 10:00 AM to 10:59 AM | 128 (0.8%) | 209 (1.4%) |
| 11:00 AM to 11:59 AM | 73 (0.5%) | 58 (0.4%) |
| 12:00 PM to 3:59 PM | 1,370 (8.9%) | 1,510 (10.2%) |
| 4:00 PM to 11:59 PM | 958 (6.2%) | 658 (4.4%) |
| Total | 15,437 (100.0%) | 14,873 (100.0%) |
Housing Occupancy in Talladega County
Occupancy by Ownership in Talladega County
Of the total 32,359 dwellings in Talladega County, owner-occupied units account for 23,275 (71.9%), while renter-occupied units make up 9,084 (28.1%).
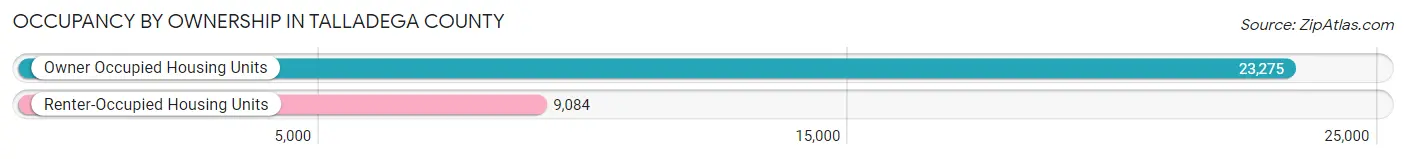
| Occupancy | # Housing Units | % Housing Units |
| Owner Occupied Housing Units | 23,275 | 71.9% |
| Renter-Occupied Housing Units | 9,084 | 28.1% |
| Total Occupied Housing Units | 32,359 | 100.0% |
Occupancy by Household Size in Talladega County
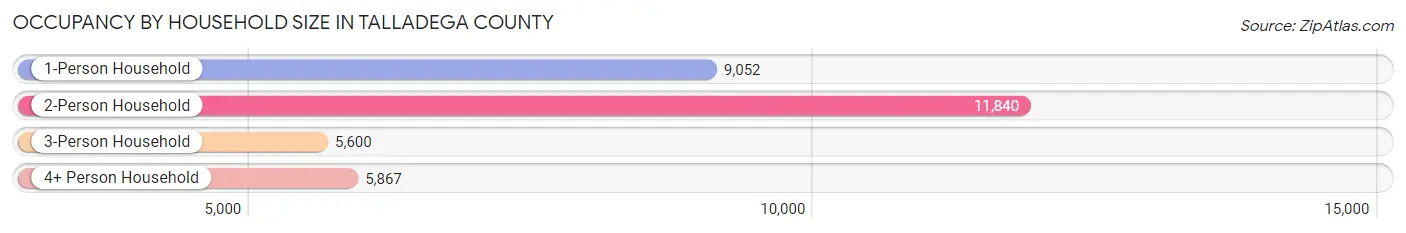
| Household Size | # Housing Units | % Housing Units |
| 1-Person Household | 9,052 | 28.0% |
| 2-Person Household | 11,840 | 36.6% |
| 3-Person Household | 5,600 | 17.3% |
| 4+ Person Household | 5,867 | 18.1% |
| Total Housing Units | 32,359 | 100.0% |
Occupancy by Ownership by Household Size in Talladega County
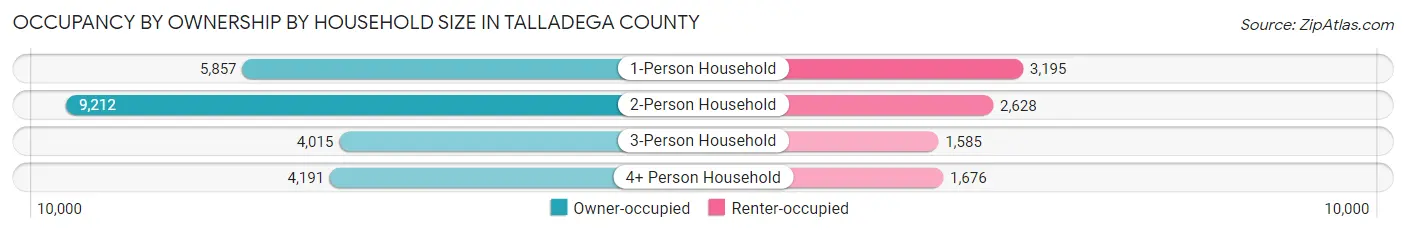
| Household Size | Owner-occupied | Renter-occupied |
| 1-Person Household | 5,857 (64.7%) | 3,195 (35.3%) |
| 2-Person Household | 9,212 (77.8%) | 2,628 (22.2%) |
| 3-Person Household | 4,015 (71.7%) | 1,585 (28.3%) |
| 4+ Person Household | 4,191 (71.4%) | 1,676 (28.6%) |
| Total Housing Units | 23,275 (71.9%) | 9,084 (28.1%) |
Occupancy by Educational Attainment in Talladega County
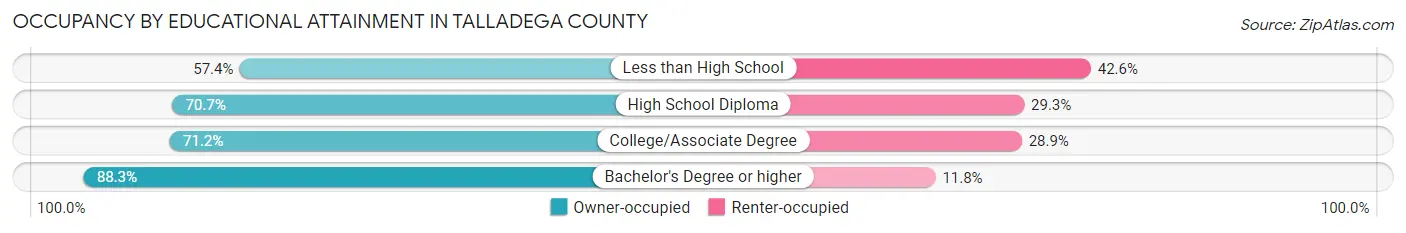
| Household Size | Owner-occupied | Renter-occupied |
| Less than High School | 2,941 (57.4%) | 2,179 (42.6%) |
| High School Diploma | 7,482 (70.7%) | 3,105 (29.3%) |
| College/Associate Degree | 7,669 (71.2%) | 3,110 (28.8%) |
| Bachelor's Degree or higher | 5,183 (88.2%) | 690 (11.7%) |
Occupancy by Age of Householder in Talladega County
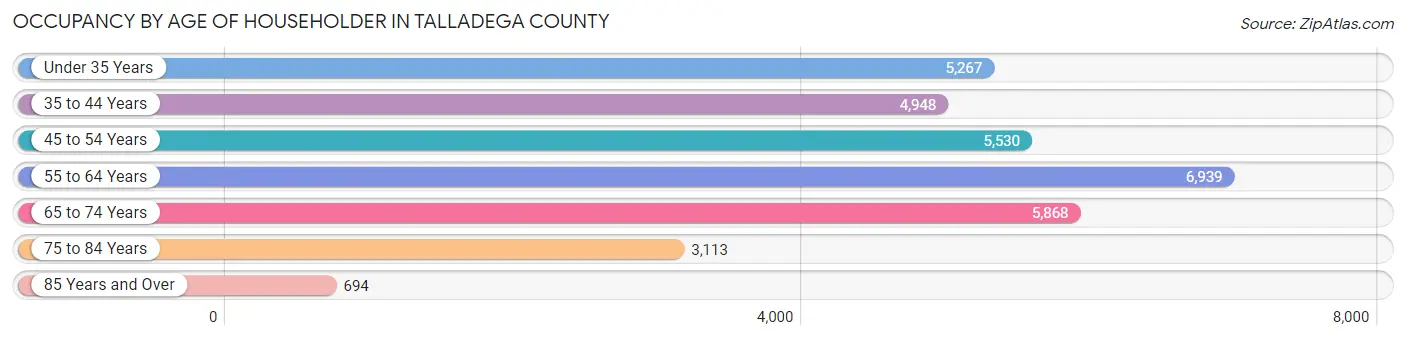
| Age Bracket | # Households | % Households |
| Under 35 Years | 5,267 | 16.3% |
| 35 to 44 Years | 4,948 | 15.3% |
| 45 to 54 Years | 5,530 | 17.1% |
| 55 to 64 Years | 6,939 | 21.4% |
| 65 to 74 Years | 5,868 | 18.1% |
| 75 to 84 Years | 3,113 | 9.6% |
| 85 Years and Over | 694 | 2.1% |
| Total | 32,359 | 100.0% |
Housing Finances in Talladega County
Median Income by Occupancy in Talladega County
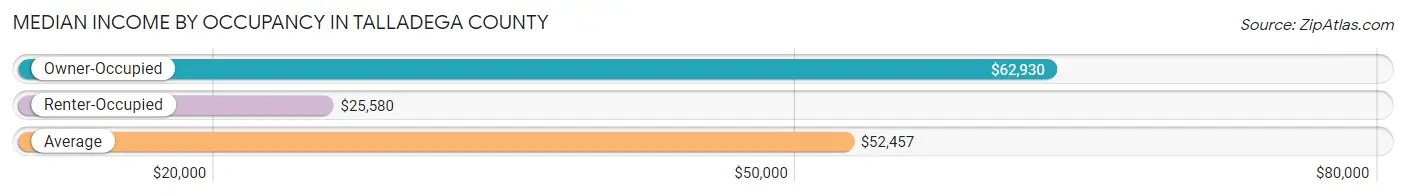
| Occupancy Type | # Households | Median Income |
| Owner-Occupied | 23,275 (71.9%) | $62,930 |
| Renter-Occupied | 9,084 (28.1%) | $25,580 |
| Average | 32,359 (100.0%) | $52,457 |
Occupancy by Householder Income Bracket in Talladega County
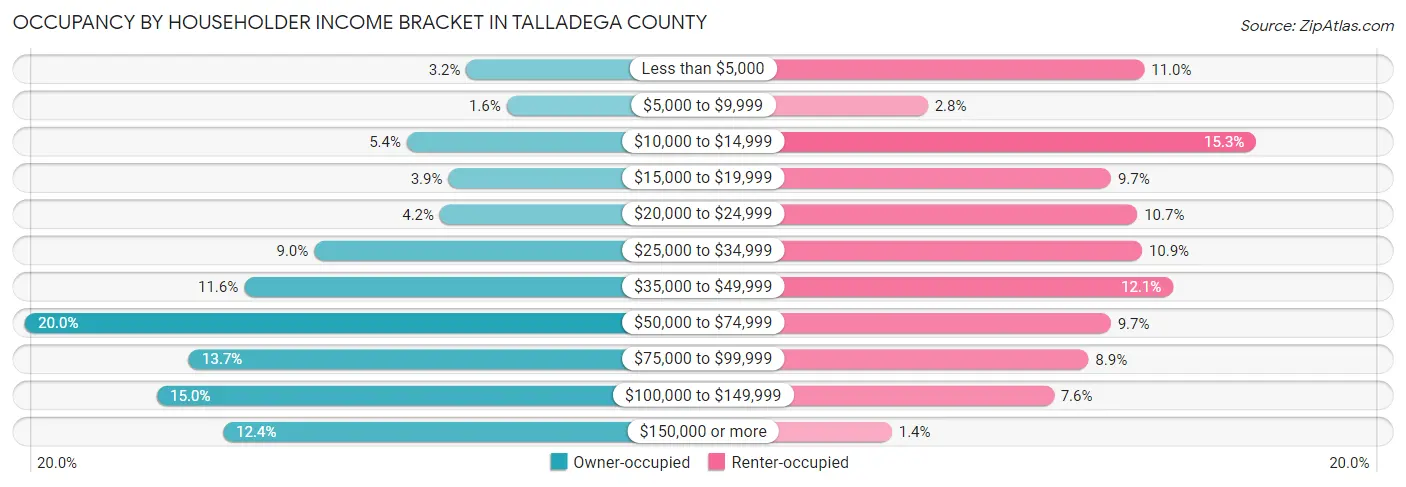
| Income Bracket | Owner-occupied | Renter-occupied |
| Less than $5,000 | 737 (3.2%) | 999 (11.0%) |
| $5,000 to $9,999 | 381 (1.6%) | 250 (2.8%) |
| $10,000 to $14,999 | 1,265 (5.4%) | 1,386 (15.3%) |
| $15,000 to $19,999 | 898 (3.9%) | 884 (9.7%) |
| $20,000 to $24,999 | 973 (4.2%) | 975 (10.7%) |
| $25,000 to $34,999 | 2,087 (9.0%) | 991 (10.9%) |
| $35,000 to $49,999 | 2,710 (11.6%) | 1,099 (12.1%) |
| $50,000 to $74,999 | 4,651 (20.0%) | 883 (9.7%) |
| $75,000 to $99,999 | 3,197 (13.7%) | 806 (8.9%) |
| $100,000 to $149,999 | 3,480 (14.9%) | 686 (7.5%) |
| $150,000 or more | 2,896 (12.4%) | 125 (1.4%) |
| Total | 23,275 (100.0%) | 9,084 (100.0%) |
Monthly Housing Cost Tiers in Talladega County
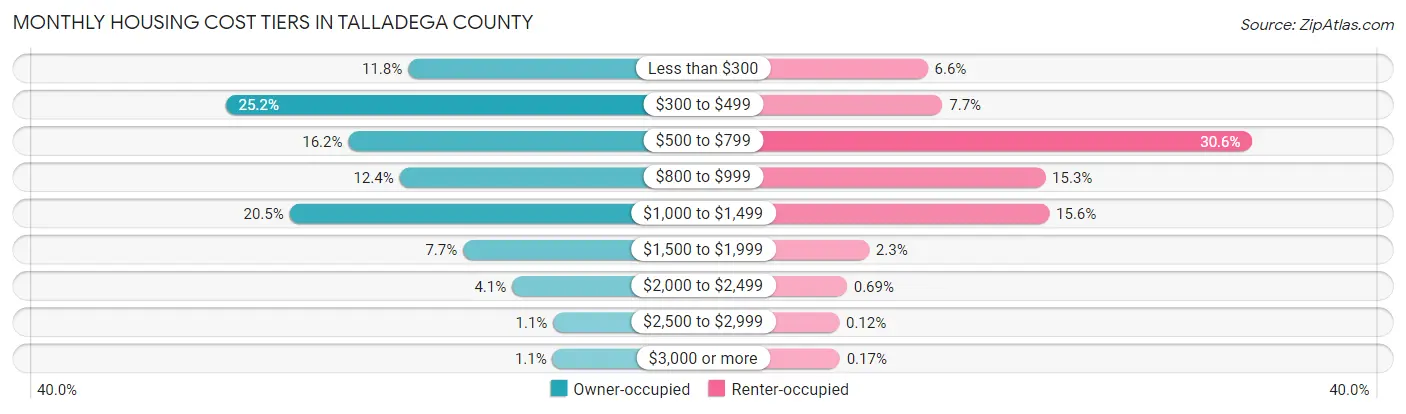
| Monthly Cost | Owner-occupied | Renter-occupied |
| Less than $300 | 2,736 (11.8%) | 603 (6.6%) |
| $300 to $499 | 5,865 (25.2%) | 702 (7.7%) |
| $500 to $799 | 3,762 (16.2%) | 2,775 (30.5%) |
| $800 to $999 | 2,883 (12.4%) | 1,390 (15.3%) |
| $1,000 to $1,499 | 4,770 (20.5%) | 1,416 (15.6%) |
| $1,500 to $1,999 | 1,794 (7.7%) | 211 (2.3%) |
| $2,000 to $2,499 | 955 (4.1%) | 63 (0.7%) |
| $2,500 to $2,999 | 249 (1.1%) | 11 (0.1%) |
| $3,000 or more | 261 (1.1%) | 15 (0.2%) |
| Total | 23,275 (100.0%) | 9,084 (100.0%) |
Physical Housing Characteristics in Talladega County
Housing Structures in Talladega County
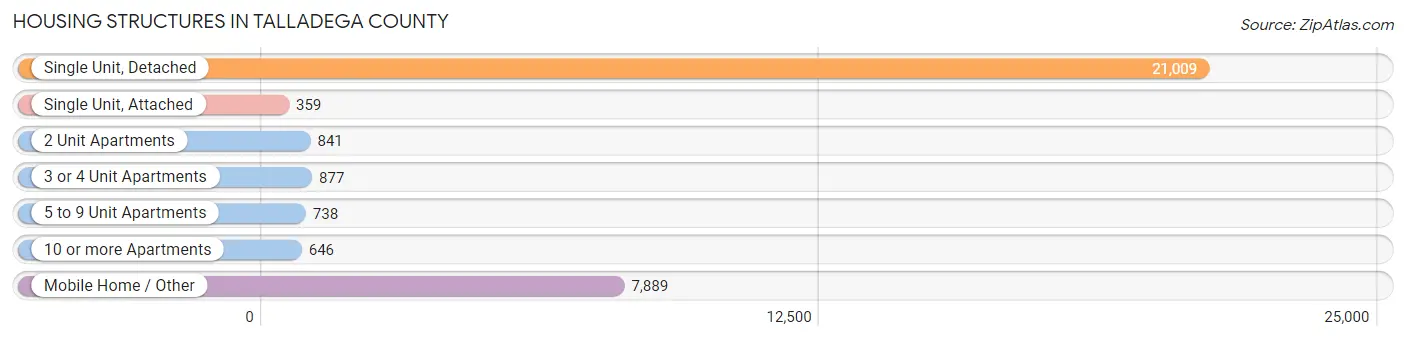
| Structure Type | # Housing Units | % Housing Units |
| Single Unit, Detached | 21,009 | 64.9% |
| Single Unit, Attached | 359 | 1.1% |
| 2 Unit Apartments | 841 | 2.6% |
| 3 or 4 Unit Apartments | 877 | 2.7% |
| 5 to 9 Unit Apartments | 738 | 2.3% |
| 10 or more Apartments | 646 | 2.0% |
| Mobile Home / Other | 7,889 | 24.4% |
| Total | 32,359 | 100.0% |
Housing Structures by Occupancy in Talladega County
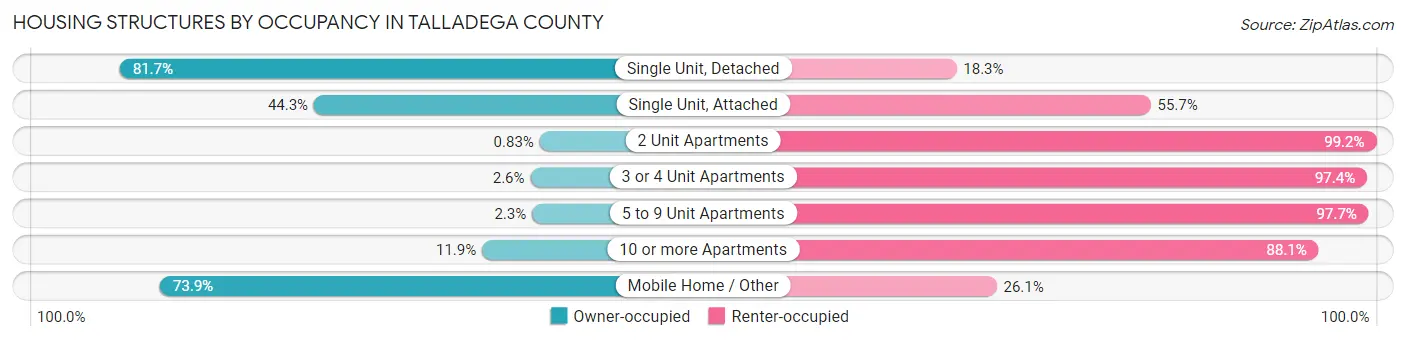
| Structure Type | Owner-occupied | Renter-occupied |
| Single Unit, Detached | 17,159 (81.7%) | 3,850 (18.3%) |
| Single Unit, Attached | 159 (44.3%) | 200 (55.7%) |
| 2 Unit Apartments | 7 (0.8%) | 834 (99.2%) |
| 3 or 4 Unit Apartments | 23 (2.6%) | 854 (97.4%) |
| 5 to 9 Unit Apartments | 17 (2.3%) | 721 (97.7%) |
| 10 or more Apartments | 77 (11.9%) | 569 (88.1%) |
| Mobile Home / Other | 5,833 (73.9%) | 2,056 (26.1%) |
| Total | 23,275 (71.9%) | 9,084 (28.1%) |
Housing Structures by Number of Rooms in Talladega County
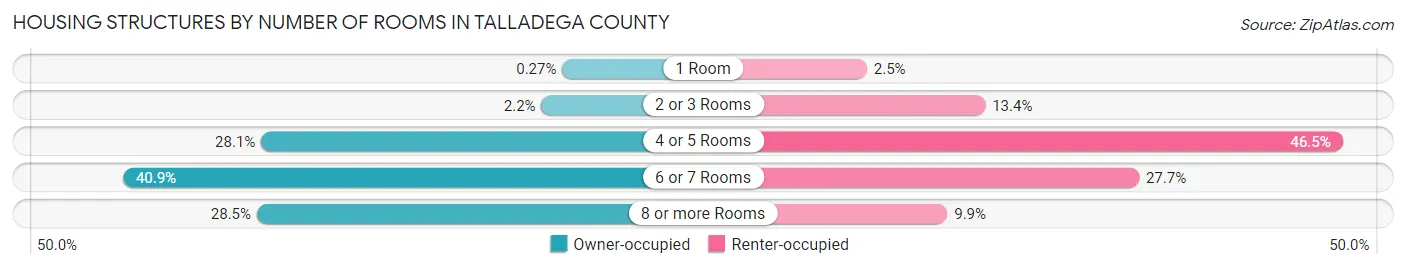
| Number of Rooms | Owner-occupied | Renter-occupied |
| 1 Room | 63 (0.3%) | 226 (2.5%) |
| 2 or 3 Rooms | 511 (2.2%) | 1,221 (13.4%) |
| 4 or 5 Rooms | 6,544 (28.1%) | 4,222 (46.5%) |
| 6 or 7 Rooms | 9,520 (40.9%) | 2,513 (27.7%) |
| 8 or more Rooms | 6,637 (28.5%) | 902 (9.9%) |
| Total | 23,275 (100.0%) | 9,084 (100.0%) |
Housing Structure by Heating Type in Talladega County
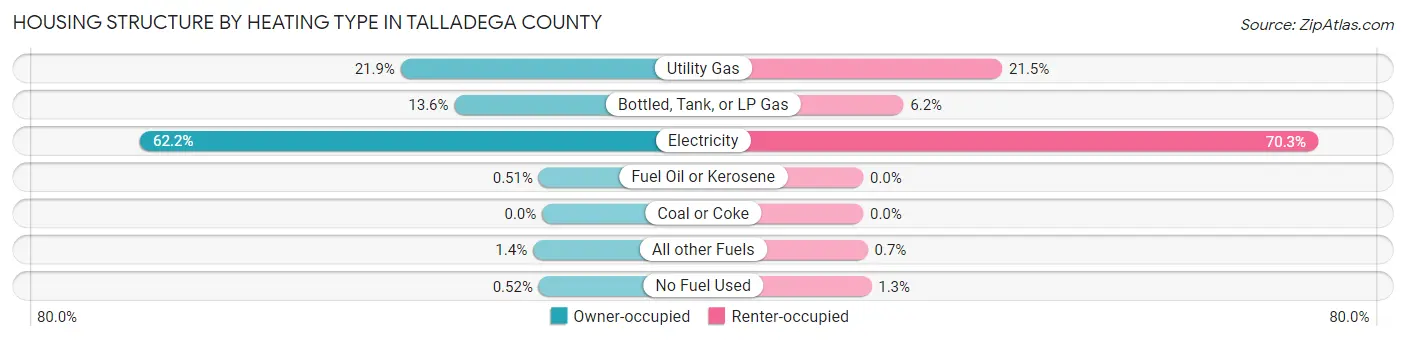
| Heating Type | Owner-occupied | Renter-occupied |
| Utility Gas | 5,087 (21.9%) | 1,953 (21.5%) |
| Bottled, Tank, or LP Gas | 3,157 (13.6%) | 566 (6.2%) |
| Electricity | 14,465 (62.2%) | 6,386 (70.3%) |
| Fuel Oil or Kerosene | 118 (0.5%) | 0 (0.0%) |
| Coal or Coke | 0 (0.0%) | 0 (0.0%) |
| All other Fuels | 328 (1.4%) | 64 (0.7%) |
| No Fuel Used | 120 (0.5%) | 115 (1.3%) |
| Total | 23,275 (100.0%) | 9,084 (100.0%) |
Household Vehicle Usage in Talladega County
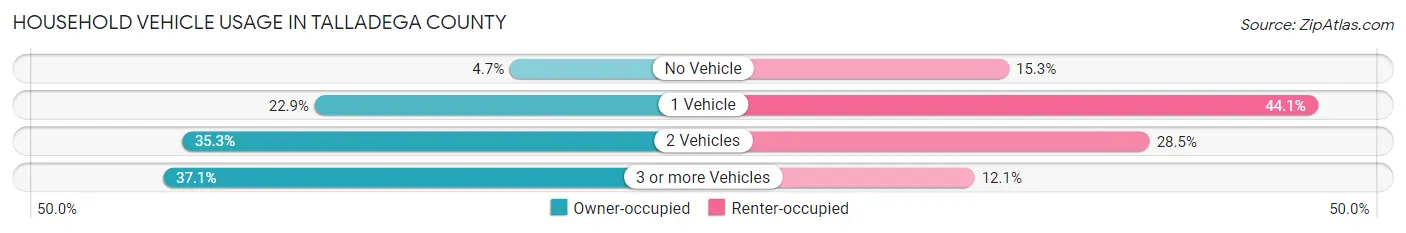
| Vehicles per Household | Owner-occupied | Renter-occupied |
| No Vehicle | 1,092 (4.7%) | 1,392 (15.3%) |
| 1 Vehicle | 5,333 (22.9%) | 4,007 (44.1%) |
| 2 Vehicles | 8,223 (35.3%) | 2,584 (28.4%) |
| 3 or more Vehicles | 8,627 (37.1%) | 1,101 (12.1%) |
| Total | 23,275 (100.0%) | 9,084 (100.0%) |
Real Estate & Mortgages in Talladega County
Real Estate and Mortgage Overview in Talladega County
| Characteristic | Without Mortgage | With Mortgage |
| Housing Units | 11,839 | 11,436 |
| Median Property Value | $98,500 | $156,200 |
| Median Household Income | $47,760 | $1,996 |
| Monthly Housing Costs | $400 | $247 |
| Real Estate Taxes | $428 | $1,721 |
Property Value by Mortgage Status in Talladega County
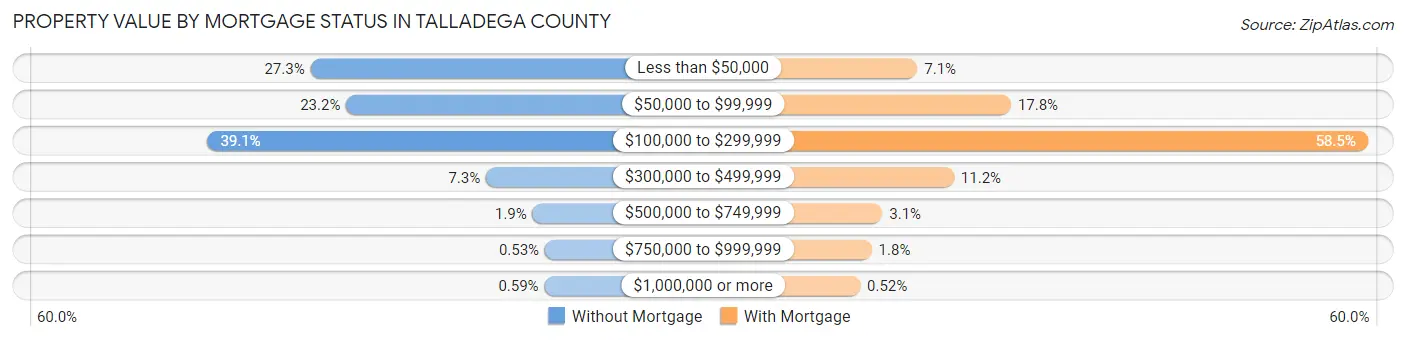
| Property Value | Without Mortgage | With Mortgage |
| Less than $50,000 | 3,236 (27.3%) | 807 (7.1%) |
| $50,000 to $99,999 | 2,751 (23.2%) | 2,031 (17.8%) |
| $100,000 to $299,999 | 4,629 (39.1%) | 6,693 (58.5%) |
| $300,000 to $499,999 | 860 (7.3%) | 1,285 (11.2%) |
| $500,000 to $749,999 | 230 (1.9%) | 350 (3.1%) |
| $750,000 to $999,999 | 63 (0.5%) | 210 (1.8%) |
| $1,000,000 or more | 70 (0.6%) | 60 (0.5%) |
| Total | 11,839 (100.0%) | 11,436 (100.0%) |
Household Income by Mortgage Status in Talladega County
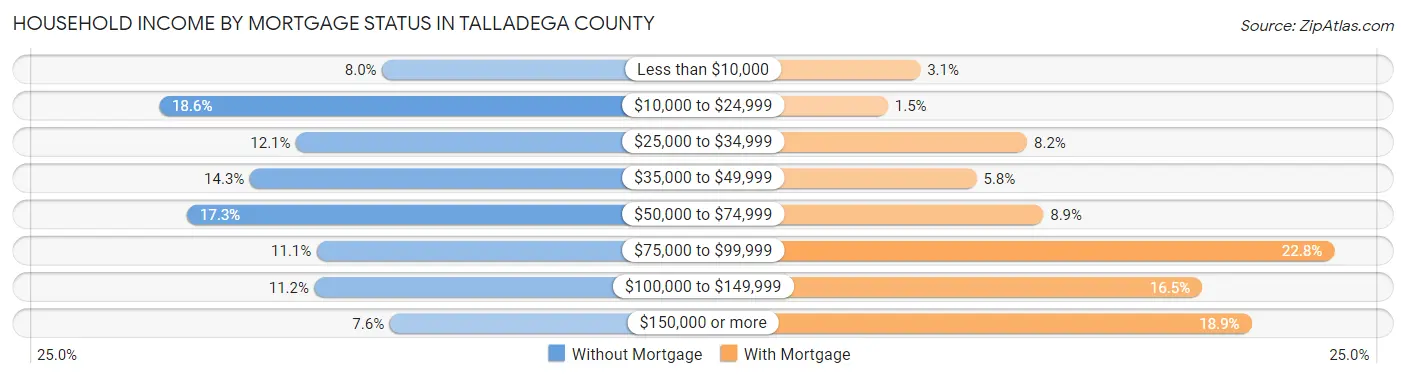
| Household Income | Without Mortgage | With Mortgage |
| Less than $10,000 | 942 (8.0%) | 352 (3.1%) |
| $10,000 to $24,999 | 2,202 (18.6%) | 176 (1.5%) |
| $25,000 to $34,999 | 1,428 (12.1%) | 934 (8.2%) |
| $35,000 to $49,999 | 1,688 (14.3%) | 659 (5.8%) |
| $50,000 to $74,999 | 2,045 (17.3%) | 1,022 (8.9%) |
| $75,000 to $99,999 | 1,310 (11.1%) | 2,606 (22.8%) |
| $100,000 to $149,999 | 1,324 (11.2%) | 1,887 (16.5%) |
| $150,000 or more | 900 (7.6%) | 2,156 (18.9%) |
| Total | 11,839 (100.0%) | 11,436 (100.0%) |
Property Value to Household Income Ratio in Talladega County
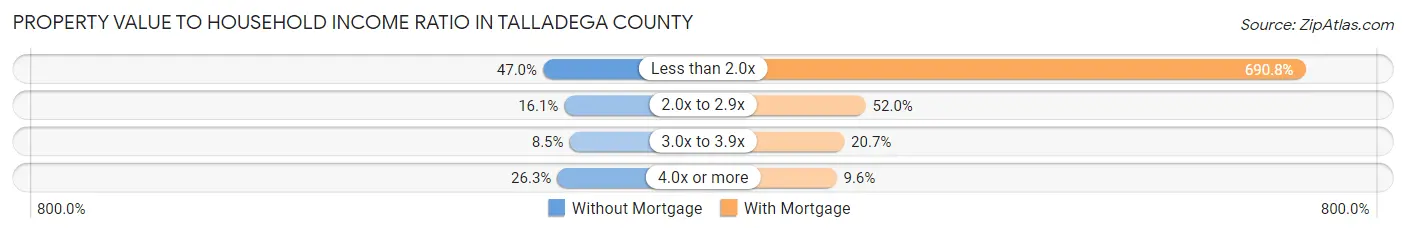
| Value-to-Income Ratio | Without Mortgage | With Mortgage |
| Less than 2.0x | 5,566 (47.0%) | 78,996 (690.8%) |
| 2.0x to 2.9x | 1,901 (16.1%) | 5,941 (51.9%) |
| 3.0x to 3.9x | 1,009 (8.5%) | 2,368 (20.7%) |
| 4.0x or more | 3,108 (26.3%) | 1,097 (9.6%) |
| Total | 11,839 (100.0%) | 11,436 (100.0%) |
Real Estate Taxes by Mortgage Status in Talladega County

| Property Taxes | Without Mortgage | With Mortgage |
| Less than $800 | 6,456 (54.5%) | 54 (0.5%) |
| $800 to $1,499 | 1,229 (10.4%) | 6,618 (57.9%) |
| $800 to $1,499 | 549 (4.6%) | 2,199 (19.2%) |
| Total | 11,839 (100.0%) | 11,436 (100.0%) |
Health & Disability in Talladega County
Health Insurance Coverage by Age in Talladega County
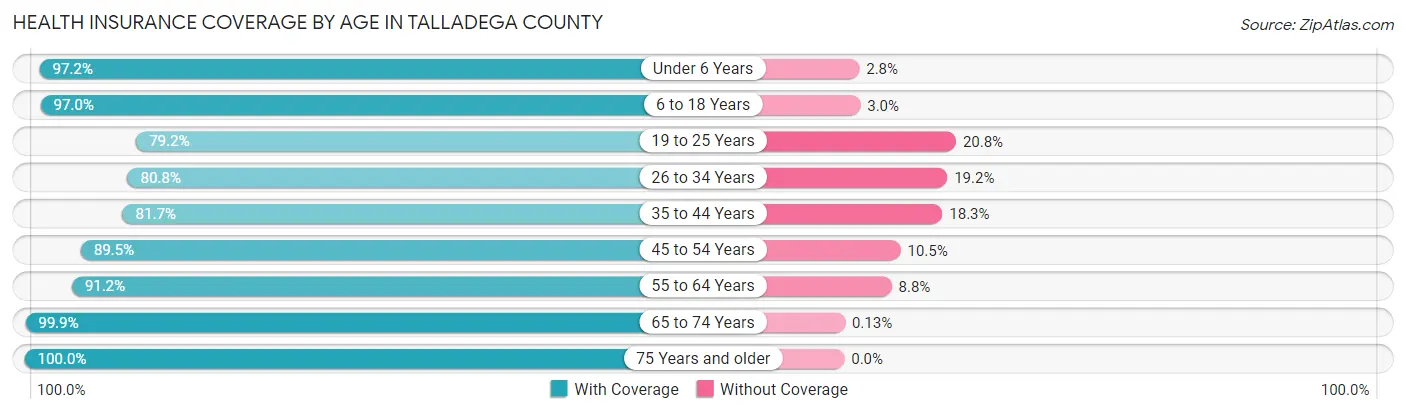
| Age Bracket | With Coverage | Without Coverage |
| Under 6 Years | 5,349 (97.2%) | 154 (2.8%) |
| 6 to 18 Years | 11,637 (97.0%) | 358 (3.0%) |
| 19 to 25 Years | 5,217 (79.2%) | 1,372 (20.8%) |
| 26 to 34 Years | 7,128 (80.8%) | 1,694 (19.2%) |
| 35 to 44 Years | 7,393 (81.7%) | 1,655 (18.3%) |
| 45 to 54 Years | 9,057 (89.5%) | 1,061 (10.5%) |
| 55 to 64 Years | 10,226 (91.2%) | 989 (8.8%) |
| 65 to 74 Years | 9,043 (99.9%) | 12 (0.1%) |
| 75 Years and older | 5,613 (100.0%) | 0 (0.0%) |
| Total | 70,663 (90.6%) | 7,295 (9.4%) |
Health Insurance Coverage by Citizenship Status in Talladega County

| Citizenship Status | With Coverage | Without Coverage |
| Native Born | 5,349 (97.2%) | 154 (2.8%) |
| Foreign Born, Citizen | 11,637 (97.0%) | 358 (3.0%) |
| Foreign Born, not a Citizen | 5,217 (79.2%) | 1,372 (20.8%) |
Health Insurance Coverage by Household Income in Talladega County
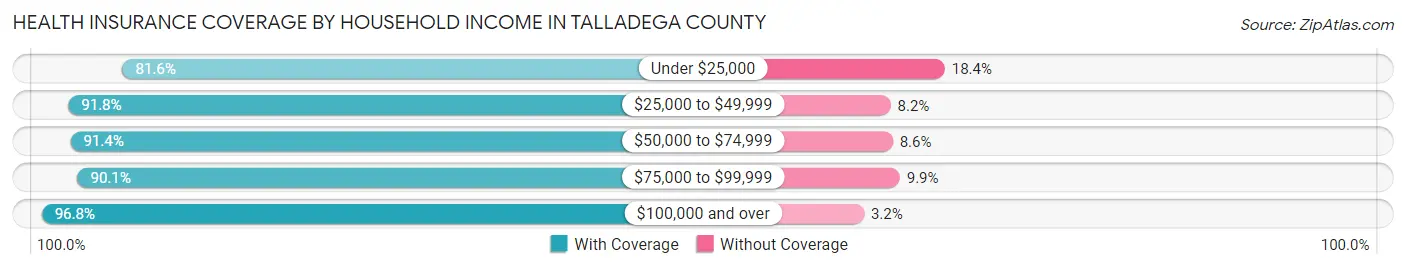
| Household Income | With Coverage | Without Coverage |
| Under $25,000 | 12,791 (81.6%) | 2,876 (18.4%) |
| $25,000 to $49,999 | 13,369 (91.8%) | 1,196 (8.2%) |
| $50,000 to $74,999 | 13,349 (91.4%) | 1,256 (8.6%) |
| $75,000 to $99,999 | 10,326 (90.1%) | 1,138 (9.9%) |
| $100,000 and over | 20,275 (96.8%) | 672 (3.2%) |
Public vs Private Health Insurance Coverage by Age in Talladega County
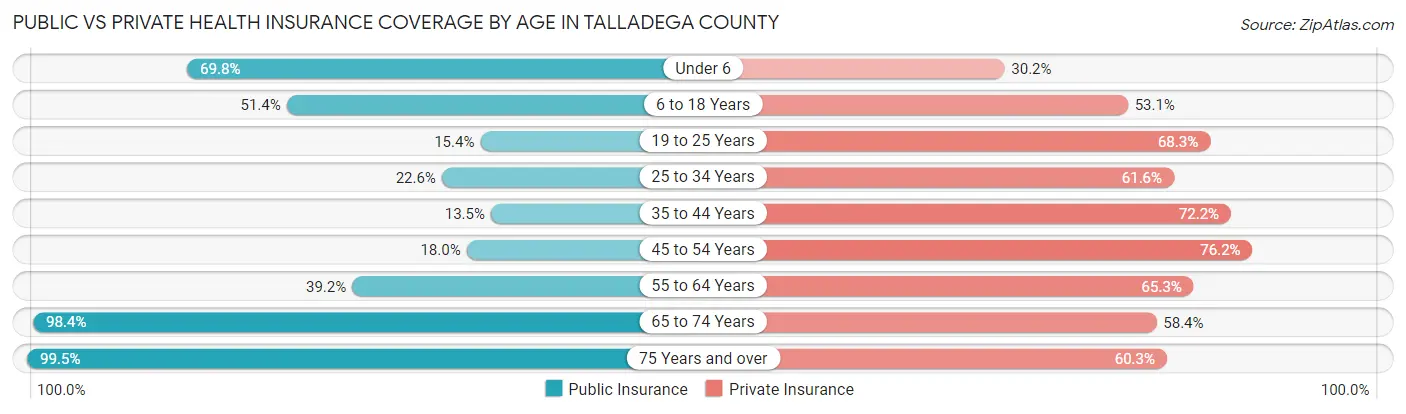
| Age Bracket | Public Insurance | Private Insurance |
| Under 6 | 3,842 (69.8%) | 1,660 (30.2%) |
| 6 to 18 Years | 6,163 (51.4%) | 6,366 (53.1%) |
| 19 to 25 Years | 1,017 (15.4%) | 4,502 (68.3%) |
| 25 to 34 Years | 1,992 (22.6%) | 5,437 (61.6%) |
| 35 to 44 Years | 1,219 (13.5%) | 6,535 (72.2%) |
| 45 to 54 Years | 1,819 (18.0%) | 7,711 (76.2%) |
| 55 to 64 Years | 4,398 (39.2%) | 7,323 (65.3%) |
| 65 to 74 Years | 8,912 (98.4%) | 5,287 (58.4%) |
| 75 Years and over | 5,587 (99.5%) | 3,386 (60.3%) |
| Total | 34,949 (44.8%) | 48,207 (61.8%) |
Disability Status by Sex by Age in Talladega County
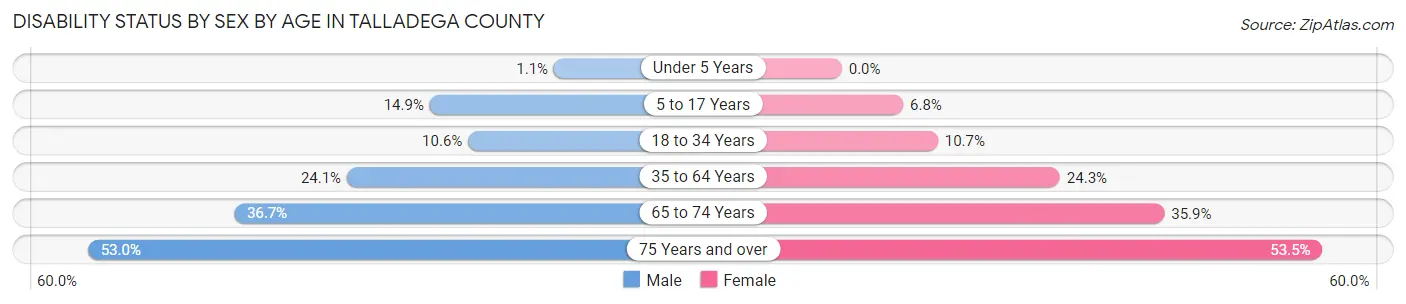
| Age Bracket | Male | Female |
| Under 5 Years | 23 (1.1%) | 0 (0.0%) |
| 5 to 17 Years | 912 (14.9%) | 411 (6.8%) |
| 18 to 34 Years | 847 (10.6%) | 903 (10.7%) |
| 35 to 64 Years | 3,403 (24.1%) | 3,950 (24.3%) |
| 65 to 74 Years | 1,575 (36.7%) | 1,710 (35.9%) |
| 75 Years and over | 1,256 (53.0%) | 1,735 (53.5%) |
Disability Class by Sex by Age in Talladega County
Disability Class: Hearing Difficulty
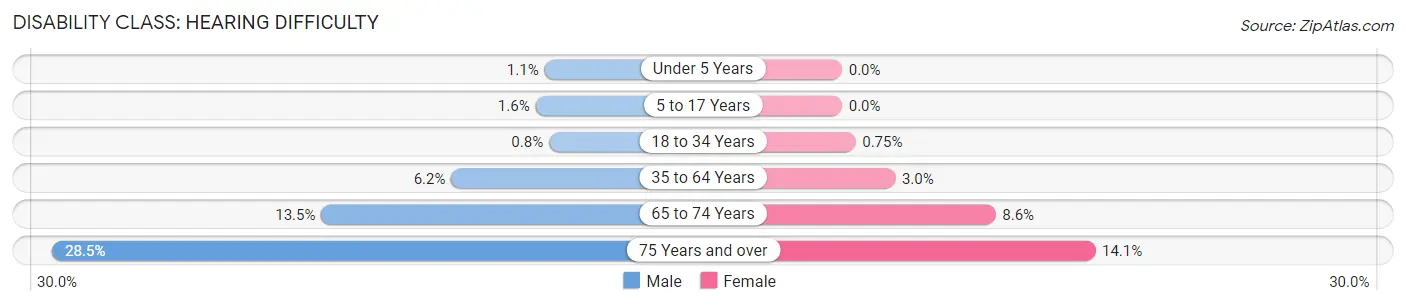
| Age Bracket | Male | Female |
| Under 5 Years | 23 (1.1%) | 0 (0.0%) |
| 5 to 17 Years | 95 (1.5%) | 0 (0.0%) |
| 18 to 34 Years | 64 (0.8%) | 63 (0.7%) |
| 35 to 64 Years | 881 (6.2%) | 482 (3.0%) |
| 65 to 74 Years | 579 (13.5%) | 407 (8.6%) |
| 75 Years and over | 675 (28.5%) | 457 (14.1%) |
Disability Class: Vision Difficulty
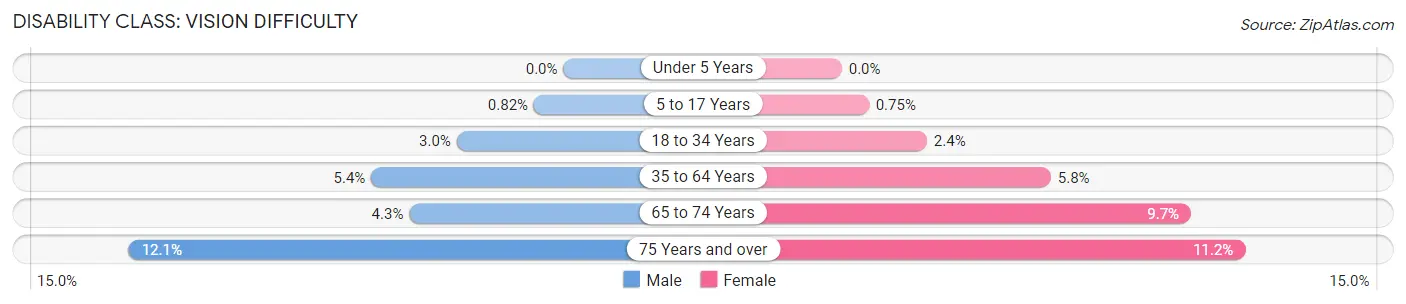
| Age Bracket | Male | Female |
| Under 5 Years | 0 (0.0%) | 0 (0.0%) |
| 5 to 17 Years | 50 (0.8%) | 45 (0.7%) |
| 18 to 34 Years | 237 (3.0%) | 200 (2.4%) |
| 35 to 64 Years | 755 (5.3%) | 947 (5.8%) |
| 65 to 74 Years | 184 (4.3%) | 463 (9.7%) |
| 75 Years and over | 287 (12.1%) | 364 (11.2%) |
Disability Class: Cognitive Difficulty
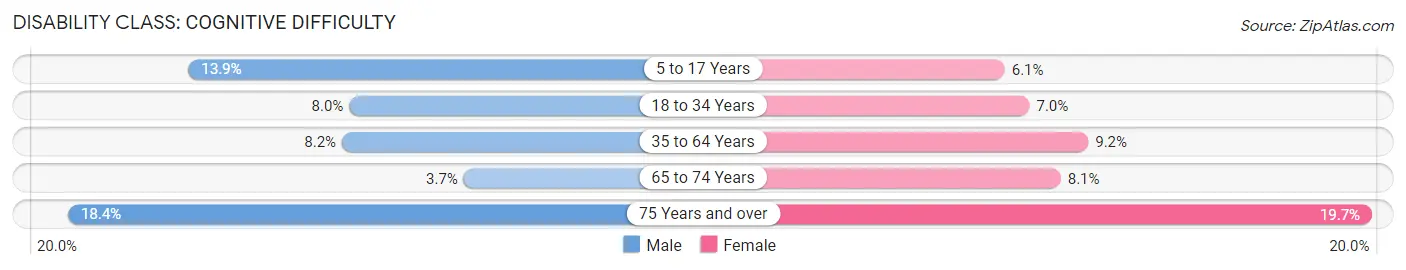
| Age Bracket | Male | Female |
| 5 to 17 Years | 853 (13.9%) | 364 (6.0%) |
| 18 to 34 Years | 635 (8.0%) | 589 (7.0%) |
| 35 to 64 Years | 1,161 (8.2%) | 1,487 (9.1%) |
| 65 to 74 Years | 159 (3.7%) | 387 (8.1%) |
| 75 Years and over | 436 (18.4%) | 638 (19.7%) |
Disability Class: Ambulatory Difficulty
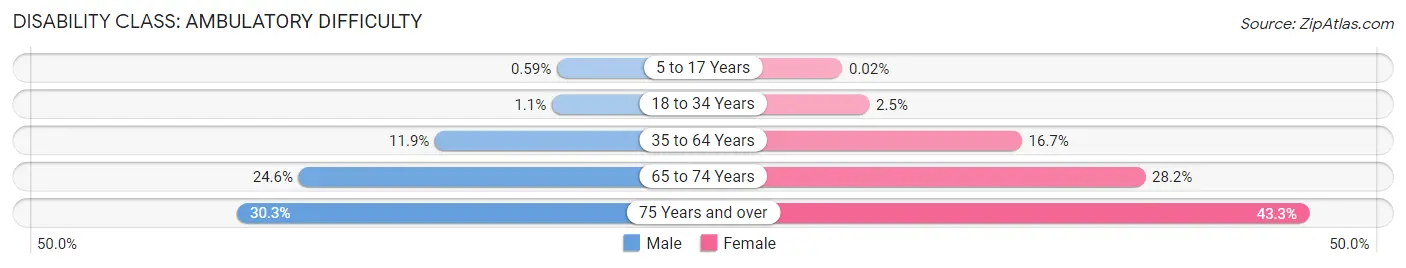
| Age Bracket | Male | Female |
| 5 to 17 Years | 36 (0.6%) | 1 (0.0%) |
| 18 to 34 Years | 84 (1.1%) | 215 (2.5%) |
| 35 to 64 Years | 1,681 (11.9%) | 2,713 (16.7%) |
| 65 to 74 Years | 1,054 (24.5%) | 1,340 (28.1%) |
| 75 Years and over | 718 (30.3%) | 1,405 (43.3%) |
Disability Class: Self-Care Difficulty
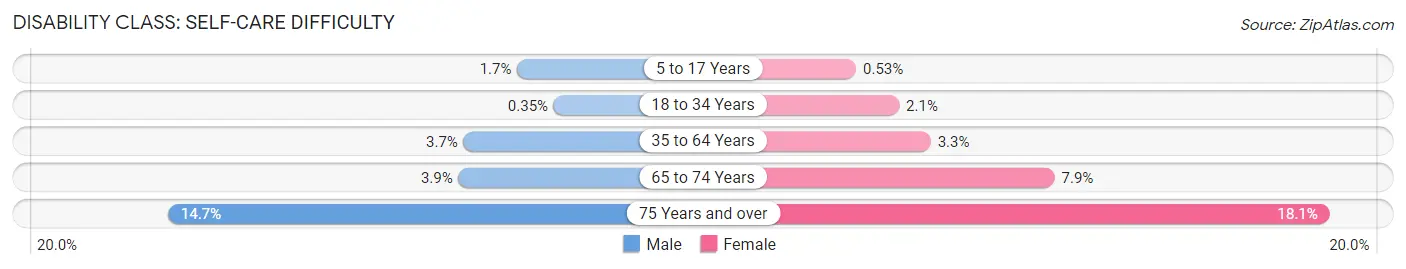
| Age Bracket | Male | Female |
| 5 to 17 Years | 105 (1.7%) | 32 (0.5%) |
| 18 to 34 Years | 28 (0.4%) | 180 (2.1%) |
| 35 to 64 Years | 522 (3.7%) | 537 (3.3%) |
| 65 to 74 Years | 167 (3.9%) | 376 (7.9%) |
| 75 Years and over | 348 (14.7%) | 587 (18.1%) |
Technology Access in Talladega County
Computing Device Access in Talladega County
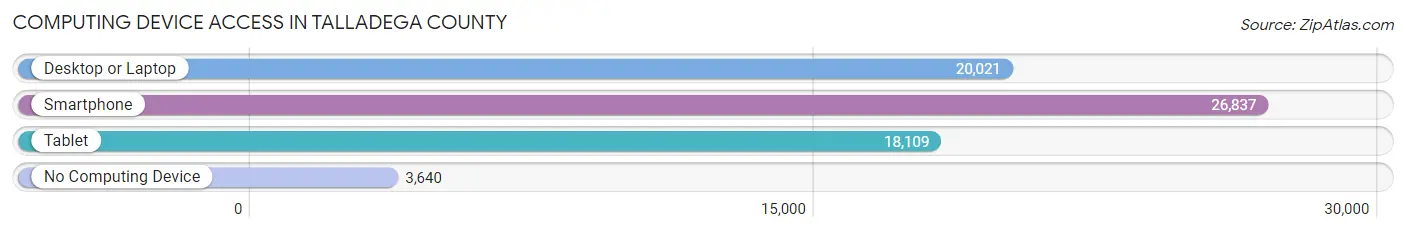
| Device Type | # Households | % Households |
| Desktop or Laptop | 20,021 | 61.9% |
| Smartphone | 26,837 | 82.9% |
| Tablet | 18,109 | 56.0% |
| No Computing Device | 3,640 | 11.3% |
| Total | 32,359 | 100.0% |
Internet Access in Talladega County
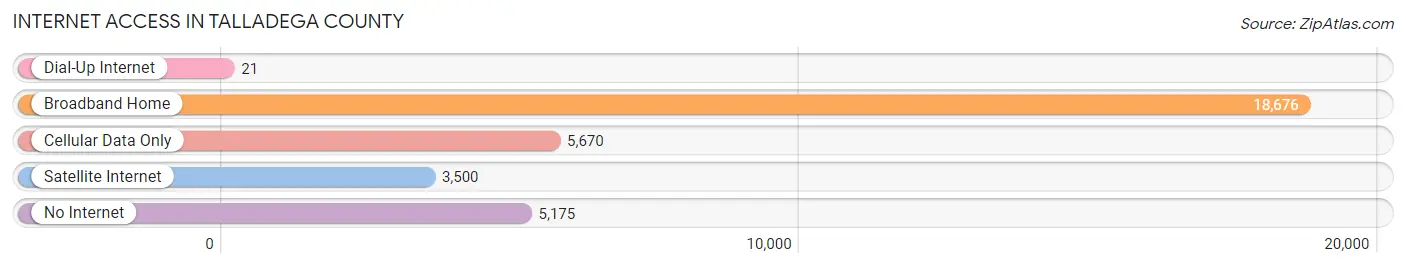
| Internet Type | # Households | % Households |
| Dial-Up Internet | 21 | 0.1% |
| Broadband Home | 18,676 | 57.7% |
| Cellular Data Only | 5,670 | 17.5% |
| Satellite Internet | 3,500 | 10.8% |
| No Internet | 5,175 | 16.0% |
| Total | 32,359 | 100.0% |
Talladega County Summary
Talladega County is located in the east-central part of the state of Alabama, in the Appalachian foothills. It is bordered by Calhoun, Clay, Cleburne, Coosa, Elmore, St. Clair, and Shelby counties. The county seat is Talladega, and the largest city is Sylacauga. As of the 2010 census, the population was 82,291.
History
Talladega County was established on December 18, 1832, from land ceded by the Creek Indians. It was named for the Talladega tribe of Creek Indians, who had a village in the area. The county was originally part of the Creek Nation, and was part of the territory ceded to the United States in the Treaty of Cusseta in 1832.
The county was divided into several smaller counties in the late 19th century, including Clay, Cleburne, Coosa, Elmore, St. Clair, and Shelby. The county seat was moved from Talladega to Sylacauga in 1866.
Geography
Talladega County is located in the east-central part of the state of Alabama, in the Appalachian foothills. It is bordered by Calhoun, Clay, Cleburne, Coosa, Elmore, St. Clair, and Shelby counties. The county has a total area of 805 square miles, of which 797 square miles is land and 8 square miles (1.0%) is water.
The county is located in the Appalachian foothills, and is mostly hilly and forested. The highest point in the county is Cheaha Mountain, which has an elevation of 2,407 feet. The county is drained by the Coosa River and its tributaries.
Economy
Talladega County's economy is largely based on agriculture and manufacturing. The county is home to several large poultry processing plants, as well as a number of smaller food processing plants. The county is also home to several automotive parts manufacturers, including Honda, Toyota, and Hyundai.
The county is also home to several large retail stores, including Walmart, Target, and Lowe's. The county is also home to several large industrial parks, including the Talladega Industrial Park and the Sylacauga Industrial Park.
Demographics
As of the 2010 census, there were 82,291 people, 32,845 households, and 22,845 families residing in the county. The population density was 103 people per square mile. There were 37,845 housing units at an average density of 48 per square mile. The racial makeup of the county was 73.2% White, 24.2% Black or African American, 0.3% Native American, 0.5% Asian, 0.1% Pacific Islander, 0.7% from other races, and 0.9% from two or more races. 1.7% of the population were Hispanic or Latino of any race.
There were 32,845 households, out of which 30.2% had children under the age of 18 living with them, 48.2% were married couples living together, 15.7% had a female householder with no husband present, and 31.7% were non-families. 27.3% of all households were made up of individuals, and 11.2% had someone living alone who was 65 years of age or older. The average household size was 2.48 and the average family size was 3.02.
In the county, the population was spread out, with 25.2% under the age of 18, 8.7% from 18 to 24, 27.2% from 25 to 44, 24.2% from 45 to 64, and 14.7% who were 65 years of age or older. The median age was 37 years. For every 100 females, there were 93.2 males. For every 100 females age 18 and over, there were 89.7 males.
The median income for a household in the county was $33,845, and the median income for a family was $41,845. Males had a median income of $33,845 versus $25,845 for females. The per capita income for the county was $17,845. About 13.2% of families and 16.2% of the population were below the poverty line, including 22.2% of those under age 18 and 14.2% of those age 65 or over.
Common Questions
What is Per Capita Income in Talladega County?
Per Capita income in Talladega County is $29,236.
What is the Median Family Income in Talladega County?
Median Family Income in Talladega County is $66,224.
What is the Median Household income in Talladega County?
Median Household Income in Talladega County is $52,457.
What is Income or Wage Gap in Talladega County?
Income or Wage Gap in Talladega County is 34.8%.
Women in Talladega County earn 65.2 cents for every dollar earned by a man.
What is Family Income Deficit in Talladega County?
Family Income Deficit in Talladega County is $11,757.
Families that are below poverty line in Talladega County earn $11,757 less on average than the poverty threshold level.
What is Inequality or Gini Index in Talladega County?
Inequality or Gini Index in Talladega County is 0.48.
What is the Total Population of Talladega County?
Total Population of Talladega County is 81,105.
What is the Total Male Population of Talladega County?
Total Male Population of Talladega County is 39,386.
What is the Total Female Population of Talladega County?
Total Female Population of Talladega County is 41,719.
What is the Ratio of Males per 100 Females in Talladega County?
There are 94.41 Males per 100 Females in Talladega County.
What is the Ratio of Females per 100 Males in Talladega County?
There are 105.92 Females per 100 Males in Talladega County.
What is the Median Population Age in Talladega County?
Median Population Age in Talladega County is 42.1 Years.
What is the Average Family Size in Talladega County
Average Family Size in Talladega County is 2.9 People.
What is the Average Household Size in Talladega County
Average Household Size in Talladega County is 2.4 People.
How Large is the Labor Force in Talladega County?
There are 35,186 People in the Labor Forcein in Talladega County.
What is the Percentage of People in the Labor Force in Talladega County?
53.1% of People are in the Labor Force in Talladega County.
What is the Unemployment Rate in Talladega County?
Unemployment Rate in Talladega County is 8.4%.