Calhoun County, AL Map & Demographics
Calhoun County Map
Calhoun County Overview
$28,227
PER CAPITA INCOME
$68,959
AVG FAMILY INCOME
$54,339
AVG HOUSEHOLD INCOME
32.1%
WAGE / INCOME GAP [ % ]
67.9¢/ $1
WAGE / INCOME GAP [ $ ]
$10,769
FAMILY INCOME DEFICIT
0.45
INEQUALITY / GINI INDEX
116,162
TOTAL POPULATION
56,185
MALE POPULATION
59,977
FEMALE POPULATION
93.68
MALES / 100 FEMALES
106.75
FEMALES / 100 MALES
39.2
MEDIAN AGE
3.1
AVG FAMILY SIZE
2.5
AVG HOUSEHOLD SIZE
53,559
LABOR FORCE [ PEOPLE ]
56.6%
PERCENT IN LABOR FORCE
6.9%
UNEMPLOYMENT RATE
Calhoun County Area Codes
Income in Calhoun County
Income Overview in Calhoun County
Per Capita Income in Calhoun County is $28,227, while median incomes of families and households are $68,959 and $54,339 respectively.
| Characteristic | Number | Measure |
| Per Capita Income | 116,162 | $28,227 |
| Median Family Income | 28,213 | $68,959 |
| Mean Family Income | 28,213 | $83,279 |
| Median Household Income | 44,693 | $54,339 |
| Mean Household Income | 44,693 | $69,213 |
| Income Deficit | 28,213 | $10,769 |
| Wage / Income Gap (%) | 116,162 | 32.13% |
| Wage / Income Gap ($) | 116,162 | 67.87¢ per $1 |
| Gini / Inequality Index | 116,162 | 0.45 |
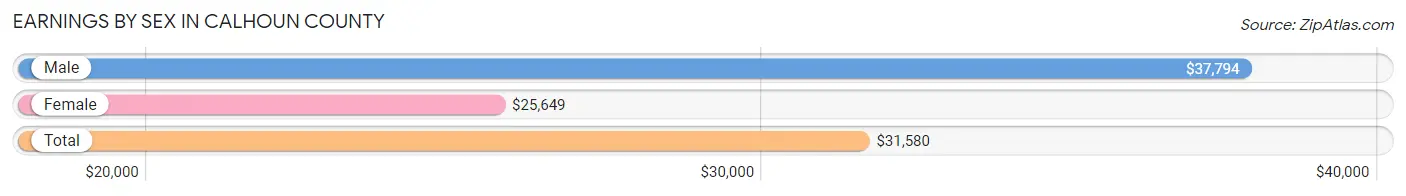
Earnings by Sex in Calhoun County
Average Earnings in Calhoun County are $31,580, $37,794 for men and $25,649 for women, a difference of 32.1%.
| Sex | Number | Average Earnings |
| Male | 29,097 (52.2%) | $37,794 |
| Female | 26,665 (47.8%) | $25,649 |
| Total | 55,762 (100.0%) | $31,580 |
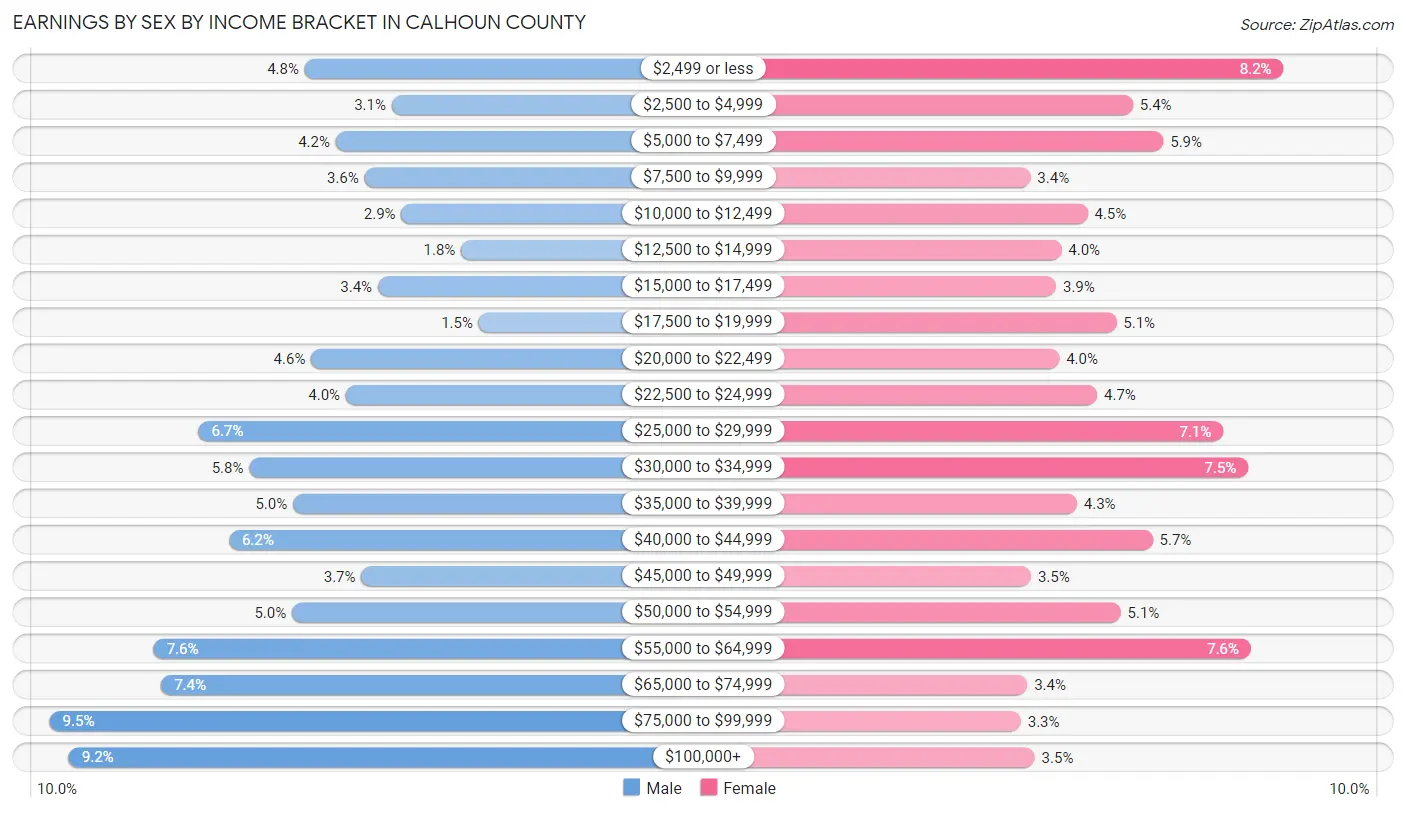
Earnings by Sex by Income Bracket in Calhoun County
The most common earnings brackets in Calhoun County are $75,000 to $99,999 for men (2,774 | 9.5%) and $2,499 or less for women (2,180 | 8.2%).
| Income | Male | Female |
| $2,499 or less | 1,382 (4.8%) | 2,180 (8.2%) |
| $2,500 to $4,999 | 907 (3.1%) | 1,430 (5.4%) |
| $5,000 to $7,499 | 1,212 (4.2%) | 1,582 (5.9%) |
| $7,500 to $9,999 | 1,057 (3.6%) | 916 (3.4%) |
| $10,000 to $12,499 | 854 (2.9%) | 1,203 (4.5%) |
| $12,500 to $14,999 | 531 (1.8%) | 1,073 (4.0%) |
| $15,000 to $17,499 | 984 (3.4%) | 1,045 (3.9%) |
| $17,500 to $19,999 | 435 (1.5%) | 1,347 (5.1%) |
| $20,000 to $22,499 | 1,346 (4.6%) | 1,060 (4.0%) |
| $22,500 to $24,999 | 1,157 (4.0%) | 1,250 (4.7%) |
| $25,000 to $29,999 | 1,961 (6.7%) | 1,881 (7.0%) |
| $30,000 to $34,999 | 1,685 (5.8%) | 2,006 (7.5%) |
| $35,000 to $39,999 | 1,447 (5.0%) | 1,148 (4.3%) |
| $40,000 to $44,999 | 1,796 (6.2%) | 1,528 (5.7%) |
| $45,000 to $49,999 | 1,074 (3.7%) | 921 (3.5%) |
| $50,000 to $54,999 | 1,453 (5.0%) | 1,368 (5.1%) |
| $55,000 to $64,999 | 2,207 (7.6%) | 2,019 (7.6%) |
| $65,000 to $74,999 | 2,166 (7.4%) | 902 (3.4%) |
| $75,000 to $99,999 | 2,774 (9.5%) | 868 (3.3%) |
| $100,000+ | 2,669 (9.2%) | 938 (3.5%) |
| Total | 29,097 (100.0%) | 26,665 (100.0%) |
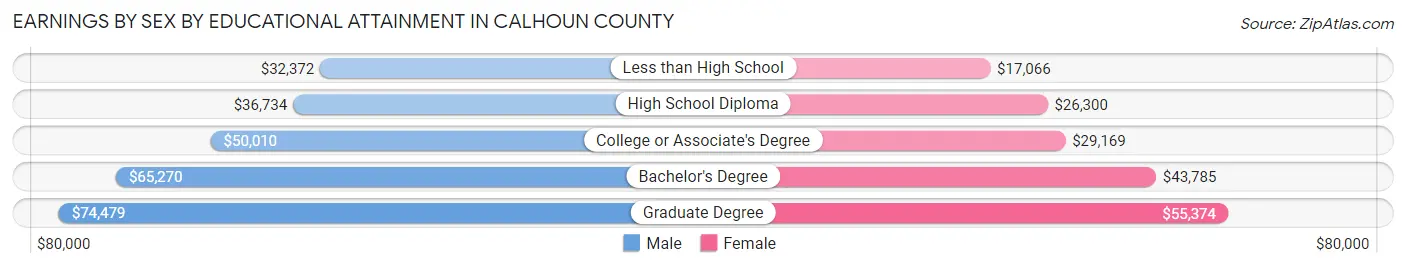
Earnings by Sex by Educational Attainment in Calhoun County
Average earnings in Calhoun County are $44,808 for men and $31,429 for women, a difference of 29.9%. Men with an educational attainment of graduate degree enjoy the highest average annual earnings of $74,479, while those with less than high school education earn the least with $32,372. Women with an educational attainment of graduate degree earn the most with the average annual earnings of $55,374, while those with less than high school education have the smallest earnings of $17,066.
| Educational Attainment | Male Income | Female Income |
| Less than High School | $32,372 | $17,066 |
| High School Diploma | $36,734 | $26,300 |
| College or Associate's Degree | $50,010 | $29,169 |
| Bachelor's Degree | $65,270 | $43,785 |
| Graduate Degree | $74,479 | $55,374 |
| Total | $44,808 | $31,429 |
Family Income in Calhoun County
Family Income Brackets in Calhoun County
According to the Calhoun County family income data, there are 5,389 families falling into the $100,000 to $149,999 income range, which is the most common income bracket and makes up 19.1% of all families. Conversely, the $10,000 to $14,999 income bracket is the least frequent group with only 875 families (3.1%) belonging to this category.
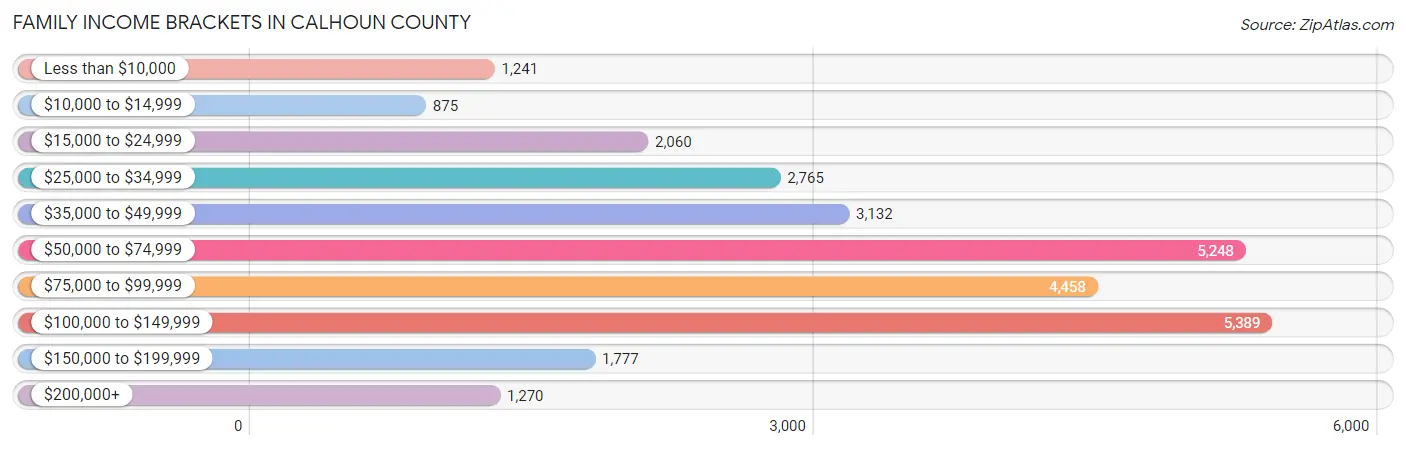
| Income Bracket | # Families | % Families |
| Less than $10,000 | 1,241 | 4.4% |
| $10,000 to $14,999 | 875 | 3.1% |
| $15,000 to $24,999 | 2,060 | 7.3% |
| $25,000 to $34,999 | 2,765 | 9.8% |
| $35,000 to $49,999 | 3,132 | 11.1% |
| $50,000 to $74,999 | 5,248 | 18.6% |
| $75,000 to $99,999 | 4,458 | 15.8% |
| $100,000 to $149,999 | 5,389 | 19.1% |
| $150,000 to $199,999 | 1,777 | 6.3% |
| $200,000+ | 1,270 | 4.5% |
Family Income by Famaliy Size in Calhoun County
6-person families (701 | 2.5%) account for the highest median family income in Calhoun County with $108,359 per family, while 2-person families (14,434 | 51.2%) have the highest median income of $30,846 per family member.
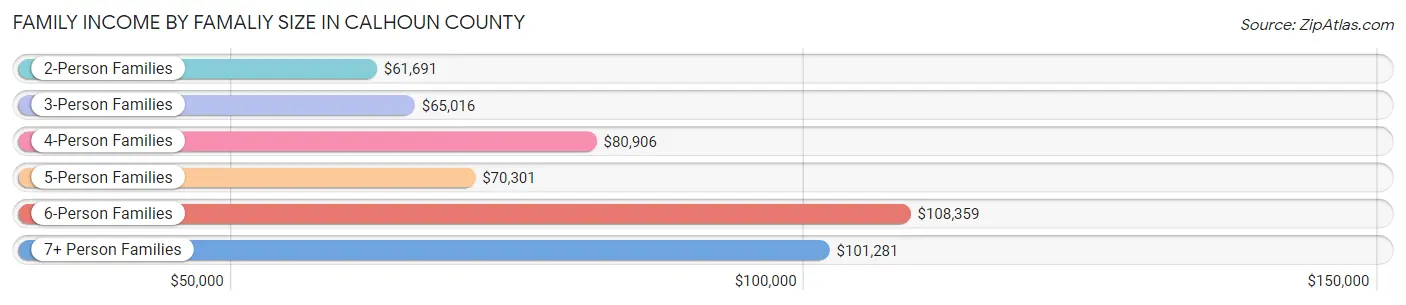
| Income Bracket | # Families | Median Income |
| 2-Person Families | 14,434 (51.2%) | $61,691 |
| 3-Person Families | 6,247 (22.1%) | $65,016 |
| 4-Person Families | 4,683 (16.6%) | $80,906 |
| 5-Person Families | 1,903 (6.8%) | $70,301 |
| 6-Person Families | 701 (2.5%) | $108,359 |
| 7+ Person Families | 245 (0.9%) | $101,281 |
| Total | 28,213 (100.0%) | $68,959 |
Family Income by Number of Earners in Calhoun County
The median family income in Calhoun County is $68,959, with families comprising 3+ earners (2,477) having the highest median family income of $114,540, while families with no earners (5,698) have the lowest median family income of $37,176, accounting for 8.8% and 20.2% of families, respectively.
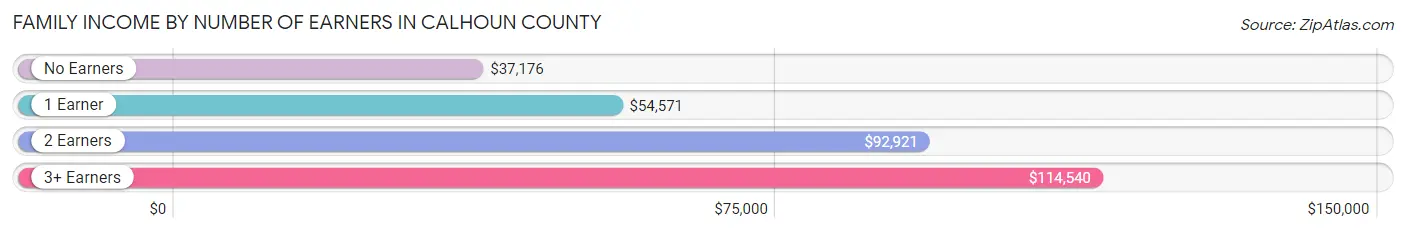
| Number of Earners | # Families | Median Income |
| No Earners | 5,698 (20.2%) | $37,176 |
| 1 Earner | 10,230 (36.3%) | $54,571 |
| 2 Earners | 9,808 (34.8%) | $92,921 |
| 3+ Earners | 2,477 (8.8%) | $114,540 |
| Total | 28,213 (100.0%) | $68,959 |
Household Income in Calhoun County
Household Income Brackets in Calhoun County
With 8,045 households falling in the category, the $50,000 to $74,999 income range is the most frequent in Calhoun County, accounting for 18.0% of all households. In contrast, only 1,520 households (3.4%) fall into the $200,000+ income bracket, making it the least populous group.
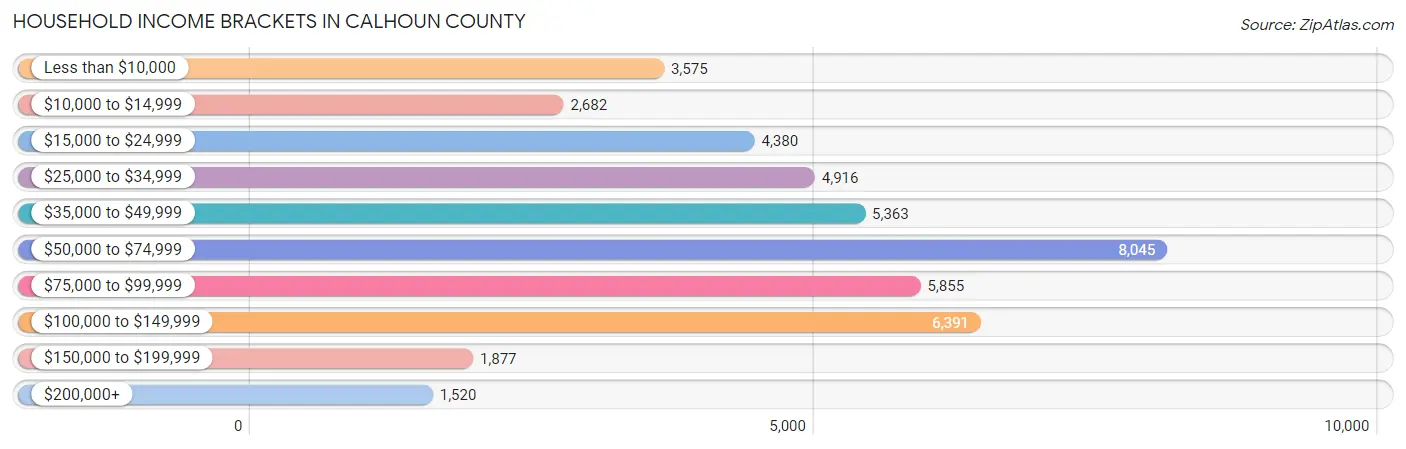
| Income Bracket | # Households | % Households |
| Less than $10,000 | 3,575 | 8.0% |
| $10,000 to $14,999 | 2,682 | 6.0% |
| $15,000 to $24,999 | 4,380 | 9.8% |
| $25,000 to $34,999 | 4,916 | 11.0% |
| $35,000 to $49,999 | 5,363 | 12.0% |
| $50,000 to $74,999 | 8,045 | 18.0% |
| $75,000 to $99,999 | 5,855 | 13.1% |
| $100,000 to $149,999 | 6,391 | 14.3% |
| $150,000 to $199,999 | 1,877 | 4.2% |
| $200,000+ | 1,520 | 3.4% |
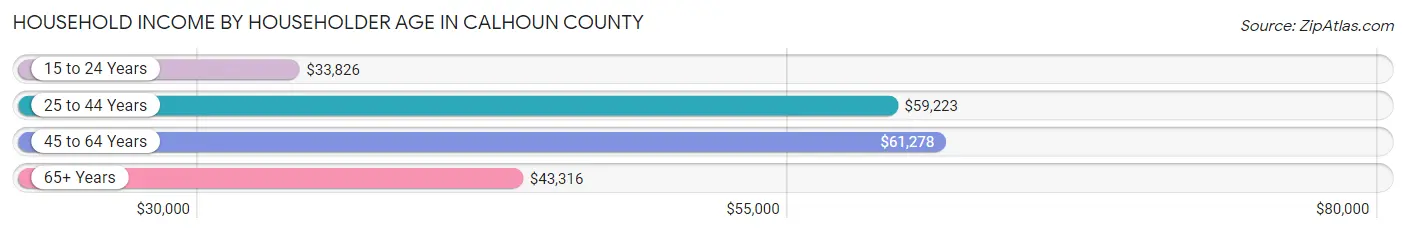
Household Income by Householder Age in Calhoun County
The median household income in Calhoun County is $54,339, with the highest median household income of $61,278 found in the 45 to 64 years age bracket for the primary householder. A total of 16,177 households (36.2%) fall into this category. Meanwhile, the 15 to 24 years age bracket for the primary householder has the lowest median household income of $33,826, with 1,599 households (3.6%) in this group.
| Income Bracket | # Households | Median Income |
| 15 to 24 Years | 1,599 (3.6%) | $33,826 |
| 25 to 44 Years | 13,545 (30.3%) | $59,223 |
| 45 to 64 Years | 16,177 (36.2%) | $61,278 |
| 65+ Years | 13,372 (29.9%) | $43,316 |
| Total | 44,693 (100.0%) | $54,339 |
Poverty in Calhoun County
Income Below Poverty by Sex and Age in Calhoun County
With 15.4% poverty level for males and 20.6% for females among the residents of Calhoun County, under 5 year old males and 18 to 24 year old females are the most vulnerable to poverty, with 907 males (27.8%) and 1,946 females (37.7%) in their respective age groups living below the poverty level.
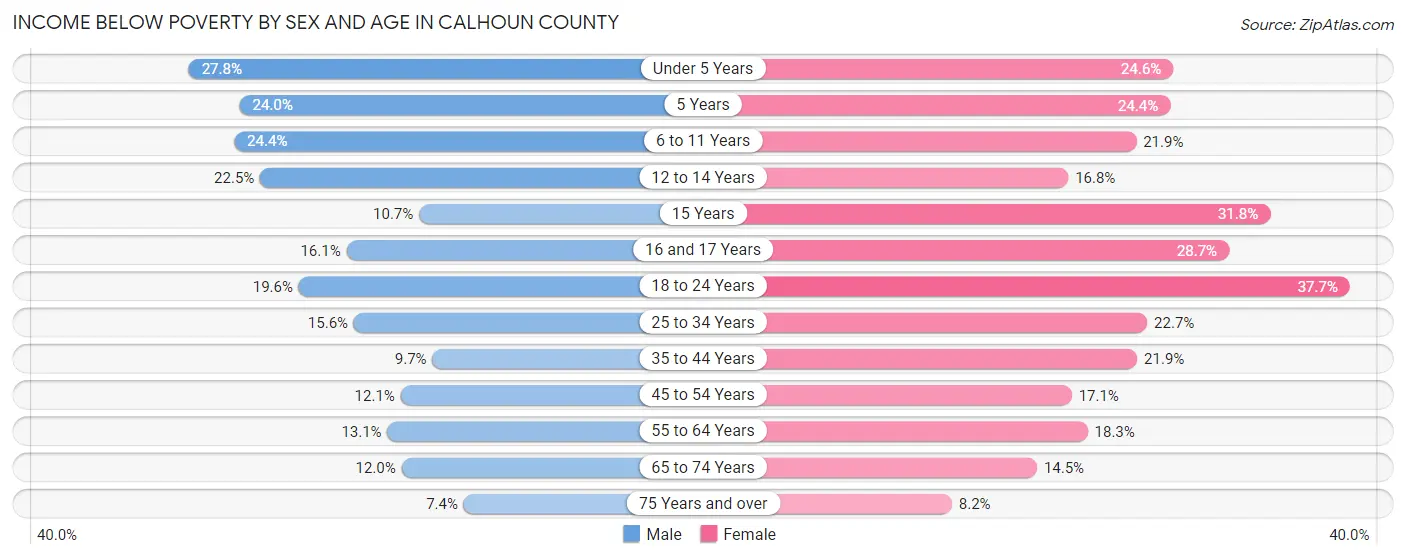
| Age Bracket | Male | Female |
| Under 5 Years | 907 (27.8%) | 780 (24.6%) |
| 5 Years | 138 (24.0%) | 155 (24.4%) |
| 6 to 11 Years | 1,013 (24.4%) | 784 (21.9%) |
| 12 to 14 Years | 445 (22.5%) | 368 (16.8%) |
| 15 Years | 69 (10.7%) | 241 (31.8%) |
| 16 and 17 Years | 254 (16.1%) | 400 (28.7%) |
| 18 to 24 Years | 1,071 (19.6%) | 1,946 (37.7%) |
| 25 to 34 Years | 1,122 (15.5%) | 1,672 (22.7%) |
| 35 to 44 Years | 642 (9.7%) | 1,560 (21.9%) |
| 45 to 54 Years | 842 (12.1%) | 1,160 (17.1%) |
| 55 to 64 Years | 979 (13.1%) | 1,442 (18.2%) |
| 65 to 74 Years | 673 (12.0%) | 969 (14.5%) |
| 75 Years and over | 220 (7.4%) | 415 (8.2%) |
| Total | 8,375 (15.4%) | 11,892 (20.6%) |
Income Above Poverty by Sex and Age in Calhoun County
According to the poverty statistics in Calhoun County, males aged 75 years and over and females aged 75 years and over are the age groups that are most secure financially, with 92.6% of males and 91.8% of females in these age groups living above the poverty line.
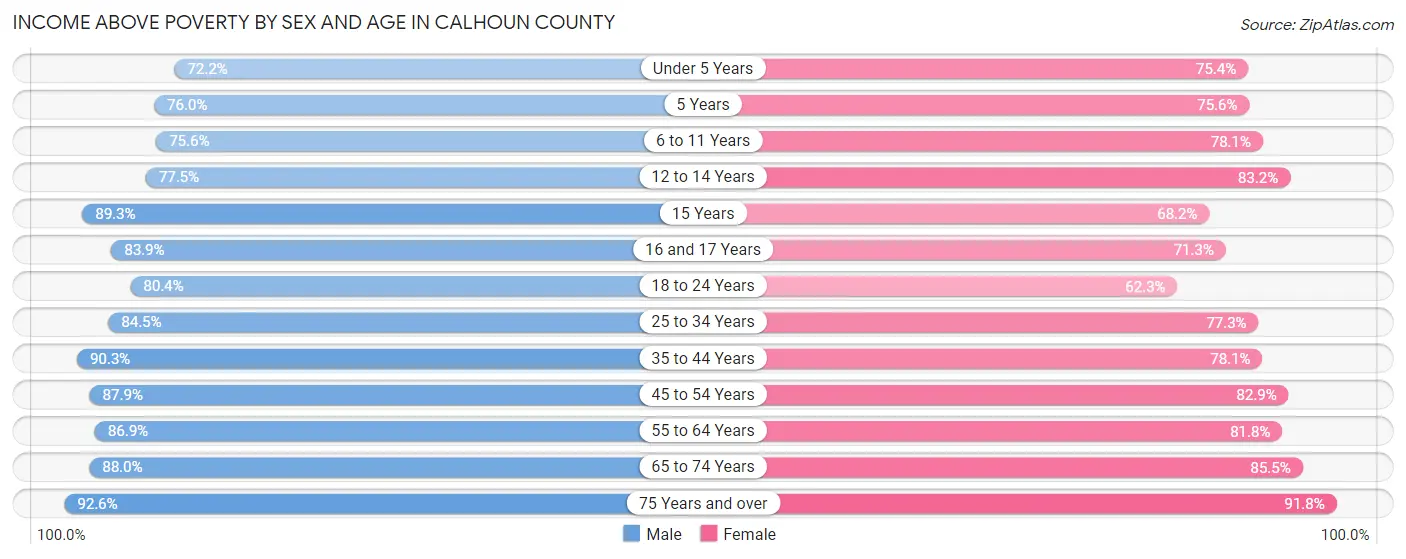
| Age Bracket | Male | Female |
| Under 5 Years | 2,354 (72.2%) | 2,391 (75.4%) |
| 5 Years | 436 (76.0%) | 481 (75.6%) |
| 6 to 11 Years | 3,132 (75.6%) | 2,802 (78.1%) |
| 12 to 14 Years | 1,532 (77.5%) | 1,821 (83.2%) |
| 15 Years | 575 (89.3%) | 517 (68.2%) |
| 16 and 17 Years | 1,324 (83.9%) | 992 (71.3%) |
| 18 to 24 Years | 4,383 (80.4%) | 3,214 (62.3%) |
| 25 to 34 Years | 6,095 (84.5%) | 5,704 (77.3%) |
| 35 to 44 Years | 5,964 (90.3%) | 5,553 (78.1%) |
| 45 to 54 Years | 6,131 (87.9%) | 5,634 (82.9%) |
| 55 to 64 Years | 6,518 (86.9%) | 6,460 (81.8%) |
| 65 to 74 Years | 4,931 (88.0%) | 5,718 (85.5%) |
| 75 Years and over | 2,756 (92.6%) | 4,665 (91.8%) |
| Total | 46,131 (84.6%) | 45,952 (79.4%) |
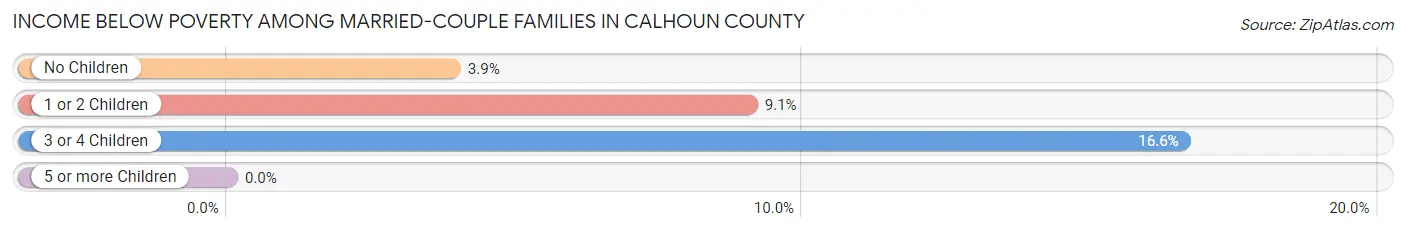
Income Below Poverty Among Married-Couple Families in Calhoun County
The poverty statistics for married-couple families in Calhoun County show that 6.3% or 1,214 of the total 19,177 families live below the poverty line. Families with 3 or 4 children have the highest poverty rate of 16.6%, comprising of 265 families. On the other hand, families with 5 or more children have the lowest poverty rate of 0.0%, which includes 0 families.
| Children | Above Poverty | Below Poverty |
| No Children | 11,812 (96.1%) | 477 (3.9%) |
| 1 or 2 Children | 4,741 (90.9%) | 472 (9.0%) |
| 3 or 4 Children | 1,333 (83.4%) | 265 (16.6%) |
| 5 or more Children | 77 (100.0%) | 0 (0.0%) |
| Total | 17,963 (93.7%) | 1,214 (6.3%) |
Income Below Poverty Among Single-Parent Households in Calhoun County
According to the poverty data in Calhoun County, 14.3% or 346 single-father households and 31.3% or 2,070 single-mother households are living below the poverty line. Among single-father households, those with 3 or 4 children have the highest poverty rate, with 55 households (37.9%) experiencing poverty. Likewise, among single-mother households, those with 5 or more children have the highest poverty rate, with 30 households (100.0%) falling below the poverty line.
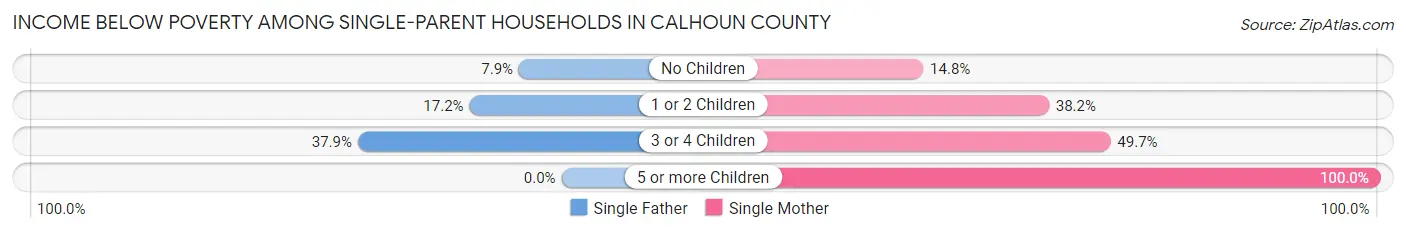
| Children | Single Father | Single Mother |
| No Children | 86 (7.9%) | 345 (14.8%) |
| 1 or 2 Children | 205 (17.2%) | 1,387 (38.2%) |
| 3 or 4 Children | 55 (37.9%) | 308 (49.7%) |
| 5 or more Children | 0 (0.0%) | 30 (100.0%) |
| Total | 346 (14.3%) | 2,070 (31.3%) |
Income Below Poverty Among Married-Couple vs Single-Parent Households in Calhoun County
The poverty data for Calhoun County shows that 1,214 of the married-couple family households (6.3%) and 2,416 of the single-parent households (26.7%) are living below the poverty level. Within the married-couple family households, those with 3 or 4 children have the highest poverty rate, with 265 households (16.6%) falling below the poverty line. Among the single-parent households, those with 5 or more children have the highest poverty rate, with 30 household (100.0%) living below poverty.
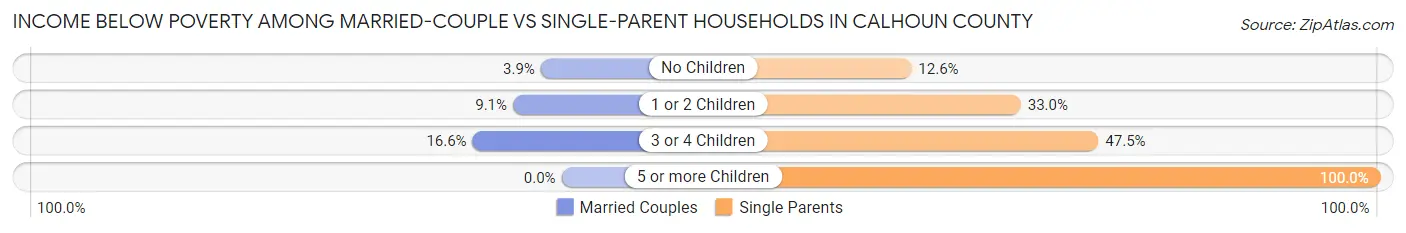
| Children | Married-Couple Families | Single-Parent Households |
| No Children | 477 (3.9%) | 431 (12.6%) |
| 1 or 2 Children | 472 (9.0%) | 1,592 (33.0%) |
| 3 or 4 Children | 265 (16.6%) | 363 (47.4%) |
| 5 or more Children | 0 (0.0%) | 30 (100.0%) |
| Total | 1,214 (6.3%) | 2,416 (26.7%) |
Race in Calhoun County
The most populous races in Calhoun County are White / Caucasian (83,306 | 71.7%), Black / African American (25,631 | 22.1%), and Hispanic or Latino (4,736 | 4.1%).
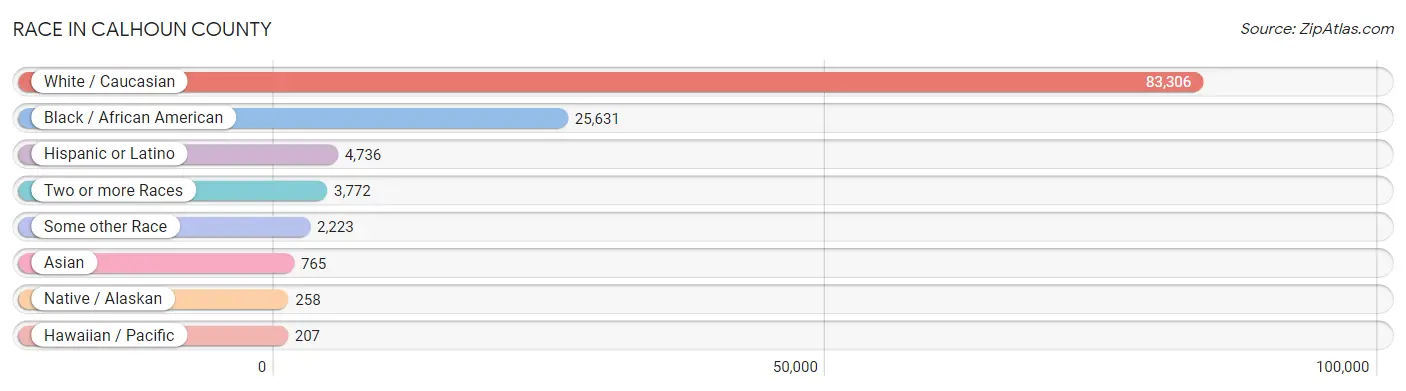
| Race | # Population | % Population |
| Asian | 765 | 0.7% |
| Black / African American | 25,631 | 22.1% |
| Hawaiian / Pacific | 207 | 0.2% |
| Hispanic or Latino | 4,736 | 4.1% |
| Native / Alaskan | 258 | 0.2% |
| White / Caucasian | 83,306 | 71.7% |
| Two or more Races | 3,772 | 3.3% |
| Some other Race | 2,223 | 1.9% |
| Total | 116,162 | 100.0% |
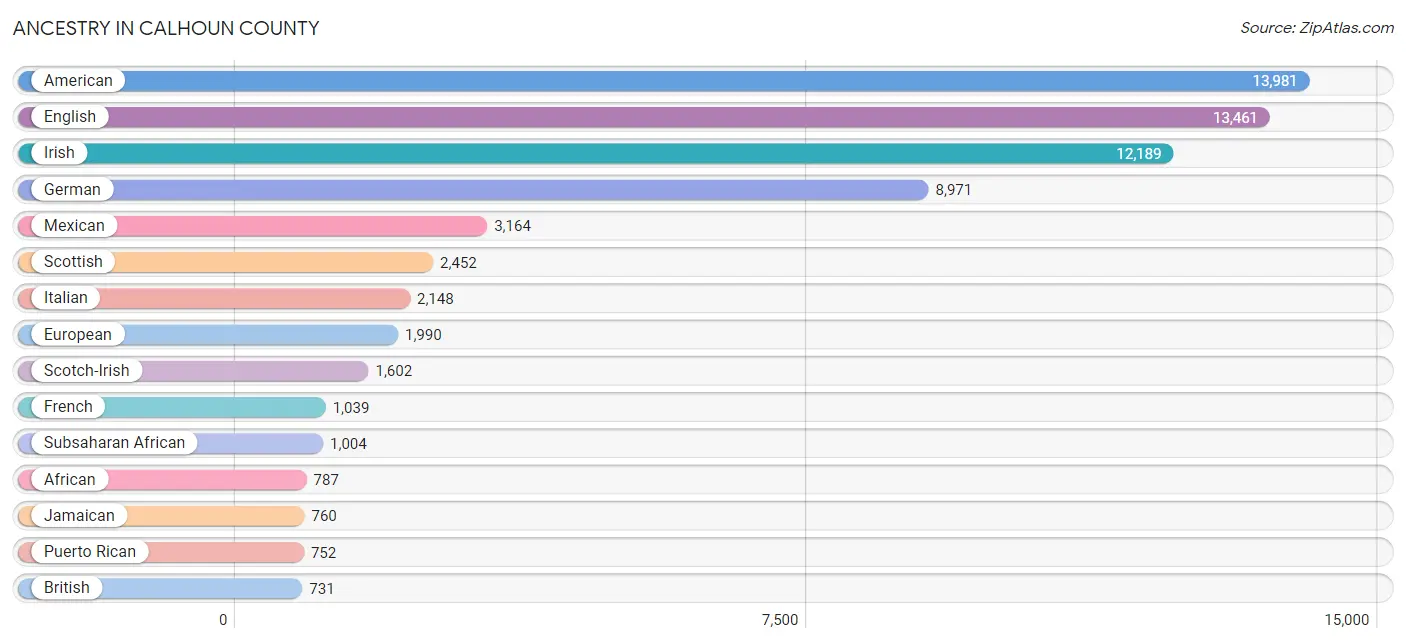
Ancestry in Calhoun County
The most populous ancestries reported in Calhoun County are American (13,981 | 12.0%), English (13,461 | 11.6%), Irish (12,189 | 10.5%), German (8,971 | 7.7%), and Mexican (3,164 | 2.7%), together accounting for 44.6% of all Calhoun County residents.
| Ancestry | # Population | % Population |
| African | 787 | 0.7% |
| American | 13,981 | 12.0% |
| Arab | 189 | 0.2% |
| Australian | 105 | 0.1% |
| Austrian | 23 | 0.0% |
| Barbadian | 8 | 0.0% |
| Belgian | 5 | 0.0% |
| Bhutanese | 117 | 0.1% |
| Blackfeet | 37 | 0.0% |
| British | 731 | 0.6% |
| Burmese | 464 | 0.4% |
| Cajun | 23 | 0.0% |
| Canadian | 233 | 0.2% |
| Central American | 291 | 0.3% |
| Cherokee | 463 | 0.4% |
| Chickasaw | 3 | 0.0% |
| Choctaw | 23 | 0.0% |
| Colombian | 56 | 0.1% |
| Comanche | 4 | 0.0% |
| Creek | 89 | 0.1% |
| Cuban | 108 | 0.1% |
| Czech | 65 | 0.1% |
| Czechoslovakian | 27 | 0.0% |
| Danish | 203 | 0.2% |
| Dominican | 74 | 0.1% |
| Dutch | 639 | 0.5% |
| Dutch West Indian | 3 | 0.0% |
| Eastern European | 78 | 0.1% |
| Egyptian | 47 | 0.0% |
| English | 13,461 | 11.6% |
| Ethiopian | 56 | 0.1% |
| European | 1,990 | 1.7% |
| French | 1,039 | 0.9% |
| French Canadian | 126 | 0.1% |
| German | 8,971 | 7.7% |
| Greek | 143 | 0.1% |
| Guamanian / Chamorro | 183 | 0.2% |
| Guatemalan | 1 | 0.0% |
| Honduran | 157 | 0.1% |
| Hungarian | 25 | 0.0% |
| Indian (Asian) | 183 | 0.2% |
| Iranian | 5 | 0.0% |
| Iraqi | 18 | 0.0% |
| Irish | 12,189 | 10.5% |
| Iroquois | 20 | 0.0% |
| Italian | 2,148 | 1.8% |
| Jamaican | 760 | 0.6% |
| Kenyan | 13 | 0.0% |
| Korean | 358 | 0.3% |
| Laotian | 46 | 0.0% |
| Lebanese | 21 | 0.0% |
| Lithuanian | 9 | 0.0% |
| Macedonian | 55 | 0.1% |
| Malaysian | 56 | 0.1% |
| Mexican | 3,164 | 2.7% |
| Mexican American Indian | 103 | 0.1% |
| Native Hawaiian | 101 | 0.1% |
| Navajo | 8 | 0.0% |
| Nigerian | 52 | 0.0% |
| Northern European | 20 | 0.0% |
| Norwegian | 458 | 0.4% |
| Pakistani | 70 | 0.1% |
| Panamanian | 48 | 0.0% |
| Pennsylvania German | 9 | 0.0% |
| Polish | 367 | 0.3% |
| Portuguese | 8 | 0.0% |
| Puerto Rican | 752 | 0.6% |
| Romanian | 62 | 0.1% |
| Russian | 44 | 0.0% |
| Salvadoran | 85 | 0.1% |
| Scandinavian | 237 | 0.2% |
| Scotch-Irish | 1,602 | 1.4% |
| Scottish | 2,452 | 2.1% |
| Seminole | 26 | 0.0% |
| Sierra Leonean | 83 | 0.1% |
| Slovak | 59 | 0.1% |
| Slovene | 31 | 0.0% |
| South American | 65 | 0.1% |
| Spaniard | 33 | 0.0% |
| Spanish | 42 | 0.0% |
| Sri Lankan | 69 | 0.1% |
| Subsaharan African | 1,004 | 0.9% |
| Swedish | 187 | 0.2% |
| Swiss | 85 | 0.1% |
| Syrian | 95 | 0.1% |
| Thai | 134 | 0.1% |
| Ukrainian | 7 | 0.0% |
| Venezuelan | 9 | 0.0% |
| Vietnamese | 30 | 0.0% |
| Welsh | 574 | 0.5% |
| West Indian | 134 | 0.1% |
| Yugoslavian | 4 | 0.0% | View All 92 Rows |
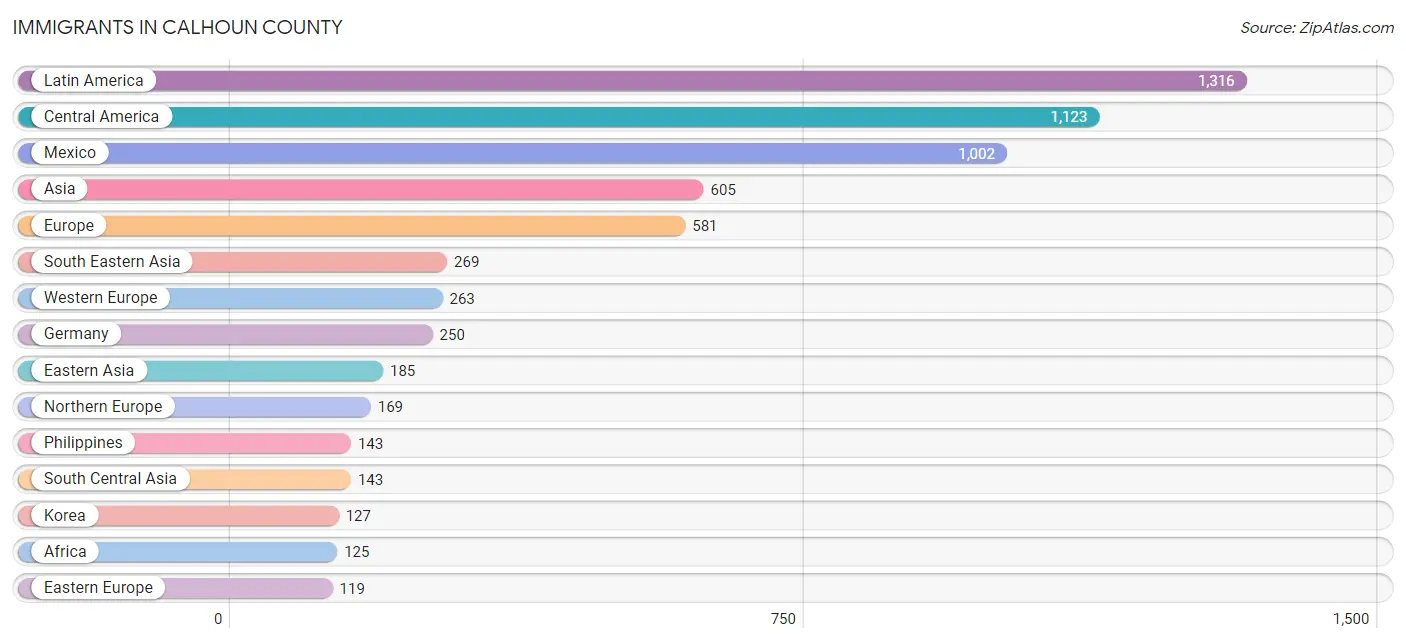
Immigrants in Calhoun County
The most numerous immigrant groups reported in Calhoun County came from Latin America (1,316 | 1.1%), Central America (1,123 | 1.0%), Mexico (1,002 | 0.9%), Asia (605 | 0.5%), and Europe (581 | 0.5%), together accounting for 4.0% of all Calhoun County residents.
| Immigration Origin | # Population | % Population |
| Africa | 125 | 0.1% |
| Asia | 605 | 0.5% |
| Australia | 6 | 0.0% |
| Austria | 13 | 0.0% |
| Bangladesh | 30 | 0.0% |
| Belarus | 11 | 0.0% |
| Brazil | 7 | 0.0% |
| Canada | 65 | 0.1% |
| Caribbean | 95 | 0.1% |
| Central America | 1,123 | 1.0% |
| Chile | 19 | 0.0% |
| China | 11 | 0.0% |
| Colombia | 40 | 0.0% |
| Cuba | 32 | 0.0% |
| Eastern Africa | 29 | 0.0% |
| Eastern Asia | 185 | 0.2% |
| Eastern Europe | 119 | 0.1% |
| El Salvador | 17 | 0.0% |
| England | 9 | 0.0% |
| Europe | 581 | 0.5% |
| Germany | 250 | 0.2% |
| Grenada | 28 | 0.0% |
| Guatemala | 24 | 0.0% |
| Honduras | 74 | 0.1% |
| India | 106 | 0.1% |
| Iraq | 8 | 0.0% |
| Ireland | 8 | 0.0% |
| Italy | 14 | 0.0% |
| Jamaica | 28 | 0.0% |
| Japan | 47 | 0.0% |
| Kenya | 13 | 0.0% |
| Korea | 127 | 0.1% |
| Latin America | 1,316 | 1.1% |
| Mexico | 1,002 | 0.9% |
| Nigeria | 48 | 0.0% |
| North Macedonia | 55 | 0.1% |
| Northern Europe | 169 | 0.2% |
| Oceania | 6 | 0.0% |
| Panama | 6 | 0.0% |
| Peru | 20 | 0.0% |
| Philippines | 143 | 0.1% |
| Romania | 43 | 0.0% |
| Scotland | 22 | 0.0% |
| South America | 98 | 0.1% |
| South Central Asia | 143 | 0.1% |
| South Eastern Asia | 269 | 0.2% |
| Southern Europe | 30 | 0.0% |
| Spain | 16 | 0.0% |
| Taiwan | 1 | 0.0% |
| Thailand | 85 | 0.1% |
| Trinidad and Tobago | 7 | 0.0% |
| Ukraine | 10 | 0.0% |
| Venezuela | 12 | 0.0% |
| Vietnam | 41 | 0.0% |
| Western Africa | 48 | 0.0% |
| Western Asia | 8 | 0.0% |
| Western Europe | 263 | 0.2% |
| Zimbabwe | 16 | 0.0% | View All 58 Rows |
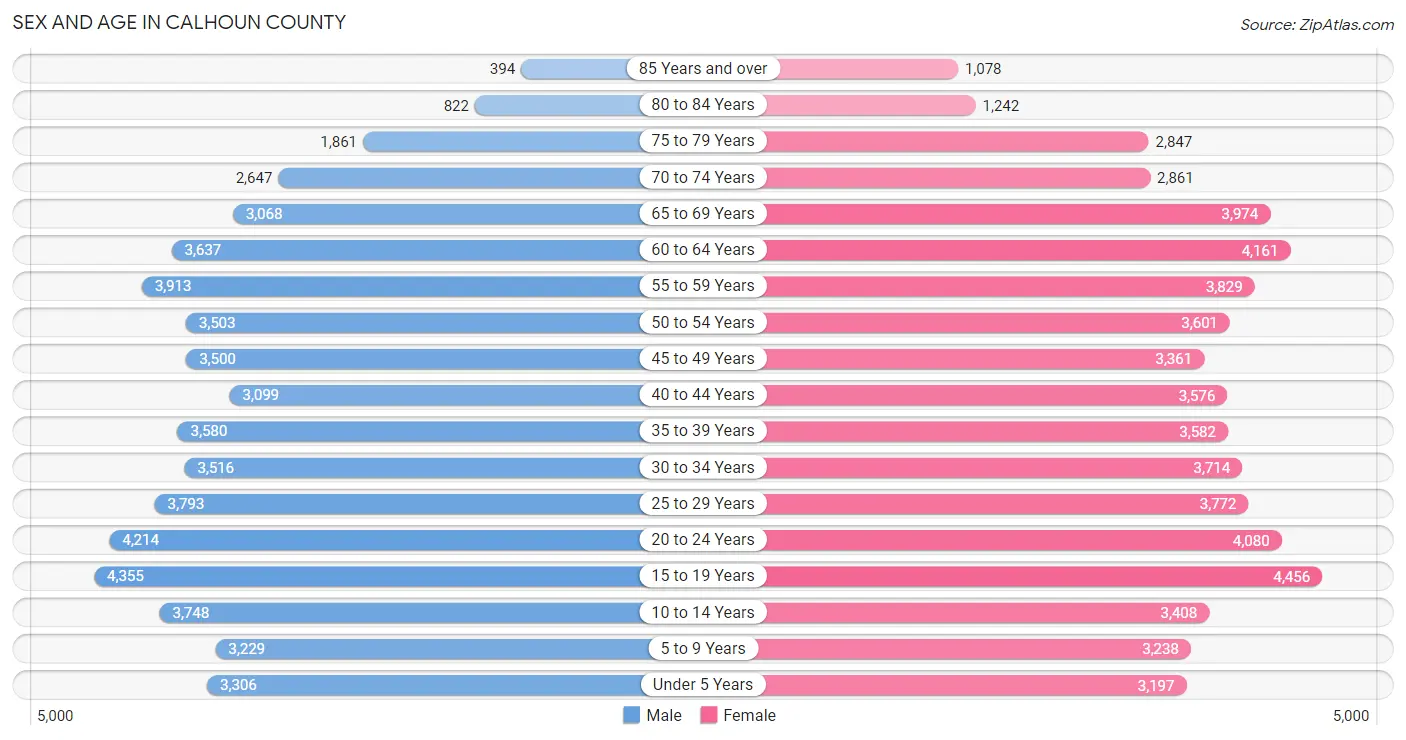
Sex and Age in Calhoun County
Sex and Age in Calhoun County
The most populous age groups in Calhoun County are 15 to 19 Years (4,355 | 7.7%) for men and 15 to 19 Years (4,456 | 7.4%) for women.
| Age Bracket | Male | Female |
| Under 5 Years | 3,306 (5.9%) | 3,197 (5.3%) |
| 5 to 9 Years | 3,229 (5.8%) | 3,238 (5.4%) |
| 10 to 14 Years | 3,748 (6.7%) | 3,408 (5.7%) |
| 15 to 19 Years | 4,355 (7.7%) | 4,456 (7.4%) |
| 20 to 24 Years | 4,214 (7.5%) | 4,080 (6.8%) |
| 25 to 29 Years | 3,793 (6.8%) | 3,772 (6.3%) |
| 30 to 34 Years | 3,516 (6.3%) | 3,714 (6.2%) |
| 35 to 39 Years | 3,580 (6.4%) | 3,582 (6.0%) |
| 40 to 44 Years | 3,099 (5.5%) | 3,576 (6.0%) |
| 45 to 49 Years | 3,500 (6.2%) | 3,361 (5.6%) |
| 50 to 54 Years | 3,503 (6.2%) | 3,601 (6.0%) |
| 55 to 59 Years | 3,913 (7.0%) | 3,829 (6.4%) |
| 60 to 64 Years | 3,637 (6.5%) | 4,161 (6.9%) |
| 65 to 69 Years | 3,068 (5.5%) | 3,974 (6.6%) |
| 70 to 74 Years | 2,647 (4.7%) | 2,861 (4.8%) |
| 75 to 79 Years | 1,861 (3.3%) | 2,847 (4.8%) |
| 80 to 84 Years | 822 (1.5%) | 1,242 (2.1%) |
| 85 Years and over | 394 (0.7%) | 1,078 (1.8%) |
| Total | 56,185 (100.0%) | 59,977 (100.0%) |
Families and Households in Calhoun County
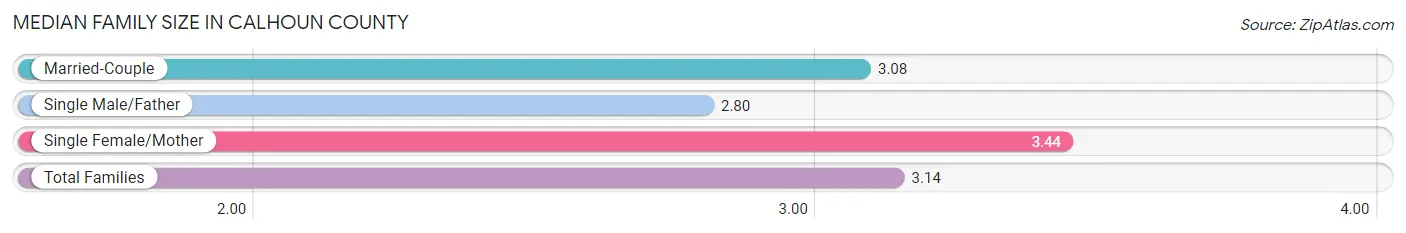
Median Family Size in Calhoun County
The median family size in Calhoun County is 3.14 persons per family, with single female/mother families (6,610 | 23.4%) accounting for the largest median family size of 3.44 persons per family. On the other hand, single male/father families (2,426 | 8.6%) represent the smallest median family size with 2.80 persons per family.
| Family Type | # Families | Family Size |
| Married-Couple | 19,177 (68.0%) | 3.08 |
| Single Male/Father | 2,426 (8.6%) | 2.80 |
| Single Female/Mother | 6,610 (23.4%) | 3.44 |
| Total Families | 28,213 (100.0%) | 3.14 |
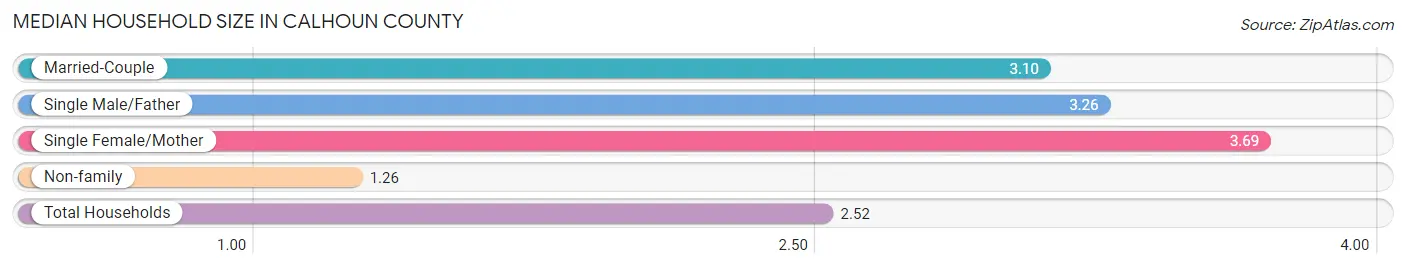
Median Household Size in Calhoun County
The median household size in Calhoun County is 2.52 persons per household, with single female/mother households (6,610 | 14.8%) accounting for the largest median household size of 3.69 persons per household. non-family households (16,480 | 36.9%) represent the smallest median household size with 1.26 persons per household.
| Household Type | # Households | Household Size |
| Married-Couple | 19,177 (42.9%) | 3.10 |
| Single Male/Father | 2,426 (5.4%) | 3.26 |
| Single Female/Mother | 6,610 (14.8%) | 3.69 |
| Non-family | 16,480 (36.9%) | 1.26 |
| Total Households | 44,693 (100.0%) | 2.52 |
Household Size by Marriage Status in Calhoun County
Out of a total of 44,693 households in Calhoun County, 28,213 (63.1%) are family households, while 16,480 (36.9%) are nonfamily households. The most numerous type of family households are 2-person households, comprising 13,306, and the most common type of nonfamily households are 1-person households, comprising 14,103.
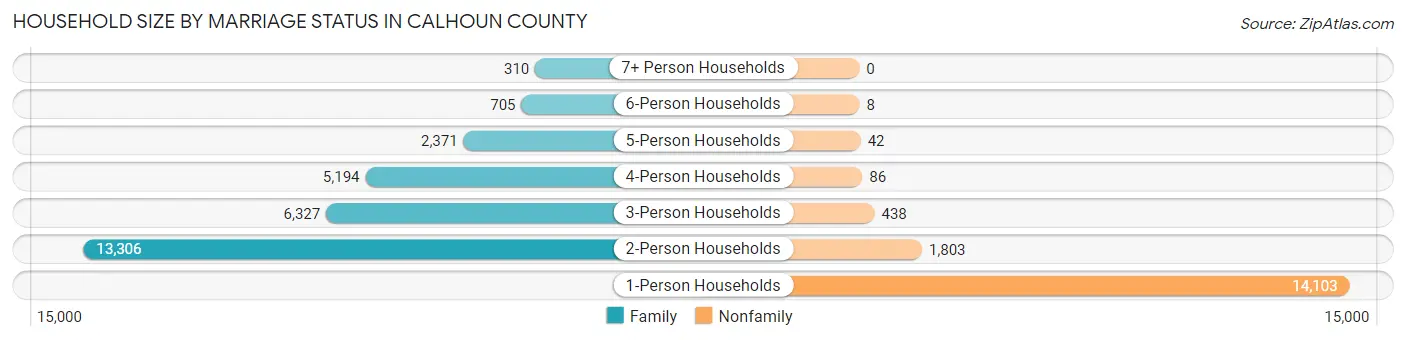
| Household Size | Family Households | Nonfamily Households |
| 1-Person Households | - | 14,103 (31.6%) |
| 2-Person Households | 13,306 (29.8%) | 1,803 (4.0%) |
| 3-Person Households | 6,327 (14.2%) | 438 (1.0%) |
| 4-Person Households | 5,194 (11.6%) | 86 (0.2%) |
| 5-Person Households | 2,371 (5.3%) | 42 (0.1%) |
| 6-Person Households | 705 (1.6%) | 8 (0.0%) |
| 7+ Person Households | 310 (0.7%) | 0 (0.0%) |
| Total | 28,213 (63.1%) | 16,480 (36.9%) |
Female Fertility in Calhoun County
Fertility by Age in Calhoun County
Average fertility rate in Calhoun County is 57.0 births per 1,000 women. Women in the age bracket of 20 to 34 years have the highest fertility rate with 96.0 births per 1,000 women. Women in the age bracket of 20 to 34 years acount for 71.4% of all women with births.
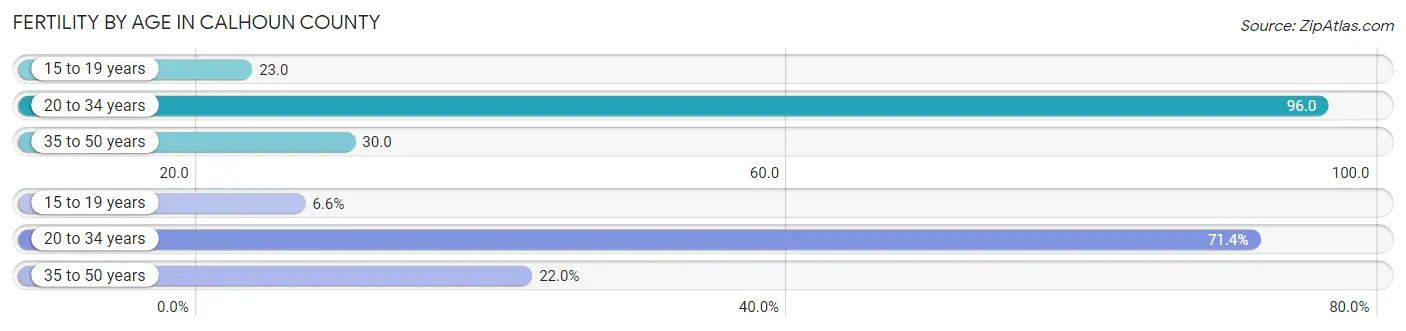
| Age Bracket | Women with Births | Births / 1,000 Women |
| 15 to 19 years | 103 (6.6%) | 23.0 |
| 20 to 34 years | 1,113 (71.4%) | 96.0 |
| 35 to 50 years | 343 (22.0%) | 30.0 |
| Total | 1,559 (100.0%) | 57.0 |
Fertility by Age by Marriage Status in Calhoun County
40.8% of women with births (1,559) in Calhoun County are married. The highest percentage of unmarried women with births falls into 20 to 34 years age bracket with 68.7% of them unmarried at the time of birth, while the lowest percentage of unmarried women with births belong to 15 to 19 years age bracket with 32.0% of them unmarried.
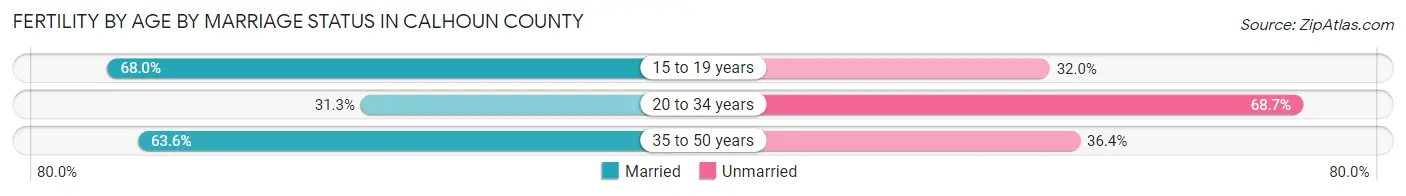
| Age Bracket | Married | Unmarried |
| 15 to 19 years | 70 (68.0%) | 33 (32.0%) |
| 20 to 34 years | 348 (31.3%) | 765 (68.7%) |
| 35 to 50 years | 218 (63.6%) | 125 (36.4%) |
| Total | 636 (40.8%) | 923 (59.2%) |
Fertility by Education in Calhoun County
Average fertility rate in Calhoun County is 57.0 births per 1,000 women. Women with the education attainment of less than high school have the highest fertility rate of 81.0 births per 1,000 women, while women with the education attainment of bachelor's degree have the lowest fertility at 41.0 births per 1,000 women. Women with the education attainment of college or associate's degree represent 33.4% of all women with births.
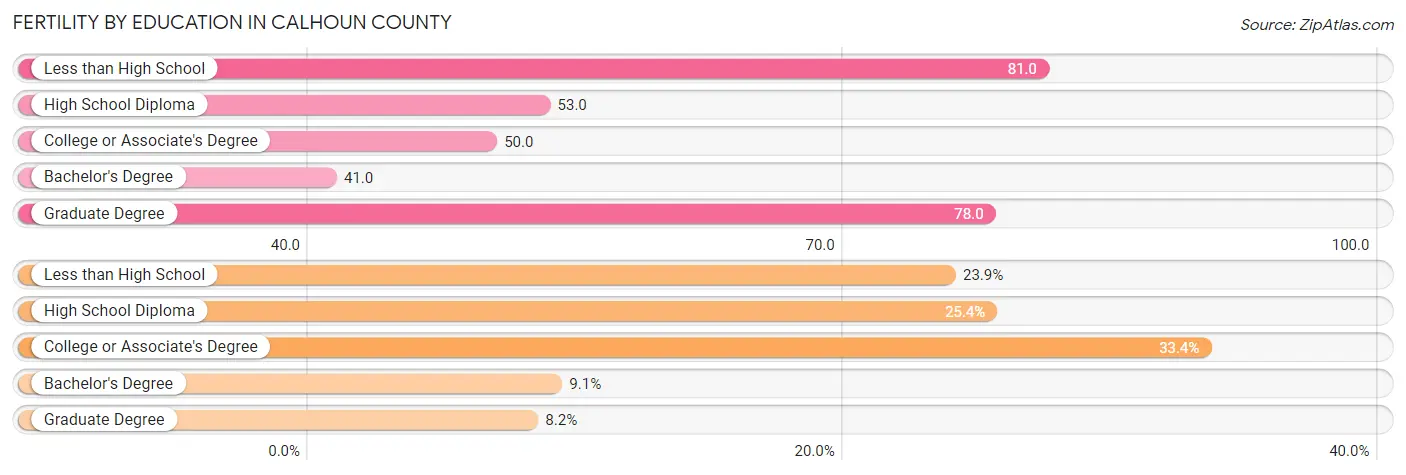
| Educational Attainment | Women with Births | Births / 1,000 Women |
| Less than High School | 372 (23.9%) | 81.0 |
| High School Diploma | 396 (25.4%) | 53.0 |
| College or Associate's Degree | 521 (33.4%) | 50.0 |
| Bachelor's Degree | 142 (9.1%) | 41.0 |
| Graduate Degree | 128 (8.2%) | 78.0 |
| Total | 1,559 (100.0%) | 57.0 |
Fertility by Education by Marriage Status in Calhoun County
59.2% of women with births in Calhoun County are unmarried. Women with the educational attainment of bachelor's degree are most likely to be married with 78.2% of them married at childbirth, while women with the educational attainment of college or associate's degree are least likely to be married with 71.8% of them unmarried at childbirth.
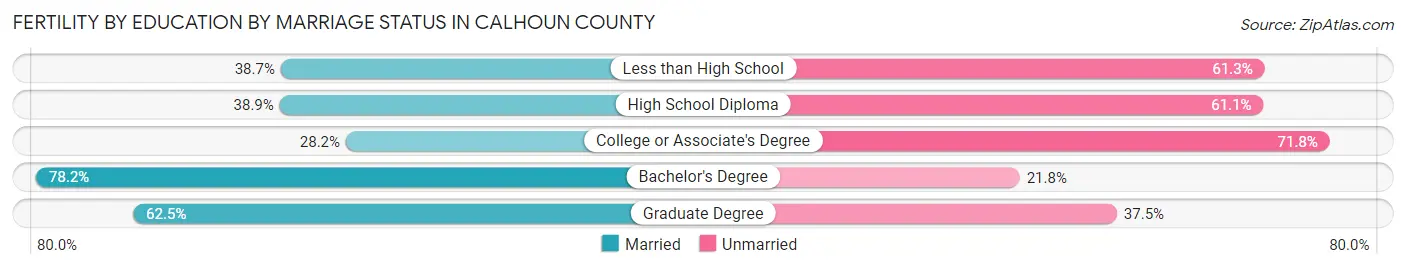
| Educational Attainment | Married | Unmarried |
| Less than High School | 144 (38.7%) | 228 (61.3%) |
| High School Diploma | 154 (38.9%) | 242 (61.1%) |
| College or Associate's Degree | 147 (28.2%) | 374 (71.8%) |
| Bachelor's Degree | 111 (78.2%) | 31 (21.8%) |
| Graduate Degree | 80 (62.5%) | 48 (37.5%) |
| Total | 636 (40.8%) | 923 (59.2%) |
Employment Characteristics in Calhoun County
Employment by Class of Employer in Calhoun County
Among the 48,898 employed individuals in Calhoun County, private company employees (33,499 | 68.5%), local government employees (3,623 | 7.4%), and federal government employees (2,775 | 5.7%) make up the most common classes of employment.
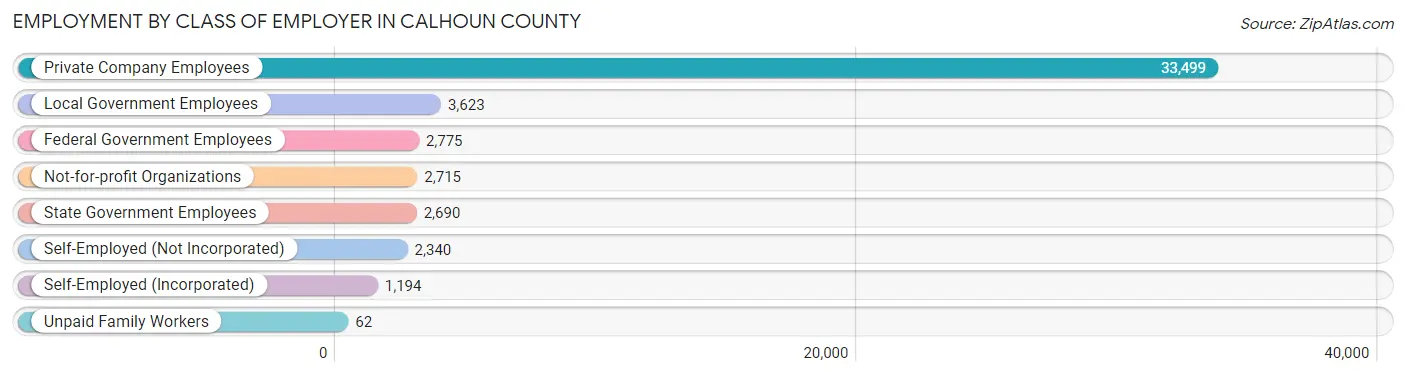
| Employer Class | # Employees | % Employees |
| Private Company Employees | 33,499 | 68.5% |
| Self-Employed (Incorporated) | 1,194 | 2.4% |
| Self-Employed (Not Incorporated) | 2,340 | 4.8% |
| Not-for-profit Organizations | 2,715 | 5.6% |
| Local Government Employees | 3,623 | 7.4% |
| State Government Employees | 2,690 | 5.5% |
| Federal Government Employees | 2,775 | 5.7% |
| Unpaid Family Workers | 62 | 0.1% |
| Total | 48,898 | 100.0% |
Employment Status by Age in Calhoun County
According to the labor force statistics for Calhoun County, out of the total population over 16 years of age (94,627), 56.6% or 53,559 individuals are in the labor force, with 6.9% or 3,696 of them unemployed. The age group with the highest labor force participation rate is 30 to 34 years, with 81.6% or 5,900 individuals in the labor force. Within the labor force, the 16 to 19 years age range has the highest percentage of unemployed individuals, with 21.6% or 667 of them being unemployed.
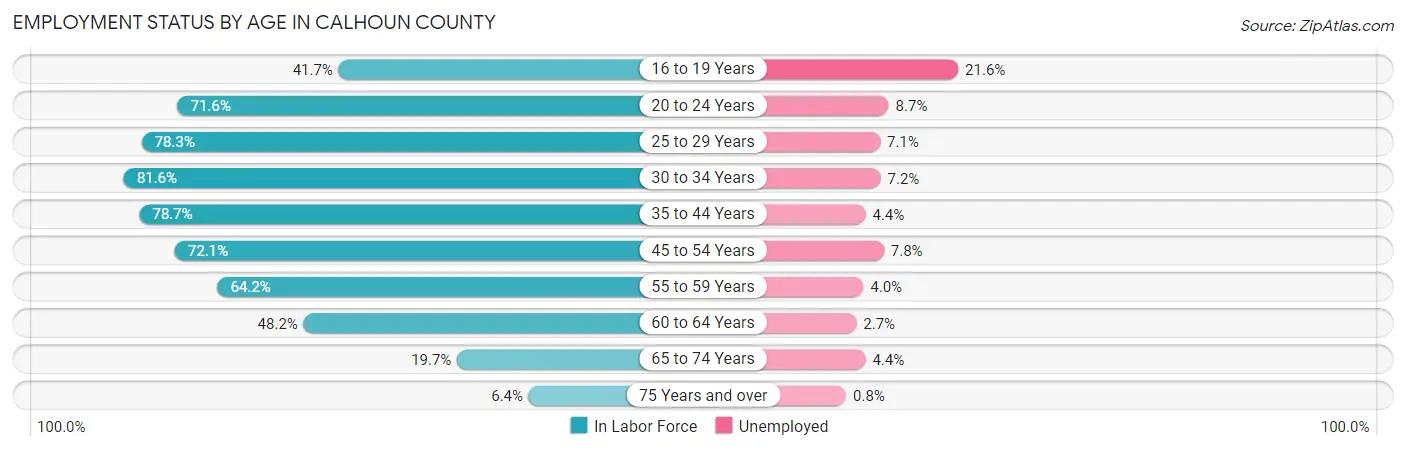
| Age Bracket | In Labor Force | Unemployed |
| 16 to 19 Years | 3,087 (41.7%) | 667 (21.6%) |
| 20 to 24 Years | 5,939 (71.6%) | 517 (8.7%) |
| 25 to 29 Years | 5,923 (78.3%) | 421 (7.1%) |
| 30 to 34 Years | 5,900 (81.6%) | 425 (7.2%) |
| 35 to 44 Years | 10,890 (78.7%) | 479 (4.4%) |
| 45 to 54 Years | 10,069 (72.1%) | 785 (7.8%) |
| 55 to 59 Years | 4,970 (64.2%) | 199 (4.0%) |
| 60 to 64 Years | 3,759 (48.2%) | 101 (2.7%) |
| 65 to 74 Years | 2,472 (19.7%) | 109 (4.4%) |
| 75 Years and over | 528 (6.4%) | 4 (0.8%) |
| Total | 53,559 (56.6%) | 3,696 (6.9%) |
Employment Status by Educational Attainment in Calhoun County
According to labor force statistics for Calhoun County, 71.4% of individuals (41,510) out of the total population between 25 and 64 years of age (58,137) are in the labor force, with 5.8% or 2,408 of them being unemployed. The group with the highest labor force participation rate are those with the educational attainment of bachelor's degree or higher, with 82.8% or 8,834 individuals in the labor force. Within the labor force, individuals with less than high school education have the highest percentage of unemployment, with 16.2% or 716 of them being unemployed.
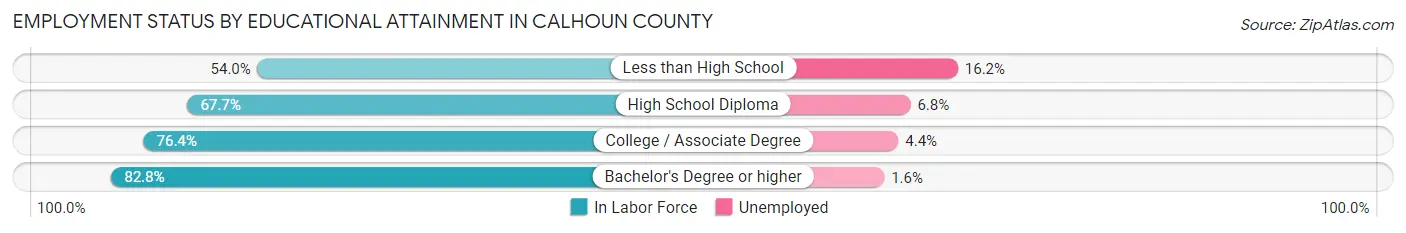
| Educational Attainment | In Labor Force | Unemployed |
| Less than High School | 4,420 (54.0%) | 1,326 (16.2%) |
| High School Diploma | 13,663 (67.7%) | 1,372 (6.8%) |
| College / Associate Degree | 14,593 (76.4%) | 840 (4.4%) |
| Bachelor's Degree or higher | 8,834 (82.8%) | 171 (1.6%) |
| Total | 41,510 (71.4%) | 3,372 (5.8%) |
Employment Occupations by Sex in Calhoun County
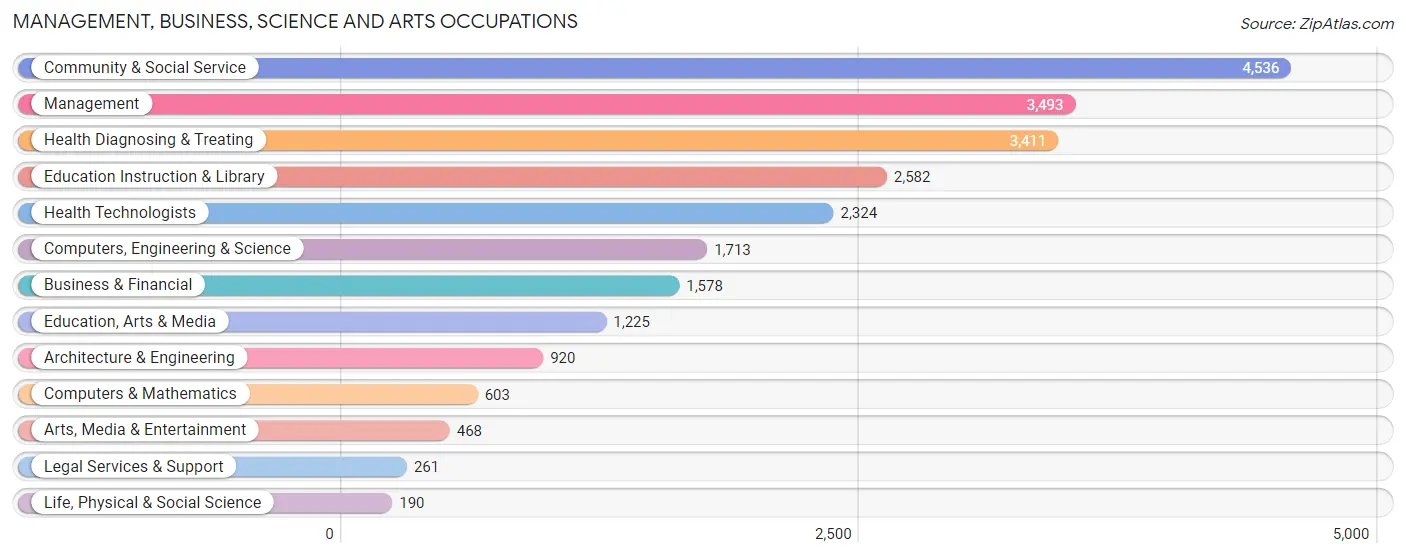
Management, Business, Science and Arts Occupations
The most common Management, Business, Science and Arts occupations in Calhoun County are Community & Social Service (4,536 | 9.2%), Management (3,493 | 7.1%), Health Diagnosing & Treating (3,411 | 6.9%), Education Instruction & Library (2,582 | 5.2%), and Health Technologists (2,324 | 4.7%).
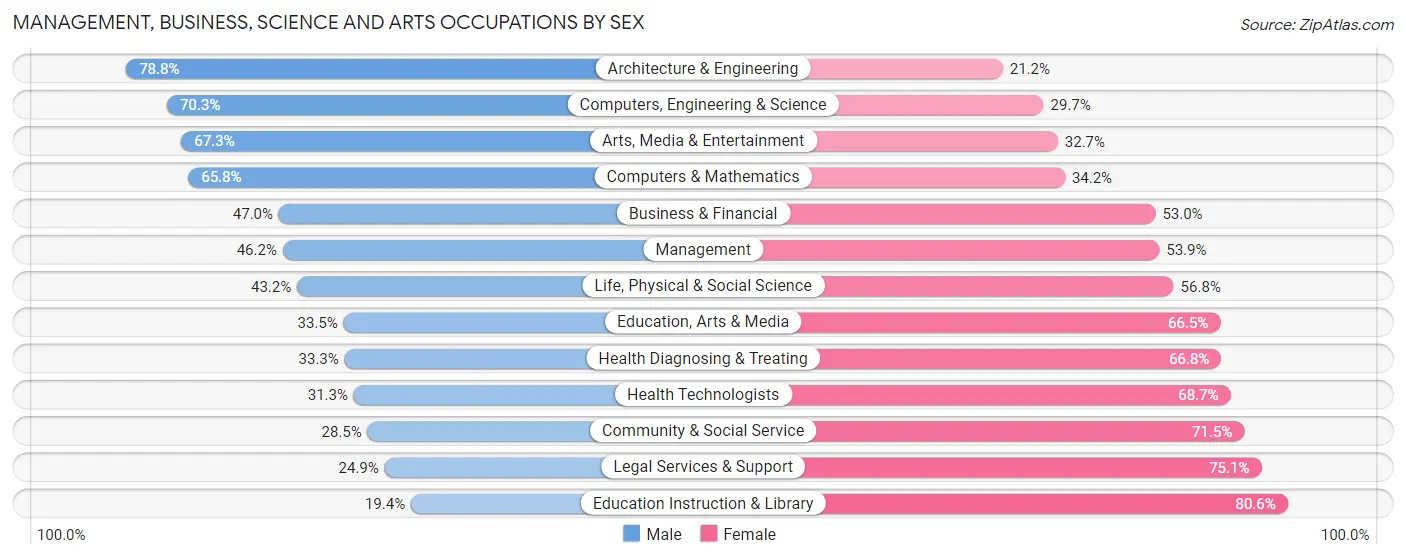
Management, Business, Science and Arts Occupations by Sex
Within the Management, Business, Science and Arts occupations in Calhoun County, the most male-oriented occupations are Architecture & Engineering (78.8%), Computers, Engineering & Science (70.3%), and Arts, Media & Entertainment (67.3%), while the most female-oriented occupations are Education Instruction & Library (80.6%), Legal Services & Support (75.1%), and Community & Social Service (71.5%).
| Occupation | Male | Female |
| Management | 1,612 (46.2%) | 1,881 (53.8%) |
| Business & Financial | 741 (47.0%) | 837 (53.0%) |
| Computers, Engineering & Science | 1,204 (70.3%) | 509 (29.7%) |
| Computers & Mathematics | 397 (65.8%) | 206 (34.2%) |
| Architecture & Engineering | 725 (78.8%) | 195 (21.2%) |
| Life, Physical & Social Science | 82 (43.2%) | 108 (56.8%) |
| Community & Social Service | 1,291 (28.5%) | 3,245 (71.5%) |
| Education, Arts & Media | 410 (33.5%) | 815 (66.5%) |
| Legal Services & Support | 65 (24.9%) | 196 (75.1%) |
| Education Instruction & Library | 501 (19.4%) | 2,081 (80.6%) |
| Arts, Media & Entertainment | 315 (67.3%) | 153 (32.7%) |
| Health Diagnosing & Treating | 1,134 (33.3%) | 2,277 (66.7%) |
| Health Technologists | 728 (31.3%) | 1,596 (68.7%) |
| Total (Category) | 5,982 (40.6%) | 8,749 (59.4%) |
| Total (Overall) | 26,192 (53.0%) | 23,263 (47.0%) |
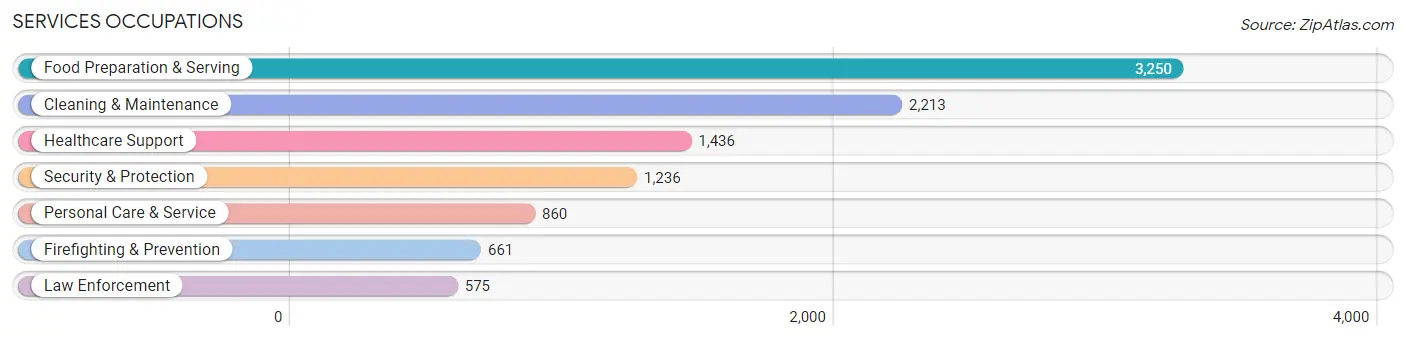
Services Occupations
The most common Services occupations in Calhoun County are Food Preparation & Serving (3,250 | 6.6%), Cleaning & Maintenance (2,213 | 4.5%), Healthcare Support (1,436 | 2.9%), Security & Protection (1,236 | 2.5%), and Personal Care & Service (860 | 1.7%).
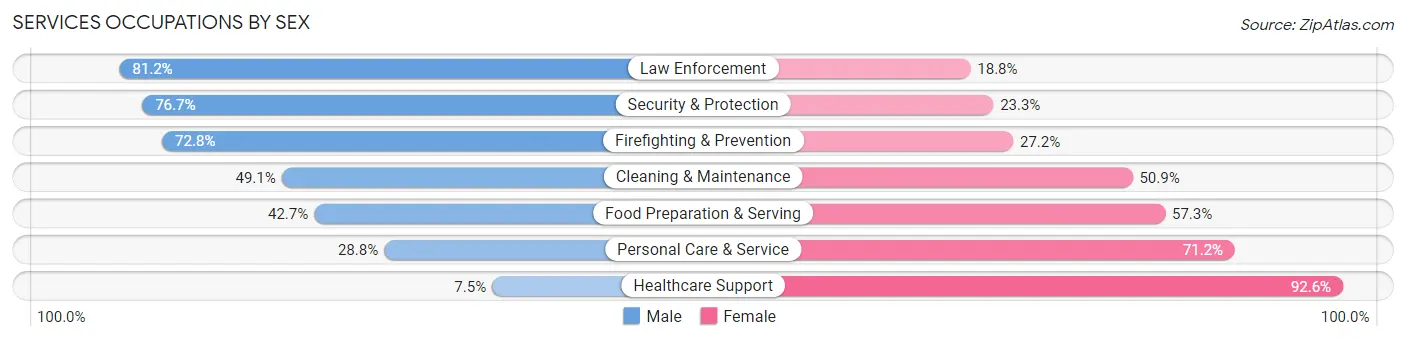
Services Occupations by Sex
Within the Services occupations in Calhoun County, the most male-oriented occupations are Law Enforcement (81.2%), Security & Protection (76.7%), and Firefighting & Prevention (72.8%), while the most female-oriented occupations are Healthcare Support (92.5%), Personal Care & Service (71.2%), and Food Preparation & Serving (57.3%).
| Occupation | Male | Female |
| Healthcare Support | 107 (7.4%) | 1,329 (92.5%) |
| Security & Protection | 948 (76.7%) | 288 (23.3%) |
| Firefighting & Prevention | 481 (72.8%) | 180 (27.2%) |
| Law Enforcement | 467 (81.2%) | 108 (18.8%) |
| Food Preparation & Serving | 1,387 (42.7%) | 1,863 (57.3%) |
| Cleaning & Maintenance | 1,087 (49.1%) | 1,126 (50.9%) |
| Personal Care & Service | 248 (28.8%) | 612 (71.2%) |
| Total (Category) | 3,777 (42.0%) | 5,218 (58.0%) |
| Total (Overall) | 26,192 (53.0%) | 23,263 (47.0%) |
Sales and Office Occupations
The most common Sales and Office occupations in Calhoun County are Office & Administration (5,418 | 11.0%), and Sales & Related (4,970 | 10.1%).

Sales and Office Occupations by Sex

| Occupation | Male | Female |
| Sales & Related | 2,568 (51.7%) | 2,402 (48.3%) |
| Office & Administration | 865 (16.0%) | 4,553 (84.0%) |
| Total (Category) | 3,433 (33.1%) | 6,955 (66.9%) |
| Total (Overall) | 26,192 (53.0%) | 23,263 (47.0%) |
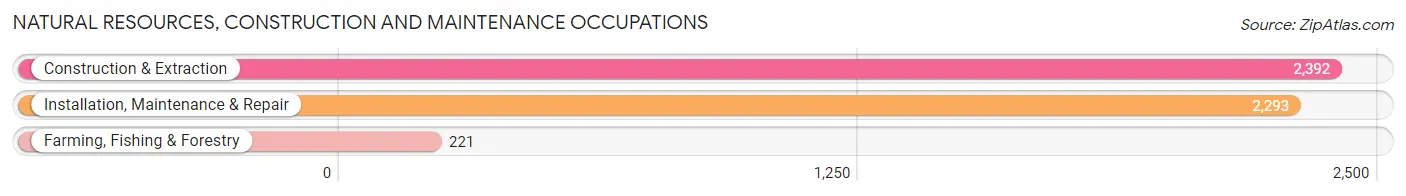
Natural Resources, Construction and Maintenance Occupations
The most common Natural Resources, Construction and Maintenance occupations in Calhoun County are Construction & Extraction (2,392 | 4.8%), Installation, Maintenance & Repair (2,293 | 4.6%), and Farming, Fishing & Forestry (221 | 0.4%).
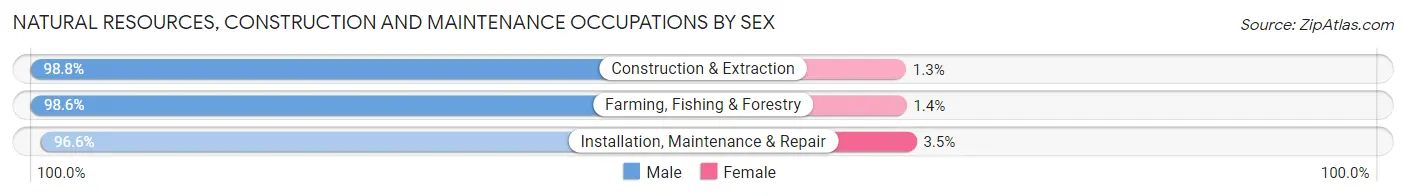
Natural Resources, Construction and Maintenance Occupations by Sex
| Occupation | Male | Female |
| Farming, Fishing & Forestry | 218 (98.6%) | 3 (1.4%) |
| Construction & Extraction | 2,362 (98.8%) | 30 (1.3%) |
| Installation, Maintenance & Repair | 2,214 (96.6%) | 79 (3.5%) |
| Total (Category) | 4,794 (97.7%) | 112 (2.3%) |
| Total (Overall) | 26,192 (53.0%) | 23,263 (47.0%) |
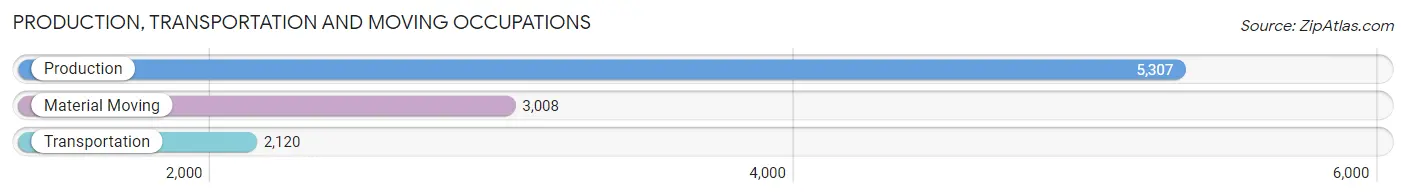
Production, Transportation and Moving Occupations
The most common Production, Transportation and Moving occupations in Calhoun County are Production (5,307 | 10.7%), Material Moving (3,008 | 6.1%), and Transportation (2,120 | 4.3%).
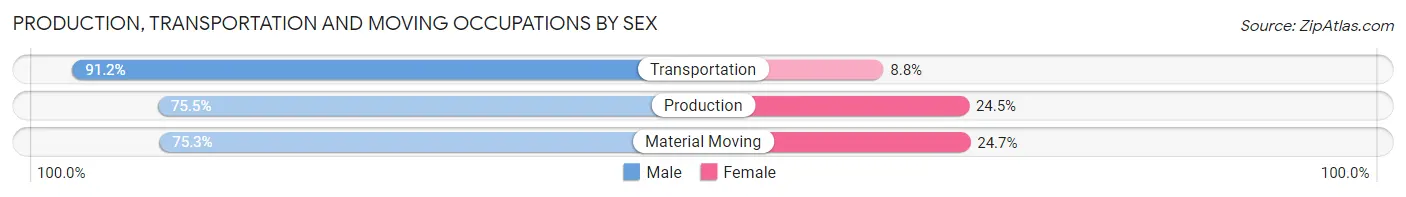
Production, Transportation and Moving Occupations by Sex
| Occupation | Male | Female |
| Production | 4,008 (75.5%) | 1,299 (24.5%) |
| Transportation | 1,934 (91.2%) | 186 (8.8%) |
| Material Moving | 2,264 (75.3%) | 744 (24.7%) |
| Total (Category) | 8,206 (78.6%) | 2,229 (21.4%) |
| Total (Overall) | 26,192 (53.0%) | 23,263 (47.0%) |
Employment Industries by Sex in Calhoun County
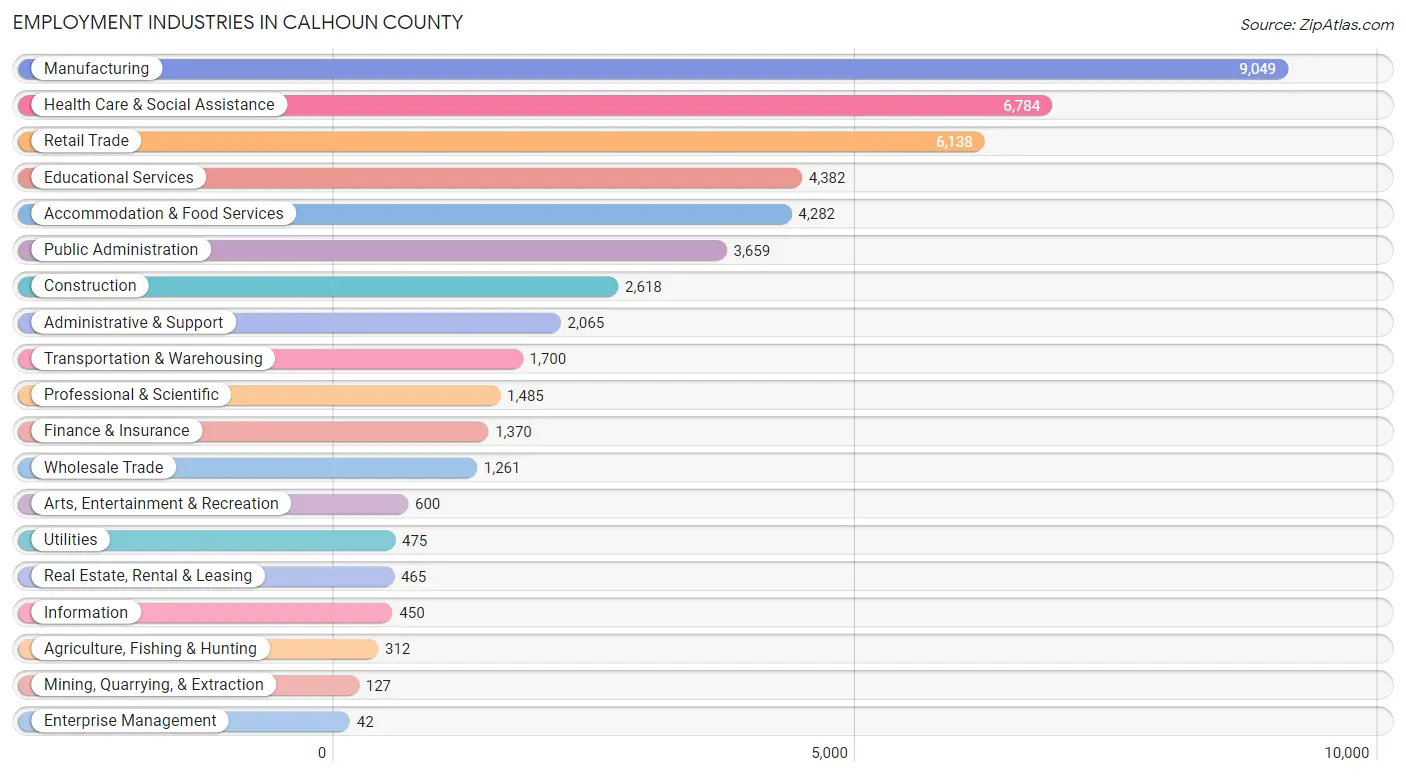
Employment Industries in Calhoun County
The major employment industries in Calhoun County include Manufacturing (9,049 | 18.3%), Health Care & Social Assistance (6,784 | 13.7%), Retail Trade (6,138 | 12.4%), Educational Services (4,382 | 8.9%), and Accommodation & Food Services (4,282 | 8.7%).
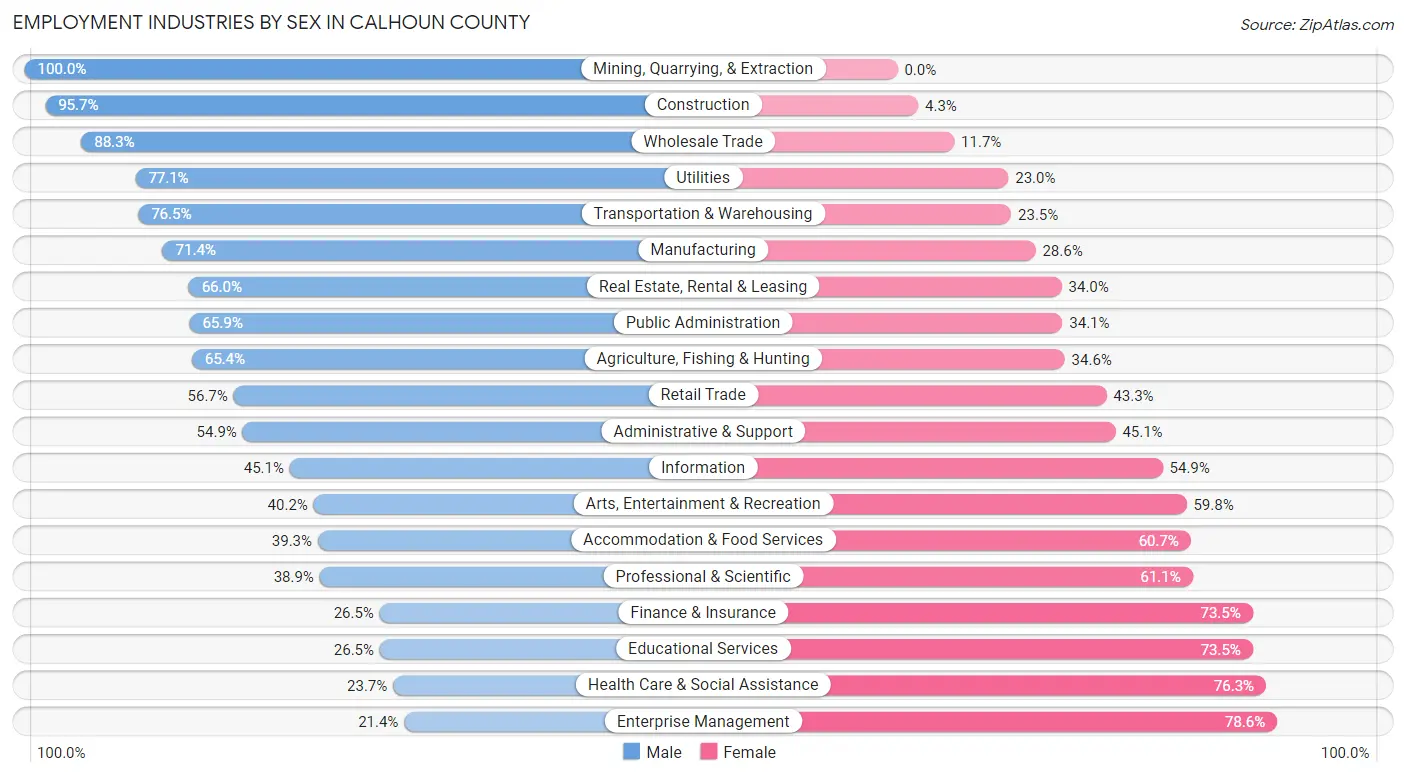
Employment Industries by Sex in Calhoun County
The Calhoun County industries that see more men than women are Mining, Quarrying, & Extraction (100.0%), Construction (95.7%), and Wholesale Trade (88.3%), whereas the industries that tend to have a higher number of women are Enterprise Management (78.6%), Health Care & Social Assistance (76.3%), and Educational Services (73.5%).
| Industry | Male | Female |
| Agriculture, Fishing & Hunting | 204 (65.4%) | 108 (34.6%) |
| Mining, Quarrying, & Extraction | 127 (100.0%) | 0 (0.0%) |
| Construction | 2,506 (95.7%) | 112 (4.3%) |
| Manufacturing | 6,463 (71.4%) | 2,586 (28.6%) |
| Wholesale Trade | 1,113 (88.3%) | 148 (11.7%) |
| Retail Trade | 3,483 (56.7%) | 2,655 (43.3%) |
| Transportation & Warehousing | 1,300 (76.5%) | 400 (23.5%) |
| Utilities | 366 (77.0%) | 109 (23.0%) |
| Information | 203 (45.1%) | 247 (54.9%) |
| Finance & Insurance | 363 (26.5%) | 1,007 (73.5%) |
| Real Estate, Rental & Leasing | 307 (66.0%) | 158 (34.0%) |
| Professional & Scientific | 578 (38.9%) | 907 (61.1%) |
| Enterprise Management | 9 (21.4%) | 33 (78.6%) |
| Administrative & Support | 1,133 (54.9%) | 932 (45.1%) |
| Educational Services | 1,160 (26.5%) | 3,222 (73.5%) |
| Health Care & Social Assistance | 1,610 (23.7%) | 5,174 (76.3%) |
| Arts, Entertainment & Recreation | 241 (40.2%) | 359 (59.8%) |
| Accommodation & Food Services | 1,683 (39.3%) | 2,599 (60.7%) |
| Public Administration | 2,410 (65.9%) | 1,249 (34.1%) |
| Total | 26,192 (53.0%) | 23,263 (47.0%) |
Education in Calhoun County
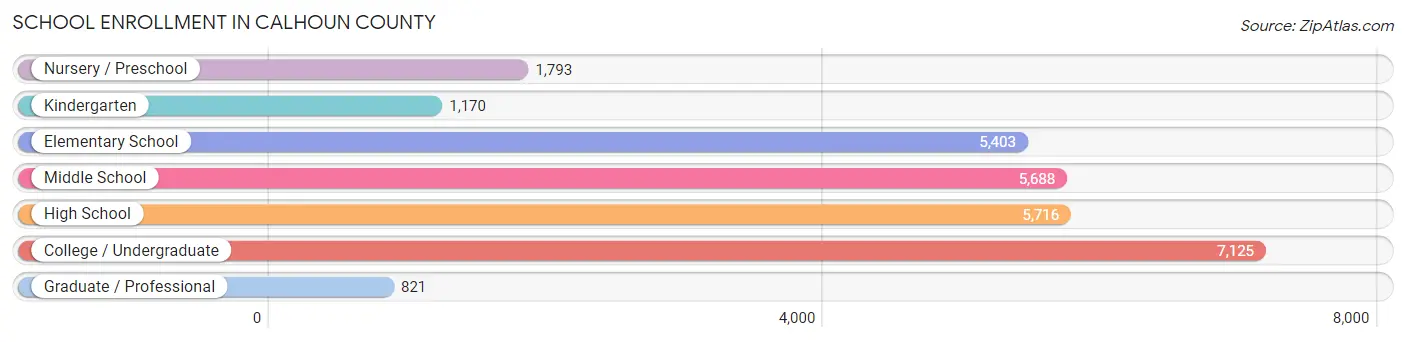
School Enrollment in Calhoun County
The most common levels of schooling among the 27,716 students in Calhoun County are college / undergraduate (7,125 | 25.7%), high school (5,716 | 20.6%), and middle school (5,688 | 20.5%).
| School Level | # Students | % Students |
| Nursery / Preschool | 1,793 | 6.5% |
| Kindergarten | 1,170 | 4.2% |
| Elementary School | 5,403 | 19.5% |
| Middle School | 5,688 | 20.5% |
| High School | 5,716 | 20.6% |
| College / Undergraduate | 7,125 | 25.7% |
| Graduate / Professional | 821 | 3.0% |
| Total | 27,716 | 100.0% |
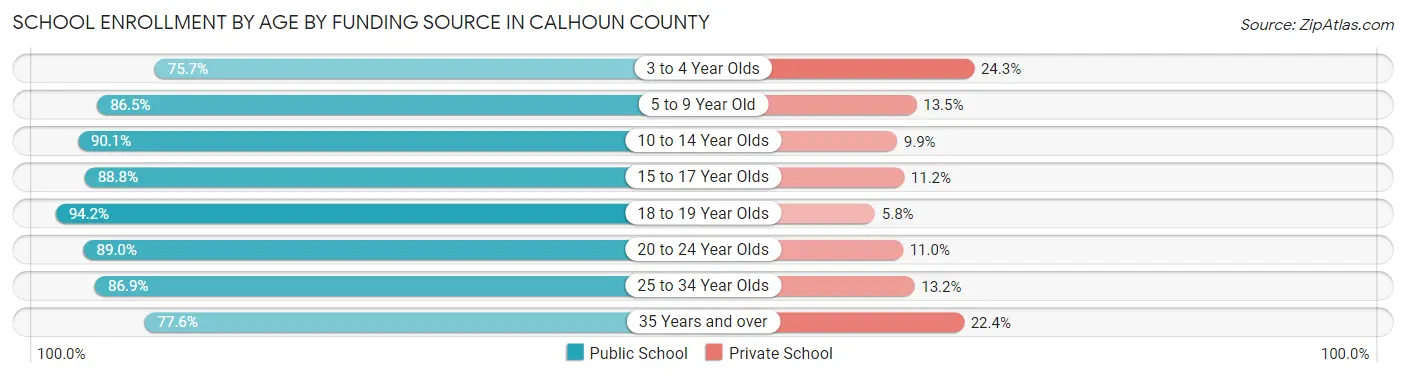
School Enrollment by Age by Funding Source in Calhoun County
Out of a total of 27,716 students who are enrolled in schools in Calhoun County, 3,298 (11.9%) attend a private institution, while the remaining 24,418 (88.1%) are enrolled in public schools. The age group of 3 to 4 year olds has the highest likelihood of being enrolled in private schools, with 341 (24.3% in the age bracket) enrolled. Conversely, the age group of 18 to 19 year olds has the lowest likelihood of being enrolled in a private school, with 2,826 (94.2% in the age bracket) attending a public institution.
| Age Bracket | Public School | Private School |
| 3 to 4 Year Olds | 1,064 (75.7%) | 341 (24.3%) |
| 5 to 9 Year Old | 5,209 (86.5%) | 815 (13.5%) |
| 10 to 14 Year Olds | 6,382 (90.1%) | 702 (9.9%) |
| 15 to 17 Year Olds | 3,880 (88.8%) | 490 (11.2%) |
| 18 to 19 Year Olds | 2,826 (94.2%) | 174 (5.8%) |
| 20 to 24 Year Olds | 3,165 (89.0%) | 391 (11.0%) |
| 25 to 34 Year Olds | 1,189 (86.9%) | 180 (13.2%) |
| 35 Years and over | 705 (77.6%) | 203 (22.4%) |
| Total | 24,418 (88.1%) | 3,298 (11.9%) |
Educational Attainment by Field of Study in Calhoun County
Education (3,212 | 20.1%), business (3,154 | 19.7%), science & technology (2,321 | 14.5%), arts & humanities (1,655 | 10.3%), and bio, nature & agricultural (955 | 6.0%) are the most common fields of study among 16,021 individuals in Calhoun County who have obtained a bachelor's degree or higher.
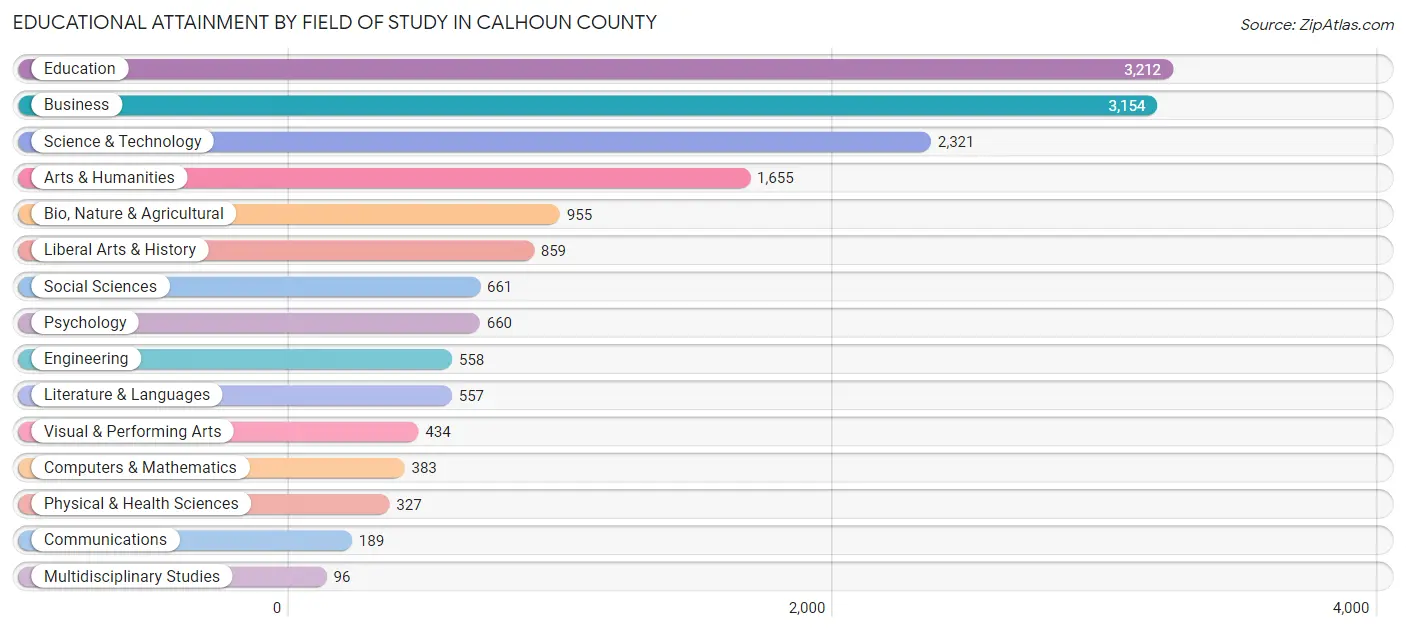
| Field of Study | # Graduates | % Graduates |
| Computers & Mathematics | 383 | 2.4% |
| Bio, Nature & Agricultural | 955 | 6.0% |
| Physical & Health Sciences | 327 | 2.0% |
| Psychology | 660 | 4.1% |
| Social Sciences | 661 | 4.1% |
| Engineering | 558 | 3.5% |
| Multidisciplinary Studies | 96 | 0.6% |
| Science & Technology | 2,321 | 14.5% |
| Business | 3,154 | 19.7% |
| Education | 3,212 | 20.1% |
| Literature & Languages | 557 | 3.5% |
| Liberal Arts & History | 859 | 5.4% |
| Visual & Performing Arts | 434 | 2.7% |
| Communications | 189 | 1.2% |
| Arts & Humanities | 1,655 | 10.3% |
| Total | 16,021 | 100.0% |
Transportation & Commute in Calhoun County
Vehicle Availability by Sex in Calhoun County
The most prevalent vehicle ownership categories in Calhoun County are males with 2 vehicles (10,248, accounting for 39.7%) and females with 2 vehicles (8,673, making up 45.9%).
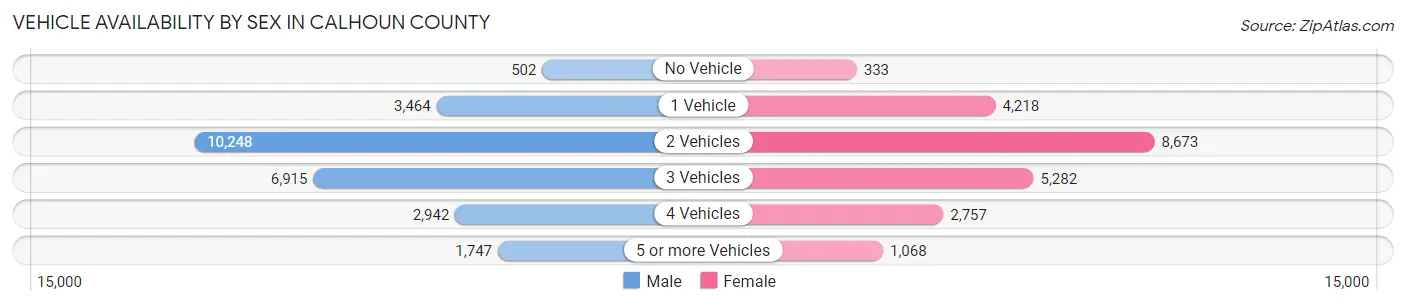
| Vehicles Available | Male | Female |
| No Vehicle | 502 (1.9%) | 333 (1.5%) |
| 1 Vehicle | 3,464 (13.4%) | 4,218 (18.9%) |
| 2 Vehicles | 10,248 (39.7%) | 8,673 (38.8%) |
| 3 Vehicles | 6,915 (26.8%) | 5,282 (23.6%) |
| 4 Vehicles | 2,942 (11.4%) | 2,757 (12.3%) |
| 5 or more Vehicles | 1,747 (6.8%) | 1,068 (4.8%) |
| Total | 25,818 (100.0%) | 22,331 (100.0%) |
Commute Time in Calhoun County
The most frequently occuring commute durations in Calhoun County are 15 to 19 minutes (9,457 commuters, 20.0%), 20 to 24 minutes (6,417 commuters, 13.6%), and 10 to 14 minutes (6,169 commuters, 13.0%).
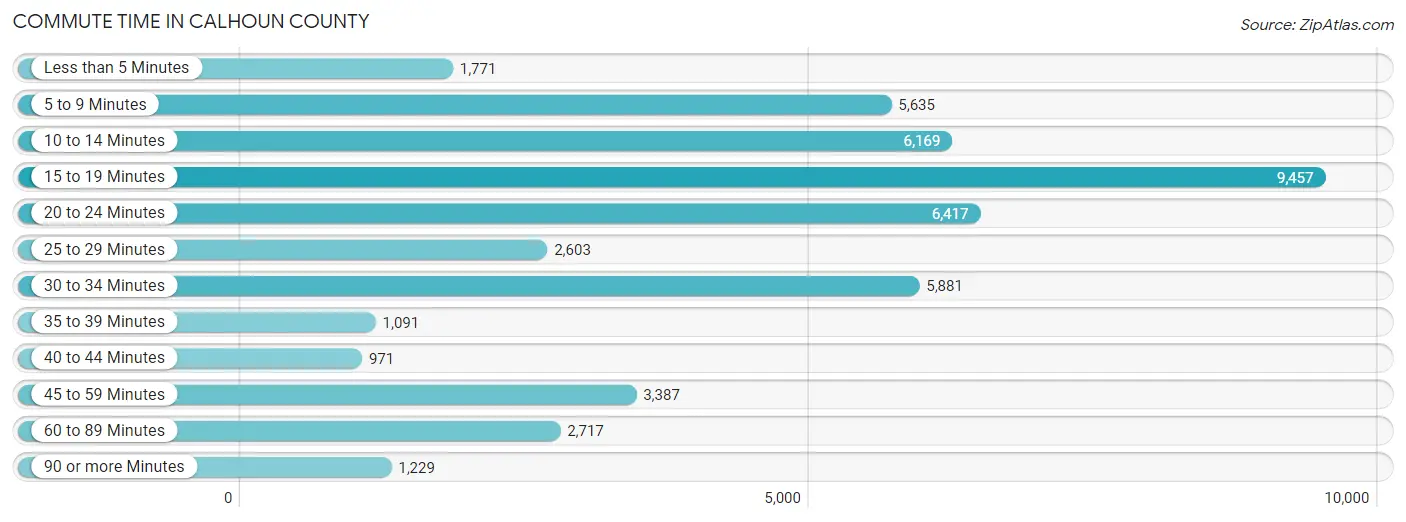
| Commute Time | # Commuters | % Commuters |
| Less than 5 Minutes | 1,771 | 3.7% |
| 5 to 9 Minutes | 5,635 | 11.9% |
| 10 to 14 Minutes | 6,169 | 13.0% |
| 15 to 19 Minutes | 9,457 | 20.0% |
| 20 to 24 Minutes | 6,417 | 13.6% |
| 25 to 29 Minutes | 2,603 | 5.5% |
| 30 to 34 Minutes | 5,881 | 12.4% |
| 35 to 39 Minutes | 1,091 | 2.3% |
| 40 to 44 Minutes | 971 | 2.1% |
| 45 to 59 Minutes | 3,387 | 7.2% |
| 60 to 89 Minutes | 2,717 | 5.7% |
| 90 or more Minutes | 1,229 | 2.6% |
Commute Time by Sex in Calhoun County
The most common commute times in Calhoun County are 15 to 19 minutes (4,567 commuters, 17.8%) for males and 15 to 19 minutes (4,890 commuters, 22.6%) for females.
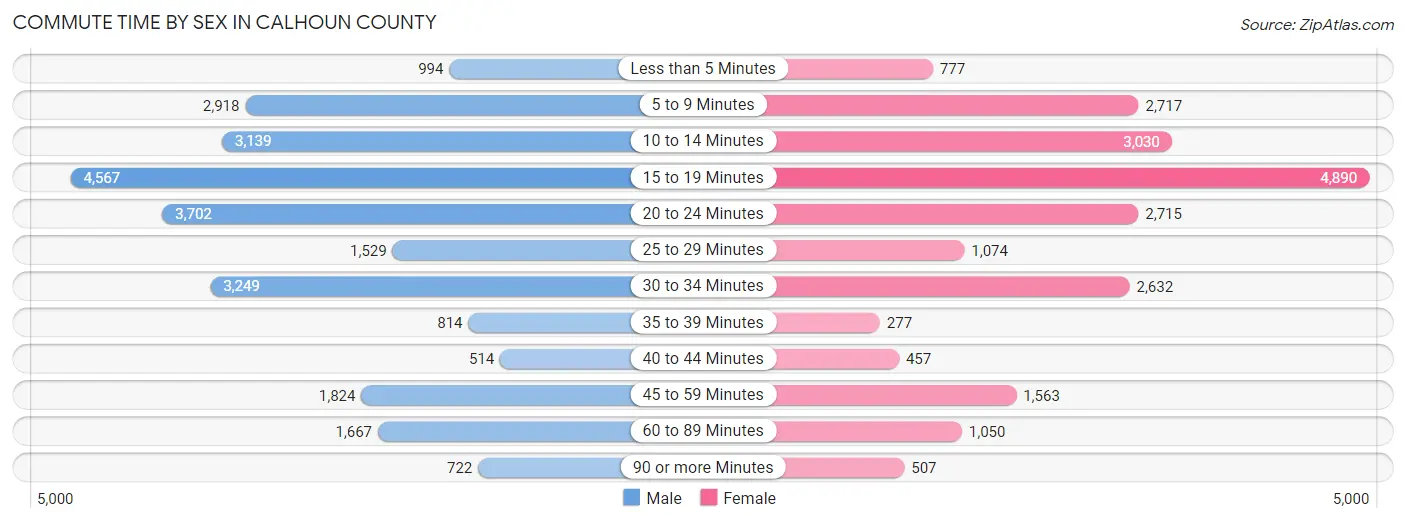
| Commute Time | Male | Female |
| Less than 5 Minutes | 994 (3.9%) | 777 (3.6%) |
| 5 to 9 Minutes | 2,918 (11.4%) | 2,717 (12.5%) |
| 10 to 14 Minutes | 3,139 (12.2%) | 3,030 (14.0%) |
| 15 to 19 Minutes | 4,567 (17.8%) | 4,890 (22.6%) |
| 20 to 24 Minutes | 3,702 (14.4%) | 2,715 (12.5%) |
| 25 to 29 Minutes | 1,529 (6.0%) | 1,074 (5.0%) |
| 30 to 34 Minutes | 3,249 (12.7%) | 2,632 (12.1%) |
| 35 to 39 Minutes | 814 (3.2%) | 277 (1.3%) |
| 40 to 44 Minutes | 514 (2.0%) | 457 (2.1%) |
| 45 to 59 Minutes | 1,824 (7.1%) | 1,563 (7.2%) |
| 60 to 89 Minutes | 1,667 (6.5%) | 1,050 (4.8%) |
| 90 or more Minutes | 722 (2.8%) | 507 (2.3%) |
Time of Departure to Work by Sex in Calhoun County
The most frequent times of departure to work in Calhoun County are 12:00 AM to 4:59 AM (3,337, 13.0%) for males and 7:00 AM to 7:29 AM (3,236, 14.9%) for females.
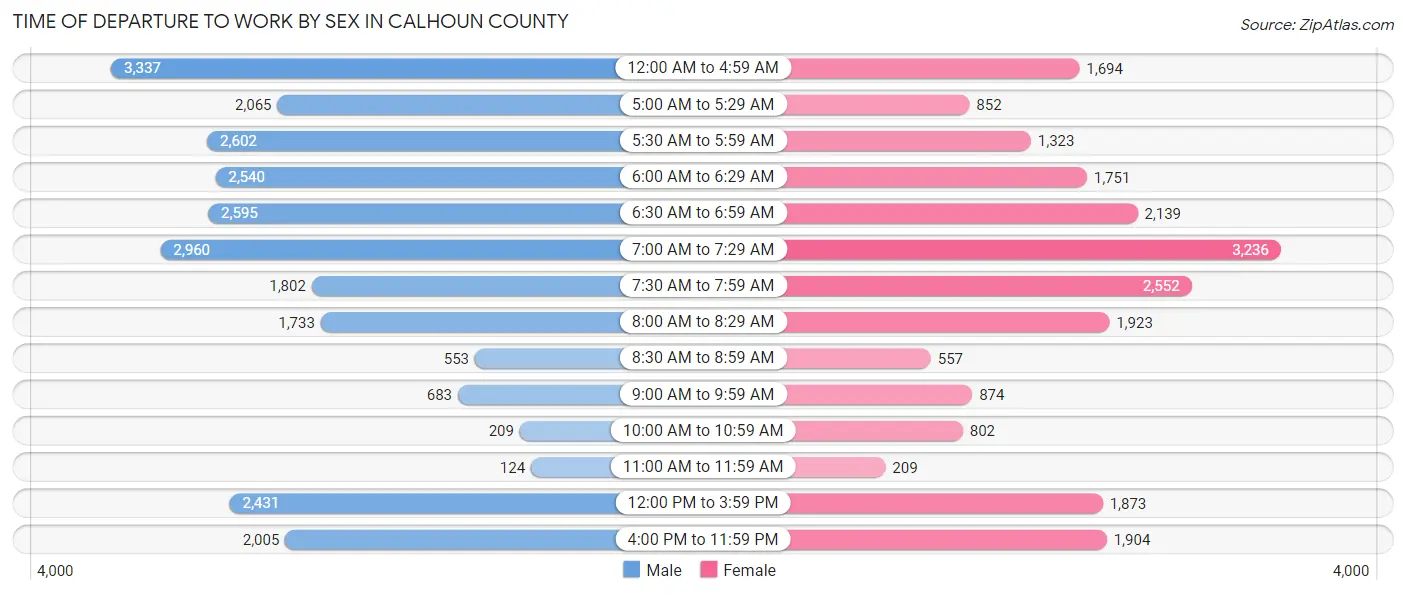
| Time of Departure | Male | Female |
| 12:00 AM to 4:59 AM | 3,337 (13.0%) | 1,694 (7.8%) |
| 5:00 AM to 5:29 AM | 2,065 (8.1%) | 852 (3.9%) |
| 5:30 AM to 5:59 AM | 2,602 (10.2%) | 1,323 (6.1%) |
| 6:00 AM to 6:29 AM | 2,540 (9.9%) | 1,751 (8.1%) |
| 6:30 AM to 6:59 AM | 2,595 (10.1%) | 2,139 (9.9%) |
| 7:00 AM to 7:29 AM | 2,960 (11.5%) | 3,236 (14.9%) |
| 7:30 AM to 7:59 AM | 1,802 (7.0%) | 2,552 (11.8%) |
| 8:00 AM to 8:29 AM | 1,733 (6.8%) | 1,923 (8.9%) |
| 8:30 AM to 8:59 AM | 553 (2.2%) | 557 (2.6%) |
| 9:00 AM to 9:59 AM | 683 (2.7%) | 874 (4.0%) |
| 10:00 AM to 10:59 AM | 209 (0.8%) | 802 (3.7%) |
| 11:00 AM to 11:59 AM | 124 (0.5%) | 209 (1.0%) |
| 12:00 PM to 3:59 PM | 2,431 (9.5%) | 1,873 (8.6%) |
| 4:00 PM to 11:59 PM | 2,005 (7.8%) | 1,904 (8.8%) |
| Total | 25,639 (100.0%) | 21,689 (100.0%) |
Housing Occupancy in Calhoun County
Occupancy by Ownership in Calhoun County
Of the total 44,693 dwellings in Calhoun County, owner-occupied units account for 31,694 (70.9%), while renter-occupied units make up 12,999 (29.1%).
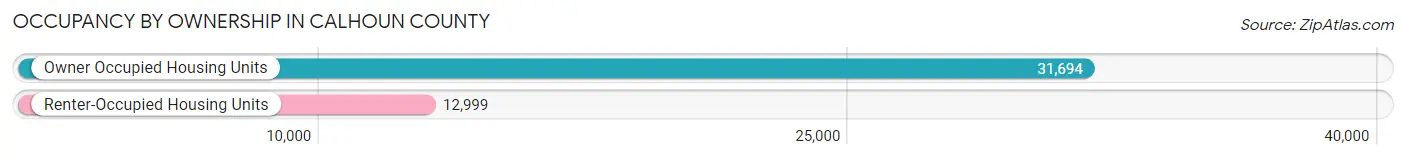
| Occupancy | # Housing Units | % Housing Units |
| Owner Occupied Housing Units | 31,694 | 70.9% |
| Renter-Occupied Housing Units | 12,999 | 29.1% |
| Total Occupied Housing Units | 44,693 | 100.0% |
Occupancy by Household Size in Calhoun County
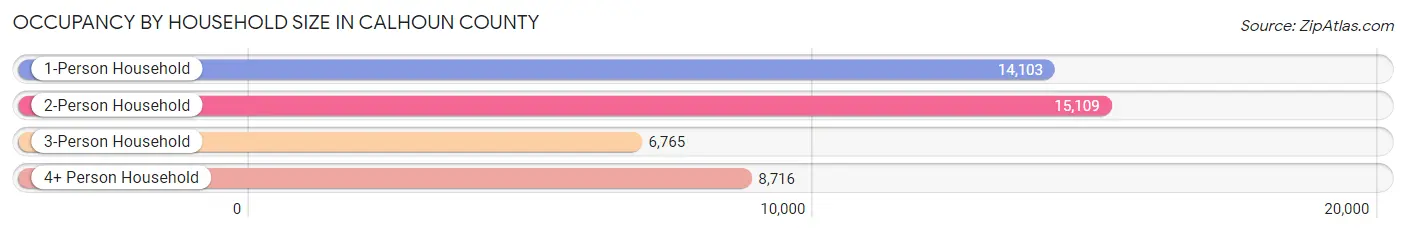
| Household Size | # Housing Units | % Housing Units |
| 1-Person Household | 14,103 | 31.6% |
| 2-Person Household | 15,109 | 33.8% |
| 3-Person Household | 6,765 | 15.1% |
| 4+ Person Household | 8,716 | 19.5% |
| Total Housing Units | 44,693 | 100.0% |
Occupancy by Ownership by Household Size in Calhoun County
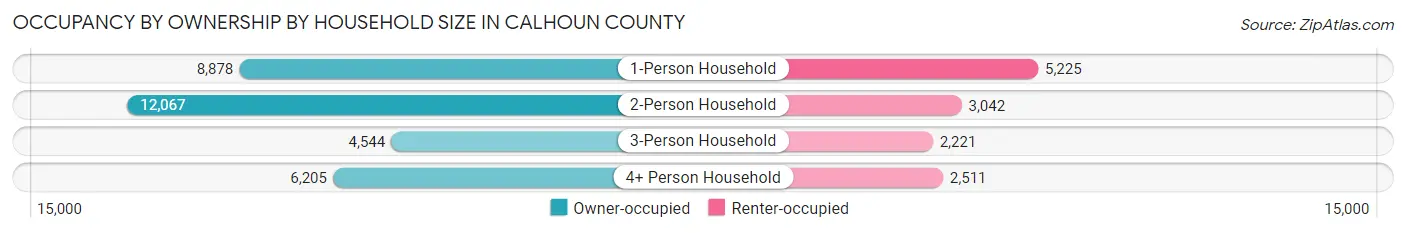
| Household Size | Owner-occupied | Renter-occupied |
| 1-Person Household | 8,878 (62.9%) | 5,225 (37.0%) |
| 2-Person Household | 12,067 (79.9%) | 3,042 (20.1%) |
| 3-Person Household | 4,544 (67.2%) | 2,221 (32.8%) |
| 4+ Person Household | 6,205 (71.2%) | 2,511 (28.8%) |
| Total Housing Units | 31,694 (70.9%) | 12,999 (29.1%) |
Occupancy by Educational Attainment in Calhoun County
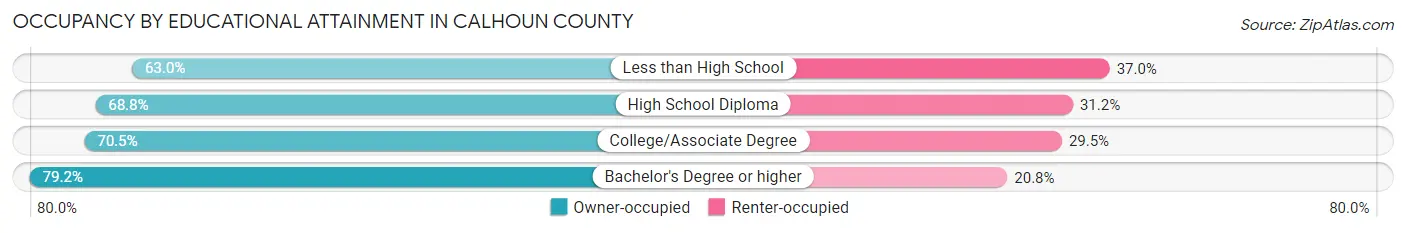
| Household Size | Owner-occupied | Renter-occupied |
| Less than High School | 3,543 (63.0%) | 2,084 (37.0%) |
| High School Diploma | 9,767 (68.8%) | 4,433 (31.2%) |
| College/Associate Degree | 10,638 (70.5%) | 4,446 (29.5%) |
| Bachelor's Degree or higher | 7,746 (79.2%) | 2,036 (20.8%) |
Occupancy by Age of Householder in Calhoun County
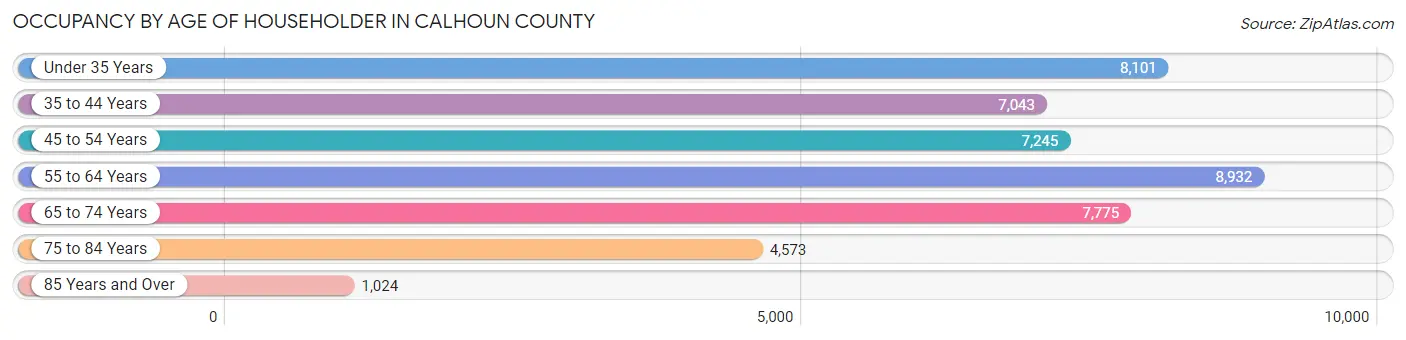
| Age Bracket | # Households | % Households |
| Under 35 Years | 8,101 | 18.1% |
| 35 to 44 Years | 7,043 | 15.8% |
| 45 to 54 Years | 7,245 | 16.2% |
| 55 to 64 Years | 8,932 | 20.0% |
| 65 to 74 Years | 7,775 | 17.4% |
| 75 to 84 Years | 4,573 | 10.2% |
| 85 Years and Over | 1,024 | 2.3% |
| Total | 44,693 | 100.0% |
Housing Finances in Calhoun County
Median Income by Occupancy in Calhoun County
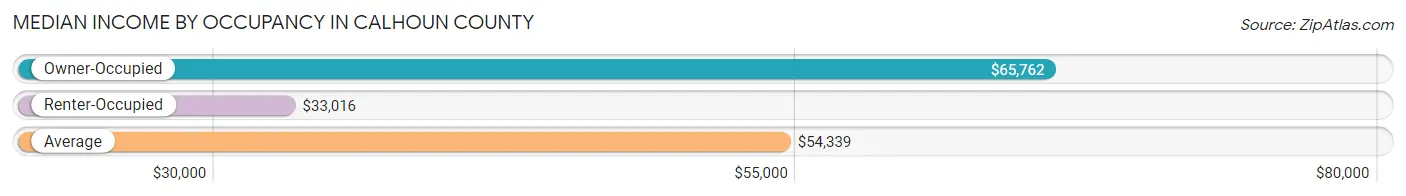
| Occupancy Type | # Households | Median Income |
| Owner-Occupied | 31,694 (70.9%) | $65,762 |
| Renter-Occupied | 12,999 (29.1%) | $33,016 |
| Average | 44,693 (100.0%) | $54,339 |
Occupancy by Householder Income Bracket in Calhoun County
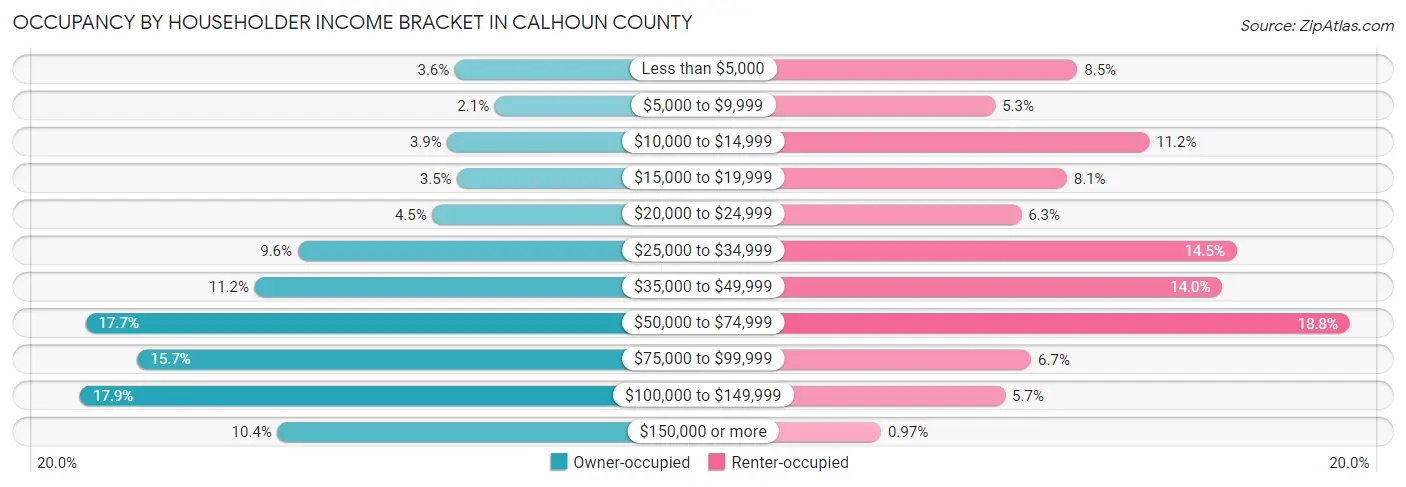
| Income Bracket | Owner-occupied | Renter-occupied |
| Less than $5,000 | 1,141 (3.6%) | 1,098 (8.5%) |
| $5,000 to $9,999 | 660 (2.1%) | 692 (5.3%) |
| $10,000 to $14,999 | 1,233 (3.9%) | 1,454 (11.2%) |
| $15,000 to $19,999 | 1,111 (3.5%) | 1,046 (8.1%) |
| $20,000 to $24,999 | 1,415 (4.5%) | 820 (6.3%) |
| $25,000 to $34,999 | 3,041 (9.6%) | 1,888 (14.5%) |
| $35,000 to $49,999 | 3,558 (11.2%) | 1,816 (14.0%) |
| $50,000 to $74,999 | 5,605 (17.7%) | 2,448 (18.8%) |
| $75,000 to $99,999 | 4,976 (15.7%) | 870 (6.7%) |
| $100,000 to $149,999 | 5,670 (17.9%) | 741 (5.7%) |
| $150,000 or more | 3,284 (10.4%) | 126 (1.0%) |
| Total | 31,694 (100.0%) | 12,999 (100.0%) |
Monthly Housing Cost Tiers in Calhoun County
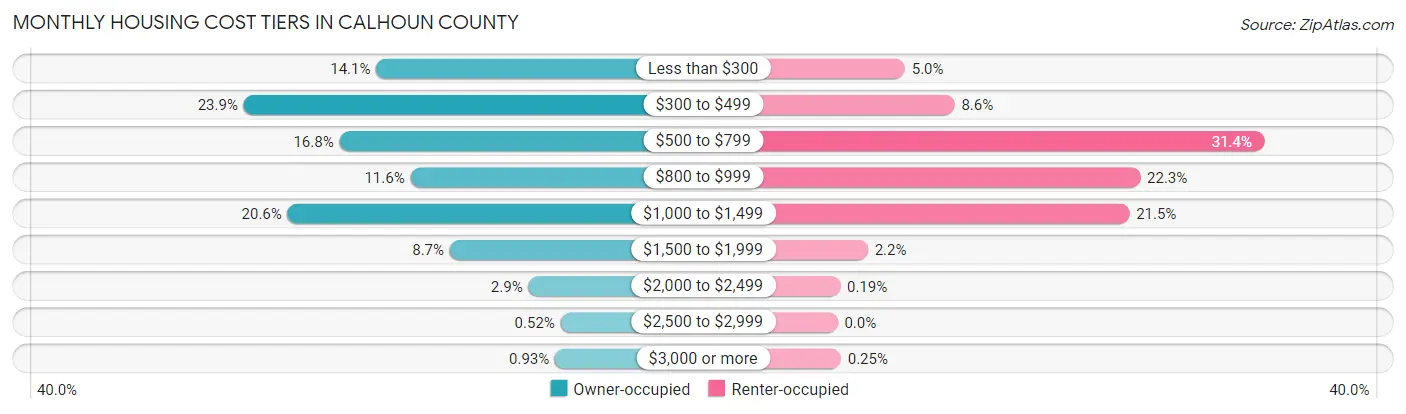
| Monthly Cost | Owner-occupied | Renter-occupied |
| Less than $300 | 4,469 (14.1%) | 645 (5.0%) |
| $300 to $499 | 7,563 (23.9%) | 1,120 (8.6%) |
| $500 to $799 | 5,328 (16.8%) | 4,082 (31.4%) |
| $800 to $999 | 3,670 (11.6%) | 2,898 (22.3%) |
| $1,000 to $1,499 | 6,537 (20.6%) | 2,793 (21.5%) |
| $1,500 to $1,999 | 2,751 (8.7%) | 290 (2.2%) |
| $2,000 to $2,499 | 917 (2.9%) | 25 (0.2%) |
| $2,500 to $2,999 | 165 (0.5%) | 0 (0.0%) |
| $3,000 or more | 294 (0.9%) | 32 (0.3%) |
| Total | 31,694 (100.0%) | 12,999 (100.0%) |
Physical Housing Characteristics in Calhoun County
Housing Structures in Calhoun County
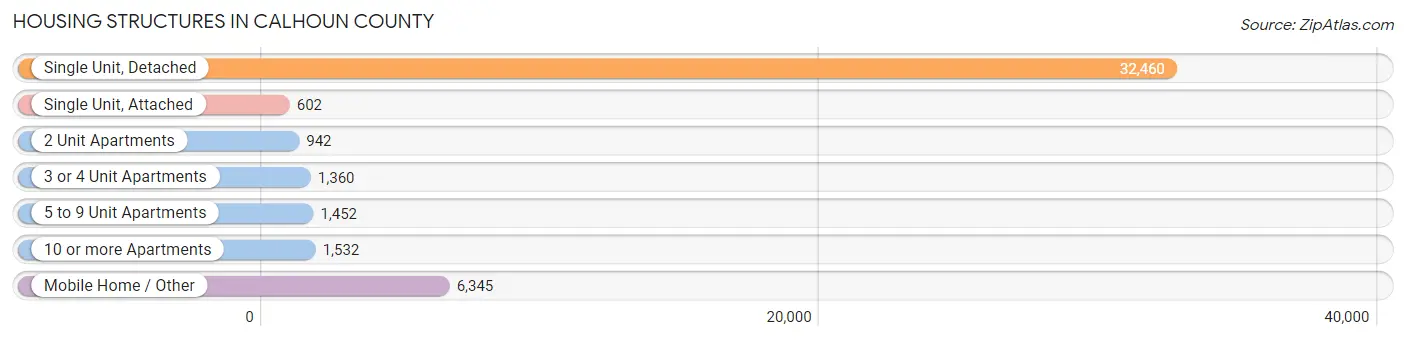
| Structure Type | # Housing Units | % Housing Units |
| Single Unit, Detached | 32,460 | 72.6% |
| Single Unit, Attached | 602 | 1.3% |
| 2 Unit Apartments | 942 | 2.1% |
| 3 or 4 Unit Apartments | 1,360 | 3.0% |
| 5 to 9 Unit Apartments | 1,452 | 3.3% |
| 10 or more Apartments | 1,532 | 3.4% |
| Mobile Home / Other | 6,345 | 14.2% |
| Total | 44,693 | 100.0% |
Housing Structures by Occupancy in Calhoun County
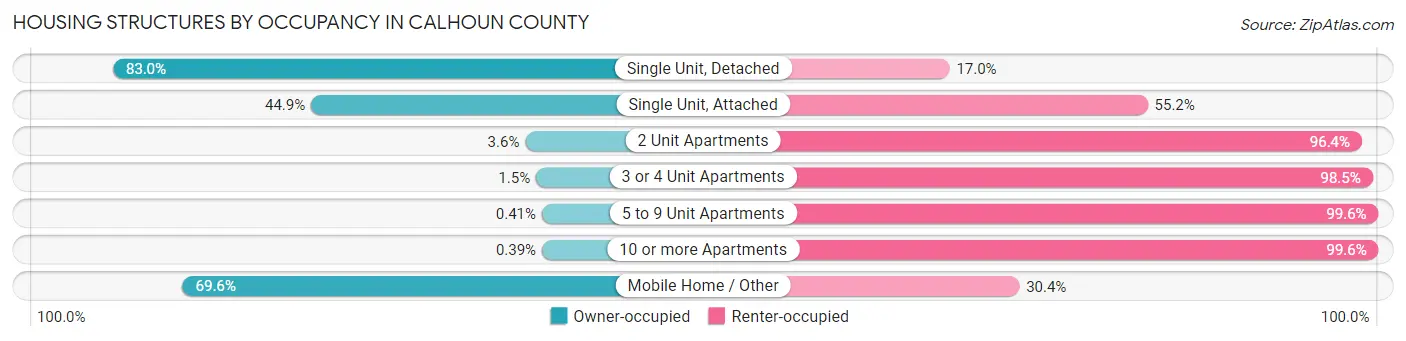
| Structure Type | Owner-occupied | Renter-occupied |
| Single Unit, Detached | 26,943 (83.0%) | 5,517 (17.0%) |
| Single Unit, Attached | 270 (44.9%) | 332 (55.1%) |
| 2 Unit Apartments | 34 (3.6%) | 908 (96.4%) |
| 3 or 4 Unit Apartments | 21 (1.5%) | 1,339 (98.5%) |
| 5 to 9 Unit Apartments | 6 (0.4%) | 1,446 (99.6%) |
| 10 or more Apartments | 6 (0.4%) | 1,526 (99.6%) |
| Mobile Home / Other | 4,414 (69.6%) | 1,931 (30.4%) |
| Total | 31,694 (70.9%) | 12,999 (29.1%) |
Housing Structures by Number of Rooms in Calhoun County
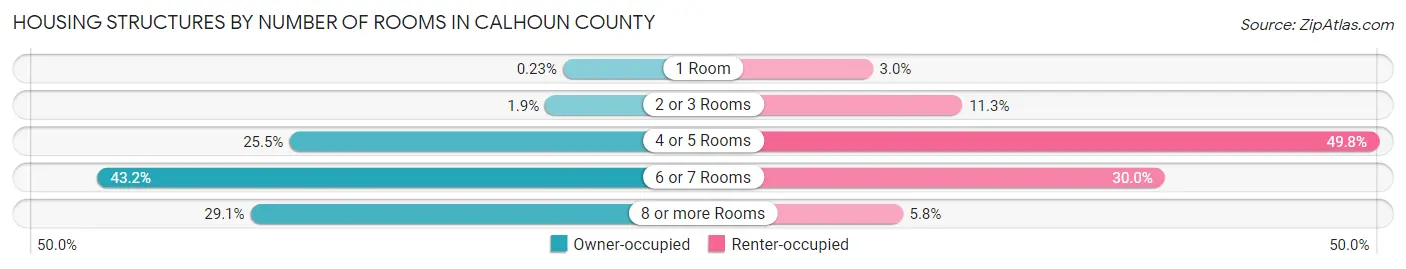
| Number of Rooms | Owner-occupied | Renter-occupied |
| 1 Room | 74 (0.2%) | 393 (3.0%) |
| 2 or 3 Rooms | 594 (1.9%) | 1,470 (11.3%) |
| 4 or 5 Rooms | 8,091 (25.5%) | 6,479 (49.8%) |
| 6 or 7 Rooms | 13,706 (43.2%) | 3,904 (30.0%) |
| 8 or more Rooms | 9,229 (29.1%) | 753 (5.8%) |
| Total | 31,694 (100.0%) | 12,999 (100.0%) |
Housing Structure by Heating Type in Calhoun County
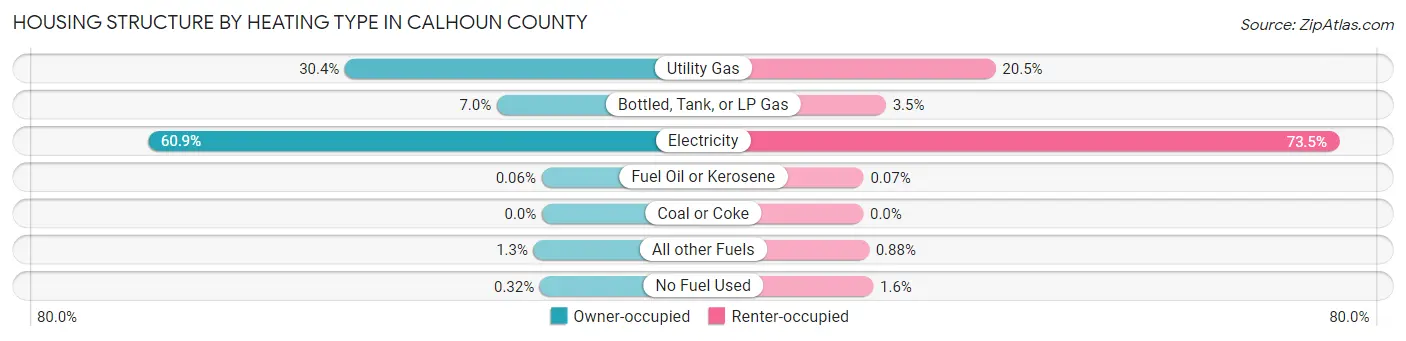
| Heating Type | Owner-occupied | Renter-occupied |
| Utility Gas | 9,648 (30.4%) | 2,659 (20.5%) |
| Bottled, Tank, or LP Gas | 2,207 (7.0%) | 455 (3.5%) |
| Electricity | 19,315 (60.9%) | 9,560 (73.5%) |
| Fuel Oil or Kerosene | 18 (0.1%) | 9 (0.1%) |
| Coal or Coke | 0 (0.0%) | 0 (0.0%) |
| All other Fuels | 406 (1.3%) | 115 (0.9%) |
| No Fuel Used | 100 (0.3%) | 201 (1.5%) |
| Total | 31,694 (100.0%) | 12,999 (100.0%) |
Household Vehicle Usage in Calhoun County
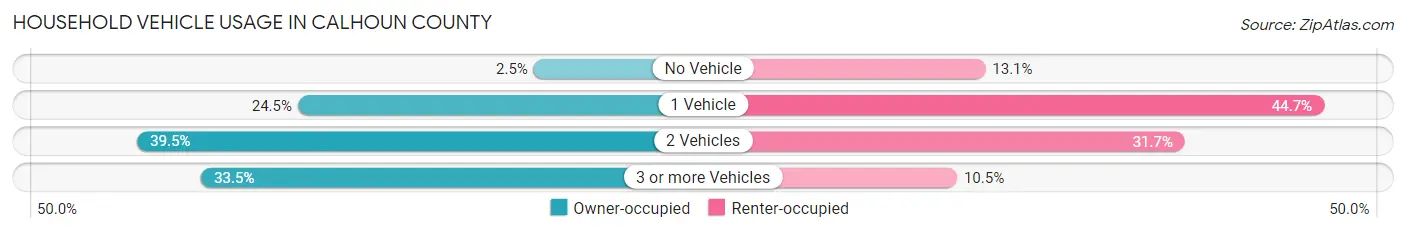
| Vehicles per Household | Owner-occupied | Renter-occupied |
| No Vehicle | 786 (2.5%) | 1,704 (13.1%) |
| 1 Vehicle | 7,765 (24.5%) | 5,812 (44.7%) |
| 2 Vehicles | 12,516 (39.5%) | 4,123 (31.7%) |
| 3 or more Vehicles | 10,627 (33.5%) | 1,360 (10.5%) |
| Total | 31,694 (100.0%) | 12,999 (100.0%) |
Real Estate & Mortgages in Calhoun County
Real Estate and Mortgage Overview in Calhoun County
| Characteristic | Without Mortgage | With Mortgage |
| Housing Units | 15,336 | 16,358 |
| Median Property Value | $110,100 | $159,700 |
| Median Household Income | $48,860 | $2,210 |
| Monthly Housing Costs | $383 | $280 |
| Real Estate Taxes | $502 | $2,978 |
Property Value by Mortgage Status in Calhoun County
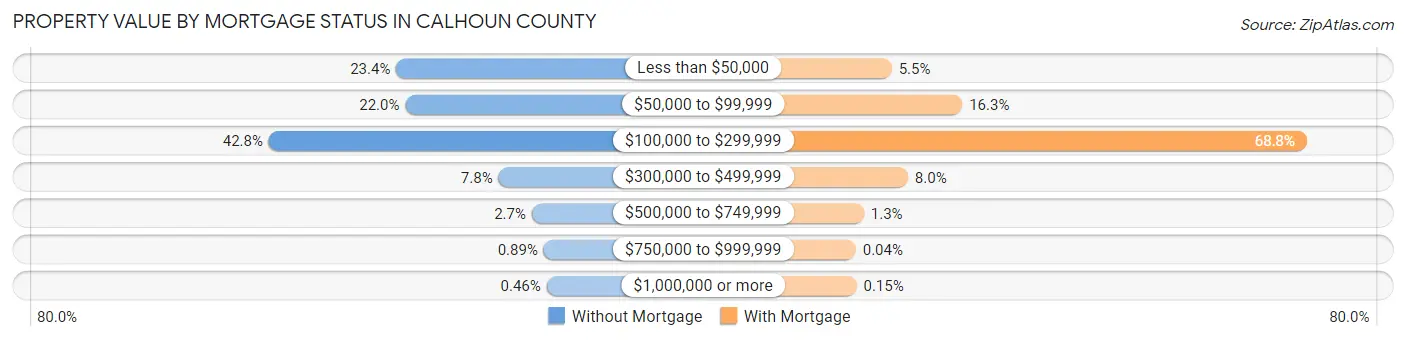
| Property Value | Without Mortgage | With Mortgage |
| Less than $50,000 | 3,584 (23.4%) | 902 (5.5%) |
| $50,000 to $99,999 | 3,373 (22.0%) | 2,660 (16.3%) |
| $100,000 to $299,999 | 6,562 (42.8%) | 11,250 (68.8%) |
| $300,000 to $499,999 | 1,195 (7.8%) | 1,306 (8.0%) |
| $500,000 to $749,999 | 415 (2.7%) | 208 (1.3%) |
| $750,000 to $999,999 | 136 (0.9%) | 7 (0.0%) |
| $1,000,000 or more | 71 (0.5%) | 25 (0.2%) |
| Total | 15,336 (100.0%) | 16,358 (100.0%) |
Household Income by Mortgage Status in Calhoun County
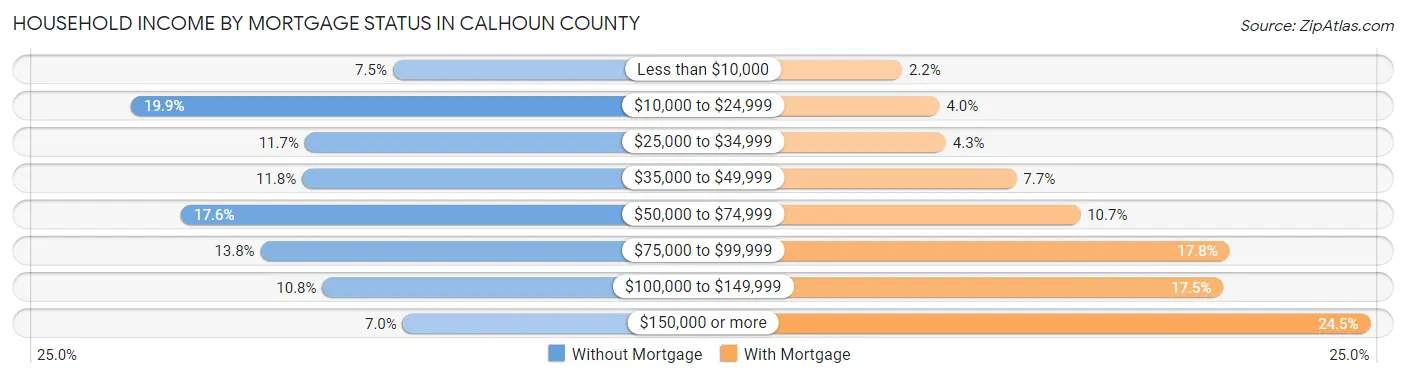
| Household Income | Without Mortgage | With Mortgage |
| Less than $10,000 | 1,146 (7.5%) | 362 (2.2%) |
| $10,000 to $24,999 | 3,056 (19.9%) | 655 (4.0%) |
| $25,000 to $34,999 | 1,788 (11.7%) | 703 (4.3%) |
| $35,000 to $49,999 | 1,808 (11.8%) | 1,253 (7.7%) |
| $50,000 to $74,999 | 2,692 (17.5%) | 1,750 (10.7%) |
| $75,000 to $99,999 | 2,112 (13.8%) | 2,913 (17.8%) |
| $100,000 to $149,999 | 1,660 (10.8%) | 2,864 (17.5%) |
| $150,000 or more | 1,074 (7.0%) | 4,010 (24.5%) |
| Total | 15,336 (100.0%) | 16,358 (100.0%) |
Property Value to Household Income Ratio in Calhoun County
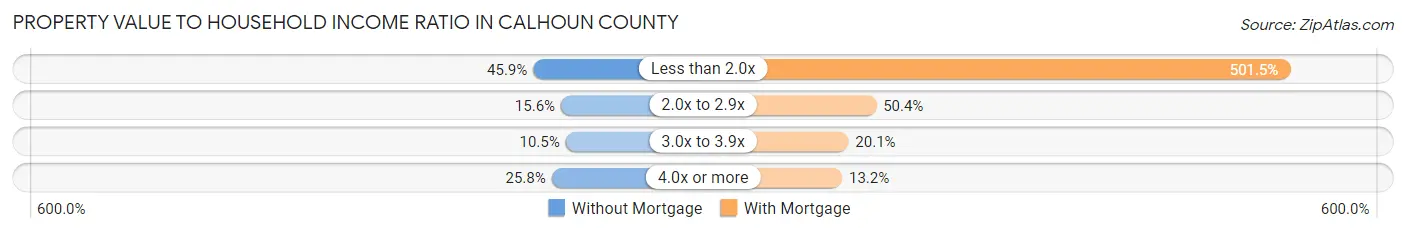
| Value-to-Income Ratio | Without Mortgage | With Mortgage |
| Less than 2.0x | 7,038 (45.9%) | 82,034 (501.5%) |
| 2.0x to 2.9x | 2,390 (15.6%) | 8,250 (50.4%) |
| 3.0x to 3.9x | 1,617 (10.5%) | 3,293 (20.1%) |
| 4.0x or more | 3,959 (25.8%) | 2,158 (13.2%) |
| Total | 15,336 (100.0%) | 16,358 (100.0%) |
Real Estate Taxes by Mortgage Status in Calhoun County
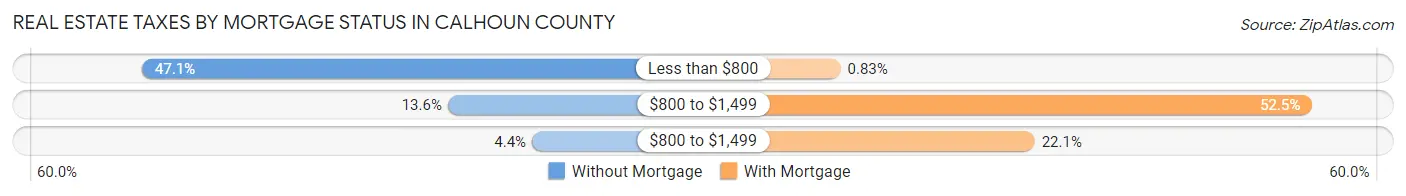
| Property Taxes | Without Mortgage | With Mortgage |
| Less than $800 | 7,230 (47.1%) | 135 (0.8%) |
| $800 to $1,499 | 2,090 (13.6%) | 8,590 (52.5%) |
| $800 to $1,499 | 675 (4.4%) | 3,615 (22.1%) |
| Total | 15,336 (100.0%) | 16,358 (100.0%) |
Health & Disability in Calhoun County
Health Insurance Coverage by Age in Calhoun County
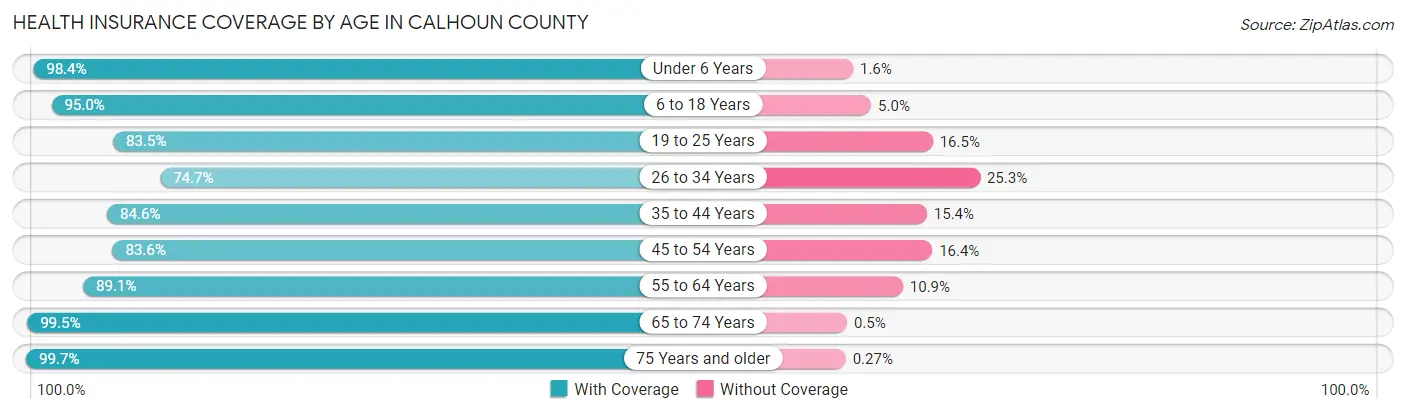
| Age Bracket | With Coverage | Without Coverage |
| Under 6 Years | 7,605 (98.4%) | 126 (1.6%) |
| 6 to 18 Years | 18,001 (95.0%) | 950 (5.0%) |
| 19 to 25 Years | 9,849 (83.5%) | 1,945 (16.5%) |
| 26 to 34 Years | 9,763 (74.7%) | 3,307 (25.3%) |
| 35 to 44 Years | 11,446 (84.6%) | 2,083 (15.4%) |
| 45 to 54 Years | 11,501 (83.6%) | 2,254 (16.4%) |
| 55 to 64 Years | 13,718 (89.1%) | 1,681 (10.9%) |
| 65 to 74 Years | 12,229 (99.5%) | 62 (0.5%) |
| 75 Years and older | 8,034 (99.7%) | 22 (0.3%) |
| Total | 102,146 (89.1%) | 12,430 (10.8%) |
Health Insurance Coverage by Citizenship Status in Calhoun County
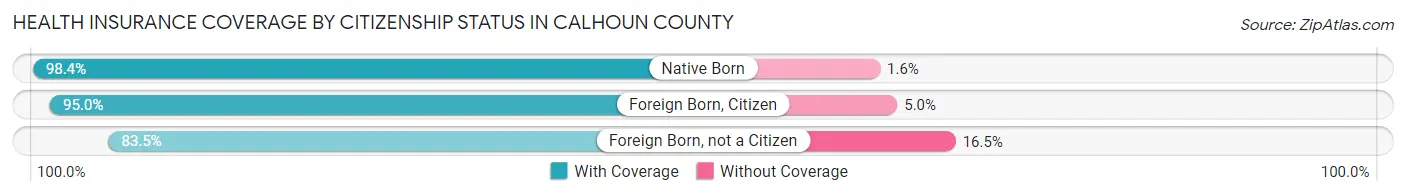
| Citizenship Status | With Coverage | Without Coverage |
| Native Born | 7,605 (98.4%) | 126 (1.6%) |
| Foreign Born, Citizen | 18,001 (95.0%) | 950 (5.0%) |
| Foreign Born, not a Citizen | 9,849 (83.5%) | 1,945 (16.5%) |
Health Insurance Coverage by Household Income in Calhoun County
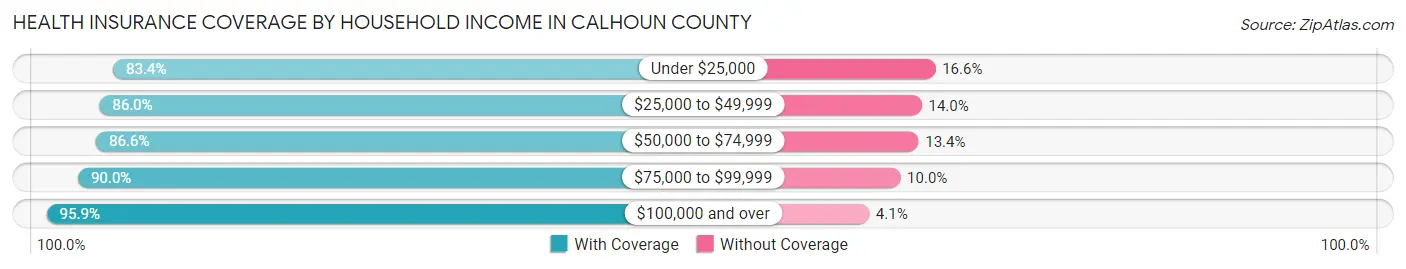
| Household Income | With Coverage | Without Coverage |
| Under $25,000 | 15,781 (83.4%) | 3,134 (16.6%) |
| $25,000 to $49,999 | 20,595 (86.0%) | 3,356 (14.0%) |
| $50,000 to $74,999 | 17,264 (86.6%) | 2,669 (13.4%) |
| $75,000 to $99,999 | 14,915 (90.0%) | 1,658 (10.0%) |
| $100,000 and over | 31,516 (95.9%) | 1,362 (4.1%) |
Public vs Private Health Insurance Coverage by Age in Calhoun County
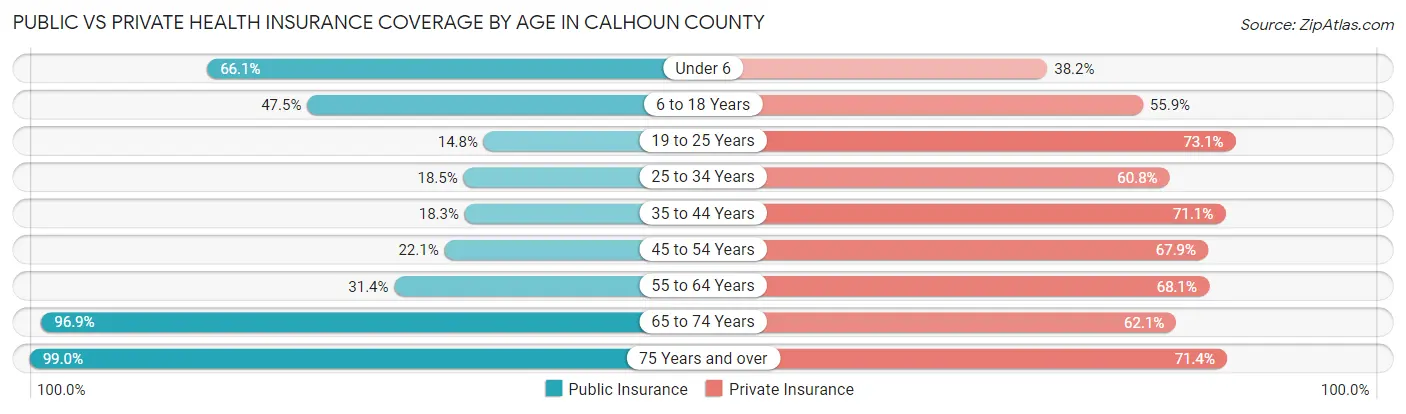
| Age Bracket | Public Insurance | Private Insurance |
| Under 6 | 5,110 (66.1%) | 2,949 (38.2%) |
| 6 to 18 Years | 9,010 (47.5%) | 10,591 (55.9%) |
| 19 to 25 Years | 1,741 (14.8%) | 8,617 (73.1%) |
| 25 to 34 Years | 2,421 (18.5%) | 7,947 (60.8%) |
| 35 to 44 Years | 2,476 (18.3%) | 9,625 (71.1%) |
| 45 to 54 Years | 3,034 (22.1%) | 9,345 (67.9%) |
| 55 to 64 Years | 4,831 (31.4%) | 10,489 (68.1%) |
| 65 to 74 Years | 11,907 (96.9%) | 7,628 (62.1%) |
| 75 Years and over | 7,979 (99.0%) | 5,755 (71.4%) |
| Total | 48,509 (42.3%) | 72,946 (63.7%) |
Disability Status by Sex by Age in Calhoun County
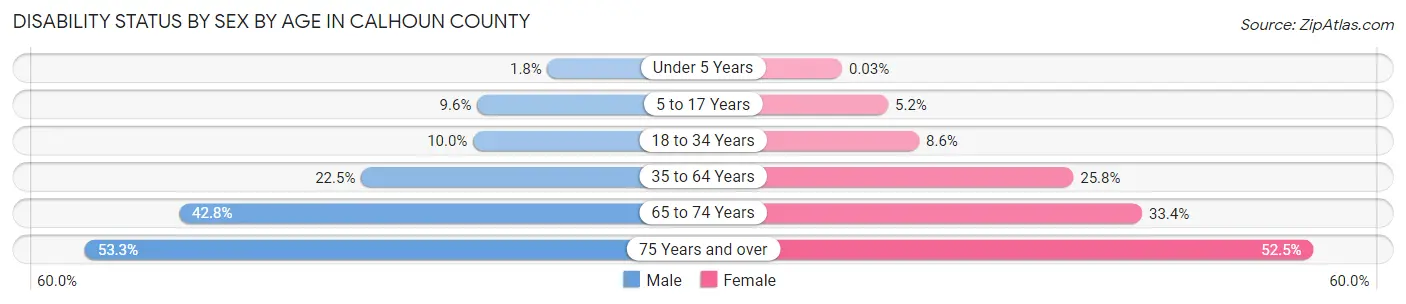
| Age Bracket | Male | Female |
| Under 5 Years | 58 (1.8%) | 1 (0.0%) |
| 5 to 17 Years | 877 (9.6%) | 455 (5.2%) |
| 18 to 34 Years | 1,348 (10.0%) | 1,175 (8.6%) |
| 35 to 64 Years | 4,706 (22.5%) | 5,615 (25.8%) |
| 65 to 74 Years | 2,398 (42.8%) | 2,236 (33.4%) |
| 75 Years and over | 1,586 (53.3%) | 2,668 (52.5%) |
Disability Class by Sex by Age in Calhoun County
Disability Class: Hearing Difficulty
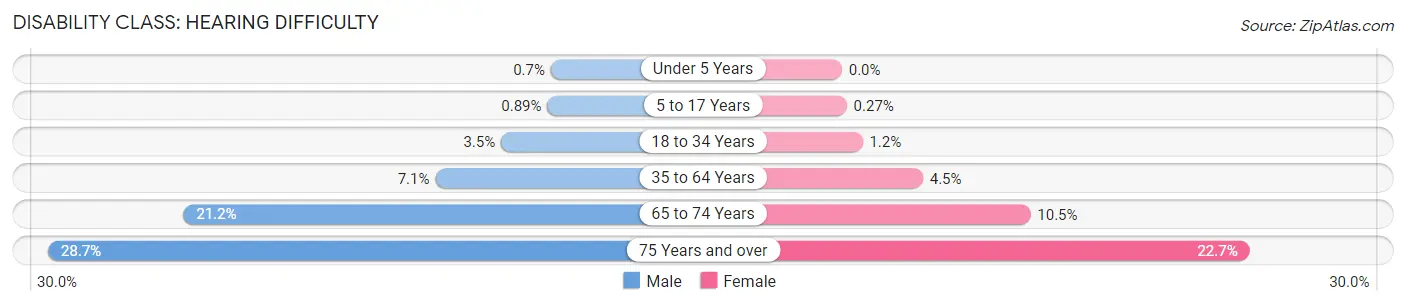
| Age Bracket | Male | Female |
| Under 5 Years | 23 (0.7%) | 0 (0.0%) |
| 5 to 17 Years | 81 (0.9%) | 24 (0.3%) |
| 18 to 34 Years | 466 (3.5%) | 157 (1.1%) |
| 35 to 64 Years | 1,490 (7.1%) | 983 (4.5%) |
| 65 to 74 Years | 1,186 (21.2%) | 702 (10.5%) |
| 75 Years and over | 854 (28.7%) | 1,153 (22.7%) |
Disability Class: Vision Difficulty
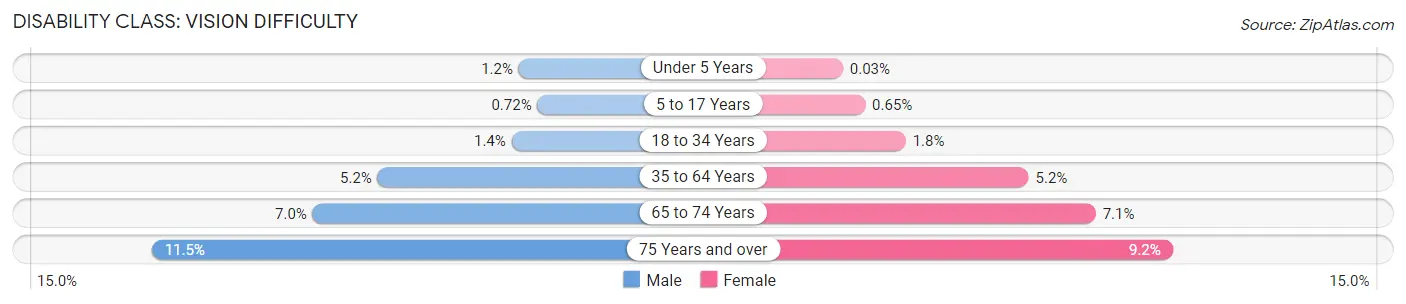
| Age Bracket | Male | Female |
| Under 5 Years | 41 (1.2%) | 1 (0.0%) |
| 5 to 17 Years | 66 (0.7%) | 57 (0.6%) |
| 18 to 34 Years | 194 (1.4%) | 243 (1.8%) |
| 35 to 64 Years | 1,081 (5.2%) | 1,132 (5.2%) |
| 65 to 74 Years | 391 (7.0%) | 473 (7.1%) |
| 75 Years and over | 341 (11.5%) | 468 (9.2%) |
Disability Class: Cognitive Difficulty
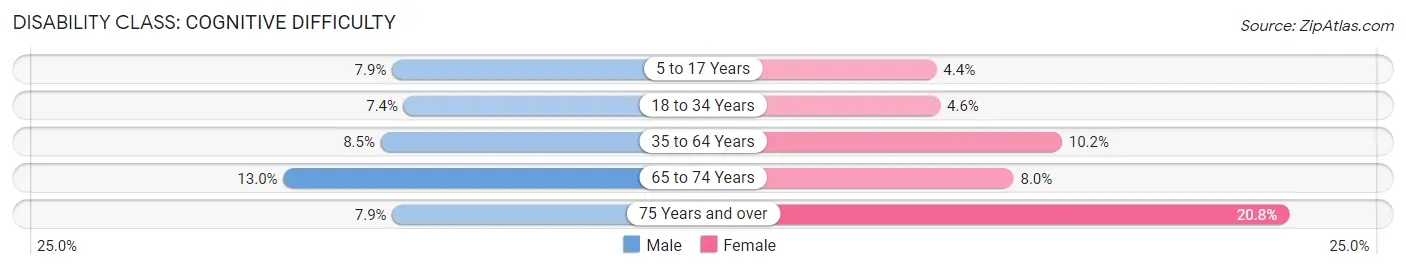
| Age Bracket | Male | Female |
| 5 to 17 Years | 726 (7.9%) | 387 (4.4%) |
| 18 to 34 Years | 994 (7.4%) | 622 (4.6%) |
| 35 to 64 Years | 1,771 (8.5%) | 2,224 (10.2%) |
| 65 to 74 Years | 728 (13.0%) | 533 (8.0%) |
| 75 Years and over | 236 (7.9%) | 1,054 (20.7%) |
Disability Class: Ambulatory Difficulty
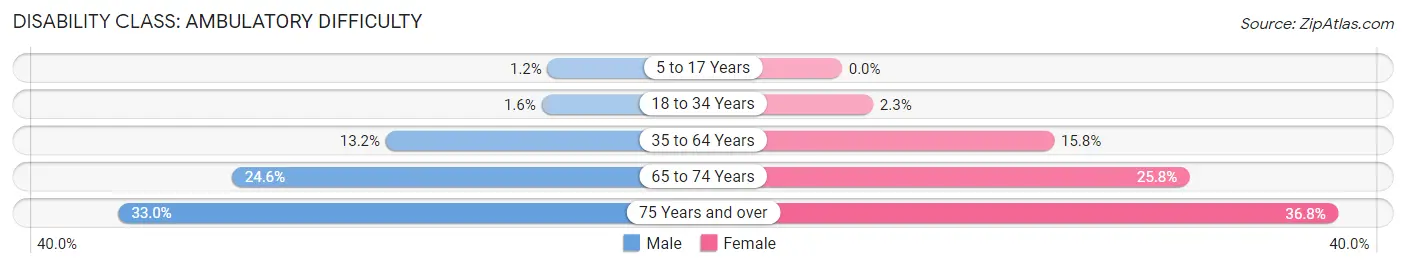
| Age Bracket | Male | Female |
| 5 to 17 Years | 107 (1.2%) | 0 (0.0%) |
| 18 to 34 Years | 218 (1.6%) | 315 (2.3%) |
| 35 to 64 Years | 2,755 (13.2%) | 3,433 (15.8%) |
| 65 to 74 Years | 1,379 (24.6%) | 1,724 (25.8%) |
| 75 Years and over | 983 (33.0%) | 1,870 (36.8%) |
Disability Class: Self-Care Difficulty
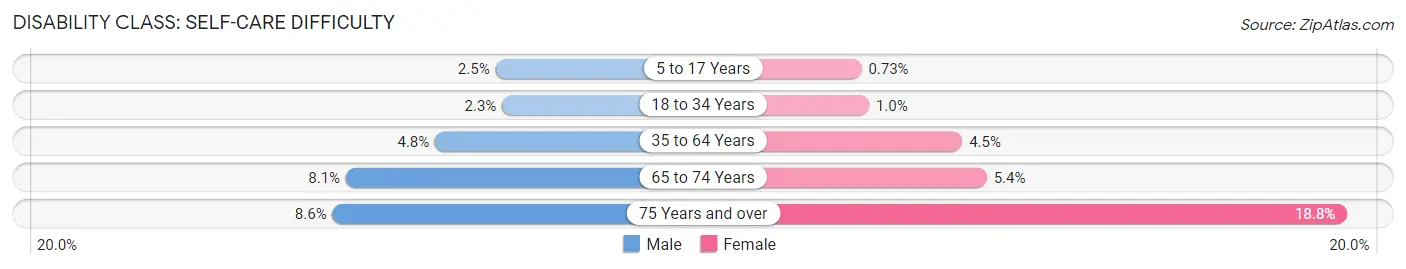
| Age Bracket | Male | Female |
| 5 to 17 Years | 230 (2.5%) | 64 (0.7%) |
| 18 to 34 Years | 305 (2.3%) | 138 (1.0%) |
| 35 to 64 Years | 996 (4.8%) | 973 (4.5%) |
| 65 to 74 Years | 452 (8.1%) | 360 (5.4%) |
| 75 Years and over | 255 (8.6%) | 953 (18.8%) |
Technology Access in Calhoun County
Computing Device Access in Calhoun County
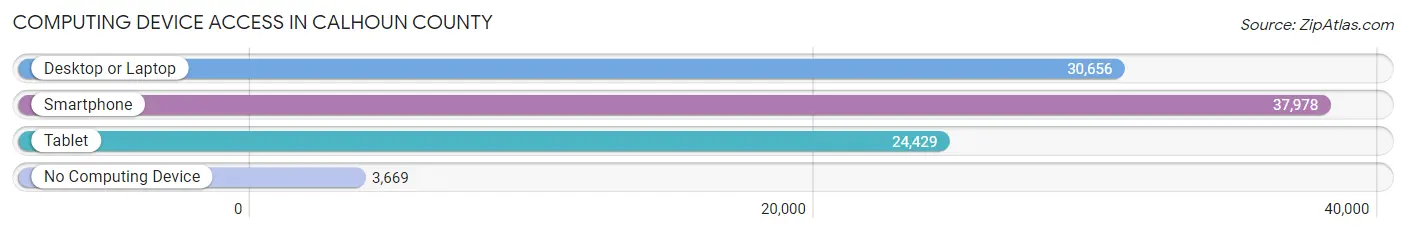
| Device Type | # Households | % Households |
| Desktop or Laptop | 30,656 | 68.6% |
| Smartphone | 37,978 | 85.0% |
| Tablet | 24,429 | 54.7% |
| No Computing Device | 3,669 | 8.2% |
| Total | 44,693 | 100.0% |
Internet Access in Calhoun County
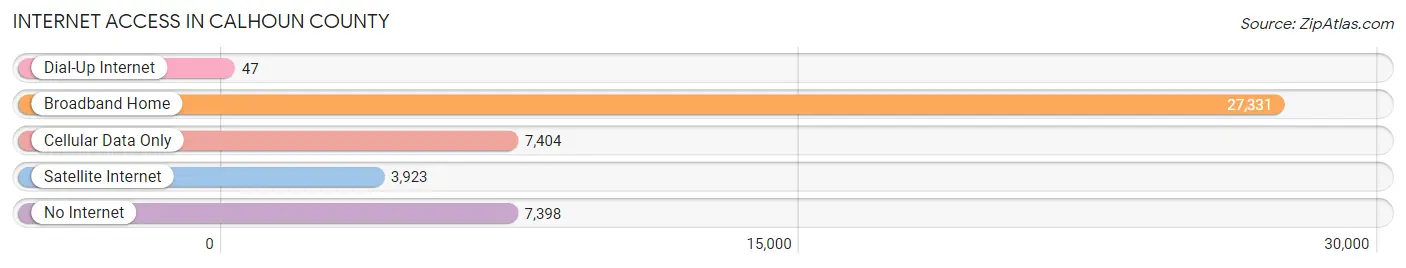
| Internet Type | # Households | % Households |
| Dial-Up Internet | 47 | 0.1% |
| Broadband Home | 27,331 | 61.2% |
| Cellular Data Only | 7,404 | 16.6% |
| Satellite Internet | 3,923 | 8.8% |
| No Internet | 7,398 | 16.6% |
| Total | 44,693 | 100.0% |
Calhoun County Summary
Calhoun County is located in the east-central part of the state of Alabama, in the Appalachian foothills. It is bordered by Cleburne County to the north, Talladega County to the east, Clay County to the south, and Etowah County to the west. The county seat is Anniston, and the county has a total area of 576 square miles.
History
Calhoun County was created in 1832 from land that was formerly part of the Creek Nation. It was named for John C. Calhoun, a prominent South Carolina politician and statesman. The county was originally divided into two townships, Jacksonville and Oxford. The county seat was established in Jacksonville in 1833, and the county courthouse was built there in 1835.
In the late 19th century, the county experienced a period of rapid growth and development. The city of Anniston was founded in 1872, and the county seat was moved there in 1877. The county also saw the development of several other towns, including Jacksonville, Oxford, Piedmont, and Weaver.
The county was the site of several major battles during the Civil War, including the Battle of Calhoun Station in 1863 and the Battle of Chinnabee in 1864. The county was also the site of the infamous "Anniston Massacre" in 1961, when a mob of white supremacists attacked a busload of Freedom Riders who were attempting to desegregate the city's bus station.
Geography
Calhoun County is located in the Appalachian foothills of east-central Alabama. The terrain is mostly hilly, with some flat areas in the valleys. The county is drained by the Coosa River, which forms its western boundary. The county is also home to several lakes, including Lake Wedowee, Lake Mitchell, and Lake Martin.
The county has a humid subtropical climate, with hot, humid summers and mild winters. The average annual temperature is around 64°F, and the average annual precipitation is around 50 inches.
Economy
Calhoun County's economy is largely based on manufacturing and agriculture. The county is home to several major manufacturing companies, including Goodyear Tire and Rubber Company, Anniston Army Depot, and International Paper. The county is also home to several agricultural operations, including poultry farms, cattle farms, and vegetable farms.
The county is also home to several tourist attractions, including the Anniston Museum of Natural History, the Berman Museum of World History, and the Anniston Civil War Museum.
Demographics
As of the 2010 census, Calhoun County had a population of 118,572. The racial makeup of the county was 73.3% White, 22.2% Black or African American, 0.4% Native American, 1.2% Asian, 0.1% Pacific Islander, 1.7% from other races, and 1.2% from two or more races. Hispanic or Latino of any race were 3.3% of the population.
The median income for a household in the county was $37,845, and the median income for a family was $45,945. The per capita income for the county was $20,845. About 17.2% of the population was below the poverty line.
Common Questions
What is Per Capita Income in Calhoun County?
Per Capita income in Calhoun County is $28,227.
What is the Median Family Income in Calhoun County?
Median Family Income in Calhoun County is $68,959.
What is the Median Household income in Calhoun County?
Median Household Income in Calhoun County is $54,339.
What is Income or Wage Gap in Calhoun County?
Income or Wage Gap in Calhoun County is 32.1%.
Women in Calhoun County earn 67.9 cents for every dollar earned by a man.
What is Family Income Deficit in Calhoun County?
Family Income Deficit in Calhoun County is $10,769.
Families that are below poverty line in Calhoun County earn $10,769 less on average than the poverty threshold level.
What is Inequality or Gini Index in Calhoun County?
Inequality or Gini Index in Calhoun County is 0.45.
What is the Total Population of Calhoun County?
Total Population of Calhoun County is 116,162.
What is the Total Male Population of Calhoun County?
Total Male Population of Calhoun County is 56,185.
What is the Total Female Population of Calhoun County?
Total Female Population of Calhoun County is 59,977.
What is the Ratio of Males per 100 Females in Calhoun County?
There are 93.68 Males per 100 Females in Calhoun County.
What is the Ratio of Females per 100 Males in Calhoun County?
There are 106.75 Females per 100 Males in Calhoun County.
What is the Median Population Age in Calhoun County?
Median Population Age in Calhoun County is 39.2 Years.
What is the Average Family Size in Calhoun County
Average Family Size in Calhoun County is 3.1 People.
What is the Average Household Size in Calhoun County
Average Household Size in Calhoun County is 2.5 People.
How Large is the Labor Force in Calhoun County?
There are 53,559 People in the Labor Forcein in Calhoun County.
What is the Percentage of People in the Labor Force in Calhoun County?
56.6% of People are in the Labor Force in Calhoun County.
What is the Unemployment Rate in Calhoun County?
Unemployment Rate in Calhoun County is 6.9%.