Dale County, AL Map & Demographics
Dale County Map
Dale County Overview
$28,312
PER CAPITA INCOME
$67,776
AVG FAMILY INCOME
$52,813
AVG HOUSEHOLD INCOME
40.5%
WAGE / INCOME GAP [ % ]
59.5¢/ $1
WAGE / INCOME GAP [ $ ]
$12,909
FAMILY INCOME DEFICIT
0.44
INEQUALITY / GINI INDEX
49,455
TOTAL POPULATION
24,461
MALE POPULATION
24,994
FEMALE POPULATION
97.87
MALES / 100 FEMALES
102.18
FEMALES / 100 MALES
37.7
MEDIAN AGE
3.2
AVG FAMILY SIZE
2.5
AVG HOUSEHOLD SIZE
21,872
LABOR FORCE [ PEOPLE ]
55.8%
PERCENT IN LABOR FORCE
7.8%
UNEMPLOYMENT RATE
Dale County Area Codes
Income in Dale County
Income Overview in Dale County
Per Capita Income in Dale County is $28,312, while median incomes of families and households are $67,776 and $52,813 respectively.
| Characteristic | Number | Measure |
| Per Capita Income | 49,455 | $28,312 |
| Median Family Income | 12,251 | $67,776 |
| Mean Family Income | 12,251 | $78,839 |
| Median Household Income | 19,400 | $52,813 |
| Mean Household Income | 19,400 | $67,432 |
| Income Deficit | 12,251 | $12,909 |
| Wage / Income Gap (%) | 49,455 | 40.50% |
| Wage / Income Gap ($) | 49,455 | 59.50¢ per $1 |
| Gini / Inequality Index | 49,455 | 0.44 |
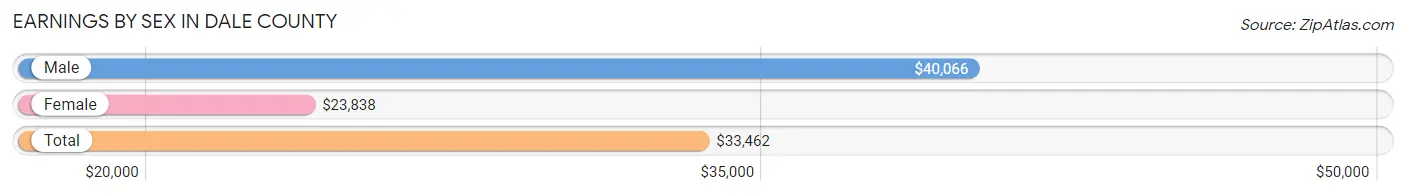
Earnings by Sex in Dale County
Average Earnings in Dale County are $33,462, $40,066 for men and $23,838 for women, a difference of 40.5%.
| Sex | Number | Average Earnings |
| Male | 12,722 (56.1%) | $40,066 |
| Female | 9,968 (43.9%) | $23,838 |
| Total | 22,690 (100.0%) | $33,462 |
Earnings by Sex by Income Bracket in Dale County
The most common earnings brackets in Dale County are $75,000 to $99,999 for men (1,570 | 12.3%) and $17,500 to $19,999 for women (852 | 8.6%).
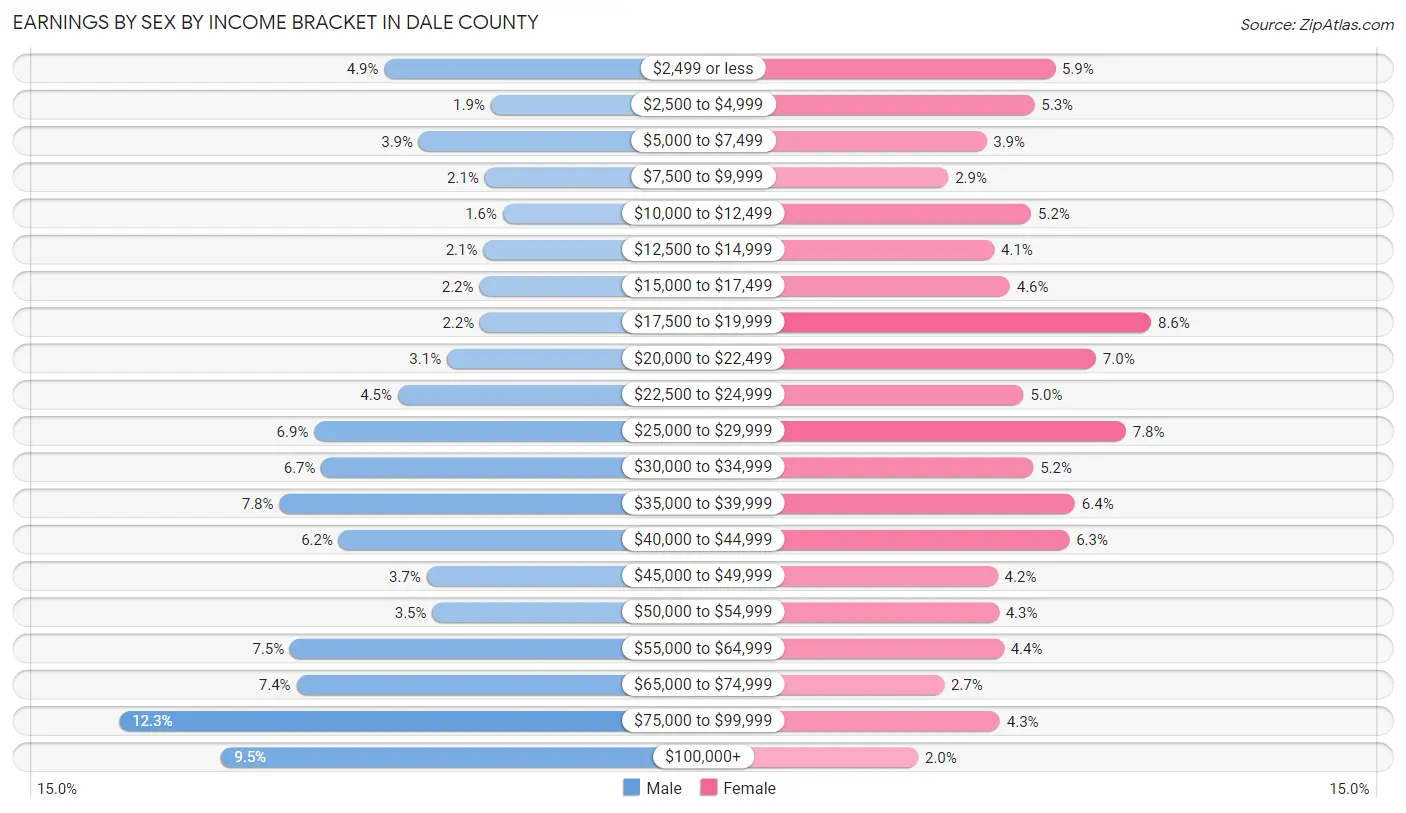
| Income | Male | Female |
| $2,499 or less | 622 (4.9%) | 583 (5.9%) |
| $2,500 to $4,999 | 242 (1.9%) | 525 (5.3%) |
| $5,000 to $7,499 | 499 (3.9%) | 391 (3.9%) |
| $7,500 to $9,999 | 263 (2.1%) | 284 (2.9%) |
| $10,000 to $12,499 | 199 (1.6%) | 516 (5.2%) |
| $12,500 to $14,999 | 269 (2.1%) | 413 (4.1%) |
| $15,000 to $17,499 | 282 (2.2%) | 457 (4.6%) |
| $17,500 to $19,999 | 280 (2.2%) | 852 (8.6%) |
| $20,000 to $22,499 | 398 (3.1%) | 698 (7.0%) |
| $22,500 to $24,999 | 574 (4.5%) | 495 (5.0%) |
| $25,000 to $29,999 | 873 (6.9%) | 781 (7.8%) |
| $30,000 to $34,999 | 847 (6.7%) | 522 (5.2%) |
| $35,000 to $39,999 | 998 (7.8%) | 639 (6.4%) |
| $40,000 to $44,999 | 785 (6.2%) | 623 (6.2%) |
| $45,000 to $49,999 | 471 (3.7%) | 423 (4.2%) |
| $50,000 to $54,999 | 450 (3.5%) | 426 (4.3%) |
| $55,000 to $64,999 | 959 (7.5%) | 440 (4.4%) |
| $65,000 to $74,999 | 936 (7.4%) | 272 (2.7%) |
| $75,000 to $99,999 | 1,570 (12.3%) | 429 (4.3%) |
| $100,000+ | 1,205 (9.5%) | 199 (2.0%) |
| Total | 12,722 (100.0%) | 9,968 (100.0%) |
Earnings by Sex by Educational Attainment in Dale County
Average earnings in Dale County are $45,409 for men and $27,667 for women, a difference of 39.1%. Men with an educational attainment of graduate degree enjoy the highest average annual earnings of $98,214, while those with less than high school education earn the least with $29,232. Women with an educational attainment of graduate degree earn the most with the average annual earnings of $54,417, while those with less than high school education have the smallest earnings of $18,293.
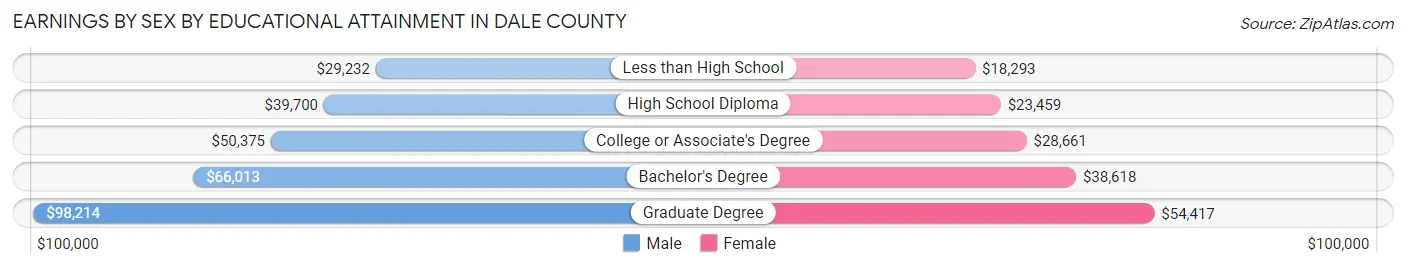
| Educational Attainment | Male Income | Female Income |
| Less than High School | $29,232 | $18,293 |
| High School Diploma | $39,700 | $23,459 |
| College or Associate's Degree | $50,375 | $28,661 |
| Bachelor's Degree | $66,013 | $38,618 |
| Graduate Degree | $98,214 | $54,417 |
| Total | $45,409 | $27,667 |
Family Income in Dale County
Family Income Brackets in Dale County
According to the Dale County family income data, there are 2,377 families falling into the $50,000 to $74,999 income range, which is the most common income bracket and makes up 19.4% of all families. Conversely, the $10,000 to $14,999 income bracket is the least frequent group with only 294 families (2.4%) belonging to this category.
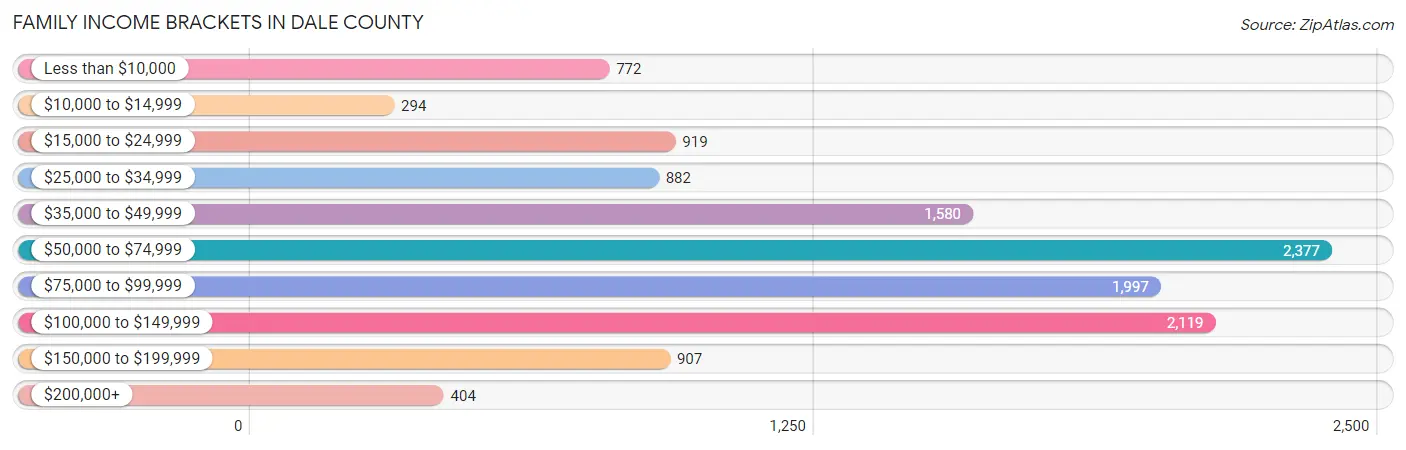
| Income Bracket | # Families | % Families |
| Less than $10,000 | 772 | 6.3% |
| $10,000 to $14,999 | 294 | 2.4% |
| $15,000 to $24,999 | 919 | 7.5% |
| $25,000 to $34,999 | 882 | 7.2% |
| $35,000 to $49,999 | 1,580 | 12.9% |
| $50,000 to $74,999 | 2,377 | 19.4% |
| $75,000 to $99,999 | 1,997 | 16.3% |
| $100,000 to $149,999 | 2,119 | 17.3% |
| $150,000 to $199,999 | 907 | 7.4% |
| $200,000+ | 404 | 3.3% |
Family Income by Famaliy Size in Dale County
7+ person families (41 | 0.3%) account for the highest median family income in Dale County with $76,563 per family, while 2-person families (6,171 | 50.4%) have the highest median income of $31,810 per family member.
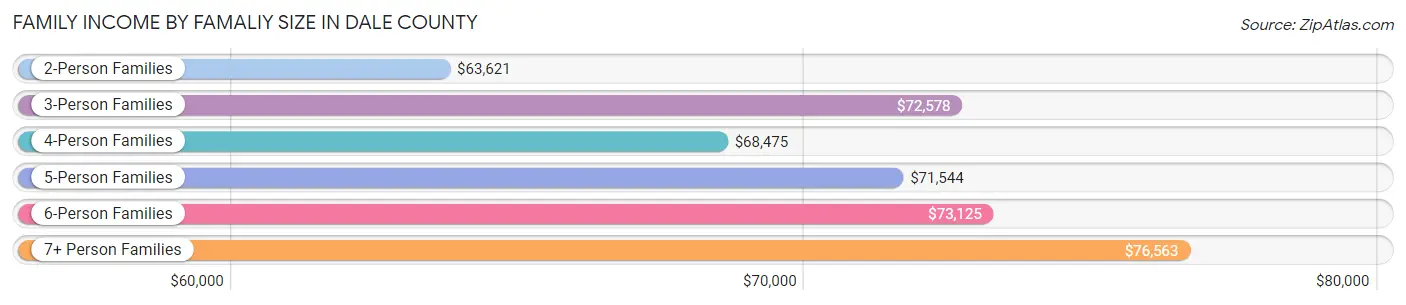
| Income Bracket | # Families | Median Income |
| 2-Person Families | 6,171 (50.4%) | $63,621 |
| 3-Person Families | 3,029 (24.7%) | $72,578 |
| 4-Person Families | 1,794 (14.6%) | $68,475 |
| 5-Person Families | 954 (7.8%) | $71,544 |
| 6-Person Families | 262 (2.1%) | $73,125 |
| 7+ Person Families | 41 (0.3%) | $76,563 |
| Total | 12,251 (100.0%) | $67,776 |
Family Income by Number of Earners in Dale County
The median family income in Dale County is $67,776, with families comprising 3+ earners (753) having the highest median family income of $105,777, while families with no earners (2,484) have the lowest median family income of $38,828, accounting for 6.1% and 20.3% of families, respectively.
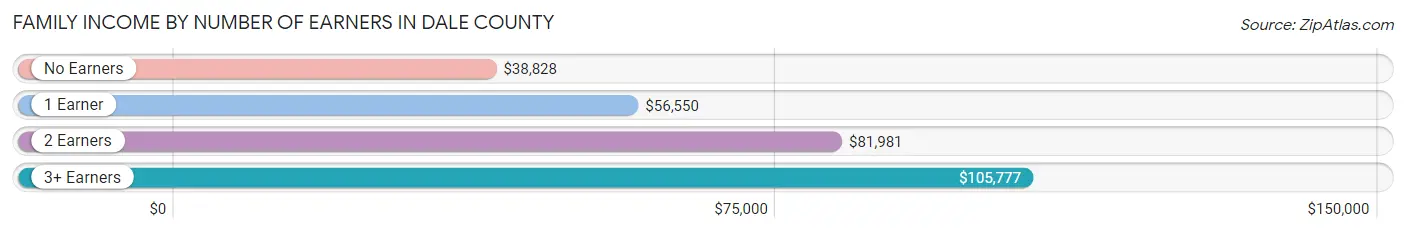
| Number of Earners | # Families | Median Income |
| No Earners | 2,484 (20.3%) | $38,828 |
| 1 Earner | 4,875 (39.8%) | $56,550 |
| 2 Earners | 4,139 (33.8%) | $81,981 |
| 3+ Earners | 753 (6.1%) | $105,777 |
| Total | 12,251 (100.0%) | $67,776 |
Household Income in Dale County
Household Income Brackets in Dale County
With 3,395 households falling in the category, the $50,000 to $74,999 income range is the most frequent in Dale County, accounting for 17.5% of all households. In contrast, only 524 households (2.7%) fall into the $200,000+ income bracket, making it the least populous group.
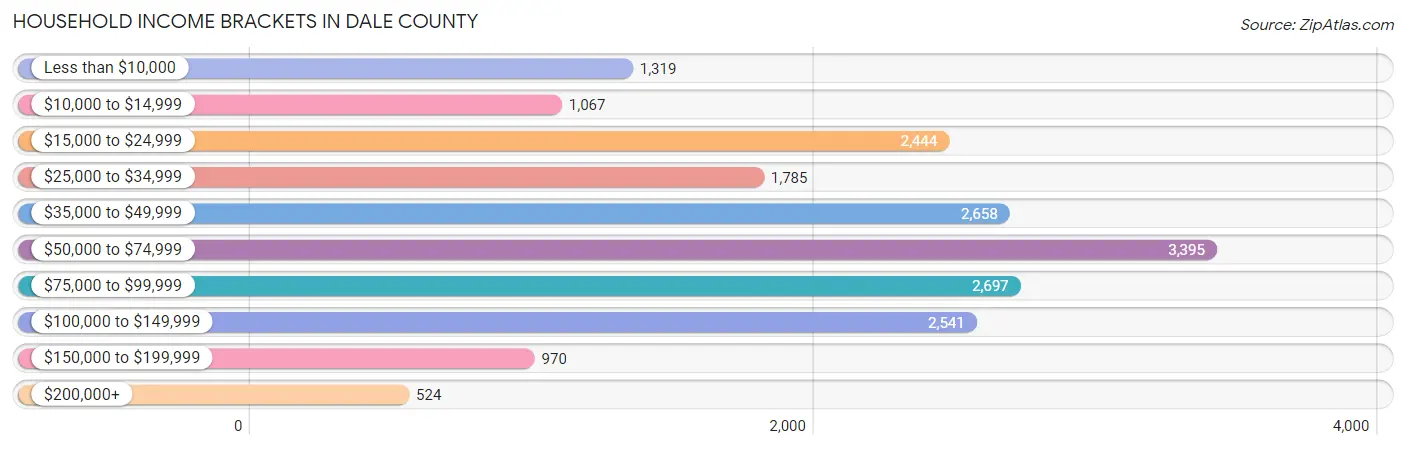
| Income Bracket | # Households | % Households |
| Less than $10,000 | 1,319 | 6.8% |
| $10,000 to $14,999 | 1,067 | 5.5% |
| $15,000 to $24,999 | 2,444 | 12.6% |
| $25,000 to $34,999 | 1,785 | 9.2% |
| $35,000 to $49,999 | 2,658 | 13.7% |
| $50,000 to $74,999 | 3,395 | 17.5% |
| $75,000 to $99,999 | 2,697 | 13.9% |
| $100,000 to $149,999 | 2,541 | 13.1% |
| $150,000 to $199,999 | 970 | 5.0% |
| $200,000+ | 524 | 2.7% |
Household Income by Householder Age in Dale County
The median household income in Dale County is $52,813, with the highest median household income of $58,874 found in the 45 to 64 years age bracket for the primary householder. A total of 7,065 households (36.4%) fall into this category. Meanwhile, the 15 to 24 years age bracket for the primary householder has the lowest median household income of $35,744, with 687 households (3.5%) in this group.
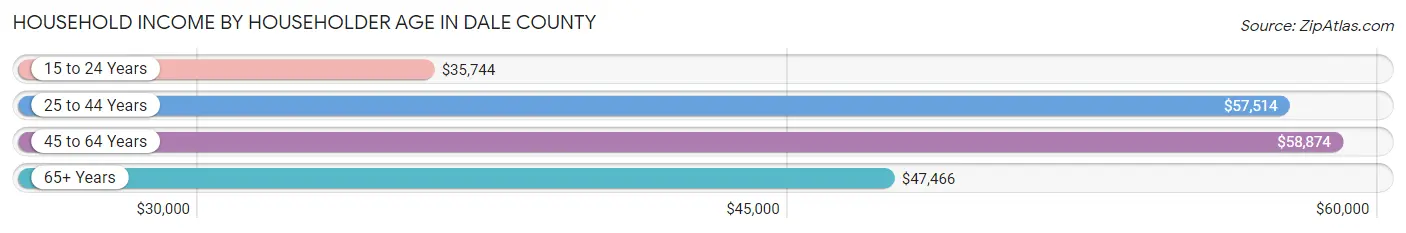
| Income Bracket | # Households | Median Income |
| 15 to 24 Years | 687 (3.5%) | $35,744 |
| 25 to 44 Years | 5,943 (30.6%) | $57,514 |
| 45 to 64 Years | 7,065 (36.4%) | $58,874 |
| 65+ Years | 5,705 (29.4%) | $47,466 |
| Total | 19,400 (100.0%) | $52,813 |
Poverty in Dale County
Income Below Poverty by Sex and Age in Dale County
With 16.4% poverty level for males and 18.6% for females among the residents of Dale County, 6 to 11 year old males and 5 year old females are the most vulnerable to poverty, with 1,121 males (46.5%) and 111 females (31.5%) in their respective age groups living below the poverty level.
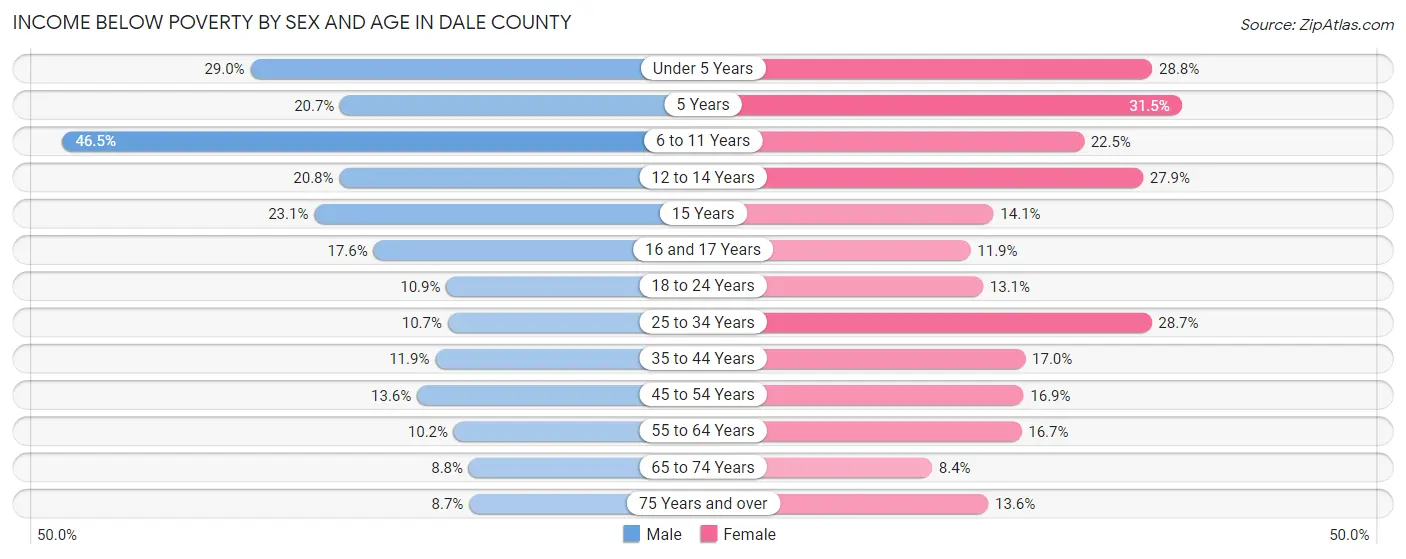
| Age Bracket | Male | Female |
| Under 5 Years | 469 (29.0%) | 436 (28.8%) |
| 5 Years | 35 (20.7%) | 111 (31.5%) |
| 6 to 11 Years | 1,121 (46.5%) | 361 (22.5%) |
| 12 to 14 Years | 131 (20.8%) | 280 (27.9%) |
| 15 Years | 89 (23.1%) | 47 (14.1%) |
| 16 and 17 Years | 105 (17.6%) | 65 (11.9%) |
| 18 to 24 Years | 212 (10.9%) | 266 (13.1%) |
| 25 to 34 Years | 367 (10.7%) | 959 (28.7%) |
| 35 to 44 Years | 344 (11.9%) | 514 (17.0%) |
| 45 to 54 Years | 372 (13.6%) | 503 (16.9%) |
| 55 to 64 Years | 306 (10.2%) | 556 (16.7%) |
| 65 to 74 Years | 225 (8.8%) | 218 (8.4%) |
| 75 Years and over | 120 (8.7%) | 257 (13.6%) |
| Total | 3,896 (16.4%) | 4,573 (18.6%) |
Income Above Poverty by Sex and Age in Dale County
According to the poverty statistics in Dale County, males aged 75 years and over and females aged 65 to 74 years are the age groups that are most secure financially, with 91.3% of males and 91.6% of females in these age groups living above the poverty line.
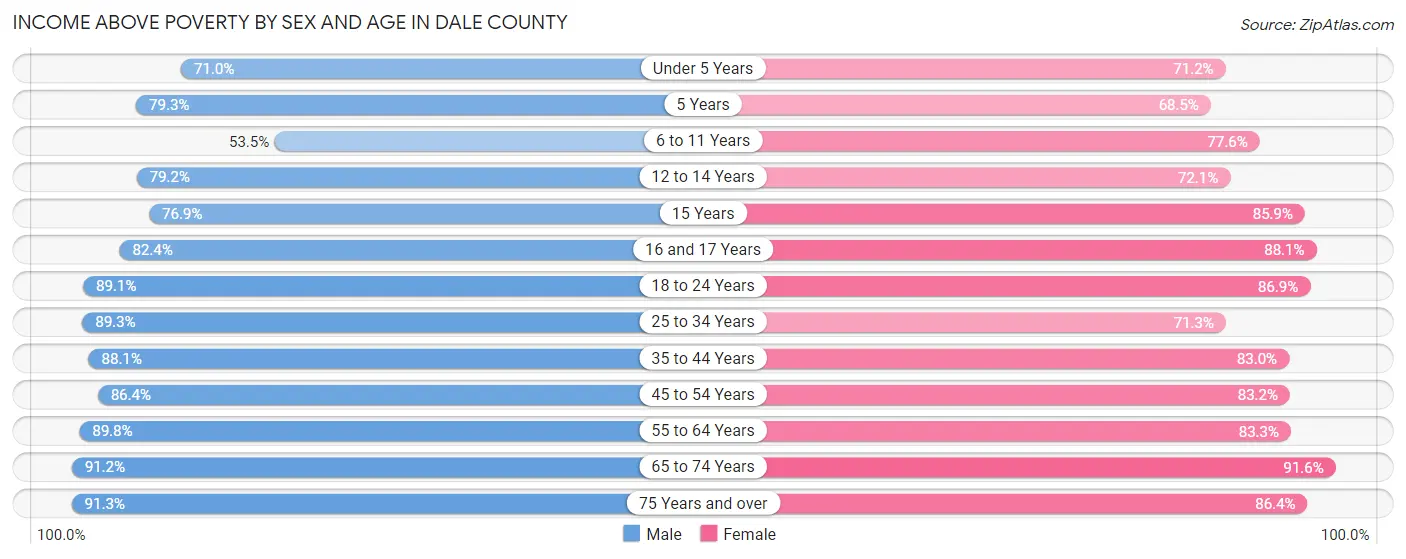
| Age Bracket | Male | Female |
| Under 5 Years | 1,146 (71.0%) | 1,078 (71.2%) |
| 5 Years | 134 (79.3%) | 241 (68.5%) |
| 6 to 11 Years | 1,291 (53.5%) | 1,247 (77.5%) |
| 12 to 14 Years | 499 (79.2%) | 722 (72.1%) |
| 15 Years | 296 (76.9%) | 287 (85.9%) |
| 16 and 17 Years | 491 (82.4%) | 480 (88.1%) |
| 18 to 24 Years | 1,741 (89.1%) | 1,766 (86.9%) |
| 25 to 34 Years | 3,058 (89.3%) | 2,379 (71.3%) |
| 35 to 44 Years | 2,550 (88.1%) | 2,508 (83.0%) |
| 45 to 54 Years | 2,370 (86.4%) | 2,482 (83.2%) |
| 55 to 64 Years | 2,707 (89.8%) | 2,781 (83.3%) |
| 65 to 74 Years | 2,341 (91.2%) | 2,390 (91.6%) |
| 75 Years and over | 1,253 (91.3%) | 1,635 (86.4%) |
| Total | 19,877 (83.6%) | 19,996 (81.4%) |
Income Below Poverty Among Married-Couple Families in Dale County
The poverty statistics for married-couple families in Dale County show that 5.0% or 422 of the total 8,522 families live below the poverty line. Families with 5 or more children have the highest poverty rate of 75.0%, comprising of 3 families. On the other hand, families with no children have the lowest poverty rate of 3.8%, which includes 204 families.
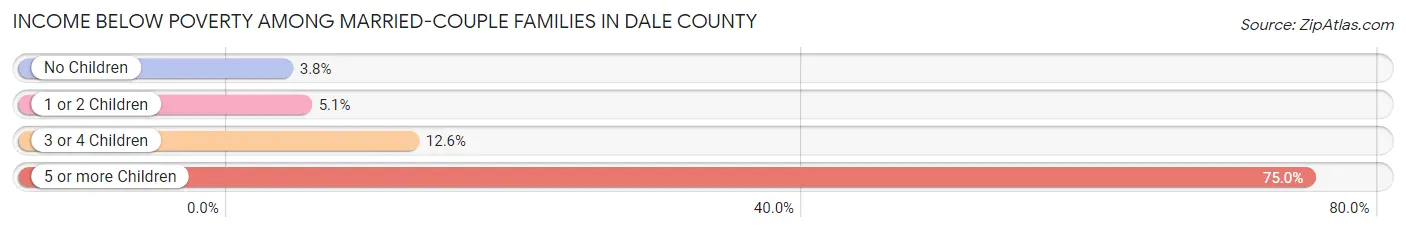
| Children | Above Poverty | Below Poverty |
| No Children | 5,151 (96.2%) | 204 (3.8%) |
| 1 or 2 Children | 2,330 (94.9%) | 126 (5.1%) |
| 3 or 4 Children | 618 (87.4%) | 89 (12.6%) |
| 5 or more Children | 1 (25.0%) | 3 (75.0%) |
| Total | 8,100 (95.1%) | 422 (5.0%) |
Income Below Poverty Among Single-Parent Households in Dale County
According to the poverty data in Dale County, 24.5% or 149 single-father households and 35.7% or 1,113 single-mother households are living below the poverty line. Among single-father households, those with 3 or 4 children have the highest poverty rate, with 13 households (39.4%) experiencing poverty. Likewise, among single-mother households, those with 3 or 4 children have the highest poverty rate, with 331 households (69.4%) falling below the poverty line.
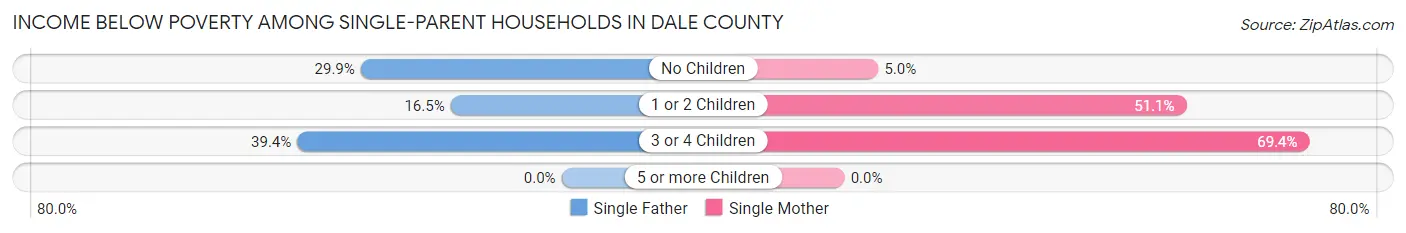
| Children | Single Father | Single Mother |
| No Children | 91 (29.9%) | 62 (5.0%) |
| 1 or 2 Children | 45 (16.5%) | 720 (51.1%) |
| 3 or 4 Children | 13 (39.4%) | 331 (69.4%) |
| 5 or more Children | 0 (0.0%) | 0 (0.0%) |
| Total | 149 (24.5%) | 1,113 (35.7%) |
Income Below Poverty Among Married-Couple vs Single-Parent Households in Dale County
The poverty data for Dale County shows that 422 of the married-couple family households (5.0%) and 1,262 of the single-parent households (33.8%) are living below the poverty level. Within the married-couple family households, those with 5 or more children have the highest poverty rate, with 3 households (75.0%) falling below the poverty line. Among the single-parent households, those with 3 or 4 children have the highest poverty rate, with 344 household (67.4%) living below poverty.
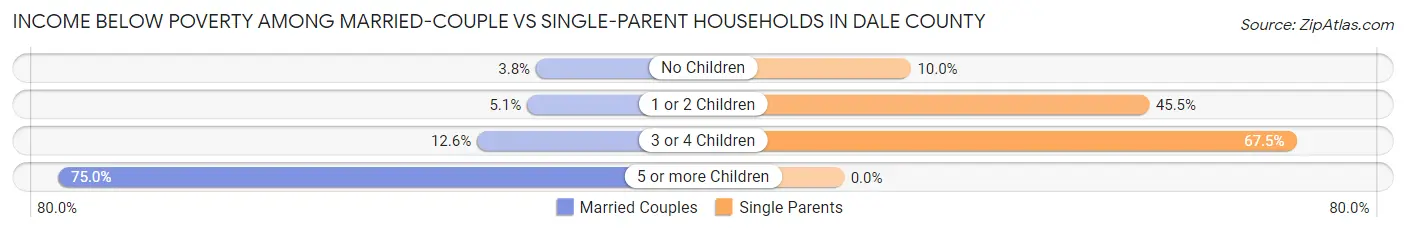
| Children | Married-Couple Families | Single-Parent Households |
| No Children | 204 (3.8%) | 153 (10.0%) |
| 1 or 2 Children | 126 (5.1%) | 765 (45.5%) |
| 3 or 4 Children | 89 (12.6%) | 344 (67.4%) |
| 5 or more Children | 3 (75.0%) | 0 (0.0%) |
| Total | 422 (5.0%) | 1,262 (33.8%) |
Race in Dale County
The most populous races in Dale County are White / Caucasian (34,817 | 70.4%), Black / African American (10,416 | 21.1%), and Hispanic or Latino (3,467 | 7.0%).
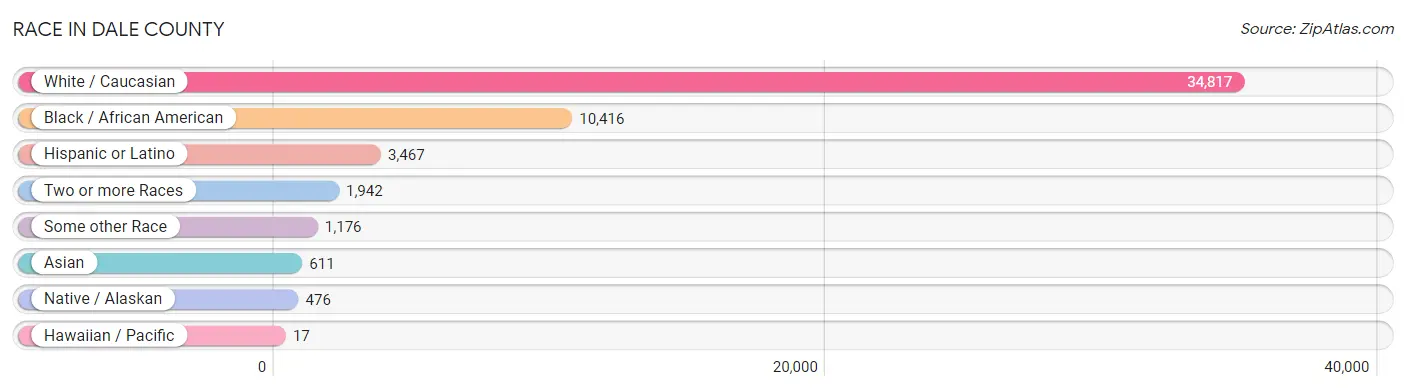
| Race | # Population | % Population |
| Asian | 611 | 1.2% |
| Black / African American | 10,416 | 21.1% |
| Hawaiian / Pacific | 17 | 0.0% |
| Hispanic or Latino | 3,467 | 7.0% |
| Native / Alaskan | 476 | 1.0% |
| White / Caucasian | 34,817 | 70.4% |
| Two or more Races | 1,942 | 3.9% |
| Some other Race | 1,176 | 2.4% |
| Total | 49,455 | 100.0% |
Ancestry in Dale County
The most populous ancestries reported in Dale County are American (8,057 | 16.3%), English (3,767 | 7.6%), Irish (3,386 | 6.9%), German (3,254 | 6.6%), and Mexican (2,025 | 4.1%), together accounting for 41.4% of all Dale County residents.
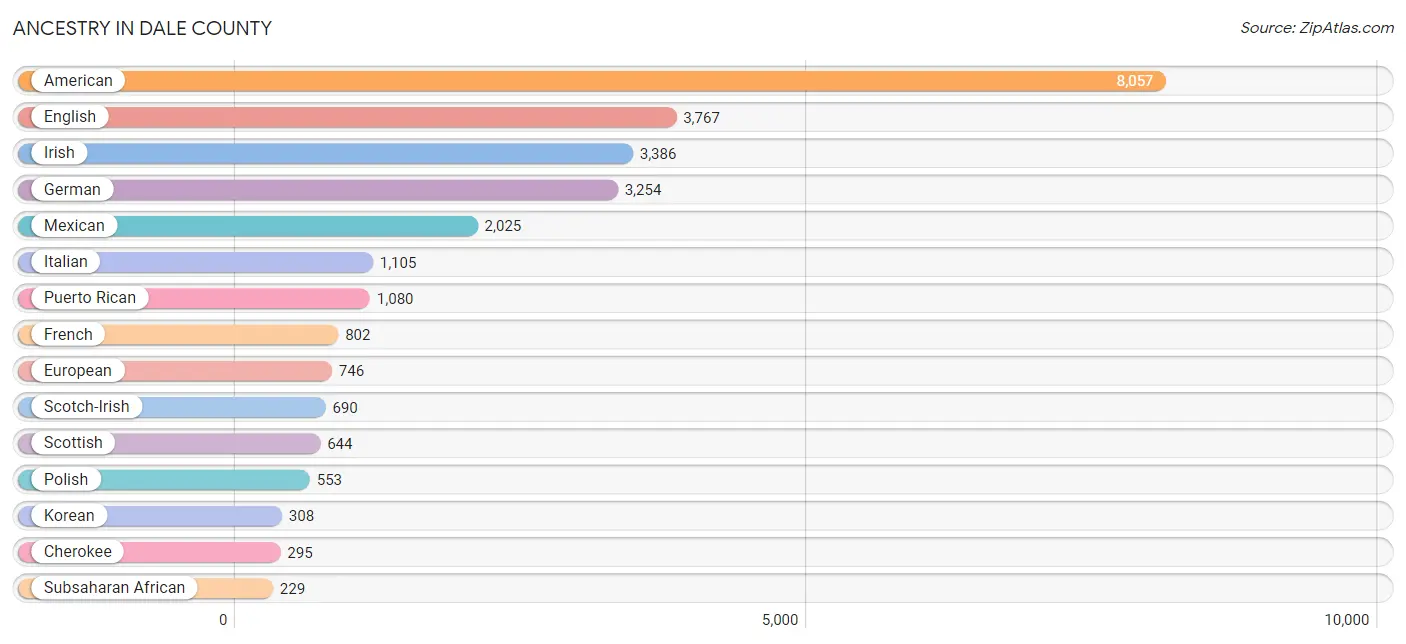
| Ancestry | # Population | % Population |
| African | 201 | 0.4% |
| American | 8,057 | 16.3% |
| Apache | 15 | 0.0% |
| Arab | 9 | 0.0% |
| Austrian | 25 | 0.1% |
| Bhutanese | 201 | 0.4% |
| Blackfeet | 44 | 0.1% |
| British | 133 | 0.3% |
| Burmese | 167 | 0.3% |
| Cajun | 3 | 0.0% |
| Canadian | 13 | 0.0% |
| Central American | 111 | 0.2% |
| Cherokee | 295 | 0.6% |
| Chickasaw | 14 | 0.0% |
| Chippewa | 19 | 0.0% |
| Choctaw | 24 | 0.1% |
| Colombian | 3 | 0.0% |
| Creek | 142 | 0.3% |
| Croatian | 39 | 0.1% |
| Crow | 77 | 0.2% |
| Cuban | 62 | 0.1% |
| Czech | 117 | 0.2% |
| Czechoslovakian | 11 | 0.0% |
| Danish | 84 | 0.2% |
| Dominican | 57 | 0.1% |
| Dutch | 153 | 0.3% |
| Eastern European | 61 | 0.1% |
| Ecuadorian | 5 | 0.0% |
| English | 3,767 | 7.6% |
| European | 746 | 1.5% |
| Filipino | 6 | 0.0% |
| French | 802 | 1.6% |
| French Canadian | 86 | 0.2% |
| German | 3,254 | 6.6% |
| Greek | 92 | 0.2% |
| Guatemalan | 4 | 0.0% |
| Hungarian | 112 | 0.2% |
| Icelander | 1 | 0.0% |
| Indian (Asian) | 97 | 0.2% |
| Irish | 3,386 | 6.9% |
| Iroquois | 53 | 0.1% |
| Italian | 1,105 | 2.2% |
| Jamaican | 17 | 0.0% |
| Japanese | 96 | 0.2% |
| Korean | 308 | 0.6% |
| Lebanese | 9 | 0.0% |
| Lithuanian | 3 | 0.0% |
| Malaysian | 6 | 0.0% |
| Mexican | 2,025 | 4.1% |
| Mexican American Indian | 149 | 0.3% |
| Native Hawaiian | 61 | 0.1% |
| Navajo | 13 | 0.0% |
| New Zealander | 43 | 0.1% |
| Nigerian | 18 | 0.0% |
| Northern European | 2 | 0.0% |
| Norwegian | 205 | 0.4% |
| Pakistani | 91 | 0.2% |
| Panamanian | 95 | 0.2% |
| Pennsylvania German | 53 | 0.1% |
| Peruvian | 20 | 0.0% |
| Polish | 553 | 1.1% |
| Portuguese | 25 | 0.1% |
| Puerto Rican | 1,080 | 2.2% |
| Romanian | 28 | 0.1% |
| Russian | 26 | 0.1% |
| Scandinavian | 170 | 0.3% |
| Scotch-Irish | 690 | 1.4% |
| Scottish | 644 | 1.3% |
| Seminole | 29 | 0.1% |
| Serbian | 18 | 0.0% |
| Sioux | 102 | 0.2% |
| Slavic | 1 | 0.0% |
| Slovak | 5 | 0.0% |
| South American | 28 | 0.1% |
| Spaniard | 34 | 0.1% |
| Spanish | 54 | 0.1% |
| Spanish American Indian | 55 | 0.1% |
| Sri Lankan | 30 | 0.1% |
| Subsaharan African | 229 | 0.5% |
| Swedish | 177 | 0.4% |
| Swiss | 24 | 0.1% |
| Thai | 27 | 0.1% |
| Trinidadian and Tobagonian | 36 | 0.1% |
| Ute | 10 | 0.0% |
| Welsh | 209 | 0.4% |
| West Indian | 3 | 0.0% | View All 86 Rows |
Immigrants in Dale County
The most numerous immigrant groups reported in Dale County came from Latin America (587 | 1.2%), Central America (524 | 1.1%), Europe (518 | 1.1%), Asia (493 | 1.0%), and Mexico (477 | 1.0%), together accounting for 5.3% of all Dale County residents.
| Immigration Origin | # Population | % Population |
| Africa | 7 | 0.0% |
| Asia | 493 | 1.0% |
| Austria | 3 | 0.0% |
| Barbados | 16 | 0.0% |
| Belgium | 14 | 0.0% |
| Cambodia | 96 | 0.2% |
| Caribbean | 28 | 0.1% |
| Central America | 524 | 1.1% |
| China | 26 | 0.1% |
| Cuba | 9 | 0.0% |
| Eastern Asia | 177 | 0.4% |
| Eastern Europe | 54 | 0.1% |
| England | 12 | 0.0% |
| Europe | 518 | 1.1% |
| France | 34 | 0.1% |
| Germany | 296 | 0.6% |
| Guatemala | 13 | 0.0% |
| Hungary | 18 | 0.0% |
| India | 14 | 0.0% |
| Iran | 7 | 0.0% |
| Ireland | 16 | 0.0% |
| Italy | 79 | 0.2% |
| Jamaica | 3 | 0.0% |
| Japan | 30 | 0.1% |
| Korea | 121 | 0.2% |
| Latin America | 587 | 1.2% |
| Mexico | 477 | 1.0% |
| Northern Europe | 38 | 0.1% |
| Oceania | 59 | 0.1% |
| Panama | 34 | 0.1% |
| Philippines | 101 | 0.2% |
| Poland | 7 | 0.0% |
| Romania | 19 | 0.0% |
| Russia | 10 | 0.0% |
| Scotland | 7 | 0.0% |
| South Africa | 7 | 0.0% |
| South America | 35 | 0.1% |
| South Central Asia | 21 | 0.0% |
| South Eastern Asia | 295 | 0.6% |
| Southern Europe | 79 | 0.2% |
| Thailand | 85 | 0.2% |
| Vietnam | 13 | 0.0% |
| Western Europe | 347 | 0.7% | View All 43 Rows |
Sex and Age in Dale County
Sex and Age in Dale County
The most populous age groups in Dale County are 25 to 29 Years (1,895 | 7.7%) for men and 55 to 59 Years (1,714 | 6.9%) for women.
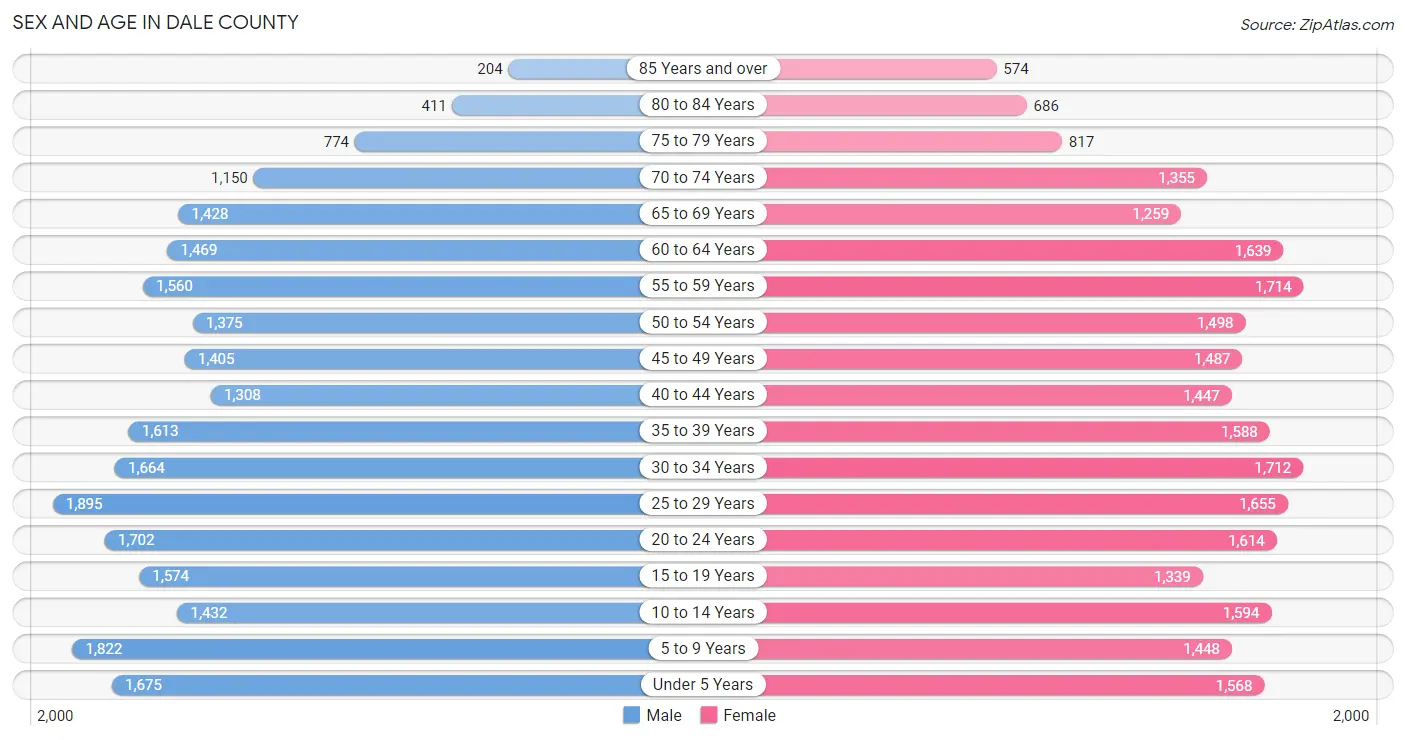
| Age Bracket | Male | Female |
| Under 5 Years | 1,675 (6.9%) | 1,568 (6.3%) |
| 5 to 9 Years | 1,822 (7.4%) | 1,448 (5.8%) |
| 10 to 14 Years | 1,432 (5.9%) | 1,594 (6.4%) |
| 15 to 19 Years | 1,574 (6.4%) | 1,339 (5.4%) |
| 20 to 24 Years | 1,702 (7.0%) | 1,614 (6.5%) |
| 25 to 29 Years | 1,895 (7.7%) | 1,655 (6.6%) |
| 30 to 34 Years | 1,664 (6.8%) | 1,712 (6.9%) |
| 35 to 39 Years | 1,613 (6.6%) | 1,588 (6.4%) |
| 40 to 44 Years | 1,308 (5.3%) | 1,447 (5.8%) |
| 45 to 49 Years | 1,405 (5.7%) | 1,487 (5.9%) |
| 50 to 54 Years | 1,375 (5.6%) | 1,498 (6.0%) |
| 55 to 59 Years | 1,560 (6.4%) | 1,714 (6.9%) |
| 60 to 64 Years | 1,469 (6.0%) | 1,639 (6.6%) |
| 65 to 69 Years | 1,428 (5.8%) | 1,259 (5.0%) |
| 70 to 74 Years | 1,150 (4.7%) | 1,355 (5.4%) |
| 75 to 79 Years | 774 (3.2%) | 817 (3.3%) |
| 80 to 84 Years | 411 (1.7%) | 686 (2.7%) |
| 85 Years and over | 204 (0.8%) | 574 (2.3%) |
| Total | 24,461 (100.0%) | 24,994 (100.0%) |
Families and Households in Dale County
Median Family Size in Dale County
The median family size in Dale County is 3.17 persons per family, with single male/father families (609 | 5.0%) accounting for the largest median family size of 3.23 persons per family. On the other hand, married-couple families (8,522 | 69.6%) represent the smallest median family size with 3.16 persons per family.
| Family Type | # Families | Family Size |
| Married-Couple | 8,522 (69.6%) | 3.16 |
| Single Male/Father | 609 (5.0%) | 3.23 |
| Single Female/Mother | 3,120 (25.5%) | 3.21 |
| Total Families | 12,251 (100.0%) | 3.17 |
Median Household Size in Dale County
The median household size in Dale County is 2.50 persons per household, with single male/father households (609 | 3.1%) accounting for the largest median household size of 3.76 persons per household. non-family households (7,149 | 36.8%) represent the smallest median household size with 1.20 persons per household.
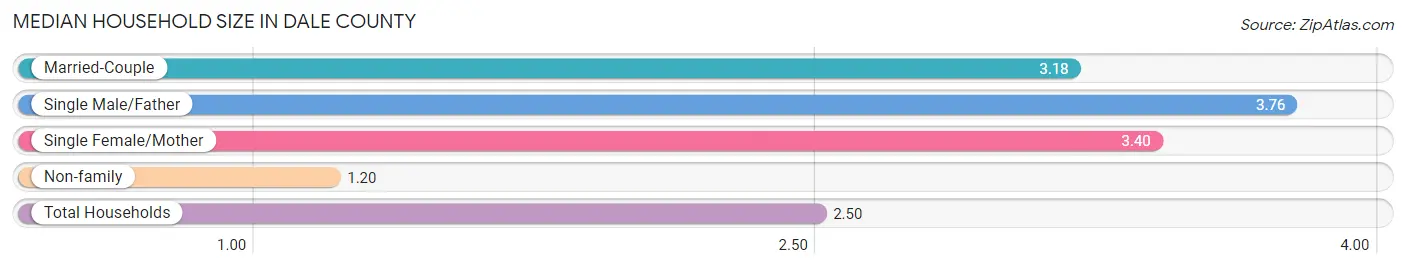
| Household Type | # Households | Household Size |
| Married-Couple | 8,522 (43.9%) | 3.18 |
| Single Male/Father | 609 (3.1%) | 3.76 |
| Single Female/Mother | 3,120 (16.1%) | 3.40 |
| Non-family | 7,149 (36.8%) | 1.20 |
| Total Households | 19,400 (100.0%) | 2.50 |
Household Size by Marriage Status in Dale County
Out of a total of 19,400 households in Dale County, 12,251 (63.1%) are family households, while 7,149 (36.8%) are nonfamily households. The most numerous type of family households are 2-person households, comprising 5,885, and the most common type of nonfamily households are 1-person households, comprising 6,267.
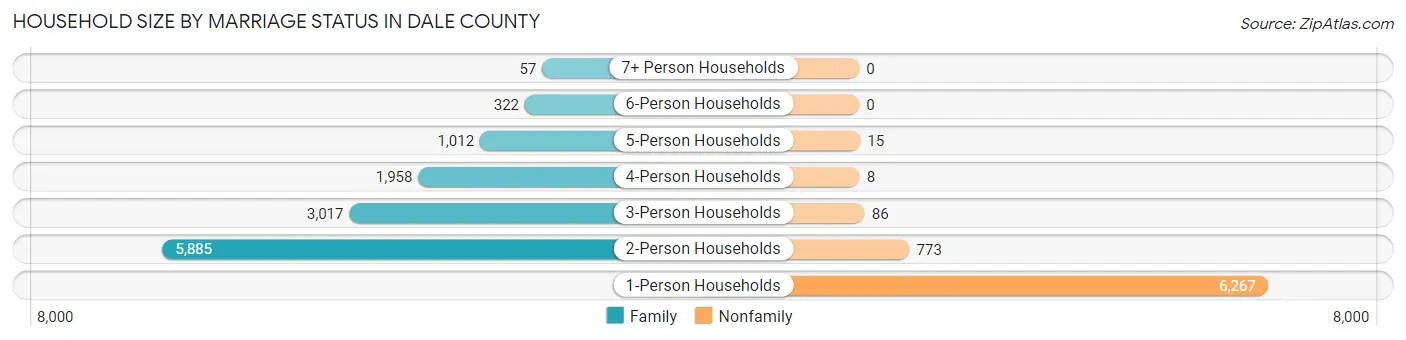
| Household Size | Family Households | Nonfamily Households |
| 1-Person Households | - | 6,267 (32.3%) |
| 2-Person Households | 5,885 (30.3%) | 773 (4.0%) |
| 3-Person Households | 3,017 (15.5%) | 86 (0.4%) |
| 4-Person Households | 1,958 (10.1%) | 8 (0.0%) |
| 5-Person Households | 1,012 (5.2%) | 15 (0.1%) |
| 6-Person Households | 322 (1.7%) | 0 (0.0%) |
| 7+ Person Households | 57 (0.3%) | 0 (0.0%) |
| Total | 12,251 (63.1%) | 7,149 (36.8%) |
Female Fertility in Dale County
Fertility by Age in Dale County
Average fertility rate in Dale County is 54.0 births per 1,000 women. Women in the age bracket of 20 to 34 years have the highest fertility rate with 98.0 births per 1,000 women. Women in the age bracket of 20 to 34 years acount for 81.7% of all women with births.
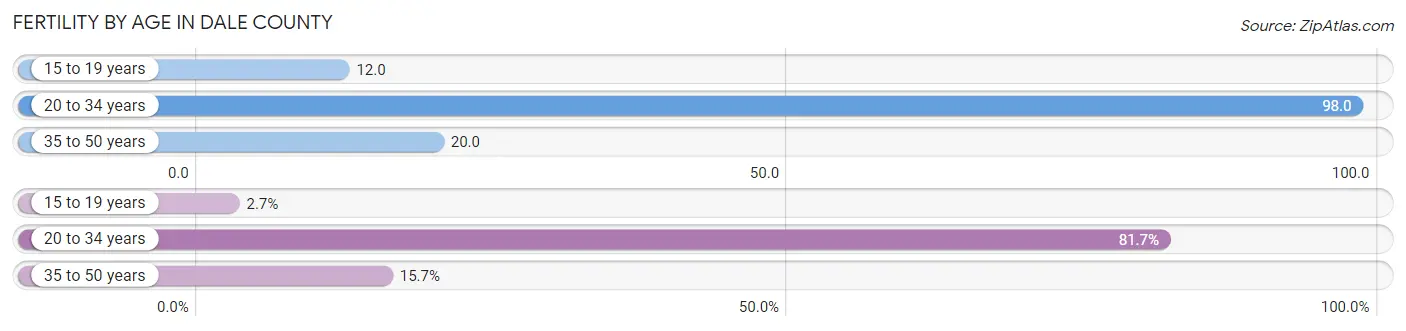
| Age Bracket | Women with Births | Births / 1,000 Women |
| 15 to 19 years | 16 (2.7%) | 12.0 |
| 20 to 34 years | 490 (81.7%) | 98.0 |
| 35 to 50 years | 94 (15.7%) | 20.0 |
| Total | 600 (100.0%) | 54.0 |
Fertility by Age by Marriage Status in Dale County
68.0% of women with births (600) in Dale County are married. The highest percentage of unmarried women with births falls into 15 to 19 years age bracket with 100.0% of them unmarried at the time of birth, while the lowest percentage of unmarried women with births belong to 35 to 50 years age bracket with 12.8% of them unmarried.
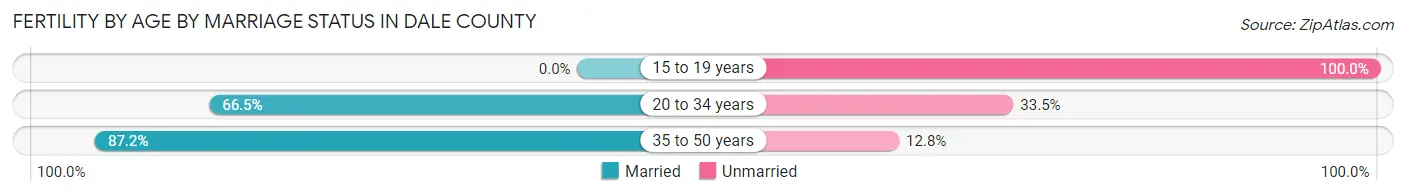
| Age Bracket | Married | Unmarried |
| 15 to 19 years | 0 (0.0%) | 16 (100.0%) |
| 20 to 34 years | 326 (66.5%) | 164 (33.5%) |
| 35 to 50 years | 82 (87.2%) | 12 (12.8%) |
| Total | 408 (68.0%) | 192 (32.0%) |
Fertility by Education in Dale County
Average fertility rate in Dale County is 54.0 births per 1,000 women. Women with the education attainment of college or associate's degree have the highest fertility rate of 78.0 births per 1,000 women, while women with the education attainment of high school diploma have the lowest fertility at 32.0 births per 1,000 women. Women with the education attainment of college or associate's degree represent 52.5% of all women with births.
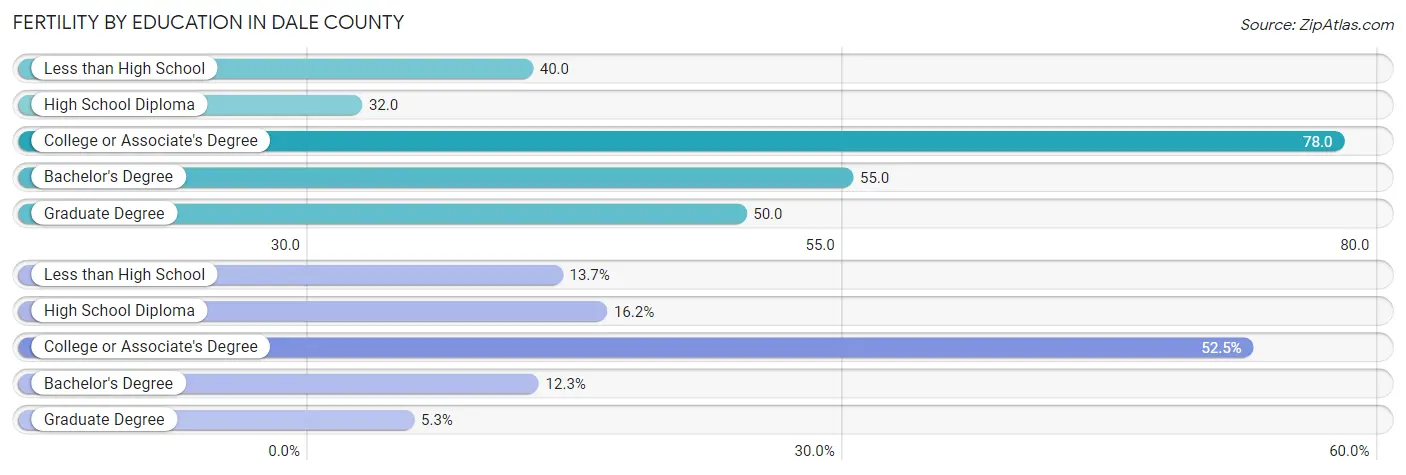
| Educational Attainment | Women with Births | Births / 1,000 Women |
| Less than High School | 82 (13.7%) | 40.0 |
| High School Diploma | 97 (16.2%) | 32.0 |
| College or Associate's Degree | 315 (52.5%) | 78.0 |
| Bachelor's Degree | 74 (12.3%) | 55.0 |
| Graduate Degree | 32 (5.3%) | 50.0 |
| Total | 600 (100.0%) | 54.0 |
Fertility by Education by Marriage Status in Dale County
32.0% of women with births in Dale County are unmarried. Women with the educational attainment of graduate degree are most likely to be married with 100.0% of them married at childbirth, while women with the educational attainment of less than high school are least likely to be married with 64.6% of them unmarried at childbirth.
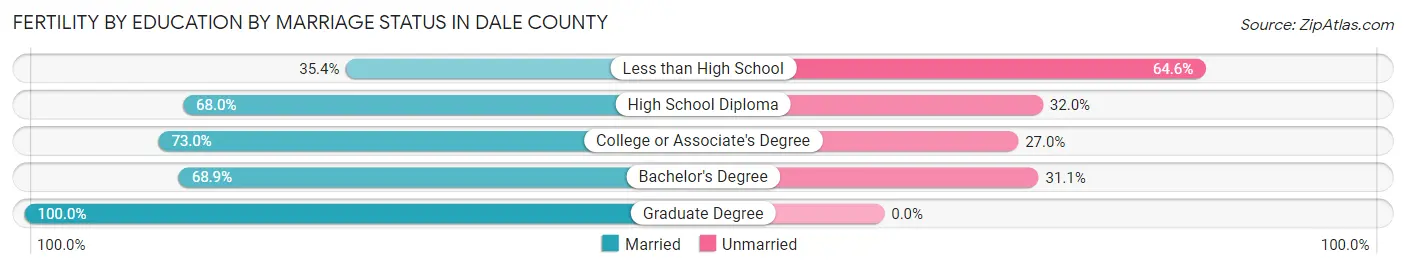
| Educational Attainment | Married | Unmarried |
| Less than High School | 29 (35.4%) | 53 (64.6%) |
| High School Diploma | 66 (68.0%) | 31 (32.0%) |
| College or Associate's Degree | 230 (73.0%) | 85 (27.0%) |
| Bachelor's Degree | 51 (68.9%) | 23 (31.1%) |
| Graduate Degree | 32 (100.0%) | 0 (0.0%) |
| Total | 408 (68.0%) | 192 (32.0%) |
Employment Characteristics in Dale County
Employment by Class of Employer in Dale County
Among the 19,769 employed individuals in Dale County, private company employees (11,692 | 59.1%), federal government employees (3,654 | 18.5%), and local government employees (1,200 | 6.1%) make up the most common classes of employment.
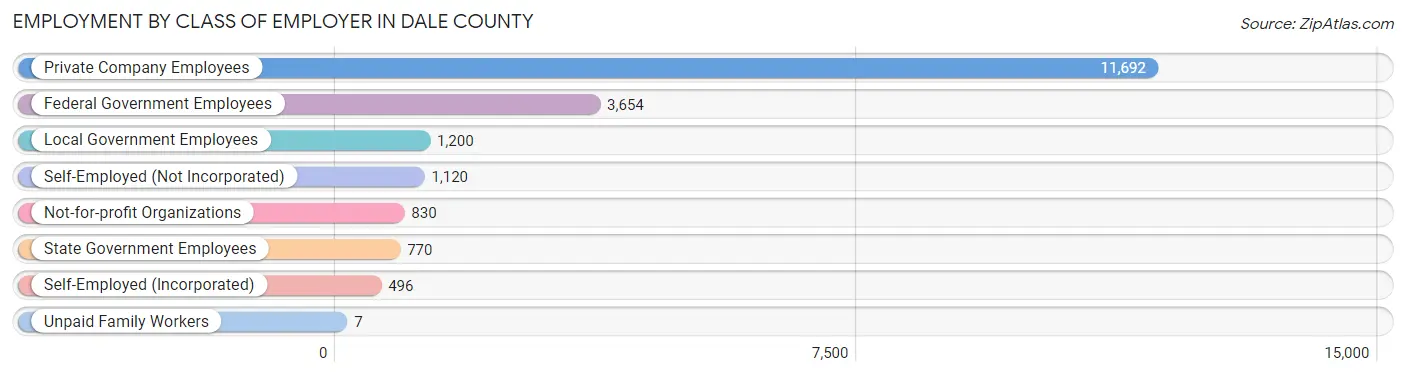
| Employer Class | # Employees | % Employees |
| Private Company Employees | 11,692 | 59.1% |
| Self-Employed (Incorporated) | 496 | 2.5% |
| Self-Employed (Not Incorporated) | 1,120 | 5.7% |
| Not-for-profit Organizations | 830 | 4.2% |
| Local Government Employees | 1,200 | 6.1% |
| State Government Employees | 770 | 3.9% |
| Federal Government Employees | 3,654 | 18.5% |
| Unpaid Family Workers | 7 | 0.0% |
| Total | 19,769 | 100.0% |
Employment Status by Age in Dale County
According to the labor force statistics for Dale County, out of the total population over 16 years of age (39,197), 55.8% or 21,872 individuals are in the labor force, with 7.8% or 1,706 of them unemployed. The age group with the highest labor force participation rate is 25 to 29 years, with 80.6% or 2,861 individuals in the labor force. Within the labor force, the 16 to 19 years age range has the highest percentage of unemployed individuals, with 22.3% or 204 of them being unemployed.
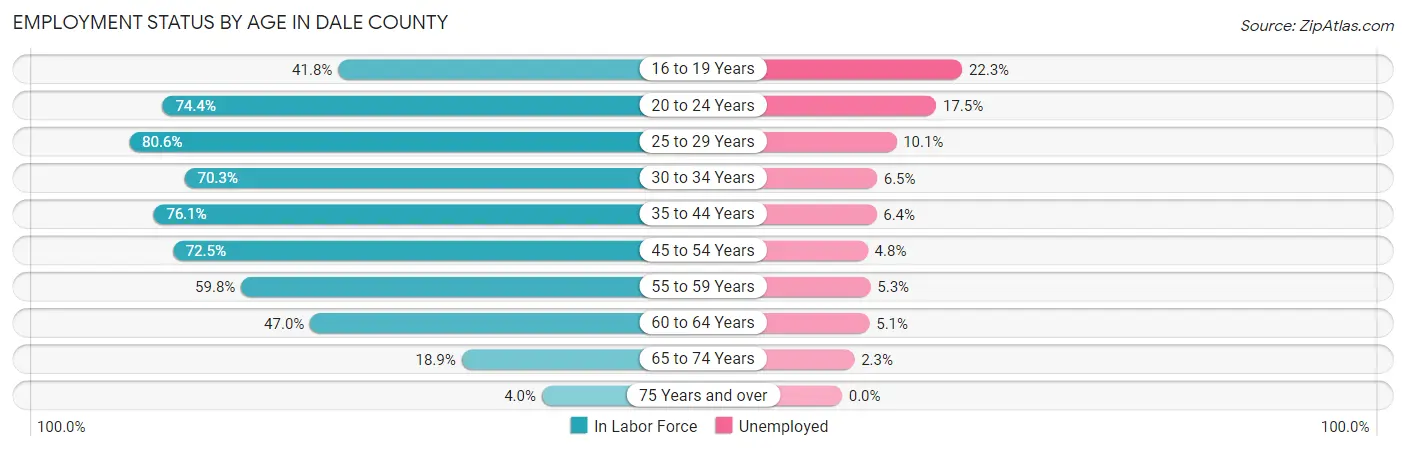
| Age Bracket | In Labor Force | Unemployed |
| 16 to 19 Years | 917 (41.8%) | 204 (22.3%) |
| 20 to 24 Years | 2,467 (74.4%) | 432 (17.5%) |
| 25 to 29 Years | 2,861 (80.6%) | 289 (10.1%) |
| 30 to 34 Years | 2,373 (70.3%) | 154 (6.5%) |
| 35 to 44 Years | 4,533 (76.1%) | 290 (6.4%) |
| 45 to 54 Years | 4,180 (72.5%) | 201 (4.8%) |
| 55 to 59 Years | 1,958 (59.8%) | 104 (5.3%) |
| 60 to 64 Years | 1,461 (47.0%) | 75 (5.1%) |
| 65 to 74 Years | 981 (18.9%) | 23 (2.3%) |
| 75 Years and over | 139 (4.0%) | 0 (0.0%) |
| Total | 21,872 (55.8%) | 1,706 (7.8%) |
Employment Status by Educational Attainment in Dale County
According to labor force statistics for Dale County, 69.4% of individuals (17,370) out of the total population between 25 and 64 years of age (25,029) are in the labor force, with 6.3% or 1,094 of them being unemployed. The group with the highest labor force participation rate are those with the educational attainment of bachelor's degree or higher, with 79.2% or 3,935 individuals in the labor force. Within the labor force, individuals with less than high school education have the highest percentage of unemployment, with 10.9% or 189 of them being unemployed.
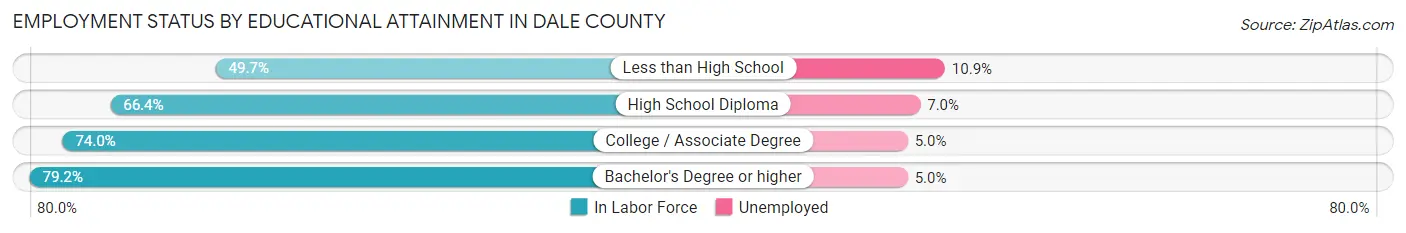
| Educational Attainment | In Labor Force | Unemployed |
| Less than High School | 1,732 (49.7%) | 380 (10.9%) |
| High School Diploma | 5,008 (66.4%) | 528 (7.0%) |
| College / Associate Degree | 6,685 (74.0%) | 452 (5.0%) |
| Bachelor's Degree or higher | 3,935 (79.2%) | 248 (5.0%) |
| Total | 17,370 (69.4%) | 1,577 (6.3%) |
Employment Occupations by Sex in Dale County
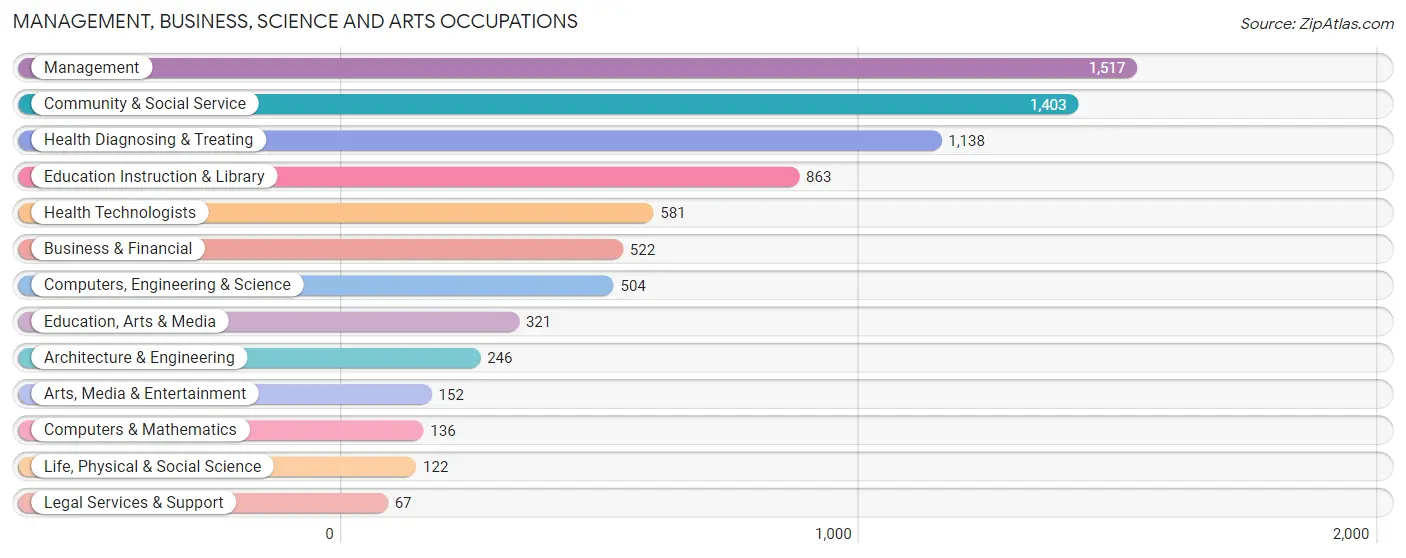
Management, Business, Science and Arts Occupations
The most common Management, Business, Science and Arts occupations in Dale County are Management (1,517 | 8.4%), Community & Social Service (1,403 | 7.7%), Health Diagnosing & Treating (1,138 | 6.3%), Education Instruction & Library (863 | 4.8%), and Health Technologists (581 | 3.2%).
Management, Business, Science and Arts Occupations by Sex
Within the Management, Business, Science and Arts occupations in Dale County, the most male-oriented occupations are Architecture & Engineering (89.4%), Computers, Engineering & Science (73.0%), and Computers & Mathematics (72.8%), while the most female-oriented occupations are Health Diagnosing & Treating (81.8%), Health Technologists (79.7%), and Education, Arts & Media (76.9%).
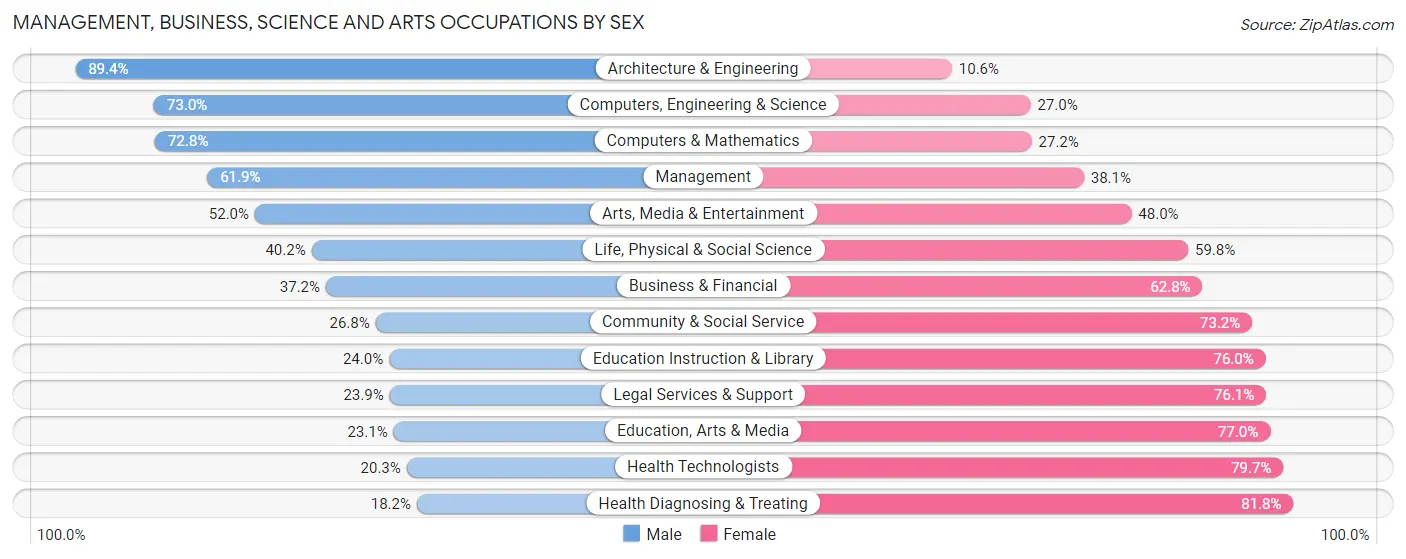
| Occupation | Male | Female |
| Management | 939 (61.9%) | 578 (38.1%) |
| Business & Financial | 194 (37.2%) | 328 (62.8%) |
| Computers, Engineering & Science | 368 (73.0%) | 136 (27.0%) |
| Computers & Mathematics | 99 (72.8%) | 37 (27.2%) |
| Architecture & Engineering | 220 (89.4%) | 26 (10.6%) |
| Life, Physical & Social Science | 49 (40.2%) | 73 (59.8%) |
| Community & Social Service | 376 (26.8%) | 1,027 (73.2%) |
| Education, Arts & Media | 74 (23.1%) | 247 (76.9%) |
| Legal Services & Support | 16 (23.9%) | 51 (76.1%) |
| Education Instruction & Library | 207 (24.0%) | 656 (76.0%) |
| Arts, Media & Entertainment | 79 (52.0%) | 73 (48.0%) |
| Health Diagnosing & Treating | 207 (18.2%) | 931 (81.8%) |
| Health Technologists | 118 (20.3%) | 463 (79.7%) |
| Total (Category) | 2,084 (41.0%) | 3,000 (59.0%) |
| Total (Overall) | 9,578 (52.9%) | 8,537 (47.1%) |
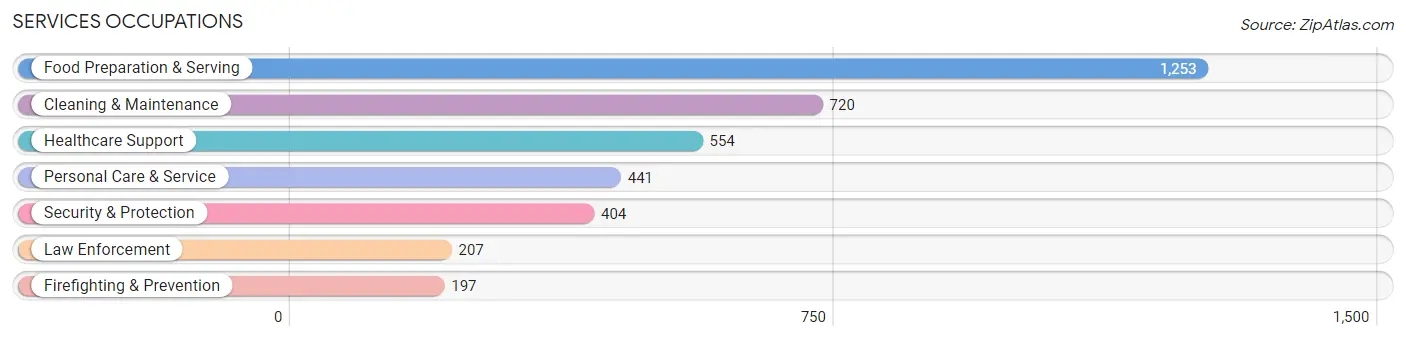
Services Occupations
The most common Services occupations in Dale County are Food Preparation & Serving (1,253 | 6.9%), Cleaning & Maintenance (720 | 4.0%), Healthcare Support (554 | 3.1%), Personal Care & Service (441 | 2.4%), and Security & Protection (404 | 2.2%).
Services Occupations by Sex
Within the Services occupations in Dale County, the most male-oriented occupations are Law Enforcement (89.9%), Security & Protection (84.9%), and Firefighting & Prevention (79.7%), while the most female-oriented occupations are Healthcare Support (88.6%), Personal Care & Service (72.8%), and Cleaning & Maintenance (57.4%).
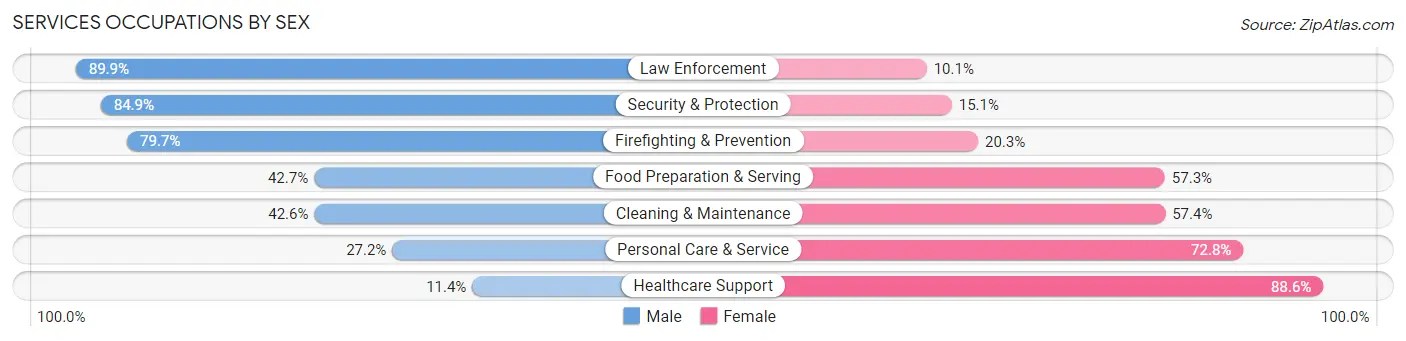
| Occupation | Male | Female |
| Healthcare Support | 63 (11.4%) | 491 (88.6%) |
| Security & Protection | 343 (84.9%) | 61 (15.1%) |
| Firefighting & Prevention | 157 (79.7%) | 40 (20.3%) |
| Law Enforcement | 186 (89.9%) | 21 (10.1%) |
| Food Preparation & Serving | 535 (42.7%) | 718 (57.3%) |
| Cleaning & Maintenance | 307 (42.6%) | 413 (57.4%) |
| Personal Care & Service | 120 (27.2%) | 321 (72.8%) |
| Total (Category) | 1,368 (40.6%) | 2,004 (59.4%) |
| Total (Overall) | 9,578 (52.9%) | 8,537 (47.1%) |
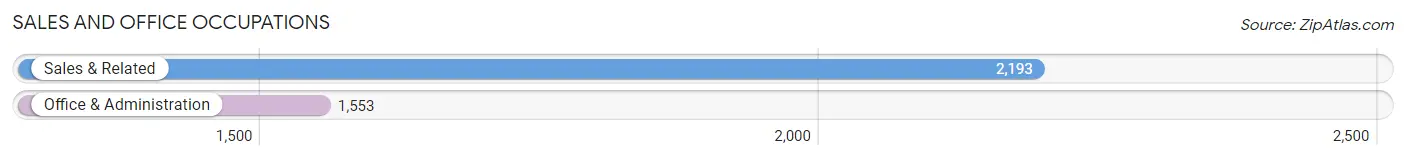
Sales and Office Occupations
The most common Sales and Office occupations in Dale County are Sales & Related (2,193 | 12.1%), and Office & Administration (1,553 | 8.6%).
Sales and Office Occupations by Sex
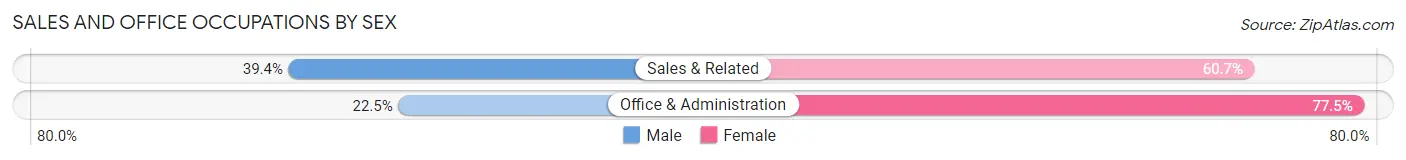
| Occupation | Male | Female |
| Sales & Related | 863 (39.4%) | 1,330 (60.7%) |
| Office & Administration | 349 (22.5%) | 1,204 (77.5%) |
| Total (Category) | 1,212 (32.4%) | 2,534 (67.6%) |
| Total (Overall) | 9,578 (52.9%) | 8,537 (47.1%) |
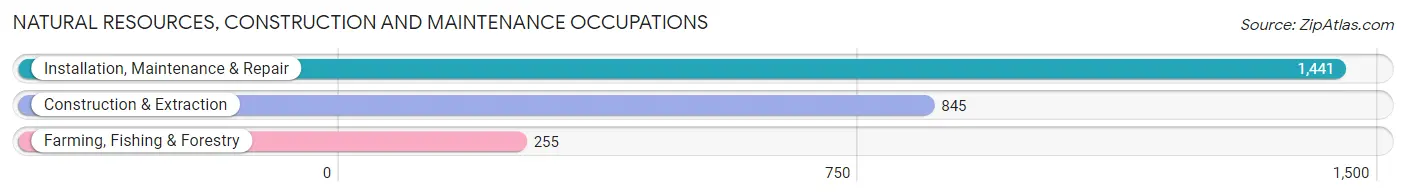
Natural Resources, Construction and Maintenance Occupations
The most common Natural Resources, Construction and Maintenance occupations in Dale County are Installation, Maintenance & Repair (1,441 | 8.0%), Construction & Extraction (845 | 4.7%), and Farming, Fishing & Forestry (255 | 1.4%).
Natural Resources, Construction and Maintenance Occupations by Sex
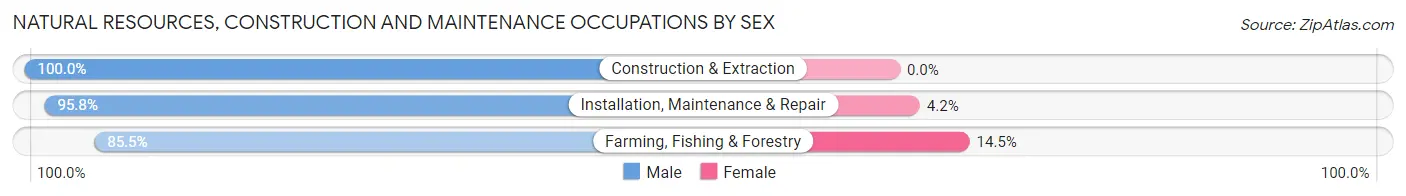
| Occupation | Male | Female |
| Farming, Fishing & Forestry | 218 (85.5%) | 37 (14.5%) |
| Construction & Extraction | 845 (100.0%) | 0 (0.0%) |
| Installation, Maintenance & Repair | 1,381 (95.8%) | 60 (4.2%) |
| Total (Category) | 2,444 (96.2%) | 97 (3.8%) |
| Total (Overall) | 9,578 (52.9%) | 8,537 (47.1%) |
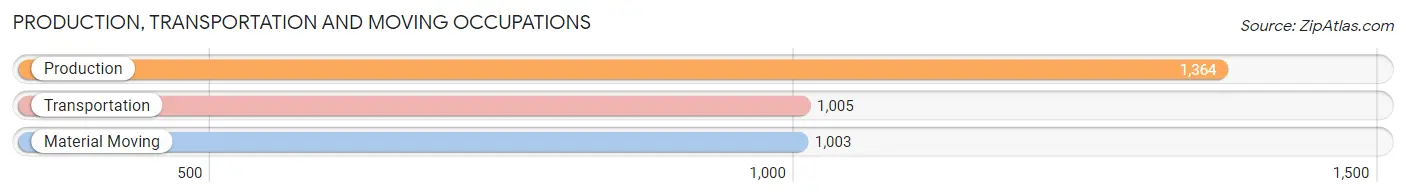
Production, Transportation and Moving Occupations
The most common Production, Transportation and Moving occupations in Dale County are Production (1,364 | 7.5%), Transportation (1,005 | 5.6%), and Material Moving (1,003 | 5.5%).
Production, Transportation and Moving Occupations by Sex
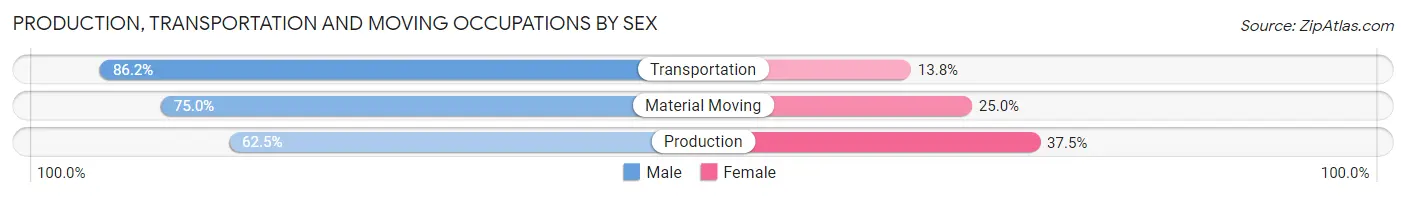
| Occupation | Male | Female |
| Production | 852 (62.5%) | 512 (37.5%) |
| Transportation | 866 (86.2%) | 139 (13.8%) |
| Material Moving | 752 (75.0%) | 251 (25.0%) |
| Total (Category) | 2,470 (73.3%) | 902 (26.8%) |
| Total (Overall) | 9,578 (52.9%) | 8,537 (47.1%) |
Employment Industries by Sex in Dale County
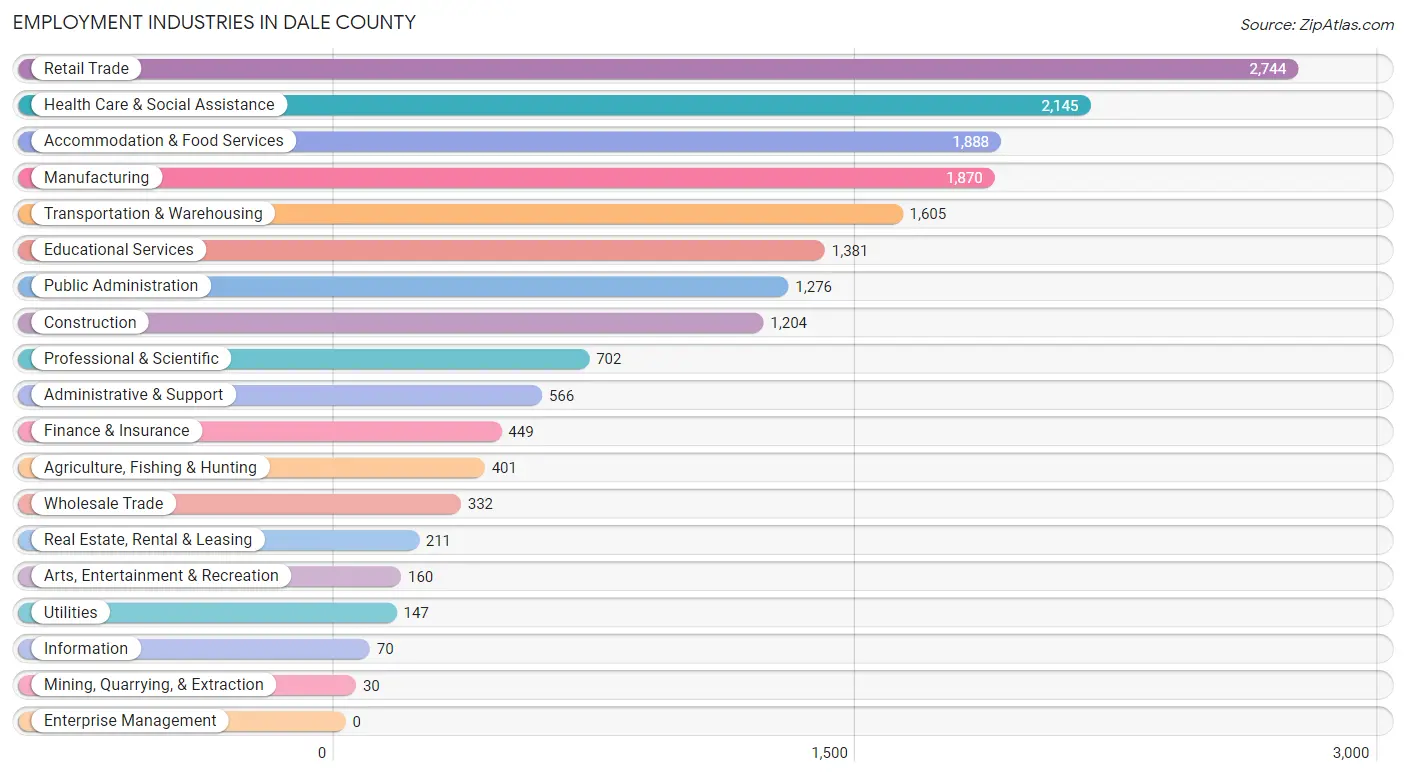
Employment Industries in Dale County
The major employment industries in Dale County include Retail Trade (2,744 | 15.1%), Health Care & Social Assistance (2,145 | 11.8%), Accommodation & Food Services (1,888 | 10.4%), Manufacturing (1,870 | 10.3%), and Transportation & Warehousing (1,605 | 8.9%).
Employment Industries by Sex in Dale County
The Dale County industries that see more men than women are Mining, Quarrying, & Extraction (100.0%), Construction (95.1%), and Agriculture, Fishing & Hunting (89.8%), whereas the industries that tend to have a higher number of women are Health Care & Social Assistance (79.9%), Information (71.4%), and Educational Services (69.7%).
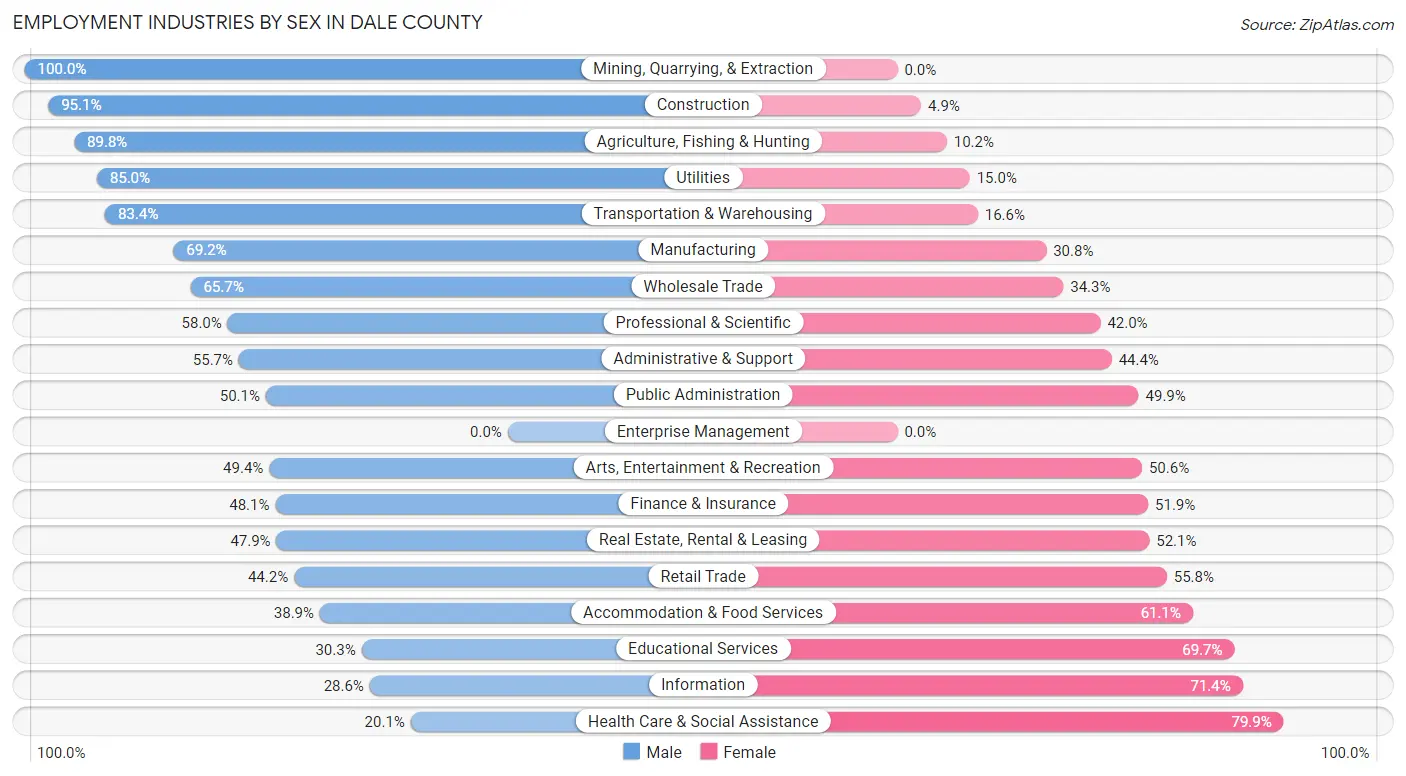
| Industry | Male | Female |
| Agriculture, Fishing & Hunting | 360 (89.8%) | 41 (10.2%) |
| Mining, Quarrying, & Extraction | 30 (100.0%) | 0 (0.0%) |
| Construction | 1,145 (95.1%) | 59 (4.9%) |
| Manufacturing | 1,294 (69.2%) | 576 (30.8%) |
| Wholesale Trade | 218 (65.7%) | 114 (34.3%) |
| Retail Trade | 1,214 (44.2%) | 1,530 (55.8%) |
| Transportation & Warehousing | 1,338 (83.4%) | 267 (16.6%) |
| Utilities | 125 (85.0%) | 22 (15.0%) |
| Information | 20 (28.6%) | 50 (71.4%) |
| Finance & Insurance | 216 (48.1%) | 233 (51.9%) |
| Real Estate, Rental & Leasing | 101 (47.9%) | 110 (52.1%) |
| Professional & Scientific | 407 (58.0%) | 295 (42.0%) |
| Enterprise Management | 0 (0.0%) | 0 (0.0%) |
| Administrative & Support | 315 (55.6%) | 251 (44.4%) |
| Educational Services | 418 (30.3%) | 963 (69.7%) |
| Health Care & Social Assistance | 431 (20.1%) | 1,714 (79.9%) |
| Arts, Entertainment & Recreation | 79 (49.4%) | 81 (50.6%) |
| Accommodation & Food Services | 734 (38.9%) | 1,154 (61.1%) |
| Public Administration | 639 (50.1%) | 637 (49.9%) |
| Total | 9,578 (52.9%) | 8,537 (47.1%) |
Education in Dale County
School Enrollment in Dale County
The most common levels of schooling among the 10,832 students in Dale County are elementary school (2,722 | 25.1%), high school (2,414 | 22.3%), and middle school (2,301 | 21.2%).
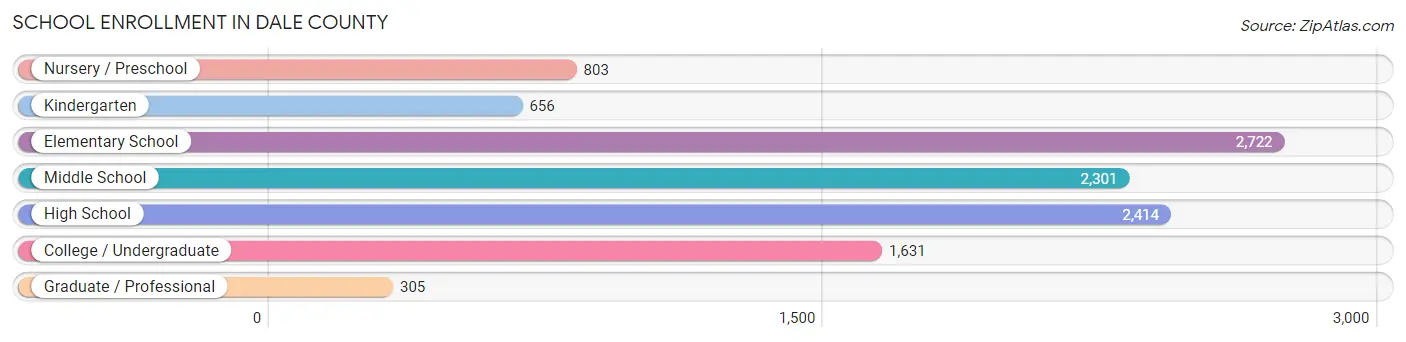
| School Level | # Students | % Students |
| Nursery / Preschool | 803 | 7.4% |
| Kindergarten | 656 | 6.1% |
| Elementary School | 2,722 | 25.1% |
| Middle School | 2,301 | 21.2% |
| High School | 2,414 | 22.3% |
| College / Undergraduate | 1,631 | 15.1% |
| Graduate / Professional | 305 | 2.8% |
| Total | 10,832 | 100.0% |
School Enrollment by Age by Funding Source in Dale County
Out of a total of 10,832 students who are enrolled in schools in Dale County, 877 (8.1%) attend a private institution, while the remaining 9,955 (91.9%) are enrolled in public schools. The age group of 35 years and over has the highest likelihood of being enrolled in private schools, with 135 (26.7% in the age bracket) enrolled. Conversely, the age group of 10 to 14 year olds has the lowest likelihood of being enrolled in a private school, with 2,801 (94.3% in the age bracket) attending a public institution.
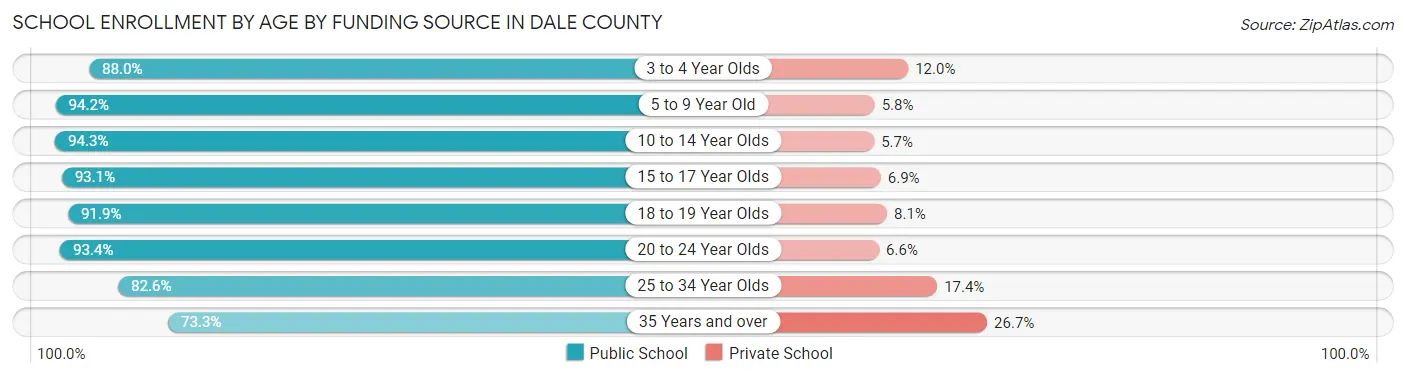
| Age Bracket | Public School | Private School |
| 3 to 4 Year Olds | 556 (88.0%) | 76 (12.0%) |
| 5 to 9 Year Old | 2,911 (94.2%) | 179 (5.8%) |
| 10 to 14 Year Olds | 2,801 (94.3%) | 169 (5.7%) |
| 15 to 17 Year Olds | 1,696 (93.1%) | 126 (6.9%) |
| 18 to 19 Year Olds | 568 (91.9%) | 50 (8.1%) |
| 20 to 24 Year Olds | 537 (93.4%) | 38 (6.6%) |
| 25 to 34 Year Olds | 512 (82.6%) | 108 (17.4%) |
| 35 Years and over | 370 (73.3%) | 135 (26.7%) |
| Total | 9,955 (91.9%) | 877 (8.1%) |
Educational Attainment by Field of Study in Dale County
Business (1,291 | 18.9%), education (1,025 | 15.0%), arts & humanities (962 | 14.1%), science & technology (722 | 10.6%), and psychology (426 | 6.2%) are the most common fields of study among 6,827 individuals in Dale County who have obtained a bachelor's degree or higher.
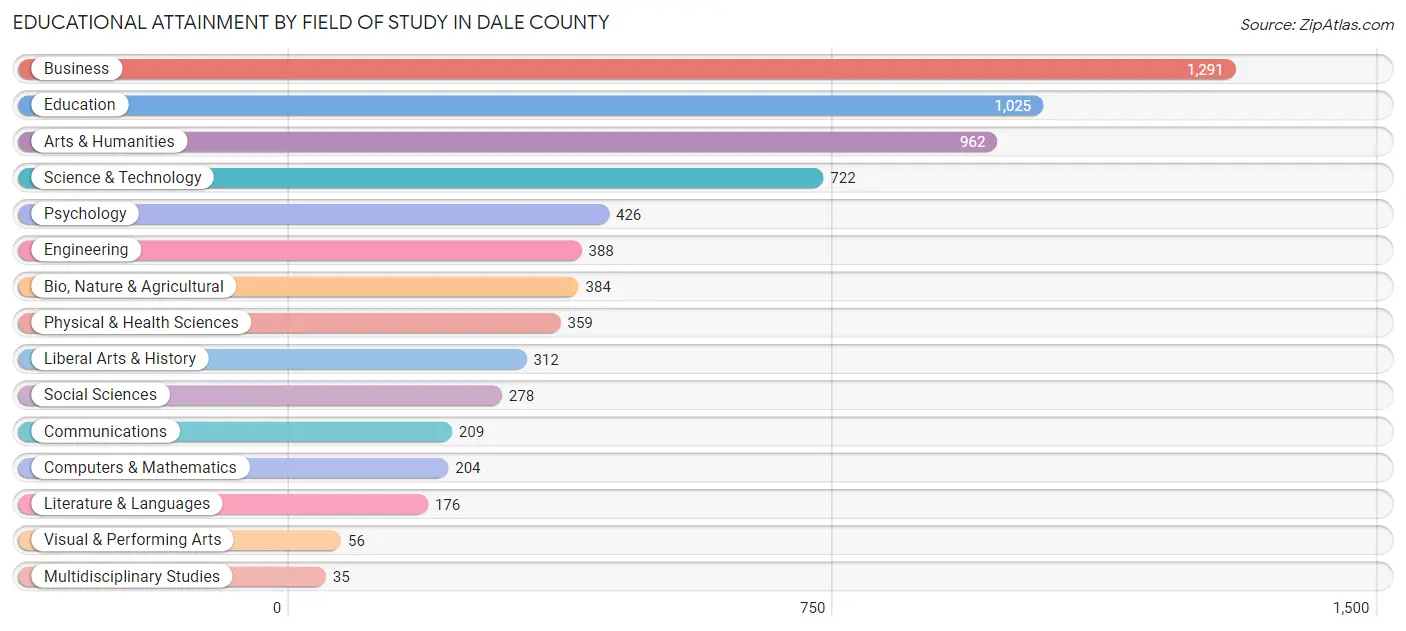
| Field of Study | # Graduates | % Graduates |
| Computers & Mathematics | 204 | 3.0% |
| Bio, Nature & Agricultural | 384 | 5.6% |
| Physical & Health Sciences | 359 | 5.3% |
| Psychology | 426 | 6.2% |
| Social Sciences | 278 | 4.1% |
| Engineering | 388 | 5.7% |
| Multidisciplinary Studies | 35 | 0.5% |
| Science & Technology | 722 | 10.6% |
| Business | 1,291 | 18.9% |
| Education | 1,025 | 15.0% |
| Literature & Languages | 176 | 2.6% |
| Liberal Arts & History | 312 | 4.6% |
| Visual & Performing Arts | 56 | 0.8% |
| Communications | 209 | 3.1% |
| Arts & Humanities | 962 | 14.1% |
| Total | 6,827 | 100.0% |
Transportation & Commute in Dale County
Vehicle Availability by Sex in Dale County
The most prevalent vehicle ownership categories in Dale County are males with 2 vehicles (4,498, accounting for 42.0%) and females with 2 vehicles (3,171, making up 52.5%).
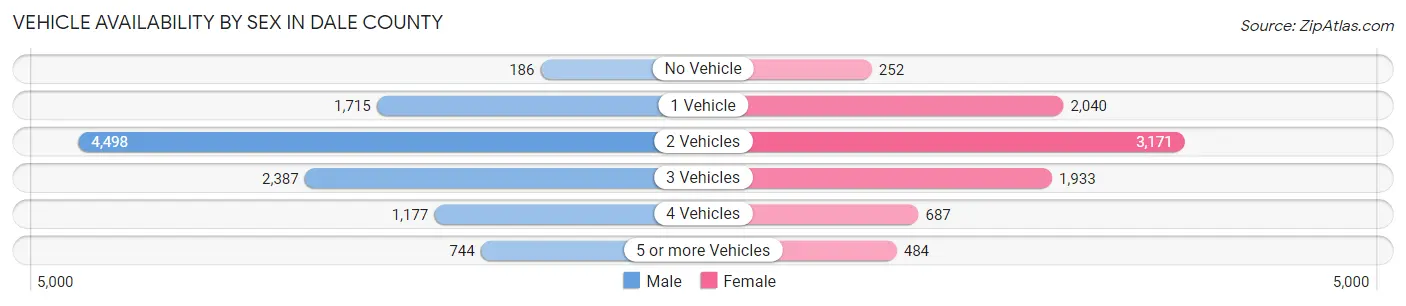
| Vehicles Available | Male | Female |
| No Vehicle | 186 (1.7%) | 252 (2.9%) |
| 1 Vehicle | 1,715 (16.0%) | 2,040 (23.8%) |
| 2 Vehicles | 4,498 (42.0%) | 3,171 (37.0%) |
| 3 Vehicles | 2,387 (22.3%) | 1,933 (22.6%) |
| 4 Vehicles | 1,177 (11.0%) | 687 (8.0%) |
| 5 or more Vehicles | 744 (7.0%) | 484 (5.7%) |
| Total | 10,707 (100.0%) | 8,567 (100.0%) |
Commute Time in Dale County
The most frequently occuring commute durations in Dale County are 15 to 19 minutes (3,718 commuters, 19.5%), 10 to 14 minutes (3,218 commuters, 16.9%), and 20 to 24 minutes (2,394 commuters, 12.6%).
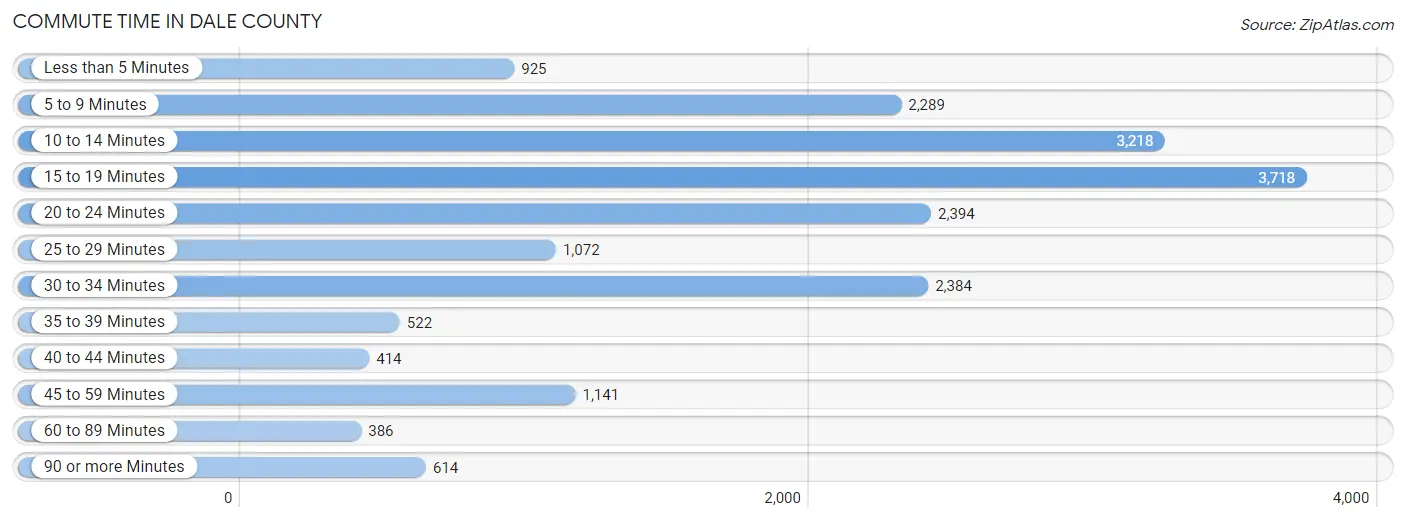
| Commute Time | # Commuters | % Commuters |
| Less than 5 Minutes | 925 | 4.9% |
| 5 to 9 Minutes | 2,289 | 12.0% |
| 10 to 14 Minutes | 3,218 | 16.9% |
| 15 to 19 Minutes | 3,718 | 19.5% |
| 20 to 24 Minutes | 2,394 | 12.6% |
| 25 to 29 Minutes | 1,072 | 5.6% |
| 30 to 34 Minutes | 2,384 | 12.5% |
| 35 to 39 Minutes | 522 | 2.7% |
| 40 to 44 Minutes | 414 | 2.2% |
| 45 to 59 Minutes | 1,141 | 6.0% |
| 60 to 89 Minutes | 386 | 2.0% |
| 90 or more Minutes | 614 | 3.2% |
Commute Time by Sex in Dale County
The most common commute times in Dale County are 15 to 19 minutes (1,980 commuters, 18.4%) for males and 15 to 19 minutes (1,738 commuters, 20.9%) for females.
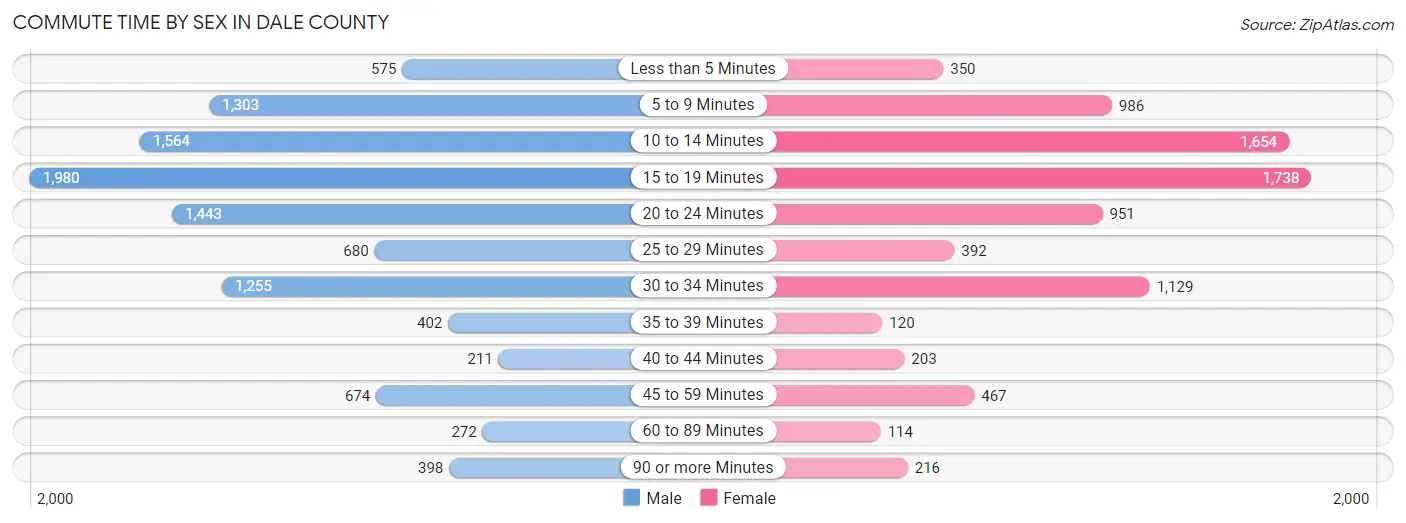
| Commute Time | Male | Female |
| Less than 5 Minutes | 575 (5.3%) | 350 (4.2%) |
| 5 to 9 Minutes | 1,303 (12.1%) | 986 (11.8%) |
| 10 to 14 Minutes | 1,564 (14.5%) | 1,654 (19.9%) |
| 15 to 19 Minutes | 1,980 (18.4%) | 1,738 (20.9%) |
| 20 to 24 Minutes | 1,443 (13.4%) | 951 (11.4%) |
| 25 to 29 Minutes | 680 (6.3%) | 392 (4.7%) |
| 30 to 34 Minutes | 1,255 (11.7%) | 1,129 (13.6%) |
| 35 to 39 Minutes | 402 (3.7%) | 120 (1.4%) |
| 40 to 44 Minutes | 211 (2.0%) | 203 (2.4%) |
| 45 to 59 Minutes | 674 (6.3%) | 467 (5.6%) |
| 60 to 89 Minutes | 272 (2.5%) | 114 (1.4%) |
| 90 or more Minutes | 398 (3.7%) | 216 (2.6%) |
Time of Departure to Work by Sex in Dale County
The most frequent times of departure to work in Dale County are 7:00 AM to 7:29 AM (1,506, 14.0%) for males and 7:00 AM to 7:29 AM (1,609, 19.3%) for females.
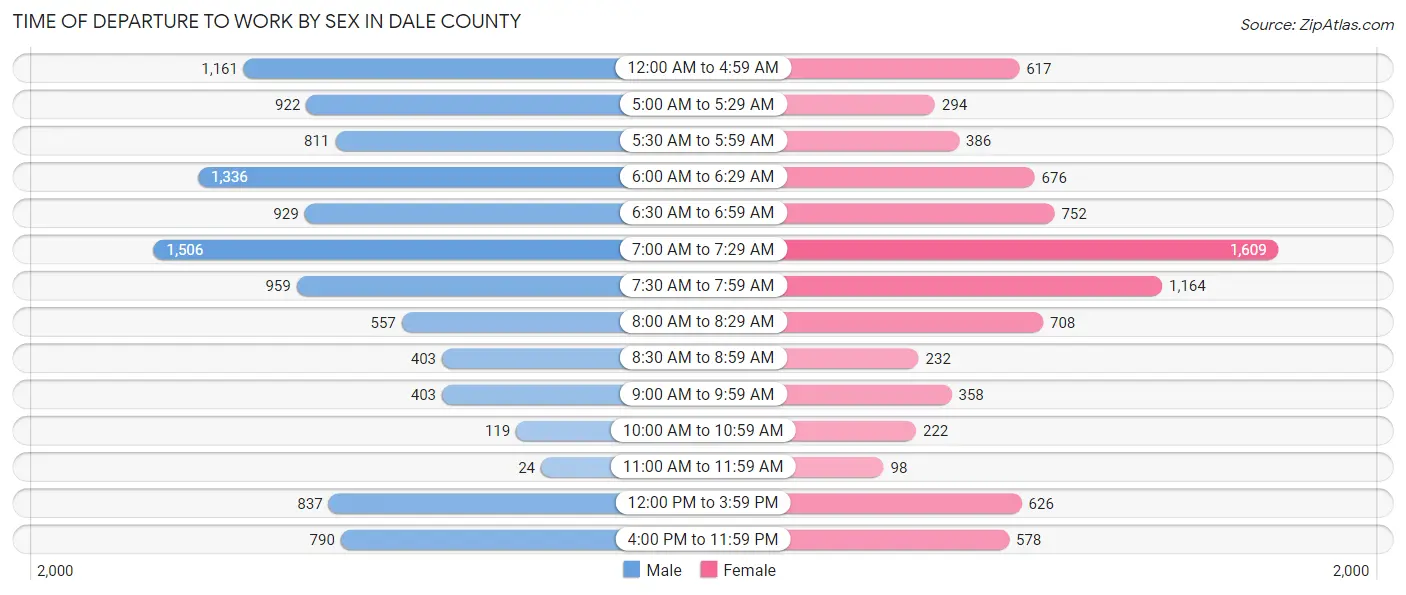
| Time of Departure | Male | Female |
| 12:00 AM to 4:59 AM | 1,161 (10.8%) | 617 (7.4%) |
| 5:00 AM to 5:29 AM | 922 (8.6%) | 294 (3.5%) |
| 5:30 AM to 5:59 AM | 811 (7.5%) | 386 (4.6%) |
| 6:00 AM to 6:29 AM | 1,336 (12.4%) | 676 (8.1%) |
| 6:30 AM to 6:59 AM | 929 (8.6%) | 752 (9.0%) |
| 7:00 AM to 7:29 AM | 1,506 (14.0%) | 1,609 (19.3%) |
| 7:30 AM to 7:59 AM | 959 (8.9%) | 1,164 (14.0%) |
| 8:00 AM to 8:29 AM | 557 (5.2%) | 708 (8.5%) |
| 8:30 AM to 8:59 AM | 403 (3.7%) | 232 (2.8%) |
| 9:00 AM to 9:59 AM | 403 (3.7%) | 358 (4.3%) |
| 10:00 AM to 10:59 AM | 119 (1.1%) | 222 (2.7%) |
| 11:00 AM to 11:59 AM | 24 (0.2%) | 98 (1.2%) |
| 12:00 PM to 3:59 PM | 837 (7.8%) | 626 (7.5%) |
| 4:00 PM to 11:59 PM | 790 (7.3%) | 578 (7.0%) |
| Total | 10,757 (100.0%) | 8,320 (100.0%) |
Housing Occupancy in Dale County
Occupancy by Ownership in Dale County
Of the total 19,400 dwellings in Dale County, owner-occupied units account for 11,669 (60.2%), while renter-occupied units make up 7,731 (39.9%).
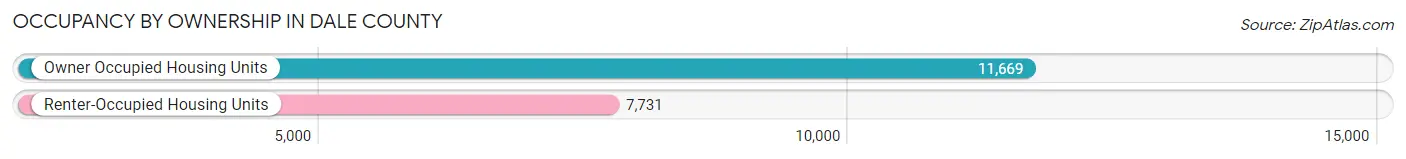
| Occupancy | # Housing Units | % Housing Units |
| Owner Occupied Housing Units | 11,669 | 60.2% |
| Renter-Occupied Housing Units | 7,731 | 39.9% |
| Total Occupied Housing Units | 19,400 | 100.0% |
Occupancy by Household Size in Dale County
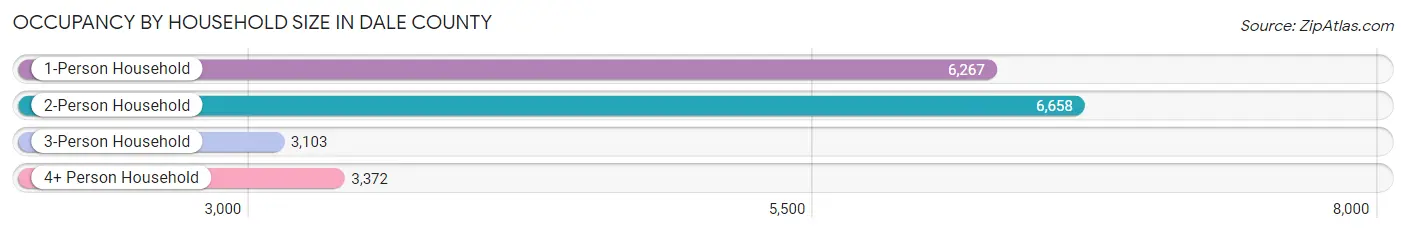
| Household Size | # Housing Units | % Housing Units |
| 1-Person Household | 6,267 | 32.3% |
| 2-Person Household | 6,658 | 34.3% |
| 3-Person Household | 3,103 | 16.0% |
| 4+ Person Household | 3,372 | 17.4% |
| Total Housing Units | 19,400 | 100.0% |
Occupancy by Ownership by Household Size in Dale County
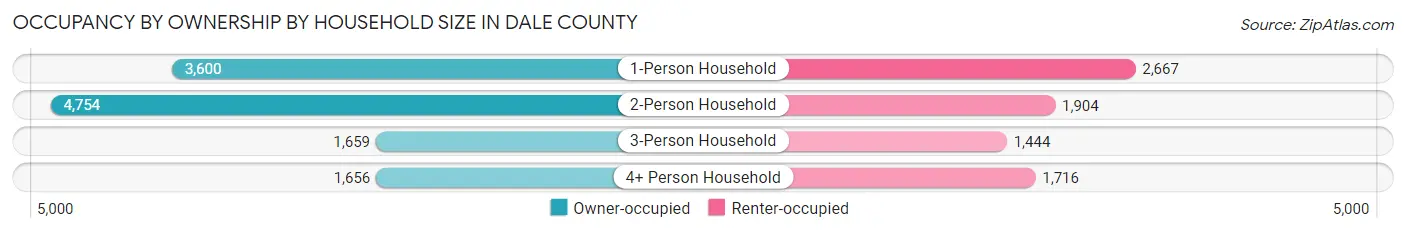
| Household Size | Owner-occupied | Renter-occupied |
| 1-Person Household | 3,600 (57.4%) | 2,667 (42.6%) |
| 2-Person Household | 4,754 (71.4%) | 1,904 (28.6%) |
| 3-Person Household | 1,659 (53.5%) | 1,444 (46.5%) |
| 4+ Person Household | 1,656 (49.1%) | 1,716 (50.9%) |
| Total Housing Units | 11,669 (60.2%) | 7,731 (39.9%) |
Occupancy by Educational Attainment in Dale County
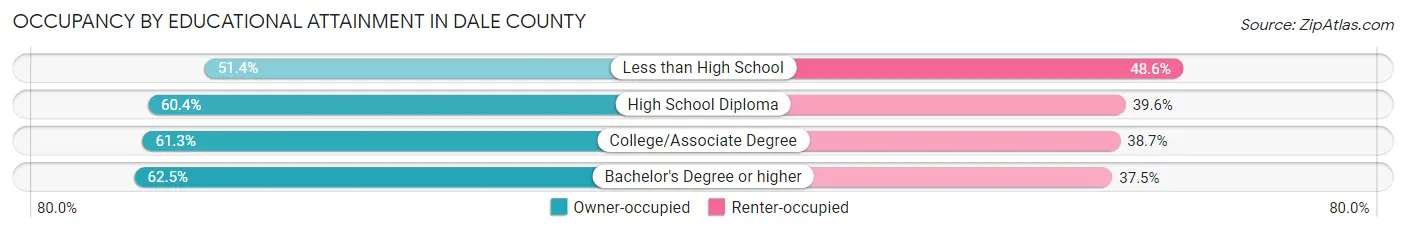
| Household Size | Owner-occupied | Renter-occupied |
| Less than High School | 1,137 (51.4%) | 1,074 (48.6%) |
| High School Diploma | 3,529 (60.4%) | 2,312 (39.6%) |
| College/Associate Degree | 4,559 (61.3%) | 2,881 (38.7%) |
| Bachelor's Degree or higher | 2,444 (62.5%) | 1,464 (37.5%) |
Occupancy by Age of Householder in Dale County
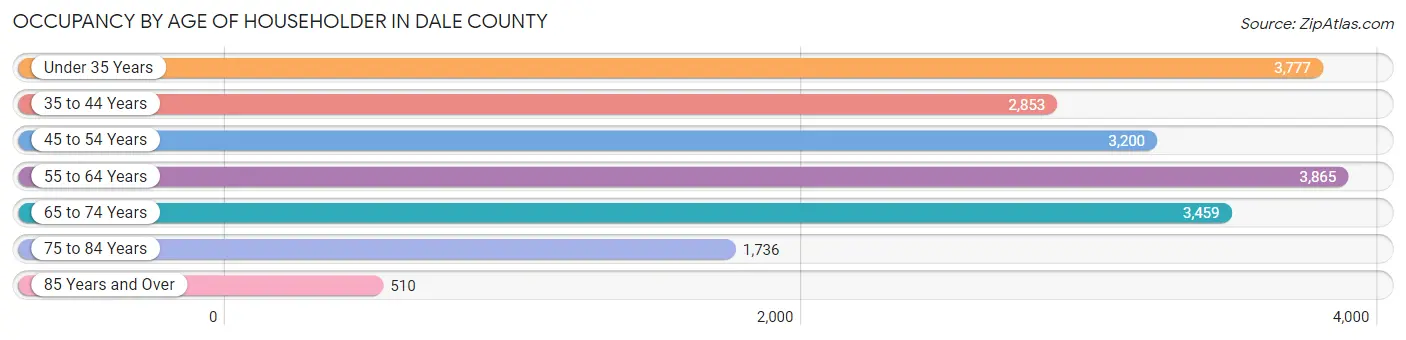
| Age Bracket | # Households | % Households |
| Under 35 Years | 3,777 | 19.5% |
| 35 to 44 Years | 2,853 | 14.7% |
| 45 to 54 Years | 3,200 | 16.5% |
| 55 to 64 Years | 3,865 | 19.9% |
| 65 to 74 Years | 3,459 | 17.8% |
| 75 to 84 Years | 1,736 | 8.9% |
| 85 Years and Over | 510 | 2.6% |
| Total | 19,400 | 100.0% |
Housing Finances in Dale County
Median Income by Occupancy in Dale County
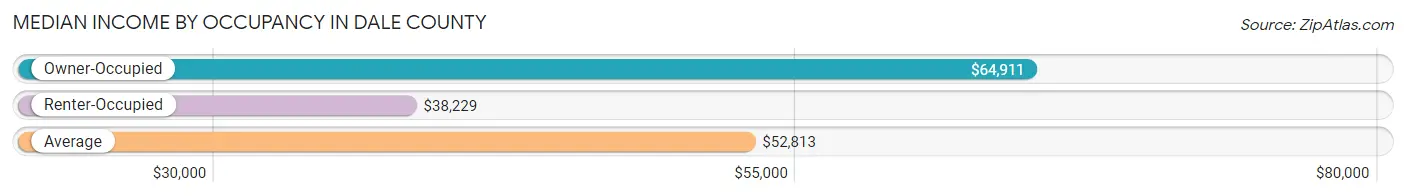
| Occupancy Type | # Households | Median Income |
| Owner-Occupied | 11,669 (60.2%) | $64,911 |
| Renter-Occupied | 7,731 (39.9%) | $38,229 |
| Average | 19,400 (100.0%) | $52,813 |
Occupancy by Householder Income Bracket in Dale County
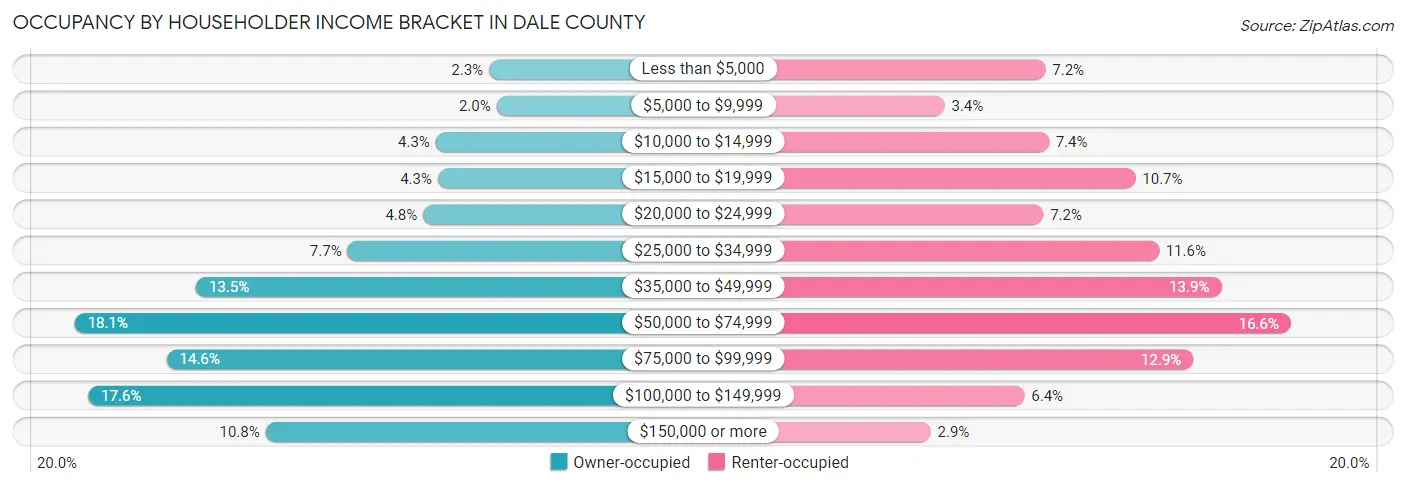
| Income Bracket | Owner-occupied | Renter-occupied |
| Less than $5,000 | 270 (2.3%) | 559 (7.2%) |
| $5,000 to $9,999 | 236 (2.0%) | 262 (3.4%) |
| $10,000 to $14,999 | 506 (4.3%) | 569 (7.4%) |
| $15,000 to $19,999 | 497 (4.3%) | 824 (10.7%) |
| $20,000 to $24,999 | 563 (4.8%) | 553 (7.1%) |
| $25,000 to $34,999 | 898 (7.7%) | 893 (11.6%) |
| $35,000 to $49,999 | 1,572 (13.5%) | 1,077 (13.9%) |
| $50,000 to $74,999 | 2,111 (18.1%) | 1,282 (16.6%) |
| $75,000 to $99,999 | 1,702 (14.6%) | 994 (12.9%) |
| $100,000 to $149,999 | 2,051 (17.6%) | 497 (6.4%) |
| $150,000 or more | 1,263 (10.8%) | 221 (2.9%) |
| Total | 11,669 (100.0%) | 7,731 (100.0%) |
Monthly Housing Cost Tiers in Dale County
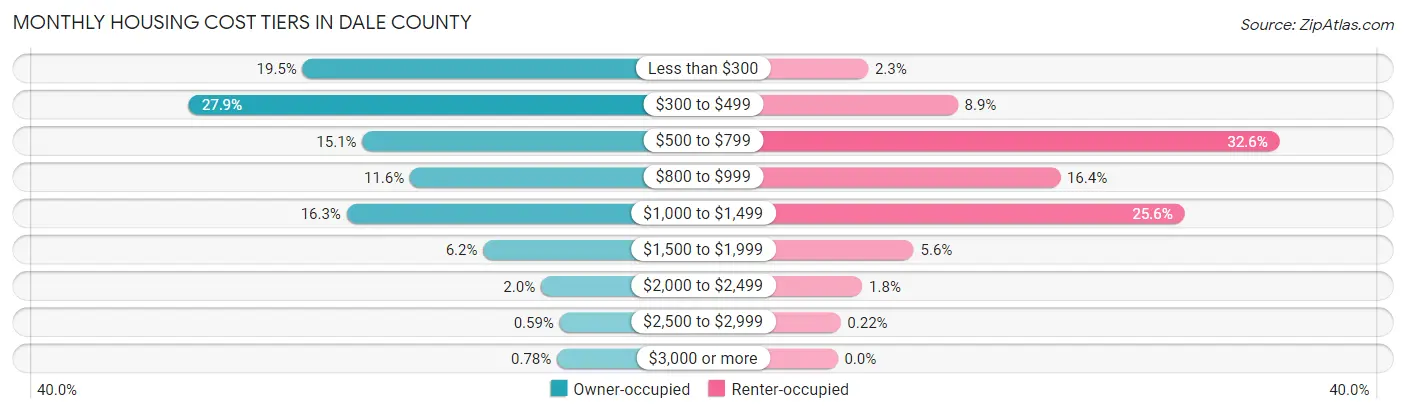
| Monthly Cost | Owner-occupied | Renter-occupied |
| Less than $300 | 2,278 (19.5%) | 174 (2.2%) |
| $300 to $499 | 3,256 (27.9%) | 684 (8.8%) |
| $500 to $799 | 1,764 (15.1%) | 2,517 (32.6%) |
| $800 to $999 | 1,355 (11.6%) | 1,267 (16.4%) |
| $1,000 to $1,499 | 1,900 (16.3%) | 1,976 (25.6%) |
| $1,500 to $1,999 | 726 (6.2%) | 434 (5.6%) |
| $2,000 to $2,499 | 230 (2.0%) | 141 (1.8%) |
| $2,500 to $2,999 | 69 (0.6%) | 17 (0.2%) |
| $3,000 or more | 91 (0.8%) | 0 (0.0%) |
| Total | 11,669 (100.0%) | 7,731 (100.0%) |
Physical Housing Characteristics in Dale County
Housing Structures in Dale County
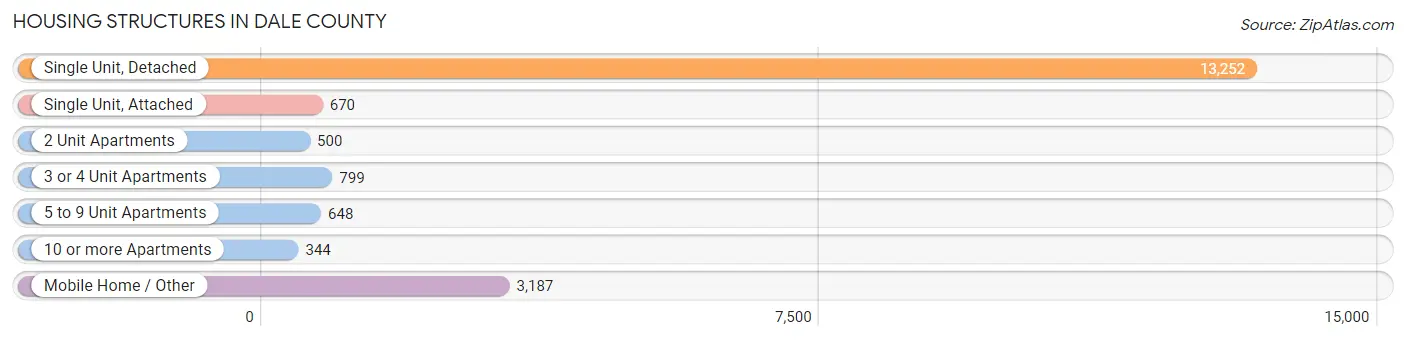
| Structure Type | # Housing Units | % Housing Units |
| Single Unit, Detached | 13,252 | 68.3% |
| Single Unit, Attached | 670 | 3.5% |
| 2 Unit Apartments | 500 | 2.6% |
| 3 or 4 Unit Apartments | 799 | 4.1% |
| 5 to 9 Unit Apartments | 648 | 3.3% |
| 10 or more Apartments | 344 | 1.8% |
| Mobile Home / Other | 3,187 | 16.4% |
| Total | 19,400 | 100.0% |
Housing Structures by Occupancy in Dale County
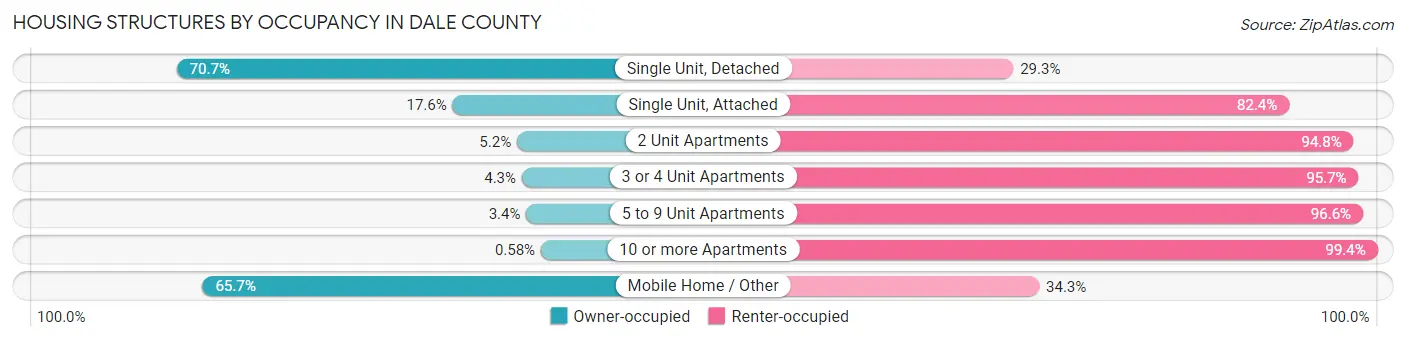
| Structure Type | Owner-occupied | Renter-occupied |
| Single Unit, Detached | 9,372 (70.7%) | 3,880 (29.3%) |
| Single Unit, Attached | 118 (17.6%) | 552 (82.4%) |
| 2 Unit Apartments | 26 (5.2%) | 474 (94.8%) |
| 3 or 4 Unit Apartments | 34 (4.3%) | 765 (95.7%) |
| 5 to 9 Unit Apartments | 22 (3.4%) | 626 (96.6%) |
| 10 or more Apartments | 2 (0.6%) | 342 (99.4%) |
| Mobile Home / Other | 2,095 (65.7%) | 1,092 (34.3%) |
| Total | 11,669 (60.2%) | 7,731 (39.9%) |
Housing Structures by Number of Rooms in Dale County
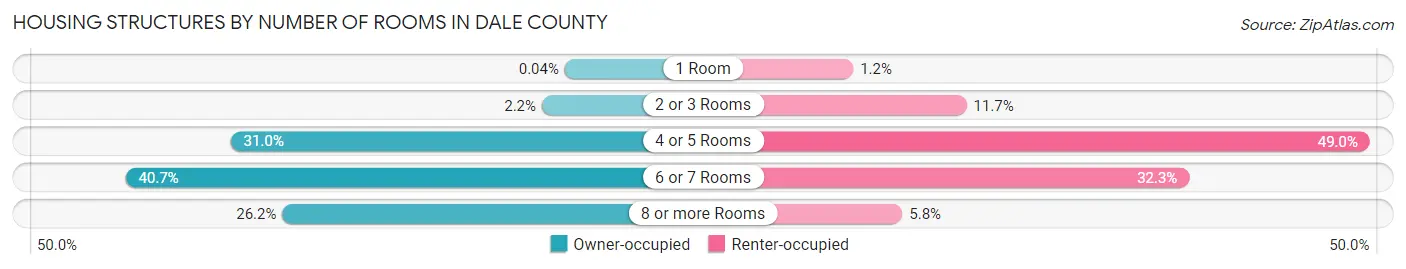
| Number of Rooms | Owner-occupied | Renter-occupied |
| 1 Room | 5 (0.0%) | 95 (1.2%) |
| 2 or 3 Rooms | 252 (2.2%) | 905 (11.7%) |
| 4 or 5 Rooms | 3,612 (30.9%) | 3,788 (49.0%) |
| 6 or 7 Rooms | 4,746 (40.7%) | 2,497 (32.3%) |
| 8 or more Rooms | 3,054 (26.2%) | 446 (5.8%) |
| Total | 11,669 (100.0%) | 7,731 (100.0%) |
Housing Structure by Heating Type in Dale County
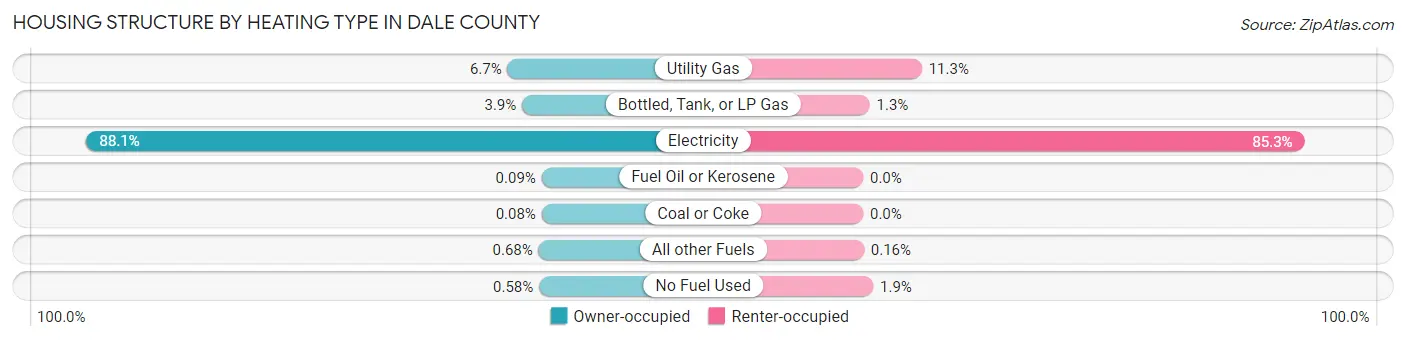
| Heating Type | Owner-occupied | Renter-occupied |
| Utility Gas | 778 (6.7%) | 877 (11.3%) |
| Bottled, Tank, or LP Gas | 450 (3.9%) | 98 (1.3%) |
| Electricity | 10,275 (88.0%) | 6,594 (85.3%) |
| Fuel Oil or Kerosene | 10 (0.1%) | 0 (0.0%) |
| Coal or Coke | 9 (0.1%) | 0 (0.0%) |
| All other Fuels | 79 (0.7%) | 12 (0.2%) |
| No Fuel Used | 68 (0.6%) | 150 (1.9%) |
| Total | 11,669 (100.0%) | 7,731 (100.0%) |
Household Vehicle Usage in Dale County
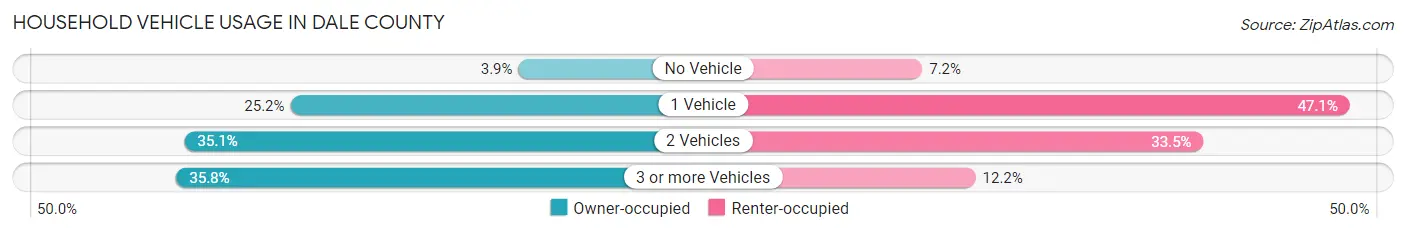
| Vehicles per Household | Owner-occupied | Renter-occupied |
| No Vehicle | 456 (3.9%) | 558 (7.2%) |
| 1 Vehicle | 2,939 (25.2%) | 3,643 (47.1%) |
| 2 Vehicles | 4,093 (35.1%) | 2,587 (33.5%) |
| 3 or more Vehicles | 4,181 (35.8%) | 943 (12.2%) |
| Total | 11,669 (100.0%) | 7,731 (100.0%) |
Real Estate & Mortgages in Dale County
Real Estate and Mortgage Overview in Dale County
| Characteristic | Without Mortgage | With Mortgage |
| Housing Units | 6,366 | 5,303 |
| Median Property Value | $105,900 | $144,400 |
| Median Household Income | $56,187 | $691 |
| Monthly Housing Costs | $353 | $91 |
| Real Estate Taxes | $375 | $798 |
Property Value by Mortgage Status in Dale County
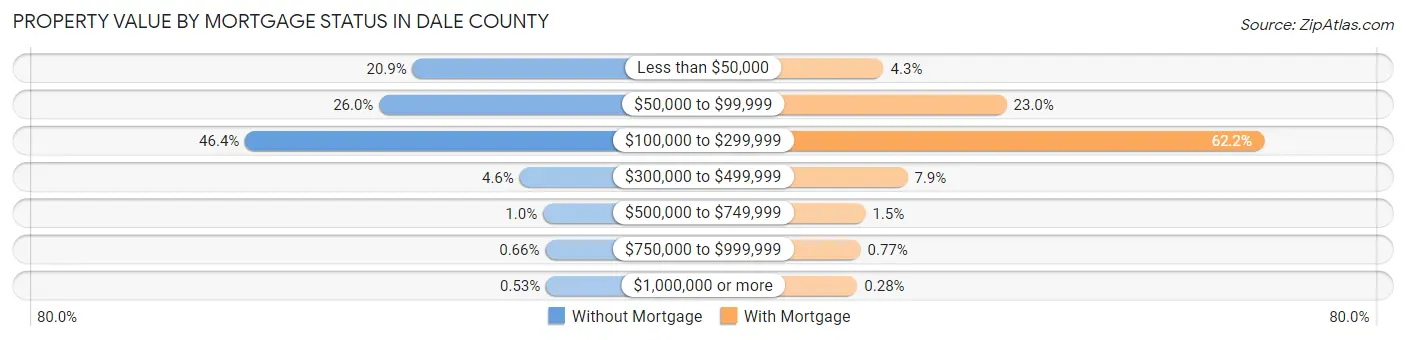
| Property Value | Without Mortgage | With Mortgage |
| Less than $50,000 | 1,329 (20.9%) | 227 (4.3%) |
| $50,000 to $99,999 | 1,653 (26.0%) | 1,221 (23.0%) |
| $100,000 to $299,999 | 2,953 (46.4%) | 3,299 (62.2%) |
| $300,000 to $499,999 | 291 (4.6%) | 420 (7.9%) |
| $500,000 to $749,999 | 64 (1.0%) | 80 (1.5%) |
| $750,000 to $999,999 | 42 (0.7%) | 41 (0.8%) |
| $1,000,000 or more | 34 (0.5%) | 15 (0.3%) |
| Total | 6,366 (100.0%) | 5,303 (100.0%) |
Household Income by Mortgage Status in Dale County
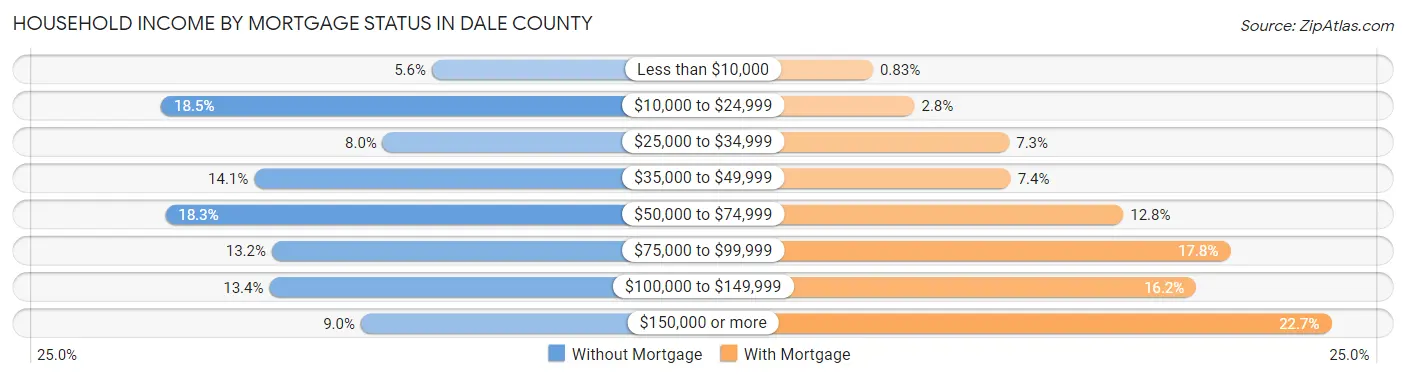
| Household Income | Without Mortgage | With Mortgage |
| Less than $10,000 | 357 (5.6%) | 44 (0.8%) |
| $10,000 to $24,999 | 1,178 (18.5%) | 149 (2.8%) |
| $25,000 to $34,999 | 506 (8.0%) | 388 (7.3%) |
| $35,000 to $49,999 | 896 (14.1%) | 392 (7.4%) |
| $50,000 to $74,999 | 1,165 (18.3%) | 676 (12.8%) |
| $75,000 to $99,999 | 842 (13.2%) | 946 (17.8%) |
| $100,000 to $149,999 | 850 (13.4%) | 860 (16.2%) |
| $150,000 or more | 572 (9.0%) | 1,201 (22.7%) |
| Total | 6,366 (100.0%) | 5,303 (100.0%) |
Property Value to Household Income Ratio in Dale County
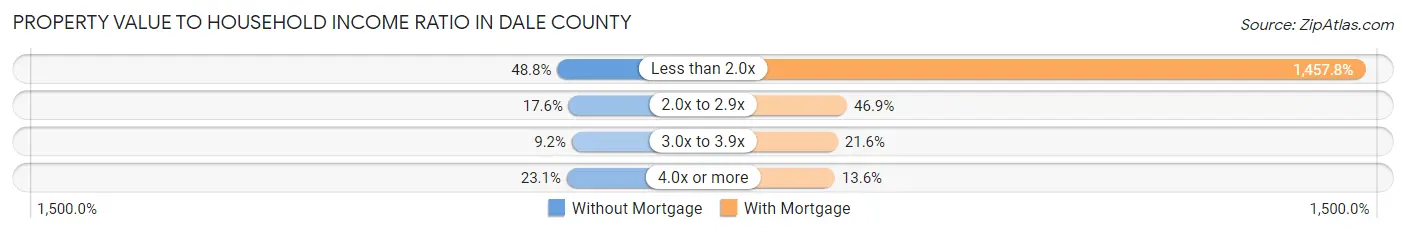
| Value-to-Income Ratio | Without Mortgage | With Mortgage |
| Less than 2.0x | 3,106 (48.8%) | 77,305 (1,457.8%) |
| 2.0x to 2.9x | 1,121 (17.6%) | 2,485 (46.9%) |
| 3.0x to 3.9x | 585 (9.2%) | 1,146 (21.6%) |
| 4.0x or more | 1,469 (23.1%) | 720 (13.6%) |
| Total | 6,366 (100.0%) | 5,303 (100.0%) |
Real Estate Taxes by Mortgage Status in Dale County
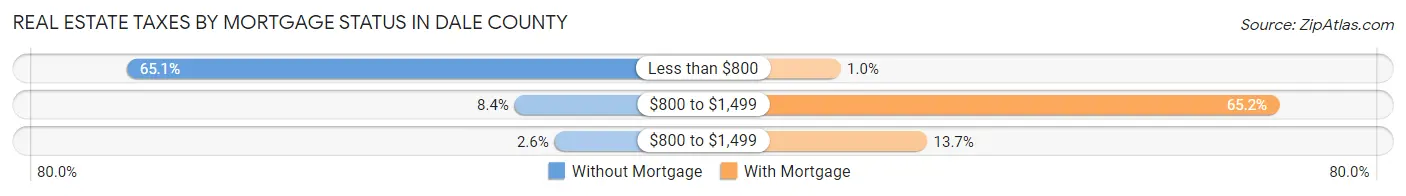
| Property Taxes | Without Mortgage | With Mortgage |
| Less than $800 | 4,142 (65.1%) | 55 (1.0%) |
| $800 to $1,499 | 534 (8.4%) | 3,455 (65.1%) |
| $800 to $1,499 | 163 (2.6%) | 725 (13.7%) |
| Total | 6,366 (100.0%) | 5,303 (100.0%) |
Health & Disability in Dale County
Health Insurance Coverage by Age in Dale County
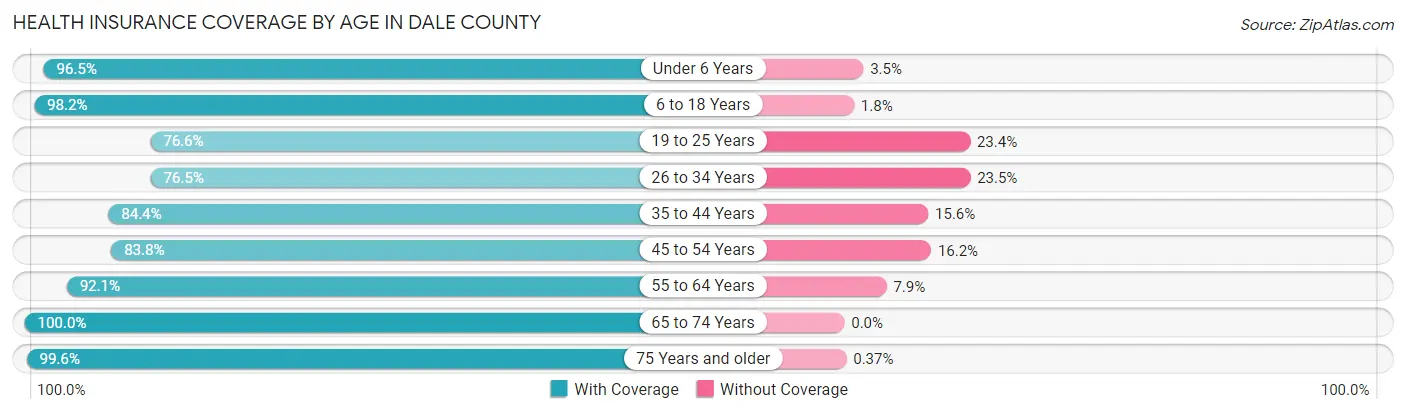
| Age Bracket | With Coverage | Without Coverage |
| Under 6 Years | 3,631 (96.5%) | 133 (3.5%) |
| 6 to 18 Years | 7,960 (98.2%) | 145 (1.8%) |
| 19 to 25 Years | 2,799 (76.6%) | 857 (23.4%) |
| 26 to 34 Years | 4,073 (76.5%) | 1,250 (23.5%) |
| 35 to 44 Years | 4,757 (84.4%) | 881 (15.6%) |
| 45 to 54 Years | 4,663 (83.8%) | 899 (16.2%) |
| 55 to 64 Years | 5,851 (92.1%) | 499 (7.9%) |
| 65 to 74 Years | 5,174 (100.0%) | 0 (0.0%) |
| 75 Years and older | 3,253 (99.6%) | 12 (0.4%) |
| Total | 42,161 (90.0%) | 4,676 (10.0%) |
Health Insurance Coverage by Citizenship Status in Dale County
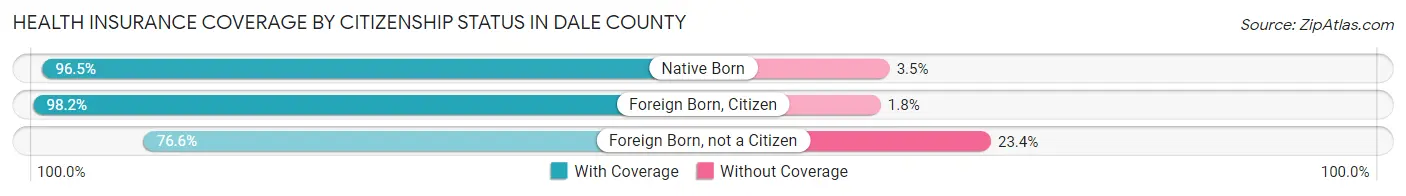
| Citizenship Status | With Coverage | Without Coverage |
| Native Born | 3,631 (96.5%) | 133 (3.5%) |
| Foreign Born, Citizen | 7,960 (98.2%) | 145 (1.8%) |
| Foreign Born, not a Citizen | 2,799 (76.6%) | 857 (23.4%) |
Health Insurance Coverage by Household Income in Dale County
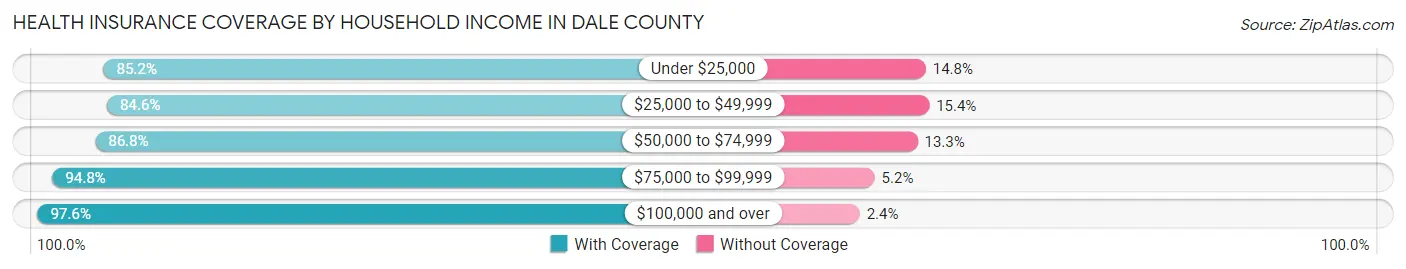
| Household Income | With Coverage | Without Coverage |
| Under $25,000 | 7,728 (85.2%) | 1,342 (14.8%) |
| $25,000 to $49,999 | 7,997 (84.6%) | 1,460 (15.4%) |
| $50,000 to $74,999 | 7,910 (86.8%) | 1,208 (13.3%) |
| $75,000 to $99,999 | 6,849 (94.8%) | 377 (5.2%) |
| $100,000 and over | 11,655 (97.6%) | 289 (2.4%) |
Public vs Private Health Insurance Coverage by Age in Dale County
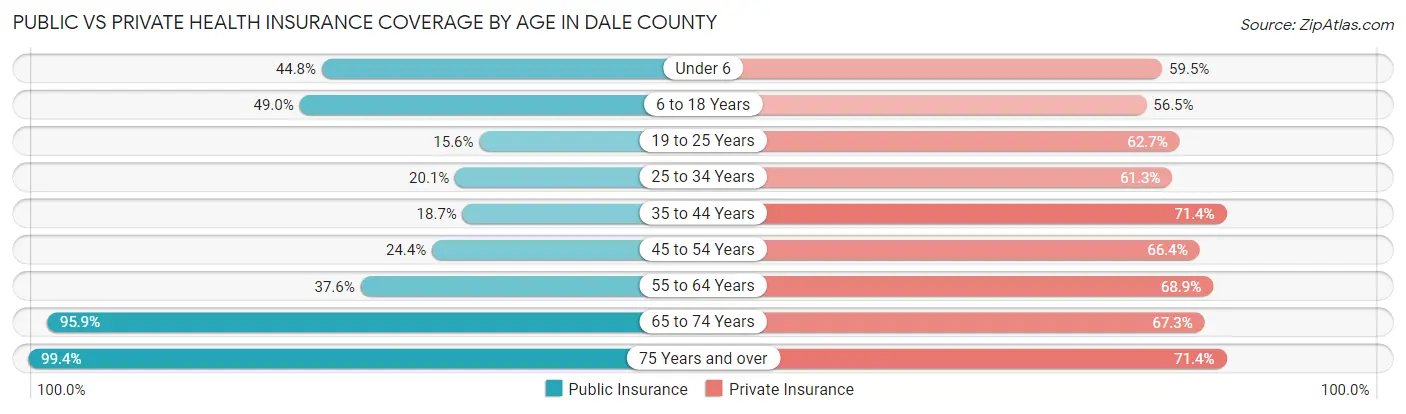
| Age Bracket | Public Insurance | Private Insurance |
| Under 6 | 1,687 (44.8%) | 2,238 (59.5%) |
| 6 to 18 Years | 3,969 (49.0%) | 4,582 (56.5%) |
| 19 to 25 Years | 570 (15.6%) | 2,292 (62.7%) |
| 25 to 34 Years | 1,069 (20.1%) | 3,264 (61.3%) |
| 35 to 44 Years | 1,054 (18.7%) | 4,025 (71.4%) |
| 45 to 54 Years | 1,356 (24.4%) | 3,693 (66.4%) |
| 55 to 64 Years | 2,390 (37.6%) | 4,375 (68.9%) |
| 65 to 74 Years | 4,961 (95.9%) | 3,483 (67.3%) |
| 75 Years and over | 3,244 (99.4%) | 2,330 (71.4%) |
| Total | 20,300 (43.3%) | 30,282 (64.6%) |
Disability Status by Sex by Age in Dale County
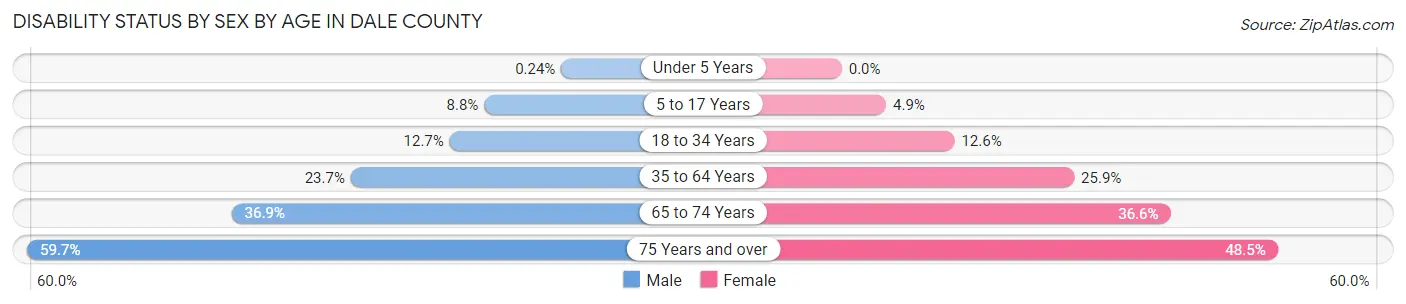
| Age Bracket | Male | Female |
| Under 5 Years | 4 (0.2%) | 0 (0.0%) |
| 5 to 17 Years | 373 (8.8%) | 193 (4.9%) |
| 18 to 34 Years | 542 (12.7%) | 650 (12.6%) |
| 35 to 64 Years | 1,953 (23.7%) | 2,408 (25.9%) |
| 65 to 74 Years | 948 (36.9%) | 954 (36.6%) |
| 75 Years and over | 820 (59.7%) | 918 (48.5%) |
Disability Class by Sex by Age in Dale County
Disability Class: Hearing Difficulty
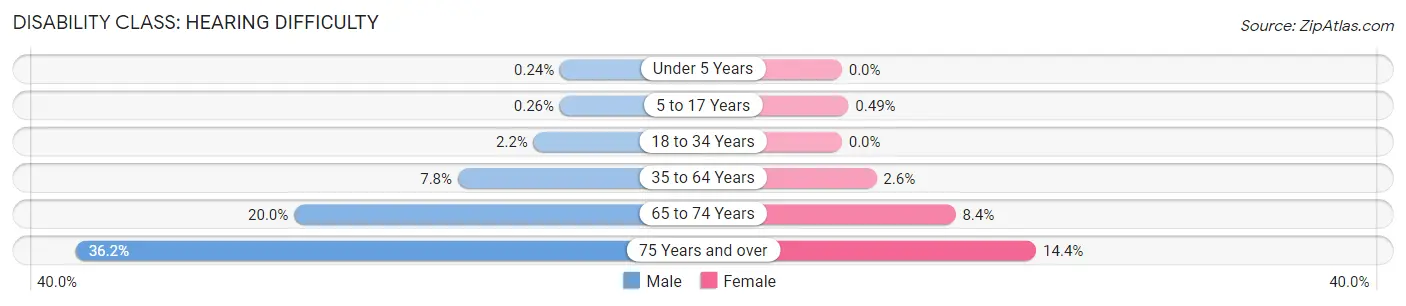
| Age Bracket | Male | Female |
| Under 5 Years | 4 (0.2%) | 0 (0.0%) |
| 5 to 17 Years | 11 (0.3%) | 19 (0.5%) |
| 18 to 34 Years | 94 (2.2%) | 0 (0.0%) |
| 35 to 64 Years | 646 (7.8%) | 239 (2.6%) |
| 65 to 74 Years | 513 (20.0%) | 220 (8.4%) |
| 75 Years and over | 497 (36.2%) | 273 (14.4%) |
Disability Class: Vision Difficulty
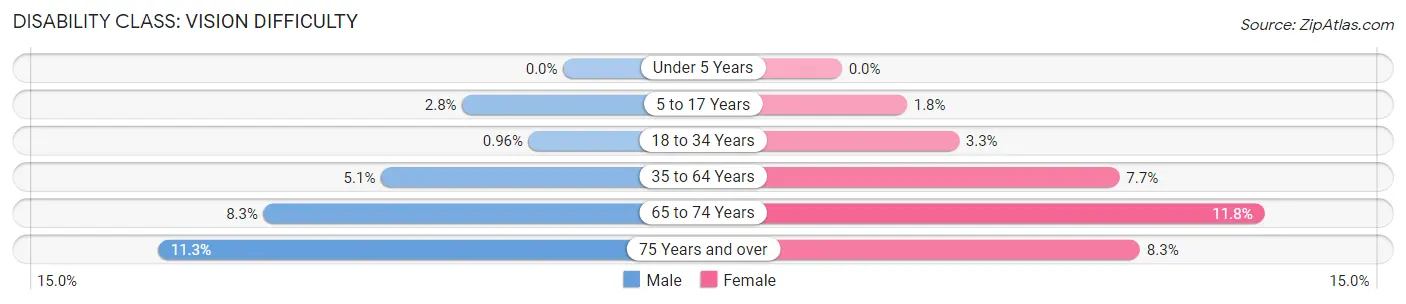
| Age Bracket | Male | Female |
| Under 5 Years | 0 (0.0%) | 0 (0.0%) |
| 5 to 17 Years | 119 (2.8%) | 71 (1.8%) |
| 18 to 34 Years | 41 (1.0%) | 169 (3.3%) |
| 35 to 64 Years | 418 (5.1%) | 719 (7.7%) |
| 65 to 74 Years | 214 (8.3%) | 307 (11.8%) |
| 75 Years and over | 155 (11.3%) | 157 (8.3%) |
Disability Class: Cognitive Difficulty
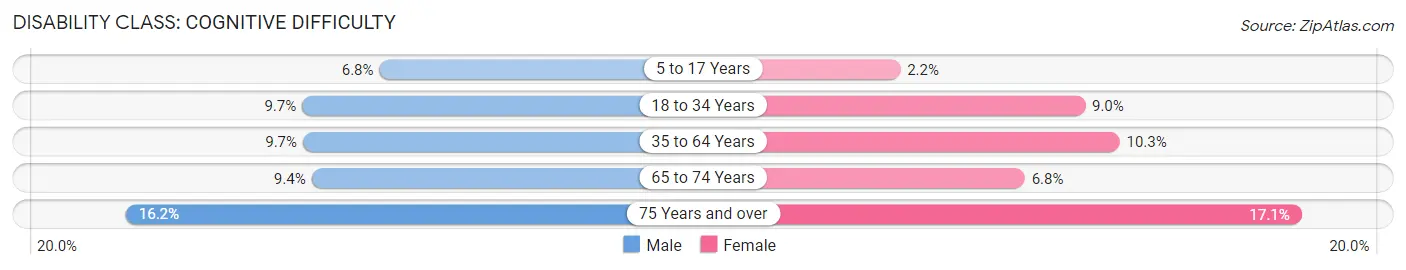
| Age Bracket | Male | Female |
| 5 to 17 Years | 289 (6.8%) | 85 (2.2%) |
| 18 to 34 Years | 415 (9.7%) | 468 (9.0%) |
| 35 to 64 Years | 797 (9.7%) | 959 (10.3%) |
| 65 to 74 Years | 240 (9.3%) | 177 (6.8%) |
| 75 Years and over | 223 (16.2%) | 323 (17.1%) |
Disability Class: Ambulatory Difficulty
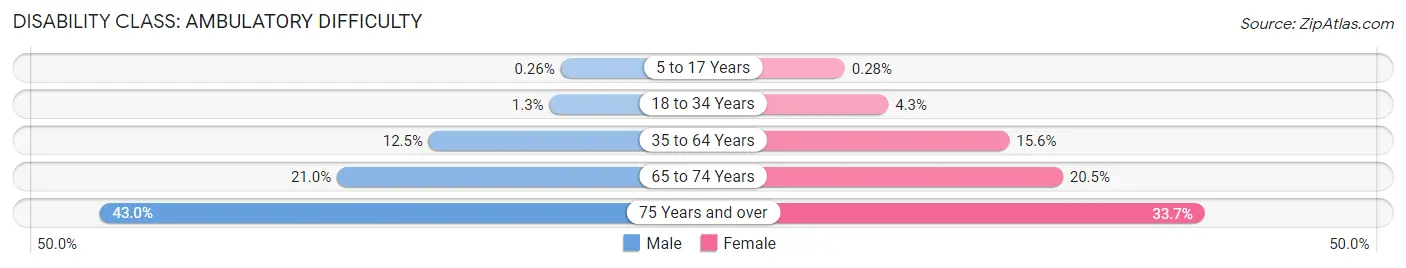
| Age Bracket | Male | Female |
| 5 to 17 Years | 11 (0.3%) | 11 (0.3%) |
| 18 to 34 Years | 55 (1.3%) | 223 (4.3%) |
| 35 to 64 Years | 1,030 (12.5%) | 1,447 (15.5%) |
| 65 to 74 Years | 539 (21.0%) | 535 (20.5%) |
| 75 Years and over | 591 (43.0%) | 637 (33.7%) |
Disability Class: Self-Care Difficulty
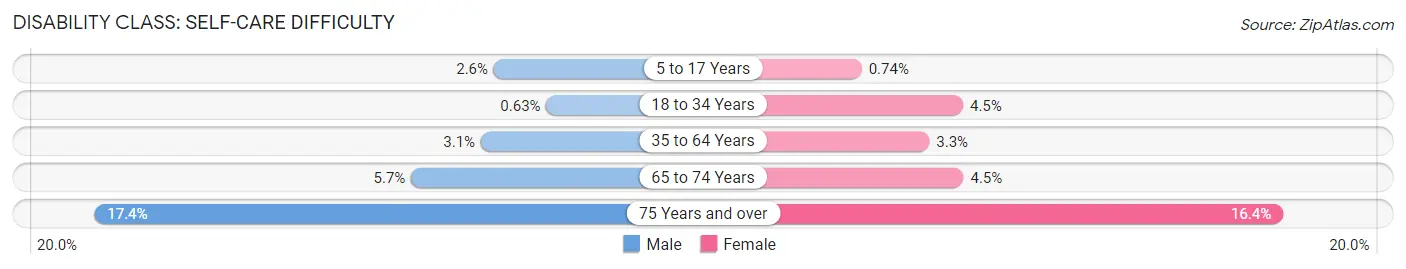
| Age Bracket | Male | Female |
| 5 to 17 Years | 109 (2.6%) | 29 (0.7%) |
| 18 to 34 Years | 27 (0.6%) | 233 (4.5%) |
| 35 to 64 Years | 252 (3.1%) | 302 (3.3%) |
| 65 to 74 Years | 145 (5.7%) | 118 (4.5%) |
| 75 Years and over | 239 (17.4%) | 310 (16.4%) |
Technology Access in Dale County
Computing Device Access in Dale County
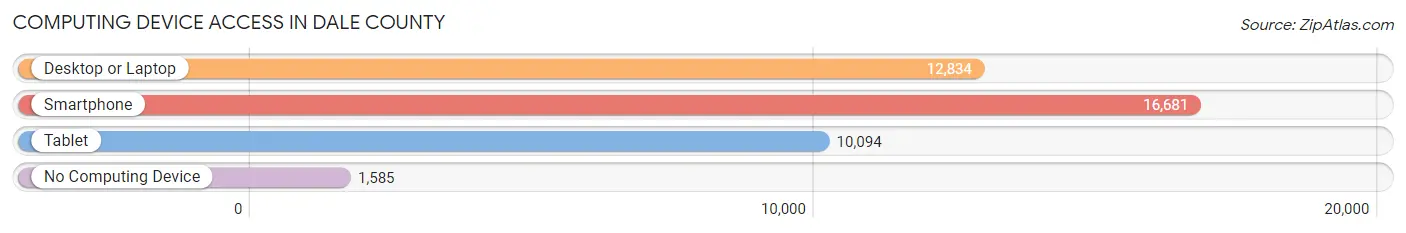
| Device Type | # Households | % Households |
| Desktop or Laptop | 12,834 | 66.1% |
| Smartphone | 16,681 | 86.0% |
| Tablet | 10,094 | 52.0% |
| No Computing Device | 1,585 | 8.2% |
| Total | 19,400 | 100.0% |
Internet Access in Dale County
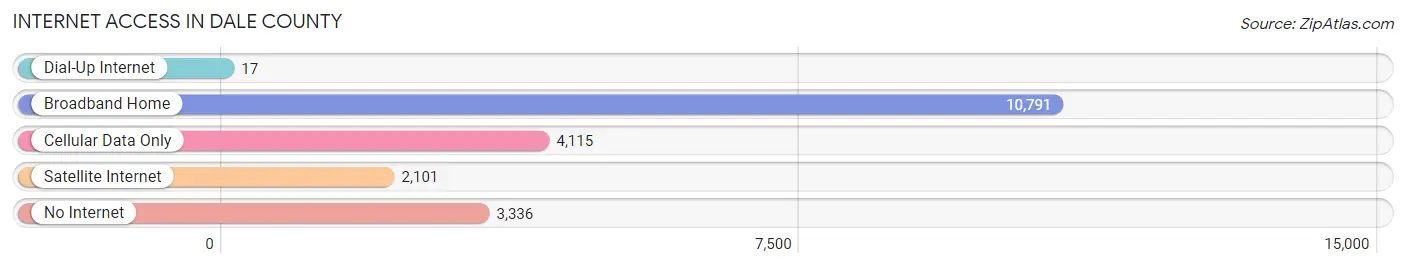
| Internet Type | # Households | % Households |
| Dial-Up Internet | 17 | 0.1% |
| Broadband Home | 10,791 | 55.6% |
| Cellular Data Only | 4,115 | 21.2% |
| Satellite Internet | 2,101 | 10.8% |
| No Internet | 3,336 | 17.2% |
| Total | 19,400 | 100.0% |
Dale County Summary
Dale County is located in the southeastern corner of Alabama, and is part of the Dothan Metropolitan Statistical Area. The county was created in 1824 and named for Samuel Dale, a hero of the Creek War of 1813-1814. The county seat is Ozark, and the largest city is Daleville. As of the 2010 census, the population was 50,251.
Geography
Dale County covers an area of 645 square miles, making it the second-smallest county in Alabama. It is bordered by Coffee County to the north, Geneva County to the east, Houston County to the south, and Covington and Crenshaw counties to the west. The county is mostly flat, with some rolling hills in the northern part. The Choctawhatchee River forms the western border of the county, and the Pea River forms the eastern border. The county is drained by several creeks, including the Choctawhatchee, Pea, and Little Choctawhatchee.
The climate of Dale County is humid subtropical, with hot, humid summers and mild winters. The average annual temperature is 64°F, and the average annual precipitation is 56 inches.
Economy
Agriculture is the mainstay of the Dale County economy. The county is one of the leading producers of peanuts, cotton, and soybeans in the state. Other crops grown in the county include corn, wheat, hay, and vegetables. Livestock production is also important, with cattle, hogs, and poultry being the main animals raised.
Manufacturing is also an important part of the economy. The county is home to several large manufacturing plants, including a paper mill, a tire plant, and a furniture factory. The county also has a growing service sector, with healthcare, retail, and tourism being the main industries.
Demographics
As of the 2010 census, there were 50,251 people, 19,845 households, and 14,072 families living in Dale County. The population density was 78 people per square mile. The racial makeup of the county was 79.2% White, 17.7% Black or African American, 0.5% Native American, 0.5% Asian, 0.2% Pacific Islander, 0.7% from other races, and 1.3% from two or more races. 2.2% of the population were Hispanic or Latino of any race.
The median income for a household in the county was $37,845, and the median income for a family was $45,945. The per capita income for the county was $19,845. About 17.2% of the population were below the poverty line.
Conclusion
Dale County is a rural county located in the southeastern corner of Alabama. It is bordered by Coffee, Geneva, Houston, Covington, and Crenshaw counties. The county has a humid subtropical climate, with hot, humid summers and mild winters. Agriculture is the mainstay of the economy, with peanuts, cotton, soybeans, and livestock being the main products. Manufacturing and services are also important parts of the economy. As of the 2010 census, the population was 50,251, with a median household income of $37,845.
Common Questions
What is Per Capita Income in Dale County?
Per Capita income in Dale County is $28,312.
What is the Median Family Income in Dale County?
Median Family Income in Dale County is $67,776.
What is the Median Household income in Dale County?
Median Household Income in Dale County is $52,813.
What is Income or Wage Gap in Dale County?
Income or Wage Gap in Dale County is 40.5%.
Women in Dale County earn 59.5 cents for every dollar earned by a man.
What is Family Income Deficit in Dale County?
Family Income Deficit in Dale County is $12,909.
Families that are below poverty line in Dale County earn $12,909 less on average than the poverty threshold level.
What is Inequality or Gini Index in Dale County?
Inequality or Gini Index in Dale County is 0.44.
What is the Total Population of Dale County?
Total Population of Dale County is 49,455.
What is the Total Male Population of Dale County?
Total Male Population of Dale County is 24,461.
What is the Total Female Population of Dale County?
Total Female Population of Dale County is 24,994.
What is the Ratio of Males per 100 Females in Dale County?
There are 97.87 Males per 100 Females in Dale County.
What is the Ratio of Females per 100 Males in Dale County?
There are 102.18 Females per 100 Males in Dale County.
What is the Median Population Age in Dale County?
Median Population Age in Dale County is 37.7 Years.
What is the Average Family Size in Dale County
Average Family Size in Dale County is 3.2 People.
What is the Average Household Size in Dale County
Average Household Size in Dale County is 2.5 People.
How Large is the Labor Force in Dale County?
There are 21,872 People in the Labor Forcein in Dale County.
What is the Percentage of People in the Labor Force in Dale County?
55.8% of People are in the Labor Force in Dale County.
What is the Unemployment Rate in Dale County?
Unemployment Rate in Dale County is 7.8%.