Chilton County, AL Map & Demographics
Chilton County Overview
$28,497
PER CAPITA INCOME
$72,090
AVG FAMILY INCOME
$62,471
AVG HOUSEHOLD INCOME
36.0%
WAGE / INCOME GAP [ % ]
64.0¢/ $1
WAGE / INCOME GAP [ $ ]
$9,398
FAMILY INCOME DEFICIT
0.42
INEQUALITY / GINI INDEX
45,140
TOTAL POPULATION
22,048
MALE POPULATION
23,092
FEMALE POPULATION
95.48
MALES / 100 FEMALES
104.74
FEMALES / 100 MALES
39.9
MEDIAN AGE
3.1
AVG FAMILY SIZE
2.6
AVG HOUSEHOLD SIZE
19,906
LABOR FORCE [ PEOPLE ]
56.4%
PERCENT IN LABOR FORCE
5.3%
UNEMPLOYMENT RATE
Income in Chilton County
Income Overview in Chilton County
Per Capita Income in Chilton County is $28,497, while median incomes of families and households are $72,090 and $62,471 respectively.
| Characteristic | Number | Measure |
| Per Capita Income | 45,140 | $28,497 |
| Median Family Income | 12,257 | $72,090 |
| Mean Family Income | 12,257 | $83,529 |
| Median Household Income | 16,931 | $62,471 |
| Mean Household Income | 16,931 | $73,650 |
| Income Deficit | 12,257 | $9,398 |
| Wage / Income Gap (%) | 45,140 | 35.95% |
| Wage / Income Gap ($) | 45,140 | 64.05¢ per $1 |
| Gini / Inequality Index | 45,140 | 0.42 |
Earnings by Sex in Chilton County
Average Earnings in Chilton County are $38,287, $45,415 for men and $29,087 for women, a difference of 35.9%.
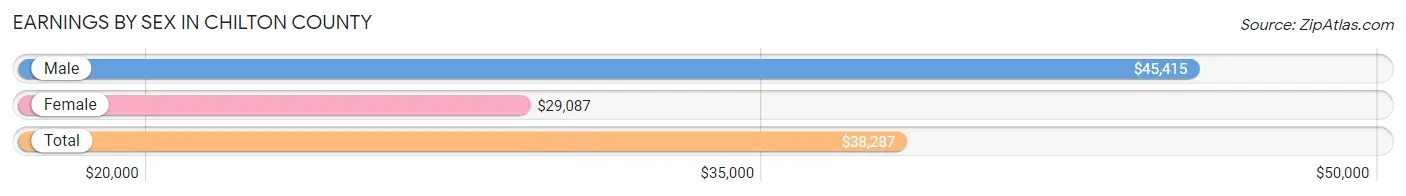
| Sex | Number | Average Earnings |
| Male | 11,628 (56.4%) | $45,415 |
| Female | 9,009 (43.6%) | $29,087 |
| Total | 20,637 (100.0%) | $38,287 |
Earnings by Sex by Income Bracket in Chilton County
The most common earnings brackets in Chilton County are $55,000 to $64,999 for men (1,433 | 12.3%) and $25,000 to $29,999 for women (788 | 8.7%).
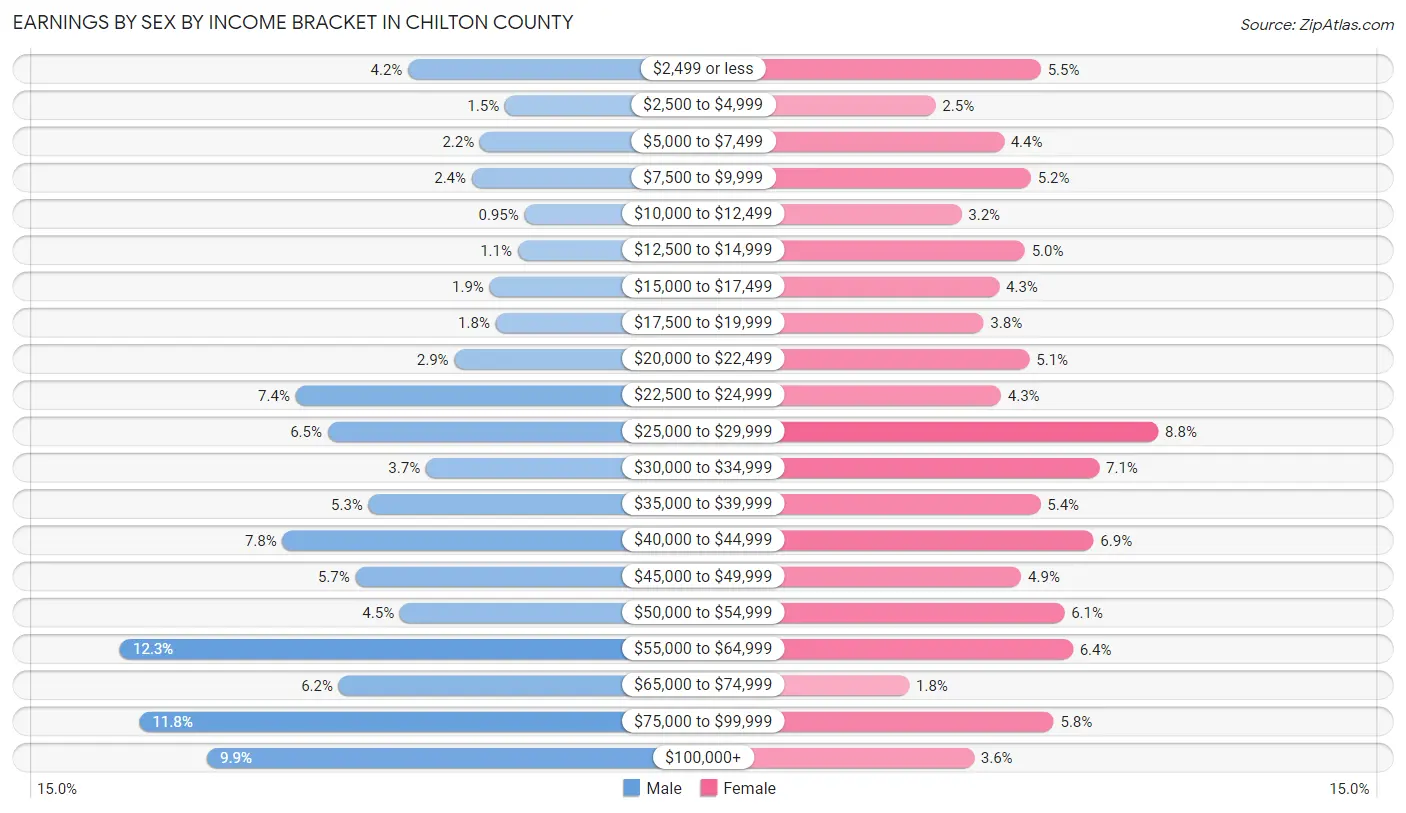
| Income | Male | Female |
| $2,499 or less | 491 (4.2%) | 491 (5.4%) |
| $2,500 to $4,999 | 174 (1.5%) | 224 (2.5%) |
| $5,000 to $7,499 | 256 (2.2%) | 397 (4.4%) |
| $7,500 to $9,999 | 283 (2.4%) | 466 (5.2%) |
| $10,000 to $12,499 | 110 (0.9%) | 290 (3.2%) |
| $12,500 to $14,999 | 133 (1.1%) | 450 (5.0%) |
| $15,000 to $17,499 | 224 (1.9%) | 386 (4.3%) |
| $17,500 to $19,999 | 205 (1.8%) | 346 (3.8%) |
| $20,000 to $22,499 | 339 (2.9%) | 462 (5.1%) |
| $22,500 to $24,999 | 858 (7.4%) | 390 (4.3%) |
| $25,000 to $29,999 | 753 (6.5%) | 788 (8.7%) |
| $30,000 to $34,999 | 433 (3.7%) | 639 (7.1%) |
| $35,000 to $39,999 | 620 (5.3%) | 490 (5.4%) |
| $40,000 to $44,999 | 901 (7.7%) | 624 (6.9%) |
| $45,000 to $49,999 | 663 (5.7%) | 441 (4.9%) |
| $50,000 to $54,999 | 518 (4.4%) | 550 (6.1%) |
| $55,000 to $64,999 | 1,433 (12.3%) | 572 (6.4%) |
| $65,000 to $74,999 | 717 (6.2%) | 158 (1.8%) |
| $75,000 to $99,999 | 1,369 (11.8%) | 523 (5.8%) |
| $100,000+ | 1,148 (9.9%) | 322 (3.6%) |
| Total | 11,628 (100.0%) | 9,009 (100.0%) |
Earnings by Sex by Educational Attainment in Chilton County
Average earnings in Chilton County are $51,680 for men and $31,940 for women, a difference of 38.2%. Men with an educational attainment of graduate degree enjoy the highest average annual earnings of $61,484, while those with less than high school education earn the least with $42,430. Women with an educational attainment of graduate degree earn the most with the average annual earnings of $50,179, while those with high school diploma education have the smallest earnings of $23,485.
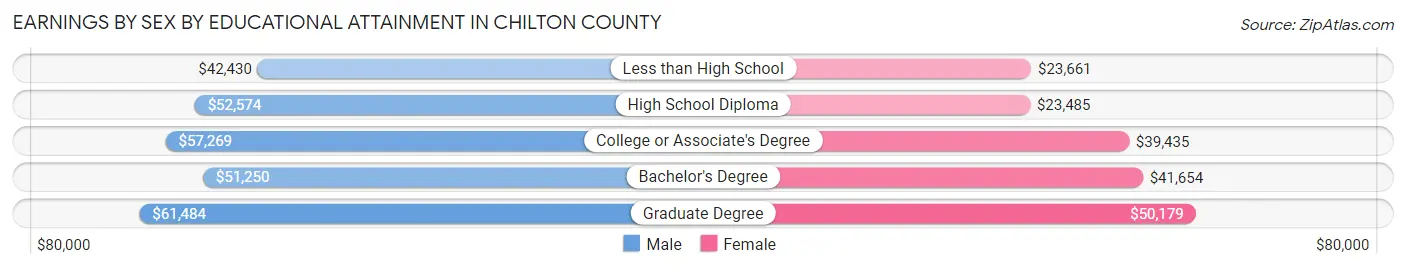
| Educational Attainment | Male Income | Female Income |
| Less than High School | $42,430 | $23,661 |
| High School Diploma | $52,574 | $23,485 |
| College or Associate's Degree | $57,269 | $39,435 |
| Bachelor's Degree | $51,250 | $41,654 |
| Graduate Degree | $61,484 | $50,179 |
| Total | $51,680 | $31,940 |
Family Income in Chilton County
Family Income Brackets in Chilton County
According to the Chilton County family income data, there are 2,586 families falling into the $50,000 to $74,999 income range, which is the most common income bracket and makes up 21.1% of all families. Conversely, the $10,000 to $14,999 income bracket is the least frequent group with only 184 families (1.5%) belonging to this category.
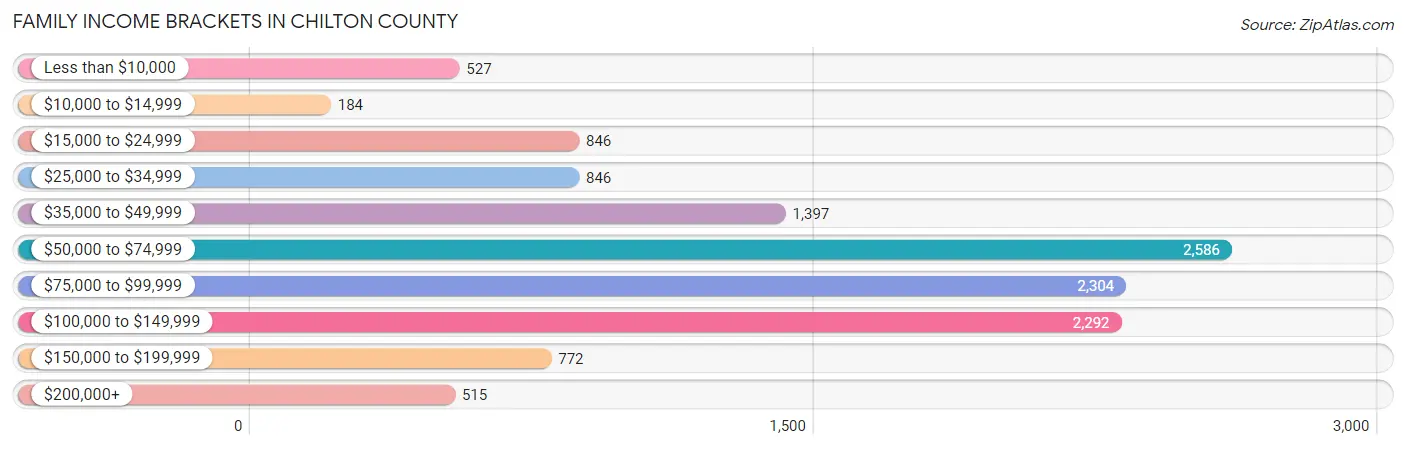
| Income Bracket | # Families | % Families |
| Less than $10,000 | 527 | 4.3% |
| $10,000 to $14,999 | 184 | 1.5% |
| $15,000 to $24,999 | 846 | 6.9% |
| $25,000 to $34,999 | 846 | 6.9% |
| $35,000 to $49,999 | 1,397 | 11.4% |
| $50,000 to $74,999 | 2,586 | 21.1% |
| $75,000 to $99,999 | 2,304 | 18.8% |
| $100,000 to $149,999 | 2,292 | 18.7% |
| $150,000 to $199,999 | 772 | 6.3% |
| $200,000+ | 515 | 4.2% |
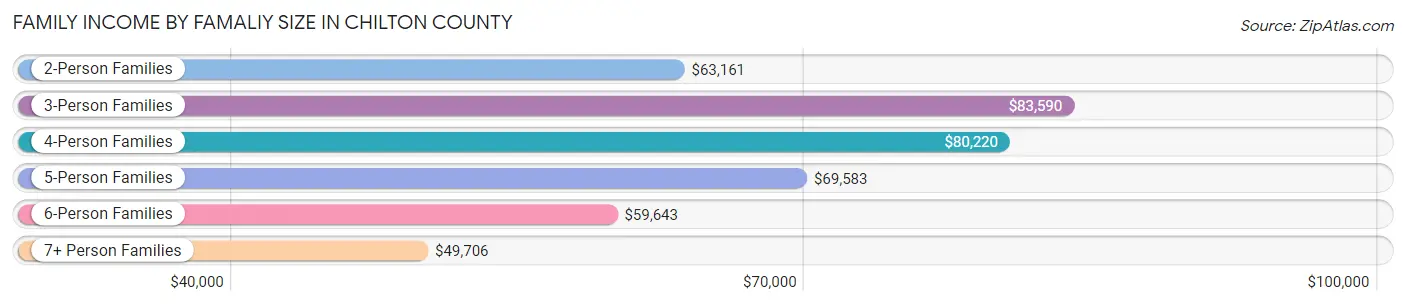
Family Income by Famaliy Size in Chilton County
3-person families (3,112 | 25.4%) account for the highest median family income in Chilton County with $83,590 per family, while 2-person families (6,112 | 49.9%) have the highest median income of $31,580 per family member.
| Income Bracket | # Families | Median Income |
| 2-Person Families | 6,112 (49.9%) | $63,161 |
| 3-Person Families | 3,112 (25.4%) | $83,590 |
| 4-Person Families | 2,289 (18.7%) | $80,220 |
| 5-Person Families | 470 (3.8%) | $69,583 |
| 6-Person Families | 196 (1.6%) | $59,643 |
| 7+ Person Families | 78 (0.6%) | $49,706 |
| Total | 12,257 (100.0%) | $72,090 |
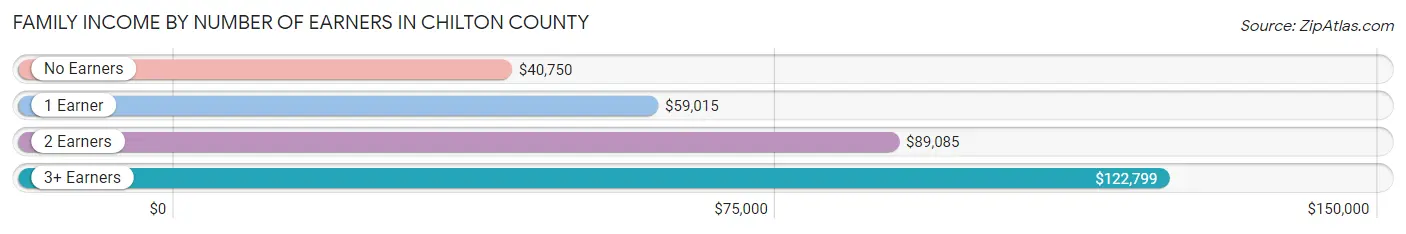
Family Income by Number of Earners in Chilton County
The median family income in Chilton County is $72,090, with families comprising 3+ earners (903) having the highest median family income of $122,799, while families with no earners (2,696) have the lowest median family income of $40,750, accounting for 7.4% and 22.0% of families, respectively.
| Number of Earners | # Families | Median Income |
| No Earners | 2,696 (22.0%) | $40,750 |
| 1 Earner | 3,605 (29.4%) | $59,015 |
| 2 Earners | 5,053 (41.2%) | $89,085 |
| 3+ Earners | 903 (7.4%) | $122,799 |
| Total | 12,257 (100.0%) | $72,090 |
Household Income in Chilton County
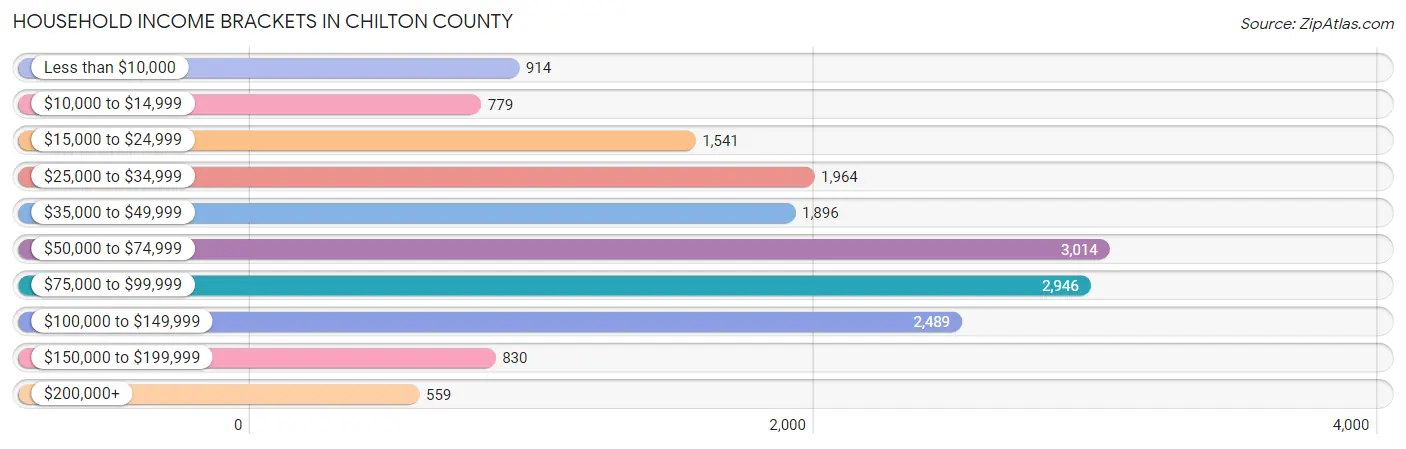
Household Income Brackets in Chilton County
With 3,014 households falling in the category, the $50,000 to $74,999 income range is the most frequent in Chilton County, accounting for 17.8% of all households. In contrast, only 559 households (3.3%) fall into the $200,000+ income bracket, making it the least populous group.
| Income Bracket | # Households | % Households |
| Less than $10,000 | 914 | 5.4% |
| $10,000 to $14,999 | 779 | 4.6% |
| $15,000 to $24,999 | 1,541 | 9.1% |
| $25,000 to $34,999 | 1,964 | 11.6% |
| $35,000 to $49,999 | 1,896 | 11.2% |
| $50,000 to $74,999 | 3,014 | 17.8% |
| $75,000 to $99,999 | 2,946 | 17.4% |
| $100,000 to $149,999 | 2,489 | 14.7% |
| $150,000 to $199,999 | 830 | 4.9% |
| $200,000+ | 559 | 3.3% |
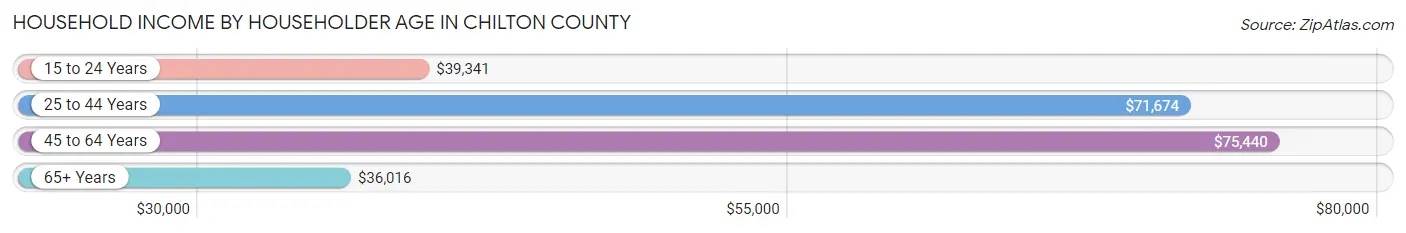
Household Income by Householder Age in Chilton County
The median household income in Chilton County is $62,471, with the highest median household income of $75,440 found in the 45 to 64 years age bracket for the primary householder. A total of 6,984 households (41.2%) fall into this category. Meanwhile, the 65+ years age bracket for the primary householder has the lowest median household income of $36,016, with 4,669 households (27.6%) in this group.
| Income Bracket | # Households | Median Income |
| 15 to 24 Years | 573 (3.4%) | $39,341 |
| 25 to 44 Years | 4,705 (27.8%) | $71,674 |
| 45 to 64 Years | 6,984 (41.2%) | $75,440 |
| 65+ Years | 4,669 (27.6%) | $36,016 |
| Total | 16,931 (100.0%) | $62,471 |
Poverty in Chilton County
Income Below Poverty by Sex and Age in Chilton County
With 14.0% poverty level for males and 14.9% for females among the residents of Chilton County, 12 to 14 year old males and 5 year old females are the most vulnerable to poverty, with 303 males (39.6%) and 70 females (41.2%) in their respective age groups living below the poverty level.
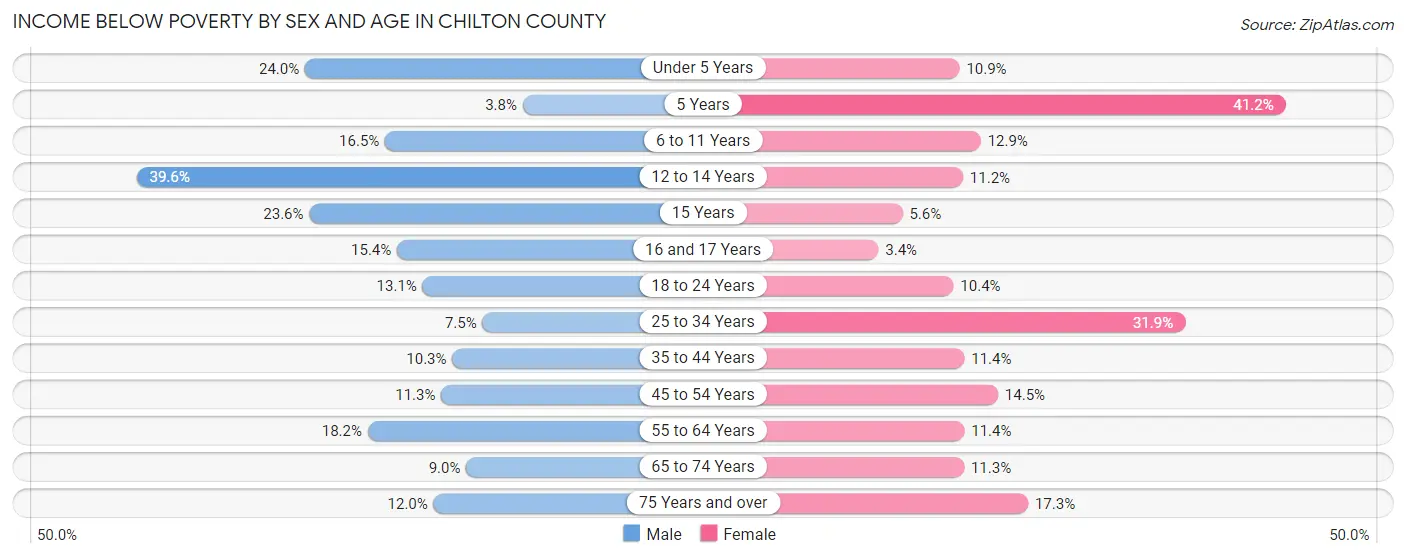
| Age Bracket | Male | Female |
| Under 5 Years | 296 (24.0%) | 150 (10.9%) |
| 5 Years | 14 (3.8%) | 70 (41.2%) |
| 6 to 11 Years | 296 (16.5%) | 242 (12.9%) |
| 12 to 14 Years | 303 (39.6%) | 109 (11.2%) |
| 15 Years | 95 (23.6%) | 31 (5.6%) |
| 16 and 17 Years | 87 (15.4%) | 10 (3.4%) |
| 18 to 24 Years | 256 (13.1%) | 189 (10.4%) |
| 25 to 34 Years | 190 (7.5%) | 950 (31.9%) |
| 35 to 44 Years | 298 (10.3%) | 305 (11.4%) |
| 45 to 54 Years | 327 (11.3%) | 413 (14.5%) |
| 55 to 64 Years | 539 (18.1%) | 345 (11.4%) |
| 65 to 74 Years | 190 (9.0%) | 268 (11.3%) |
| 75 Years and over | 153 (12.0%) | 296 (17.3%) |
| Total | 3,044 (14.0%) | 3,378 (14.9%) |
Income Above Poverty by Sex and Age in Chilton County
According to the poverty statistics in Chilton County, males aged 5 years and females aged 16 and 17 years are the age groups that are most secure financially, with 96.2% of males and 96.6% of females in these age groups living above the poverty line.
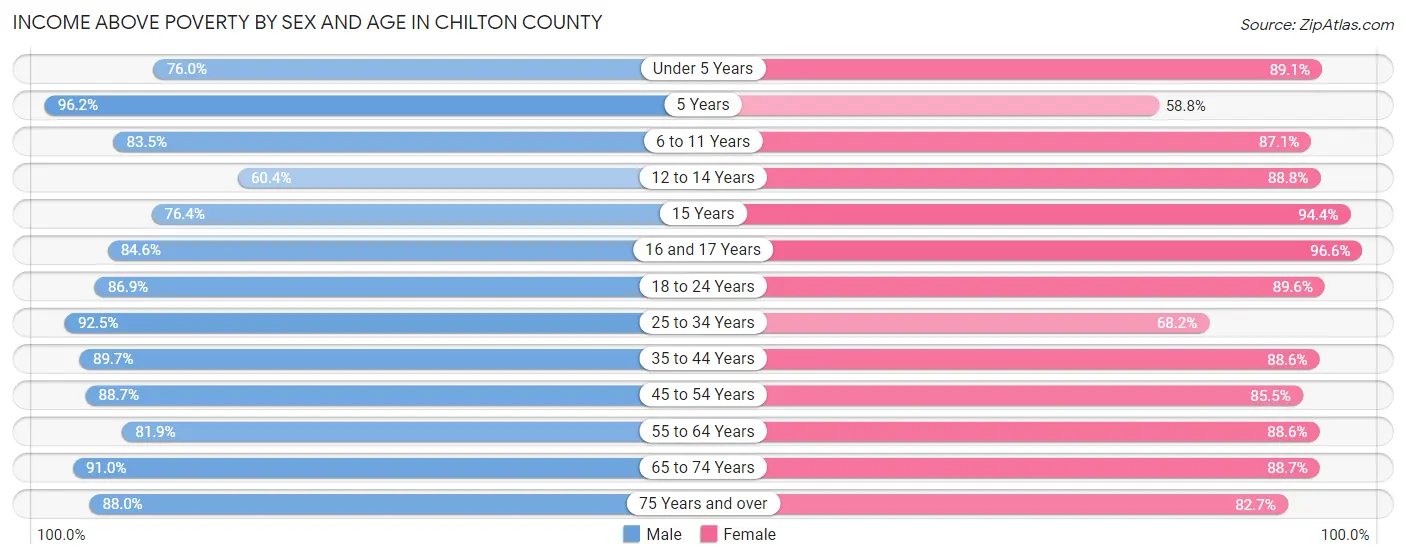
| Age Bracket | Male | Female |
| Under 5 Years | 939 (76.0%) | 1,223 (89.1%) |
| 5 Years | 358 (96.2%) | 100 (58.8%) |
| 6 to 11 Years | 1,494 (83.5%) | 1,635 (87.1%) |
| 12 to 14 Years | 462 (60.4%) | 861 (88.8%) |
| 15 Years | 308 (76.4%) | 520 (94.4%) |
| 16 and 17 Years | 477 (84.6%) | 285 (96.6%) |
| 18 to 24 Years | 1,704 (86.9%) | 1,635 (89.6%) |
| 25 to 34 Years | 2,345 (92.5%) | 2,033 (68.1%) |
| 35 to 44 Years | 2,596 (89.7%) | 2,377 (88.6%) |
| 45 to 54 Years | 2,559 (88.7%) | 2,438 (85.5%) |
| 55 to 64 Years | 2,430 (81.9%) | 2,690 (88.6%) |
| 65 to 74 Years | 1,919 (91.0%) | 2,096 (88.7%) |
| 75 Years and over | 1,118 (88.0%) | 1,417 (82.7%) |
| Total | 18,709 (86.0%) | 19,310 (85.1%) |
Income Below Poverty Among Married-Couple Families in Chilton County
The poverty statistics for married-couple families in Chilton County show that 6.3% or 574 of the total 9,062 families live below the poverty line. Families with 5 or more children have the highest poverty rate of 21.7%, comprising of 5 families. On the other hand, families with 3 or 4 children have the lowest poverty rate of 4.1%, which includes 18 families.
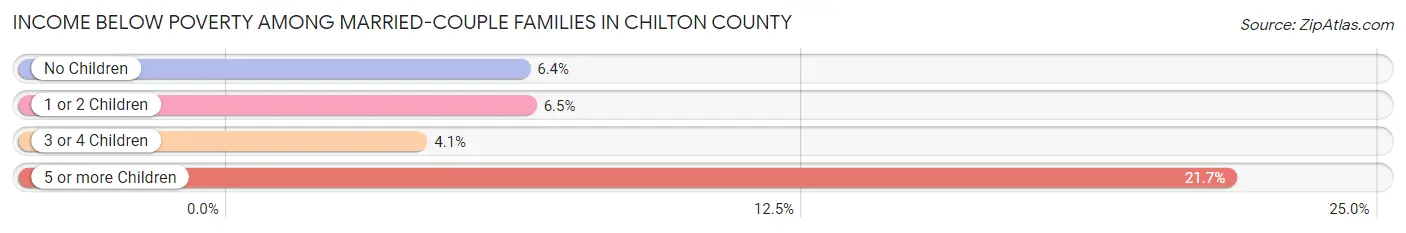
| Children | Above Poverty | Below Poverty |
| No Children | 5,274 (93.6%) | 358 (6.4%) |
| 1 or 2 Children | 2,777 (93.5%) | 193 (6.5%) |
| 3 or 4 Children | 419 (95.9%) | 18 (4.1%) |
| 5 or more Children | 18 (78.3%) | 5 (21.7%) |
| Total | 8,488 (93.7%) | 574 (6.3%) |
Income Below Poverty Among Single-Parent Households in Chilton County
According to the poverty data in Chilton County, 20.9% or 209 single-father households and 26.9% or 590 single-mother households are living below the poverty line. Among single-father households, those with 1 or 2 children have the highest poverty rate, with 145 households (31.4%) experiencing poverty. Likewise, among single-mother households, those with 1 or 2 children have the highest poverty rate, with 392 households (46.5%) falling below the poverty line.
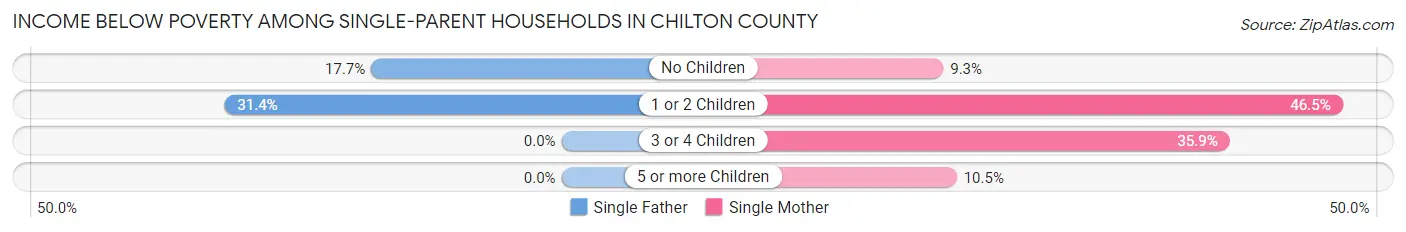
| Children | Single Father | Single Mother |
| No Children | 64 (17.7%) | 97 (9.3%) |
| 1 or 2 Children | 145 (31.4%) | 392 (46.5%) |
| 3 or 4 Children | 0 (0.0%) | 97 (35.9%) |
| 5 or more Children | 0 (0.0%) | 4 (10.5%) |
| Total | 209 (20.9%) | 590 (26.9%) |
Income Below Poverty Among Married-Couple vs Single-Parent Households in Chilton County
The poverty data for Chilton County shows that 574 of the married-couple family households (6.3%) and 799 of the single-parent households (25.0%) are living below the poverty level. Within the married-couple family households, those with 5 or more children have the highest poverty rate, with 5 households (21.7%) falling below the poverty line. Among the single-parent households, those with 1 or 2 children have the highest poverty rate, with 537 household (41.1%) living below poverty.
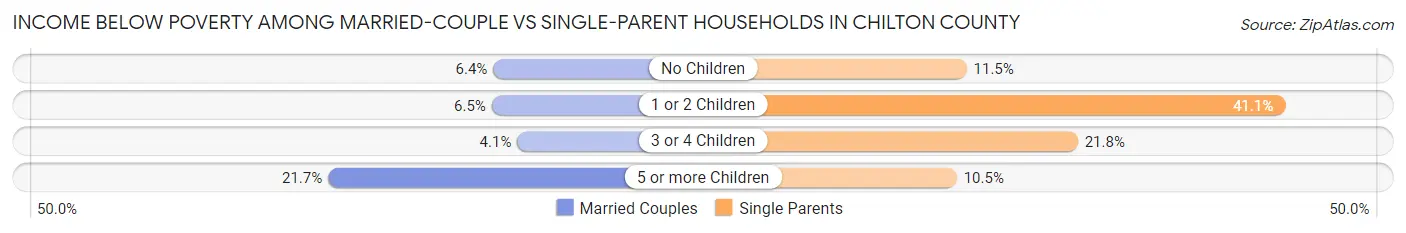
| Children | Married-Couple Families | Single-Parent Households |
| No Children | 358 (6.4%) | 161 (11.5%) |
| 1 or 2 Children | 193 (6.5%) | 537 (41.1%) |
| 3 or 4 Children | 18 (4.1%) | 97 (21.8%) |
| 5 or more Children | 5 (21.7%) | 4 (10.5%) |
| Total | 574 (6.3%) | 799 (25.0%) |
Race in Chilton County
The most populous races in Chilton County are White / Caucasian (36,693 | 81.3%), Black / African American (4,257 | 9.4%), and Hispanic or Latino (3,664 | 8.1%).
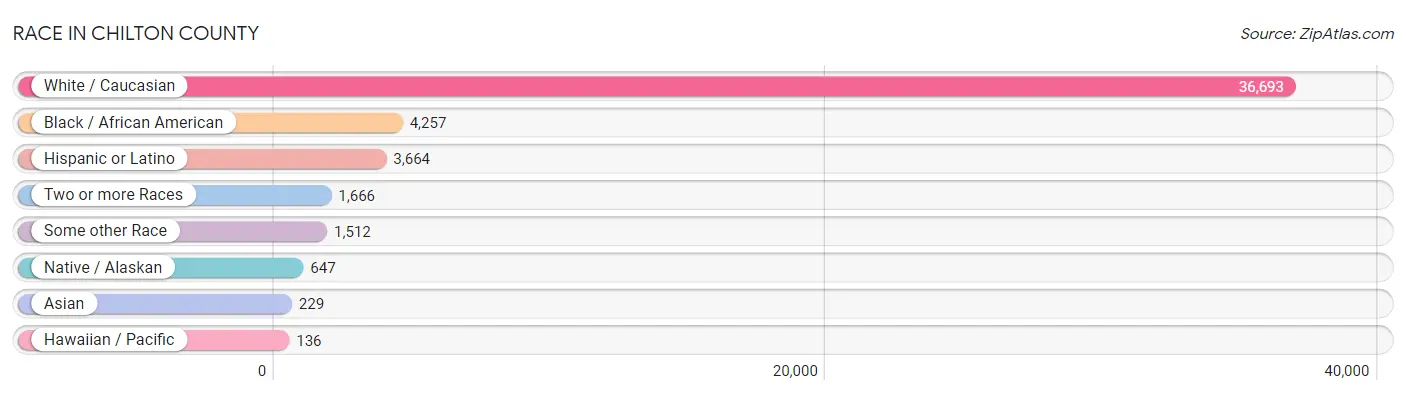
| Race | # Population | % Population |
| Asian | 229 | 0.5% |
| Black / African American | 4,257 | 9.4% |
| Hawaiian / Pacific | 136 | 0.3% |
| Hispanic or Latino | 3,664 | 8.1% |
| Native / Alaskan | 647 | 1.4% |
| White / Caucasian | 36,693 | 81.3% |
| Two or more Races | 1,666 | 3.7% |
| Some other Race | 1,512 | 3.4% |
| Total | 45,140 | 100.0% |
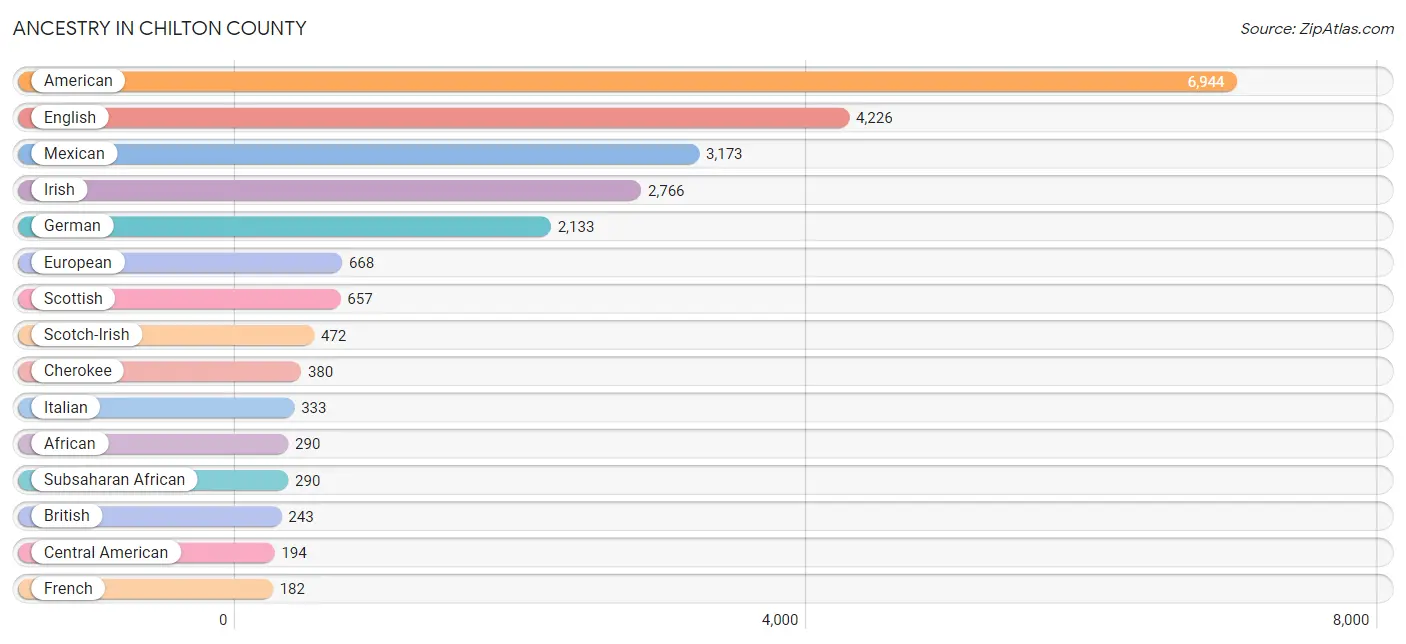
Ancestry in Chilton County
The most populous ancestries reported in Chilton County are American (6,944 | 15.4%), English (4,226 | 9.4%), Mexican (3,173 | 7.0%), Irish (2,766 | 6.1%), and German (2,133 | 4.7%), together accounting for 42.6% of all Chilton County residents.
| Ancestry | # Population | % Population |
| African | 290 | 0.6% |
| American | 6,944 | 15.4% |
| Arab | 6 | 0.0% |
| Armenian | 9 | 0.0% |
| Belgian | 7 | 0.0% |
| Bhutanese | 19 | 0.0% |
| British | 243 | 0.5% |
| Burmese | 19 | 0.0% |
| Cajun | 23 | 0.1% |
| Canadian | 37 | 0.1% |
| Central American | 194 | 0.4% |
| Central American Indian | 41 | 0.1% |
| Cherokee | 380 | 0.8% |
| Colombian | 4 | 0.0% |
| Creek | 10 | 0.0% |
| Dutch | 90 | 0.2% |
| Dutch West Indian | 13 | 0.0% |
| Eastern European | 24 | 0.1% |
| English | 4,226 | 9.4% |
| European | 668 | 1.5% |
| Fijian | 15 | 0.0% |
| French | 182 | 0.4% |
| French Canadian | 67 | 0.2% |
| German | 2,133 | 4.7% |
| Honduran | 98 | 0.2% |
| Hungarian | 20 | 0.0% |
| Indian (Asian) | 49 | 0.1% |
| Irish | 2,766 | 6.1% |
| Italian | 333 | 0.7% |
| Lebanese | 6 | 0.0% |
| Lithuanian | 2 | 0.0% |
| Mexican | 3,173 | 7.0% |
| Mexican American Indian | 26 | 0.1% |
| Native Hawaiian | 29 | 0.1% |
| Norwegian | 57 | 0.1% |
| Polish | 81 | 0.2% |
| Portuguese | 11 | 0.0% |
| Puerto Rican | 144 | 0.3% |
| Russian | 8 | 0.0% |
| Salvadoran | 96 | 0.2% |
| Scandinavian | 117 | 0.3% |
| Scotch-Irish | 472 | 1.1% |
| Scottish | 657 | 1.5% |
| Serbian | 29 | 0.1% |
| Slovak | 2 | 0.0% |
| South American | 9 | 0.0% |
| Sri Lankan | 112 | 0.3% |
| Subsaharan African | 290 | 0.6% |
| Swedish | 126 | 0.3% |
| Swiss | 23 | 0.1% |
| Thai | 59 | 0.1% |
| Ukrainian | 3 | 0.0% |
| Venezuelan | 5 | 0.0% |
| Welsh | 145 | 0.3% |
| West Indian | 5 | 0.0% | View All 55 Rows |
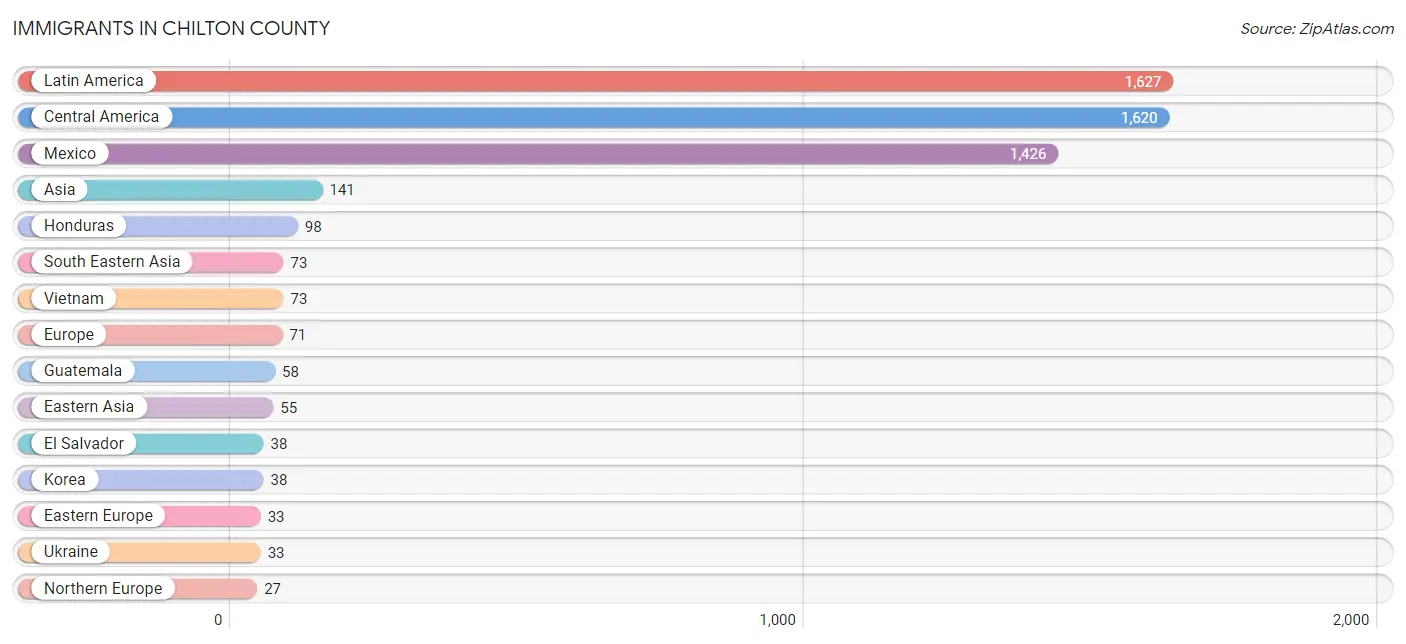
Immigrants in Chilton County
The most numerous immigrant groups reported in Chilton County came from Latin America (1,627 | 3.6%), Central America (1,620 | 3.6%), Mexico (1,426 | 3.2%), Asia (141 | 0.3%), and Honduras (98 | 0.2%), together accounting for 10.9% of all Chilton County residents.
| Immigration Origin | # Population | % Population |
| Asia | 141 | 0.3% |
| Central America | 1,620 | 3.6% |
| China | 17 | 0.0% |
| Colombia | 7 | 0.0% |
| Eastern Asia | 55 | 0.1% |
| Eastern Europe | 33 | 0.1% |
| El Salvador | 38 | 0.1% |
| England | 25 | 0.1% |
| Europe | 71 | 0.2% |
| Germany | 11 | 0.0% |
| Guatemala | 58 | 0.1% |
| Honduras | 98 | 0.2% |
| India | 11 | 0.0% |
| Korea | 38 | 0.1% |
| Latin America | 1,627 | 3.6% |
| Lebanon | 2 | 0.0% |
| Mexico | 1,426 | 3.2% |
| Northern Europe | 27 | 0.1% |
| South America | 7 | 0.0% |
| South Central Asia | 11 | 0.0% |
| South Eastern Asia | 73 | 0.2% |
| Sweden | 2 | 0.0% |
| Ukraine | 33 | 0.1% |
| Vietnam | 73 | 0.2% |
| Western Asia | 2 | 0.0% |
| Western Europe | 11 | 0.0% | View All 26 Rows |
Sex and Age in Chilton County
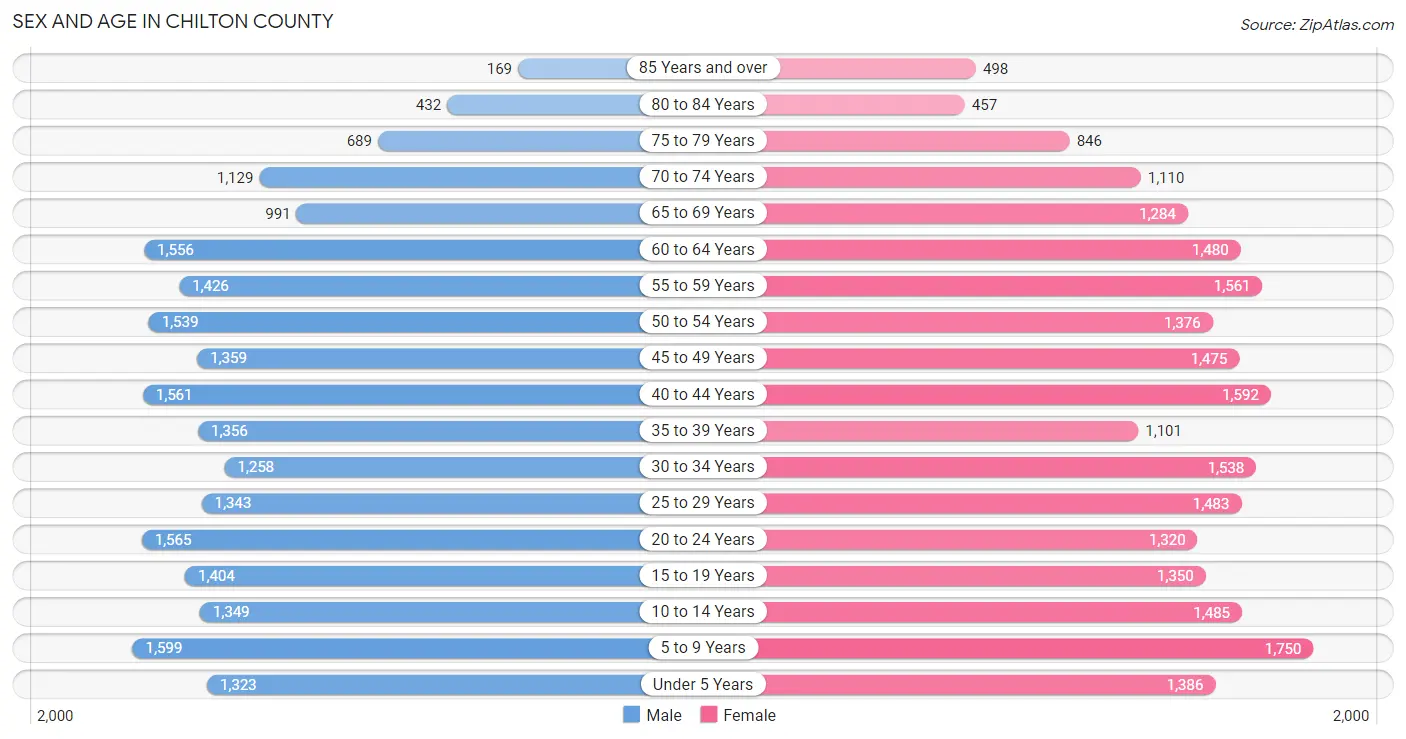
Sex and Age in Chilton County
The most populous age groups in Chilton County are 5 to 9 Years (1,599 | 7.2%) for men and 5 to 9 Years (1,750 | 7.6%) for women.
| Age Bracket | Male | Female |
| Under 5 Years | 1,323 (6.0%) | 1,386 (6.0%) |
| 5 to 9 Years | 1,599 (7.2%) | 1,750 (7.6%) |
| 10 to 14 Years | 1,349 (6.1%) | 1,485 (6.4%) |
| 15 to 19 Years | 1,404 (6.4%) | 1,350 (5.9%) |
| 20 to 24 Years | 1,565 (7.1%) | 1,320 (5.7%) |
| 25 to 29 Years | 1,343 (6.1%) | 1,483 (6.4%) |
| 30 to 34 Years | 1,258 (5.7%) | 1,538 (6.7%) |
| 35 to 39 Years | 1,356 (6.1%) | 1,101 (4.8%) |
| 40 to 44 Years | 1,561 (7.1%) | 1,592 (6.9%) |
| 45 to 49 Years | 1,359 (6.2%) | 1,475 (6.4%) |
| 50 to 54 Years | 1,539 (7.0%) | 1,376 (6.0%) |
| 55 to 59 Years | 1,426 (6.5%) | 1,561 (6.8%) |
| 60 to 64 Years | 1,556 (7.1%) | 1,480 (6.4%) |
| 65 to 69 Years | 991 (4.5%) | 1,284 (5.6%) |
| 70 to 74 Years | 1,129 (5.1%) | 1,110 (4.8%) |
| 75 to 79 Years | 689 (3.1%) | 846 (3.7%) |
| 80 to 84 Years | 432 (2.0%) | 457 (2.0%) |
| 85 Years and over | 169 (0.8%) | 498 (2.2%) |
| Total | 22,048 (100.0%) | 23,092 (100.0%) |
Families and Households in Chilton County
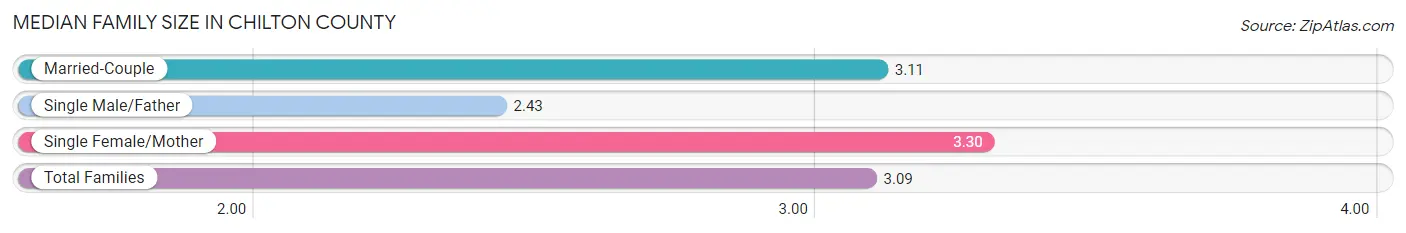
Median Family Size in Chilton County
The median family size in Chilton County is 3.09 persons per family, with single female/mother families (2,197 | 17.9%) accounting for the largest median family size of 3.3 persons per family. On the other hand, single male/father families (998 | 8.1%) represent the smallest median family size with 2.43 persons per family.
| Family Type | # Families | Family Size |
| Married-Couple | 9,062 (73.9%) | 3.11 |
| Single Male/Father | 998 (8.1%) | 2.43 |
| Single Female/Mother | 2,197 (17.9%) | 3.30 |
| Total Families | 12,257 (100.0%) | 3.09 |
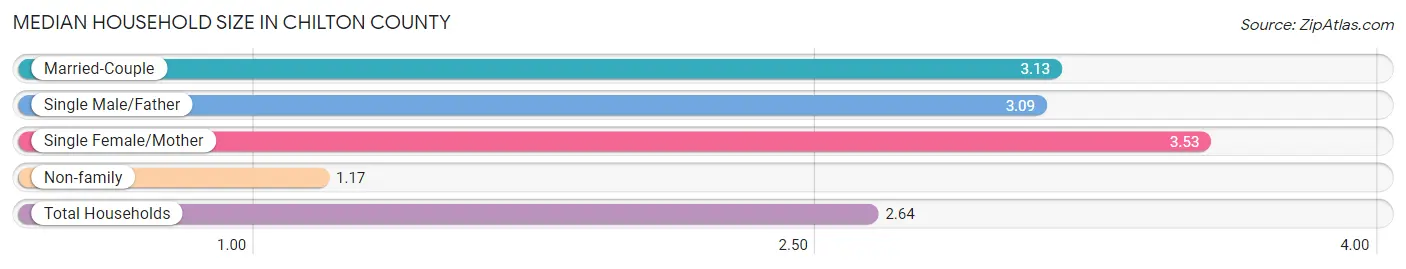
Median Household Size in Chilton County
The median household size in Chilton County is 2.64 persons per household, with single female/mother households (2,197 | 13.0%) accounting for the largest median household size of 3.53 persons per household. non-family households (4,674 | 27.6%) represent the smallest median household size with 1.17 persons per household.
| Household Type | # Households | Household Size |
| Married-Couple | 9,062 (53.5%) | 3.13 |
| Single Male/Father | 998 (5.9%) | 3.09 |
| Single Female/Mother | 2,197 (13.0%) | 3.53 |
| Non-family | 4,674 (27.6%) | 1.17 |
| Total Households | 16,931 (100.0%) | 2.64 |
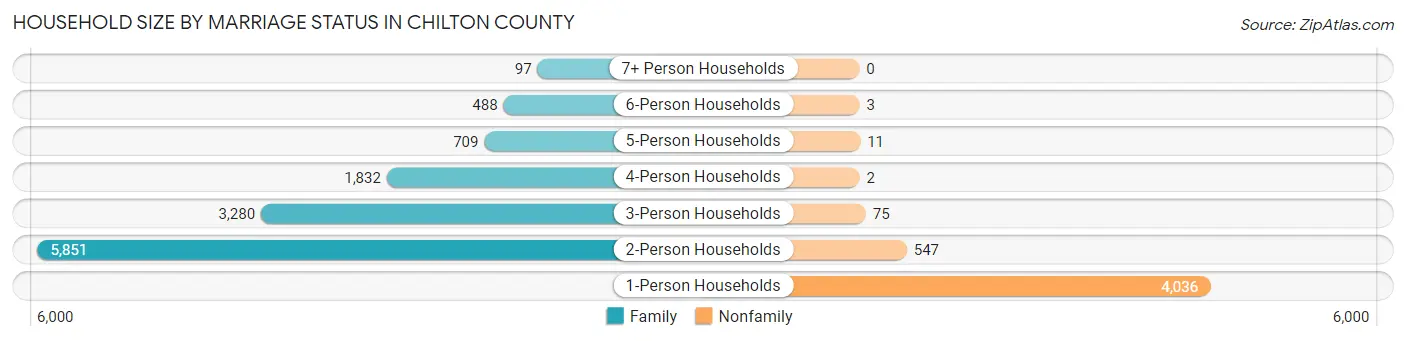
Household Size by Marriage Status in Chilton County
Out of a total of 16,931 households in Chilton County, 12,257 (72.4%) are family households, while 4,674 (27.6%) are nonfamily households. The most numerous type of family households are 2-person households, comprising 5,851, and the most common type of nonfamily households are 1-person households, comprising 4,036.
| Household Size | Family Households | Nonfamily Households |
| 1-Person Households | - | 4,036 (23.8%) |
| 2-Person Households | 5,851 (34.6%) | 547 (3.2%) |
| 3-Person Households | 3,280 (19.4%) | 75 (0.4%) |
| 4-Person Households | 1,832 (10.8%) | 2 (0.0%) |
| 5-Person Households | 709 (4.2%) | 11 (0.1%) |
| 6-Person Households | 488 (2.9%) | 3 (0.0%) |
| 7+ Person Households | 97 (0.6%) | 0 (0.0%) |
| Total | 12,257 (72.4%) | 4,674 (27.6%) |
Female Fertility in Chilton County
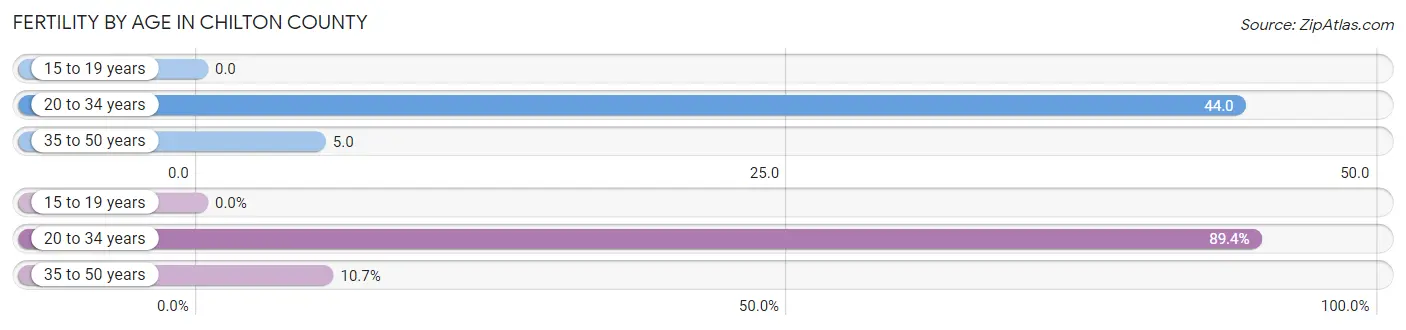
Fertility by Age in Chilton County
Average fertility rate in Chilton County is 21.0 births per 1,000 women. Women in the age bracket of 20 to 34 years have the highest fertility rate with 44.0 births per 1,000 women. Women in the age bracket of 20 to 34 years acount for 89.3% of all women with births.
| Age Bracket | Women with Births | Births / 1,000 Women |
| 15 to 19 years | 0 (0.0%) | 0.0 |
| 20 to 34 years | 193 (89.3%) | 44.0 |
| 35 to 50 years | 23 (10.6%) | 5.0 |
| Total | 216 (100.0%) | 21.0 |
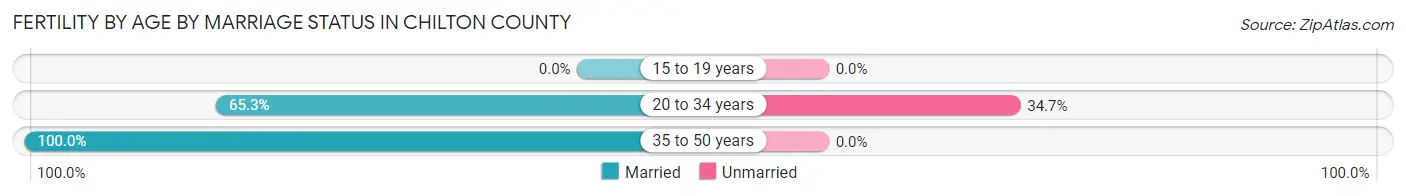
Fertility by Age by Marriage Status in Chilton County
69.0% of women with births (216) in Chilton County are married. The highest percentage of unmarried women with births falls into 20 to 34 years age bracket with 34.7% of them unmarried at the time of birth, while the lowest percentage of unmarried women with births belong to 35 to 50 years age bracket with 0.0% of them unmarried.
| Age Bracket | Married | Unmarried |
| 15 to 19 years | 0 (0.0%) | 0 (0.0%) |
| 20 to 34 years | 126 (65.3%) | 67 (34.7%) |
| 35 to 50 years | 23 (100.0%) | 0 (0.0%) |
| Total | 149 (69.0%) | 67 (31.0%) |
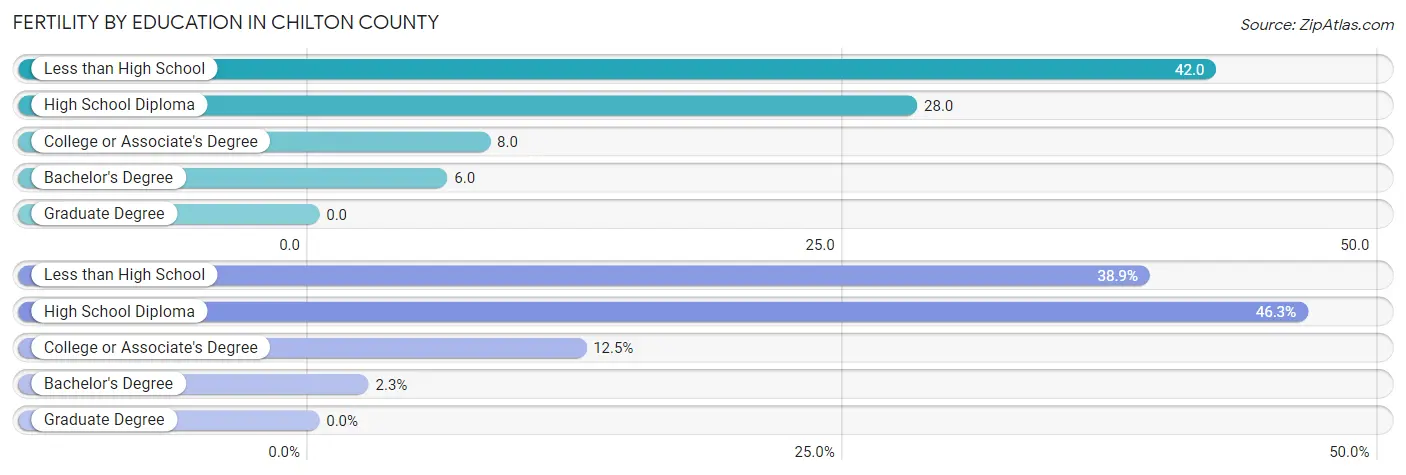
Fertility by Education in Chilton County
| Educational Attainment | Women with Births | Births / 1,000 Women |
| Less than High School | 84 (38.9%) | 42.0 |
| High School Diploma | 100 (46.3%) | 28.0 |
| College or Associate's Degree | 27 (12.5%) | 8.0 |
| Bachelor's Degree | 5 (2.3%) | 6.0 |
| Graduate Degree | 0 (0.0%) | 0.0 |
| Total | 216 (100.0%) | 21.0 |
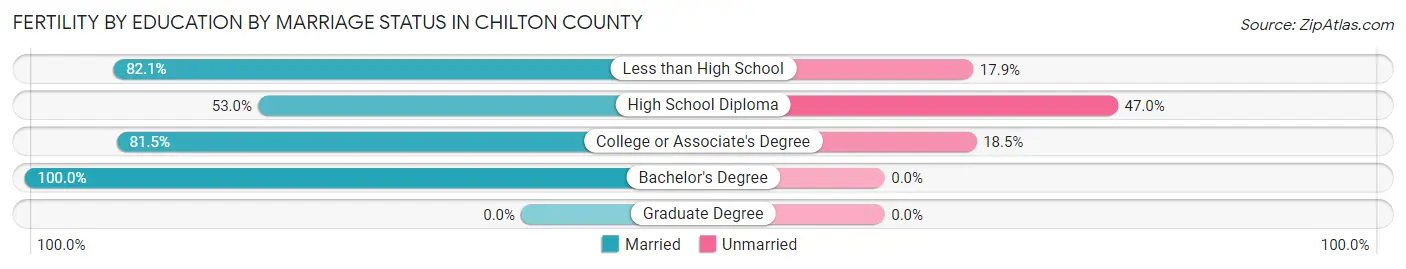
Fertility by Education by Marriage Status in Chilton County
31.0% of women with births in Chilton County are unmarried. Women with the educational attainment of bachelor's degree are most likely to be married with 100.0% of them married at childbirth, while women with the educational attainment of high school diploma are least likely to be married with 47.0% of them unmarried at childbirth.
| Educational Attainment | Married | Unmarried |
| Less than High School | 69 (82.1%) | 15 (17.9%) |
| High School Diploma | 53 (53.0%) | 47 (47.0%) |
| College or Associate's Degree | 22 (81.5%) | 5 (18.5%) |
| Bachelor's Degree | 5 (100.0%) | 0 (0.0%) |
| Graduate Degree | 0 (0.0%) | 0 (0.0%) |
| Total | 149 (69.0%) | 67 (31.0%) |
Employment Characteristics in Chilton County
Employment by Class of Employer in Chilton County
Among the 18,524 employed individuals in Chilton County, private company employees (13,119 | 70.8%), not-for-profit organizations (1,205 | 6.5%), and self-employed (not incorporated) (1,147 | 6.2%) make up the most common classes of employment.
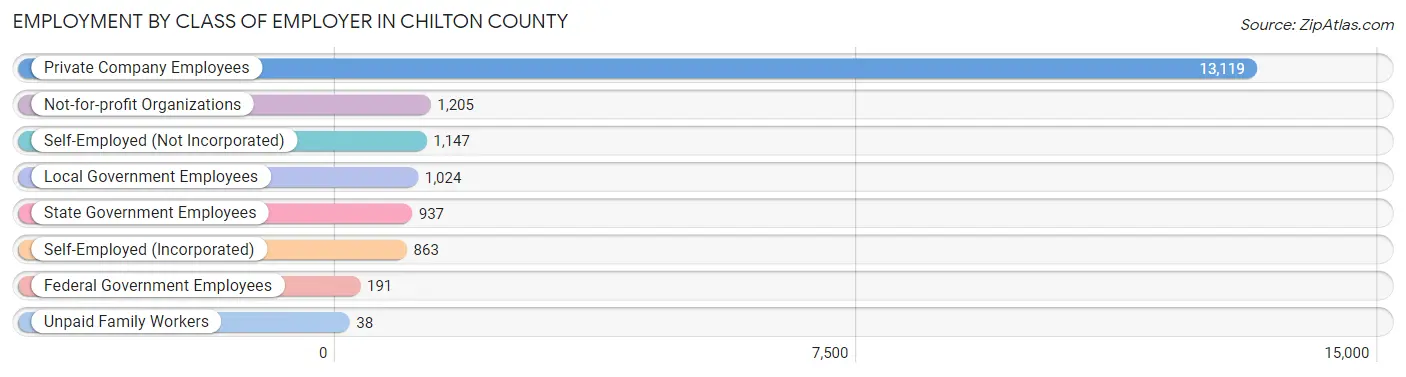
| Employer Class | # Employees | % Employees |
| Private Company Employees | 13,119 | 70.8% |
| Self-Employed (Incorporated) | 863 | 4.7% |
| Self-Employed (Not Incorporated) | 1,147 | 6.2% |
| Not-for-profit Organizations | 1,205 | 6.5% |
| Local Government Employees | 1,024 | 5.5% |
| State Government Employees | 937 | 5.1% |
| Federal Government Employees | 191 | 1.0% |
| Unpaid Family Workers | 38 | 0.2% |
| Total | 18,524 | 100.0% |
Employment Status by Age in Chilton County
According to the labor force statistics for Chilton County, out of the total population over 16 years of age (35,294), 56.4% or 19,906 individuals are in the labor force, with 5.3% or 1,055 of them unemployed. The age group with the highest labor force participation rate is 45 to 54 years, with 77.6% or 4,461 individuals in the labor force. Within the labor force, the 16 to 19 years age range has the highest percentage of unemployed individuals, with 21.3% or 160 of them being unemployed.
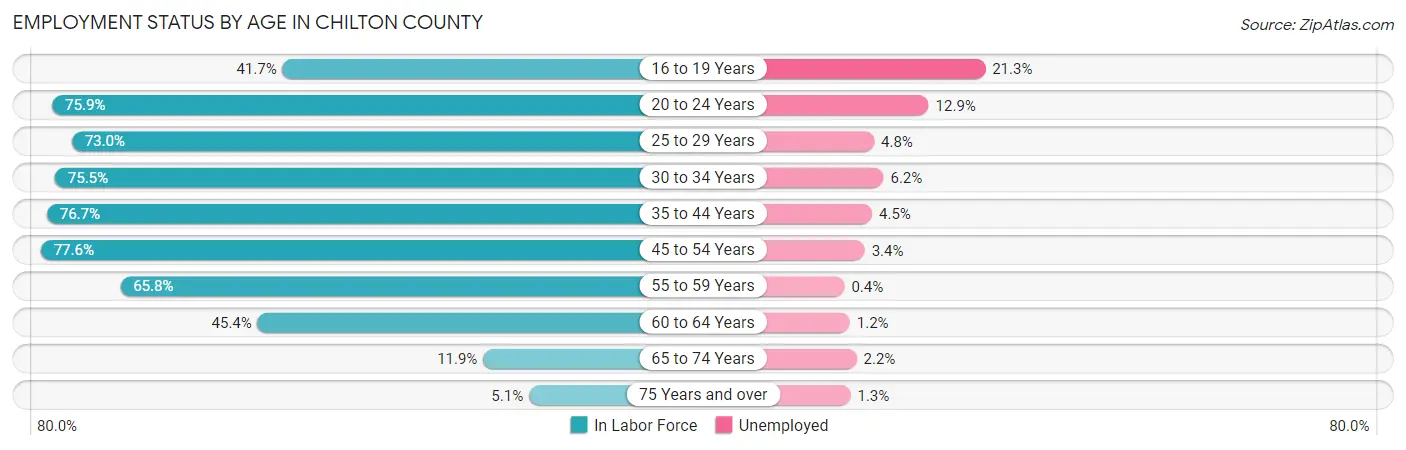
| Age Bracket | In Labor Force | Unemployed |
| 16 to 19 Years | 751 (41.7%) | 160 (21.3%) |
| 20 to 24 Years | 2,190 (75.9%) | 283 (12.9%) |
| 25 to 29 Years | 2,063 (73.0%) | 99 (4.8%) |
| 30 to 34 Years | 2,111 (75.5%) | 131 (6.2%) |
| 35 to 44 Years | 4,303 (76.7%) | 194 (4.5%) |
| 45 to 54 Years | 4,461 (77.6%) | 152 (3.4%) |
| 55 to 59 Years | 1,965 (65.8%) | 8 (0.4%) |
| 60 to 64 Years | 1,378 (45.4%) | 17 (1.2%) |
| 65 to 74 Years | 537 (11.9%) | 12 (2.2%) |
| 75 Years and over | 158 (5.1%) | 2 (1.3%) |
| Total | 19,906 (56.4%) | 1,055 (5.3%) |
Employment Status by Educational Attainment in Chilton County
According to labor force statistics for Chilton County, 70.8% of individuals (16,287) out of the total population between 25 and 64 years of age (23,004) are in the labor force, with 3.7% or 603 of them being unemployed. The group with the highest labor force participation rate are those with the educational attainment of bachelor's degree or higher, with 90.0% or 2,726 individuals in the labor force. Within the labor force, individuals with less than high school education have the highest percentage of unemployment, with 8.0% or 192 of them being unemployed.
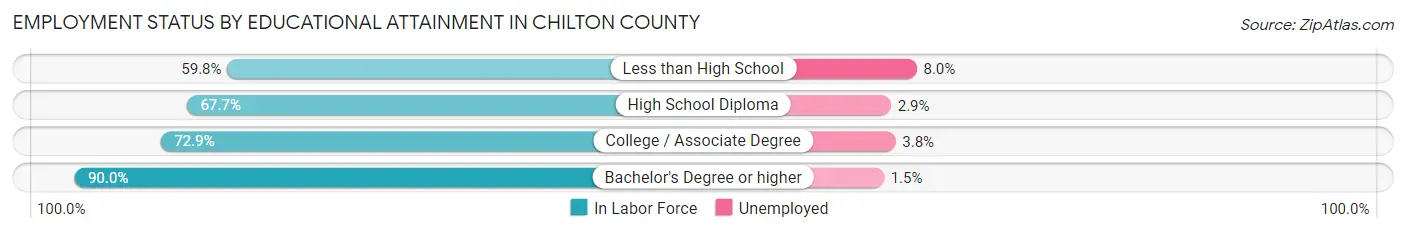
| Educational Attainment | In Labor Force | Unemployed |
| Less than High School | 2,406 (59.8%) | 322 (8.0%) |
| High School Diploma | 6,272 (67.7%) | 269 (2.9%) |
| College / Associate Degree | 4,875 (72.9%) | 254 (3.8%) |
| Bachelor's Degree or higher | 2,726 (90.0%) | 45 (1.5%) |
| Total | 16,287 (70.8%) | 851 (3.7%) |
Employment Occupations by Sex in Chilton County
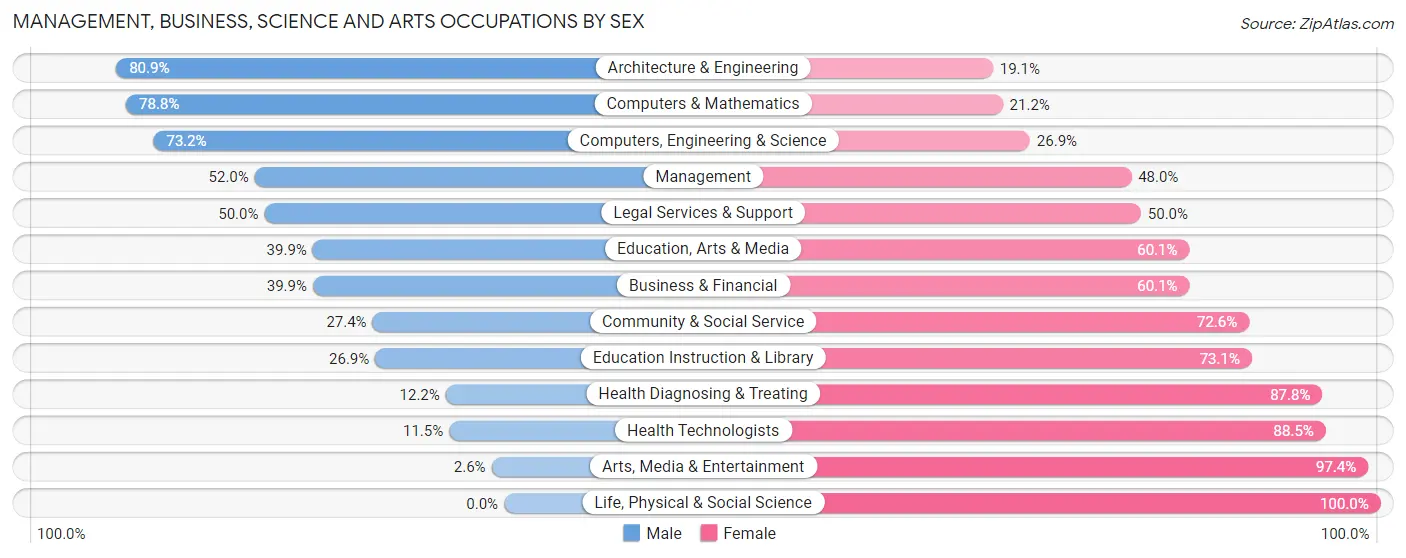
Management, Business, Science and Arts Occupations
The most common Management, Business, Science and Arts occupations in Chilton County are Community & Social Service (1,432 | 7.6%), Management (1,238 | 6.6%), Education Instruction & Library (1,064 | 5.6%), Health Diagnosing & Treating (1,011 | 5.4%), and Health Technologists (567 | 3.0%).
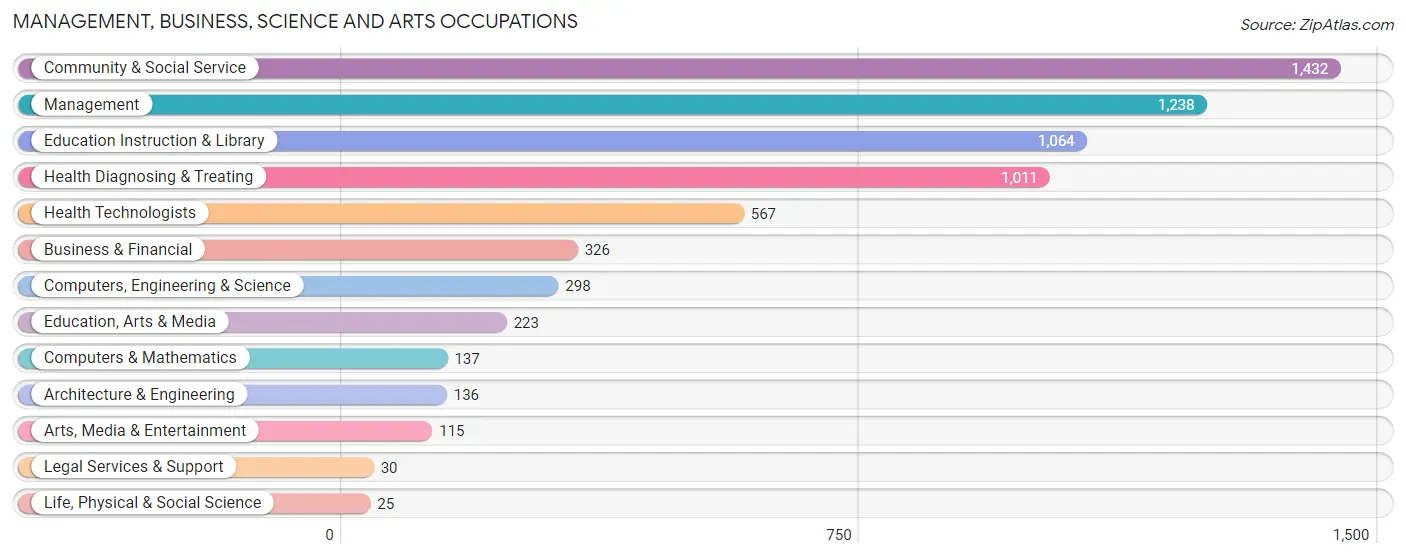
Management, Business, Science and Arts Occupations by Sex
Within the Management, Business, Science and Arts occupations in Chilton County, the most male-oriented occupations are Architecture & Engineering (80.9%), Computers & Mathematics (78.8%), and Computers, Engineering & Science (73.2%), while the most female-oriented occupations are Life, Physical & Social Science (100.0%), Arts, Media & Entertainment (97.4%), and Health Technologists (88.5%).
| Occupation | Male | Female |
| Management | 644 (52.0%) | 594 (48.0%) |
| Business & Financial | 130 (39.9%) | 196 (60.1%) |
| Computers, Engineering & Science | 218 (73.2%) | 80 (26.9%) |
| Computers & Mathematics | 108 (78.8%) | 29 (21.2%) |
| Architecture & Engineering | 110 (80.9%) | 26 (19.1%) |
| Life, Physical & Social Science | 0 (0.0%) | 25 (100.0%) |
| Community & Social Service | 393 (27.4%) | 1,039 (72.6%) |
| Education, Arts & Media | 89 (39.9%) | 134 (60.1%) |
| Legal Services & Support | 15 (50.0%) | 15 (50.0%) |
| Education Instruction & Library | 286 (26.9%) | 778 (73.1%) |
| Arts, Media & Entertainment | 3 (2.6%) | 112 (97.4%) |
| Health Diagnosing & Treating | 123 (12.2%) | 888 (87.8%) |
| Health Technologists | 65 (11.5%) | 502 (88.5%) |
| Total (Category) | 1,508 (35.0%) | 2,797 (65.0%) |
| Total (Overall) | 10,692 (56.7%) | 8,173 (43.3%) |
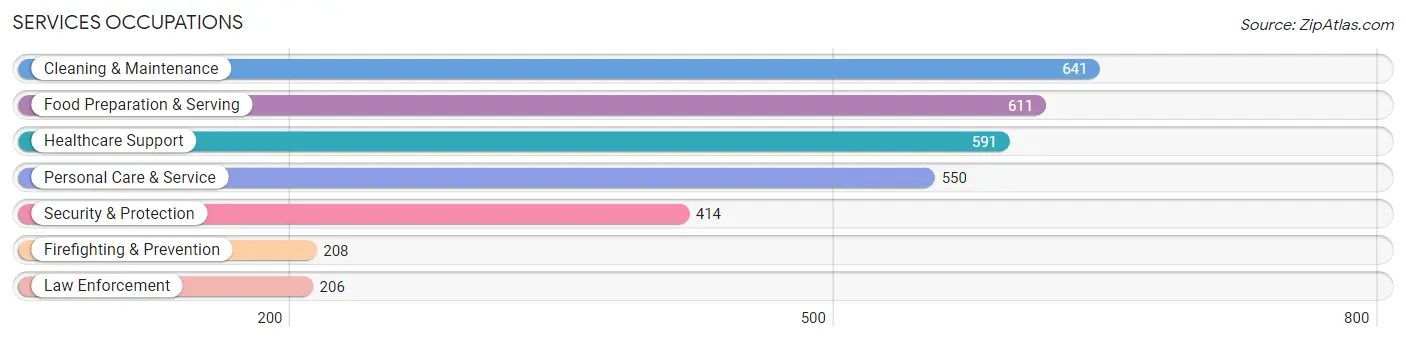
Services Occupations
The most common Services occupations in Chilton County are Cleaning & Maintenance (641 | 3.4%), Food Preparation & Serving (611 | 3.2%), Healthcare Support (591 | 3.1%), Personal Care & Service (550 | 2.9%), and Security & Protection (414 | 2.2%).
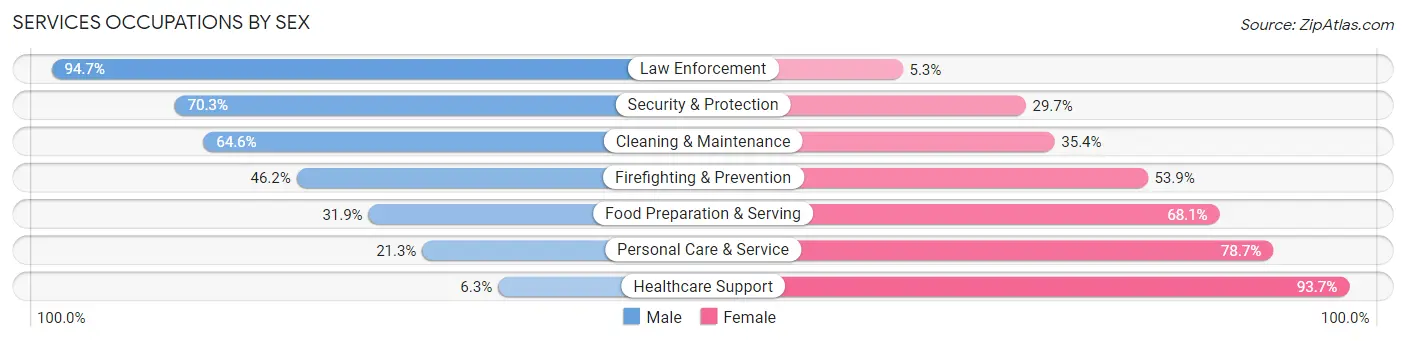
Services Occupations by Sex
Within the Services occupations in Chilton County, the most male-oriented occupations are Law Enforcement (94.7%), Security & Protection (70.3%), and Cleaning & Maintenance (64.6%), while the most female-oriented occupations are Healthcare Support (93.7%), Personal Care & Service (78.7%), and Food Preparation & Serving (68.1%).
| Occupation | Male | Female |
| Healthcare Support | 37 (6.3%) | 554 (93.7%) |
| Security & Protection | 291 (70.3%) | 123 (29.7%) |
| Firefighting & Prevention | 96 (46.2%) | 112 (53.8%) |
| Law Enforcement | 195 (94.7%) | 11 (5.3%) |
| Food Preparation & Serving | 195 (31.9%) | 416 (68.1%) |
| Cleaning & Maintenance | 414 (64.6%) | 227 (35.4%) |
| Personal Care & Service | 117 (21.3%) | 433 (78.7%) |
| Total (Category) | 1,054 (37.6%) | 1,753 (62.5%) |
| Total (Overall) | 10,692 (56.7%) | 8,173 (43.3%) |
Sales and Office Occupations
The most common Sales and Office occupations in Chilton County are Sales & Related (1,970 | 10.4%), and Office & Administration (1,721 | 9.1%).
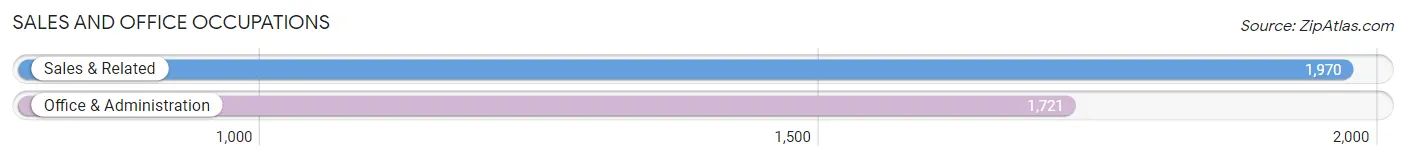
Sales and Office Occupations by Sex
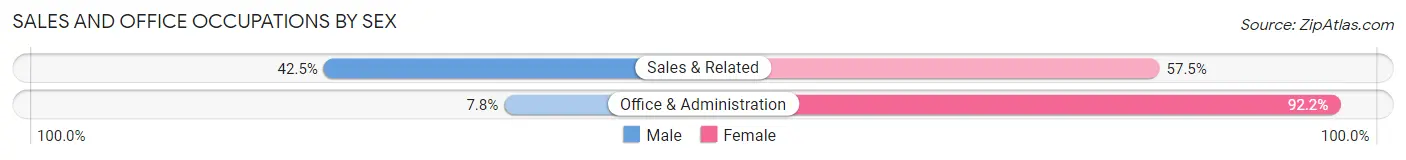
| Occupation | Male | Female |
| Sales & Related | 837 (42.5%) | 1,133 (57.5%) |
| Office & Administration | 134 (7.8%) | 1,587 (92.2%) |
| Total (Category) | 971 (26.3%) | 2,720 (73.7%) |
| Total (Overall) | 10,692 (56.7%) | 8,173 (43.3%) |
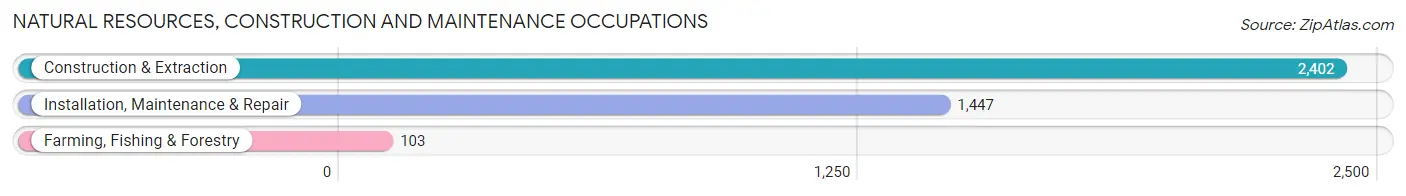
Natural Resources, Construction and Maintenance Occupations
The most common Natural Resources, Construction and Maintenance occupations in Chilton County are Construction & Extraction (2,402 | 12.7%), Installation, Maintenance & Repair (1,447 | 7.7%), and Farming, Fishing & Forestry (103 | 0.5%).
Natural Resources, Construction and Maintenance Occupations by Sex
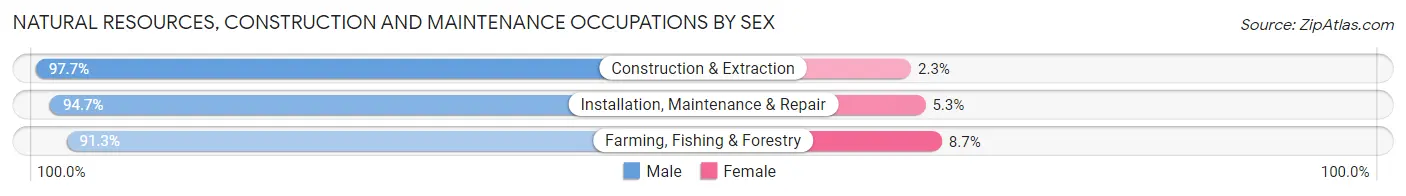
| Occupation | Male | Female |
| Farming, Fishing & Forestry | 94 (91.3%) | 9 (8.7%) |
| Construction & Extraction | 2,346 (97.7%) | 56 (2.3%) |
| Installation, Maintenance & Repair | 1,370 (94.7%) | 77 (5.3%) |
| Total (Category) | 3,810 (96.4%) | 142 (3.6%) |
| Total (Overall) | 10,692 (56.7%) | 8,173 (43.3%) |
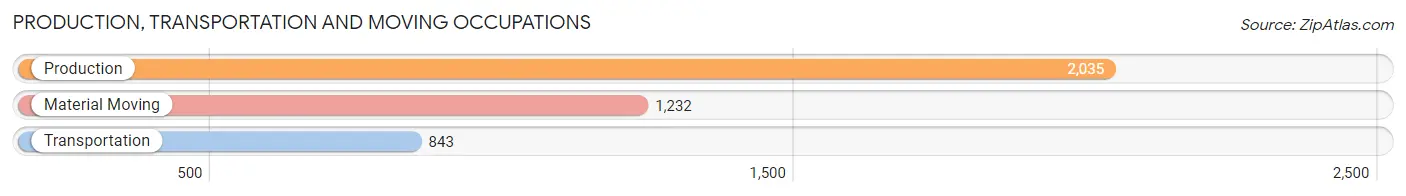
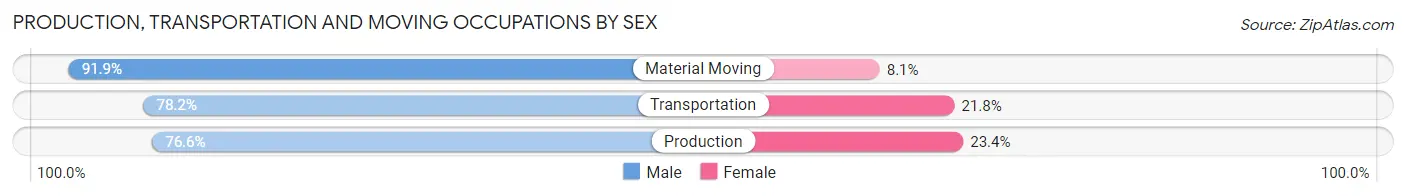
Production, Transportation and Moving Occupations
The most common Production, Transportation and Moving occupations in Chilton County are Production (2,035 | 10.8%), Material Moving (1,232 | 6.5%), and Transportation (843 | 4.5%).
Production, Transportation and Moving Occupations by Sex
| Occupation | Male | Female |
| Production | 1,558 (76.6%) | 477 (23.4%) |
| Transportation | 659 (78.2%) | 184 (21.8%) |
| Material Moving | 1,132 (91.9%) | 100 (8.1%) |
| Total (Category) | 3,349 (81.5%) | 761 (18.5%) |
| Total (Overall) | 10,692 (56.7%) | 8,173 (43.3%) |
Employment Industries by Sex in Chilton County
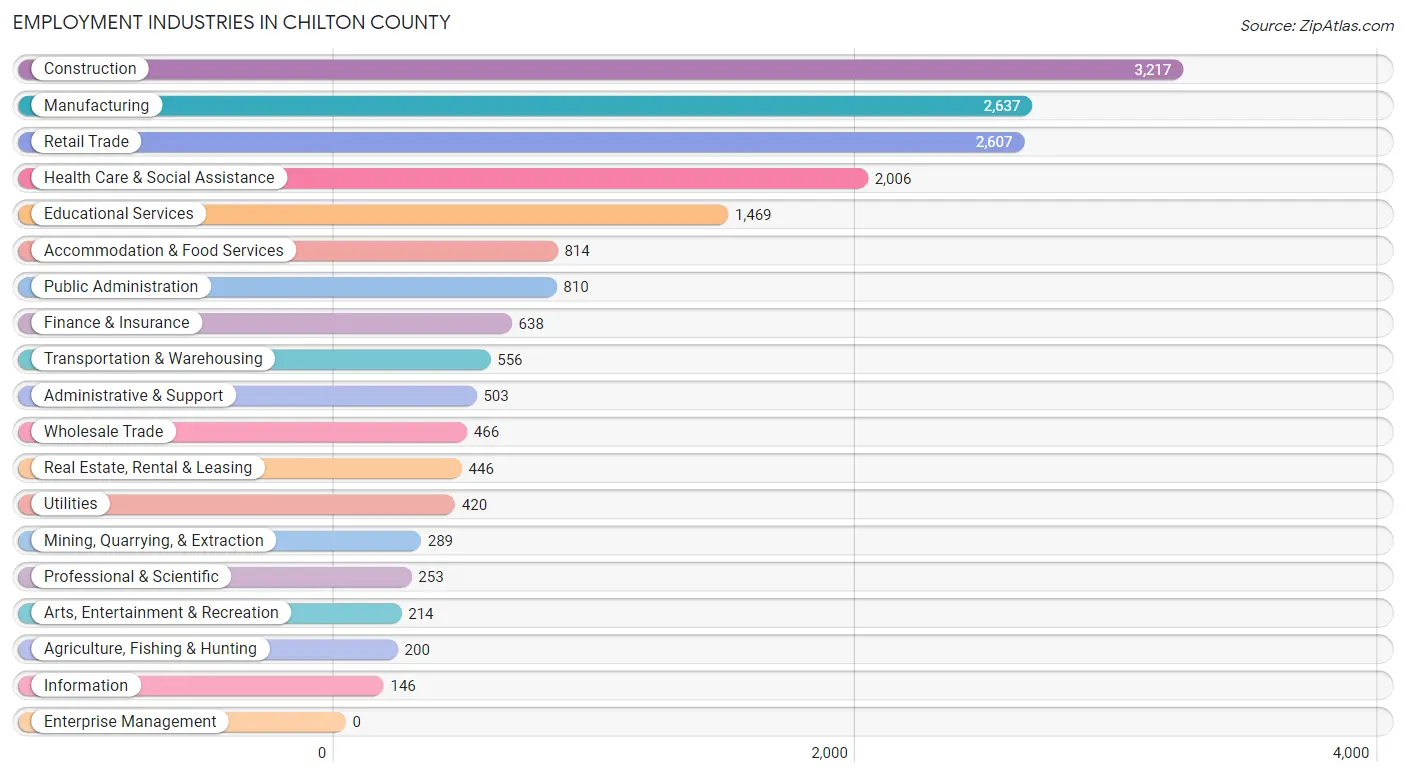
Employment Industries in Chilton County
The major employment industries in Chilton County include Construction (3,217 | 17.1%), Manufacturing (2,637 | 14.0%), Retail Trade (2,607 | 13.8%), Health Care & Social Assistance (2,006 | 10.6%), and Educational Services (1,469 | 7.8%).
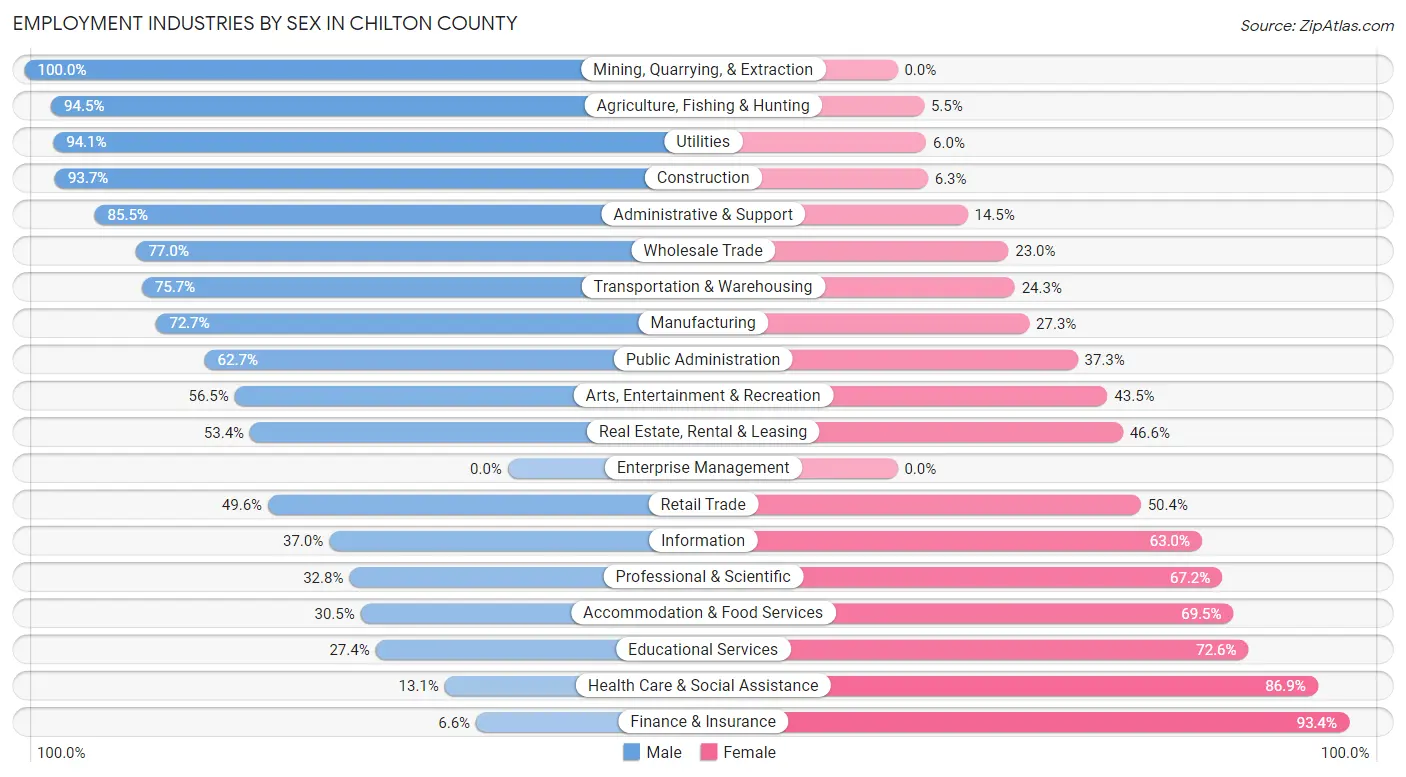
Employment Industries by Sex in Chilton County
The Chilton County industries that see more men than women are Mining, Quarrying, & Extraction (100.0%), Agriculture, Fishing & Hunting (94.5%), and Utilities (94.1%), whereas the industries that tend to have a higher number of women are Finance & Insurance (93.4%), Health Care & Social Assistance (86.9%), and Educational Services (72.6%).
| Industry | Male | Female |
| Agriculture, Fishing & Hunting | 189 (94.5%) | 11 (5.5%) |
| Mining, Quarrying, & Extraction | 289 (100.0%) | 0 (0.0%) |
| Construction | 3,015 (93.7%) | 202 (6.3%) |
| Manufacturing | 1,918 (72.7%) | 719 (27.3%) |
| Wholesale Trade | 359 (77.0%) | 107 (23.0%) |
| Retail Trade | 1,294 (49.6%) | 1,313 (50.4%) |
| Transportation & Warehousing | 421 (75.7%) | 135 (24.3%) |
| Utilities | 395 (94.1%) | 25 (5.9%) |
| Information | 54 (37.0%) | 92 (63.0%) |
| Finance & Insurance | 42 (6.6%) | 596 (93.4%) |
| Real Estate, Rental & Leasing | 238 (53.4%) | 208 (46.6%) |
| Professional & Scientific | 83 (32.8%) | 170 (67.2%) |
| Enterprise Management | 0 (0.0%) | 0 (0.0%) |
| Administrative & Support | 430 (85.5%) | 73 (14.5%) |
| Educational Services | 402 (27.4%) | 1,067 (72.6%) |
| Health Care & Social Assistance | 262 (13.1%) | 1,744 (86.9%) |
| Arts, Entertainment & Recreation | 121 (56.5%) | 93 (43.5%) |
| Accommodation & Food Services | 248 (30.5%) | 566 (69.5%) |
| Public Administration | 508 (62.7%) | 302 (37.3%) |
| Total | 10,692 (56.7%) | 8,173 (43.3%) |
Education in Chilton County
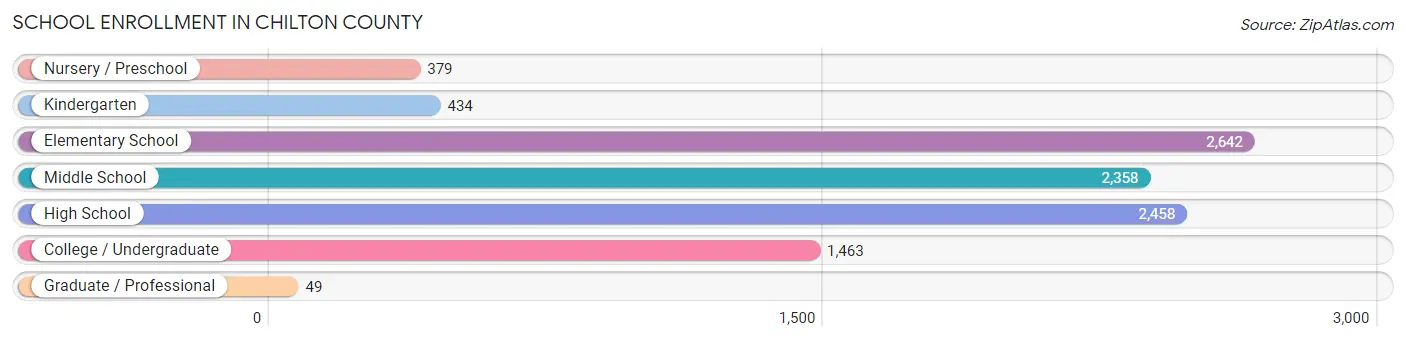
School Enrollment in Chilton County
The most common levels of schooling among the 9,783 students in Chilton County are elementary school (2,642 | 27.0%), high school (2,458 | 25.1%), and middle school (2,358 | 24.1%).
| School Level | # Students | % Students |
| Nursery / Preschool | 379 | 3.9% |
| Kindergarten | 434 | 4.4% |
| Elementary School | 2,642 | 27.0% |
| Middle School | 2,358 | 24.1% |
| High School | 2,458 | 25.1% |
| College / Undergraduate | 1,463 | 14.9% |
| Graduate / Professional | 49 | 0.5% |
| Total | 9,783 | 100.0% |
School Enrollment by Age by Funding Source in Chilton County
Out of a total of 9,783 students who are enrolled in schools in Chilton County, 949 (9.7%) attend a private institution, while the remaining 8,834 (90.3%) are enrolled in public schools. The age group of 3 to 4 year olds has the highest likelihood of being enrolled in private schools, with 101 (38.0% in the age bracket) enrolled. Conversely, the age group of 20 to 24 year olds has the lowest likelihood of being enrolled in a private school, with 746 (97.4% in the age bracket) attending a public institution.
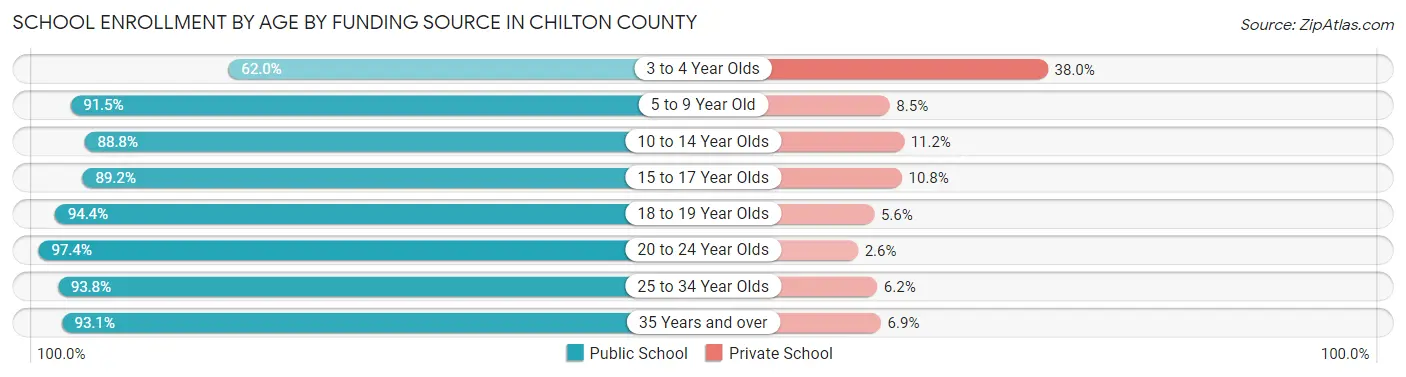
| Age Bracket | Public School | Private School |
| 3 to 4 Year Olds | 165 (62.0%) | 101 (38.0%) |
| 5 to 9 Year Old | 2,790 (91.5%) | 260 (8.5%) |
| 10 to 14 Year Olds | 2,424 (88.8%) | 305 (11.2%) |
| 15 to 17 Year Olds | 1,588 (89.2%) | 192 (10.8%) |
| 18 to 19 Year Olds | 535 (94.4%) | 32 (5.6%) |
| 20 to 24 Year Olds | 746 (97.4%) | 20 (2.6%) |
| 25 to 34 Year Olds | 273 (93.8%) | 18 (6.2%) |
| 35 Years and over | 311 (93.1%) | 23 (6.9%) |
| Total | 8,834 (90.3%) | 949 (9.7%) |
Educational Attainment by Field of Study in Chilton County
Business (936 | 21.2%), education (902 | 20.4%), arts & humanities (544 | 12.3%), science & technology (359 | 8.1%), and visual & performing arts (293 | 6.6%) are the most common fields of study among 4,421 individuals in Chilton County who have obtained a bachelor's degree or higher.
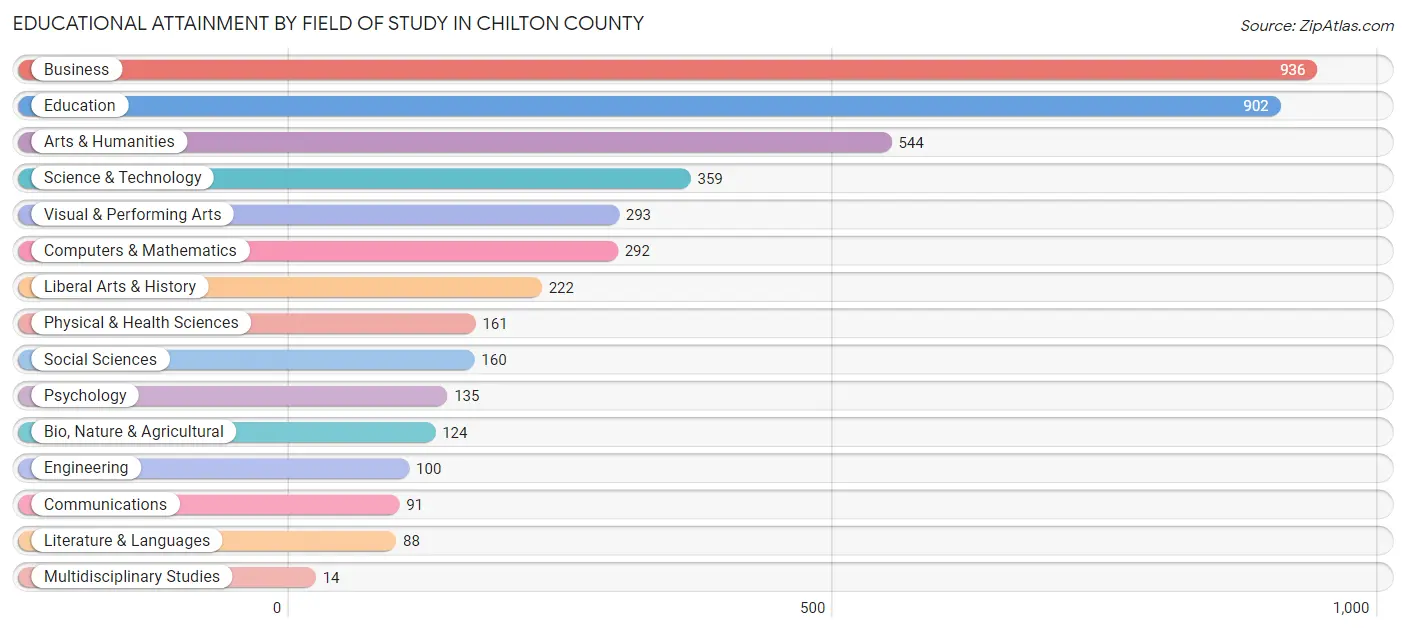
| Field of Study | # Graduates | % Graduates |
| Computers & Mathematics | 292 | 6.6% |
| Bio, Nature & Agricultural | 124 | 2.8% |
| Physical & Health Sciences | 161 | 3.6% |
| Psychology | 135 | 3.0% |
| Social Sciences | 160 | 3.6% |
| Engineering | 100 | 2.3% |
| Multidisciplinary Studies | 14 | 0.3% |
| Science & Technology | 359 | 8.1% |
| Business | 936 | 21.2% |
| Education | 902 | 20.4% |
| Literature & Languages | 88 | 2.0% |
| Liberal Arts & History | 222 | 5.0% |
| Visual & Performing Arts | 293 | 6.6% |
| Communications | 91 | 2.1% |
| Arts & Humanities | 544 | 12.3% |
| Total | 4,421 | 100.0% |
Transportation & Commute in Chilton County
Vehicle Availability by Sex in Chilton County
The most prevalent vehicle ownership categories in Chilton County are males with 2 vehicles (4,095, accounting for 39.3%) and females with 2 vehicles (3,773, making up 50.6%).
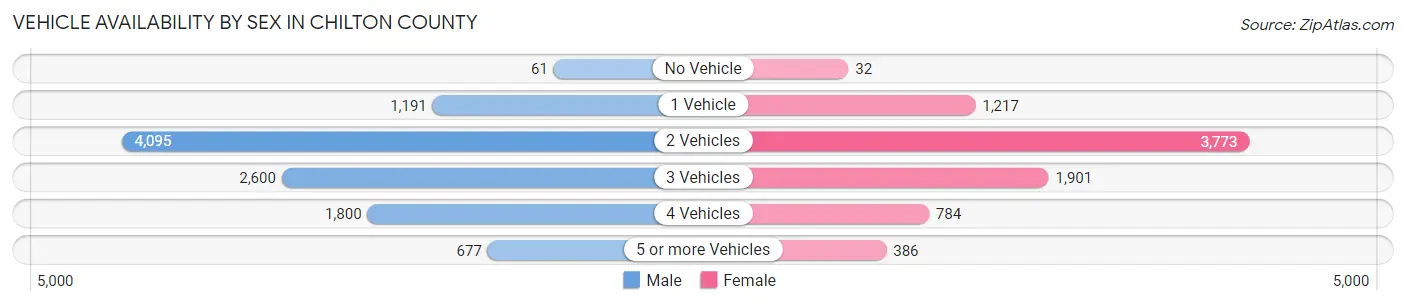
| Vehicles Available | Male | Female |
| No Vehicle | 61 (0.6%) | 32 (0.4%) |
| 1 Vehicle | 1,191 (11.4%) | 1,217 (15.0%) |
| 2 Vehicles | 4,095 (39.3%) | 3,773 (46.6%) |
| 3 Vehicles | 2,600 (24.9%) | 1,901 (23.5%) |
| 4 Vehicles | 1,800 (17.3%) | 784 (9.7%) |
| 5 or more Vehicles | 677 (6.5%) | 386 (4.8%) |
| Total | 10,424 (100.0%) | 8,093 (100.0%) |
Commute Time in Chilton County
The most frequently occuring commute durations in Chilton County are 45 to 59 minutes (2,914 commuters, 16.5%), 60 to 89 minutes (2,251 commuters, 12.7%), and 20 to 24 minutes (1,969 commuters, 11.1%).
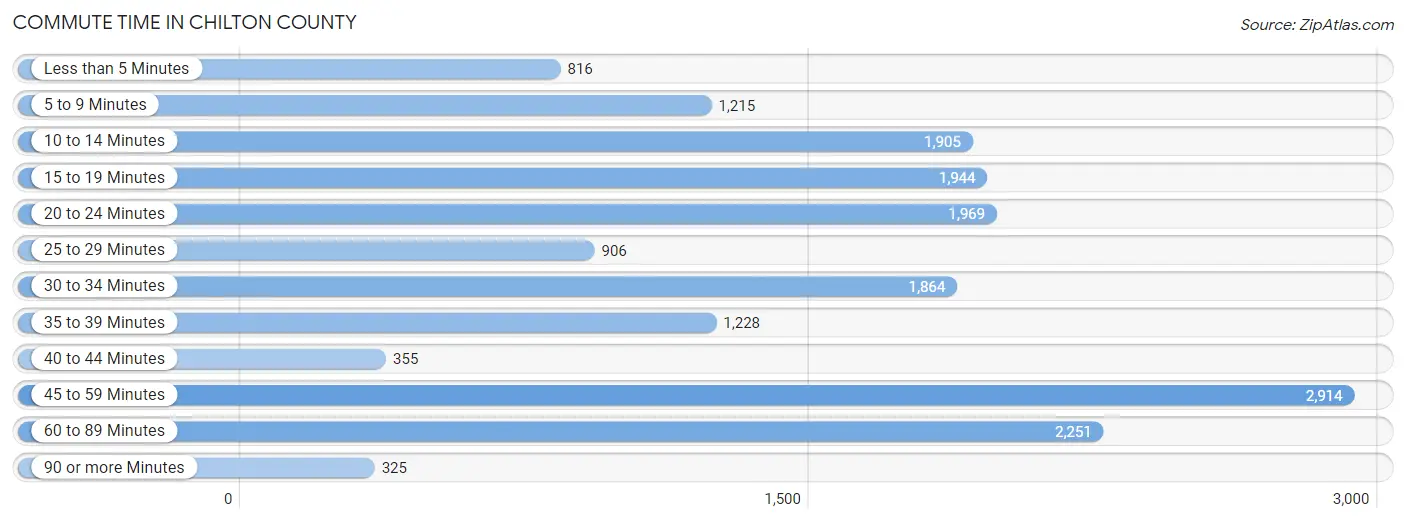
| Commute Time | # Commuters | % Commuters |
| Less than 5 Minutes | 816 | 4.6% |
| 5 to 9 Minutes | 1,215 | 6.9% |
| 10 to 14 Minutes | 1,905 | 10.8% |
| 15 to 19 Minutes | 1,944 | 11.0% |
| 20 to 24 Minutes | 1,969 | 11.1% |
| 25 to 29 Minutes | 906 | 5.1% |
| 30 to 34 Minutes | 1,864 | 10.5% |
| 35 to 39 Minutes | 1,228 | 6.9% |
| 40 to 44 Minutes | 355 | 2.0% |
| 45 to 59 Minutes | 2,914 | 16.5% |
| 60 to 89 Minutes | 2,251 | 12.7% |
| 90 or more Minutes | 325 | 1.8% |
Commute Time by Sex in Chilton County
The most common commute times in Chilton County are 45 to 59 minutes (1,632 commuters, 16.2%) for males and 45 to 59 minutes (1,282 commuters, 16.9%) for females.
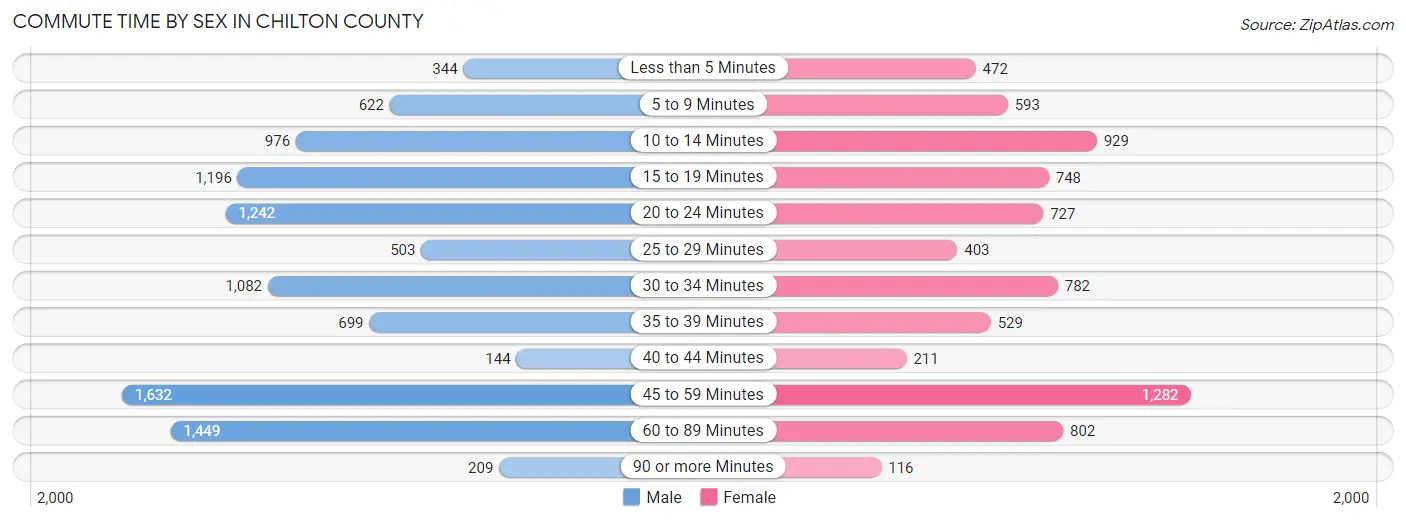
| Commute Time | Male | Female |
| Less than 5 Minutes | 344 (3.4%) | 472 (6.2%) |
| 5 to 9 Minutes | 622 (6.2%) | 593 (7.8%) |
| 10 to 14 Minutes | 976 (9.7%) | 929 (12.2%) |
| 15 to 19 Minutes | 1,196 (11.8%) | 748 (9.9%) |
| 20 to 24 Minutes | 1,242 (12.3%) | 727 (9.6%) |
| 25 to 29 Minutes | 503 (5.0%) | 403 (5.3%) |
| 30 to 34 Minutes | 1,082 (10.7%) | 782 (10.3%) |
| 35 to 39 Minutes | 699 (6.9%) | 529 (7.0%) |
| 40 to 44 Minutes | 144 (1.4%) | 211 (2.8%) |
| 45 to 59 Minutes | 1,632 (16.2%) | 1,282 (16.9%) |
| 60 to 89 Minutes | 1,449 (14.3%) | 802 (10.6%) |
| 90 or more Minutes | 209 (2.1%) | 116 (1.5%) |
Time of Departure to Work by Sex in Chilton County
The most frequent times of departure to work in Chilton County are 6:00 AM to 6:29 AM (1,812, 17.9%) for males and 7:00 AM to 7:29 AM (1,660, 21.9%) for females.
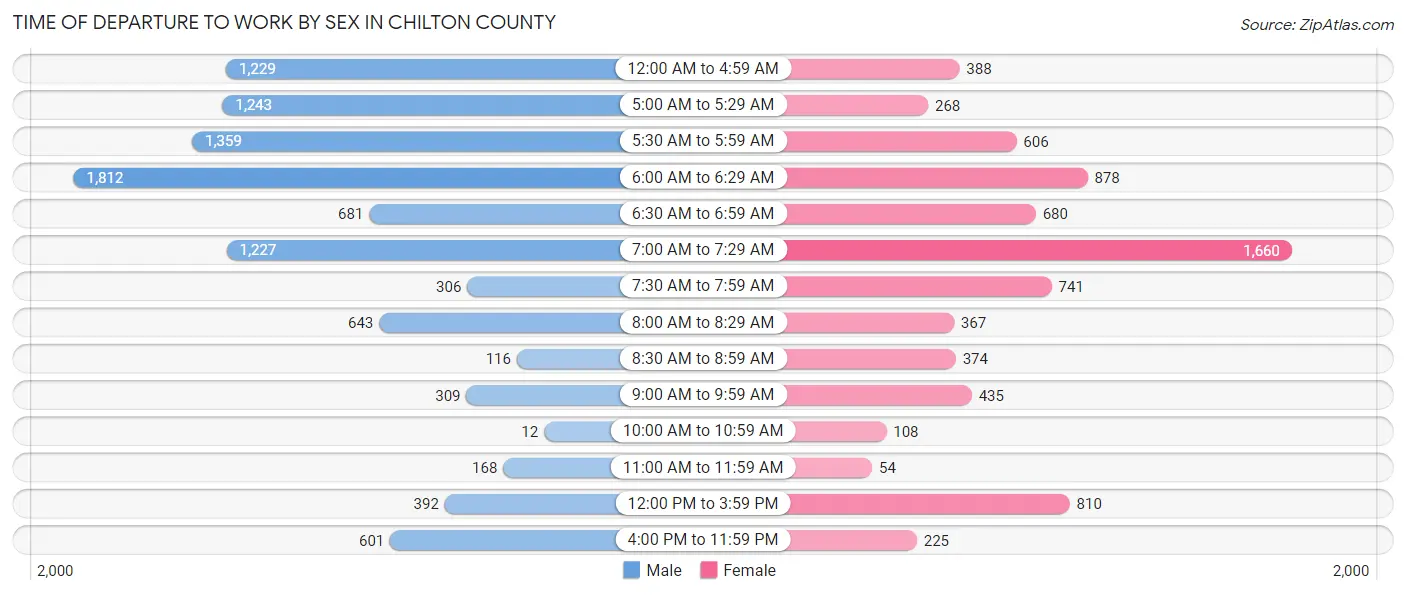
| Time of Departure | Male | Female |
| 12:00 AM to 4:59 AM | 1,229 (12.2%) | 388 (5.1%) |
| 5:00 AM to 5:29 AM | 1,243 (12.3%) | 268 (3.5%) |
| 5:30 AM to 5:59 AM | 1,359 (13.5%) | 606 (8.0%) |
| 6:00 AM to 6:29 AM | 1,812 (17.9%) | 878 (11.6%) |
| 6:30 AM to 6:59 AM | 681 (6.7%) | 680 (8.9%) |
| 7:00 AM to 7:29 AM | 1,227 (12.1%) | 1,660 (21.9%) |
| 7:30 AM to 7:59 AM | 306 (3.0%) | 741 (9.8%) |
| 8:00 AM to 8:29 AM | 643 (6.4%) | 367 (4.8%) |
| 8:30 AM to 8:59 AM | 116 (1.1%) | 374 (4.9%) |
| 9:00 AM to 9:59 AM | 309 (3.1%) | 435 (5.7%) |
| 10:00 AM to 10:59 AM | 12 (0.1%) | 108 (1.4%) |
| 11:00 AM to 11:59 AM | 168 (1.7%) | 54 (0.7%) |
| 12:00 PM to 3:59 PM | 392 (3.9%) | 810 (10.7%) |
| 4:00 PM to 11:59 PM | 601 (5.9%) | 225 (3.0%) |
| Total | 10,098 (100.0%) | 7,594 (100.0%) |
Housing Occupancy in Chilton County
Occupancy by Ownership in Chilton County
Of the total 16,931 dwellings in Chilton County, owner-occupied units account for 12,700 (75.0%), while renter-occupied units make up 4,231 (25.0%).
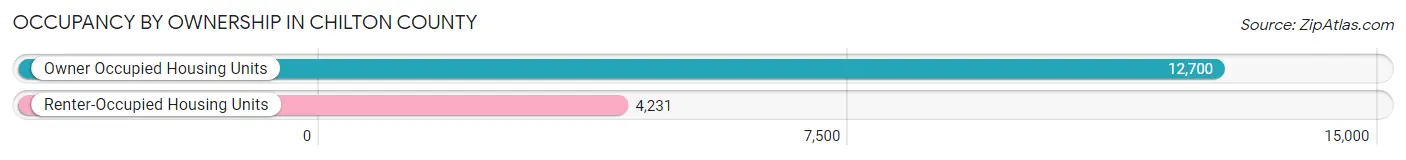
| Occupancy | # Housing Units | % Housing Units |
| Owner Occupied Housing Units | 12,700 | 75.0% |
| Renter-Occupied Housing Units | 4,231 | 25.0% |
| Total Occupied Housing Units | 16,931 | 100.0% |
Occupancy by Household Size in Chilton County
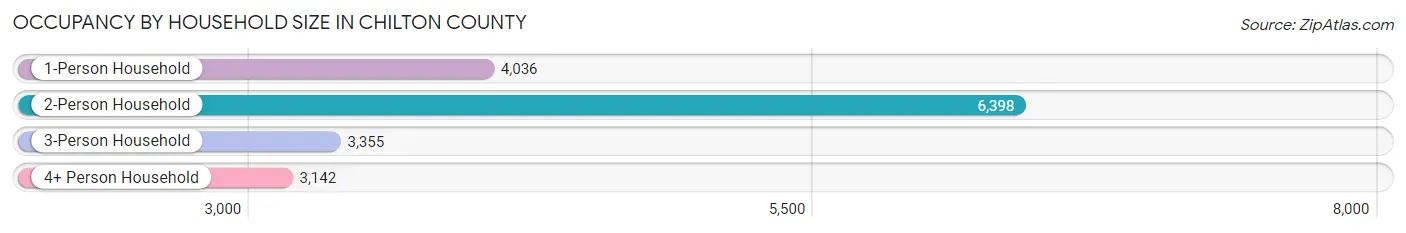
| Household Size | # Housing Units | % Housing Units |
| 1-Person Household | 4,036 | 23.8% |
| 2-Person Household | 6,398 | 37.8% |
| 3-Person Household | 3,355 | 19.8% |
| 4+ Person Household | 3,142 | 18.6% |
| Total Housing Units | 16,931 | 100.0% |
Occupancy by Ownership by Household Size in Chilton County
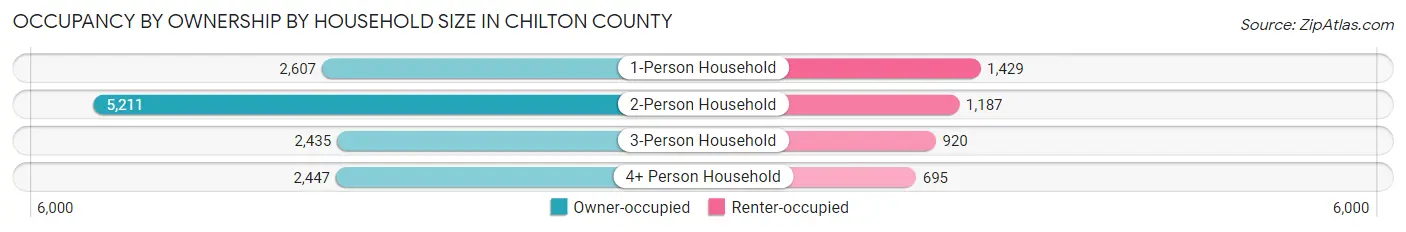
| Household Size | Owner-occupied | Renter-occupied |
| 1-Person Household | 2,607 (64.6%) | 1,429 (35.4%) |
| 2-Person Household | 5,211 (81.5%) | 1,187 (18.5%) |
| 3-Person Household | 2,435 (72.6%) | 920 (27.4%) |
| 4+ Person Household | 2,447 (77.9%) | 695 (22.1%) |
| Total Housing Units | 12,700 (75.0%) | 4,231 (25.0%) |
Occupancy by Educational Attainment in Chilton County
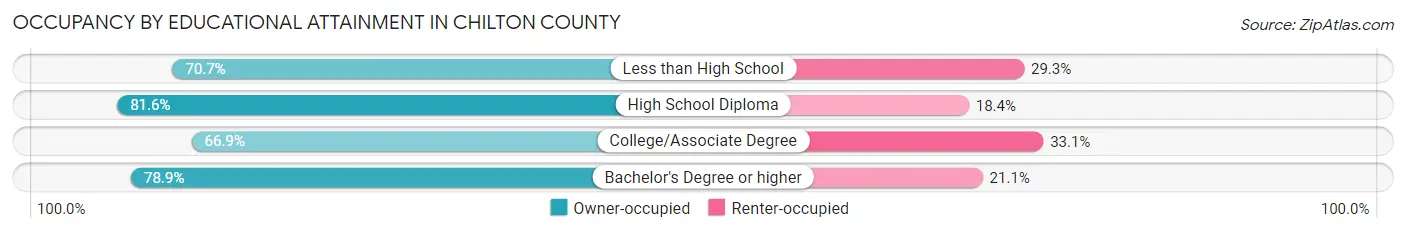
| Household Size | Owner-occupied | Renter-occupied |
| Less than High School | 2,112 (70.7%) | 876 (29.3%) |
| High School Diploma | 5,243 (81.6%) | 1,180 (18.4%) |
| College/Associate Degree | 3,271 (66.9%) | 1,620 (33.1%) |
| Bachelor's Degree or higher | 2,074 (78.9%) | 555 (21.1%) |
Occupancy by Age of Householder in Chilton County
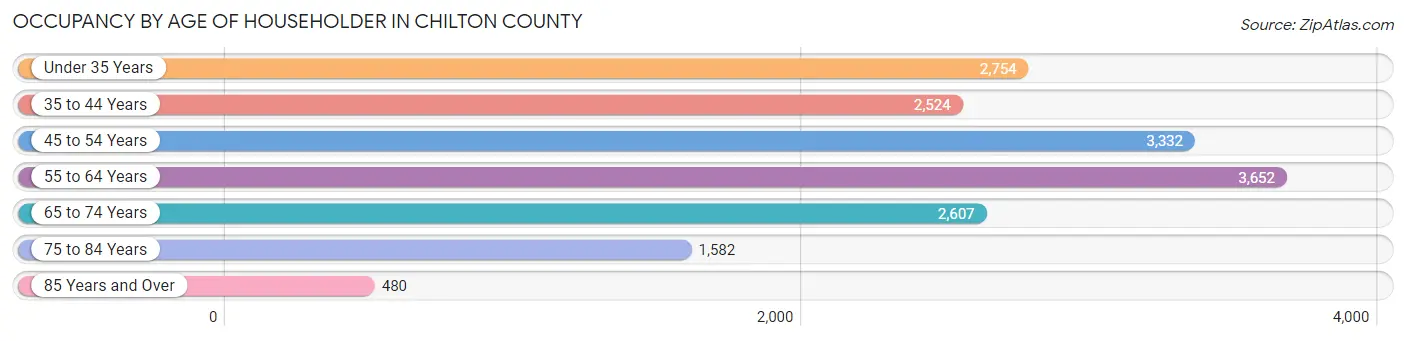
| Age Bracket | # Households | % Households |
| Under 35 Years | 2,754 | 16.3% |
| 35 to 44 Years | 2,524 | 14.9% |
| 45 to 54 Years | 3,332 | 19.7% |
| 55 to 64 Years | 3,652 | 21.6% |
| 65 to 74 Years | 2,607 | 15.4% |
| 75 to 84 Years | 1,582 | 9.3% |
| 85 Years and Over | 480 | 2.8% |
| Total | 16,931 | 100.0% |
Housing Finances in Chilton County
Median Income by Occupancy in Chilton County
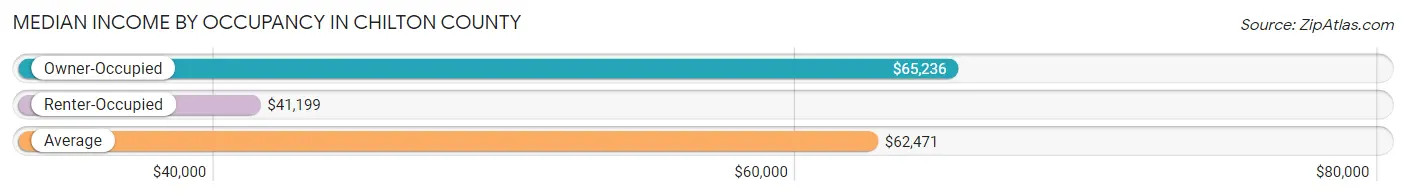
| Occupancy Type | # Households | Median Income |
| Owner-Occupied | 12,700 (75.0%) | $65,236 |
| Renter-Occupied | 4,231 (25.0%) | $41,199 |
| Average | 16,931 (100.0%) | $62,471 |
Occupancy by Householder Income Bracket in Chilton County
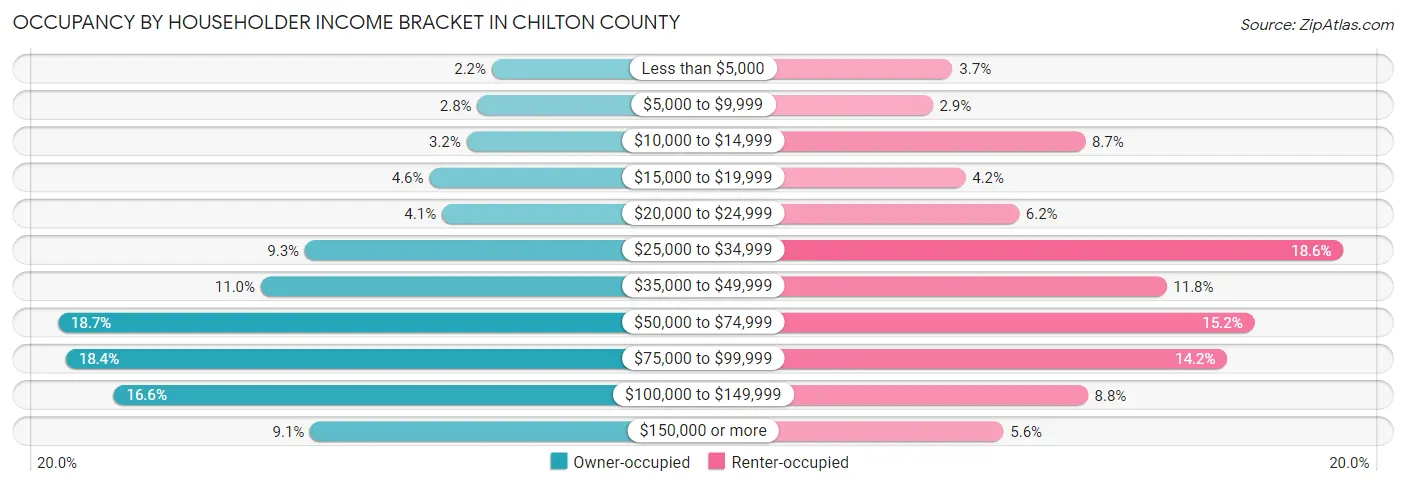
| Income Bracket | Owner-occupied | Renter-occupied |
| Less than $5,000 | 280 (2.2%) | 156 (3.7%) |
| $5,000 to $9,999 | 349 (2.8%) | 124 (2.9%) |
| $10,000 to $14,999 | 401 (3.2%) | 370 (8.7%) |
| $15,000 to $19,999 | 582 (4.6%) | 177 (4.2%) |
| $20,000 to $24,999 | 521 (4.1%) | 263 (6.2%) |
| $25,000 to $34,999 | 1,184 (9.3%) | 786 (18.6%) |
| $35,000 to $49,999 | 1,397 (11.0%) | 501 (11.8%) |
| $50,000 to $74,999 | 2,379 (18.7%) | 643 (15.2%) |
| $75,000 to $99,999 | 2,340 (18.4%) | 599 (14.2%) |
| $100,000 to $149,999 | 2,109 (16.6%) | 374 (8.8%) |
| $150,000 or more | 1,158 (9.1%) | 238 (5.6%) |
| Total | 12,700 (100.0%) | 4,231 (100.0%) |
Monthly Housing Cost Tiers in Chilton County
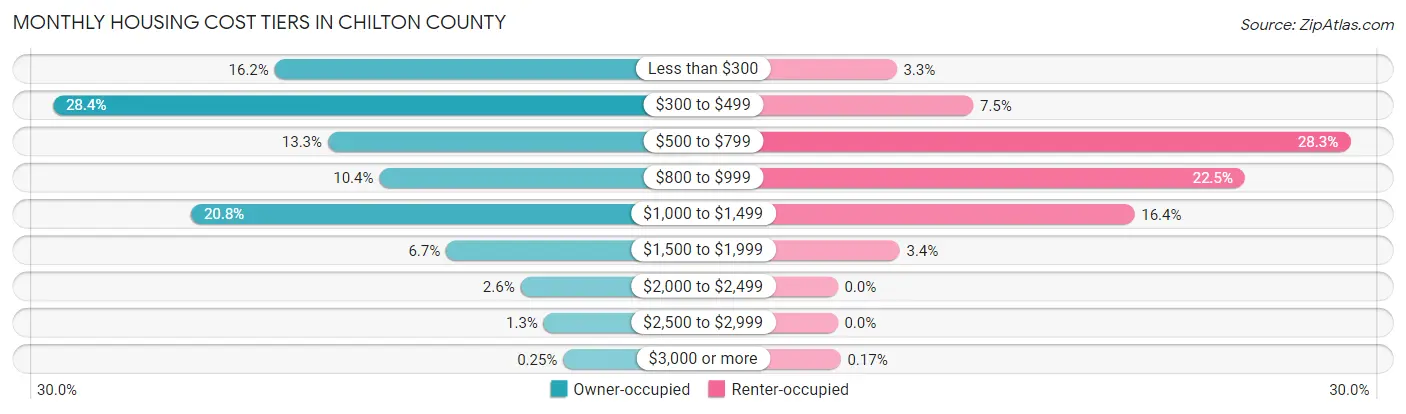
| Monthly Cost | Owner-occupied | Renter-occupied |
| Less than $300 | 2,056 (16.2%) | 138 (3.3%) |
| $300 to $499 | 3,610 (28.4%) | 317 (7.5%) |
| $500 to $799 | 1,683 (13.3%) | 1,198 (28.3%) |
| $800 to $999 | 1,322 (10.4%) | 952 (22.5%) |
| $1,000 to $1,499 | 2,643 (20.8%) | 694 (16.4%) |
| $1,500 to $1,999 | 854 (6.7%) | 145 (3.4%) |
| $2,000 to $2,499 | 331 (2.6%) | 0 (0.0%) |
| $2,500 to $2,999 | 169 (1.3%) | 0 (0.0%) |
| $3,000 or more | 32 (0.3%) | 7 (0.2%) |
| Total | 12,700 (100.0%) | 4,231 (100.0%) |
Physical Housing Characteristics in Chilton County
Housing Structures in Chilton County
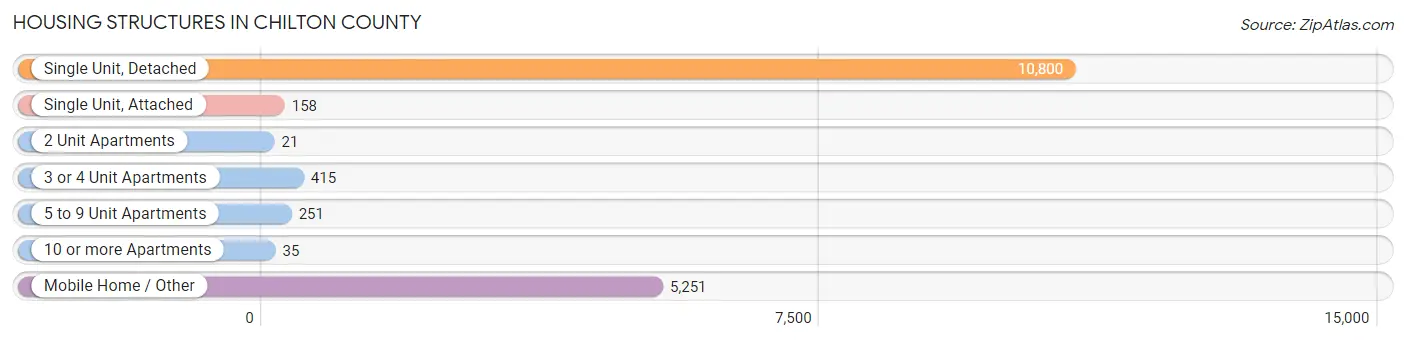
| Structure Type | # Housing Units | % Housing Units |
| Single Unit, Detached | 10,800 | 63.8% |
| Single Unit, Attached | 158 | 0.9% |
| 2 Unit Apartments | 21 | 0.1% |
| 3 or 4 Unit Apartments | 415 | 2.5% |
| 5 to 9 Unit Apartments | 251 | 1.5% |
| 10 or more Apartments | 35 | 0.2% |
| Mobile Home / Other | 5,251 | 31.0% |
| Total | 16,931 | 100.0% |
Housing Structures by Occupancy in Chilton County
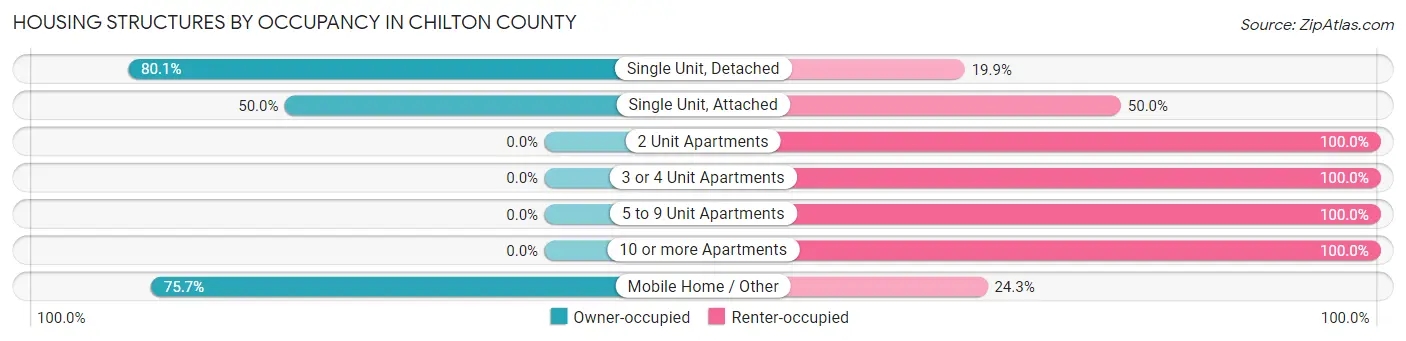
| Structure Type | Owner-occupied | Renter-occupied |
| Single Unit, Detached | 8,647 (80.1%) | 2,153 (19.9%) |
| Single Unit, Attached | 79 (50.0%) | 79 (50.0%) |
| 2 Unit Apartments | 0 (0.0%) | 21 (100.0%) |
| 3 or 4 Unit Apartments | 0 (0.0%) | 415 (100.0%) |
| 5 to 9 Unit Apartments | 0 (0.0%) | 251 (100.0%) |
| 10 or more Apartments | 0 (0.0%) | 35 (100.0%) |
| Mobile Home / Other | 3,974 (75.7%) | 1,277 (24.3%) |
| Total | 12,700 (75.0%) | 4,231 (25.0%) |
Housing Structures by Number of Rooms in Chilton County
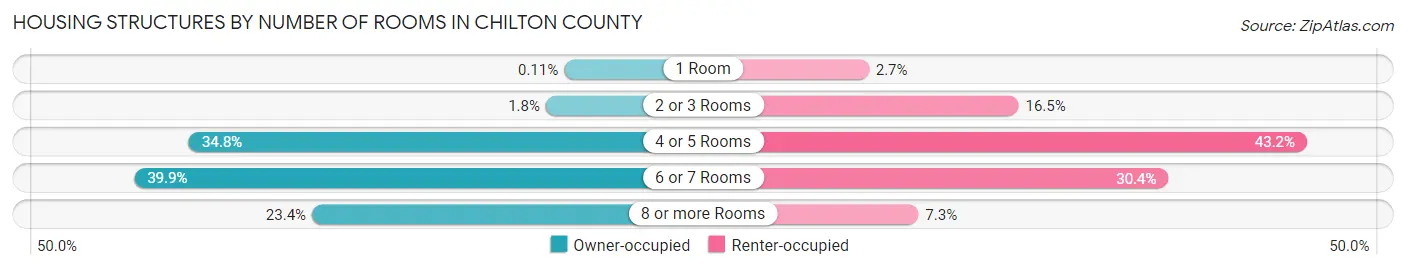
| Number of Rooms | Owner-occupied | Renter-occupied |
| 1 Room | 14 (0.1%) | 113 (2.7%) |
| 2 or 3 Rooms | 228 (1.8%) | 699 (16.5%) |
| 4 or 5 Rooms | 4,420 (34.8%) | 1,827 (43.2%) |
| 6 or 7 Rooms | 5,062 (39.9%) | 1,285 (30.4%) |
| 8 or more Rooms | 2,976 (23.4%) | 307 (7.3%) |
| Total | 12,700 (100.0%) | 4,231 (100.0%) |
Housing Structure by Heating Type in Chilton County
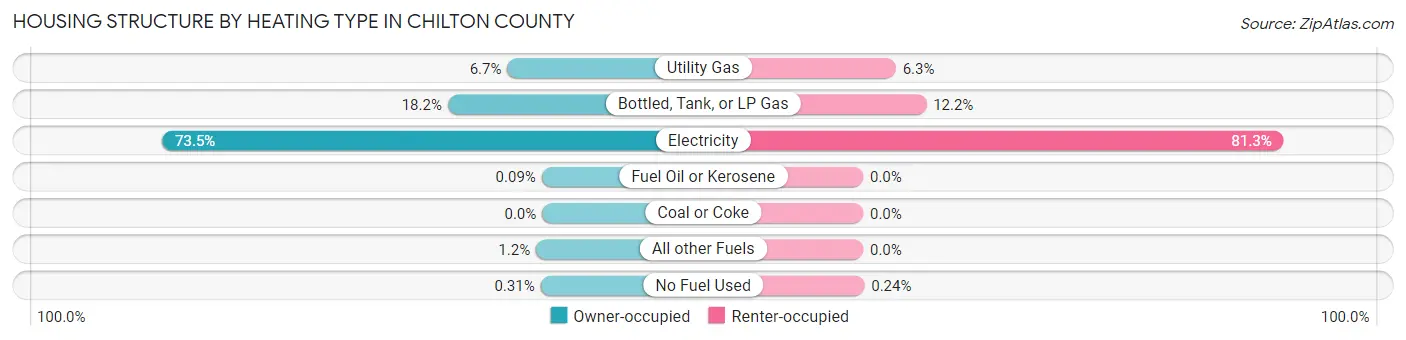
| Heating Type | Owner-occupied | Renter-occupied |
| Utility Gas | 854 (6.7%) | 267 (6.3%) |
| Bottled, Tank, or LP Gas | 2,316 (18.2%) | 516 (12.2%) |
| Electricity | 9,328 (73.5%) | 3,438 (81.3%) |
| Fuel Oil or Kerosene | 12 (0.1%) | 0 (0.0%) |
| Coal or Coke | 0 (0.0%) | 0 (0.0%) |
| All other Fuels | 150 (1.2%) | 0 (0.0%) |
| No Fuel Used | 40 (0.3%) | 10 (0.2%) |
| Total | 12,700 (100.0%) | 4,231 (100.0%) |
Household Vehicle Usage in Chilton County
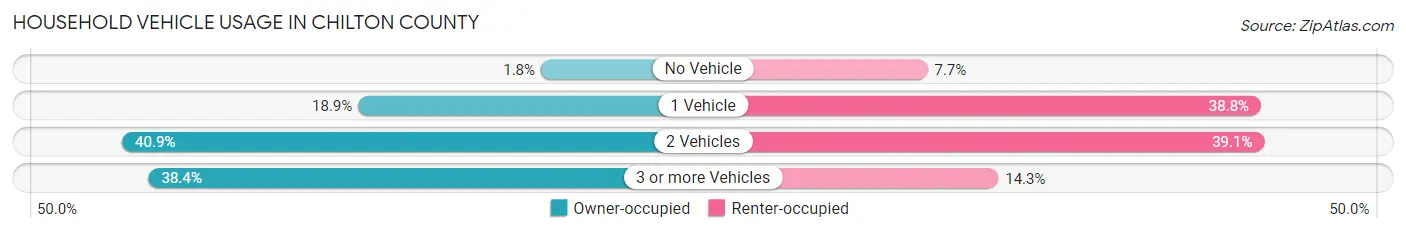
| Vehicles per Household | Owner-occupied | Renter-occupied |
| No Vehicle | 230 (1.8%) | 326 (7.7%) |
| 1 Vehicle | 2,397 (18.9%) | 1,643 (38.8%) |
| 2 Vehicles | 5,193 (40.9%) | 1,656 (39.1%) |
| 3 or more Vehicles | 4,880 (38.4%) | 606 (14.3%) |
| Total | 12,700 (100.0%) | 4,231 (100.0%) |
Real Estate & Mortgages in Chilton County
Real Estate and Mortgage Overview in Chilton County
| Characteristic | Without Mortgage | With Mortgage |
| Housing Units | 7,264 | 5,436 |
| Median Property Value | $106,400 | $156,200 |
| Median Household Income | $57,091 | $641 |
| Monthly Housing Costs | $383 | $32 |
| Real Estate Taxes | $396 | $735 |
Property Value by Mortgage Status in Chilton County
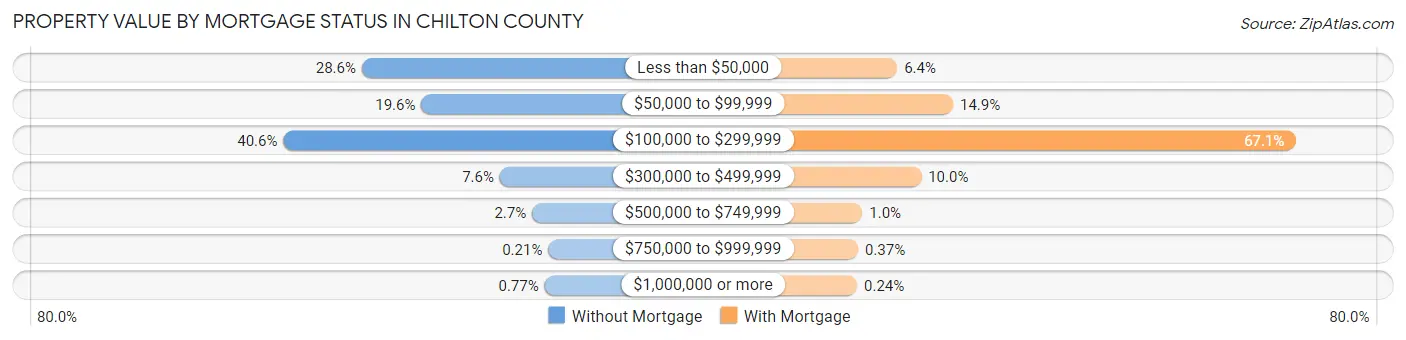
| Property Value | Without Mortgage | With Mortgage |
| Less than $50,000 | 2,079 (28.6%) | 345 (6.4%) |
| $50,000 to $99,999 | 1,420 (19.6%) | 808 (14.9%) |
| $100,000 to $299,999 | 2,948 (40.6%) | 3,650 (67.1%) |
| $300,000 to $499,999 | 551 (7.6%) | 544 (10.0%) |
| $500,000 to $749,999 | 195 (2.7%) | 56 (1.0%) |
| $750,000 to $999,999 | 15 (0.2%) | 20 (0.4%) |
| $1,000,000 or more | 56 (0.8%) | 13 (0.2%) |
| Total | 7,264 (100.0%) | 5,436 (100.0%) |
Household Income by Mortgage Status in Chilton County
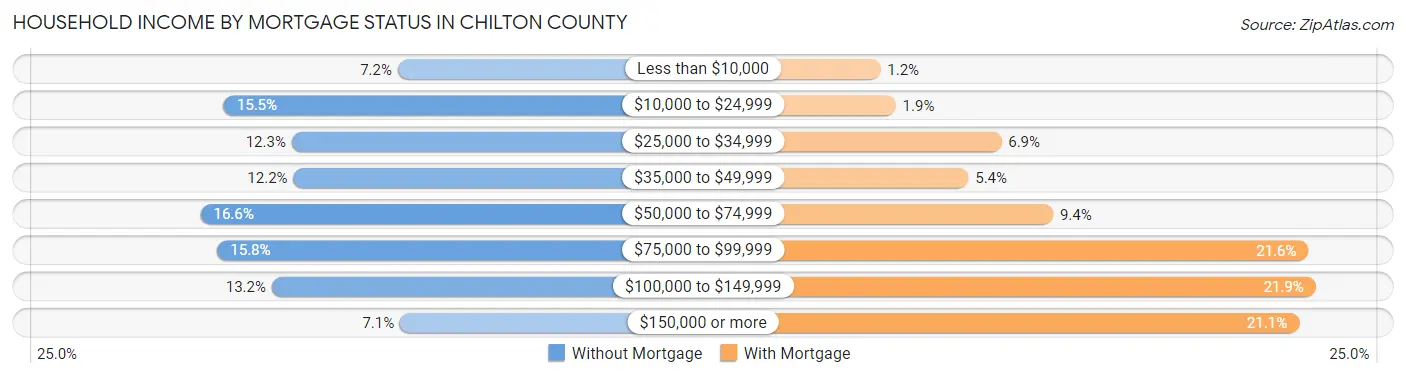
| Household Income | Without Mortgage | With Mortgage |
| Less than $10,000 | 525 (7.2%) | 64 (1.2%) |
| $10,000 to $24,999 | 1,127 (15.5%) | 104 (1.9%) |
| $25,000 to $34,999 | 892 (12.3%) | 377 (6.9%) |
| $35,000 to $49,999 | 886 (12.2%) | 292 (5.4%) |
| $50,000 to $74,999 | 1,207 (16.6%) | 511 (9.4%) |
| $75,000 to $99,999 | 1,149 (15.8%) | 1,172 (21.6%) |
| $100,000 to $149,999 | 961 (13.2%) | 1,191 (21.9%) |
| $150,000 or more | 517 (7.1%) | 1,148 (21.1%) |
| Total | 7,264 (100.0%) | 5,436 (100.0%) |
Property Value to Household Income Ratio in Chilton County
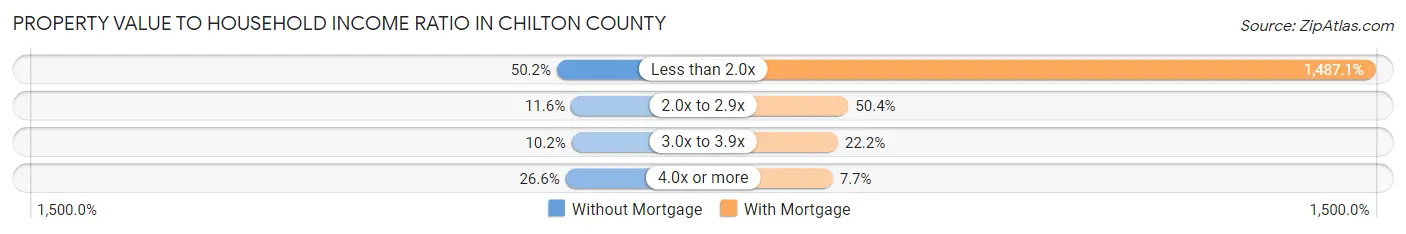
| Value-to-Income Ratio | Without Mortgage | With Mortgage |
| Less than 2.0x | 3,646 (50.2%) | 80,841 (1,487.1%) |
| 2.0x to 2.9x | 841 (11.6%) | 2,740 (50.4%) |
| 3.0x to 3.9x | 744 (10.2%) | 1,206 (22.2%) |
| 4.0x or more | 1,929 (26.6%) | 421 (7.7%) |
| Total | 7,264 (100.0%) | 5,436 (100.0%) |
Real Estate Taxes by Mortgage Status in Chilton County
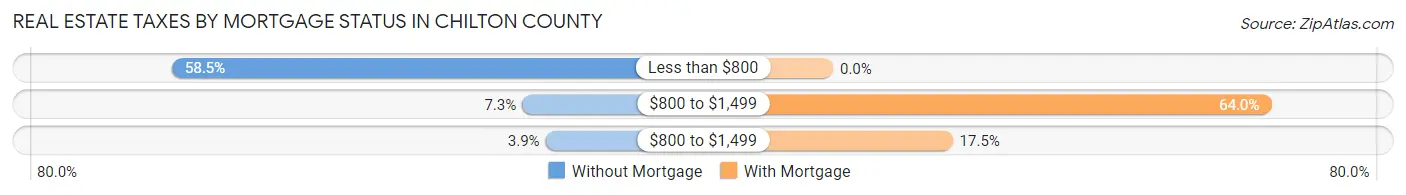
| Property Taxes | Without Mortgage | With Mortgage |
| Less than $800 | 4,248 (58.5%) | 0 (0.0%) |
| $800 to $1,499 | 531 (7.3%) | 3,481 (64.0%) |
| $800 to $1,499 | 283 (3.9%) | 950 (17.5%) |
| Total | 7,264 (100.0%) | 5,436 (100.0%) |
Health & Disability in Chilton County
Health Insurance Coverage by Age in Chilton County
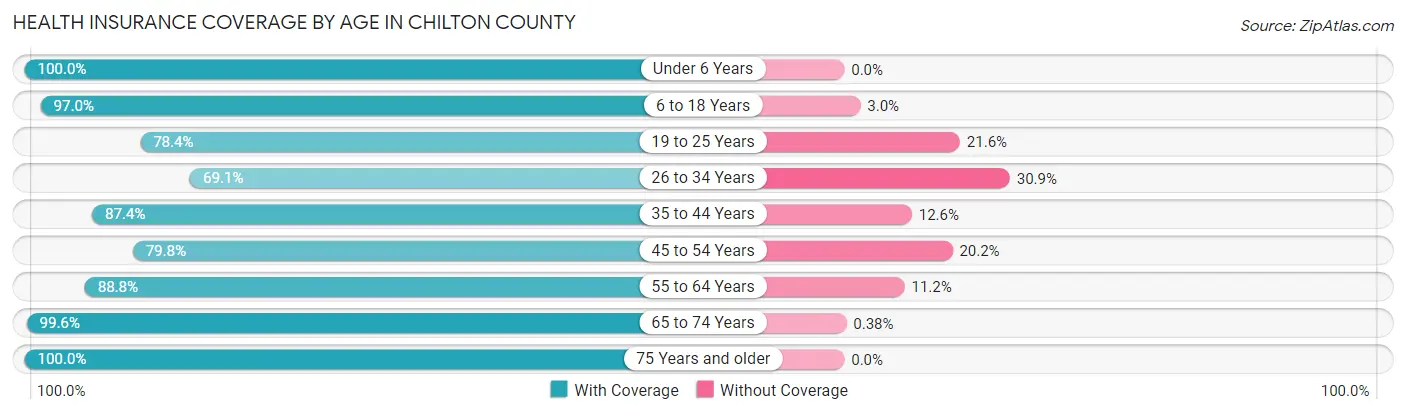
| Age Bracket | With Coverage | Without Coverage |
| Under 6 Years | 3,257 (100.0%) | 0 (0.0%) |
| 6 to 18 Years | 7,732 (97.0%) | 239 (3.0%) |
| 19 to 25 Years | 2,969 (78.4%) | 816 (21.6%) |
| 26 to 34 Years | 3,453 (69.1%) | 1,541 (30.9%) |
| 35 to 44 Years | 4,874 (87.4%) | 702 (12.6%) |
| 45 to 54 Years | 4,580 (79.8%) | 1,157 (20.2%) |
| 55 to 64 Years | 5,330 (88.8%) | 674 (11.2%) |
| 65 to 74 Years | 4,456 (99.6%) | 17 (0.4%) |
| 75 Years and older | 2,984 (100.0%) | 0 (0.0%) |
| Total | 39,635 (88.5%) | 5,146 (11.5%) |
Health Insurance Coverage by Citizenship Status in Chilton County
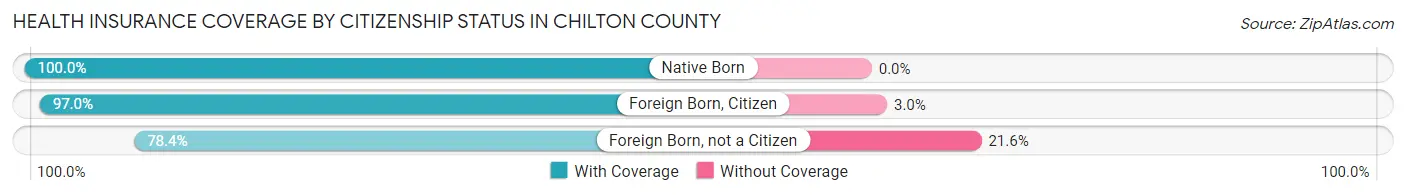
| Citizenship Status | With Coverage | Without Coverage |
| Native Born | 3,257 (100.0%) | 0 (0.0%) |
| Foreign Born, Citizen | 7,732 (97.0%) | 239 (3.0%) |
| Foreign Born, not a Citizen | 2,969 (78.4%) | 816 (21.6%) |
Health Insurance Coverage by Household Income in Chilton County
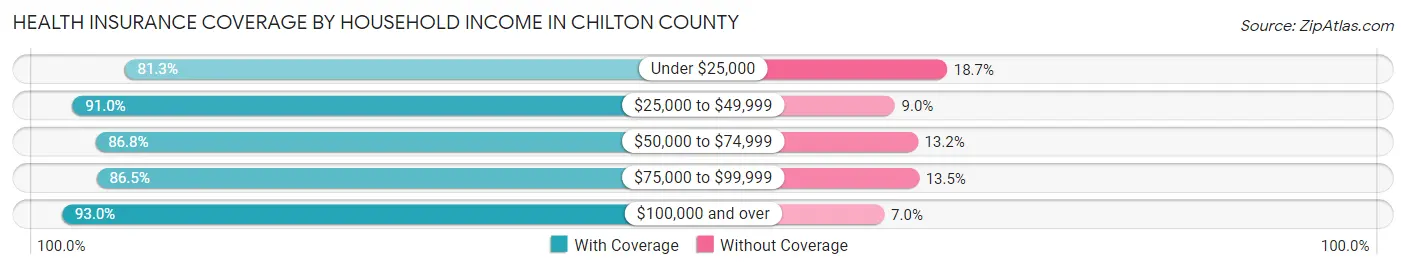
| Household Income | With Coverage | Without Coverage |
| Under $25,000 | 4,890 (81.3%) | 1,127 (18.7%) |
| $25,000 to $49,999 | 7,955 (91.0%) | 783 (9.0%) |
| $50,000 to $74,999 | 7,609 (86.8%) | 1,161 (13.2%) |
| $75,000 to $99,999 | 7,522 (86.5%) | 1,171 (13.5%) |
| $100,000 and over | 11,590 (93.0%) | 873 (7.0%) |
Public vs Private Health Insurance Coverage by Age in Chilton County
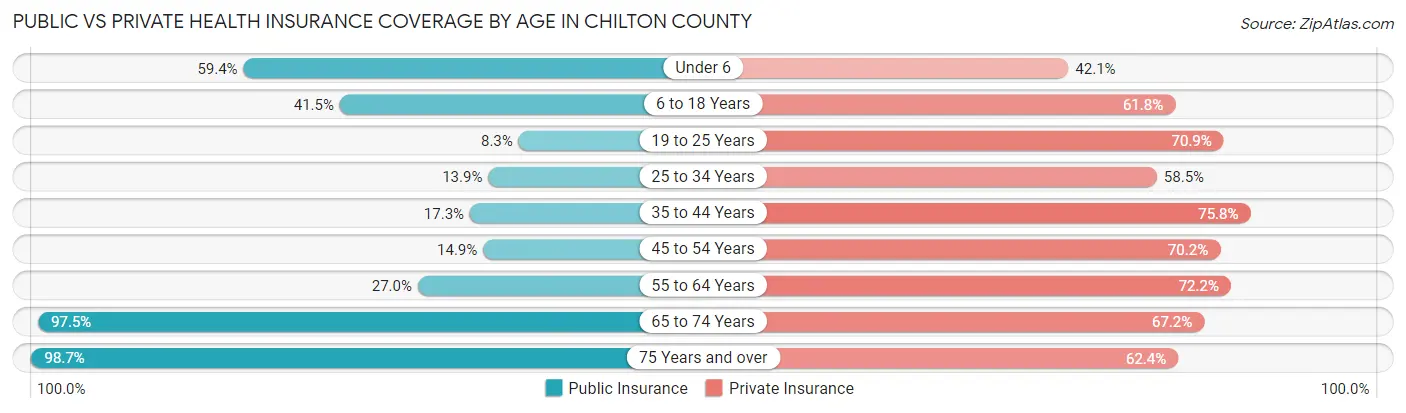
| Age Bracket | Public Insurance | Private Insurance |
| Under 6 | 1,934 (59.4%) | 1,370 (42.1%) |
| 6 to 18 Years | 3,308 (41.5%) | 4,929 (61.8%) |
| 19 to 25 Years | 314 (8.3%) | 2,682 (70.9%) |
| 25 to 34 Years | 696 (13.9%) | 2,921 (58.5%) |
| 35 to 44 Years | 967 (17.3%) | 4,227 (75.8%) |
| 45 to 54 Years | 854 (14.9%) | 4,027 (70.2%) |
| 55 to 64 Years | 1,622 (27.0%) | 4,334 (72.2%) |
| 65 to 74 Years | 4,362 (97.5%) | 3,007 (67.2%) |
| 75 Years and over | 2,946 (98.7%) | 1,862 (62.4%) |
| Total | 17,003 (38.0%) | 29,359 (65.6%) |
Disability Status by Sex by Age in Chilton County
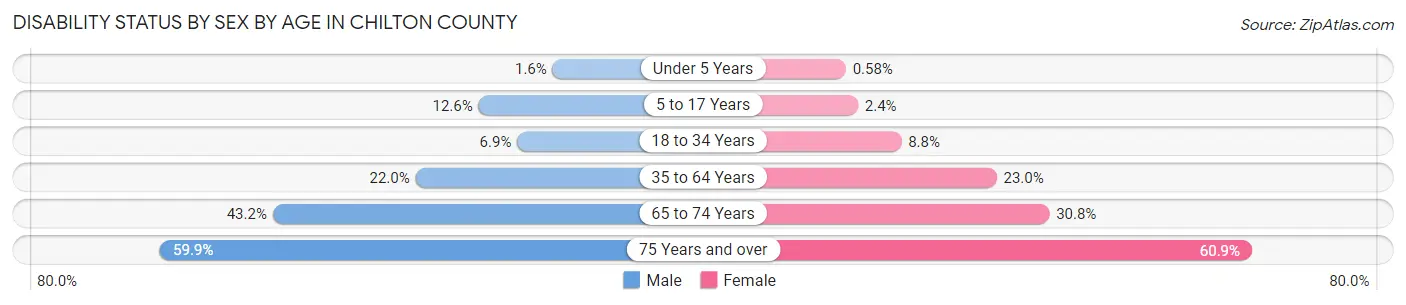
| Age Bracket | Male | Female |
| Under 5 Years | 21 (1.6%) | 8 (0.6%) |
| 5 to 17 Years | 493 (12.6%) | 97 (2.4%) |
| 18 to 34 Years | 308 (6.9%) | 424 (8.8%) |
| 35 to 64 Years | 1,920 (22.0%) | 1,969 (23.0%) |
| 65 to 74 Years | 910 (43.1%) | 728 (30.8%) |
| 75 Years and over | 761 (59.9%) | 1,043 (60.9%) |
Disability Class by Sex by Age in Chilton County
Disability Class: Hearing Difficulty
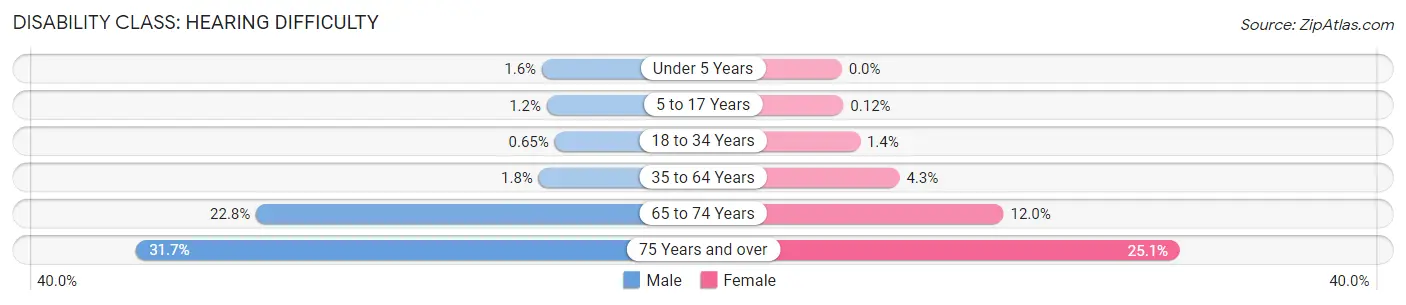
| Age Bracket | Male | Female |
| Under 5 Years | 21 (1.6%) | 0 (0.0%) |
| 5 to 17 Years | 48 (1.2%) | 5 (0.1%) |
| 18 to 34 Years | 29 (0.6%) | 65 (1.3%) |
| 35 to 64 Years | 160 (1.8%) | 367 (4.3%) |
| 65 to 74 Years | 481 (22.8%) | 284 (12.0%) |
| 75 Years and over | 403 (31.7%) | 430 (25.1%) |
Disability Class: Vision Difficulty
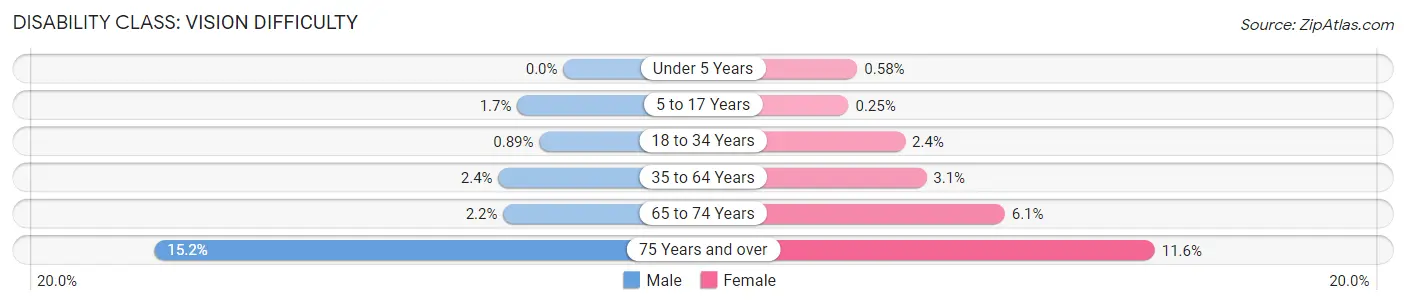
| Age Bracket | Male | Female |
| Under 5 Years | 0 (0.0%) | 8 (0.6%) |
| 5 to 17 Years | 67 (1.7%) | 10 (0.3%) |
| 18 to 34 Years | 40 (0.9%) | 113 (2.4%) |
| 35 to 64 Years | 211 (2.4%) | 269 (3.1%) |
| 65 to 74 Years | 47 (2.2%) | 143 (6.0%) |
| 75 Years and over | 193 (15.2%) | 199 (11.6%) |
Disability Class: Cognitive Difficulty
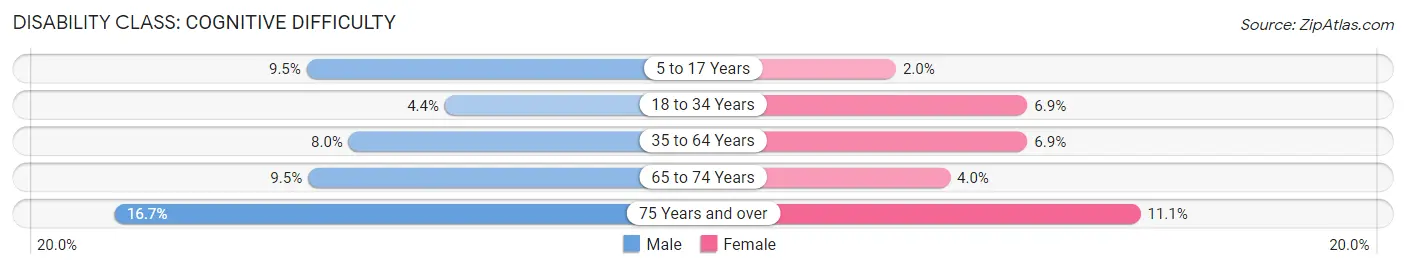
| Age Bracket | Male | Female |
| 5 to 17 Years | 373 (9.5%) | 82 (2.0%) |
| 18 to 34 Years | 198 (4.4%) | 331 (6.9%) |
| 35 to 64 Years | 697 (8.0%) | 590 (6.9%) |
| 65 to 74 Years | 200 (9.5%) | 95 (4.0%) |
| 75 Years and over | 212 (16.7%) | 190 (11.1%) |
Disability Class: Ambulatory Difficulty
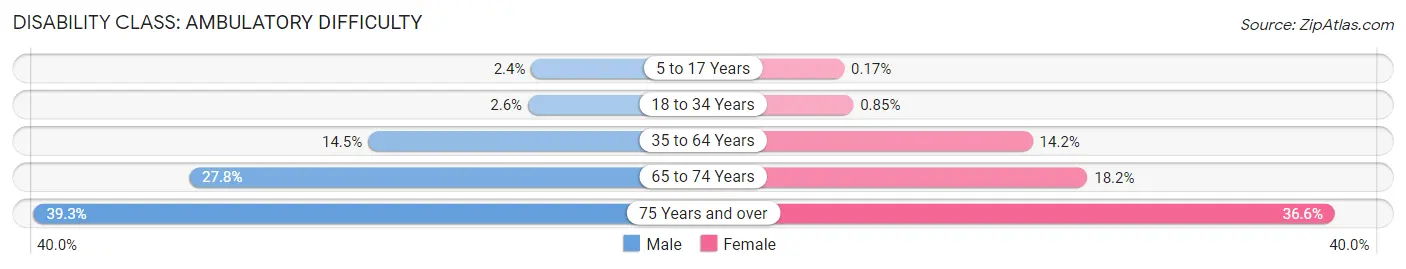
| Age Bracket | Male | Female |
| 5 to 17 Years | 93 (2.4%) | 7 (0.2%) |
| 18 to 34 Years | 118 (2.6%) | 41 (0.9%) |
| 35 to 64 Years | 1,269 (14.5%) | 1,214 (14.2%) |
| 65 to 74 Years | 586 (27.8%) | 431 (18.2%) |
| 75 Years and over | 500 (39.3%) | 627 (36.6%) |
Disability Class: Self-Care Difficulty
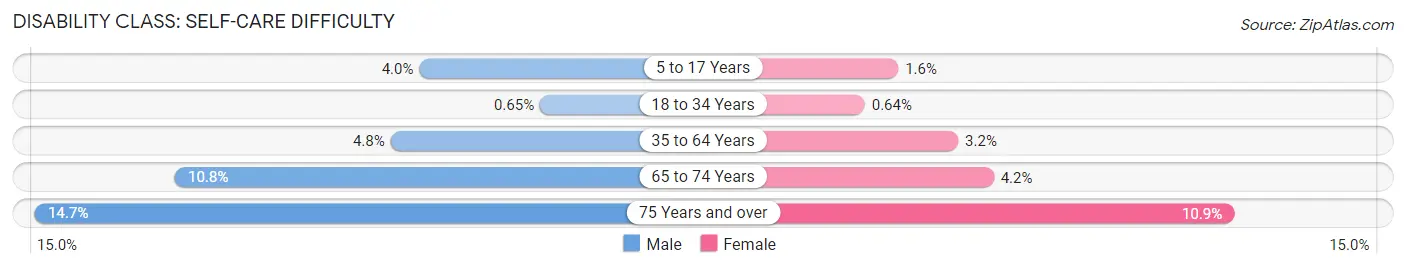
| Age Bracket | Male | Female |
| 5 to 17 Years | 157 (4.0%) | 64 (1.6%) |
| 18 to 34 Years | 29 (0.6%) | 31 (0.6%) |
| 35 to 64 Years | 421 (4.8%) | 278 (3.2%) |
| 65 to 74 Years | 228 (10.8%) | 100 (4.2%) |
| 75 Years and over | 187 (14.7%) | 187 (10.9%) |
Technology Access in Chilton County
Computing Device Access in Chilton County
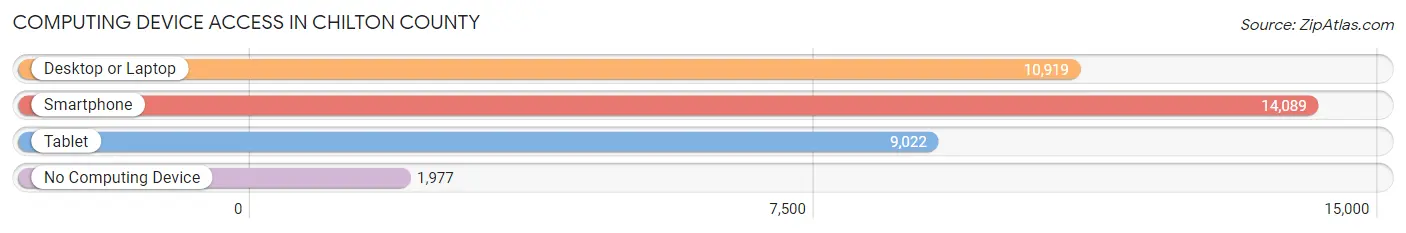
| Device Type | # Households | % Households |
| Desktop or Laptop | 10,919 | 64.5% |
| Smartphone | 14,089 | 83.2% |
| Tablet | 9,022 | 53.3% |
| No Computing Device | 1,977 | 11.7% |
| Total | 16,931 | 100.0% |
Internet Access in Chilton County
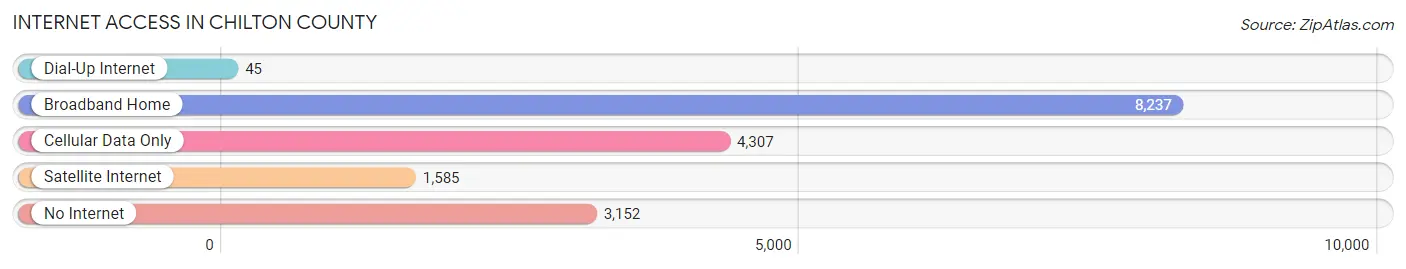
| Internet Type | # Households | % Households |
| Dial-Up Internet | 45 | 0.3% |
| Broadband Home | 8,237 | 48.6% |
| Cellular Data Only | 4,307 | 25.4% |
| Satellite Internet | 1,585 | 9.4% |
| No Internet | 3,152 | 18.6% |
| Total | 16,931 | 100.0% |
Chilton County Summary
Chilton County is located in the central part of Alabama, in the United States. It is bordered by Autauga County to the north, Shelby County to the east, Coosa County to the south, and Bibb County to the west. The county seat is Clanton, and the largest city is Jemison. The county was established on December 30, 1868, and was named for William Parish Chilton, a former Alabama Supreme Court Chief Justice.
Geography
Chilton County covers an area of 677 square miles, of which 675 square miles is land and 2 square miles is water. The county is located in the Piedmont region of Alabama, and is characterized by rolling hills and valleys. The Coosa River forms the northern boundary of the county, and the Tallapoosa River forms the southern boundary. The county is home to several lakes, including Lay Lake, Mitchell Lake, and Jordan Lake.
The climate of Chilton County is humid subtropical, with hot, humid summers and mild winters. The average annual temperature is 64°F, and the average annual precipitation is 52 inches.
Demographics
As of the 2010 United States Census, there were 43,643 people, 16,845 households, and 12,093 families living in Chilton County. The population density was 64.3 people per square mile. The racial makeup of the county was 79.2% White, 18.2% Black or African American, 0.3% Native American, 0.4% Asian, 0.1% Pacific Islander, 0.7% from other races, and 1.1% from two or more races. 1.7% of the population were Hispanic or Latino of any race.
The median income for a household in Chilton County was $37,845, and the median income for a family was $45,945. The per capita income for the county was $18,945. About 15.2% of the population were below the poverty line.
Economy
The economy of Chilton County is largely based on agriculture. The county is home to several large farms, and the main crops grown are cotton, corn, soybeans, and peanuts. The county is also home to several poultry farms, and poultry is the county’s largest agricultural product.
In addition to agriculture, Chilton County is home to several manufacturing companies, including a steel mill, a paper mill, and a furniture factory. The county is also home to several retail stores, restaurants, and other businesses.
History
The area that is now Chilton County was originally inhabited by the Creek and Choctaw Native American tribes. The first European settlers arrived in the area in the early 1800s, and the county was established in 1868.
During the Civil War, Chilton County was a major producer of cotton, and the county was the site of several battles. After the war, the county’s economy shifted to agriculture, and the county remained largely rural until the mid-20th century.
In the late 20th century, the county began to experience population growth, as people moved to the area from other parts of the state. The county’s population has continued to grow in recent years, and the county is now home to several large businesses and industries.
Common Questions
What is Per Capita Income in Chilton County?
Per Capita income in Chilton County is $28,497.
What is the Median Family Income in Chilton County?
Median Family Income in Chilton County is $72,090.
What is the Median Household income in Chilton County?
Median Household Income in Chilton County is $62,471.
What is Income or Wage Gap in Chilton County?
Income or Wage Gap in Chilton County is 36.0%.
Women in Chilton County earn 64.0 cents for every dollar earned by a man.
What is Family Income Deficit in Chilton County?
Family Income Deficit in Chilton County is $9,398.
Families that are below poverty line in Chilton County earn $9,398 less on average than the poverty threshold level.
What is Inequality or Gini Index in Chilton County?
Inequality or Gini Index in Chilton County is 0.42.
What is the Total Population of Chilton County?
Total Population of Chilton County is 45,140.
What is the Total Male Population of Chilton County?
Total Male Population of Chilton County is 22,048.
What is the Total Female Population of Chilton County?
Total Female Population of Chilton County is 23,092.
What is the Ratio of Males per 100 Females in Chilton County?
There are 95.48 Males per 100 Females in Chilton County.
What is the Ratio of Females per 100 Males in Chilton County?
There are 104.74 Females per 100 Males in Chilton County.
What is the Median Population Age in Chilton County?
Median Population Age in Chilton County is 39.9 Years.
What is the Average Family Size in Chilton County
Average Family Size in Chilton County is 3.1 People.
What is the Average Household Size in Chilton County
Average Household Size in Chilton County is 2.6 People.
How Large is the Labor Force in Chilton County?
There are 19,906 People in the Labor Forcein in Chilton County.
What is the Percentage of People in the Labor Force in Chilton County?
56.4% of People are in the Labor Force in Chilton County.
What is the Unemployment Rate in Chilton County?
Unemployment Rate in Chilton County is 5.3%.