Cullman County, AL Map & Demographics
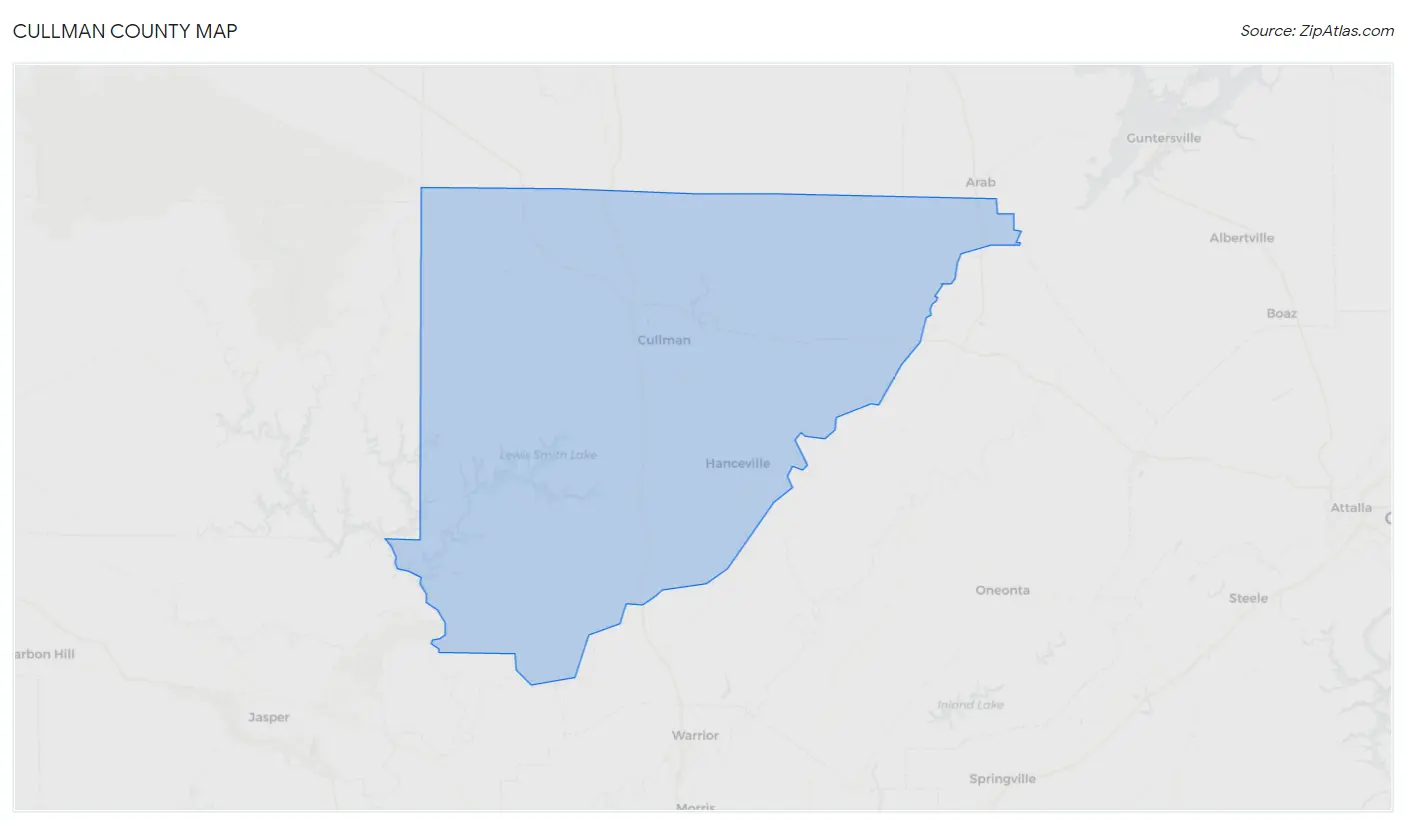
Cullman County Map
Cullman County Overview
$29,788
PER CAPITA INCOME
$72,331
AVG FAMILY INCOME
$58,119
AVG HOUSEHOLD INCOME
37.3%
WAGE / INCOME GAP [ % ]
62.7¢/ $1
WAGE / INCOME GAP [ $ ]
$10,908
FAMILY INCOME DEFICIT
0.44
INEQUALITY / GINI INDEX
88,284
TOTAL POPULATION
43,820
MALE POPULATION
44,464
FEMALE POPULATION
98.55
MALES / 100 FEMALES
101.47
FEMALES / 100 MALES
41.4
MEDIAN AGE
3.1
AVG FAMILY SIZE
2.6
AVG HOUSEHOLD SIZE
41,224
LABOR FORCE [ PEOPLE ]
58.1%
PERCENT IN LABOR FORCE
4.3%
UNEMPLOYMENT RATE
Cullman County Area Codes
Income in Cullman County
Income Overview in Cullman County
Per Capita Income in Cullman County is $29,788, while median incomes of families and households are $72,331 and $58,119 respectively.
| Characteristic | Number | Measure |
| Per Capita Income | 88,284 | $29,788 |
| Median Family Income | 23,598 | $72,331 |
| Mean Family Income | 23,598 | $88,779 |
| Median Household Income | 33,649 | $58,119 |
| Mean Household Income | 33,649 | $75,873 |
| Income Deficit | 23,598 | $10,908 |
| Wage / Income Gap (%) | 88,284 | 37.30% |
| Wage / Income Gap ($) | 88,284 | 62.70¢ per $1 |
| Gini / Inequality Index | 88,284 | 0.44 |
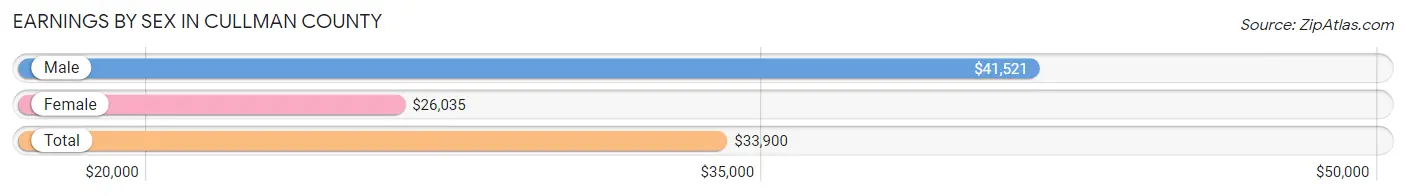
Earnings by Sex in Cullman County
Average Earnings in Cullman County are $33,900, $41,521 for men and $26,035 for women, a difference of 37.3%.
| Sex | Number | Average Earnings |
| Male | 23,821 (54.3%) | $41,521 |
| Female | 20,017 (45.7%) | $26,035 |
| Total | 43,838 (100.0%) | $33,900 |
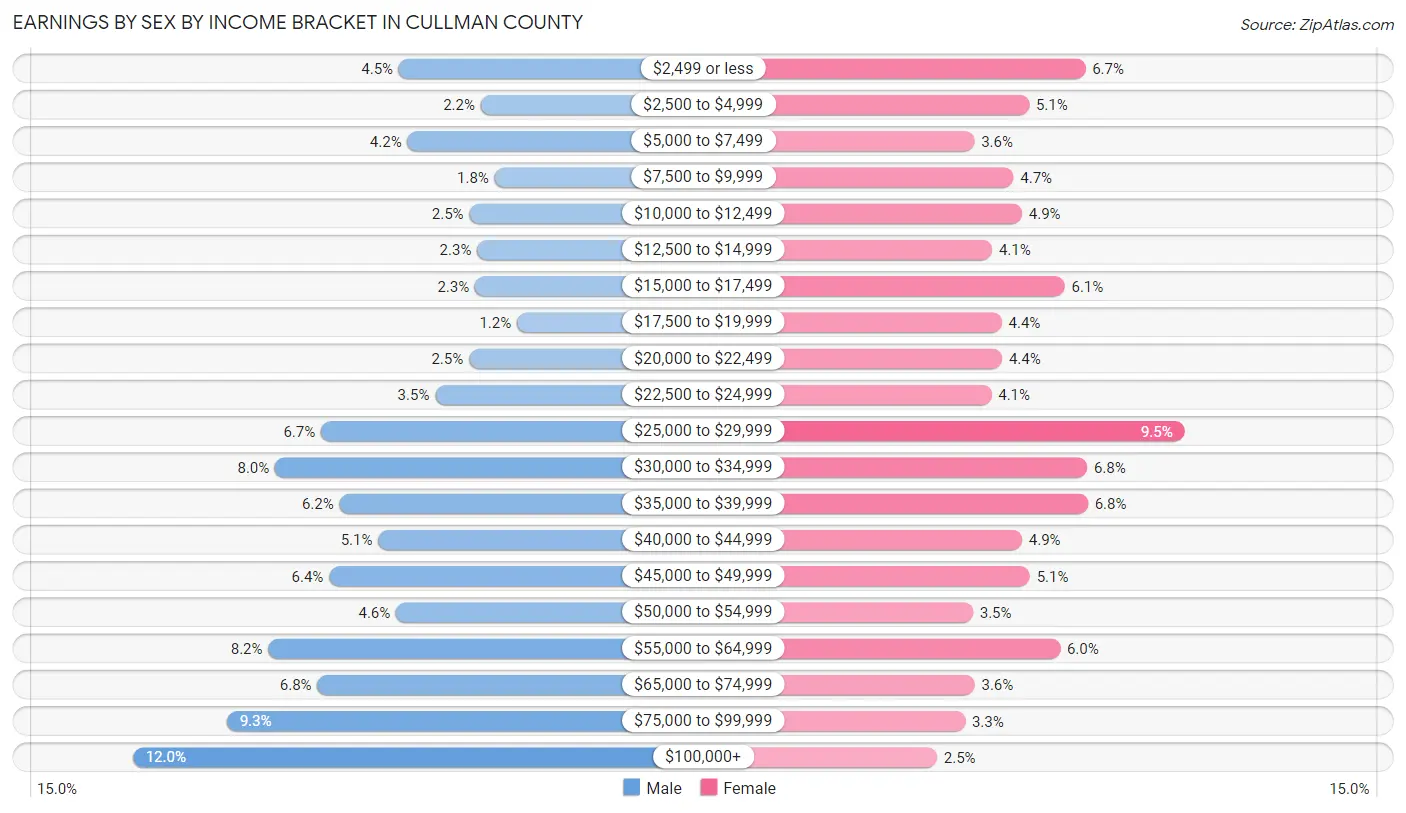
Earnings by Sex by Income Bracket in Cullman County
The most common earnings brackets in Cullman County are $100,000+ for men (2,849 | 12.0%) and $25,000 to $29,999 for women (1,899 | 9.5%).
| Income | Male | Female |
| $2,499 or less | 1,067 (4.5%) | 1,341 (6.7%) |
| $2,500 to $4,999 | 520 (2.2%) | 1,024 (5.1%) |
| $5,000 to $7,499 | 1,010 (4.2%) | 716 (3.6%) |
| $7,500 to $9,999 | 427 (1.8%) | 937 (4.7%) |
| $10,000 to $12,499 | 595 (2.5%) | 985 (4.9%) |
| $12,500 to $14,999 | 544 (2.3%) | 816 (4.1%) |
| $15,000 to $17,499 | 558 (2.3%) | 1,225 (6.1%) |
| $17,500 to $19,999 | 277 (1.2%) | 870 (4.3%) |
| $20,000 to $22,499 | 598 (2.5%) | 873 (4.4%) |
| $22,500 to $24,999 | 825 (3.5%) | 812 (4.1%) |
| $25,000 to $29,999 | 1,590 (6.7%) | 1,899 (9.5%) |
| $30,000 to $34,999 | 1,895 (8.0%) | 1,352 (6.8%) |
| $35,000 to $39,999 | 1,466 (6.1%) | 1,356 (6.8%) |
| $40,000 to $44,999 | 1,205 (5.1%) | 984 (4.9%) |
| $45,000 to $49,999 | 1,535 (6.4%) | 1,029 (5.1%) |
| $50,000 to $54,999 | 1,087 (4.6%) | 709 (3.5%) |
| $55,000 to $64,999 | 1,941 (8.2%) | 1,199 (6.0%) |
| $65,000 to $74,999 | 1,612 (6.8%) | 719 (3.6%) |
| $75,000 to $99,999 | 2,220 (9.3%) | 665 (3.3%) |
| $100,000+ | 2,849 (12.0%) | 506 (2.5%) |
| Total | 23,821 (100.0%) | 20,017 (100.0%) |
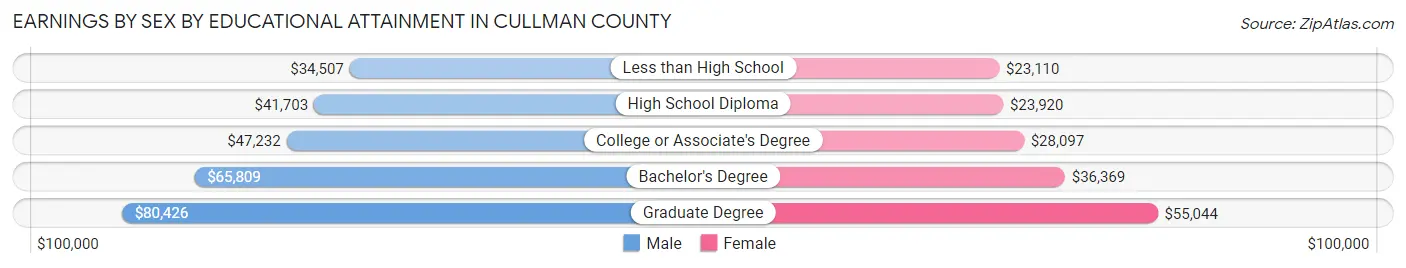
Earnings by Sex by Educational Attainment in Cullman County
Average earnings in Cullman County are $46,899 for men and $28,983 for women, a difference of 38.2%. Men with an educational attainment of graduate degree enjoy the highest average annual earnings of $80,426, while those with less than high school education earn the least with $34,507. Women with an educational attainment of graduate degree earn the most with the average annual earnings of $55,044, while those with less than high school education have the smallest earnings of $23,110.
| Educational Attainment | Male Income | Female Income |
| Less than High School | $34,507 | $23,110 |
| High School Diploma | $41,703 | $23,920 |
| College or Associate's Degree | $47,232 | $28,097 |
| Bachelor's Degree | $65,809 | $36,369 |
| Graduate Degree | $80,426 | $55,044 |
| Total | $46,899 | $28,983 |
Family Income in Cullman County
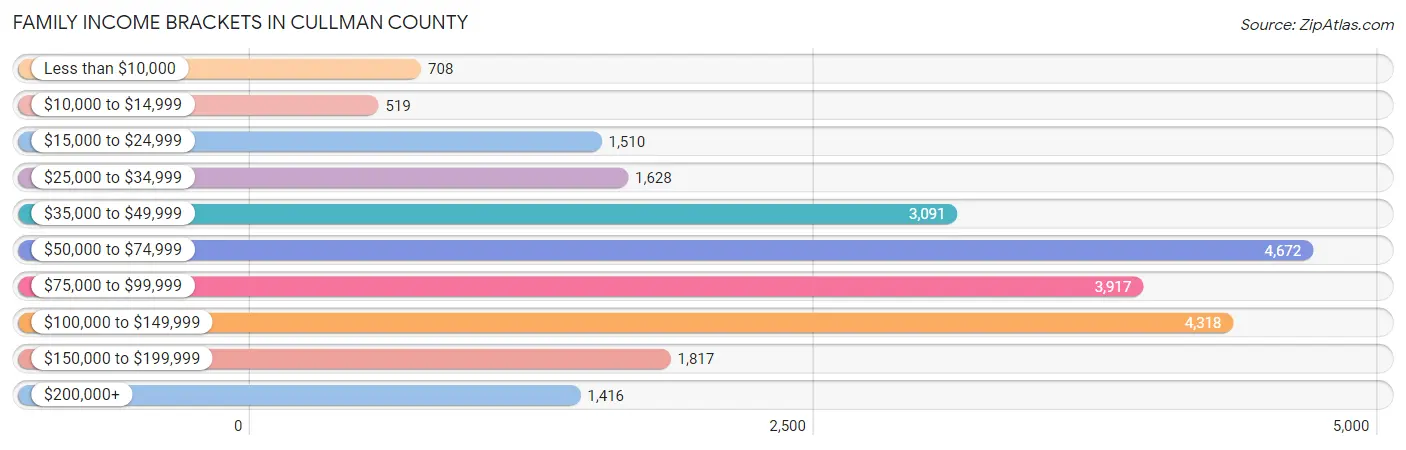
Family Income Brackets in Cullman County
According to the Cullman County family income data, there are 4,672 families falling into the $50,000 to $74,999 income range, which is the most common income bracket and makes up 19.8% of all families. Conversely, the $10,000 to $14,999 income bracket is the least frequent group with only 519 families (2.2%) belonging to this category.
| Income Bracket | # Families | % Families |
| Less than $10,000 | 708 | 3.0% |
| $10,000 to $14,999 | 519 | 2.2% |
| $15,000 to $24,999 | 1,510 | 6.4% |
| $25,000 to $34,999 | 1,628 | 6.9% |
| $35,000 to $49,999 | 3,091 | 13.1% |
| $50,000 to $74,999 | 4,672 | 19.8% |
| $75,000 to $99,999 | 3,917 | 16.6% |
| $100,000 to $149,999 | 4,318 | 18.3% |
| $150,000 to $199,999 | 1,817 | 7.7% |
| $200,000+ | 1,416 | 6.0% |
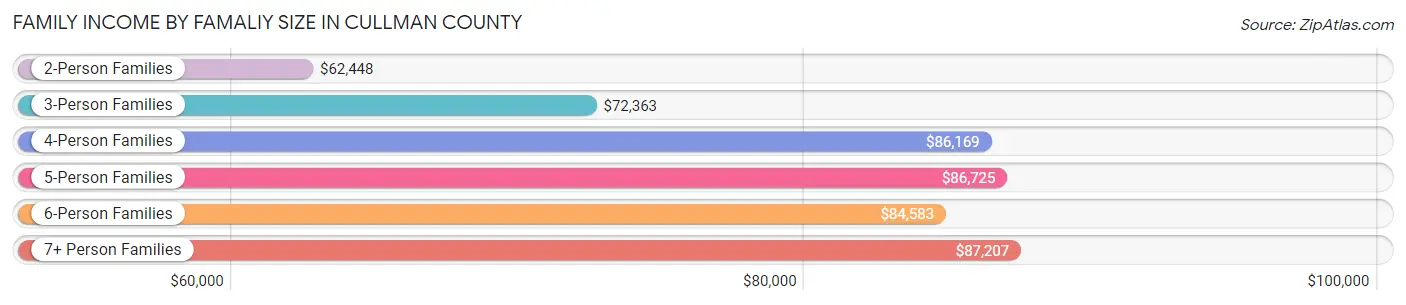
Family Income by Famaliy Size in Cullman County
7+ person families (453 | 1.9%) account for the highest median family income in Cullman County with $87,207 per family, while 2-person families (11,850 | 50.2%) have the highest median income of $31,224 per family member.
| Income Bracket | # Families | Median Income |
| 2-Person Families | 11,850 (50.2%) | $62,448 |
| 3-Person Families | 5,099 (21.6%) | $72,363 |
| 4-Person Families | 3,717 (15.8%) | $86,169 |
| 5-Person Families | 1,900 (8.1%) | $86,725 |
| 6-Person Families | 579 (2.5%) | $84,583 |
| 7+ Person Families | 453 (1.9%) | $87,207 |
| Total | 23,598 (100.0%) | $72,331 |
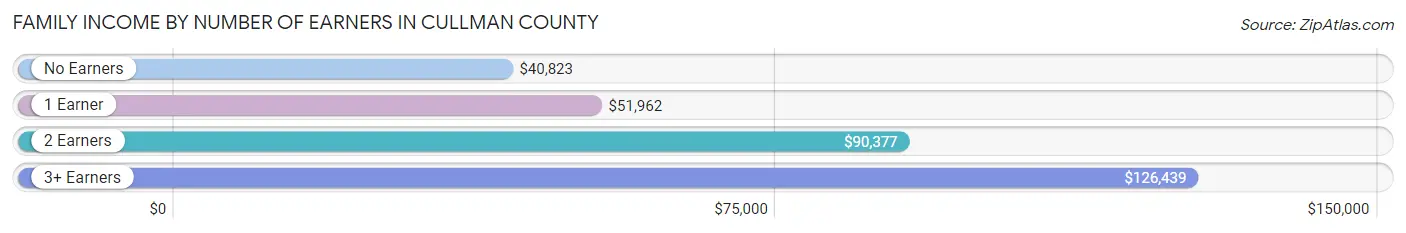
Family Income by Number of Earners in Cullman County
The median family income in Cullman County is $72,331, with families comprising 3+ earners (2,686) having the highest median family income of $126,439, while families with no earners (4,476) have the lowest median family income of $40,823, accounting for 11.4% and 19.0% of families, respectively.
| Number of Earners | # Families | Median Income |
| No Earners | 4,476 (19.0%) | $40,823 |
| 1 Earner | 7,488 (31.7%) | $51,962 |
| 2 Earners | 8,948 (37.9%) | $90,377 |
| 3+ Earners | 2,686 (11.4%) | $126,439 |
| Total | 23,598 (100.0%) | $72,331 |
Household Income in Cullman County
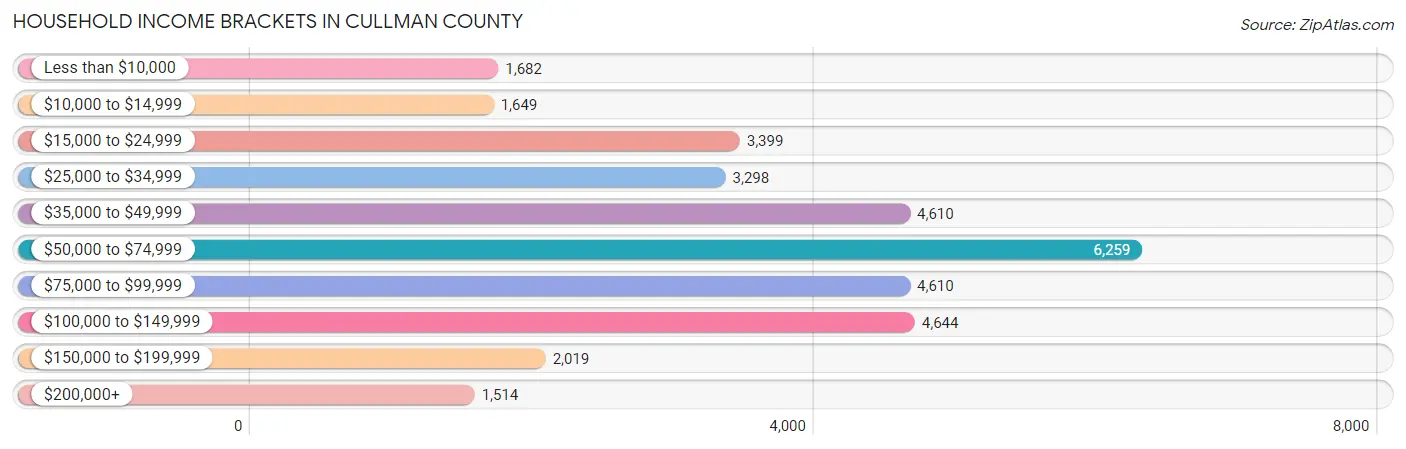
Household Income Brackets in Cullman County
With 6,259 households falling in the category, the $50,000 to $74,999 income range is the most frequent in Cullman County, accounting for 18.6% of all households. In contrast, only 1,514 households (4.5%) fall into the $200,000+ income bracket, making it the least populous group.
| Income Bracket | # Households | % Households |
| Less than $10,000 | 1,682 | 5.0% |
| $10,000 to $14,999 | 1,649 | 4.9% |
| $15,000 to $24,999 | 3,399 | 10.1% |
| $25,000 to $34,999 | 3,298 | 9.8% |
| $35,000 to $49,999 | 4,610 | 13.7% |
| $50,000 to $74,999 | 6,259 | 18.6% |
| $75,000 to $99,999 | 4,610 | 13.7% |
| $100,000 to $149,999 | 4,644 | 13.8% |
| $150,000 to $199,999 | 2,019 | 6.0% |
| $200,000+ | 1,514 | 4.5% |
Household Income by Householder Age in Cullman County
The median household income in Cullman County is $58,119, with the highest median household income of $70,902 found in the 25 to 44 years age bracket for the primary householder. A total of 9,486 households (28.2%) fall into this category. Meanwhile, the 65+ years age bracket for the primary householder has the lowest median household income of $39,509, with 10,263 households (30.5%) in this group.
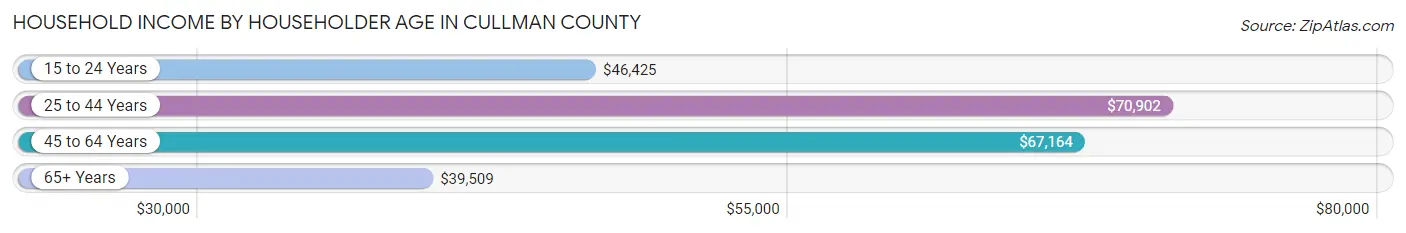
| Income Bracket | # Households | Median Income |
| 15 to 24 Years | 901 (2.7%) | $46,425 |
| 25 to 44 Years | 9,486 (28.2%) | $70,902 |
| 45 to 64 Years | 12,999 (38.6%) | $67,164 |
| 65+ Years | 10,263 (30.5%) | $39,509 |
| Total | 33,649 (100.0%) | $58,119 |
Poverty in Cullman County
Income Below Poverty by Sex and Age in Cullman County
With 11.9% poverty level for males and 14.1% for females among the residents of Cullman County, 5 year old males and 6 to 11 year old females are the most vulnerable to poverty, with 159 males (29.5%) and 742 females (24.0%) in their respective age groups living below the poverty level.
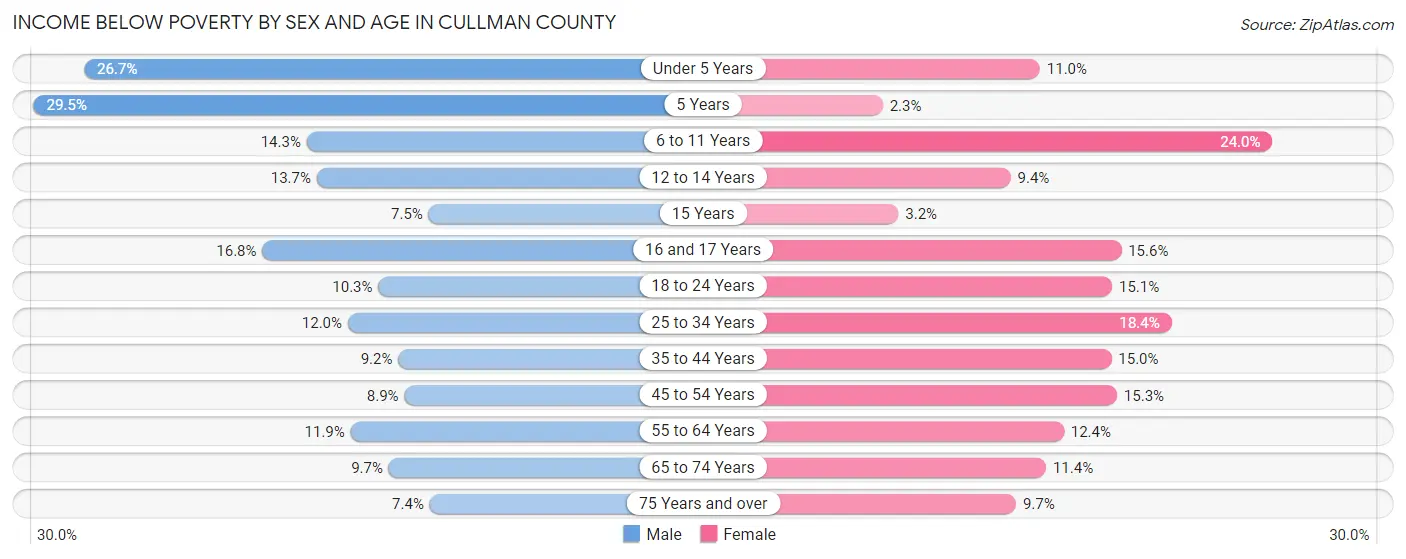
| Age Bracket | Male | Female |
| Under 5 Years | 688 (26.7%) | 285 (11.0%) |
| 5 Years | 159 (29.5%) | 14 (2.3%) |
| 6 to 11 Years | 474 (14.3%) | 742 (24.0%) |
| 12 to 14 Years | 235 (13.7%) | 154 (9.4%) |
| 15 Years | 54 (7.5%) | 14 (3.2%) |
| 16 and 17 Years | 187 (16.8%) | 190 (15.6%) |
| 18 to 24 Years | 377 (10.3%) | 481 (15.0%) |
| 25 to 34 Years | 644 (12.0%) | 976 (18.4%) |
| 35 to 44 Years | 479 (9.2%) | 792 (15.0%) |
| 45 to 54 Years | 510 (8.8%) | 860 (15.3%) |
| 55 to 64 Years | 711 (11.8%) | 740 (12.4%) |
| 65 to 74 Years | 440 (9.7%) | 577 (11.4%) |
| 75 Years and over | 203 (7.4%) | 378 (9.7%) |
| Total | 5,161 (11.9%) | 6,203 (14.1%) |
Income Above Poverty by Sex and Age in Cullman County
According to the poverty statistics in Cullman County, males aged 75 years and over and females aged 5 years are the age groups that are most secure financially, with 92.6% of males and 97.7% of females in these age groups living above the poverty line.
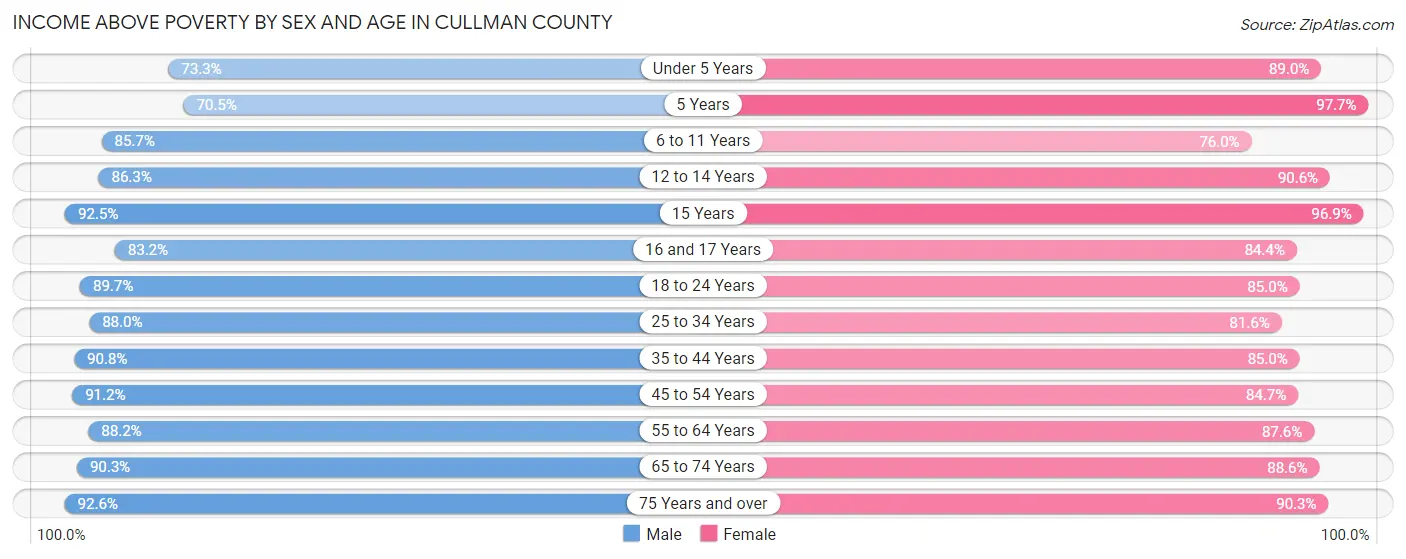
| Age Bracket | Male | Female |
| Under 5 Years | 1,890 (73.3%) | 2,299 (89.0%) |
| 5 Years | 380 (70.5%) | 601 (97.7%) |
| 6 to 11 Years | 2,843 (85.7%) | 2,353 (76.0%) |
| 12 to 14 Years | 1,477 (86.3%) | 1,484 (90.6%) |
| 15 Years | 666 (92.5%) | 430 (96.9%) |
| 16 and 17 Years | 929 (83.2%) | 1,031 (84.4%) |
| 18 to 24 Years | 3,284 (89.7%) | 2,716 (85.0%) |
| 25 to 34 Years | 4,723 (88.0%) | 4,340 (81.6%) |
| 35 to 44 Years | 4,736 (90.8%) | 4,484 (85.0%) |
| 45 to 54 Years | 5,255 (91.1%) | 4,755 (84.7%) |
| 55 to 64 Years | 5,289 (88.1%) | 5,245 (87.6%) |
| 65 to 74 Years | 4,086 (90.3%) | 4,499 (88.6%) |
| 75 Years and over | 2,524 (92.6%) | 3,518 (90.3%) |
| Total | 38,082 (88.1%) | 37,755 (85.9%) |
Income Below Poverty Among Married-Couple Families in Cullman County
The poverty statistics for married-couple families in Cullman County show that 5.3% or 971 of the total 18,371 families live below the poverty line. Families with 3 or 4 children have the highest poverty rate of 13.3%, comprising of 187 families. On the other hand, families with no children have the lowest poverty rate of 3.7%, which includes 398 families.
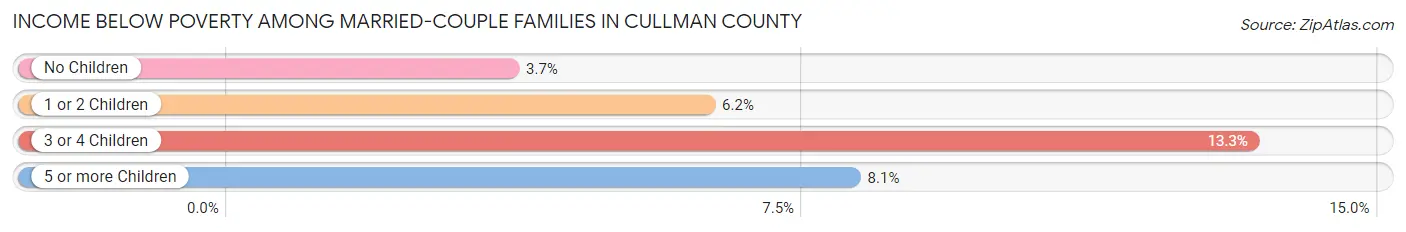
| Children | Above Poverty | Below Poverty |
| No Children | 10,442 (96.3%) | 398 (3.7%) |
| 1 or 2 Children | 5,551 (93.8%) | 369 (6.2%) |
| 3 or 4 Children | 1,215 (86.7%) | 187 (13.3%) |
| 5 or more Children | 192 (91.9%) | 17 (8.1%) |
| Total | 17,400 (94.7%) | 971 (5.3%) |
Income Below Poverty Among Single-Parent Households in Cullman County
According to the poverty data in Cullman County, 14.1% or 231 single-father households and 29.5% or 1,058 single-mother households are living below the poverty line. Among single-father households, those with 1 or 2 children have the highest poverty rate, with 175 households (20.6%) experiencing poverty. Likewise, among single-mother households, those with 5 or more children have the highest poverty rate, with 27 households (64.3%) falling below the poverty line.
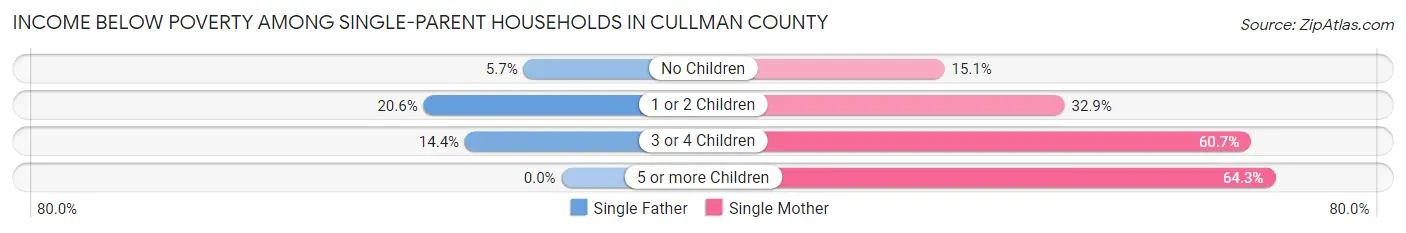
| Children | Single Father | Single Mother |
| No Children | 37 (5.7%) | 194 (15.0%) |
| 1 or 2 Children | 175 (20.6%) | 633 (32.9%) |
| 3 or 4 Children | 19 (14.4%) | 204 (60.7%) |
| 5 or more Children | 0 (0.0%) | 27 (64.3%) |
| Total | 231 (14.1%) | 1,058 (29.5%) |
Income Below Poverty Among Married-Couple vs Single-Parent Households in Cullman County
The poverty data for Cullman County shows that 971 of the married-couple family households (5.3%) and 1,289 of the single-parent households (24.7%) are living below the poverty level. Within the married-couple family households, those with 3 or 4 children have the highest poverty rate, with 187 households (13.3%) falling below the poverty line. Among the single-parent households, those with 5 or more children have the highest poverty rate, with 27 household (64.3%) living below poverty.
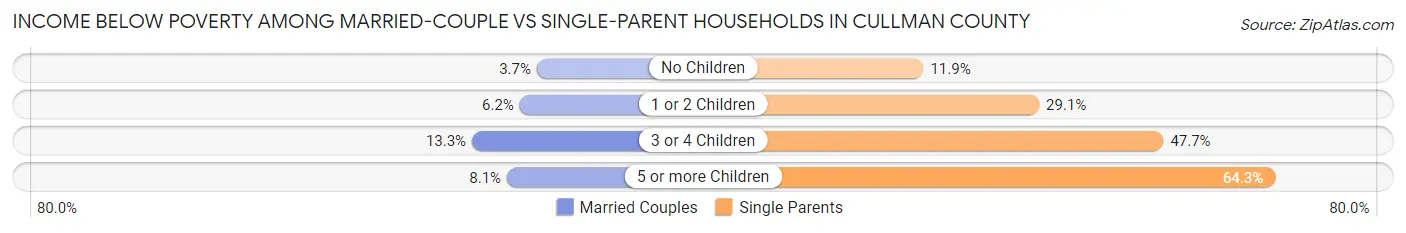
| Children | Married-Couple Families | Single-Parent Households |
| No Children | 398 (3.7%) | 231 (11.9%) |
| 1 or 2 Children | 369 (6.2%) | 808 (29.1%) |
| 3 or 4 Children | 187 (13.3%) | 223 (47.6%) |
| 5 or more Children | 17 (8.1%) | 27 (64.3%) |
| Total | 971 (5.3%) | 1,289 (24.7%) |
Race in Cullman County
The most populous races in Cullman County are White / Caucasian (81,077 | 91.8%), Two or more Races (4,127 | 4.7%), and Hispanic or Latino (4,056 | 4.6%).
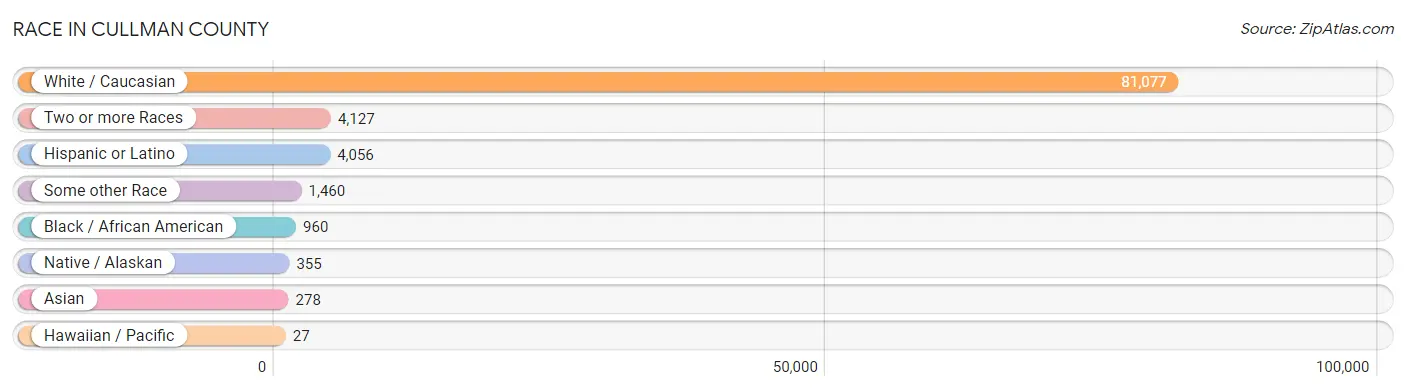
| Race | # Population | % Population |
| Asian | 278 | 0.3% |
| Black / African American | 960 | 1.1% |
| Hawaiian / Pacific | 27 | 0.0% |
| Hispanic or Latino | 4,056 | 4.6% |
| Native / Alaskan | 355 | 0.4% |
| White / Caucasian | 81,077 | 91.8% |
| Two or more Races | 4,127 | 4.7% |
| Some other Race | 1,460 | 1.7% |
| Total | 88,284 | 100.0% |
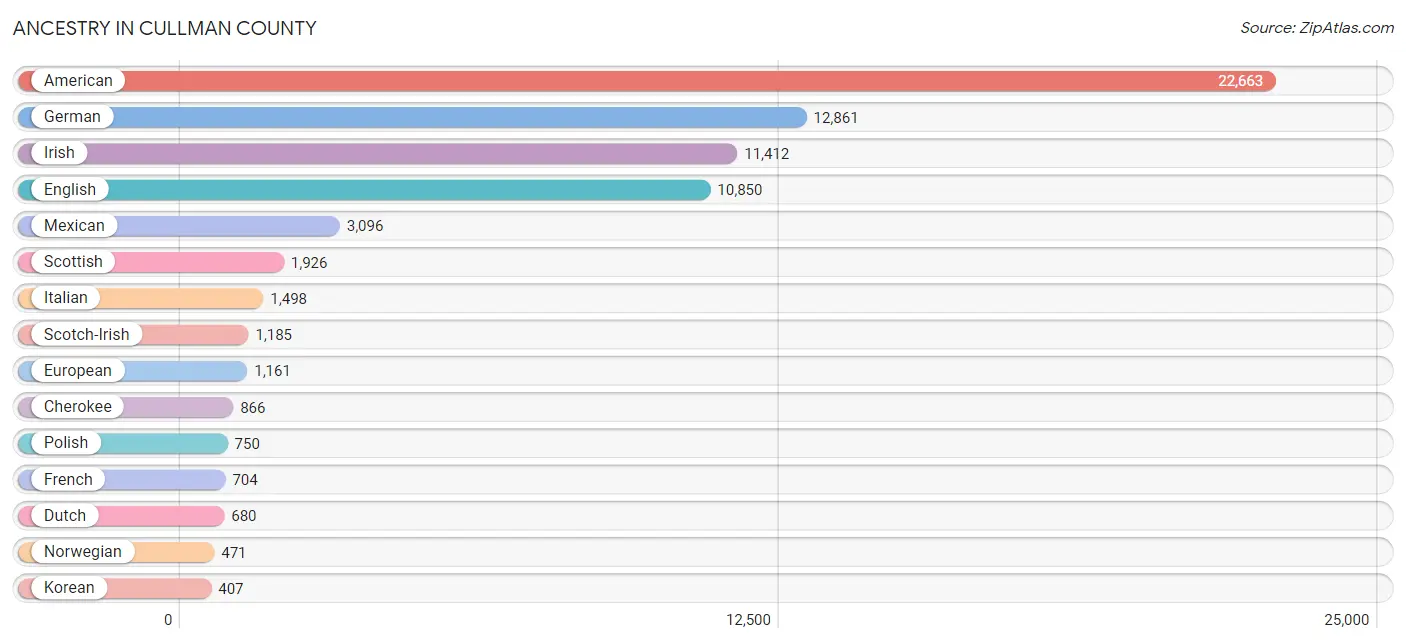
Ancestry in Cullman County
The most populous ancestries reported in Cullman County are American (22,663 | 25.7%), German (12,861 | 14.6%), Irish (11,412 | 12.9%), English (10,850 | 12.3%), and Mexican (3,096 | 3.5%), together accounting for 69.0% of all Cullman County residents.
| Ancestry | # Population | % Population |
| African | 113 | 0.1% |
| American | 22,663 | 25.7% |
| Arab | 37 | 0.0% |
| Argentinean | 31 | 0.0% |
| Australian | 13 | 0.0% |
| Belgian | 6 | 0.0% |
| Bhutanese | 113 | 0.1% |
| Blackfeet | 11 | 0.0% |
| British | 396 | 0.4% |
| Burmese | 70 | 0.1% |
| Cajun | 20 | 0.0% |
| Canadian | 14 | 0.0% |
| Celtic | 53 | 0.1% |
| Central American | 153 | 0.2% |
| Cherokee | 866 | 1.0% |
| Chickasaw | 5 | 0.0% |
| Choctaw | 122 | 0.1% |
| Colombian | 7 | 0.0% |
| Creek | 57 | 0.1% |
| Croatian | 9 | 0.0% |
| Cuban | 93 | 0.1% |
| Czech | 33 | 0.0% |
| Czechoslovakian | 6 | 0.0% |
| Danish | 30 | 0.0% |
| Dominican | 217 | 0.3% |
| Dutch | 680 | 0.8% |
| Dutch West Indian | 3 | 0.0% |
| Eastern European | 63 | 0.1% |
| Ecuadorian | 4 | 0.0% |
| English | 10,850 | 12.3% |
| Ethiopian | 26 | 0.0% |
| European | 1,161 | 1.3% |
| Filipino | 27 | 0.0% |
| French | 704 | 0.8% |
| French Canadian | 57 | 0.1% |
| German | 12,861 | 14.6% |
| Greek | 19 | 0.0% |
| Guatemalan | 117 | 0.1% |
| Hungarian | 99 | 0.1% |
| Indian (Asian) | 67 | 0.1% |
| Indonesian | 39 | 0.0% |
| Irish | 11,412 | 12.9% |
| Italian | 1,498 | 1.7% |
| Japanese | 20 | 0.0% |
| Korean | 407 | 0.5% |
| Lebanese | 35 | 0.0% |
| Lithuanian | 25 | 0.0% |
| Mexican | 3,096 | 3.5% |
| Mexican American Indian | 195 | 0.2% |
| Native Hawaiian | 55 | 0.1% |
| Nicaraguan | 36 | 0.0% |
| Northern European | 80 | 0.1% |
| Norwegian | 471 | 0.5% |
| Pakistani | 7 | 0.0% |
| Paraguayan | 10 | 0.0% |
| Polish | 750 | 0.9% |
| Portuguese | 349 | 0.4% |
| Puerto Rican | 185 | 0.2% |
| Romanian | 96 | 0.1% |
| Russian | 95 | 0.1% |
| Scandinavian | 222 | 0.3% |
| Scotch-Irish | 1,185 | 1.3% |
| Scottish | 1,926 | 2.2% |
| Sioux | 16 | 0.0% |
| Slovak | 25 | 0.0% |
| Slovene | 9 | 0.0% |
| South American | 54 | 0.1% |
| Spaniard | 25 | 0.0% |
| Spanish | 12 | 0.0% |
| Spanish American Indian | 10 | 0.0% |
| Sri Lankan | 50 | 0.1% |
| Subsaharan African | 113 | 0.1% |
| Swedish | 202 | 0.2% |
| Thai | 13 | 0.0% |
| Ukrainian | 19 | 0.0% |
| Venezuelan | 2 | 0.0% |
| Welsh | 340 | 0.4% | View All 77 Rows |
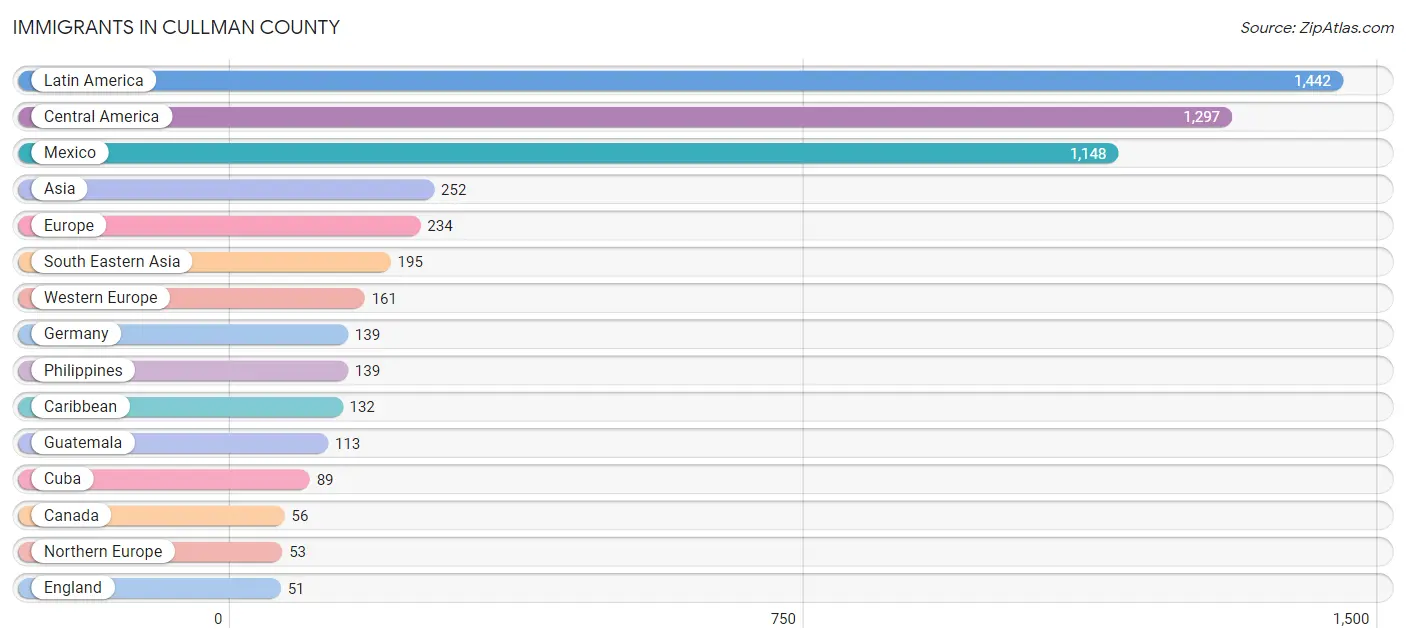
Immigrants in Cullman County
The most numerous immigrant groups reported in Cullman County came from Latin America (1,442 | 1.6%), Central America (1,297 | 1.5%), Mexico (1,148 | 1.3%), Asia (252 | 0.3%), and Europe (234 | 0.3%), together accounting for 5.0% of all Cullman County residents.
| Immigration Origin | # Population | % Population |
| Africa | 26 | 0.0% |
| Asia | 252 | 0.3% |
| Australia | 17 | 0.0% |
| Canada | 56 | 0.1% |
| Caribbean | 132 | 0.2% |
| Central America | 1,297 | 1.5% |
| China | 4 | 0.0% |
| Colombia | 7 | 0.0% |
| Cuba | 89 | 0.1% |
| Dominican Republic | 43 | 0.1% |
| Eastern Africa | 26 | 0.0% |
| Eastern Asia | 34 | 0.0% |
| Eastern Europe | 20 | 0.0% |
| Ecuador | 4 | 0.0% |
| England | 51 | 0.1% |
| Ethiopia | 26 | 0.0% |
| Europe | 234 | 0.3% |
| France | 22 | 0.0% |
| Germany | 139 | 0.2% |
| Guatemala | 113 | 0.1% |
| Iraq | 11 | 0.0% |
| Japan | 19 | 0.0% |
| Korea | 11 | 0.0% |
| Latin America | 1,442 | 1.6% |
| Mexico | 1,148 | 1.3% |
| Nicaragua | 36 | 0.0% |
| Northern Europe | 53 | 0.1% |
| Oceania | 37 | 0.0% |
| Philippines | 139 | 0.2% |
| Russia | 12 | 0.0% |
| South America | 13 | 0.0% |
| South Eastern Asia | 195 | 0.2% |
| Syria | 12 | 0.0% |
| Thailand | 34 | 0.0% |
| Ukraine | 8 | 0.0% |
| Venezuela | 2 | 0.0% |
| Vietnam | 22 | 0.0% |
| Western Asia | 23 | 0.0% |
| Western Europe | 161 | 0.2% | View All 39 Rows |
Sex and Age in Cullman County
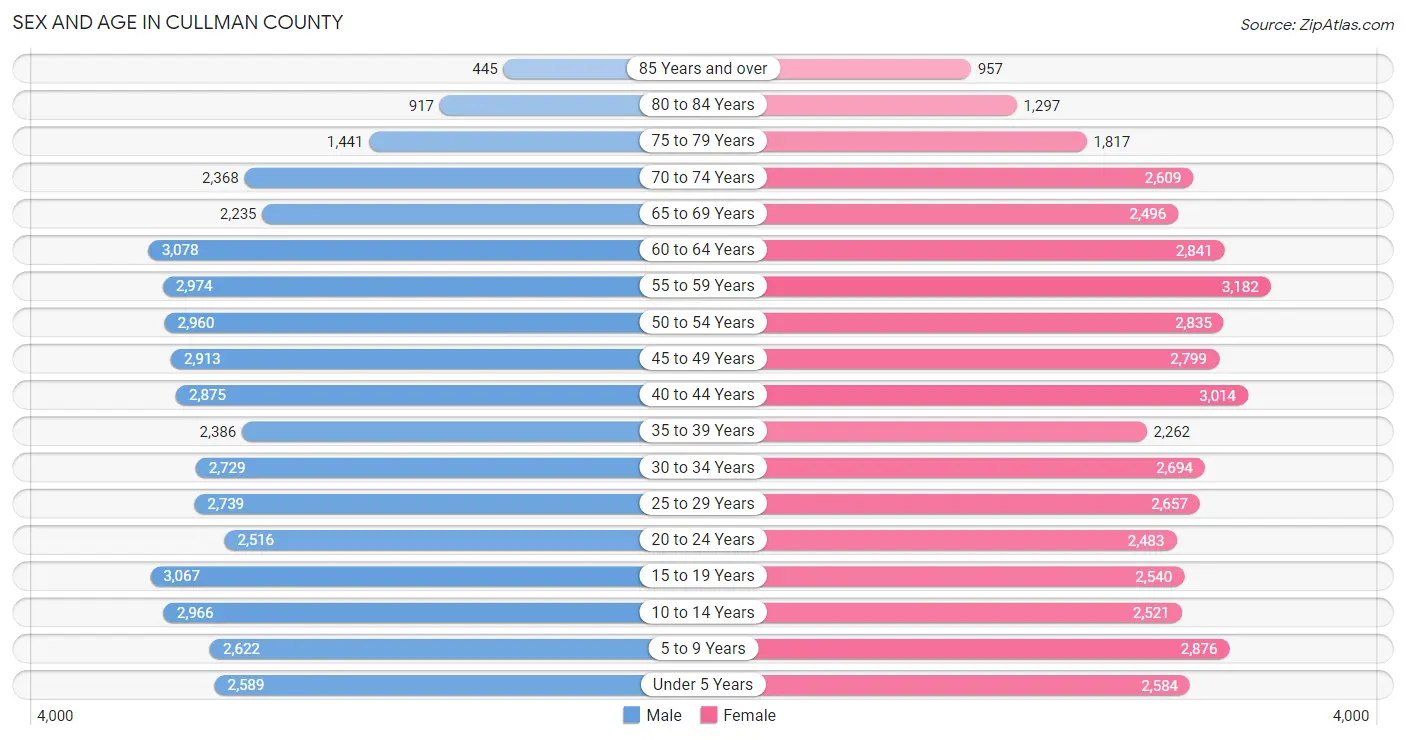
Sex and Age in Cullman County
The most populous age groups in Cullman County are 60 to 64 Years (3,078 | 7.0%) for men and 55 to 59 Years (3,182 | 7.2%) for women.
| Age Bracket | Male | Female |
| Under 5 Years | 2,589 (5.9%) | 2,584 (5.8%) |
| 5 to 9 Years | 2,622 (6.0%) | 2,876 (6.5%) |
| 10 to 14 Years | 2,966 (6.8%) | 2,521 (5.7%) |
| 15 to 19 Years | 3,067 (7.0%) | 2,540 (5.7%) |
| 20 to 24 Years | 2,516 (5.7%) | 2,483 (5.6%) |
| 25 to 29 Years | 2,739 (6.2%) | 2,657 (6.0%) |
| 30 to 34 Years | 2,729 (6.2%) | 2,694 (6.1%) |
| 35 to 39 Years | 2,386 (5.4%) | 2,262 (5.1%) |
| 40 to 44 Years | 2,875 (6.6%) | 3,014 (6.8%) |
| 45 to 49 Years | 2,913 (6.7%) | 2,799 (6.3%) |
| 50 to 54 Years | 2,960 (6.8%) | 2,835 (6.4%) |
| 55 to 59 Years | 2,974 (6.8%) | 3,182 (7.2%) |
| 60 to 64 Years | 3,078 (7.0%) | 2,841 (6.4%) |
| 65 to 69 Years | 2,235 (5.1%) | 2,496 (5.6%) |
| 70 to 74 Years | 2,368 (5.4%) | 2,609 (5.9%) |
| 75 to 79 Years | 1,441 (3.3%) | 1,817 (4.1%) |
| 80 to 84 Years | 917 (2.1%) | 1,297 (2.9%) |
| 85 Years and over | 445 (1.0%) | 957 (2.1%) |
| Total | 43,820 (100.0%) | 44,464 (100.0%) |
Families and Households in Cullman County
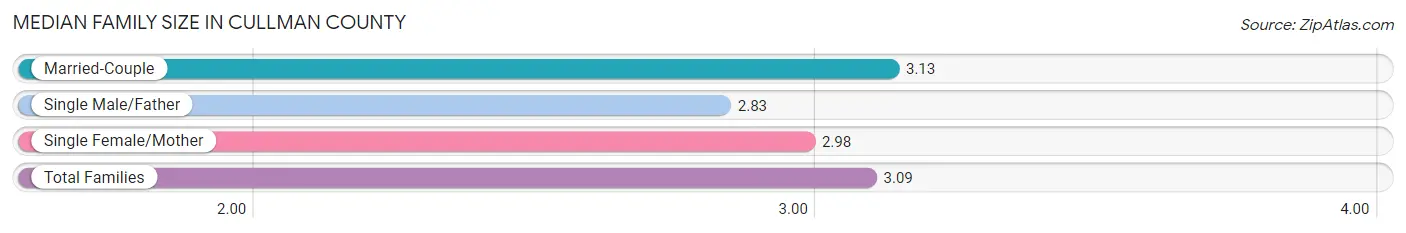
Median Family Size in Cullman County
The median family size in Cullman County is 3.09 persons per family, with married-couple families (18,371 | 77.8%) accounting for the largest median family size of 3.13 persons per family. On the other hand, single male/father families (1,637 | 6.9%) represent the smallest median family size with 2.83 persons per family.
| Family Type | # Families | Family Size |
| Married-Couple | 18,371 (77.8%) | 3.13 |
| Single Male/Father | 1,637 (6.9%) | 2.83 |
| Single Female/Mother | 3,590 (15.2%) | 2.98 |
| Total Families | 23,598 (100.0%) | 3.09 |
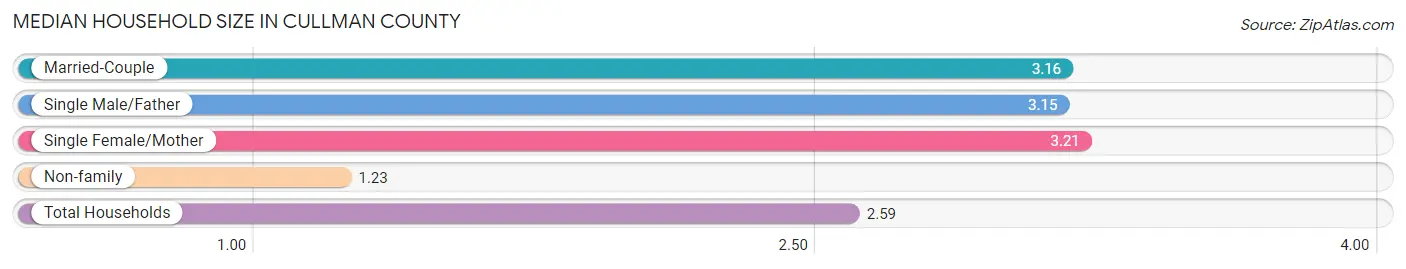
Median Household Size in Cullman County
The median household size in Cullman County is 2.59 persons per household, with single female/mother households (3,590 | 10.7%) accounting for the largest median household size of 3.21 persons per household. non-family households (10,051 | 29.9%) represent the smallest median household size with 1.23 persons per household.
| Household Type | # Households | Household Size |
| Married-Couple | 18,371 (54.6%) | 3.16 |
| Single Male/Father | 1,637 (4.9%) | 3.15 |
| Single Female/Mother | 3,590 (10.7%) | 3.21 |
| Non-family | 10,051 (29.9%) | 1.23 |
| Total Households | 33,649 (100.0%) | 2.59 |
Household Size by Marriage Status in Cullman County
Out of a total of 33,649 households in Cullman County, 23,598 (70.1%) are family households, while 10,051 (29.9%) are nonfamily households. The most numerous type of family households are 2-person households, comprising 11,323, and the most common type of nonfamily households are 1-person households, comprising 8,496.
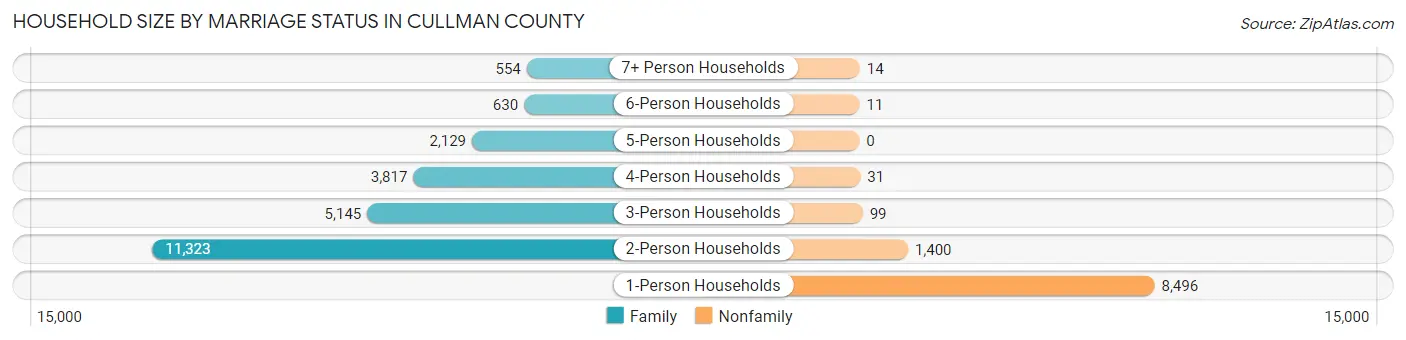
| Household Size | Family Households | Nonfamily Households |
| 1-Person Households | - | 8,496 (25.3%) |
| 2-Person Households | 11,323 (33.7%) | 1,400 (4.2%) |
| 3-Person Households | 5,145 (15.3%) | 99 (0.3%) |
| 4-Person Households | 3,817 (11.3%) | 31 (0.1%) |
| 5-Person Households | 2,129 (6.3%) | 0 (0.0%) |
| 6-Person Households | 630 (1.9%) | 11 (0.0%) |
| 7+ Person Households | 554 (1.7%) | 14 (0.0%) |
| Total | 23,598 (70.1%) | 10,051 (29.9%) |
Female Fertility in Cullman County
Fertility by Age in Cullman County
Average fertility rate in Cullman County is 46.0 births per 1,000 women. Women in the age bracket of 20 to 34 years have the highest fertility rate with 99.0 births per 1,000 women. Women in the age bracket of 20 to 34 years acount for 87.1% of all women with births.
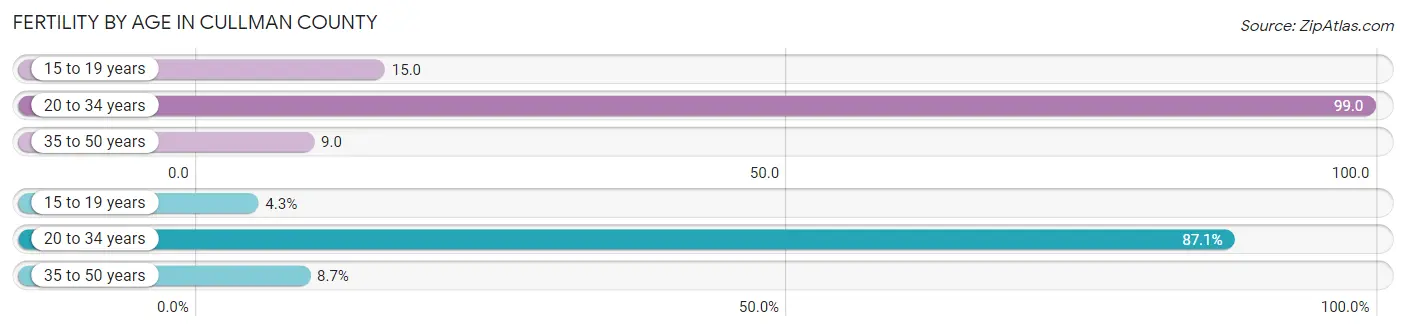
| Age Bracket | Women with Births | Births / 1,000 Women |
| 15 to 19 years | 38 (4.3%) | 15.0 |
| 20 to 34 years | 774 (87.1%) | 99.0 |
| 35 to 50 years | 77 (8.7%) | 9.0 |
| Total | 889 (100.0%) | 46.0 |
Fertility by Age by Marriage Status in Cullman County
73.2% of women with births (889) in Cullman County are married. The highest percentage of unmarried women with births falls into 15 to 19 years age bracket with 78.9% of them unmarried at the time of birth, while the lowest percentage of unmarried women with births belong to 35 to 50 years age bracket with 0.0% of them unmarried.
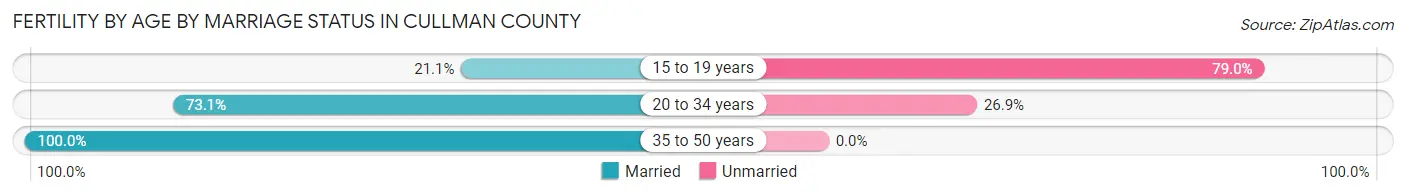
| Age Bracket | Married | Unmarried |
| 15 to 19 years | 8 (21.0%) | 30 (78.9%) |
| 20 to 34 years | 566 (73.1%) | 208 (26.9%) |
| 35 to 50 years | 77 (100.0%) | 0 (0.0%) |
| Total | 651 (73.2%) | 238 (26.8%) |
Fertility by Education in Cullman County
Average fertility rate in Cullman County is 46.0 births per 1,000 women. Women with the education attainment of bachelor's degree have the highest fertility rate of 107.0 births per 1,000 women, while women with the education attainment of less than high school have the lowest fertility at 26.0 births per 1,000 women. Women with the education attainment of college or associate's degree represent 35.4% of all women with births.
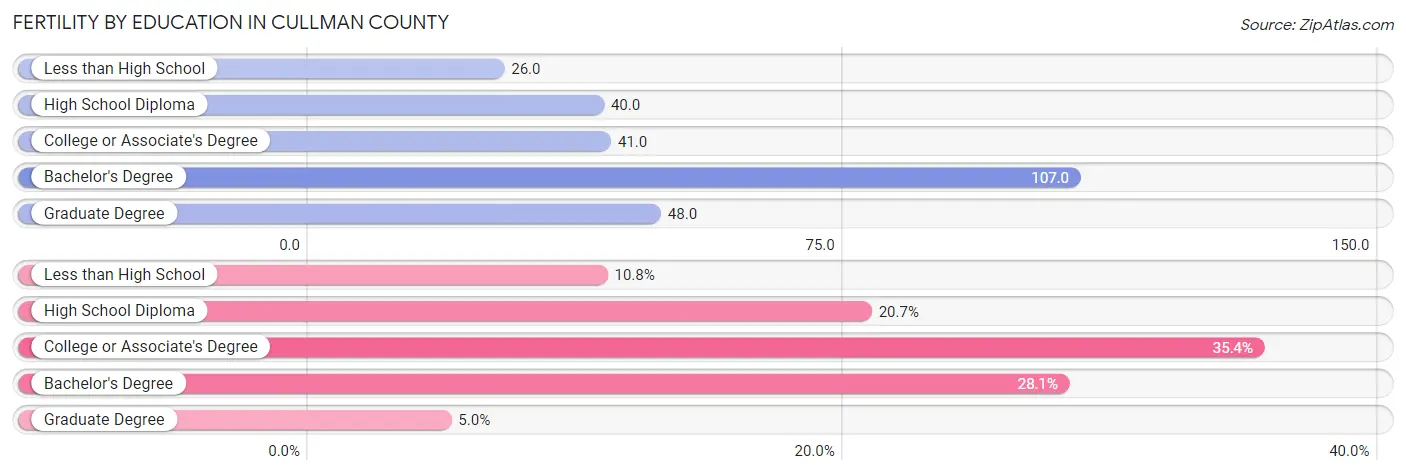
| Educational Attainment | Women with Births | Births / 1,000 Women |
| Less than High School | 96 (10.8%) | 26.0 |
| High School Diploma | 184 (20.7%) | 40.0 |
| College or Associate's Degree | 315 (35.4%) | 41.0 |
| Bachelor's Degree | 250 (28.1%) | 107.0 |
| Graduate Degree | 44 (5.0%) | 48.0 |
| Total | 889 (100.0%) | 46.0 |
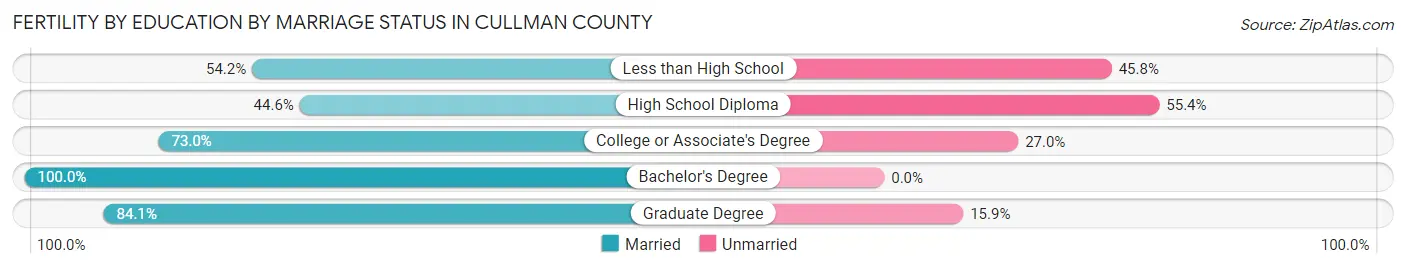
Fertility by Education by Marriage Status in Cullman County
26.8% of women with births in Cullman County are unmarried. Women with the educational attainment of bachelor's degree are most likely to be married with 100.0% of them married at childbirth, while women with the educational attainment of high school diploma are least likely to be married with 55.4% of them unmarried at childbirth.
| Educational Attainment | Married | Unmarried |
| Less than High School | 52 (54.2%) | 44 (45.8%) |
| High School Diploma | 82 (44.6%) | 102 (55.4%) |
| College or Associate's Degree | 230 (73.0%) | 85 (27.0%) |
| Bachelor's Degree | 250 (100.0%) | 0 (0.0%) |
| Graduate Degree | 37 (84.1%) | 7 (15.9%) |
| Total | 651 (73.2%) | 238 (26.8%) |
Employment Characteristics in Cullman County
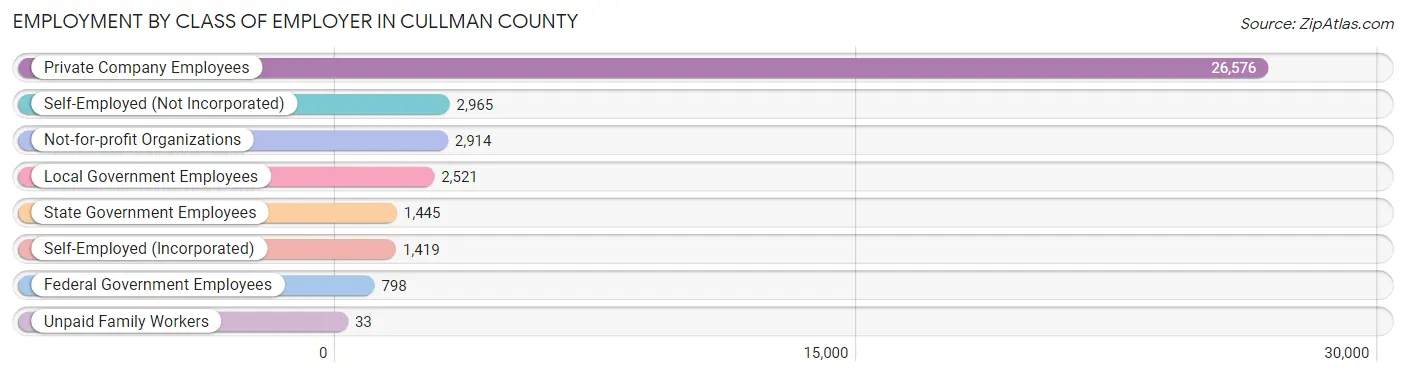
Employment by Class of Employer in Cullman County
Among the 38,671 employed individuals in Cullman County, private company employees (26,576 | 68.7%), self-employed (not incorporated) (2,965 | 7.7%), and not-for-profit organizations (2,914 | 7.5%) make up the most common classes of employment.
| Employer Class | # Employees | % Employees |
| Private Company Employees | 26,576 | 68.7% |
| Self-Employed (Incorporated) | 1,419 | 3.7% |
| Self-Employed (Not Incorporated) | 2,965 | 7.7% |
| Not-for-profit Organizations | 2,914 | 7.5% |
| Local Government Employees | 2,521 | 6.5% |
| State Government Employees | 1,445 | 3.7% |
| Federal Government Employees | 798 | 2.1% |
| Unpaid Family Workers | 33 | 0.1% |
| Total | 38,671 | 100.0% |
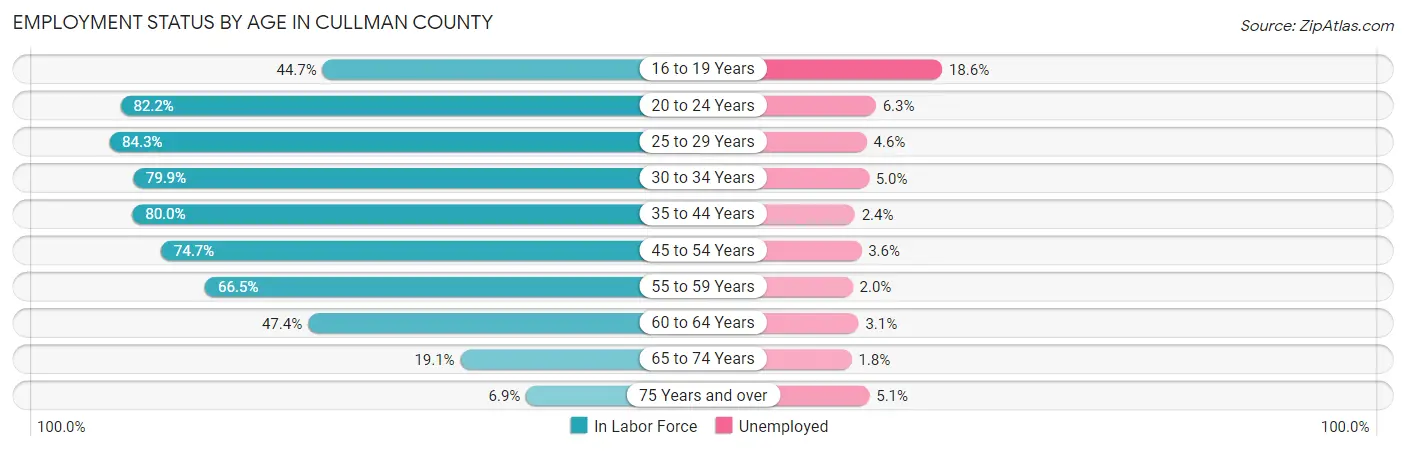
Employment Status by Age in Cullman County
According to the labor force statistics for Cullman County, out of the total population over 16 years of age (70,954), 58.1% or 41,224 individuals are in the labor force, with 4.3% or 1,773 of them unemployed. The age group with the highest labor force participation rate is 25 to 29 years, with 84.3% or 4,549 individuals in the labor force. Within the labor force, the 16 to 19 years age range has the highest percentage of unemployed individuals, with 18.6% or 369 of them being unemployed.
| Age Bracket | In Labor Force | Unemployed |
| 16 to 19 Years | 1,982 (44.7%) | 369 (18.6%) |
| 20 to 24 Years | 4,109 (82.2%) | 259 (6.3%) |
| 25 to 29 Years | 4,549 (84.3%) | 209 (4.6%) |
| 30 to 34 Years | 4,333 (79.9%) | 217 (5.0%) |
| 35 to 44 Years | 8,430 (80.0%) | 202 (2.4%) |
| 45 to 54 Years | 8,596 (74.7%) | 309 (3.6%) |
| 55 to 59 Years | 4,094 (66.5%) | 82 (2.0%) |
| 60 to 64 Years | 2,806 (47.4%) | 87 (3.1%) |
| 65 to 74 Years | 1,854 (19.1%) | 33 (1.8%) |
| 75 Years and over | 474 (6.9%) | 24 (5.1%) |
| Total | 41,224 (58.1%) | 1,773 (4.3%) |
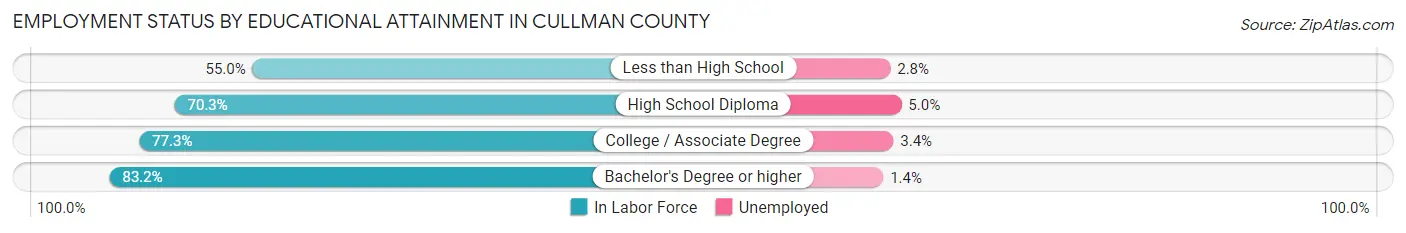
Employment Status by Educational Attainment in Cullman County
According to labor force statistics for Cullman County, 73.0% of individuals (32,805) out of the total population between 25 and 64 years of age (44,938) are in the labor force, with 3.4% or 1,115 of them being unemployed. The group with the highest labor force participation rate are those with the educational attainment of bachelor's degree or higher, with 83.2% or 6,689 individuals in the labor force. Within the labor force, individuals with high school diploma education have the highest percentage of unemployment, with 5.0% or 463 of them being unemployed.
| Educational Attainment | In Labor Force | Unemployed |
| Less than High School | 3,638 (55.0%) | 185 (2.8%) |
| High School Diploma | 9,263 (70.3%) | 659 (5.0%) |
| College / Associate Degree | 13,224 (77.3%) | 582 (3.4%) |
| Bachelor's Degree or higher | 6,689 (83.2%) | 113 (1.4%) |
| Total | 32,805 (73.0%) | 1,528 (3.4%) |
Employment Occupations by Sex in Cullman County
Management, Business, Science and Arts Occupations
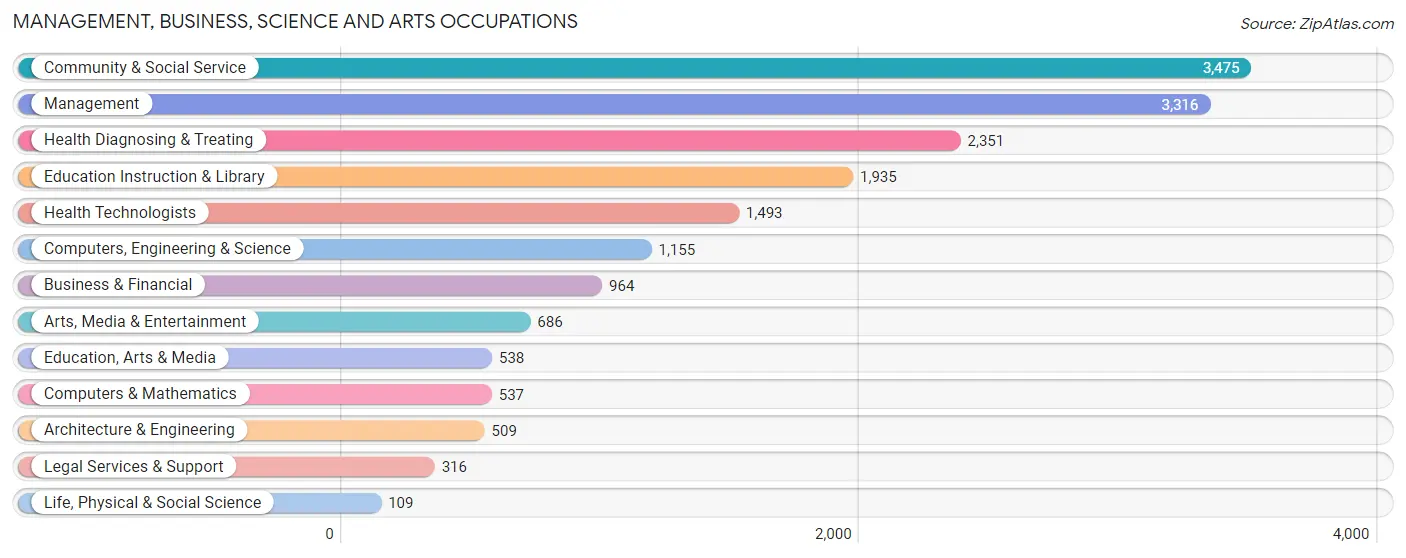
The most common Management, Business, Science and Arts occupations in Cullman County are Community & Social Service (3,475 | 8.8%), Management (3,316 | 8.4%), Health Diagnosing & Treating (2,351 | 6.0%), Education Instruction & Library (1,935 | 4.9%), and Health Technologists (1,493 | 3.8%).
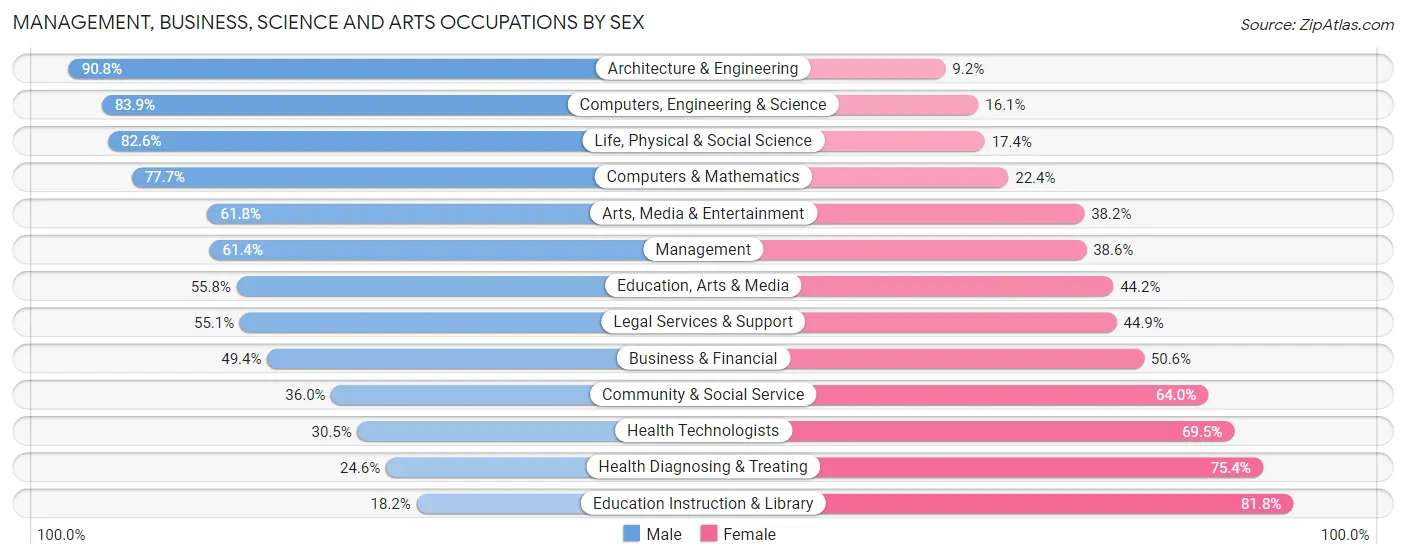
Management, Business, Science and Arts Occupations by Sex
Within the Management, Business, Science and Arts occupations in Cullman County, the most male-oriented occupations are Architecture & Engineering (90.8%), Computers, Engineering & Science (83.9%), and Life, Physical & Social Science (82.6%), while the most female-oriented occupations are Education Instruction & Library (81.8%), Health Diagnosing & Treating (75.4%), and Health Technologists (69.5%).
| Occupation | Male | Female |
| Management | 2,036 (61.4%) | 1,280 (38.6%) |
| Business & Financial | 476 (49.4%) | 488 (50.6%) |
| Computers, Engineering & Science | 969 (83.9%) | 186 (16.1%) |
| Computers & Mathematics | 417 (77.6%) | 120 (22.4%) |
| Architecture & Engineering | 462 (90.8%) | 47 (9.2%) |
| Life, Physical & Social Science | 90 (82.6%) | 19 (17.4%) |
| Community & Social Service | 1,251 (36.0%) | 2,224 (64.0%) |
| Education, Arts & Media | 300 (55.8%) | 238 (44.2%) |
| Legal Services & Support | 174 (55.1%) | 142 (44.9%) |
| Education Instruction & Library | 353 (18.2%) | 1,582 (81.8%) |
| Arts, Media & Entertainment | 424 (61.8%) | 262 (38.2%) |
| Health Diagnosing & Treating | 578 (24.6%) | 1,773 (75.4%) |
| Health Technologists | 456 (30.5%) | 1,037 (69.5%) |
| Total (Category) | 5,310 (47.1%) | 5,951 (52.8%) |
| Total (Overall) | 21,595 (54.7%) | 17,845 (45.3%) |
Services Occupations
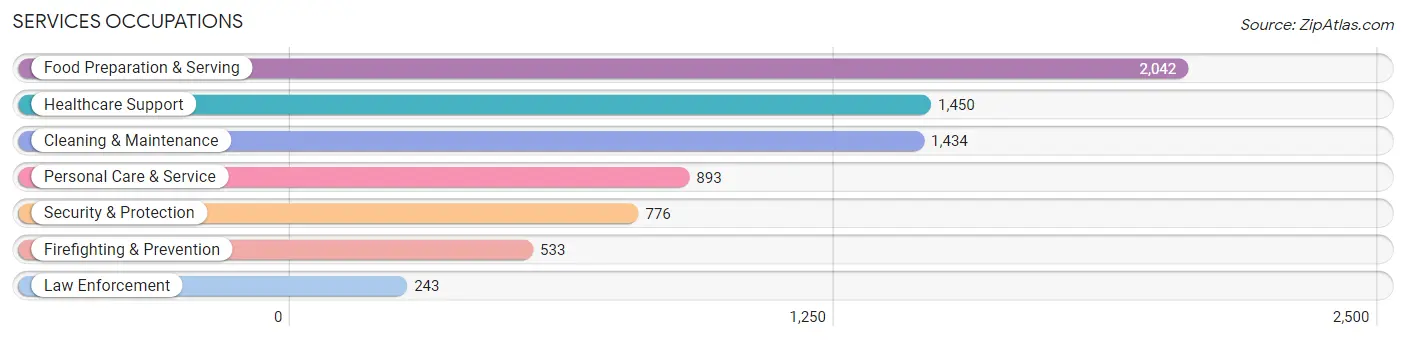
The most common Services occupations in Cullman County are Food Preparation & Serving (2,042 | 5.2%), Healthcare Support (1,450 | 3.7%), Cleaning & Maintenance (1,434 | 3.6%), Personal Care & Service (893 | 2.3%), and Security & Protection (776 | 2.0%).
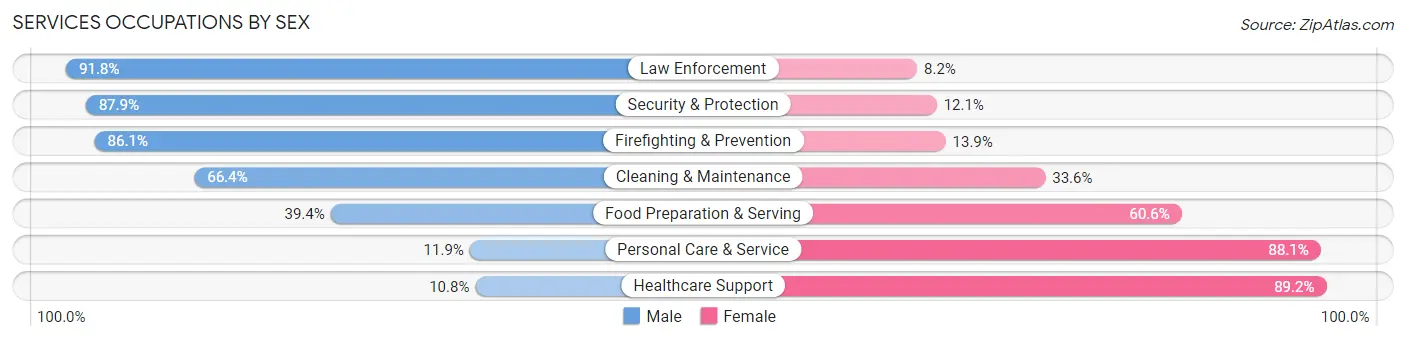
Services Occupations by Sex
Within the Services occupations in Cullman County, the most male-oriented occupations are Law Enforcement (91.8%), Security & Protection (87.9%), and Firefighting & Prevention (86.1%), while the most female-oriented occupations are Healthcare Support (89.2%), Personal Care & Service (88.1%), and Food Preparation & Serving (60.6%).
| Occupation | Male | Female |
| Healthcare Support | 156 (10.8%) | 1,294 (89.2%) |
| Security & Protection | 682 (87.9%) | 94 (12.1%) |
| Firefighting & Prevention | 459 (86.1%) | 74 (13.9%) |
| Law Enforcement | 223 (91.8%) | 20 (8.2%) |
| Food Preparation & Serving | 805 (39.4%) | 1,237 (60.6%) |
| Cleaning & Maintenance | 952 (66.4%) | 482 (33.6%) |
| Personal Care & Service | 106 (11.9%) | 787 (88.1%) |
| Total (Category) | 2,701 (41.0%) | 3,894 (59.0%) |
| Total (Overall) | 21,595 (54.7%) | 17,845 (45.3%) |
Sales and Office Occupations
The most common Sales and Office occupations in Cullman County are Sales & Related (4,532 | 11.5%), and Office & Administration (4,390 | 11.1%).

Sales and Office Occupations by Sex

| Occupation | Male | Female |
| Sales & Related | 2,111 (46.6%) | 2,421 (53.4%) |
| Office & Administration | 826 (18.8%) | 3,564 (81.2%) |
| Total (Category) | 2,937 (32.9%) | 5,985 (67.1%) |
| Total (Overall) | 21,595 (54.7%) | 17,845 (45.3%) |
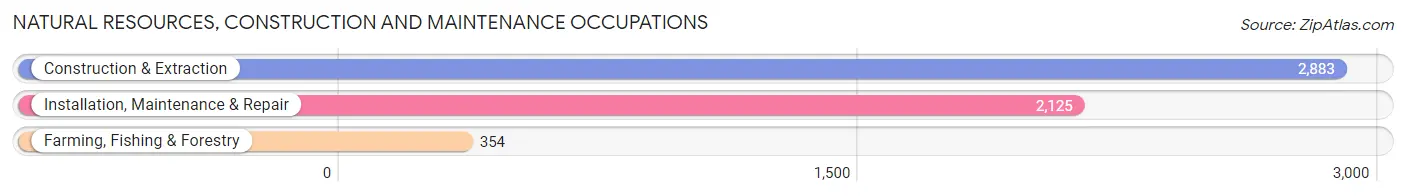
Natural Resources, Construction and Maintenance Occupations
The most common Natural Resources, Construction and Maintenance occupations in Cullman County are Construction & Extraction (2,883 | 7.3%), Installation, Maintenance & Repair (2,125 | 5.4%), and Farming, Fishing & Forestry (354 | 0.9%).
Natural Resources, Construction and Maintenance Occupations by Sex
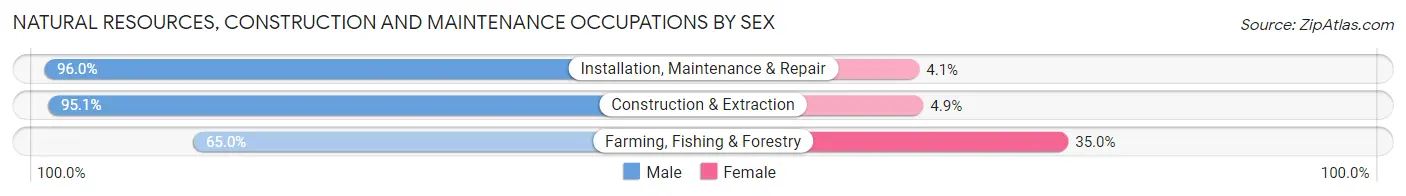
| Occupation | Male | Female |
| Farming, Fishing & Forestry | 230 (65.0%) | 124 (35.0%) |
| Construction & Extraction | 2,742 (95.1%) | 141 (4.9%) |
| Installation, Maintenance & Repair | 2,039 (96.0%) | 86 (4.1%) |
| Total (Category) | 5,011 (93.4%) | 351 (6.6%) |
| Total (Overall) | 21,595 (54.7%) | 17,845 (45.3%) |
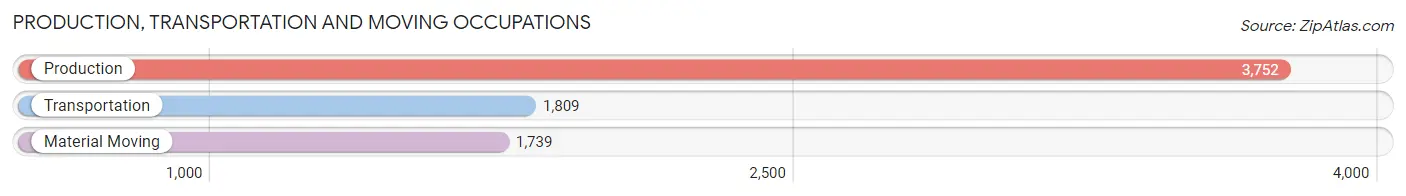
Production, Transportation and Moving Occupations
The most common Production, Transportation and Moving occupations in Cullman County are Production (3,752 | 9.5%), Transportation (1,809 | 4.6%), and Material Moving (1,739 | 4.4%).
Production, Transportation and Moving Occupations by Sex
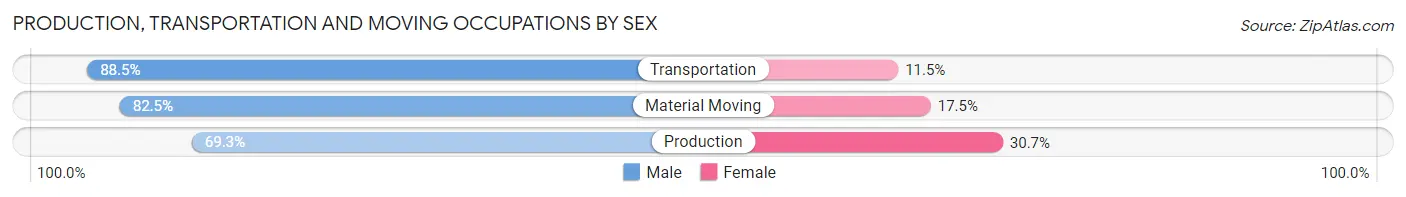
| Occupation | Male | Female |
| Production | 2,600 (69.3%) | 1,152 (30.7%) |
| Transportation | 1,601 (88.5%) | 208 (11.5%) |
| Material Moving | 1,435 (82.5%) | 304 (17.5%) |
| Total (Category) | 5,636 (77.2%) | 1,664 (22.8%) |
| Total (Overall) | 21,595 (54.7%) | 17,845 (45.3%) |
Employment Industries by Sex in Cullman County
Employment Industries in Cullman County
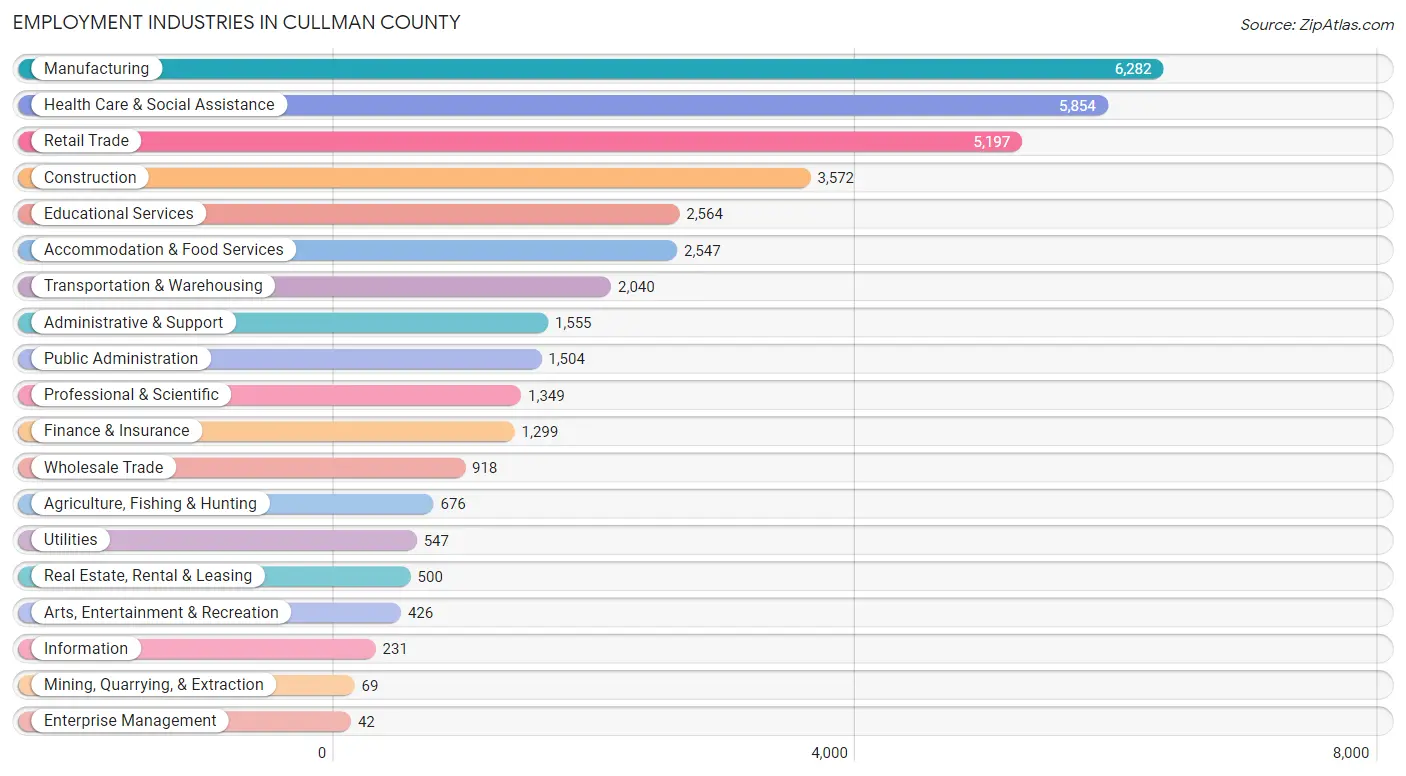
The major employment industries in Cullman County include Manufacturing (6,282 | 15.9%), Health Care & Social Assistance (5,854 | 14.8%), Retail Trade (5,197 | 13.2%), Construction (3,572 | 9.1%), and Educational Services (2,564 | 6.5%).
Employment Industries by Sex in Cullman County
The Cullman County industries that see more men than women are Mining, Quarrying, & Extraction (100.0%), Enterprise Management (100.0%), and Construction (93.1%), whereas the industries that tend to have a higher number of women are Health Care & Social Assistance (80.9%), Educational Services (73.3%), and Arts, Entertainment & Recreation (70.9%).
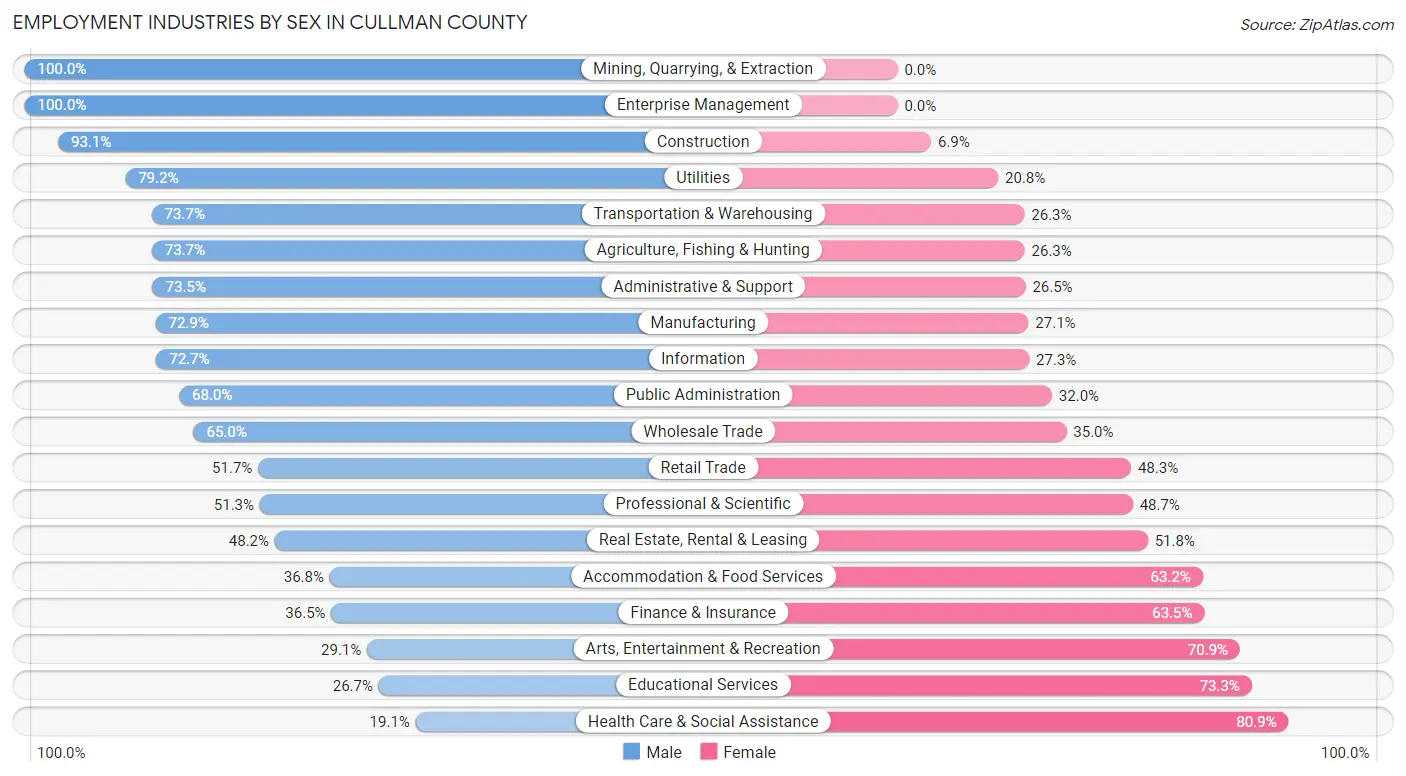
| Industry | Male | Female |
| Agriculture, Fishing & Hunting | 498 (73.7%) | 178 (26.3%) |
| Mining, Quarrying, & Extraction | 69 (100.0%) | 0 (0.0%) |
| Construction | 3,324 (93.1%) | 248 (6.9%) |
| Manufacturing | 4,579 (72.9%) | 1,703 (27.1%) |
| Wholesale Trade | 597 (65.0%) | 321 (35.0%) |
| Retail Trade | 2,685 (51.7%) | 2,512 (48.3%) |
| Transportation & Warehousing | 1,504 (73.7%) | 536 (26.3%) |
| Utilities | 433 (79.2%) | 114 (20.8%) |
| Information | 168 (72.7%) | 63 (27.3%) |
| Finance & Insurance | 474 (36.5%) | 825 (63.5%) |
| Real Estate, Rental & Leasing | 241 (48.2%) | 259 (51.8%) |
| Professional & Scientific | 692 (51.3%) | 657 (48.7%) |
| Enterprise Management | 42 (100.0%) | 0 (0.0%) |
| Administrative & Support | 1,143 (73.5%) | 412 (26.5%) |
| Educational Services | 684 (26.7%) | 1,880 (73.3%) |
| Health Care & Social Assistance | 1,116 (19.1%) | 4,738 (80.9%) |
| Arts, Entertainment & Recreation | 124 (29.1%) | 302 (70.9%) |
| Accommodation & Food Services | 938 (36.8%) | 1,609 (63.2%) |
| Public Administration | 1,023 (68.0%) | 481 (32.0%) |
| Total | 21,595 (54.7%) | 17,845 (45.3%) |
Education in Cullman County
School Enrollment in Cullman County
The most common levels of schooling among the 19,179 students in Cullman County are middle school (4,445 | 23.2%), high school (4,431 | 23.1%), and elementary school (4,334 | 22.6%).
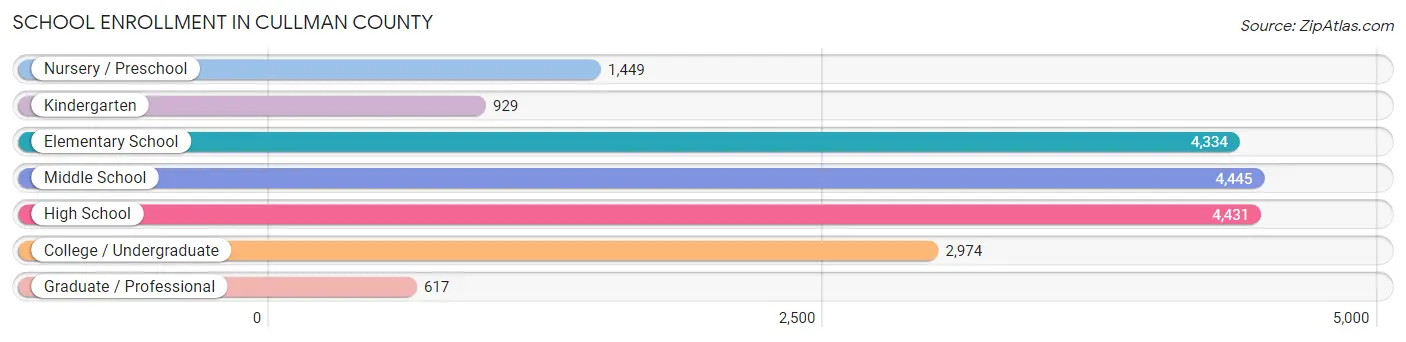
| School Level | # Students | % Students |
| Nursery / Preschool | 1,449 | 7.6% |
| Kindergarten | 929 | 4.8% |
| Elementary School | 4,334 | 22.6% |
| Middle School | 4,445 | 23.2% |
| High School | 4,431 | 23.1% |
| College / Undergraduate | 2,974 | 15.5% |
| Graduate / Professional | 617 | 3.2% |
| Total | 19,179 | 100.0% |
School Enrollment by Age by Funding Source in Cullman County
Out of a total of 19,179 students who are enrolled in schools in Cullman County, 2,417 (12.6%) attend a private institution, while the remaining 16,762 (87.4%) are enrolled in public schools. The age group of 3 to 4 year olds has the highest likelihood of being enrolled in private schools, with 264 (27.4% in the age bracket) enrolled. Conversely, the age group of 20 to 24 year olds has the lowest likelihood of being enrolled in a private school, with 1,554 (93.0% in the age bracket) attending a public institution.
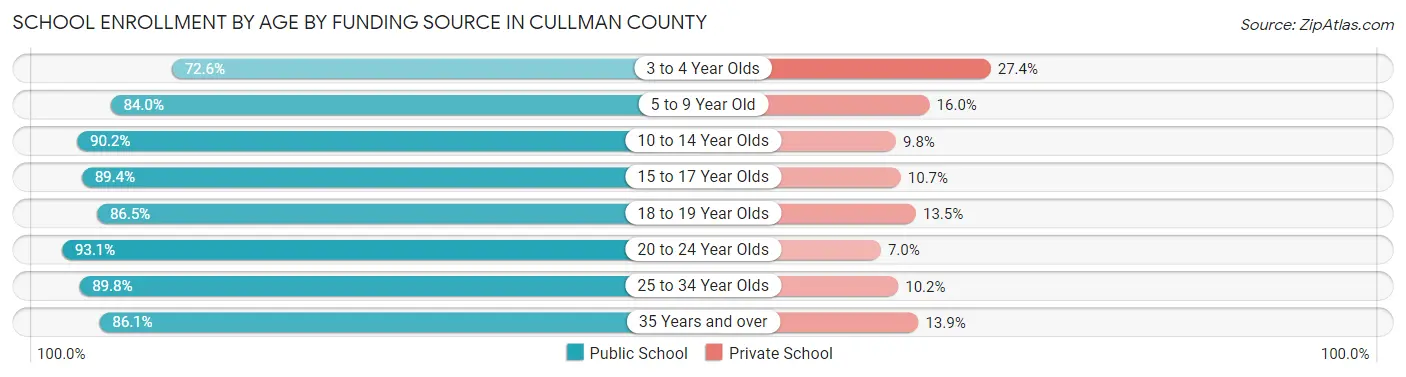
| Age Bracket | Public School | Private School |
| 3 to 4 Year Olds | 699 (72.6%) | 264 (27.4%) |
| 5 to 9 Year Old | 4,294 (84.0%) | 819 (16.0%) |
| 10 to 14 Year Olds | 4,837 (90.2%) | 524 (9.8%) |
| 15 to 17 Year Olds | 3,054 (89.3%) | 364 (10.6%) |
| 18 to 19 Year Olds | 1,117 (86.5%) | 174 (13.5%) |
| 20 to 24 Year Olds | 1,554 (93.0%) | 116 (7.0%) |
| 25 to 34 Year Olds | 644 (89.8%) | 73 (10.2%) |
| 35 Years and over | 556 (86.1%) | 90 (13.9%) |
| Total | 16,762 (87.4%) | 2,417 (12.6%) |
Educational Attainment by Field of Study in Cullman County
Education (3,128 | 26.3%), business (2,802 | 23.6%), science & technology (1,226 | 10.3%), arts & humanities (801 | 6.7%), and liberal arts & history (785 | 6.6%) are the most common fields of study among 11,887 individuals in Cullman County who have obtained a bachelor's degree or higher.
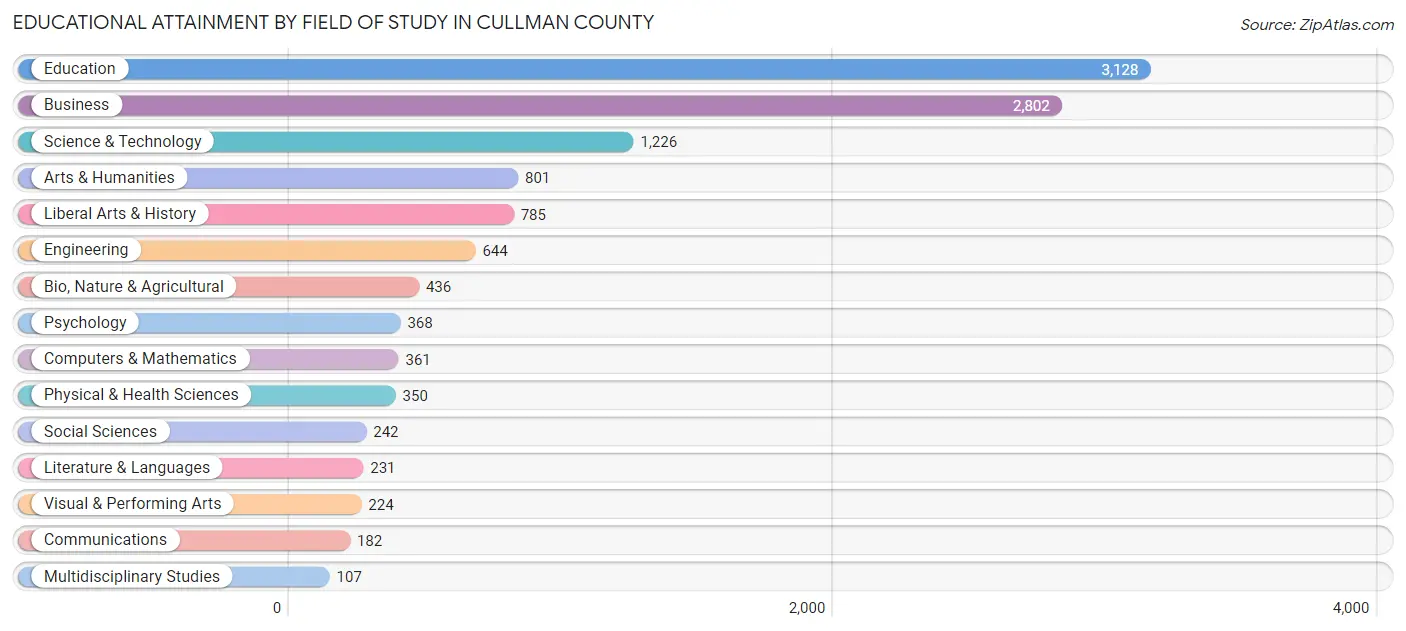
| Field of Study | # Graduates | % Graduates |
| Computers & Mathematics | 361 | 3.0% |
| Bio, Nature & Agricultural | 436 | 3.7% |
| Physical & Health Sciences | 350 | 2.9% |
| Psychology | 368 | 3.1% |
| Social Sciences | 242 | 2.0% |
| Engineering | 644 | 5.4% |
| Multidisciplinary Studies | 107 | 0.9% |
| Science & Technology | 1,226 | 10.3% |
| Business | 2,802 | 23.6% |
| Education | 3,128 | 26.3% |
| Literature & Languages | 231 | 1.9% |
| Liberal Arts & History | 785 | 6.6% |
| Visual & Performing Arts | 224 | 1.9% |
| Communications | 182 | 1.5% |
| Arts & Humanities | 801 | 6.7% |
| Total | 11,887 | 100.0% |
Transportation & Commute in Cullman County
Vehicle Availability by Sex in Cullman County
The most prevalent vehicle ownership categories in Cullman County are males with 2 vehicles (7,282, accounting for 34.3%) and females with 2 vehicles (5,720, making up 42.0%).
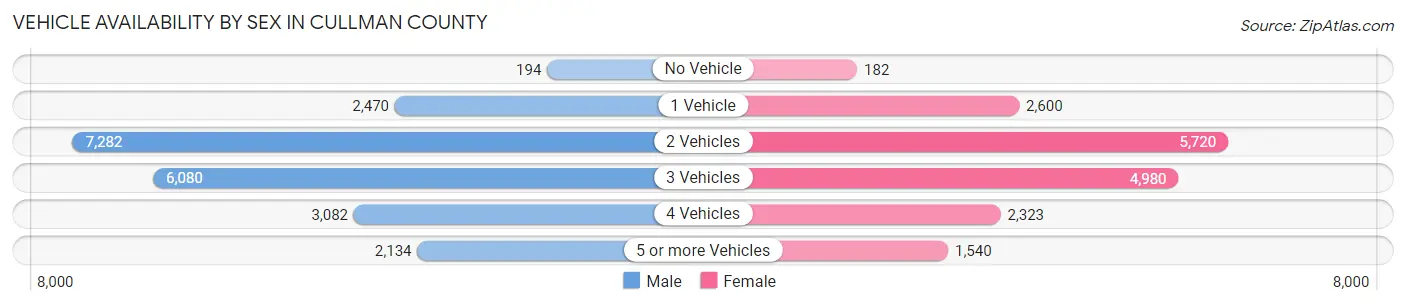
| Vehicles Available | Male | Female |
| No Vehicle | 194 (0.9%) | 182 (1.1%) |
| 1 Vehicle | 2,470 (11.6%) | 2,600 (15.0%) |
| 2 Vehicles | 7,282 (34.3%) | 5,720 (33.0%) |
| 3 Vehicles | 6,080 (28.6%) | 4,980 (28.7%) |
| 4 Vehicles | 3,082 (14.5%) | 2,323 (13.4%) |
| 5 or more Vehicles | 2,134 (10.1%) | 1,540 (8.9%) |
| Total | 21,242 (100.0%) | 17,345 (100.0%) |
Commute Time in Cullman County
The most frequently occuring commute durations in Cullman County are 15 to 19 minutes (5,813 commuters, 15.4%), 10 to 14 minutes (5,515 commuters, 14.6%), and 20 to 24 minutes (4,902 commuters, 13.0%).
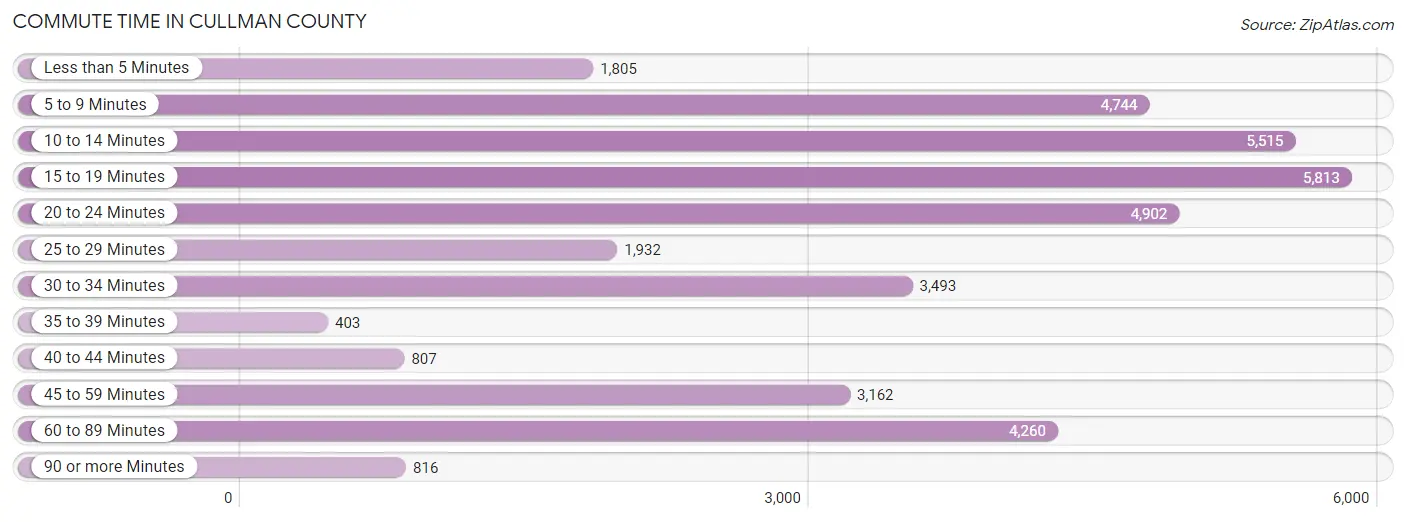
| Commute Time | # Commuters | % Commuters |
| Less than 5 Minutes | 1,805 | 4.8% |
| 5 to 9 Minutes | 4,744 | 12.6% |
| 10 to 14 Minutes | 5,515 | 14.6% |
| 15 to 19 Minutes | 5,813 | 15.4% |
| 20 to 24 Minutes | 4,902 | 13.0% |
| 25 to 29 Minutes | 1,932 | 5.1% |
| 30 to 34 Minutes | 3,493 | 9.3% |
| 35 to 39 Minutes | 403 | 1.1% |
| 40 to 44 Minutes | 807 | 2.1% |
| 45 to 59 Minutes | 3,162 | 8.4% |
| 60 to 89 Minutes | 4,260 | 11.3% |
| 90 or more Minutes | 816 | 2.2% |
Commute Time by Sex in Cullman County
The most common commute times in Cullman County are 60 to 89 minutes (3,165 commuters, 15.2%) for males and 15 to 19 minutes (2,867 commuters, 17.0%) for females.
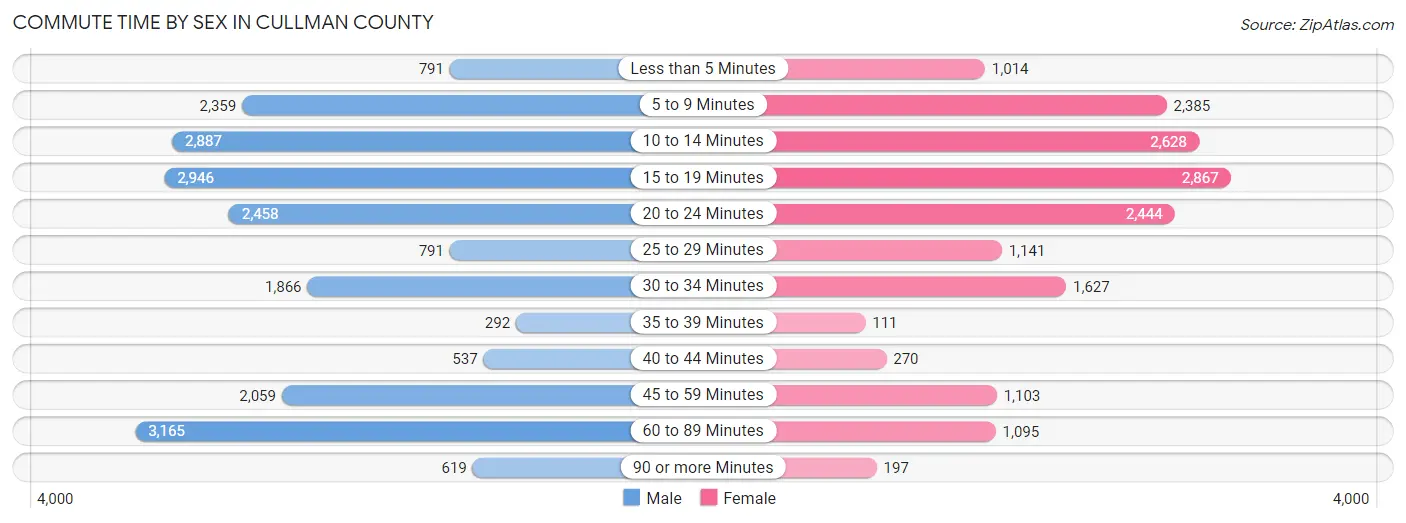
| Commute Time | Male | Female |
| Less than 5 Minutes | 791 (3.8%) | 1,014 (6.0%) |
| 5 to 9 Minutes | 2,359 (11.4%) | 2,385 (14.1%) |
| 10 to 14 Minutes | 2,887 (13.9%) | 2,628 (15.6%) |
| 15 to 19 Minutes | 2,946 (14.2%) | 2,867 (17.0%) |
| 20 to 24 Minutes | 2,458 (11.8%) | 2,444 (14.5%) |
| 25 to 29 Minutes | 791 (3.8%) | 1,141 (6.8%) |
| 30 to 34 Minutes | 1,866 (9.0%) | 1,627 (9.6%) |
| 35 to 39 Minutes | 292 (1.4%) | 111 (0.7%) |
| 40 to 44 Minutes | 537 (2.6%) | 270 (1.6%) |
| 45 to 59 Minutes | 2,059 (9.9%) | 1,103 (6.5%) |
| 60 to 89 Minutes | 3,165 (15.2%) | 1,095 (6.5%) |
| 90 or more Minutes | 619 (3.0%) | 197 (1.2%) |
Time of Departure to Work by Sex in Cullman County
The most frequent times of departure to work in Cullman County are 7:00 AM to 7:29 AM (2,818, 13.6%) for males and 7:00 AM to 7:29 AM (3,079, 18.2%) for females.
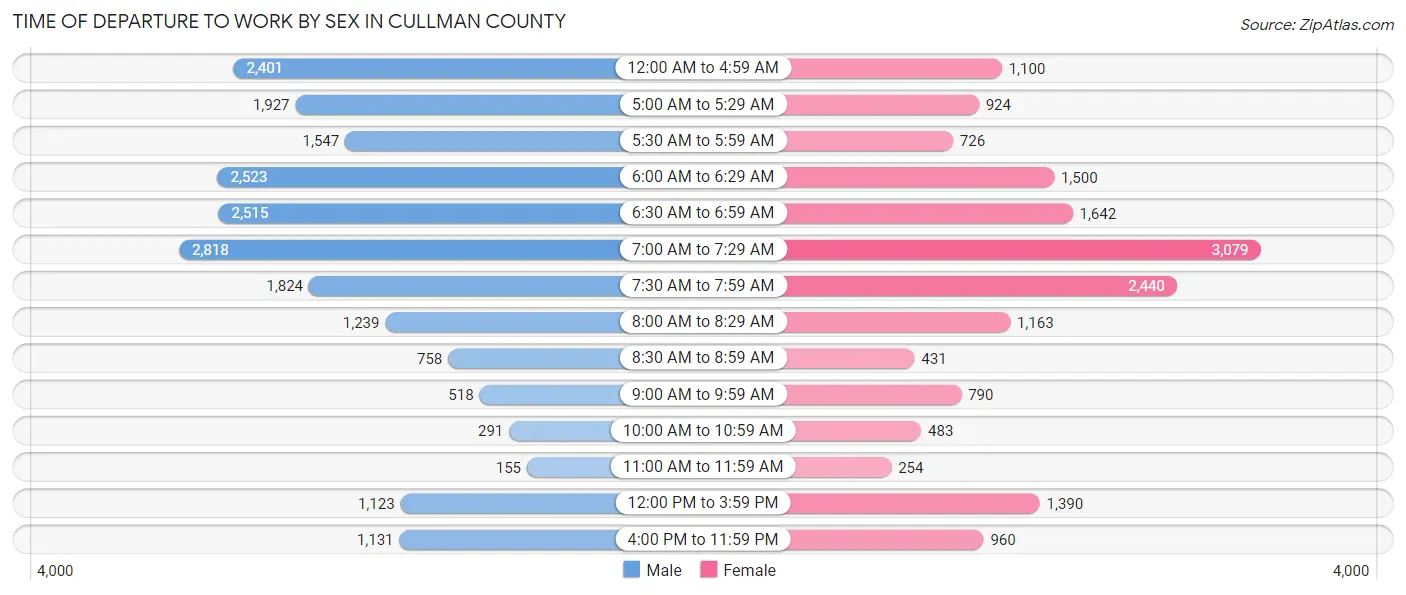
| Time of Departure | Male | Female |
| 12:00 AM to 4:59 AM | 2,401 (11.6%) | 1,100 (6.5%) |
| 5:00 AM to 5:29 AM | 1,927 (9.3%) | 924 (5.5%) |
| 5:30 AM to 5:59 AM | 1,547 (7.4%) | 726 (4.3%) |
| 6:00 AM to 6:29 AM | 2,523 (12.1%) | 1,500 (8.9%) |
| 6:30 AM to 6:59 AM | 2,515 (12.1%) | 1,642 (9.7%) |
| 7:00 AM to 7:29 AM | 2,818 (13.6%) | 3,079 (18.2%) |
| 7:30 AM to 7:59 AM | 1,824 (8.8%) | 2,440 (14.4%) |
| 8:00 AM to 8:29 AM | 1,239 (6.0%) | 1,163 (6.9%) |
| 8:30 AM to 8:59 AM | 758 (3.6%) | 431 (2.5%) |
| 9:00 AM to 9:59 AM | 518 (2.5%) | 790 (4.7%) |
| 10:00 AM to 10:59 AM | 291 (1.4%) | 483 (2.9%) |
| 11:00 AM to 11:59 AM | 155 (0.7%) | 254 (1.5%) |
| 12:00 PM to 3:59 PM | 1,123 (5.4%) | 1,390 (8.2%) |
| 4:00 PM to 11:59 PM | 1,131 (5.4%) | 960 (5.7%) |
| Total | 20,770 (100.0%) | 16,882 (100.0%) |
Housing Occupancy in Cullman County
Occupancy by Ownership in Cullman County
Of the total 33,649 dwellings in Cullman County, owner-occupied units account for 25,640 (76.2%), while renter-occupied units make up 8,009 (23.8%).
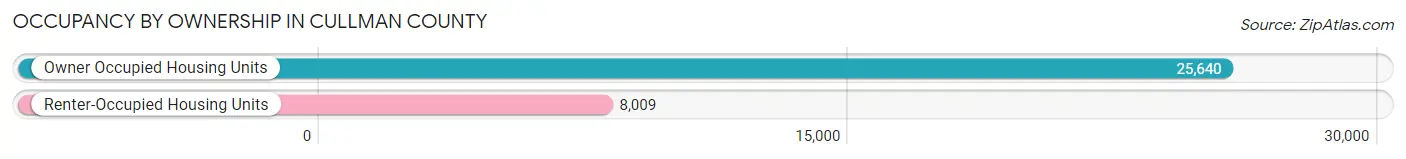
| Occupancy | # Housing Units | % Housing Units |
| Owner Occupied Housing Units | 25,640 | 76.2% |
| Renter-Occupied Housing Units | 8,009 | 23.8% |
| Total Occupied Housing Units | 33,649 | 100.0% |
Occupancy by Household Size in Cullman County
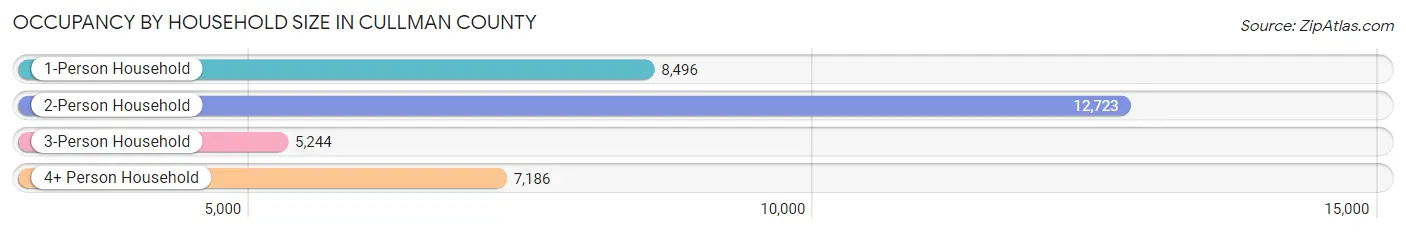
| Household Size | # Housing Units | % Housing Units |
| 1-Person Household | 8,496 | 25.3% |
| 2-Person Household | 12,723 | 37.8% |
| 3-Person Household | 5,244 | 15.6% |
| 4+ Person Household | 7,186 | 21.4% |
| Total Housing Units | 33,649 | 100.0% |
Occupancy by Ownership by Household Size in Cullman County
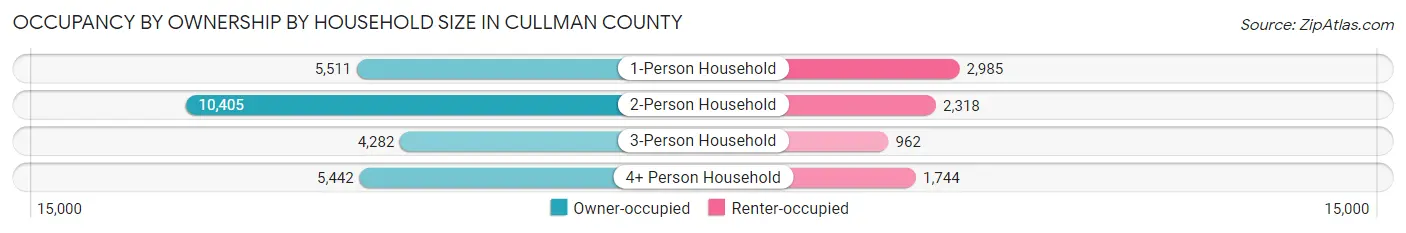
| Household Size | Owner-occupied | Renter-occupied |
| 1-Person Household | 5,511 (64.9%) | 2,985 (35.1%) |
| 2-Person Household | 10,405 (81.8%) | 2,318 (18.2%) |
| 3-Person Household | 4,282 (81.7%) | 962 (18.3%) |
| 4+ Person Household | 5,442 (75.7%) | 1,744 (24.3%) |
| Total Housing Units | 25,640 (76.2%) | 8,009 (23.8%) |
Occupancy by Educational Attainment in Cullman County
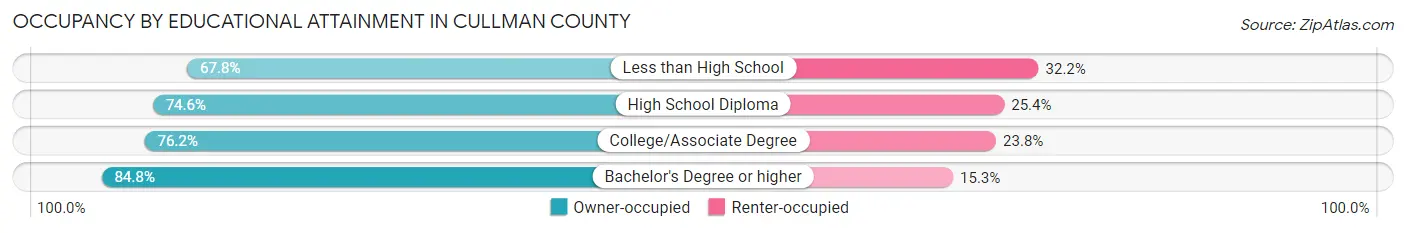
| Household Size | Owner-occupied | Renter-occupied |
| Less than High School | 3,209 (67.8%) | 1,525 (32.2%) |
| High School Diploma | 7,553 (74.6%) | 2,572 (25.4%) |
| College/Associate Degree | 9,333 (76.2%) | 2,914 (23.8%) |
| Bachelor's Degree or higher | 5,545 (84.8%) | 998 (15.2%) |
Occupancy by Age of Householder in Cullman County
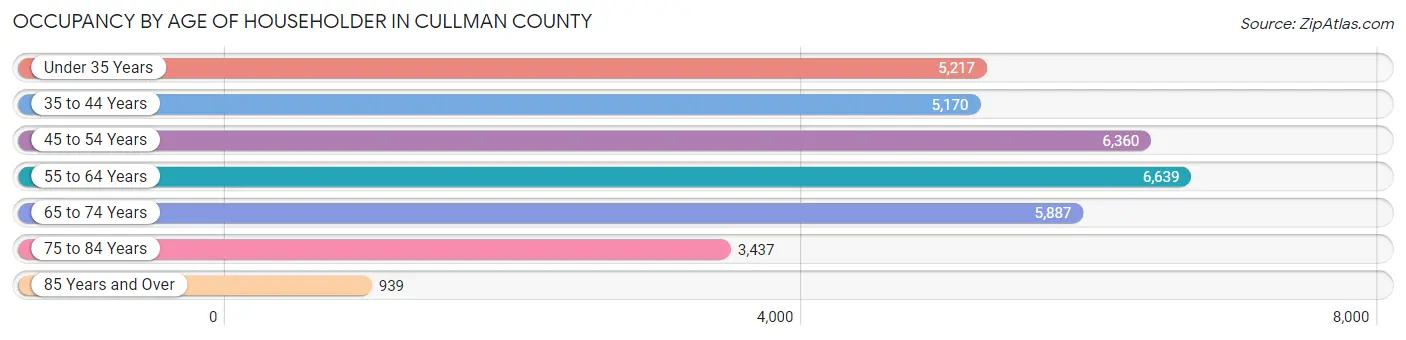
| Age Bracket | # Households | % Households |
| Under 35 Years | 5,217 | 15.5% |
| 35 to 44 Years | 5,170 | 15.4% |
| 45 to 54 Years | 6,360 | 18.9% |
| 55 to 64 Years | 6,639 | 19.7% |
| 65 to 74 Years | 5,887 | 17.5% |
| 75 to 84 Years | 3,437 | 10.2% |
| 85 Years and Over | 939 | 2.8% |
| Total | 33,649 | 100.0% |
Housing Finances in Cullman County
Median Income by Occupancy in Cullman County
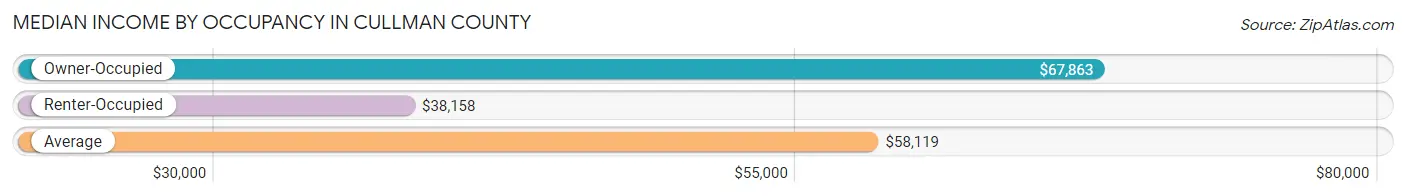
| Occupancy Type | # Households | Median Income |
| Owner-Occupied | 25,640 (76.2%) | $67,863 |
| Renter-Occupied | 8,009 (23.8%) | $38,158 |
| Average | 33,649 (100.0%) | $58,119 |
Occupancy by Householder Income Bracket in Cullman County
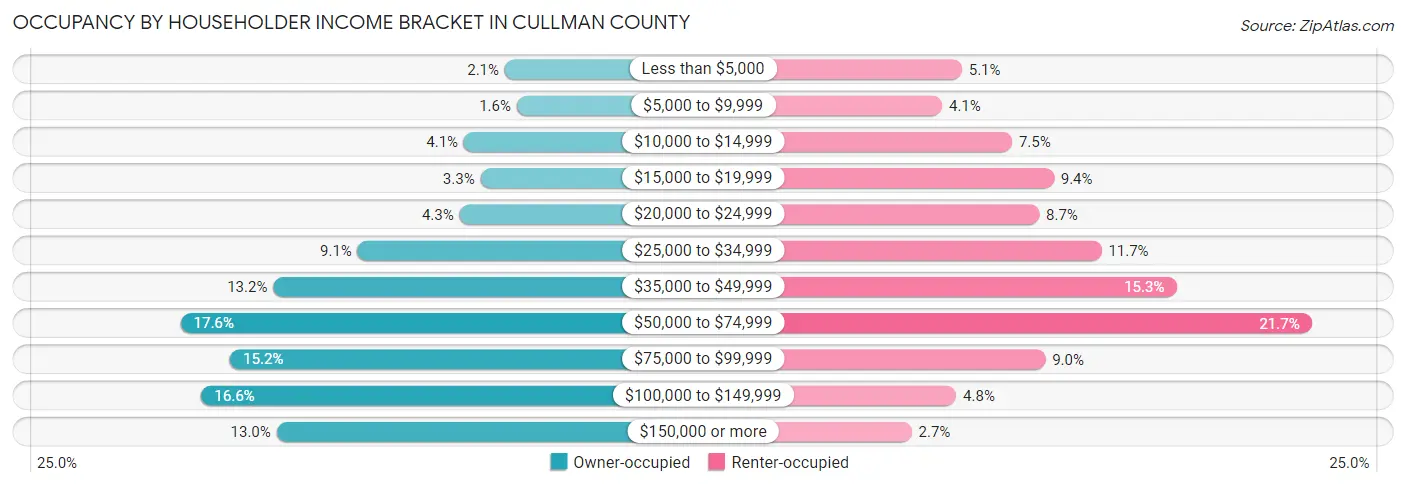
| Income Bracket | Owner-occupied | Renter-occupied |
| Less than $5,000 | 546 (2.1%) | 405 (5.1%) |
| $5,000 to $9,999 | 399 (1.6%) | 330 (4.1%) |
| $10,000 to $14,999 | 1,045 (4.1%) | 597 (7.4%) |
| $15,000 to $19,999 | 843 (3.3%) | 756 (9.4%) |
| $20,000 to $24,999 | 1,100 (4.3%) | 700 (8.7%) |
| $25,000 to $34,999 | 2,343 (9.1%) | 938 (11.7%) |
| $35,000 to $49,999 | 3,373 (13.2%) | 1,223 (15.3%) |
| $50,000 to $74,999 | 4,505 (17.6%) | 1,739 (21.7%) |
| $75,000 to $99,999 | 3,901 (15.2%) | 723 (9.0%) |
| $100,000 to $149,999 | 4,251 (16.6%) | 384 (4.8%) |
| $150,000 or more | 3,334 (13.0%) | 214 (2.7%) |
| Total | 25,640 (100.0%) | 8,009 (100.0%) |
Monthly Housing Cost Tiers in Cullman County
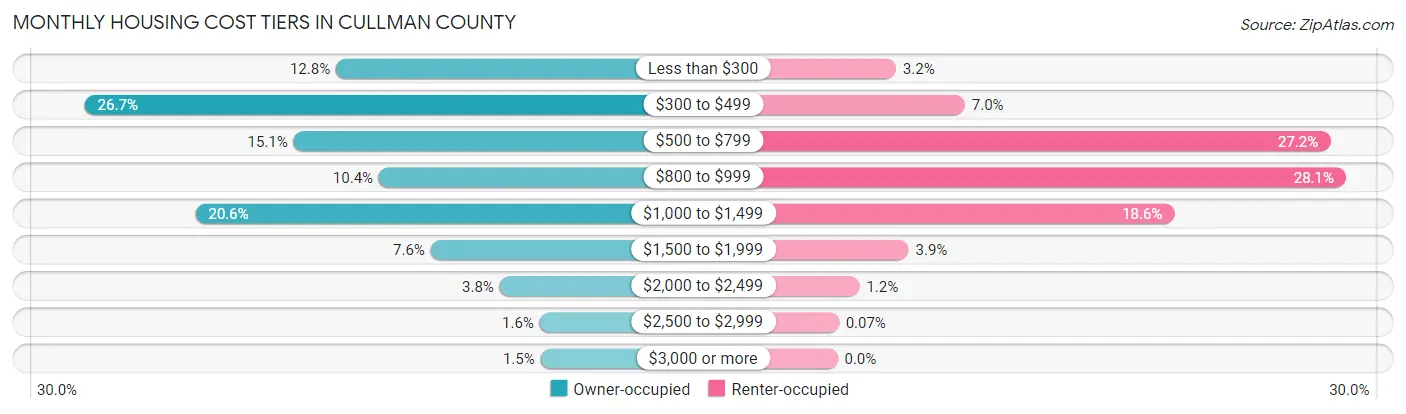
| Monthly Cost | Owner-occupied | Renter-occupied |
| Less than $300 | 3,282 (12.8%) | 259 (3.2%) |
| $300 to $499 | 6,842 (26.7%) | 564 (7.0%) |
| $500 to $799 | 3,883 (15.1%) | 2,179 (27.2%) |
| $800 to $999 | 2,675 (10.4%) | 2,249 (28.1%) |
| $1,000 to $1,499 | 5,273 (20.6%) | 1,490 (18.6%) |
| $1,500 to $1,999 | 1,941 (7.6%) | 315 (3.9%) |
| $2,000 to $2,499 | 963 (3.8%) | 98 (1.2%) |
| $2,500 to $2,999 | 397 (1.5%) | 6 (0.1%) |
| $3,000 or more | 384 (1.5%) | 0 (0.0%) |
| Total | 25,640 (100.0%) | 8,009 (100.0%) |
Physical Housing Characteristics in Cullman County
Housing Structures in Cullman County
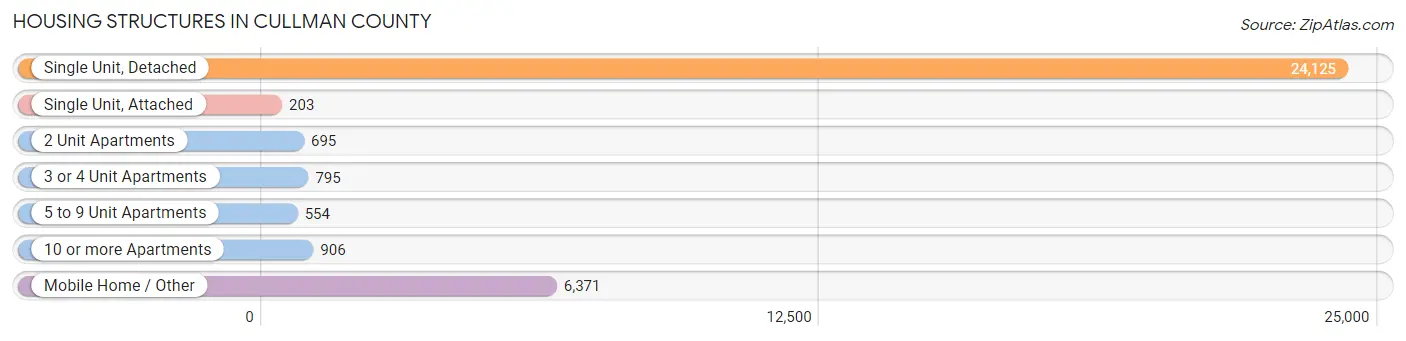
| Structure Type | # Housing Units | % Housing Units |
| Single Unit, Detached | 24,125 | 71.7% |
| Single Unit, Attached | 203 | 0.6% |
| 2 Unit Apartments | 695 | 2.1% |
| 3 or 4 Unit Apartments | 795 | 2.4% |
| 5 to 9 Unit Apartments | 554 | 1.7% |
| 10 or more Apartments | 906 | 2.7% |
| Mobile Home / Other | 6,371 | 18.9% |
| Total | 33,649 | 100.0% |
Housing Structures by Occupancy in Cullman County
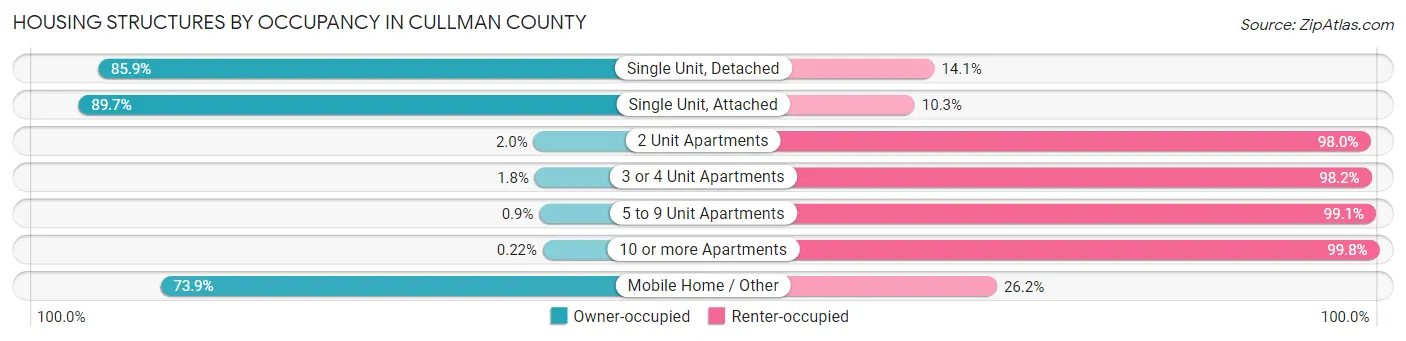
| Structure Type | Owner-occupied | Renter-occupied |
| Single Unit, Detached | 20,718 (85.9%) | 3,407 (14.1%) |
| Single Unit, Attached | 182 (89.7%) | 21 (10.3%) |
| 2 Unit Apartments | 14 (2.0%) | 681 (98.0%) |
| 3 or 4 Unit Apartments | 14 (1.8%) | 781 (98.2%) |
| 5 to 9 Unit Apartments | 5 (0.9%) | 549 (99.1%) |
| 10 or more Apartments | 2 (0.2%) | 904 (99.8%) |
| Mobile Home / Other | 4,705 (73.9%) | 1,666 (26.2%) |
| Total | 25,640 (76.2%) | 8,009 (23.8%) |
Housing Structures by Number of Rooms in Cullman County
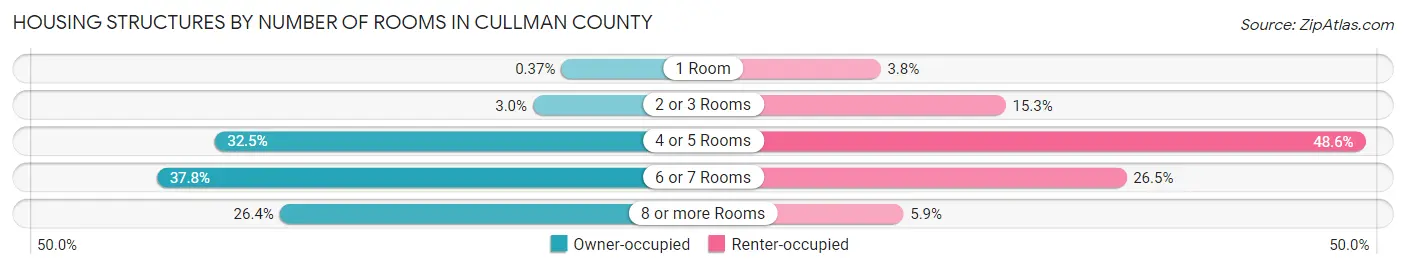
| Number of Rooms | Owner-occupied | Renter-occupied |
| 1 Room | 94 (0.4%) | 300 (3.7%) |
| 2 or 3 Rooms | 766 (3.0%) | 1,227 (15.3%) |
| 4 or 5 Rooms | 8,321 (32.5%) | 3,892 (48.6%) |
| 6 or 7 Rooms | 9,688 (37.8%) | 2,121 (26.5%) |
| 8 or more Rooms | 6,771 (26.4%) | 469 (5.9%) |
| Total | 25,640 (100.0%) | 8,009 (100.0%) |
Housing Structure by Heating Type in Cullman County
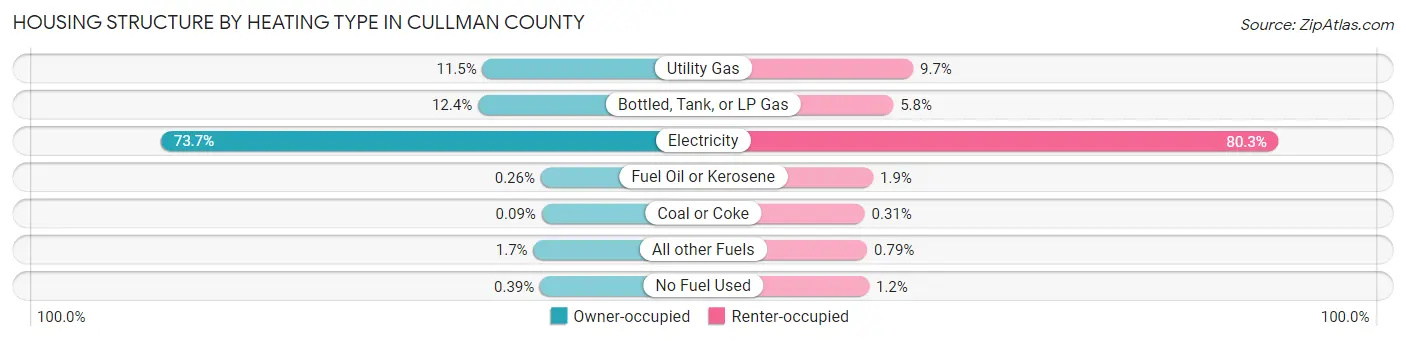
| Heating Type | Owner-occupied | Renter-occupied |
| Utility Gas | 2,949 (11.5%) | 775 (9.7%) |
| Bottled, Tank, or LP Gas | 3,177 (12.4%) | 467 (5.8%) |
| Electricity | 18,892 (73.7%) | 6,431 (80.3%) |
| Fuel Oil or Kerosene | 67 (0.3%) | 155 (1.9%) |
| Coal or Coke | 24 (0.1%) | 25 (0.3%) |
| All other Fuels | 430 (1.7%) | 63 (0.8%) |
| No Fuel Used | 101 (0.4%) | 93 (1.2%) |
| Total | 25,640 (100.0%) | 8,009 (100.0%) |
Household Vehicle Usage in Cullman County
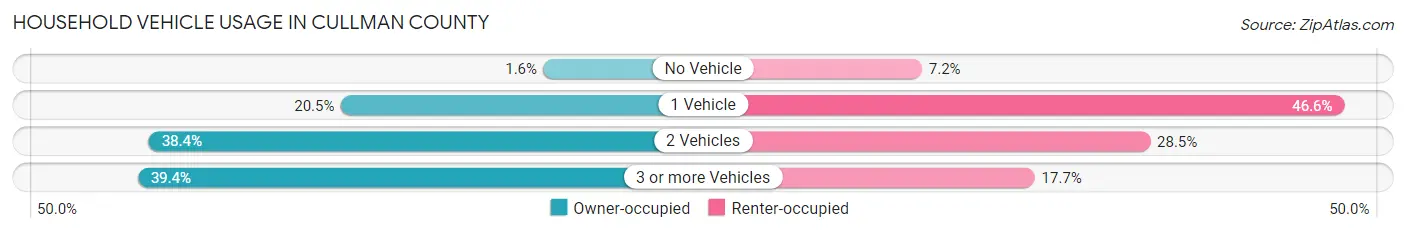
| Vehicles per Household | Owner-occupied | Renter-occupied |
| No Vehicle | 415 (1.6%) | 575 (7.2%) |
| 1 Vehicle | 5,264 (20.5%) | 3,734 (46.6%) |
| 2 Vehicles | 9,849 (38.4%) | 2,282 (28.5%) |
| 3 or more Vehicles | 10,112 (39.4%) | 1,418 (17.7%) |
| Total | 25,640 (100.0%) | 8,009 (100.0%) |
Real Estate & Mortgages in Cullman County
Real Estate and Mortgage Overview in Cullman County
| Characteristic | Without Mortgage | With Mortgage |
| Housing Units | 13,431 | 12,209 |
| Median Property Value | $150,500 | $179,900 |
| Median Household Income | $48,498 | $2,275 |
| Monthly Housing Costs | $399 | $368 |
| Real Estate Taxes | $355 | $1,249 |
Property Value by Mortgage Status in Cullman County
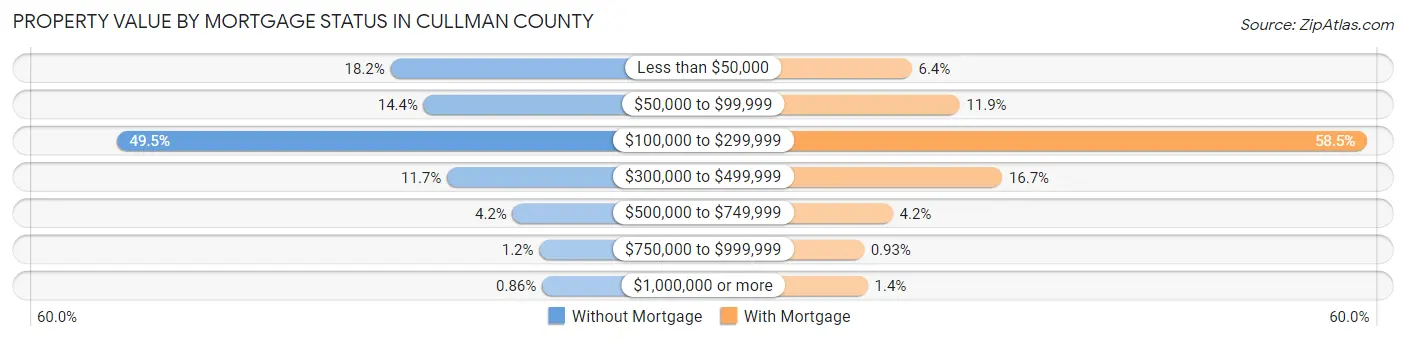
| Property Value | Without Mortgage | With Mortgage |
| Less than $50,000 | 2,441 (18.2%) | 781 (6.4%) |
| $50,000 to $99,999 | 1,932 (14.4%) | 1,449 (11.9%) |
| $100,000 to $299,999 | 6,645 (49.5%) | 7,138 (58.5%) |
| $300,000 to $499,999 | 1,573 (11.7%) | 2,043 (16.7%) |
| $500,000 to $749,999 | 567 (4.2%) | 516 (4.2%) |
| $750,000 to $999,999 | 157 (1.2%) | 114 (0.9%) |
| $1,000,000 or more | 116 (0.9%) | 168 (1.4%) |
| Total | 13,431 (100.0%) | 12,209 (100.0%) |
Household Income by Mortgage Status in Cullman County
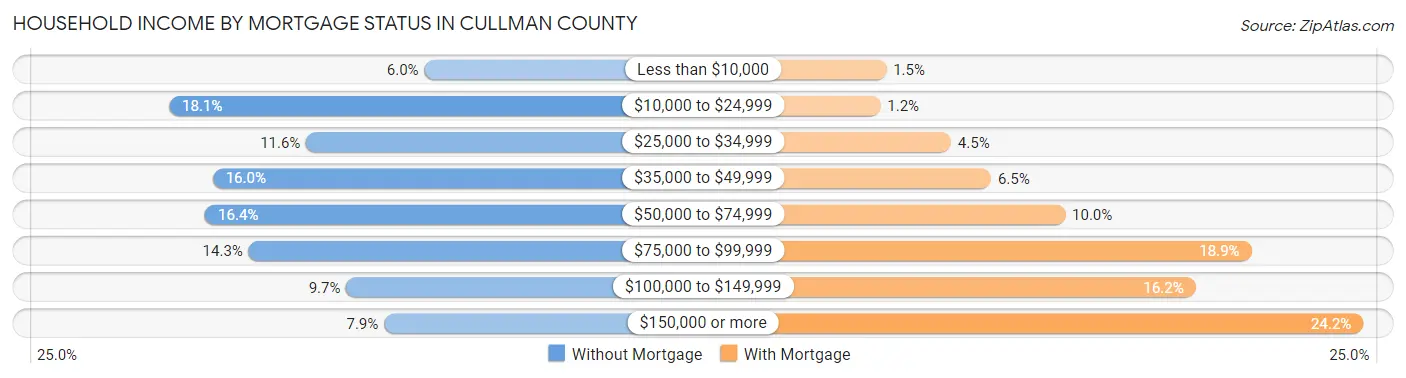
| Household Income | Without Mortgage | With Mortgage |
| Less than $10,000 | 801 (6.0%) | 178 (1.5%) |
| $10,000 to $24,999 | 2,434 (18.1%) | 144 (1.2%) |
| $25,000 to $34,999 | 1,556 (11.6%) | 554 (4.5%) |
| $35,000 to $49,999 | 2,154 (16.0%) | 787 (6.5%) |
| $50,000 to $74,999 | 2,203 (16.4%) | 1,219 (10.0%) |
| $75,000 to $99,999 | 1,924 (14.3%) | 2,302 (18.9%) |
| $100,000 to $149,999 | 1,300 (9.7%) | 1,977 (16.2%) |
| $150,000 or more | 1,059 (7.9%) | 2,951 (24.2%) |
| Total | 13,431 (100.0%) | 12,209 (100.0%) |
Property Value to Household Income Ratio in Cullman County
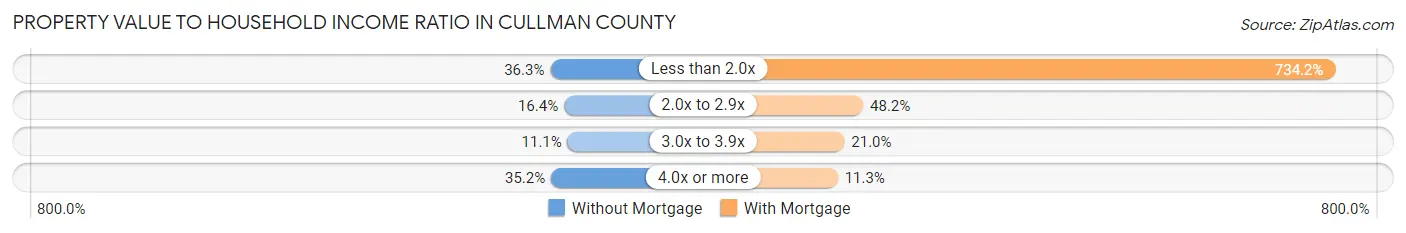
| Value-to-Income Ratio | Without Mortgage | With Mortgage |
| Less than 2.0x | 4,876 (36.3%) | 89,635 (734.2%) |
| 2.0x to 2.9x | 2,197 (16.4%) | 5,888 (48.2%) |
| 3.0x to 3.9x | 1,487 (11.1%) | 2,558 (20.9%) |
| 4.0x or more | 4,721 (35.1%) | 1,379 (11.3%) |
| Total | 13,431 (100.0%) | 12,209 (100.0%) |
Real Estate Taxes by Mortgage Status in Cullman County
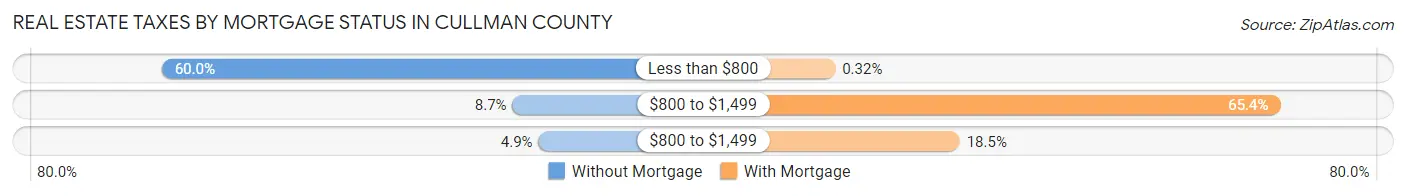
| Property Taxes | Without Mortgage | With Mortgage |
| Less than $800 | 8,053 (60.0%) | 39 (0.3%) |
| $800 to $1,499 | 1,171 (8.7%) | 7,978 (65.3%) |
| $800 to $1,499 | 661 (4.9%) | 2,260 (18.5%) |
| Total | 13,431 (100.0%) | 12,209 (100.0%) |
Health & Disability in Cullman County
Health Insurance Coverage by Age in Cullman County
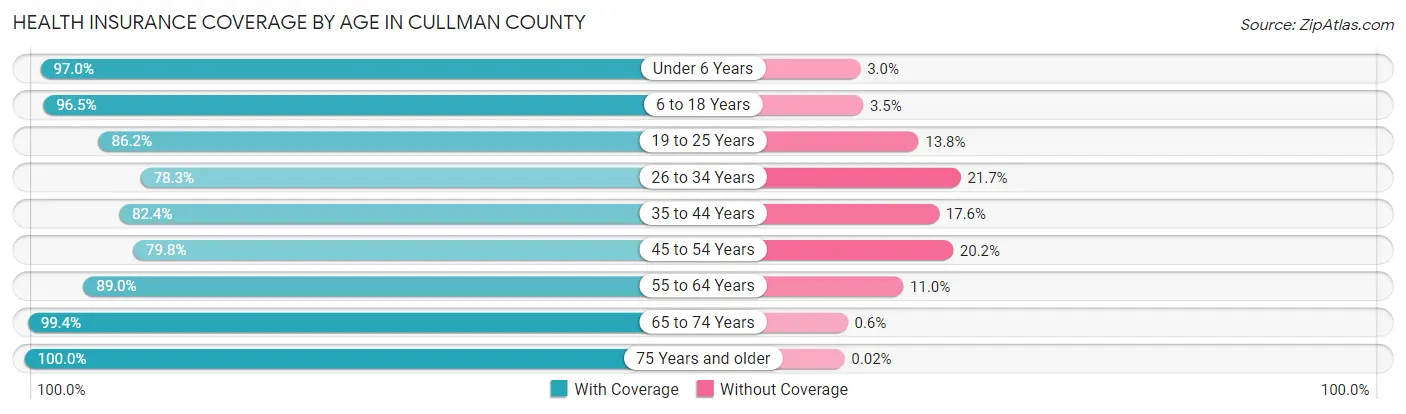
| Age Bracket | With Coverage | Without Coverage |
| Under 6 Years | 6,134 (97.0%) | 188 (3.0%) |
| 6 to 18 Years | 13,929 (96.5%) | 502 (3.5%) |
| 19 to 25 Years | 6,018 (86.2%) | 964 (13.8%) |
| 26 to 34 Years | 7,543 (78.3%) | 2,085 (21.7%) |
| 35 to 44 Years | 8,641 (82.4%) | 1,850 (17.6%) |
| 45 to 54 Years | 9,075 (79.8%) | 2,303 (20.2%) |
| 55 to 64 Years | 10,670 (89.0%) | 1,315 (11.0%) |
| 65 to 74 Years | 9,544 (99.4%) | 58 (0.6%) |
| 75 Years and older | 6,622 (100.0%) | 1 (0.0%) |
| Total | 78,176 (89.4%) | 9,266 (10.6%) |
Health Insurance Coverage by Citizenship Status in Cullman County
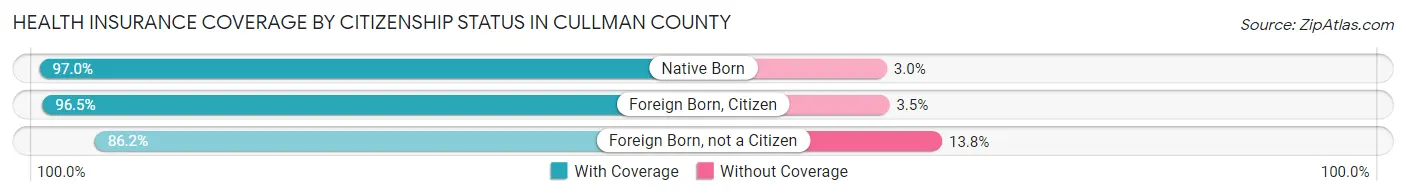
| Citizenship Status | With Coverage | Without Coverage |
| Native Born | 6,134 (97.0%) | 188 (3.0%) |
| Foreign Born, Citizen | 13,929 (96.5%) | 502 (3.5%) |
| Foreign Born, not a Citizen | 6,018 (86.2%) | 964 (13.8%) |
Health Insurance Coverage by Household Income in Cullman County
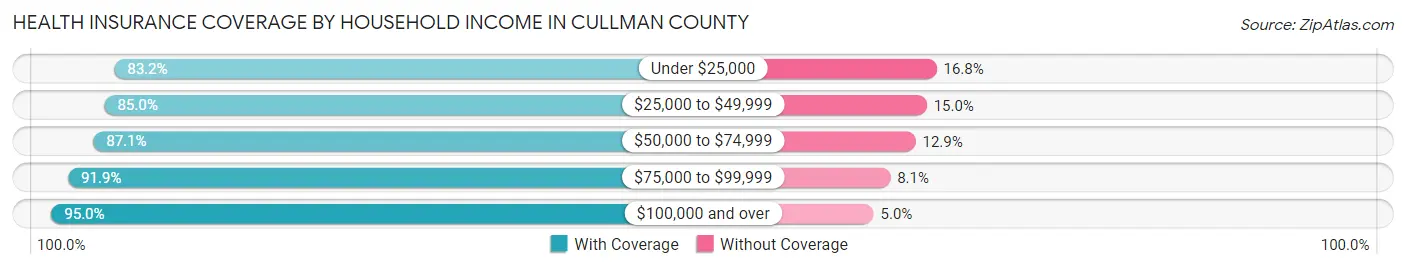
| Household Income | With Coverage | Without Coverage |
| Under $25,000 | 9,542 (83.2%) | 1,928 (16.8%) |
| $25,000 to $49,999 | 14,178 (85.0%) | 2,496 (15.0%) |
| $50,000 to $74,999 | 14,895 (87.1%) | 2,202 (12.9%) |
| $75,000 to $99,999 | 13,515 (91.9%) | 1,198 (8.1%) |
| $100,000 and over | 25,756 (95.0%) | 1,362 (5.0%) |
Public vs Private Health Insurance Coverage by Age in Cullman County
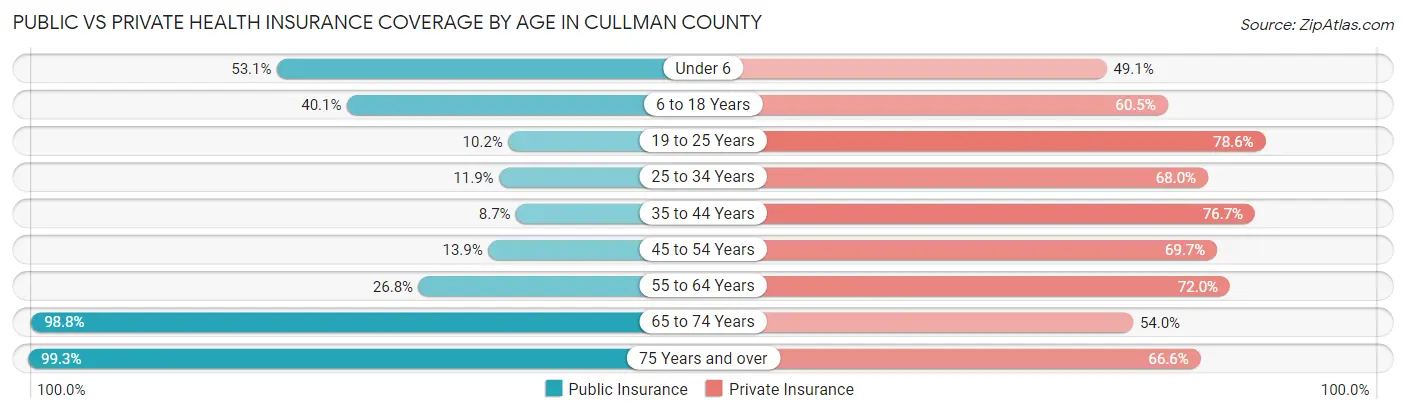
| Age Bracket | Public Insurance | Private Insurance |
| Under 6 | 3,357 (53.1%) | 3,106 (49.1%) |
| 6 to 18 Years | 5,788 (40.1%) | 8,726 (60.5%) |
| 19 to 25 Years | 709 (10.2%) | 5,489 (78.6%) |
| 25 to 34 Years | 1,143 (11.9%) | 6,542 (67.9%) |
| 35 to 44 Years | 914 (8.7%) | 8,045 (76.7%) |
| 45 to 54 Years | 1,580 (13.9%) | 7,927 (69.7%) |
| 55 to 64 Years | 3,213 (26.8%) | 8,634 (72.0%) |
| 65 to 74 Years | 9,484 (98.8%) | 5,189 (54.0%) |
| 75 Years and over | 6,579 (99.3%) | 4,410 (66.6%) |
| Total | 32,767 (37.5%) | 58,068 (66.4%) |
Disability Status by Sex by Age in Cullman County
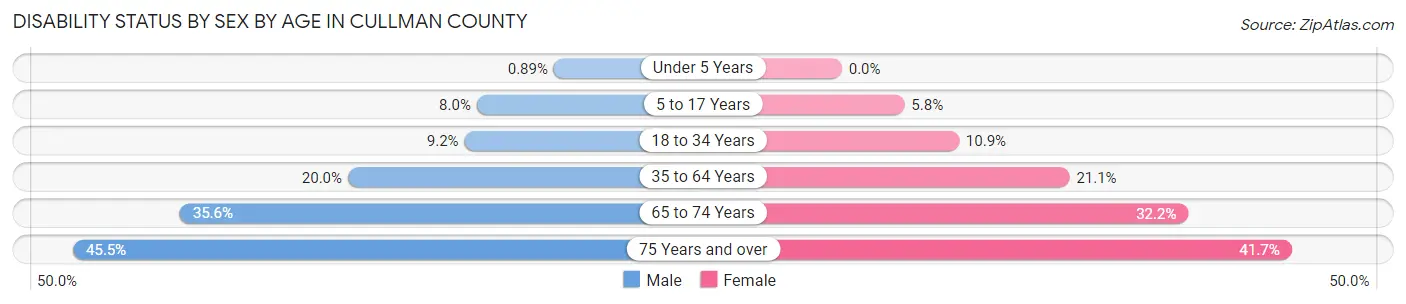
| Age Bracket | Male | Female |
| Under 5 Years | 23 (0.9%) | 0 (0.0%) |
| 5 to 17 Years | 597 (8.0%) | 410 (5.8%) |
| 18 to 34 Years | 833 (9.2%) | 939 (10.9%) |
| 35 to 64 Years | 3,396 (20.0%) | 3,566 (21.1%) |
| 65 to 74 Years | 1,611 (35.6%) | 1,632 (32.2%) |
| 75 Years and over | 1,241 (45.5%) | 1,626 (41.7%) |
Disability Class by Sex by Age in Cullman County
Disability Class: Hearing Difficulty
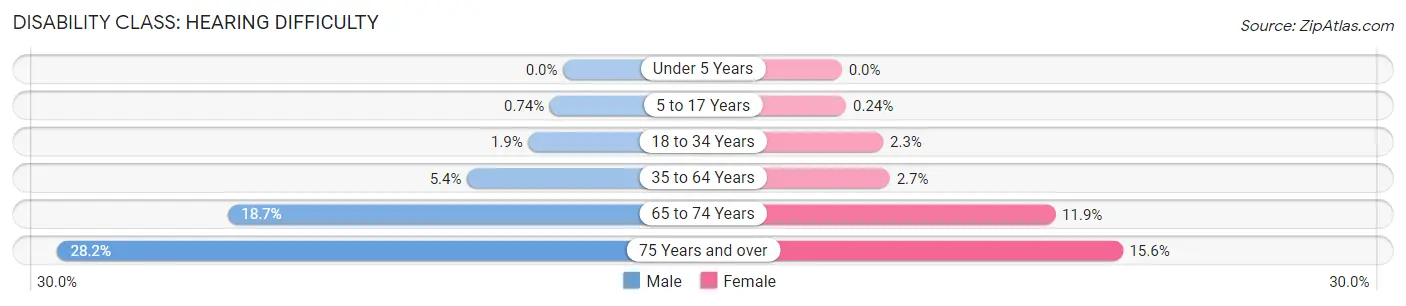
| Age Bracket | Male | Female |
| Under 5 Years | 0 (0.0%) | 0 (0.0%) |
| 5 to 17 Years | 55 (0.7%) | 17 (0.2%) |
| 18 to 34 Years | 176 (1.9%) | 199 (2.3%) |
| 35 to 64 Years | 908 (5.3%) | 450 (2.7%) |
| 65 to 74 Years | 844 (18.6%) | 603 (11.9%) |
| 75 Years and over | 768 (28.2%) | 609 (15.6%) |
Disability Class: Vision Difficulty
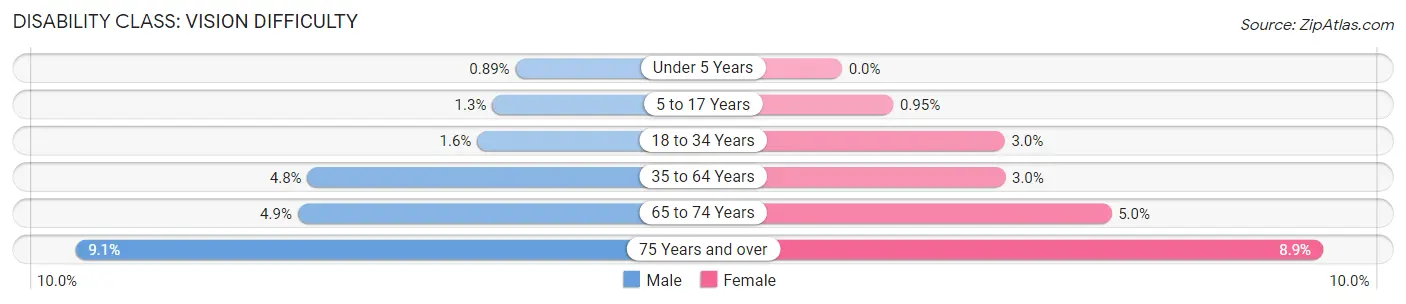
| Age Bracket | Male | Female |
| Under 5 Years | 23 (0.9%) | 0 (0.0%) |
| 5 to 17 Years | 98 (1.3%) | 67 (0.9%) |
| 18 to 34 Years | 145 (1.6%) | 261 (3.0%) |
| 35 to 64 Years | 806 (4.8%) | 512 (3.0%) |
| 65 to 74 Years | 223 (4.9%) | 254 (5.0%) |
| 75 Years and over | 247 (9.1%) | 348 (8.9%) |
Disability Class: Cognitive Difficulty
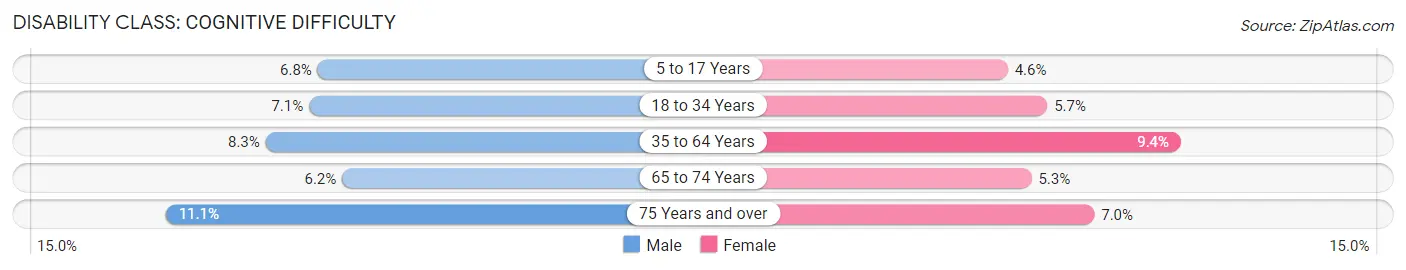
| Age Bracket | Male | Female |
| 5 to 17 Years | 508 (6.8%) | 326 (4.6%) |
| 18 to 34 Years | 643 (7.1%) | 494 (5.7%) |
| 35 to 64 Years | 1,408 (8.3%) | 1,593 (9.4%) |
| 65 to 74 Years | 279 (6.2%) | 268 (5.3%) |
| 75 Years and over | 302 (11.1%) | 274 (7.0%) |
Disability Class: Ambulatory Difficulty
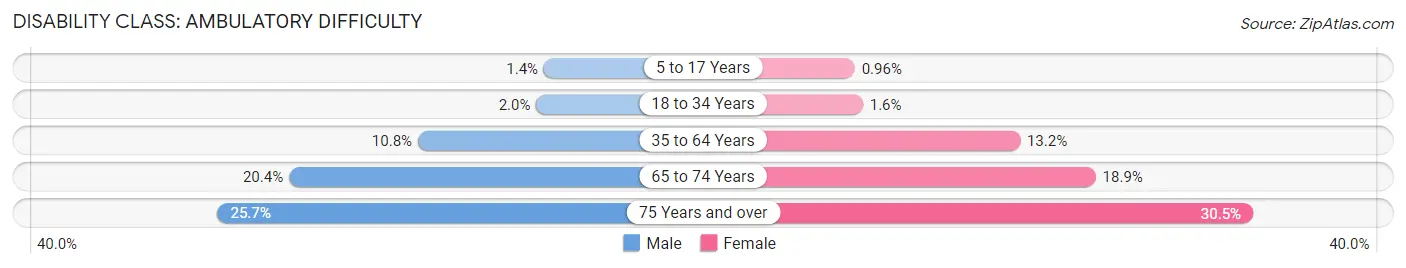
| Age Bracket | Male | Female |
| 5 to 17 Years | 107 (1.4%) | 68 (1.0%) |
| 18 to 34 Years | 182 (2.0%) | 135 (1.6%) |
| 35 to 64 Years | 1,833 (10.8%) | 2,232 (13.2%) |
| 65 to 74 Years | 922 (20.4%) | 957 (18.9%) |
| 75 Years and over | 700 (25.7%) | 1,189 (30.5%) |
Disability Class: Self-Care Difficulty
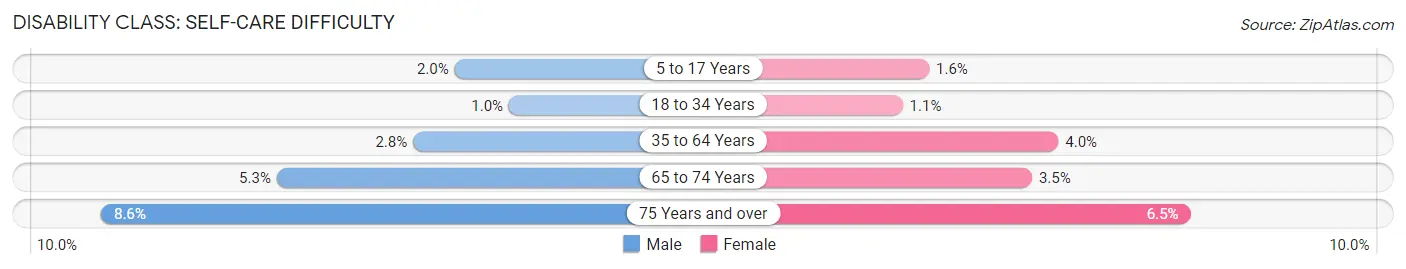
| Age Bracket | Male | Female |
| 5 to 17 Years | 150 (2.0%) | 114 (1.6%) |
| 18 to 34 Years | 92 (1.0%) | 98 (1.1%) |
| 35 to 64 Years | 473 (2.8%) | 678 (4.0%) |
| 65 to 74 Years | 241 (5.3%) | 179 (3.5%) |
| 75 Years and over | 234 (8.6%) | 252 (6.5%) |
Technology Access in Cullman County
Computing Device Access in Cullman County
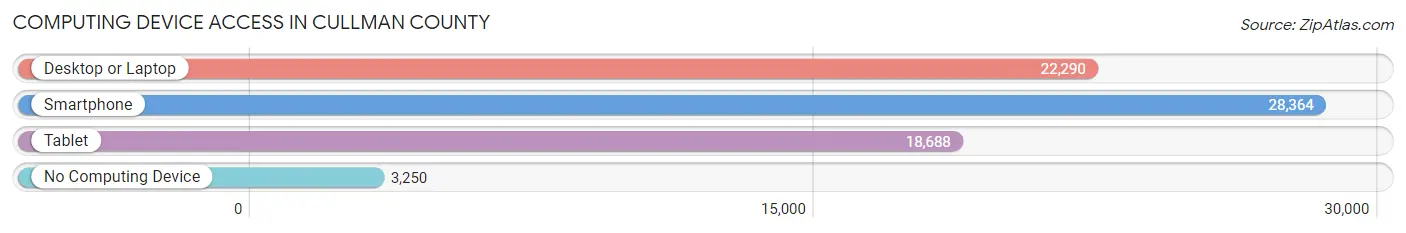
| Device Type | # Households | % Households |
| Desktop or Laptop | 22,290 | 66.2% |
| Smartphone | 28,364 | 84.3% |
| Tablet | 18,688 | 55.5% |
| No Computing Device | 3,250 | 9.7% |
| Total | 33,649 | 100.0% |
Internet Access in Cullman County
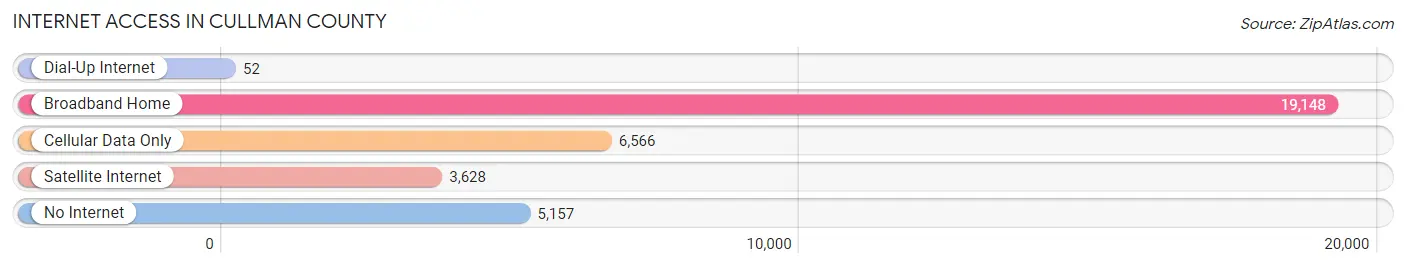
| Internet Type | # Households | % Households |
| Dial-Up Internet | 52 | 0.2% |
| Broadband Home | 19,148 | 56.9% |
| Cellular Data Only | 6,566 | 19.5% |
| Satellite Internet | 3,628 | 10.8% |
| No Internet | 5,157 | 15.3% |
| Total | 33,649 | 100.0% |
Cullman County Summary
Cullman County is located in the north-central region of Alabama, and is part of the Birmingham-Hoover-Cullman Combined Statistical Area. The county was established in 1877 and is named after Colonel John G. Cullman, a German immigrant who was a prominent figure in the area’s early history. The county seat is Cullman, and the county has a population of 80,406 as of the 2010 census.
Geography
Cullman County is located in the Appalachian foothills of the Appalachian Mountains, and is bordered by Blount County to the north, Marshall County to the east, Morgan County to the south, and Winston County to the west. The county covers an area of 602 square miles, and is home to several rivers and streams, including the Mulberry Fork, the Blackwater Creek, and the Sipsey Fork. The county is also home to several lakes, including Smith Lake, Lewis Smith Lake, and Lake Catoma. The terrain of the county is mostly hilly, with some flat areas in the northern and western parts of the county.
Economy
Cullman County’s economy is largely based on agriculture, with the county’s main crops being cotton, corn, soybeans, and wheat. The county is also home to several manufacturing companies, including Goodyear Tire and Rubber Company, which has a plant in the city of Cullman. The county is also home to several large retail stores, including Walmart, Lowe’s, and Home Depot.
Demographics
As of the 2010 census, the population of Cullman County was 80,406, with a population density of 133 people per square mile. The racial makeup of the county was 87.3% White, 9.2% Black or African American, 0.5% Native American, 0.4% Asian, 0.1% Pacific Islander, 1.2% from other races, and 1.3% from two or more races. The median household income in the county was $41,945, and the median family income was $50,945. The per capita income in the county was $20,945.
The largest city in Cullman County is Cullman, with a population of 14,775 as of the 2010 census. Other cities in the county include Hanceville, Good Hope, and Dodge City. The county is served by the Cullman County School System, which consists of 15 elementary schools, four middle schools, and four high schools. The county is also home to Wallace State Community College, a two-year college located in Hanceville.
Cullman County is a largely rural county, with a strong agricultural base and a growing manufacturing sector. The county is home to several large retail stores, and is served by the Cullman County School System. The county is also home to Wallace State Community College, a two-year college located in Hanceville. The county has a population of 80,406 as of the 2010 census, and is a part of the Birmingham-Hoover-Cullman Combined Statistical Area.
Common Questions
What is Per Capita Income in Cullman County?
Per Capita income in Cullman County is $29,788.
What is the Median Family Income in Cullman County?
Median Family Income in Cullman County is $72,331.
What is the Median Household income in Cullman County?
Median Household Income in Cullman County is $58,119.
What is Income or Wage Gap in Cullman County?
Income or Wage Gap in Cullman County is 37.3%.
Women in Cullman County earn 62.7 cents for every dollar earned by a man.
What is Family Income Deficit in Cullman County?
Family Income Deficit in Cullman County is $10,908.
Families that are below poverty line in Cullman County earn $10,908 less on average than the poverty threshold level.
What is Inequality or Gini Index in Cullman County?
Inequality or Gini Index in Cullman County is 0.44.
What is the Total Population of Cullman County?
Total Population of Cullman County is 88,284.
What is the Total Male Population of Cullman County?
Total Male Population of Cullman County is 43,820.
What is the Total Female Population of Cullman County?
Total Female Population of Cullman County is 44,464.
What is the Ratio of Males per 100 Females in Cullman County?
There are 98.55 Males per 100 Females in Cullman County.
What is the Ratio of Females per 100 Males in Cullman County?
There are 101.47 Females per 100 Males in Cullman County.
What is the Median Population Age in Cullman County?
Median Population Age in Cullman County is 41.4 Years.
What is the Average Family Size in Cullman County
Average Family Size in Cullman County is 3.1 People.
What is the Average Household Size in Cullman County
Average Household Size in Cullman County is 2.6 People.
How Large is the Labor Force in Cullman County?
There are 41,224 People in the Labor Forcein in Cullman County.
What is the Percentage of People in the Labor Force in Cullman County?
58.1% of People are in the Labor Force in Cullman County.
What is the Unemployment Rate in Cullman County?
Unemployment Rate in Cullman County is 4.3%.