Blount County, AL Map & Demographics
Blount County Map
Blount County Overview
$29,053
PER CAPITA INCOME
$73,528
AVG FAMILY INCOME
$57,440
AVG HOUSEHOLD INCOME
28.7%
WAGE / INCOME GAP [ % ]
71.3¢/ $1
WAGE / INCOME GAP [ $ ]
$9,719
FAMILY INCOME DEFICIT
0.45
INEQUALITY / GINI INDEX
59,077
TOTAL POPULATION
29,864
MALE POPULATION
29,213
FEMALE POPULATION
102.23
MALES / 100 FEMALES
97.82
FEMALES / 100 MALES
40.8
MEDIAN AGE
3.2
AVG FAMILY SIZE
2.7
AVG HOUSEHOLD SIZE
26,466
LABOR FORCE [ PEOPLE ]
56.0%
PERCENT IN LABOR FORCE
6.0%
UNEMPLOYMENT RATE
Blount County Area Codes
Income in Blount County
Income Overview in Blount County
Per Capita Income in Blount County is $29,053, while median incomes of families and households are $73,528 and $57,440 respectively.
| Characteristic | Number | Measure |
| Per Capita Income | 59,077 | $29,053 |
| Median Family Income | 15,416 | $73,528 |
| Mean Family Income | 15,416 | $87,850 |
| Median Household Income | 21,626 | $57,440 |
| Mean Household Income | 21,626 | $75,954 |
| Income Deficit | 15,416 | $9,719 |
| Wage / Income Gap (%) | 59,077 | 28.68% |
| Wage / Income Gap ($) | 59,077 | 71.32¢ per $1 |
| Gini / Inequality Index | 59,077 | 0.45 |
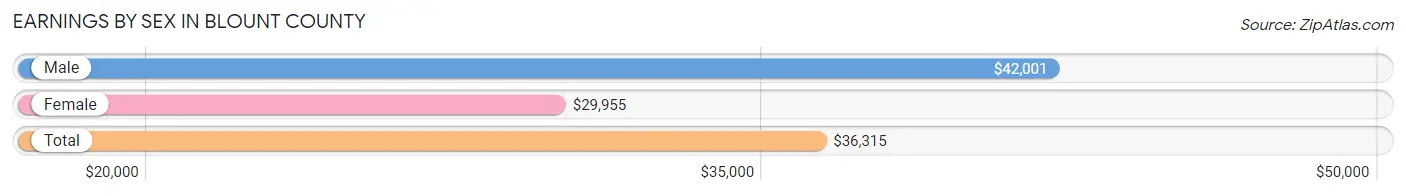
Earnings by Sex in Blount County
Average Earnings in Blount County are $36,315, $42,001 for men and $29,955 for women, a difference of 28.7%.
| Sex | Number | Average Earnings |
| Male | 14,992 (54.9%) | $42,001 |
| Female | 12,319 (45.1%) | $29,955 |
| Total | 27,311 (100.0%) | $36,315 |
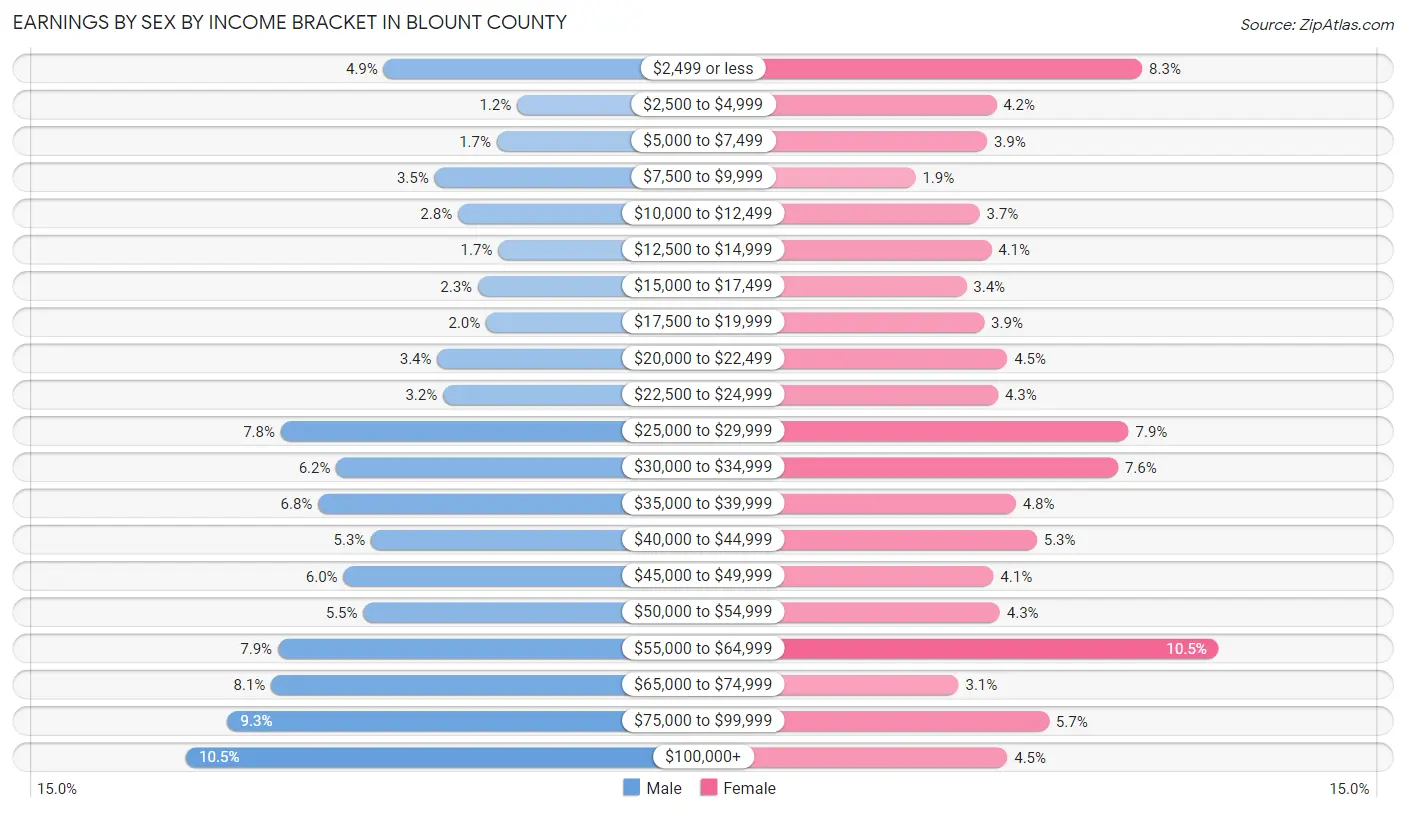
Earnings by Sex by Income Bracket in Blount County
The most common earnings brackets in Blount County are $100,000+ for men (1,568 | 10.5%) and $55,000 to $64,999 for women (1,287 | 10.4%).
| Income | Male | Female |
| $2,499 or less | 736 (4.9%) | 1,023 (8.3%) |
| $2,500 to $4,999 | 174 (1.2%) | 518 (4.2%) |
| $5,000 to $7,499 | 259 (1.7%) | 485 (3.9%) |
| $7,500 to $9,999 | 522 (3.5%) | 238 (1.9%) |
| $10,000 to $12,499 | 423 (2.8%) | 460 (3.7%) |
| $12,500 to $14,999 | 254 (1.7%) | 500 (4.1%) |
| $15,000 to $17,499 | 339 (2.3%) | 414 (3.4%) |
| $17,500 to $19,999 | 304 (2.0%) | 476 (3.9%) |
| $20,000 to $22,499 | 510 (3.4%) | 555 (4.5%) |
| $22,500 to $24,999 | 486 (3.2%) | 524 (4.3%) |
| $25,000 to $29,999 | 1,169 (7.8%) | 976 (7.9%) |
| $30,000 to $34,999 | 935 (6.2%) | 939 (7.6%) |
| $35,000 to $39,999 | 1,012 (6.8%) | 585 (4.8%) |
| $40,000 to $44,999 | 789 (5.3%) | 658 (5.3%) |
| $45,000 to $49,999 | 905 (6.0%) | 508 (4.1%) |
| $50,000 to $54,999 | 821 (5.5%) | 530 (4.3%) |
| $55,000 to $64,999 | 1,182 (7.9%) | 1,287 (10.4%) |
| $65,000 to $74,999 | 1,210 (8.1%) | 387 (3.1%) |
| $75,000 to $99,999 | 1,394 (9.3%) | 700 (5.7%) |
| $100,000+ | 1,568 (10.5%) | 556 (4.5%) |
| Total | 14,992 (100.0%) | 12,319 (100.0%) |
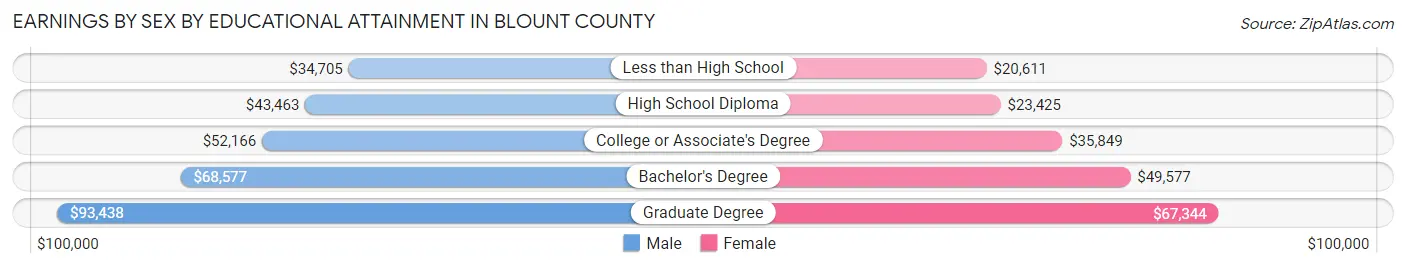
Earnings by Sex by Educational Attainment in Blount County
Average earnings in Blount County are $47,056 for men and $33,503 for women, a difference of 28.8%. Men with an educational attainment of graduate degree enjoy the highest average annual earnings of $93,438, while those with less than high school education earn the least with $34,705. Women with an educational attainment of graduate degree earn the most with the average annual earnings of $67,344, while those with less than high school education have the smallest earnings of $20,611.
| Educational Attainment | Male Income | Female Income |
| Less than High School | $34,705 | $20,611 |
| High School Diploma | $43,463 | $23,425 |
| College or Associate's Degree | $52,166 | $35,849 |
| Bachelor's Degree | $68,577 | $49,577 |
| Graduate Degree | $93,438 | $67,344 |
| Total | $47,056 | $33,503 |
Family Income in Blount County
Family Income Brackets in Blount County
According to the Blount County family income data, there are 3,114 families falling into the $100,000 to $149,999 income range, which is the most common income bracket and makes up 20.2% of all families. Conversely, the $10,000 to $14,999 income bracket is the least frequent group with only 355 families (2.3%) belonging to this category.
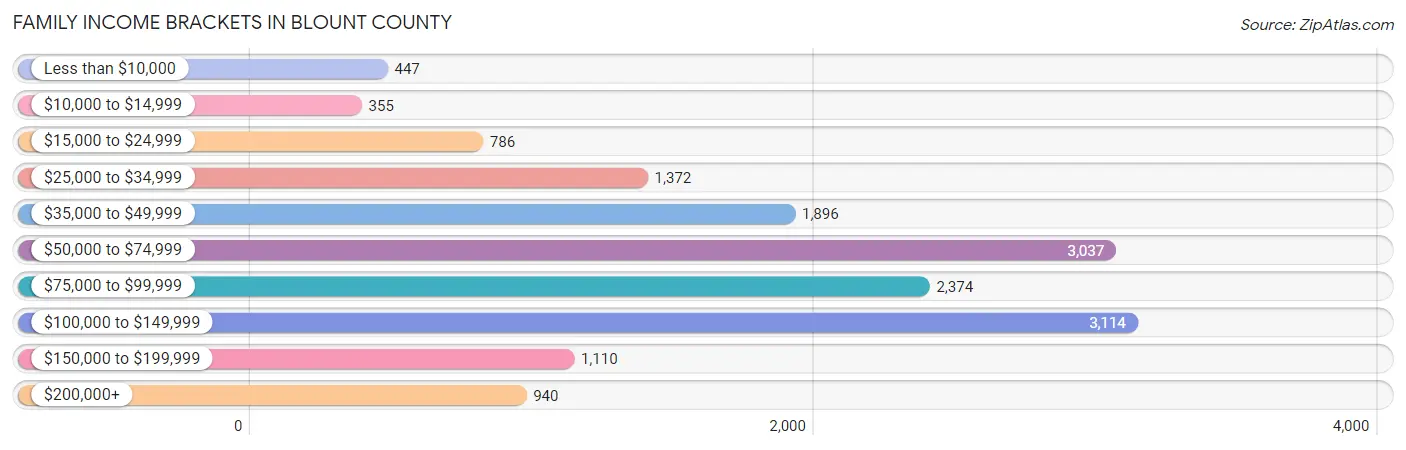
| Income Bracket | # Families | % Families |
| Less than $10,000 | 447 | 2.9% |
| $10,000 to $14,999 | 355 | 2.3% |
| $15,000 to $24,999 | 786 | 5.1% |
| $25,000 to $34,999 | 1,372 | 8.9% |
| $35,000 to $49,999 | 1,896 | 12.3% |
| $50,000 to $74,999 | 3,037 | 19.7% |
| $75,000 to $99,999 | 2,374 | 15.4% |
| $100,000 to $149,999 | 3,114 | 20.2% |
| $150,000 to $199,999 | 1,110 | 7.2% |
| $200,000+ | 940 | 6.1% |
Family Income by Famaliy Size in Blount County
6-person families (320 | 2.1%) account for the highest median family income in Blount County with $115,938 per family, while 2-person families (6,938 | 45.0%) have the highest median income of $28,434 per family member.
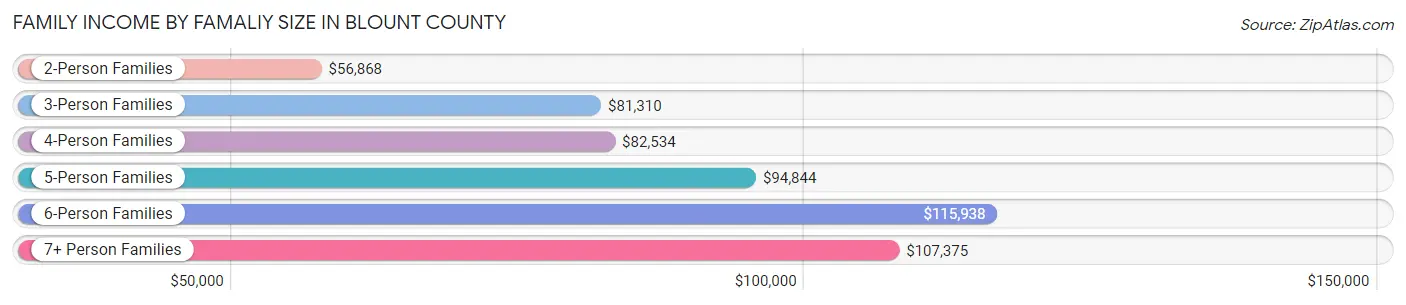
| Income Bracket | # Families | Median Income |
| 2-Person Families | 6,938 (45.0%) | $56,868 |
| 3-Person Families | 3,480 (22.6%) | $81,310 |
| 4-Person Families | 3,387 (22.0%) | $82,534 |
| 5-Person Families | 1,044 (6.8%) | $94,844 |
| 6-Person Families | 320 (2.1%) | $115,938 |
| 7+ Person Families | 247 (1.6%) | $107,375 |
| Total | 15,416 (100.0%) | $73,528 |
Family Income by Number of Earners in Blount County
The median family income in Blount County is $73,528, with families comprising 3+ earners (1,666) having the highest median family income of $110,172, while families with no earners (3,100) have the lowest median family income of $37,575, accounting for 10.8% and 20.1% of families, respectively.
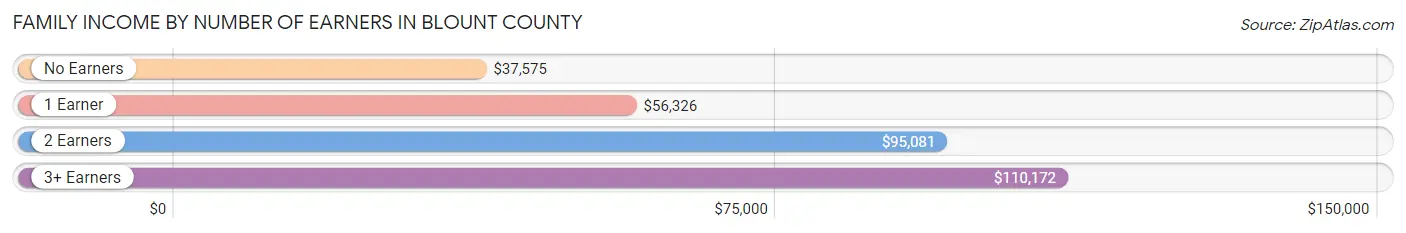
| Number of Earners | # Families | Median Income |
| No Earners | 3,100 (20.1%) | $37,575 |
| 1 Earner | 4,812 (31.2%) | $56,326 |
| 2 Earners | 5,838 (37.9%) | $95,081 |
| 3+ Earners | 1,666 (10.8%) | $110,172 |
| Total | 15,416 (100.0%) | $73,528 |
Household Income in Blount County
Household Income Brackets in Blount County
With 3,547 households falling in the category, the $50,000 to $74,999 income range is the most frequent in Blount County, accounting for 16.4% of all households. In contrast, only 1,060 households (4.9%) fall into the $200,000+ income bracket, making it the least populous group.
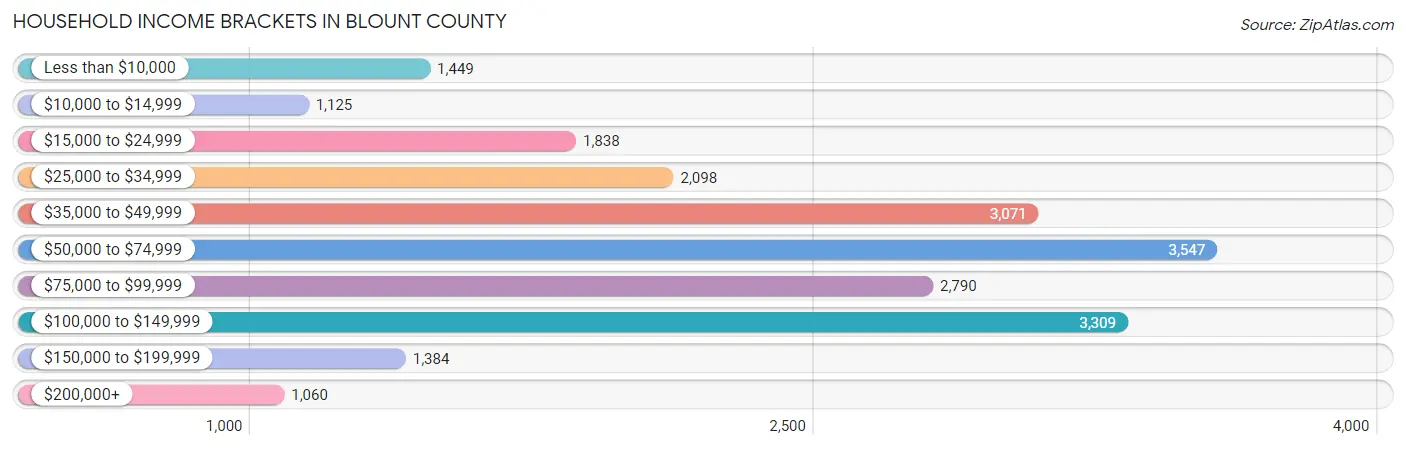
| Income Bracket | # Households | % Households |
| Less than $10,000 | 1,449 | 6.7% |
| $10,000 to $14,999 | 1,125 | 5.2% |
| $15,000 to $24,999 | 1,838 | 8.5% |
| $25,000 to $34,999 | 2,098 | 9.7% |
| $35,000 to $49,999 | 3,071 | 14.2% |
| $50,000 to $74,999 | 3,547 | 16.4% |
| $75,000 to $99,999 | 2,790 | 12.9% |
| $100,000 to $149,999 | 3,309 | 15.3% |
| $150,000 to $199,999 | 1,384 | 6.4% |
| $200,000+ | 1,060 | 4.9% |
Household Income by Householder Age in Blount County
The median household income in Blount County is $57,440, with the highest median household income of $71,213 found in the 25 to 44 years age bracket for the primary householder. A total of 6,243 households (28.9%) fall into this category. Meanwhile, the 15 to 24 years age bracket for the primary householder has the lowest median household income of $37,928, with 439 households (2.0%) in this group.
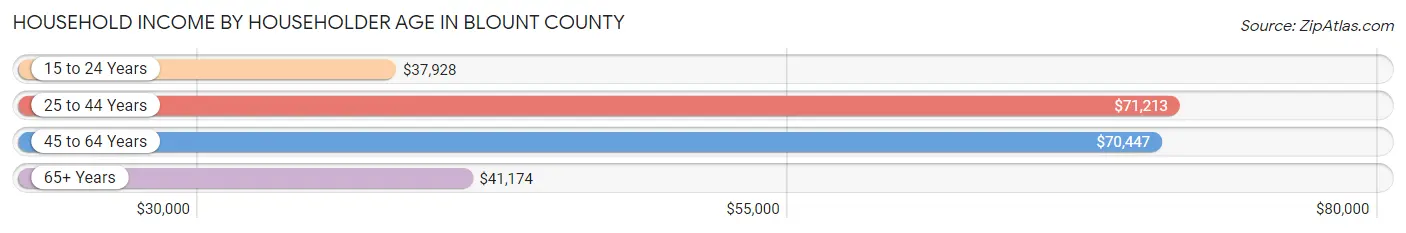
| Income Bracket | # Households | Median Income |
| 15 to 24 Years | 439 (2.0%) | $37,928 |
| 25 to 44 Years | 6,243 (28.9%) | $71,213 |
| 45 to 64 Years | 8,266 (38.2%) | $70,447 |
| 65+ Years | 6,678 (30.9%) | $41,174 |
| Total | 21,626 (100.0%) | $57,440 |
Poverty in Blount County
Income Below Poverty by Sex and Age in Blount County
With 12.3% poverty level for males and 16.1% for females among the residents of Blount County, 16 and 17 year old males and under 5 year old females are the most vulnerable to poverty, with 225 males (21.4%) and 392 females (23.9%) in their respective age groups living below the poverty level.
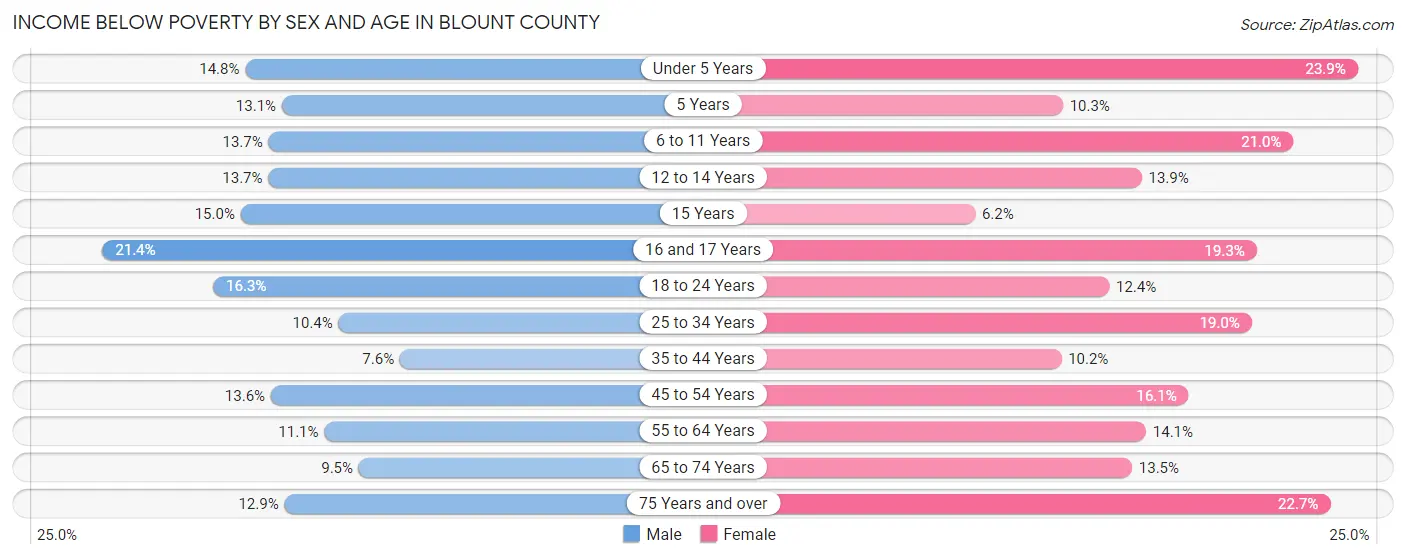
| Age Bracket | Male | Female |
| Under 5 Years | 250 (14.8%) | 392 (23.9%) |
| 5 Years | 35 (13.1%) | 25 (10.2%) |
| 6 to 11 Years | 353 (13.7%) | 494 (20.9%) |
| 12 to 14 Years | 150 (13.7%) | 136 (13.9%) |
| 15 Years | 56 (15.0%) | 23 (6.2%) |
| 16 and 17 Years | 225 (21.4%) | 134 (19.3%) |
| 18 to 24 Years | 408 (16.3%) | 271 (12.4%) |
| 25 to 34 Years | 367 (10.4%) | 657 (19.0%) |
| 35 to 44 Years | 272 (7.6%) | 354 (10.2%) |
| 45 to 54 Years | 524 (13.6%) | 619 (16.1%) |
| 55 to 64 Years | 467 (11.1%) | 545 (14.1%) |
| 65 to 74 Years | 276 (9.5%) | 442 (13.5%) |
| 75 Years and over | 241 (12.9%) | 561 (22.7%) |
| Total | 3,624 (12.3%) | 4,653 (16.1%) |
Income Above Poverty by Sex and Age in Blount County
According to the poverty statistics in Blount County, males aged 35 to 44 years and females aged 15 years are the age groups that are most secure financially, with 92.4% of males and 93.8% of females in these age groups living above the poverty line.
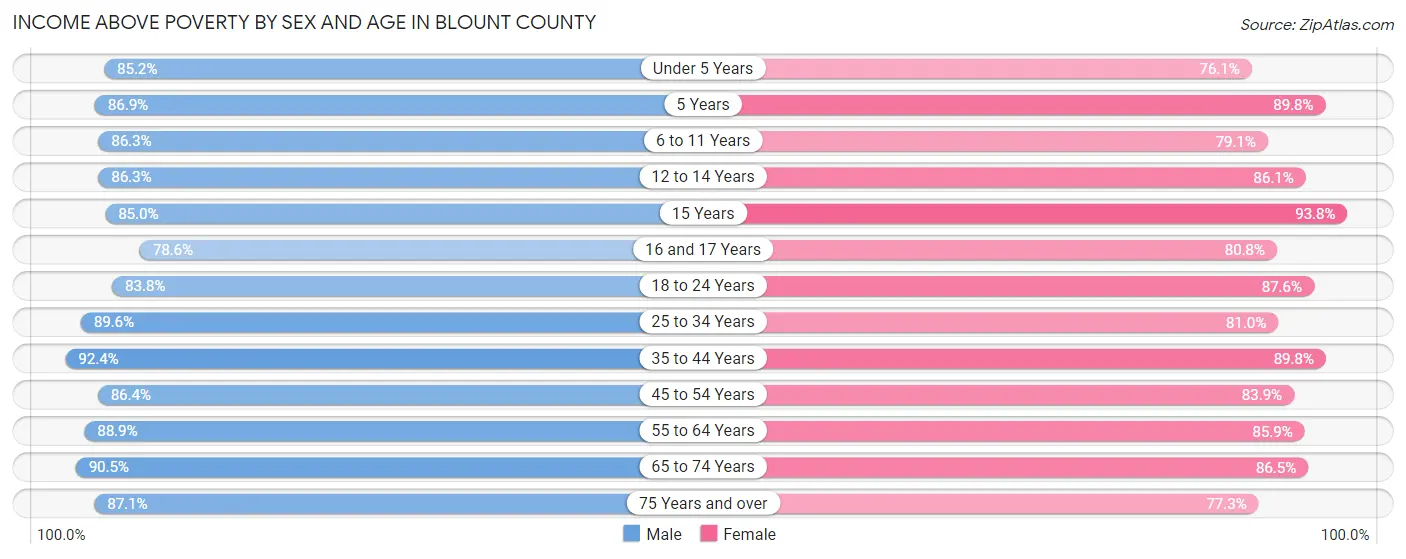
| Age Bracket | Male | Female |
| Under 5 Years | 1,444 (85.2%) | 1,246 (76.1%) |
| 5 Years | 233 (86.9%) | 219 (89.7%) |
| 6 to 11 Years | 2,228 (86.3%) | 1,864 (79.0%) |
| 12 to 14 Years | 946 (86.3%) | 842 (86.1%) |
| 15 Years | 318 (85.0%) | 349 (93.8%) |
| 16 and 17 Years | 827 (78.6%) | 562 (80.7%) |
| 18 to 24 Years | 2,102 (83.8%) | 1,915 (87.6%) |
| 25 to 34 Years | 3,152 (89.6%) | 2,797 (81.0%) |
| 35 to 44 Years | 3,316 (92.4%) | 3,122 (89.8%) |
| 45 to 54 Years | 3,337 (86.4%) | 3,229 (83.9%) |
| 55 to 64 Years | 3,745 (88.9%) | 3,318 (85.9%) |
| 65 to 74 Years | 2,633 (90.5%) | 2,841 (86.5%) |
| 75 Years and over | 1,622 (87.1%) | 1,915 (77.3%) |
| Total | 25,903 (87.7%) | 24,219 (83.9%) |
Income Below Poverty Among Married-Couple Families in Blount County
The poverty statistics for married-couple families in Blount County show that 7.4% or 895 of the total 12,066 families live below the poverty line. Families with 3 or 4 children have the highest poverty rate of 21.4%, comprising of 169 families. On the other hand, families with no children have the lowest poverty rate of 5.0%, which includes 355 families.
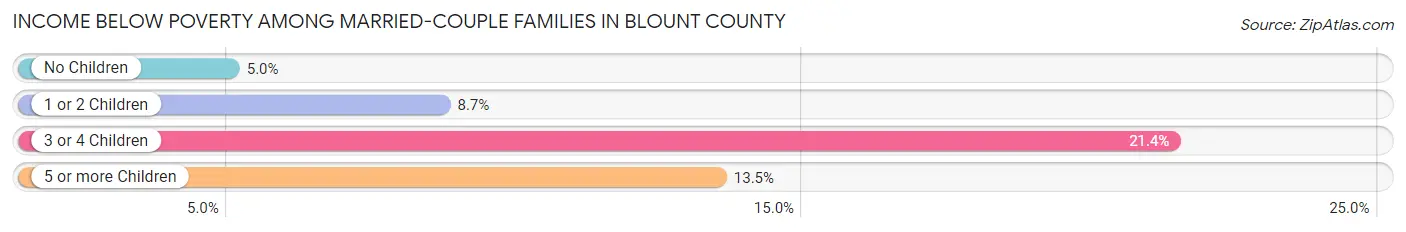
| Children | Above Poverty | Below Poverty |
| No Children | 6,700 (95.0%) | 355 (5.0%) |
| 1 or 2 Children | 3,787 (91.3%) | 361 (8.7%) |
| 3 or 4 Children | 620 (78.6%) | 169 (21.4%) |
| 5 or more Children | 64 (86.5%) | 10 (13.5%) |
| Total | 11,171 (92.6%) | 895 (7.4%) |
Income Below Poverty Among Single-Parent Households in Blount County
According to the poverty data in Blount County, 17.0% or 168 single-father households and 21.4% or 506 single-mother households are living below the poverty line. Among single-father households, those with 3 or 4 children have the highest poverty rate, with 49 households (38.3%) experiencing poverty. Likewise, among single-mother households, those with 3 or 4 children have the highest poverty rate, with 81 households (50.9%) falling below the poverty line.
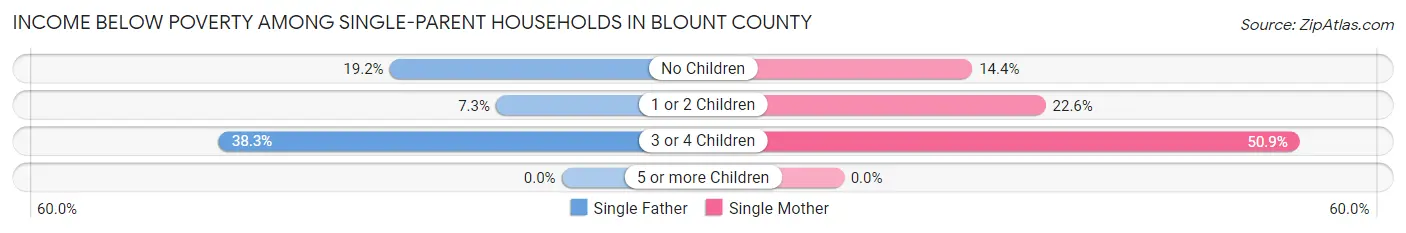
| Children | Single Father | Single Mother |
| No Children | 90 (19.2%) | 121 (14.4%) |
| 1 or 2 Children | 29 (7.3%) | 304 (22.6%) |
| 3 or 4 Children | 49 (38.3%) | 81 (50.9%) |
| 5 or more Children | 0 (0.0%) | 0 (0.0%) |
| Total | 168 (17.0%) | 506 (21.4%) |
Income Below Poverty Among Married-Couple vs Single-Parent Households in Blount County
The poverty data for Blount County shows that 895 of the married-couple family households (7.4%) and 674 of the single-parent households (20.1%) are living below the poverty level. Within the married-couple family households, those with 3 or 4 children have the highest poverty rate, with 169 households (21.4%) falling below the poverty line. Among the single-parent households, those with 3 or 4 children have the highest poverty rate, with 130 household (45.3%) living below poverty.
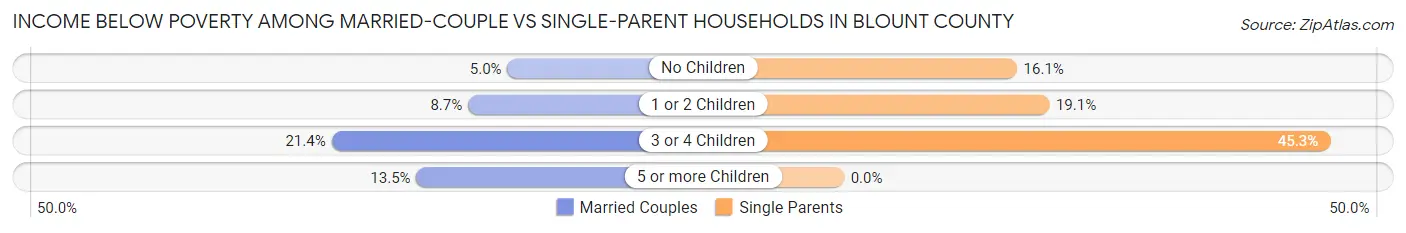
| Children | Married-Couple Families | Single-Parent Households |
| No Children | 355 (5.0%) | 211 (16.1%) |
| 1 or 2 Children | 361 (8.7%) | 333 (19.1%) |
| 3 or 4 Children | 169 (21.4%) | 130 (45.3%) |
| 5 or more Children | 10 (13.5%) | 0 (0.0%) |
| Total | 895 (7.4%) | 674 (20.1%) |
Race in Blount County
The most populous races in Blount County are White / Caucasian (53,941 | 91.3%), Hispanic or Latino (5,721 | 9.7%), and Two or more Races (2,104 | 3.6%).
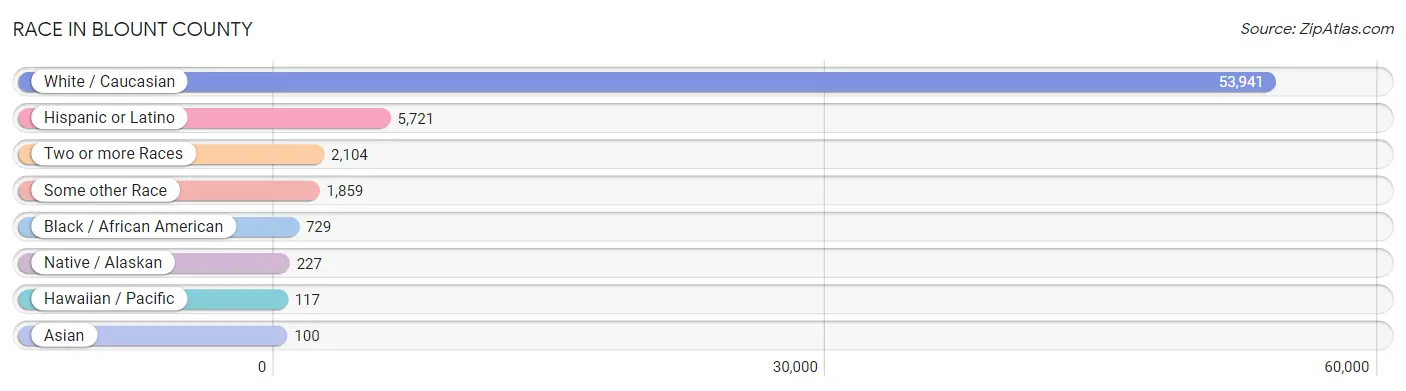
| Race | # Population | % Population |
| Asian | 100 | 0.2% |
| Black / African American | 729 | 1.2% |
| Hawaiian / Pacific | 117 | 0.2% |
| Hispanic or Latino | 5,721 | 9.7% |
| Native / Alaskan | 227 | 0.4% |
| White / Caucasian | 53,941 | 91.3% |
| Two or more Races | 2,104 | 3.6% |
| Some other Race | 1,859 | 3.2% |
| Total | 59,077 | 100.0% |
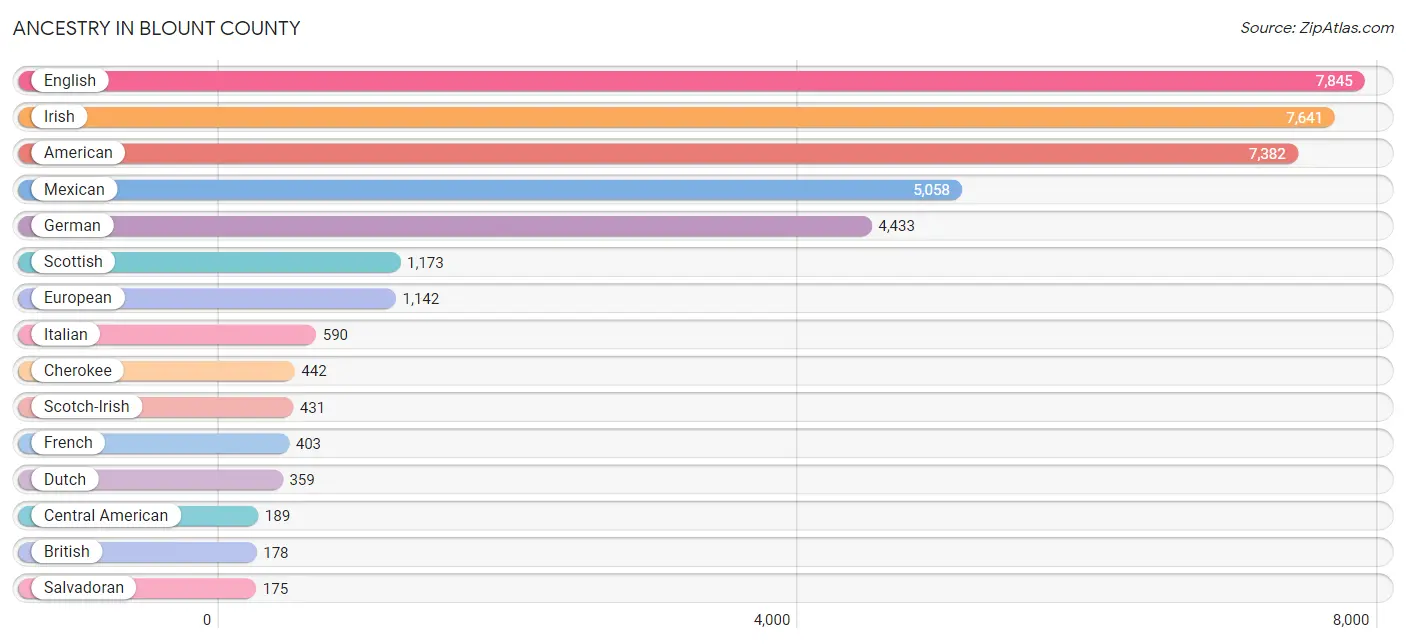
Ancestry in Blount County
The most populous ancestries reported in Blount County are English (7,845 | 13.3%), Irish (7,641 | 12.9%), American (7,382 | 12.5%), Mexican (5,058 | 8.6%), and German (4,433 | 7.5%), together accounting for 54.8% of all Blount County residents.
| Ancestry | # Population | % Population |
| African | 60 | 0.1% |
| American | 7,382 | 12.5% |
| Apache | 7 | 0.0% |
| Arab | 28 | 0.1% |
| Austrian | 57 | 0.1% |
| Blackfeet | 27 | 0.1% |
| British | 178 | 0.3% |
| Bulgarian | 82 | 0.1% |
| Burmese | 36 | 0.1% |
| Cajun | 2 | 0.0% |
| Canadian | 46 | 0.1% |
| Central American | 189 | 0.3% |
| Central American Indian | 23 | 0.0% |
| Cherokee | 442 | 0.7% |
| Choctaw | 6 | 0.0% |
| Colombian | 52 | 0.1% |
| Comanche | 9 | 0.0% |
| Creek | 44 | 0.1% |
| Cuban | 56 | 0.1% |
| Czech | 21 | 0.0% |
| Czechoslovakian | 5 | 0.0% |
| Danish | 51 | 0.1% |
| Dominican | 1 | 0.0% |
| Dutch | 359 | 0.6% |
| Eastern European | 79 | 0.1% |
| English | 7,845 | 13.3% |
| European | 1,142 | 1.9% |
| Filipino | 5 | 0.0% |
| Finnish | 4 | 0.0% |
| French | 403 | 0.7% |
| French Canadian | 32 | 0.1% |
| German | 4,433 | 7.5% |
| Greek | 68 | 0.1% |
| Guamanian / Chamorro | 48 | 0.1% |
| Guatemalan | 7 | 0.0% |
| Honduran | 7 | 0.0% |
| Hungarian | 6 | 0.0% |
| Indian (Asian) | 1 | 0.0% |
| Irish | 7,641 | 12.9% |
| Italian | 590 | 1.0% |
| Jamaican | 51 | 0.1% |
| Korean | 164 | 0.3% |
| Latvian | 6 | 0.0% |
| Lebanese | 26 | 0.0% |
| Lithuanian | 28 | 0.1% |
| Mexican | 5,058 | 8.6% |
| Mexican American Indian | 14 | 0.0% |
| Native Hawaiian | 172 | 0.3% |
| Navajo | 66 | 0.1% |
| Northern European | 45 | 0.1% |
| Norwegian | 128 | 0.2% |
| Polish | 151 | 0.3% |
| Portuguese | 15 | 0.0% |
| Pueblo | 63 | 0.1% |
| Puerto Rican | 55 | 0.1% |
| Russian | 59 | 0.1% |
| Salvadoran | 175 | 0.3% |
| Scandinavian | 61 | 0.1% |
| Scotch-Irish | 431 | 0.7% |
| Scottish | 1,173 | 2.0% |
| Sioux | 7 | 0.0% |
| Slovak | 12 | 0.0% |
| South American | 52 | 0.1% |
| Spaniard | 30 | 0.1% |
| Subsaharan African | 60 | 0.1% |
| Swedish | 99 | 0.2% |
| Swiss | 35 | 0.1% |
| Syrian | 2 | 0.0% |
| Thai | 66 | 0.1% |
| Ute | 4 | 0.0% |
| Welsh | 94 | 0.2% |
| Yugoslavian | 14 | 0.0% | View All 72 Rows |
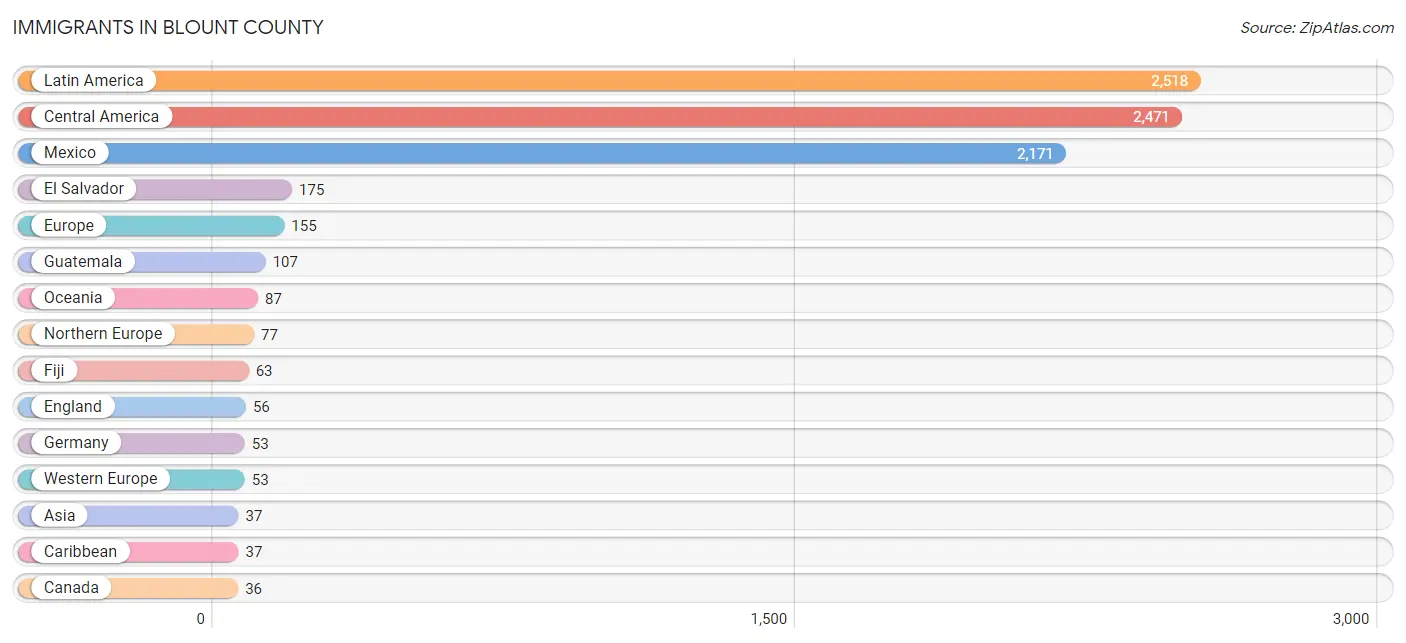
Immigrants in Blount County
The most numerous immigrant groups reported in Blount County came from Latin America (2,518 | 4.3%), Central America (2,471 | 4.2%), Mexico (2,171 | 3.7%), El Salvador (175 | 0.3%), and Europe (155 | 0.3%), together accounting for 12.7% of all Blount County residents.
| Immigration Origin | # Population | % Population |
| Africa | 10 | 0.0% |
| Asia | 37 | 0.1% |
| Australia | 24 | 0.0% |
| Canada | 36 | 0.1% |
| Caribbean | 37 | 0.1% |
| Central America | 2,471 | 4.2% |
| Colombia | 10 | 0.0% |
| Cuba | 36 | 0.1% |
| Eastern Asia | 18 | 0.0% |
| Eastern Europe | 20 | 0.0% |
| El Salvador | 175 | 0.3% |
| England | 56 | 0.1% |
| Europe | 155 | 0.3% |
| Fiji | 63 | 0.1% |
| Germany | 53 | 0.1% |
| Greece | 5 | 0.0% |
| Guatemala | 107 | 0.2% |
| Honduras | 7 | 0.0% |
| Kazakhstan | 3 | 0.0% |
| Korea | 18 | 0.0% |
| Latin America | 2,518 | 4.3% |
| Latvia | 6 | 0.0% |
| Lebanon | 3 | 0.0% |
| Mexico | 2,171 | 3.7% |
| Nigeria | 10 | 0.0% |
| Northern Europe | 77 | 0.1% |
| Oceania | 87 | 0.2% |
| Panama | 11 | 0.0% |
| Philippines | 13 | 0.0% |
| Russia | 14 | 0.0% |
| South America | 10 | 0.0% |
| South Central Asia | 3 | 0.0% |
| South Eastern Asia | 13 | 0.0% |
| Southern Europe | 5 | 0.0% |
| Sweden | 10 | 0.0% |
| West Indies | 1 | 0.0% |
| Western Africa | 10 | 0.0% |
| Western Asia | 3 | 0.0% |
| Western Europe | 53 | 0.1% | View All 39 Rows |
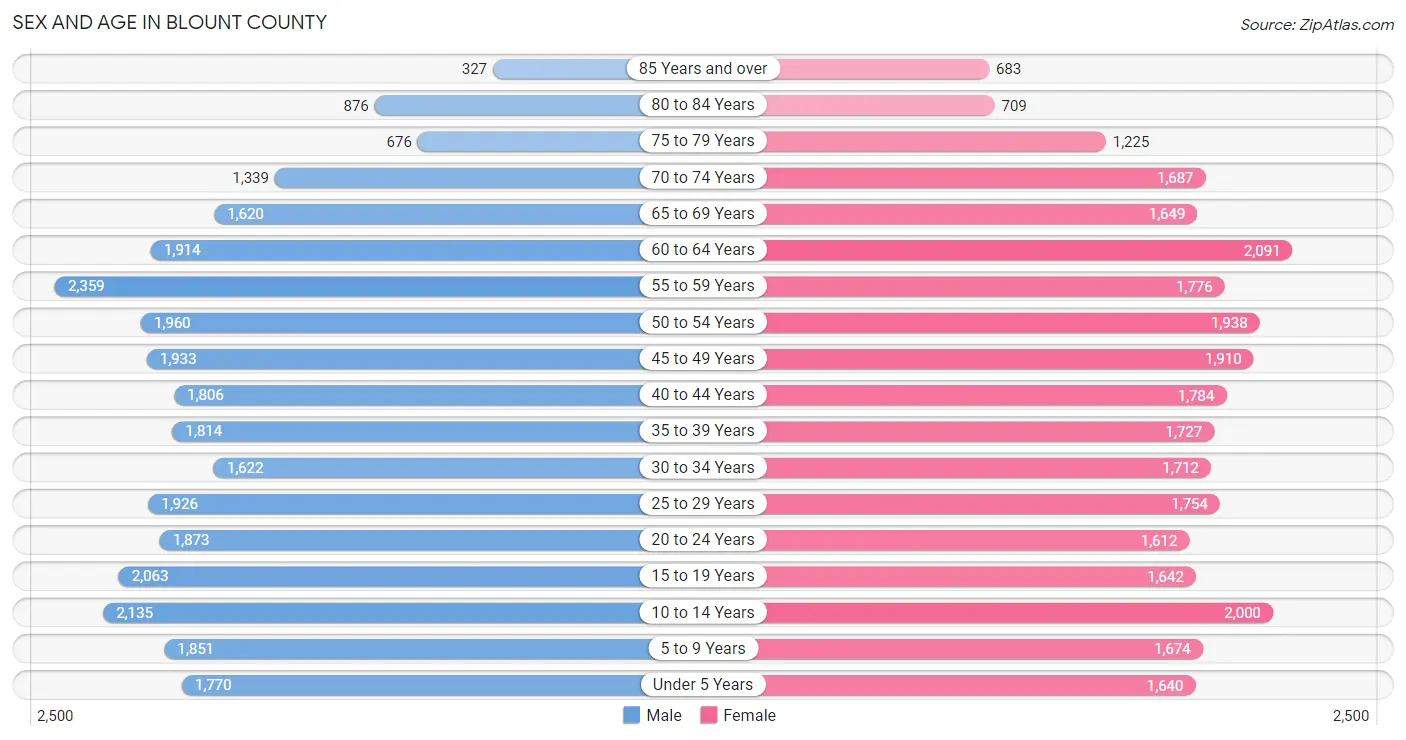
Sex and Age in Blount County
Sex and Age in Blount County
The most populous age groups in Blount County are 55 to 59 Years (2,359 | 7.9%) for men and 60 to 64 Years (2,091 | 7.2%) for women.
| Age Bracket | Male | Female |
| Under 5 Years | 1,770 (5.9%) | 1,640 (5.6%) |
| 5 to 9 Years | 1,851 (6.2%) | 1,674 (5.7%) |
| 10 to 14 Years | 2,135 (7.1%) | 2,000 (6.9%) |
| 15 to 19 Years | 2,063 (6.9%) | 1,642 (5.6%) |
| 20 to 24 Years | 1,873 (6.3%) | 1,612 (5.5%) |
| 25 to 29 Years | 1,926 (6.5%) | 1,754 (6.0%) |
| 30 to 34 Years | 1,622 (5.4%) | 1,712 (5.9%) |
| 35 to 39 Years | 1,814 (6.1%) | 1,727 (5.9%) |
| 40 to 44 Years | 1,806 (6.0%) | 1,784 (6.1%) |
| 45 to 49 Years | 1,933 (6.5%) | 1,910 (6.5%) |
| 50 to 54 Years | 1,960 (6.6%) | 1,938 (6.6%) |
| 55 to 59 Years | 2,359 (7.9%) | 1,776 (6.1%) |
| 60 to 64 Years | 1,914 (6.4%) | 2,091 (7.2%) |
| 65 to 69 Years | 1,620 (5.4%) | 1,649 (5.6%) |
| 70 to 74 Years | 1,339 (4.5%) | 1,687 (5.8%) |
| 75 to 79 Years | 676 (2.3%) | 1,225 (4.2%) |
| 80 to 84 Years | 876 (2.9%) | 709 (2.4%) |
| 85 Years and over | 327 (1.1%) | 683 (2.3%) |
| Total | 29,864 (100.0%) | 29,213 (100.0%) |
Families and Households in Blount County
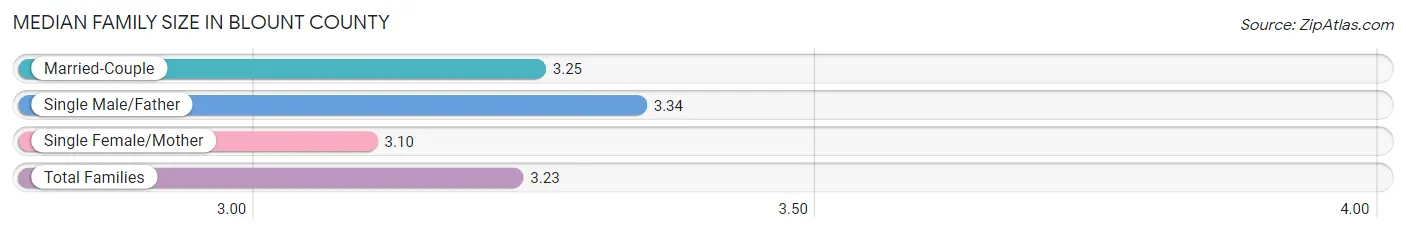
Median Family Size in Blount County
The median family size in Blount County is 3.23 persons per family, with single male/father families (991 | 6.4%) accounting for the largest median family size of 3.34 persons per family. On the other hand, single female/mother families (2,359 | 15.3%) represent the smallest median family size with 3.10 persons per family.
| Family Type | # Families | Family Size |
| Married-Couple | 12,066 (78.3%) | 3.25 |
| Single Male/Father | 991 (6.4%) | 3.34 |
| Single Female/Mother | 2,359 (15.3%) | 3.10 |
| Total Families | 15,416 (100.0%) | 3.23 |
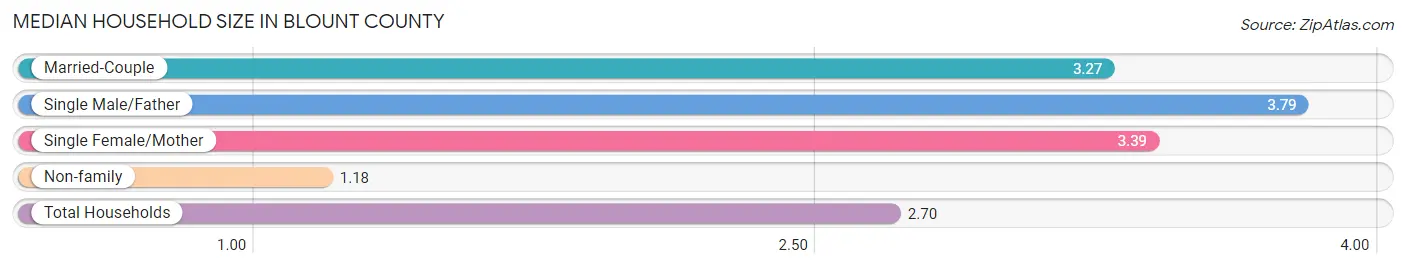
Median Household Size in Blount County
The median household size in Blount County is 2.70 persons per household, with single male/father households (991 | 4.6%) accounting for the largest median household size of 3.79 persons per household. non-family households (6,210 | 28.7%) represent the smallest median household size with 1.18 persons per household.
| Household Type | # Households | Household Size |
| Married-Couple | 12,066 (55.8%) | 3.27 |
| Single Male/Father | 991 (4.6%) | 3.79 |
| Single Female/Mother | 2,359 (10.9%) | 3.39 |
| Non-family | 6,210 (28.7%) | 1.18 |
| Total Households | 21,626 (100.0%) | 2.70 |
Household Size by Marriage Status in Blount County
Out of a total of 21,626 households in Blount County, 15,416 (71.3%) are family households, while 6,210 (28.7%) are nonfamily households. The most numerous type of family households are 2-person households, comprising 6,638, and the most common type of nonfamily households are 1-person households, comprising 5,495.
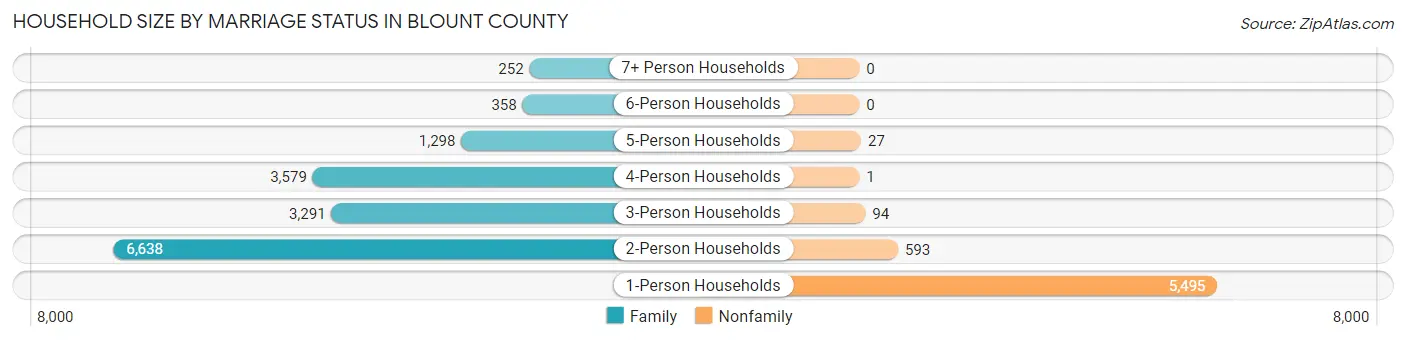
| Household Size | Family Households | Nonfamily Households |
| 1-Person Households | - | 5,495 (25.4%) |
| 2-Person Households | 6,638 (30.7%) | 593 (2.7%) |
| 3-Person Households | 3,291 (15.2%) | 94 (0.4%) |
| 4-Person Households | 3,579 (16.6%) | 1 (0.0%) |
| 5-Person Households | 1,298 (6.0%) | 27 (0.1%) |
| 6-Person Households | 358 (1.7%) | 0 (0.0%) |
| 7+ Person Households | 252 (1.2%) | 0 (0.0%) |
| Total | 15,416 (71.3%) | 6,210 (28.7%) |
Female Fertility in Blount County
Fertility by Age in Blount County
Average fertility rate in Blount County is 51.0 births per 1,000 women. Women in the age bracket of 20 to 34 years have the highest fertility rate with 106.0 births per 1,000 women. Women in the age bracket of 20 to 34 years acount for 84.9% of all women with births.
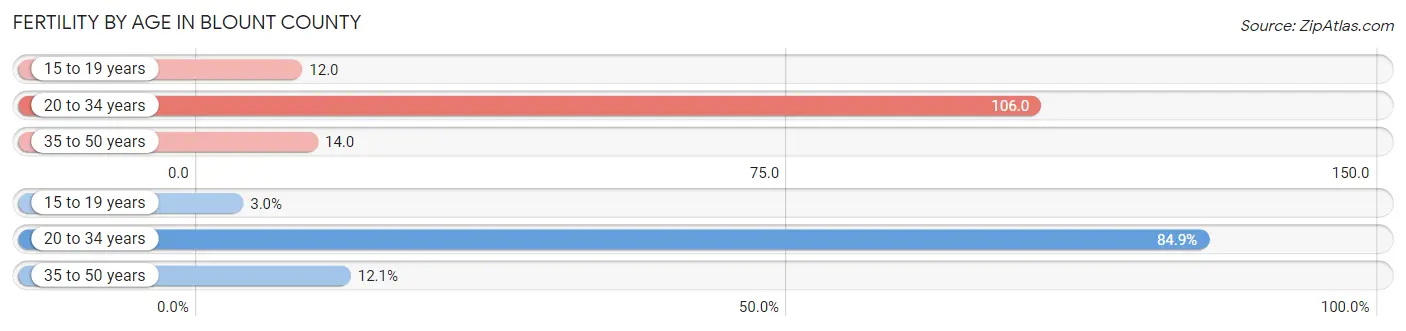
| Age Bracket | Women with Births | Births / 1,000 Women |
| 15 to 19 years | 19 (3.0%) | 12.0 |
| 20 to 34 years | 540 (84.9%) | 106.0 |
| 35 to 50 years | 77 (12.1%) | 14.0 |
| Total | 636 (100.0%) | 51.0 |
Fertility by Age by Marriage Status in Blount County
68.4% of women with births (636) in Blount County are married. The highest percentage of unmarried women with births falls into 15 to 19 years age bracket with 100.0% of them unmarried at the time of birth, while the lowest percentage of unmarried women with births belong to 35 to 50 years age bracket with 26.0% of them unmarried.
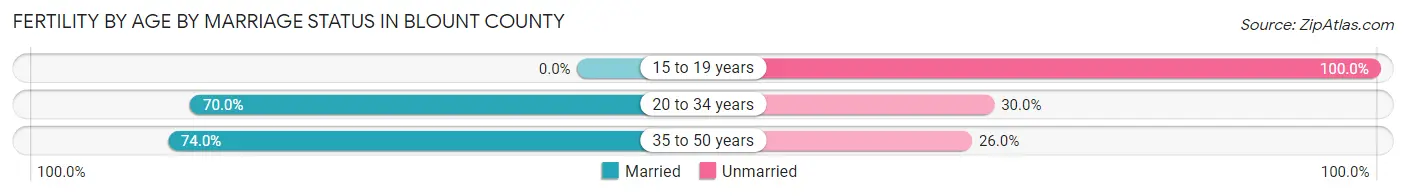
| Age Bracket | Married | Unmarried |
| 15 to 19 years | 0 (0.0%) | 19 (100.0%) |
| 20 to 34 years | 378 (70.0%) | 162 (30.0%) |
| 35 to 50 years | 57 (74.0%) | 20 (26.0%) |
| Total | 435 (68.4%) | 201 (31.6%) |
Fertility by Education in Blount County
Average fertility rate in Blount County is 51.0 births per 1,000 women. Women with the education attainment of less than high school have the highest fertility rate of 79.0 births per 1,000 women, while women with the education attainment of graduate degree have the lowest fertility at 30.0 births per 1,000 women. Women with the education attainment of less than high school represent 29.6% of all women with births.
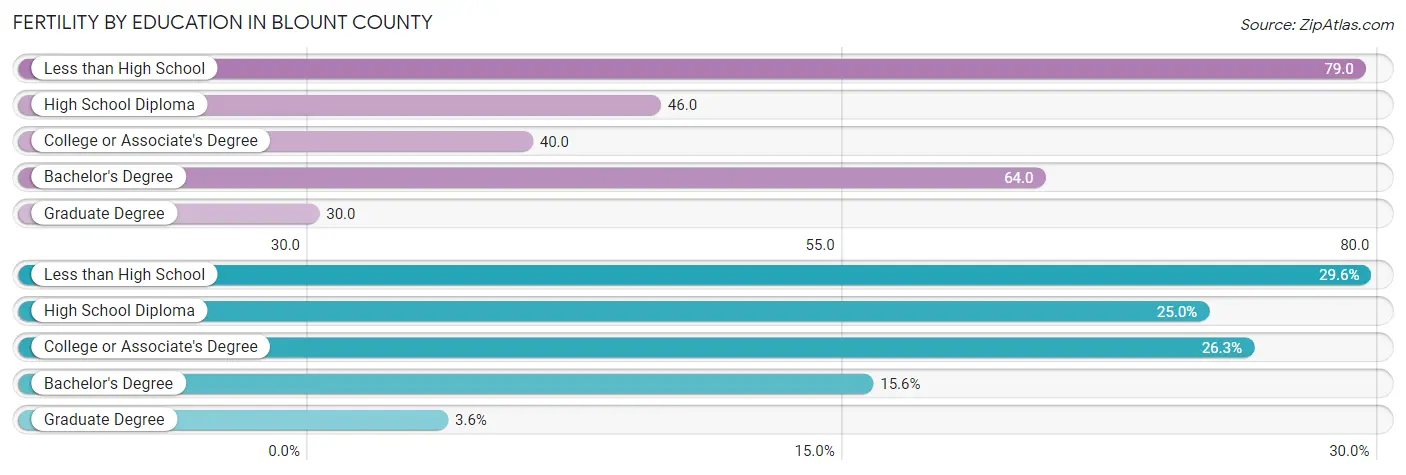
| Educational Attainment | Women with Births | Births / 1,000 Women |
| Less than High School | 188 (29.6%) | 79.0 |
| High School Diploma | 159 (25.0%) | 46.0 |
| College or Associate's Degree | 167 (26.3%) | 40.0 |
| Bachelor's Degree | 99 (15.6%) | 64.0 |
| Graduate Degree | 23 (3.6%) | 30.0 |
| Total | 636 (100.0%) | 51.0 |
Fertility by Education by Marriage Status in Blount County
31.6% of women with births in Blount County are unmarried. Women with the educational attainment of bachelor's degree are most likely to be married with 100.0% of them married at childbirth, while women with the educational attainment of high school diploma are least likely to be married with 66.0% of them unmarried at childbirth.
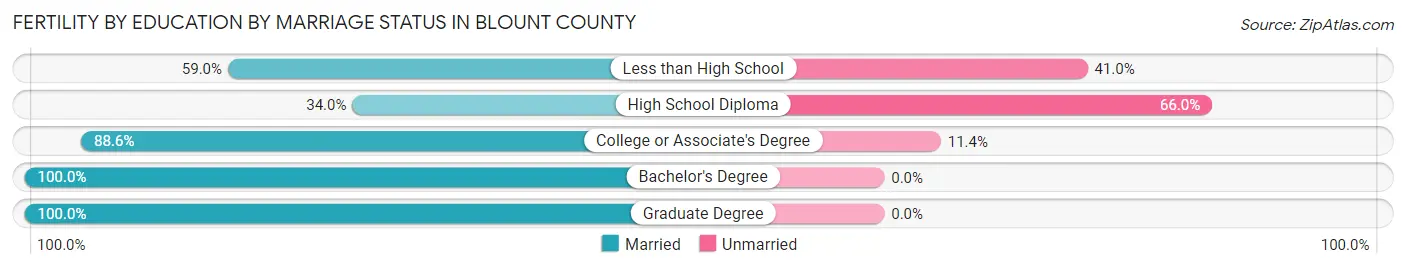
| Educational Attainment | Married | Unmarried |
| Less than High School | 111 (59.0%) | 77 (41.0%) |
| High School Diploma | 54 (34.0%) | 105 (66.0%) |
| College or Associate's Degree | 148 (88.6%) | 19 (11.4%) |
| Bachelor's Degree | 99 (100.0%) | 0 (0.0%) |
| Graduate Degree | 23 (100.0%) | 0 (0.0%) |
| Total | 435 (68.4%) | 201 (31.6%) |
Employment Characteristics in Blount County
Employment by Class of Employer in Blount County
Among the 24,402 employed individuals in Blount County, private company employees (17,563 | 72.0%), self-employed (not incorporated) (1,830 | 7.5%), and not-for-profit organizations (1,481 | 6.1%) make up the most common classes of employment.
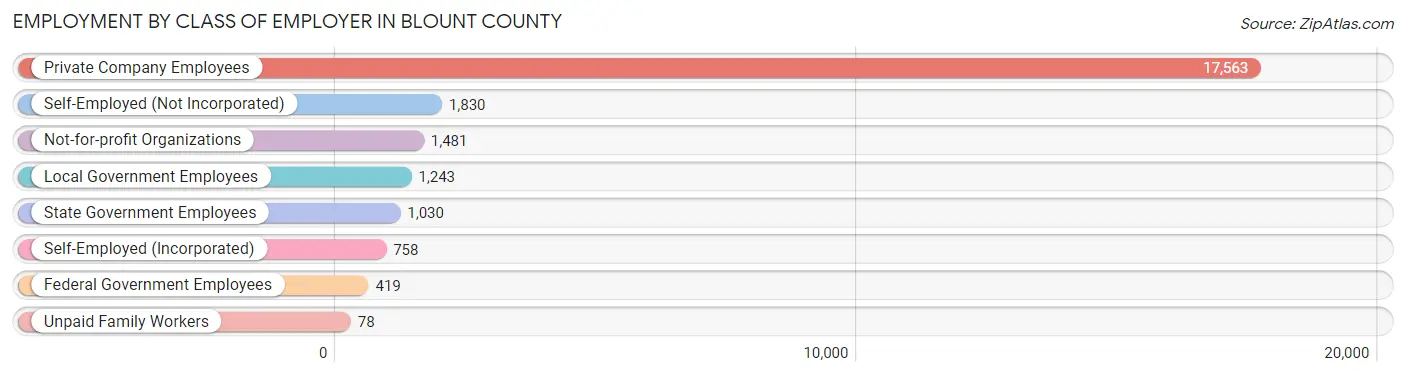
| Employer Class | # Employees | % Employees |
| Private Company Employees | 17,563 | 72.0% |
| Self-Employed (Incorporated) | 758 | 3.1% |
| Self-Employed (Not Incorporated) | 1,830 | 7.5% |
| Not-for-profit Organizations | 1,481 | 6.1% |
| Local Government Employees | 1,243 | 5.1% |
| State Government Employees | 1,030 | 4.2% |
| Federal Government Employees | 419 | 1.7% |
| Unpaid Family Workers | 78 | 0.3% |
| Total | 24,402 | 100.0% |
Employment Status by Age in Blount County
According to the labor force statistics for Blount County, out of the total population over 16 years of age (47,261), 56.0% or 26,466 individuals are in the labor force, with 6.0% or 1,588 of them unemployed. The age group with the highest labor force participation rate is 35 to 44 years, with 81.7% or 5,826 individuals in the labor force. Within the labor force, the 16 to 19 years age range has the highest percentage of unemployed individuals, with 11.2% or 127 of them being unemployed.
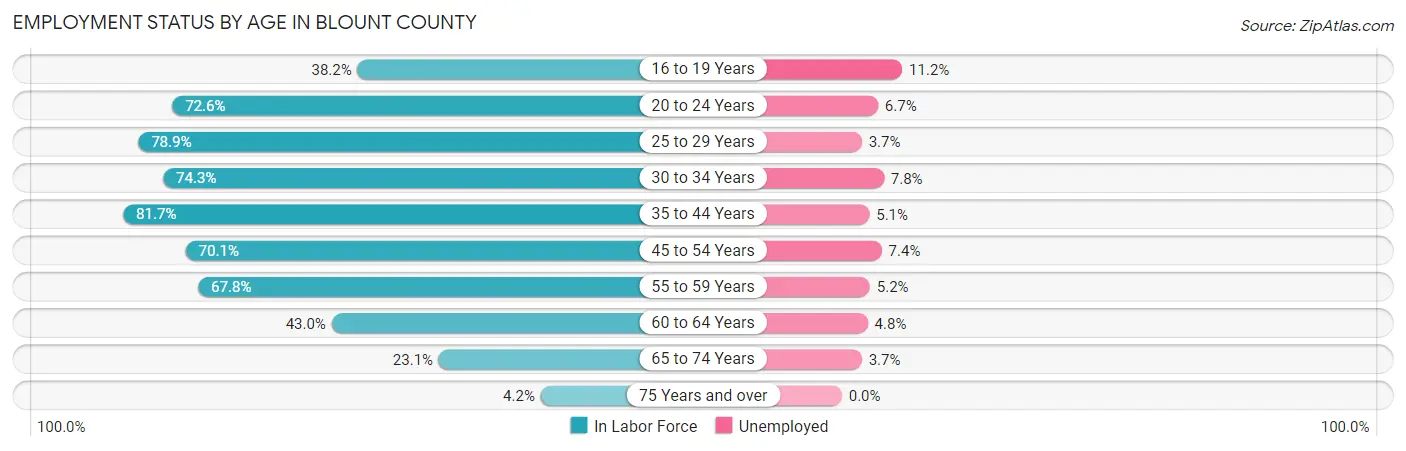
| Age Bracket | In Labor Force | Unemployed |
| 16 to 19 Years | 1,130 (38.2%) | 127 (11.2%) |
| 20 to 24 Years | 2,530 (72.6%) | 170 (6.7%) |
| 25 to 29 Years | 2,904 (78.9%) | 107 (3.7%) |
| 30 to 34 Years | 2,477 (74.3%) | 193 (7.8%) |
| 35 to 44 Years | 5,826 (81.7%) | 297 (5.1%) |
| 45 to 54 Years | 5,426 (70.1%) | 402 (7.4%) |
| 55 to 59 Years | 2,804 (67.8%) | 146 (5.2%) |
| 60 to 64 Years | 1,722 (43.0%) | 83 (4.8%) |
| 65 to 74 Years | 1,454 (23.1%) | 54 (3.7%) |
| 75 Years and over | 189 (4.2%) | 0 (0.0%) |
| Total | 26,466 (56.0%) | 1,588 (6.0%) |
Employment Status by Educational Attainment in Blount County
According to labor force statistics for Blount County, 70.5% of individuals (21,168) out of the total population between 25 and 64 years of age (30,026) are in the labor force, with 5.8% or 1,228 of them being unemployed. The group with the highest labor force participation rate are those with the educational attainment of bachelor's degree or higher, with 81.1% or 3,813 individuals in the labor force. Within the labor force, individuals with less than high school education have the highest percentage of unemployment, with 8.2% or 244 of them being unemployed.
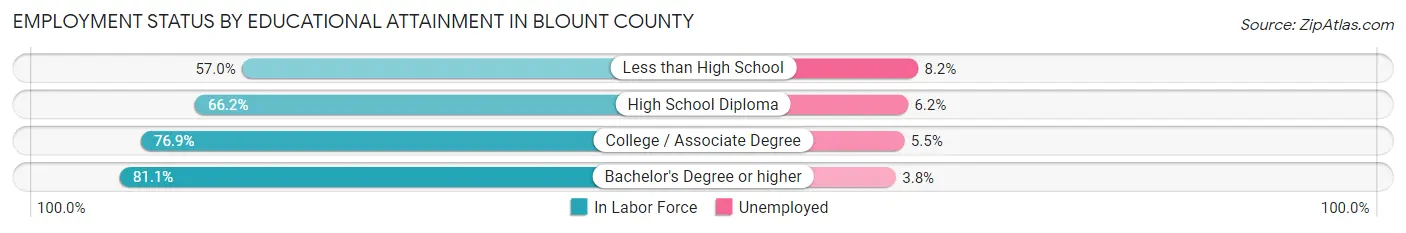
| Educational Attainment | In Labor Force | Unemployed |
| Less than High School | 2,975 (57.0%) | 428 (8.2%) |
| High School Diploma | 6,748 (66.2%) | 632 (6.2%) |
| College / Associate Degree | 7,623 (76.9%) | 545 (5.5%) |
| Bachelor's Degree or higher | 3,813 (81.1%) | 179 (3.8%) |
| Total | 21,168 (70.5%) | 1,742 (5.8%) |
Employment Occupations by Sex in Blount County
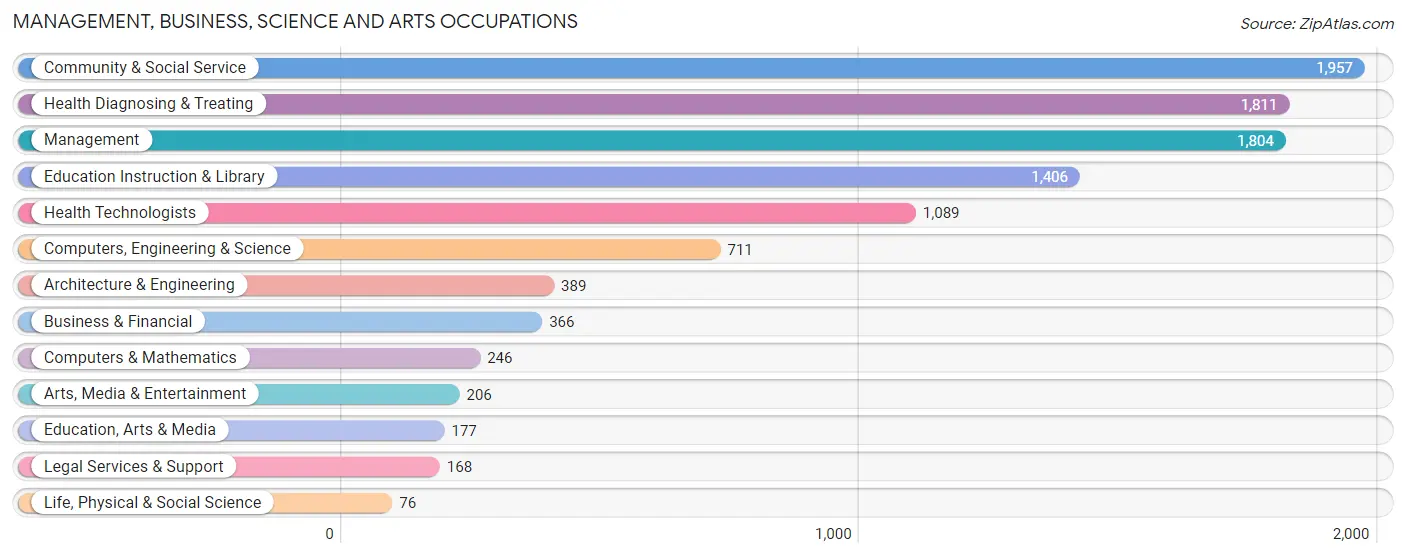
Management, Business, Science and Arts Occupations
The most common Management, Business, Science and Arts occupations in Blount County are Community & Social Service (1,957 | 7.9%), Health Diagnosing & Treating (1,811 | 7.3%), Management (1,804 | 7.3%), Education Instruction & Library (1,406 | 5.7%), and Health Technologists (1,089 | 4.4%).
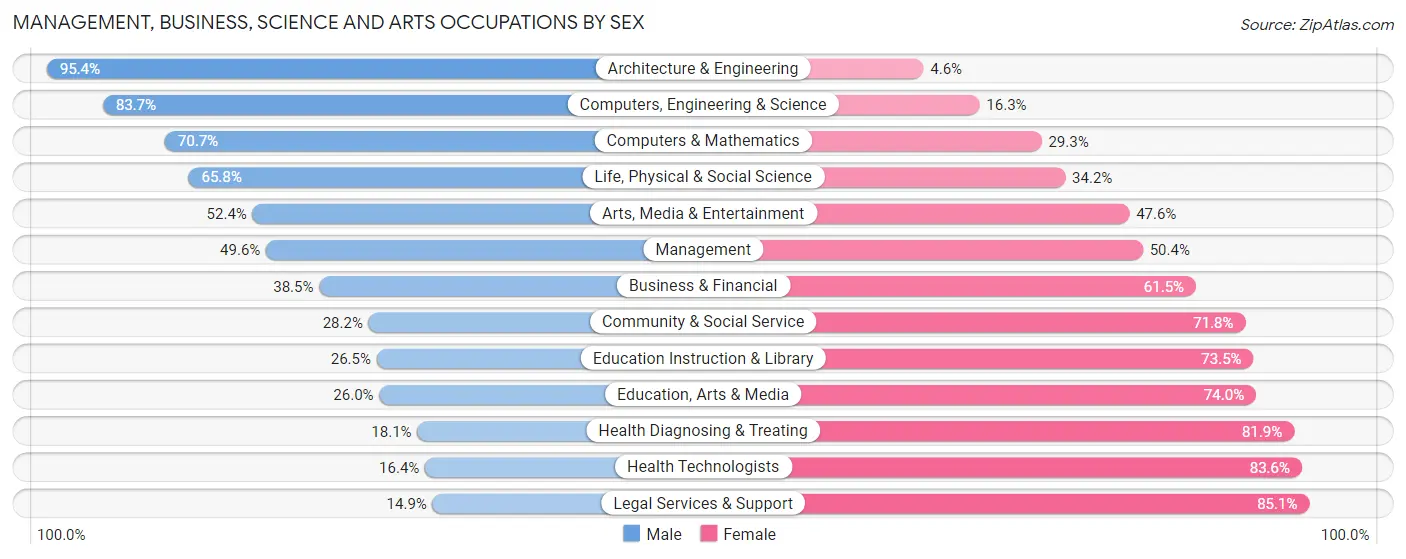
Management, Business, Science and Arts Occupations by Sex
Within the Management, Business, Science and Arts occupations in Blount County, the most male-oriented occupations are Architecture & Engineering (95.4%), Computers, Engineering & Science (83.7%), and Computers & Mathematics (70.7%), while the most female-oriented occupations are Legal Services & Support (85.1%), Health Technologists (83.6%), and Health Diagnosing & Treating (81.9%).
| Occupation | Male | Female |
| Management | 895 (49.6%) | 909 (50.4%) |
| Business & Financial | 141 (38.5%) | 225 (61.5%) |
| Computers, Engineering & Science | 595 (83.7%) | 116 (16.3%) |
| Computers & Mathematics | 174 (70.7%) | 72 (29.3%) |
| Architecture & Engineering | 371 (95.4%) | 18 (4.6%) |
| Life, Physical & Social Science | 50 (65.8%) | 26 (34.2%) |
| Community & Social Service | 552 (28.2%) | 1,405 (71.8%) |
| Education, Arts & Media | 46 (26.0%) | 131 (74.0%) |
| Legal Services & Support | 25 (14.9%) | 143 (85.1%) |
| Education Instruction & Library | 373 (26.5%) | 1,033 (73.5%) |
| Arts, Media & Entertainment | 108 (52.4%) | 98 (47.6%) |
| Health Diagnosing & Treating | 327 (18.1%) | 1,484 (81.9%) |
| Health Technologists | 179 (16.4%) | 910 (83.6%) |
| Total (Category) | 2,510 (37.8%) | 4,139 (62.3%) |
| Total (Overall) | 13,663 (55.0%) | 11,193 (45.0%) |
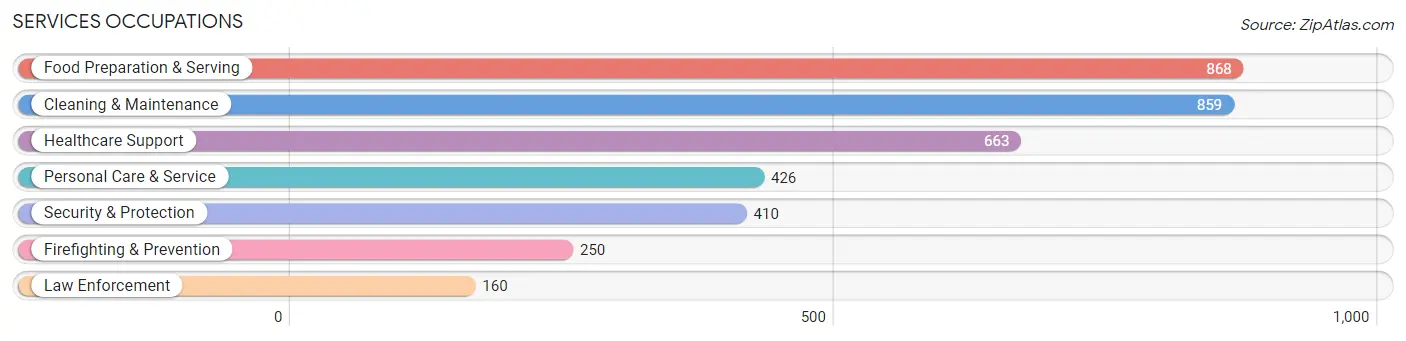
Services Occupations
The most common Services occupations in Blount County are Food Preparation & Serving (868 | 3.5%), Cleaning & Maintenance (859 | 3.5%), Healthcare Support (663 | 2.7%), Personal Care & Service (426 | 1.7%), and Security & Protection (410 | 1.7%).
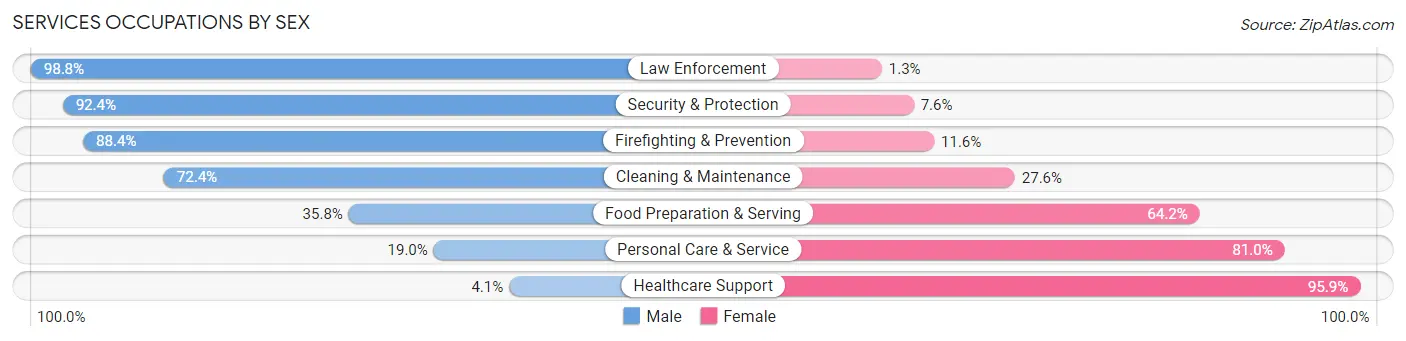
Services Occupations by Sex
Within the Services occupations in Blount County, the most male-oriented occupations are Law Enforcement (98.8%), Security & Protection (92.4%), and Firefighting & Prevention (88.4%), while the most female-oriented occupations are Healthcare Support (95.9%), Personal Care & Service (81.0%), and Food Preparation & Serving (64.2%).
| Occupation | Male | Female |
| Healthcare Support | 27 (4.1%) | 636 (95.9%) |
| Security & Protection | 379 (92.4%) | 31 (7.6%) |
| Firefighting & Prevention | 221 (88.4%) | 29 (11.6%) |
| Law Enforcement | 158 (98.8%) | 2 (1.3%) |
| Food Preparation & Serving | 311 (35.8%) | 557 (64.2%) |
| Cleaning & Maintenance | 622 (72.4%) | 237 (27.6%) |
| Personal Care & Service | 81 (19.0%) | 345 (81.0%) |
| Total (Category) | 1,420 (44.0%) | 1,806 (56.0%) |
| Total (Overall) | 13,663 (55.0%) | 11,193 (45.0%) |
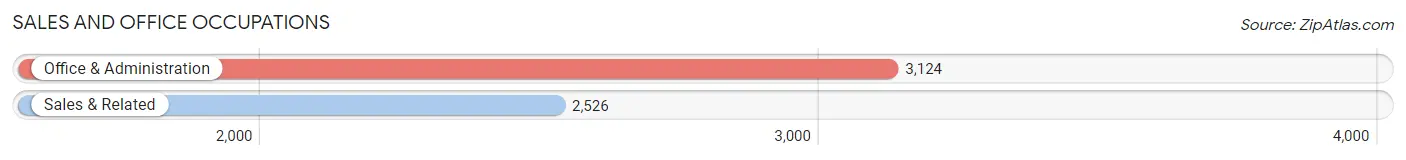
Sales and Office Occupations
The most common Sales and Office occupations in Blount County are Office & Administration (3,124 | 12.6%), and Sales & Related (2,526 | 10.2%).
Sales and Office Occupations by Sex
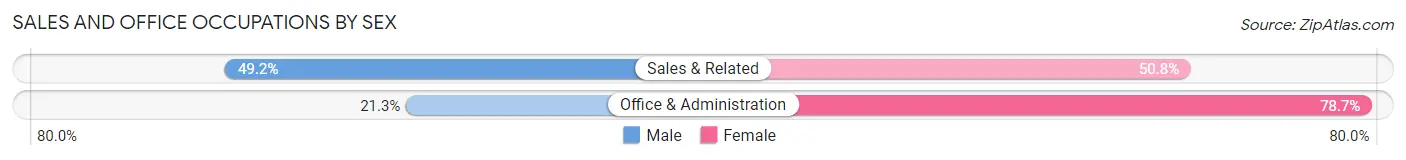
| Occupation | Male | Female |
| Sales & Related | 1,242 (49.2%) | 1,284 (50.8%) |
| Office & Administration | 665 (21.3%) | 2,459 (78.7%) |
| Total (Category) | 1,907 (33.8%) | 3,743 (66.2%) |
| Total (Overall) | 13,663 (55.0%) | 11,193 (45.0%) |
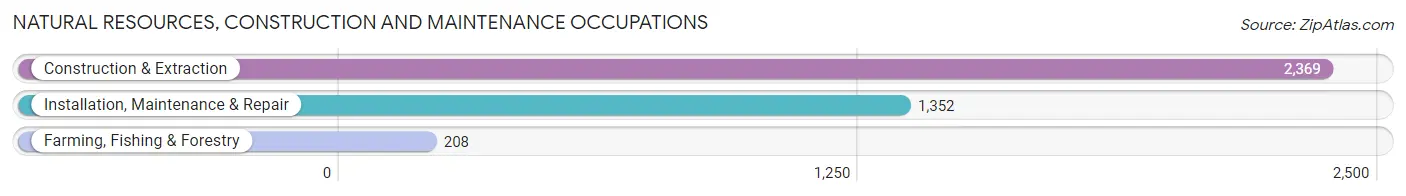
Natural Resources, Construction and Maintenance Occupations
The most common Natural Resources, Construction and Maintenance occupations in Blount County are Construction & Extraction (2,369 | 9.5%), Installation, Maintenance & Repair (1,352 | 5.4%), and Farming, Fishing & Forestry (208 | 0.8%).
Natural Resources, Construction and Maintenance Occupations by Sex
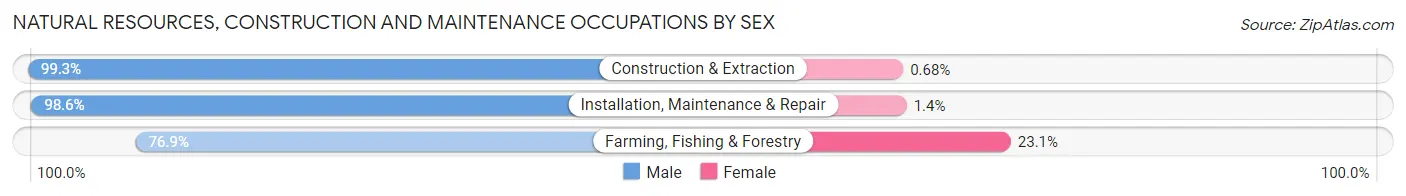
| Occupation | Male | Female |
| Farming, Fishing & Forestry | 160 (76.9%) | 48 (23.1%) |
| Construction & Extraction | 2,353 (99.3%) | 16 (0.7%) |
| Installation, Maintenance & Repair | 1,333 (98.6%) | 19 (1.4%) |
| Total (Category) | 3,846 (97.9%) | 83 (2.1%) |
| Total (Overall) | 13,663 (55.0%) | 11,193 (45.0%) |
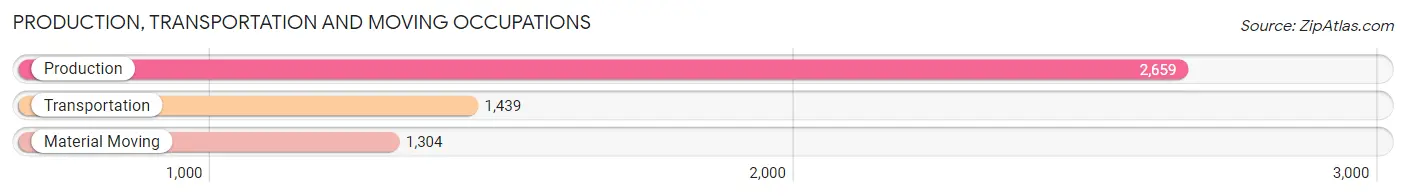
Production, Transportation and Moving Occupations
The most common Production, Transportation and Moving occupations in Blount County are Production (2,659 | 10.7%), Transportation (1,439 | 5.8%), and Material Moving (1,304 | 5.2%).
Production, Transportation and Moving Occupations by Sex
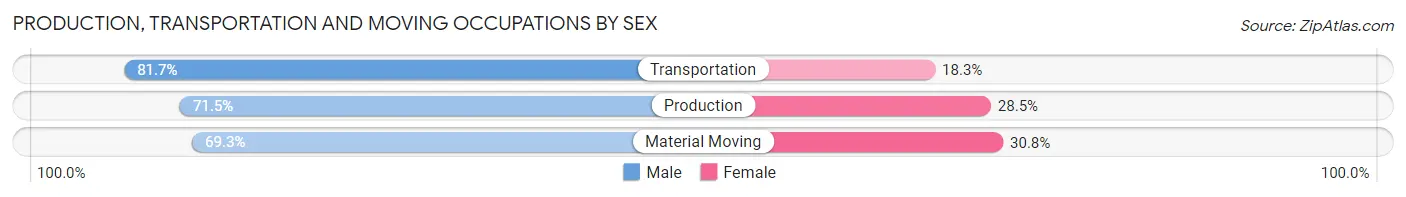
| Occupation | Male | Female |
| Production | 1,901 (71.5%) | 758 (28.5%) |
| Transportation | 1,176 (81.7%) | 263 (18.3%) |
| Material Moving | 903 (69.3%) | 401 (30.7%) |
| Total (Category) | 3,980 (73.7%) | 1,422 (26.3%) |
| Total (Overall) | 13,663 (55.0%) | 11,193 (45.0%) |
Employment Industries by Sex in Blount County
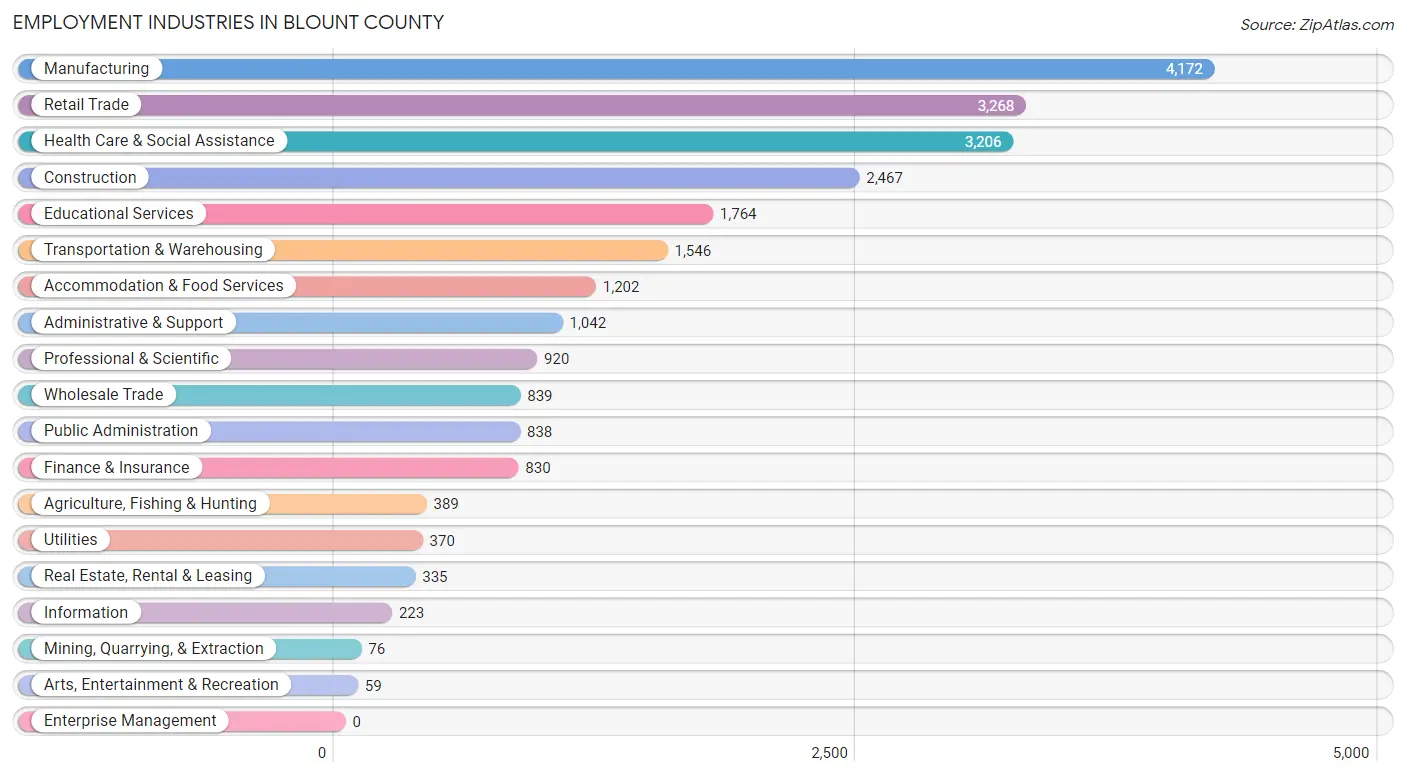
Employment Industries in Blount County
The major employment industries in Blount County include Manufacturing (4,172 | 16.8%), Retail Trade (3,268 | 13.2%), Health Care & Social Assistance (3,206 | 12.9%), Construction (2,467 | 9.9%), and Educational Services (1,764 | 7.1%).
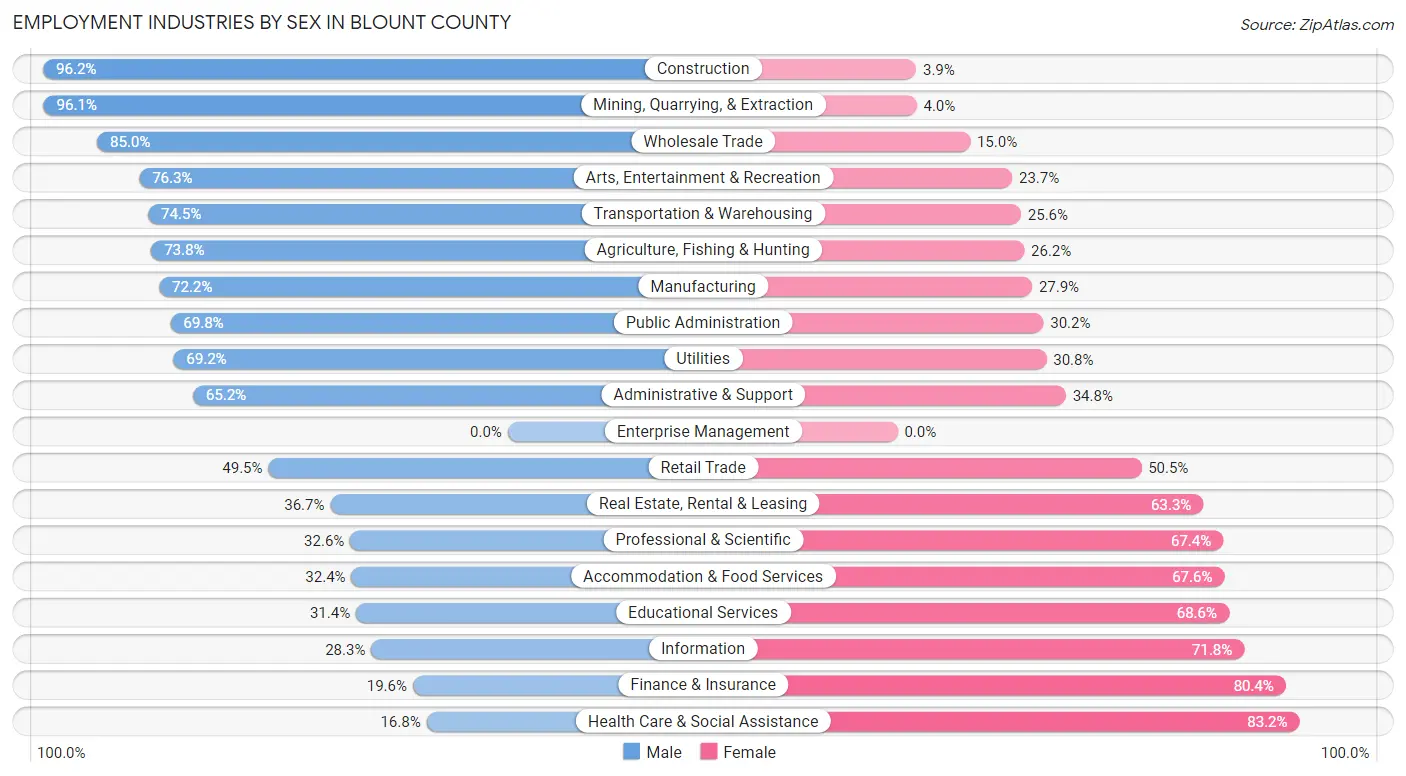
Employment Industries by Sex in Blount County
The Blount County industries that see more men than women are Construction (96.2%), Mining, Quarrying, & Extraction (96.1%), and Wholesale Trade (85.0%), whereas the industries that tend to have a higher number of women are Health Care & Social Assistance (83.2%), Finance & Insurance (80.4%), and Information (71.8%).
| Industry | Male | Female |
| Agriculture, Fishing & Hunting | 287 (73.8%) | 102 (26.2%) |
| Mining, Quarrying, & Extraction | 73 (96.1%) | 3 (4.0%) |
| Construction | 2,372 (96.2%) | 95 (3.8%) |
| Manufacturing | 3,010 (72.2%) | 1,162 (27.9%) |
| Wholesale Trade | 713 (85.0%) | 126 (15.0%) |
| Retail Trade | 1,619 (49.5%) | 1,649 (50.5%) |
| Transportation & Warehousing | 1,151 (74.5%) | 395 (25.6%) |
| Utilities | 256 (69.2%) | 114 (30.8%) |
| Information | 63 (28.2%) | 160 (71.8%) |
| Finance & Insurance | 163 (19.6%) | 667 (80.4%) |
| Real Estate, Rental & Leasing | 123 (36.7%) | 212 (63.3%) |
| Professional & Scientific | 300 (32.6%) | 620 (67.4%) |
| Enterprise Management | 0 (0.0%) | 0 (0.0%) |
| Administrative & Support | 679 (65.2%) | 363 (34.8%) |
| Educational Services | 554 (31.4%) | 1,210 (68.6%) |
| Health Care & Social Assistance | 539 (16.8%) | 2,667 (83.2%) |
| Arts, Entertainment & Recreation | 45 (76.3%) | 14 (23.7%) |
| Accommodation & Food Services | 389 (32.4%) | 813 (67.6%) |
| Public Administration | 585 (69.8%) | 253 (30.2%) |
| Total | 13,663 (55.0%) | 11,193 (45.0%) |
Education in Blount County
School Enrollment in Blount County
The most common levels of schooling among the 12,727 students in Blount County are elementary school (3,490 | 27.4%), high school (3,100 | 24.4%), and middle school (3,025 | 23.8%).
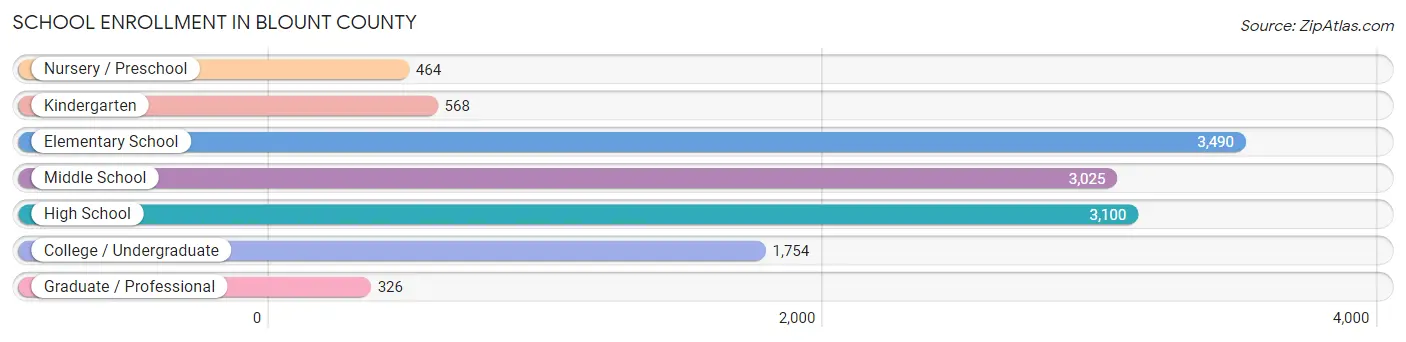
| School Level | # Students | % Students |
| Nursery / Preschool | 464 | 3.6% |
| Kindergarten | 568 | 4.5% |
| Elementary School | 3,490 | 27.4% |
| Middle School | 3,025 | 23.8% |
| High School | 3,100 | 24.4% |
| College / Undergraduate | 1,754 | 13.8% |
| Graduate / Professional | 326 | 2.6% |
| Total | 12,727 | 100.0% |
School Enrollment by Age by Funding Source in Blount County
Out of a total of 12,727 students who are enrolled in schools in Blount County, 1,235 (9.7%) attend a private institution, while the remaining 11,492 (90.3%) are enrolled in public schools. The age group of 35 years and over has the highest likelihood of being enrolled in private schools, with 159 (32.5% in the age bracket) enrolled. Conversely, the age group of 25 to 34 year olds has the lowest likelihood of being enrolled in a private school, with 609 (95.5% in the age bracket) attending a public institution.
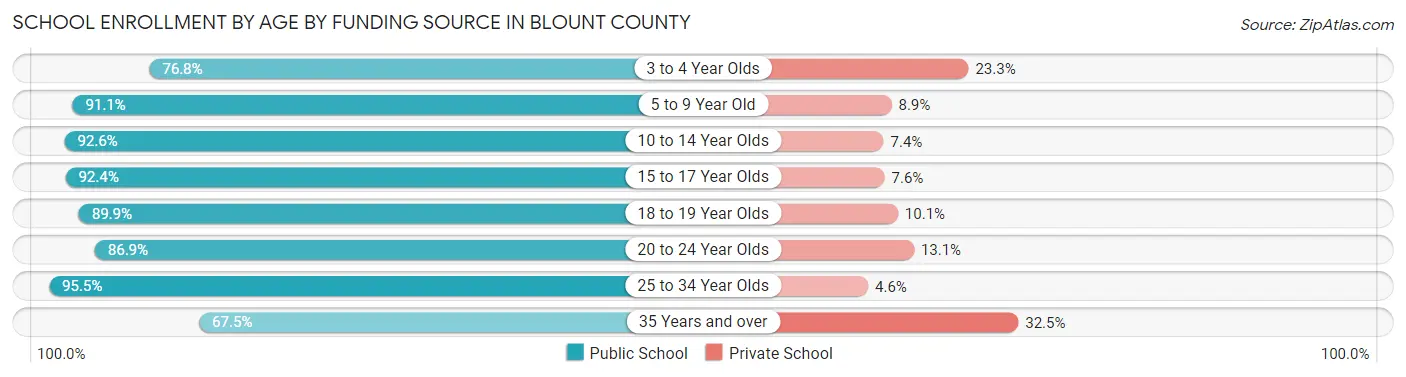
| Age Bracket | Public School | Private School |
| 3 to 4 Year Olds | 307 (76.7%) | 93 (23.3%) |
| 5 to 9 Year Old | 2,890 (91.1%) | 283 (8.9%) |
| 10 to 14 Year Olds | 3,788 (92.6%) | 304 (7.4%) |
| 15 to 17 Year Olds | 2,231 (92.4%) | 184 (7.6%) |
| 18 to 19 Year Olds | 659 (89.9%) | 74 (10.1%) |
| 20 to 24 Year Olds | 684 (86.9%) | 103 (13.1%) |
| 25 to 34 Year Olds | 609 (95.5%) | 29 (4.5%) |
| 35 Years and over | 330 (67.5%) | 159 (32.5%) |
| Total | 11,492 (90.3%) | 1,235 (9.7%) |
Educational Attainment by Field of Study in Blount County
Education (1,717 | 27.6%), science & technology (1,326 | 21.3%), business (1,178 | 18.9%), arts & humanities (297 | 4.8%), and engineering (244 | 3.9%) are the most common fields of study among 6,232 individuals in Blount County who have obtained a bachelor's degree or higher.
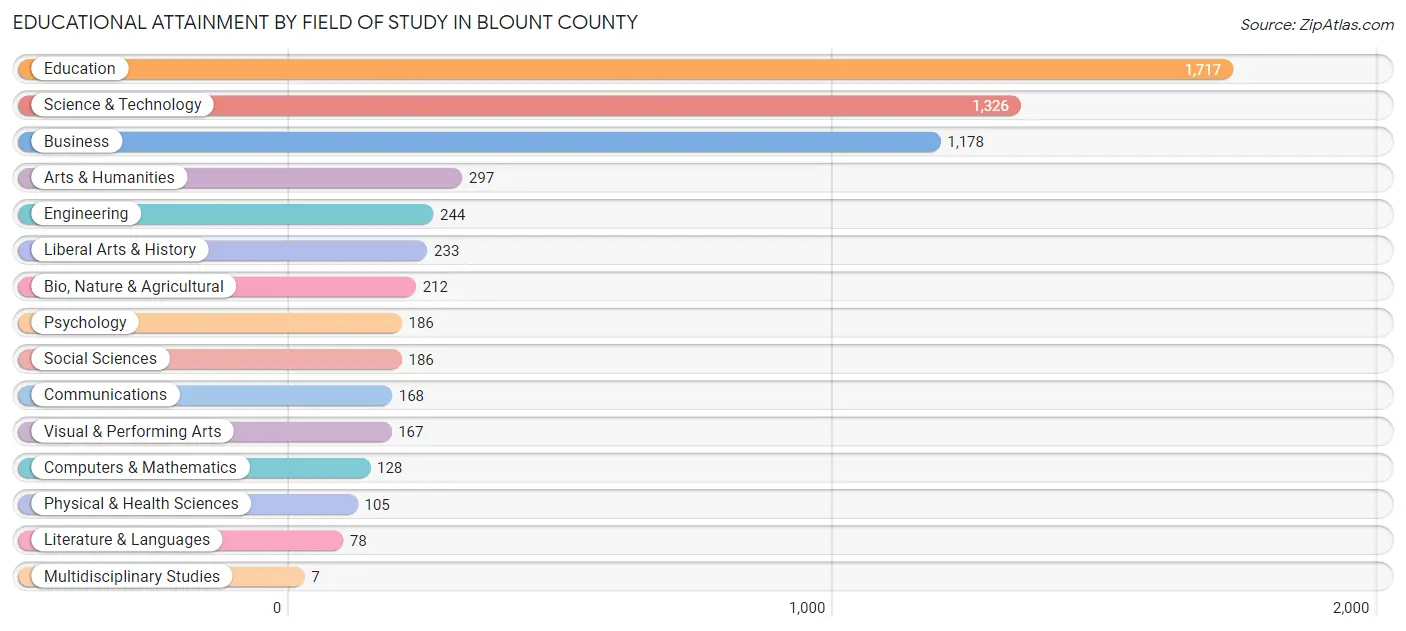
| Field of Study | # Graduates | % Graduates |
| Computers & Mathematics | 128 | 2.1% |
| Bio, Nature & Agricultural | 212 | 3.4% |
| Physical & Health Sciences | 105 | 1.7% |
| Psychology | 186 | 3.0% |
| Social Sciences | 186 | 3.0% |
| Engineering | 244 | 3.9% |
| Multidisciplinary Studies | 7 | 0.1% |
| Science & Technology | 1,326 | 21.3% |
| Business | 1,178 | 18.9% |
| Education | 1,717 | 27.6% |
| Literature & Languages | 78 | 1.3% |
| Liberal Arts & History | 233 | 3.7% |
| Visual & Performing Arts | 167 | 2.7% |
| Communications | 168 | 2.7% |
| Arts & Humanities | 297 | 4.8% |
| Total | 6,232 | 100.0% |
Transportation & Commute in Blount County
Vehicle Availability by Sex in Blount County
The most prevalent vehicle ownership categories in Blount County are males with 2 vehicles (4,302, accounting for 32.1%) and females with 2 vehicles (3,155, making up 39.2%).
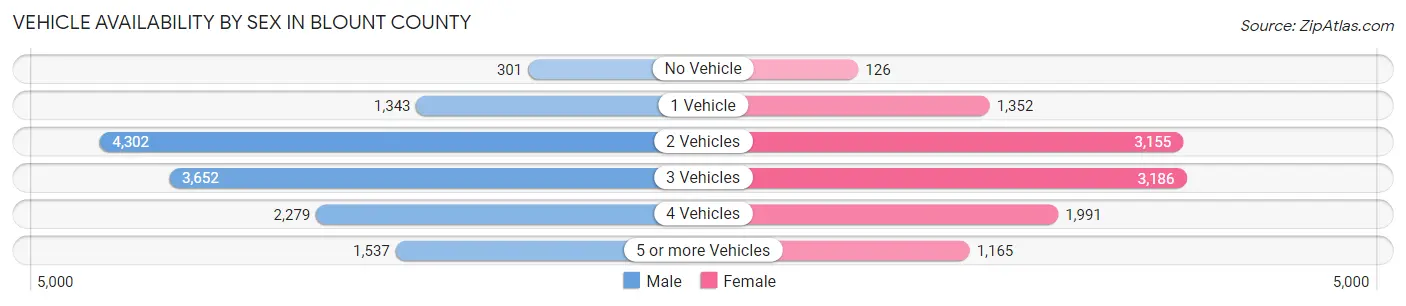
| Vehicles Available | Male | Female |
| No Vehicle | 301 (2.2%) | 126 (1.1%) |
| 1 Vehicle | 1,343 (10.0%) | 1,352 (12.3%) |
| 2 Vehicles | 4,302 (32.1%) | 3,155 (28.7%) |
| 3 Vehicles | 3,652 (27.2%) | 3,186 (29.0%) |
| 4 Vehicles | 2,279 (17.0%) | 1,991 (18.1%) |
| 5 or more Vehicles | 1,537 (11.5%) | 1,165 (10.6%) |
| Total | 13,414 (100.0%) | 10,975 (100.0%) |
Commute Time in Blount County
The most frequently occuring commute durations in Blount County are 45 to 59 minutes (4,670 commuters, 20.0%), 60 to 89 minutes (3,611 commuters, 15.4%), and 30 to 34 minutes (3,264 commuters, 14.0%).
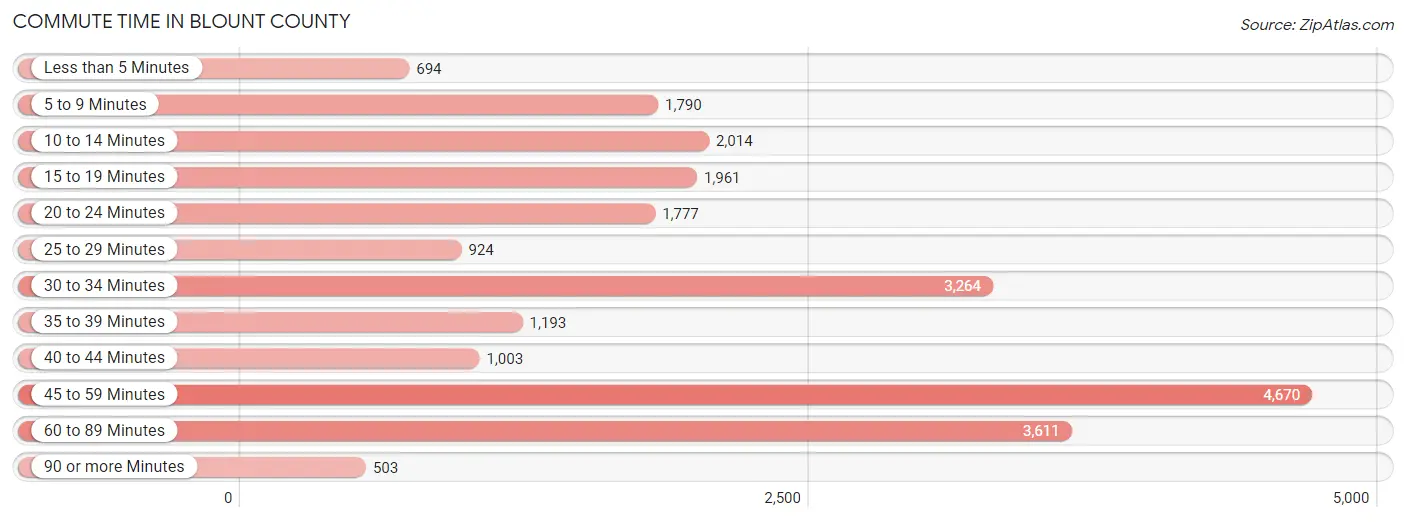
| Commute Time | # Commuters | % Commuters |
| Less than 5 Minutes | 694 | 3.0% |
| 5 to 9 Minutes | 1,790 | 7.6% |
| 10 to 14 Minutes | 2,014 | 8.6% |
| 15 to 19 Minutes | 1,961 | 8.4% |
| 20 to 24 Minutes | 1,777 | 7.6% |
| 25 to 29 Minutes | 924 | 4.0% |
| 30 to 34 Minutes | 3,264 | 14.0% |
| 35 to 39 Minutes | 1,193 | 5.1% |
| 40 to 44 Minutes | 1,003 | 4.3% |
| 45 to 59 Minutes | 4,670 | 20.0% |
| 60 to 89 Minutes | 3,611 | 15.4% |
| 90 or more Minutes | 503 | 2.1% |
Commute Time by Sex in Blount County
The most common commute times in Blount County are 45 to 59 minutes (2,815 commuters, 21.7%) for males and 45 to 59 minutes (1,855 commuters, 17.8%) for females.
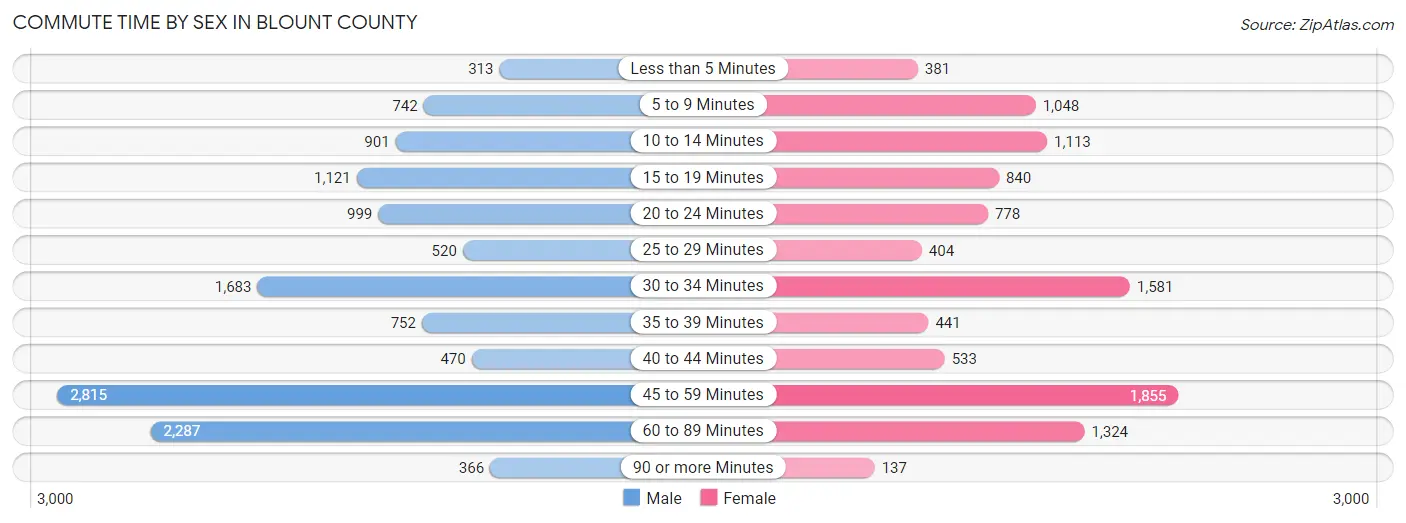
| Commute Time | Male | Female |
| Less than 5 Minutes | 313 (2.4%) | 381 (3.6%) |
| 5 to 9 Minutes | 742 (5.7%) | 1,048 (10.0%) |
| 10 to 14 Minutes | 901 (7.0%) | 1,113 (10.7%) |
| 15 to 19 Minutes | 1,121 (8.6%) | 840 (8.1%) |
| 20 to 24 Minutes | 999 (7.7%) | 778 (7.5%) |
| 25 to 29 Minutes | 520 (4.0%) | 404 (3.9%) |
| 30 to 34 Minutes | 1,683 (13.0%) | 1,581 (15.1%) |
| 35 to 39 Minutes | 752 (5.8%) | 441 (4.2%) |
| 40 to 44 Minutes | 470 (3.6%) | 533 (5.1%) |
| 45 to 59 Minutes | 2,815 (21.7%) | 1,855 (17.8%) |
| 60 to 89 Minutes | 2,287 (17.6%) | 1,324 (12.7%) |
| 90 or more Minutes | 366 (2.8%) | 137 (1.3%) |
Time of Departure to Work by Sex in Blount County
The most frequent times of departure to work in Blount County are 6:00 AM to 6:29 AM (2,115, 16.3%) for males and 6:00 AM to 6:29 AM (1,568, 15.0%) for females.
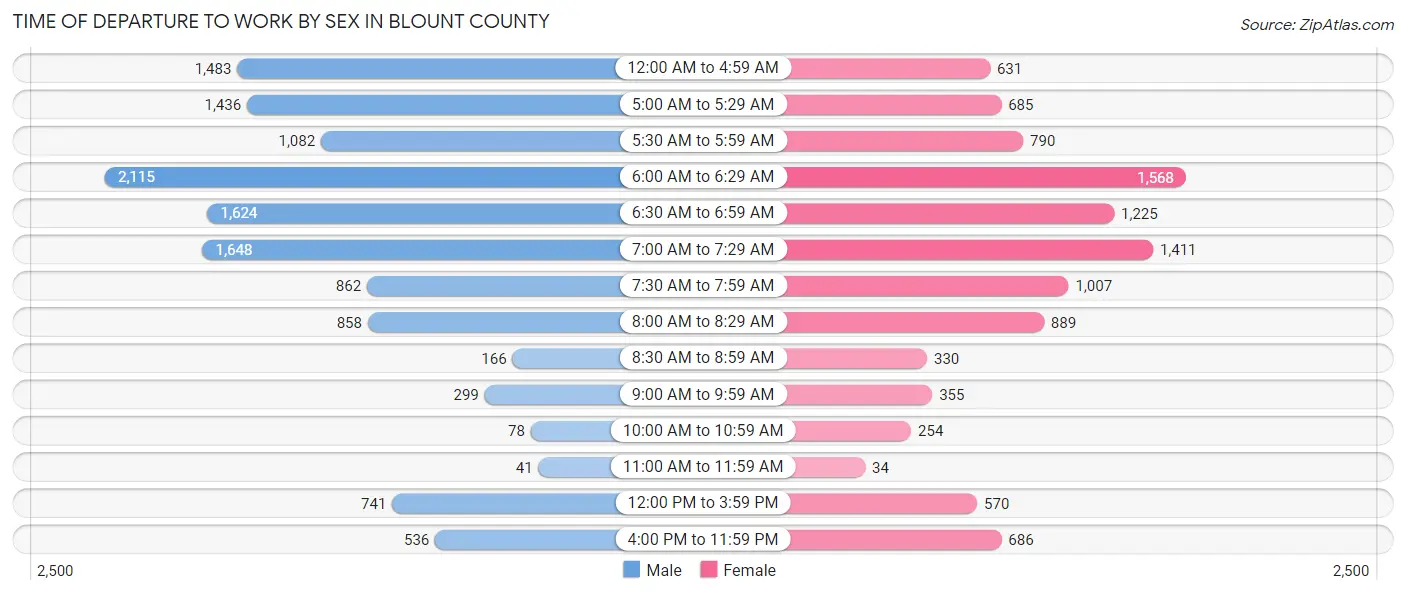
| Time of Departure | Male | Female |
| 12:00 AM to 4:59 AM | 1,483 (11.4%) | 631 (6.0%) |
| 5:00 AM to 5:29 AM | 1,436 (11.1%) | 685 (6.6%) |
| 5:30 AM to 5:59 AM | 1,082 (8.3%) | 790 (7.6%) |
| 6:00 AM to 6:29 AM | 2,115 (16.3%) | 1,568 (15.0%) |
| 6:30 AM to 6:59 AM | 1,624 (12.5%) | 1,225 (11.7%) |
| 7:00 AM to 7:29 AM | 1,648 (12.7%) | 1,411 (13.5%) |
| 7:30 AM to 7:59 AM | 862 (6.7%) | 1,007 (9.7%) |
| 8:00 AM to 8:29 AM | 858 (6.6%) | 889 (8.5%) |
| 8:30 AM to 8:59 AM | 166 (1.3%) | 330 (3.2%) |
| 9:00 AM to 9:59 AM | 299 (2.3%) | 355 (3.4%) |
| 10:00 AM to 10:59 AM | 78 (0.6%) | 254 (2.4%) |
| 11:00 AM to 11:59 AM | 41 (0.3%) | 34 (0.3%) |
| 12:00 PM to 3:59 PM | 741 (5.7%) | 570 (5.5%) |
| 4:00 PM to 11:59 PM | 536 (4.1%) | 686 (6.6%) |
| Total | 12,969 (100.0%) | 10,435 (100.0%) |
Housing Occupancy in Blount County
Occupancy by Ownership in Blount County
Of the total 21,626 dwellings in Blount County, owner-occupied units account for 17,144 (79.3%), while renter-occupied units make up 4,482 (20.7%).
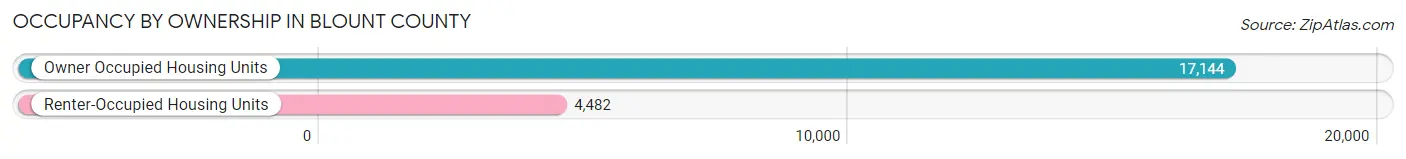
| Occupancy | # Housing Units | % Housing Units |
| Owner Occupied Housing Units | 17,144 | 79.3% |
| Renter-Occupied Housing Units | 4,482 | 20.7% |
| Total Occupied Housing Units | 21,626 | 100.0% |
Occupancy by Household Size in Blount County
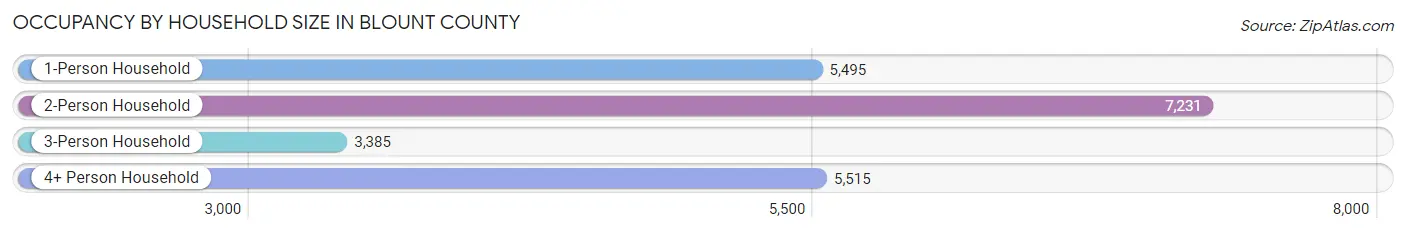
| Household Size | # Housing Units | % Housing Units |
| 1-Person Household | 5,495 | 25.4% |
| 2-Person Household | 7,231 | 33.4% |
| 3-Person Household | 3,385 | 15.7% |
| 4+ Person Household | 5,515 | 25.5% |
| Total Housing Units | 21,626 | 100.0% |
Occupancy by Ownership by Household Size in Blount County
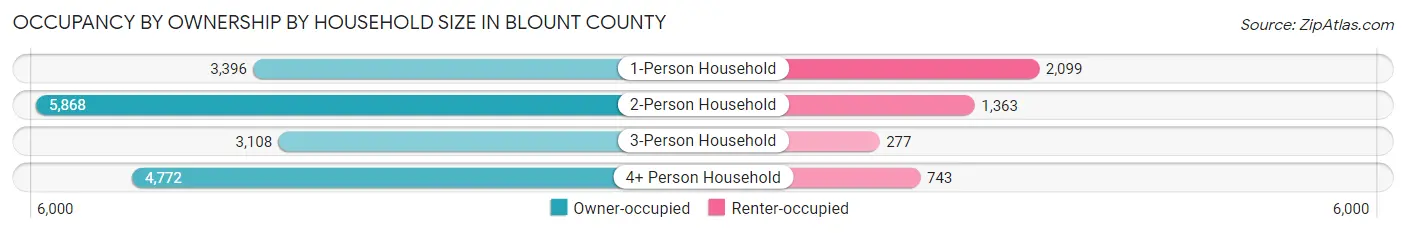
| Household Size | Owner-occupied | Renter-occupied |
| 1-Person Household | 3,396 (61.8%) | 2,099 (38.2%) |
| 2-Person Household | 5,868 (81.1%) | 1,363 (18.9%) |
| 3-Person Household | 3,108 (91.8%) | 277 (8.2%) |
| 4+ Person Household | 4,772 (86.5%) | 743 (13.5%) |
| Total Housing Units | 17,144 (79.3%) | 4,482 (20.7%) |
Occupancy by Educational Attainment in Blount County
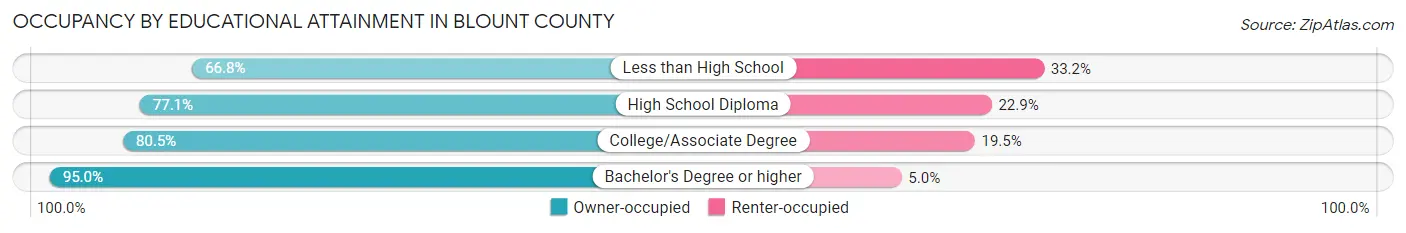
| Household Size | Owner-occupied | Renter-occupied |
| Less than High School | 2,472 (66.8%) | 1,231 (33.2%) |
| High School Diploma | 5,525 (77.1%) | 1,637 (22.9%) |
| College/Associate Degree | 5,973 (80.5%) | 1,447 (19.5%) |
| Bachelor's Degree or higher | 3,174 (95.0%) | 167 (5.0%) |
Occupancy by Age of Householder in Blount County
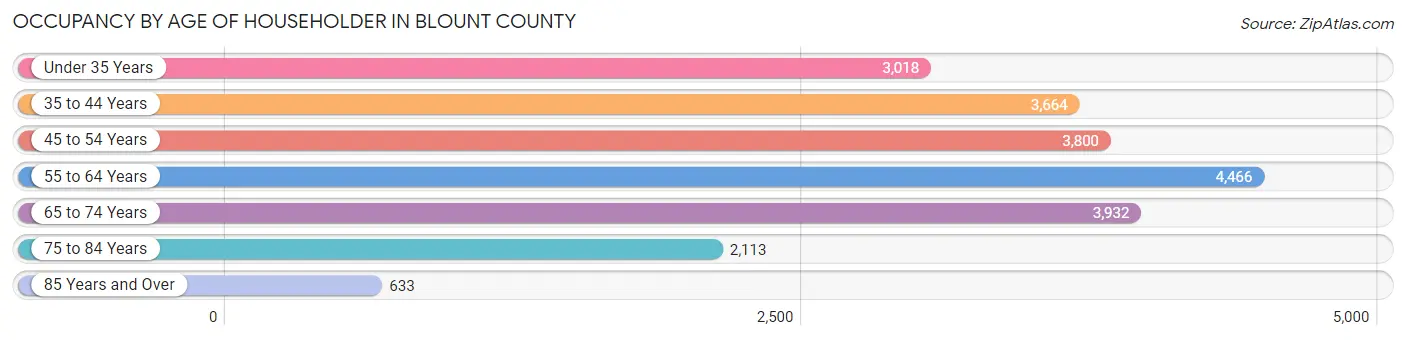
| Age Bracket | # Households | % Households |
| Under 35 Years | 3,018 | 14.0% |
| 35 to 44 Years | 3,664 | 16.9% |
| 45 to 54 Years | 3,800 | 17.6% |
| 55 to 64 Years | 4,466 | 20.6% |
| 65 to 74 Years | 3,932 | 18.2% |
| 75 to 84 Years | 2,113 | 9.8% |
| 85 Years and Over | 633 | 2.9% |
| Total | 21,626 | 100.0% |
Housing Finances in Blount County
Median Income by Occupancy in Blount County
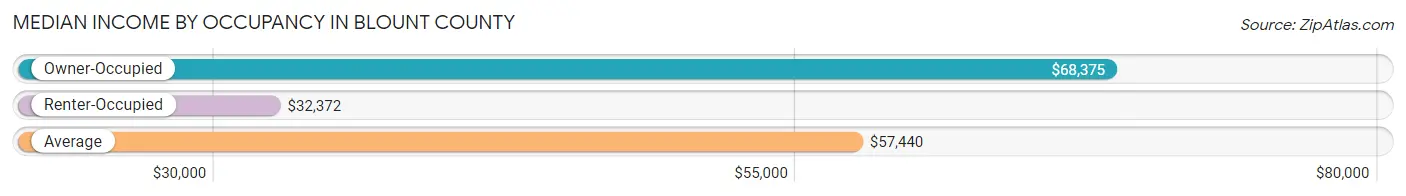
| Occupancy Type | # Households | Median Income |
| Owner-Occupied | 17,144 (79.3%) | $68,375 |
| Renter-Occupied | 4,482 (20.7%) | $32,372 |
| Average | 21,626 (100.0%) | $57,440 |
Occupancy by Householder Income Bracket in Blount County
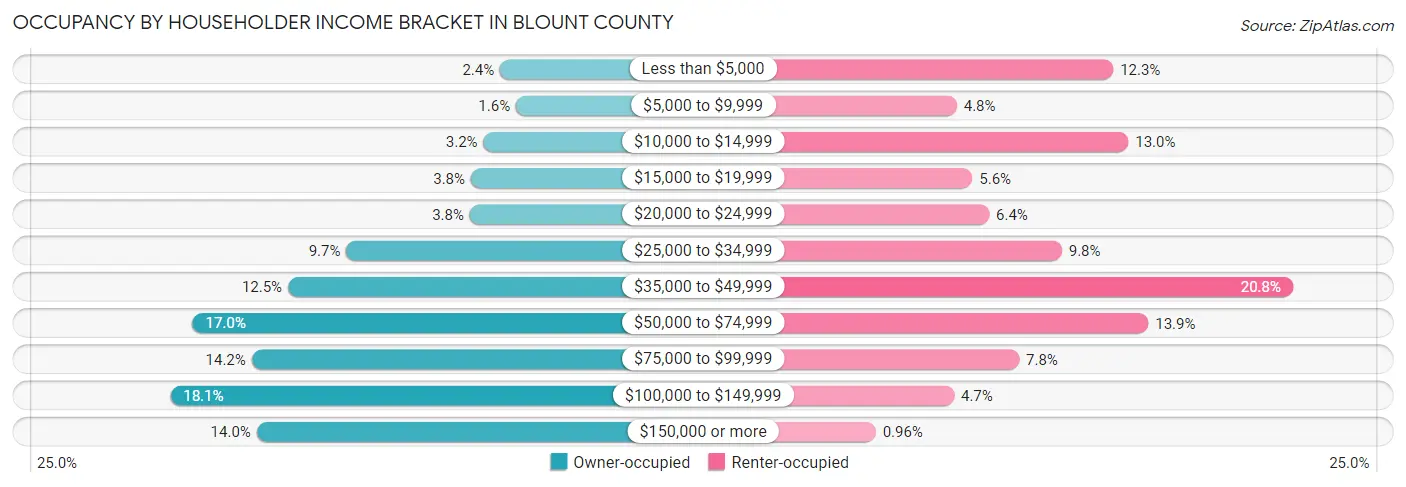
| Income Bracket | Owner-occupied | Renter-occupied |
| Less than $5,000 | 404 (2.4%) | 550 (12.3%) |
| $5,000 to $9,999 | 275 (1.6%) | 216 (4.8%) |
| $10,000 to $14,999 | 540 (3.2%) | 582 (13.0%) |
| $15,000 to $19,999 | 643 (3.7%) | 249 (5.6%) |
| $20,000 to $24,999 | 651 (3.8%) | 285 (6.4%) |
| $25,000 to $34,999 | 1,660 (9.7%) | 440 (9.8%) |
| $35,000 to $49,999 | 2,136 (12.5%) | 933 (20.8%) |
| $50,000 to $74,999 | 2,914 (17.0%) | 625 (13.9%) |
| $75,000 to $99,999 | 2,433 (14.2%) | 349 (7.8%) |
| $100,000 to $149,999 | 3,097 (18.1%) | 210 (4.7%) |
| $150,000 or more | 2,391 (14.0%) | 43 (1.0%) |
| Total | 17,144 (100.0%) | 4,482 (100.0%) |
Monthly Housing Cost Tiers in Blount County
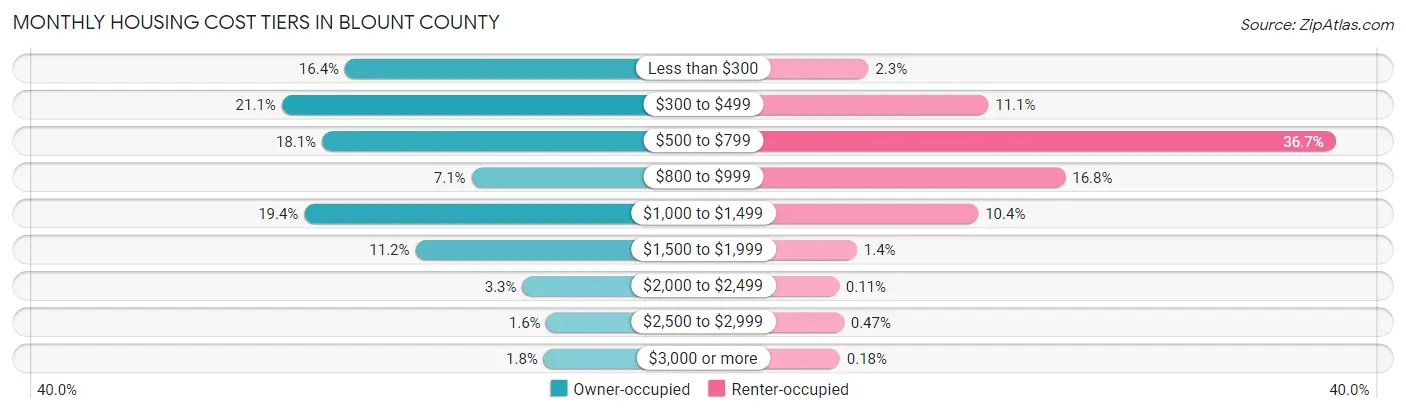
| Monthly Cost | Owner-occupied | Renter-occupied |
| Less than $300 | 2,814 (16.4%) | 102 (2.3%) |
| $300 to $499 | 3,613 (21.1%) | 498 (11.1%) |
| $500 to $799 | 3,103 (18.1%) | 1,644 (36.7%) |
| $800 to $999 | 1,216 (7.1%) | 752 (16.8%) |
| $1,000 to $1,499 | 3,328 (19.4%) | 465 (10.4%) |
| $1,500 to $1,999 | 1,923 (11.2%) | 64 (1.4%) |
| $2,000 to $2,499 | 573 (3.3%) | 5 (0.1%) |
| $2,500 to $2,999 | 270 (1.6%) | 21 (0.5%) |
| $3,000 or more | 304 (1.8%) | 8 (0.2%) |
| Total | 17,144 (100.0%) | 4,482 (100.0%) |
Physical Housing Characteristics in Blount County
Housing Structures in Blount County
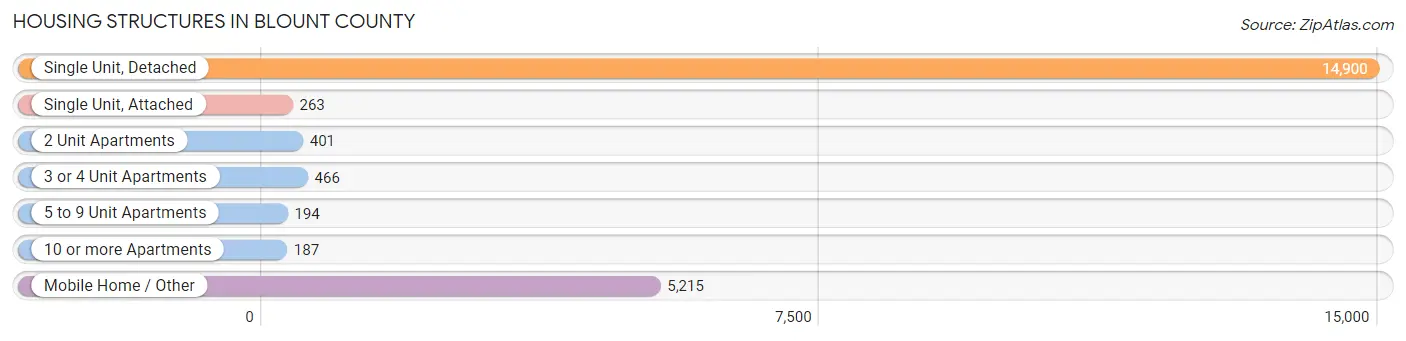
| Structure Type | # Housing Units | % Housing Units |
| Single Unit, Detached | 14,900 | 68.9% |
| Single Unit, Attached | 263 | 1.2% |
| 2 Unit Apartments | 401 | 1.8% |
| 3 or 4 Unit Apartments | 466 | 2.1% |
| 5 to 9 Unit Apartments | 194 | 0.9% |
| 10 or more Apartments | 187 | 0.9% |
| Mobile Home / Other | 5,215 | 24.1% |
| Total | 21,626 | 100.0% |
Housing Structures by Occupancy in Blount County
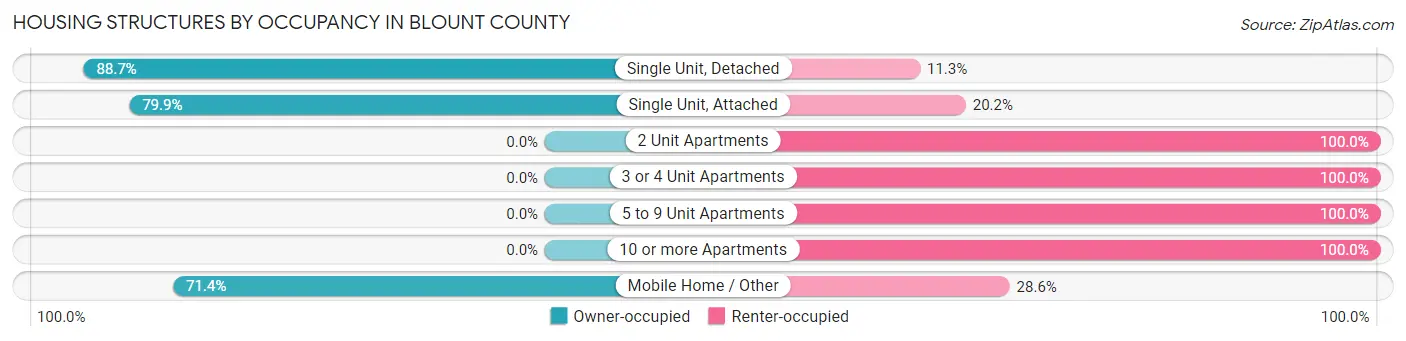
| Structure Type | Owner-occupied | Renter-occupied |
| Single Unit, Detached | 13,210 (88.7%) | 1,690 (11.3%) |
| Single Unit, Attached | 210 (79.8%) | 53 (20.2%) |
| 2 Unit Apartments | 0 (0.0%) | 401 (100.0%) |
| 3 or 4 Unit Apartments | 0 (0.0%) | 466 (100.0%) |
| 5 to 9 Unit Apartments | 0 (0.0%) | 194 (100.0%) |
| 10 or more Apartments | 0 (0.0%) | 187 (100.0%) |
| Mobile Home / Other | 3,724 (71.4%) | 1,491 (28.6%) |
| Total | 17,144 (79.3%) | 4,482 (20.7%) |
Housing Structures by Number of Rooms in Blount County
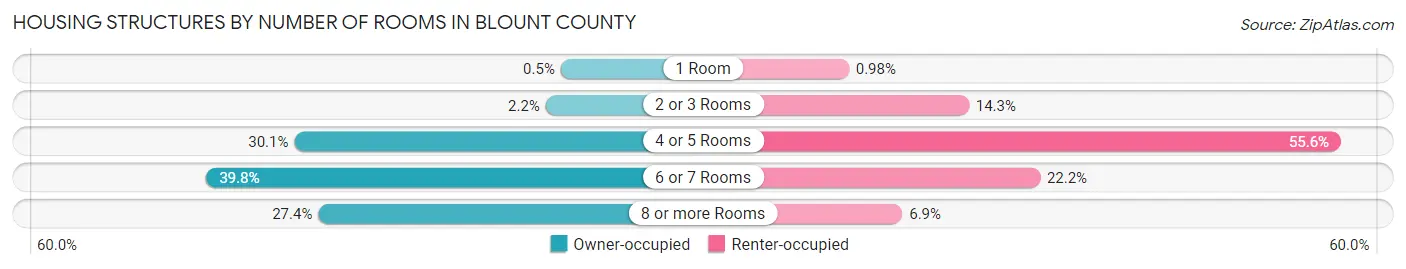
| Number of Rooms | Owner-occupied | Renter-occupied |
| 1 Room | 86 (0.5%) | 44 (1.0%) |
| 2 or 3 Rooms | 372 (2.2%) | 641 (14.3%) |
| 4 or 5 Rooms | 5,156 (30.1%) | 2,492 (55.6%) |
| 6 or 7 Rooms | 6,831 (39.8%) | 995 (22.2%) |
| 8 or more Rooms | 4,699 (27.4%) | 310 (6.9%) |
| Total | 17,144 (100.0%) | 4,482 (100.0%) |
Housing Structure by Heating Type in Blount County
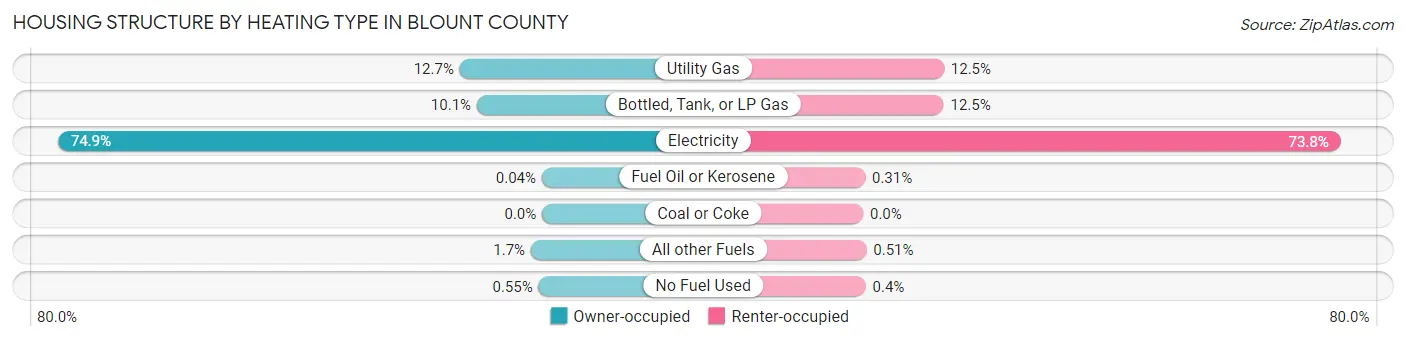
| Heating Type | Owner-occupied | Renter-occupied |
| Utility Gas | 2,183 (12.7%) | 560 (12.5%) |
| Bottled, Tank, or LP Gas | 1,728 (10.1%) | 558 (12.4%) |
| Electricity | 12,835 (74.9%) | 3,309 (73.8%) |
| Fuel Oil or Kerosene | 7 (0.0%) | 14 (0.3%) |
| Coal or Coke | 0 (0.0%) | 0 (0.0%) |
| All other Fuels | 297 (1.7%) | 23 (0.5%) |
| No Fuel Used | 94 (0.5%) | 18 (0.4%) |
| Total | 17,144 (100.0%) | 4,482 (100.0%) |
Household Vehicle Usage in Blount County
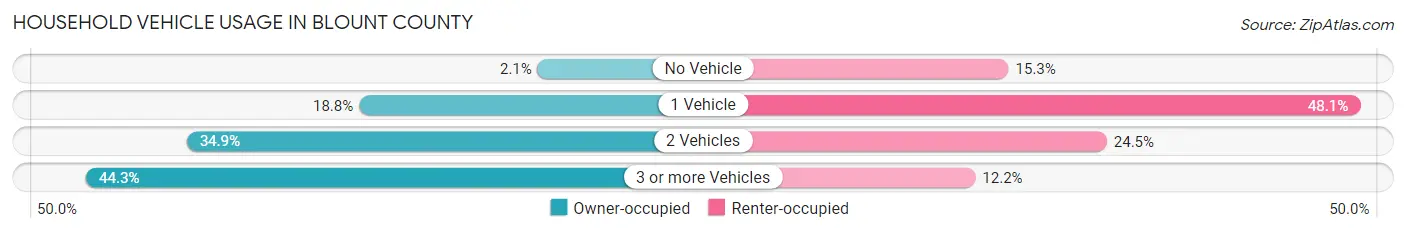
| Vehicles per Household | Owner-occupied | Renter-occupied |
| No Vehicle | 362 (2.1%) | 685 (15.3%) |
| 1 Vehicle | 3,220 (18.8%) | 2,155 (48.1%) |
| 2 Vehicles | 5,976 (34.9%) | 1,096 (24.4%) |
| 3 or more Vehicles | 7,586 (44.3%) | 546 (12.2%) |
| Total | 17,144 (100.0%) | 4,482 (100.0%) |
Real Estate & Mortgages in Blount County
Real Estate and Mortgage Overview in Blount County
| Characteristic | Without Mortgage | With Mortgage |
| Housing Units | 8,497 | 8,647 |
| Median Property Value | $120,200 | $179,200 |
| Median Household Income | $54,696 | $1,721 |
| Monthly Housing Costs | $380 | $285 |
| Real Estate Taxes | $337 | $1,057 |
Property Value by Mortgage Status in Blount County
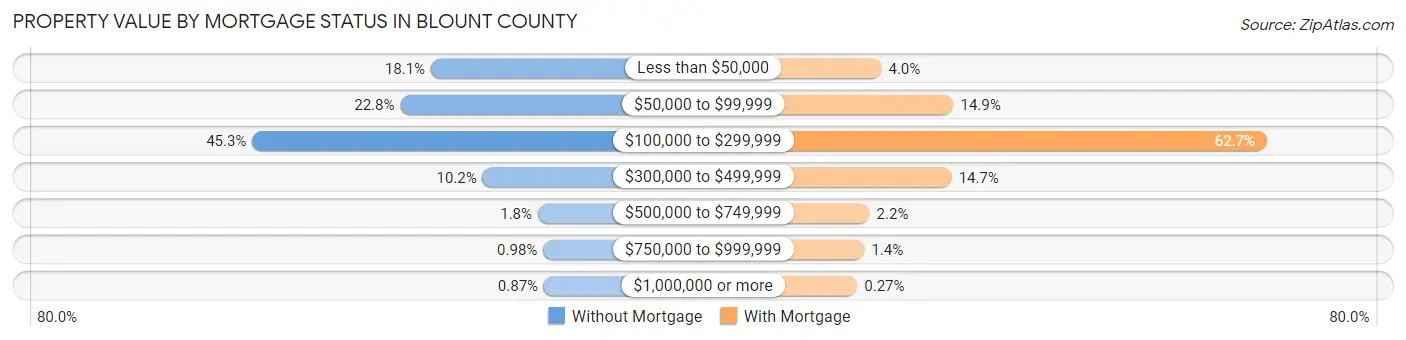
| Property Value | Without Mortgage | With Mortgage |
| Less than $50,000 | 1,536 (18.1%) | 342 (4.0%) |
| $50,000 to $99,999 | 1,933 (22.8%) | 1,291 (14.9%) |
| $100,000 to $299,999 | 3,851 (45.3%) | 5,420 (62.7%) |
| $300,000 to $499,999 | 868 (10.2%) | 1,267 (14.6%) |
| $500,000 to $749,999 | 152 (1.8%) | 186 (2.1%) |
| $750,000 to $999,999 | 83 (1.0%) | 118 (1.4%) |
| $1,000,000 or more | 74 (0.9%) | 23 (0.3%) |
| Total | 8,497 (100.0%) | 8,647 (100.0%) |
Household Income by Mortgage Status in Blount County
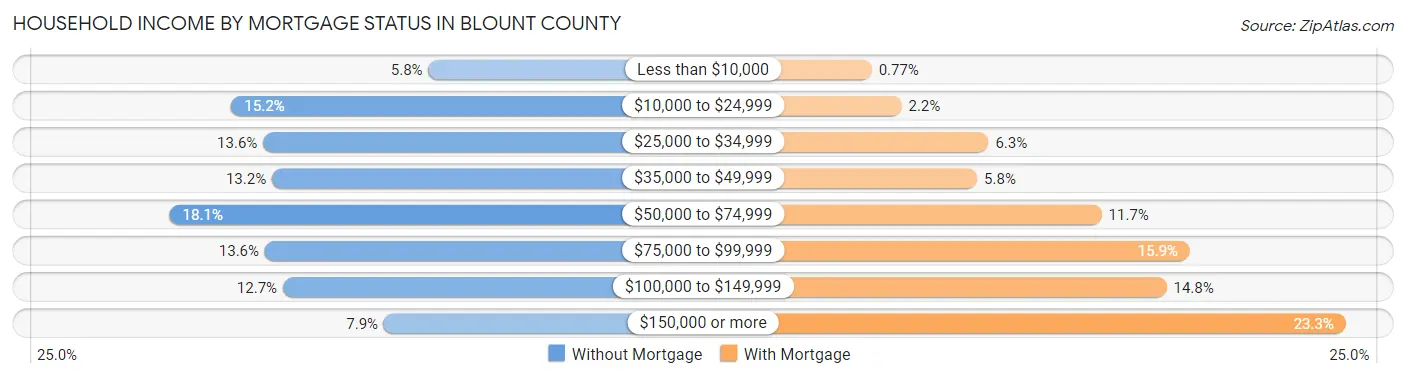
| Household Income | Without Mortgage | With Mortgage |
| Less than $10,000 | 490 (5.8%) | 67 (0.8%) |
| $10,000 to $24,999 | 1,287 (15.1%) | 189 (2.2%) |
| $25,000 to $34,999 | 1,159 (13.6%) | 547 (6.3%) |
| $35,000 to $49,999 | 1,123 (13.2%) | 501 (5.8%) |
| $50,000 to $74,999 | 1,537 (18.1%) | 1,013 (11.7%) |
| $75,000 to $99,999 | 1,152 (13.6%) | 1,377 (15.9%) |
| $100,000 to $149,999 | 1,079 (12.7%) | 1,281 (14.8%) |
| $150,000 or more | 670 (7.9%) | 2,018 (23.3%) |
| Total | 8,497 (100.0%) | 8,647 (100.0%) |
Property Value to Household Income Ratio in Blount County
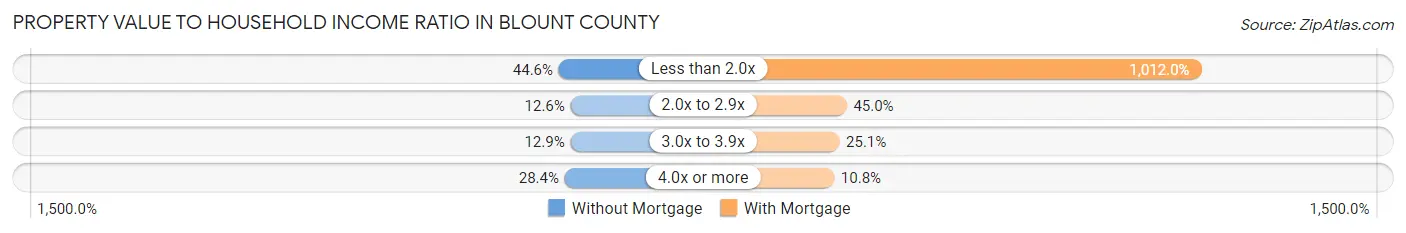
| Value-to-Income Ratio | Without Mortgage | With Mortgage |
| Less than 2.0x | 3,789 (44.6%) | 87,507 (1,012.0%) |
| 2.0x to 2.9x | 1,069 (12.6%) | 3,894 (45.0%) |
| 3.0x to 3.9x | 1,095 (12.9%) | 2,170 (25.1%) |
| 4.0x or more | 2,411 (28.4%) | 935 (10.8%) |
| Total | 8,497 (100.0%) | 8,647 (100.0%) |
Real Estate Taxes by Mortgage Status in Blount County
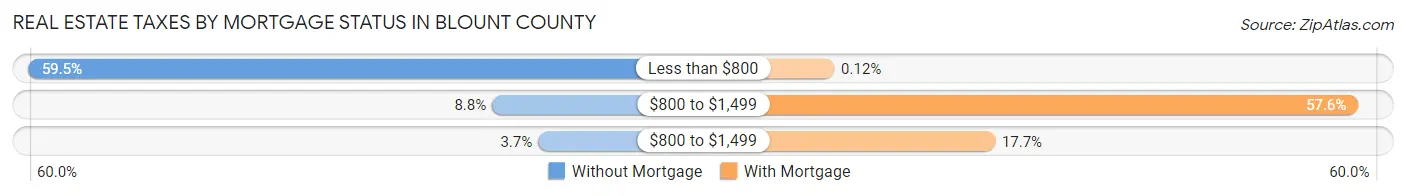
| Property Taxes | Without Mortgage | With Mortgage |
| Less than $800 | 5,059 (59.5%) | 10 (0.1%) |
| $800 to $1,499 | 745 (8.8%) | 4,976 (57.6%) |
| $800 to $1,499 | 317 (3.7%) | 1,534 (17.7%) |
| Total | 8,497 (100.0%) | 8,647 (100.0%) |
Health & Disability in Blount County
Health Insurance Coverage by Age in Blount County
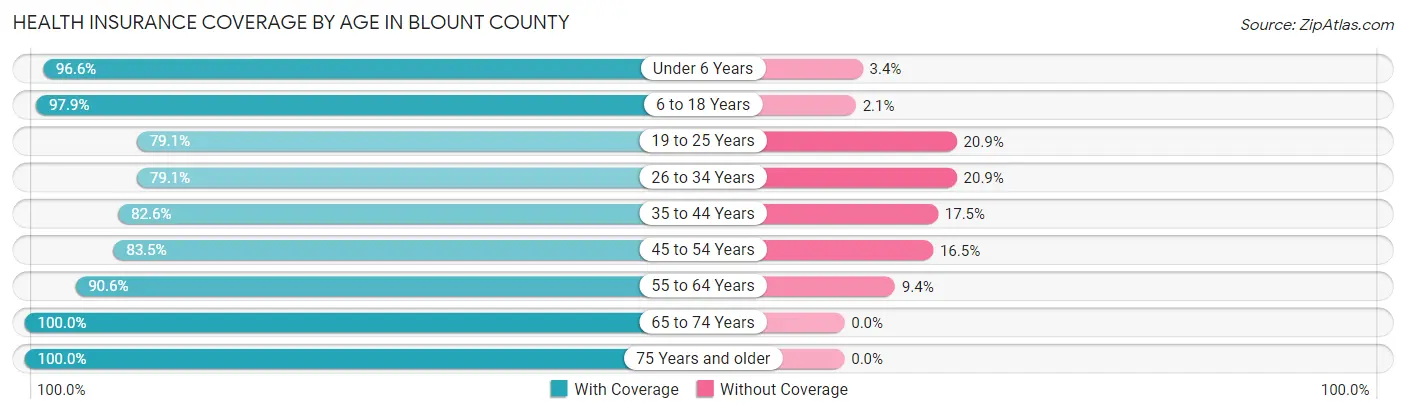
| Age Bracket | With Coverage | Without Coverage |
| Under 6 Years | 3,788 (96.6%) | 134 (3.4%) |
| 6 to 18 Years | 9,958 (97.9%) | 217 (2.1%) |
| 19 to 25 Years | 4,052 (79.1%) | 1,072 (20.9%) |
| 26 to 34 Years | 4,747 (79.1%) | 1,257 (20.9%) |
| 35 to 44 Years | 5,829 (82.6%) | 1,232 (17.4%) |
| 45 to 54 Years | 6,434 (83.5%) | 1,275 (16.5%) |
| 55 to 64 Years | 7,300 (90.6%) | 761 (9.4%) |
| 65 to 74 Years | 6,192 (100.0%) | 0 (0.0%) |
| 75 Years and older | 4,339 (100.0%) | 0 (0.0%) |
| Total | 52,639 (89.8%) | 5,948 (10.2%) |
Health Insurance Coverage by Citizenship Status in Blount County
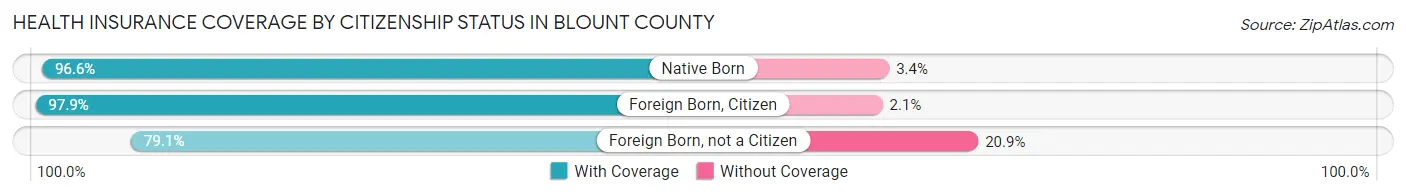
| Citizenship Status | With Coverage | Without Coverage |
| Native Born | 3,788 (96.6%) | 134 (3.4%) |
| Foreign Born, Citizen | 9,958 (97.9%) | 217 (2.1%) |
| Foreign Born, not a Citizen | 4,052 (79.1%) | 1,072 (20.9%) |
Health Insurance Coverage by Household Income in Blount County
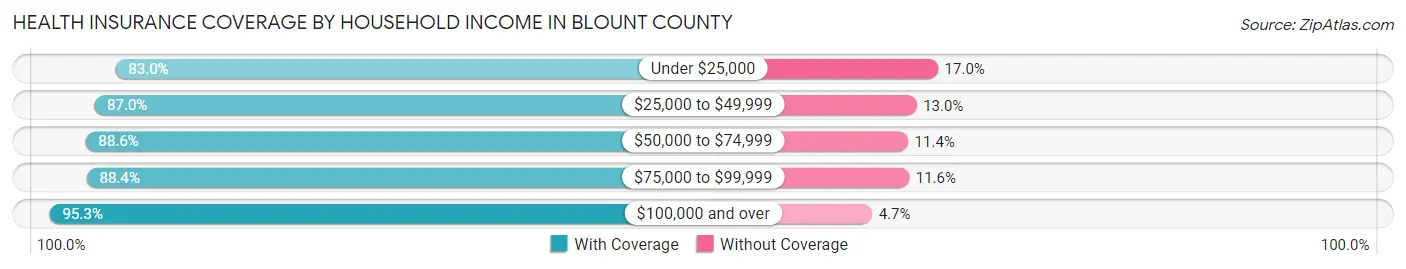
| Household Income | With Coverage | Without Coverage |
| Under $25,000 | 6,085 (83.0%) | 1,248 (17.0%) |
| $25,000 to $49,999 | 10,409 (87.0%) | 1,556 (13.0%) |
| $50,000 to $74,999 | 9,106 (88.6%) | 1,172 (11.4%) |
| $75,000 to $99,999 | 7,500 (88.4%) | 985 (11.6%) |
| $100,000 and over | 19,427 (95.3%) | 952 (4.7%) |
Public vs Private Health Insurance Coverage by Age in Blount County
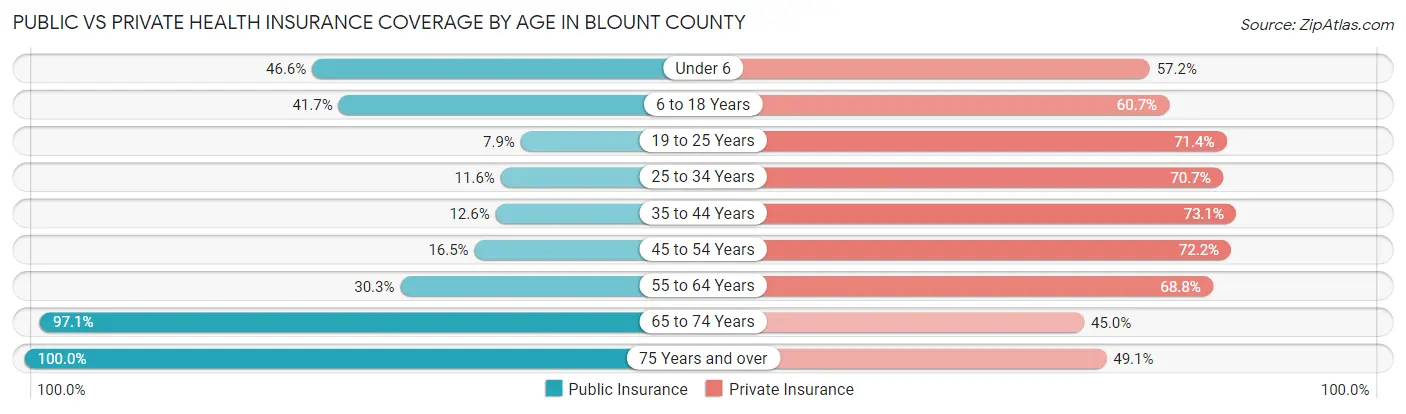
| Age Bracket | Public Insurance | Private Insurance |
| Under 6 | 1,829 (46.6%) | 2,242 (57.2%) |
| 6 to 18 Years | 4,247 (41.7%) | 6,177 (60.7%) |
| 19 to 25 Years | 406 (7.9%) | 3,656 (71.4%) |
| 25 to 34 Years | 699 (11.6%) | 4,242 (70.7%) |
| 35 to 44 Years | 890 (12.6%) | 5,164 (73.1%) |
| 45 to 54 Years | 1,272 (16.5%) | 5,568 (72.2%) |
| 55 to 64 Years | 2,439 (30.3%) | 5,548 (68.8%) |
| 65 to 74 Years | 6,014 (97.1%) | 2,785 (45.0%) |
| 75 Years and over | 4,339 (100.0%) | 2,130 (49.1%) |
| Total | 22,135 (37.8%) | 37,512 (64.0%) |
Disability Status by Sex by Age in Blount County
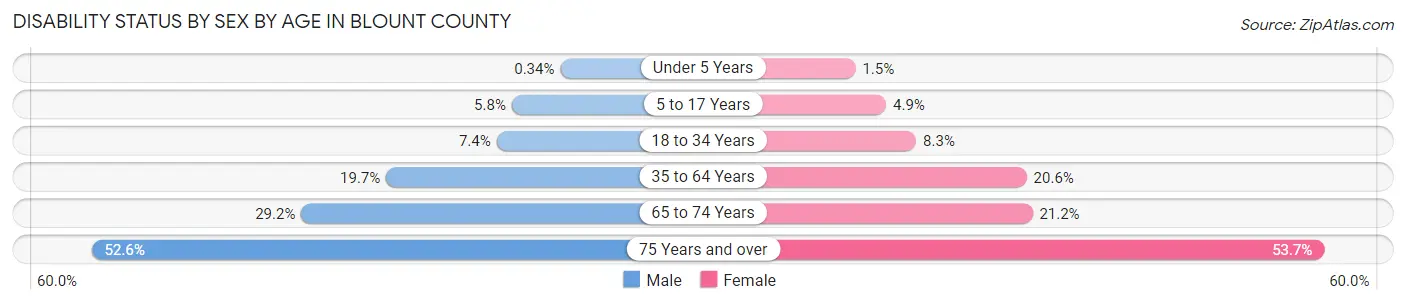
| Age Bracket | Male | Female |
| Under 5 Years | 6 (0.3%) | 25 (1.5%) |
| 5 to 17 Years | 311 (5.8%) | 234 (4.9%) |
| 18 to 34 Years | 448 (7.4%) | 467 (8.3%) |
| 35 to 64 Years | 2,299 (19.7%) | 2,303 (20.6%) |
| 65 to 74 Years | 849 (29.2%) | 697 (21.2%) |
| 75 Years and over | 979 (52.5%) | 1,330 (53.7%) |
Disability Class by Sex by Age in Blount County
Disability Class: Hearing Difficulty
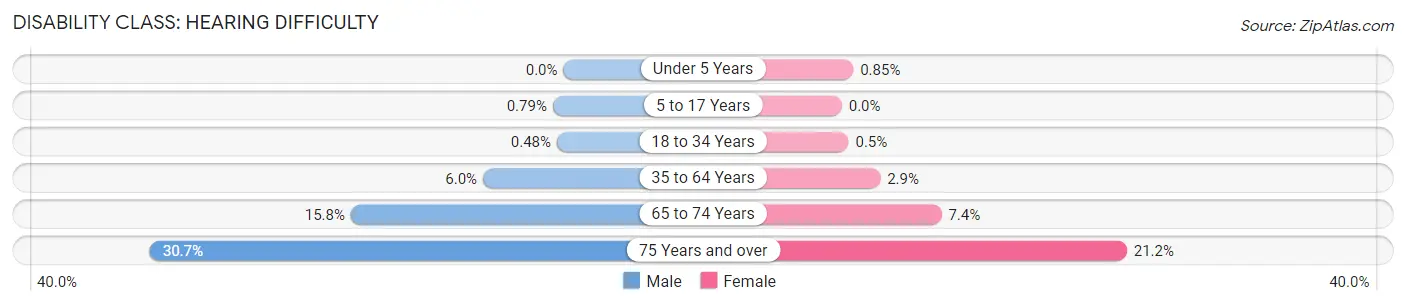
| Age Bracket | Male | Female |
| Under 5 Years | 0 (0.0%) | 14 (0.9%) |
| 5 to 17 Years | 43 (0.8%) | 0 (0.0%) |
| 18 to 34 Years | 29 (0.5%) | 28 (0.5%) |
| 35 to 64 Years | 695 (6.0%) | 319 (2.9%) |
| 65 to 74 Years | 459 (15.8%) | 243 (7.4%) |
| 75 Years and over | 572 (30.7%) | 524 (21.2%) |
Disability Class: Vision Difficulty
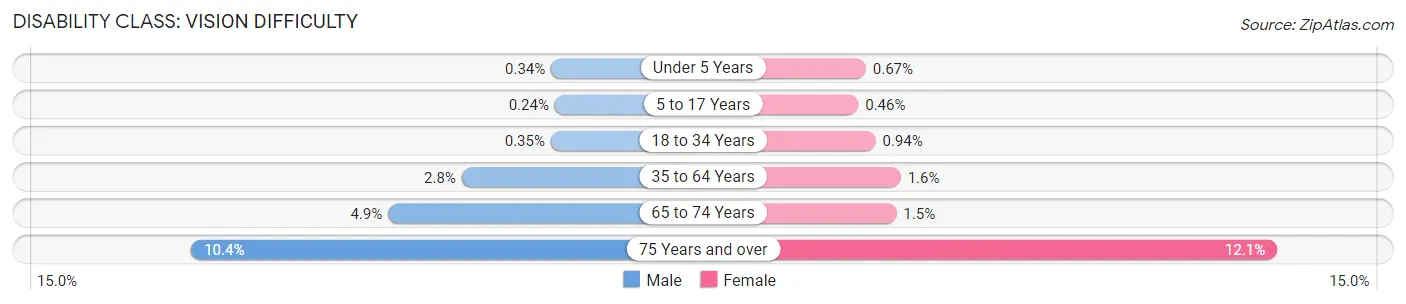
| Age Bracket | Male | Female |
| Under 5 Years | 6 (0.3%) | 11 (0.7%) |
| 5 to 17 Years | 13 (0.2%) | 22 (0.5%) |
| 18 to 34 Years | 21 (0.4%) | 53 (0.9%) |
| 35 to 64 Years | 329 (2.8%) | 183 (1.6%) |
| 65 to 74 Years | 142 (4.9%) | 50 (1.5%) |
| 75 Years and over | 193 (10.4%) | 300 (12.1%) |
Disability Class: Cognitive Difficulty
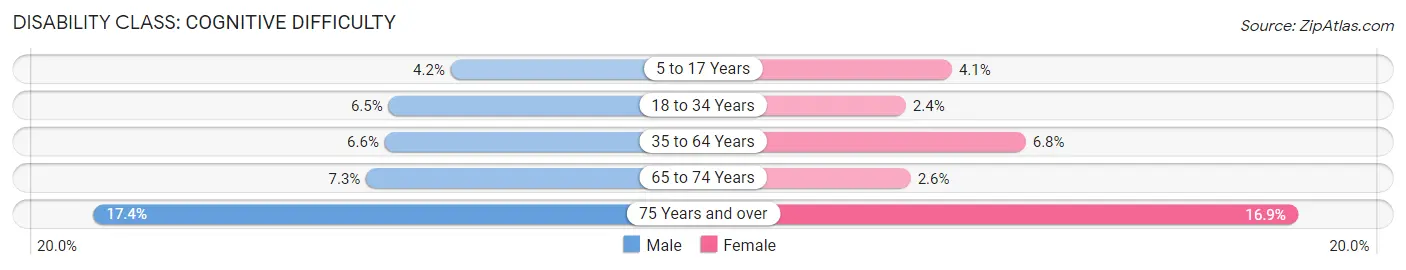
| Age Bracket | Male | Female |
| 5 to 17 Years | 226 (4.2%) | 194 (4.1%) |
| 18 to 34 Years | 391 (6.5%) | 134 (2.4%) |
| 35 to 64 Years | 772 (6.6%) | 764 (6.8%) |
| 65 to 74 Years | 213 (7.3%) | 84 (2.6%) |
| 75 Years and over | 325 (17.4%) | 419 (16.9%) |
Disability Class: Ambulatory Difficulty
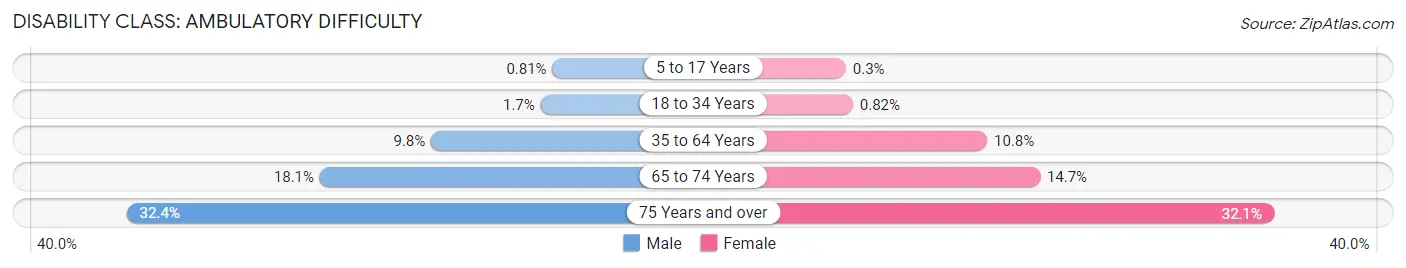
| Age Bracket | Male | Female |
| 5 to 17 Years | 44 (0.8%) | 14 (0.3%) |
| 18 to 34 Years | 102 (1.7%) | 46 (0.8%) |
| 35 to 64 Years | 1,144 (9.8%) | 1,207 (10.8%) |
| 65 to 74 Years | 526 (18.1%) | 483 (14.7%) |
| 75 Years and over | 604 (32.4%) | 794 (32.1%) |
Disability Class: Self-Care Difficulty
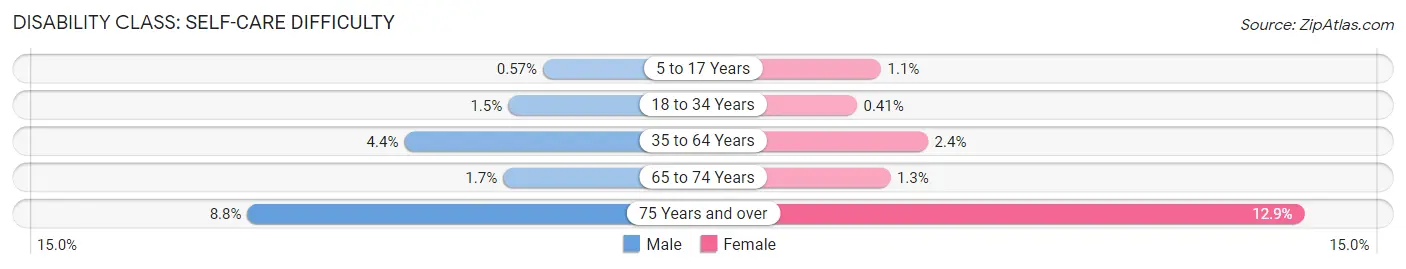
| Age Bracket | Male | Female |
| 5 to 17 Years | 31 (0.6%) | 51 (1.1%) |
| 18 to 34 Years | 93 (1.5%) | 23 (0.4%) |
| 35 to 64 Years | 516 (4.4%) | 267 (2.4%) |
| 65 to 74 Years | 49 (1.7%) | 44 (1.3%) |
| 75 Years and over | 164 (8.8%) | 319 (12.9%) |
Technology Access in Blount County
Computing Device Access in Blount County
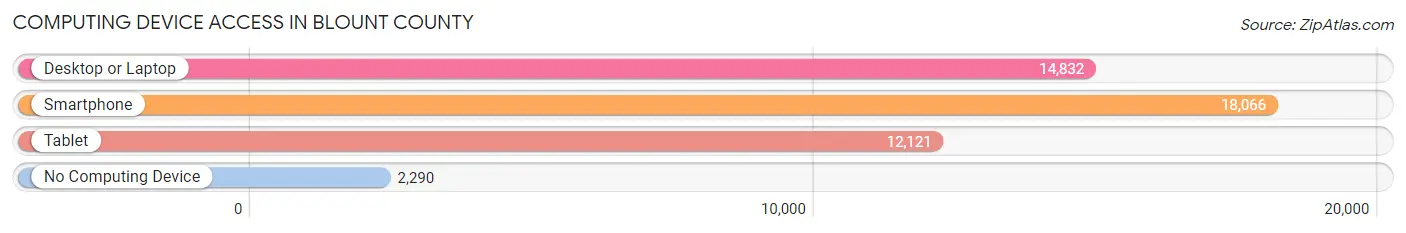
| Device Type | # Households | % Households |
| Desktop or Laptop | 14,832 | 68.6% |
| Smartphone | 18,066 | 83.5% |
| Tablet | 12,121 | 56.0% |
| No Computing Device | 2,290 | 10.6% |
| Total | 21,626 | 100.0% |
Internet Access in Blount County
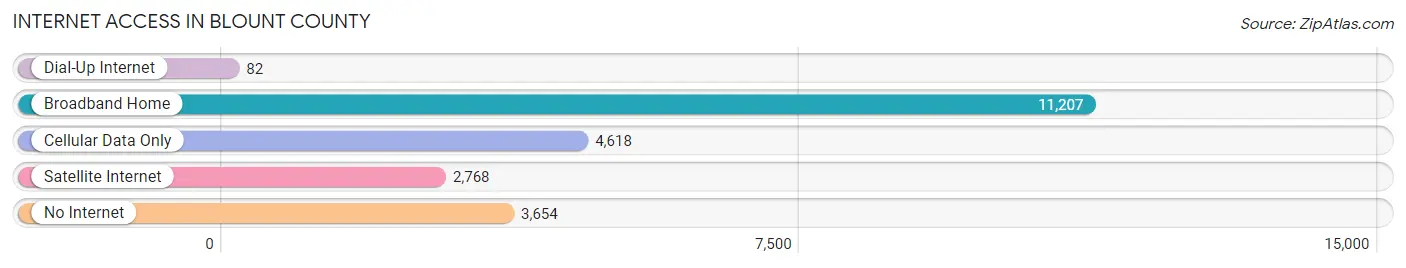
| Internet Type | # Households | % Households |
| Dial-Up Internet | 82 | 0.4% |
| Broadband Home | 11,207 | 51.8% |
| Cellular Data Only | 4,618 | 21.3% |
| Satellite Internet | 2,768 | 12.8% |
| No Internet | 3,654 | 16.9% |
| Total | 21,626 | 100.0% |
Blount County Summary
Blount County, Alabama is located in the northeastern part of the state and is part of the Birmingham-Hoover Metropolitan Statistical Area. It is bordered by Cullman County to the north, Marshall County to the east, Jefferson County to the south, and Walker County to the west. The county seat is Oneonta, and the largest city is Hayden.
History
Blount County was established in 1818 and named for Governor Willie Blount of Tennessee. The county was originally part of the Cherokee Nation, and the area was home to several Native American tribes, including the Creek, Chickasaw, and Cherokee. The county was part of the Trail of Tears, and many Native Americans were forced to relocate to Oklahoma in the 1830s.
The county was largely agricultural in the 19th century, with cotton and corn being the main crops. The county was also home to several iron ore mines, which provided jobs for many of the residents.
Geography
Blount County covers an area of 602 square miles and is located in the Appalachian Mountains. The terrain is mostly hilly, with the highest point being Mount Cheaha, which has an elevation of 2,407 feet. The county is drained by the Locust Fork of the Black Warrior River.
The climate is humid subtropical, with hot, humid summers and mild winters. The average annual temperature is 64°F, and the average annual precipitation is 52 inches.
Economy
The economy of Blount County is largely based on agriculture and manufacturing. The county is home to several large poultry farms, and poultry is the county’s largest agricultural product. Other agricultural products include cattle, hay, corn, and soybeans.
Manufacturing is also an important part of the economy, with several large factories located in the county. The largest employers in the county are the poultry farms, followed by the manufacturing plants.
Demographics
As of the 2010 census, the population of Blount County was 57,322. The population is predominantly white (86.3%), with African Americans making up 10.3% of the population. Other racial groups include Hispanics (2.2%), Asians (0.7%), and Native Americans (0.2%).
The median household income in the county is $45,845, and the median family income is $54,845. The per capita income is $22,845. The poverty rate is 17.3%, and the unemployment rate is 6.2%.
Blount County is served by the Blount County School System, which consists of 15 elementary schools, five middle schools, and four high schools. The county is also home to several private schools, including the Alabama School of Math and Science and the Alabama School of the Arts.
Common Questions
What is Per Capita Income in Blount County?
Per Capita income in Blount County is $29,053.
What is the Median Family Income in Blount County?
Median Family Income in Blount County is $73,528.
What is the Median Household income in Blount County?
Median Household Income in Blount County is $57,440.
What is Income or Wage Gap in Blount County?
Income or Wage Gap in Blount County is 28.7%.
Women in Blount County earn 71.3 cents for every dollar earned by a man.
What is Family Income Deficit in Blount County?
Family Income Deficit in Blount County is $9,719.
Families that are below poverty line in Blount County earn $9,719 less on average than the poverty threshold level.
What is Inequality or Gini Index in Blount County?
Inequality or Gini Index in Blount County is 0.45.
What is the Total Population of Blount County?
Total Population of Blount County is 59,077.
What is the Total Male Population of Blount County?
Total Male Population of Blount County is 29,864.
What is the Total Female Population of Blount County?
Total Female Population of Blount County is 29,213.
What is the Ratio of Males per 100 Females in Blount County?
There are 102.23 Males per 100 Females in Blount County.
What is the Ratio of Females per 100 Males in Blount County?
There are 97.82 Females per 100 Males in Blount County.
What is the Median Population Age in Blount County?
Median Population Age in Blount County is 40.8 Years.
What is the Average Family Size in Blount County
Average Family Size in Blount County is 3.2 People.
What is the Average Household Size in Blount County
Average Household Size in Blount County is 2.7 People.
How Large is the Labor Force in Blount County?
There are 26,466 People in the Labor Forcein in Blount County.
What is the Percentage of People in the Labor Force in Blount County?
56.0% of People are in the Labor Force in Blount County.
What is the Unemployment Rate in Blount County?
Unemployment Rate in Blount County is 6.0%.