Bessemer, AL Map & Demographics
Bessemer Map
Bessemer Overview
$22,622
PER CAPITA INCOME
$48,803
AVG FAMILY INCOME
$34,953
AVG HOUSEHOLD INCOME
11.7%
WAGE / INCOME GAP [ % ]
88.3¢/ $1
WAGE / INCOME GAP [ $ ]
0.50
INEQUALITY / GINI INDEX
25,890
TOTAL POPULATION
12,012
MALE POPULATION
13,878
FEMALE POPULATION
86.55
MALES / 100 FEMALES
115.53
FEMALES / 100 MALES
41.8
MEDIAN AGE
3.4
AVG FAMILY SIZE
2.4
AVG HOUSEHOLD SIZE
10,418
LABOR FORCE [ PEOPLE ]
49.9%
PERCENT IN LABOR FORCE
10.8%
UNEMPLOYMENT RATE
Bessemer Area Codes
Income in Bessemer
Income Overview in Bessemer
Per Capita Income in Bessemer is $22,622, while median incomes of families and households are $48,803 and $34,953 respectively.
| Characteristic | Number | Measure |
| Per Capita Income | 25,890 | $22,622 |
| Median Family Income | 5,558 | $48,803 |
| Mean Family Income | 5,558 | $65,473 |
| Median Household Income | 10,316 | $34,953 |
| Mean Household Income | 10,316 | $52,335 |
| Income Deficit | 5,558 | $0 |
| Wage / Income Gap (%) | 25,890 | 11.71% |
| Wage / Income Gap ($) | 25,890 | 88.29¢ per $1 |
| Gini / Inequality Index | 25,890 | 0.50 |
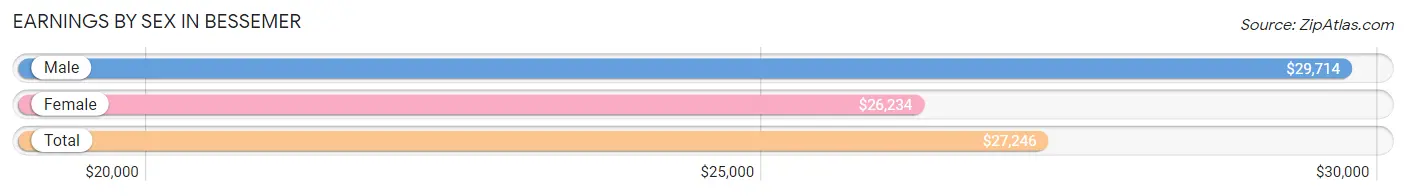
Earnings by Sex in Bessemer
Average Earnings in Bessemer are $27,246, $29,714 for men and $26,234 for women, a difference of 11.7%.
| Sex | Number | Average Earnings |
| Male | 5,049 (47.2%) | $29,714 |
| Female | 5,645 (52.8%) | $26,234 |
| Total | 10,694 (100.0%) | $27,246 |
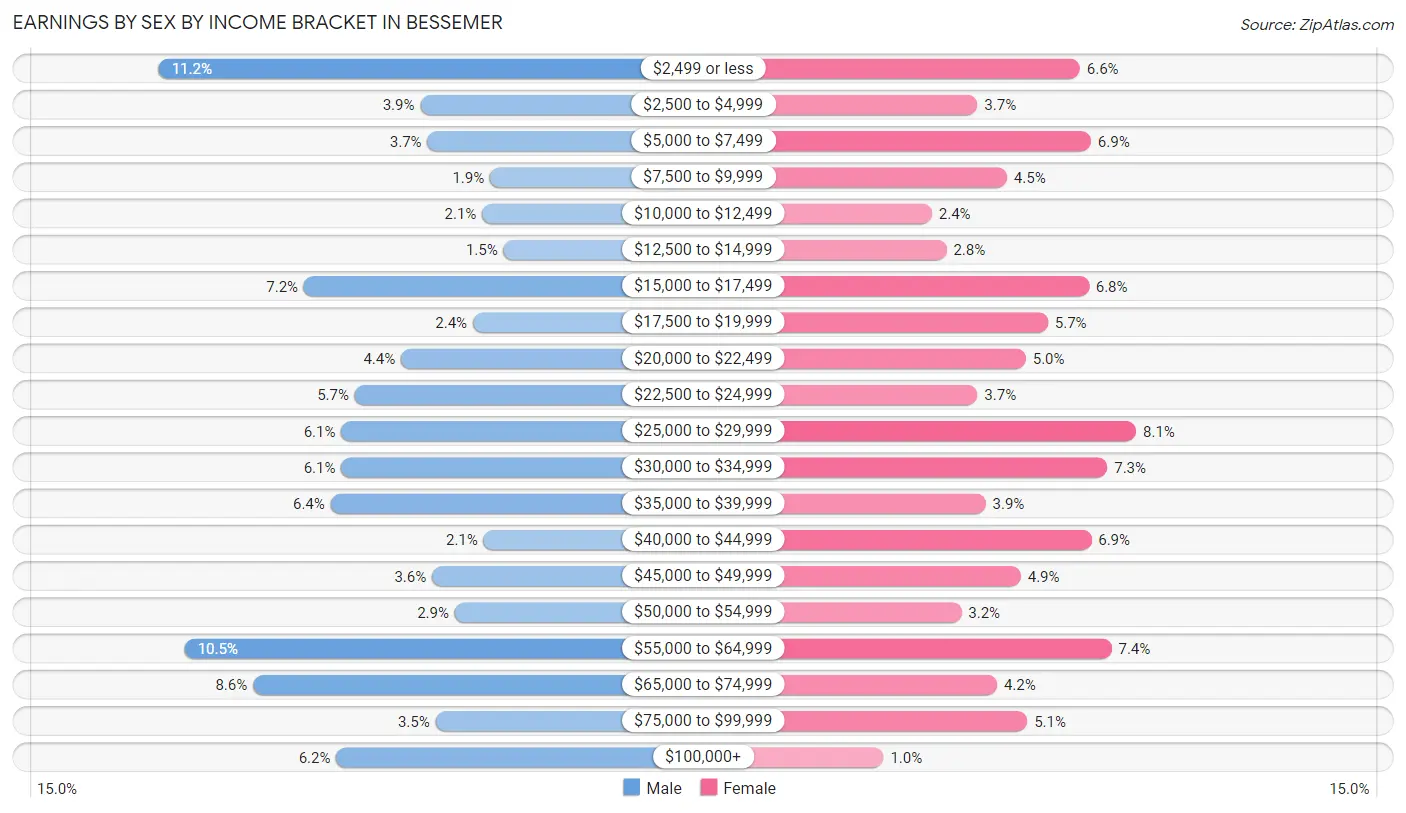
Earnings by Sex by Income Bracket in Bessemer
The most common earnings brackets in Bessemer are $2,499 or less for men (567 | 11.2%) and $25,000 to $29,999 for women (459 | 8.1%).
| Income | Male | Female |
| $2,499 or less | 567 (11.2%) | 370 (6.6%) |
| $2,500 to $4,999 | 196 (3.9%) | 207 (3.7%) |
| $5,000 to $7,499 | 186 (3.7%) | 387 (6.9%) |
| $7,500 to $9,999 | 97 (1.9%) | 254 (4.5%) |
| $10,000 to $12,499 | 108 (2.1%) | 135 (2.4%) |
| $12,500 to $14,999 | 78 (1.5%) | 158 (2.8%) |
| $15,000 to $17,499 | 361 (7.1%) | 384 (6.8%) |
| $17,500 to $19,999 | 121 (2.4%) | 319 (5.7%) |
| $20,000 to $22,499 | 223 (4.4%) | 284 (5.0%) |
| $22,500 to $24,999 | 289 (5.7%) | 207 (3.7%) |
| $25,000 to $29,999 | 308 (6.1%) | 459 (8.1%) |
| $30,000 to $34,999 | 308 (6.1%) | 413 (7.3%) |
| $35,000 to $39,999 | 323 (6.4%) | 220 (3.9%) |
| $40,000 to $44,999 | 106 (2.1%) | 388 (6.9%) |
| $45,000 to $49,999 | 179 (3.5%) | 276 (4.9%) |
| $50,000 to $54,999 | 147 (2.9%) | 182 (3.2%) |
| $55,000 to $64,999 | 530 (10.5%) | 420 (7.4%) |
| $65,000 to $74,999 | 433 (8.6%) | 238 (4.2%) |
| $75,000 to $99,999 | 174 (3.5%) | 286 (5.1%) |
| $100,000+ | 315 (6.2%) | 58 (1.0%) |
| Total | 5,049 (100.0%) | 5,645 (100.0%) |
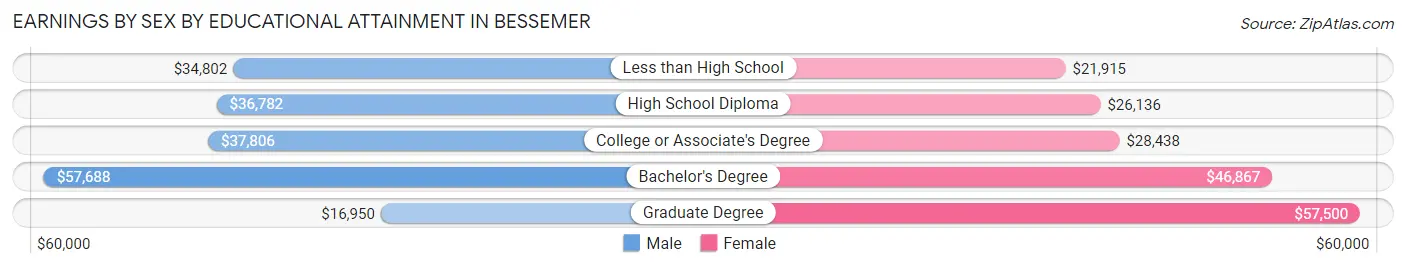
Earnings by Sex by Educational Attainment in Bessemer
Average earnings in Bessemer are $38,238 for men and $31,412 for women, a difference of 17.8%. Men with an educational attainment of bachelor's degree enjoy the highest average annual earnings of $57,688, while those with graduate degree education earn the least with $16,950. Women with an educational attainment of graduate degree earn the most with the average annual earnings of $57,500, while those with less than high school education have the smallest earnings of $21,915.
| Educational Attainment | Male Income | Female Income |
| Less than High School | $34,802 | $21,915 |
| High School Diploma | $36,782 | $26,136 |
| College or Associate's Degree | $37,806 | $28,438 |
| Bachelor's Degree | $57,688 | $46,867 |
| Graduate Degree | $16,950 | $57,500 |
| Total | $38,238 | $31,412 |
Family Income in Bessemer
Family Income Brackets in Bessemer
According to the Bessemer family income data, there are 989 families falling into the $50,000 to $74,999 income range, which is the most common income bracket and makes up 17.8% of all families. Conversely, the $200,000+ income bracket is the least frequent group with only 145 families (2.6%) belonging to this category.
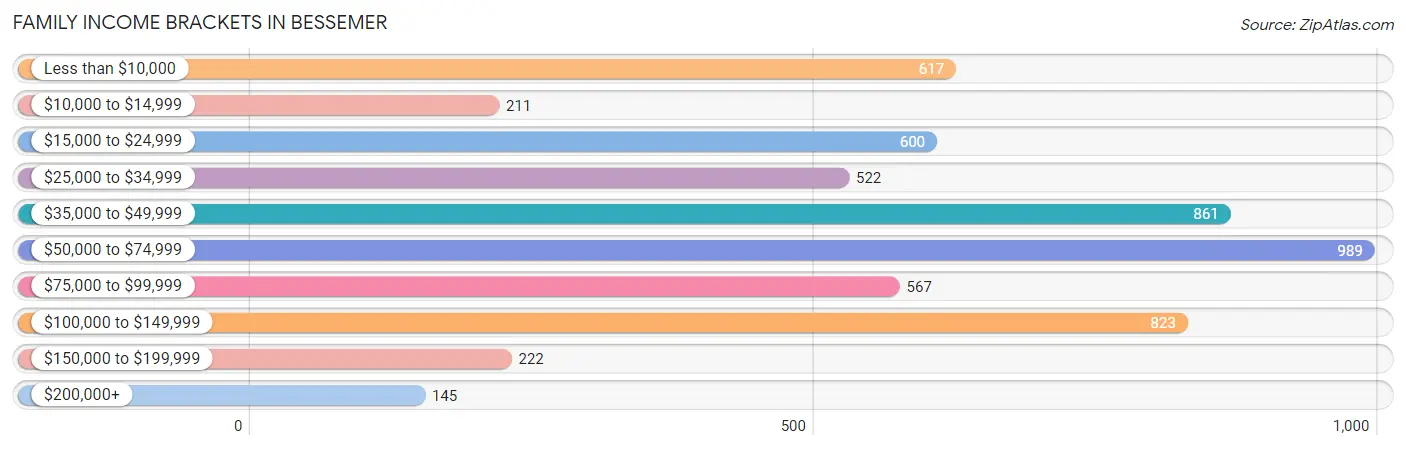
| Income Bracket | # Families | % Families |
| Less than $10,000 | 617 | 11.1% |
| $10,000 to $14,999 | 211 | 3.8% |
| $15,000 to $24,999 | 600 | 10.8% |
| $25,000 to $34,999 | 522 | 9.4% |
| $35,000 to $49,999 | 861 | 15.5% |
| $50,000 to $74,999 | 989 | 17.8% |
| $75,000 to $99,999 | 567 | 10.2% |
| $100,000 to $149,999 | 823 | 14.8% |
| $150,000 to $199,999 | 222 | 4.0% |
| $200,000+ | 145 | 2.6% |
Family Income by Famaliy Size in Bessemer
7+ person families (81 | 1.5%) account for the highest median family income in Bessemer with $59,338 per family, while 2-person families (2,838 | 51.1%) have the highest median income of $23,940 per family member.
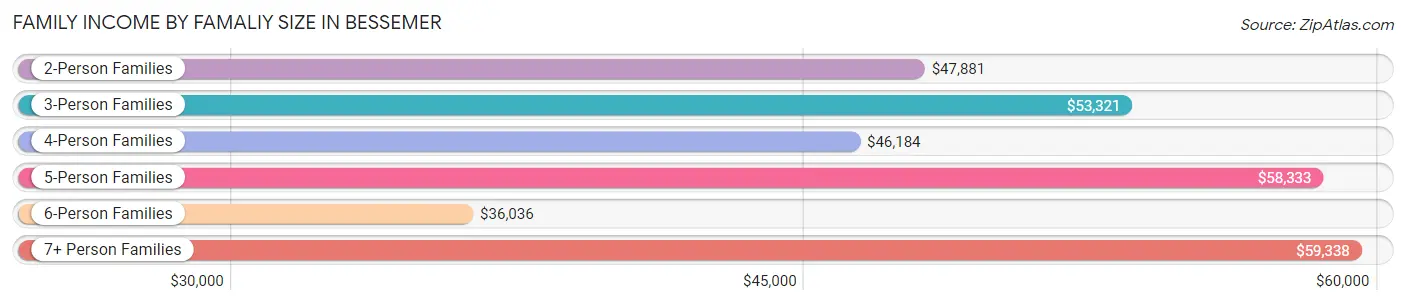
| Income Bracket | # Families | Median Income |
| 2-Person Families | 2,838 (51.1%) | $47,881 |
| 3-Person Families | 1,354 (24.4%) | $53,321 |
| 4-Person Families | 760 (13.7%) | $46,184 |
| 5-Person Families | 378 (6.8%) | $58,333 |
| 6-Person Families | 147 (2.6%) | $36,036 |
| 7+ Person Families | 81 (1.5%) | $59,338 |
| Total | 5,558 (100.0%) | $48,803 |
Family Income by Number of Earners in Bessemer
The median family income in Bessemer is $48,803, with families comprising 3+ earners (582) having the highest median family income of $88,800, while families with no earners (1,404) have the lowest median family income of $27,788, accounting for 10.5% and 25.3% of families, respectively.
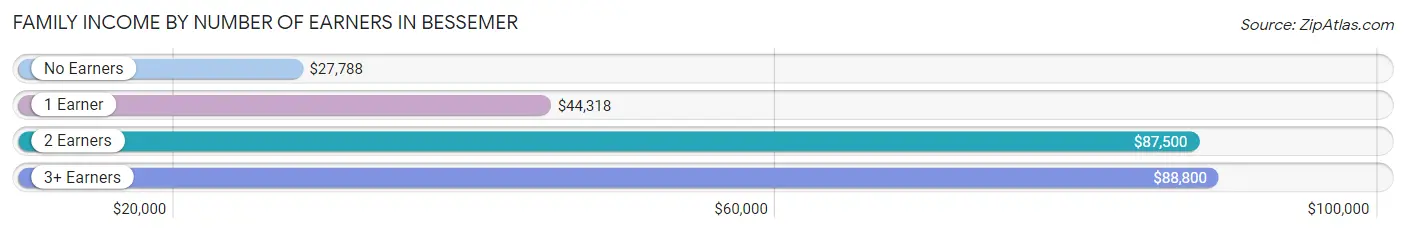
| Number of Earners | # Families | Median Income |
| No Earners | 1,404 (25.3%) | $27,788 |
| 1 Earner | 2,028 (36.5%) | $44,318 |
| 2 Earners | 1,544 (27.8%) | $87,500 |
| 3+ Earners | 582 (10.5%) | $88,800 |
| Total | 5,558 (100.0%) | $48,803 |
Household Income in Bessemer
Household Income Brackets in Bessemer
With 1,743 households falling in the category, the $15,000 to $24,999 income range is the most frequent in Bessemer, accounting for 16.9% of all households. In contrast, only 186 households (1.8%) fall into the $200,000+ income bracket, making it the least populous group.
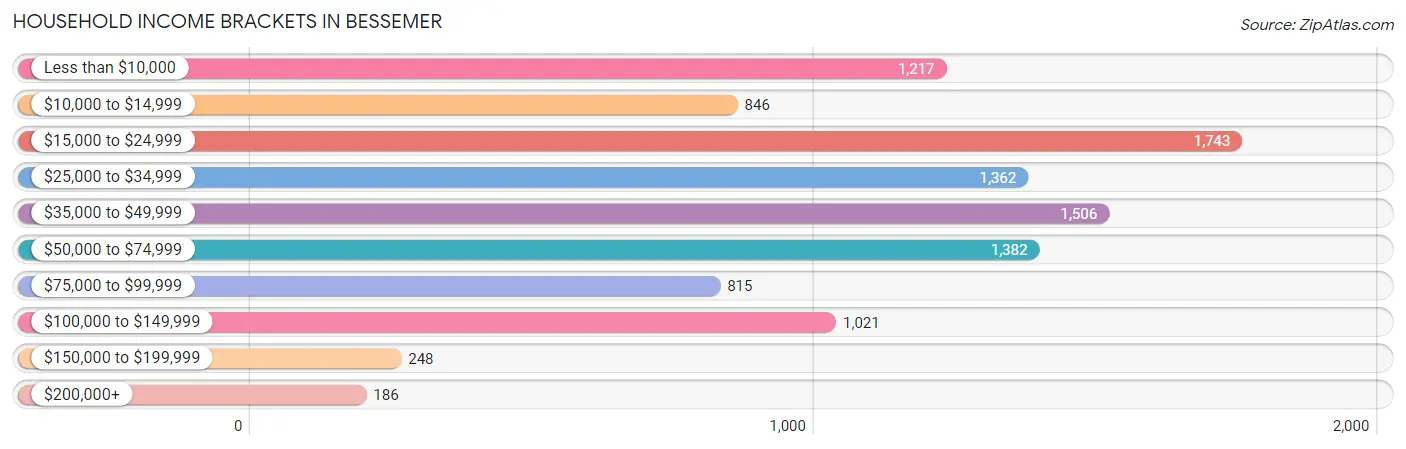
| Income Bracket | # Households | % Households |
| Less than $10,000 | 1,217 | 11.8% |
| $10,000 to $14,999 | 846 | 8.2% |
| $15,000 to $24,999 | 1,743 | 16.9% |
| $25,000 to $34,999 | 1,362 | 13.2% |
| $35,000 to $49,999 | 1,506 | 14.6% |
| $50,000 to $74,999 | 1,382 | 13.4% |
| $75,000 to $99,999 | 815 | 7.9% |
| $100,000 to $149,999 | 1,021 | 9.9% |
| $150,000 to $199,999 | 248 | 2.4% |
| $200,000+ | 186 | 1.8% |
Household Income by Householder Age in Bessemer
The median household income in Bessemer is $34,953, with the highest median household income of $41,042 found in the 45 to 64 years age bracket for the primary householder. A total of 4,111 households (39.9%) fall into this category. Meanwhile, the 15 to 24 years age bracket for the primary householder has the lowest median household income of $24,149, with 425 households (4.1%) in this group.
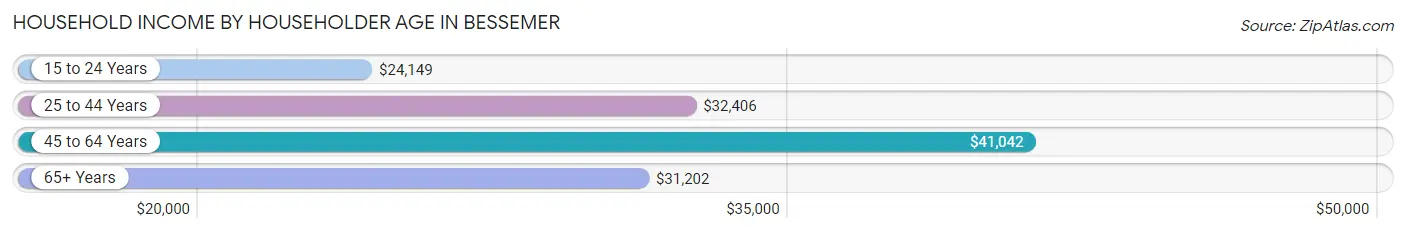
| Income Bracket | # Households | Median Income |
| 15 to 24 Years | 425 (4.1%) | $24,149 |
| 25 to 44 Years | 2,403 (23.3%) | $32,406 |
| 45 to 64 Years | 4,111 (39.9%) | $41,042 |
| 65+ Years | 3,377 (32.7%) | $31,202 |
| Total | 10,316 (100.0%) | $34,953 |
Poverty in Bessemer
Income Below Poverty by Sex and Age in Bessemer
With 30.5% poverty level for males and 33.3% for females among the residents of Bessemer, 5 year old males and 6 to 11 year old females are the most vulnerable to poverty, with 30 males (78.9%) and 710 females (68.7%) in their respective age groups living below the poverty level.
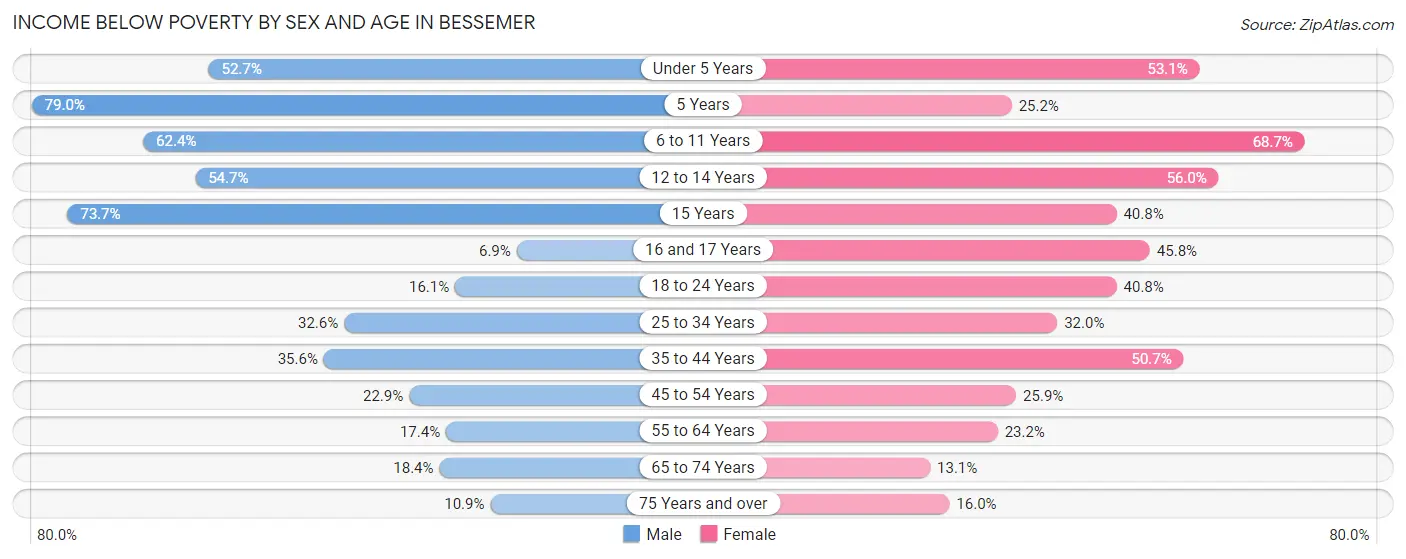
| Age Bracket | Male | Female |
| Under 5 Years | 432 (52.7%) | 408 (53.1%) |
| 5 Years | 30 (78.9%) | 27 (25.2%) |
| 6 to 11 Years | 632 (62.4%) | 710 (68.7%) |
| 12 to 14 Years | 258 (54.7%) | 244 (56.0%) |
| 15 Years | 151 (73.7%) | 31 (40.8%) |
| 16 and 17 Years | 10 (6.9%) | 113 (45.8%) |
| 18 to 24 Years | 231 (16.1%) | 446 (40.8%) |
| 25 to 34 Years | 461 (32.6%) | 491 (32.0%) |
| 35 to 44 Years | 533 (35.6%) | 651 (50.7%) |
| 45 to 54 Years | 271 (22.9%) | 504 (25.9%) |
| 55 to 64 Years | 271 (17.4%) | 484 (23.2%) |
| 65 to 74 Years | 224 (18.4%) | 224 (13.1%) |
| 75 Years and over | 80 (10.8%) | 207 (16.0%) |
| Total | 3,584 (30.5%) | 4,540 (33.3%) |
Income Above Poverty by Sex and Age in Bessemer
According to the poverty statistics in Bessemer, males aged 16 and 17 years and females aged 65 to 74 years are the age groups that are most secure financially, with 93.1% of males and 86.9% of females in these age groups living above the poverty line.
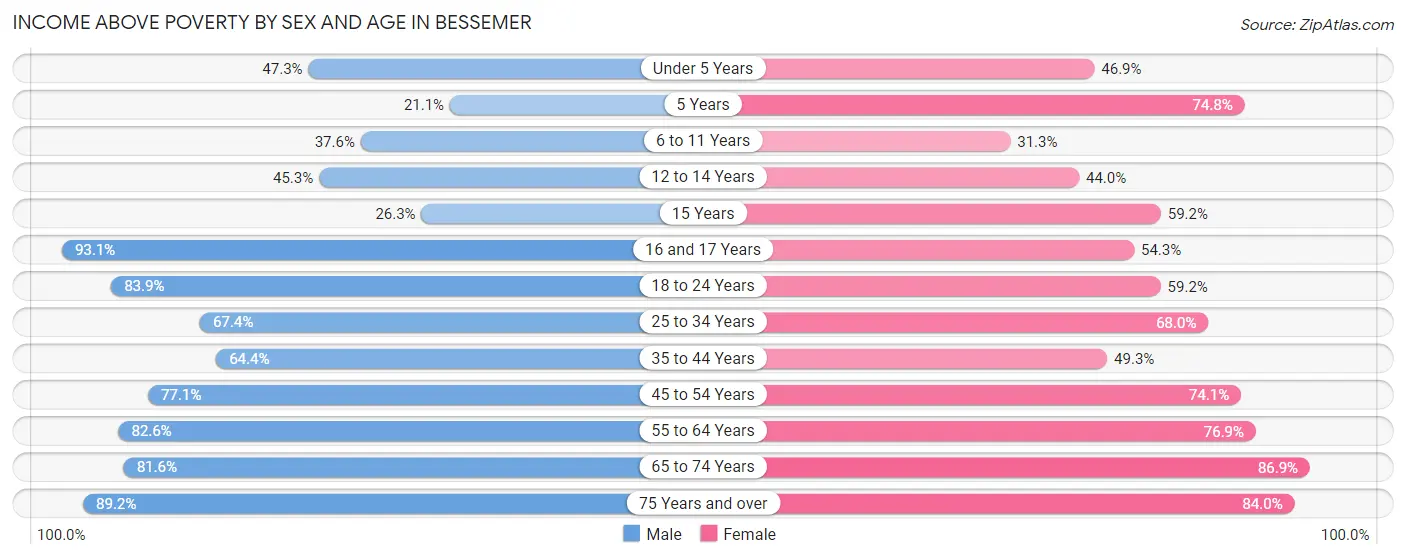
| Age Bracket | Male | Female |
| Under 5 Years | 388 (47.3%) | 360 (46.9%) |
| 5 Years | 8 (21.0%) | 80 (74.8%) |
| 6 to 11 Years | 381 (37.6%) | 323 (31.3%) |
| 12 to 14 Years | 214 (45.3%) | 192 (44.0%) |
| 15 Years | 54 (26.3%) | 45 (59.2%) |
| 16 and 17 Years | 134 (93.1%) | 134 (54.2%) |
| 18 to 24 Years | 1,206 (83.9%) | 647 (59.2%) |
| 25 to 34 Years | 955 (67.4%) | 1,044 (68.0%) |
| 35 to 44 Years | 965 (64.4%) | 632 (49.3%) |
| 45 to 54 Years | 912 (77.1%) | 1,443 (74.1%) |
| 55 to 64 Years | 1,284 (82.6%) | 1,607 (76.8%) |
| 65 to 74 Years | 993 (81.6%) | 1,485 (86.9%) |
| 75 Years and over | 657 (89.1%) | 1,088 (84.0%) |
| Total | 8,151 (69.5%) | 9,080 (66.7%) |
Income Below Poverty Among Married-Couple Families in Bessemer
The poverty statistics for married-couple families in Bessemer show that 10.2% or 246 of the total 2,406 families live below the poverty line. Families with 3 or 4 children have the highest poverty rate of 38.9%, comprising of 72 families. On the other hand, families with no children have the lowest poverty rate of 7.2%, which includes 141 families.
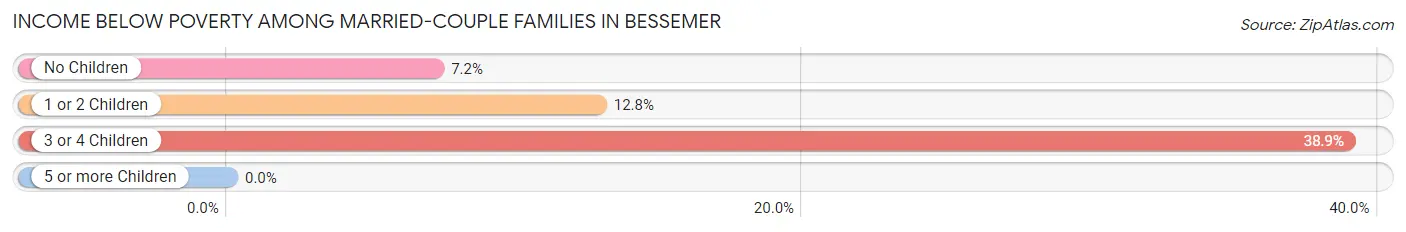
| Children | Above Poverty | Below Poverty |
| No Children | 1,823 (92.8%) | 141 (7.2%) |
| 1 or 2 Children | 224 (87.2%) | 33 (12.8%) |
| 3 or 4 Children | 113 (61.1%) | 72 (38.9%) |
| 5 or more Children | 0 (0.0%) | 0 (0.0%) |
| Total | 2,160 (89.8%) | 246 (10.2%) |
Income Below Poverty Among Single-Parent Households in Bessemer
According to the poverty data in Bessemer, 13.3% or 65 single-father households and 42.0% or 1,118 single-mother households are living below the poverty line. Among single-father households, those with 5 or more children have the highest poverty rate, with 9 households (100.0%) experiencing poverty. Likewise, among single-mother households, those with 3 or 4 children have the highest poverty rate, with 242 households (73.8%) falling below the poverty line.
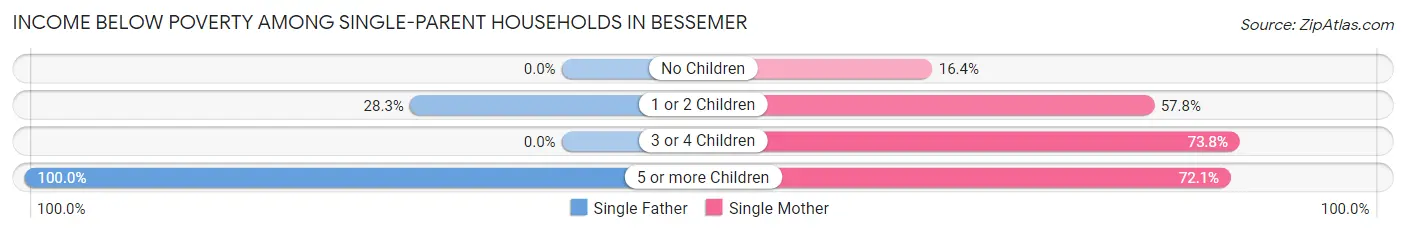
| Children | Single Father | Single Mother |
| No Children | 0 (0.0%) | 191 (16.4%) |
| 1 or 2 Children | 56 (28.3%) | 641 (57.8%) |
| 3 or 4 Children | 0 (0.0%) | 242 (73.8%) |
| 5 or more Children | 9 (100.0%) | 44 (72.1%) |
| Total | 65 (13.3%) | 1,118 (42.0%) |
Income Below Poverty Among Married-Couple vs Single-Parent Households in Bessemer
The poverty data for Bessemer shows that 246 of the married-couple family households (10.2%) and 1,183 of the single-parent households (37.5%) are living below the poverty level. Within the married-couple family households, those with 3 or 4 children have the highest poverty rate, with 72 households (38.9%) falling below the poverty line. Among the single-parent households, those with 5 or more children have the highest poverty rate, with 53 household (75.7%) living below poverty.
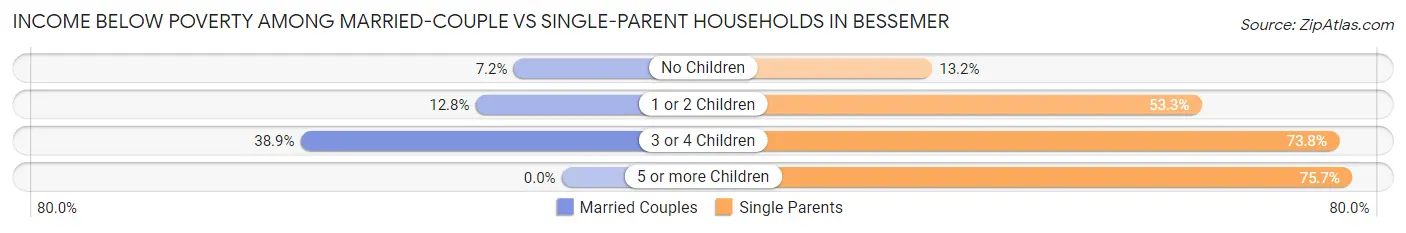
| Children | Married-Couple Families | Single-Parent Households |
| No Children | 141 (7.2%) | 191 (13.2%) |
| 1 or 2 Children | 33 (12.8%) | 697 (53.3%) |
| 3 or 4 Children | 72 (38.9%) | 242 (73.8%) |
| 5 or more Children | 0 (0.0%) | 53 (75.7%) |
| Total | 246 (10.2%) | 1,183 (37.5%) |
Race in Bessemer
The most populous races in Bessemer are Black / African American (18,628 | 72.0%), White / Caucasian (4,989 | 19.3%), and Hispanic or Latino (1,670 | 6.5%).
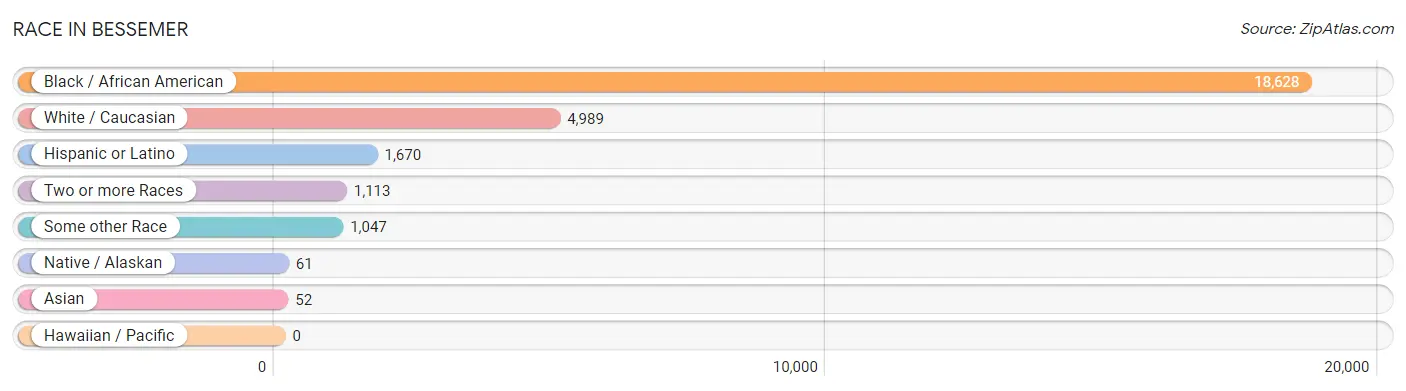
| Race | # Population | % Population |
| Asian | 52 | 0.2% |
| Black / African American | 18,628 | 72.0% |
| Hawaiian / Pacific | 0 | 0.0% |
| Hispanic or Latino | 1,670 | 6.5% |
| Native / Alaskan | 61 | 0.2% |
| White / Caucasian | 4,989 | 19.3% |
| Two or more Races | 1,113 | 4.3% |
| Some other Race | 1,047 | 4.0% |
| Total | 25,890 | 100.0% |
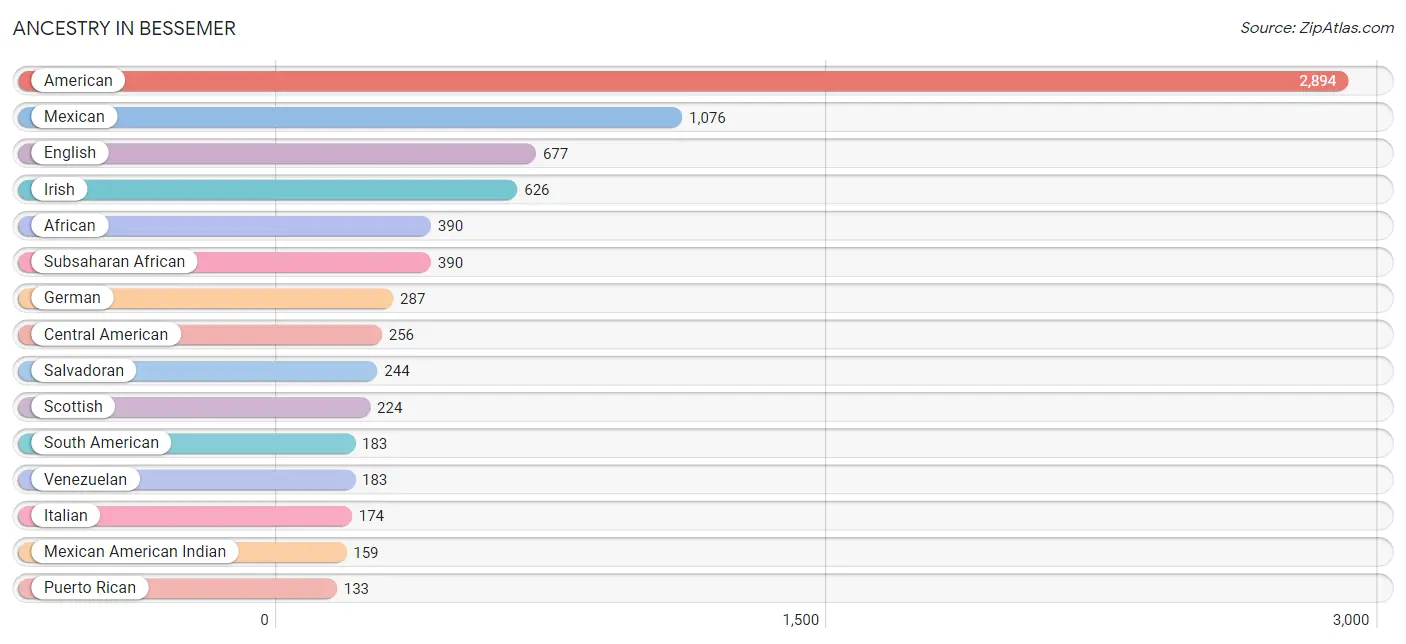
Ancestry in Bessemer
The most populous ancestries reported in Bessemer are American (2,894 | 11.2%), Mexican (1,076 | 4.2%), English (677 | 2.6%), Irish (626 | 2.4%), and African (390 | 1.5%), together accounting for 21.9% of all Bessemer residents.
| Ancestry | # Population | % Population |
| African | 390 | 1.5% |
| American | 2,894 | 11.2% |
| Arab | 39 | 0.2% |
| Austrian | 4 | 0.0% |
| Bhutanese | 20 | 0.1% |
| Blackfeet | 5 | 0.0% |
| British | 12 | 0.1% |
| Burmese | 15 | 0.1% |
| Central American | 256 | 1.0% |
| Central American Indian | 35 | 0.1% |
| Cherokee | 71 | 0.3% |
| Choctaw | 8 | 0.0% |
| Creek | 24 | 0.1% |
| Czech | 8 | 0.0% |
| Dutch | 54 | 0.2% |
| English | 677 | 2.6% |
| European | 73 | 0.3% |
| French | 91 | 0.4% |
| French Canadian | 35 | 0.1% |
| German | 287 | 1.1% |
| Haitian | 76 | 0.3% |
| Honduran | 12 | 0.1% |
| Irish | 626 | 2.4% |
| Italian | 174 | 0.7% |
| Jamaican | 70 | 0.3% |
| Korean | 21 | 0.1% |
| Mexican | 1,076 | 4.2% |
| Mexican American Indian | 159 | 0.6% |
| Moroccan | 35 | 0.1% |
| Northern European | 6 | 0.0% |
| Norwegian | 13 | 0.1% |
| Puerto Rican | 133 | 0.5% |
| Russian | 11 | 0.0% |
| Salvadoran | 244 | 0.9% |
| Scandinavian | 12 | 0.1% |
| Scotch-Irish | 18 | 0.1% |
| Scottish | 224 | 0.9% |
| South American | 183 | 0.7% |
| Spaniard | 22 | 0.1% |
| Sri Lankan | 12 | 0.1% |
| Subsaharan African | 390 | 1.5% |
| Swedish | 12 | 0.1% |
| Swiss | 10 | 0.0% |
| Syrian | 4 | 0.0% |
| Venezuelan | 183 | 0.7% |
| Welsh | 76 | 0.3% | View All 46 Rows |
Immigrants in Bessemer
The most numerous immigrant groups reported in Bessemer came from Latin America (698 | 2.7%), Central America (490 | 1.9%), Mexico (351 | 1.4%), South America (183 | 0.7%), and Venezuela (183 | 0.7%), together accounting for 7.4% of all Bessemer residents.
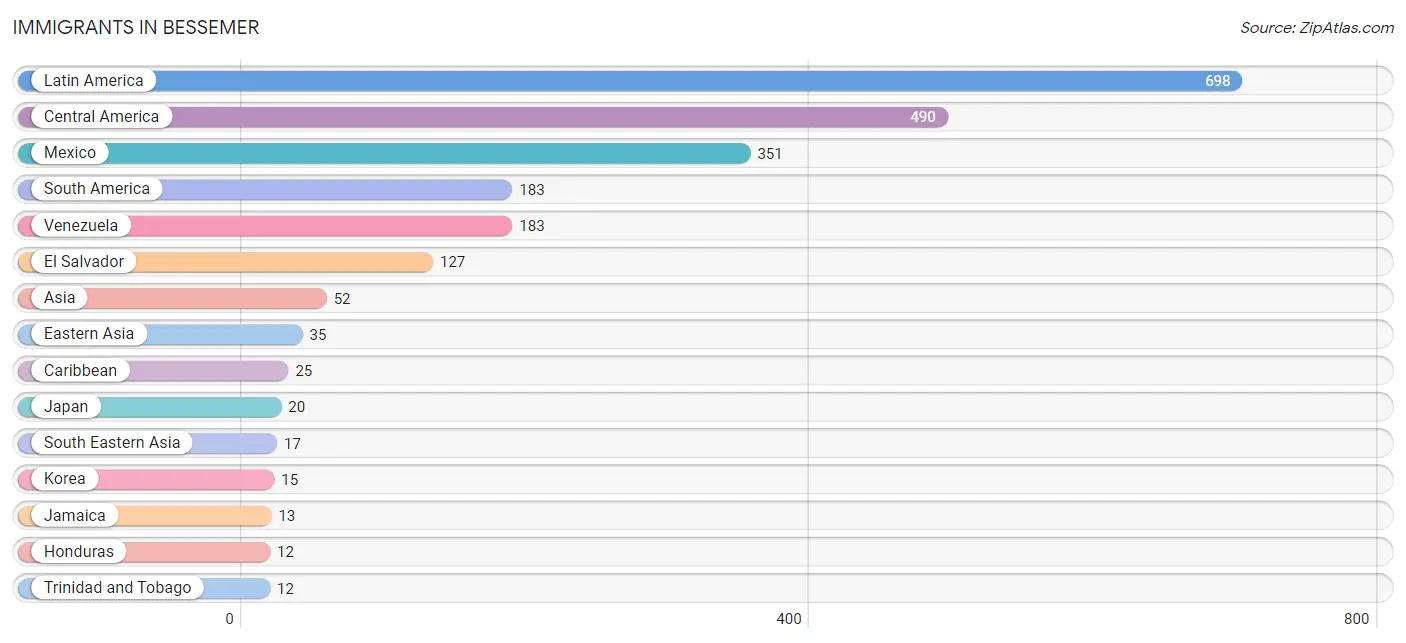
| Immigration Origin | # Population | % Population |
| Asia | 52 | 0.2% |
| Caribbean | 25 | 0.1% |
| Central America | 490 | 1.9% |
| Eastern Asia | 35 | 0.1% |
| El Salvador | 127 | 0.5% |
| Europe | 6 | 0.0% |
| Germany | 6 | 0.0% |
| Honduras | 12 | 0.1% |
| Jamaica | 13 | 0.1% |
| Japan | 20 | 0.1% |
| Korea | 15 | 0.1% |
| Latin America | 698 | 2.7% |
| Mexico | 351 | 1.4% |
| Philippines | 5 | 0.0% |
| South America | 183 | 0.7% |
| South Eastern Asia | 17 | 0.1% |
| Trinidad and Tobago | 12 | 0.1% |
| Venezuela | 183 | 0.7% |
| Vietnam | 12 | 0.1% |
| Western Europe | 6 | 0.0% | View All 20 Rows |
Sex and Age in Bessemer
Sex and Age in Bessemer
The most populous age groups in Bessemer are 10 to 14 Years (910 | 7.6%) for men and 50 to 54 Years (1,223 | 8.8%) for women.
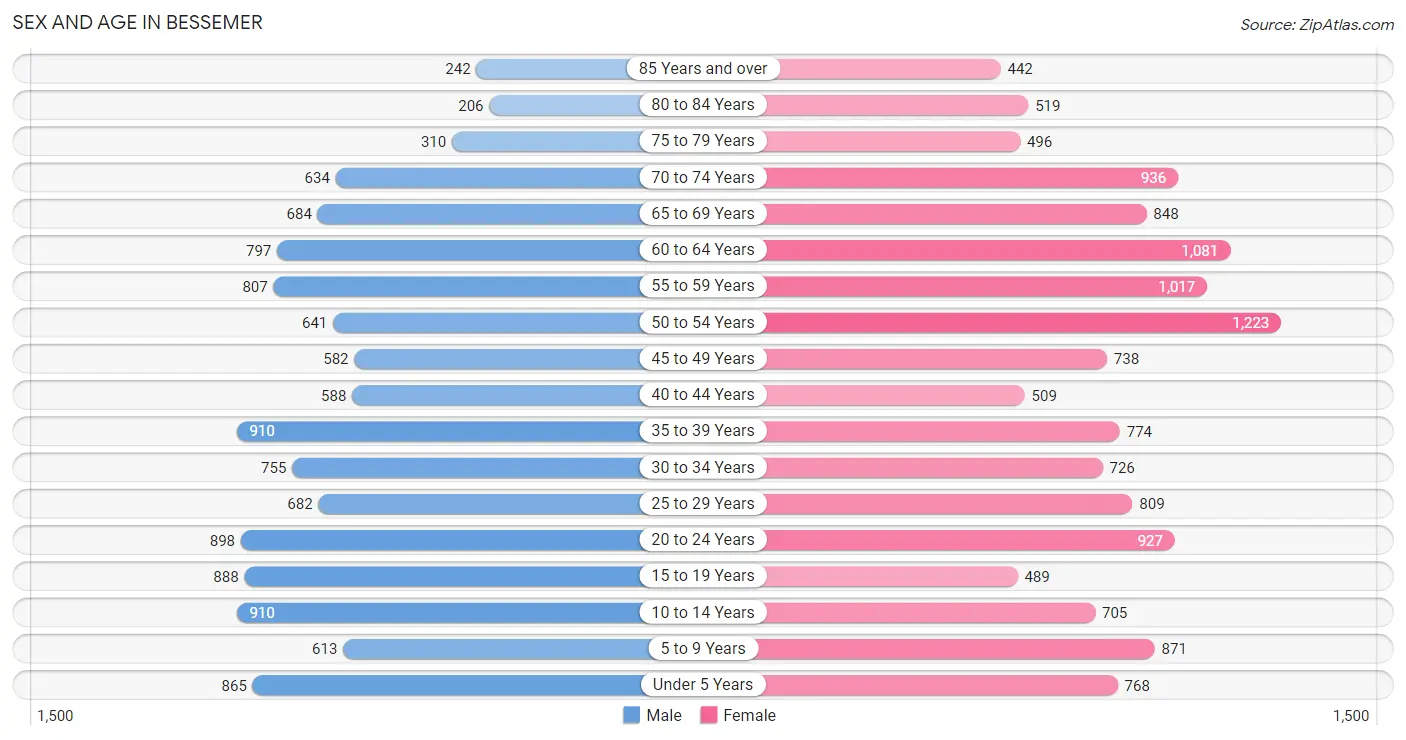
| Age Bracket | Male | Female |
| Under 5 Years | 865 (7.2%) | 768 (5.5%) |
| 5 to 9 Years | 613 (5.1%) | 871 (6.3%) |
| 10 to 14 Years | 910 (7.6%) | 705 (5.1%) |
| 15 to 19 Years | 888 (7.4%) | 489 (3.5%) |
| 20 to 24 Years | 898 (7.5%) | 927 (6.7%) |
| 25 to 29 Years | 682 (5.7%) | 809 (5.8%) |
| 30 to 34 Years | 755 (6.3%) | 726 (5.2%) |
| 35 to 39 Years | 910 (7.6%) | 774 (5.6%) |
| 40 to 44 Years | 588 (4.9%) | 509 (3.7%) |
| 45 to 49 Years | 582 (4.9%) | 738 (5.3%) |
| 50 to 54 Years | 641 (5.3%) | 1,223 (8.8%) |
| 55 to 59 Years | 807 (6.7%) | 1,017 (7.3%) |
| 60 to 64 Years | 797 (6.6%) | 1,081 (7.8%) |
| 65 to 69 Years | 684 (5.7%) | 848 (6.1%) |
| 70 to 74 Years | 634 (5.3%) | 936 (6.7%) |
| 75 to 79 Years | 310 (2.6%) | 496 (3.6%) |
| 80 to 84 Years | 206 (1.7%) | 519 (3.7%) |
| 85 Years and over | 242 (2.0%) | 442 (3.2%) |
| Total | 12,012 (100.0%) | 13,878 (100.0%) |
Families and Households in Bessemer
Median Family Size in Bessemer
The median family size in Bessemer is 3.43 persons per family, with single female/mother families (2,662 | 47.9%) accounting for the largest median family size of 3.73 persons per family. On the other hand, married-couple families (2,406 | 43.3%) represent the smallest median family size with 3.09 persons per family.
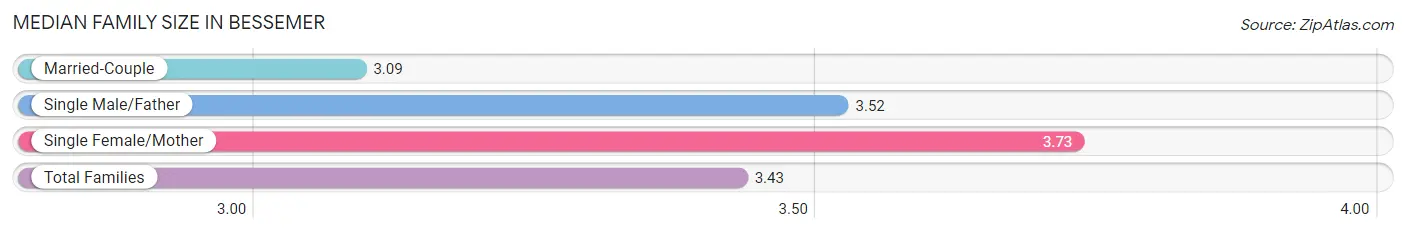
| Family Type | # Families | Family Size |
| Married-Couple | 2,406 (43.3%) | 3.09 |
| Single Male/Father | 490 (8.8%) | 3.52 |
| Single Female/Mother | 2,662 (47.9%) | 3.73 |
| Total Families | 5,558 (100.0%) | 3.43 |
Median Household Size in Bessemer
The median household size in Bessemer is 2.43 persons per household, with single female/mother households (2,662 | 25.8%) accounting for the largest median household size of 3.94 persons per household. non-family households (4,758 | 46.1%) represent the smallest median household size with 1.12 persons per household.
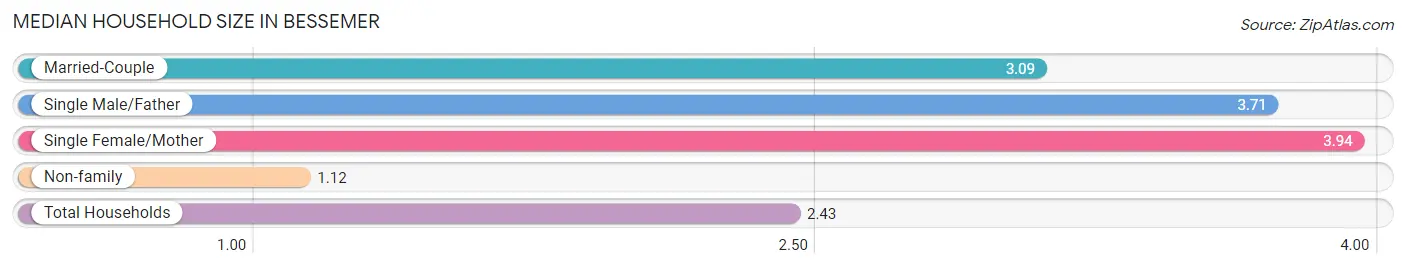
| Household Type | # Households | Household Size |
| Married-Couple | 2,406 (23.3%) | 3.09 |
| Single Male/Father | 490 (4.8%) | 3.71 |
| Single Female/Mother | 2,662 (25.8%) | 3.94 |
| Non-family | 4,758 (46.1%) | 1.12 |
| Total Households | 10,316 (100.0%) | 2.43 |
Household Size by Marriage Status in Bessemer
Out of a total of 10,316 households in Bessemer, 5,558 (53.9%) are family households, while 4,758 (46.1%) are nonfamily households. The most numerous type of family households are 2-person households, comprising 2,736, and the most common type of nonfamily households are 1-person households, comprising 4,339.
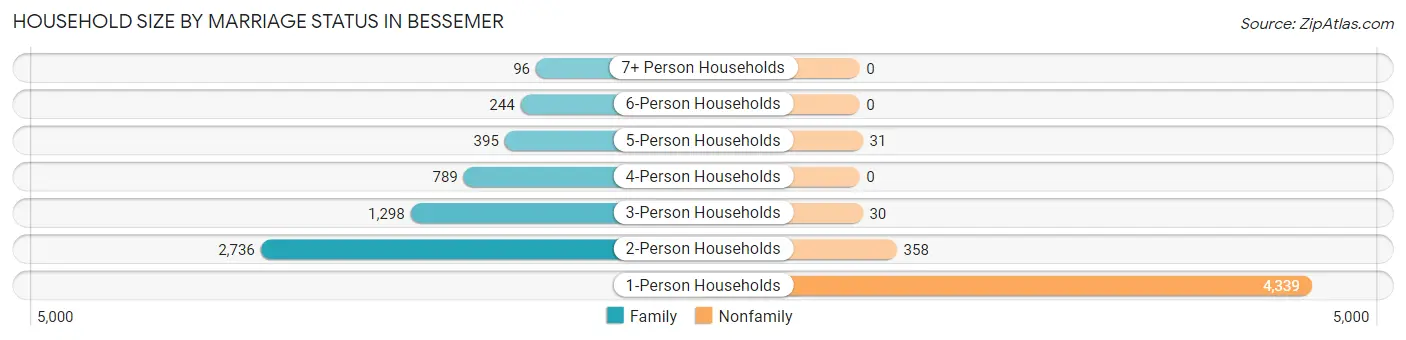
| Household Size | Family Households | Nonfamily Households |
| 1-Person Households | - | 4,339 (42.1%) |
| 2-Person Households | 2,736 (26.5%) | 358 (3.5%) |
| 3-Person Households | 1,298 (12.6%) | 30 (0.3%) |
| 4-Person Households | 789 (7.6%) | 0 (0.0%) |
| 5-Person Households | 395 (3.8%) | 31 (0.3%) |
| 6-Person Households | 244 (2.4%) | 0 (0.0%) |
| 7+ Person Households | 96 (0.9%) | 0 (0.0%) |
| Total | 5,558 (53.9%) | 4,758 (46.1%) |
Female Fertility in Bessemer
Fertility by Age in Bessemer
Average fertility rate in Bessemer is 43.0 births per 1,000 women. Women in the age bracket of 20 to 34 years have the highest fertility rate with 81.0 births per 1,000 women. Women in the age bracket of 20 to 34 years acount for 90.4% of all women with births.
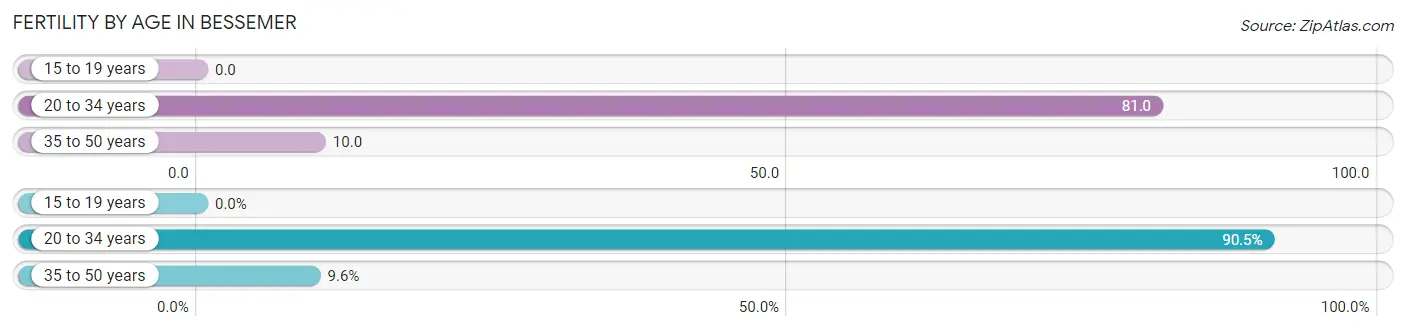
| Age Bracket | Women with Births | Births / 1,000 Women |
| 15 to 19 years | 0 (0.0%) | 0.0 |
| 20 to 34 years | 199 (90.4%) | 81.0 |
| 35 to 50 years | 21 (9.6%) | 10.0 |
| Total | 220 (100.0%) | 43.0 |
Fertility by Age by Marriage Status in Bessemer
32.7% of women with births (220) in Bessemer are married. The highest percentage of unmarried women with births falls into 35 to 50 years age bracket with 76.2% of them unmarried at the time of birth, while the lowest percentage of unmarried women with births belong to 20 to 34 years age bracket with 66.3% of them unmarried.
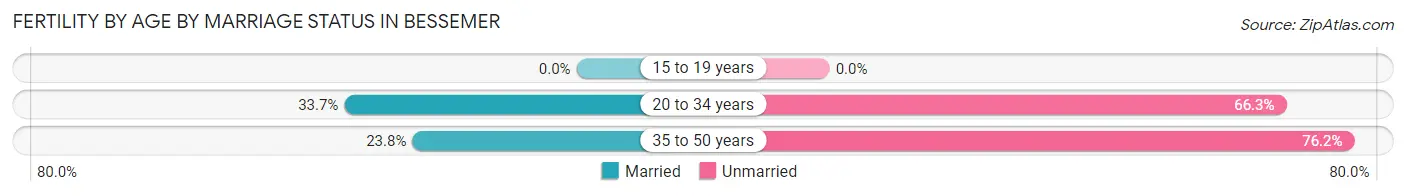
| Age Bracket | Married | Unmarried |
| 15 to 19 years | 0 (0.0%) | 0 (0.0%) |
| 20 to 34 years | 67 (33.7%) | 132 (66.3%) |
| 35 to 50 years | 5 (23.8%) | 16 (76.2%) |
| Total | 72 (32.7%) | 148 (67.3%) |
Fertility by Education in Bessemer
Average fertility rate in Bessemer is 43.0 births per 1,000 women. Women with the education attainment of high school diploma have the highest fertility rate of 66.0 births per 1,000 women, while women with the education attainment of bachelor's degree have the lowest fertility at 12.0 births per 1,000 women. Women with the education attainment of high school diploma represent 44.6% of all women with births.
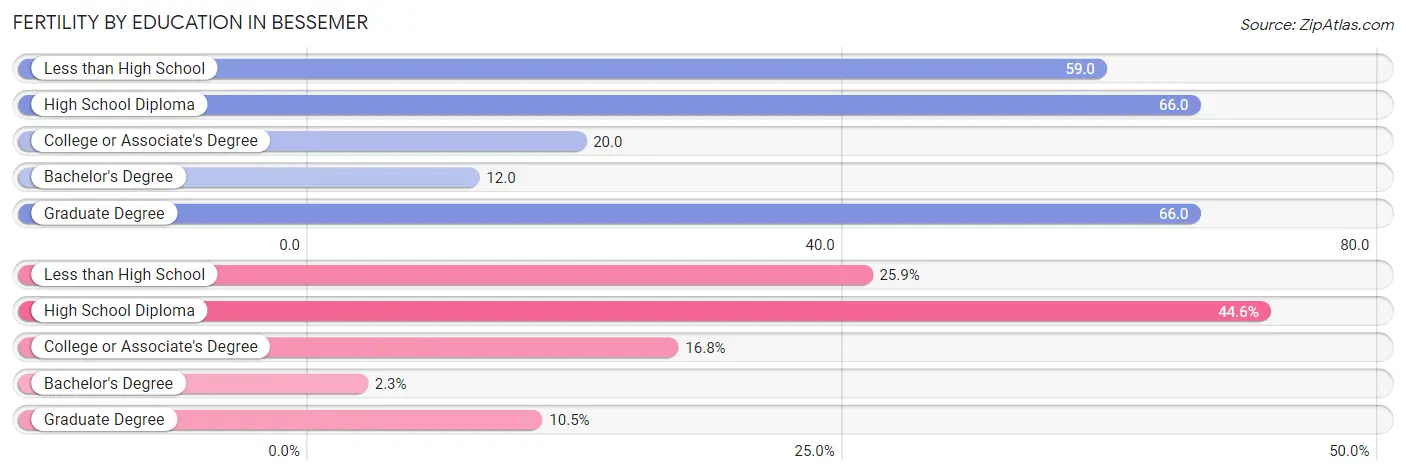
| Educational Attainment | Women with Births | Births / 1,000 Women |
| Less than High School | 57 (25.9%) | 59.0 |
| High School Diploma | 98 (44.6%) | 66.0 |
| College or Associate's Degree | 37 (16.8%) | 20.0 |
| Bachelor's Degree | 5 (2.3%) | 12.0 |
| Graduate Degree | 23 (10.4%) | 66.0 |
| Total | 220 (100.0%) | 43.0 |
Fertility by Education by Marriage Status in Bessemer
67.3% of women with births in Bessemer are unmarried. Women with the educational attainment of bachelor's degree are most likely to be married with 100.0% of them married at childbirth, while women with the educational attainment of less than high school are least likely to be married with 100.0% of them unmarried at childbirth.
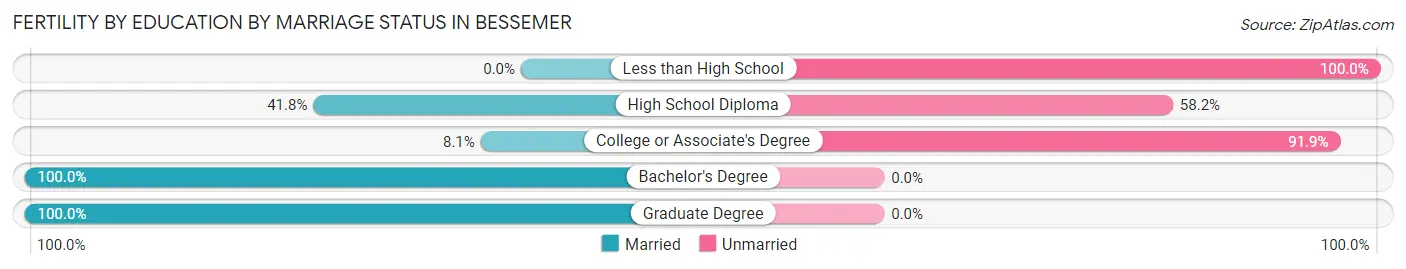
| Educational Attainment | Married | Unmarried |
| Less than High School | 0 (0.0%) | 57 (100.0%) |
| High School Diploma | 41 (41.8%) | 57 (58.2%) |
| College or Associate's Degree | 3 (8.1%) | 34 (91.9%) |
| Bachelor's Degree | 5 (100.0%) | 0 (0.0%) |
| Graduate Degree | 23 (100.0%) | 0 (0.0%) |
| Total | 72 (32.7%) | 148 (67.3%) |
Employment Characteristics in Bessemer
Employment by Class of Employer in Bessemer
Among the 8,907 employed individuals in Bessemer, private company employees (6,272 | 70.4%), not-for-profit organizations (753 | 8.5%), and state government employees (604 | 6.8%) make up the most common classes of employment.
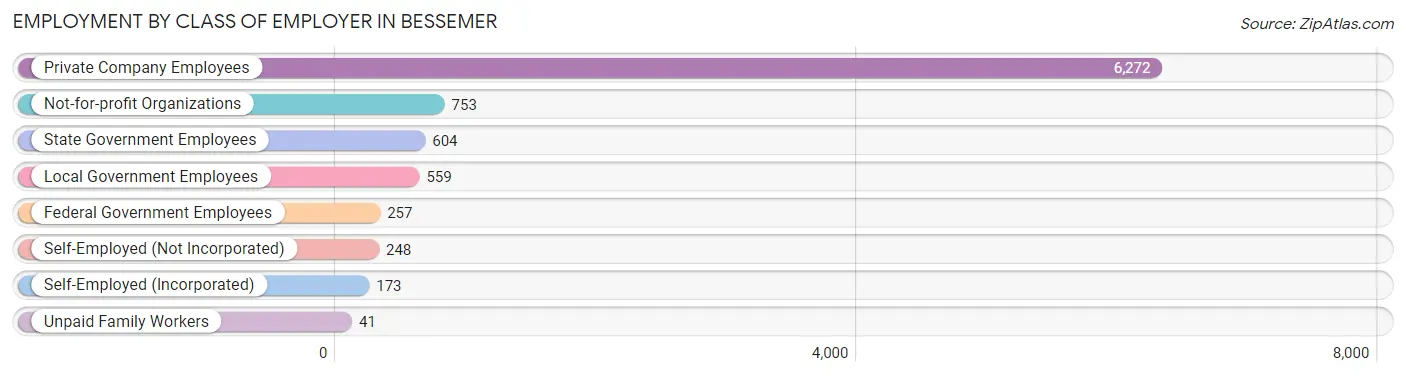
| Employer Class | # Employees | % Employees |
| Private Company Employees | 6,272 | 70.4% |
| Self-Employed (Incorporated) | 173 | 1.9% |
| Self-Employed (Not Incorporated) | 248 | 2.8% |
| Not-for-profit Organizations | 753 | 8.5% |
| Local Government Employees | 559 | 6.3% |
| State Government Employees | 604 | 6.8% |
| Federal Government Employees | 257 | 2.9% |
| Unpaid Family Workers | 41 | 0.5% |
| Total | 8,907 | 100.0% |
Employment Status by Age in Bessemer
According to the labor force statistics for Bessemer, out of the total population over 16 years of age (20,877), 49.9% or 10,418 individuals are in the labor force, with 10.8% or 1,125 of them unemployed. The age group with the highest labor force participation rate is 20 to 24 years, with 82.9% or 1,513 individuals in the labor force. Within the labor force, the 16 to 19 years age range has the highest percentage of unemployed individuals, with 20.4% or 66 of them being unemployed.
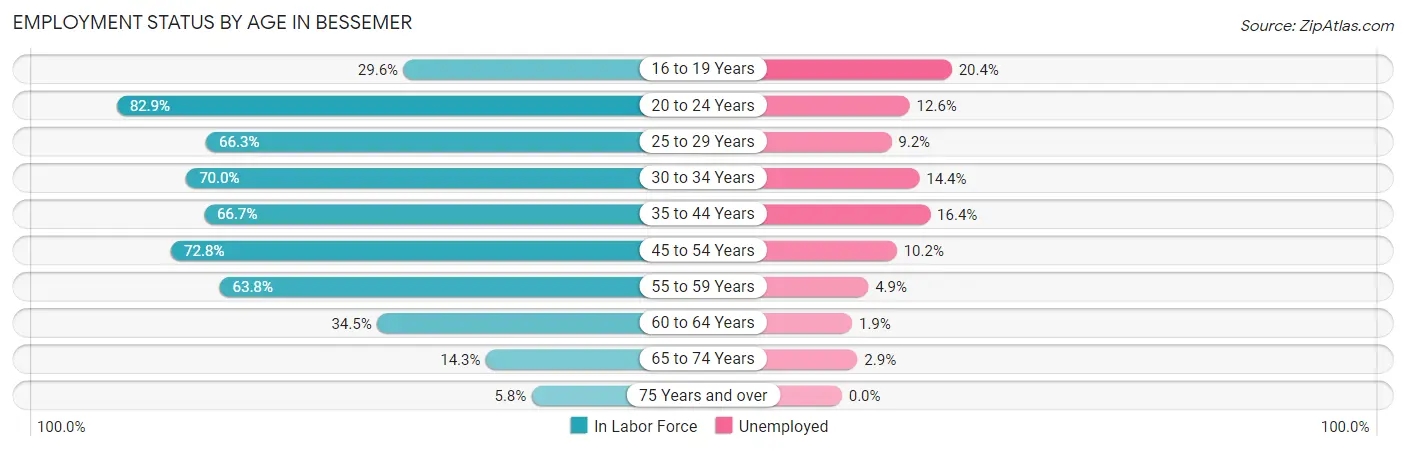
| Age Bracket | In Labor Force | Unemployed |
| 16 to 19 Years | 324 (29.6%) | 66 (20.4%) |
| 20 to 24 Years | 1,513 (82.9%) | 191 (12.6%) |
| 25 to 29 Years | 989 (66.3%) | 91 (9.2%) |
| 30 to 34 Years | 1,037 (70.0%) | 149 (14.4%) |
| 35 to 44 Years | 1,855 (66.7%) | 304 (16.4%) |
| 45 to 54 Years | 2,318 (72.8%) | 236 (10.2%) |
| 55 to 59 Years | 1,164 (63.8%) | 57 (4.9%) |
| 60 to 64 Years | 648 (34.5%) | 12 (1.9%) |
| 65 to 74 Years | 444 (14.3%) | 13 (2.9%) |
| 75 Years and over | 128 (5.8%) | 0 (0.0%) |
| Total | 10,418 (49.9%) | 1,125 (10.8%) |
Employment Status by Educational Attainment in Bessemer
According to labor force statistics for Bessemer, 63.4% of individuals (8,013) out of the total population between 25 and 64 years of age (12,639) are in the labor force, with 10.6% or 849 of them being unemployed. The group with the highest labor force participation rate are those with the educational attainment of bachelor's degree or higher, with 88.7% or 1,384 individuals in the labor force. Within the labor force, individuals with high school diploma education have the highest percentage of unemployment, with 12.4% or 354 of them being unemployed.
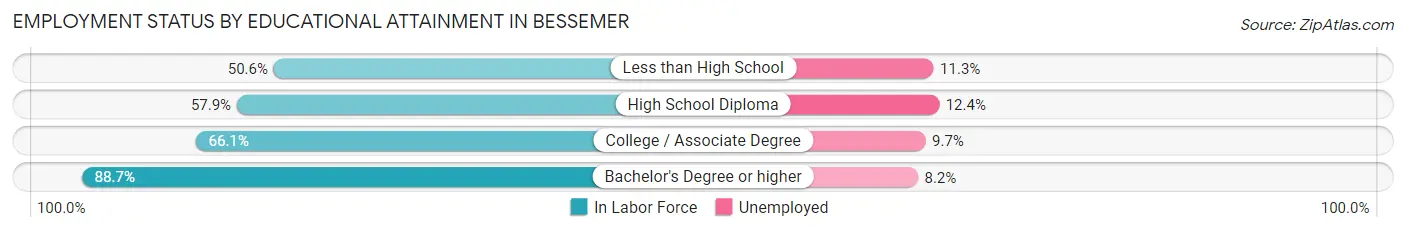
| Educational Attainment | In Labor Force | Unemployed |
| Less than High School | 950 (50.6%) | 212 (11.3%) |
| High School Diploma | 2,853 (57.9%) | 611 (12.4%) |
| College / Associate Degree | 2,826 (66.1%) | 415 (9.7%) |
| Bachelor's Degree or higher | 1,384 (88.7%) | 128 (8.2%) |
| Total | 8,013 (63.4%) | 1,340 (10.6%) |
Employment Occupations by Sex in Bessemer
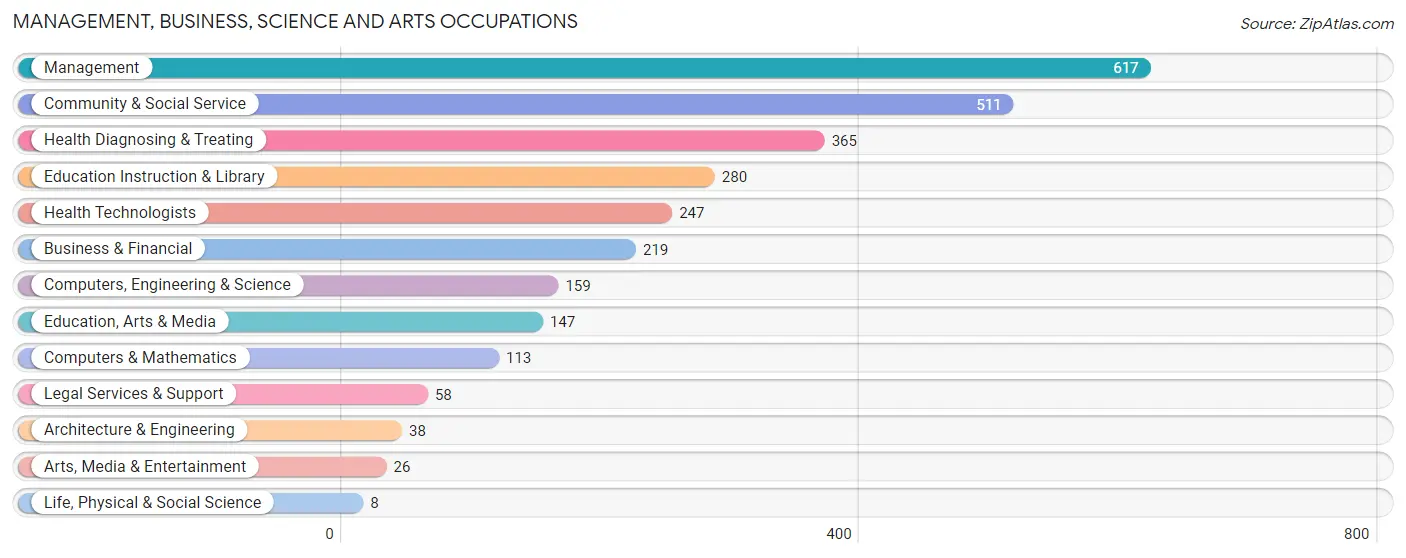
Management, Business, Science and Arts Occupations
The most common Management, Business, Science and Arts occupations in Bessemer are Management (617 | 6.6%), Community & Social Service (511 | 5.5%), Health Diagnosing & Treating (365 | 3.9%), Education Instruction & Library (280 | 3.0%), and Health Technologists (247 | 2.7%).
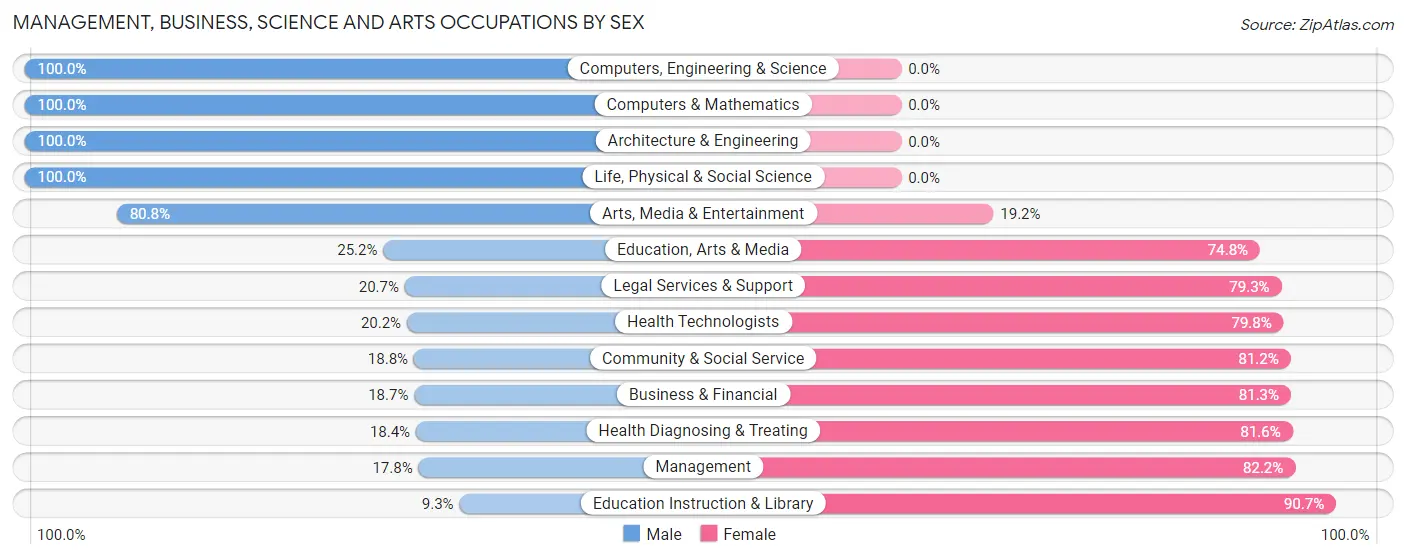
Management, Business, Science and Arts Occupations by Sex
Within the Management, Business, Science and Arts occupations in Bessemer, the most male-oriented occupations are Computers, Engineering & Science (100.0%), Computers & Mathematics (100.0%), and Architecture & Engineering (100.0%), while the most female-oriented occupations are Education Instruction & Library (90.7%), Management (82.2%), and Health Diagnosing & Treating (81.6%).
| Occupation | Male | Female |
| Management | 110 (17.8%) | 507 (82.2%) |
| Business & Financial | 41 (18.7%) | 178 (81.3%) |
| Computers, Engineering & Science | 159 (100.0%) | 0 (0.0%) |
| Computers & Mathematics | 113 (100.0%) | 0 (0.0%) |
| Architecture & Engineering | 38 (100.0%) | 0 (0.0%) |
| Life, Physical & Social Science | 8 (100.0%) | 0 (0.0%) |
| Community & Social Service | 96 (18.8%) | 415 (81.2%) |
| Education, Arts & Media | 37 (25.2%) | 110 (74.8%) |
| Legal Services & Support | 12 (20.7%) | 46 (79.3%) |
| Education Instruction & Library | 26 (9.3%) | 254 (90.7%) |
| Arts, Media & Entertainment | 21 (80.8%) | 5 (19.2%) |
| Health Diagnosing & Treating | 67 (18.4%) | 298 (81.6%) |
| Health Technologists | 50 (20.2%) | 197 (79.8%) |
| Total (Category) | 473 (25.3%) | 1,398 (74.7%) |
| Total (Overall) | 4,313 (46.4%) | 4,986 (53.6%) |
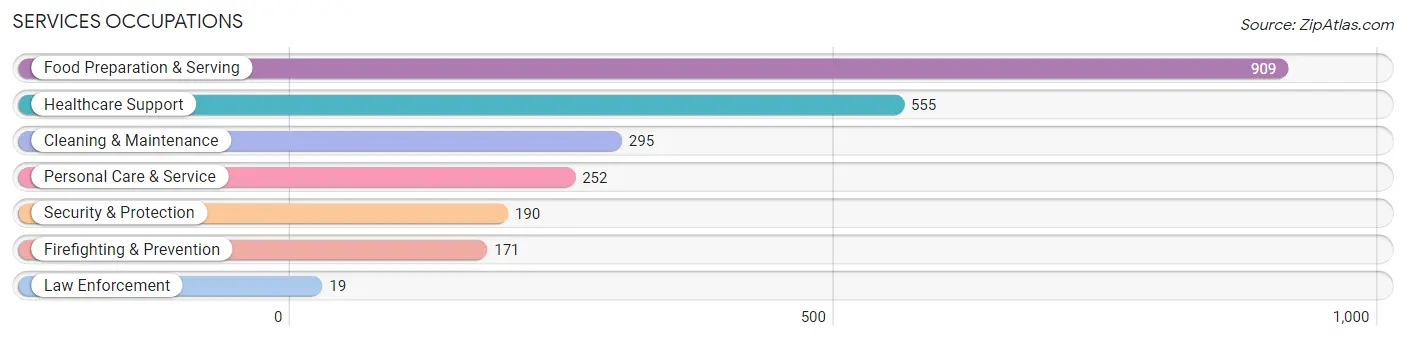
Services Occupations
The most common Services occupations in Bessemer are Food Preparation & Serving (909 | 9.8%), Healthcare Support (555 | 6.0%), Cleaning & Maintenance (295 | 3.2%), Personal Care & Service (252 | 2.7%), and Security & Protection (190 | 2.0%).
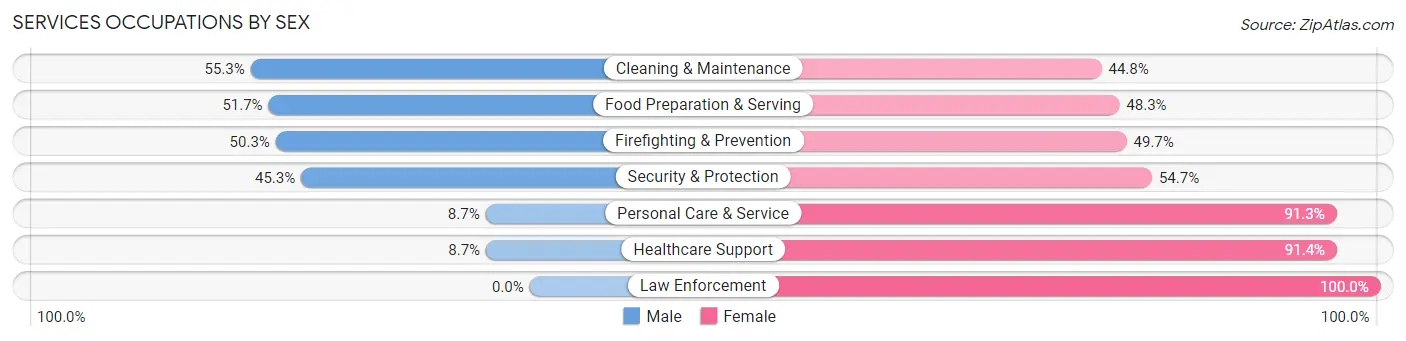
Services Occupations by Sex
Within the Services occupations in Bessemer, the most male-oriented occupations are Cleaning & Maintenance (55.2%), Food Preparation & Serving (51.7%), and Firefighting & Prevention (50.3%), while the most female-oriented occupations are Law Enforcement (100.0%), Healthcare Support (91.3%), and Personal Care & Service (91.3%).
| Occupation | Male | Female |
| Healthcare Support | 48 (8.6%) | 507 (91.3%) |
| Security & Protection | 86 (45.3%) | 104 (54.7%) |
| Firefighting & Prevention | 86 (50.3%) | 85 (49.7%) |
| Law Enforcement | 0 (0.0%) | 19 (100.0%) |
| Food Preparation & Serving | 470 (51.7%) | 439 (48.3%) |
| Cleaning & Maintenance | 163 (55.2%) | 132 (44.8%) |
| Personal Care & Service | 22 (8.7%) | 230 (91.3%) |
| Total (Category) | 789 (35.8%) | 1,412 (64.1%) |
| Total (Overall) | 4,313 (46.4%) | 4,986 (53.6%) |
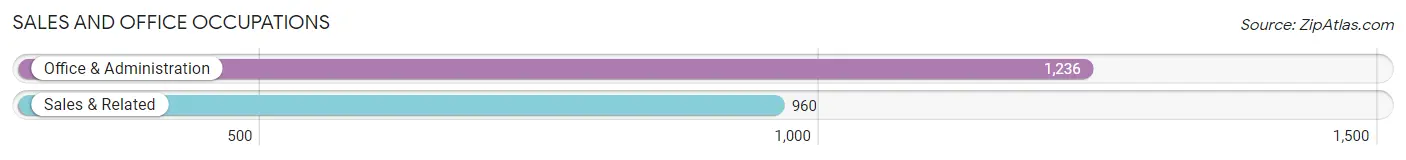
Sales and Office Occupations
The most common Sales and Office occupations in Bessemer are Office & Administration (1,236 | 13.3%), and Sales & Related (960 | 10.3%).
Sales and Office Occupations by Sex
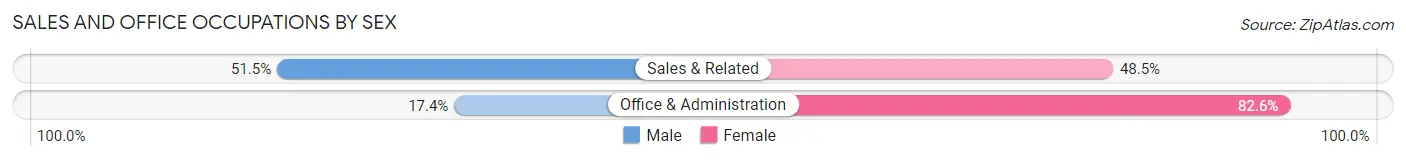
| Occupation | Male | Female |
| Sales & Related | 494 (51.5%) | 466 (48.5%) |
| Office & Administration | 215 (17.4%) | 1,021 (82.6%) |
| Total (Category) | 709 (32.3%) | 1,487 (67.7%) |
| Total (Overall) | 4,313 (46.4%) | 4,986 (53.6%) |
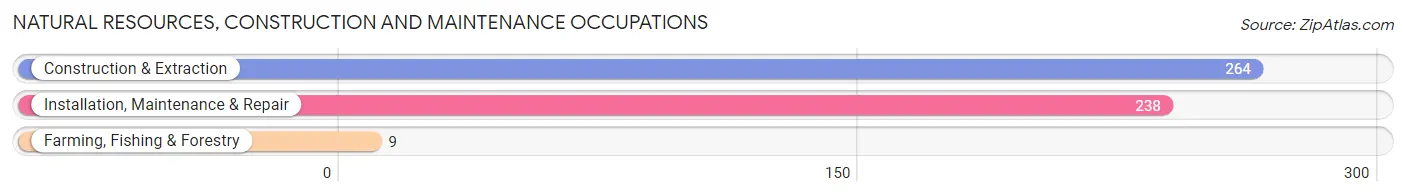
Natural Resources, Construction and Maintenance Occupations
The most common Natural Resources, Construction and Maintenance occupations in Bessemer are Construction & Extraction (264 | 2.8%), Installation, Maintenance & Repair (238 | 2.6%), and Farming, Fishing & Forestry (9 | 0.1%).
Natural Resources, Construction and Maintenance Occupations by Sex
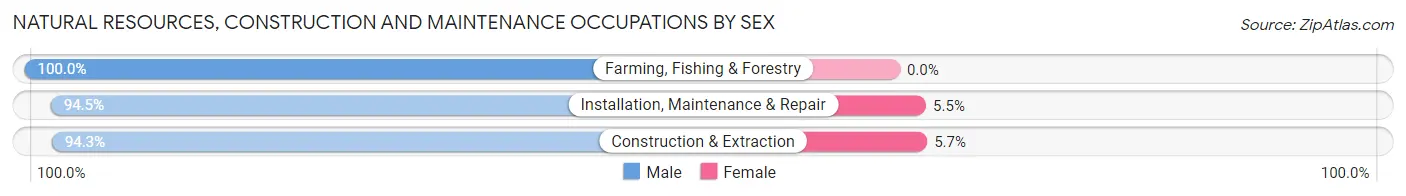
| Occupation | Male | Female |
| Farming, Fishing & Forestry | 9 (100.0%) | 0 (0.0%) |
| Construction & Extraction | 249 (94.3%) | 15 (5.7%) |
| Installation, Maintenance & Repair | 225 (94.5%) | 13 (5.5%) |
| Total (Category) | 483 (94.5%) | 28 (5.5%) |
| Total (Overall) | 4,313 (46.4%) | 4,986 (53.6%) |
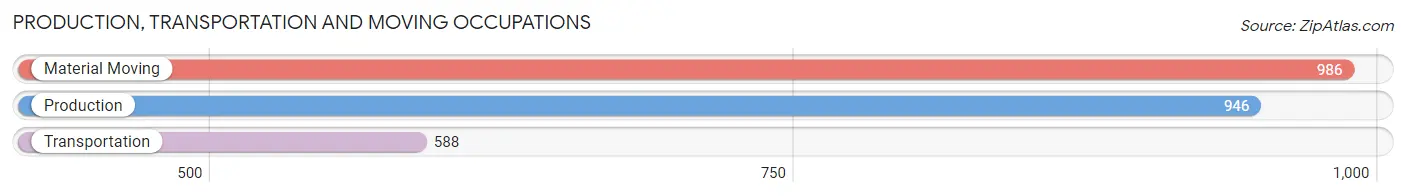
Production, Transportation and Moving Occupations
The most common Production, Transportation and Moving occupations in Bessemer are Material Moving (986 | 10.6%), Production (946 | 10.2%), and Transportation (588 | 6.3%).
Production, Transportation and Moving Occupations by Sex
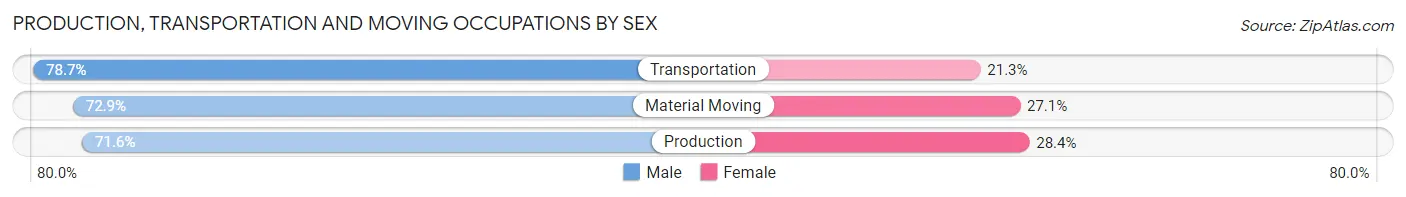
| Occupation | Male | Female |
| Production | 677 (71.6%) | 269 (28.4%) |
| Transportation | 463 (78.7%) | 125 (21.3%) |
| Material Moving | 719 (72.9%) | 267 (27.1%) |
| Total (Category) | 1,859 (73.8%) | 661 (26.2%) |
| Total (Overall) | 4,313 (46.4%) | 4,986 (53.6%) |
Employment Industries by Sex in Bessemer
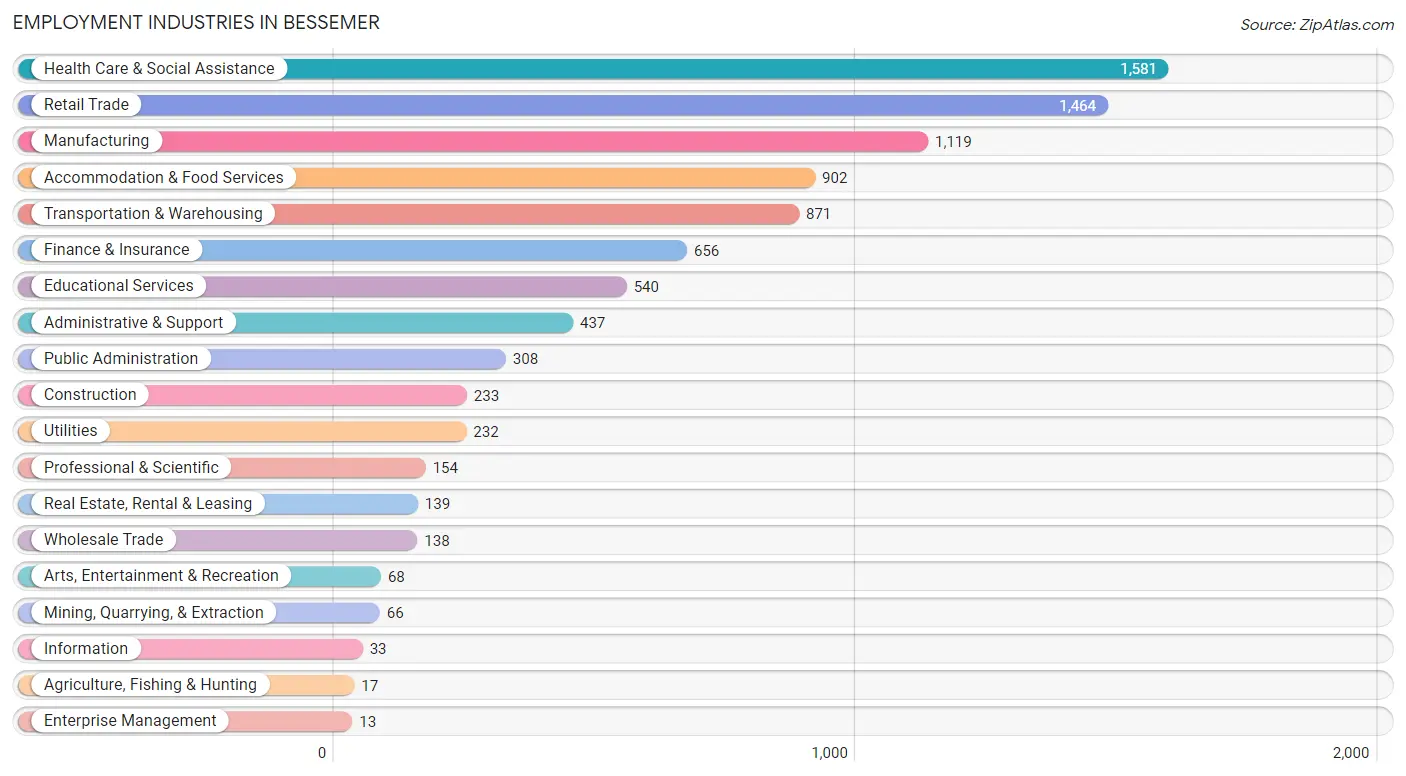
Employment Industries in Bessemer
The major employment industries in Bessemer include Health Care & Social Assistance (1,581 | 17.0%), Retail Trade (1,464 | 15.7%), Manufacturing (1,119 | 12.0%), Accommodation & Food Services (902 | 9.7%), and Transportation & Warehousing (871 | 9.4%).
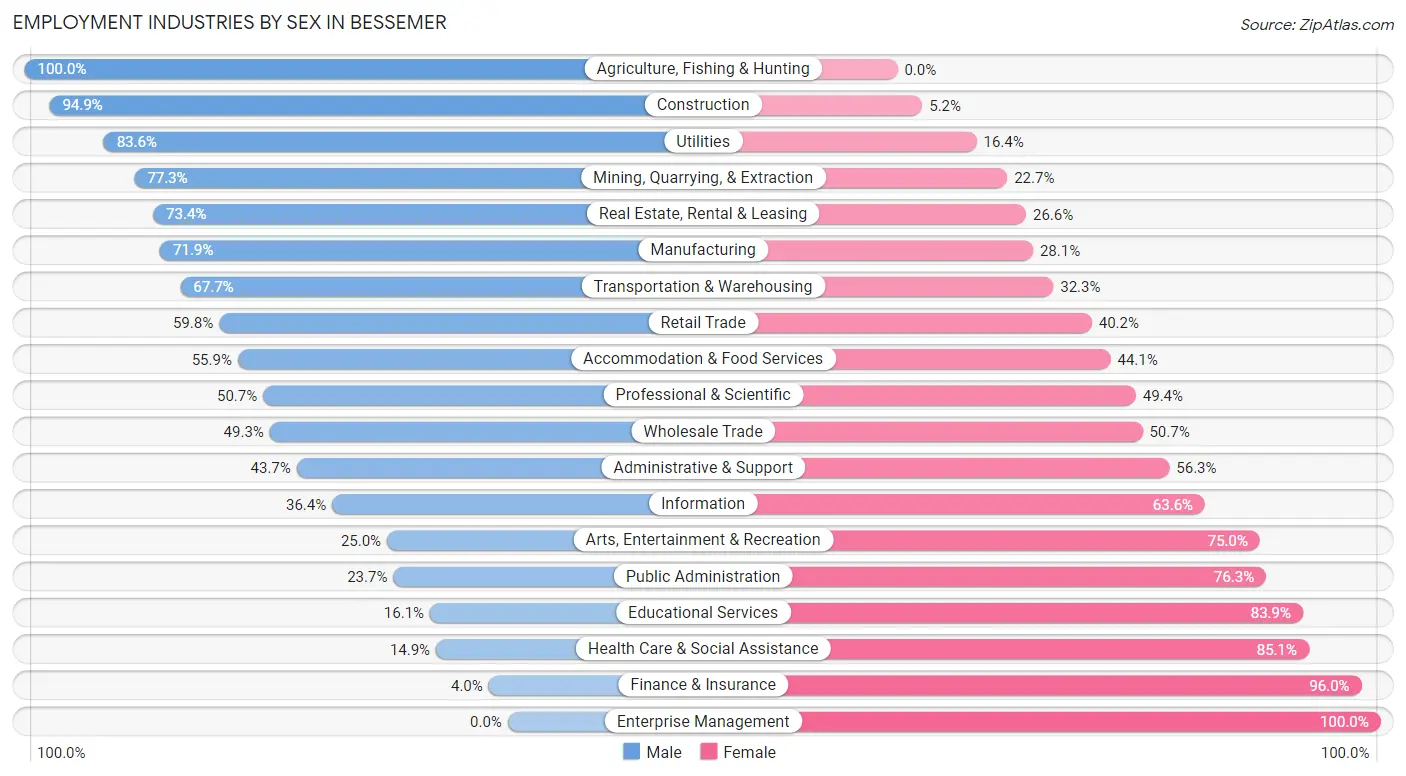
Employment Industries by Sex in Bessemer
The Bessemer industries that see more men than women are Agriculture, Fishing & Hunting (100.0%), Construction (94.9%), and Utilities (83.6%), whereas the industries that tend to have a higher number of women are Enterprise Management (100.0%), Finance & Insurance (96.0%), and Health Care & Social Assistance (85.1%).
| Industry | Male | Female |
| Agriculture, Fishing & Hunting | 17 (100.0%) | 0 (0.0%) |
| Mining, Quarrying, & Extraction | 51 (77.3%) | 15 (22.7%) |
| Construction | 221 (94.9%) | 12 (5.1%) |
| Manufacturing | 805 (71.9%) | 314 (28.1%) |
| Wholesale Trade | 68 (49.3%) | 70 (50.7%) |
| Retail Trade | 875 (59.8%) | 589 (40.2%) |
| Transportation & Warehousing | 590 (67.7%) | 281 (32.3%) |
| Utilities | 194 (83.6%) | 38 (16.4%) |
| Information | 12 (36.4%) | 21 (63.6%) |
| Finance & Insurance | 26 (4.0%) | 630 (96.0%) |
| Real Estate, Rental & Leasing | 102 (73.4%) | 37 (26.6%) |
| Professional & Scientific | 78 (50.6%) | 76 (49.3%) |
| Enterprise Management | 0 (0.0%) | 13 (100.0%) |
| Administrative & Support | 191 (43.7%) | 246 (56.3%) |
| Educational Services | 87 (16.1%) | 453 (83.9%) |
| Health Care & Social Assistance | 235 (14.9%) | 1,346 (85.1%) |
| Arts, Entertainment & Recreation | 17 (25.0%) | 51 (75.0%) |
| Accommodation & Food Services | 504 (55.9%) | 398 (44.1%) |
| Public Administration | 73 (23.7%) | 235 (76.3%) |
| Total | 4,313 (46.4%) | 4,986 (53.6%) |
Education in Bessemer
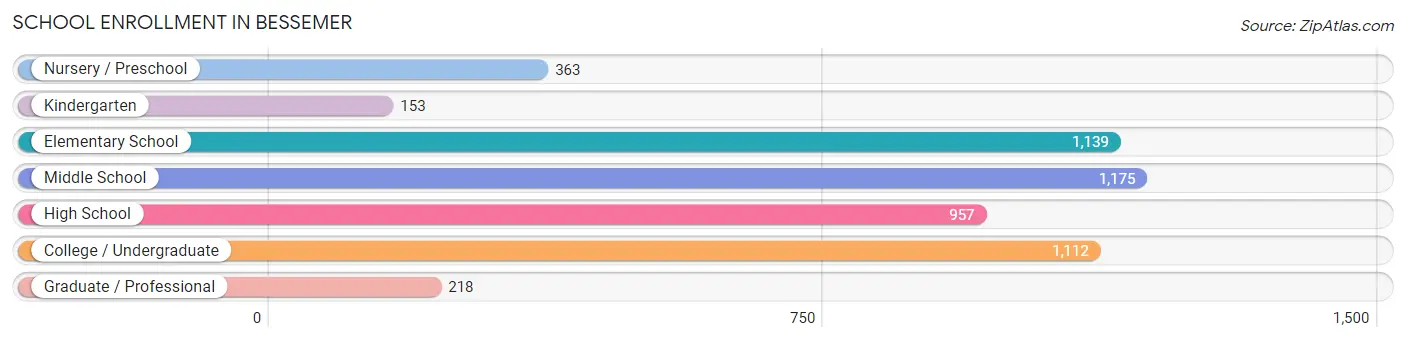
School Enrollment in Bessemer
The most common levels of schooling among the 5,117 students in Bessemer are middle school (1,175 | 23.0%), elementary school (1,139 | 22.3%), and college / undergraduate (1,112 | 21.7%).
| School Level | # Students | % Students |
| Nursery / Preschool | 363 | 7.1% |
| Kindergarten | 153 | 3.0% |
| Elementary School | 1,139 | 22.3% |
| Middle School | 1,175 | 23.0% |
| High School | 957 | 18.7% |
| College / Undergraduate | 1,112 | 21.7% |
| Graduate / Professional | 218 | 4.3% |
| Total | 5,117 | 100.0% |
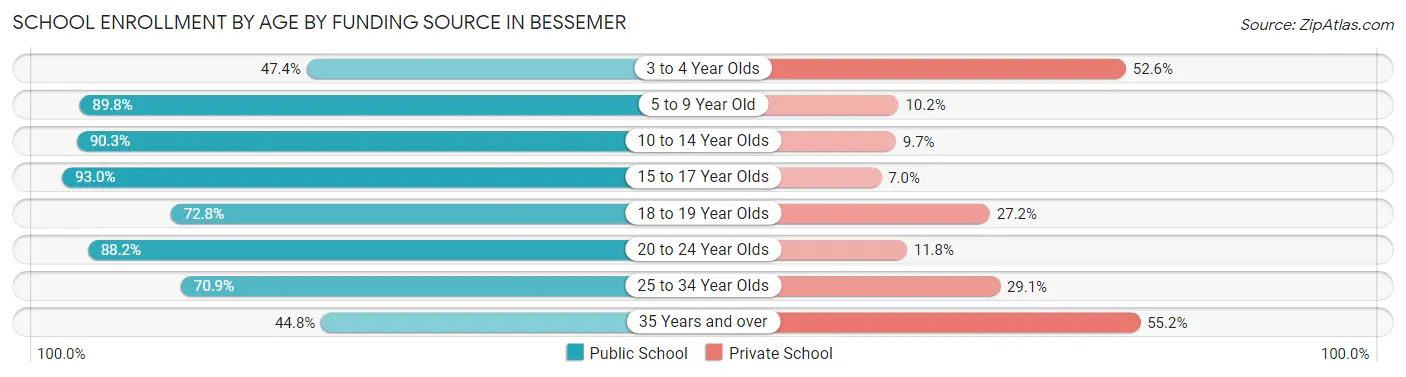
School Enrollment by Age by Funding Source in Bessemer
Out of a total of 5,117 students who are enrolled in schools in Bessemer, 1,018 (19.9%) attend a private institution, while the remaining 4,099 (80.1%) are enrolled in public schools. The age group of 35 years and over has the highest likelihood of being enrolled in private schools, with 327 (55.2% in the age bracket) enrolled. Conversely, the age group of 15 to 17 year olds has the lowest likelihood of being enrolled in a private school, with 532 (93.0% in the age bracket) attending a public institution.
| Age Bracket | Public School | Private School |
| 3 to 4 Year Olds | 167 (47.4%) | 185 (52.6%) |
| 5 to 9 Year Old | 1,126 (89.8%) | 128 (10.2%) |
| 10 to 14 Year Olds | 1,161 (90.3%) | 125 (9.7%) |
| 15 to 17 Year Olds | 532 (93.0%) | 40 (7.0%) |
| 18 to 19 Year Olds | 286 (72.8%) | 107 (27.2%) |
| 20 to 24 Year Olds | 450 (88.2%) | 60 (11.8%) |
| 25 to 34 Year Olds | 112 (70.9%) | 46 (29.1%) |
| 35 Years and over | 265 (44.8%) | 327 (55.2%) |
| Total | 4,099 (80.1%) | 1,018 (19.9%) |
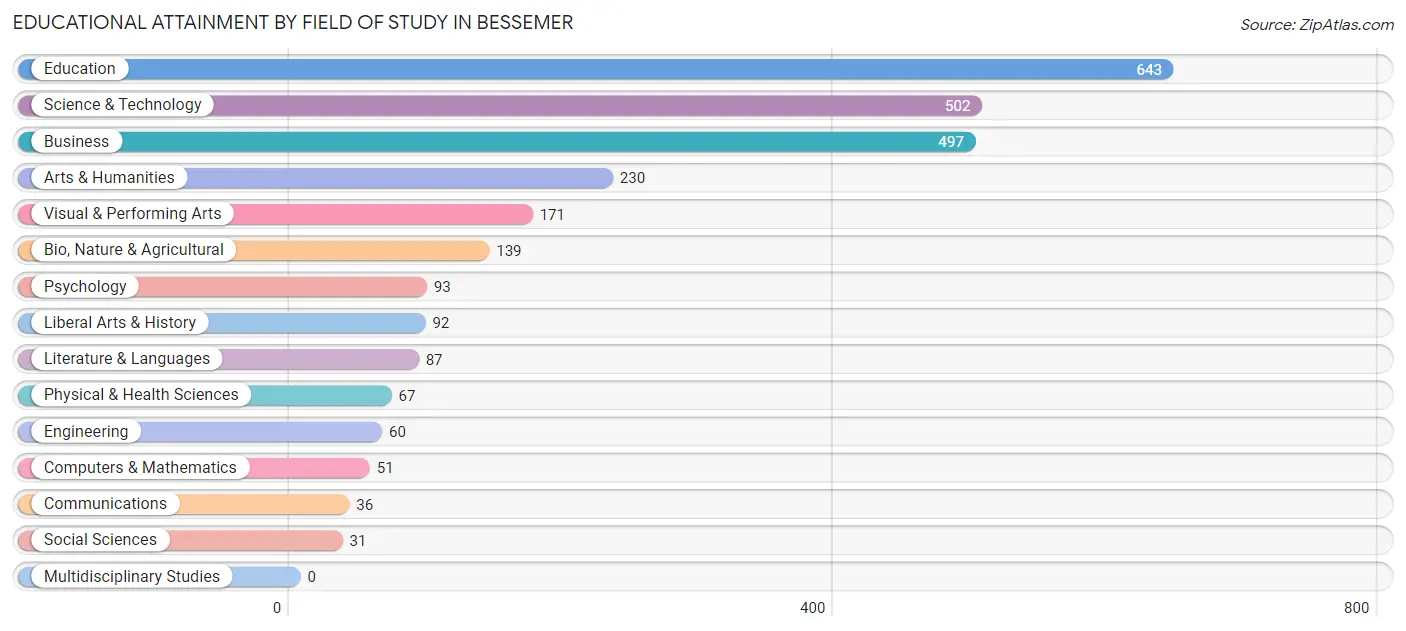
Educational Attainment by Field of Study in Bessemer
Education (643 | 23.8%), science & technology (502 | 18.6%), business (497 | 18.4%), arts & humanities (230 | 8.5%), and visual & performing arts (171 | 6.3%) are the most common fields of study among 2,699 individuals in Bessemer who have obtained a bachelor's degree or higher.
| Field of Study | # Graduates | % Graduates |
| Computers & Mathematics | 51 | 1.9% |
| Bio, Nature & Agricultural | 139 | 5.1% |
| Physical & Health Sciences | 67 | 2.5% |
| Psychology | 93 | 3.5% |
| Social Sciences | 31 | 1.1% |
| Engineering | 60 | 2.2% |
| Multidisciplinary Studies | 0 | 0.0% |
| Science & Technology | 502 | 18.6% |
| Business | 497 | 18.4% |
| Education | 643 | 23.8% |
| Literature & Languages | 87 | 3.2% |
| Liberal Arts & History | 92 | 3.4% |
| Visual & Performing Arts | 171 | 6.3% |
| Communications | 36 | 1.3% |
| Arts & Humanities | 230 | 8.5% |
| Total | 2,699 | 100.0% |
Transportation & Commute in Bessemer
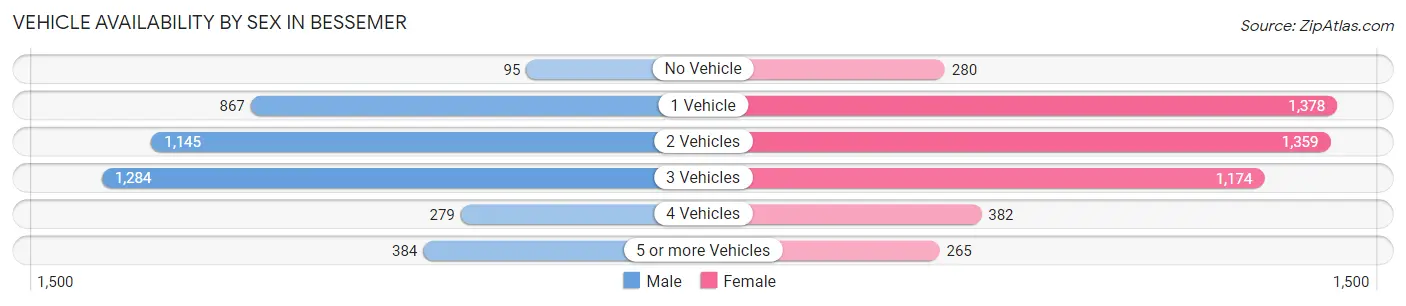
Vehicle Availability by Sex in Bessemer
The most prevalent vehicle ownership categories in Bessemer are males with 3 vehicles (1,284, accounting for 31.7%) and females with 3 vehicles (1,174, making up 26.5%).
| Vehicles Available | Male | Female |
| No Vehicle | 95 (2.3%) | 280 (5.8%) |
| 1 Vehicle | 867 (21.4%) | 1,378 (28.5%) |
| 2 Vehicles | 1,145 (28.2%) | 1,359 (28.1%) |
| 3 Vehicles | 1,284 (31.7%) | 1,174 (24.3%) |
| 4 Vehicles | 279 (6.9%) | 382 (7.9%) |
| 5 or more Vehicles | 384 (9.5%) | 265 (5.5%) |
| Total | 4,054 (100.0%) | 4,838 (100.0%) |
Commute Time in Bessemer
The most frequently occuring commute durations in Bessemer are 20 to 24 minutes (1,520 commuters, 18.6%), 30 to 34 minutes (1,312 commuters, 16.1%), and 10 to 14 minutes (1,198 commuters, 14.7%).
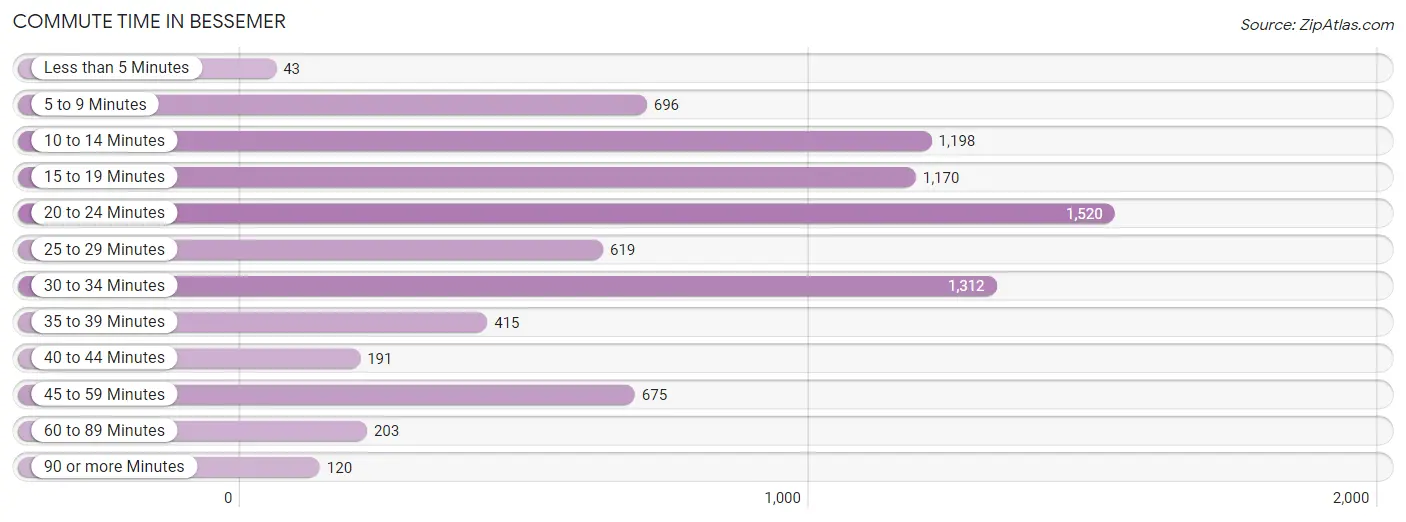
| Commute Time | # Commuters | % Commuters |
| Less than 5 Minutes | 43 | 0.5% |
| 5 to 9 Minutes | 696 | 8.5% |
| 10 to 14 Minutes | 1,198 | 14.7% |
| 15 to 19 Minutes | 1,170 | 14.3% |
| 20 to 24 Minutes | 1,520 | 18.6% |
| 25 to 29 Minutes | 619 | 7.6% |
| 30 to 34 Minutes | 1,312 | 16.1% |
| 35 to 39 Minutes | 415 | 5.1% |
| 40 to 44 Minutes | 191 | 2.3% |
| 45 to 59 Minutes | 675 | 8.3% |
| 60 to 89 Minutes | 203 | 2.5% |
| 90 or more Minutes | 120 | 1.5% |
Commute Time by Sex in Bessemer
The most common commute times in Bessemer are 20 to 24 minutes (690 commuters, 17.7%) for males and 20 to 24 minutes (830 commuters, 19.5%) for females.
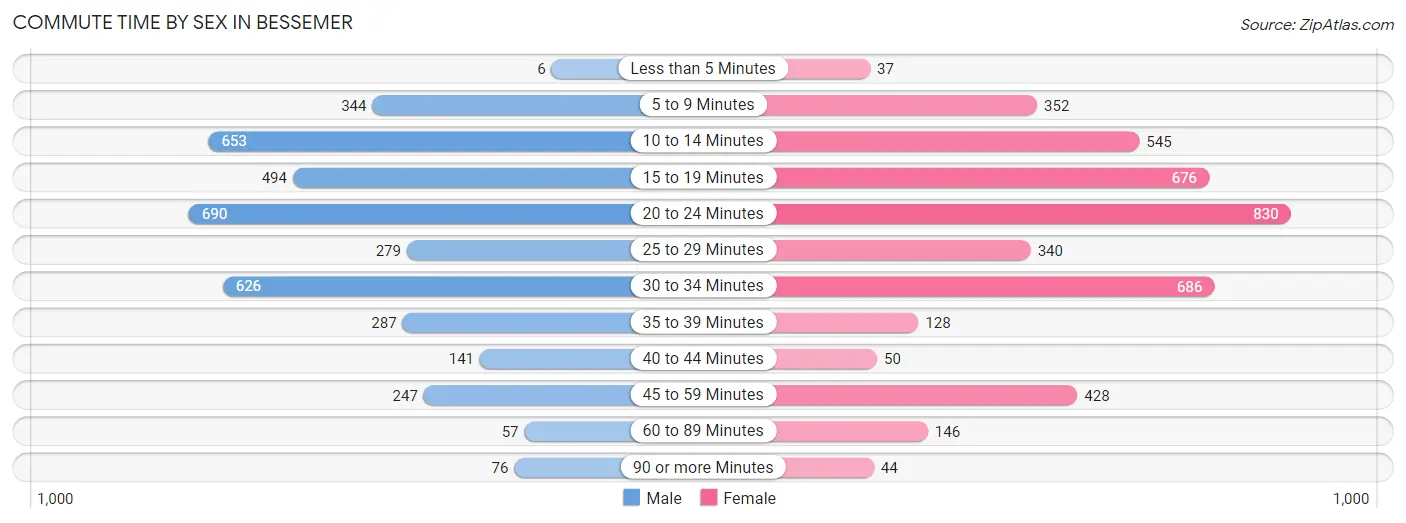
| Commute Time | Male | Female |
| Less than 5 Minutes | 6 (0.2%) | 37 (0.9%) |
| 5 to 9 Minutes | 344 (8.8%) | 352 (8.3%) |
| 10 to 14 Minutes | 653 (16.7%) | 545 (12.8%) |
| 15 to 19 Minutes | 494 (12.7%) | 676 (15.9%) |
| 20 to 24 Minutes | 690 (17.7%) | 830 (19.5%) |
| 25 to 29 Minutes | 279 (7.1%) | 340 (8.0%) |
| 30 to 34 Minutes | 626 (16.1%) | 686 (16.1%) |
| 35 to 39 Minutes | 287 (7.4%) | 128 (3.0%) |
| 40 to 44 Minutes | 141 (3.6%) | 50 (1.2%) |
| 45 to 59 Minutes | 247 (6.3%) | 428 (10.0%) |
| 60 to 89 Minutes | 57 (1.5%) | 146 (3.4%) |
| 90 or more Minutes | 76 (1.9%) | 44 (1.0%) |
Time of Departure to Work by Sex in Bessemer
The most frequent times of departure to work in Bessemer are 7:00 AM to 7:29 AM (624, 16.0%) for males and 7:30 AM to 7:59 AM (718, 16.9%) for females.
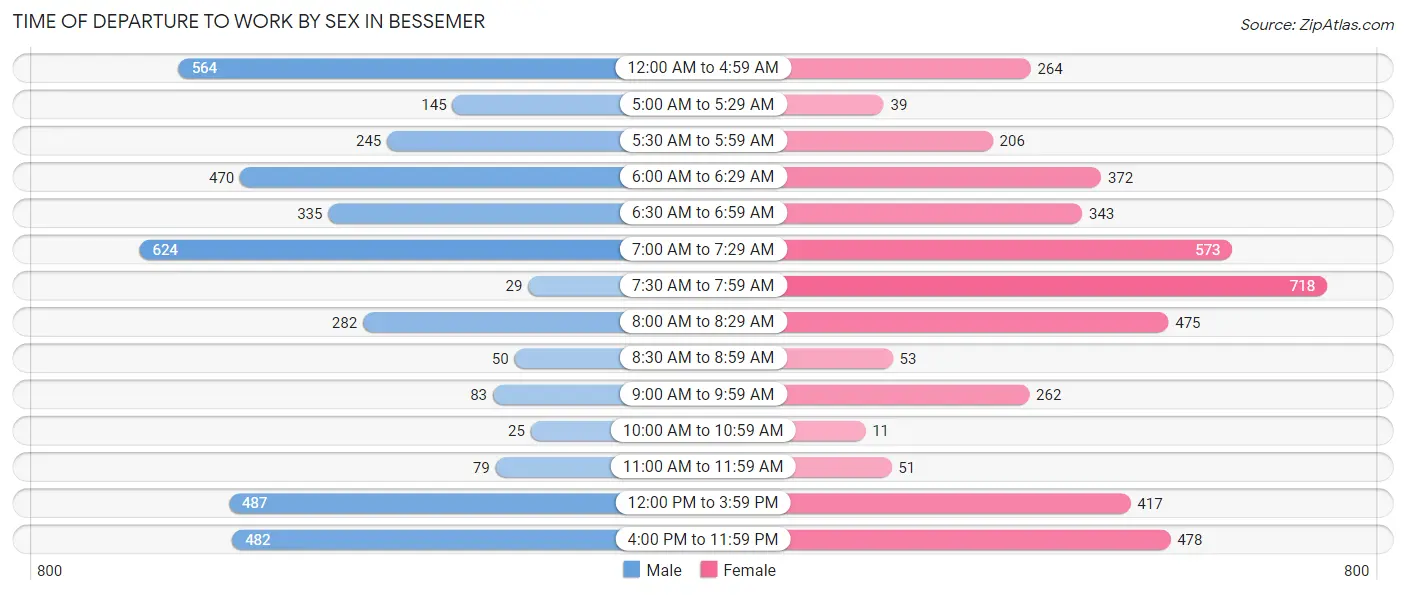
| Time of Departure | Male | Female |
| 12:00 AM to 4:59 AM | 564 (14.5%) | 264 (6.2%) |
| 5:00 AM to 5:29 AM | 145 (3.7%) | 39 (0.9%) |
| 5:30 AM to 5:59 AM | 245 (6.3%) | 206 (4.8%) |
| 6:00 AM to 6:29 AM | 470 (12.0%) | 372 (8.7%) |
| 6:30 AM to 6:59 AM | 335 (8.6%) | 343 (8.1%) |
| 7:00 AM to 7:29 AM | 624 (16.0%) | 573 (13.4%) |
| 7:30 AM to 7:59 AM | 29 (0.7%) | 718 (16.9%) |
| 8:00 AM to 8:29 AM | 282 (7.2%) | 475 (11.2%) |
| 8:30 AM to 8:59 AM | 50 (1.3%) | 53 (1.2%) |
| 9:00 AM to 9:59 AM | 83 (2.1%) | 262 (6.1%) |
| 10:00 AM to 10:59 AM | 25 (0.6%) | 11 (0.3%) |
| 11:00 AM to 11:59 AM | 79 (2.0%) | 51 (1.2%) |
| 12:00 PM to 3:59 PM | 487 (12.5%) | 417 (9.8%) |
| 4:00 PM to 11:59 PM | 482 (12.4%) | 478 (11.2%) |
| Total | 3,900 (100.0%) | 4,262 (100.0%) |
Housing Occupancy in Bessemer
Occupancy by Ownership in Bessemer
Of the total 10,316 dwellings in Bessemer, owner-occupied units account for 5,604 (54.3%), while renter-occupied units make up 4,712 (45.7%).
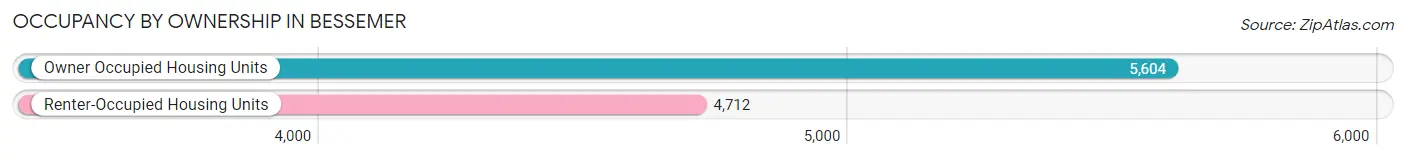
| Occupancy | # Housing Units | % Housing Units |
| Owner Occupied Housing Units | 5,604 | 54.3% |
| Renter-Occupied Housing Units | 4,712 | 45.7% |
| Total Occupied Housing Units | 10,316 | 100.0% |
Occupancy by Household Size in Bessemer
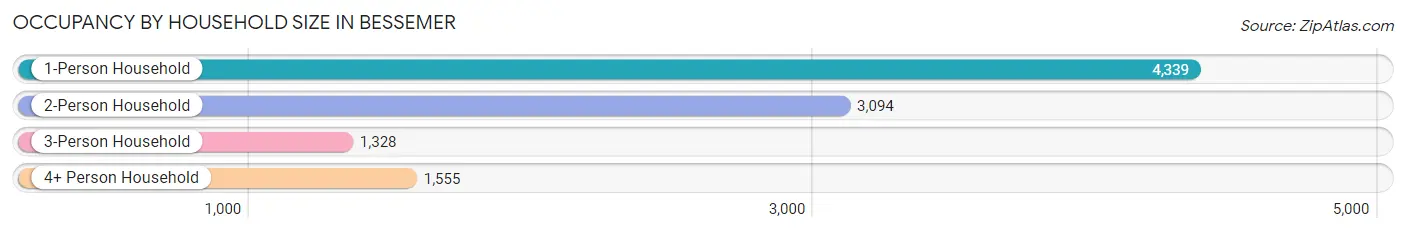
| Household Size | # Housing Units | % Housing Units |
| 1-Person Household | 4,339 | 42.1% |
| 2-Person Household | 3,094 | 30.0% |
| 3-Person Household | 1,328 | 12.9% |
| 4+ Person Household | 1,555 | 15.1% |
| Total Housing Units | 10,316 | 100.0% |
Occupancy by Ownership by Household Size in Bessemer
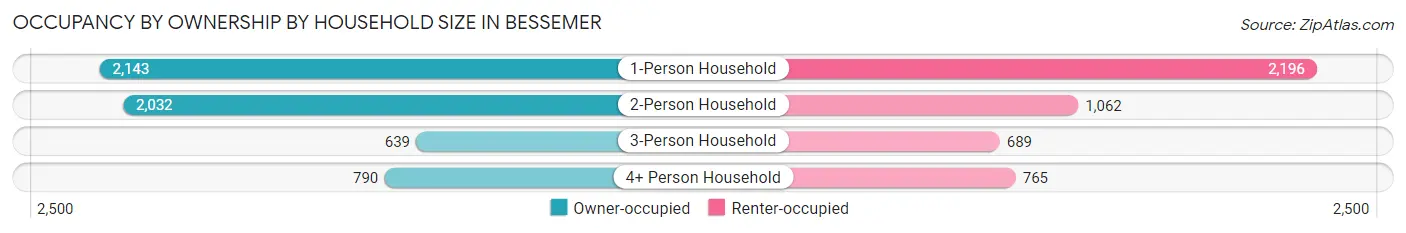
| Household Size | Owner-occupied | Renter-occupied |
| 1-Person Household | 2,143 (49.4%) | 2,196 (50.6%) |
| 2-Person Household | 2,032 (65.7%) | 1,062 (34.3%) |
| 3-Person Household | 639 (48.1%) | 689 (51.9%) |
| 4+ Person Household | 790 (50.8%) | 765 (49.2%) |
| Total Housing Units | 5,604 (54.3%) | 4,712 (45.7%) |
Occupancy by Educational Attainment in Bessemer
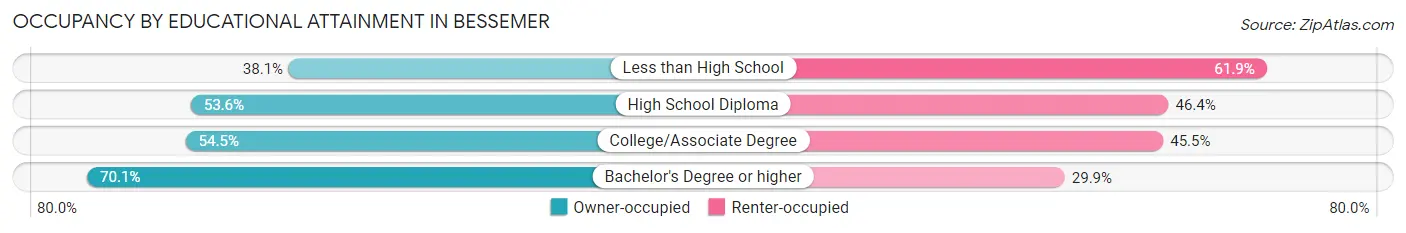
| Household Size | Owner-occupied | Renter-occupied |
| Less than High School | 481 (38.1%) | 782 (61.9%) |
| High School Diploma | 2,255 (53.6%) | 1,950 (46.4%) |
| College/Associate Degree | 1,845 (54.5%) | 1,543 (45.5%) |
| Bachelor's Degree or higher | 1,023 (70.1%) | 437 (29.9%) |
Occupancy by Age of Householder in Bessemer
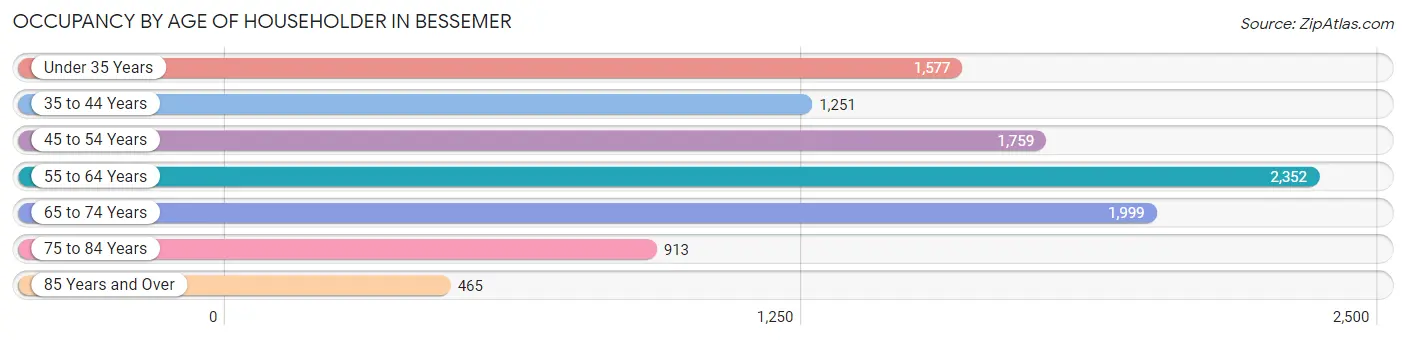
| Age Bracket | # Households | % Households |
| Under 35 Years | 1,577 | 15.3% |
| 35 to 44 Years | 1,251 | 12.1% |
| 45 to 54 Years | 1,759 | 17.1% |
| 55 to 64 Years | 2,352 | 22.8% |
| 65 to 74 Years | 1,999 | 19.4% |
| 75 to 84 Years | 913 | 8.8% |
| 85 Years and Over | 465 | 4.5% |
| Total | 10,316 | 100.0% |
Housing Finances in Bessemer
Median Income by Occupancy in Bessemer
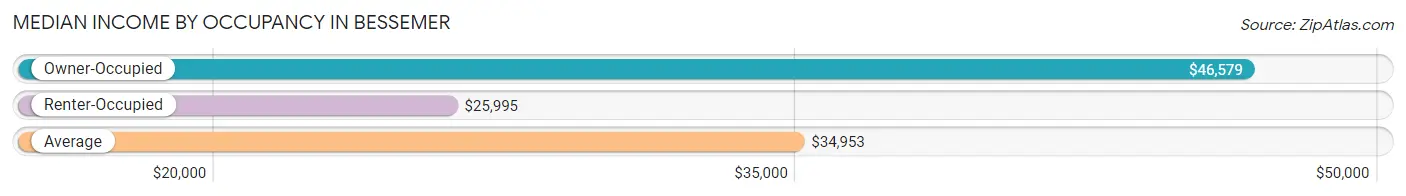
| Occupancy Type | # Households | Median Income |
| Owner-Occupied | 5,604 (54.3%) | $46,579 |
| Renter-Occupied | 4,712 (45.7%) | $25,995 |
| Average | 10,316 (100.0%) | $34,953 |
Occupancy by Householder Income Bracket in Bessemer
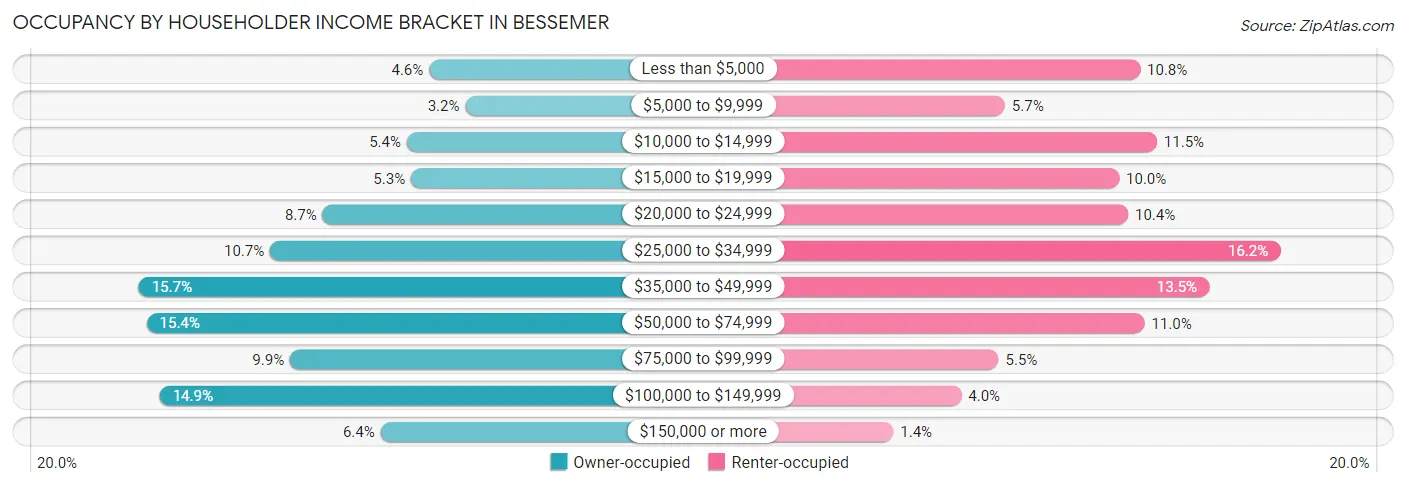
| Income Bracket | Owner-occupied | Renter-occupied |
| Less than $5,000 | 257 (4.6%) | 511 (10.8%) |
| $5,000 to $9,999 | 180 (3.2%) | 268 (5.7%) |
| $10,000 to $14,999 | 305 (5.4%) | 541 (11.5%) |
| $15,000 to $19,999 | 296 (5.3%) | 473 (10.0%) |
| $20,000 to $24,999 | 485 (8.6%) | 489 (10.4%) |
| $25,000 to $34,999 | 597 (10.6%) | 762 (16.2%) |
| $35,000 to $49,999 | 877 (15.7%) | 634 (13.5%) |
| $50,000 to $74,999 | 860 (15.3%) | 519 (11.0%) |
| $75,000 to $99,999 | 554 (9.9%) | 257 (5.4%) |
| $100,000 to $149,999 | 832 (14.8%) | 190 (4.0%) |
| $150,000 or more | 361 (6.4%) | 68 (1.4%) |
| Total | 5,604 (100.0%) | 4,712 (100.0%) |
Monthly Housing Cost Tiers in Bessemer
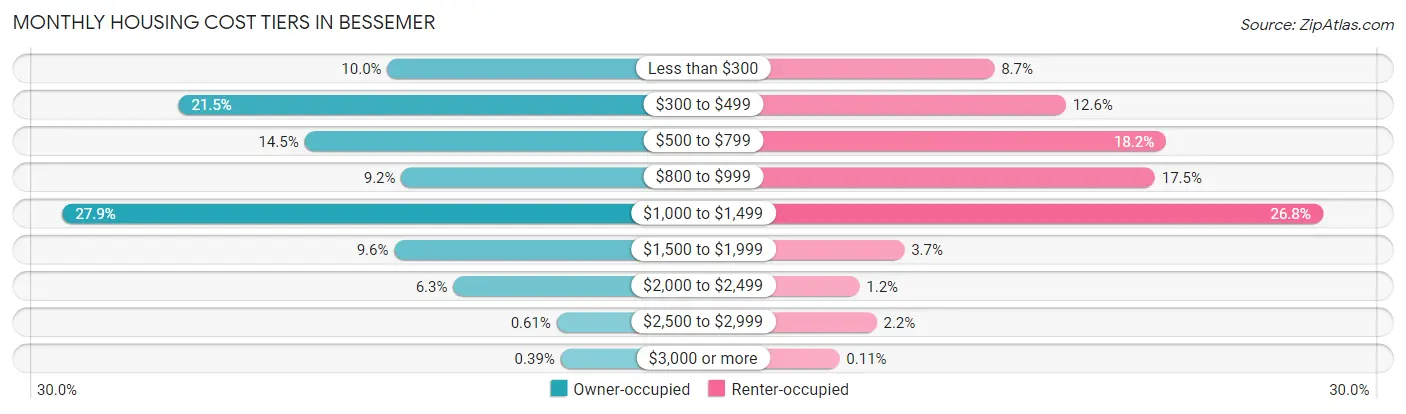
| Monthly Cost | Owner-occupied | Renter-occupied |
| Less than $300 | 558 (10.0%) | 408 (8.7%) |
| $300 to $499 | 1,205 (21.5%) | 594 (12.6%) |
| $500 to $799 | 815 (14.5%) | 855 (18.1%) |
| $800 to $999 | 515 (9.2%) | 826 (17.5%) |
| $1,000 to $1,499 | 1,564 (27.9%) | 1,263 (26.8%) |
| $1,500 to $1,999 | 537 (9.6%) | 174 (3.7%) |
| $2,000 to $2,499 | 354 (6.3%) | 57 (1.2%) |
| $2,500 to $2,999 | 34 (0.6%) | 102 (2.2%) |
| $3,000 or more | 22 (0.4%) | 5 (0.1%) |
| Total | 5,604 (100.0%) | 4,712 (100.0%) |
Physical Housing Characteristics in Bessemer
Housing Structures in Bessemer
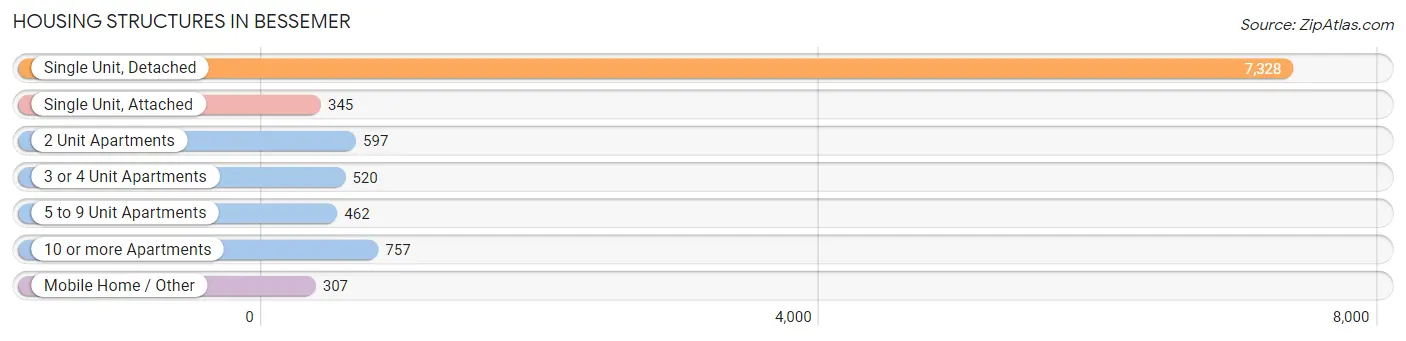
| Structure Type | # Housing Units | % Housing Units |
| Single Unit, Detached | 7,328 | 71.0% |
| Single Unit, Attached | 345 | 3.3% |
| 2 Unit Apartments | 597 | 5.8% |
| 3 or 4 Unit Apartments | 520 | 5.0% |
| 5 to 9 Unit Apartments | 462 | 4.5% |
| 10 or more Apartments | 757 | 7.3% |
| Mobile Home / Other | 307 | 3.0% |
| Total | 10,316 | 100.0% |
Housing Structures by Occupancy in Bessemer
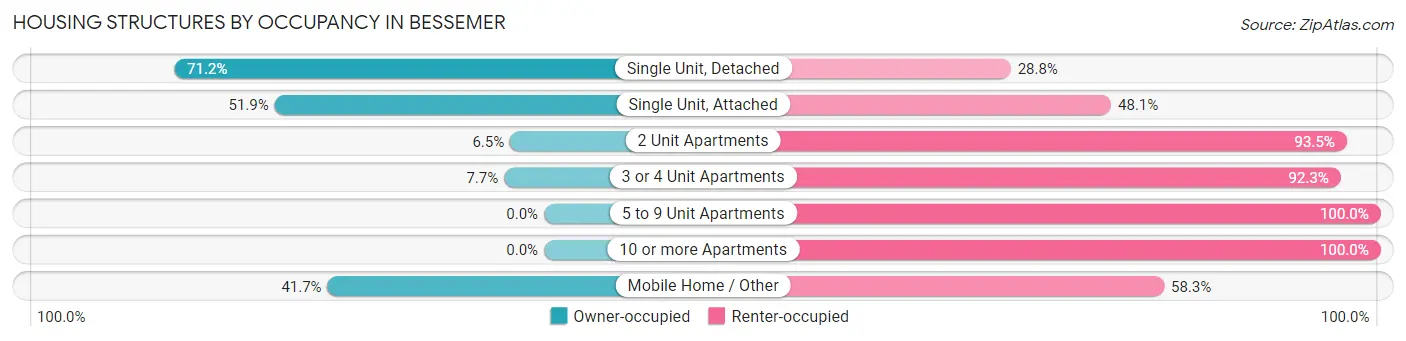
| Structure Type | Owner-occupied | Renter-occupied |
| Single Unit, Detached | 5,218 (71.2%) | 2,110 (28.8%) |
| Single Unit, Attached | 179 (51.9%) | 166 (48.1%) |
| 2 Unit Apartments | 39 (6.5%) | 558 (93.5%) |
| 3 or 4 Unit Apartments | 40 (7.7%) | 480 (92.3%) |
| 5 to 9 Unit Apartments | 0 (0.0%) | 462 (100.0%) |
| 10 or more Apartments | 0 (0.0%) | 757 (100.0%) |
| Mobile Home / Other | 128 (41.7%) | 179 (58.3%) |
| Total | 5,604 (54.3%) | 4,712 (45.7%) |
Housing Structures by Number of Rooms in Bessemer
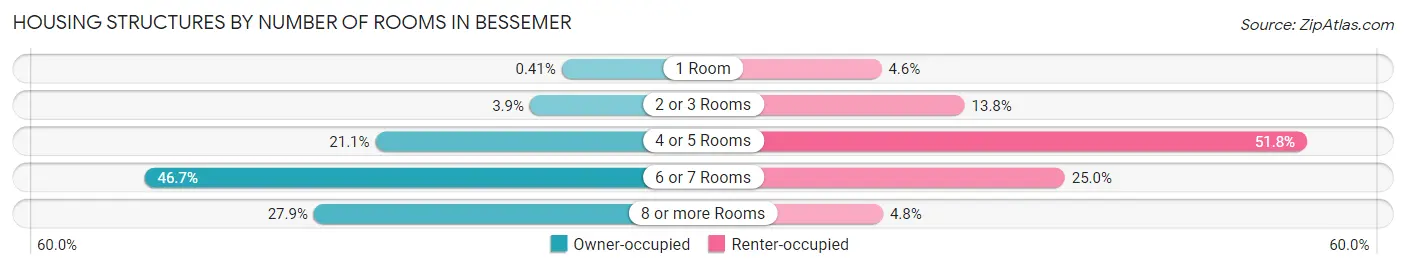
| Number of Rooms | Owner-occupied | Renter-occupied |
| 1 Room | 23 (0.4%) | 217 (4.6%) |
| 2 or 3 Rooms | 220 (3.9%) | 652 (13.8%) |
| 4 or 5 Rooms | 1,181 (21.1%) | 2,442 (51.8%) |
| 6 or 7 Rooms | 2,616 (46.7%) | 1,176 (25.0%) |
| 8 or more Rooms | 1,564 (27.9%) | 225 (4.8%) |
| Total | 5,604 (100.0%) | 4,712 (100.0%) |
Housing Structure by Heating Type in Bessemer
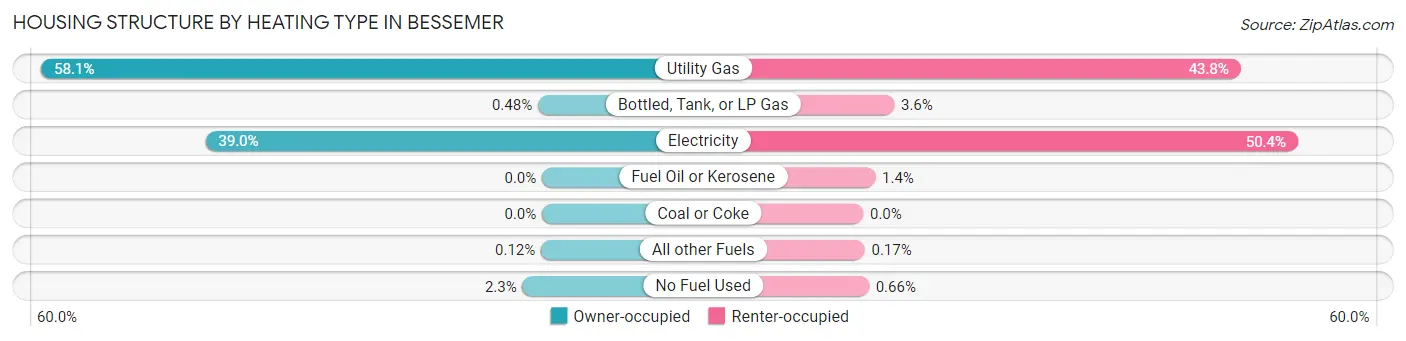
| Heating Type | Owner-occupied | Renter-occupied |
| Utility Gas | 3,255 (58.1%) | 2,063 (43.8%) |
| Bottled, Tank, or LP Gas | 27 (0.5%) | 169 (3.6%) |
| Electricity | 2,188 (39.0%) | 2,375 (50.4%) |
| Fuel Oil or Kerosene | 0 (0.0%) | 66 (1.4%) |
| Coal or Coke | 0 (0.0%) | 0 (0.0%) |
| All other Fuels | 7 (0.1%) | 8 (0.2%) |
| No Fuel Used | 127 (2.3%) | 31 (0.7%) |
| Total | 5,604 (100.0%) | 4,712 (100.0%) |
Household Vehicle Usage in Bessemer
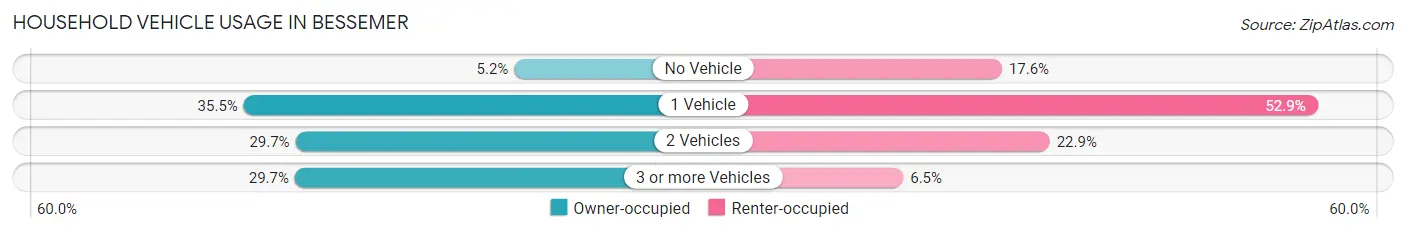
| Vehicles per Household | Owner-occupied | Renter-occupied |
| No Vehicle | 289 (5.2%) | 829 (17.6%) |
| 1 Vehicle | 1,987 (35.5%) | 2,494 (52.9%) |
| 2 Vehicles | 1,662 (29.7%) | 1,081 (22.9%) |
| 3 or more Vehicles | 1,666 (29.7%) | 308 (6.5%) |
| Total | 5,604 (100.0%) | 4,712 (100.0%) |
Real Estate & Mortgages in Bessemer
Real Estate and Mortgage Overview in Bessemer
| Characteristic | Without Mortgage | With Mortgage |
| Housing Units | 2,518 | 3,086 |
| Median Property Value | $88,800 | $148,700 |
| Median Household Income | $40,000 | $201 |
| Monthly Housing Costs | $422 | $4 |
| Real Estate Taxes | $749 | $634 |
Property Value by Mortgage Status in Bessemer
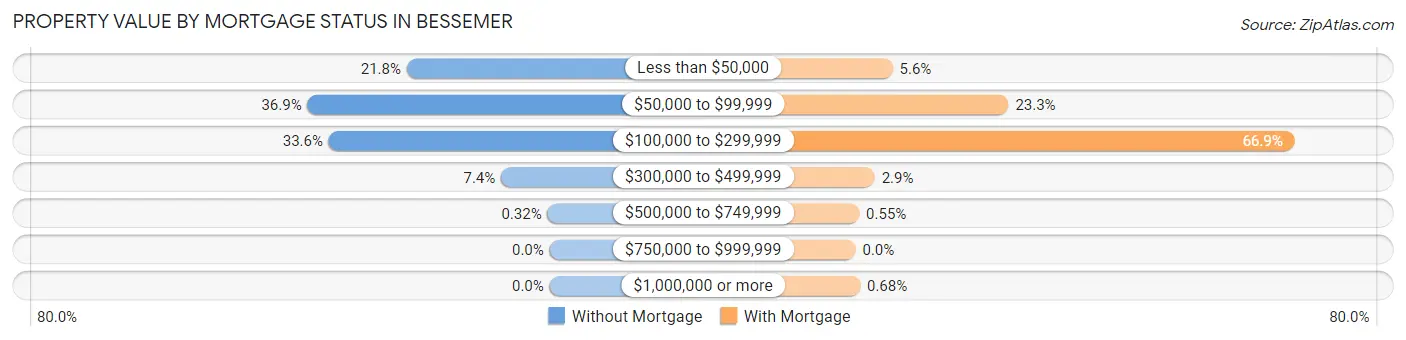
| Property Value | Without Mortgage | With Mortgage |
| Less than $50,000 | 548 (21.8%) | 174 (5.6%) |
| $50,000 to $99,999 | 929 (36.9%) | 719 (23.3%) |
| $100,000 to $299,999 | 847 (33.6%) | 2,065 (66.9%) |
| $300,000 to $499,999 | 186 (7.4%) | 90 (2.9%) |
| $500,000 to $749,999 | 8 (0.3%) | 17 (0.5%) |
| $750,000 to $999,999 | 0 (0.0%) | 0 (0.0%) |
| $1,000,000 or more | 0 (0.0%) | 21 (0.7%) |
| Total | 2,518 (100.0%) | 3,086 (100.0%) |
Household Income by Mortgage Status in Bessemer
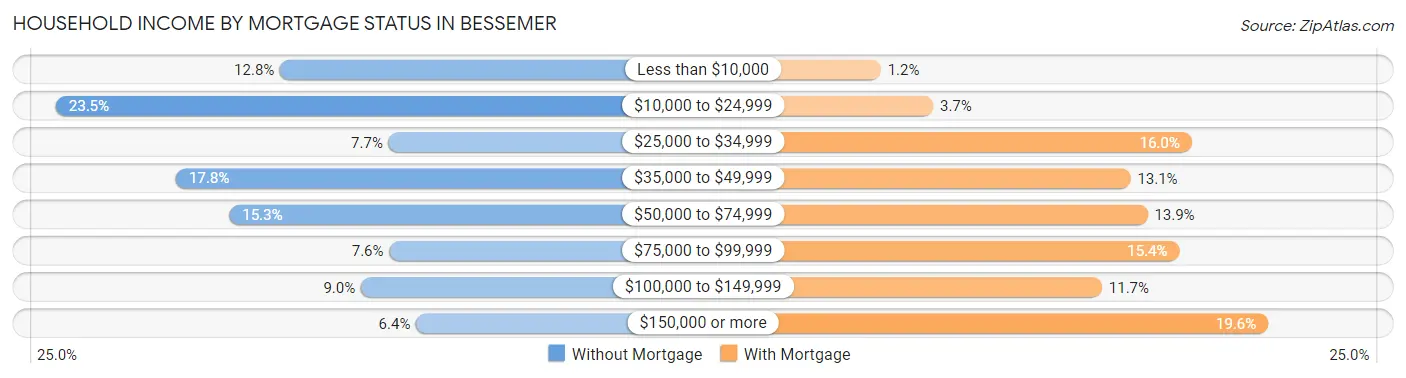
| Household Income | Without Mortgage | With Mortgage |
| Less than $10,000 | 323 (12.8%) | 37 (1.2%) |
| $10,000 to $24,999 | 592 (23.5%) | 114 (3.7%) |
| $25,000 to $34,999 | 193 (7.7%) | 494 (16.0%) |
| $35,000 to $49,999 | 448 (17.8%) | 404 (13.1%) |
| $50,000 to $74,999 | 384 (15.2%) | 429 (13.9%) |
| $75,000 to $99,999 | 192 (7.6%) | 476 (15.4%) |
| $100,000 to $149,999 | 226 (9.0%) | 362 (11.7%) |
| $150,000 or more | 160 (6.4%) | 606 (19.6%) |
| Total | 2,518 (100.0%) | 3,086 (100.0%) |
Property Value to Household Income Ratio in Bessemer
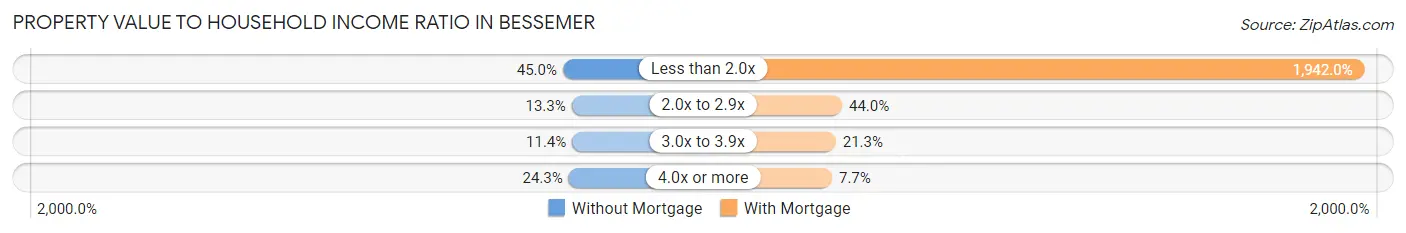
| Value-to-Income Ratio | Without Mortgage | With Mortgage |
| Less than 2.0x | 1,133 (45.0%) | 59,930 (1,942.0%) |
| 2.0x to 2.9x | 336 (13.3%) | 1,358 (44.0%) |
| 3.0x to 3.9x | 286 (11.4%) | 656 (21.3%) |
| 4.0x or more | 612 (24.3%) | 238 (7.7%) |
| Total | 2,518 (100.0%) | 3,086 (100.0%) |
Real Estate Taxes by Mortgage Status in Bessemer
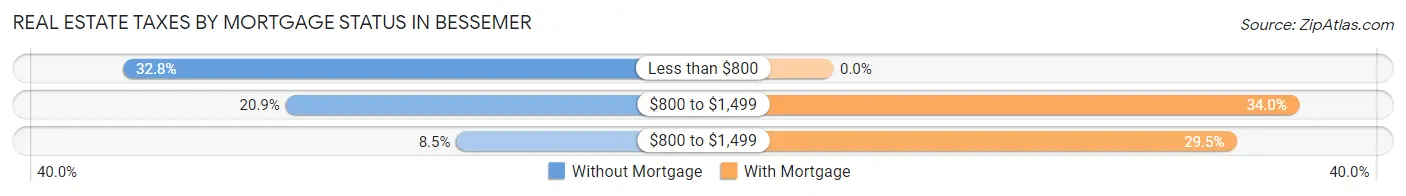
| Property Taxes | Without Mortgage | With Mortgage |
| Less than $800 | 826 (32.8%) | 0 (0.0%) |
| $800 to $1,499 | 527 (20.9%) | 1,050 (34.0%) |
| $800 to $1,499 | 213 (8.5%) | 909 (29.5%) |
| Total | 2,518 (100.0%) | 3,086 (100.0%) |
Health & Disability in Bessemer
Health Insurance Coverage by Age in Bessemer
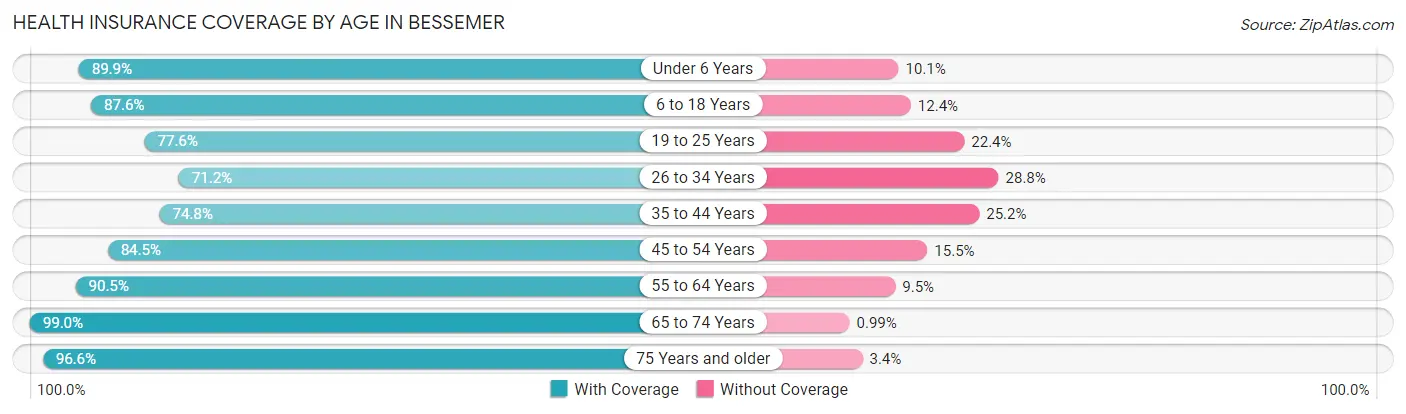
| Age Bracket | With Coverage | Without Coverage |
| Under 6 Years | 1,598 (89.9%) | 180 (10.1%) |
| 6 to 18 Years | 3,547 (87.6%) | 503 (12.4%) |
| 19 to 25 Years | 1,924 (77.6%) | 555 (22.4%) |
| 26 to 34 Years | 1,836 (71.2%) | 742 (28.8%) |
| 35 to 44 Years | 2,081 (74.8%) | 700 (25.2%) |
| 45 to 54 Years | 2,645 (84.5%) | 485 (15.5%) |
| 55 to 64 Years | 3,299 (90.5%) | 347 (9.5%) |
| 65 to 74 Years | 2,897 (99.0%) | 29 (1.0%) |
| 75 Years and older | 1,963 (96.6%) | 69 (3.4%) |
| Total | 21,790 (85.8%) | 3,610 (14.2%) |
Health Insurance Coverage by Citizenship Status in Bessemer
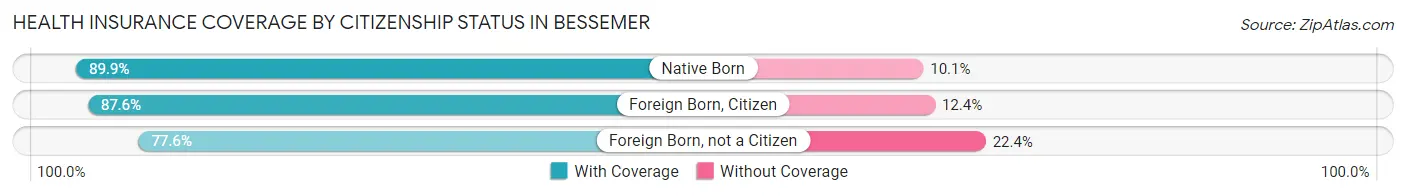
| Citizenship Status | With Coverage | Without Coverage |
| Native Born | 1,598 (89.9%) | 180 (10.1%) |
| Foreign Born, Citizen | 3,547 (87.6%) | 503 (12.4%) |
| Foreign Born, not a Citizen | 1,924 (77.6%) | 555 (22.4%) |
Health Insurance Coverage by Household Income in Bessemer
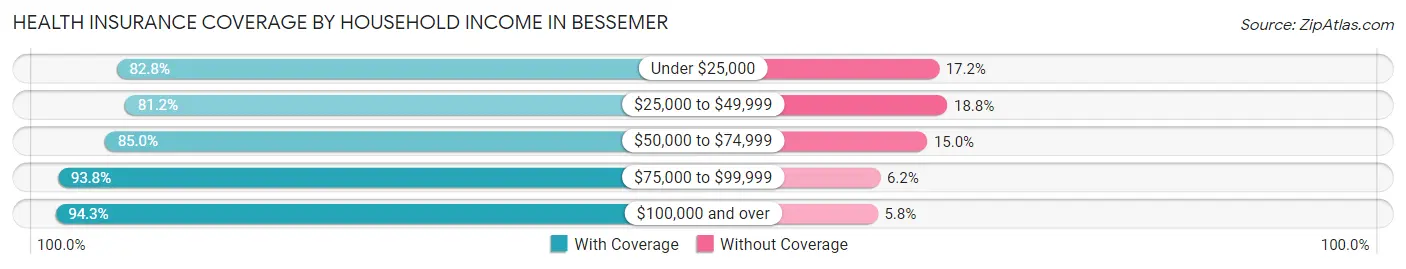
| Household Income | With Coverage | Without Coverage |
| Under $25,000 | 5,931 (82.8%) | 1,234 (17.2%) |
| $25,000 to $49,999 | 5,719 (81.2%) | 1,323 (18.8%) |
| $50,000 to $74,999 | 3,113 (85.0%) | 550 (15.0%) |
| $75,000 to $99,999 | 2,412 (93.8%) | 160 (6.2%) |
| $100,000 and over | 4,360 (94.3%) | 266 (5.8%) |
Public vs Private Health Insurance Coverage by Age in Bessemer
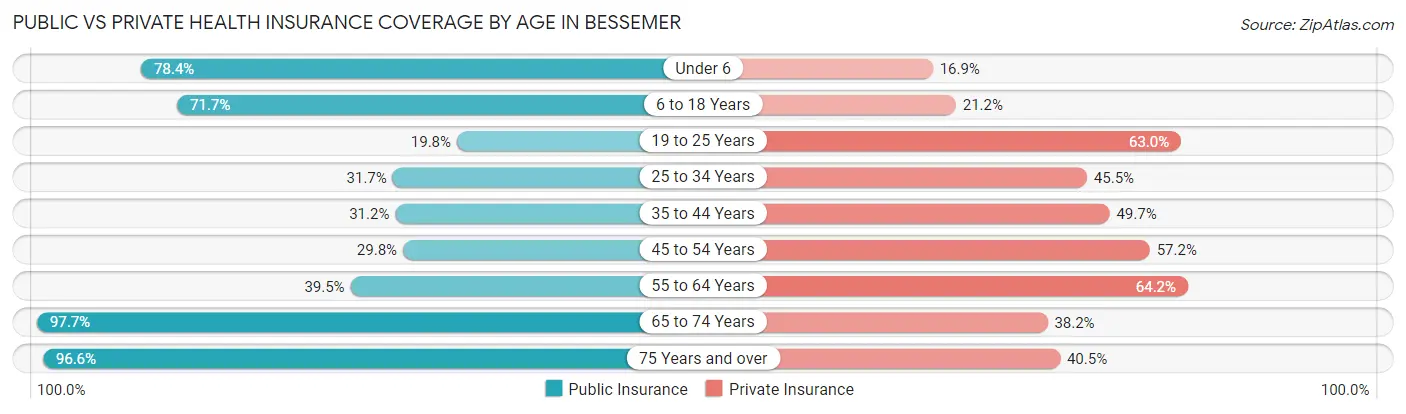
| Age Bracket | Public Insurance | Private Insurance |
| Under 6 | 1,394 (78.4%) | 300 (16.9%) |
| 6 to 18 Years | 2,904 (71.7%) | 857 (21.2%) |
| 19 to 25 Years | 490 (19.8%) | 1,561 (63.0%) |
| 25 to 34 Years | 817 (31.7%) | 1,173 (45.5%) |
| 35 to 44 Years | 868 (31.2%) | 1,382 (49.7%) |
| 45 to 54 Years | 932 (29.8%) | 1,789 (57.2%) |
| 55 to 64 Years | 1,441 (39.5%) | 2,342 (64.2%) |
| 65 to 74 Years | 2,859 (97.7%) | 1,117 (38.2%) |
| 75 Years and over | 1,963 (96.6%) | 823 (40.5%) |
| Total | 13,668 (53.8%) | 11,344 (44.7%) |
Disability Status by Sex by Age in Bessemer
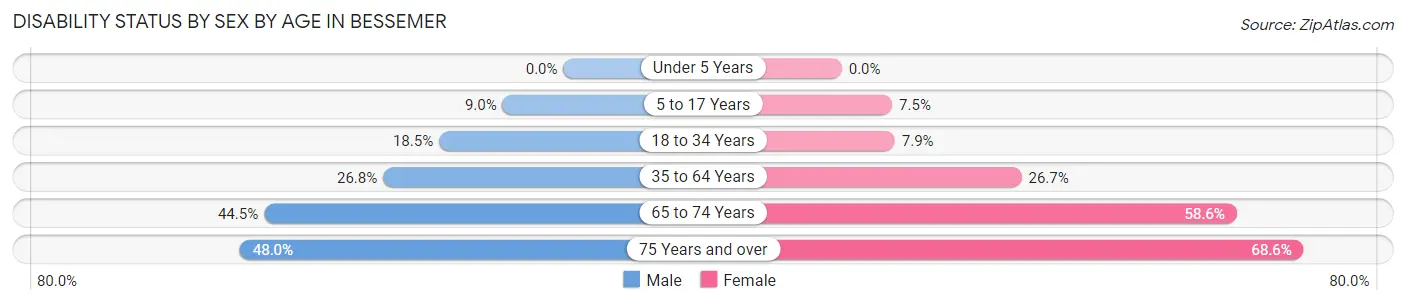
| Age Bracket | Male | Female |
| Under 5 Years | 0 (0.0%) | 0 (0.0%) |
| 5 to 17 Years | 169 (9.0%) | 142 (7.5%) |
| 18 to 34 Years | 527 (18.5%) | 207 (7.9%) |
| 35 to 64 Years | 1,134 (26.8%) | 1,420 (26.7%) |
| 65 to 74 Years | 541 (44.5%) | 1,002 (58.6%) |
| 75 Years and over | 354 (48.0%) | 888 (68.6%) |
Disability Class by Sex by Age in Bessemer
Disability Class: Hearing Difficulty
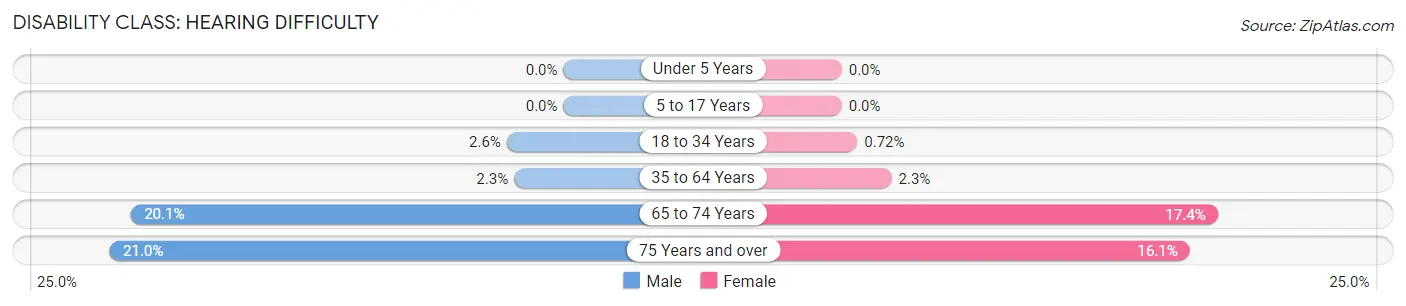
| Age Bracket | Male | Female |
| Under 5 Years | 0 (0.0%) | 0 (0.0%) |
| 5 to 17 Years | 0 (0.0%) | 0 (0.0%) |
| 18 to 34 Years | 75 (2.6%) | 19 (0.7%) |
| 35 to 64 Years | 97 (2.3%) | 123 (2.3%) |
| 65 to 74 Years | 244 (20.1%) | 298 (17.4%) |
| 75 Years and over | 155 (21.0%) | 209 (16.1%) |
Disability Class: Vision Difficulty
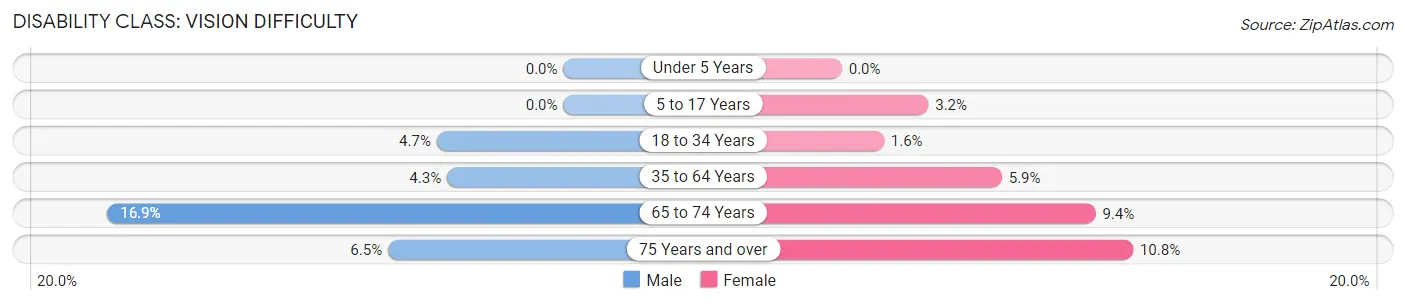
| Age Bracket | Male | Female |
| Under 5 Years | 0 (0.0%) | 0 (0.0%) |
| 5 to 17 Years | 0 (0.0%) | 61 (3.2%) |
| 18 to 34 Years | 134 (4.7%) | 41 (1.6%) |
| 35 to 64 Years | 183 (4.3%) | 316 (5.9%) |
| 65 to 74 Years | 206 (16.9%) | 161 (9.4%) |
| 75 Years and over | 48 (6.5%) | 140 (10.8%) |
Disability Class: Cognitive Difficulty
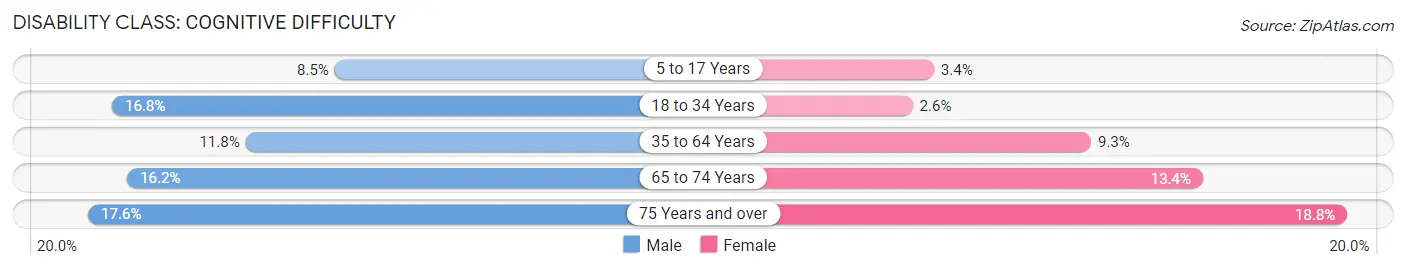
| Age Bracket | Male | Female |
| 5 to 17 Years | 159 (8.5%) | 65 (3.4%) |
| 18 to 34 Years | 478 (16.8%) | 69 (2.6%) |
| 35 to 64 Years | 500 (11.8%) | 492 (9.2%) |
| 65 to 74 Years | 197 (16.2%) | 229 (13.4%) |
| 75 Years and over | 130 (17.6%) | 243 (18.8%) |
Disability Class: Ambulatory Difficulty
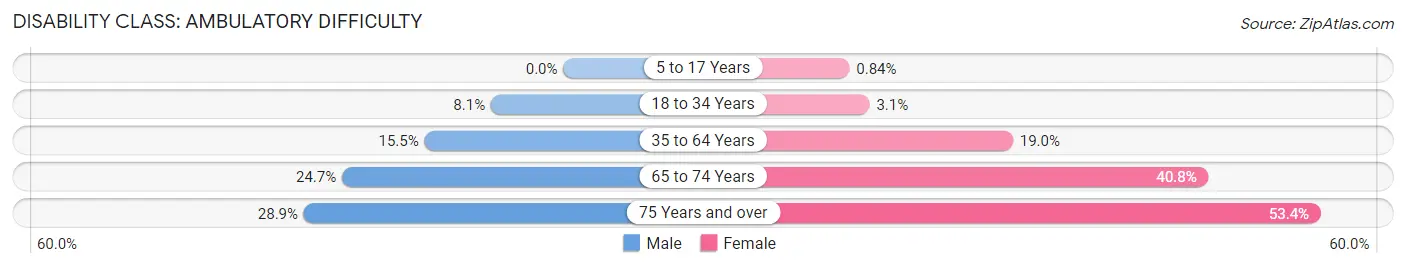
| Age Bracket | Male | Female |
| 5 to 17 Years | 0 (0.0%) | 16 (0.8%) |
| 18 to 34 Years | 230 (8.1%) | 81 (3.1%) |
| 35 to 64 Years | 655 (15.5%) | 1,013 (19.0%) |
| 65 to 74 Years | 300 (24.6%) | 698 (40.8%) |
| 75 Years and over | 213 (28.9%) | 691 (53.4%) |
Disability Class: Self-Care Difficulty
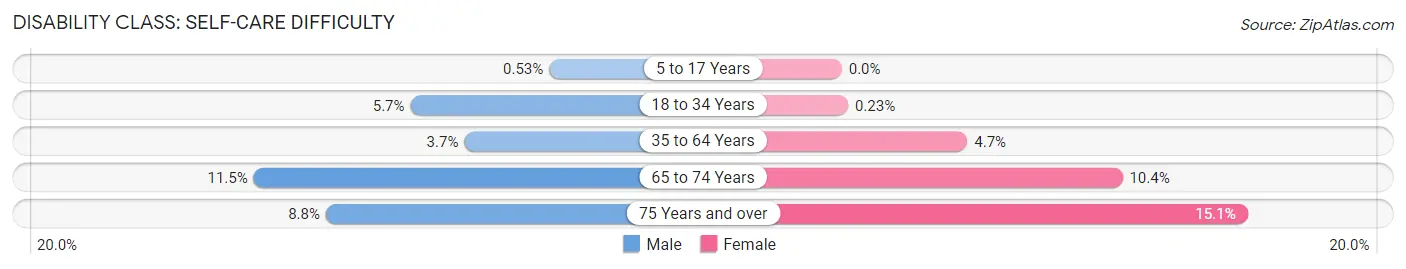
| Age Bracket | Male | Female |
| 5 to 17 Years | 10 (0.5%) | 0 (0.0%) |
| 18 to 34 Years | 162 (5.7%) | 6 (0.2%) |
| 35 to 64 Years | 156 (3.7%) | 248 (4.7%) |
| 65 to 74 Years | 140 (11.5%) | 178 (10.4%) |
| 75 Years and over | 65 (8.8%) | 195 (15.1%) |
Technology Access in Bessemer
Computing Device Access in Bessemer
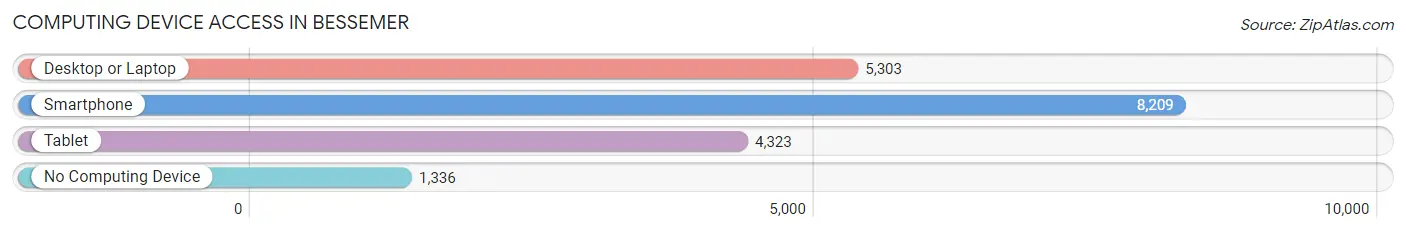
| Device Type | # Households | % Households |
| Desktop or Laptop | 5,303 | 51.4% |
| Smartphone | 8,209 | 79.6% |
| Tablet | 4,323 | 41.9% |
| No Computing Device | 1,336 | 13.0% |
| Total | 10,316 | 100.0% |
Internet Access in Bessemer
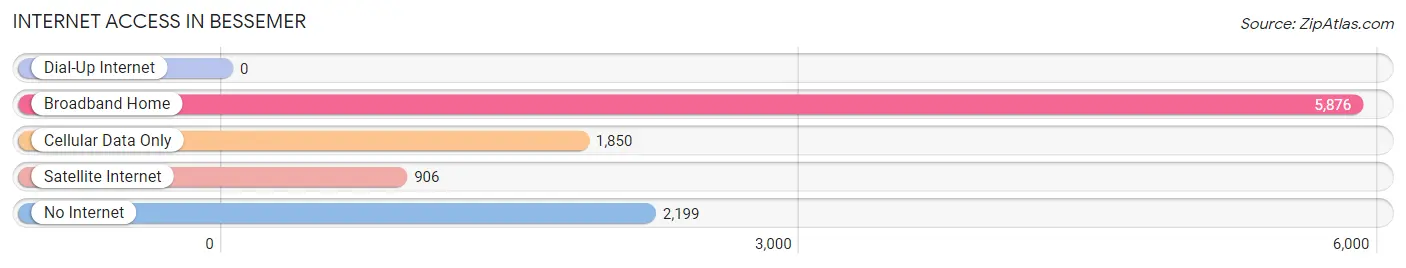
| Internet Type | # Households | % Households |
| Dial-Up Internet | 0 | 0.0% |
| Broadband Home | 5,876 | 57.0% |
| Cellular Data Only | 1,850 | 17.9% |
| Satellite Internet | 906 | 8.8% |
| No Internet | 2,199 | 21.3% |
| Total | 10,316 | 100.0% |
Bessemer Summary
Bessemer is a city located in Jefferson County, Alabama, United States. It is located in the Birmingham-Hoover Metropolitan Statistical Area and is part of the Birmingham-Hoover-Cullman Combined Statistical Area. The population was 27,456 at the 2010 census.
History
Bessemer was founded in 1887 by the Bessemer Land and Improvement Company, owned by coal magnate Henry F. DeBardeleben. The city was named after Henry Bessemer, a British inventor who developed a process to convert iron ore into steel. The city was incorporated in 1887 and was the site of the first Bessemer converter in the United States.
The city was a major industrial center in the early 20th century, with steel production being the primary industry. The city was home to the Tennessee Coal, Iron and Railroad Company (TCI), which was acquired by U.S. Steel in 1907. The city was also home to the Alabama Great Southern Railroad, which was acquired by the Southern Railway in 1971.
Geography
Bessemer is located at 33°23'25" North, 86°57'15" West (33.3903, -86.9542). According to the U.S. Census Bureau, the city has a total area of 24.2 square miles (62.7 km2), of which 24.1 square miles (62.4 km2) is land and 0.1 square miles (0.3 km2) is water.
Economy
Bessemer's economy is largely based on manufacturing and retail. The city is home to several large manufacturing plants, including U.S. Steel, Vulcan Materials, and Nucor Steel. The city is also home to several retail stores, including Walmart, Target, and Lowe's.
Demographics
As of the 2010 census, there were 27,456 people, 10,845 households, and 6,945 families residing in the city. The population density was 1,139.2 people per square mile (440.2/km2). There were 12,717 housing units at an average density of 527.2 per square mile (203.4/km2). The racial makeup of the city was 57.2% White, 37.7% Black or African American, 0.3% Native American, 0.7% Asian, 0.1% Pacific Islander, 2.2% from other races, and 2.0% from two or more races. 4.7% of the population were Hispanic or Latino of any race.
The median income for a household in the city was $30,912, and the median income for a family was $37,813. Males had a median income of $31,919 versus $25,836 for females. The per capita income for the city was $16,945. About 17.2% of families and 20.3% of the population were below the poverty line, including 28.3% of those under age 18 and 16.2% of those age 65 or over.
Common Questions
What is Per Capita Income in Bessemer?
Per Capita income in Bessemer is $22,622.
What is the Median Family Income in Bessemer?
Median Family Income in Bessemer is $48,803.
What is the Median Household income in Bessemer?
Median Household Income in Bessemer is $34,953.
What is Income or Wage Gap in Bessemer?
Income or Wage Gap in Bessemer is 11.7%.
Women in Bessemer earn 88.3 cents for every dollar earned by a man.
What is Inequality or Gini Index in Bessemer?
Inequality or Gini Index in Bessemer is 0.50.
What is the Total Population of Bessemer?
Total Population of Bessemer is 25,890.
What is the Total Male Population of Bessemer?
Total Male Population of Bessemer is 12,012.
What is the Total Female Population of Bessemer?
Total Female Population of Bessemer is 13,878.
What is the Ratio of Males per 100 Females in Bessemer?
There are 86.55 Males per 100 Females in Bessemer.
What is the Ratio of Females per 100 Males in Bessemer?
There are 115.53 Females per 100 Males in Bessemer.
What is the Median Population Age in Bessemer?
Median Population Age in Bessemer is 41.8 Years.
What is the Average Family Size in Bessemer
Average Family Size in Bessemer is 3.4 People.
What is the Average Household Size in Bessemer
Average Household Size in Bessemer is 2.4 People.
How Large is the Labor Force in Bessemer?
There are 10,418 People in the Labor Forcein in Bessemer.
What is the Percentage of People in the Labor Force in Bessemer?
49.9% of People are in the Labor Force in Bessemer.
What is the Unemployment Rate in Bessemer?
Unemployment Rate in Bessemer is 10.8%.