Area Code 205 Map & Demographics
Area Code 205 Map
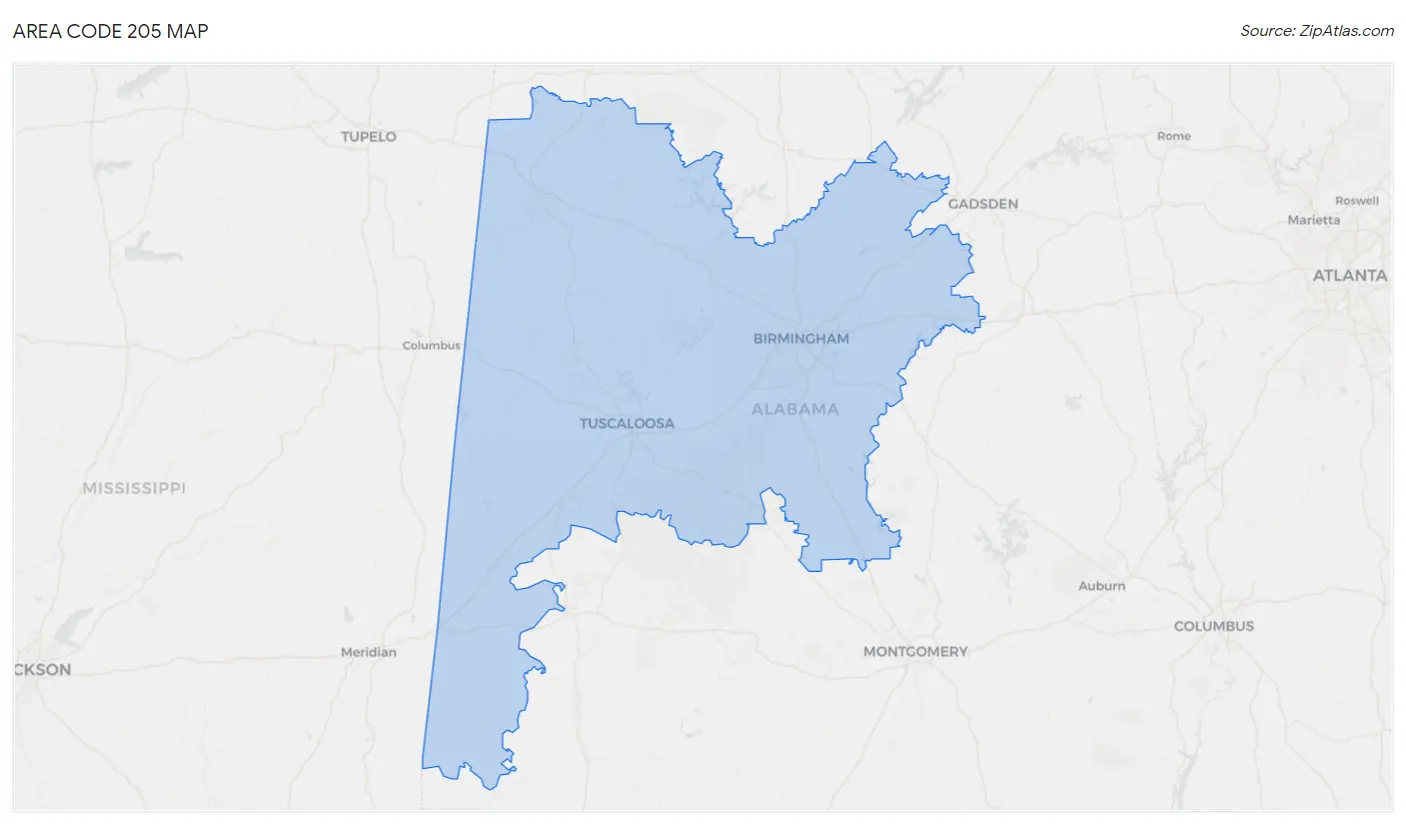
Area Code 205 Overview
$30,259
PER CAPITA INCOME
$75,808
AVG FAMILY INCOME
$59,200
AVG HOUSEHOLD INCOME
29.3%
WAGE / INCOME GAP [ % ]
70.7¢/ $1
WAGE / INCOME GAP [ $ ]
$10,669
FAMILY INCOME DEFICIT
71.43
INEQUALITY / GINI INDEX
1,535,361
TOTAL POPULATION
743,814
MALE POPULATION
791,547
FEMALE POPULATION
93.97
MALES / 100 FEMALES
106.42
FEMALES / 100 MALES
40.7
MEDIAN AGE
3.2
AVG FAMILY SIZE
2.6
AVG HOUSEHOLD SIZE
689,066
LABOR FORCE [ PEOPLE ]
55.9%
PERCENT IN LABOR FORCE
7.5%
UNEMPLOYMENT RATE
Income in Area Code 205
Income Overview in Area Code 205
Per Capita Income in Area Code 205 is $30,259, while median incomes of families and households are $75,808 and $59,200 respectively.
| Characteristic | Number | Measure |
| Per Capita Income | 1,535,361 | $30,259 |
| Median Family Income | 380,166 | $75,808 |
| Mean Family Income | 380,166 | $14,604,529 |
| Median Household Income | 584,843 | $59,200 |
| Mean Household Income | 584,843 | $12,338,298 |
| Income Deficit | 380,166 | $10,669 |
| Wage / Income Gap (%) | 1,535,361 | 29.32% |
| Wage / Income Gap ($) | 1,535,361 | 70.68¢ per $1 |
| Gini / Inequality Index | 1,535,361 | 71.43 |
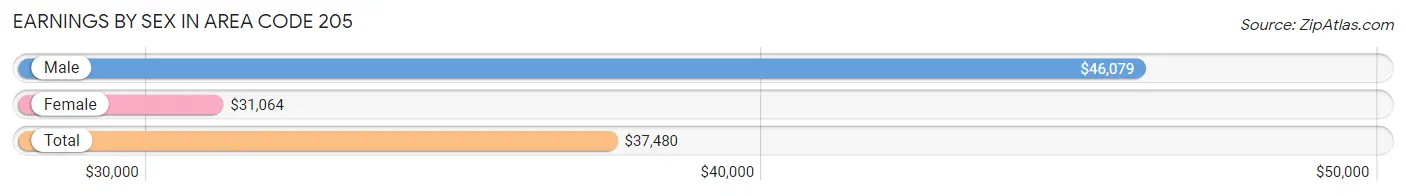
Earnings by Sex in Area Code 205
Average Earnings in Area Code 205 are $37,480, $46,079 for men and $31,064 for women, a difference of 32.6%.
| Sex | Number | Average Earnings |
| Male | 400,976 (51.7%) | $46,079 |
| Female | 375,034 (48.3%) | $31,064 |
| Total | 776,010 (100.0%) | $37,480 |
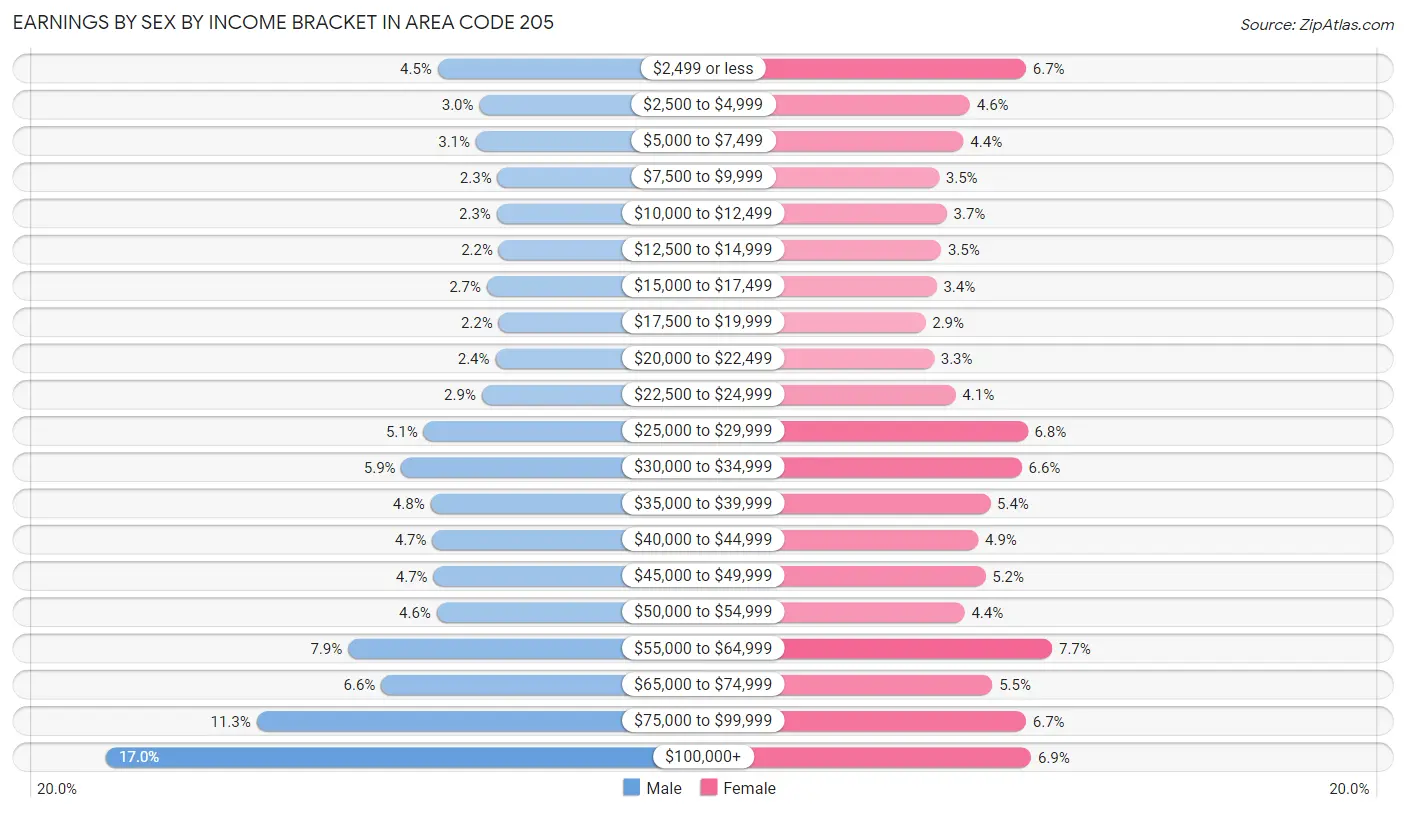
Earnings by Sex by Income Bracket in Area Code 205
The most common earnings brackets in Area Code 205 are $100,000+ for men (67,978 | 17.0%) and $55,000 to $64,999 for women (28,843 | 7.7%).
| Income | Male | Female |
| $2,499 or less | 18,133 (4.5%) | 25,156 (6.7%) |
| $2,500 to $4,999 | 11,851 (3.0%) | 17,289 (4.6%) |
| $5,000 to $7,499 | 12,372 (3.1%) | 16,378 (4.4%) |
| $7,500 to $9,999 | 9,139 (2.3%) | 12,949 (3.5%) |
| $10,000 to $12,499 | 9,250 (2.3%) | 14,031 (3.7%) |
| $12,500 to $14,999 | 8,949 (2.2%) | 13,235 (3.5%) |
| $15,000 to $17,499 | 10,732 (2.7%) | 12,593 (3.4%) |
| $17,500 to $19,999 | 8,999 (2.2%) | 11,017 (2.9%) |
| $20,000 to $22,499 | 9,471 (2.4%) | 12,241 (3.3%) |
| $22,500 to $24,999 | 11,508 (2.9%) | 15,268 (4.1%) |
| $25,000 to $29,999 | 20,269 (5.1%) | 25,405 (6.8%) |
| $30,000 to $34,999 | 23,581 (5.9%) | 24,577 (6.6%) |
| $35,000 to $39,999 | 19,192 (4.8%) | 20,144 (5.4%) |
| $40,000 to $44,999 | 18,941 (4.7%) | 18,462 (4.9%) |
| $45,000 to $49,999 | 18,756 (4.7%) | 19,450 (5.2%) |
| $50,000 to $54,999 | 18,270 (4.6%) | 16,529 (4.4%) |
| $55,000 to $64,999 | 31,597 (7.9%) | 28,843 (7.7%) |
| $65,000 to $74,999 | 26,625 (6.6%) | 20,448 (5.4%) |
| $75,000 to $99,999 | 45,363 (11.3%) | 25,154 (6.7%) |
| $100,000+ | 67,978 (17.0%) | 25,865 (6.9%) |
| Total | 400,976 (100.0%) | 375,034 (100.0%) |
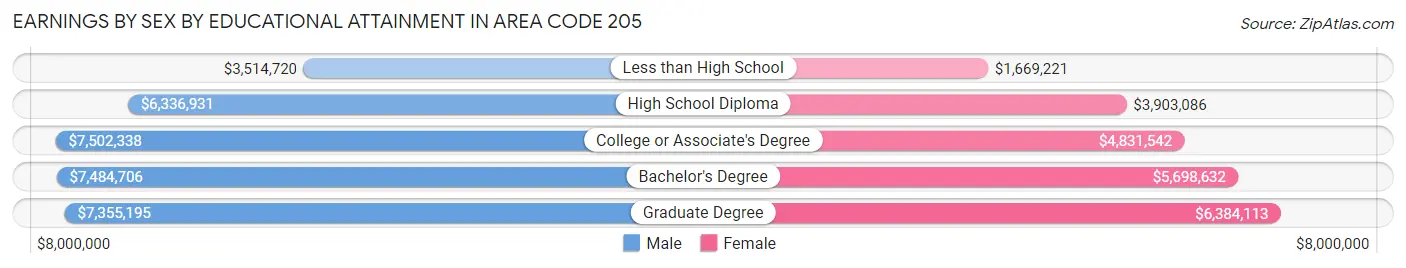
Earnings by Sex by Educational Attainment in Area Code 205
Average earnings in Area Code 205 are $8,061,561 for men and $5,487,744 for women, a difference of 31.9%. Men with an educational attainment of college or associate's degree enjoy the highest average annual earnings of $7,502,338, while those with less than high school education earn the least with $3,514,720. Women with an educational attainment of graduate degree earn the most with the average annual earnings of $6,384,113, while those with less than high school education have the smallest earnings of $1,669,221.
| Educational Attainment | Male Income | Female Income |
| Less than High School | $3,514,720 | $1,669,221 |
| High School Diploma | $6,336,931 | $3,903,086 |
| College or Associate's Degree | $7,502,338 | $4,831,542 |
| Bachelor's Degree | $7,484,706 | $5,698,632 |
| Graduate Degree | $7,355,195 | $6,384,113 |
| Total | $8,061,561 | $5,487,744 |
Family Income in Area Code 205
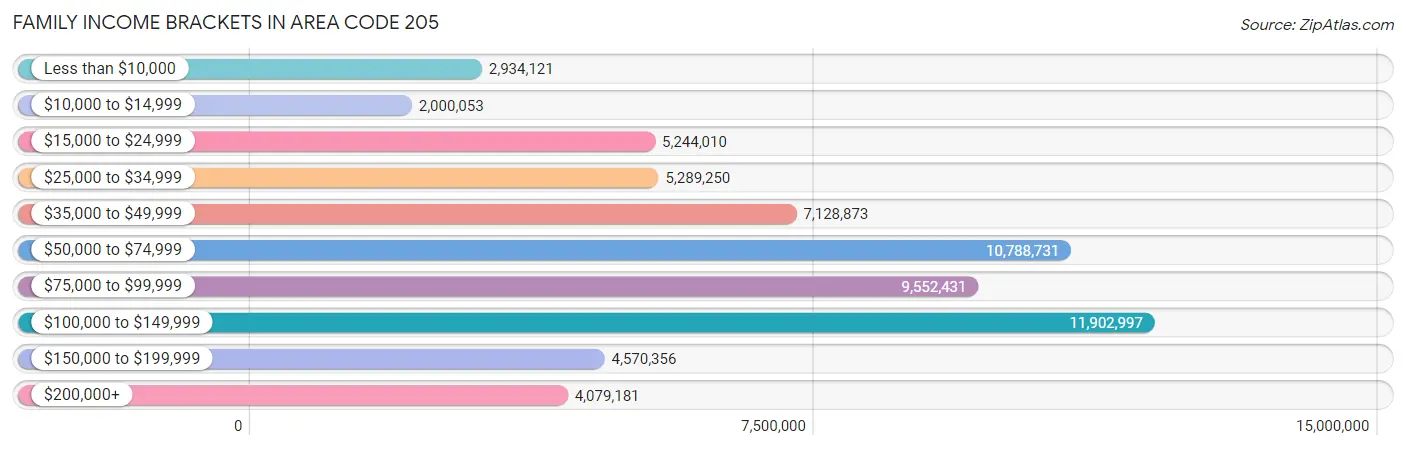
Family Income Brackets in Area Code 205
According to the Area Code 205 family income data, there are 11,902,997 families falling into the $100,000 to $149,999 income range, which is the most common income bracket and makes up 3,131.0% of all families. Conversely, the $10,000 to $14,999 income bracket is the least frequent group with only 2,000,053 families (526.1%) belonging to this category.
| Income Bracket | # Families | % Families |
| Less than $10,000 | 2,934,121 | 771.8% |
| $10,000 to $14,999 | 2,000,053 | 526.1% |
| $15,000 to $24,999 | 5,244,010 | 1,379.4% |
| $25,000 to $34,999 | 5,289,250 | 1,391.3% |
| $35,000 to $49,999 | 7,128,873 | 1,875.2% |
| $50,000 to $74,999 | 10,788,731 | 2,837.9% |
| $75,000 to $99,999 | 9,552,431 | 2,512.7% |
| $100,000 to $149,999 | 11,902,997 | 3,131.0% |
| $150,000 to $199,999 | 4,570,356 | 1,202.2% |
| $200,000+ | 4,079,181 | 1,073.0% |
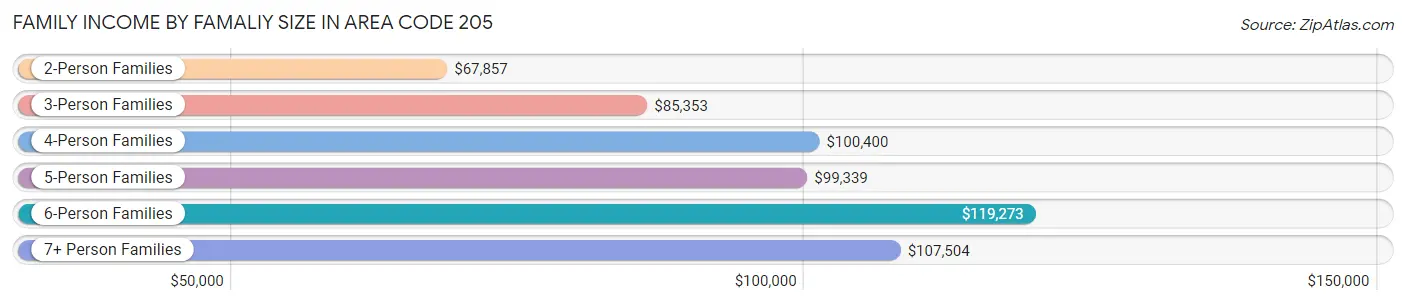
Family Income by Famaliy Size in Area Code 205
6-person families (8,663 | 2.3%) account for the highest median family income in Area Code 205 with $119,273 per family, while 2-person families (184,310 | 48.5%) have the highest median income of $33,929 per family member.
| Income Bracket | # Families | Median Income |
| 2-Person Families | 184,310 (48.5%) | $67,857 |
| 3-Person Families | 87,802 (23.1%) | $85,353 |
| 4-Person Families | 67,997 (17.9%) | $100,400 |
| 5-Person Families | 27,159 (7.1%) | $99,339 |
| 6-Person Families | 8,663 (2.3%) | $119,273 |
| 7+ Person Families | 4,235 (1.1%) | $107,504 |
| Total | 380,166 (100.0%) | $75,808 |
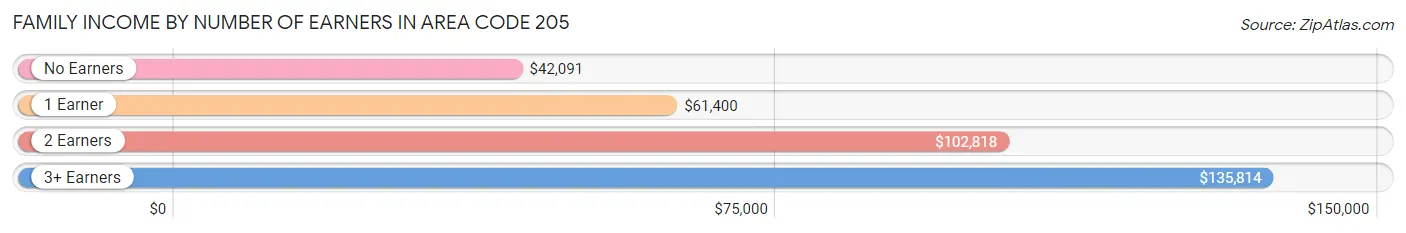
Family Income by Number of Earners in Area Code 205
The median family income in Area Code 205 is $75,808, with families comprising 3+ earners (35,099) having the highest median family income of $135,814, while families with no earners (64,194) have the lowest median family income of $42,091, accounting for 9.2% and 16.9% of families, respectively.
| Number of Earners | # Families | Median Income |
| No Earners | 64,194 (16.9%) | $42,091 |
| 1 Earner | 123,917 (32.6%) | $61,400 |
| 2 Earners | 156,956 (41.3%) | $102,818 |
| 3+ Earners | 35,099 (9.2%) | $135,814 |
| Total | 380,166 (100.0%) | $75,808 |
Household Income in Area Code 205
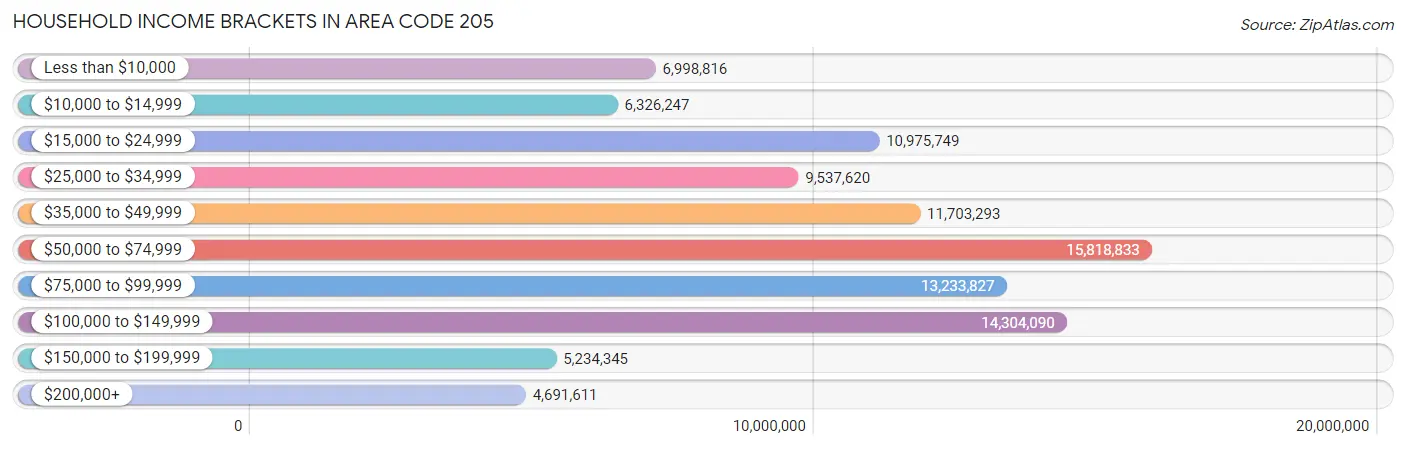
Household Income Brackets in Area Code 205
With 15,818,833 households falling in the category, the $50,000 to $74,999 income range is the most frequent in Area Code 205, accounting for 2,704.8% of all households. In contrast, only 4,691,611 households (802.2%) fall into the $200,000+ income bracket, making it the least populous group.
| Income Bracket | # Households | % Households |
| Less than $10,000 | 6,998,816 | 1,196.7% |
| $10,000 to $14,999 | 6,326,247 | 1,081.7% |
| $15,000 to $24,999 | 10,975,749 | 1,876.7% |
| $25,000 to $34,999 | 9,537,620 | 1,630.8% |
| $35,000 to $49,999 | 11,703,293 | 2,001.1% |
| $50,000 to $74,999 | 15,818,833 | 2,704.8% |
| $75,000 to $99,999 | 13,233,827 | 2,262.8% |
| $100,000 to $149,999 | 14,304,090 | 2,445.8% |
| $150,000 to $199,999 | 5,234,345 | 895.0% |
| $200,000+ | 4,691,611 | 802.2% |
Household Income by Householder Age in Area Code 205
The median household income in Area Code 205 is $59,200, with the highest median household income of $71,750 found in the 45 to 64 years age bracket for the primary householder. A total of 215,629 households (36.9%) fall into this category. Meanwhile, the 65+ years age bracket for the primary householder has the lowest median household income of $44,651, with 160,215 households (27.4%) in this group.
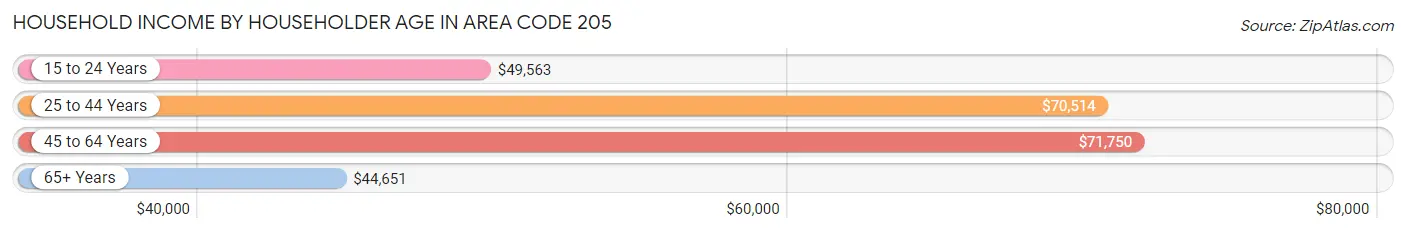
| Income Bracket | # Households | Median Income |
| 15 to 24 Years | 23,398 (4.0%) | $49,563 |
| 25 to 44 Years | 185,601 (31.7%) | $70,514 |
| 45 to 64 Years | 215,629 (36.9%) | $71,750 |
| 65+ Years | 160,215 (27.4%) | $44,651 |
| Total | 584,843 (100.0%) | $59,200 |
Poverty in Area Code 205
Income Below Poverty by Sex and Age in Area Code 205
With 13.3% poverty level for males and 16.0% for females among the residents of Area Code 205, 5 year old males and 18 to 24 year old females are the most vulnerable to poverty, with 2,322 males (24.5%) and 17,767 females (27.0%) in their respective age groups living below the poverty level.
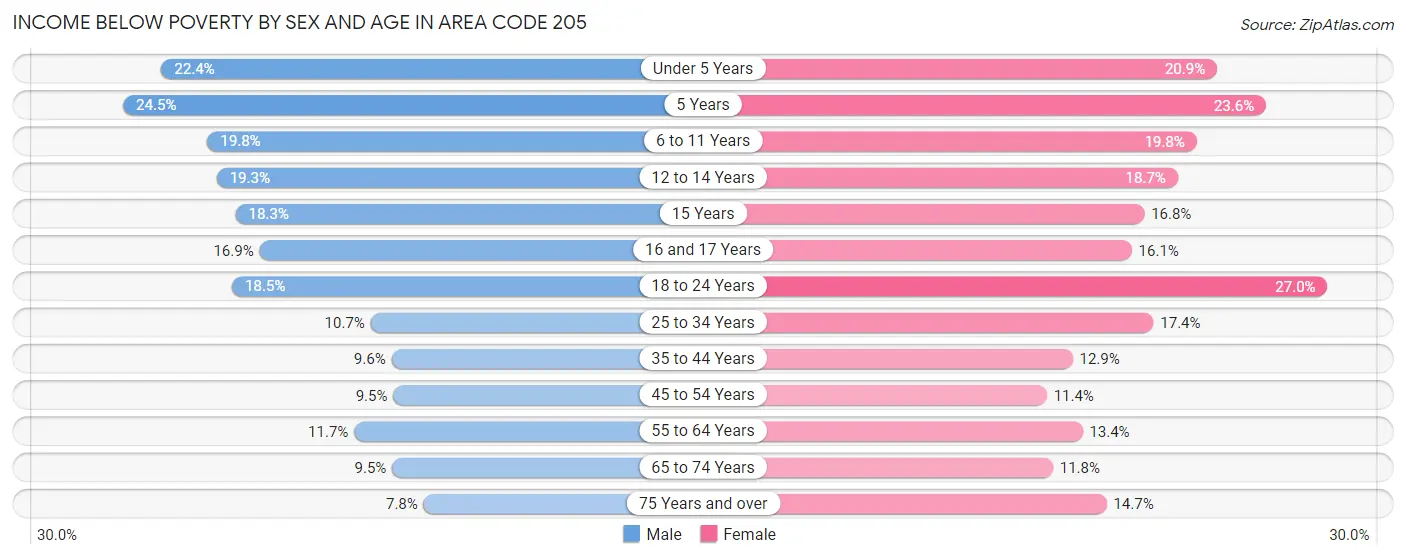
| Age Bracket | Male | Female |
| Under 5 Years | 9,898 (22.4%) | 9,047 (20.9%) |
| 5 Years | 2,322 (24.5%) | 2,088 (23.6%) |
| 6 to 11 Years | 11,635 (19.8%) | 10,851 (19.8%) |
| 12 to 14 Years | 5,679 (19.3%) | 5,350 (18.7%) |
| 15 Years | 1,823 (18.2%) | 1,490 (16.8%) |
| 16 and 17 Years | 3,384 (16.9%) | 3,114 (16.1%) |
| 18 to 24 Years | 12,710 (18.4%) | 17,767 (27.0%) |
| 25 to 34 Years | 10,502 (10.7%) | 17,871 (17.3%) |
| 35 to 44 Years | 8,868 (9.6%) | 12,594 (12.9%) |
| 45 to 54 Years | 8,642 (9.5%) | 10,934 (11.4%) |
| 55 to 64 Years | 10,739 (11.7%) | 13,489 (13.4%) |
| 65 to 74 Years | 6,592 (9.5%) | 9,587 (11.7%) |
| 75 Years and over | 2,973 (7.8%) | 8,584 (14.7%) |
| Total | 95,767 (13.3%) | 122,766 (16.0%) |
Income Above Poverty by Sex and Age in Area Code 205
According to the poverty statistics in Area Code 205, males aged 75 years and over and females aged 45 to 54 years are the age groups that are most secure financially, with 92.2% of males and 88.6% of females in these age groups living above the poverty line.
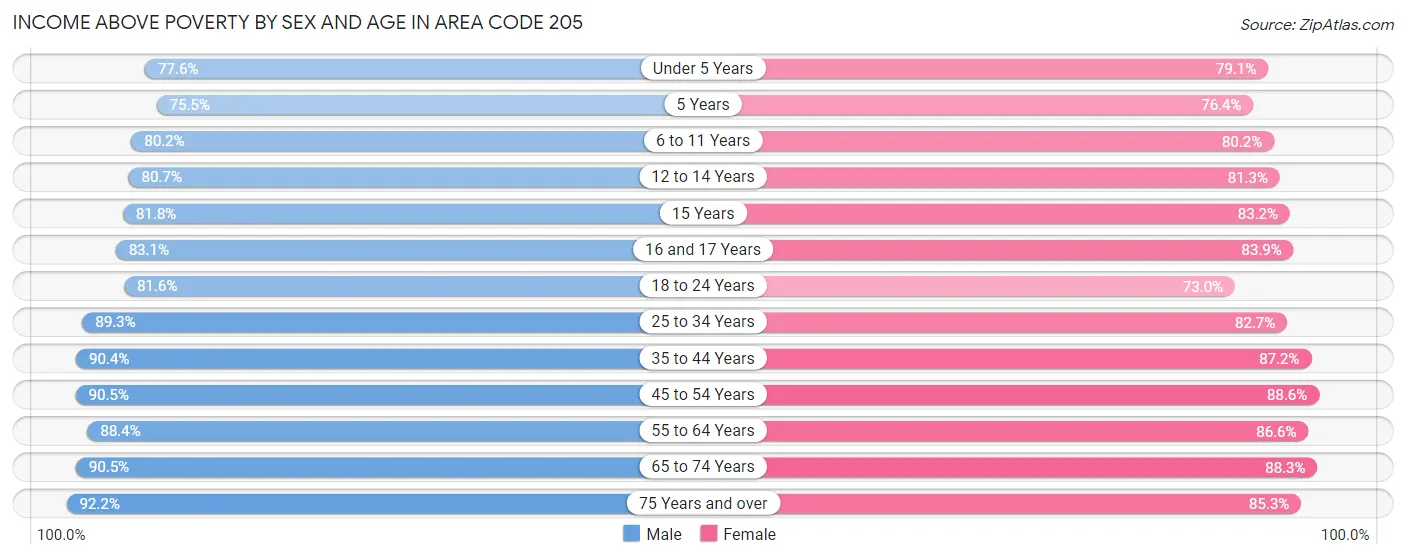
| Age Bracket | Male | Female |
| Under 5 Years | 34,338 (77.6%) | 34,259 (79.1%) |
| 5 Years | 7,152 (75.5%) | 6,752 (76.4%) |
| 6 to 11 Years | 47,076 (80.2%) | 44,055 (80.2%) |
| 12 to 14 Years | 23,753 (80.7%) | 23,261 (81.3%) |
| 15 Years | 8,164 (81.8%) | 7,360 (83.2%) |
| 16 and 17 Years | 16,620 (83.1%) | 16,176 (83.9%) |
| 18 to 24 Years | 56,190 (81.6%) | 47,951 (73.0%) |
| 25 to 34 Years | 87,390 (89.3%) | 85,146 (82.7%) |
| 35 to 44 Years | 83,831 (90.4%) | 85,393 (87.2%) |
| 45 to 54 Years | 82,646 (90.5%) | 84,893 (88.6%) |
| 55 to 64 Years | 81,473 (88.3%) | 87,159 (86.6%) |
| 65 to 74 Years | 62,578 (90.5%) | 72,037 (88.2%) |
| 75 Years and over | 35,239 (92.2%) | 49,658 (85.3%) |
| Total | 626,450 (86.7%) | 644,100 (84.0%) |
Income Below Poverty Among Married-Couple Families in Area Code 205
The poverty statistics for married-couple families in Area Code 205 show that 4.6% or 12,753 of the total 276,336 families live below the poverty line. Families with 5 or more children have the highest poverty rate of 27.5%, comprising of 380 families. On the other hand, families with no children have the lowest poverty rate of 3.9%, which includes 6,360 families.
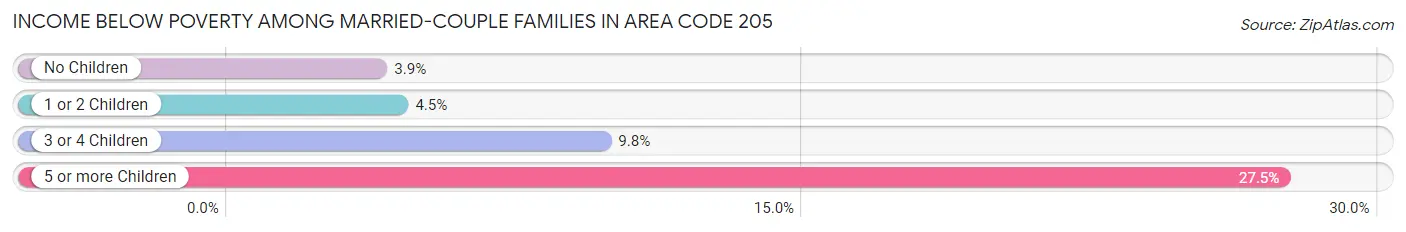
| Children | Above Poverty | Below Poverty |
| No Children | 156,850 (96.1%) | 6,360 (3.9%) |
| 1 or 2 Children | 87,991 (95.6%) | 4,096 (4.4%) |
| 3 or 4 Children | 17,740 (90.2%) | 1,917 (9.8%) |
| 5 or more Children | 1,002 (72.5%) | 380 (27.5%) |
| Total | 263,583 (95.4%) | 12,753 (4.6%) |
Income Below Poverty Among Single-Parent Households in Area Code 205
According to the poverty data in Area Code 205, 14.2% or 3,342 single-father households and 28.2% or 22,668 single-mother households are living below the poverty line. Among single-father households, those with 3 or 4 children have the highest poverty rate, with 438 households (27.4%) experiencing poverty. Likewise, among single-mother households, those with 5 or more children have the highest poverty rate, with 703 households (76.5%) falling below the poverty line.
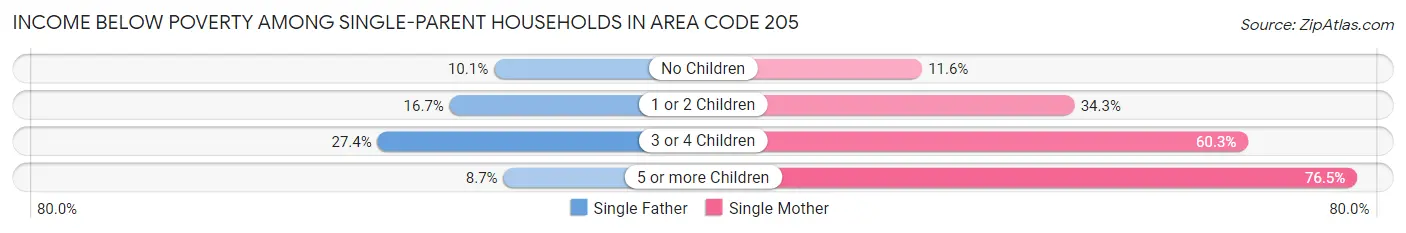
| Children | Single Father | Single Mother |
| No Children | 1,119 (10.1%) | 3,805 (11.6%) |
| 1 or 2 Children | 1,776 (16.7%) | 12,991 (34.3%) |
| 3 or 4 Children | 438 (27.4%) | 5,169 (60.3%) |
| 5 or more Children | 9 (8.6%) | 703 (76.5%) |
| Total | 3,342 (14.2%) | 22,668 (28.2%) |
Income Below Poverty Among Married-Couple vs Single-Parent Households in Area Code 205
The poverty data for Area Code 205 shows that 12,753 of the married-couple family households (4.6%) and 26,010 of the single-parent households (25.1%) are living below the poverty level. Within the married-couple family households, those with 5 or more children have the highest poverty rate, with 380 households (27.5%) falling below the poverty line. Among the single-parent households, those with 5 or more children have the highest poverty rate, with 712 household (69.6%) living below poverty.
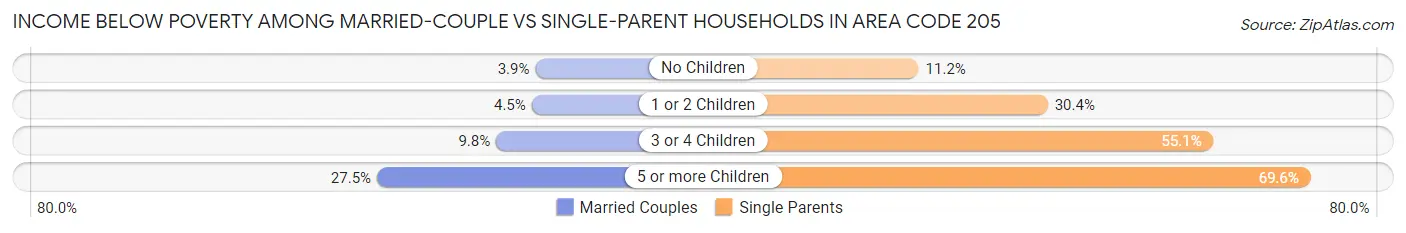
| Children | Married-Couple Families | Single-Parent Households |
| No Children | 6,360 (3.9%) | 4,924 (11.2%) |
| 1 or 2 Children | 4,096 (4.4%) | 14,767 (30.4%) |
| 3 or 4 Children | 1,917 (9.8%) | 5,607 (55.1%) |
| 5 or more Children | 380 (27.5%) | 712 (69.6%) |
| Total | 12,753 (4.6%) | 26,010 (25.1%) |
Race in Area Code 205
The most populous races in Area Code 205 are White / Caucasian (986,990 | 64.3%), Black / African American (445,112 | 29.0%), and Hispanic or Latino (68,793 | 4.5%).
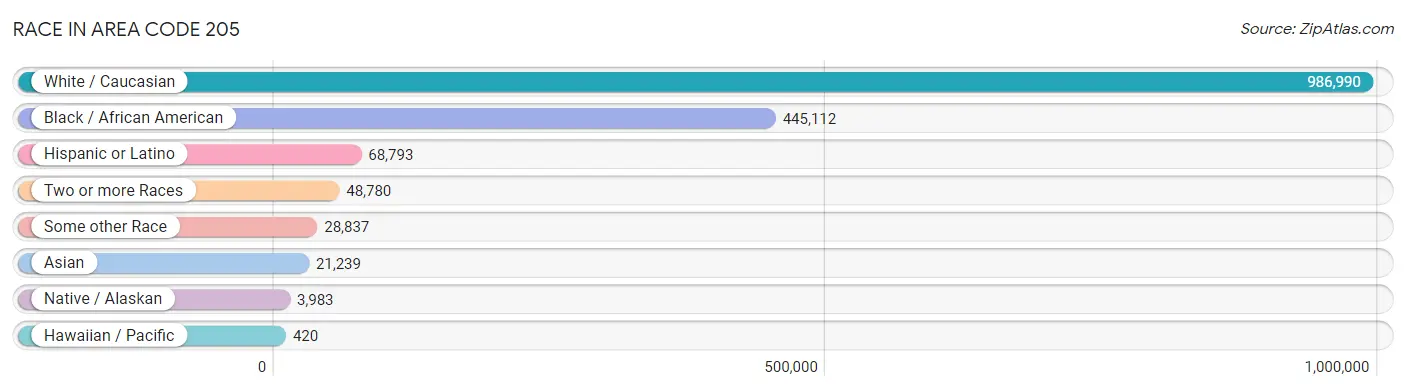
| Race | # Population | % Population |
| Asian | 21,239 | 1.4% |
| Black / African American | 445,112 | 29.0% |
| Hawaiian / Pacific | 420 | 0.0% |
| Hispanic or Latino | 68,793 | 4.5% |
| Native / Alaskan | 3,983 | 0.3% |
| White / Caucasian | 986,990 | 64.3% |
| Two or more Races | 48,780 | 3.2% |
| Some other Race | 28,837 | 1.9% |
| Total | 1,535,361 | 100.0% |
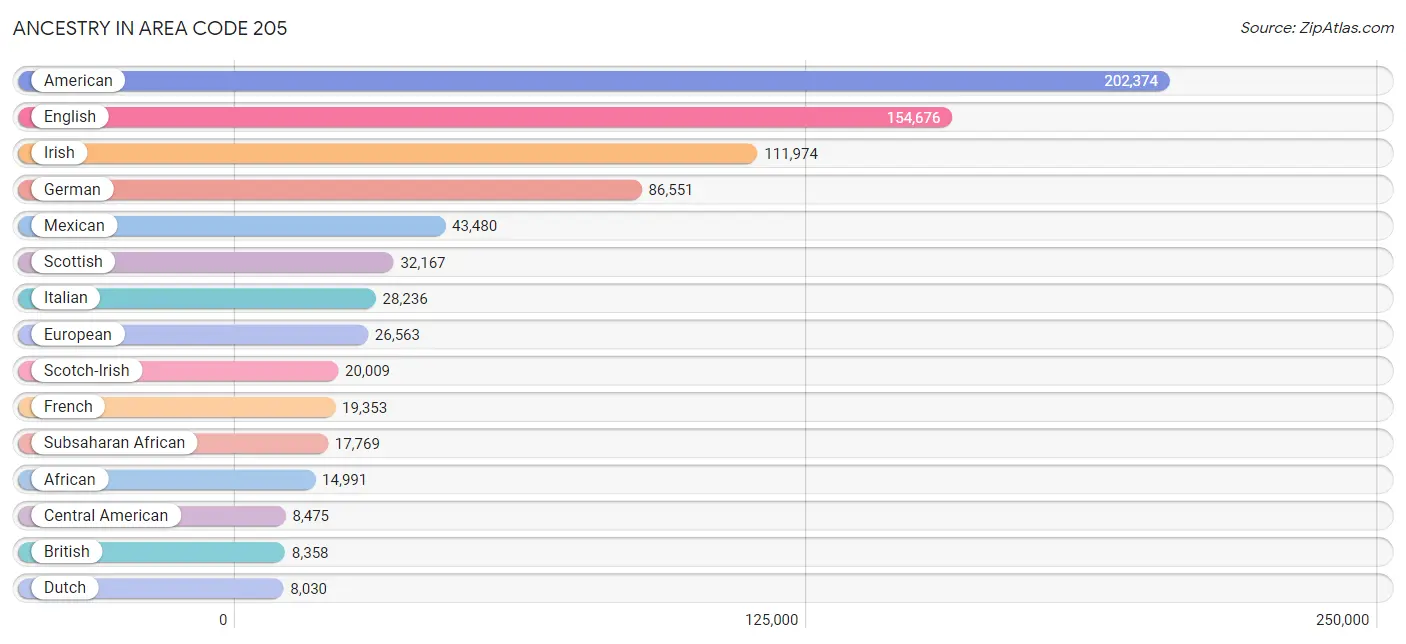
Ancestry in Area Code 205
The most populous ancestries reported in Area Code 205 are American (202,374 | 13.2%), English (154,676 | 10.1%), Irish (111,974 | 7.3%), German (86,551 | 5.6%), and Mexican (43,480 | 2.8%), together accounting for 39.0% of all Area Code 205 residents.
| Ancestry | # Population | % Population |
| Afghan | 15 | 0.0% |
| African | 14,991 | 1.0% |
| Albanian | 95 | 0.0% |
| Aleut | 21 | 0.0% |
| American | 202,374 | 13.2% |
| Apache | 28 | 0.0% |
| Arab | 6,258 | 0.4% |
| Argentinean | 472 | 0.0% |
| Armenian | 30 | 0.0% |
| Assyrian / Chaldean / Syriac | 7 | 0.0% |
| Australian | 109 | 0.0% |
| Austrian | 841 | 0.1% |
| Bahamian | 158 | 0.0% |
| Bangladeshi | 27 | 0.0% |
| Barbadian | 39 | 0.0% |
| Belgian | 600 | 0.0% |
| Belizean | 37 | 0.0% |
| Bermudan | 5 | 0.0% |
| Bhutanese | 1,823 | 0.1% |
| Blackfeet | 549 | 0.0% |
| Bolivian | 41 | 0.0% |
| Brazilian | 473 | 0.0% |
| British | 8,358 | 0.5% |
| British West Indian | 33 | 0.0% |
| Bulgarian | 178 | 0.0% |
| Burmese | 2,693 | 0.2% |
| Cajun | 438 | 0.0% |
| Canadian | 960 | 0.1% |
| Cape Verdean | 22 | 0.0% |
| Celtic | 203 | 0.0% |
| Central American | 8,475 | 0.5% |
| Central American Indian | 695 | 0.1% |
| Cherokee | 5,047 | 0.3% |
| Chickasaw | 142 | 0.0% |
| Chilean | 369 | 0.0% |
| Chippewa | 27 | 0.0% |
| Choctaw | 352 | 0.0% |
| Colombian | 878 | 0.1% |
| Comanche | 9 | 0.0% |
| Costa Rican | 126 | 0.0% |
| Creek | 804 | 0.1% |
| Croatian | 376 | 0.0% |
| Crow | 6 | 0.0% |
| Cuban | 2,360 | 0.2% |
| Czech | 1,256 | 0.1% |
| Czechoslovakian | 306 | 0.0% |
| Danish | 1,803 | 0.1% |
| Dominican | 509 | 0.0% |
| Dutch | 8,030 | 0.5% |
| Dutch West Indian | 43 | 0.0% |
| Eastern European | 1,837 | 0.1% |
| Ecuadorian | 347 | 0.0% |
| Egyptian | 545 | 0.0% |
| English | 154,676 | 10.1% |
| Estonian | 16 | 0.0% |
| Ethiopian | 94 | 0.0% |
| European | 26,563 | 1.7% |
| Fijian | 15 | 0.0% |
| Filipino | 408 | 0.0% |
| Finnish | 1,092 | 0.1% |
| French | 19,353 | 1.3% |
| French Canadian | 1,683 | 0.1% |
| German | 86,551 | 5.6% |
| Ghanaian | 60 | 0.0% |
| Greek | 2,831 | 0.2% |
| Guamanian / Chamorro | 123 | 0.0% |
| Guatemalan | 3,677 | 0.2% |
| Guyanese | 97 | 0.0% |
| Haitian | 666 | 0.0% |
| Honduran | 1,775 | 0.1% |
| Houma | 11 | 0.0% |
| Hungarian | 1,838 | 0.1% |
| Icelander | 73 | 0.0% |
| Indian (Asian) | 6,084 | 0.4% |
| Indonesian | 20 | 0.0% |
| Inupiat | 106 | 0.0% |
| Iranian | 765 | 0.1% |
| Iraqi | 19 | 0.0% |
| Irish | 111,974 | 7.3% |
| Iroquois | 92 | 0.0% |
| Israeli | 67 | 0.0% |
| Italian | 28,236 | 1.8% |
| Jamaican | 1,077 | 0.1% |
| Japanese | 20 | 0.0% |
| Jordanian | 94 | 0.0% |
| Kenyan | 617 | 0.0% |
| Korean | 3,597 | 0.2% |
| Laotian | 154 | 0.0% |
| Latvian | 188 | 0.0% |
| Lebanese | 2,855 | 0.2% |
| Lithuanian | 590 | 0.0% |
| Lumbee | 60 | 0.0% |
| Macedonian | 70 | 0.0% |
| Malaysian | 26 | 0.0% |
| Maltese | 21 | 0.0% |
| Menominee | 9 | 0.0% |
| Mexican | 43,480 | 2.8% |
| Mexican American Indian | 1,212 | 0.1% |
| Mongolian | 284 | 0.0% |
| Moroccan | 911 | 0.1% |
| Native Hawaiian | 794 | 0.1% |
| Navajo | 179 | 0.0% |
| New Zealander | 27 | 0.0% |
| Nicaraguan | 139 | 0.0% |
| Nigerian | 1,495 | 0.1% |
| Northern European | 1,556 | 0.1% |
| Norwegian | 4,536 | 0.3% |
| Pakistani | 942 | 0.1% |
| Palestinian | 743 | 0.1% |
| Panamanian | 403 | 0.0% |
| Paraguayan | 10 | 0.0% |
| Pennsylvania German | 102 | 0.0% |
| Peruvian | 494 | 0.0% |
| Polish | 7,457 | 0.5% |
| Portuguese | 1,273 | 0.1% |
| Potawatomi | 12 | 0.0% |
| Pueblo | 176 | 0.0% |
| Puerto Rican | 4,646 | 0.3% |
| Puget Sound Salish | 27 | 0.0% |
| Romanian | 633 | 0.0% |
| Russian | 3,014 | 0.2% |
| Salvadoran | 2,175 | 0.1% |
| Samoan | 118 | 0.0% |
| Scandinavian | 2,348 | 0.2% |
| Scotch-Irish | 20,009 | 1.3% |
| Scottish | 32,167 | 2.1% |
| Seminole | 44 | 0.0% |
| Serbian | 182 | 0.0% |
| Shoshone | 14 | 0.0% |
| Sierra Leonean | 22 | 0.0% |
| Sioux | 134 | 0.0% |
| Slavic | 460 | 0.0% |
| Slovak | 553 | 0.0% |
| Slovene | 79 | 0.0% |
| Somali | 18 | 0.0% |
| South African | 286 | 0.0% |
| South American | 4,059 | 0.3% |
| South American Indian | 58 | 0.0% |
| Spaniard | 864 | 0.1% |
| Spanish | 960 | 0.1% |
| Spanish American | 68 | 0.0% |
| Spanish American Indian | 19 | 0.0% |
| Sri Lankan | 3,103 | 0.2% |
| Subsaharan African | 17,769 | 1.2% |
| Swedish | 4,051 | 0.3% |
| Swiss | 1,849 | 0.1% |
| Syrian | 452 | 0.0% |
| Thai | 6,712 | 0.4% |
| Tongan | 16 | 0.0% |
| Trinidadian and Tobagonian | 196 | 0.0% |
| Turkish | 134 | 0.0% |
| U.S. Virgin Islander | 13 | 0.0% |
| Ugandan | 40 | 0.0% |
| Ukrainian | 950 | 0.1% |
| Ute | 4 | 0.0% |
| Venezuelan | 1,418 | 0.1% |
| Vietnamese | 229 | 0.0% |
| Welsh | 6,863 | 0.4% |
| West Indian | 499 | 0.0% |
| Yugoslavian | 116 | 0.0% | View All 160 Rows |
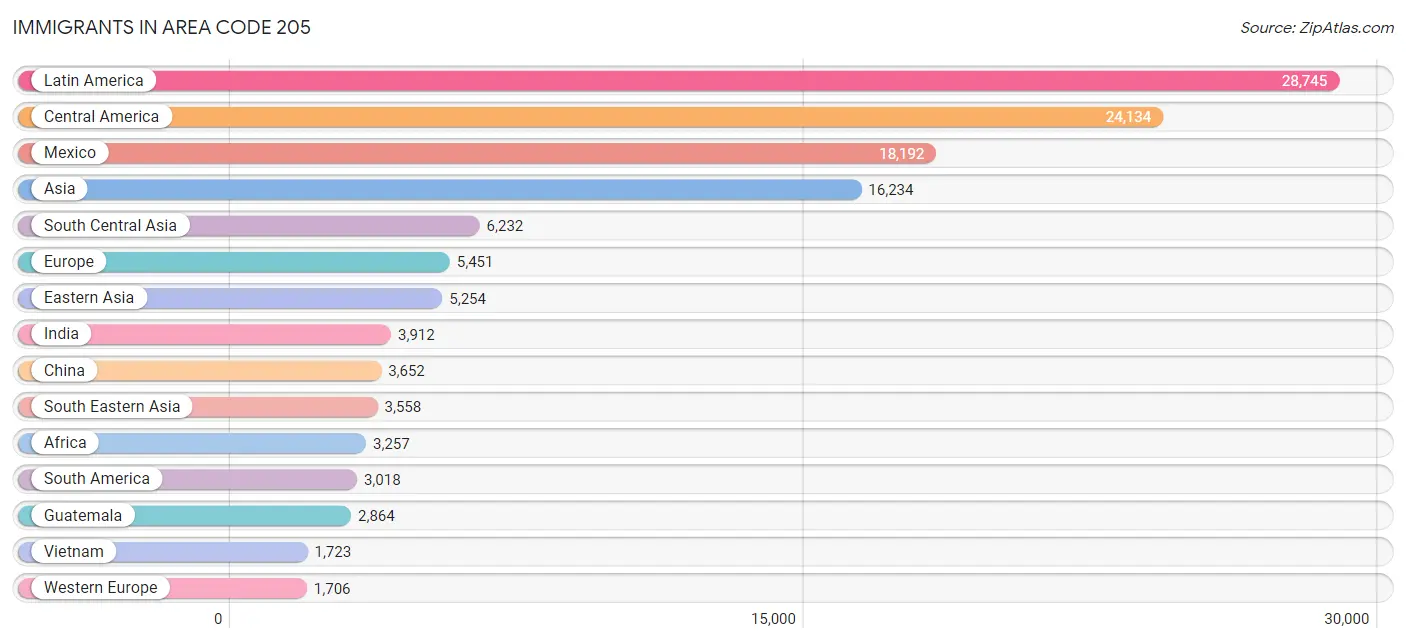
Immigrants in Area Code 205
The most numerous immigrant groups reported in Area Code 205 came from Latin America (28,745 | 1.9%), Central America (24,134 | 1.6%), Mexico (18,192 | 1.2%), Asia (16,234 | 1.1%), and South Central Asia (6,232 | 0.4%), together accounting for 6.1% of all Area Code 205 residents.
| Immigration Origin | # Population | % Population |
| Afghanistan | 22 | 0.0% |
| Africa | 3,257 | 0.2% |
| Argentina | 140 | 0.0% |
| Asia | 16,234 | 1.1% |
| Australia | 157 | 0.0% |
| Austria | 65 | 0.0% |
| Bahamas | 64 | 0.0% |
| Bangladesh | 385 | 0.0% |
| Barbados | 34 | 0.0% |
| Belarus | 106 | 0.0% |
| Belgium | 16 | 0.0% |
| Belize | 37 | 0.0% |
| Bolivia | 50 | 0.0% |
| Bosnia and Herzegovina | 34 | 0.0% |
| Brazil | 662 | 0.0% |
| Bulgaria | 52 | 0.0% |
| Cambodia | 20 | 0.0% |
| Cameroon | 10 | 0.0% |
| Canada | 1,096 | 0.1% |
| Caribbean | 1,593 | 0.1% |
| Central America | 24,134 | 1.6% |
| Chile | 218 | 0.0% |
| China | 3,652 | 0.2% |
| Colombia | 548 | 0.0% |
| Congo | 48 | 0.0% |
| Costa Rica | 51 | 0.0% |
| Cuba | 795 | 0.1% |
| Czechoslovakia | 57 | 0.0% |
| Denmark | 10 | 0.0% |
| Dominican Republic | 82 | 0.0% |
| Eastern Africa | 1,172 | 0.1% |
| Eastern Asia | 5,254 | 0.3% |
| Eastern Europe | 1,563 | 0.1% |
| Ecuador | 82 | 0.0% |
| Egypt | 303 | 0.0% |
| El Salvador | 1,607 | 0.1% |
| England | 568 | 0.0% |
| Ethiopia | 77 | 0.0% |
| Europe | 5,451 | 0.4% |
| Fiji | 63 | 0.0% |
| France | 150 | 0.0% |
| Germany | 1,349 | 0.1% |
| Ghana | 68 | 0.0% |
| Greece | 40 | 0.0% |
| Guatemala | 2,864 | 0.2% |
| Guyana | 111 | 0.0% |
| Haiti | 95 | 0.0% |
| Honduras | 1,115 | 0.1% |
| Hong Kong | 39 | 0.0% |
| Hungary | 74 | 0.0% |
| India | 3,912 | 0.3% |
| Indonesia | 110 | 0.0% |
| Iran | 401 | 0.0% |
| Iraq | 33 | 0.0% |
| Ireland | 27 | 0.0% |
| Israel | 177 | 0.0% |
| Italy | 175 | 0.0% |
| Jamaica | 418 | 0.0% |
| Japan | 445 | 0.0% |
| Jordan | 52 | 0.0% |
| Kazakhstan | 71 | 0.0% |
| Kenya | 997 | 0.1% |
| Korea | 1,157 | 0.1% |
| Kuwait | 118 | 0.0% |
| Laos | 22 | 0.0% |
| Latin America | 28,745 | 1.9% |
| Latvia | 42 | 0.0% |
| Lebanon | 214 | 0.0% |
| Liberia | 95 | 0.0% |
| Lithuania | 69 | 0.0% |
| Malaysia | 313 | 0.0% |
| Mexico | 18,192 | 1.2% |
| Middle Africa | 71 | 0.0% |
| Moldova | 123 | 0.0% |
| Morocco | 9 | 0.0% |
| Nepal | 495 | 0.0% |
| Netherlands | 102 | 0.0% |
| Nicaragua | 66 | 0.0% |
| Nigeria | 728 | 0.1% |
| Northern Africa | 322 | 0.0% |
| Northern Europe | 1,640 | 0.1% |
| Norway | 54 | 0.0% |
| Oceania | 313 | 0.0% |
| Pakistan | 889 | 0.1% |
| Panama | 145 | 0.0% |
| Peru | 238 | 0.0% |
| Philippines | 1,169 | 0.1% |
| Poland | 48 | 0.0% |
| Portugal | 111 | 0.0% |
| Romania | 86 | 0.0% |
| Russia | 501 | 0.0% |
| Saudi Arabia | 94 | 0.0% |
| Scotland | 130 | 0.0% |
| Sierra Leone | 205 | 0.0% |
| Singapore | 10 | 0.0% |
| South Africa | 238 | 0.0% |
| South America | 3,018 | 0.2% |
| South Central Asia | 6,232 | 0.4% |
| South Eastern Asia | 3,558 | 0.2% |
| Southern Europe | 542 | 0.0% |
| Spain | 216 | 0.0% |
| Sri Lanka | 23 | 0.0% |
| Sweden | 12 | 0.0% |
| Switzerland | 24 | 0.0% |
| Syria | 96 | 0.0% |
| Taiwan | 399 | 0.0% |
| Thailand | 171 | 0.0% |
| Trinidad and Tobago | 46 | 0.0% |
| Turkey | 97 | 0.0% |
| Uganda | 60 | 0.0% |
| Ukraine | 255 | 0.0% |
| Venezuela | 962 | 0.1% |
| Vietnam | 1,723 | 0.1% |
| West Indies | 11 | 0.0% |
| Western Africa | 1,428 | 0.1% |
| Western Asia | 1,047 | 0.1% |
| Western Europe | 1,706 | 0.1% |
| Yemen | 69 | 0.0% |
| Zimbabwe | 11 | 0.0% | View All 119 Rows |
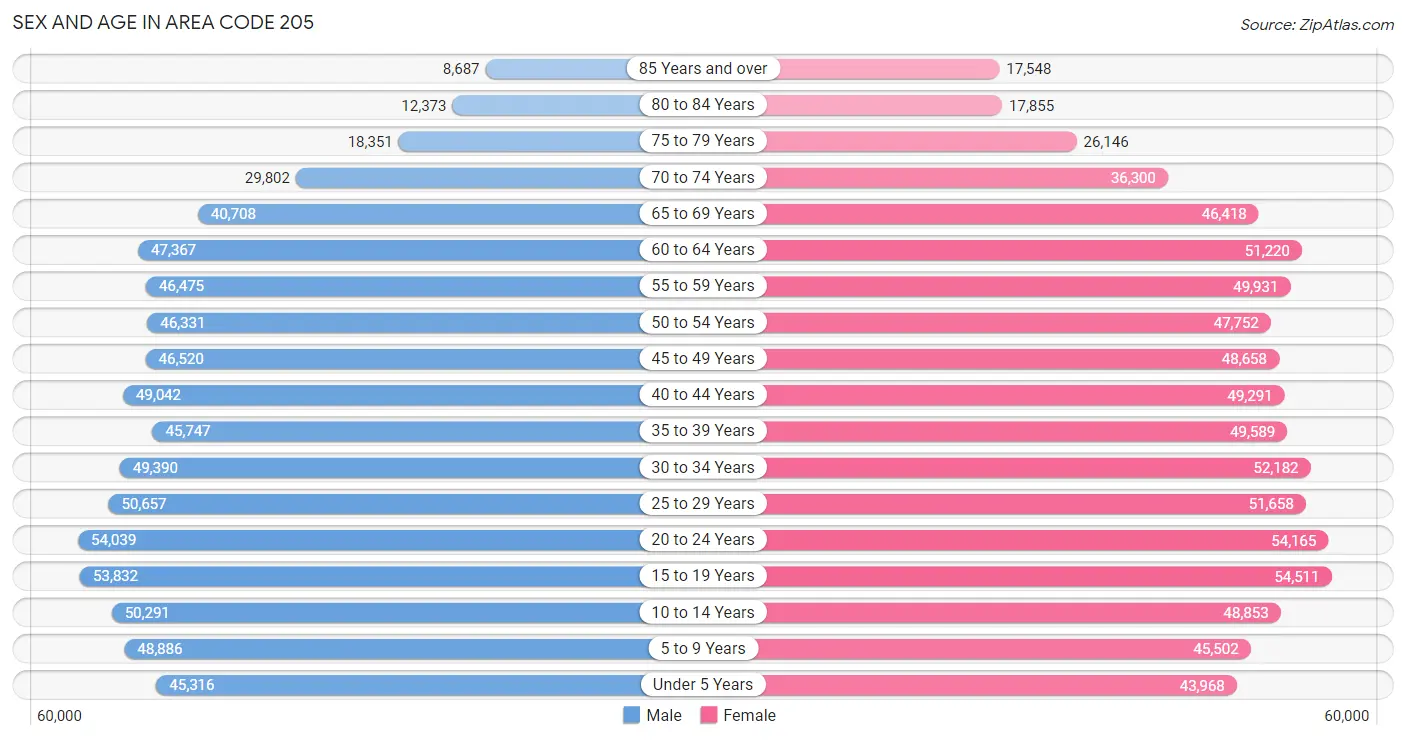
Sex and Age in Area Code 205
Sex and Age in Area Code 205
The most populous age groups in Area Code 205 are 20 to 24 Years (54,039 | 7.3%) for men and 15 to 19 Years (54,511 | 6.9%) for women.
| Age Bracket | Male | Female |
| Under 5 Years | 45,316 (6.1%) | 43,968 (5.6%) |
| 5 to 9 Years | 48,886 (6.6%) | 45,502 (5.8%) |
| 10 to 14 Years | 50,291 (6.8%) | 48,853 (6.2%) |
| 15 to 19 Years | 53,832 (7.2%) | 54,511 (6.9%) |
| 20 to 24 Years | 54,039 (7.3%) | 54,165 (6.8%) |
| 25 to 29 Years | 50,657 (6.8%) | 51,658 (6.5%) |
| 30 to 34 Years | 49,390 (6.6%) | 52,182 (6.6%) |
| 35 to 39 Years | 45,747 (6.1%) | 49,589 (6.3%) |
| 40 to 44 Years | 49,042 (6.6%) | 49,291 (6.2%) |
| 45 to 49 Years | 46,520 (6.2%) | 48,658 (6.1%) |
| 50 to 54 Years | 46,331 (6.2%) | 47,752 (6.0%) |
| 55 to 59 Years | 46,475 (6.2%) | 49,931 (6.3%) |
| 60 to 64 Years | 47,367 (6.4%) | 51,220 (6.5%) |
| 65 to 69 Years | 40,708 (5.5%) | 46,418 (5.9%) |
| 70 to 74 Years | 29,802 (4.0%) | 36,300 (4.6%) |
| 75 to 79 Years | 18,351 (2.5%) | 26,146 (3.3%) |
| 80 to 84 Years | 12,373 (1.7%) | 17,855 (2.3%) |
| 85 Years and over | 8,687 (1.2%) | 17,548 (2.2%) |
| Total | 743,814 (100.0%) | 791,547 (100.0%) |
Families and Households in Area Code 205
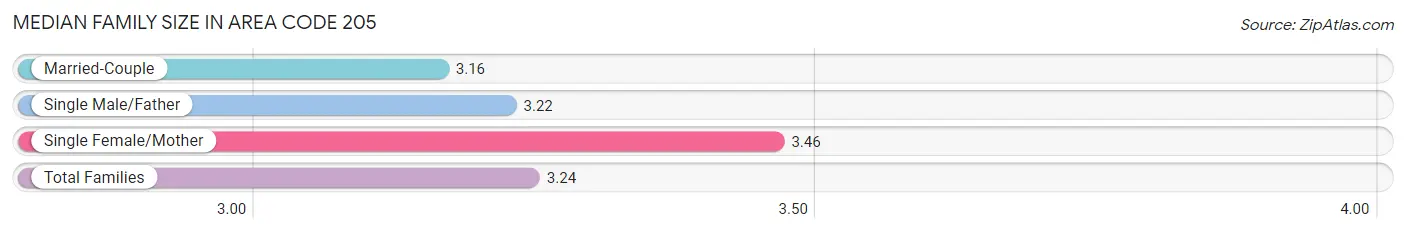
Median Family Size in Area Code 205
The median family size in Area Code 205 is 3.24 persons per family, with single female/mother families (80,348 | 21.1%) accounting for the largest median family size of 3.4628 persons per family. On the other hand, married-couple families (276,336 | 72.7%) represent the smallest median family size with 3.16 persons per family.
| Family Type | # Families | Family Size |
| Married-Couple | 276,336 (72.7%) | 3.16 |
| Single Male/Father | 23,482 (6.2%) | 3.22 |
| Single Female/Mother | 80,348 (21.1%) | 3.46 |
| Total Families | 380,166 (100.0%) | 3.24 |
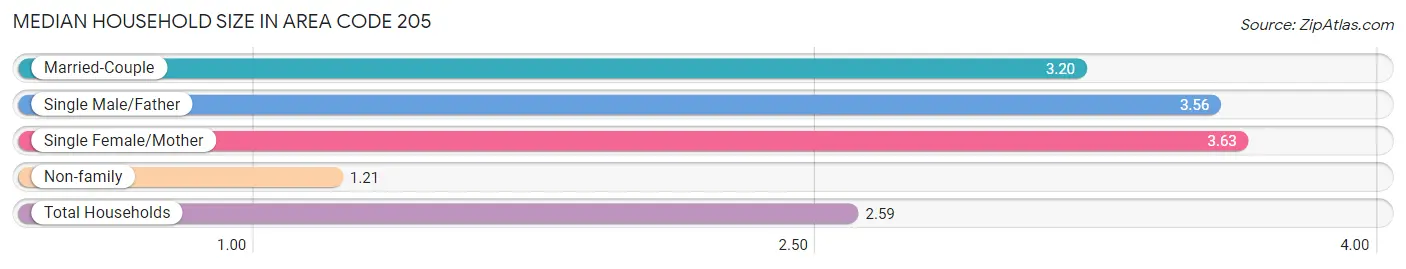
Median Household Size in Area Code 205
The median household size in Area Code 205 is 2.59 persons per household, with single female/mother households (80,348 | 13.7%) accounting for the largest median household size of 3.63024 persons per household. non-family households (204,677 | 35.0%) represent the smallest median household size with 1.21 persons per household.
| Household Type | # Households | Household Size |
| Married-Couple | 276,336 (47.2%) | 3.20 |
| Single Male/Father | 23,482 (4.0%) | 3.56 |
| Single Female/Mother | 80,348 (13.7%) | 3.63 |
| Non-family | 204,677 (35.0%) | 1.21 |
| Total Households | 584,843 (100.0%) | 2.59 |
Household Size by Marriage Status in Area Code 205
Out of a total of 584,843 households in Area Code 205, 380,166 (65.0%) are family households, while 204,677 (35.0%) are nonfamily households. The most numerous type of family households are 2-person households, comprising 174,145, and the most common type of nonfamily households are 1-person households, comprising 176,367.
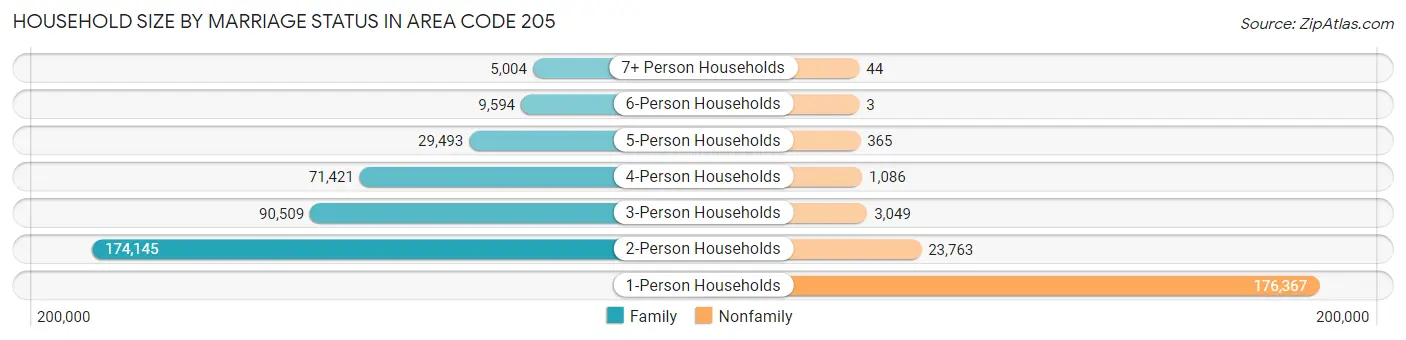
| Household Size | Family Households | Nonfamily Households |
| 1-Person Households | - | 176,367 (30.2%) |
| 2-Person Households | 174,145 (29.8%) | 23,763 (4.1%) |
| 3-Person Households | 90,509 (15.5%) | 3,049 (0.5%) |
| 4-Person Households | 71,421 (12.2%) | 1,086 (0.2%) |
| 5-Person Households | 29,493 (5.0%) | 365 (0.1%) |
| 6-Person Households | 9,594 (1.6%) | 3 (0.0%) |
| 7+ Person Households | 5,004 (0.9%) | 44 (0.0%) |
| Total | 380,166 (65.0%) | 204,677 (35.0%) |
Female Fertility in Area Code 205
Fertility by Age in Area Code 205
Average fertility rate in Area Code 205 is 53.6 births per 1,000 women. Women in the age bracket of 20 to 34 years have the highest fertility rate with 109.1 births per 1,000 women. Women in the age bracket of 20 to 34 years acount for 79.1% of all women with births.
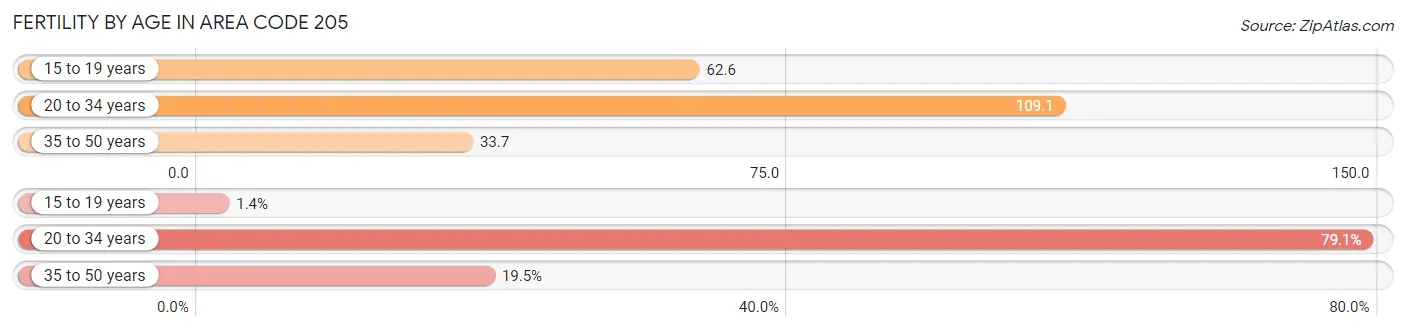
| Age Bracket | Women with Births | Births / 1,000 Women |
| 15 to 19 years | 267 (1.4%) | 62.6 |
| 20 to 34 years | 14,629 (79.1%) | 109.1 |
| 35 to 50 years | 3,602 (19.5%) | 33.7 |
| Total | 18,498 (100.0%) | 53.6 |
Fertility by Age by Marriage Status in Area Code 205
52.2% of women with births (18,498) in Area Code 205 are married. The highest percentage of unmarried women with births falls into 15 to 19 years age bracket with 94.8% of them unmarried at the time of birth, while the lowest percentage of unmarried women with births belong to 20 to 34 years age bracket with 51.9% of them unmarried.
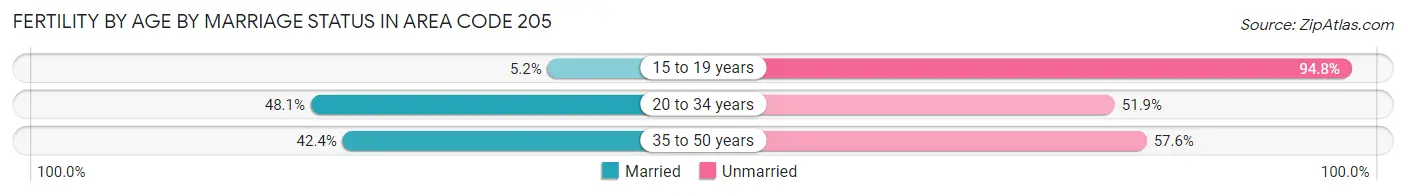
| Age Bracket | Married | Unmarried |
| 15 to 19 years | 14 (5.2%) | 253 (94.8%) |
| 20 to 34 years | 7,043 (48.1%) | 7,586 (51.9%) |
| 35 to 50 years | 1,526 (42.4%) | 2,076 (57.6%) |
| Total | 9,664 (52.2%) | 8,834 (47.8%) |
Fertility by Education in Area Code 205
Average fertility rate in Area Code 205 is 53.6 births per 1,000 women. Women with the education attainment of graduate degree have the highest fertility rate of 142.2 births per 1,000 women, while women with the education attainment of college or associate's degree have the lowest fertility at 74.2 births per 1,000 women. Women with the education attainment of college or associate's degree represent 34.9% of all women with births.
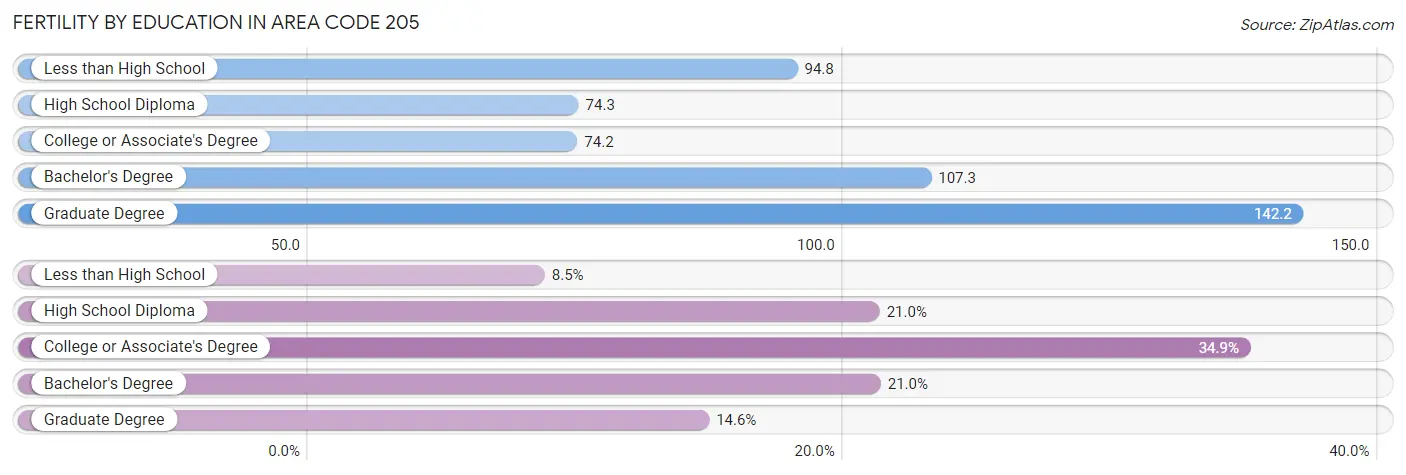
| Educational Attainment | Women with Births | Births / 1,000 Women |
| Less than High School | 1,564 (8.5%) | 94.8 |
| High School Diploma | 3,884 (21.0%) | 74.3 |
| College or Associate's Degree | 6,456 (34.9%) | 74.2 |
| Bachelor's Degree | 3,892 (21.0%) | 107.3 |
| Graduate Degree | 2,702 (14.6%) | 142.2 |
| Total | 18,498 (100.0%) | 53.6 |
Fertility by Education by Marriage Status in Area Code 205
47.8% of women with births in Area Code 205 are unmarried. Women with the educational attainment of graduate degree are most likely to be married with 43.5% of them married at childbirth, while women with the educational attainment of less than high school are least likely to be married with 85.6% of them unmarried at childbirth.
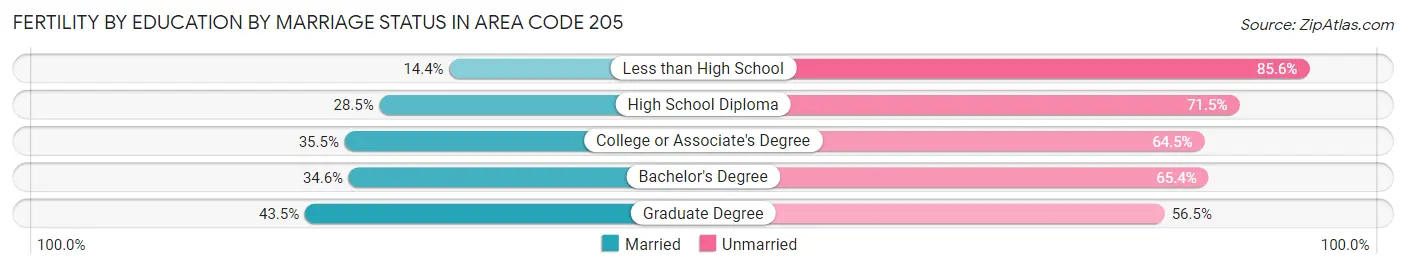
| Educational Attainment | Married | Unmarried |
| Less than High School | 225 (14.4%) | 1,339 (85.6%) |
| High School Diploma | 1,106 (28.5%) | 2,778 (71.5%) |
| College or Associate's Degree | 2,291 (35.5%) | 4,165 (64.5%) |
| Bachelor's Degree | 1,348 (34.6%) | 2,544 (65.4%) |
| Graduate Degree | 1,175 (43.5%) | 1,527 (56.5%) |
| Total | 9,664 (52.2%) | 8,834 (47.8%) |
Employment Characteristics in Area Code 205
Employment by Class of Employer in Area Code 205
Among the 689,811 employed individuals in Area Code 205, private company employees (469,623 | 68.1%), not-for-profit organizations (54,551 | 7.9%), and local government employees (46,880 | 6.8%) make up the most common classes of employment.
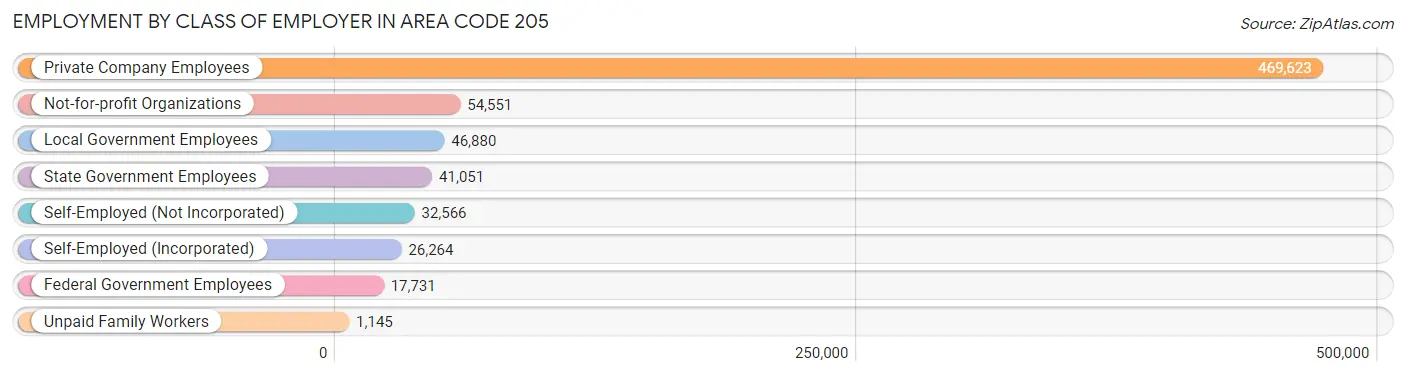
| Employer Class | # Employees | % Employees |
| Private Company Employees | 469,623 | 68.1% |
| Self-Employed (Incorporated) | 26,264 | 3.8% |
| Self-Employed (Not Incorporated) | 32,566 | 4.7% |
| Not-for-profit Organizations | 54,551 | 7.9% |
| Local Government Employees | 46,880 | 6.8% |
| State Government Employees | 41,051 | 5.9% |
| Federal Government Employees | 17,731 | 2.6% |
| Unpaid Family Workers | 1,145 | 0.2% |
| Total | 689,811 | 100.0% |
Employment Status by Age in Area Code 205
According to the labor force statistics for Area Code 205, out of the total population over 16 years of age (1,233,676), 55.8% or 689,008 individuals are in the labor force, with 7.4% or 51,331 of them unemployed. The age group with the highest labor force participation rate is 25 to 29 years, with 79.1% or 80,921 individuals in the labor force. Within the labor force, the 16 to 19 years age range has the highest percentage of unemployed individuals, with 2,671.3% or 971,338 of them being unemployed.
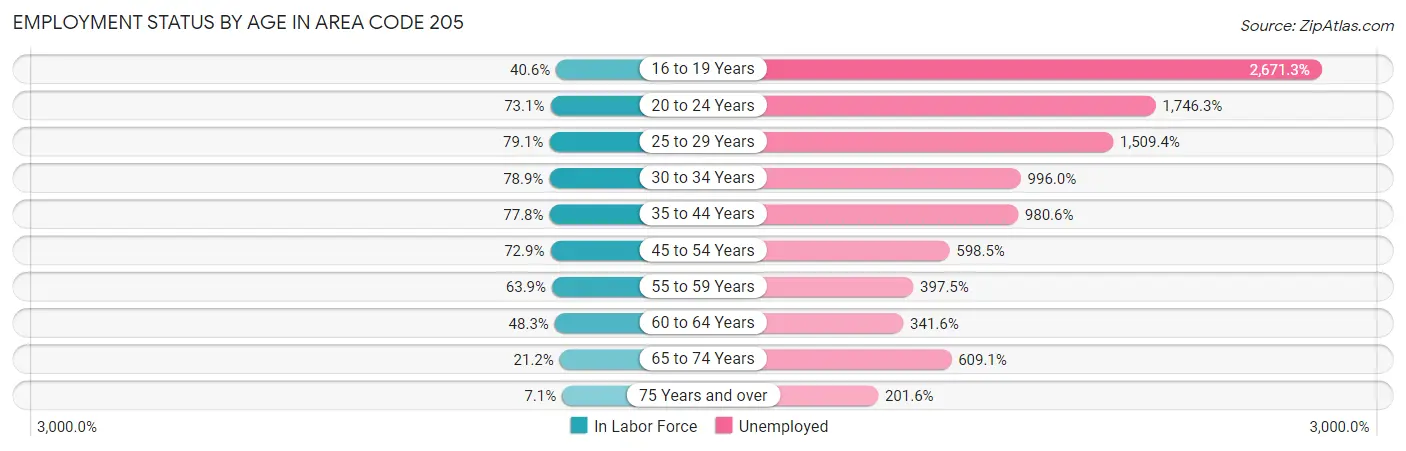
| Age Bracket | In Labor Force | Unemployed |
| 16 to 19 Years | 36,361 (40.6%) | 971,338 (2,671.3%) |
| 20 to 24 Years | 79,093 (73.1%) | 1,381,271 (1,746.3%) |
| 25 to 29 Years | 80,923 (79.1%) | 1,221,422 (1,509.4%) |
| 30 to 34 Years | 80,109 (78.9%) | 797,896 (996.0%) |
| 35 to 44 Years | 150,716 (77.8%) | 1,477,892 (980.6%) |
| 45 to 54 Years | 138,056 (72.9%) | 826,211 (598.5%) |
| 55 to 59 Years | 61,606 (63.9%) | 244,872 (397.5%) |
| 60 to 64 Years | 47,653 (48.3%) | 162,796 (341.6%) |
| 65 to 74 Years | 32,433 (21.2%) | 197,580 (609.1%) |
| 75 Years and over | 7,212 (7.1%) | 14,533 (201.6%) |
| Total | 689,066 (55.8%) | 51,351 (7.4%) |
Employment Status by Educational Attainment in Area Code 205
According to labor force statistics for Area Code 205, 70.7% of individuals (552,427) out of the total population between 25 and 64 years of age (781,810) are in the labor force, with 993.4% or 5,487,810 of them being unemployed. The group with the highest labor force participation rate are those with the educational attainment of bachelor's degree or higher, with 84.9% or 216,792 individuals in the labor force. Within the labor force, individuals with less than high school education have the highest percentage of unemployment, with 1,407.9% or 551,122 of them being unemployed.
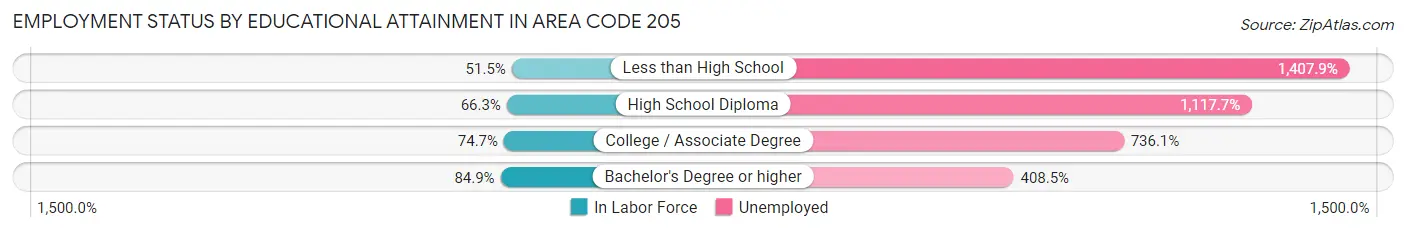
| Educational Attainment | In Labor Force | Unemployed |
| Less than High School | 39,149 (51.5%) | 1,069,525 (1,407.9%) |
| High School Diploma | 139,520 (66.3%) | 2,352,345 (1,117.7%) |
| College / Associate Degree | 179,228 (74.7%) | 1,766,427 (736.1%) |
| Bachelor's Degree or higher | 216,782 (84.9%) | 1,043,350 (408.5%) |
| Total | 552,397 (70.7%) | 7,766,501 (993.4%) |
Employment Occupations by Sex in Area Code 205
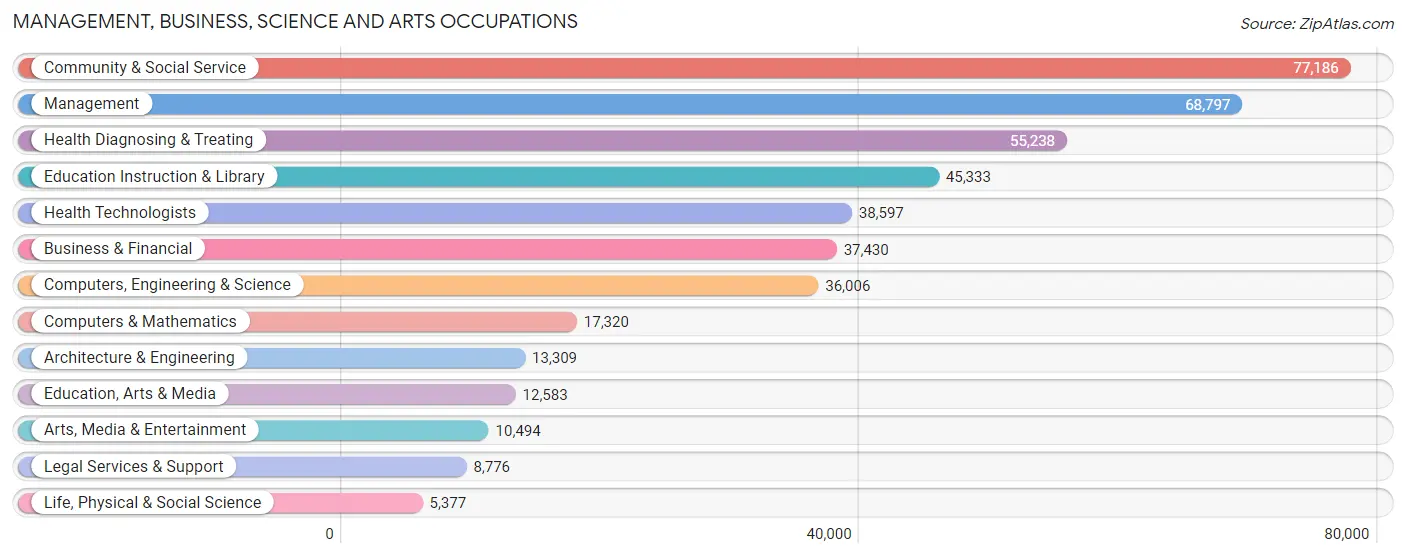
Management, Business, Science and Arts Occupations
The most common Management, Business, Science and Arts occupations in Area Code 205 are Community & Social Service (77,186 | 11.0%), Management (68,797 | 9.8%), Health Diagnosing & Treating (55,238 | 7.9%), Education Instruction & Library (45,333 | 6.5%), and Health Technologists (38,597 | 5.5%).
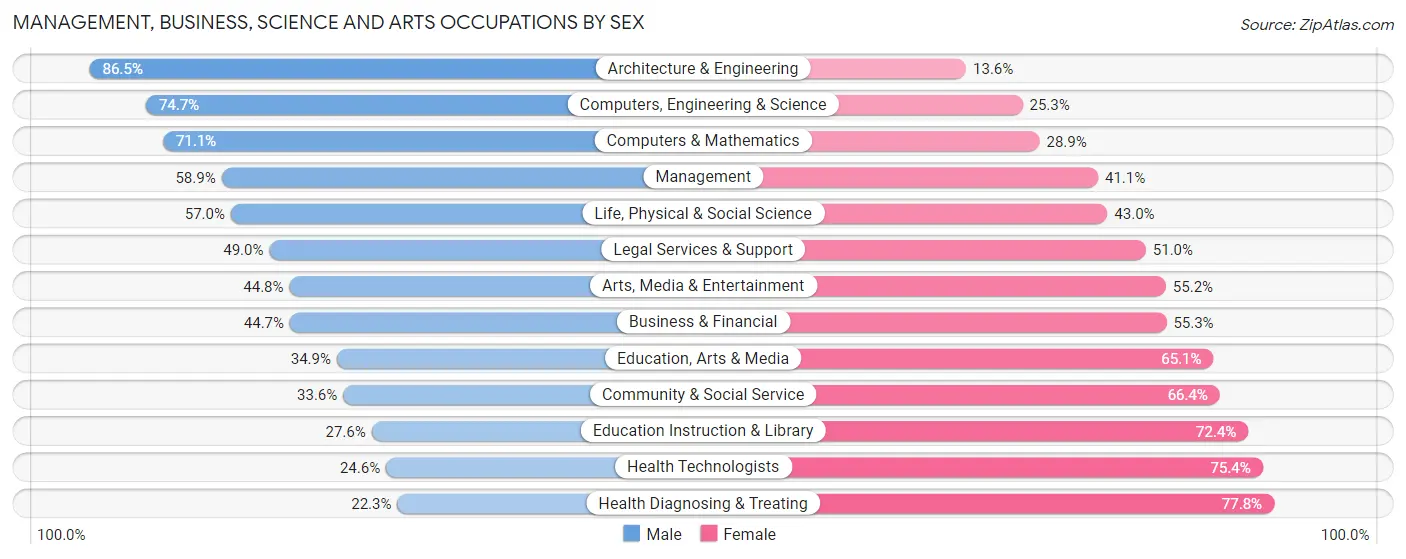
Management, Business, Science and Arts Occupations by Sex
Within the Management, Business, Science and Arts occupations in Area Code 205, the most male-oriented occupations are Architecture & Engineering (86.5%), Computers, Engineering & Science (74.7%), and Computers & Mathematics (71.1%), while the most female-oriented occupations are Health Diagnosing & Treating (77.7%), Health Technologists (75.4%), and Education Instruction & Library (72.4%).
| Occupation | Male | Female |
| Management | 40,541 (58.9%) | 28,256 (41.1%) |
| Business & Financial | 16,718 (44.7%) | 20,712 (55.3%) |
| Computers, Engineering & Science | 26,889 (74.7%) | 9,117 (25.3%) |
| Computers & Mathematics | 12,319 (71.1%) | 5,001 (28.9%) |
| Architecture & Engineering | 11,506 (86.5%) | 1,803 (13.6%) |
| Life, Physical & Social Science | 3,064 (57.0%) | 2,313 (43.0%) |
| Community & Social Service | 25,906 (33.6%) | 51,280 (66.4%) |
| Education, Arts & Media | 4,389 (34.9%) | 8,194 (65.1%) |
| Legal Services & Support | 4,297 (49.0%) | 4,479 (51.0%) |
| Education Instruction & Library | 12,522 (27.6%) | 32,811 (72.4%) |
| Arts, Media & Entertainment | 4,698 (44.8%) | 5,796 (55.2%) |
| Health Diagnosing & Treating | 12,291 (22.3%) | 42,947 (77.7%) |
| Health Technologists | 9,498 (24.6%) | 29,099 (75.4%) |
| Total (Category) | 122,345 (44.5%) | 152,312 (55.5%) |
| Total (Overall) | 364,407 (52.0%) | 336,758 (48.0%) |
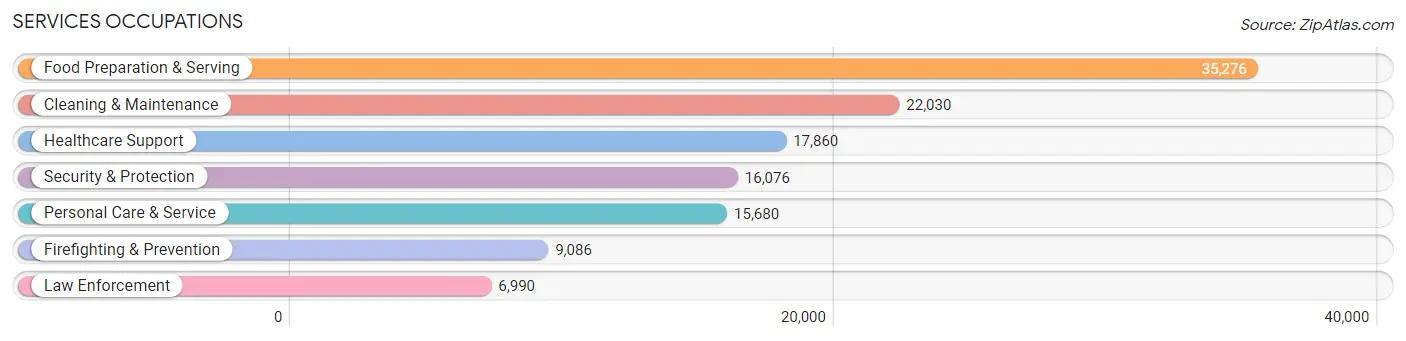
Services Occupations
The most common Services occupations in Area Code 205 are Food Preparation & Serving (35,276 | 5.0%), Cleaning & Maintenance (22,030 | 3.1%), Healthcare Support (17,860 | 2.5%), Security & Protection (16,076 | 2.3%), and Personal Care & Service (15,680 | 2.2%).
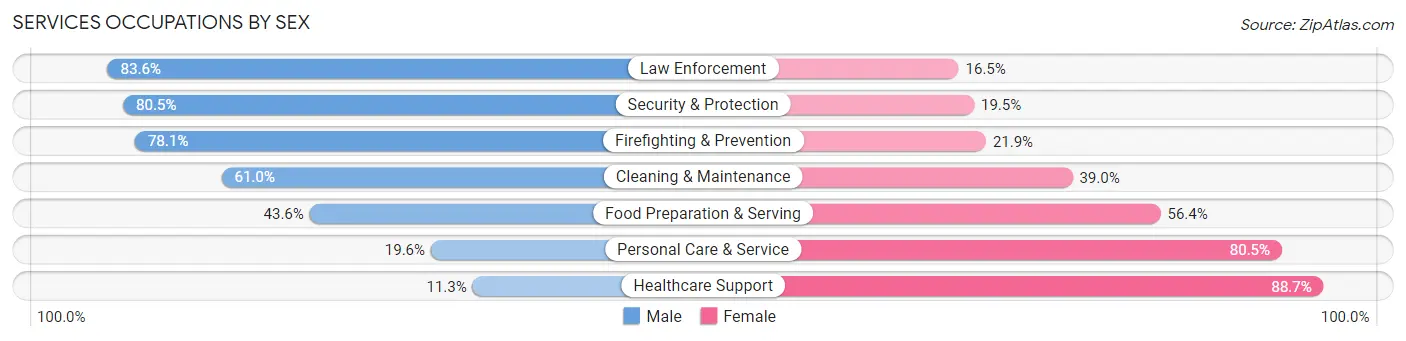
Services Occupations by Sex
Within the Services occupations in Area Code 205, the most male-oriented occupations are Law Enforcement (83.6%), Security & Protection (80.5%), and Firefighting & Prevention (78.1%), while the most female-oriented occupations are Healthcare Support (88.7%), Personal Care & Service (80.4%), and Food Preparation & Serving (56.4%).
| Occupation | Male | Female |
| Healthcare Support | 2,018 (11.3%) | 15,842 (88.7%) |
| Security & Protection | 12,940 (80.5%) | 3,136 (19.5%) |
| Firefighting & Prevention | 7,100 (78.1%) | 1,986 (21.9%) |
| Law Enforcement | 5,840 (83.6%) | 1,150 (16.5%) |
| Food Preparation & Serving | 15,366 (43.6%) | 19,910 (56.4%) |
| Cleaning & Maintenance | 13,438 (61.0%) | 8,592 (39.0%) |
| Personal Care & Service | 3,066 (19.6%) | 12,614 (80.4%) |
| Total (Category) | 46,828 (43.8%) | 60,094 (56.2%) |
| Total (Overall) | 364,407 (52.0%) | 336,758 (48.0%) |
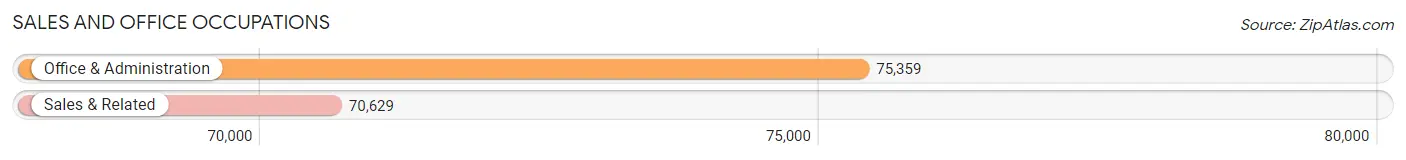
Sales and Office Occupations
The most common Sales and Office occupations in Area Code 205 are Office & Administration (75,359 | 10.7%), and Sales & Related (70,629 | 10.1%).
Sales and Office Occupations by Sex
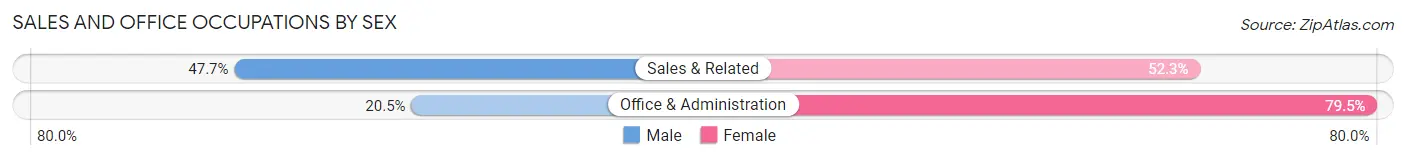
| Occupation | Male | Female |
| Sales & Related | 33,713 (47.7%) | 36,916 (52.3%) |
| Office & Administration | 15,438 (20.5%) | 59,921 (79.5%) |
| Total (Category) | 49,151 (33.7%) | 96,837 (66.3%) |
| Total (Overall) | 364,407 (52.0%) | 336,758 (48.0%) |
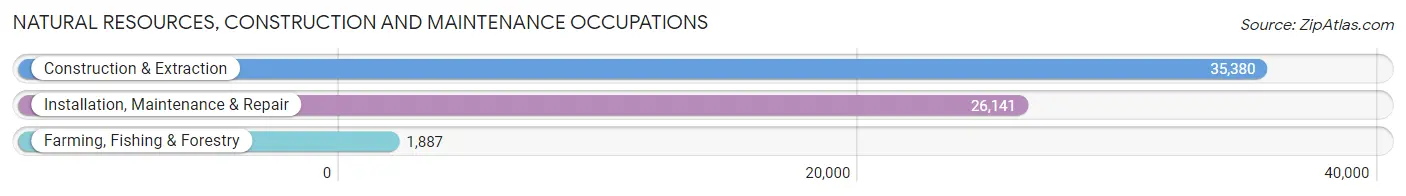
Natural Resources, Construction and Maintenance Occupations
The most common Natural Resources, Construction and Maintenance occupations in Area Code 205 are Construction & Extraction (35,380 | 5.1%), Installation, Maintenance & Repair (26,141 | 3.7%), and Farming, Fishing & Forestry (1,887 | 0.3%).
Natural Resources, Construction and Maintenance Occupations by Sex
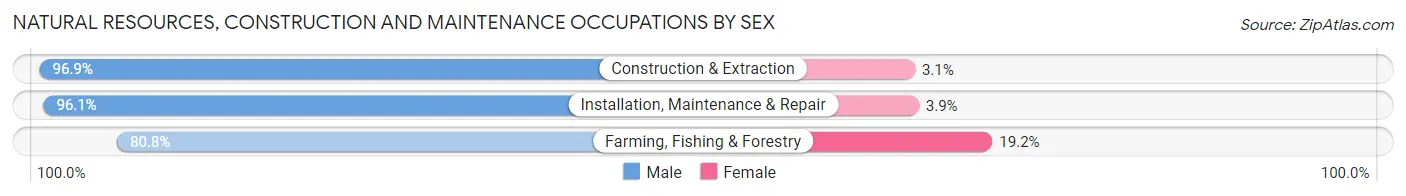
| Occupation | Male | Female |
| Farming, Fishing & Forestry | 1,524 (80.8%) | 363 (19.2%) |
| Construction & Extraction | 34,272 (96.9%) | 1,108 (3.1%) |
| Installation, Maintenance & Repair | 25,114 (96.1%) | 1,027 (3.9%) |
| Total (Category) | 60,910 (96.1%) | 2,498 (3.9%) |
| Total (Overall) | 364,407 (52.0%) | 336,758 (48.0%) |
Production, Transportation and Moving Occupations
The most common Production, Transportation and Moving occupations in Area Code 205 are Production (50,119 | 7.1%), Material Moving (32,950 | 4.7%), and Transportation (27,121 | 3.9%).
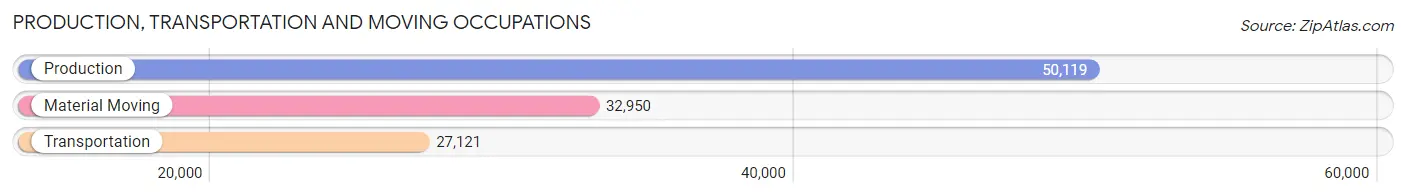
Production, Transportation and Moving Occupations by Sex
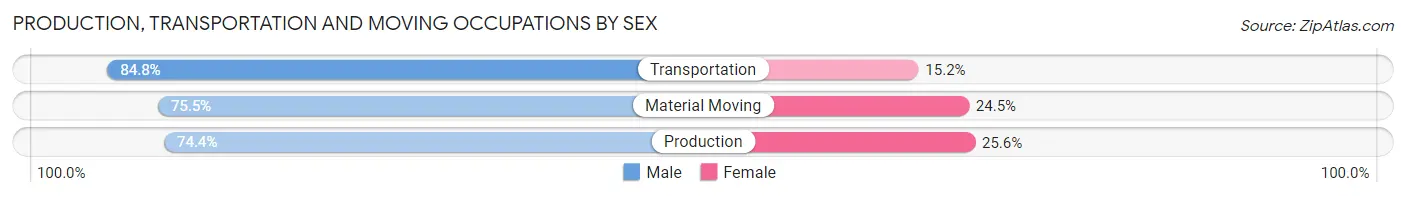
| Occupation | Male | Female |
| Production | 37,288 (74.4%) | 12,831 (25.6%) |
| Transportation | 22,999 (84.8%) | 4,122 (15.2%) |
| Material Moving | 24,886 (75.5%) | 8,064 (24.5%) |
| Total (Category) | 85,173 (77.3%) | 25,017 (22.7%) |
| Total (Overall) | 364,407 (52.0%) | 336,758 (48.0%) |
Employment Industries by Sex in Area Code 205
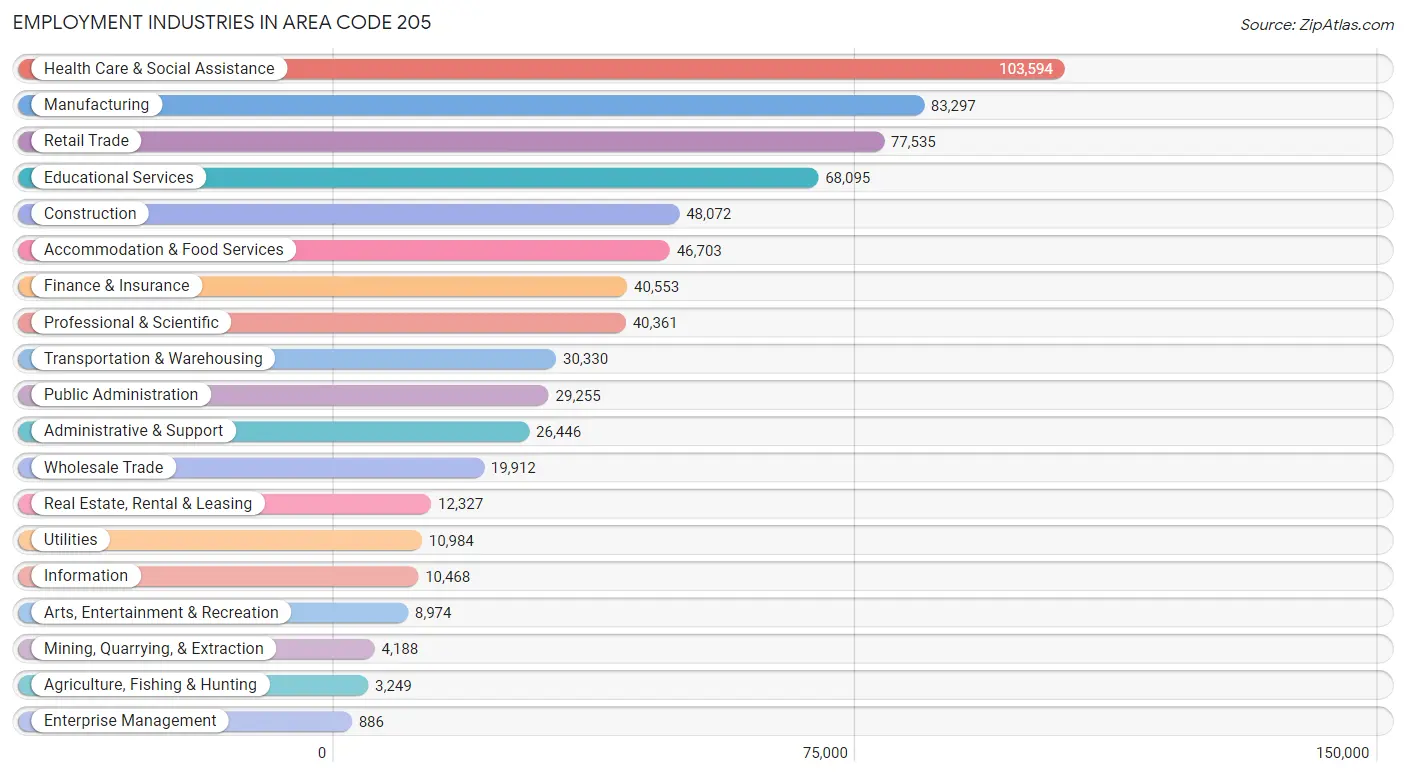
Employment Industries in Area Code 205
The major employment industries in Area Code 205 include Health Care & Social Assistance (103,594 | 14.8%), Manufacturing (83,297 | 11.9%), Retail Trade (77,535 | 11.1%), Educational Services (68,095 | 9.7%), and Construction (48,072 | 6.9%).
Employment Industries by Sex in Area Code 205
The Area Code 205 industries that see more men than women are Mining, Quarrying, & Extraction (92.4%), Construction (91.0%), and Agriculture, Fishing & Hunting (83.3%), whereas the industries that tend to have a higher number of women are Health Care & Social Assistance (80.5%), Enterprise Management (68.9%), and Educational Services (68.0%).
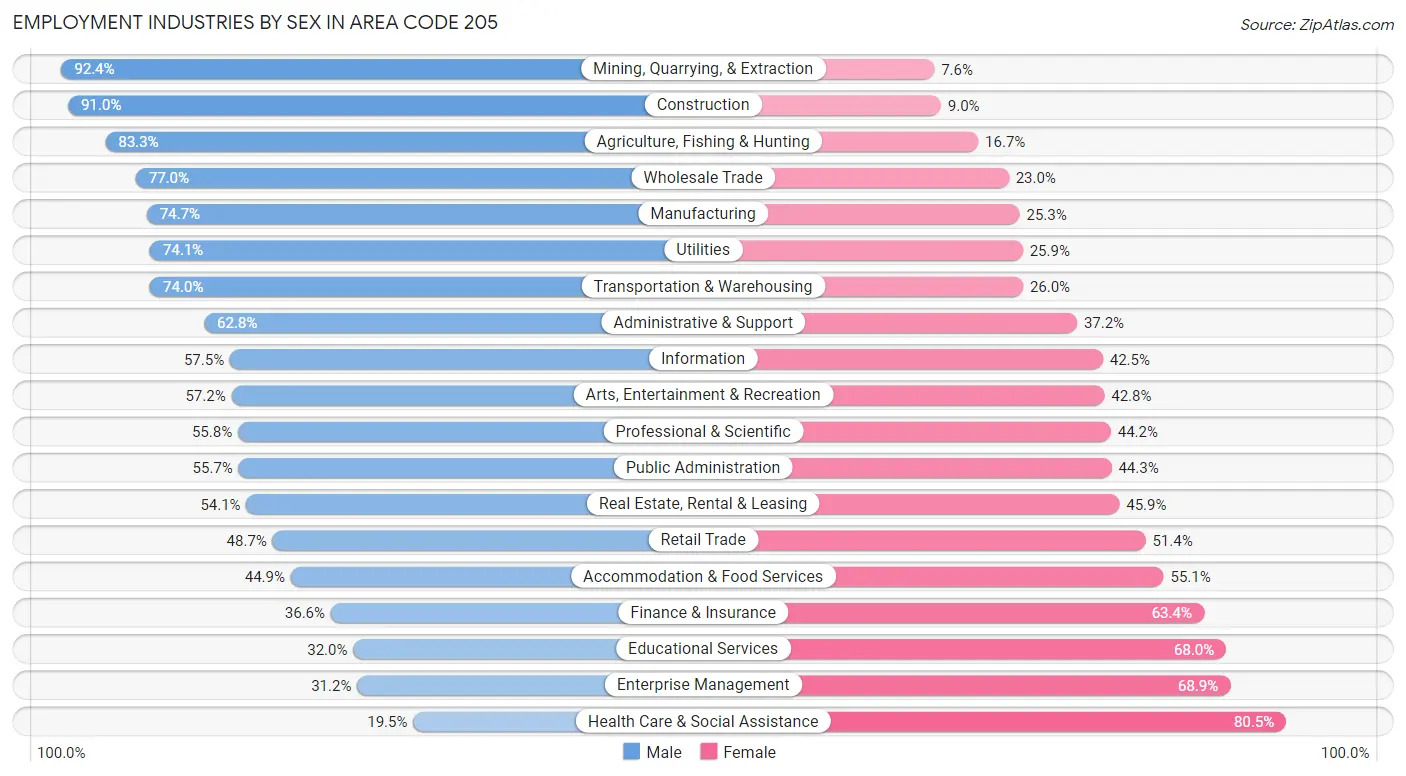
| Industry | Male | Female |
| Agriculture, Fishing & Hunting | 2,706 (83.3%) | 543 (16.7%) |
| Mining, Quarrying, & Extraction | 3,869 (92.4%) | 319 (7.6%) |
| Construction | 43,750 (91.0%) | 4,322 (9.0%) |
| Manufacturing | 62,242 (74.7%) | 21,055 (25.3%) |
| Wholesale Trade | 15,326 (77.0%) | 4,586 (23.0%) |
| Retail Trade | 37,723 (48.6%) | 39,812 (51.3%) |
| Transportation & Warehousing | 22,451 (74.0%) | 7,879 (26.0%) |
| Utilities | 8,135 (74.1%) | 2,849 (25.9%) |
| Information | 6,018 (57.5%) | 4,450 (42.5%) |
| Finance & Insurance | 14,847 (36.6%) | 25,706 (63.4%) |
| Real Estate, Rental & Leasing | 6,667 (54.1%) | 5,660 (45.9%) |
| Professional & Scientific | 22,534 (55.8%) | 17,827 (44.2%) |
| Enterprise Management | 276 (31.1%) | 610 (68.9%) |
| Administrative & Support | 16,619 (62.8%) | 9,827 (37.2%) |
| Educational Services | 21,769 (32.0%) | 46,326 (68.0%) |
| Health Care & Social Assistance | 20,246 (19.5%) | 83,348 (80.5%) |
| Arts, Entertainment & Recreation | 5,131 (57.2%) | 3,843 (42.8%) |
| Accommodation & Food Services | 20,975 (44.9%) | 25,728 (55.1%) |
| Public Administration | 16,293 (55.7%) | 12,962 (44.3%) |
| Total | 364,407 (52.0%) | 336,758 (48.0%) |
Education in Area Code 205
School Enrollment in Area Code 205
The most common levels of schooling among the 380,465 students in Area Code 205 are college / undergraduate (88,978 | 23.4%), high school (77,375 | 20.3%), and middle school (76,407 | 20.1%).
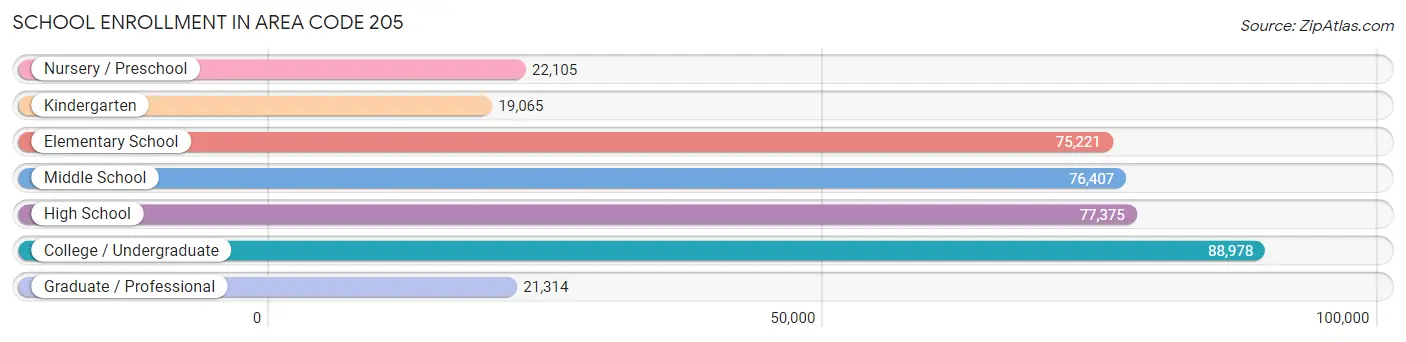
| School Level | # Students | % Students |
| Nursery / Preschool | 22,105 | 5.8% |
| Kindergarten | 19,065 | 5.0% |
| Elementary School | 75,221 | 19.8% |
| Middle School | 76,407 | 20.1% |
| High School | 77,375 | 20.3% |
| College / Undergraduate | 88,978 | 23.4% |
| Graduate / Professional | 21,314 | 5.6% |
| Total | 380,465 | 100.0% |
School Enrollment by Age by Funding Source in Area Code 205
Out of a total of 380,465 students who are enrolled in schools in Area Code 205, 56,595 (14.9%) attend a private institution, while the remaining 323,870 (85.1%) are enrolled in public schools. The age group of 3 to 4 year olds has the highest likelihood of being enrolled in private schools, with 8,234 (46.7% in the age bracket) enrolled. Conversely, the age group of 18 to 19 year olds has the lowest likelihood of being enrolled in a private school, with 34,643 (89.2% in the age bracket) attending a public institution.
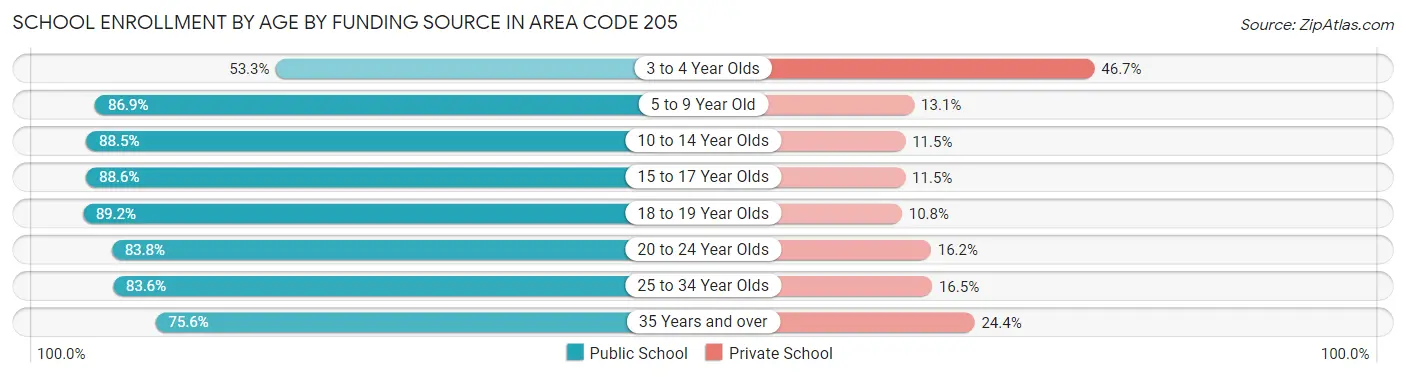
| Age Bracket | Public School | Private School |
| 3 to 4 Year Olds | 9,403 (53.3%) | 8,234 (46.7%) |
| 5 to 9 Year Old | 76,452 (86.9%) | 11,553 (13.1%) |
| 10 to 14 Year Olds | 84,238 (88.5%) | 10,914 (11.5%) |
| 15 to 17 Year Olds | 49,555 (88.5%) | 6,409 (11.5%) |
| 18 to 19 Year Olds | 34,643 (89.2%) | 4,208 (10.8%) |
| 20 to 24 Year Olds | 38,913 (83.8%) | 7,537 (16.2%) |
| 25 to 34 Year Olds | 17,498 (83.6%) | 3,445 (16.5%) |
| 35 Years and over | 13,207 (75.6%) | 4,256 (24.4%) |
| Total | 323,870 (85.1%) | 56,595 (14.9%) |
Educational Attainment by Field of Study in Area Code 205
Business (80,751 | 23.5%), education (45,747 | 13.3%), science & technology (40,218 | 11.7%), arts & humanities (23,966 | 7.0%), and bio, nature & agricultural (21,047 | 6.1%) are the most common fields of study among 343,375 individuals in Area Code 205 who have obtained a bachelor's degree or higher.
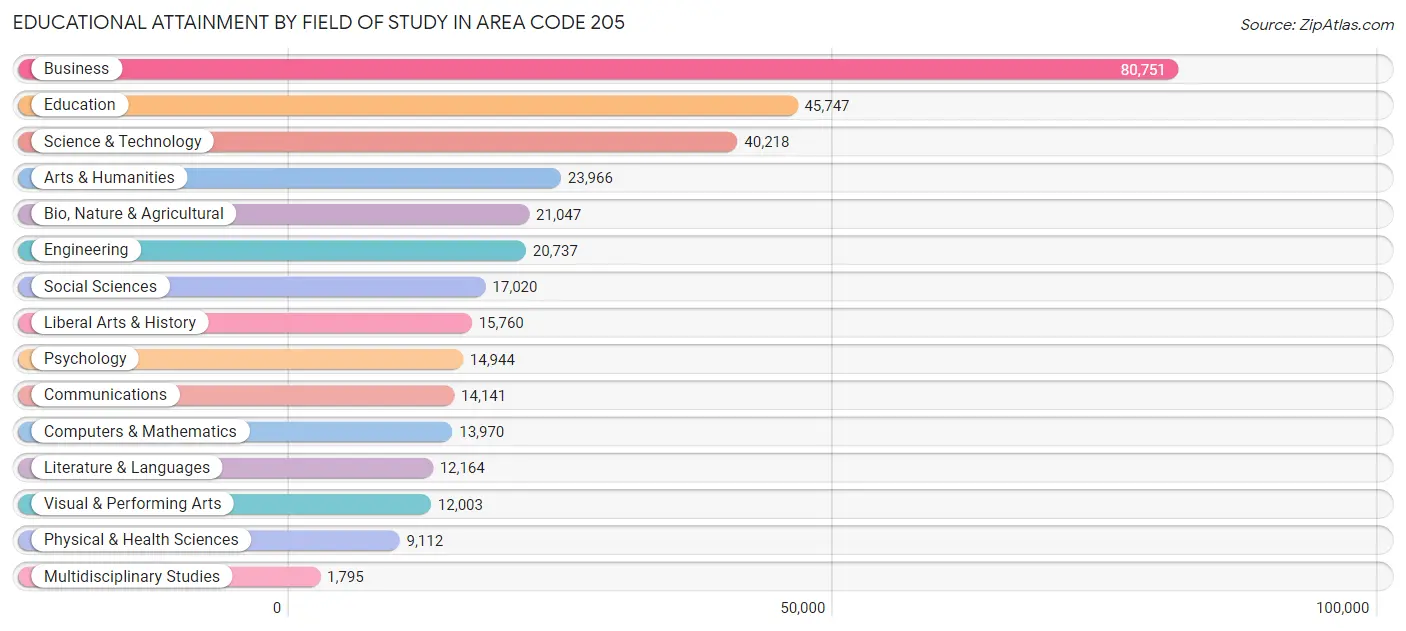
| Field of Study | # Graduates | % Graduates |
| Computers & Mathematics | 13,970 | 4.1% |
| Bio, Nature & Agricultural | 21,047 | 6.1% |
| Physical & Health Sciences | 9,112 | 2.6% |
| Psychology | 14,944 | 4.3% |
| Social Sciences | 17,020 | 5.0% |
| Engineering | 20,737 | 6.0% |
| Multidisciplinary Studies | 1,795 | 0.5% |
| Science & Technology | 40,218 | 11.7% |
| Business | 80,751 | 23.5% |
| Education | 45,747 | 13.3% |
| Literature & Languages | 12,164 | 3.5% |
| Liberal Arts & History | 15,760 | 4.6% |
| Visual & Performing Arts | 12,003 | 3.5% |
| Communications | 14,141 | 4.1% |
| Arts & Humanities | 23,966 | 7.0% |
| Total | 343,375 | 100.0% |
Transportation & Commute in Area Code 205
Vehicle Availability by Sex in Area Code 205
The most prevalent vehicle ownership categories in Area Code 205 are males with 2 vehicles (147,200, accounting for 41.1%) and females with 2 vehicles (127,199, making up 45.2%).
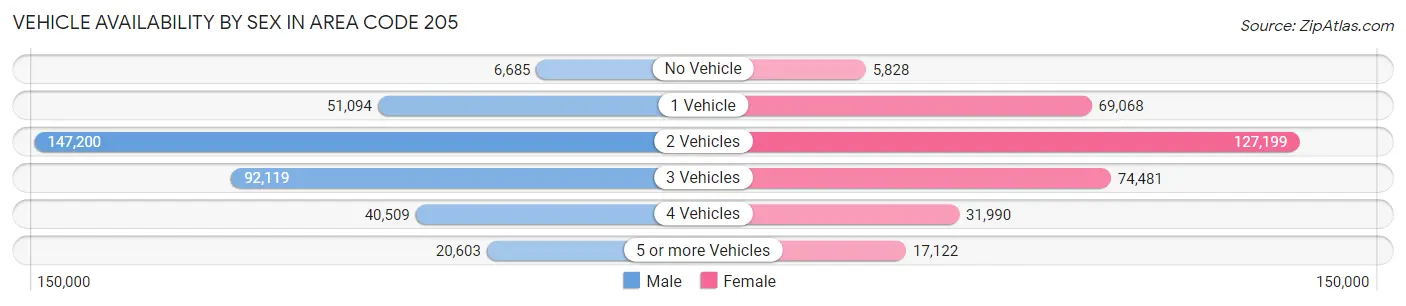
| Vehicles Available | Male | Female |
| No Vehicle | 6,685 (1.9%) | 5,828 (1.8%) |
| 1 Vehicle | 51,094 (14.3%) | 69,068 (21.2%) |
| 2 Vehicles | 147,200 (41.1%) | 127,199 (39.1%) |
| 3 Vehicles | 92,119 (25.7%) | 74,481 (22.9%) |
| 4 Vehicles | 40,509 (11.3%) | 31,990 (9.8%) |
| 5 or more Vehicles | 20,603 (5.8%) | 17,122 (5.3%) |
| Total | 358,210 (100.0%) | 325,688 (100.0%) |
Commute Time in Area Code 205
The most frequently occuring commute durations in Area Code 205 are 20 to 24 minutes (99,141 commuters, 15.6%), 15 to 19 minutes (98,849 commuters, 15.6%), and 30 to 34 minutes (98,061 commuters, 15.4%).
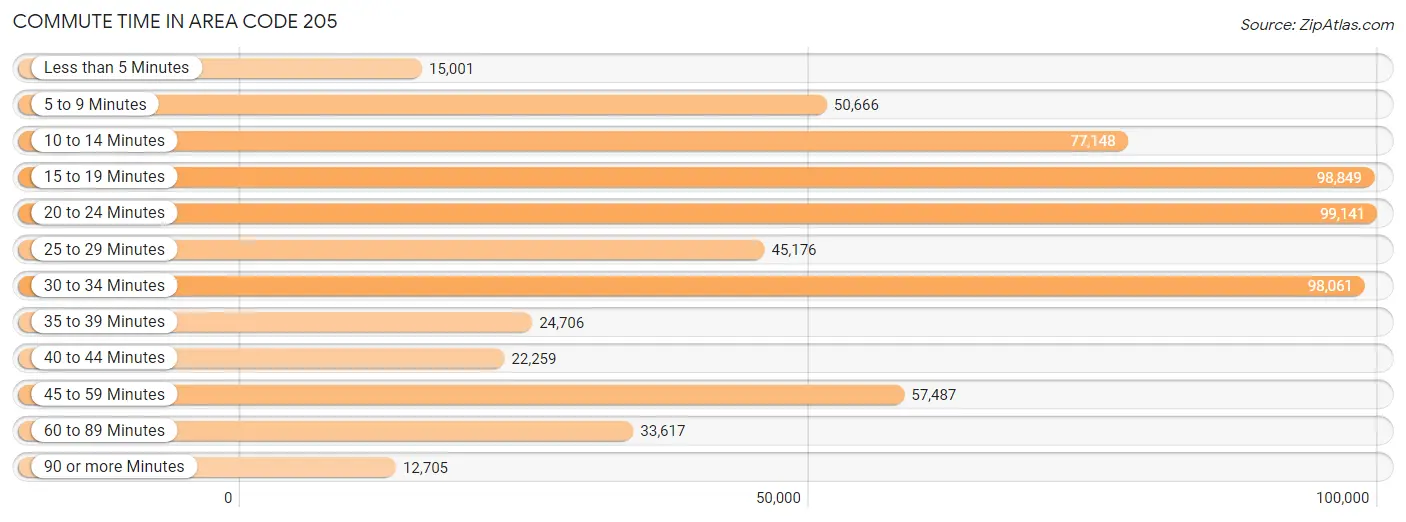
| Commute Time | # Commuters | % Commuters |
| Less than 5 Minutes | 15,001 | 2.4% |
| 5 to 9 Minutes | 50,666 | 8.0% |
| 10 to 14 Minutes | 77,148 | 12.1% |
| 15 to 19 Minutes | 98,849 | 15.6% |
| 20 to 24 Minutes | 99,141 | 15.6% |
| 25 to 29 Minutes | 45,176 | 7.1% |
| 30 to 34 Minutes | 98,061 | 15.4% |
| 35 to 39 Minutes | 24,706 | 3.9% |
| 40 to 44 Minutes | 22,259 | 3.5% |
| 45 to 59 Minutes | 57,487 | 9.1% |
| 60 to 89 Minutes | 33,617 | 5.3% |
| 90 or more Minutes | 12,705 | 2.0% |
Commute Time by Sex in Area Code 205
The most common commute times in Area Code 205 are 30 to 34 minutes (52,857 commuters, 15.8%) for males and 15 to 19 minutes (49,616 commuters, 16.5%) for females.
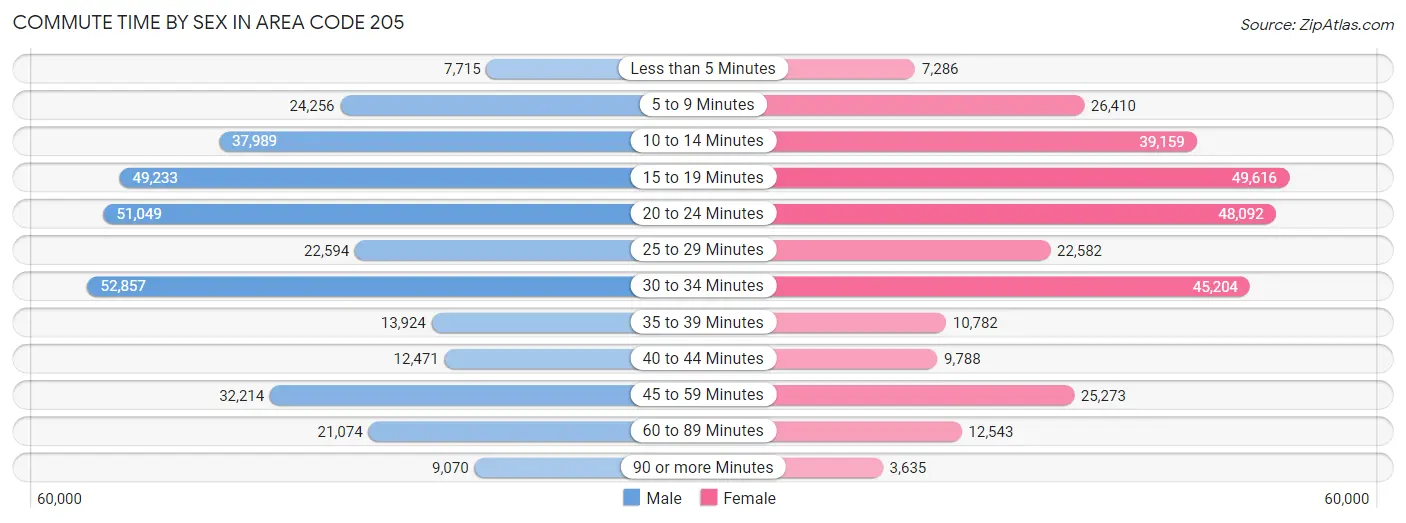
| Commute Time | Male | Female |
| Less than 5 Minutes | 7,715 (2.3%) | 7,286 (2.4%) |
| 5 to 9 Minutes | 24,256 (7.2%) | 26,410 (8.8%) |
| 10 to 14 Minutes | 37,989 (11.4%) | 39,159 (13.0%) |
| 15 to 19 Minutes | 49,233 (14.7%) | 49,616 (16.5%) |
| 20 to 24 Minutes | 51,049 (15.3%) | 48,092 (16.0%) |
| 25 to 29 Minutes | 22,594 (6.8%) | 22,582 (7.5%) |
| 30 to 34 Minutes | 52,857 (15.8%) | 45,204 (15.0%) |
| 35 to 39 Minutes | 13,924 (4.2%) | 10,782 (3.6%) |
| 40 to 44 Minutes | 12,471 (3.7%) | 9,788 (3.3%) |
| 45 to 59 Minutes | 32,214 (9.6%) | 25,273 (8.4%) |
| 60 to 89 Minutes | 21,074 (6.3%) | 12,543 (4.2%) |
| 90 or more Minutes | 9,070 (2.7%) | 3,635 (1.2%) |
Time of Departure to Work by Sex in Area Code 205
The most frequent times of departure to work in Area Code 205 are 7:00 AM to 7:29 AM (47,258, 14.1%) for males and 7:00 AM to 7:29 AM (53,539, 17.8%) for females.
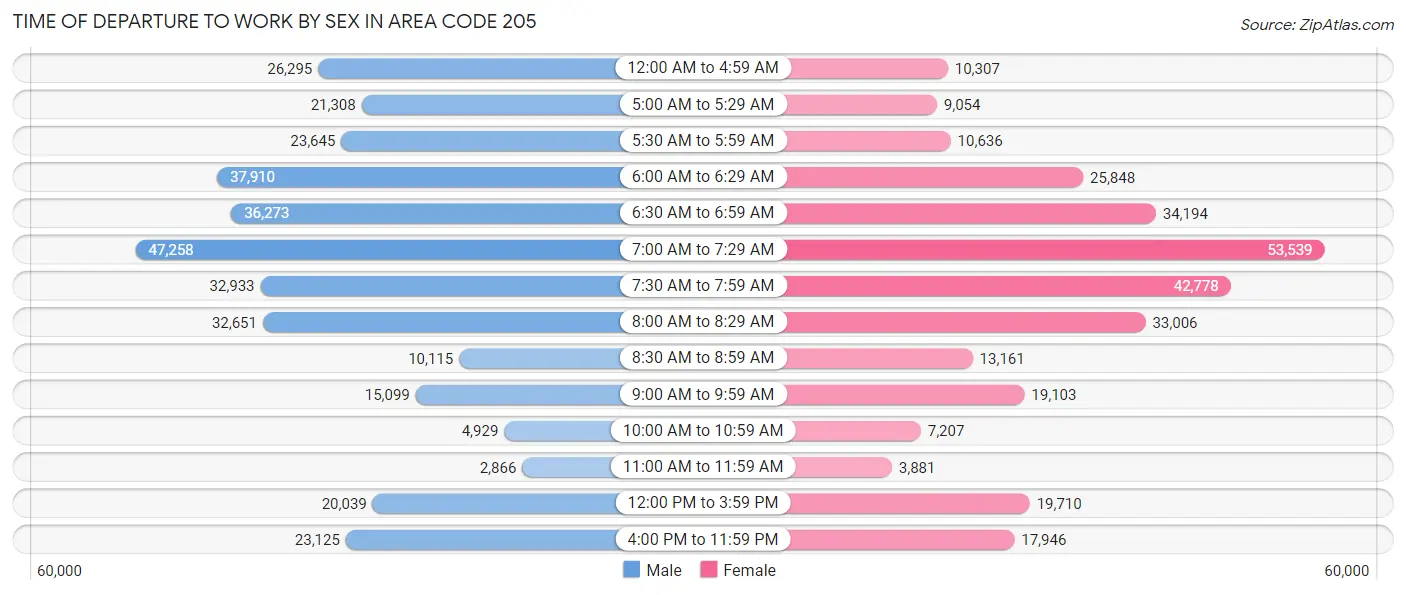
| Time of Departure | Male | Female |
| 12:00 AM to 4:59 AM | 26,295 (7.9%) | 10,307 (3.4%) |
| 5:00 AM to 5:29 AM | 21,308 (6.4%) | 9,054 (3.0%) |
| 5:30 AM to 5:59 AM | 23,645 (7.1%) | 10,636 (3.5%) |
| 6:00 AM to 6:29 AM | 37,910 (11.3%) | 25,848 (8.6%) |
| 6:30 AM to 6:59 AM | 36,273 (10.8%) | 34,194 (11.4%) |
| 7:00 AM to 7:29 AM | 47,258 (14.1%) | 53,539 (17.8%) |
| 7:30 AM to 7:59 AM | 32,933 (9.9%) | 42,778 (14.2%) |
| 8:00 AM to 8:29 AM | 32,651 (9.8%) | 33,006 (11.0%) |
| 8:30 AM to 8:59 AM | 10,115 (3.0%) | 13,161 (4.4%) |
| 9:00 AM to 9:59 AM | 15,099 (4.5%) | 19,103 (6.4%) |
| 10:00 AM to 10:59 AM | 4,929 (1.5%) | 7,207 (2.4%) |
| 11:00 AM to 11:59 AM | 2,866 (0.9%) | 3,881 (1.3%) |
| 12:00 PM to 3:59 PM | 20,039 (6.0%) | 19,710 (6.6%) |
| 4:00 PM to 11:59 PM | 23,125 (6.9%) | 17,946 (6.0%) |
| Total | 334,446 (100.0%) | 300,370 (100.0%) |
Housing Occupancy in Area Code 205
Occupancy by Ownership in Area Code 205
Of the total 584,843 dwellings in Area Code 205, owner-occupied units account for 407,803 (69.7%), while renter-occupied units make up 177,040 (30.3%).
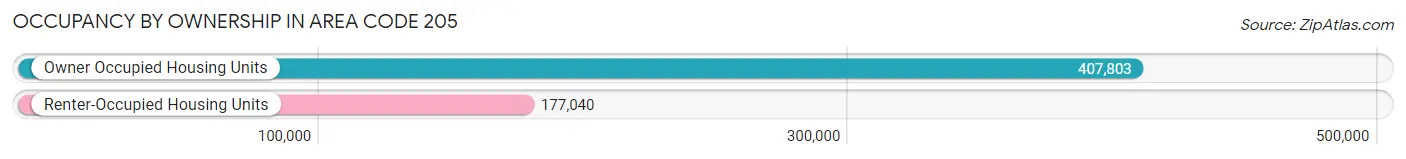
| Occupancy | # Housing Units | % Housing Units |
| Owner Occupied Housing Units | 407,803 | 69.7% |
| Renter-Occupied Housing Units | 177,040 | 30.3% |
| Total Occupied Housing Units | 584,843 | 100.0% |
Occupancy by Household Size in Area Code 205
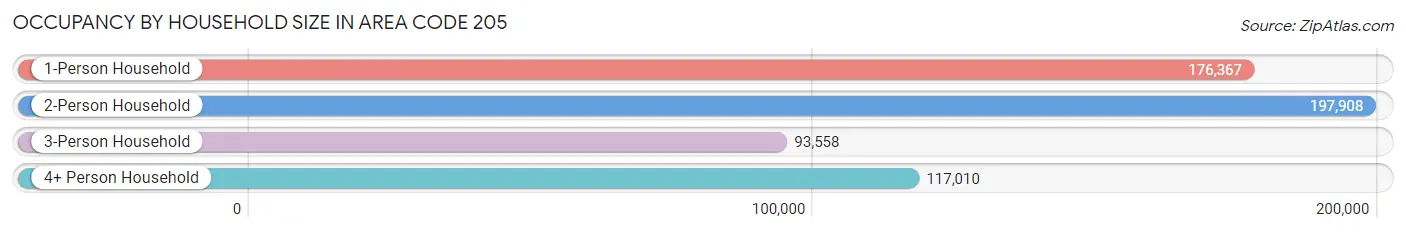
| Household Size | # Housing Units | % Housing Units |
| 1-Person Household | 176,367 | 30.2% |
| 2-Person Household | 197,908 | 33.8% |
| 3-Person Household | 93,558 | 16.0% |
| 4+ Person Household | 117,010 | 20.0% |
| Total Housing Units | 584,843 | 100.0% |
Occupancy by Ownership by Household Size in Area Code 205
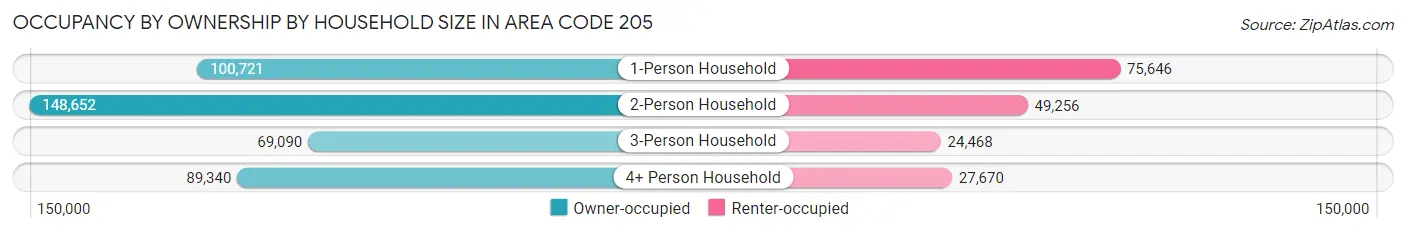
| Household Size | Owner-occupied | Renter-occupied |
| 1-Person Household | 100,721 (57.1%) | 75,646 (42.9%) |
| 2-Person Household | 148,652 (75.1%) | 49,256 (24.9%) |
| 3-Person Household | 69,090 (73.9%) | 24,468 (26.2%) |
| 4+ Person Household | 89,340 (76.3%) | 27,670 (23.6%) |
| Total Housing Units | 407,803 (69.7%) | 177,040 (30.3%) |
Occupancy by Educational Attainment in Area Code 205
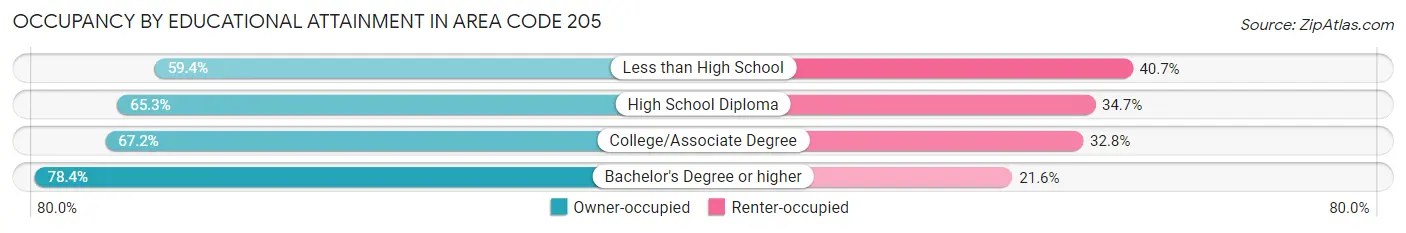
| Household Size | Owner-occupied | Renter-occupied |
| Less than High School | 32,229 (59.4%) | 22,070 (40.6%) |
| High School Diploma | 99,065 (65.3%) | 52,667 (34.7%) |
| College/Associate Degree | 122,595 (67.2%) | 59,891 (32.8%) |
| Bachelor's Degree or higher | 153,914 (78.4%) | 42,412 (21.6%) |
Occupancy by Age of Householder in Area Code 205
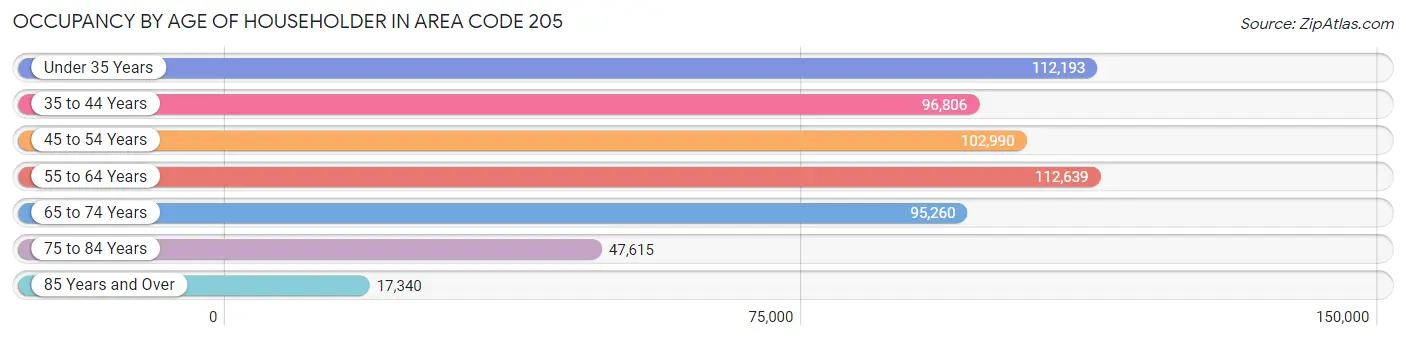
| Age Bracket | # Households | % Households |
| Under 35 Years | 112,193 | 19.2% |
| 35 to 44 Years | 96,806 | 16.6% |
| 45 to 54 Years | 102,990 | 17.6% |
| 55 to 64 Years | 112,639 | 19.3% |
| 65 to 74 Years | 95,260 | 16.3% |
| 75 to 84 Years | 47,615 | 8.1% |
| 85 Years and Over | 17,340 | 3.0% |
| Total | 584,843 | 100.0% |
Housing Finances in Area Code 205
Median Income by Occupancy in Area Code 205
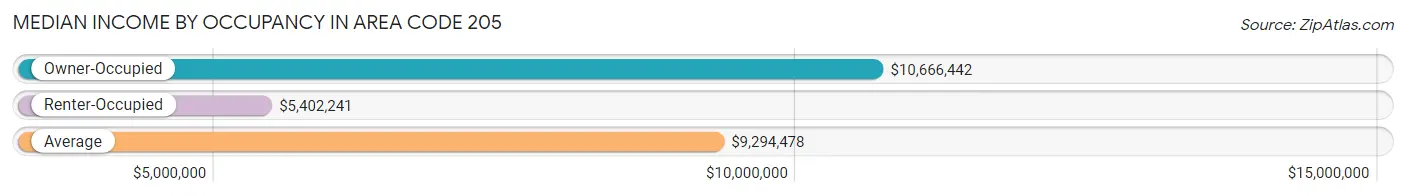
| Occupancy Type | # Households | Median Income |
| Owner-Occupied | 407,803 (69.7%) | $10,666,442 |
| Renter-Occupied | 177,040 (30.3%) | $5,402,241 |
| Average | 584,843 (100.0%) | $9,294,478 |
Occupancy by Householder Income Bracket in Area Code 205
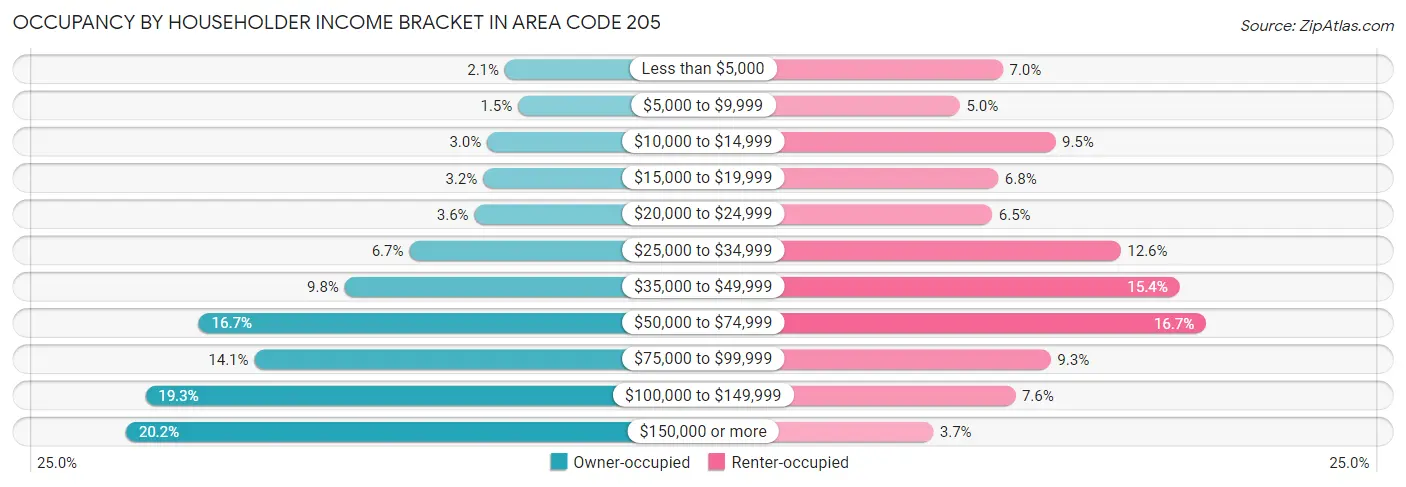
| Income Bracket | Owner-occupied | Renter-occupied |
| Less than $5,000 | 8,692 (2.1%) | 12,390 (7.0%) |
| $5,000 to $9,999 | 6,130 (1.5%) | 8,769 (5.0%) |
| $10,000 to $14,999 | 12,157 (3.0%) | 16,813 (9.5%) |
| $15,000 to $19,999 | 12,916 (3.2%) | 12,005 (6.8%) |
| $20,000 to $24,999 | 14,589 (3.6%) | 11,491 (6.5%) |
| $25,000 to $34,999 | 27,230 (6.7%) | 22,316 (12.6%) |
| $35,000 to $49,999 | 39,791 (9.8%) | 27,318 (15.4%) |
| $50,000 to $74,999 | 68,161 (16.7%) | 29,551 (16.7%) |
| $75,000 to $99,999 | 57,319 (14.1%) | 16,433 (9.3%) |
| $100,000 to $149,999 | 78,507 (19.3%) | 13,431 (7.6%) |
| $150,000 or more | 82,311 (20.2%) | 6,523 (3.7%) |
| Total | 407,803 (100.0%) | 177,040 (100.0%) |
Monthly Housing Cost Tiers in Area Code 205
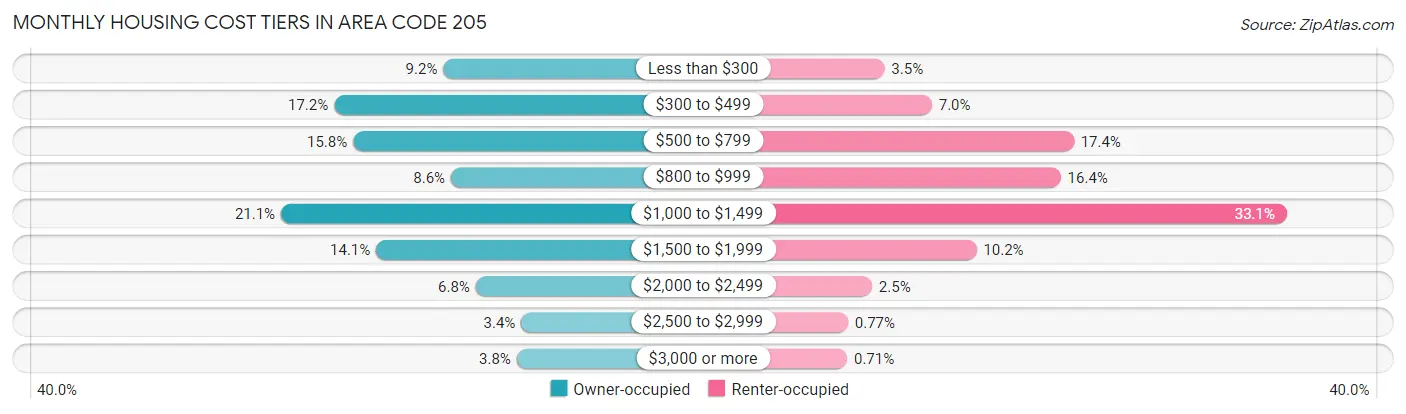
| Monthly Cost | Owner-occupied | Renter-occupied |
| Less than $300 | 37,396 (9.2%) | 6,124 (3.5%) |
| $300 to $499 | 70,202 (17.2%) | 12,296 (7.0%) |
| $500 to $799 | 64,461 (15.8%) | 30,802 (17.4%) |
| $800 to $999 | 35,068 (8.6%) | 29,110 (16.4%) |
| $1,000 to $1,499 | 86,136 (21.1%) | 58,575 (33.1%) |
| $1,500 to $1,999 | 57,557 (14.1%) | 18,127 (10.2%) |
| $2,000 to $2,499 | 27,654 (6.8%) | 4,505 (2.5%) |
| $2,500 to $2,999 | 13,988 (3.4%) | 1,359 (0.8%) |
| $3,000 or more | 15,341 (3.8%) | 1,259 (0.7%) |
| Total | 407,803 (100.0%) | 177,040 (100.0%) |
Physical Housing Characteristics in Area Code 205
Housing Structures in Area Code 205
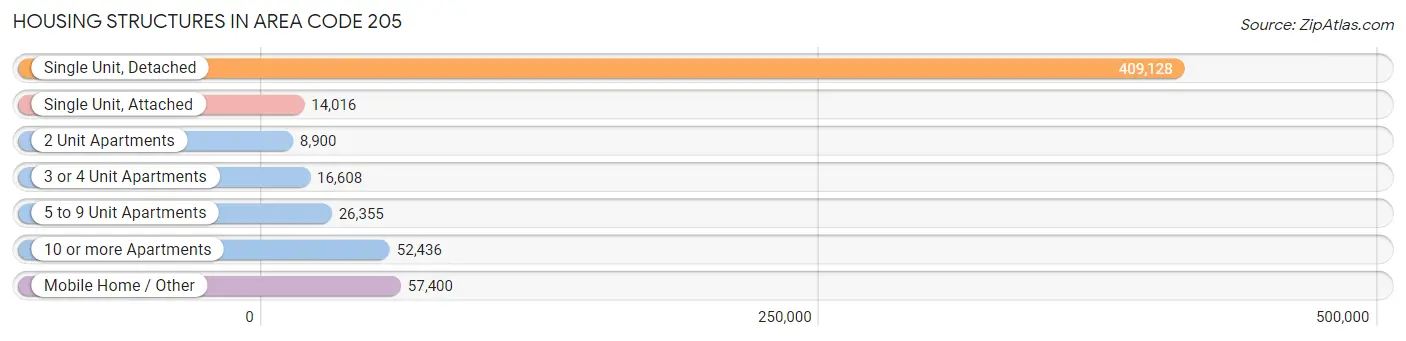
| Structure Type | # Housing Units | % Housing Units |
| Single Unit, Detached | 409,128 | 70.0% |
| Single Unit, Attached | 14,016 | 2.4% |
| 2 Unit Apartments | 8,900 | 1.5% |
| 3 or 4 Unit Apartments | 16,608 | 2.8% |
| 5 to 9 Unit Apartments | 26,355 | 4.5% |
| 10 or more Apartments | 52,436 | 9.0% |
| Mobile Home / Other | 57,400 | 9.8% |
| Total | 584,843 | 100.0% |
Housing Structures by Occupancy in Area Code 205
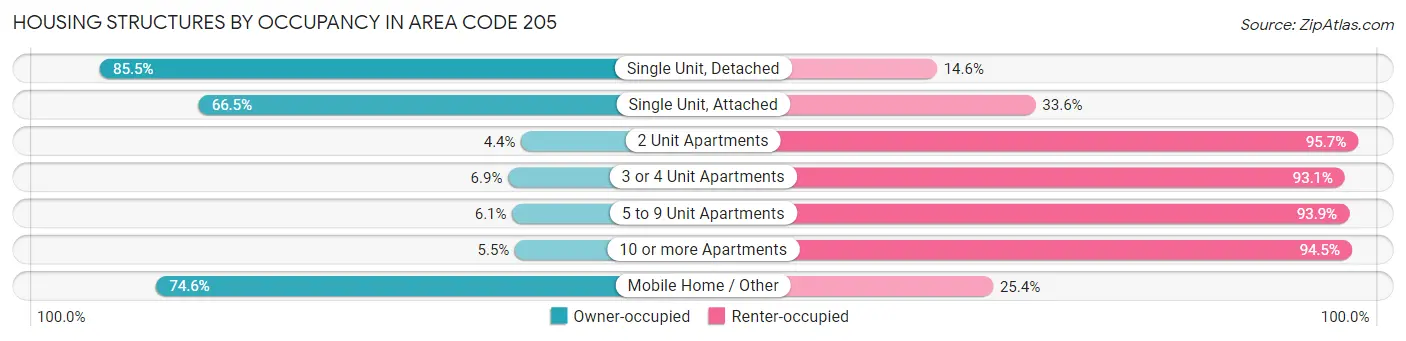
| Structure Type | Owner-occupied | Renter-occupied |
| Single Unit, Detached | 349,618 (85.5%) | 59,510 (14.5%) |
| Single Unit, Attached | 9,314 (66.4%) | 4,702 (33.6%) |
| 2 Unit Apartments | 387 (4.3%) | 8,513 (95.7%) |
| 3 or 4 Unit Apartments | 1,143 (6.9%) | 15,465 (93.1%) |
| 5 to 9 Unit Apartments | 1,604 (6.1%) | 24,751 (93.9%) |
| 10 or more Apartments | 2,907 (5.5%) | 49,529 (94.5%) |
| Mobile Home / Other | 42,830 (74.6%) | 14,570 (25.4%) |
| Total | 407,803 (69.7%) | 177,040 (30.3%) |
Housing Structures by Number of Rooms in Area Code 205
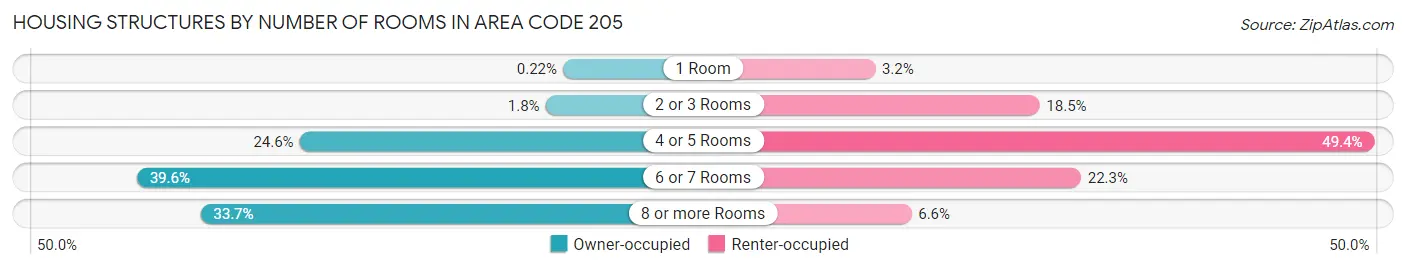
| Number of Rooms | Owner-occupied | Renter-occupied |
| 1 Room | 900 (0.2%) | 5,742 (3.2%) |
| 2 or 3 Rooms | 7,454 (1.8%) | 32,657 (18.4%) |
| 4 or 5 Rooms | 100,258 (24.6%) | 87,513 (49.4%) |
| 6 or 7 Rooms | 161,596 (39.6%) | 39,447 (22.3%) |
| 8 or more Rooms | 137,595 (33.7%) | 11,681 (6.6%) |
| Total | 407,803 (100.0%) | 177,040 (100.0%) |
Housing Structure by Heating Type in Area Code 205
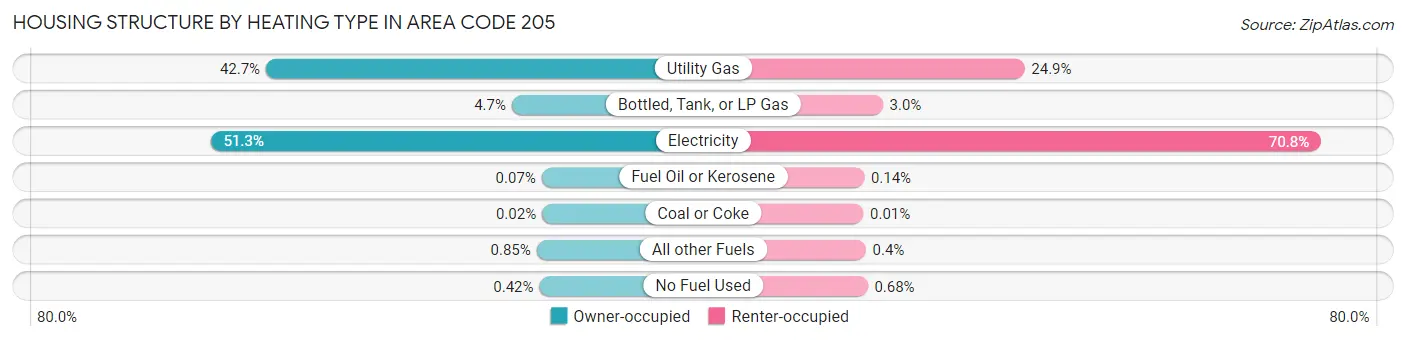
| Heating Type | Owner-occupied | Renter-occupied |
| Utility Gas | 174,108 (42.7%) | 44,158 (24.9%) |
| Bottled, Tank, or LP Gas | 19,102 (4.7%) | 5,354 (3.0%) |
| Electricity | 209,031 (51.3%) | 125,344 (70.8%) |
| Fuel Oil or Kerosene | 281 (0.1%) | 256 (0.1%) |
| Coal or Coke | 82 (0.0%) | 9 (0.0%) |
| All other Fuels | 3,472 (0.9%) | 716 (0.4%) |
| No Fuel Used | 1,727 (0.4%) | 1,203 (0.7%) |
| Total | 407,803 (100.0%) | 177,040 (100.0%) |
Household Vehicle Usage in Area Code 205
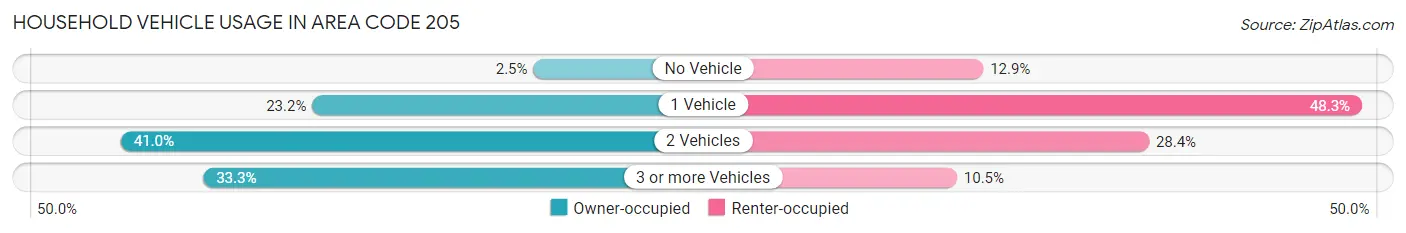
| Vehicles per Household | Owner-occupied | Renter-occupied |
| No Vehicle | 10,232 (2.5%) | 22,859 (12.9%) |
| 1 Vehicle | 94,409 (23.2%) | 85,435 (48.3%) |
| 2 Vehicles | 167,294 (41.0%) | 50,237 (28.4%) |
| 3 or more Vehicles | 135,868 (33.3%) | 18,509 (10.4%) |
| Total | 407,803 (100.0%) | 177,040 (100.0%) |
Real Estate & Mortgages in Area Code 205
Real Estate and Mortgage Overview in Area Code 205
| Characteristic | Without Mortgage | With Mortgage |
| Housing Units | 170,242 | 237,561 |
| Median Property Value | $23,023,900 | $27,961,900 |
| Median Household Income | $8,279,929 | $61,131 |
| Monthly Housing Costs | $67,159 | $14,941 |
| Real Estate Taxes | $104,793 | $25,803 |
Property Value by Mortgage Status in Area Code 205
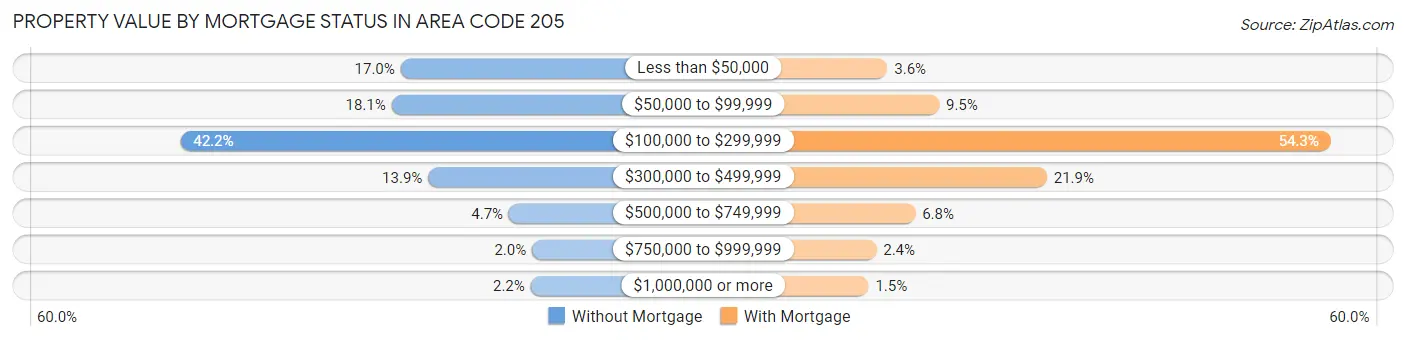
| Property Value | Without Mortgage | With Mortgage |
| Less than $50,000 | 28,986 (17.0%) | 8,615 (3.6%) |
| $50,000 to $99,999 | 30,741 (18.1%) | 22,668 (9.5%) |
| $100,000 to $299,999 | 71,850 (42.2%) | 129,029 (54.3%) |
| $300,000 to $499,999 | 23,637 (13.9%) | 51,930 (21.9%) |
| $500,000 to $749,999 | 7,910 (4.6%) | 16,191 (6.8%) |
| $750,000 to $999,999 | 3,421 (2.0%) | 5,619 (2.4%) |
| $1,000,000 or more | 3,697 (2.2%) | 3,509 (1.5%) |
| Total | 170,242 (100.0%) | 237,561 (100.0%) |
Household Income by Mortgage Status in Area Code 205
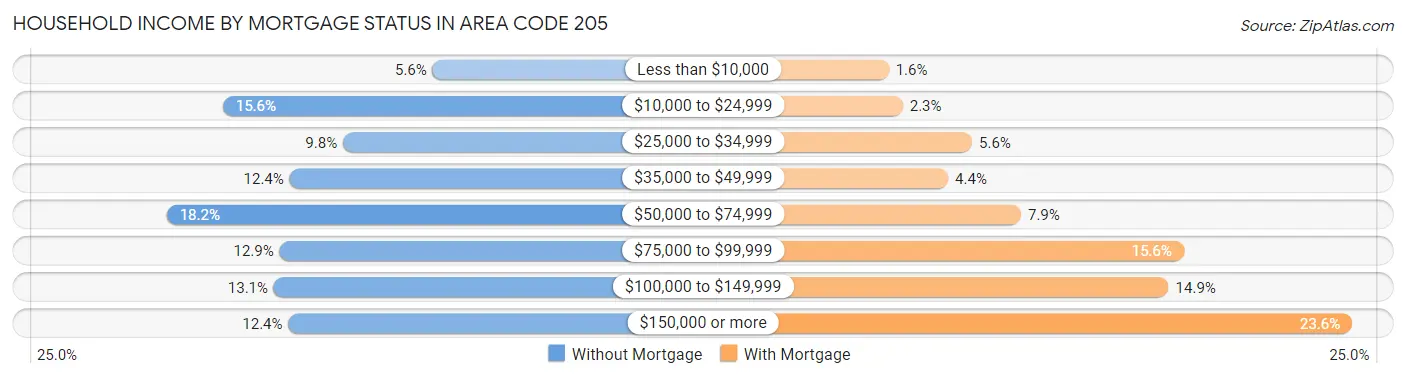
| Household Income | Without Mortgage | With Mortgage |
| Less than $10,000 | 9,486 (5.6%) | 3,764 (1.6%) |
| $10,000 to $24,999 | 26,483 (15.6%) | 5,336 (2.2%) |
| $25,000 to $34,999 | 16,757 (9.8%) | 13,179 (5.6%) |
| $35,000 to $49,999 | 21,072 (12.4%) | 10,473 (4.4%) |
| $50,000 to $74,999 | 31,028 (18.2%) | 18,719 (7.9%) |
| $75,000 to $99,999 | 21,891 (12.9%) | 37,133 (15.6%) |
| $100,000 to $149,999 | 22,345 (13.1%) | 35,428 (14.9%) |
| $150,000 or more | 21,180 (12.4%) | 56,162 (23.6%) |
| Total | 170,242 (100.0%) | 237,561 (100.0%) |
Property Value to Household Income Ratio in Area Code 205
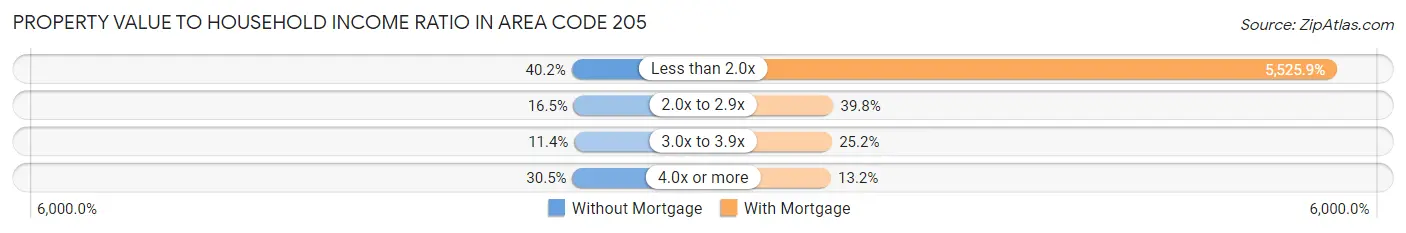
| Value-to-Income Ratio | Without Mortgage | With Mortgage |
| Less than 2.0x | 68,375 (40.2%) | 13,127,451 (5,525.9%) |
| 2.0x to 2.9x | 28,005 (16.5%) | 94,634 (39.8%) |
| 3.0x to 3.9x | 19,392 (11.4%) | 59,749 (25.2%) |
| 4.0x or more | 51,934 (30.5%) | 31,328 (13.2%) |
| Total | 170,242 (100.0%) | 237,561 (100.0%) |
Real Estate Taxes by Mortgage Status in Area Code 205
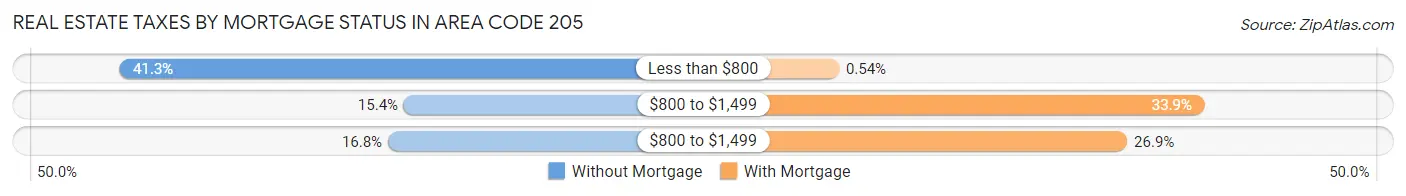
| Property Taxes | Without Mortgage | With Mortgage |
| Less than $800 | 70,287 (41.3%) | 1,292 (0.5%) |
| $800 to $1,499 | 26,143 (15.4%) | 80,431 (33.9%) |
| $800 to $1,499 | 28,637 (16.8%) | 63,809 (26.9%) |
| Total | 170,242 (100.0%) | 237,561 (100.0%) |
Health & Disability in Area Code 205
Health Insurance Coverage by Age in Area Code 205
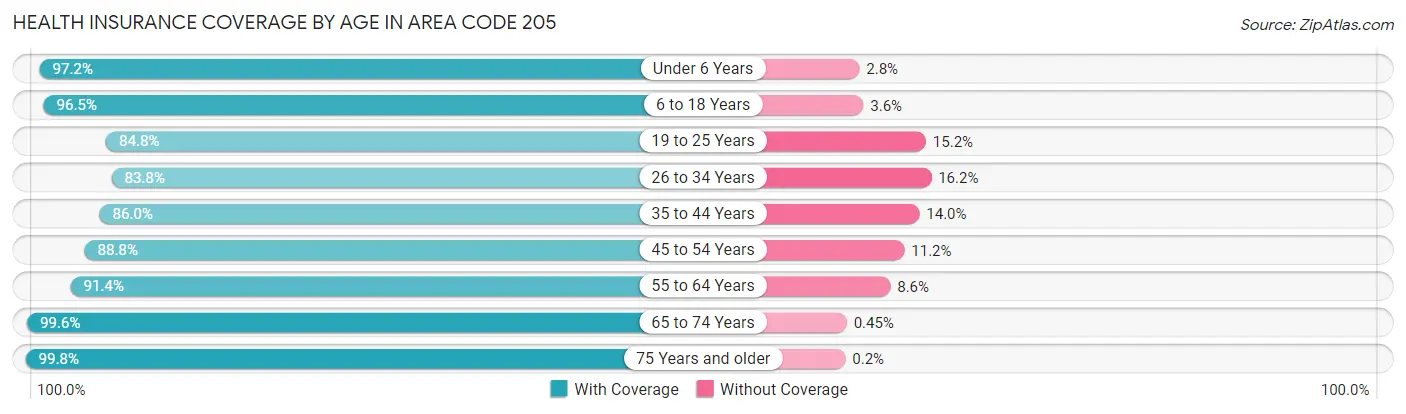
| Age Bracket | With Coverage | Without Coverage |
| Under 6 Years | 104,929 (97.2%) | 3,039 (2.8%) |
| 6 to 18 Years | 249,959 (96.5%) | 9,212 (3.5%) |
| 19 to 25 Years | 128,172 (84.8%) | 23,006 (15.2%) |
| 26 to 34 Years | 150,992 (83.8%) | 29,212 (16.2%) |
| 35 to 44 Years | 163,712 (86.0%) | 26,654 (14.0%) |
| 45 to 54 Years | 165,922 (88.8%) | 20,926 (11.2%) |
| 55 to 64 Years | 176,144 (91.4%) | 16,530 (8.6%) |
| 65 to 74 Years | 150,118 (99.6%) | 676 (0.4%) |
| 75 Years and older | 96,259 (99.8%) | 195 (0.2%) |
| Total | 1,386,207 (91.5%) | 129,450 (8.5%) |
Health Insurance Coverage by Citizenship Status in Area Code 205
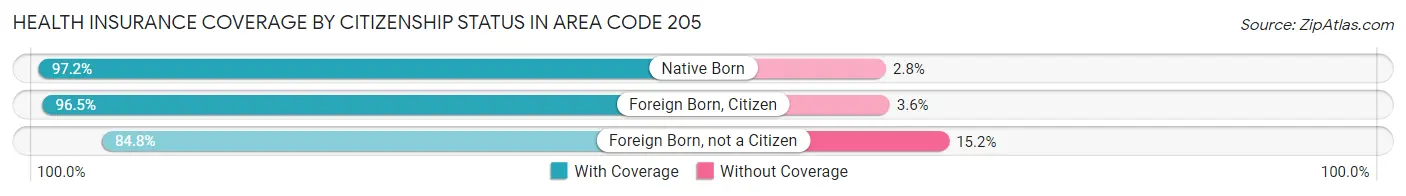
| Citizenship Status | With Coverage | Without Coverage |
| Native Born | 104,929 (97.2%) | 3,039 (2.8%) |
| Foreign Born, Citizen | 249,959 (96.5%) | 9,212 (3.5%) |
| Foreign Born, not a Citizen | 128,172 (84.8%) | 23,006 (15.2%) |
Health Insurance Coverage by Household Income in Area Code 205
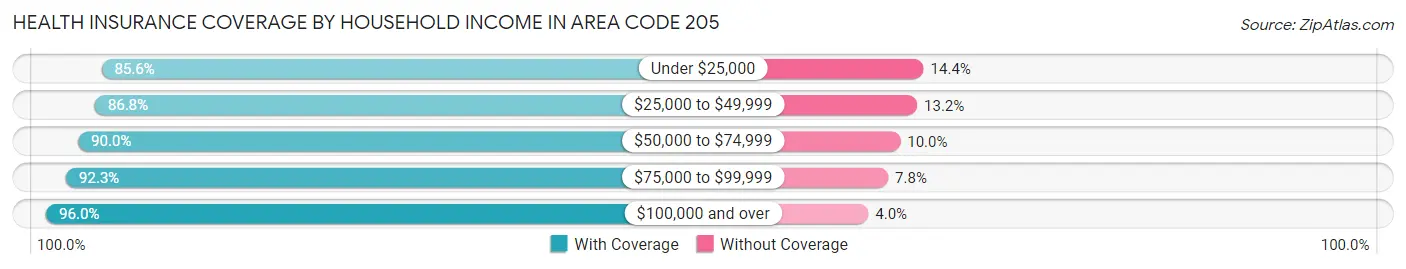
| Household Income | With Coverage | Without Coverage |
| Under $25,000 | 180,307 (85.6%) | 30,334 (14.4%) |
| $25,000 to $49,999 | 224,971 (86.8%) | 34,122 (13.2%) |
| $50,000 to $74,999 | 215,037 (90.0%) | 23,938 (10.0%) |
| $75,000 to $99,999 | 188,242 (92.2%) | 15,805 (7.7%) |
| $100,000 and over | 552,087 (96.0%) | 23,215 (4.0%) |
Public vs Private Health Insurance Coverage by Age in Area Code 205
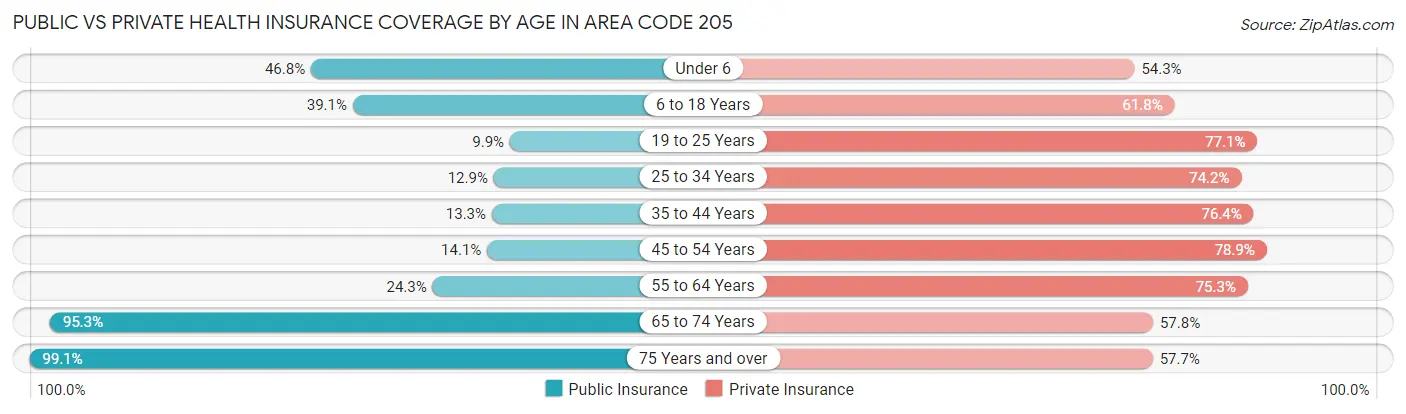
| Age Bracket | Public Insurance | Private Insurance |
| Under 6 | 50,574 (46.8%) | 58,645 (54.3%) |
| 6 to 18 Years | 101,280 (39.1%) | 160,058 (61.8%) |
| 19 to 25 Years | 14,997 (9.9%) | 116,574 (77.1%) |
| 25 to 34 Years | 23,276 (12.9%) | 133,630 (74.2%) |
| 35 to 44 Years | 25,259 (13.3%) | 145,495 (76.4%) |
| 45 to 54 Years | 26,413 (14.1%) | 147,349 (78.9%) |
| 55 to 64 Years | 46,786 (24.3%) | 145,156 (75.3%) |
| 65 to 74 Years | 143,723 (95.3%) | 87,097 (57.8%) |
| 75 Years and over | 95,598 (99.1%) | 55,662 (57.7%) |
| Total | 527,906 (34.8%) | 1,049,666 (69.3%) |
Disability Status by Sex by Age in Area Code 205
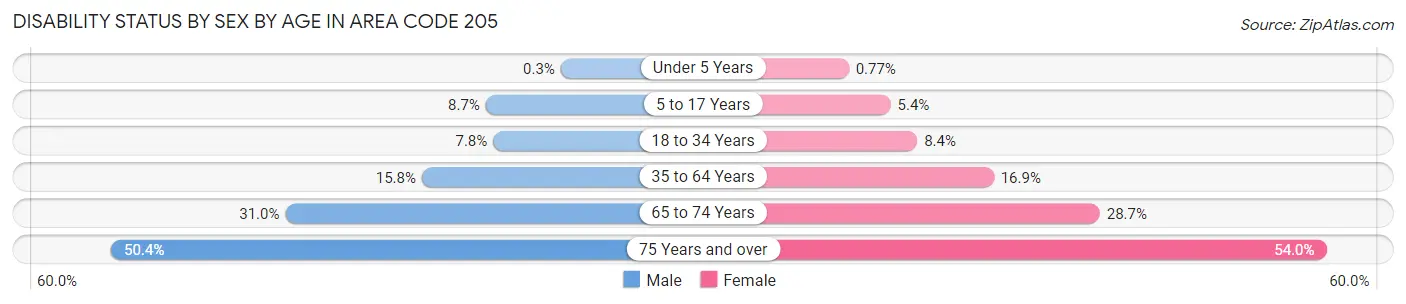
| Age Bracket | Male | Female |
| Under 5 Years | 135 (0.3%) | 340 (0.8%) |
| 5 to 17 Years | 11,180 (8.6%) | 6,683 (5.4%) |
| 18 to 34 Years | 13,622 (7.8%) | 15,370 (8.4%) |
| 35 to 64 Years | 43,453 (15.8%) | 49,801 (16.9%) |
| 65 to 74 Years | 21,424 (31.0%) | 23,452 (28.7%) |
| 75 Years and over | 19,249 (50.4%) | 31,426 (54.0%) |
Disability Class by Sex by Age in Area Code 205
Disability Class: Hearing Difficulty
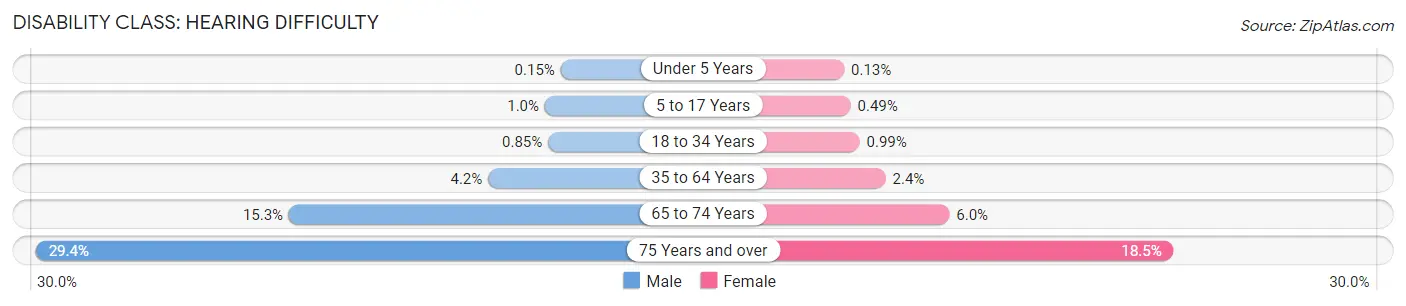
| Age Bracket | Male | Female |
| Under 5 Years | 67 (0.2%) | 58 (0.1%) |
| 5 to 17 Years | 1,333 (1.0%) | 607 (0.5%) |
| 18 to 34 Years | 1,474 (0.9%) | 1,810 (1.0%) |
| 35 to 64 Years | 11,542 (4.2%) | 7,175 (2.4%) |
| 65 to 74 Years | 10,571 (15.3%) | 4,887 (6.0%) |
| 75 Years and over | 11,226 (29.4%) | 10,758 (18.5%) |
Disability Class: Vision Difficulty
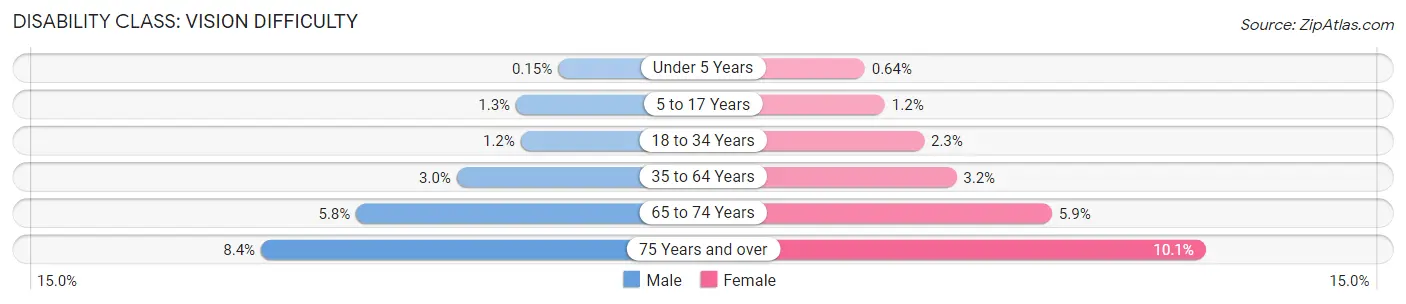
| Age Bracket | Male | Female |
| Under 5 Years | 68 (0.2%) | 282 (0.6%) |
| 5 to 17 Years | 1,706 (1.3%) | 1,474 (1.2%) |
| 18 to 34 Years | 2,080 (1.2%) | 4,181 (2.3%) |
| 35 to 64 Years | 8,193 (3.0%) | 9,388 (3.2%) |
| 65 to 74 Years | 3,992 (5.8%) | 4,775 (5.9%) |
| 75 Years and over | 3,217 (8.4%) | 5,901 (10.1%) |
Disability Class: Cognitive Difficulty
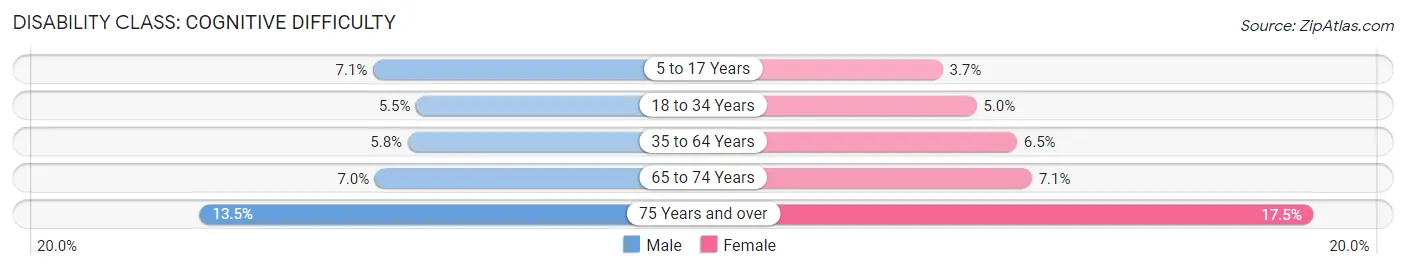
| Age Bracket | Male | Female |
| 5 to 17 Years | 9,118 (7.1%) | 4,589 (3.7%) |
| 18 to 34 Years | 9,507 (5.5%) | 9,140 (5.0%) |
| 35 to 64 Years | 15,908 (5.8%) | 19,132 (6.5%) |
| 65 to 74 Years | 4,837 (7.0%) | 5,753 (7.0%) |
| 75 Years and over | 5,157 (13.5%) | 10,198 (17.5%) |
Disability Class: Ambulatory Difficulty
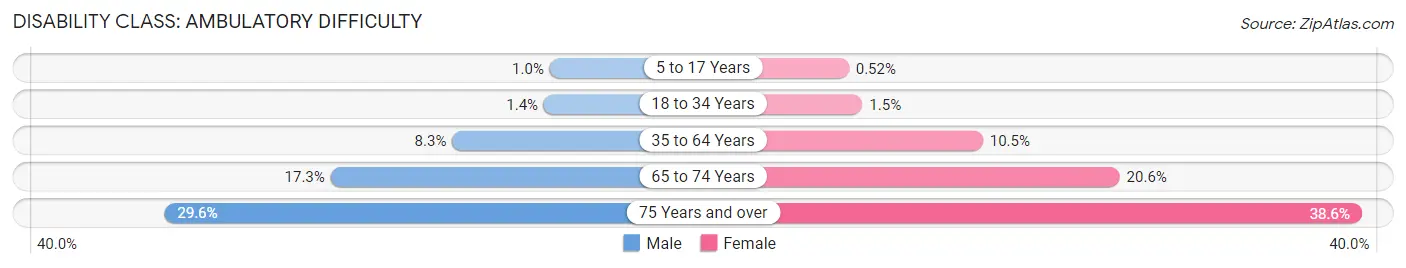
| Age Bracket | Male | Female |
| 5 to 17 Years | 1,311 (1.0%) | 637 (0.5%) |
| 18 to 34 Years | 2,511 (1.4%) | 2,798 (1.5%) |
| 35 to 64 Years | 22,740 (8.3%) | 30,806 (10.5%) |
| 65 to 74 Years | 11,954 (17.3%) | 16,840 (20.6%) |
| 75 Years and over | 11,320 (29.6%) | 22,479 (38.6%) |
Disability Class: Self-Care Difficulty
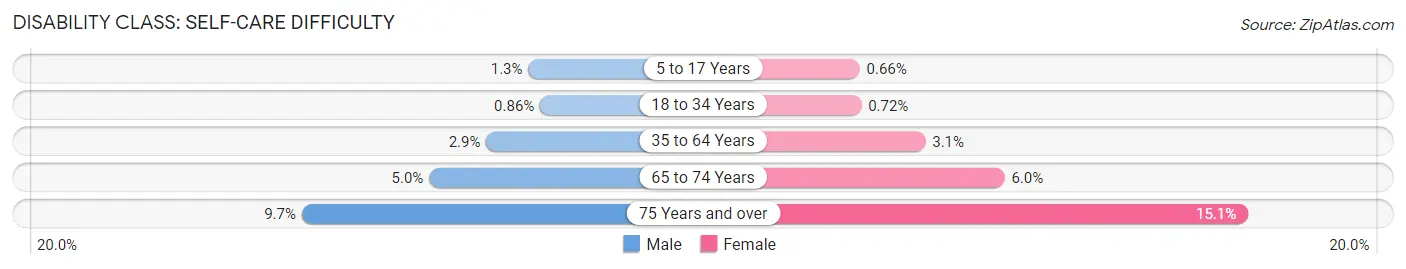
| Age Bracket | Male | Female |
| 5 to 17 Years | 1,679 (1.3%) | 807 (0.7%) |
| 18 to 34 Years | 1,497 (0.9%) | 1,323 (0.7%) |
| 35 to 64 Years | 7,885 (2.9%) | 9,123 (3.1%) |
| 65 to 74 Years | 3,442 (5.0%) | 4,933 (6.0%) |
| 75 Years and over | 3,712 (9.7%) | 8,785 (15.1%) |
Technology Access in Area Code 205
Computing Device Access in Area Code 205
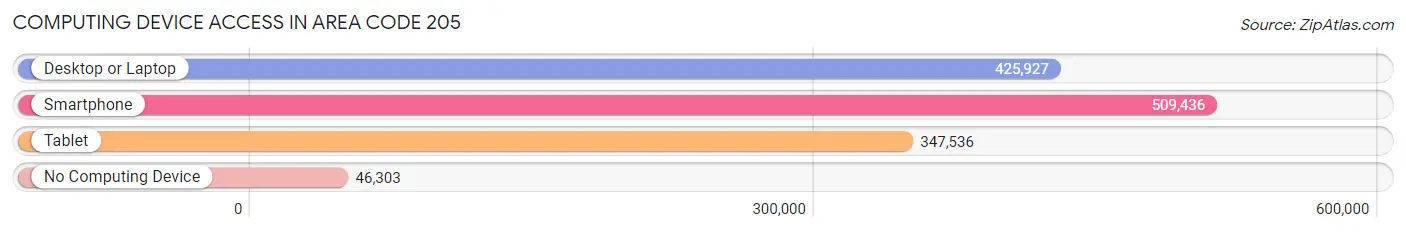
| Device Type | # Households | % Households |
| Desktop or Laptop | 425,927 | 72.8% |
| Smartphone | 509,436 | 87.1% |
| Tablet | 347,536 | 59.4% |
| No Computing Device | 46,303 | 7.9% |
| Total | 584,843 | 100.0% |
Internet Access in Area Code 205
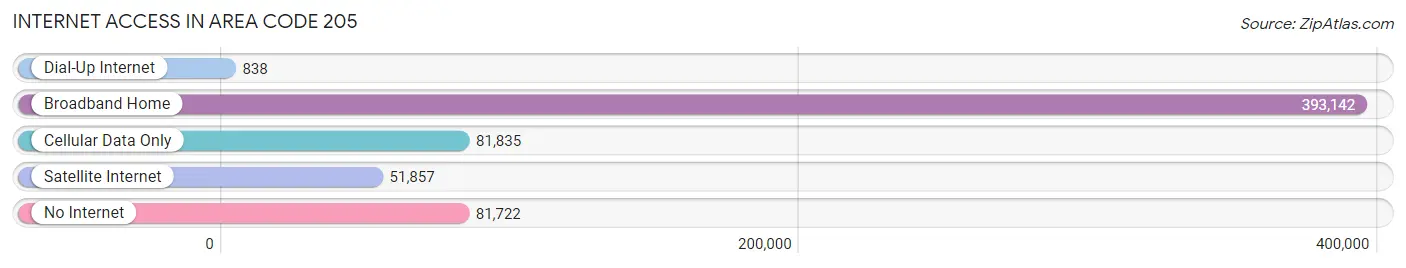
| Internet Type | # Households | % Households |
| Dial-Up Internet | 838 | 0.1% |
| Broadband Home | 393,142 | 67.2% |
| Cellular Data Only | 81,835 | 14.0% |
| Satellite Internet | 51,857 | 8.9% |
| No Internet | 81,722 | 14.0% |
| Total | 584,843 | 100.0% |
Area Code 205 Summary
Area code 205 is a telephone area code that serves the central and western regions of the state of Alabama in the United States. The area code encompasses a diverse range of geographic, social, economic, and demographic characteristics.
Geographically, area code 205 includes portions of the Appalachian Mountains in the northeastern part of the state and the Black Belt region in the central part of the state. The region is known for its diverse landscape, including rolling hills, forests, and rivers. The area also has several state parks and nature reserves, including the Talladega National Forest and the Cahaba River National Wildlife Refuge.
Socially, the region served by area code 205 is a diverse one, with a mix of ethnicities and cultures. The population is generally friendly and hospitable, with a strong sense of community. The region is home to several universities and colleges, including the University of Alabama, Samford University, and the University of Montevallo. The area also has a vibrant arts and culture scene, with several theaters, museums, and galleries.
Economically, the region served by area code 205 has a mix of industries, including manufacturing, healthcare, education, and agriculture. The area is home to several large corporations, including the Regions Financial Corporation and the Mercedes-Benz U.S. International plant. The region has a relatively low median household income of approximately $51,000.
Demographically, the region served by area code 205 is diverse, with a mix of ethnicities and cultures. The largest ethnic group is White, followed by African American and Hispanic/Latino. The region has a relatively low number of foreign-born residents, with immigrants making up approximately 4% of the population. The area is known for its Southern hospitality and its rich history, including the Civil Rights Movement.
In conclusion, area code 205 serves a diverse region of central and western Alabama, with a mix of urban, suburban, and rural areas. The region is known for its friendly and hospitable population, diverse economy, and multicultural society.
Common Questions
What is Per Capita Income in Area Code 205?
Per Capita income in Area Code 205 is $30,259.
What is the Median Family Income in Area Code 205?
Median Family Income in Area Code 205 is $75,808.
What is the Median Household income in Area Code 205?
Median Household Income in Area Code 205 is $59,200.
What is Income or Wage Gap in Area Code 205?
Income or Wage Gap in Area Code 205 is 29.3%.
Women in Area Code 205 earn 70.7 cents for every dollar earned by a man.
What is Family Income Deficit in Area Code 205?
Family Income Deficit in Area Code 205 is $10,669.
Families that are below poverty line in Area Code 205 earn $10,669 less on average than the poverty threshold level.
What is Inequality or Gini Index in Area Code 205?
Inequality or Gini Index in Area Code 205 is 71.43.
What is the Total Population of Area Code 205?
Total Population of Area Code 205 is 1,535,361.
What is the Total Male Population of Area Code 205?
Total Male Population of Area Code 205 is 743,814.
What is the Total Female Population of Area Code 205?
Total Female Population of Area Code 205 is 791,547.
What is the Ratio of Males per 100 Females in Area Code 205?
There are 93.97 Males per 100 Females in Area Code 205.
What is the Ratio of Females per 100 Males in Area Code 205?
There are 106.42 Females per 100 Males in Area Code 205.
What is the Median Population Age in Area Code 205?
Median Population Age in Area Code 205 is 40.7 Years.
What is the Average Family Size in Area Code 205
Average Family Size in Area Code 205 is 3.2 People.
What is the Average Household Size in Area Code 205
Average Household Size in Area Code 205 is 2.6 People.
How Large is the Labor Force in Area Code 205?
There are 689,066 People in the Labor Forcein in Area Code 205.
What is the Percentage of People in the Labor Force in Area Code 205?
55.9% of People are in the Labor Force in Area Code 205.
What is the Unemployment Rate in Area Code 205?
Unemployment Rate in Area Code 205 is 7.5%.