Hoover, AL Map & Demographics
Hoover Map
Hoover Overview
$52,906
PER CAPITA INCOME
$127,071
AVG FAMILY INCOME
$101,765
AVG HOUSEHOLD INCOME
31.8%
WAGE / INCOME GAP [ % ]
68.2¢/ $1
WAGE / INCOME GAP [ $ ]
$12,172
FAMILY INCOME DEFICIT
0.44
INEQUALITY / GINI INDEX
91,995
TOTAL POPULATION
44,066
MALE POPULATION
47,929
FEMALE POPULATION
91.94
MALES / 100 FEMALES
108.77
FEMALES / 100 MALES
38.3
MEDIAN AGE
3.1
AVG FAMILY SIZE
2.5
AVG HOUSEHOLD SIZE
49,510
LABOR FORCE [ PEOPLE ]
68.4%
PERCENT IN LABOR FORCE
3.9%
UNEMPLOYMENT RATE
Hoover Area Codes
Income in Hoover
Income Overview in Hoover
Per Capita Income in Hoover is $52,906, while median incomes of families and households are $127,071 and $101,765 respectively.
| Characteristic | Number | Measure |
| Per Capita Income | 91,995 | $52,906 |
| Median Family Income | 25,151 | $127,071 |
| Mean Family Income | 25,151 | $157,117 |
| Median Household Income | 36,189 | $101,765 |
| Mean Household Income | 36,189 | $131,259 |
| Income Deficit | 25,151 | $12,172 |
| Wage / Income Gap (%) | 91,995 | 31.75% |
| Wage / Income Gap ($) | 91,995 | 68.25¢ per $1 |
| Gini / Inequality Index | 91,995 | 0.44 |
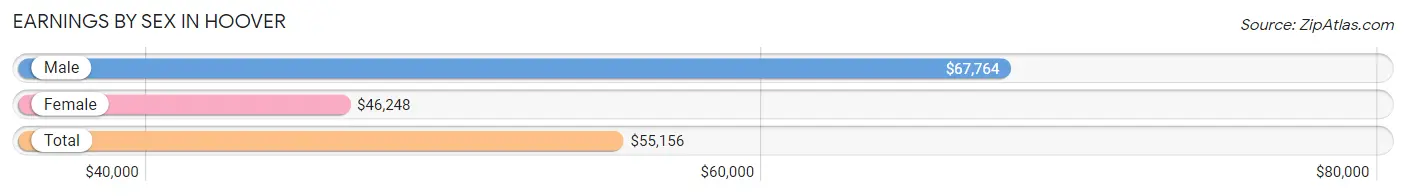
Earnings by Sex in Hoover
Average Earnings in Hoover are $55,156, $67,764 for men and $46,248 for women, a difference of 31.8%.
| Sex | Number | Average Earnings |
| Male | 27,137 (52.7%) | $67,764 |
| Female | 24,311 (47.2%) | $46,248 |
| Total | 51,448 (100.0%) | $55,156 |
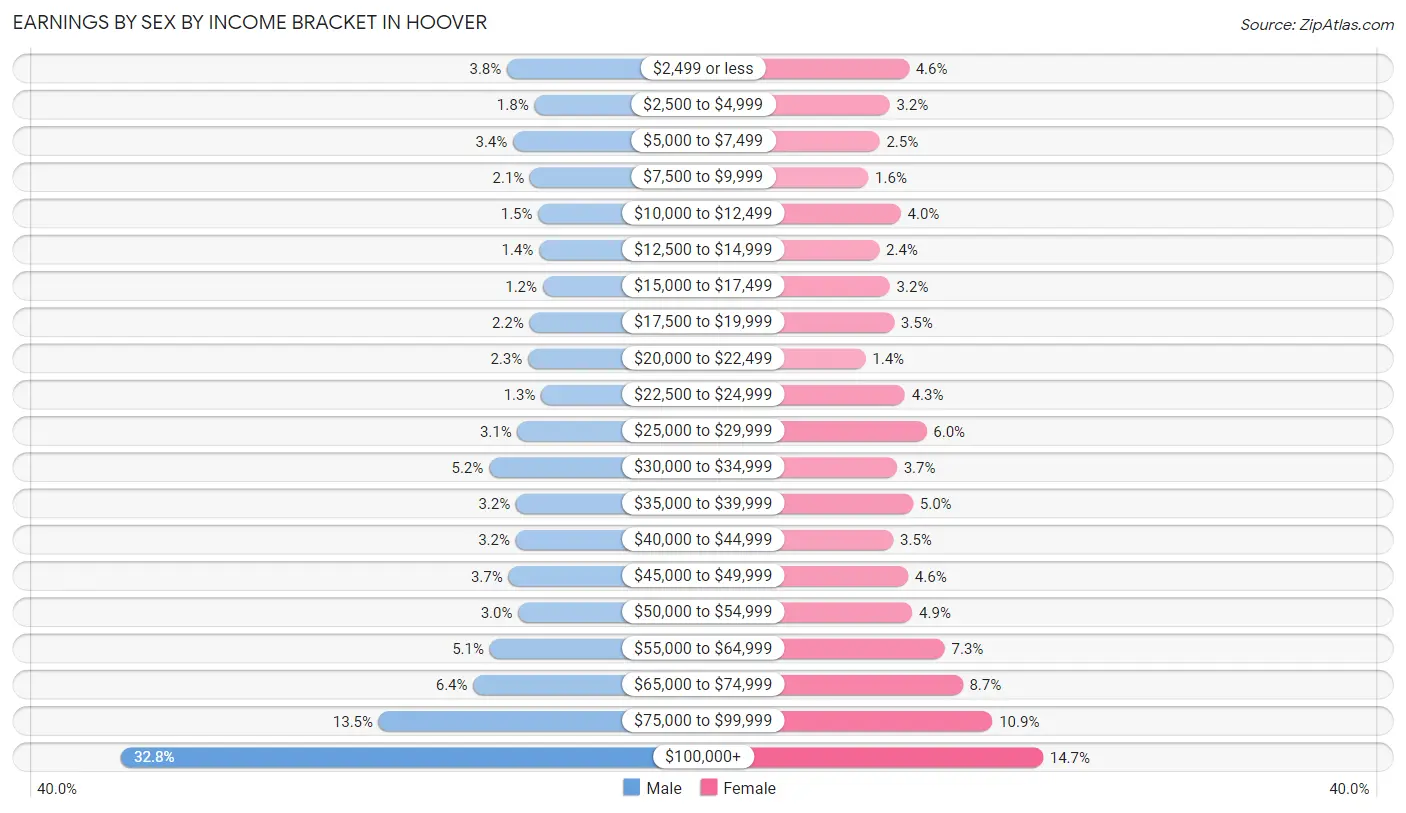
Earnings by Sex by Income Bracket in Hoover
The most common earnings brackets in Hoover are $100,000+ for men (8,890 | 32.8%) and $100,000+ for women (3,571 | 14.7%).
| Income | Male | Female |
| $2,499 or less | 1,042 (3.8%) | 1,128 (4.6%) |
| $2,500 to $4,999 | 485 (1.8%) | 779 (3.2%) |
| $5,000 to $7,499 | 921 (3.4%) | 595 (2.5%) |
| $7,500 to $9,999 | 572 (2.1%) | 388 (1.6%) |
| $10,000 to $12,499 | 407 (1.5%) | 980 (4.0%) |
| $12,500 to $14,999 | 390 (1.4%) | 588 (2.4%) |
| $15,000 to $17,499 | 316 (1.2%) | 780 (3.2%) |
| $17,500 to $19,999 | 585 (2.2%) | 859 (3.5%) |
| $20,000 to $22,499 | 616 (2.3%) | 338 (1.4%) |
| $22,500 to $24,999 | 347 (1.3%) | 1,054 (4.3%) |
| $25,000 to $29,999 | 831 (3.1%) | 1,448 (6.0%) |
| $30,000 to $34,999 | 1,409 (5.2%) | 910 (3.7%) |
| $35,000 to $39,999 | 861 (3.2%) | 1,204 (5.0%) |
| $40,000 to $44,999 | 866 (3.2%) | 844 (3.5%) |
| $45,000 to $49,999 | 1,011 (3.7%) | 1,114 (4.6%) |
| $50,000 to $54,999 | 813 (3.0%) | 1,192 (4.9%) |
| $55,000 to $64,999 | 1,396 (5.1%) | 1,781 (7.3%) |
| $65,000 to $74,999 | 1,728 (6.4%) | 2,108 (8.7%) |
| $75,000 to $99,999 | 3,651 (13.5%) | 2,650 (10.9%) |
| $100,000+ | 8,890 (32.8%) | 3,571 (14.7%) |
| Total | 27,137 (100.0%) | 24,311 (100.0%) |
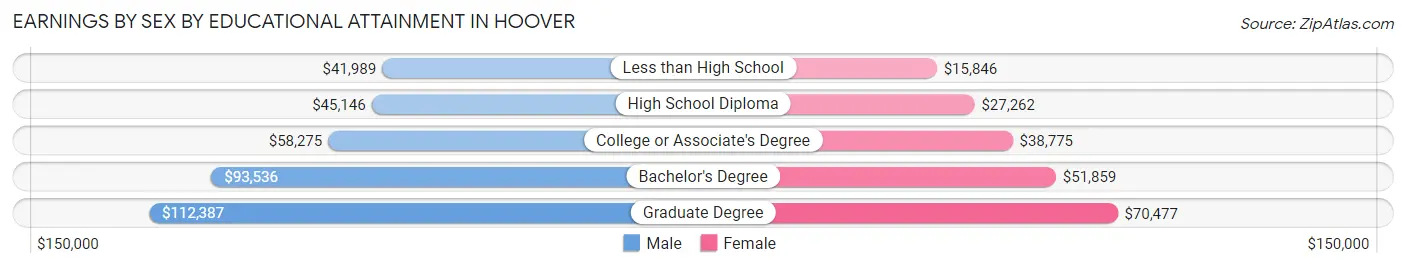
Earnings by Sex by Educational Attainment in Hoover
Average earnings in Hoover are $81,297 for men and $50,511 for women, a difference of 37.9%. Men with an educational attainment of graduate degree enjoy the highest average annual earnings of $112,387, while those with less than high school education earn the least with $41,989. Women with an educational attainment of graduate degree earn the most with the average annual earnings of $70,477, while those with less than high school education have the smallest earnings of $15,846.
| Educational Attainment | Male Income | Female Income |
| Less than High School | $41,989 | $15,846 |
| High School Diploma | $45,146 | $27,262 |
| College or Associate's Degree | $58,275 | $38,775 |
| Bachelor's Degree | $93,536 | $51,859 |
| Graduate Degree | $112,387 | $70,477 |
| Total | $81,297 | $50,511 |
Family Income in Hoover
Family Income Brackets in Hoover
According to the Hoover family income data, there are 5,986 families falling into the $200,000+ income range, which is the most common income bracket and makes up 23.8% of all families. Conversely, the less than $10,000 income bracket is the least frequent group with only 226 families (0.9%) belonging to this category.
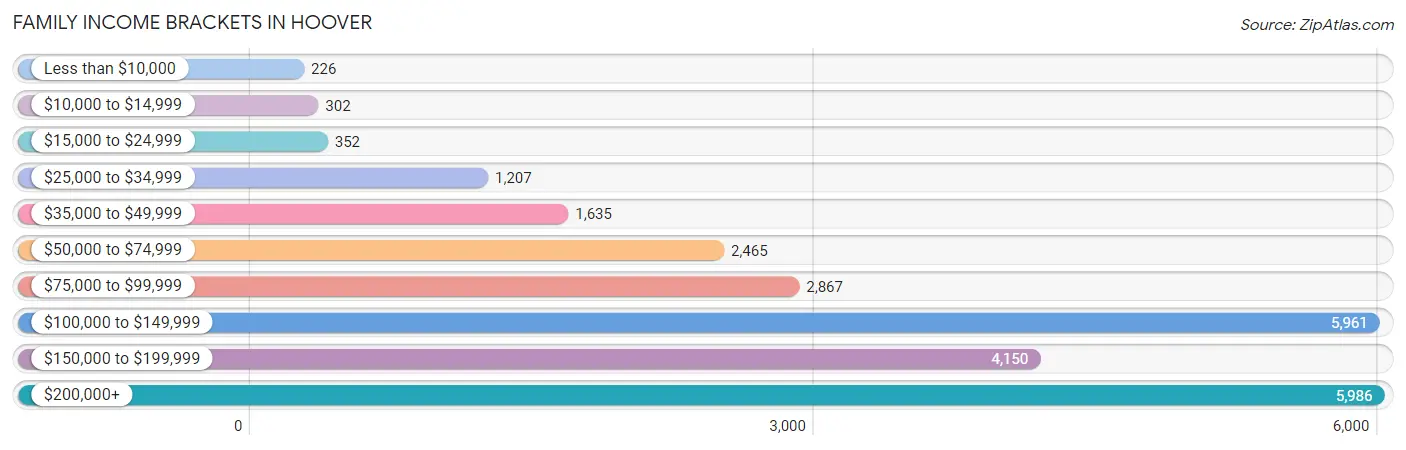
| Income Bracket | # Families | % Families |
| Less than $10,000 | 226 | 0.9% |
| $10,000 to $14,999 | 302 | 1.2% |
| $15,000 to $24,999 | 352 | 1.4% |
| $25,000 to $34,999 | 1,207 | 4.8% |
| $35,000 to $49,999 | 1,635 | 6.5% |
| $50,000 to $74,999 | 2,465 | 9.8% |
| $75,000 to $99,999 | 2,867 | 11.4% |
| $100,000 to $149,999 | 5,961 | 23.7% |
| $150,000 to $199,999 | 4,150 | 16.5% |
| $200,000+ | 5,986 | 23.8% |
Family Income by Famaliy Size in Hoover
7+ person families (186 | 0.7%) account for the highest median family income in Hoover with $169,259 per family, while 2-person families (12,103 | 48.1%) have the highest median income of $52,397 per family member.
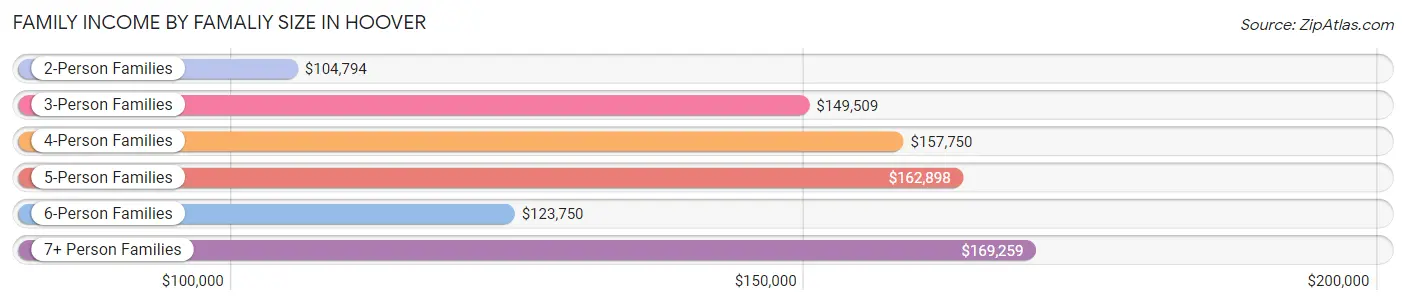
| Income Bracket | # Families | Median Income |
| 2-Person Families | 12,103 (48.1%) | $104,794 |
| 3-Person Families | 5,796 (23.0%) | $149,509 |
| 4-Person Families | 4,937 (19.6%) | $157,750 |
| 5-Person Families | 1,765 (7.0%) | $162,898 |
| 6-Person Families | 364 (1.5%) | $123,750 |
| 7+ Person Families | 186 (0.7%) | $169,259 |
| Total | 25,151 (100.0%) | $127,071 |
Family Income by Number of Earners in Hoover
The median family income in Hoover is $127,071, with families comprising 3+ earners (2,559) having the highest median family income of $163,972, while families with no earners (3,358) have the lowest median family income of $89,890, accounting for 10.2% and 13.4% of families, respectively.
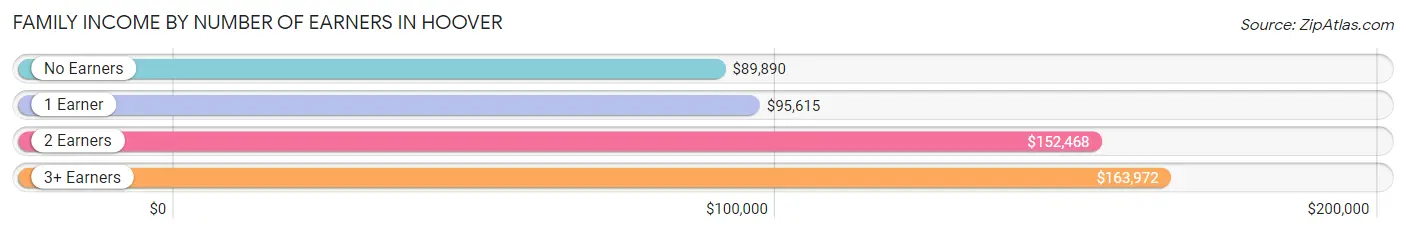
| Number of Earners | # Families | Median Income |
| No Earners | 3,358 (13.4%) | $89,890 |
| 1 Earner | 6,843 (27.2%) | $95,615 |
| 2 Earners | 12,391 (49.3%) | $152,468 |
| 3+ Earners | 2,559 (10.2%) | $163,972 |
| Total | 25,151 (100.0%) | $127,071 |
Household Income in Hoover
Household Income Brackets in Hoover
With 7,310 households falling in the category, the $100,000 to $149,999 income range is the most frequent in Hoover, accounting for 20.2% of all households. In contrast, only 724 households (2.0%) fall into the $10,000 to $14,999 income bracket, making it the least populous group.
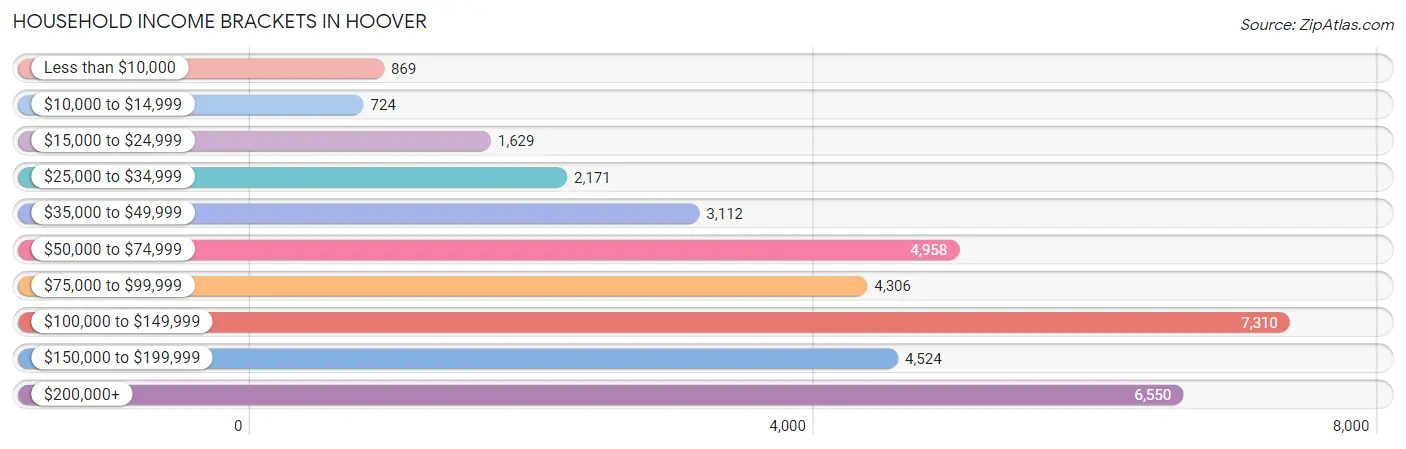
| Income Bracket | # Households | % Households |
| Less than $10,000 | 869 | 2.4% |
| $10,000 to $14,999 | 724 | 2.0% |
| $15,000 to $24,999 | 1,629 | 4.5% |
| $25,000 to $34,999 | 2,171 | 6.0% |
| $35,000 to $49,999 | 3,112 | 8.6% |
| $50,000 to $74,999 | 4,958 | 13.7% |
| $75,000 to $99,999 | 4,306 | 11.9% |
| $100,000 to $149,999 | 7,310 | 20.2% |
| $150,000 to $199,999 | 4,524 | 12.5% |
| $200,000+ | 6,550 | 18.1% |
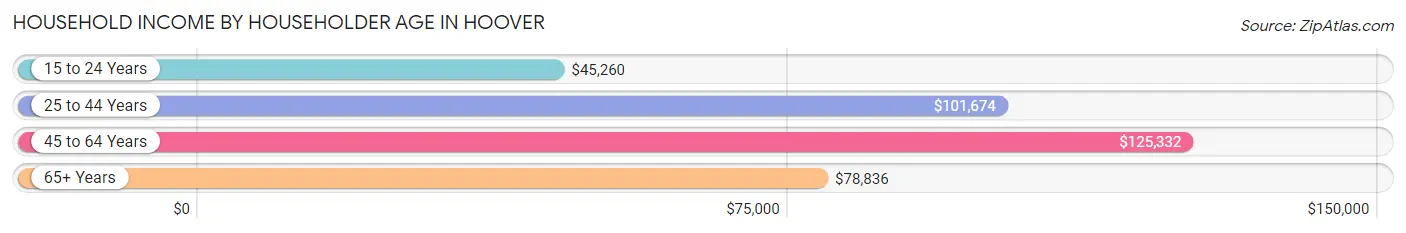
Household Income by Householder Age in Hoover
The median household income in Hoover is $101,765, with the highest median household income of $125,332 found in the 45 to 64 years age bracket for the primary householder. A total of 13,036 households (36.0%) fall into this category. Meanwhile, the 15 to 24 years age bracket for the primary householder has the lowest median household income of $45,260, with 1,105 households (3.0%) in this group.
| Income Bracket | # Households | Median Income |
| 15 to 24 Years | 1,105 (3.0%) | $45,260 |
| 25 to 44 Years | 12,864 (35.5%) | $101,674 |
| 45 to 64 Years | 13,036 (36.0%) | $125,332 |
| 65+ Years | 9,184 (25.4%) | $78,836 |
| Total | 36,189 (100.0%) | $101,765 |
Poverty in Hoover
Income Below Poverty by Sex and Age in Hoover
With 4.6% poverty level for males and 6.2% for females among the residents of Hoover, under 5 year old males and 18 to 24 year old females are the most vulnerable to poverty, with 498 males (17.5%) and 343 females (11.9%) in their respective age groups living below the poverty level.
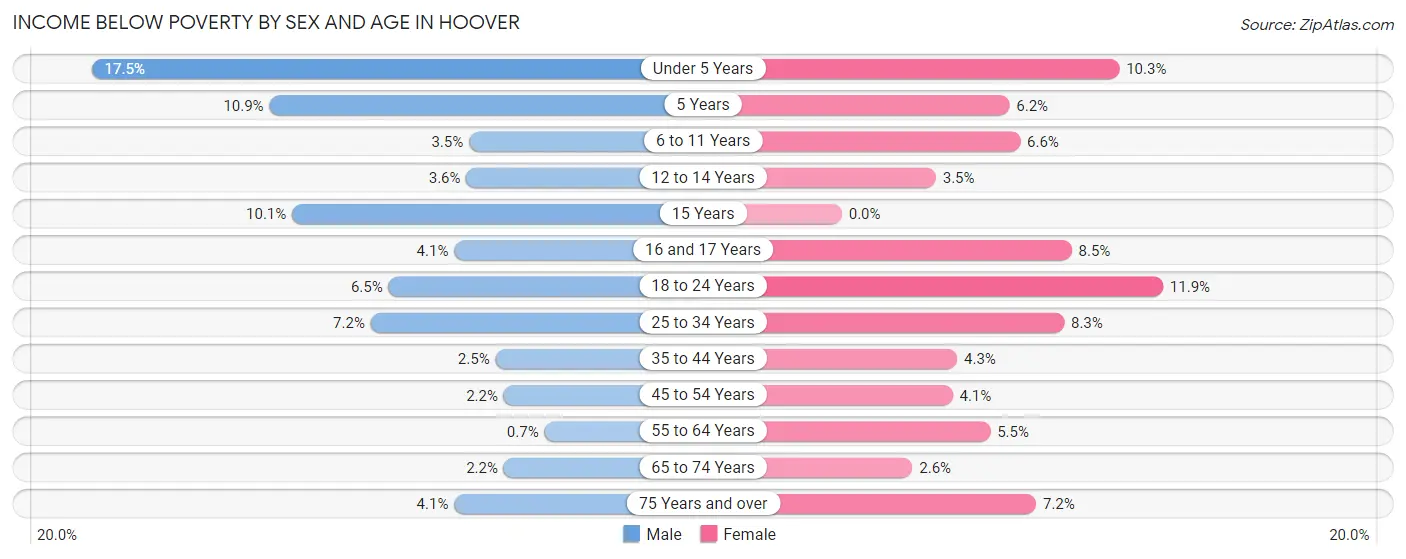
| Age Bracket | Male | Female |
| Under 5 Years | 498 (17.5%) | 378 (10.3%) |
| 5 Years | 49 (10.9%) | 45 (6.2%) |
| 6 to 11 Years | 147 (3.5%) | 219 (6.6%) |
| 12 to 14 Years | 59 (3.6%) | 57 (3.5%) |
| 15 Years | 43 (10.1%) | 0 (0.0%) |
| 16 and 17 Years | 57 (4.1%) | 105 (8.5%) |
| 18 to 24 Years | 241 (6.5%) | 343 (11.9%) |
| 25 to 34 Years | 440 (7.1%) | 531 (8.3%) |
| 35 to 44 Years | 151 (2.5%) | 292 (4.3%) |
| 45 to 54 Years | 130 (2.2%) | 273 (4.1%) |
| 55 to 64 Years | 33 (0.7%) | 304 (5.5%) |
| 65 to 74 Years | 85 (2.2%) | 114 (2.6%) |
| 75 Years and over | 102 (4.1%) | 269 (7.2%) |
| Total | 2,035 (4.6%) | 2,930 (6.2%) |
Income Above Poverty by Sex and Age in Hoover
According to the poverty statistics in Hoover, males aged 55 to 64 years and females aged 15 years are the age groups that are most secure financially, with 99.3% of males and 100.0% of females in these age groups living above the poverty line.
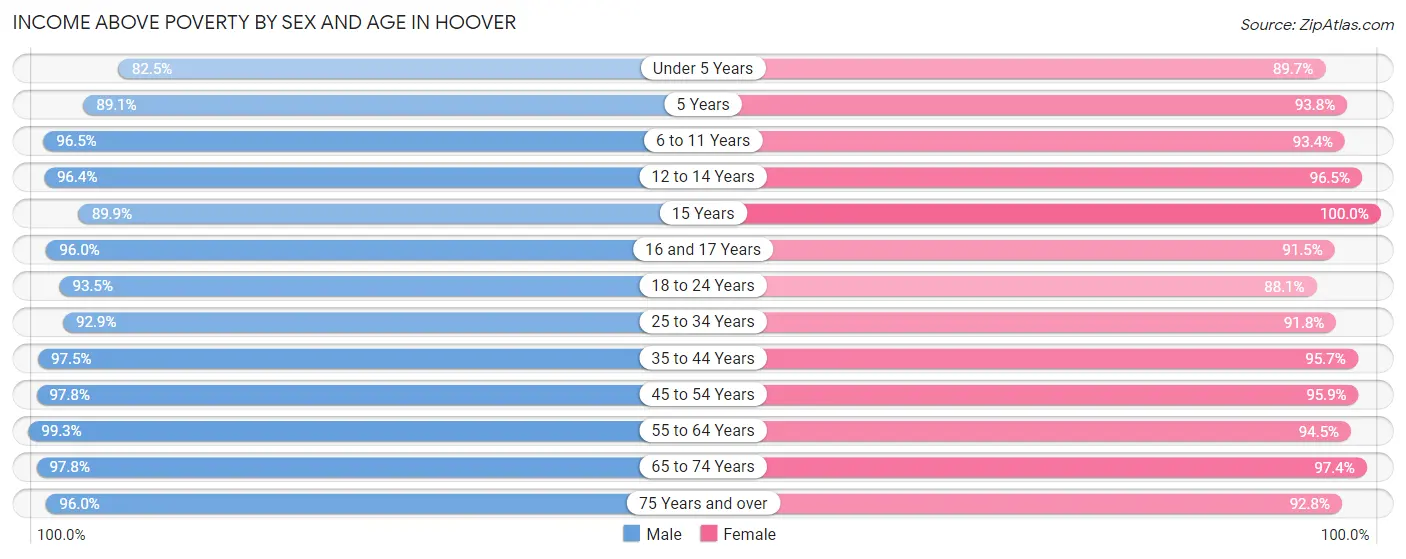
| Age Bracket | Male | Female |
| Under 5 Years | 2,346 (82.5%) | 3,291 (89.7%) |
| 5 Years | 400 (89.1%) | 679 (93.8%) |
| 6 to 11 Years | 4,055 (96.5%) | 3,088 (93.4%) |
| 12 to 14 Years | 1,580 (96.4%) | 1,575 (96.5%) |
| 15 Years | 384 (89.9%) | 601 (100.0%) |
| 16 and 17 Years | 1,351 (96.0%) | 1,126 (91.5%) |
| 18 to 24 Years | 3,474 (93.5%) | 2,535 (88.1%) |
| 25 to 34 Years | 5,717 (92.8%) | 5,908 (91.7%) |
| 35 to 44 Years | 5,833 (97.5%) | 6,532 (95.7%) |
| 45 to 54 Years | 5,743 (97.8%) | 6,366 (95.9%) |
| 55 to 64 Years | 4,684 (99.3%) | 5,213 (94.5%) |
| 65 to 74 Years | 3,761 (97.8%) | 4,231 (97.4%) |
| 75 Years and over | 2,415 (96.0%) | 3,461 (92.8%) |
| Total | 41,743 (95.4%) | 44,606 (93.8%) |
Income Below Poverty Among Married-Couple Families in Hoover
The poverty statistics for married-couple families in Hoover show that 1.6% or 323 of the total 20,079 families live below the poverty line. Families with 3 or 4 children have the highest poverty rate of 4.9%, comprising of 75 families. On the other hand, families with 5 or more children have the lowest poverty rate of 0.0%, which includes 0 families.
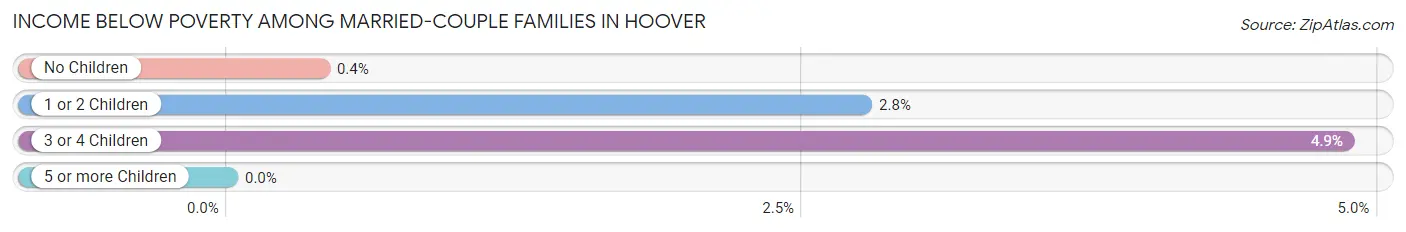
| Children | Above Poverty | Below Poverty |
| No Children | 11,085 (99.6%) | 45 (0.4%) |
| 1 or 2 Children | 7,161 (97.2%) | 203 (2.8%) |
| 3 or 4 Children | 1,468 (95.1%) | 75 (4.9%) |
| 5 or more Children | 42 (100.0%) | 0 (0.0%) |
| Total | 19,756 (98.4%) | 323 (1.6%) |
Income Below Poverty Among Single-Parent Households in Hoover
According to the poverty data in Hoover, 6.1% or 103 single-father households and 10.2% or 347 single-mother households are living below the poverty line. Among single-father households, those with 3 or 4 children have the highest poverty rate, with 11 households (25.0%) experiencing poverty. Likewise, among single-mother households, those with 3 or 4 children have the highest poverty rate, with 34 households (16.7%) falling below the poverty line.
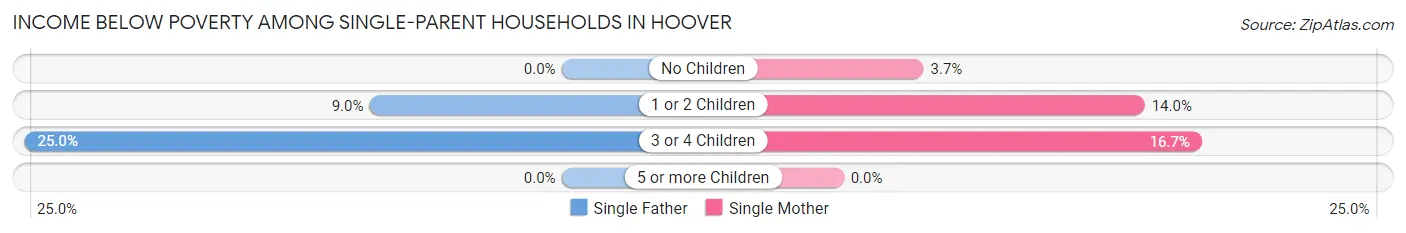
| Children | Single Father | Single Mother |
| No Children | 0 (0.0%) | 48 (3.7%) |
| 1 or 2 Children | 92 (8.9%) | 265 (14.0%) |
| 3 or 4 Children | 11 (25.0%) | 34 (16.7%) |
| 5 or more Children | 0 (0.0%) | 0 (0.0%) |
| Total | 103 (6.1%) | 347 (10.2%) |
Income Below Poverty Among Married-Couple vs Single-Parent Households in Hoover
The poverty data for Hoover shows that 323 of the married-couple family households (1.6%) and 450 of the single-parent households (8.9%) are living below the poverty level. Within the married-couple family households, those with 3 or 4 children have the highest poverty rate, with 75 households (4.9%) falling below the poverty line. Among the single-parent households, those with 3 or 4 children have the highest poverty rate, with 45 household (18.1%) living below poverty.
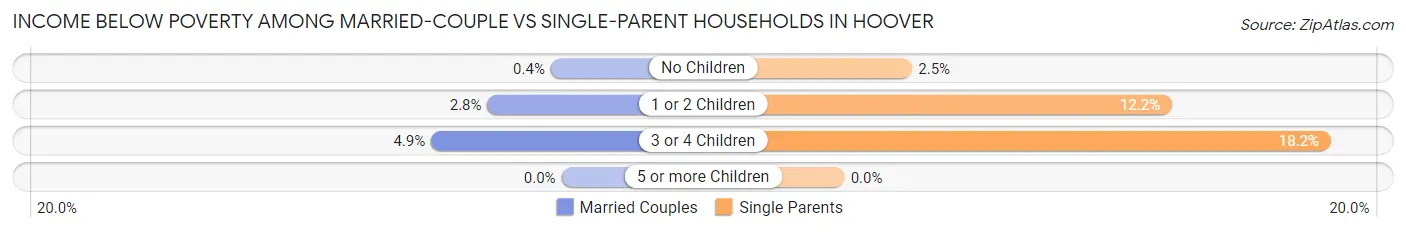
| Children | Married-Couple Families | Single-Parent Households |
| No Children | 45 (0.4%) | 48 (2.5%) |
| 1 or 2 Children | 203 (2.8%) | 357 (12.2%) |
| 3 or 4 Children | 75 (4.9%) | 45 (18.1%) |
| 5 or more Children | 0 (0.0%) | 0 (0.0%) |
| Total | 323 (1.6%) | 450 (8.9%) |
Race in Hoover
The most populous races in Hoover are White / Caucasian (64,162 | 69.8%), Black / African American (18,210 | 19.8%), and Asian (4,938 | 5.4%).
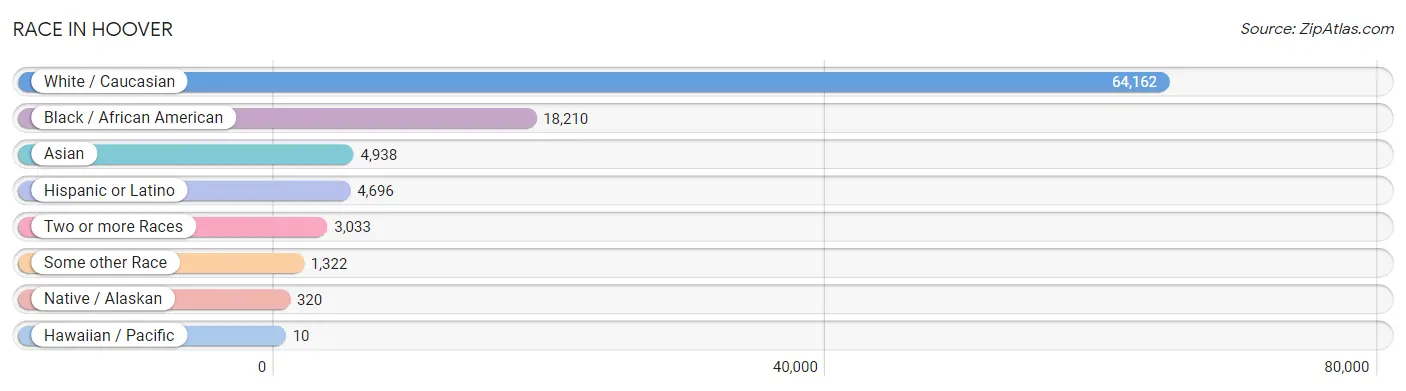
| Race | # Population | % Population |
| Asian | 4,938 | 5.4% |
| Black / African American | 18,210 | 19.8% |
| Hawaiian / Pacific | 10 | 0.0% |
| Hispanic or Latino | 4,696 | 5.1% |
| Native / Alaskan | 320 | 0.4% |
| White / Caucasian | 64,162 | 69.8% |
| Two or more Races | 3,033 | 3.3% |
| Some other Race | 1,322 | 1.4% |
| Total | 91,995 | 100.0% |
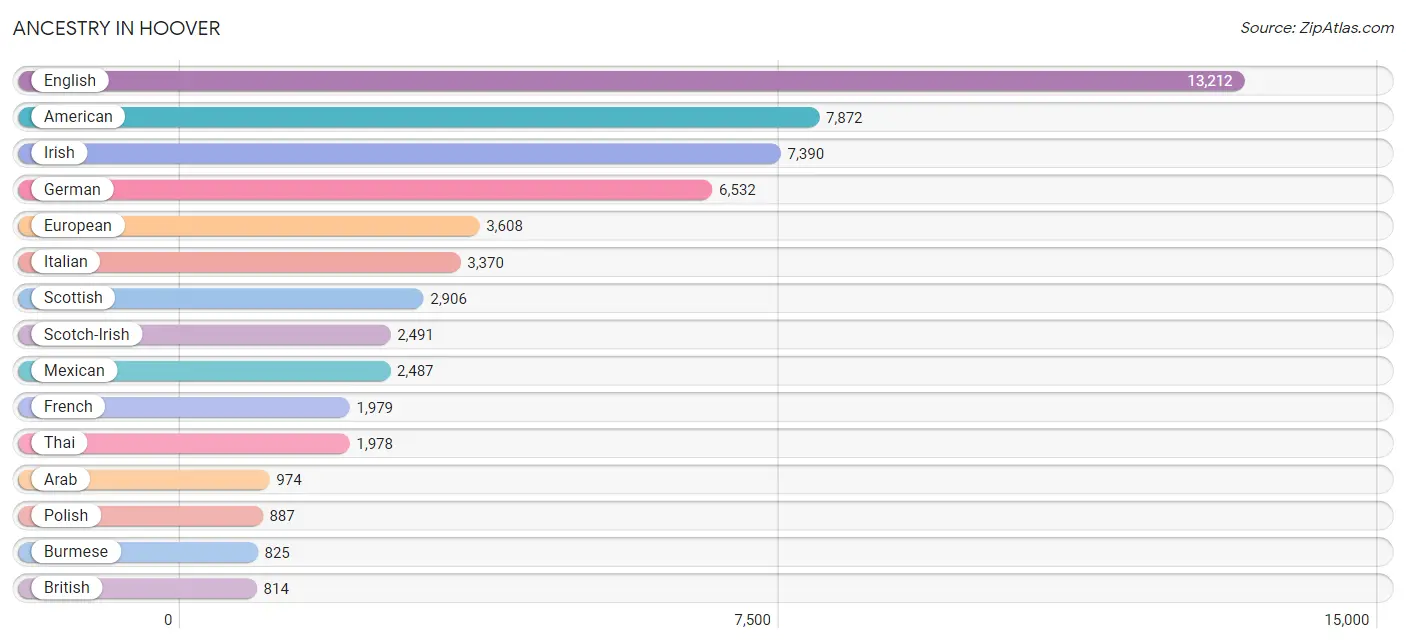
Ancestry in Hoover
The most populous ancestries reported in Hoover are English (13,212 | 14.4%), American (7,872 | 8.6%), Irish (7,390 | 8.0%), German (6,532 | 7.1%), and European (3,608 | 3.9%), together accounting for 42.0% of all Hoover residents.
| Ancestry | # Population | % Population |
| African | 332 | 0.4% |
| American | 7,872 | 8.6% |
| Arab | 974 | 1.1% |
| Australian | 16 | 0.0% |
| Austrian | 91 | 0.1% |
| Belgian | 15 | 0.0% |
| Bhutanese | 158 | 0.2% |
| Blackfeet | 17 | 0.0% |
| Brazilian | 112 | 0.1% |
| British | 814 | 0.9% |
| Bulgarian | 11 | 0.0% |
| Burmese | 825 | 0.9% |
| Cajun | 209 | 0.2% |
| Canadian | 149 | 0.2% |
| Central American | 527 | 0.6% |
| Central American Indian | 75 | 0.1% |
| Cherokee | 107 | 0.1% |
| Chilean | 13 | 0.0% |
| Choctaw | 35 | 0.0% |
| Colombian | 305 | 0.3% |
| Costa Rican | 20 | 0.0% |
| Creek | 34 | 0.0% |
| Croatian | 8 | 0.0% |
| Cuban | 303 | 0.3% |
| Czech | 91 | 0.1% |
| Czechoslovakian | 49 | 0.1% |
| Danish | 65 | 0.1% |
| Dominican | 55 | 0.1% |
| Dutch | 644 | 0.7% |
| Eastern European | 139 | 0.2% |
| Ecuadorian | 27 | 0.0% |
| Egyptian | 68 | 0.1% |
| English | 13,212 | 14.4% |
| European | 3,608 | 3.9% |
| Filipino | 99 | 0.1% |
| Finnish | 103 | 0.1% |
| French | 1,979 | 2.1% |
| French Canadian | 178 | 0.2% |
| German | 6,532 | 7.1% |
| Greek | 267 | 0.3% |
| Guamanian / Chamorro | 2 | 0.0% |
| Guatemalan | 104 | 0.1% |
| Guyanese | 13 | 0.0% |
| Haitian | 150 | 0.2% |
| Honduran | 192 | 0.2% |
| Hungarian | 224 | 0.2% |
| Indian (Asian) | 728 | 0.8% |
| Indonesian | 11 | 0.0% |
| Iranian | 78 | 0.1% |
| Iraqi | 12 | 0.0% |
| Irish | 7,390 | 8.0% |
| Italian | 3,370 | 3.7% |
| Jamaican | 92 | 0.1% |
| Jordanian | 26 | 0.0% |
| Kenyan | 129 | 0.1% |
| Korean | 439 | 0.5% |
| Laotian | 57 | 0.1% |
| Latvian | 15 | 0.0% |
| Lebanese | 353 | 0.4% |
| Lithuanian | 68 | 0.1% |
| Malaysian | 13 | 0.0% |
| Maltese | 21 | 0.0% |
| Mexican | 2,487 | 2.7% |
| Mexican American Indian | 198 | 0.2% |
| Native Hawaiian | 47 | 0.1% |
| New Zealander | 10 | 0.0% |
| Nigerian | 126 | 0.1% |
| Northern European | 195 | 0.2% |
| Norwegian | 602 | 0.6% |
| Pakistani | 226 | 0.3% |
| Palestinian | 366 | 0.4% |
| Panamanian | 69 | 0.1% |
| Pennsylvania German | 15 | 0.0% |
| Peruvian | 142 | 0.2% |
| Polish | 887 | 1.0% |
| Portuguese | 358 | 0.4% |
| Puerto Rican | 383 | 0.4% |
| Romanian | 151 | 0.2% |
| Russian | 330 | 0.4% |
| Salvadoran | 142 | 0.2% |
| Scandinavian | 125 | 0.1% |
| Scotch-Irish | 2,491 | 2.7% |
| Scottish | 2,906 | 3.2% |
| Sioux | 18 | 0.0% |
| Slavic | 191 | 0.2% |
| Slovak | 65 | 0.1% |
| Slovene | 16 | 0.0% |
| South African | 29 | 0.0% |
| South American | 673 | 0.7% |
| Spaniard | 137 | 0.2% |
| Spanish | 14 | 0.0% |
| Sri Lankan | 407 | 0.4% |
| Subsaharan African | 628 | 0.7% |
| Swedish | 755 | 0.8% |
| Swiss | 346 | 0.4% |
| Syrian | 56 | 0.1% |
| Thai | 1,978 | 2.1% |
| Turkish | 40 | 0.0% |
| Ukrainian | 55 | 0.1% |
| Venezuelan | 156 | 0.2% |
| Vietnamese | 10 | 0.0% |
| Welsh | 473 | 0.5% |
| West Indian | 3 | 0.0% | View All 103 Rows |
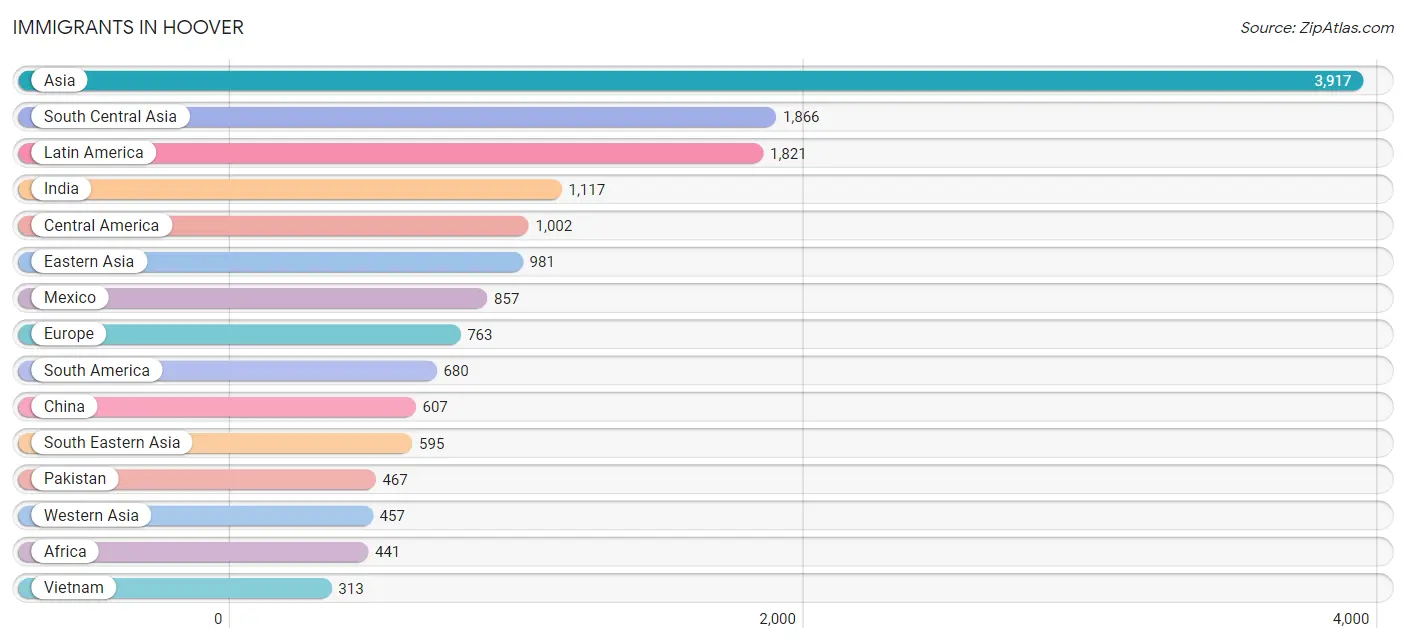
Immigrants in Hoover
The most numerous immigrant groups reported in Hoover came from Asia (3,917 | 4.3%), South Central Asia (1,866 | 2.0%), Latin America (1,821 | 2.0%), India (1,117 | 1.2%), and Central America (1,002 | 1.1%), together accounting for 10.6% of all Hoover residents.
| Immigration Origin | # Population | % Population |
| Africa | 441 | 0.5% |
| Asia | 3,917 | 4.3% |
| Australia | 8 | 0.0% |
| Bangladesh | 30 | 0.0% |
| Belarus | 46 | 0.1% |
| Brazil | 254 | 0.3% |
| Bulgaria | 11 | 0.0% |
| Canada | 158 | 0.2% |
| Caribbean | 139 | 0.2% |
| Central America | 1,002 | 1.1% |
| Chile | 13 | 0.0% |
| China | 607 | 0.7% |
| Colombia | 187 | 0.2% |
| Congo | 48 | 0.1% |
| Cuba | 96 | 0.1% |
| Eastern Africa | 247 | 0.3% |
| Eastern Asia | 981 | 1.1% |
| Eastern Europe | 281 | 0.3% |
| Egypt | 68 | 0.1% |
| El Salvador | 92 | 0.1% |
| England | 116 | 0.1% |
| Europe | 763 | 0.8% |
| France | 18 | 0.0% |
| Germany | 110 | 0.1% |
| Greece | 9 | 0.0% |
| Guatemala | 42 | 0.1% |
| Guyana | 13 | 0.0% |
| Haiti | 40 | 0.0% |
| Honduras | 11 | 0.0% |
| Hong Kong | 16 | 0.0% |
| India | 1,117 | 1.2% |
| Indonesia | 57 | 0.1% |
| Iran | 7 | 0.0% |
| Iraq | 12 | 0.0% |
| Israel | 127 | 0.1% |
| Italy | 18 | 0.0% |
| Jamaica | 3 | 0.0% |
| Japan | 69 | 0.1% |
| Jordan | 16 | 0.0% |
| Kenya | 235 | 0.3% |
| Korea | 305 | 0.3% |
| Kuwait | 98 | 0.1% |
| Latin America | 1,821 | 2.0% |
| Lebanon | 68 | 0.1% |
| Malaysia | 17 | 0.0% |
| Mexico | 857 | 0.9% |
| Middle Africa | 48 | 0.1% |
| Moldova | 91 | 0.1% |
| Nepal | 226 | 0.3% |
| Netherlands | 21 | 0.0% |
| Nigeria | 28 | 0.0% |
| Northern Africa | 68 | 0.1% |
| Northern Europe | 220 | 0.2% |
| Oceania | 18 | 0.0% |
| Pakistan | 467 | 0.5% |
| Peru | 57 | 0.1% |
| Philippines | 156 | 0.2% |
| Portugal | 80 | 0.1% |
| Russia | 107 | 0.1% |
| Scotland | 13 | 0.0% |
| South Africa | 29 | 0.0% |
| South America | 680 | 0.7% |
| South Central Asia | 1,866 | 2.0% |
| South Eastern Asia | 595 | 0.6% |
| Southern Europe | 113 | 0.1% |
| Spain | 6 | 0.0% |
| Syria | 40 | 0.0% |
| Taiwan | 63 | 0.1% |
| Thailand | 41 | 0.0% |
| Turkey | 22 | 0.0% |
| Uganda | 12 | 0.0% |
| Ukraine | 11 | 0.0% |
| Venezuela | 156 | 0.2% |
| Vietnam | 313 | 0.3% |
| Western Africa | 49 | 0.1% |
| Western Asia | 457 | 0.5% |
| Western Europe | 149 | 0.2% |
| Yemen | 33 | 0.0% | View All 78 Rows |
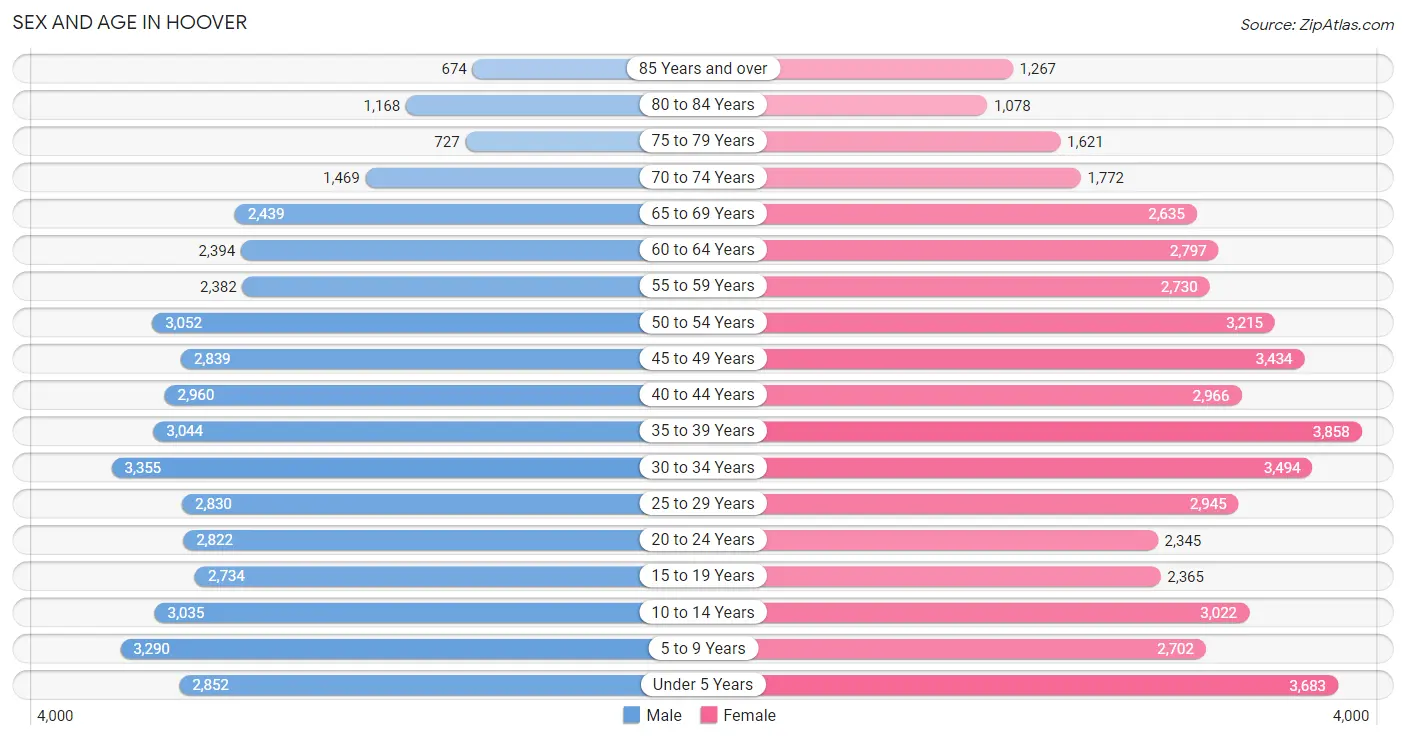
Sex and Age in Hoover
Sex and Age in Hoover
The most populous age groups in Hoover are 30 to 34 Years (3,355 | 7.6%) for men and 35 to 39 Years (3,858 | 8.1%) for women.
| Age Bracket | Male | Female |
| Under 5 Years | 2,852 (6.5%) | 3,683 (7.7%) |
| 5 to 9 Years | 3,290 (7.5%) | 2,702 (5.6%) |
| 10 to 14 Years | 3,035 (6.9%) | 3,022 (6.3%) |
| 15 to 19 Years | 2,734 (6.2%) | 2,365 (4.9%) |
| 20 to 24 Years | 2,822 (6.4%) | 2,345 (4.9%) |
| 25 to 29 Years | 2,830 (6.4%) | 2,945 (6.1%) |
| 30 to 34 Years | 3,355 (7.6%) | 3,494 (7.3%) |
| 35 to 39 Years | 3,044 (6.9%) | 3,858 (8.1%) |
| 40 to 44 Years | 2,960 (6.7%) | 2,966 (6.2%) |
| 45 to 49 Years | 2,839 (6.4%) | 3,434 (7.2%) |
| 50 to 54 Years | 3,052 (6.9%) | 3,215 (6.7%) |
| 55 to 59 Years | 2,382 (5.4%) | 2,730 (5.7%) |
| 60 to 64 Years | 2,394 (5.4%) | 2,797 (5.8%) |
| 65 to 69 Years | 2,439 (5.5%) | 2,635 (5.5%) |
| 70 to 74 Years | 1,469 (3.3%) | 1,772 (3.7%) |
| 75 to 79 Years | 727 (1.7%) | 1,621 (3.4%) |
| 80 to 84 Years | 1,168 (2.6%) | 1,078 (2.2%) |
| 85 Years and over | 674 (1.5%) | 1,267 (2.6%) |
| Total | 44,066 (100.0%) | 47,929 (100.0%) |
Families and Households in Hoover
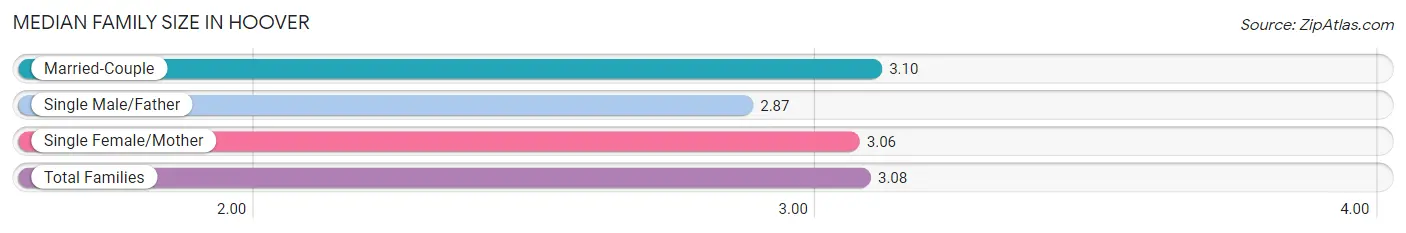
Median Family Size in Hoover
The median family size in Hoover is 3.08 persons per family, with married-couple families (20,079 | 79.8%) accounting for the largest median family size of 3.1 persons per family. On the other hand, single male/father families (1,686 | 6.7%) represent the smallest median family size with 2.87 persons per family.
| Family Type | # Families | Family Size |
| Married-Couple | 20,079 (79.8%) | 3.10 |
| Single Male/Father | 1,686 (6.7%) | 2.87 |
| Single Female/Mother | 3,386 (13.5%) | 3.06 |
| Total Families | 25,151 (100.0%) | 3.08 |
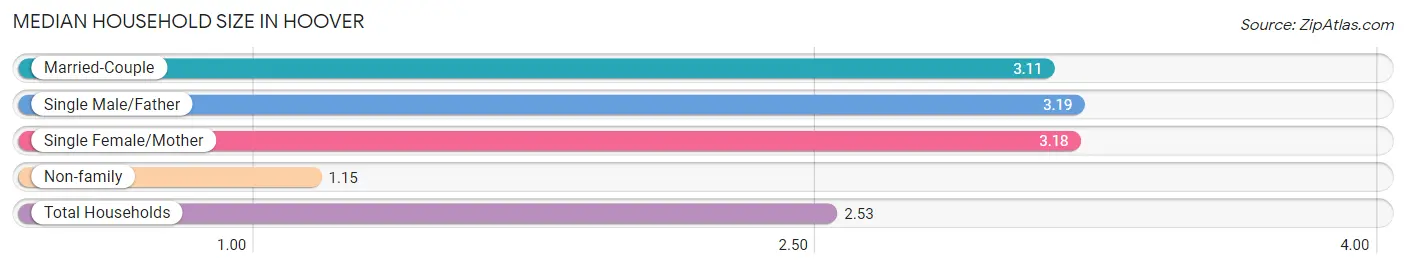
Median Household Size in Hoover
The median household size in Hoover is 2.53 persons per household, with single male/father households (1,686 | 4.7%) accounting for the largest median household size of 3.19 persons per household. non-family households (11,038 | 30.5%) represent the smallest median household size with 1.15 persons per household.
| Household Type | # Households | Household Size |
| Married-Couple | 20,079 (55.5%) | 3.11 |
| Single Male/Father | 1,686 (4.7%) | 3.19 |
| Single Female/Mother | 3,386 (9.4%) | 3.18 |
| Non-family | 11,038 (30.5%) | 1.15 |
| Total Households | 36,189 (100.0%) | 2.53 |
Household Size by Marriage Status in Hoover
Out of a total of 36,189 households in Hoover, 25,151 (69.5%) are family households, while 11,038 (30.5%) are nonfamily households. The most numerous type of family households are 2-person households, comprising 11,619, and the most common type of nonfamily households are 1-person households, comprising 9,800.
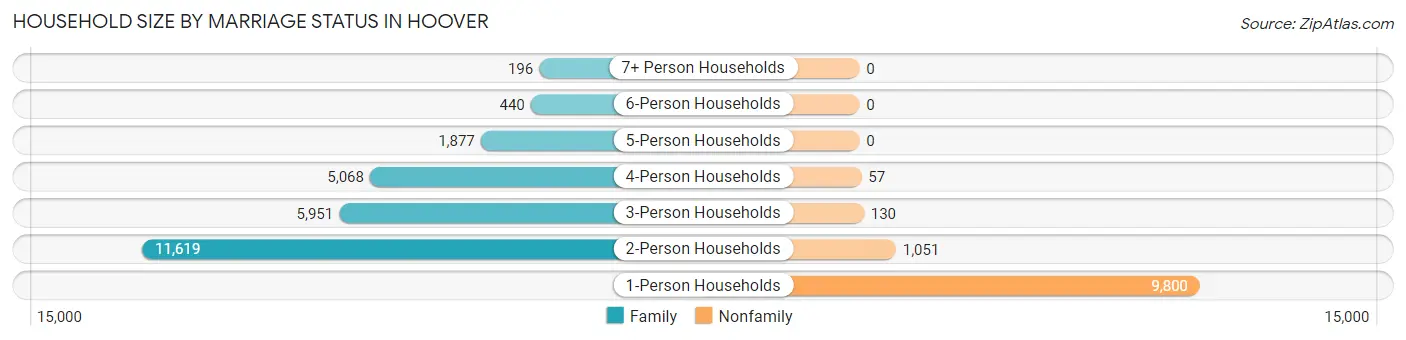
| Household Size | Family Households | Nonfamily Households |
| 1-Person Households | - | 9,800 (27.1%) |
| 2-Person Households | 11,619 (32.1%) | 1,051 (2.9%) |
| 3-Person Households | 5,951 (16.4%) | 130 (0.4%) |
| 4-Person Households | 5,068 (14.0%) | 57 (0.2%) |
| 5-Person Households | 1,877 (5.2%) | 0 (0.0%) |
| 6-Person Households | 440 (1.2%) | 0 (0.0%) |
| 7+ Person Households | 196 (0.5%) | 0 (0.0%) |
| Total | 25,151 (69.5%) | 11,038 (30.5%) |
Female Fertility in Hoover
Fertility by Age in Hoover
Average fertility rate in Hoover is 62.0 births per 1,000 women. Women in the age bracket of 20 to 34 years have the highest fertility rate with 112.0 births per 1,000 women. Women in the age bracket of 20 to 34 years acount for 71.5% of all women with births.
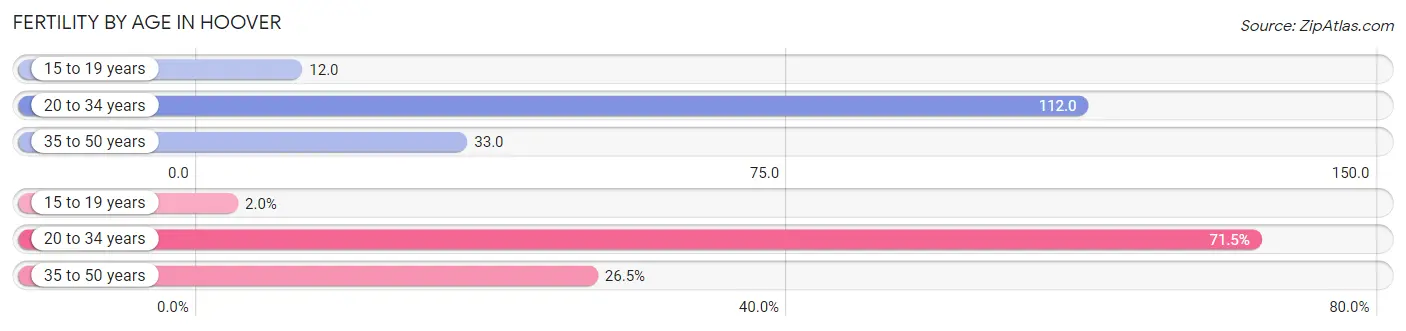
| Age Bracket | Women with Births | Births / 1,000 Women |
| 15 to 19 years | 28 (2.0%) | 12.0 |
| 20 to 34 years | 981 (71.5%) | 112.0 |
| 35 to 50 years | 363 (26.5%) | 33.0 |
| Total | 1,372 (100.0%) | 62.0 |
Fertility by Age by Marriage Status in Hoover
81.9% of women with births (1,372) in Hoover are married. The highest percentage of unmarried women with births falls into 15 to 19 years age bracket with 100.0% of them unmarried at the time of birth, while the lowest percentage of unmarried women with births belong to 35 to 50 years age bracket with 13.5% of them unmarried.
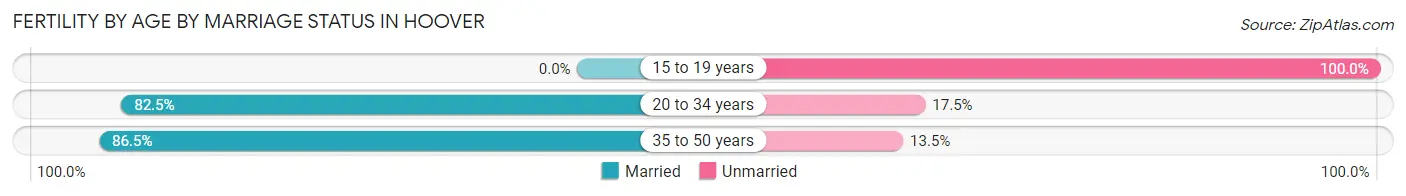
| Age Bracket | Married | Unmarried |
| 15 to 19 years | 0 (0.0%) | 28 (100.0%) |
| 20 to 34 years | 809 (82.5%) | 172 (17.5%) |
| 35 to 50 years | 314 (86.5%) | 49 (13.5%) |
| Total | 1,124 (81.9%) | 248 (18.1%) |
Fertility by Education in Hoover
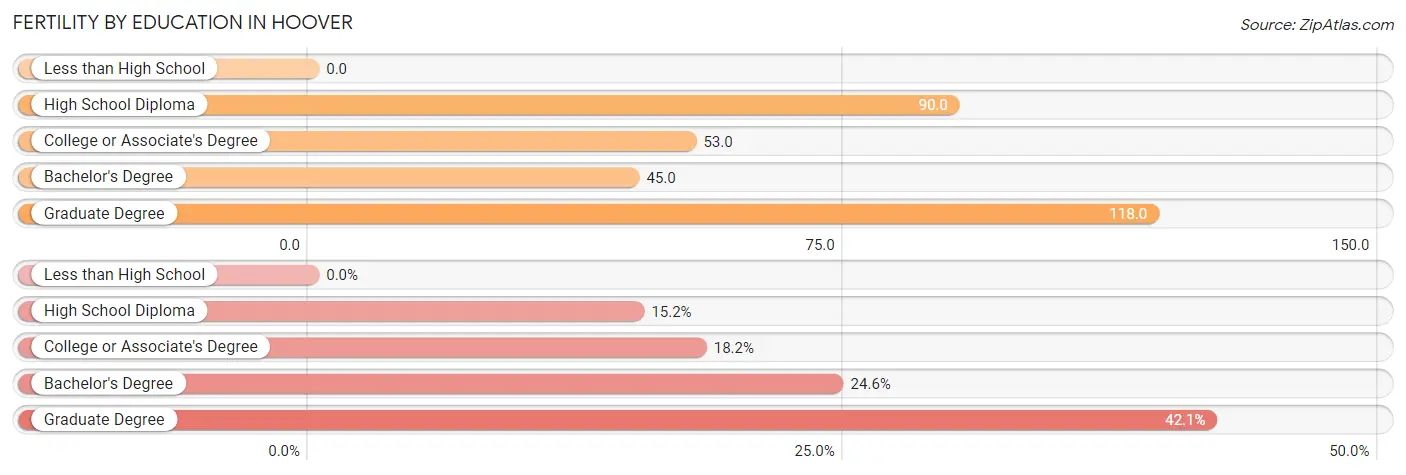
| Educational Attainment | Women with Births | Births / 1,000 Women |
| Less than High School | 0 (0.0%) | 0.0 |
| High School Diploma | 209 (15.2%) | 90.0 |
| College or Associate's Degree | 249 (18.1%) | 53.0 |
| Bachelor's Degree | 337 (24.6%) | 45.0 |
| Graduate Degree | 577 (42.1%) | 118.0 |
| Total | 1,372 (100.0%) | 62.0 |
Fertility by Education by Marriage Status in Hoover
18.1% of women with births in Hoover are unmarried. Women with the educational attainment of graduate degree are most likely to be married with 96.0% of them married at childbirth, while women with the educational attainment of high school diploma are least likely to be married with 48.8% of them unmarried at childbirth.
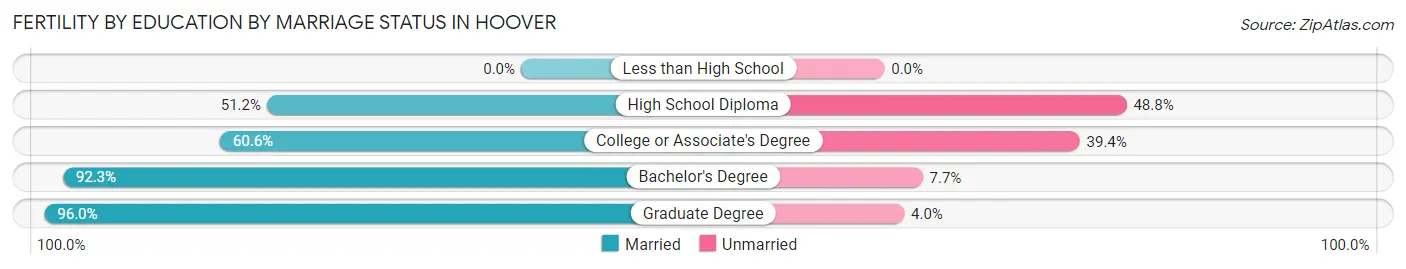
| Educational Attainment | Married | Unmarried |
| Less than High School | 0 (0.0%) | 0 (0.0%) |
| High School Diploma | 107 (51.2%) | 102 (48.8%) |
| College or Associate's Degree | 151 (60.6%) | 98 (39.4%) |
| Bachelor's Degree | 311 (92.3%) | 26 (7.7%) |
| Graduate Degree | 554 (96.0%) | 23 (4.0%) |
| Total | 1,124 (81.9%) | 248 (18.1%) |
Employment Characteristics in Hoover
Employment by Class of Employer in Hoover
Among the 47,009 employed individuals in Hoover, private company employees (31,482 | 67.0%), not-for-profit organizations (4,571 | 9.7%), and local government employees (2,816 | 6.0%) make up the most common classes of employment.
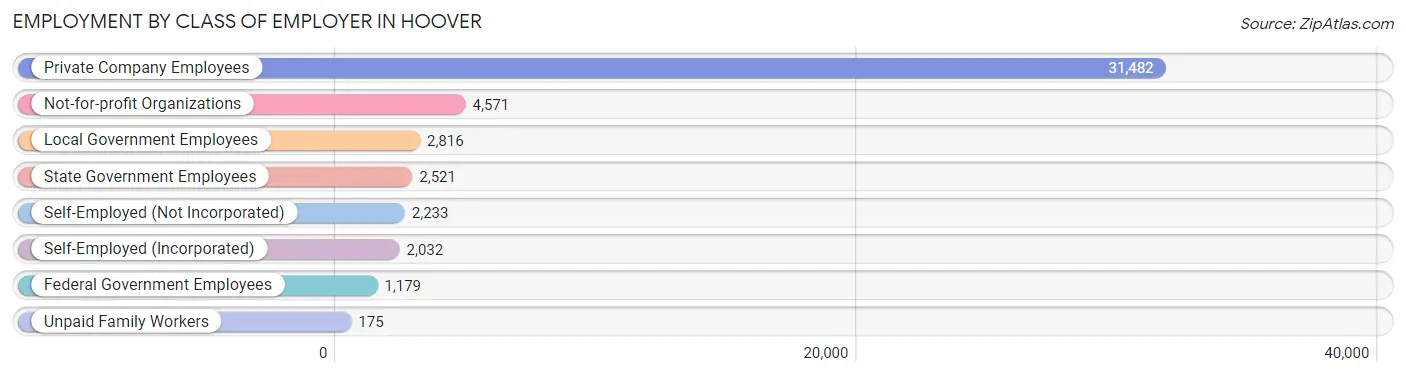
| Employer Class | # Employees | % Employees |
| Private Company Employees | 31,482 | 67.0% |
| Self-Employed (Incorporated) | 2,032 | 4.3% |
| Self-Employed (Not Incorporated) | 2,233 | 4.8% |
| Not-for-profit Organizations | 4,571 | 9.7% |
| Local Government Employees | 2,816 | 6.0% |
| State Government Employees | 2,521 | 5.4% |
| Federal Government Employees | 1,179 | 2.5% |
| Unpaid Family Workers | 175 | 0.4% |
| Total | 47,009 | 100.0% |
Employment Status by Age in Hoover
According to the labor force statistics for Hoover, out of the total population over 16 years of age (72,383), 68.4% or 49,510 individuals are in the labor force, with 3.9% or 1,931 of them unemployed. The age group with the highest labor force participation rate is 25 to 29 years, with 89.7% or 5,180 individuals in the labor force. Within the labor force, the 20 to 24 years age range has the highest percentage of unemployed individuals, with 13.0% or 513 of them being unemployed.
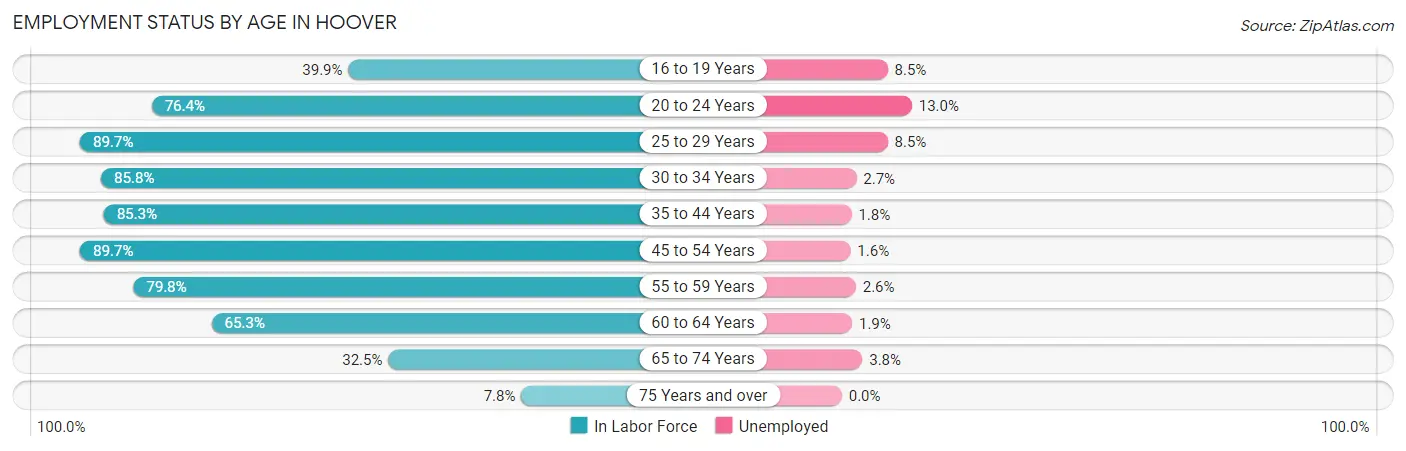
| Age Bracket | In Labor Force | Unemployed |
| 16 to 19 Years | 1,624 (39.9%) | 138 (8.5%) |
| 20 to 24 Years | 3,948 (76.4%) | 513 (13.0%) |
| 25 to 29 Years | 5,180 (89.7%) | 440 (8.5%) |
| 30 to 34 Years | 5,876 (85.8%) | 159 (2.7%) |
| 35 to 44 Years | 10,942 (85.3%) | 197 (1.8%) |
| 45 to 54 Years | 11,248 (89.7%) | 180 (1.6%) |
| 55 to 59 Years | 4,079 (79.8%) | 106 (2.6%) |
| 60 to 64 Years | 3,390 (65.3%) | 64 (1.9%) |
| 65 to 74 Years | 2,702 (32.5%) | 103 (3.8%) |
| 75 Years and over | 510 (7.8%) | 0 (0.0%) |
| Total | 49,510 (68.4%) | 1,931 (3.9%) |
Employment Status by Educational Attainment in Hoover
According to labor force statistics for Hoover, 84.3% of individuals (40,713) out of the total population between 25 and 64 years of age (48,295) are in the labor force, with 2.8% or 1,140 of them being unemployed. The group with the highest labor force participation rate are those with the educational attainment of bachelor's degree or higher, with 87.1% or 26,701 individuals in the labor force. Within the labor force, individuals with less than high school education have the highest percentage of unemployment, with 5.2% or 59 of them being unemployed.
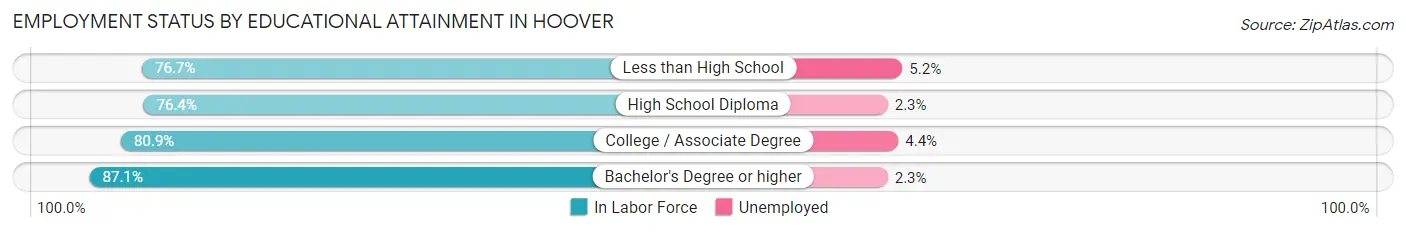
| Educational Attainment | In Labor Force | Unemployed |
| Less than High School | 1,137 (76.7%) | 77 (5.2%) |
| High School Diploma | 3,705 (76.4%) | 112 (2.3%) |
| College / Associate Degree | 9,147 (80.9%) | 498 (4.4%) |
| Bachelor's Degree or higher | 26,701 (87.1%) | 705 (2.3%) |
| Total | 40,713 (84.3%) | 1,352 (2.8%) |
Employment Occupations by Sex in Hoover
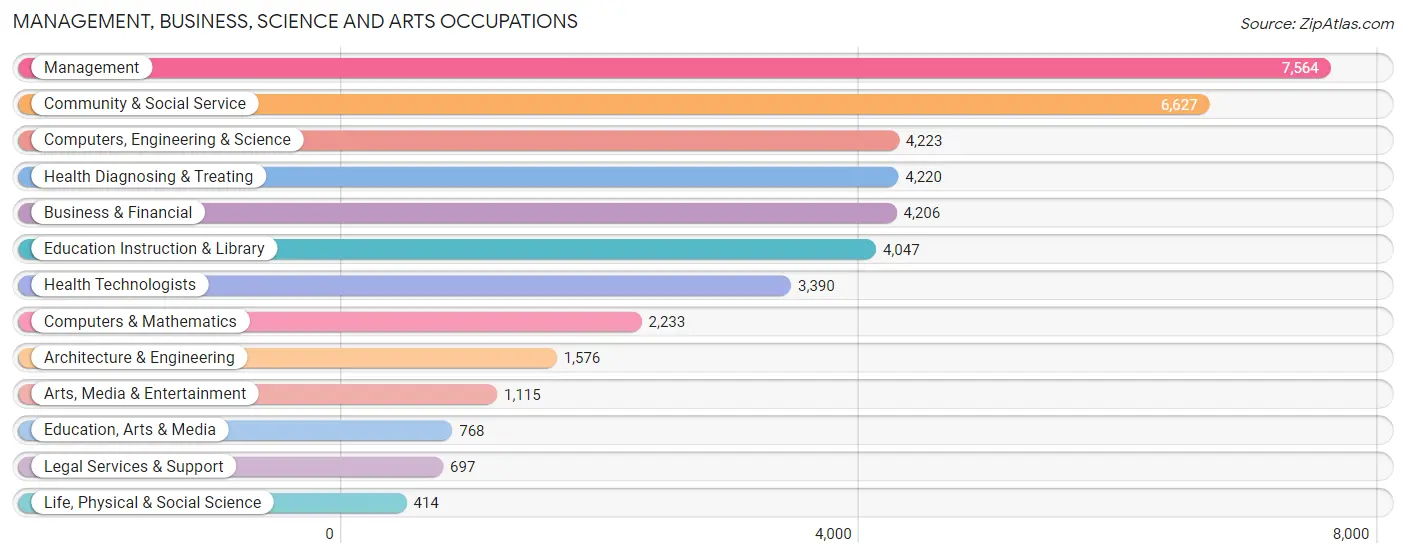
Management, Business, Science and Arts Occupations
The most common Management, Business, Science and Arts occupations in Hoover are Management (7,564 | 15.9%), Community & Social Service (6,627 | 14.0%), Computers, Engineering & Science (4,223 | 8.9%), Health Diagnosing & Treating (4,220 | 8.9%), and Business & Financial (4,206 | 8.9%).
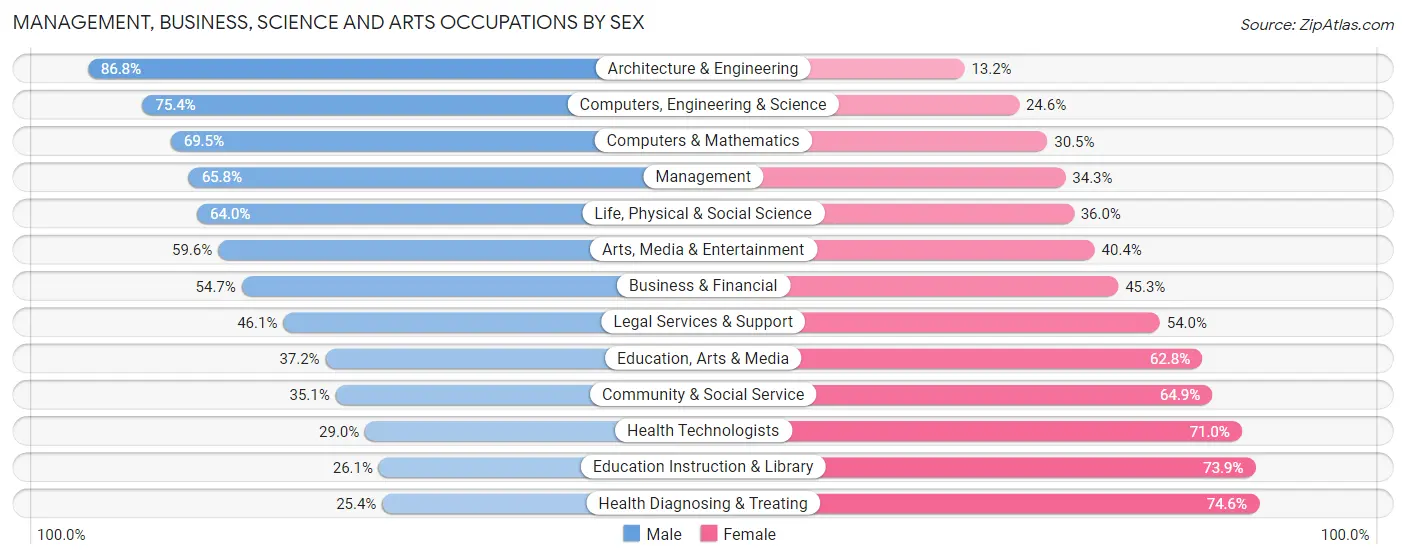
Management, Business, Science and Arts Occupations by Sex
Within the Management, Business, Science and Arts occupations in Hoover, the most male-oriented occupations are Architecture & Engineering (86.8%), Computers, Engineering & Science (75.4%), and Computers & Mathematics (69.5%), while the most female-oriented occupations are Health Diagnosing & Treating (74.6%), Education Instruction & Library (73.9%), and Health Technologists (71.0%).
| Occupation | Male | Female |
| Management | 4,973 (65.7%) | 2,591 (34.3%) |
| Business & Financial | 2,302 (54.7%) | 1,904 (45.3%) |
| Computers, Engineering & Science | 3,185 (75.4%) | 1,038 (24.6%) |
| Computers & Mathematics | 1,552 (69.5%) | 681 (30.5%) |
| Architecture & Engineering | 1,368 (86.8%) | 208 (13.2%) |
| Life, Physical & Social Science | 265 (64.0%) | 149 (36.0%) |
| Community & Social Service | 2,329 (35.1%) | 4,298 (64.9%) |
| Education, Arts & Media | 286 (37.2%) | 482 (62.8%) |
| Legal Services & Support | 321 (46.1%) | 376 (53.9%) |
| Education Instruction & Library | 1,057 (26.1%) | 2,990 (73.9%) |
| Arts, Media & Entertainment | 665 (59.6%) | 450 (40.4%) |
| Health Diagnosing & Treating | 1,072 (25.4%) | 3,148 (74.6%) |
| Health Technologists | 982 (29.0%) | 2,408 (71.0%) |
| Total (Category) | 13,861 (51.6%) | 12,979 (48.4%) |
| Total (Overall) | 25,579 (53.9%) | 21,885 (46.1%) |
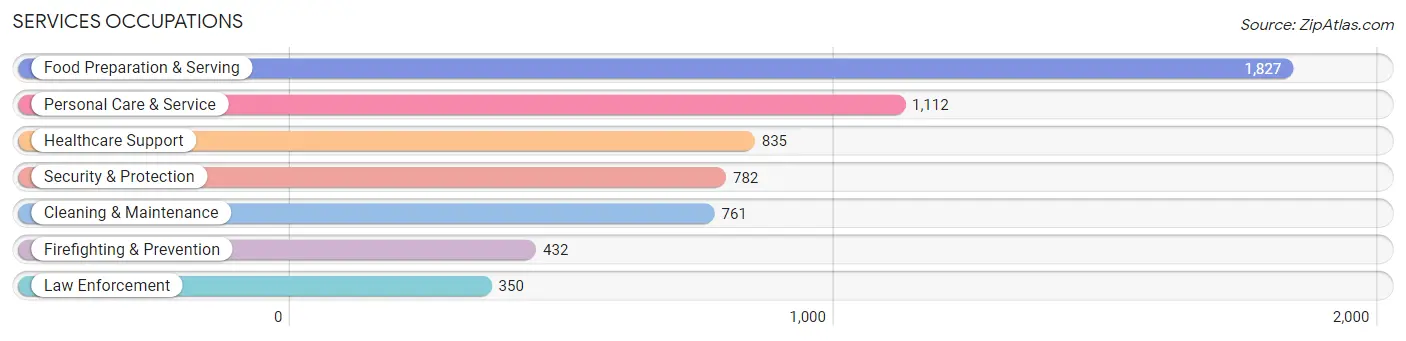
Services Occupations
The most common Services occupations in Hoover are Food Preparation & Serving (1,827 | 3.8%), Personal Care & Service (1,112 | 2.3%), Healthcare Support (835 | 1.8%), Security & Protection (782 | 1.7%), and Cleaning & Maintenance (761 | 1.6%).
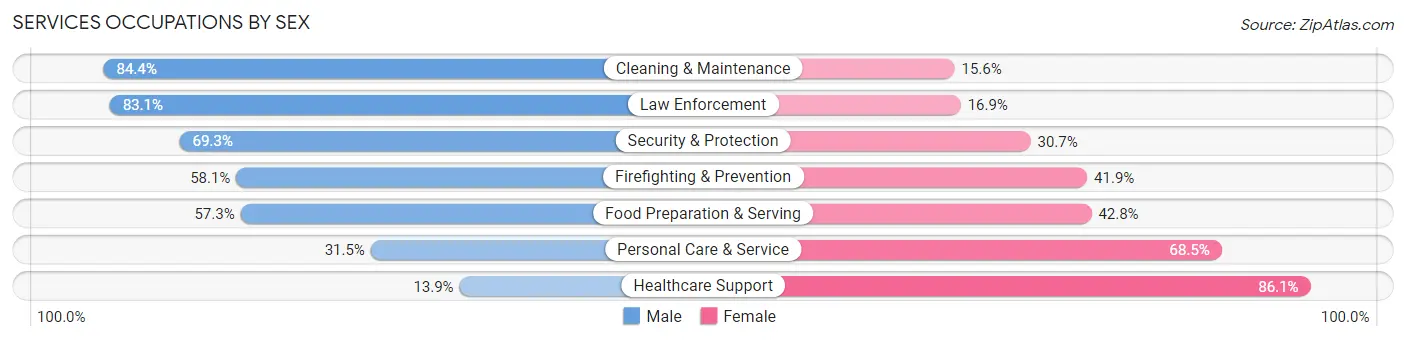
Services Occupations by Sex
Within the Services occupations in Hoover, the most male-oriented occupations are Cleaning & Maintenance (84.4%), Law Enforcement (83.1%), and Security & Protection (69.3%), while the most female-oriented occupations are Healthcare Support (86.1%), Personal Care & Service (68.5%), and Food Preparation & Serving (42.7%).
| Occupation | Male | Female |
| Healthcare Support | 116 (13.9%) | 719 (86.1%) |
| Security & Protection | 542 (69.3%) | 240 (30.7%) |
| Firefighting & Prevention | 251 (58.1%) | 181 (41.9%) |
| Law Enforcement | 291 (83.1%) | 59 (16.9%) |
| Food Preparation & Serving | 1,046 (57.3%) | 781 (42.7%) |
| Cleaning & Maintenance | 642 (84.4%) | 119 (15.6%) |
| Personal Care & Service | 350 (31.5%) | 762 (68.5%) |
| Total (Category) | 2,696 (50.7%) | 2,621 (49.3%) |
| Total (Overall) | 25,579 (53.9%) | 21,885 (46.1%) |
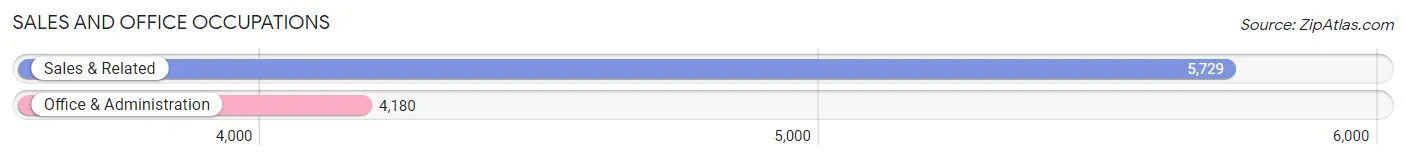
Sales and Office Occupations
The most common Sales and Office occupations in Hoover are Sales & Related (5,729 | 12.1%), and Office & Administration (4,180 | 8.8%).
Sales and Office Occupations by Sex
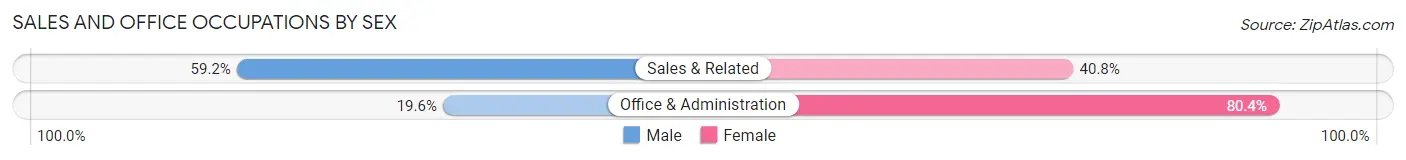
| Occupation | Male | Female |
| Sales & Related | 3,393 (59.2%) | 2,336 (40.8%) |
| Office & Administration | 819 (19.6%) | 3,361 (80.4%) |
| Total (Category) | 4,212 (42.5%) | 5,697 (57.5%) |
| Total (Overall) | 25,579 (53.9%) | 21,885 (46.1%) |
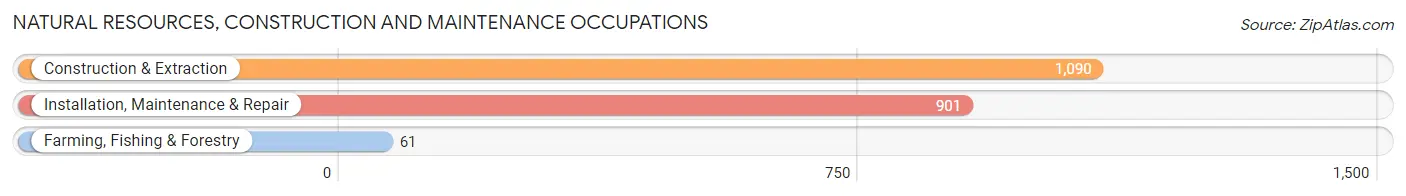
Natural Resources, Construction and Maintenance Occupations
The most common Natural Resources, Construction and Maintenance occupations in Hoover are Construction & Extraction (1,090 | 2.3%), Installation, Maintenance & Repair (901 | 1.9%), and Farming, Fishing & Forestry (61 | 0.1%).
Natural Resources, Construction and Maintenance Occupations by Sex
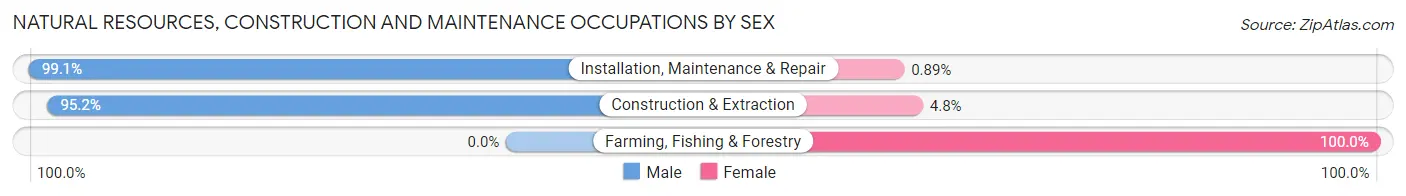
| Occupation | Male | Female |
| Farming, Fishing & Forestry | 0 (0.0%) | 61 (100.0%) |
| Construction & Extraction | 1,038 (95.2%) | 52 (4.8%) |
| Installation, Maintenance & Repair | 893 (99.1%) | 8 (0.9%) |
| Total (Category) | 1,931 (94.1%) | 121 (5.9%) |
| Total (Overall) | 25,579 (53.9%) | 21,885 (46.1%) |
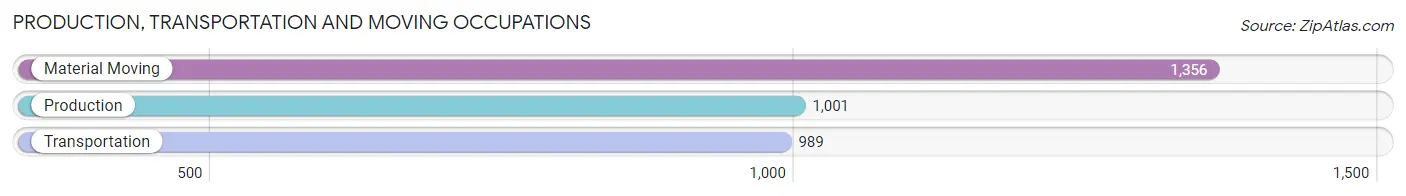
Production, Transportation and Moving Occupations
The most common Production, Transportation and Moving occupations in Hoover are Material Moving (1,356 | 2.9%), Production (1,001 | 2.1%), and Transportation (989 | 2.1%).
Production, Transportation and Moving Occupations by Sex
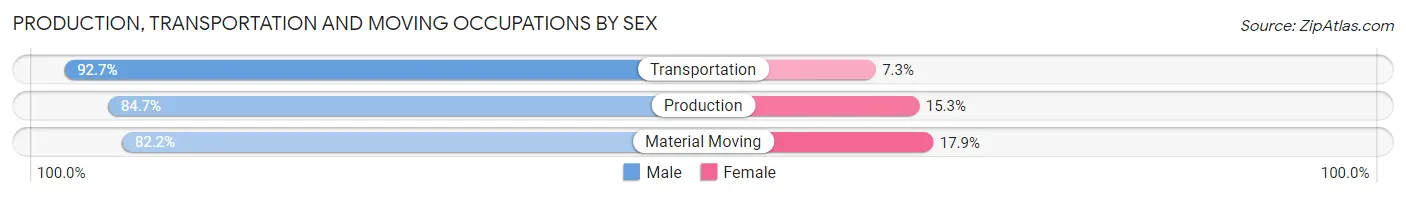
| Occupation | Male | Female |
| Production | 848 (84.7%) | 153 (15.3%) |
| Transportation | 917 (92.7%) | 72 (7.3%) |
| Material Moving | 1,114 (82.2%) | 242 (17.8%) |
| Total (Category) | 2,879 (86.0%) | 467 (14.0%) |
| Total (Overall) | 25,579 (53.9%) | 21,885 (46.1%) |
Employment Industries by Sex in Hoover
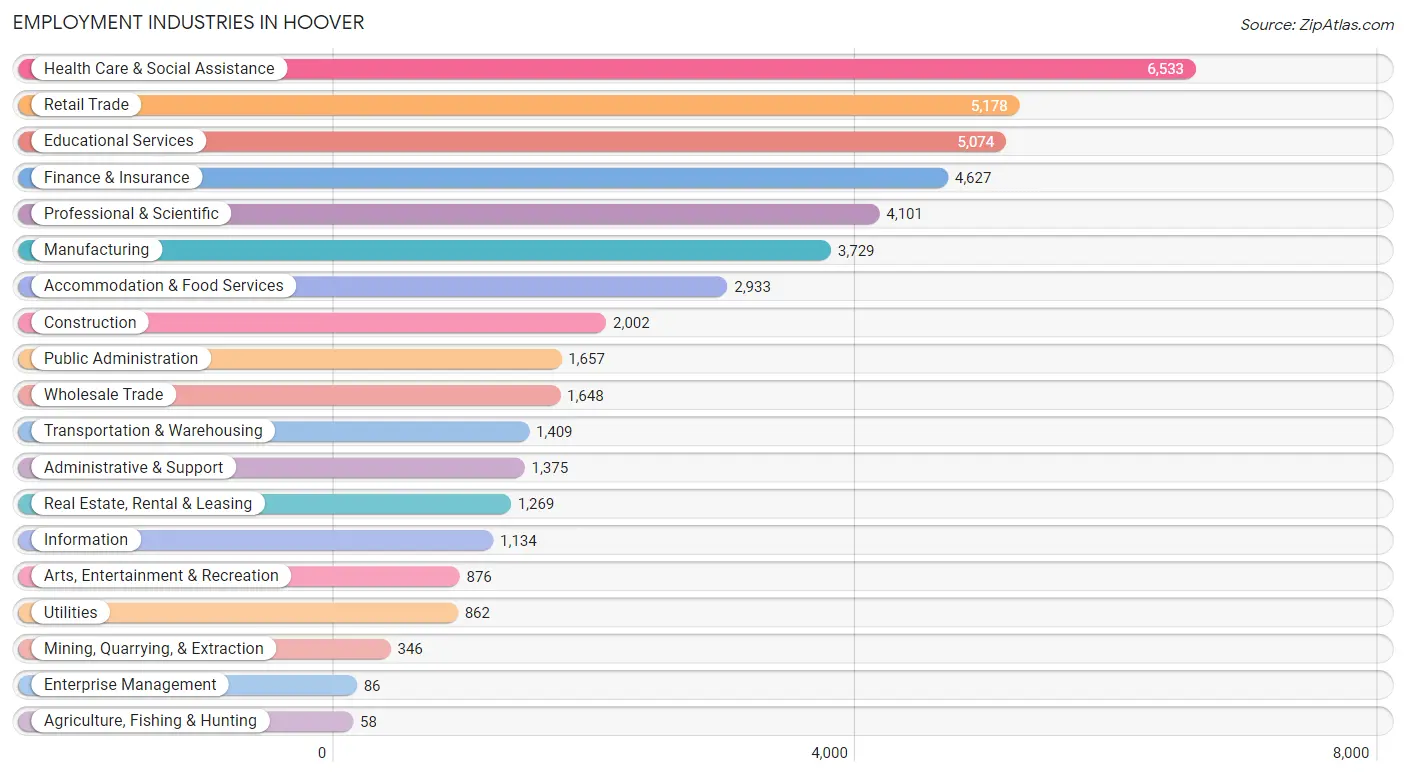
Employment Industries in Hoover
The major employment industries in Hoover include Health Care & Social Assistance (6,533 | 13.8%), Retail Trade (5,178 | 10.9%), Educational Services (5,074 | 10.7%), Finance & Insurance (4,627 | 9.8%), and Professional & Scientific (4,101 | 8.6%).
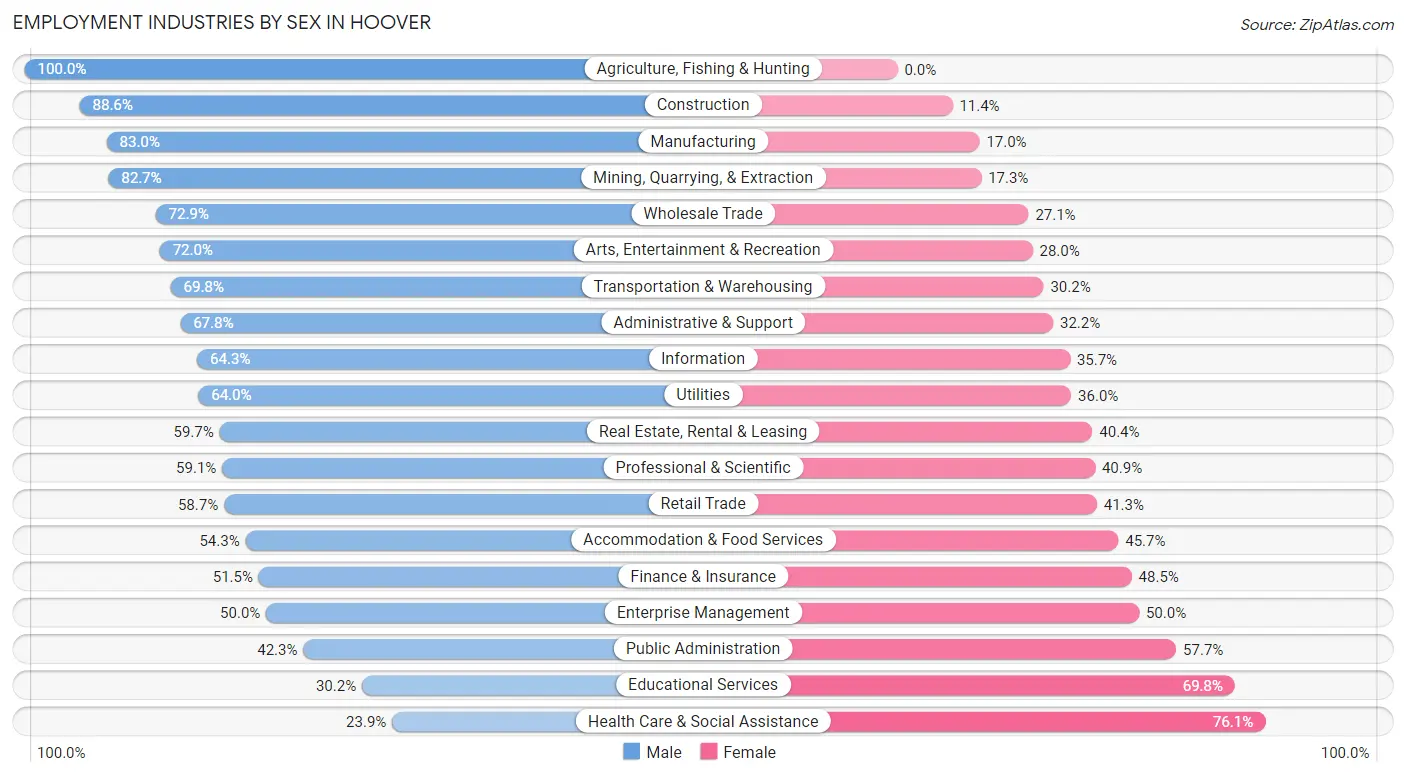
Employment Industries by Sex in Hoover
The Hoover industries that see more men than women are Agriculture, Fishing & Hunting (100.0%), Construction (88.6%), and Manufacturing (83.0%), whereas the industries that tend to have a higher number of women are Health Care & Social Assistance (76.1%), Educational Services (69.8%), and Public Administration (57.7%).
| Industry | Male | Female |
| Agriculture, Fishing & Hunting | 58 (100.0%) | 0 (0.0%) |
| Mining, Quarrying, & Extraction | 286 (82.7%) | 60 (17.3%) |
| Construction | 1,774 (88.6%) | 228 (11.4%) |
| Manufacturing | 3,096 (83.0%) | 633 (17.0%) |
| Wholesale Trade | 1,201 (72.9%) | 447 (27.1%) |
| Retail Trade | 3,041 (58.7%) | 2,137 (41.3%) |
| Transportation & Warehousing | 983 (69.8%) | 426 (30.2%) |
| Utilities | 552 (64.0%) | 310 (36.0%) |
| Information | 729 (64.3%) | 405 (35.7%) |
| Finance & Insurance | 2,384 (51.5%) | 2,243 (48.5%) |
| Real Estate, Rental & Leasing | 757 (59.7%) | 512 (40.4%) |
| Professional & Scientific | 2,424 (59.1%) | 1,677 (40.9%) |
| Enterprise Management | 43 (50.0%) | 43 (50.0%) |
| Administrative & Support | 932 (67.8%) | 443 (32.2%) |
| Educational Services | 1,531 (30.2%) | 3,543 (69.8%) |
| Health Care & Social Assistance | 1,563 (23.9%) | 4,970 (76.1%) |
| Arts, Entertainment & Recreation | 631 (72.0%) | 245 (28.0%) |
| Accommodation & Food Services | 1,592 (54.3%) | 1,341 (45.7%) |
| Public Administration | 701 (42.3%) | 956 (57.7%) |
| Total | 25,579 (53.9%) | 21,885 (46.1%) |
Education in Hoover
School Enrollment in Hoover
The most common levels of schooling among the 22,346 students in Hoover are high school (4,936 | 22.1%), elementary school (4,932 | 22.1%), and middle school (4,468 | 20.0%).
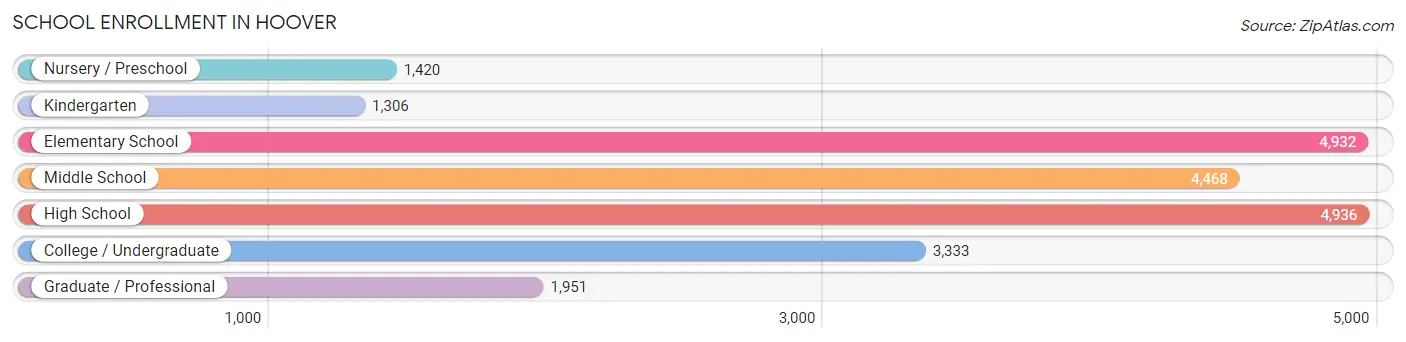
| School Level | # Students | % Students |
| Nursery / Preschool | 1,420 | 6.4% |
| Kindergarten | 1,306 | 5.8% |
| Elementary School | 4,932 | 22.1% |
| Middle School | 4,468 | 20.0% |
| High School | 4,936 | 22.1% |
| College / Undergraduate | 3,333 | 14.9% |
| Graduate / Professional | 1,951 | 8.7% |
| Total | 22,346 | 100.0% |
School Enrollment by Age by Funding Source in Hoover
Out of a total of 22,346 students who are enrolled in schools in Hoover, 3,575 (16.0%) attend a private institution, while the remaining 18,771 (84.0%) are enrolled in public schools. The age group of 3 to 4 year olds has the highest likelihood of being enrolled in private schools, with 706 (63.9% in the age bracket) enrolled. Conversely, the age group of 15 to 17 year olds has the lowest likelihood of being enrolled in a private school, with 3,303 (90.5% in the age bracket) attending a public institution.
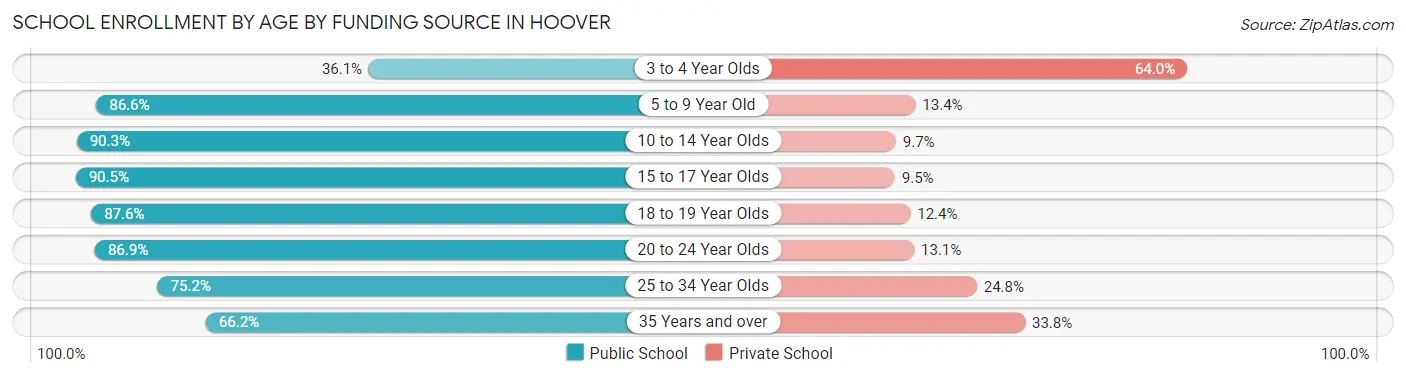
| Age Bracket | Public School | Private School |
| 3 to 4 Year Olds | 398 (36.0%) | 706 (63.9%) |
| 5 to 9 Year Old | 4,888 (86.6%) | 754 (13.4%) |
| 10 to 14 Year Olds | 5,426 (90.3%) | 584 (9.7%) |
| 15 to 17 Year Olds | 3,303 (90.5%) | 348 (9.5%) |
| 18 to 19 Year Olds | 925 (87.6%) | 131 (12.4%) |
| 20 to 24 Year Olds | 1,980 (86.9%) | 299 (13.1%) |
| 25 to 34 Year Olds | 1,001 (75.2%) | 330 (24.8%) |
| 35 Years and over | 843 (66.2%) | 430 (33.8%) |
| Total | 18,771 (84.0%) | 3,575 (16.0%) |
Educational Attainment by Field of Study in Hoover
Business (10,393 | 25.6%), science & technology (4,479 | 11.0%), education (4,460 | 11.0%), engineering (3,156 | 7.8%), and bio, nature & agricultural (2,346 | 5.8%) are the most common fields of study among 40,670 individuals in Hoover who have obtained a bachelor's degree or higher.
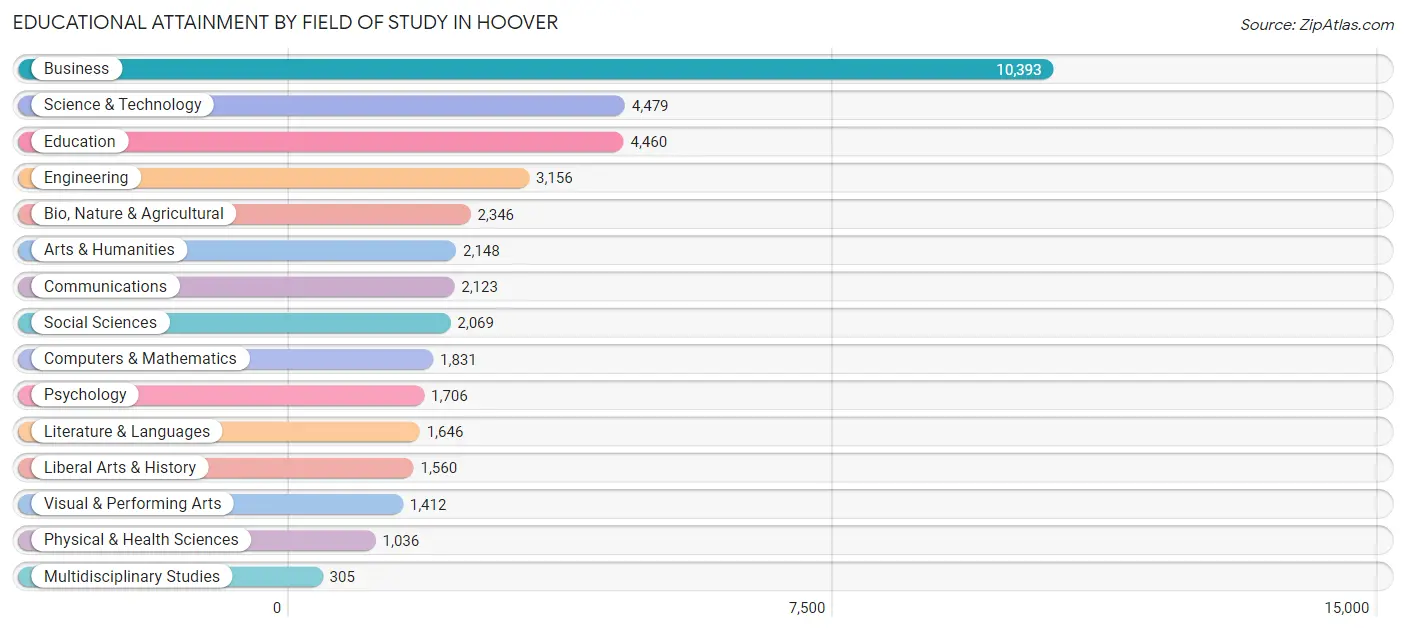
| Field of Study | # Graduates | % Graduates |
| Computers & Mathematics | 1,831 | 4.5% |
| Bio, Nature & Agricultural | 2,346 | 5.8% |
| Physical & Health Sciences | 1,036 | 2.5% |
| Psychology | 1,706 | 4.2% |
| Social Sciences | 2,069 | 5.1% |
| Engineering | 3,156 | 7.8% |
| Multidisciplinary Studies | 305 | 0.7% |
| Science & Technology | 4,479 | 11.0% |
| Business | 10,393 | 25.6% |
| Education | 4,460 | 11.0% |
| Literature & Languages | 1,646 | 4.1% |
| Liberal Arts & History | 1,560 | 3.8% |
| Visual & Performing Arts | 1,412 | 3.5% |
| Communications | 2,123 | 5.2% |
| Arts & Humanities | 2,148 | 5.3% |
| Total | 40,670 | 100.0% |
Transportation & Commute in Hoover
Vehicle Availability by Sex in Hoover
The most prevalent vehicle ownership categories in Hoover are males with 2 vehicles (12,048, accounting for 47.3%) and females with 2 vehicles (9,514, making up 55.9%).
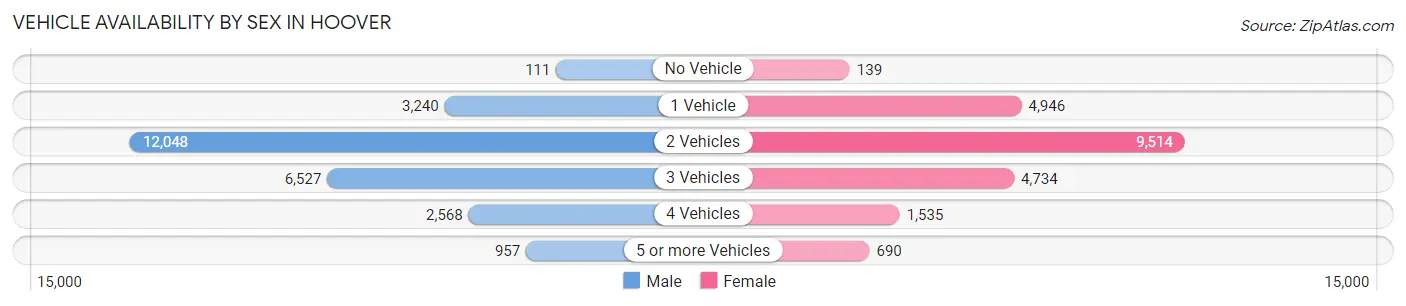
| Vehicles Available | Male | Female |
| No Vehicle | 111 (0.4%) | 139 (0.6%) |
| 1 Vehicle | 3,240 (12.7%) | 4,946 (22.9%) |
| 2 Vehicles | 12,048 (47.3%) | 9,514 (44.1%) |
| 3 Vehicles | 6,527 (25.7%) | 4,734 (22.0%) |
| 4 Vehicles | 2,568 (10.1%) | 1,535 (7.1%) |
| 5 or more Vehicles | 957 (3.8%) | 690 (3.2%) |
| Total | 25,451 (100.0%) | 21,558 (100.0%) |
Commute Time in Hoover
The most frequently occuring commute durations in Hoover are 20 to 24 minutes (8,939 commuters, 21.8%), 30 to 34 minutes (7,600 commuters, 18.5%), and 15 to 19 minutes (6,434 commuters, 15.7%).
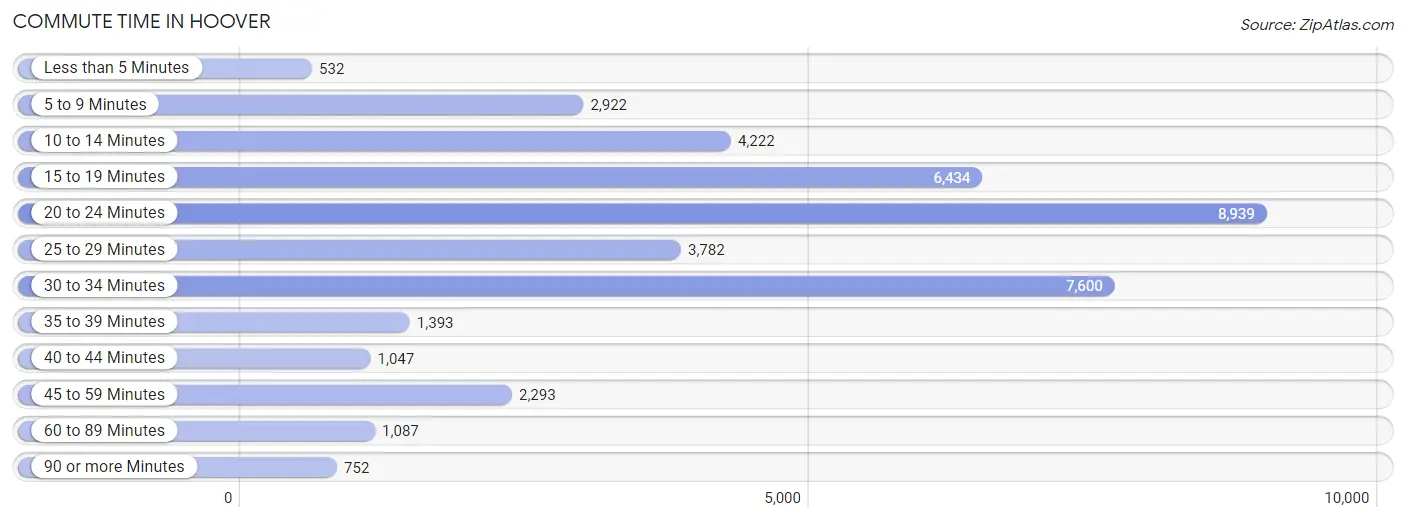
| Commute Time | # Commuters | % Commuters |
| Less than 5 Minutes | 532 | 1.3% |
| 5 to 9 Minutes | 2,922 | 7.1% |
| 10 to 14 Minutes | 4,222 | 10.3% |
| 15 to 19 Minutes | 6,434 | 15.7% |
| 20 to 24 Minutes | 8,939 | 21.8% |
| 25 to 29 Minutes | 3,782 | 9.2% |
| 30 to 34 Minutes | 7,600 | 18.5% |
| 35 to 39 Minutes | 1,393 | 3.4% |
| 40 to 44 Minutes | 1,047 | 2.5% |
| 45 to 59 Minutes | 2,293 | 5.6% |
| 60 to 89 Minutes | 1,087 | 2.6% |
| 90 or more Minutes | 752 | 1.8% |
Commute Time by Sex in Hoover
The most common commute times in Hoover are 20 to 24 minutes (4,613 commuters, 20.7%) for males and 20 to 24 minutes (4,326 commuters, 23.2%) for females.
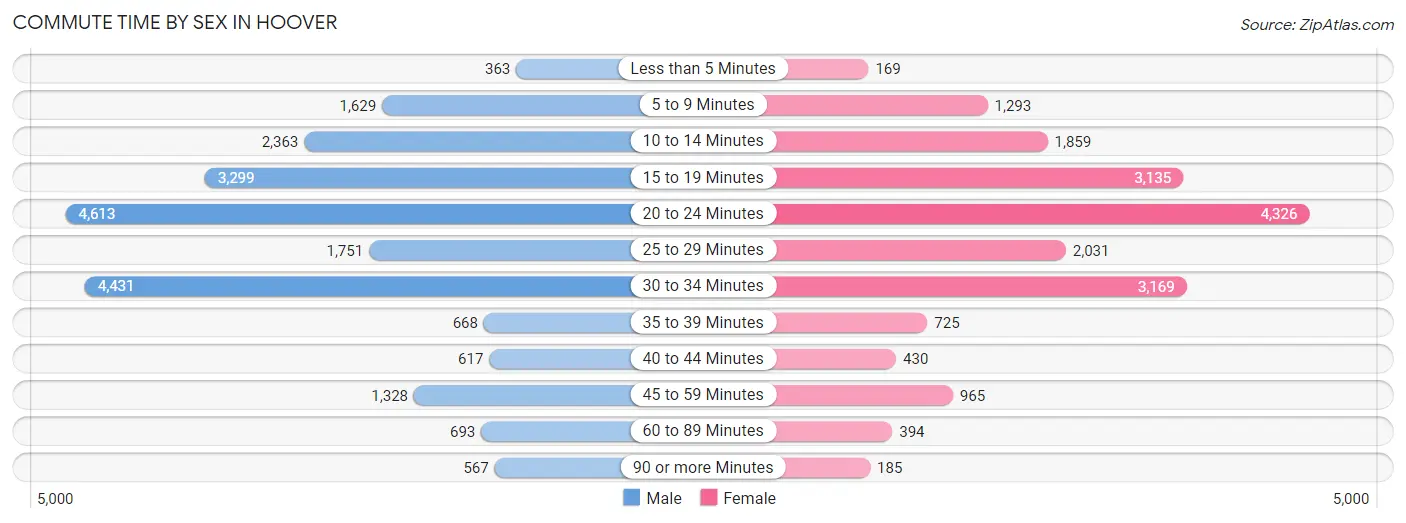
| Commute Time | Male | Female |
| Less than 5 Minutes | 363 (1.6%) | 169 (0.9%) |
| 5 to 9 Minutes | 1,629 (7.3%) | 1,293 (6.9%) |
| 10 to 14 Minutes | 2,363 (10.6%) | 1,859 (10.0%) |
| 15 to 19 Minutes | 3,299 (14.8%) | 3,135 (16.8%) |
| 20 to 24 Minutes | 4,613 (20.7%) | 4,326 (23.2%) |
| 25 to 29 Minutes | 1,751 (7.8%) | 2,031 (10.9%) |
| 30 to 34 Minutes | 4,431 (19.9%) | 3,169 (17.0%) |
| 35 to 39 Minutes | 668 (3.0%) | 725 (3.9%) |
| 40 to 44 Minutes | 617 (2.8%) | 430 (2.3%) |
| 45 to 59 Minutes | 1,328 (5.9%) | 965 (5.2%) |
| 60 to 89 Minutes | 693 (3.1%) | 394 (2.1%) |
| 90 or more Minutes | 567 (2.5%) | 185 (1.0%) |
Time of Departure to Work by Sex in Hoover
The most frequent times of departure to work in Hoover are 7:00 AM to 7:29 AM (3,737, 16.7%) for males and 7:00 AM to 7:29 AM (3,840, 20.6%) for females.
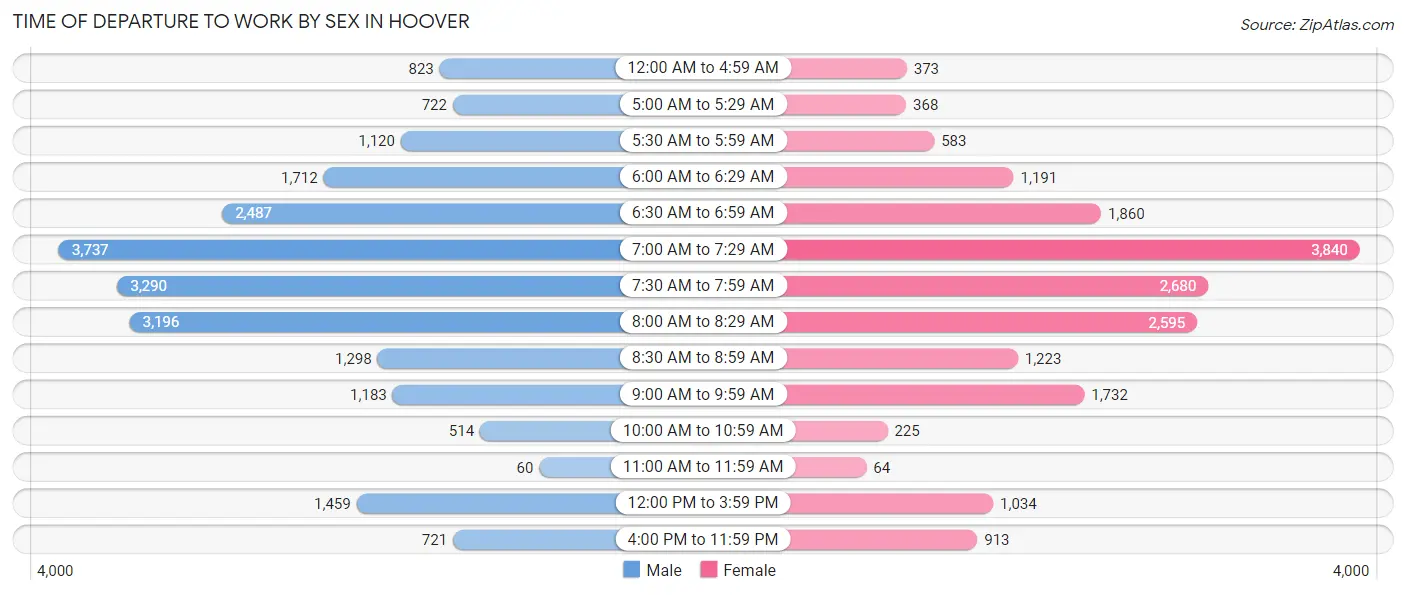
| Time of Departure | Male | Female |
| 12:00 AM to 4:59 AM | 823 (3.7%) | 373 (2.0%) |
| 5:00 AM to 5:29 AM | 722 (3.2%) | 368 (2.0%) |
| 5:30 AM to 5:59 AM | 1,120 (5.0%) | 583 (3.1%) |
| 6:00 AM to 6:29 AM | 1,712 (7.7%) | 1,191 (6.4%) |
| 6:30 AM to 6:59 AM | 2,487 (11.1%) | 1,860 (10.0%) |
| 7:00 AM to 7:29 AM | 3,737 (16.7%) | 3,840 (20.6%) |
| 7:30 AM to 7:59 AM | 3,290 (14.7%) | 2,680 (14.3%) |
| 8:00 AM to 8:29 AM | 3,196 (14.3%) | 2,595 (13.9%) |
| 8:30 AM to 8:59 AM | 1,298 (5.8%) | 1,223 (6.6%) |
| 9:00 AM to 9:59 AM | 1,183 (5.3%) | 1,732 (9.3%) |
| 10:00 AM to 10:59 AM | 514 (2.3%) | 225 (1.2%) |
| 11:00 AM to 11:59 AM | 60 (0.3%) | 64 (0.3%) |
| 12:00 PM to 3:59 PM | 1,459 (6.5%) | 1,034 (5.5%) |
| 4:00 PM to 11:59 PM | 721 (3.2%) | 913 (4.9%) |
| Total | 22,322 (100.0%) | 18,681 (100.0%) |
Housing Occupancy in Hoover
Occupancy by Ownership in Hoover
Of the total 36,189 dwellings in Hoover, owner-occupied units account for 25,141 (69.5%), while renter-occupied units make up 11,048 (30.5%).
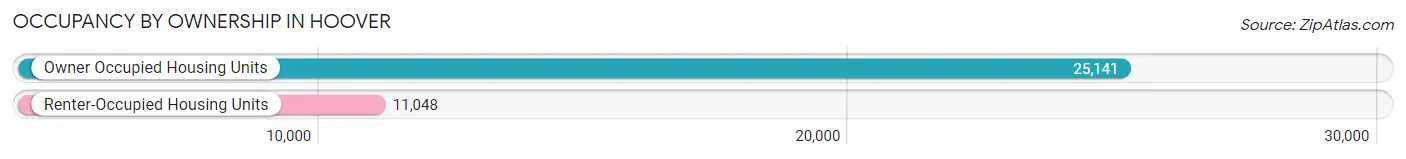
| Occupancy | # Housing Units | % Housing Units |
| Owner Occupied Housing Units | 25,141 | 69.5% |
| Renter-Occupied Housing Units | 11,048 | 30.5% |
| Total Occupied Housing Units | 36,189 | 100.0% |
Occupancy by Household Size in Hoover
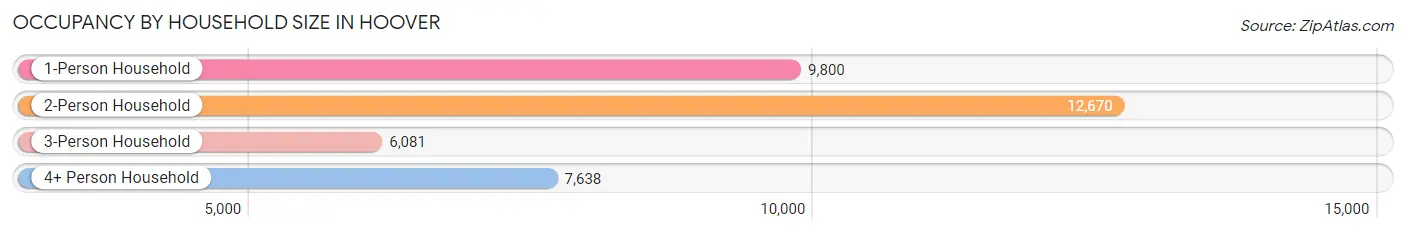
| Household Size | # Housing Units | % Housing Units |
| 1-Person Household | 9,800 | 27.1% |
| 2-Person Household | 12,670 | 35.0% |
| 3-Person Household | 6,081 | 16.8% |
| 4+ Person Household | 7,638 | 21.1% |
| Total Housing Units | 36,189 | 100.0% |
Occupancy by Ownership by Household Size in Hoover
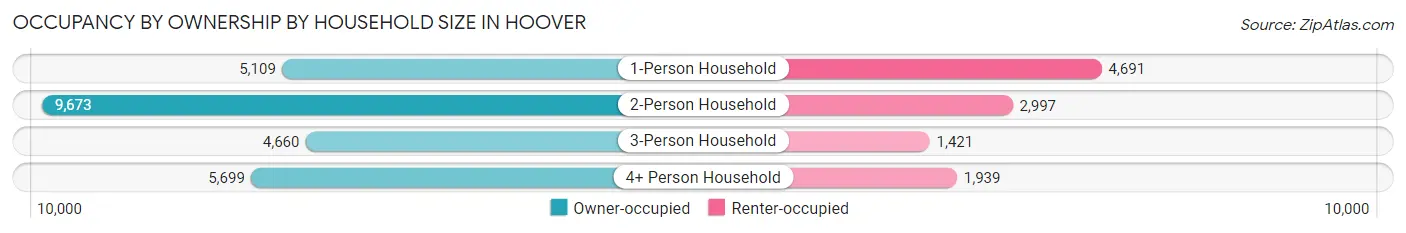
| Household Size | Owner-occupied | Renter-occupied |
| 1-Person Household | 5,109 (52.1%) | 4,691 (47.9%) |
| 2-Person Household | 9,673 (76.3%) | 2,997 (23.6%) |
| 3-Person Household | 4,660 (76.6%) | 1,421 (23.4%) |
| 4+ Person Household | 5,699 (74.6%) | 1,939 (25.4%) |
| Total Housing Units | 25,141 (69.5%) | 11,048 (30.5%) |
Occupancy by Educational Attainment in Hoover
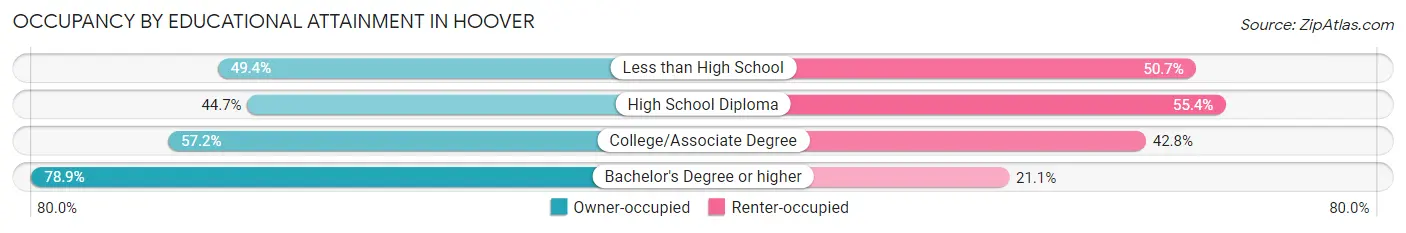
| Household Size | Owner-occupied | Renter-occupied |
| Less than High School | 380 (49.3%) | 390 (50.6%) |
| High School Diploma | 1,675 (44.7%) | 2,076 (55.3%) |
| College/Associate Degree | 5,029 (57.2%) | 3,758 (42.8%) |
| Bachelor's Degree or higher | 18,057 (78.9%) | 4,824 (21.1%) |
Occupancy by Age of Householder in Hoover
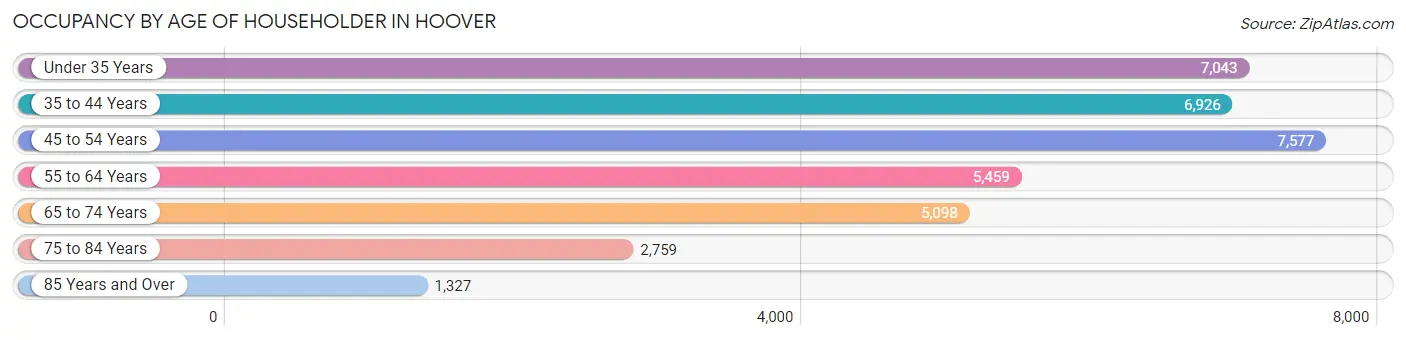
| Age Bracket | # Households | % Households |
| Under 35 Years | 7,043 | 19.5% |
| 35 to 44 Years | 6,926 | 19.1% |
| 45 to 54 Years | 7,577 | 20.9% |
| 55 to 64 Years | 5,459 | 15.1% |
| 65 to 74 Years | 5,098 | 14.1% |
| 75 to 84 Years | 2,759 | 7.6% |
| 85 Years and Over | 1,327 | 3.7% |
| Total | 36,189 | 100.0% |
Housing Finances in Hoover
Median Income by Occupancy in Hoover
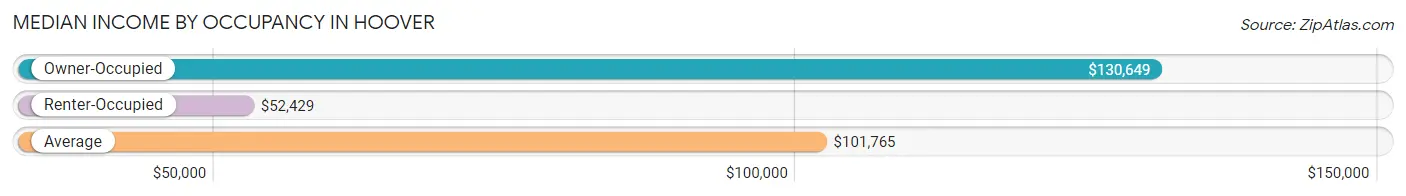
| Occupancy Type | # Households | Median Income |
| Owner-Occupied | 25,141 (69.5%) | $130,649 |
| Renter-Occupied | 11,048 (30.5%) | $52,429 |
| Average | 36,189 (100.0%) | $101,765 |
Occupancy by Householder Income Bracket in Hoover
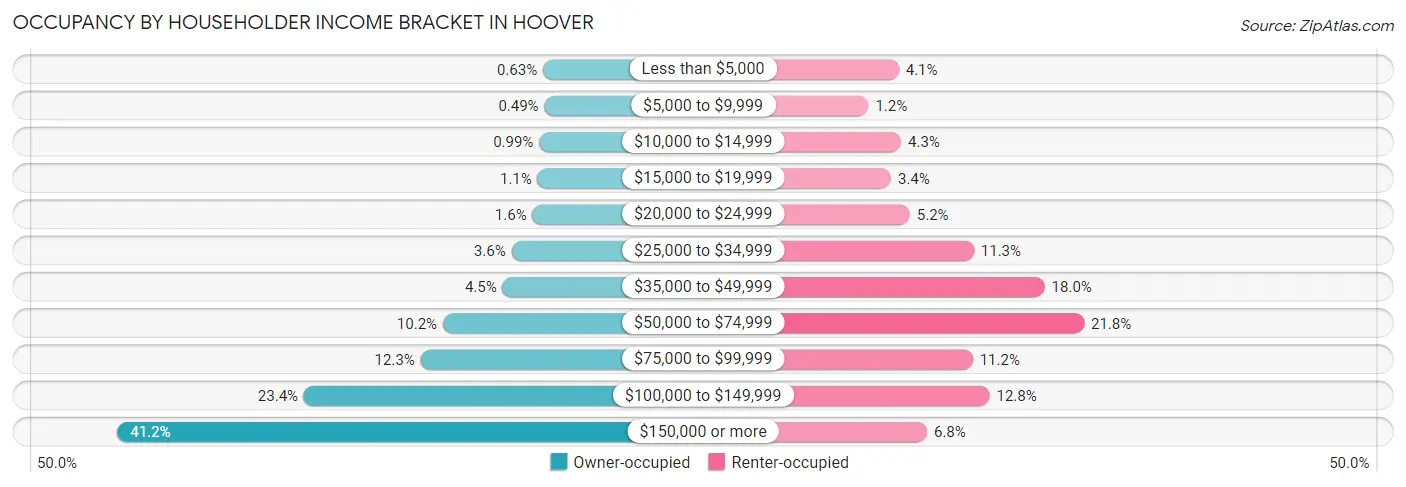
| Income Bracket | Owner-occupied | Renter-occupied |
| Less than $5,000 | 158 (0.6%) | 455 (4.1%) |
| $5,000 to $9,999 | 122 (0.5%) | 136 (1.2%) |
| $10,000 to $14,999 | 250 (1.0%) | 479 (4.3%) |
| $15,000 to $19,999 | 286 (1.1%) | 373 (3.4%) |
| $20,000 to $24,999 | 411 (1.6%) | 571 (5.2%) |
| $25,000 to $34,999 | 913 (3.6%) | 1,245 (11.3%) |
| $35,000 to $49,999 | 1,126 (4.5%) | 1,990 (18.0%) |
| $50,000 to $74,999 | 2,554 (10.2%) | 2,404 (21.8%) |
| $75,000 to $99,999 | 3,087 (12.3%) | 1,233 (11.2%) |
| $100,000 to $149,999 | 5,884 (23.4%) | 1,410 (12.8%) |
| $150,000 or more | 10,350 (41.2%) | 752 (6.8%) |
| Total | 25,141 (100.0%) | 11,048 (100.0%) |
Monthly Housing Cost Tiers in Hoover
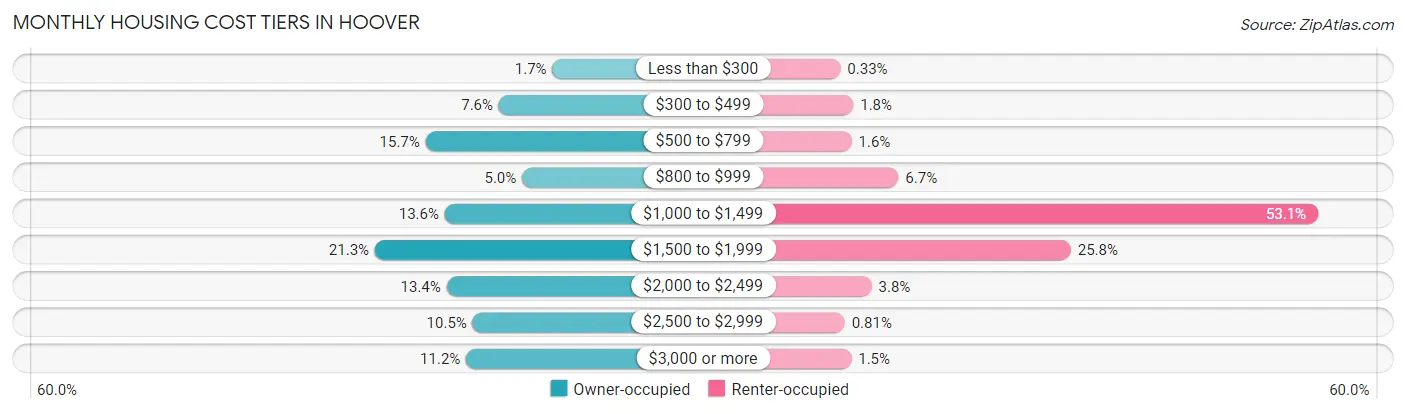
| Monthly Cost | Owner-occupied | Renter-occupied |
| Less than $300 | 424 (1.7%) | 37 (0.3%) |
| $300 to $499 | 1,912 (7.6%) | 193 (1.8%) |
| $500 to $799 | 3,946 (15.7%) | 174 (1.6%) |
| $800 to $999 | 1,266 (5.0%) | 745 (6.7%) |
| $1,000 to $1,499 | 3,415 (13.6%) | 5,864 (53.1%) |
| $1,500 to $1,999 | 5,354 (21.3%) | 2,848 (25.8%) |
| $2,000 to $2,499 | 3,363 (13.4%) | 418 (3.8%) |
| $2,500 to $2,999 | 2,639 (10.5%) | 90 (0.8%) |
| $3,000 or more | 2,822 (11.2%) | 169 (1.5%) |
| Total | 25,141 (100.0%) | 11,048 (100.0%) |
Physical Housing Characteristics in Hoover
Housing Structures in Hoover
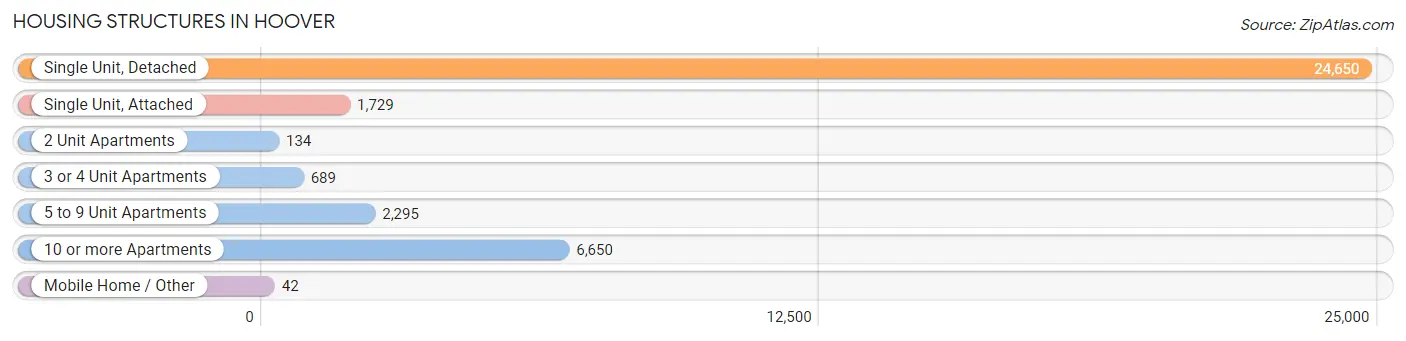
| Structure Type | # Housing Units | % Housing Units |
| Single Unit, Detached | 24,650 | 68.1% |
| Single Unit, Attached | 1,729 | 4.8% |
| 2 Unit Apartments | 134 | 0.4% |
| 3 or 4 Unit Apartments | 689 | 1.9% |
| 5 to 9 Unit Apartments | 2,295 | 6.3% |
| 10 or more Apartments | 6,650 | 18.4% |
| Mobile Home / Other | 42 | 0.1% |
| Total | 36,189 | 100.0% |
Housing Structures by Occupancy in Hoover
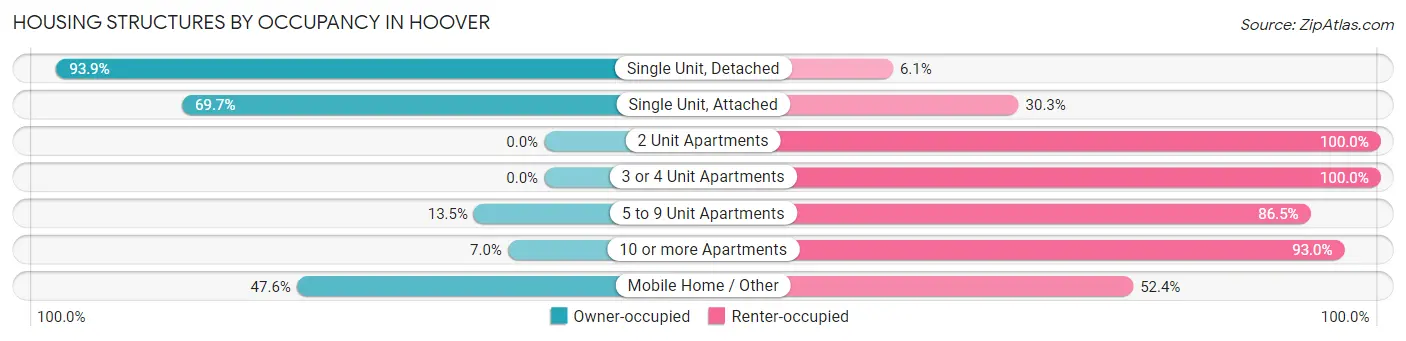
| Structure Type | Owner-occupied | Renter-occupied |
| Single Unit, Detached | 23,142 (93.9%) | 1,508 (6.1%) |
| Single Unit, Attached | 1,205 (69.7%) | 524 (30.3%) |
| 2 Unit Apartments | 0 (0.0%) | 134 (100.0%) |
| 3 or 4 Unit Apartments | 0 (0.0%) | 689 (100.0%) |
| 5 to 9 Unit Apartments | 310 (13.5%) | 1,985 (86.5%) |
| 10 or more Apartments | 464 (7.0%) | 6,186 (93.0%) |
| Mobile Home / Other | 20 (47.6%) | 22 (52.4%) |
| Total | 25,141 (69.5%) | 11,048 (30.5%) |
Housing Structures by Number of Rooms in Hoover
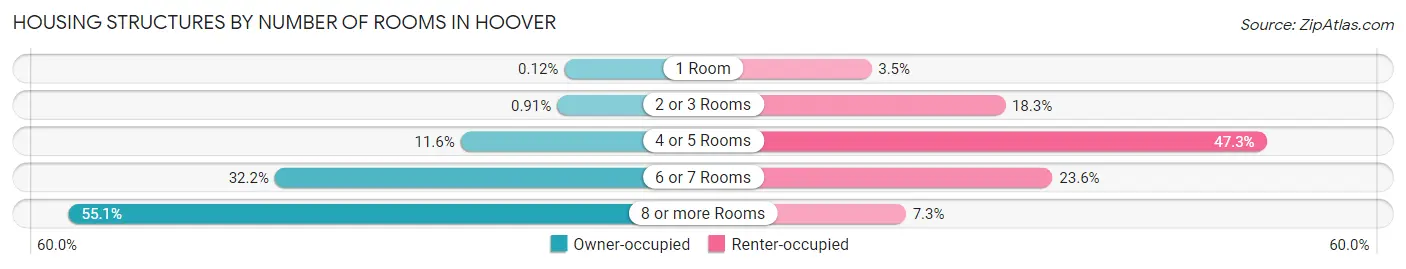
| Number of Rooms | Owner-occupied | Renter-occupied |
| 1 Room | 31 (0.1%) | 384 (3.5%) |
| 2 or 3 Rooms | 229 (0.9%) | 2,024 (18.3%) |
| 4 or 5 Rooms | 2,921 (11.6%) | 5,229 (47.3%) |
| 6 or 7 Rooms | 8,105 (32.2%) | 2,605 (23.6%) |
| 8 or more Rooms | 13,855 (55.1%) | 806 (7.3%) |
| Total | 25,141 (100.0%) | 11,048 (100.0%) |
Housing Structure by Heating Type in Hoover
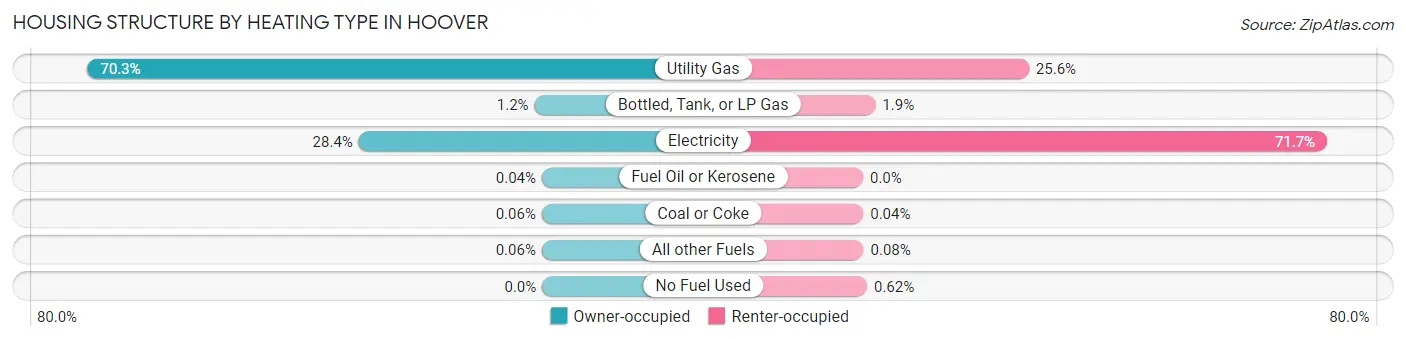
| Heating Type | Owner-occupied | Renter-occupied |
| Utility Gas | 17,671 (70.3%) | 2,833 (25.6%) |
| Bottled, Tank, or LP Gas | 300 (1.2%) | 211 (1.9%) |
| Electricity | 7,129 (28.4%) | 7,923 (71.7%) |
| Fuel Oil or Kerosene | 9 (0.0%) | 0 (0.0%) |
| Coal or Coke | 16 (0.1%) | 4 (0.0%) |
| All other Fuels | 16 (0.1%) | 9 (0.1%) |
| No Fuel Used | 0 (0.0%) | 68 (0.6%) |
| Total | 25,141 (100.0%) | 11,048 (100.0%) |
Household Vehicle Usage in Hoover
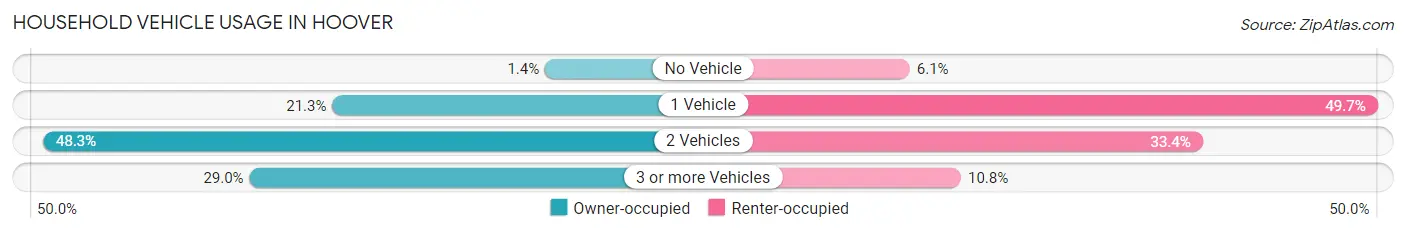
| Vehicles per Household | Owner-occupied | Renter-occupied |
| No Vehicle | 356 (1.4%) | 669 (6.1%) |
| 1 Vehicle | 5,351 (21.3%) | 5,492 (49.7%) |
| 2 Vehicles | 12,140 (48.3%) | 3,689 (33.4%) |
| 3 or more Vehicles | 7,294 (29.0%) | 1,198 (10.8%) |
| Total | 25,141 (100.0%) | 11,048 (100.0%) |
Real Estate & Mortgages in Hoover
Real Estate and Mortgage Overview in Hoover
| Characteristic | Without Mortgage | With Mortgage |
| Housing Units | 7,844 | 17,297 |
| Median Property Value | $348,000 | $372,700 |
| Median Household Income | $101,138 | $8,261 |
| Monthly Housing Costs | $616 | $2,822 |
| Real Estate Taxes | $2,190 | $706 |
Property Value by Mortgage Status in Hoover
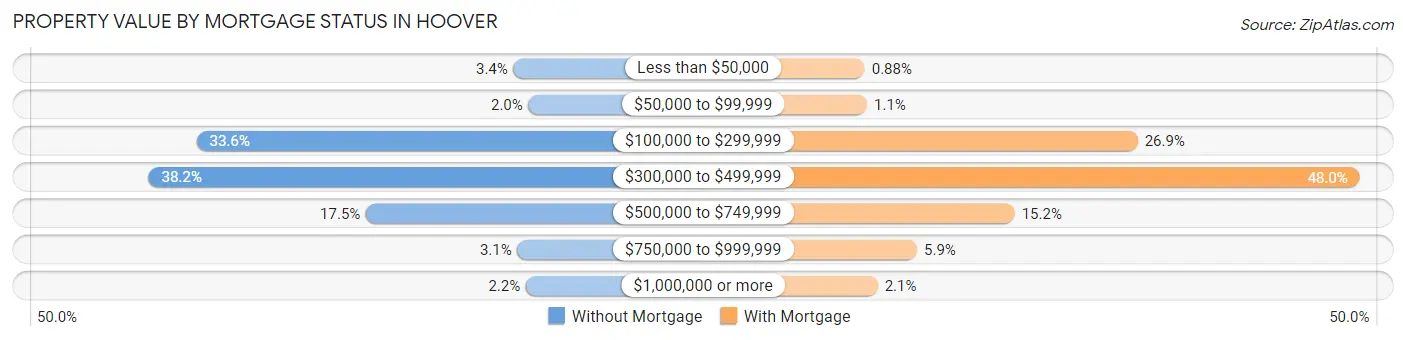
| Property Value | Without Mortgage | With Mortgage |
| Less than $50,000 | 269 (3.4%) | 153 (0.9%) |
| $50,000 to $99,999 | 157 (2.0%) | 191 (1.1%) |
| $100,000 to $299,999 | 2,637 (33.6%) | 4,648 (26.9%) |
| $300,000 to $499,999 | 2,996 (38.2%) | 8,304 (48.0%) |
| $500,000 to $749,999 | 1,370 (17.5%) | 2,623 (15.2%) |
| $750,000 to $999,999 | 239 (3.0%) | 1,013 (5.9%) |
| $1,000,000 or more | 176 (2.2%) | 365 (2.1%) |
| Total | 7,844 (100.0%) | 17,297 (100.0%) |
Household Income by Mortgage Status in Hoover
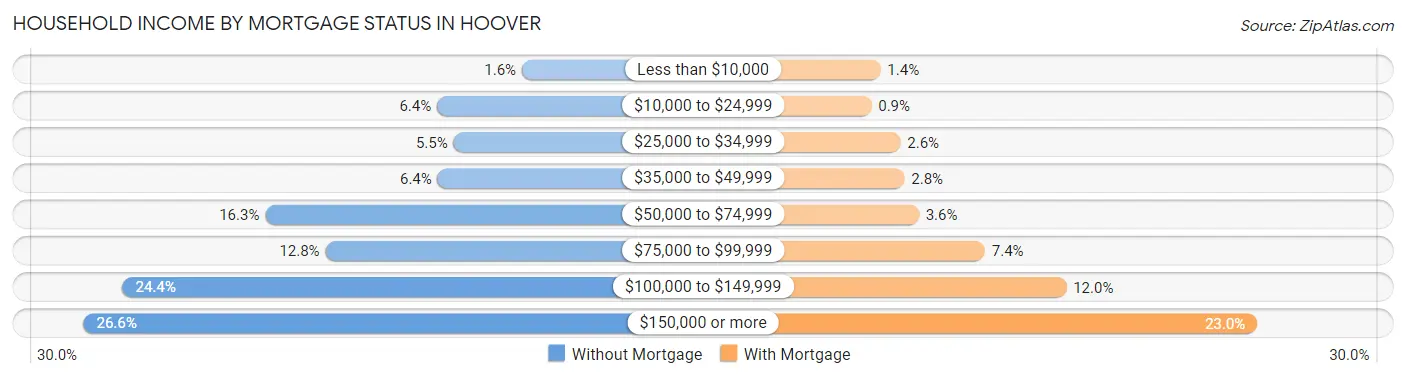
| Household Income | Without Mortgage | With Mortgage |
| Less than $10,000 | 124 (1.6%) | 245 (1.4%) |
| $10,000 to $24,999 | 504 (6.4%) | 156 (0.9%) |
| $25,000 to $34,999 | 431 (5.5%) | 443 (2.6%) |
| $35,000 to $49,999 | 502 (6.4%) | 482 (2.8%) |
| $50,000 to $74,999 | 1,275 (16.3%) | 624 (3.6%) |
| $75,000 to $99,999 | 1,005 (12.8%) | 1,279 (7.4%) |
| $100,000 to $149,999 | 1,914 (24.4%) | 2,082 (12.0%) |
| $150,000 or more | 2,089 (26.6%) | 3,970 (23.0%) |
| Total | 7,844 (100.0%) | 17,297 (100.0%) |
Property Value to Household Income Ratio in Hoover
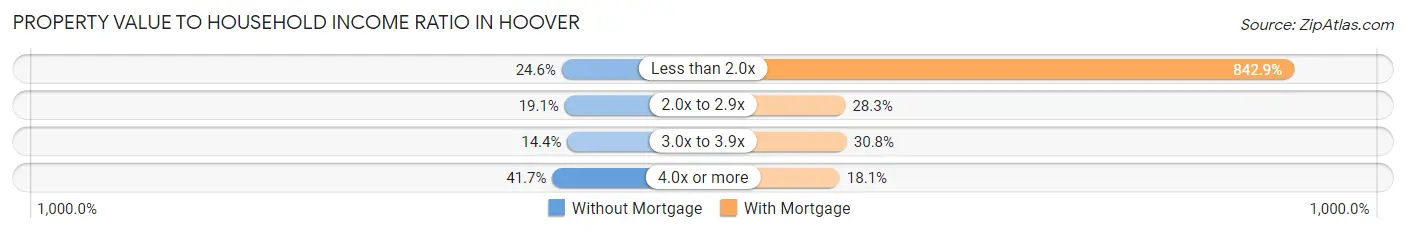
| Value-to-Income Ratio | Without Mortgage | With Mortgage |
| Less than 2.0x | 1,929 (24.6%) | 145,799 (842.9%) |
| 2.0x to 2.9x | 1,501 (19.1%) | 4,891 (28.3%) |
| 3.0x to 3.9x | 1,129 (14.4%) | 5,330 (30.8%) |
| 4.0x or more | 3,268 (41.7%) | 3,134 (18.1%) |
| Total | 7,844 (100.0%) | 17,297 (100.0%) |
Real Estate Taxes by Mortgage Status in Hoover
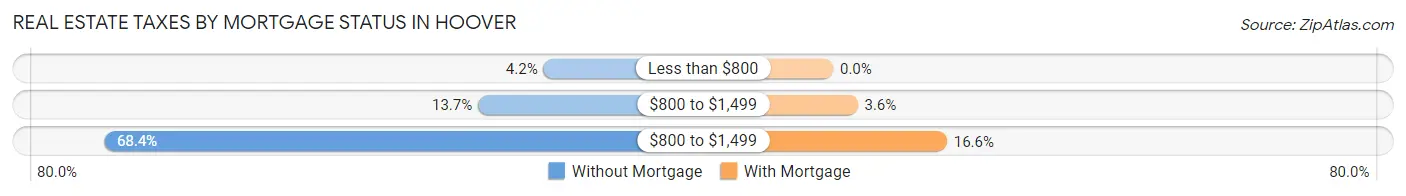
| Property Taxes | Without Mortgage | With Mortgage |
| Less than $800 | 328 (4.2%) | 0 (0.0%) |
| $800 to $1,499 | 1,078 (13.7%) | 619 (3.6%) |
| $800 to $1,499 | 5,365 (68.4%) | 2,874 (16.6%) |
| Total | 7,844 (100.0%) | 17,297 (100.0%) |
Health & Disability in Hoover
Health Insurance Coverage by Age in Hoover
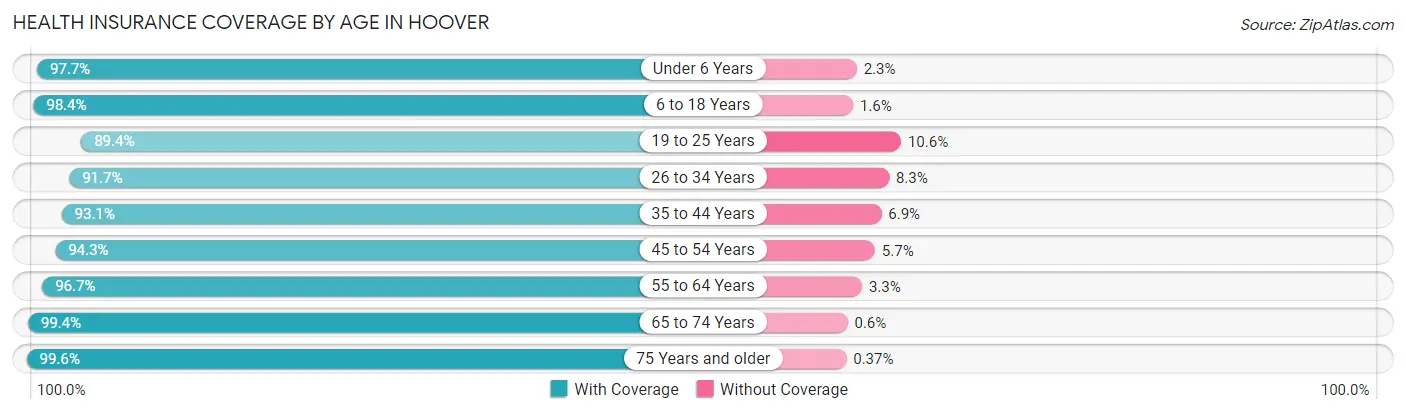
| Age Bracket | With Coverage | Without Coverage |
| Under 6 Years | 7,542 (97.7%) | 178 (2.3%) |
| 6 to 18 Years | 15,025 (98.4%) | 249 (1.6%) |
| 19 to 25 Years | 5,924 (89.4%) | 700 (10.6%) |
| 26 to 34 Years | 10,837 (91.7%) | 985 (8.3%) |
| 35 to 44 Years | 11,890 (93.1%) | 882 (6.9%) |
| 45 to 54 Years | 11,707 (94.3%) | 709 (5.7%) |
| 55 to 64 Years | 9,897 (96.7%) | 337 (3.3%) |
| 65 to 74 Years | 8,142 (99.4%) | 49 (0.6%) |
| 75 Years and older | 6,224 (99.6%) | 23 (0.4%) |
| Total | 87,188 (95.5%) | 4,112 (4.5%) |
Health Insurance Coverage by Citizenship Status in Hoover
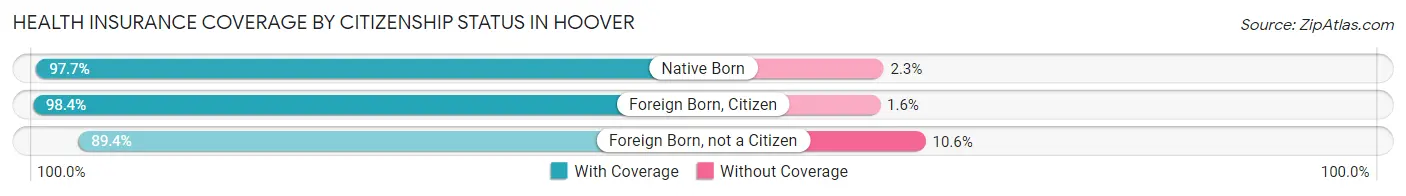
| Citizenship Status | With Coverage | Without Coverage |
| Native Born | 7,542 (97.7%) | 178 (2.3%) |
| Foreign Born, Citizen | 15,025 (98.4%) | 249 (1.6%) |
| Foreign Born, not a Citizen | 5,924 (89.4%) | 700 (10.6%) |
Health Insurance Coverage by Household Income in Hoover
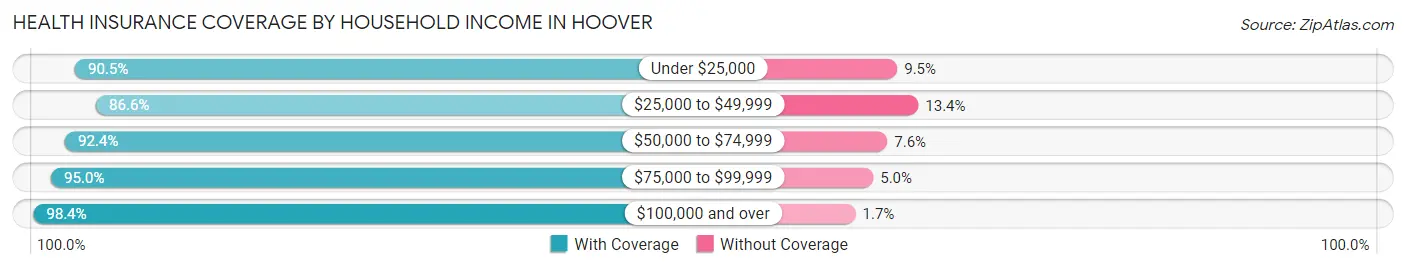
| Household Income | With Coverage | Without Coverage |
| Under $25,000 | 4,947 (90.5%) | 517 (9.5%) |
| $25,000 to $49,999 | 9,397 (86.6%) | 1,455 (13.4%) |
| $50,000 to $74,999 | 8,857 (92.4%) | 727 (7.6%) |
| $75,000 to $99,999 | 9,481 (95.0%) | 495 (5.0%) |
| $100,000 and over | 54,493 (98.4%) | 917 (1.7%) |
Public vs Private Health Insurance Coverage by Age in Hoover
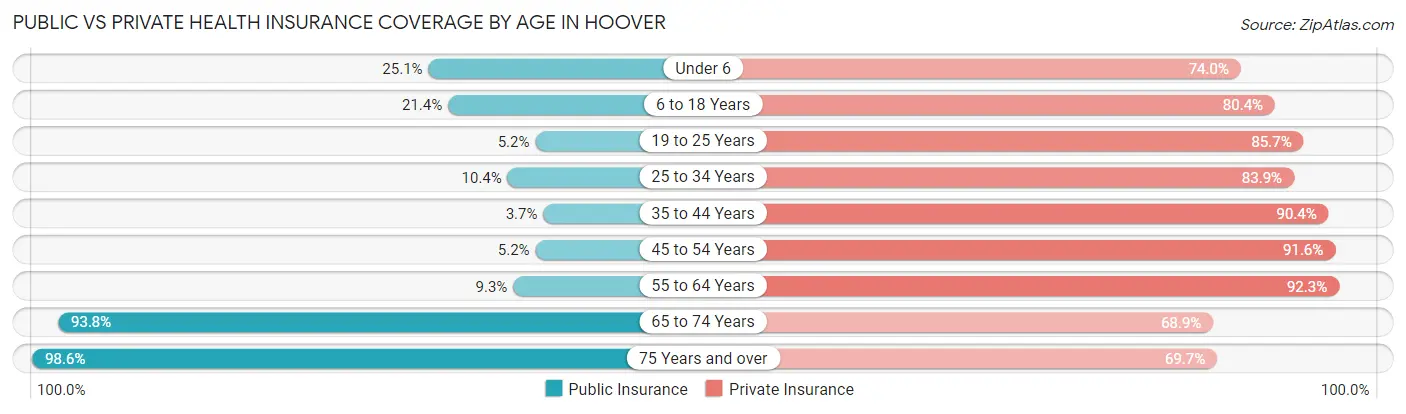
| Age Bracket | Public Insurance | Private Insurance |
| Under 6 | 1,934 (25.1%) | 5,716 (74.0%) |
| 6 to 18 Years | 3,268 (21.4%) | 12,279 (80.4%) |
| 19 to 25 Years | 345 (5.2%) | 5,676 (85.7%) |
| 25 to 34 Years | 1,224 (10.3%) | 9,920 (83.9%) |
| 35 to 44 Years | 476 (3.7%) | 11,539 (90.3%) |
| 45 to 54 Years | 643 (5.2%) | 11,368 (91.6%) |
| 55 to 64 Years | 953 (9.3%) | 9,444 (92.3%) |
| 65 to 74 Years | 7,685 (93.8%) | 5,646 (68.9%) |
| 75 Years and over | 6,161 (98.6%) | 4,351 (69.7%) |
| Total | 22,689 (24.8%) | 75,939 (83.2%) |
Disability Status by Sex by Age in Hoover
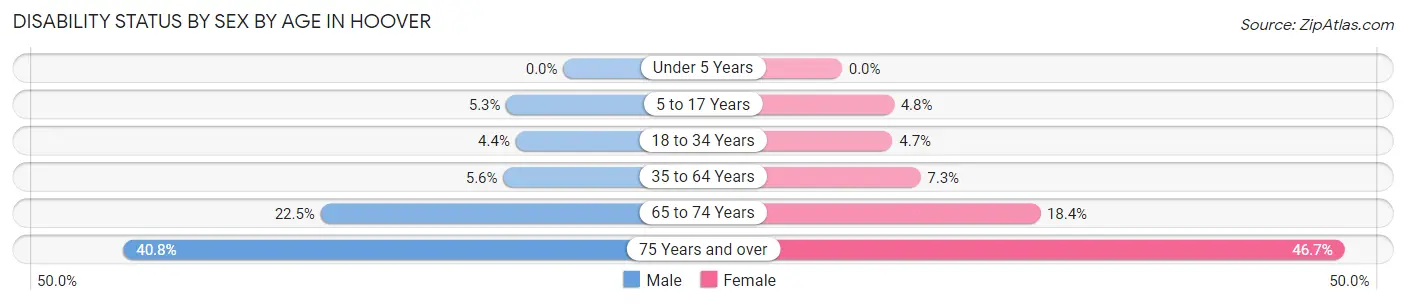
| Age Bracket | Male | Female |
| Under 5 Years | 0 (0.0%) | 0 (0.0%) |
| 5 to 17 Years | 432 (5.3%) | 364 (4.8%) |
| 18 to 34 Years | 436 (4.4%) | 437 (4.7%) |
| 35 to 64 Years | 918 (5.6%) | 1,381 (7.3%) |
| 65 to 74 Years | 866 (22.5%) | 799 (18.4%) |
| 75 Years and over | 1,028 (40.8%) | 1,740 (46.7%) |
Disability Class by Sex by Age in Hoover
Disability Class: Hearing Difficulty
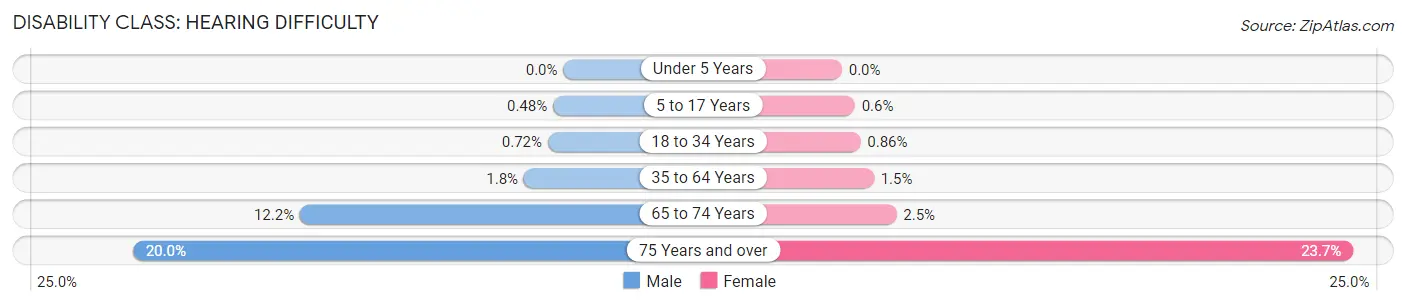
| Age Bracket | Male | Female |
| Under 5 Years | 0 (0.0%) | 0 (0.0%) |
| 5 to 17 Years | 39 (0.5%) | 45 (0.6%) |
| 18 to 34 Years | 71 (0.7%) | 80 (0.9%) |
| 35 to 64 Years | 302 (1.8%) | 281 (1.5%) |
| 65 to 74 Years | 470 (12.2%) | 110 (2.5%) |
| 75 Years and over | 503 (20.0%) | 885 (23.7%) |
Disability Class: Vision Difficulty
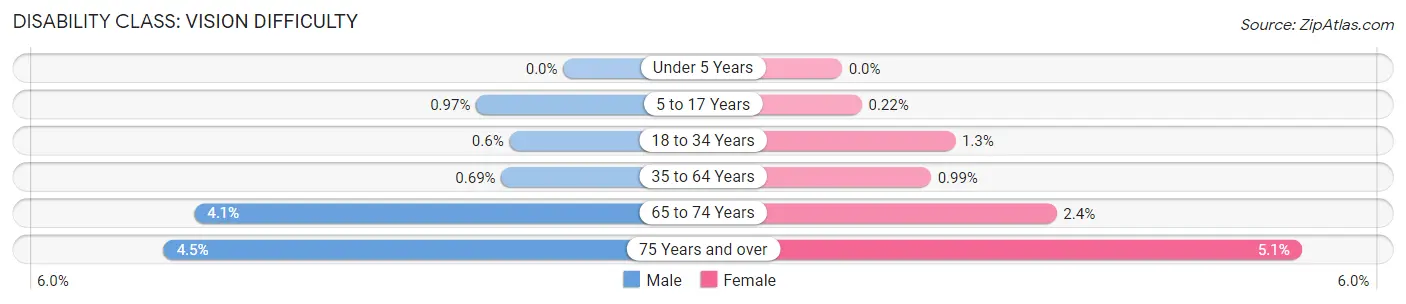
| Age Bracket | Male | Female |
| Under 5 Years | 0 (0.0%) | 0 (0.0%) |
| 5 to 17 Years | 79 (1.0%) | 17 (0.2%) |
| 18 to 34 Years | 59 (0.6%) | 117 (1.3%) |
| 35 to 64 Years | 113 (0.7%) | 188 (1.0%) |
| 65 to 74 Years | 158 (4.1%) | 104 (2.4%) |
| 75 Years and over | 112 (4.4%) | 191 (5.1%) |
Disability Class: Cognitive Difficulty
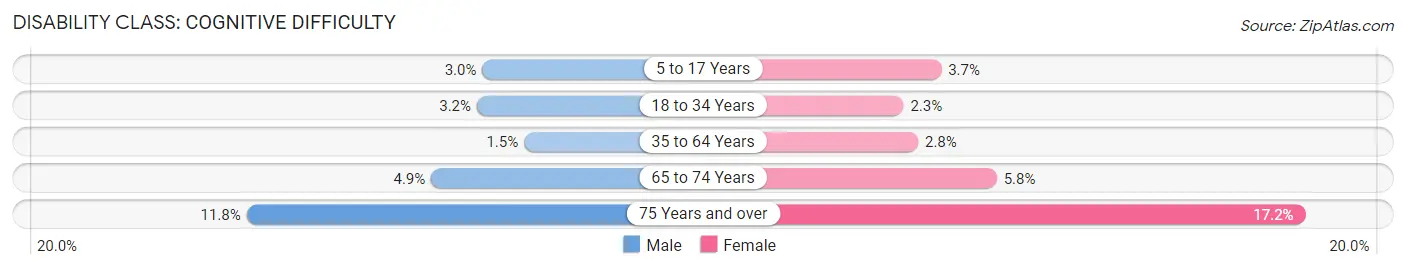
| Age Bracket | Male | Female |
| 5 to 17 Years | 246 (3.0%) | 279 (3.7%) |
| 18 to 34 Years | 317 (3.2%) | 213 (2.3%) |
| 35 to 64 Years | 241 (1.5%) | 535 (2.8%) |
| 65 to 74 Years | 189 (4.9%) | 250 (5.8%) |
| 75 Years and over | 296 (11.8%) | 642 (17.2%) |
Disability Class: Ambulatory Difficulty
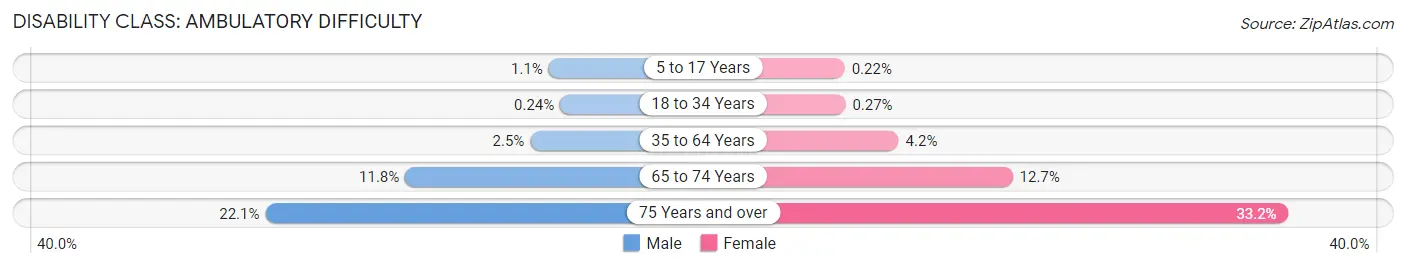
| Age Bracket | Male | Female |
| 5 to 17 Years | 89 (1.1%) | 17 (0.2%) |
| 18 to 34 Years | 24 (0.2%) | 25 (0.3%) |
| 35 to 64 Years | 406 (2.5%) | 799 (4.2%) |
| 65 to 74 Years | 452 (11.7%) | 551 (12.7%) |
| 75 Years and over | 557 (22.1%) | 1,237 (33.2%) |
Disability Class: Self-Care Difficulty
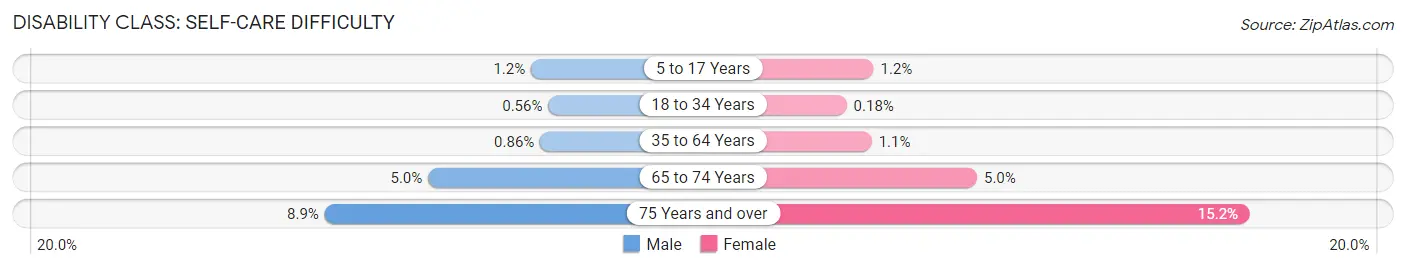
| Age Bracket | Male | Female |
| 5 to 17 Years | 98 (1.2%) | 89 (1.2%) |
| 18 to 34 Years | 55 (0.6%) | 17 (0.2%) |
| 35 to 64 Years | 142 (0.9%) | 210 (1.1%) |
| 65 to 74 Years | 193 (5.0%) | 218 (5.0%) |
| 75 Years and over | 223 (8.9%) | 565 (15.1%) |
Technology Access in Hoover
Computing Device Access in Hoover
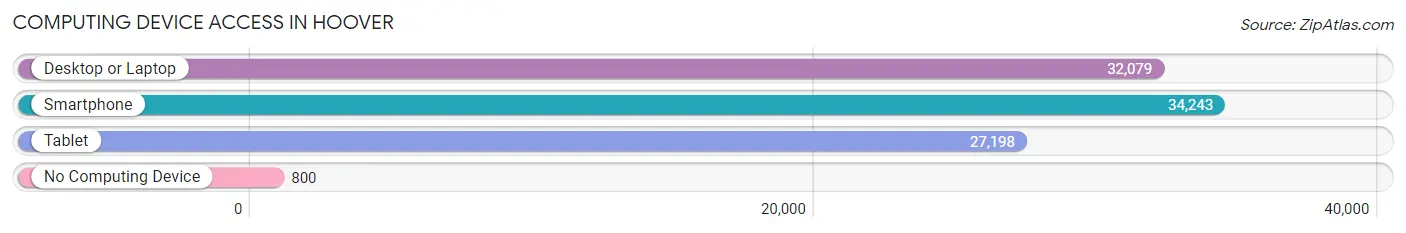
| Device Type | # Households | % Households |
| Desktop or Laptop | 32,079 | 88.6% |
| Smartphone | 34,243 | 94.6% |
| Tablet | 27,198 | 75.2% |
| No Computing Device | 800 | 2.2% |
| Total | 36,189 | 100.0% |
Internet Access in Hoover
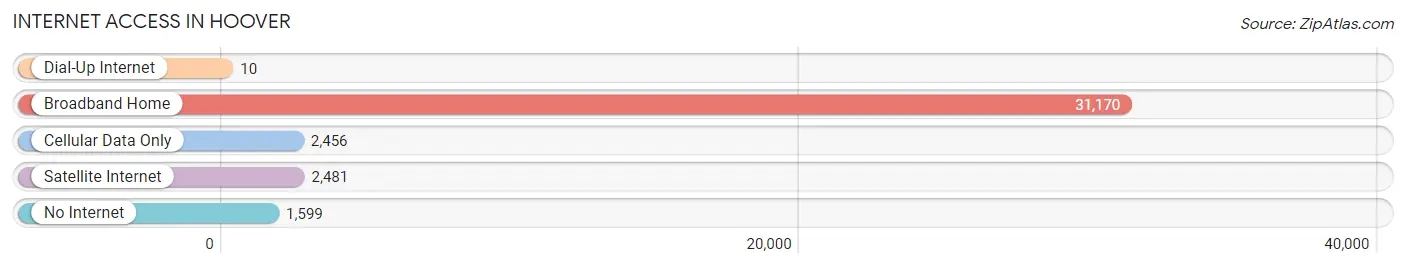
| Internet Type | # Households | % Households |
| Dial-Up Internet | 10 | 0.0% |
| Broadband Home | 31,170 | 86.1% |
| Cellular Data Only | 2,456 | 6.8% |
| Satellite Internet | 2,481 | 6.9% |
| No Internet | 1,599 | 4.4% |
| Total | 36,189 | 100.0% |
Hoover Summary
Hoover, Alabama is a city located in Jefferson and Shelby counties in the state of Alabama. It is a suburb of Birmingham and is part of the Birmingham-Hoover Metropolitan Statistical Area. As of the 2010 census, the population of Hoover was 84,848, making it the second largest city in Alabama.
History
Hoover was founded in 1967 by William H. Hoover, a real estate developer. The city was named after him and was incorporated in 1967. The city was initially developed as a planned community and was designed to be a self-contained city with its own schools, shopping centers, and recreational facilities.
In the late 1970s, the city began to experience rapid growth due to its proximity to Birmingham and its attractive suburban lifestyle. By the 1990s, Hoover had become one of the fastest growing cities in the state and was one of the most affluent cities in the region.
Geography
Hoover is located in central Alabama, approximately 20 miles south of Birmingham. It is situated in the foothills of the Appalachian Mountains and is bordered by the Cahaba River to the east and the Little Cahaba River to the west. The city covers an area of approximately 37 square miles and has an elevation of 600 feet.
Economy
Hoover is a major economic center in the Birmingham-Hoover metropolitan area. The city is home to several major employers, including Regions Bank, Blue Cross Blue Shield of Alabama, and the University of Alabama at Birmingham. The city is also home to several shopping centers, including the Riverchase Galleria, which is the largest shopping mall in the state.
Demographics
As of the 2010 census, the population of Hoover was 84,848. The racial makeup of the city was 79.2% White, 15.3% African American, 0.3% Native American, 2.7% Asian, 0.1% Pacific Islander, 1.2% from other races, and 1.4% from two or more races. Hispanic or Latino of any race were 3.2% of the population.
The median income for a household in the city was $76,845, and the median income for a family was $90,945. The per capita income for the city was $37,945. About 4.2% of families and 5.7% of the population were below the poverty line, including 6.7% of those under age 18 and 4.2% of those age 65 or over.
Common Questions
What is Per Capita Income in Hoover?
Per Capita income in Hoover is $52,906.
What is the Median Family Income in Hoover?
Median Family Income in Hoover is $127,071.
What is the Median Household income in Hoover?
Median Household Income in Hoover is $101,765.
What is Income or Wage Gap in Hoover?
Income or Wage Gap in Hoover is 31.8%.
Women in Hoover earn 68.2 cents for every dollar earned by a man.
What is Family Income Deficit in Hoover?
Family Income Deficit in Hoover is $12,172.
Families that are below poverty line in Hoover earn $12,172 less on average than the poverty threshold level.
What is Inequality or Gini Index in Hoover?
Inequality or Gini Index in Hoover is 0.44.
What is the Total Population of Hoover?
Total Population of Hoover is 91,995.
What is the Total Male Population of Hoover?
Total Male Population of Hoover is 44,066.
What is the Total Female Population of Hoover?
Total Female Population of Hoover is 47,929.
What is the Ratio of Males per 100 Females in Hoover?
There are 91.94 Males per 100 Females in Hoover.
What is the Ratio of Females per 100 Males in Hoover?
There are 108.77 Females per 100 Males in Hoover.
What is the Median Population Age in Hoover?
Median Population Age in Hoover is 38.3 Years.
What is the Average Family Size in Hoover
Average Family Size in Hoover is 3.1 People.
What is the Average Household Size in Hoover
Average Household Size in Hoover is 2.5 People.
How Large is the Labor Force in Hoover?
There are 49,510 People in the Labor Forcein in Hoover.
What is the Percentage of People in the Labor Force in Hoover?
68.4% of People are in the Labor Force in Hoover.
What is the Unemployment Rate in Hoover?
Unemployment Rate in Hoover is 3.9%.