Colbert County, AL Map & Demographics
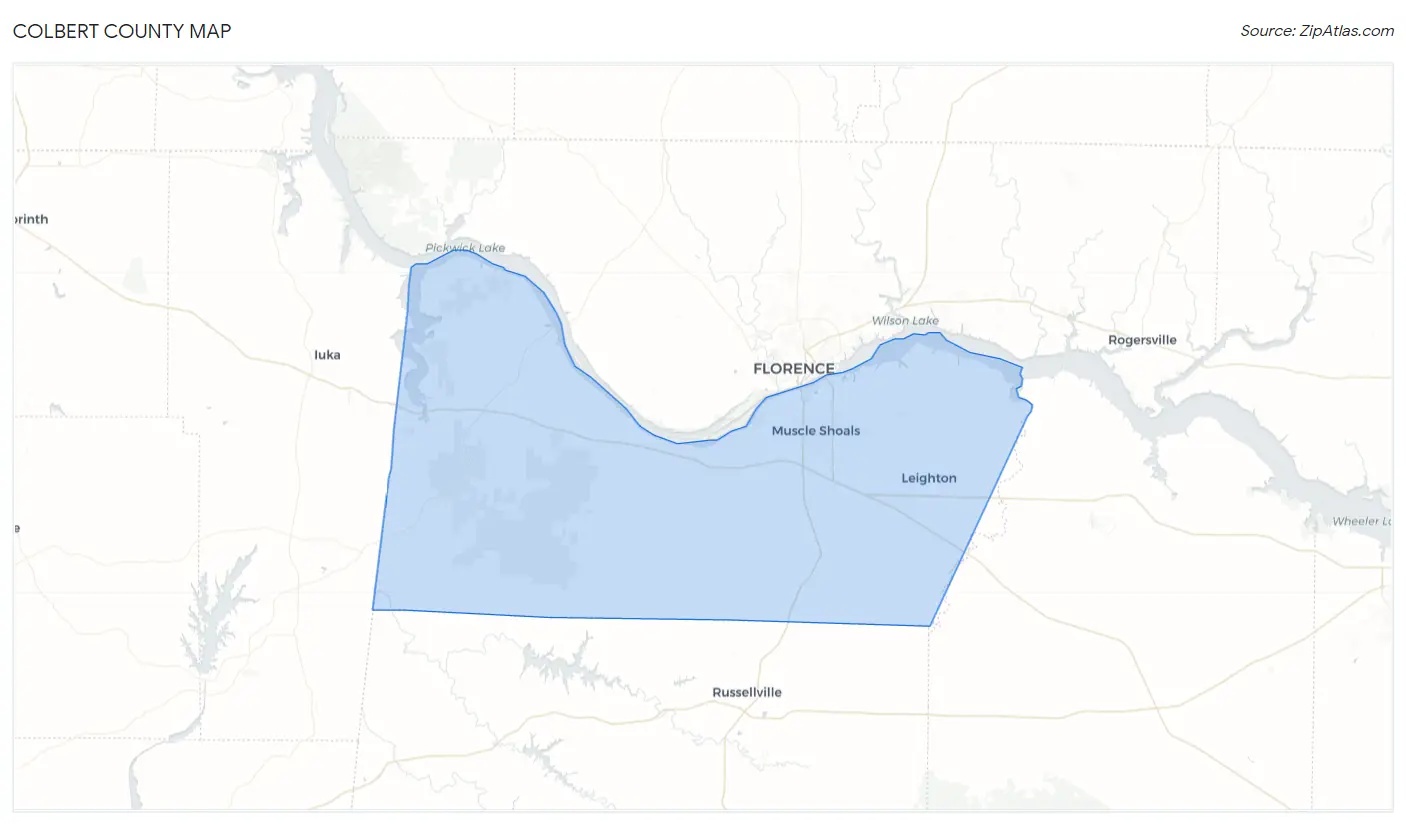
Colbert County Map
Colbert County Overview
$30,724
PER CAPITA INCOME
$69,400
AVG FAMILY INCOME
$56,149
AVG HOUSEHOLD INCOME
38.2%
WAGE / INCOME GAP [ % ]
61.8¢/ $1
WAGE / INCOME GAP [ $ ]
$12,885
FAMILY INCOME DEFICIT
0.45
INEQUALITY / GINI INDEX
57,270
TOTAL POPULATION
27,911
MALE POPULATION
29,359
FEMALE POPULATION
95.07
MALES / 100 FEMALES
105.19
FEMALES / 100 MALES
42.0
MEDIAN AGE
3.0
AVG FAMILY SIZE
2.4
AVG HOUSEHOLD SIZE
26,568
LABOR FORCE [ PEOPLE ]
56.9%
PERCENT IN LABOR FORCE
3.4%
UNEMPLOYMENT RATE
Colbert County Area Codes
Income in Colbert County
Income Overview in Colbert County
Per Capita Income in Colbert County is $30,724, while median incomes of families and households are $69,400 and $56,149 respectively.
| Characteristic | Number | Measure |
| Per Capita Income | 57,270 | $30,724 |
| Median Family Income | 14,999 | $69,400 |
| Mean Family Income | 14,999 | $83,535 |
| Median Household Income | 23,266 | $56,149 |
| Mean Household Income | 23,266 | $71,460 |
| Income Deficit | 14,999 | $12,885 |
| Wage / Income Gap (%) | 57,270 | 38.17% |
| Wage / Income Gap ($) | 57,270 | 61.83¢ per $1 |
| Gini / Inequality Index | 57,270 | 0.45 |
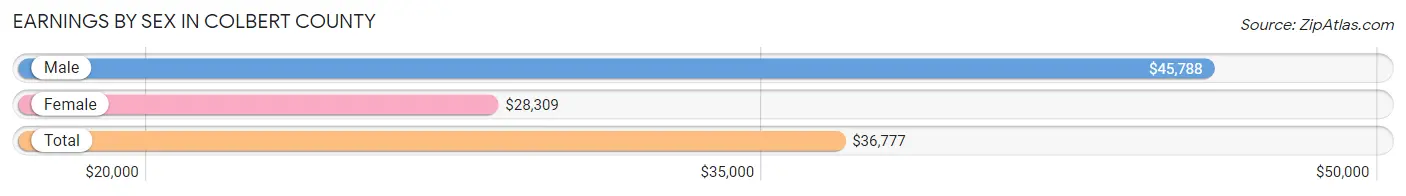
Earnings by Sex in Colbert County
Average Earnings in Colbert County are $36,777, $45,788 for men and $28,309 for women, a difference of 38.2%.
| Sex | Number | Average Earnings |
| Male | 14,347 (52.7%) | $45,788 |
| Female | 12,890 (47.3%) | $28,309 |
| Total | 27,237 (100.0%) | $36,777 |
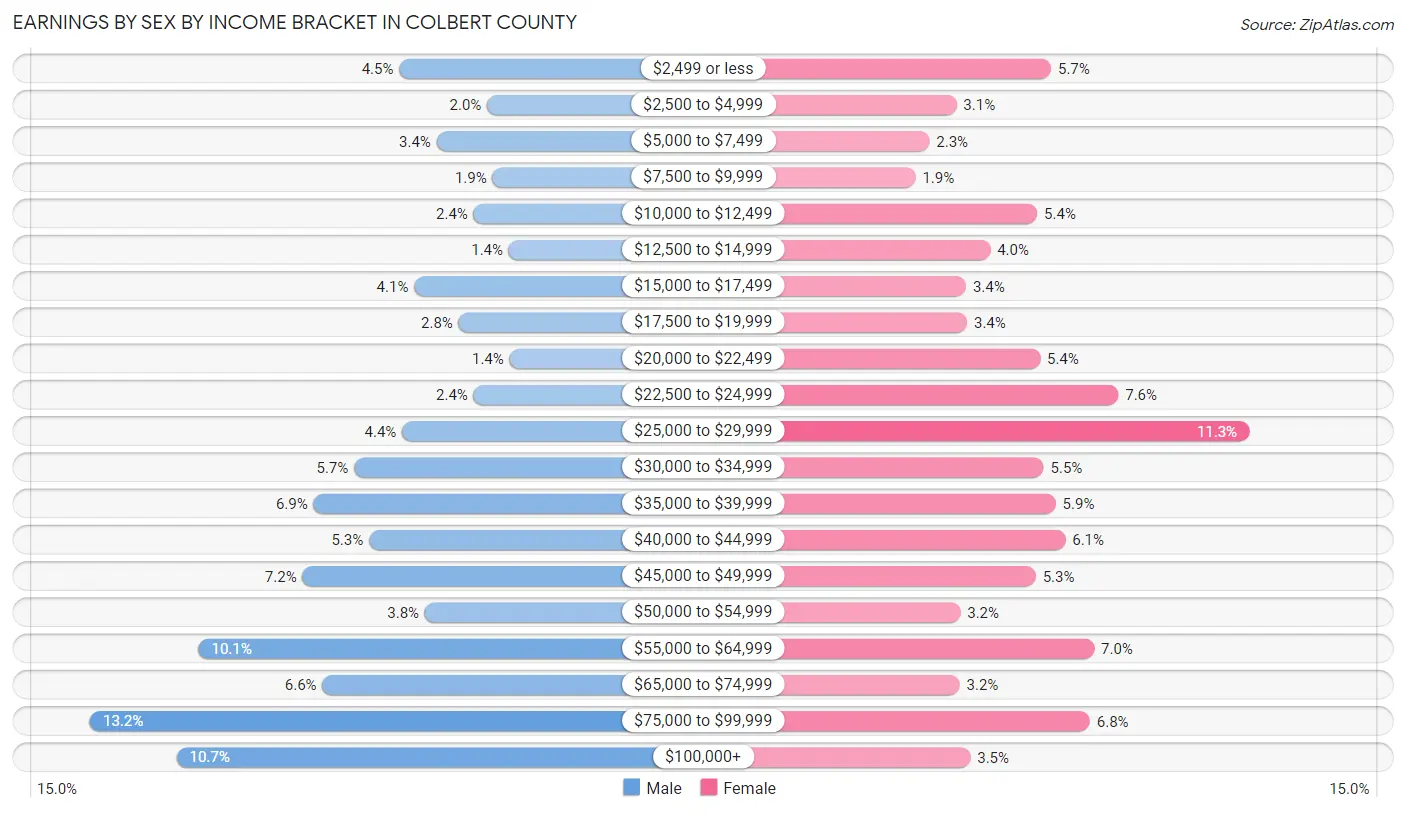
Earnings by Sex by Income Bracket in Colbert County
The most common earnings brackets in Colbert County are $75,000 to $99,999 for men (1,888 | 13.2%) and $25,000 to $29,999 for women (1,457 | 11.3%).
| Income | Male | Female |
| $2,499 or less | 641 (4.5%) | 740 (5.7%) |
| $2,500 to $4,999 | 287 (2.0%) | 397 (3.1%) |
| $5,000 to $7,499 | 490 (3.4%) | 299 (2.3%) |
| $7,500 to $9,999 | 266 (1.8%) | 249 (1.9%) |
| $10,000 to $12,499 | 342 (2.4%) | 689 (5.3%) |
| $12,500 to $14,999 | 200 (1.4%) | 519 (4.0%) |
| $15,000 to $17,499 | 581 (4.1%) | 432 (3.4%) |
| $17,500 to $19,999 | 401 (2.8%) | 436 (3.4%) |
| $20,000 to $22,499 | 196 (1.4%) | 700 (5.4%) |
| $22,500 to $24,999 | 342 (2.4%) | 983 (7.6%) |
| $25,000 to $29,999 | 630 (4.4%) | 1,457 (11.3%) |
| $30,000 to $34,999 | 823 (5.7%) | 713 (5.5%) |
| $35,000 to $39,999 | 987 (6.9%) | 757 (5.9%) |
| $40,000 to $44,999 | 763 (5.3%) | 791 (6.1%) |
| $45,000 to $49,999 | 1,032 (7.2%) | 685 (5.3%) |
| $50,000 to $54,999 | 538 (3.7%) | 411 (3.2%) |
| $55,000 to $64,999 | 1,450 (10.1%) | 896 (7.0%) |
| $65,000 to $74,999 | 951 (6.6%) | 408 (3.2%) |
| $75,000 to $99,999 | 1,888 (13.2%) | 881 (6.8%) |
| $100,000+ | 1,539 (10.7%) | 447 (3.5%) |
| Total | 14,347 (100.0%) | 12,890 (100.0%) |
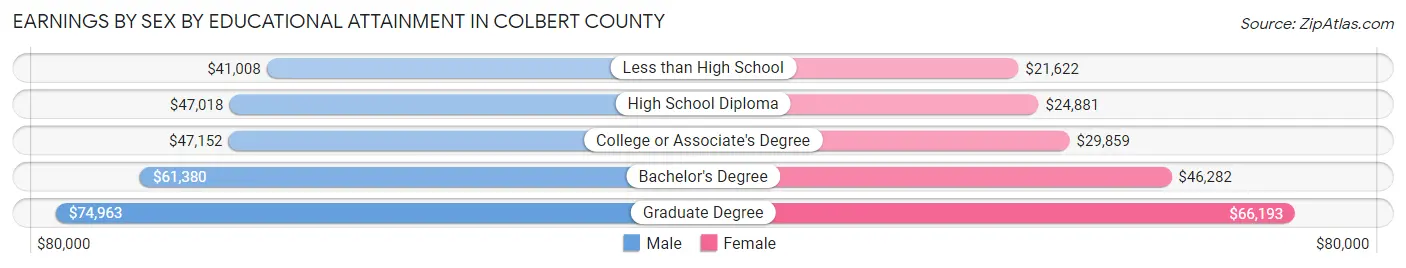
Earnings by Sex by Educational Attainment in Colbert County
Average earnings in Colbert County are $49,344 for men and $32,178 for women, a difference of 34.8%. Men with an educational attainment of graduate degree enjoy the highest average annual earnings of $74,963, while those with less than high school education earn the least with $41,008. Women with an educational attainment of graduate degree earn the most with the average annual earnings of $66,193, while those with less than high school education have the smallest earnings of $21,622.
| Educational Attainment | Male Income | Female Income |
| Less than High School | $41,008 | $21,622 |
| High School Diploma | $47,018 | $24,881 |
| College or Associate's Degree | $47,152 | $29,859 |
| Bachelor's Degree | $61,380 | $46,282 |
| Graduate Degree | $74,963 | $66,193 |
| Total | $49,344 | $32,178 |
Family Income in Colbert County
Family Income Brackets in Colbert County
According to the Colbert County family income data, there are 3,060 families falling into the $50,000 to $74,999 income range, which is the most common income bracket and makes up 20.4% of all families. Conversely, the $10,000 to $14,999 income bracket is the least frequent group with only 360 families (2.4%) belonging to this category.
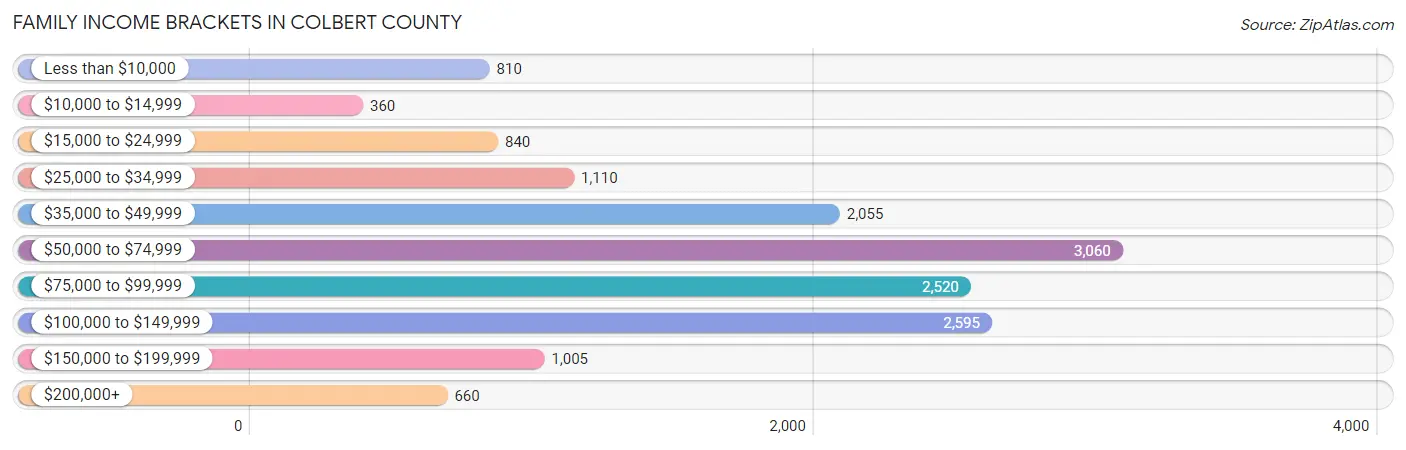
| Income Bracket | # Families | % Families |
| Less than $10,000 | 810 | 5.4% |
| $10,000 to $14,999 | 360 | 2.4% |
| $15,000 to $24,999 | 840 | 5.6% |
| $25,000 to $34,999 | 1,110 | 7.4% |
| $35,000 to $49,999 | 2,055 | 13.7% |
| $50,000 to $74,999 | 3,060 | 20.4% |
| $75,000 to $99,999 | 2,520 | 16.8% |
| $100,000 to $149,999 | 2,595 | 17.3% |
| $150,000 to $199,999 | 1,005 | 6.7% |
| $200,000+ | 660 | 4.4% |
Family Income by Famaliy Size in Colbert County
4-person families (2,661 | 17.7%) account for the highest median family income in Colbert County with $99,295 per family, while 2-person families (8,148 | 54.3%) have the highest median income of $29,594 per family member.
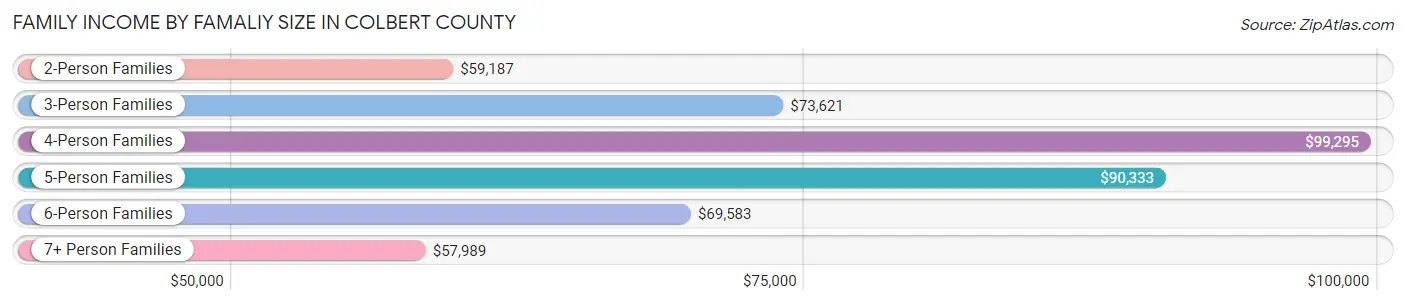
| Income Bracket | # Families | Median Income |
| 2-Person Families | 8,148 (54.3%) | $59,187 |
| 3-Person Families | 2,870 (19.1%) | $73,621 |
| 4-Person Families | 2,661 (17.7%) | $99,295 |
| 5-Person Families | 916 (6.1%) | $90,333 |
| 6-Person Families | 331 (2.2%) | $69,583 |
| 7+ Person Families | 73 (0.5%) | $57,989 |
| Total | 14,999 (100.0%) | $69,400 |
Family Income by Number of Earners in Colbert County
The median family income in Colbert County is $69,400, with families comprising 3+ earners (1,299) having the highest median family income of $129,069, while families with no earners (3,543) have the lowest median family income of $39,744, accounting for 8.7% and 23.6% of families, respectively.
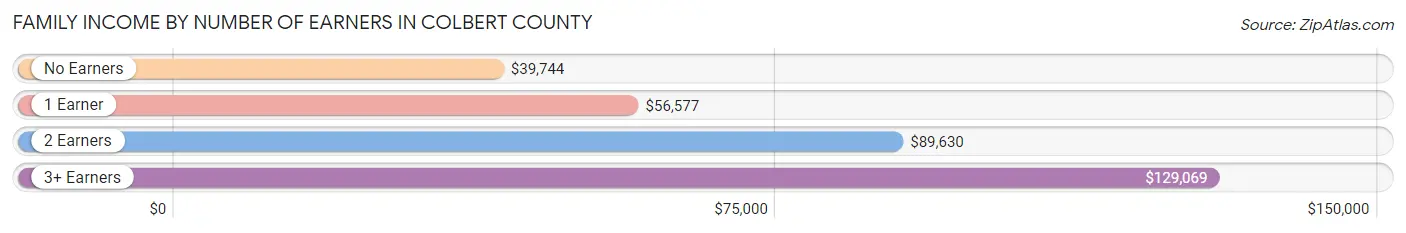
| Number of Earners | # Families | Median Income |
| No Earners | 3,543 (23.6%) | $39,744 |
| 1 Earner | 4,913 (32.8%) | $56,577 |
| 2 Earners | 5,244 (35.0%) | $89,630 |
| 3+ Earners | 1,299 (8.7%) | $129,069 |
| Total | 14,999 (100.0%) | $69,400 |
Household Income in Colbert County
Household Income Brackets in Colbert County
With 4,141 households falling in the category, the $50,000 to $74,999 income range is the most frequent in Colbert County, accounting for 17.8% of all households. In contrast, only 861 households (3.7%) fall into the $200,000+ income bracket, making it the least populous group.
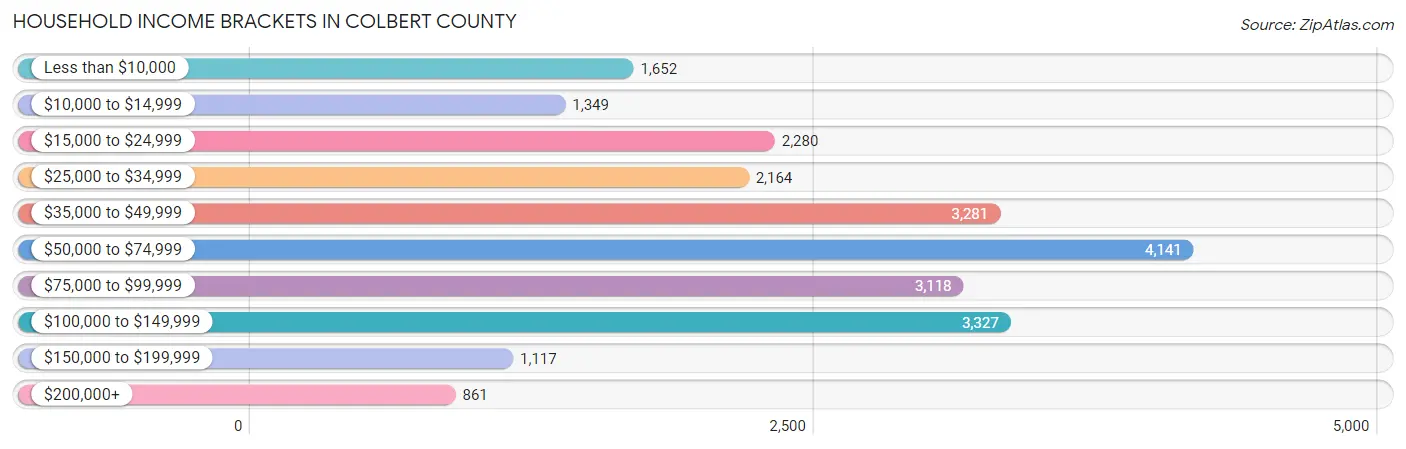
| Income Bracket | # Households | % Households |
| Less than $10,000 | 1,652 | 7.1% |
| $10,000 to $14,999 | 1,349 | 5.8% |
| $15,000 to $24,999 | 2,280 | 9.8% |
| $25,000 to $34,999 | 2,164 | 9.3% |
| $35,000 to $49,999 | 3,281 | 14.1% |
| $50,000 to $74,999 | 4,141 | 17.8% |
| $75,000 to $99,999 | 3,118 | 13.4% |
| $100,000 to $149,999 | 3,327 | 14.3% |
| $150,000 to $199,999 | 1,117 | 4.8% |
| $200,000+ | 861 | 3.7% |
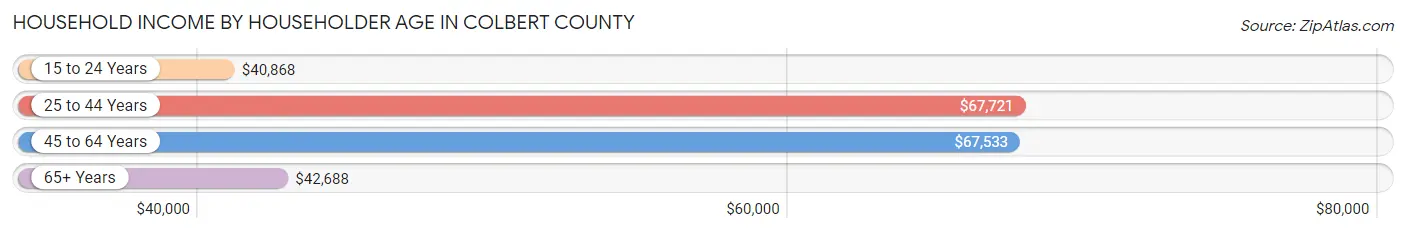
Household Income by Householder Age in Colbert County
The median household income in Colbert County is $56,149, with the highest median household income of $67,721 found in the 25 to 44 years age bracket for the primary householder. A total of 6,483 households (27.9%) fall into this category. Meanwhile, the 15 to 24 years age bracket for the primary householder has the lowest median household income of $40,868, with 935 households (4.0%) in this group.
| Income Bracket | # Households | Median Income |
| 15 to 24 Years | 935 (4.0%) | $40,868 |
| 25 to 44 Years | 6,483 (27.9%) | $67,721 |
| 45 to 64 Years | 8,703 (37.4%) | $67,533 |
| 65+ Years | 7,145 (30.7%) | $42,688 |
| Total | 23,266 (100.0%) | $56,149 |
Poverty in Colbert County
Income Below Poverty by Sex and Age in Colbert County
With 15.0% poverty level for males and 16.7% for females among the residents of Colbert County, under 5 year old males and 6 to 11 year old females are the most vulnerable to poverty, with 954 males (49.9%) and 594 females (32.9%) in their respective age groups living below the poverty level.
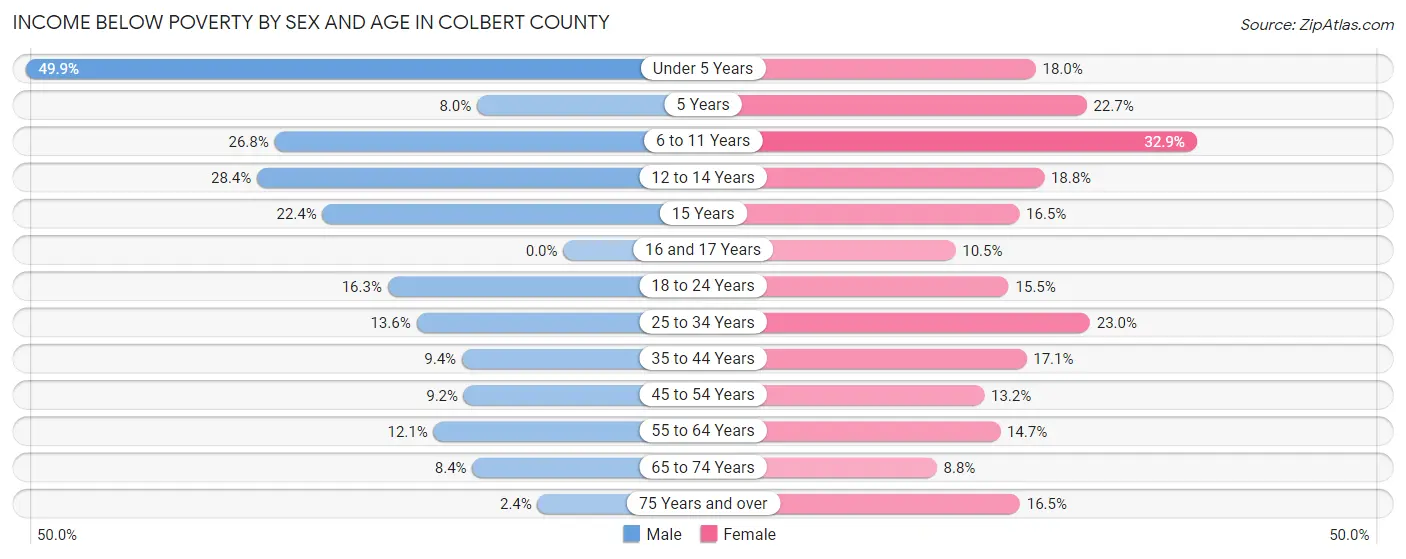
| Age Bracket | Male | Female |
| Under 5 Years | 954 (49.9%) | 219 (18.0%) |
| 5 Years | 25 (8.0%) | 62 (22.7%) |
| 6 to 11 Years | 565 (26.8%) | 594 (32.9%) |
| 12 to 14 Years | 287 (28.4%) | 223 (18.8%) |
| 15 Years | 76 (22.4%) | 39 (16.5%) |
| 16 and 17 Years | 0 (0.0%) | 80 (10.5%) |
| 18 to 24 Years | 366 (16.3%) | 342 (15.5%) |
| 25 to 34 Years | 480 (13.6%) | 817 (23.0%) |
| 35 to 44 Years | 313 (9.4%) | 589 (17.1%) |
| 45 to 54 Years | 331 (9.2%) | 495 (13.2%) |
| 55 to 64 Years | 464 (12.0%) | 611 (14.7%) |
| 65 to 74 Years | 252 (8.4%) | 313 (8.8%) |
| 75 Years and over | 46 (2.4%) | 455 (16.5%) |
| Total | 4,159 (15.0%) | 4,839 (16.7%) |
Income Above Poverty by Sex and Age in Colbert County
According to the poverty statistics in Colbert County, males aged 16 and 17 years and females aged 65 to 74 years are the age groups that are most secure financially, with 100.0% of males and 91.2% of females in these age groups living above the poverty line.
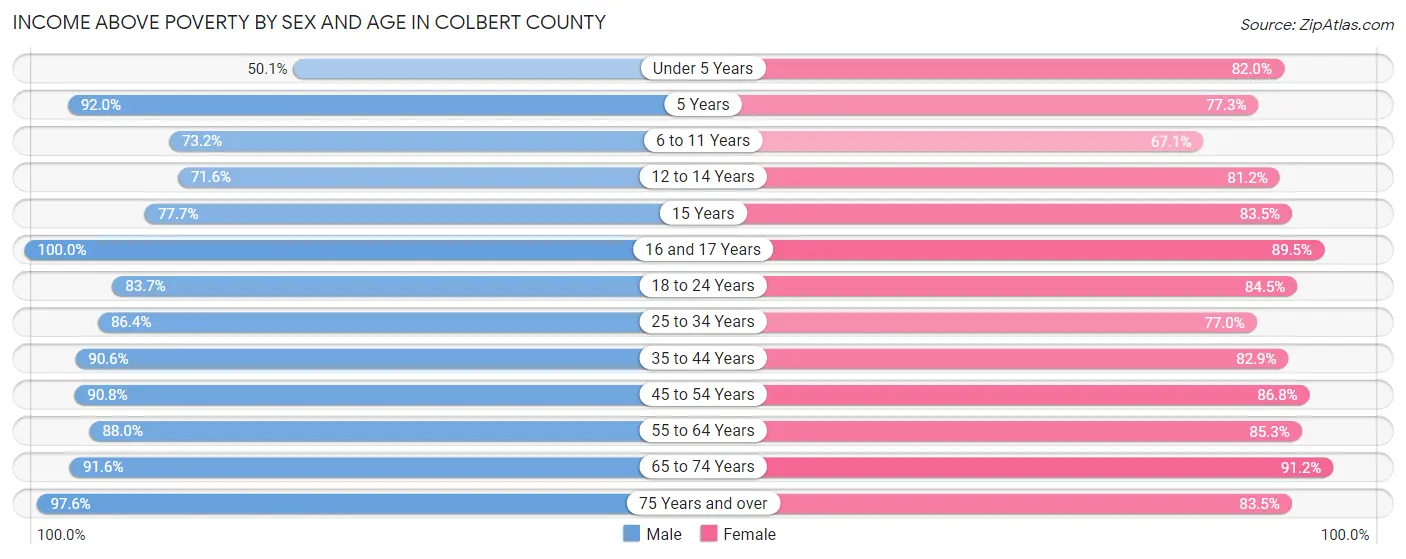
| Age Bracket | Male | Female |
| Under 5 Years | 958 (50.1%) | 999 (82.0%) |
| 5 Years | 287 (92.0%) | 211 (77.3%) |
| 6 to 11 Years | 1,543 (73.2%) | 1,210 (67.1%) |
| 12 to 14 Years | 723 (71.6%) | 966 (81.2%) |
| 15 Years | 264 (77.6%) | 198 (83.5%) |
| 16 and 17 Years | 638 (100.0%) | 680 (89.5%) |
| 18 to 24 Years | 1,880 (83.7%) | 1,868 (84.5%) |
| 25 to 34 Years | 3,041 (86.4%) | 2,732 (77.0%) |
| 35 to 44 Years | 3,014 (90.6%) | 2,852 (82.9%) |
| 45 to 54 Years | 3,257 (90.8%) | 3,254 (86.8%) |
| 55 to 64 Years | 3,386 (87.9%) | 3,552 (85.3%) |
| 65 to 74 Years | 2,735 (91.6%) | 3,244 (91.2%) |
| 75 Years and over | 1,878 (97.6%) | 2,299 (83.5%) |
| Total | 23,604 (85.0%) | 24,065 (83.3%) |
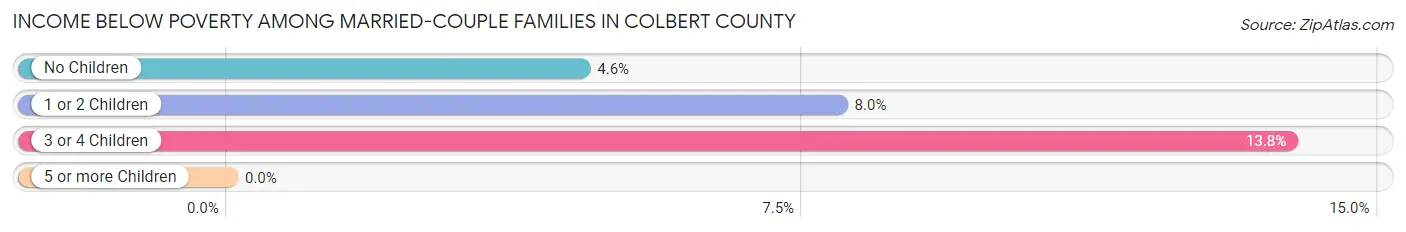
Income Below Poverty Among Married-Couple Families in Colbert County
The poverty statistics for married-couple families in Colbert County show that 6.0% or 665 of the total 11,064 families live below the poverty line. Families with 3 or 4 children have the highest poverty rate of 13.8%, comprising of 80 families. On the other hand, families with 5 or more children have the lowest poverty rate of 0.0%, which includes 0 families.
| Children | Above Poverty | Below Poverty |
| No Children | 7,064 (95.4%) | 341 (4.6%) |
| 1 or 2 Children | 2,823 (92.0%) | 244 (8.0%) |
| 3 or 4 Children | 498 (86.2%) | 80 (13.8%) |
| 5 or more Children | 14 (100.0%) | 0 (0.0%) |
| Total | 10,399 (94.0%) | 665 (6.0%) |
Income Below Poverty Among Single-Parent Households in Colbert County
According to the poverty data in Colbert County, 16.1% or 140 single-father households and 32.1% or 983 single-mother households are living below the poverty line. Among single-father households, those with 1 or 2 children have the highest poverty rate, with 102 households (23.1%) experiencing poverty. Likewise, among single-mother households, those with 5 or more children have the highest poverty rate, with 123 households (100.0%) falling below the poverty line.
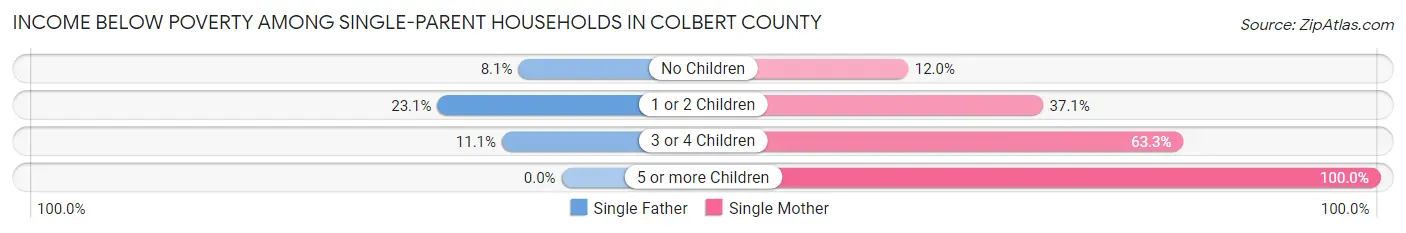
| Children | Single Father | Single Mother |
| No Children | 26 (8.1%) | 153 (11.9%) |
| 1 or 2 Children | 102 (23.1%) | 485 (37.0%) |
| 3 or 4 Children | 12 (11.1%) | 222 (63.2%) |
| 5 or more Children | 0 (0.0%) | 123 (100.0%) |
| Total | 140 (16.1%) | 983 (32.1%) |
Income Below Poverty Among Married-Couple vs Single-Parent Households in Colbert County
The poverty data for Colbert County shows that 665 of the married-couple family households (6.0%) and 1,123 of the single-parent households (28.5%) are living below the poverty level. Within the married-couple family households, those with 3 or 4 children have the highest poverty rate, with 80 households (13.8%) falling below the poverty line. Among the single-parent households, those with 5 or more children have the highest poverty rate, with 123 household (100.0%) living below poverty.
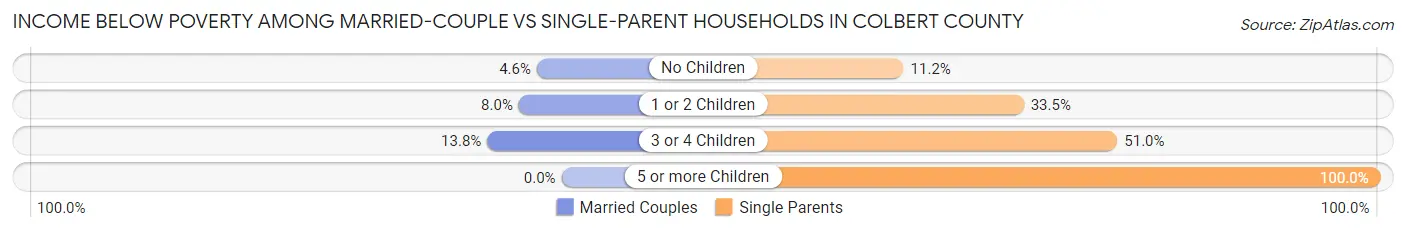
| Children | Married-Couple Families | Single-Parent Households |
| No Children | 341 (4.6%) | 179 (11.2%) |
| 1 or 2 Children | 244 (8.0%) | 587 (33.5%) |
| 3 or 4 Children | 80 (13.8%) | 234 (51.0%) |
| 5 or more Children | 0 (0.0%) | 123 (100.0%) |
| Total | 665 (6.0%) | 1,123 (28.5%) |
Race in Colbert County
The most populous races in Colbert County are White / Caucasian (44,698 | 78.0%), Black / African American (9,185 | 16.0%), and Hispanic or Latino (1,837 | 3.2%).
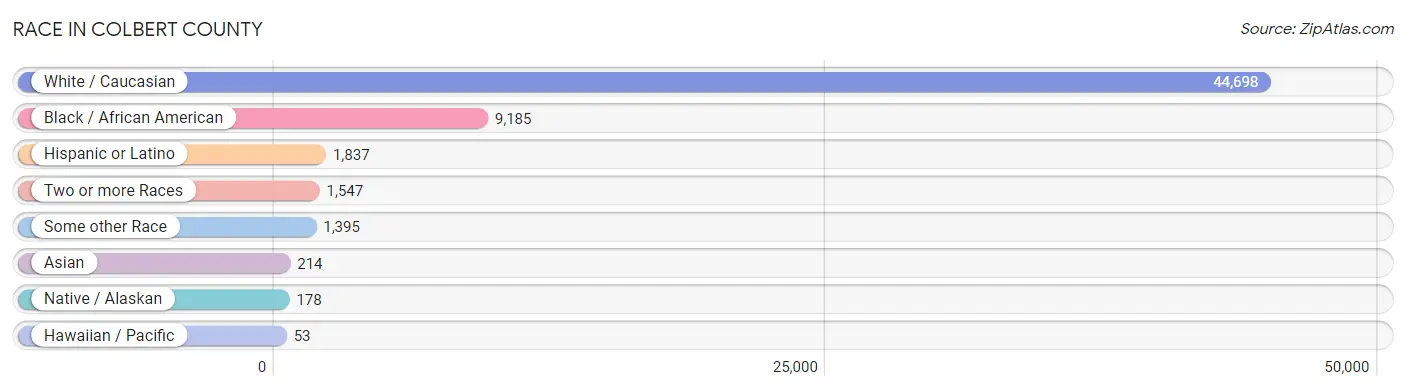
| Race | # Population | % Population |
| Asian | 214 | 0.4% |
| Black / African American | 9,185 | 16.0% |
| Hawaiian / Pacific | 53 | 0.1% |
| Hispanic or Latino | 1,837 | 3.2% |
| Native / Alaskan | 178 | 0.3% |
| White / Caucasian | 44,698 | 78.0% |
| Two or more Races | 1,547 | 2.7% |
| Some other Race | 1,395 | 2.4% |
| Total | 57,270 | 100.0% |
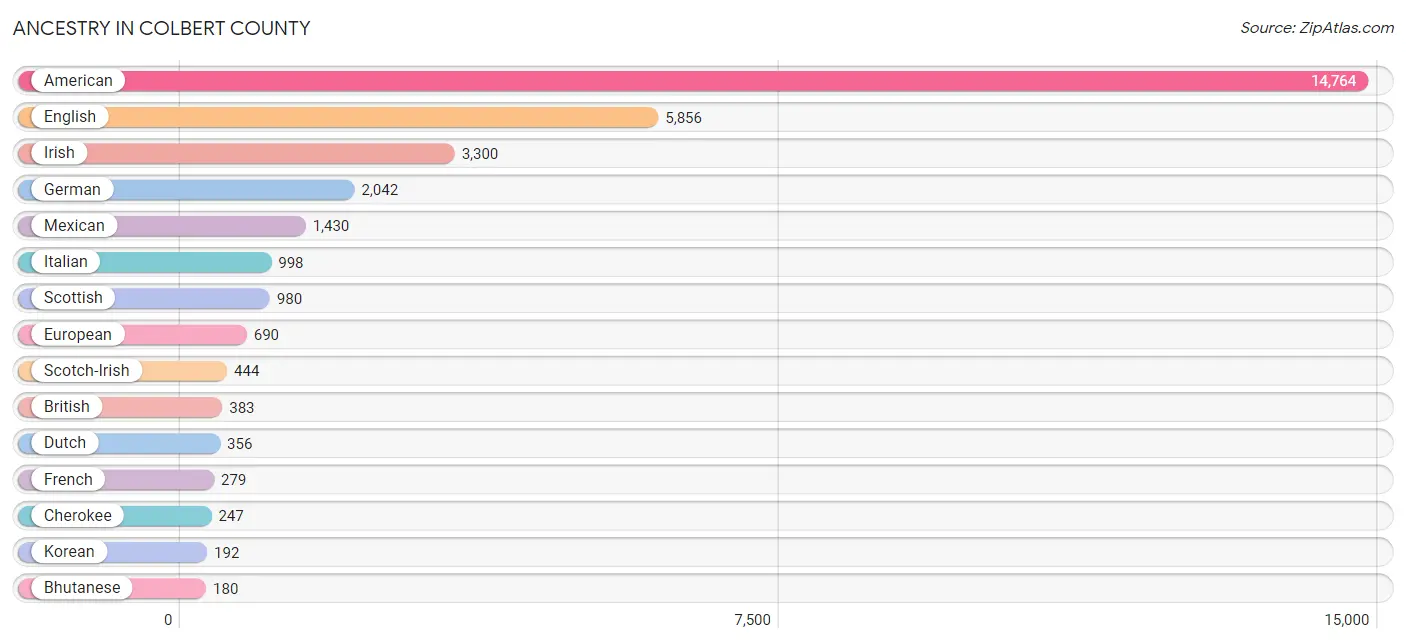
Ancestry in Colbert County
The most populous ancestries reported in Colbert County are American (14,764 | 25.8%), English (5,856 | 10.2%), Irish (3,300 | 5.8%), German (2,042 | 3.6%), and Mexican (1,430 | 2.5%), together accounting for 47.8% of all Colbert County residents.
| Ancestry | # Population | % Population |
| African | 133 | 0.2% |
| American | 14,764 | 25.8% |
| Arab | 24 | 0.0% |
| Australian | 30 | 0.1% |
| Austrian | 11 | 0.0% |
| Belgian | 14 | 0.0% |
| Bhutanese | 180 | 0.3% |
| British | 383 | 0.7% |
| Burmese | 16 | 0.0% |
| Canadian | 1 | 0.0% |
| Central American | 153 | 0.3% |
| Cherokee | 247 | 0.4% |
| Chickasaw | 42 | 0.1% |
| Choctaw | 17 | 0.0% |
| Creek | 30 | 0.1% |
| Croatian | 10 | 0.0% |
| Cuban | 59 | 0.1% |
| Czech | 11 | 0.0% |
| Dominican | 40 | 0.1% |
| Dutch | 356 | 0.6% |
| Eastern European | 20 | 0.0% |
| English | 5,856 | 10.2% |
| European | 690 | 1.2% |
| Finnish | 14 | 0.0% |
| French | 279 | 0.5% |
| German | 2,042 | 3.6% |
| Greek | 25 | 0.0% |
| Guamanian / Chamorro | 21 | 0.0% |
| Guatemalan | 74 | 0.1% |
| Houma | 8 | 0.0% |
| Hungarian | 3 | 0.0% |
| Indian (Asian) | 5 | 0.0% |
| Irish | 3,300 | 5.8% |
| Italian | 998 | 1.7% |
| Korean | 192 | 0.3% |
| Lithuanian | 11 | 0.0% |
| Lumbee | 15 | 0.0% |
| Mexican | 1,430 | 2.5% |
| Mexican American Indian | 45 | 0.1% |
| Native Hawaiian | 47 | 0.1% |
| Navajo | 9 | 0.0% |
| Northern European | 5 | 0.0% |
| Norwegian | 92 | 0.2% |
| Pakistani | 86 | 0.2% |
| Pennsylvania German | 10 | 0.0% |
| Polish | 157 | 0.3% |
| Portuguese | 34 | 0.1% |
| Puerto Rican | 91 | 0.2% |
| Romanian | 16 | 0.0% |
| Russian | 13 | 0.0% |
| Salvadoran | 79 | 0.1% |
| Scandinavian | 67 | 0.1% |
| Scotch-Irish | 444 | 0.8% |
| Scottish | 980 | 1.7% |
| Spaniard | 30 | 0.1% |
| Spanish | 12 | 0.0% |
| Subsaharan African | 133 | 0.2% |
| Swedish | 132 | 0.2% |
| Swiss | 63 | 0.1% |
| Thai | 97 | 0.2% |
| Ukrainian | 4 | 0.0% |
| Welsh | 150 | 0.3% |
| West Indian | 12 | 0.0% |
| Yugoslavian | 14 | 0.0% | View All 64 Rows |
Immigrants in Colbert County
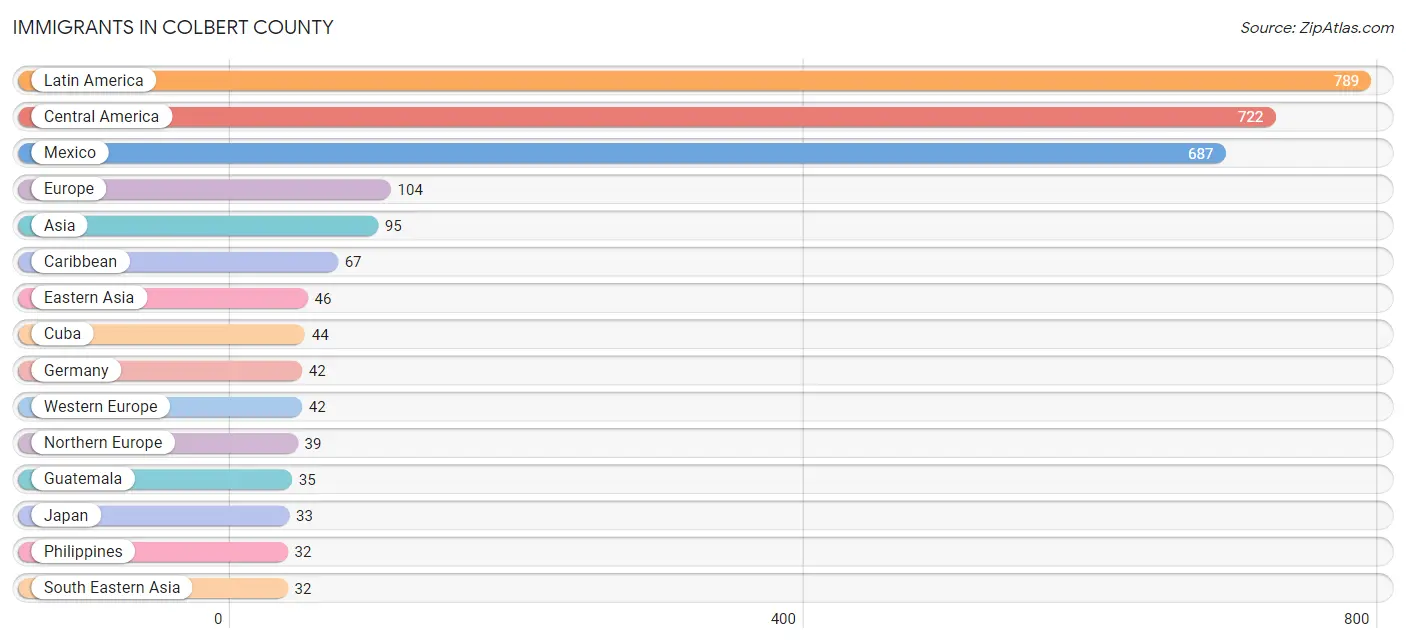
The most numerous immigrant groups reported in Colbert County came from Latin America (789 | 1.4%), Central America (722 | 1.3%), Mexico (687 | 1.2%), Europe (104 | 0.2%), and Asia (95 | 0.2%), together accounting for 4.2% of all Colbert County residents.
| Immigration Origin | # Population | % Population |
| Asia | 95 | 0.2% |
| Azores | 7 | 0.0% |
| Caribbean | 67 | 0.1% |
| Central America | 722 | 1.3% |
| China | 5 | 0.0% |
| Cuba | 44 | 0.1% |
| Eastern Asia | 46 | 0.1% |
| Eastern Europe | 16 | 0.0% |
| Europe | 104 | 0.2% |
| Germany | 42 | 0.1% |
| Guatemala | 35 | 0.1% |
| India | 17 | 0.0% |
| Jamaica | 11 | 0.0% |
| Japan | 33 | 0.1% |
| Korea | 8 | 0.0% |
| Latin America | 789 | 1.4% |
| Mexico | 687 | 1.2% |
| Northern Europe | 39 | 0.1% |
| Philippines | 32 | 0.1% |
| Portugal | 7 | 0.0% |
| Romania | 16 | 0.0% |
| South Central Asia | 17 | 0.0% |
| South Eastern Asia | 32 | 0.1% |
| Southern Europe | 7 | 0.0% |
| Trinidad and Tobago | 12 | 0.0% |
| Western Europe | 42 | 0.1% | View All 26 Rows |
Sex and Age in Colbert County
Sex and Age in Colbert County
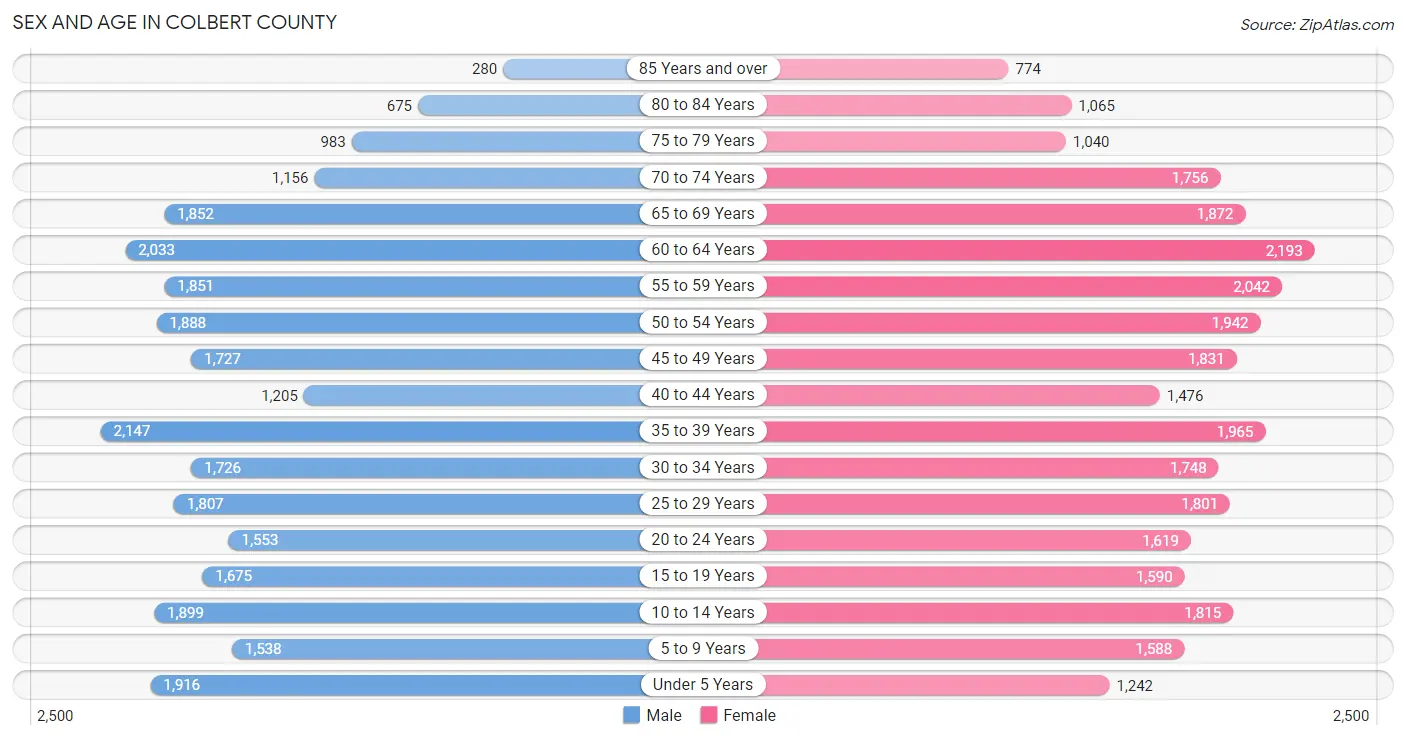
The most populous age groups in Colbert County are 35 to 39 Years (2,147 | 7.7%) for men and 60 to 64 Years (2,193 | 7.5%) for women.
| Age Bracket | Male | Female |
| Under 5 Years | 1,916 (6.9%) | 1,242 (4.2%) |
| 5 to 9 Years | 1,538 (5.5%) | 1,588 (5.4%) |
| 10 to 14 Years | 1,899 (6.8%) | 1,815 (6.2%) |
| 15 to 19 Years | 1,675 (6.0%) | 1,590 (5.4%) |
| 20 to 24 Years | 1,553 (5.6%) | 1,619 (5.5%) |
| 25 to 29 Years | 1,807 (6.5%) | 1,801 (6.1%) |
| 30 to 34 Years | 1,726 (6.2%) | 1,748 (5.9%) |
| 35 to 39 Years | 2,147 (7.7%) | 1,965 (6.7%) |
| 40 to 44 Years | 1,205 (4.3%) | 1,476 (5.0%) |
| 45 to 49 Years | 1,727 (6.2%) | 1,831 (6.2%) |
| 50 to 54 Years | 1,888 (6.8%) | 1,942 (6.6%) |
| 55 to 59 Years | 1,851 (6.6%) | 2,042 (7.0%) |
| 60 to 64 Years | 2,033 (7.3%) | 2,193 (7.5%) |
| 65 to 69 Years | 1,852 (6.6%) | 1,872 (6.4%) |
| 70 to 74 Years | 1,156 (4.1%) | 1,756 (6.0%) |
| 75 to 79 Years | 983 (3.5%) | 1,040 (3.5%) |
| 80 to 84 Years | 675 (2.4%) | 1,065 (3.6%) |
| 85 Years and over | 280 (1.0%) | 774 (2.6%) |
| Total | 27,911 (100.0%) | 29,359 (100.0%) |
Families and Households in Colbert County
Median Family Size in Colbert County
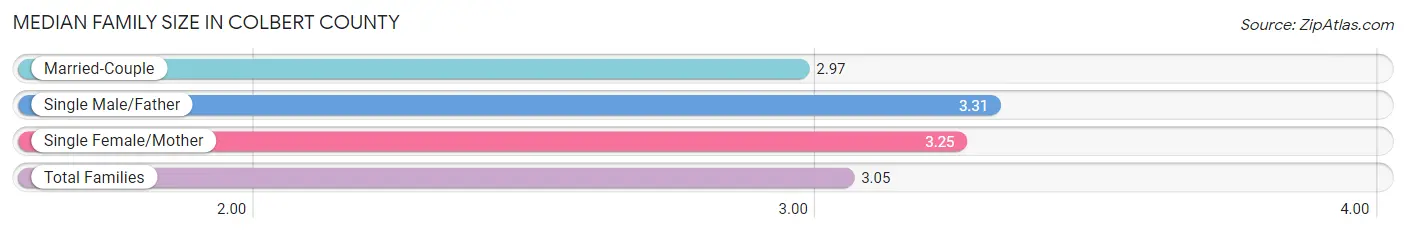
The median family size in Colbert County is 3.05 persons per family, with single male/father families (872 | 5.8%) accounting for the largest median family size of 3.31 persons per family. On the other hand, married-couple families (11,064 | 73.8%) represent the smallest median family size with 2.97 persons per family.
| Family Type | # Families | Family Size |
| Married-Couple | 11,064 (73.8%) | 2.97 |
| Single Male/Father | 872 (5.8%) | 3.31 |
| Single Female/Mother | 3,063 (20.4%) | 3.25 |
| Total Families | 14,999 (100.0%) | 3.05 |
Median Household Size in Colbert County
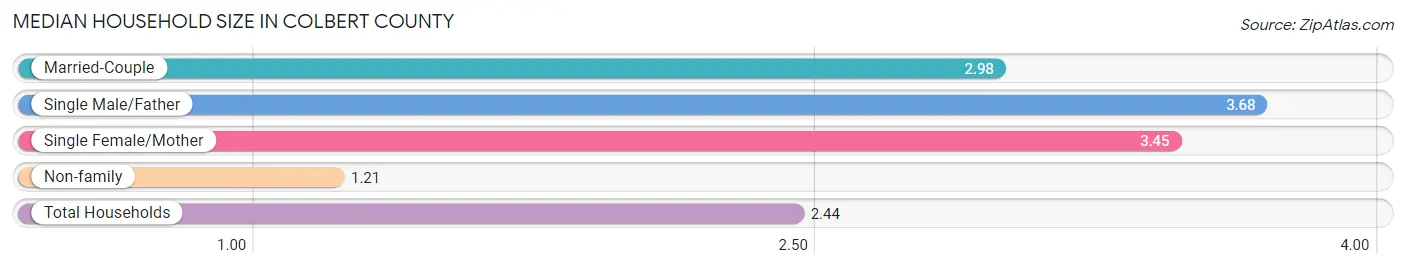
The median household size in Colbert County is 2.44 persons per household, with single male/father households (872 | 3.7%) accounting for the largest median household size of 3.68 persons per household. non-family households (8,267 | 35.5%) represent the smallest median household size with 1.21 persons per household.
| Household Type | # Households | Household Size |
| Married-Couple | 11,064 (47.5%) | 2.98 |
| Single Male/Father | 872 (3.7%) | 3.68 |
| Single Female/Mother | 3,063 (13.2%) | 3.45 |
| Non-family | 8,267 (35.5%) | 1.21 |
| Total Households | 23,266 (100.0%) | 2.44 |
Household Size by Marriage Status in Colbert County
Out of a total of 23,266 households in Colbert County, 14,999 (64.5%) are family households, while 8,267 (35.5%) are nonfamily households. The most numerous type of family households are 2-person households, comprising 7,697, and the most common type of nonfamily households are 1-person households, comprising 6,848.
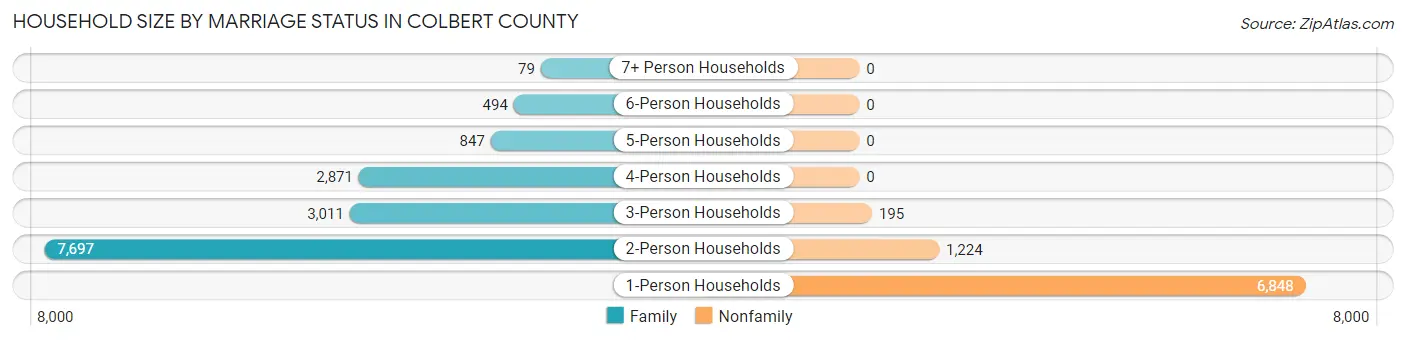
| Household Size | Family Households | Nonfamily Households |
| 1-Person Households | - | 6,848 (29.4%) |
| 2-Person Households | 7,697 (33.1%) | 1,224 (5.3%) |
| 3-Person Households | 3,011 (12.9%) | 195 (0.8%) |
| 4-Person Households | 2,871 (12.3%) | 0 (0.0%) |
| 5-Person Households | 847 (3.6%) | 0 (0.0%) |
| 6-Person Households | 494 (2.1%) | 0 (0.0%) |
| 7+ Person Households | 79 (0.3%) | 0 (0.0%) |
| Total | 14,999 (64.5%) | 8,267 (35.5%) |
Female Fertility in Colbert County
Fertility by Age in Colbert County
Average fertility rate in Colbert County is 45.0 births per 1,000 women. Women in the age bracket of 20 to 34 years have the highest fertility rate with 96.0 births per 1,000 women. Women in the age bracket of 20 to 34 years acount for 88.3% of all women with births.
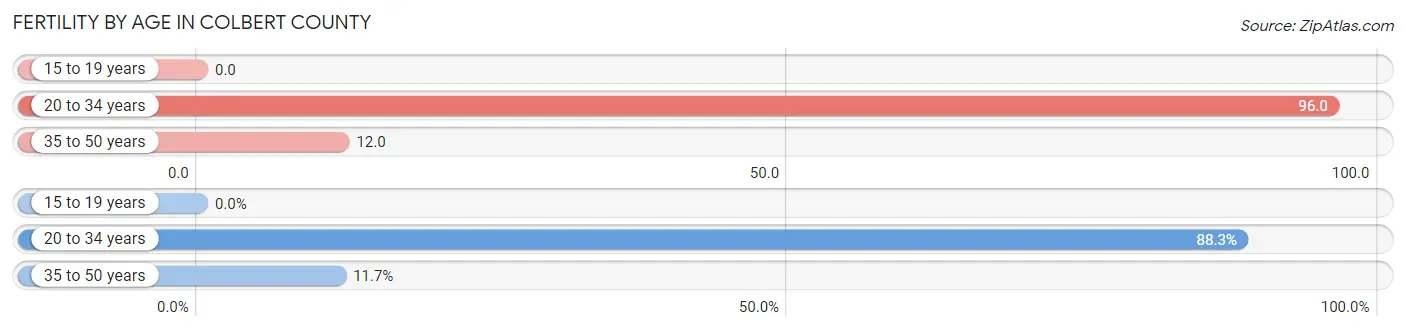
| Age Bracket | Women with Births | Births / 1,000 Women |
| 15 to 19 years | 0 (0.0%) | 0.0 |
| 20 to 34 years | 497 (88.3%) | 96.0 |
| 35 to 50 years | 66 (11.7%) | 12.0 |
| Total | 563 (100.0%) | 45.0 |
Fertility by Age by Marriage Status in Colbert County
66.4% of women with births (563) in Colbert County are married. The highest percentage of unmarried women with births falls into 20 to 34 years age bracket with 35.8% of them unmarried at the time of birth, while the lowest percentage of unmarried women with births belong to 35 to 50 years age bracket with 16.7% of them unmarried.
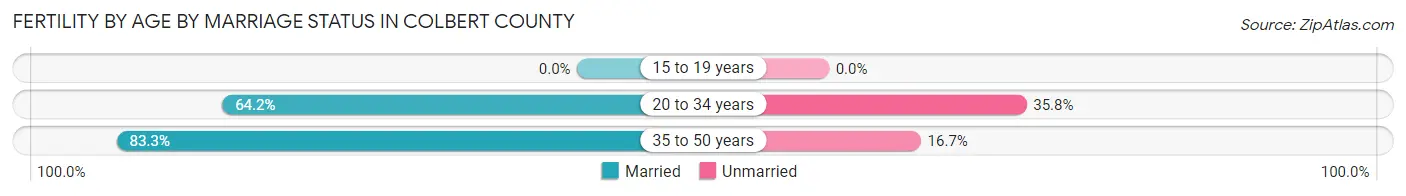
| Age Bracket | Married | Unmarried |
| 15 to 19 years | 0 (0.0%) | 0 (0.0%) |
| 20 to 34 years | 319 (64.2%) | 178 (35.8%) |
| 35 to 50 years | 55 (83.3%) | 11 (16.7%) |
| Total | 374 (66.4%) | 189 (33.6%) |
Fertility by Education in Colbert County
Average fertility rate in Colbert County is 45.0 births per 1,000 women. Women with the education attainment of bachelor's degree have the highest fertility rate of 96.0 births per 1,000 women, while women with the education attainment of less than high school have the lowest fertility at 4.0 births per 1,000 women. Women with the education attainment of college or associate's degree represent 32.3% of all women with births.
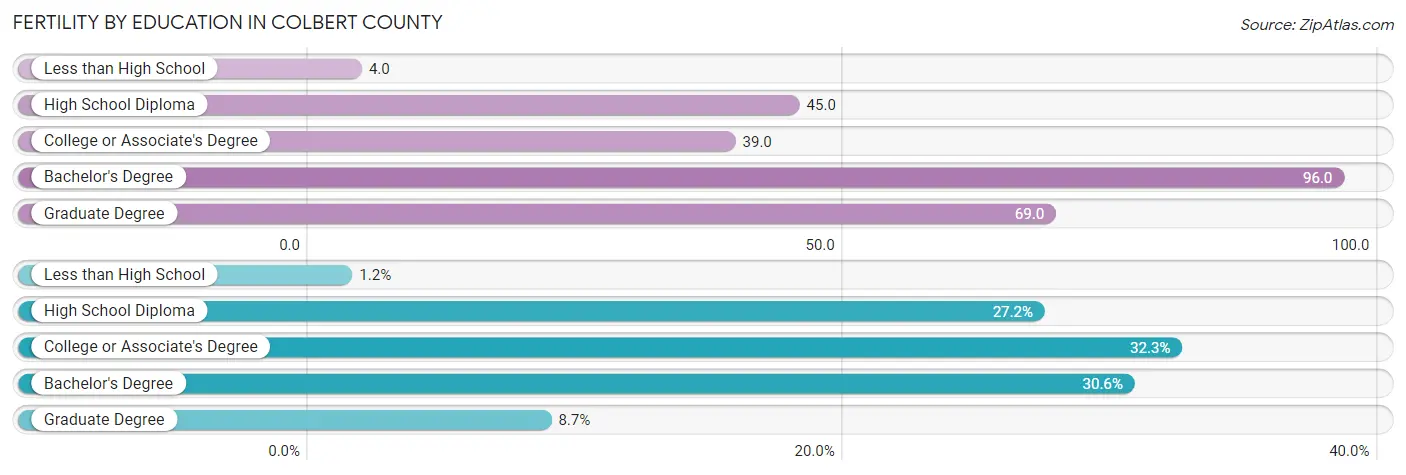
| Educational Attainment | Women with Births | Births / 1,000 Women |
| Less than High School | 7 (1.2%) | 4.0 |
| High School Diploma | 153 (27.2%) | 45.0 |
| College or Associate's Degree | 182 (32.3%) | 39.0 |
| Bachelor's Degree | 172 (30.5%) | 96.0 |
| Graduate Degree | 49 (8.7%) | 69.0 |
| Total | 563 (100.0%) | 45.0 |
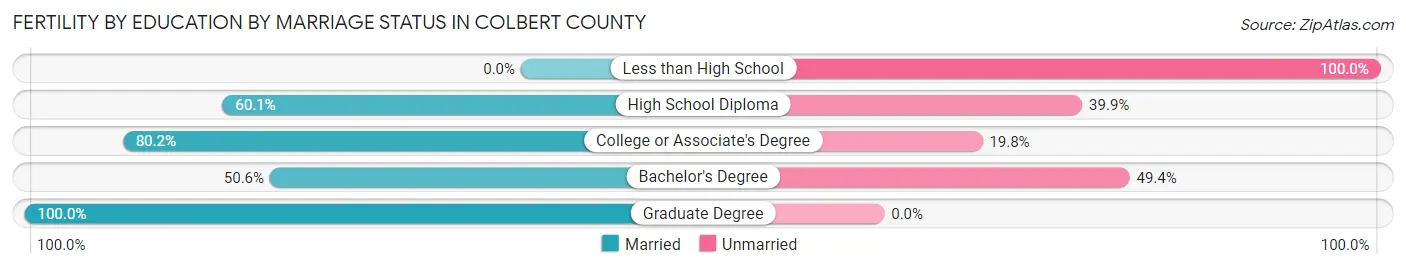
Fertility by Education by Marriage Status in Colbert County
33.6% of women with births in Colbert County are unmarried. Women with the educational attainment of graduate degree are most likely to be married with 100.0% of them married at childbirth, while women with the educational attainment of less than high school are least likely to be married with 100.0% of them unmarried at childbirth.
| Educational Attainment | Married | Unmarried |
| Less than High School | 0 (0.0%) | 7 (100.0%) |
| High School Diploma | 92 (60.1%) | 61 (39.9%) |
| College or Associate's Degree | 146 (80.2%) | 36 (19.8%) |
| Bachelor's Degree | 87 (50.6%) | 85 (49.4%) |
| Graduate Degree | 49 (100.0%) | 0 (0.0%) |
| Total | 374 (66.4%) | 189 (33.6%) |
Employment Characteristics in Colbert County
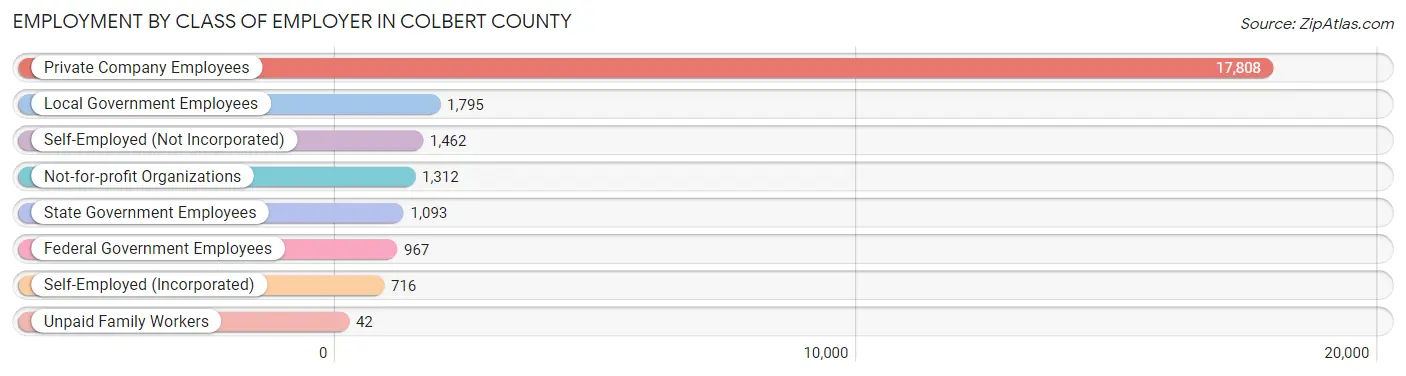
Employment by Class of Employer in Colbert County
Among the 25,195 employed individuals in Colbert County, private company employees (17,808 | 70.7%), local government employees (1,795 | 7.1%), and self-employed (not incorporated) (1,462 | 5.8%) make up the most common classes of employment.
| Employer Class | # Employees | % Employees |
| Private Company Employees | 17,808 | 70.7% |
| Self-Employed (Incorporated) | 716 | 2.8% |
| Self-Employed (Not Incorporated) | 1,462 | 5.8% |
| Not-for-profit Organizations | 1,312 | 5.2% |
| Local Government Employees | 1,795 | 7.1% |
| State Government Employees | 1,093 | 4.3% |
| Federal Government Employees | 967 | 3.8% |
| Unpaid Family Workers | 42 | 0.2% |
| Total | 25,195 | 100.0% |
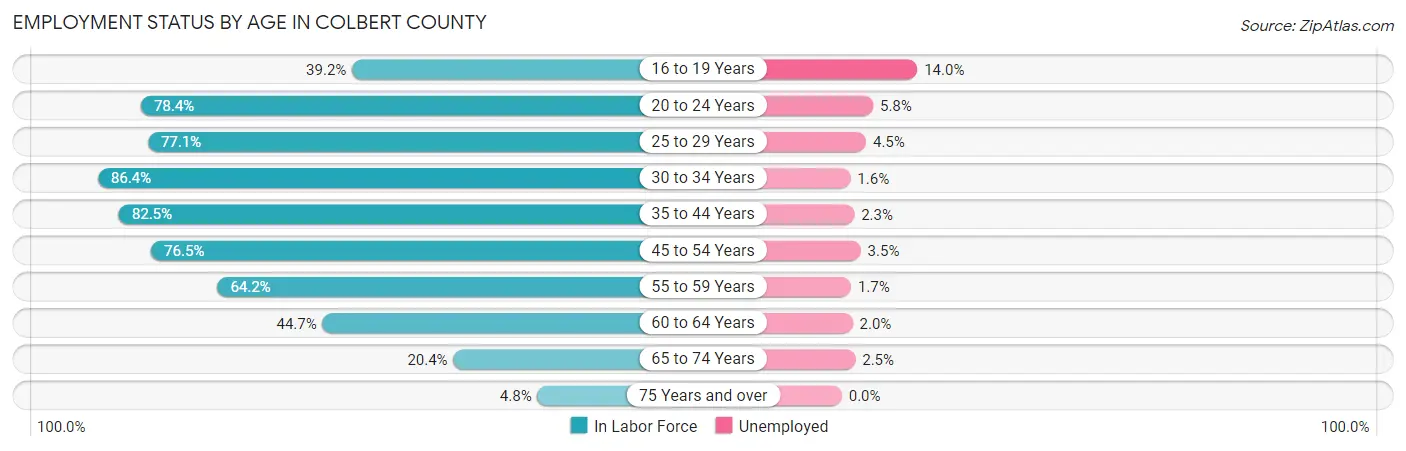
Employment Status by Age in Colbert County
According to the labor force statistics for Colbert County, out of the total population over 16 years of age (46,692), 56.9% or 26,568 individuals are in the labor force, with 3.4% or 903 of them unemployed. The age group with the highest labor force participation rate is 30 to 34 years, with 86.4% or 3,002 individuals in the labor force. Within the labor force, the 16 to 19 years age range has the highest percentage of unemployed individuals, with 14.0% or 147 of them being unemployed.
| Age Bracket | In Labor Force | Unemployed |
| 16 to 19 Years | 1,053 (39.2%) | 147 (14.0%) |
| 20 to 24 Years | 2,487 (78.4%) | 144 (5.8%) |
| 25 to 29 Years | 2,782 (77.1%) | 125 (4.5%) |
| 30 to 34 Years | 3,002 (86.4%) | 48 (1.6%) |
| 35 to 44 Years | 5,604 (82.5%) | 129 (2.3%) |
| 45 to 54 Years | 5,652 (76.5%) | 198 (3.5%) |
| 55 to 59 Years | 2,499 (64.2%) | 42 (1.7%) |
| 60 to 64 Years | 1,889 (44.7%) | 38 (2.0%) |
| 65 to 74 Years | 1,354 (20.4%) | 34 (2.5%) |
| 75 Years and over | 231 (4.8%) | 0 (0.0%) |
| Total | 26,568 (56.9%) | 903 (3.4%) |
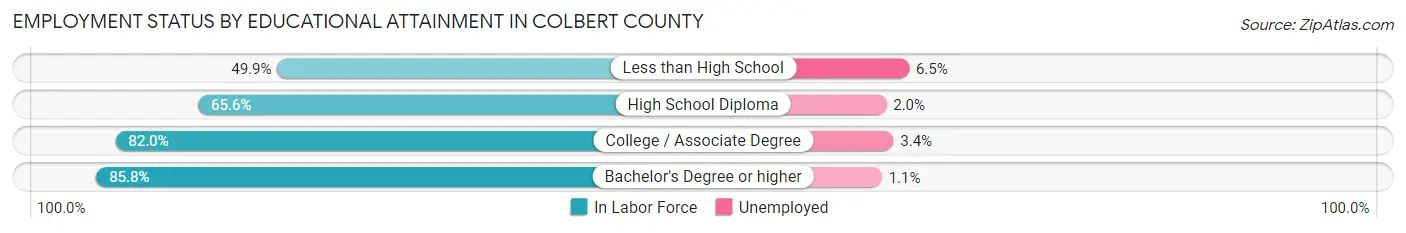
Employment Status by Educational Attainment in Colbert County
According to labor force statistics for Colbert County, 72.9% of individuals (21,419) out of the total population between 25 and 64 years of age (29,382) are in the labor force, with 2.7% or 578 of them being unemployed. The group with the highest labor force participation rate are those with the educational attainment of bachelor's degree or higher, with 85.8% or 4,902 individuals in the labor force. Within the labor force, individuals with less than high school education have the highest percentage of unemployment, with 6.5% or 126 of them being unemployed.
| Educational Attainment | In Labor Force | Unemployed |
| Less than High School | 1,937 (49.9%) | 252 (6.5%) |
| High School Diploma | 6,537 (65.6%) | 199 (2.0%) |
| College / Associate Degree | 8,055 (82.0%) | 334 (3.4%) |
| Bachelor's Degree or higher | 4,902 (85.8%) | 63 (1.1%) |
| Total | 21,419 (72.9%) | 793 (2.7%) |
Employment Occupations by Sex in Colbert County
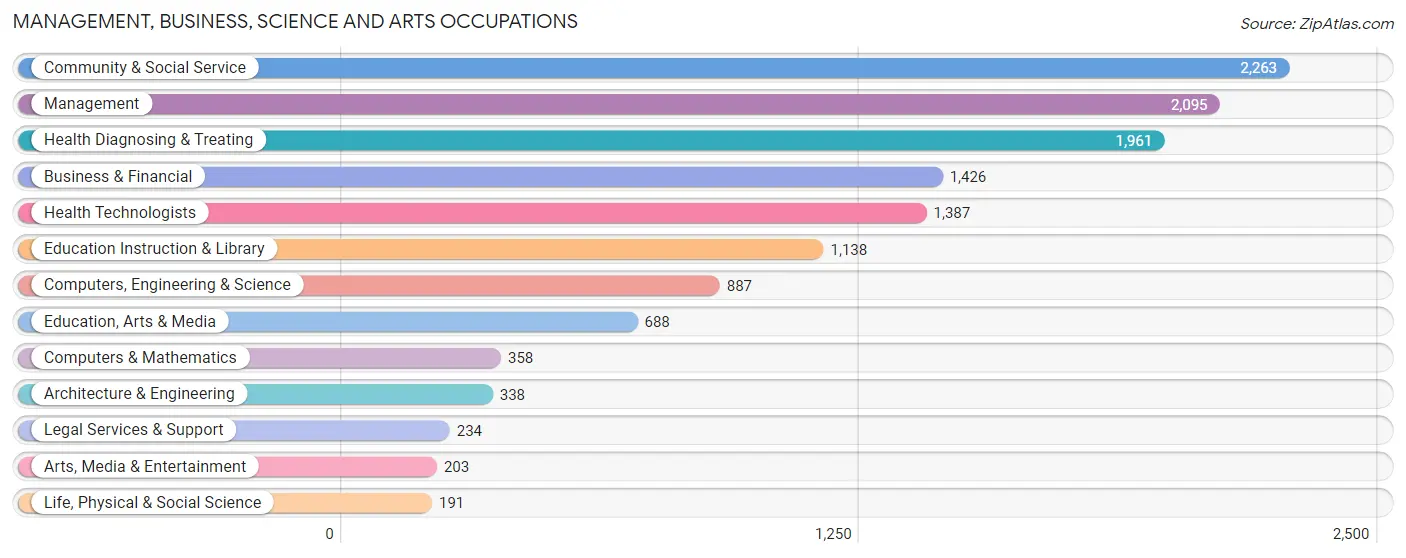
Management, Business, Science and Arts Occupations
The most common Management, Business, Science and Arts occupations in Colbert County are Community & Social Service (2,263 | 8.8%), Management (2,095 | 8.2%), Health Diagnosing & Treating (1,961 | 7.7%), Business & Financial (1,426 | 5.6%), and Health Technologists (1,387 | 5.4%).
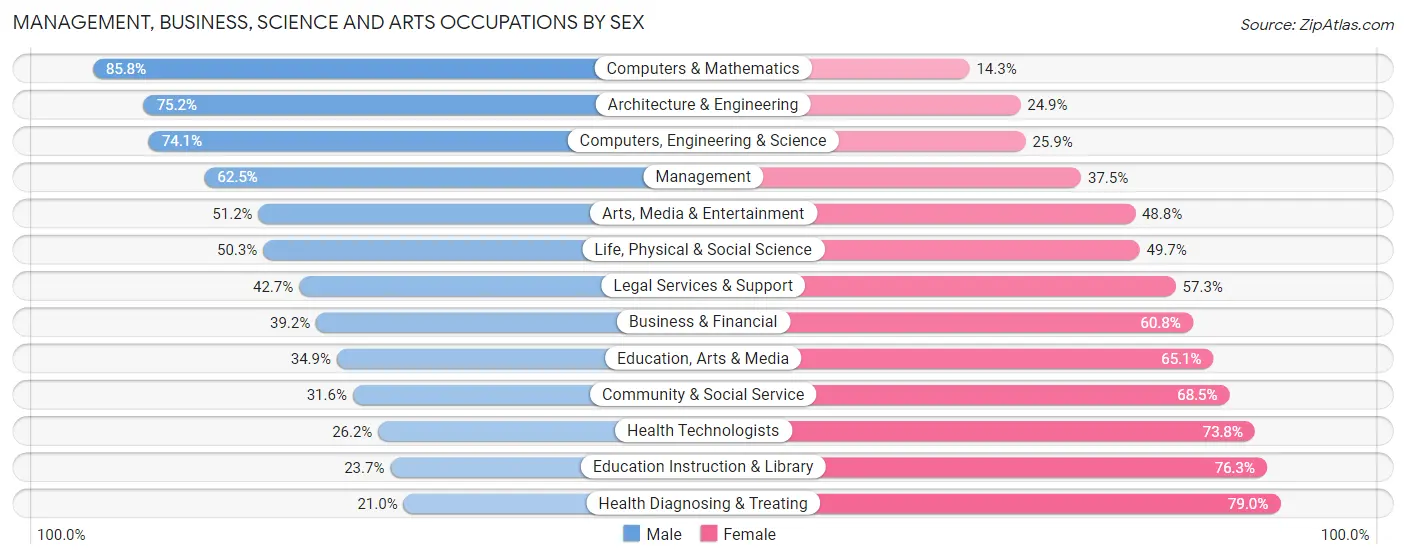
Management, Business, Science and Arts Occupations by Sex
Within the Management, Business, Science and Arts occupations in Colbert County, the most male-oriented occupations are Computers & Mathematics (85.8%), Architecture & Engineering (75.1%), and Computers, Engineering & Science (74.1%), while the most female-oriented occupations are Health Diagnosing & Treating (79.0%), Education Instruction & Library (76.3%), and Health Technologists (73.8%).
| Occupation | Male | Female |
| Management | 1,309 (62.5%) | 786 (37.5%) |
| Business & Financial | 559 (39.2%) | 867 (60.8%) |
| Computers, Engineering & Science | 657 (74.1%) | 230 (25.9%) |
| Computers & Mathematics | 307 (85.8%) | 51 (14.2%) |
| Architecture & Engineering | 254 (75.1%) | 84 (24.8%) |
| Life, Physical & Social Science | 96 (50.3%) | 95 (49.7%) |
| Community & Social Service | 714 (31.6%) | 1,549 (68.4%) |
| Education, Arts & Media | 240 (34.9%) | 448 (65.1%) |
| Legal Services & Support | 100 (42.7%) | 134 (57.3%) |
| Education Instruction & Library | 270 (23.7%) | 868 (76.3%) |
| Arts, Media & Entertainment | 104 (51.2%) | 99 (48.8%) |
| Health Diagnosing & Treating | 411 (21.0%) | 1,550 (79.0%) |
| Health Technologists | 364 (26.2%) | 1,023 (73.8%) |
| Total (Category) | 3,650 (42.3%) | 4,982 (57.7%) |
| Total (Overall) | 13,545 (52.9%) | 12,044 (47.1%) |
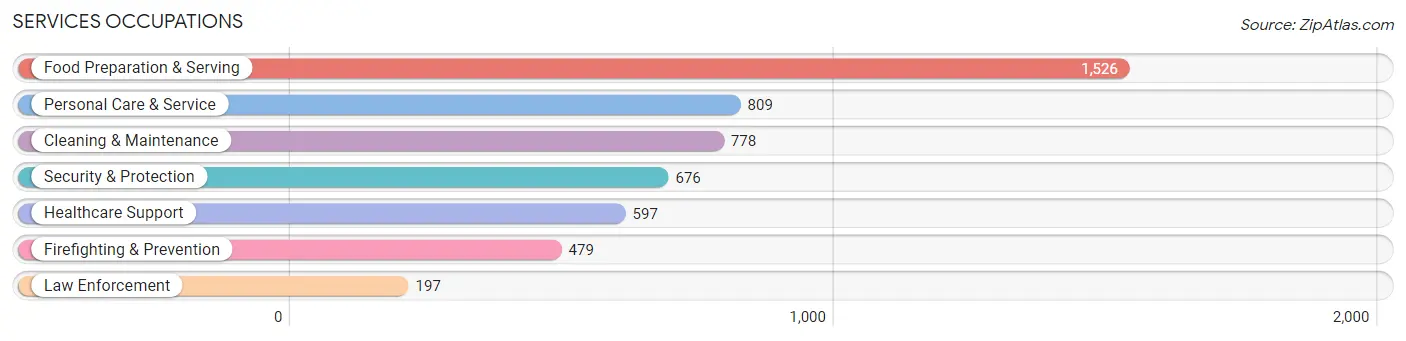
Services Occupations
The most common Services occupations in Colbert County are Food Preparation & Serving (1,526 | 6.0%), Personal Care & Service (809 | 3.2%), Cleaning & Maintenance (778 | 3.0%), Security & Protection (676 | 2.6%), and Healthcare Support (597 | 2.3%).
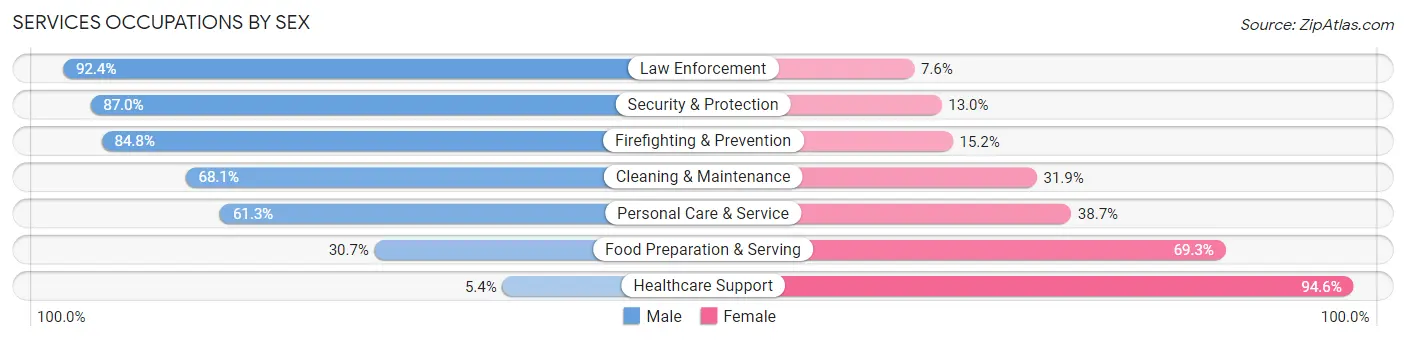
Services Occupations by Sex
Within the Services occupations in Colbert County, the most male-oriented occupations are Law Enforcement (92.4%), Security & Protection (87.0%), and Firefighting & Prevention (84.8%), while the most female-oriented occupations are Healthcare Support (94.6%), Food Preparation & Serving (69.3%), and Personal Care & Service (38.7%).
| Occupation | Male | Female |
| Healthcare Support | 32 (5.4%) | 565 (94.6%) |
| Security & Protection | 588 (87.0%) | 88 (13.0%) |
| Firefighting & Prevention | 406 (84.8%) | 73 (15.2%) |
| Law Enforcement | 182 (92.4%) | 15 (7.6%) |
| Food Preparation & Serving | 468 (30.7%) | 1,058 (69.3%) |
| Cleaning & Maintenance | 530 (68.1%) | 248 (31.9%) |
| Personal Care & Service | 496 (61.3%) | 313 (38.7%) |
| Total (Category) | 2,114 (48.2%) | 2,272 (51.8%) |
| Total (Overall) | 13,545 (52.9%) | 12,044 (47.1%) |
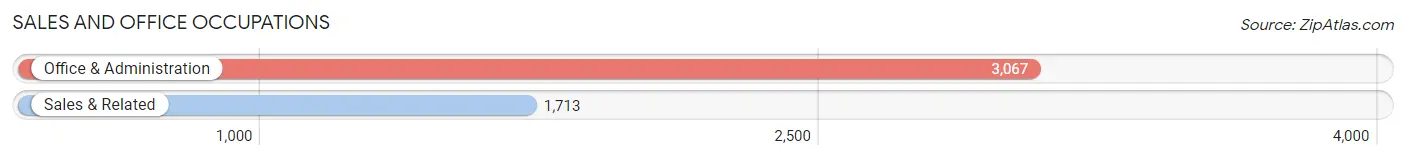
Sales and Office Occupations
The most common Sales and Office occupations in Colbert County are Office & Administration (3,067 | 12.0%), and Sales & Related (1,713 | 6.7%).
Sales and Office Occupations by Sex
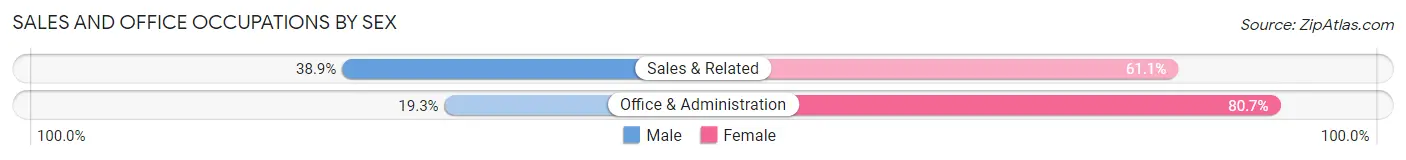
| Occupation | Male | Female |
| Sales & Related | 667 (38.9%) | 1,046 (61.1%) |
| Office & Administration | 591 (19.3%) | 2,476 (80.7%) |
| Total (Category) | 1,258 (26.3%) | 3,522 (73.7%) |
| Total (Overall) | 13,545 (52.9%) | 12,044 (47.1%) |
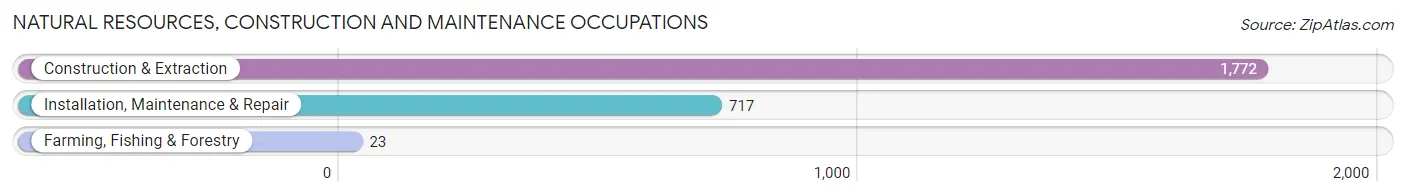
Natural Resources, Construction and Maintenance Occupations
The most common Natural Resources, Construction and Maintenance occupations in Colbert County are Construction & Extraction (1,772 | 6.9%), Installation, Maintenance & Repair (717 | 2.8%), and Farming, Fishing & Forestry (23 | 0.1%).
Natural Resources, Construction and Maintenance Occupations by Sex
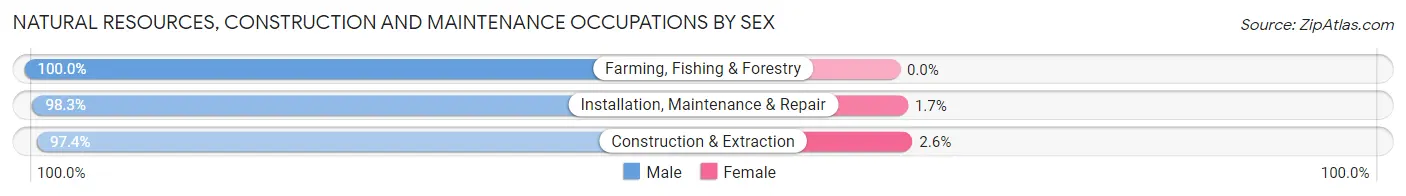
| Occupation | Male | Female |
| Farming, Fishing & Forestry | 23 (100.0%) | 0 (0.0%) |
| Construction & Extraction | 1,726 (97.4%) | 46 (2.6%) |
| Installation, Maintenance & Repair | 705 (98.3%) | 12 (1.7%) |
| Total (Category) | 2,454 (97.7%) | 58 (2.3%) |
| Total (Overall) | 13,545 (52.9%) | 12,044 (47.1%) |
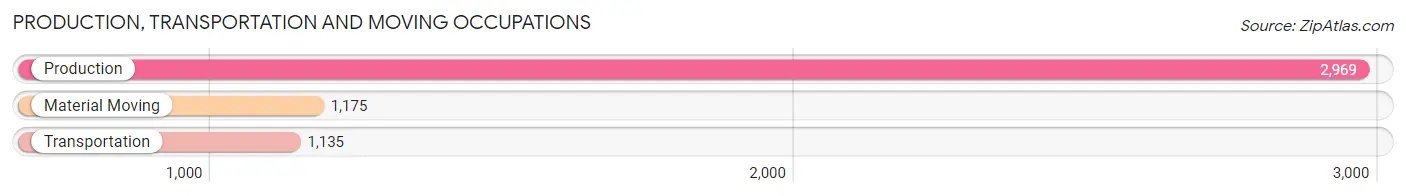
Production, Transportation and Moving Occupations
The most common Production, Transportation and Moving occupations in Colbert County are Production (2,969 | 11.6%), Material Moving (1,175 | 4.6%), and Transportation (1,135 | 4.4%).
Production, Transportation and Moving Occupations by Sex
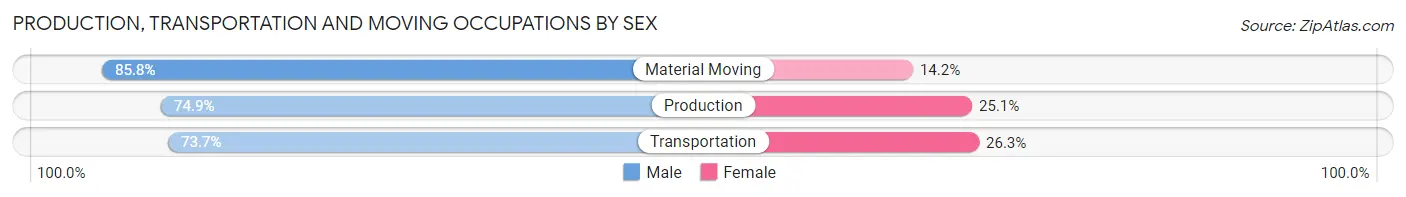
| Occupation | Male | Female |
| Production | 2,225 (74.9%) | 744 (25.1%) |
| Transportation | 836 (73.7%) | 299 (26.3%) |
| Material Moving | 1,008 (85.8%) | 167 (14.2%) |
| Total (Category) | 4,069 (77.1%) | 1,210 (22.9%) |
| Total (Overall) | 13,545 (52.9%) | 12,044 (47.1%) |
Employment Industries by Sex in Colbert County
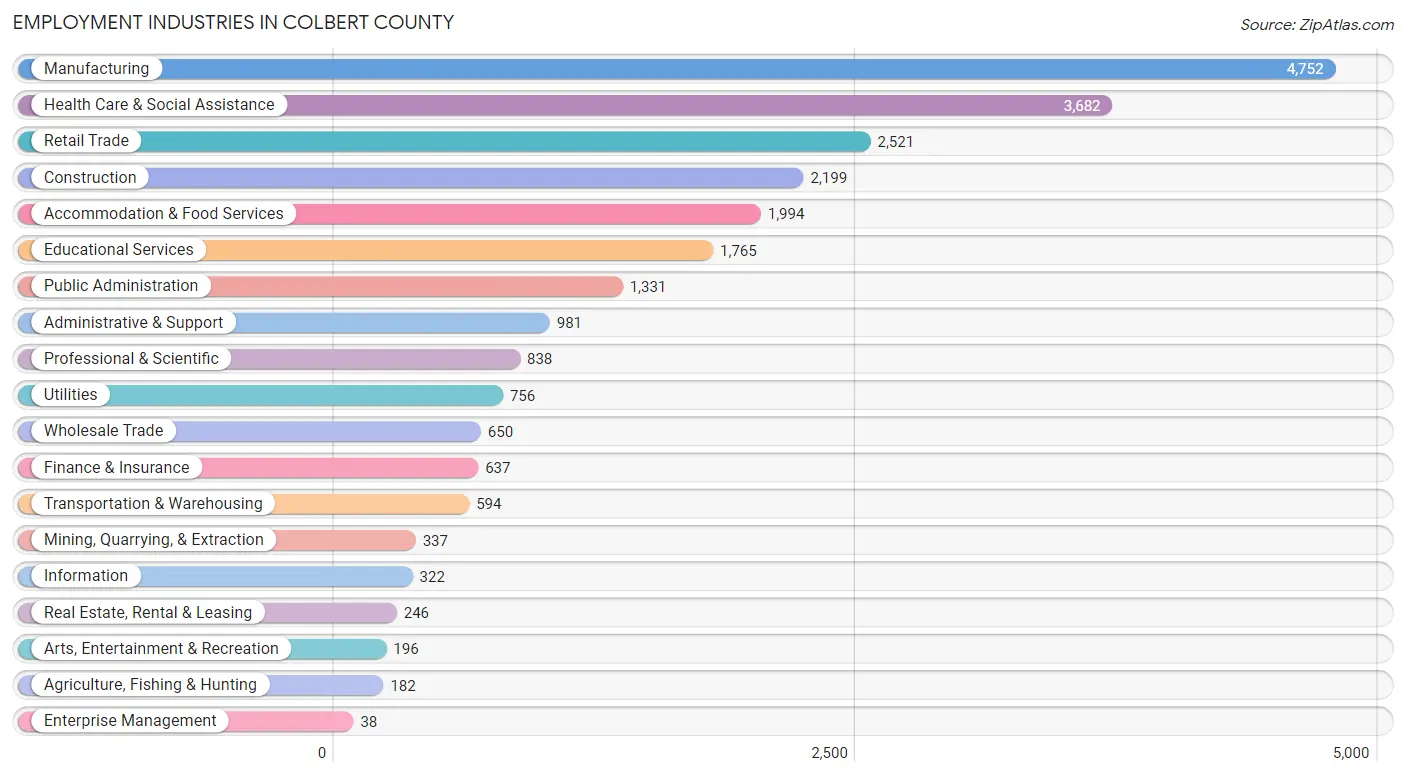
Employment Industries in Colbert County
The major employment industries in Colbert County include Manufacturing (4,752 | 18.6%), Health Care & Social Assistance (3,682 | 14.4%), Retail Trade (2,521 | 9.9%), Construction (2,199 | 8.6%), and Accommodation & Food Services (1,994 | 7.8%).
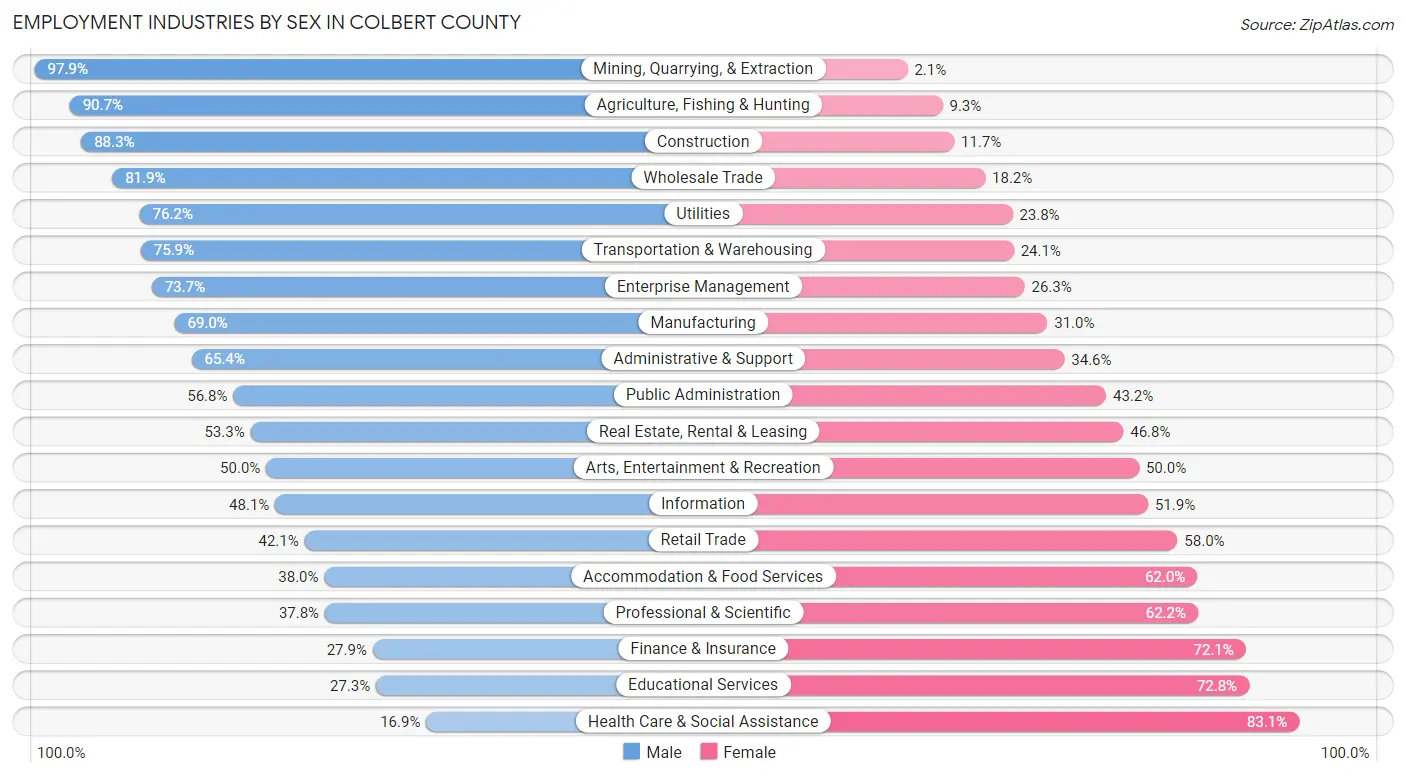
Employment Industries by Sex in Colbert County
The Colbert County industries that see more men than women are Mining, Quarrying, & Extraction (97.9%), Agriculture, Fishing & Hunting (90.7%), and Construction (88.3%), whereas the industries that tend to have a higher number of women are Health Care & Social Assistance (83.1%), Educational Services (72.8%), and Finance & Insurance (72.1%).
| Industry | Male | Female |
| Agriculture, Fishing & Hunting | 165 (90.7%) | 17 (9.3%) |
| Mining, Quarrying, & Extraction | 330 (97.9%) | 7 (2.1%) |
| Construction | 1,941 (88.3%) | 258 (11.7%) |
| Manufacturing | 3,278 (69.0%) | 1,474 (31.0%) |
| Wholesale Trade | 532 (81.9%) | 118 (18.1%) |
| Retail Trade | 1,060 (42.0%) | 1,461 (58.0%) |
| Transportation & Warehousing | 451 (75.9%) | 143 (24.1%) |
| Utilities | 576 (76.2%) | 180 (23.8%) |
| Information | 155 (48.1%) | 167 (51.9%) |
| Finance & Insurance | 178 (27.9%) | 459 (72.1%) |
| Real Estate, Rental & Leasing | 131 (53.2%) | 115 (46.8%) |
| Professional & Scientific | 317 (37.8%) | 521 (62.2%) |
| Enterprise Management | 28 (73.7%) | 10 (26.3%) |
| Administrative & Support | 642 (65.4%) | 339 (34.6%) |
| Educational Services | 481 (27.3%) | 1,284 (72.8%) |
| Health Care & Social Assistance | 621 (16.9%) | 3,061 (83.1%) |
| Arts, Entertainment & Recreation | 98 (50.0%) | 98 (50.0%) |
| Accommodation & Food Services | 757 (38.0%) | 1,237 (62.0%) |
| Public Administration | 756 (56.8%) | 575 (43.2%) |
| Total | 13,545 (52.9%) | 12,044 (47.1%) |
Education in Colbert County
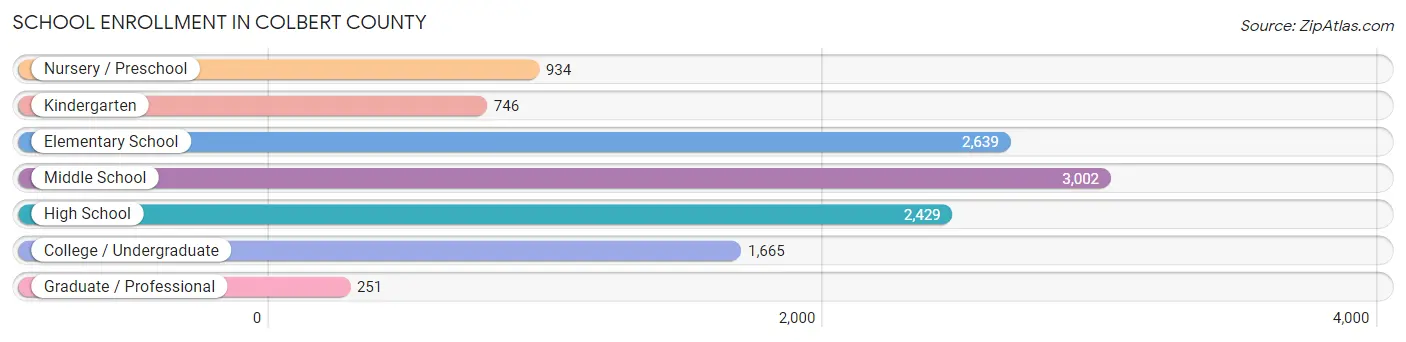
School Enrollment in Colbert County
The most common levels of schooling among the 11,666 students in Colbert County are middle school (3,002 | 25.7%), elementary school (2,639 | 22.6%), and high school (2,429 | 20.8%).
| School Level | # Students | % Students |
| Nursery / Preschool | 934 | 8.0% |
| Kindergarten | 746 | 6.4% |
| Elementary School | 2,639 | 22.6% |
| Middle School | 3,002 | 25.7% |
| High School | 2,429 | 20.8% |
| College / Undergraduate | 1,665 | 14.3% |
| Graduate / Professional | 251 | 2.1% |
| Total | 11,666 | 100.0% |
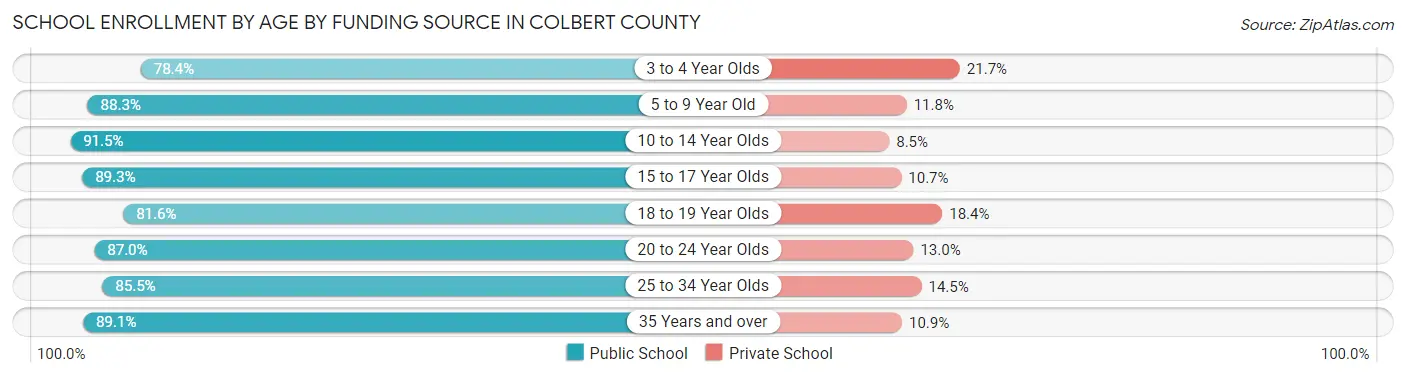
School Enrollment by Age by Funding Source in Colbert County
Out of a total of 11,666 students who are enrolled in schools in Colbert County, 1,388 (11.9%) attend a private institution, while the remaining 10,278 (88.1%) are enrolled in public schools. The age group of 3 to 4 year olds has the highest likelihood of being enrolled in private schools, with 176 (21.6% in the age bracket) enrolled. Conversely, the age group of 10 to 14 year olds has the lowest likelihood of being enrolled in a private school, with 3,346 (91.5% in the age bracket) attending a public institution.
| Age Bracket | Public School | Private School |
| 3 to 4 Year Olds | 637 (78.3%) | 176 (21.6%) |
| 5 to 9 Year Old | 2,703 (88.2%) | 360 (11.7%) |
| 10 to 14 Year Olds | 3,346 (91.5%) | 311 (8.5%) |
| 15 to 17 Year Olds | 1,688 (89.3%) | 203 (10.7%) |
| 18 to 19 Year Olds | 680 (81.6%) | 153 (18.4%) |
| 20 to 24 Year Olds | 542 (87.0%) | 81 (13.0%) |
| 25 to 34 Year Olds | 507 (85.5%) | 86 (14.5%) |
| 35 Years and over | 172 (89.1%) | 21 (10.9%) |
| Total | 10,278 (88.1%) | 1,388 (11.9%) |
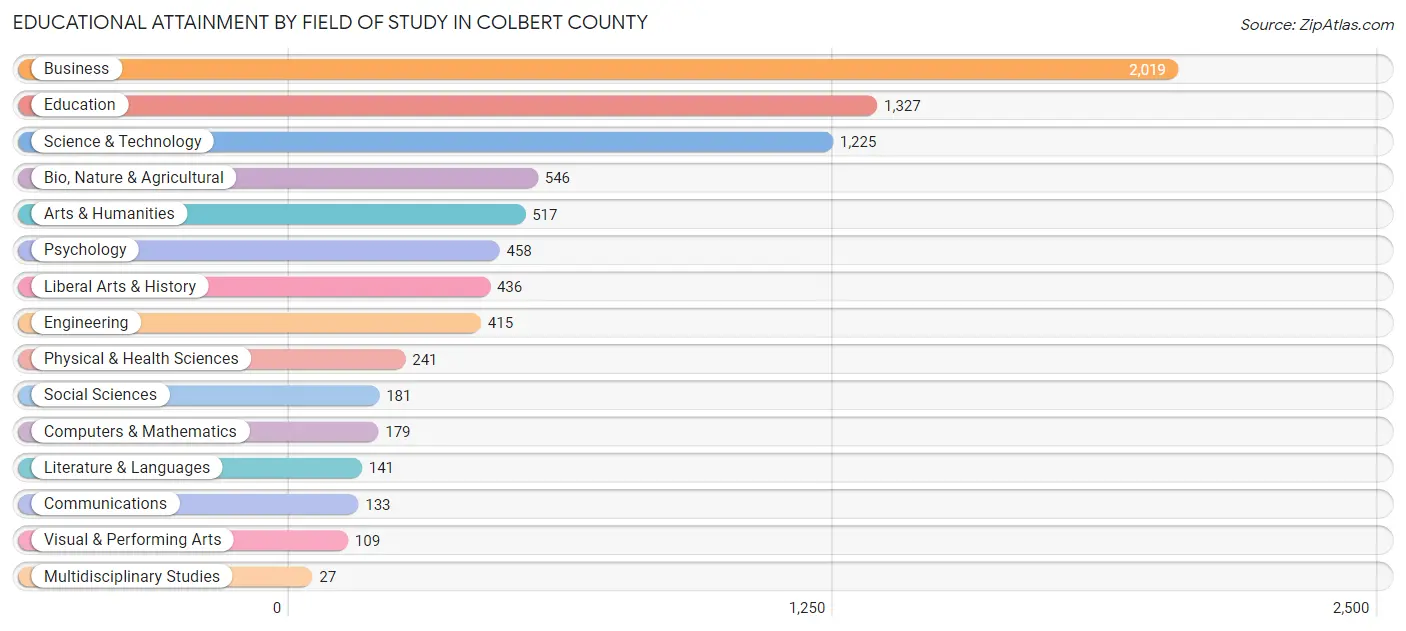
Educational Attainment by Field of Study in Colbert County
Business (2,019 | 25.4%), education (1,327 | 16.7%), science & technology (1,225 | 15.4%), bio, nature & agricultural (546 | 6.9%), and arts & humanities (517 | 6.5%) are the most common fields of study among 7,954 individuals in Colbert County who have obtained a bachelor's degree or higher.
| Field of Study | # Graduates | % Graduates |
| Computers & Mathematics | 179 | 2.2% |
| Bio, Nature & Agricultural | 546 | 6.9% |
| Physical & Health Sciences | 241 | 3.0% |
| Psychology | 458 | 5.8% |
| Social Sciences | 181 | 2.3% |
| Engineering | 415 | 5.2% |
| Multidisciplinary Studies | 27 | 0.3% |
| Science & Technology | 1,225 | 15.4% |
| Business | 2,019 | 25.4% |
| Education | 1,327 | 16.7% |
| Literature & Languages | 141 | 1.8% |
| Liberal Arts & History | 436 | 5.5% |
| Visual & Performing Arts | 109 | 1.4% |
| Communications | 133 | 1.7% |
| Arts & Humanities | 517 | 6.5% |
| Total | 7,954 | 100.0% |
Transportation & Commute in Colbert County
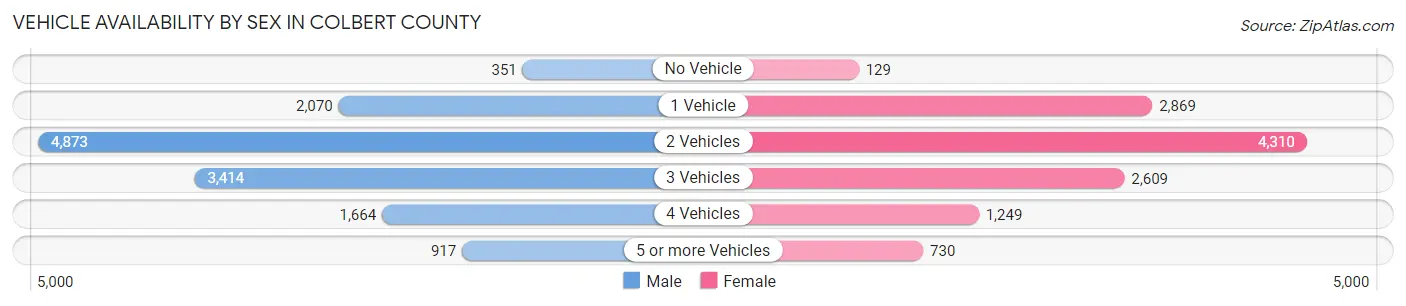
Vehicle Availability by Sex in Colbert County
The most prevalent vehicle ownership categories in Colbert County are males with 2 vehicles (4,873, accounting for 36.7%) and females with 2 vehicles (4,310, making up 41.0%).
| Vehicles Available | Male | Female |
| No Vehicle | 351 (2.6%) | 129 (1.1%) |
| 1 Vehicle | 2,070 (15.6%) | 2,869 (24.1%) |
| 2 Vehicles | 4,873 (36.7%) | 4,310 (36.2%) |
| 3 Vehicles | 3,414 (25.7%) | 2,609 (21.9%) |
| 4 Vehicles | 1,664 (12.5%) | 1,249 (10.5%) |
| 5 or more Vehicles | 917 (6.9%) | 730 (6.1%) |
| Total | 13,289 (100.0%) | 11,896 (100.0%) |
Commute Time in Colbert County
The most frequently occuring commute durations in Colbert County are 15 to 19 minutes (5,552 commuters, 23.2%), 20 to 24 minutes (4,477 commuters, 18.7%), and 10 to 14 minutes (3,745 commuters, 15.7%).
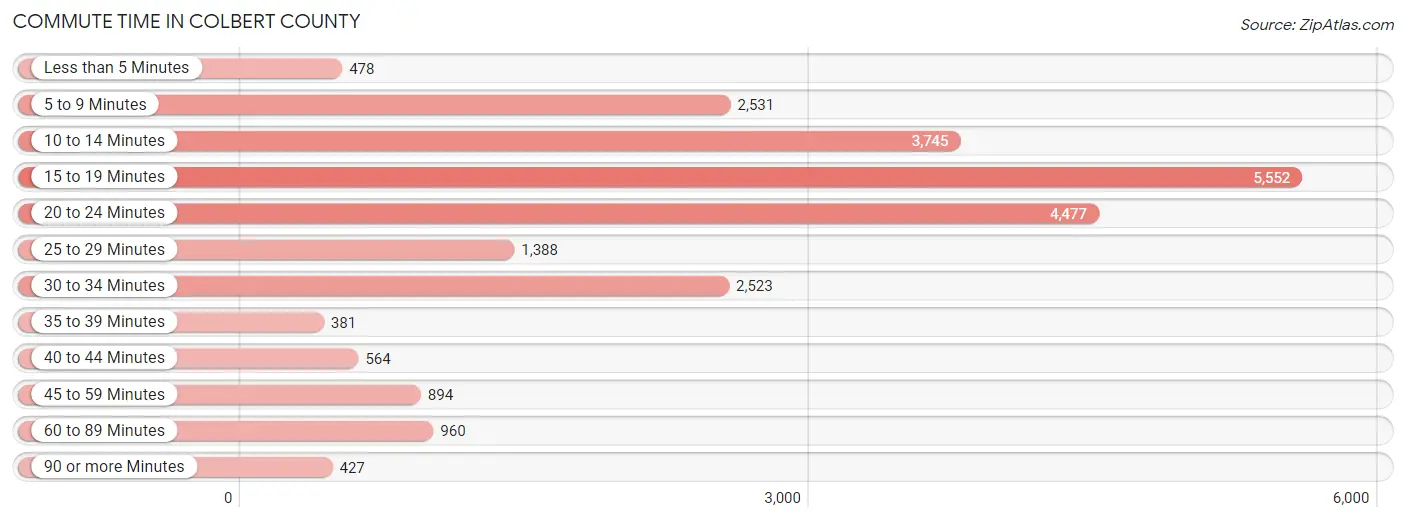
| Commute Time | # Commuters | % Commuters |
| Less than 5 Minutes | 478 | 2.0% |
| 5 to 9 Minutes | 2,531 | 10.6% |
| 10 to 14 Minutes | 3,745 | 15.7% |
| 15 to 19 Minutes | 5,552 | 23.2% |
| 20 to 24 Minutes | 4,477 | 18.7% |
| 25 to 29 Minutes | 1,388 | 5.8% |
| 30 to 34 Minutes | 2,523 | 10.5% |
| 35 to 39 Minutes | 381 | 1.6% |
| 40 to 44 Minutes | 564 | 2.4% |
| 45 to 59 Minutes | 894 | 3.7% |
| 60 to 89 Minutes | 960 | 4.0% |
| 90 or more Minutes | 427 | 1.8% |
Commute Time by Sex in Colbert County
The most common commute times in Colbert County are 15 to 19 minutes (2,796 commuters, 22.2%) for males and 15 to 19 minutes (2,756 commuters, 24.3%) for females.
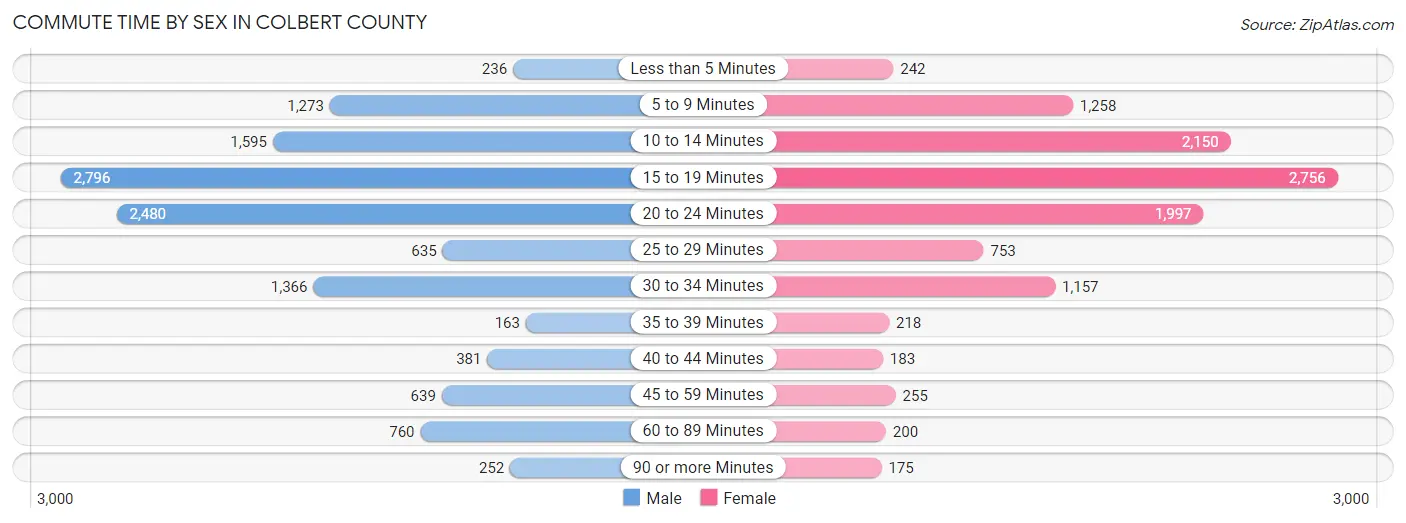
| Commute Time | Male | Female |
| Less than 5 Minutes | 236 (1.9%) | 242 (2.1%) |
| 5 to 9 Minutes | 1,273 (10.1%) | 1,258 (11.1%) |
| 10 to 14 Minutes | 1,595 (12.7%) | 2,150 (19.0%) |
| 15 to 19 Minutes | 2,796 (22.2%) | 2,756 (24.3%) |
| 20 to 24 Minutes | 2,480 (19.7%) | 1,997 (17.6%) |
| 25 to 29 Minutes | 635 (5.1%) | 753 (6.6%) |
| 30 to 34 Minutes | 1,366 (10.9%) | 1,157 (10.2%) |
| 35 to 39 Minutes | 163 (1.3%) | 218 (1.9%) |
| 40 to 44 Minutes | 381 (3.0%) | 183 (1.6%) |
| 45 to 59 Minutes | 639 (5.1%) | 255 (2.2%) |
| 60 to 89 Minutes | 760 (6.0%) | 200 (1.8%) |
| 90 or more Minutes | 252 (2.0%) | 175 (1.5%) |
Time of Departure to Work by Sex in Colbert County
The most frequent times of departure to work in Colbert County are 7:00 AM to 7:29 AM (1,907, 15.2%) for males and 7:30 AM to 7:59 AM (2,488, 21.9%) for females.
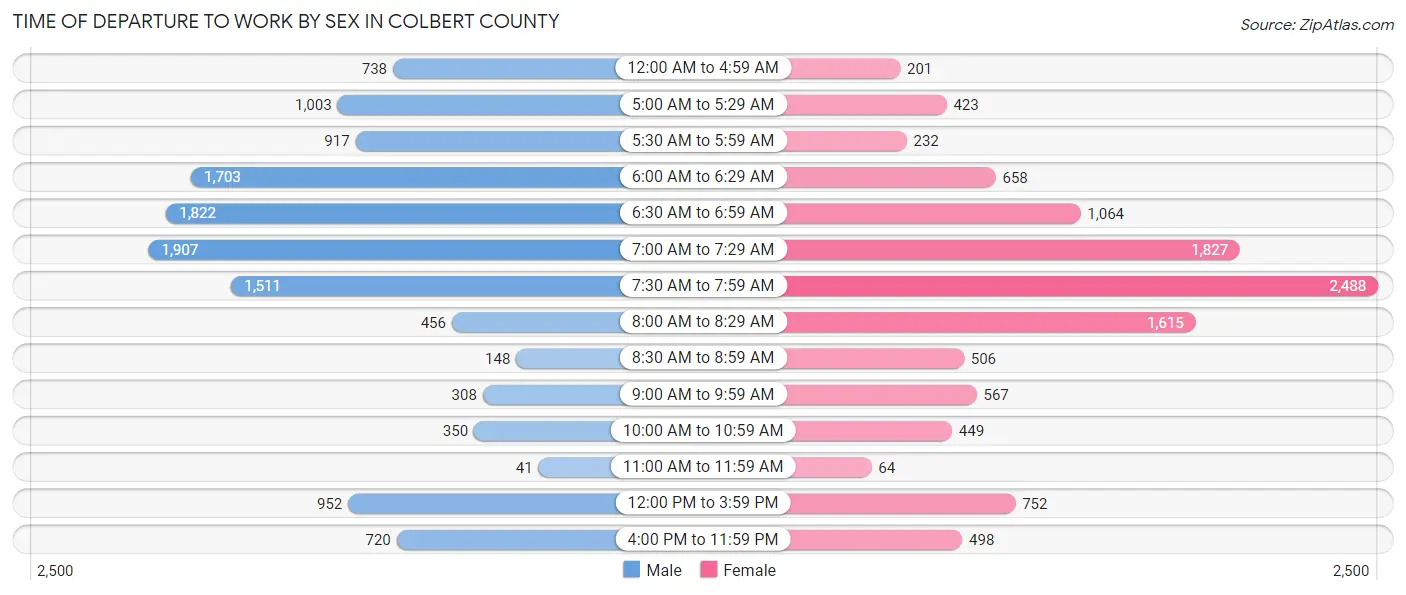
| Time of Departure | Male | Female |
| 12:00 AM to 4:59 AM | 738 (5.9%) | 201 (1.8%) |
| 5:00 AM to 5:29 AM | 1,003 (8.0%) | 423 (3.7%) |
| 5:30 AM to 5:59 AM | 917 (7.3%) | 232 (2.1%) |
| 6:00 AM to 6:29 AM | 1,703 (13.5%) | 658 (5.8%) |
| 6:30 AM to 6:59 AM | 1,822 (14.5%) | 1,064 (9.4%) |
| 7:00 AM to 7:29 AM | 1,907 (15.2%) | 1,827 (16.1%) |
| 7:30 AM to 7:59 AM | 1,511 (12.0%) | 2,488 (21.9%) |
| 8:00 AM to 8:29 AM | 456 (3.6%) | 1,615 (14.2%) |
| 8:30 AM to 8:59 AM | 148 (1.2%) | 506 (4.5%) |
| 9:00 AM to 9:59 AM | 308 (2.5%) | 567 (5.0%) |
| 10:00 AM to 10:59 AM | 350 (2.8%) | 449 (4.0%) |
| 11:00 AM to 11:59 AM | 41 (0.3%) | 64 (0.6%) |
| 12:00 PM to 3:59 PM | 952 (7.6%) | 752 (6.6%) |
| 4:00 PM to 11:59 PM | 720 (5.7%) | 498 (4.4%) |
| Total | 12,576 (100.0%) | 11,344 (100.0%) |
Housing Occupancy in Colbert County
Occupancy by Ownership in Colbert County
Of the total 23,266 dwellings in Colbert County, owner-occupied units account for 16,520 (71.0%), while renter-occupied units make up 6,746 (29.0%).
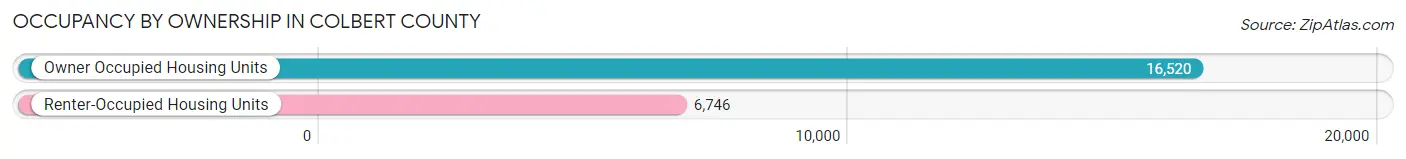
| Occupancy | # Housing Units | % Housing Units |
| Owner Occupied Housing Units | 16,520 | 71.0% |
| Renter-Occupied Housing Units | 6,746 | 29.0% |
| Total Occupied Housing Units | 23,266 | 100.0% |
Occupancy by Household Size in Colbert County
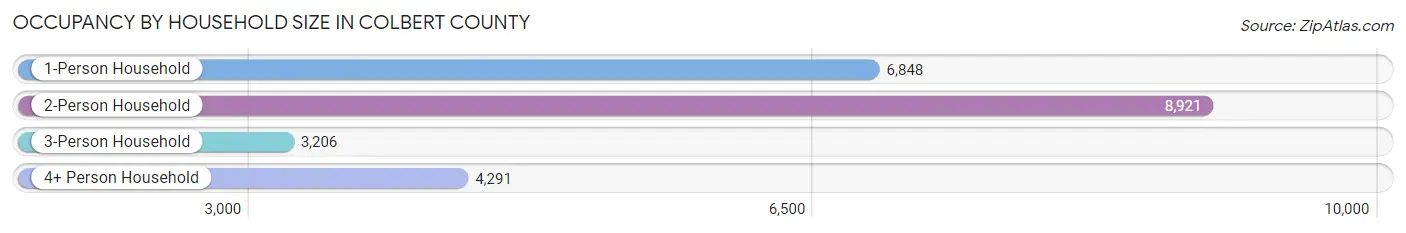
| Household Size | # Housing Units | % Housing Units |
| 1-Person Household | 6,848 | 29.4% |
| 2-Person Household | 8,921 | 38.3% |
| 3-Person Household | 3,206 | 13.8% |
| 4+ Person Household | 4,291 | 18.4% |
| Total Housing Units | 23,266 | 100.0% |
Occupancy by Ownership by Household Size in Colbert County
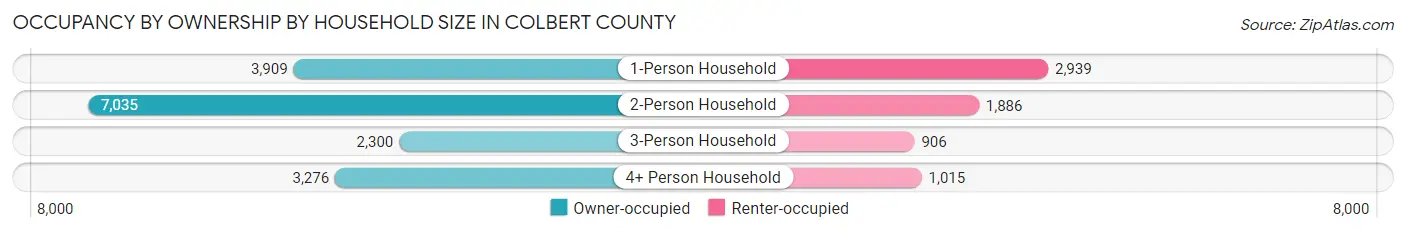
| Household Size | Owner-occupied | Renter-occupied |
| 1-Person Household | 3,909 (57.1%) | 2,939 (42.9%) |
| 2-Person Household | 7,035 (78.9%) | 1,886 (21.1%) |
| 3-Person Household | 2,300 (71.7%) | 906 (28.3%) |
| 4+ Person Household | 3,276 (76.3%) | 1,015 (23.6%) |
| Total Housing Units | 16,520 (71.0%) | 6,746 (29.0%) |
Occupancy by Educational Attainment in Colbert County
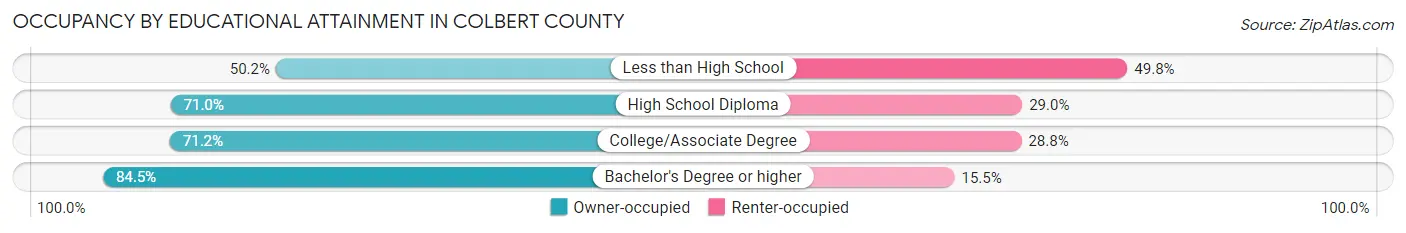
| Household Size | Owner-occupied | Renter-occupied |
| Less than High School | 1,479 (50.2%) | 1,468 (49.8%) |
| High School Diploma | 5,936 (71.0%) | 2,420 (29.0%) |
| College/Associate Degree | 5,360 (71.2%) | 2,169 (28.8%) |
| Bachelor's Degree or higher | 3,745 (84.5%) | 689 (15.5%) |
Occupancy by Age of Householder in Colbert County
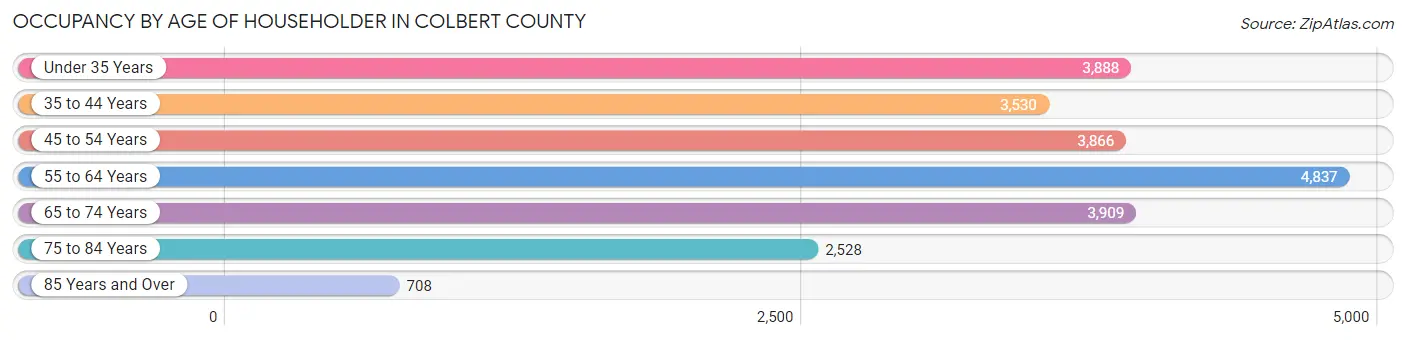
| Age Bracket | # Households | % Households |
| Under 35 Years | 3,888 | 16.7% |
| 35 to 44 Years | 3,530 | 15.2% |
| 45 to 54 Years | 3,866 | 16.6% |
| 55 to 64 Years | 4,837 | 20.8% |
| 65 to 74 Years | 3,909 | 16.8% |
| 75 to 84 Years | 2,528 | 10.9% |
| 85 Years and Over | 708 | 3.0% |
| Total | 23,266 | 100.0% |
Housing Finances in Colbert County
Median Income by Occupancy in Colbert County
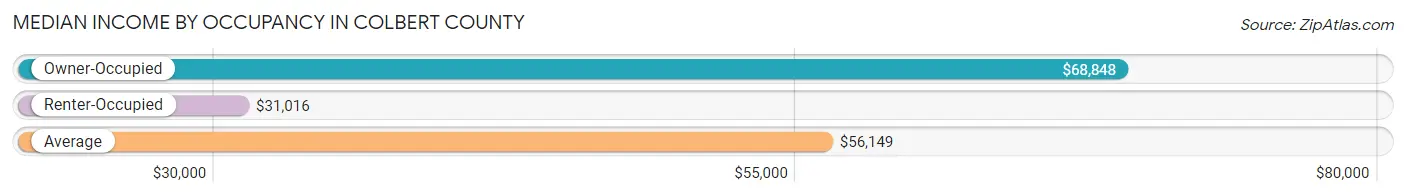
| Occupancy Type | # Households | Median Income |
| Owner-Occupied | 16,520 (71.0%) | $68,848 |
| Renter-Occupied | 6,746 (29.0%) | $31,016 |
| Average | 23,266 (100.0%) | $56,149 |
Occupancy by Householder Income Bracket in Colbert County
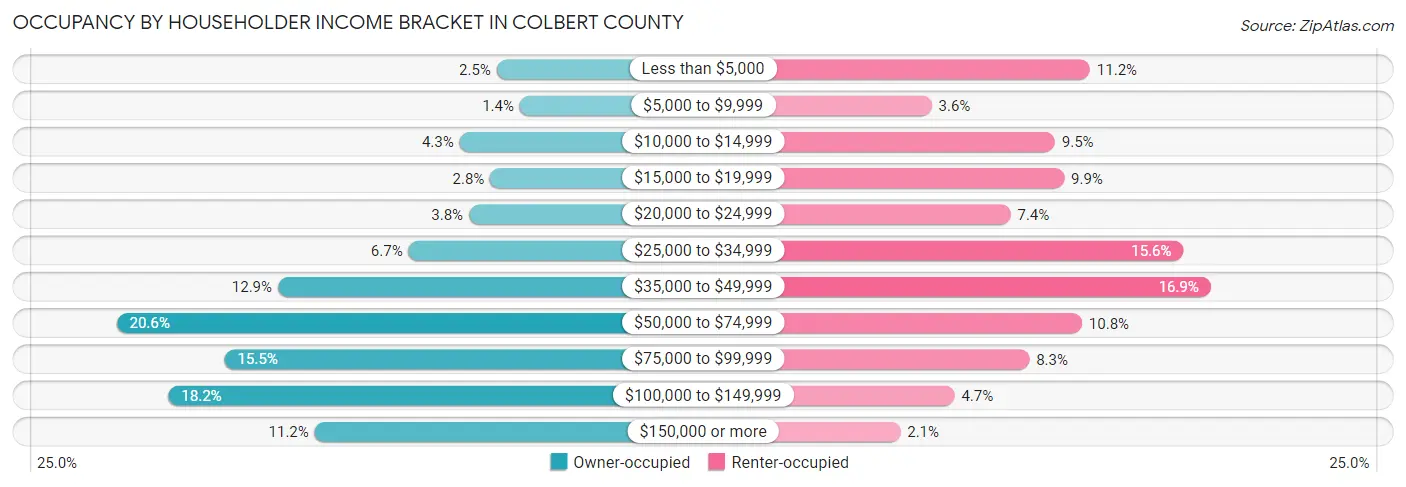
| Income Bracket | Owner-occupied | Renter-occupied |
| Less than $5,000 | 416 (2.5%) | 753 (11.2%) |
| $5,000 to $9,999 | 235 (1.4%) | 244 (3.6%) |
| $10,000 to $14,999 | 708 (4.3%) | 640 (9.5%) |
| $15,000 to $19,999 | 468 (2.8%) | 670 (9.9%) |
| $20,000 to $24,999 | 634 (3.8%) | 498 (7.4%) |
| $25,000 to $34,999 | 1,110 (6.7%) | 1,053 (15.6%) |
| $35,000 to $49,999 | 2,138 (12.9%) | 1,141 (16.9%) |
| $50,000 to $74,999 | 3,407 (20.6%) | 727 (10.8%) |
| $75,000 to $99,999 | 2,558 (15.5%) | 558 (8.3%) |
| $100,000 to $149,999 | 2,998 (18.1%) | 318 (4.7%) |
| $150,000 or more | 1,848 (11.2%) | 144 (2.1%) |
| Total | 16,520 (100.0%) | 6,746 (100.0%) |
Monthly Housing Cost Tiers in Colbert County
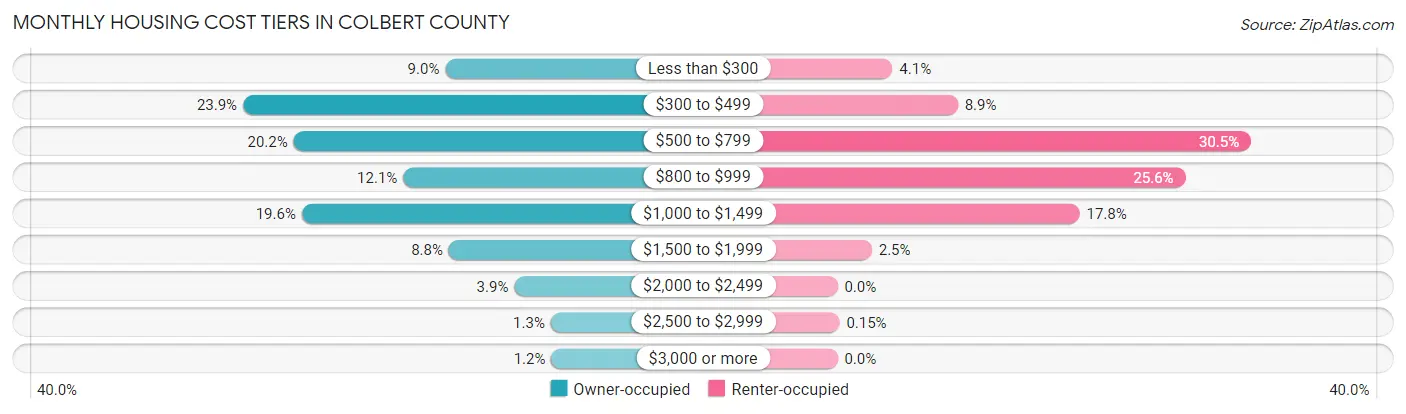
| Monthly Cost | Owner-occupied | Renter-occupied |
| Less than $300 | 1,490 (9.0%) | 273 (4.1%) |
| $300 to $499 | 3,952 (23.9%) | 598 (8.9%) |
| $500 to $799 | 3,335 (20.2%) | 2,055 (30.5%) |
| $800 to $999 | 2,003 (12.1%) | 1,729 (25.6%) |
| $1,000 to $1,499 | 3,236 (19.6%) | 1,203 (17.8%) |
| $1,500 to $1,999 | 1,447 (8.8%) | 171 (2.5%) |
| $2,000 to $2,499 | 651 (3.9%) | 0 (0.0%) |
| $2,500 to $2,999 | 206 (1.3%) | 10 (0.2%) |
| $3,000 or more | 200 (1.2%) | 0 (0.0%) |
| Total | 16,520 (100.0%) | 6,746 (100.0%) |
Physical Housing Characteristics in Colbert County
Housing Structures in Colbert County
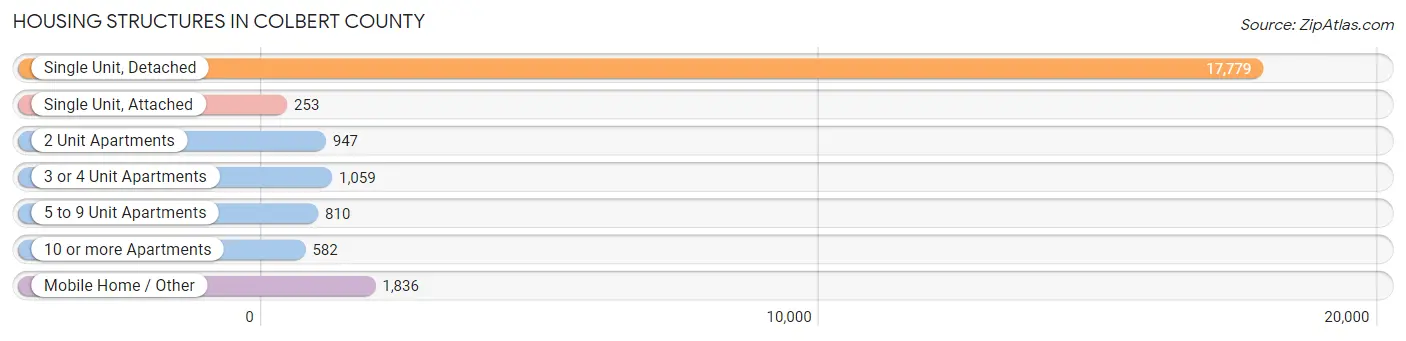
| Structure Type | # Housing Units | % Housing Units |
| Single Unit, Detached | 17,779 | 76.4% |
| Single Unit, Attached | 253 | 1.1% |
| 2 Unit Apartments | 947 | 4.1% |
| 3 or 4 Unit Apartments | 1,059 | 4.5% |
| 5 to 9 Unit Apartments | 810 | 3.5% |
| 10 or more Apartments | 582 | 2.5% |
| Mobile Home / Other | 1,836 | 7.9% |
| Total | 23,266 | 100.0% |
Housing Structures by Occupancy in Colbert County
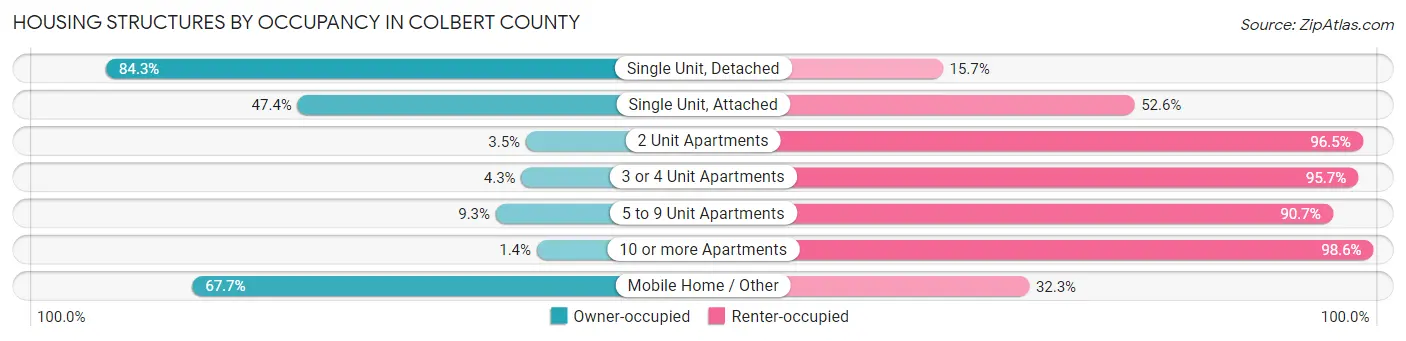
| Structure Type | Owner-occupied | Renter-occupied |
| Single Unit, Detached | 14,995 (84.3%) | 2,784 (15.7%) |
| Single Unit, Attached | 120 (47.4%) | 133 (52.6%) |
| 2 Unit Apartments | 33 (3.5%) | 914 (96.5%) |
| 3 or 4 Unit Apartments | 46 (4.3%) | 1,013 (95.7%) |
| 5 to 9 Unit Apartments | 75 (9.3%) | 735 (90.7%) |
| 10 or more Apartments | 8 (1.4%) | 574 (98.6%) |
| Mobile Home / Other | 1,243 (67.7%) | 593 (32.3%) |
| Total | 16,520 (71.0%) | 6,746 (29.0%) |
Housing Structures by Number of Rooms in Colbert County
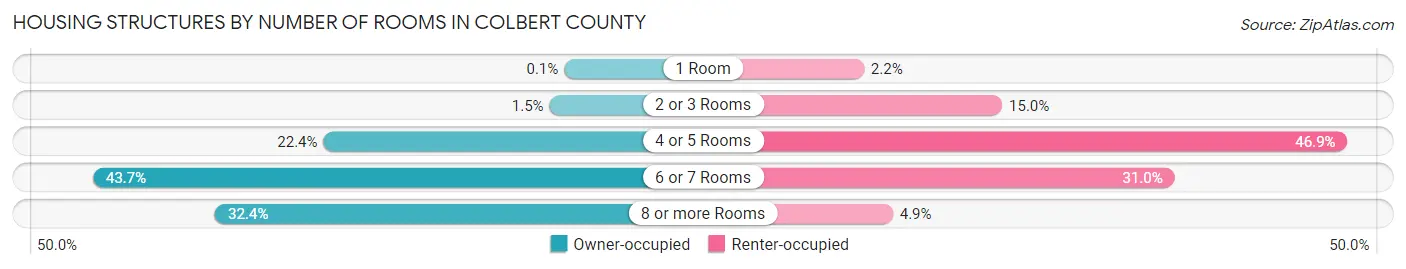
| Number of Rooms | Owner-occupied | Renter-occupied |
| 1 Room | 16 (0.1%) | 150 (2.2%) |
| 2 or 3 Rooms | 241 (1.5%) | 1,012 (15.0%) |
| 4 or 5 Rooms | 3,695 (22.4%) | 3,166 (46.9%) |
| 6 or 7 Rooms | 7,218 (43.7%) | 2,088 (30.9%) |
| 8 or more Rooms | 5,350 (32.4%) | 330 (4.9%) |
| Total | 16,520 (100.0%) | 6,746 (100.0%) |
Housing Structure by Heating Type in Colbert County
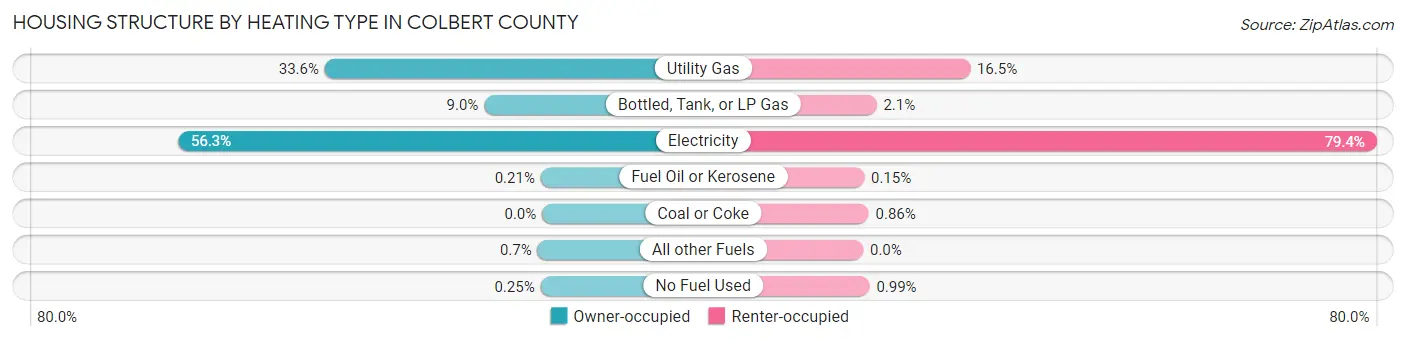
| Heating Type | Owner-occupied | Renter-occupied |
| Utility Gas | 5,549 (33.6%) | 1,115 (16.5%) |
| Bottled, Tank, or LP Gas | 1,479 (8.9%) | 140 (2.1%) |
| Electricity | 9,300 (56.3%) | 5,356 (79.4%) |
| Fuel Oil or Kerosene | 34 (0.2%) | 10 (0.2%) |
| Coal or Coke | 0 (0.0%) | 58 (0.9%) |
| All other Fuels | 116 (0.7%) | 0 (0.0%) |
| No Fuel Used | 42 (0.3%) | 67 (1.0%) |
| Total | 16,520 (100.0%) | 6,746 (100.0%) |
Household Vehicle Usage in Colbert County
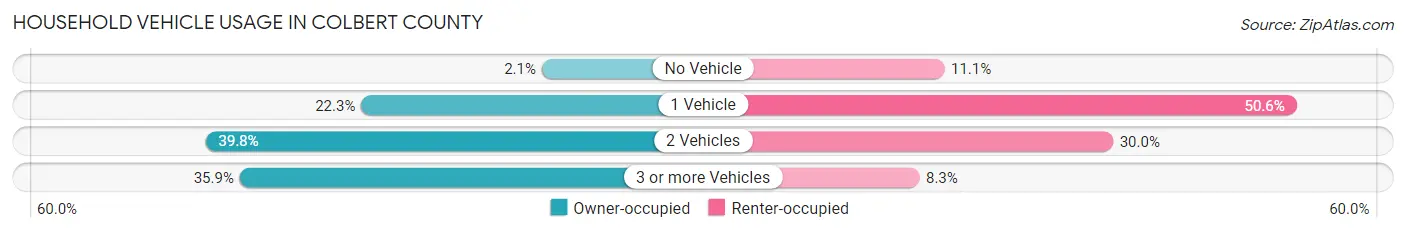
| Vehicles per Household | Owner-occupied | Renter-occupied |
| No Vehicle | 340 (2.1%) | 749 (11.1%) |
| 1 Vehicle | 3,683 (22.3%) | 3,413 (50.6%) |
| 2 Vehicles | 6,566 (39.8%) | 2,024 (30.0%) |
| 3 or more Vehicles | 5,931 (35.9%) | 560 (8.3%) |
| Total | 16,520 (100.0%) | 6,746 (100.0%) |
Real Estate & Mortgages in Colbert County
Real Estate and Mortgage Overview in Colbert County
| Characteristic | Without Mortgage | With Mortgage |
| Housing Units | 7,953 | 8,567 |
| Median Property Value | $123,700 | $167,300 |
| Median Household Income | $54,815 | $1,057 |
| Monthly Housing Costs | $422 | $119 |
| Real Estate Taxes | $482 | $1,402 |
Property Value by Mortgage Status in Colbert County
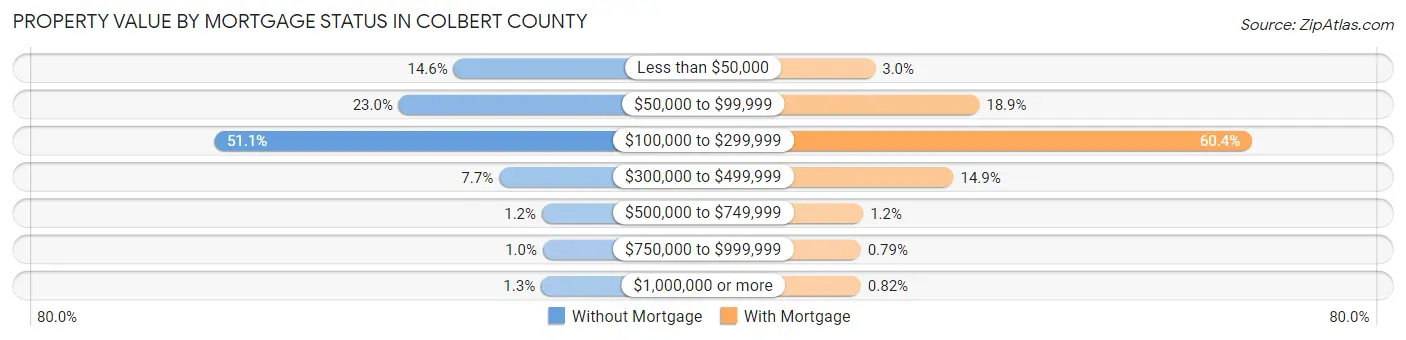
| Property Value | Without Mortgage | With Mortgage |
| Less than $50,000 | 1,164 (14.6%) | 258 (3.0%) |
| $50,000 to $99,999 | 1,828 (23.0%) | 1,616 (18.9%) |
| $100,000 to $299,999 | 4,067 (51.1%) | 5,176 (60.4%) |
| $300,000 to $499,999 | 613 (7.7%) | 1,279 (14.9%) |
| $500,000 to $749,999 | 94 (1.2%) | 100 (1.2%) |
| $750,000 to $999,999 | 83 (1.0%) | 68 (0.8%) |
| $1,000,000 or more | 104 (1.3%) | 70 (0.8%) |
| Total | 7,953 (100.0%) | 8,567 (100.0%) |
Household Income by Mortgage Status in Colbert County
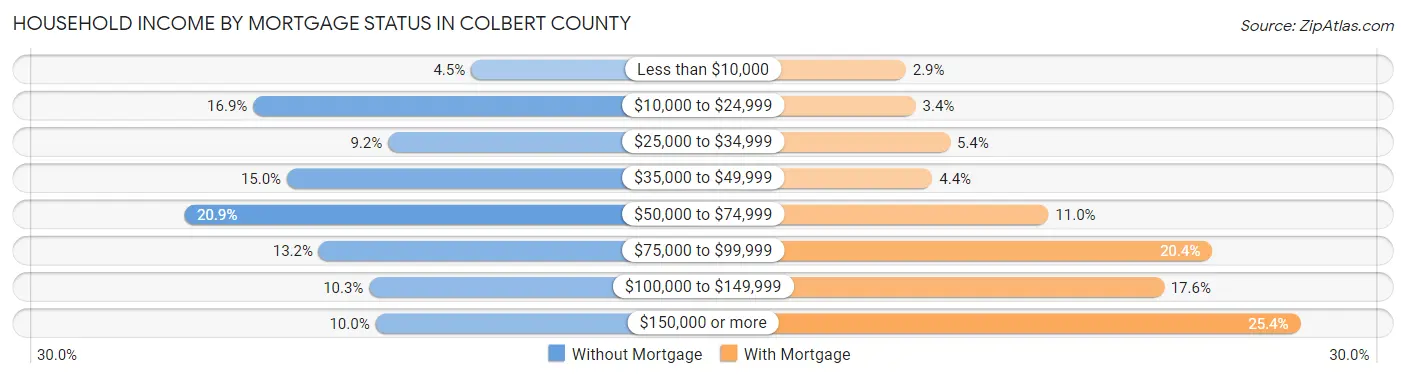
| Household Income | Without Mortgage | With Mortgage |
| Less than $10,000 | 357 (4.5%) | 246 (2.9%) |
| $10,000 to $24,999 | 1,347 (16.9%) | 294 (3.4%) |
| $25,000 to $34,999 | 734 (9.2%) | 463 (5.4%) |
| $35,000 to $49,999 | 1,194 (15.0%) | 376 (4.4%) |
| $50,000 to $74,999 | 1,661 (20.9%) | 944 (11.0%) |
| $75,000 to $99,999 | 1,049 (13.2%) | 1,746 (20.4%) |
| $100,000 to $149,999 | 820 (10.3%) | 1,509 (17.6%) |
| $150,000 or more | 791 (10.0%) | 2,178 (25.4%) |
| Total | 7,953 (100.0%) | 8,567 (100.0%) |
Property Value to Household Income Ratio in Colbert County
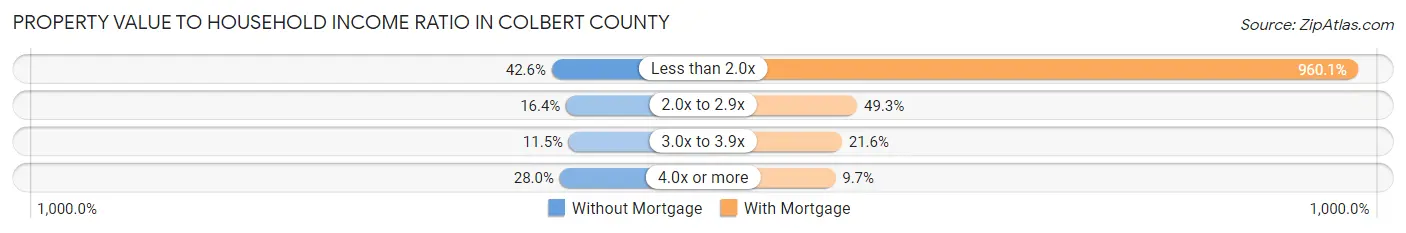
| Value-to-Income Ratio | Without Mortgage | With Mortgage |
| Less than 2.0x | 3,389 (42.6%) | 82,248 (960.1%) |
| 2.0x to 2.9x | 1,306 (16.4%) | 4,222 (49.3%) |
| 3.0x to 3.9x | 915 (11.5%) | 1,848 (21.6%) |
| 4.0x or more | 2,224 (28.0%) | 833 (9.7%) |
| Total | 7,953 (100.0%) | 8,567 (100.0%) |
Real Estate Taxes by Mortgage Status in Colbert County
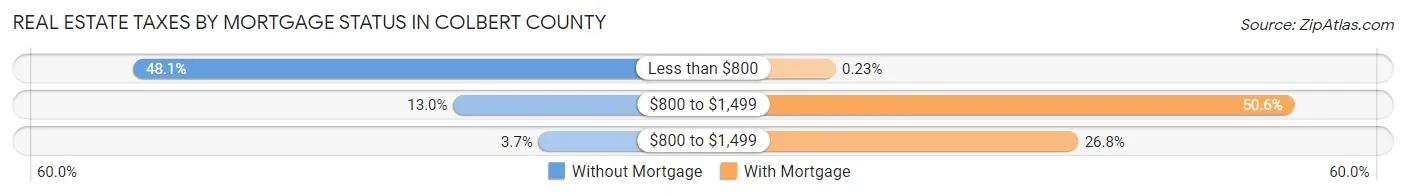
| Property Taxes | Without Mortgage | With Mortgage |
| Less than $800 | 3,826 (48.1%) | 20 (0.2%) |
| $800 to $1,499 | 1,035 (13.0%) | 4,334 (50.6%) |
| $800 to $1,499 | 291 (3.7%) | 2,297 (26.8%) |
| Total | 7,953 (100.0%) | 8,567 (100.0%) |
Health & Disability in Colbert County
Health Insurance Coverage by Age in Colbert County
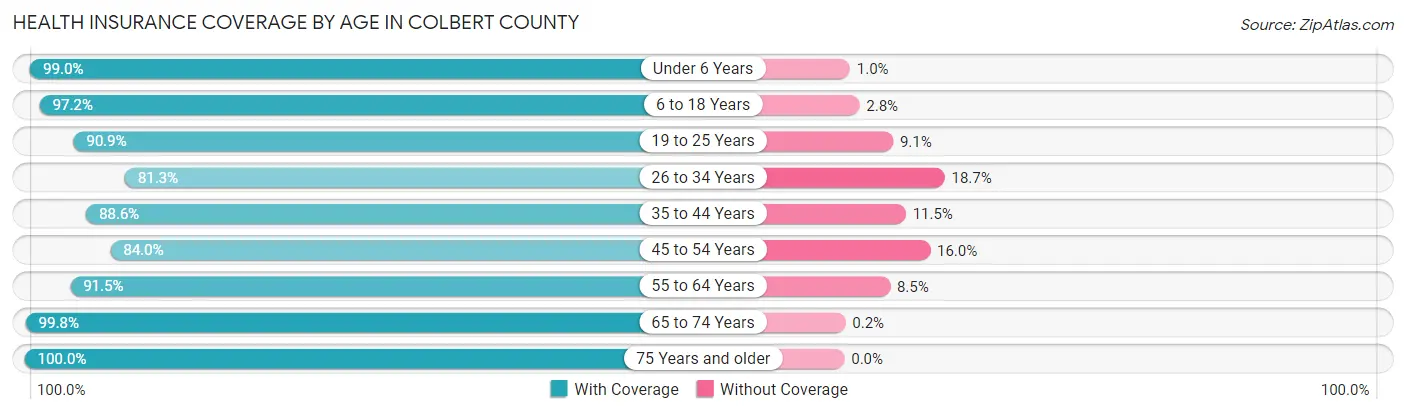
| Age Bracket | With Coverage | Without Coverage |
| Under 6 Years | 3,719 (99.0%) | 39 (1.0%) |
| 6 to 18 Years | 8,692 (97.2%) | 251 (2.8%) |
| 19 to 25 Years | 4,046 (90.9%) | 404 (9.1%) |
| 26 to 34 Years | 5,116 (81.3%) | 1,177 (18.7%) |
| 35 to 44 Years | 5,993 (88.5%) | 775 (11.5%) |
| 45 to 54 Years | 6,164 (84.0%) | 1,173 (16.0%) |
| 55 to 64 Years | 7,331 (91.5%) | 682 (8.5%) |
| 65 to 74 Years | 6,531 (99.8%) | 13 (0.2%) |
| 75 Years and older | 4,678 (100.0%) | 0 (0.0%) |
| Total | 52,270 (92.0%) | 4,514 (8.0%) |
Health Insurance Coverage by Citizenship Status in Colbert County
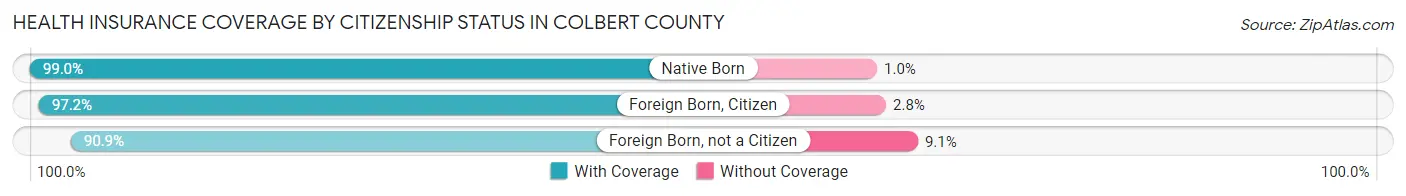
| Citizenship Status | With Coverage | Without Coverage |
| Native Born | 3,719 (99.0%) | 39 (1.0%) |
| Foreign Born, Citizen | 8,692 (97.2%) | 251 (2.8%) |
| Foreign Born, not a Citizen | 4,046 (90.9%) | 404 (9.1%) |
Health Insurance Coverage by Household Income in Colbert County
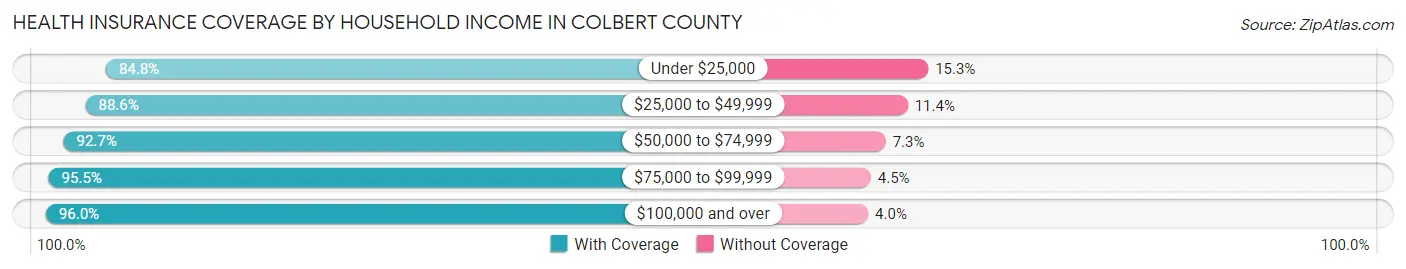
| Household Income | With Coverage | Without Coverage |
| Under $25,000 | 7,994 (84.8%) | 1,439 (15.2%) |
| $25,000 to $49,999 | 9,614 (88.6%) | 1,240 (11.4%) |
| $50,000 to $74,999 | 9,225 (92.7%) | 726 (7.3%) |
| $75,000 to $99,999 | 8,640 (95.5%) | 408 (4.5%) |
| $100,000 and over | 16,734 (96.0%) | 698 (4.0%) |
Public vs Private Health Insurance Coverage by Age in Colbert County
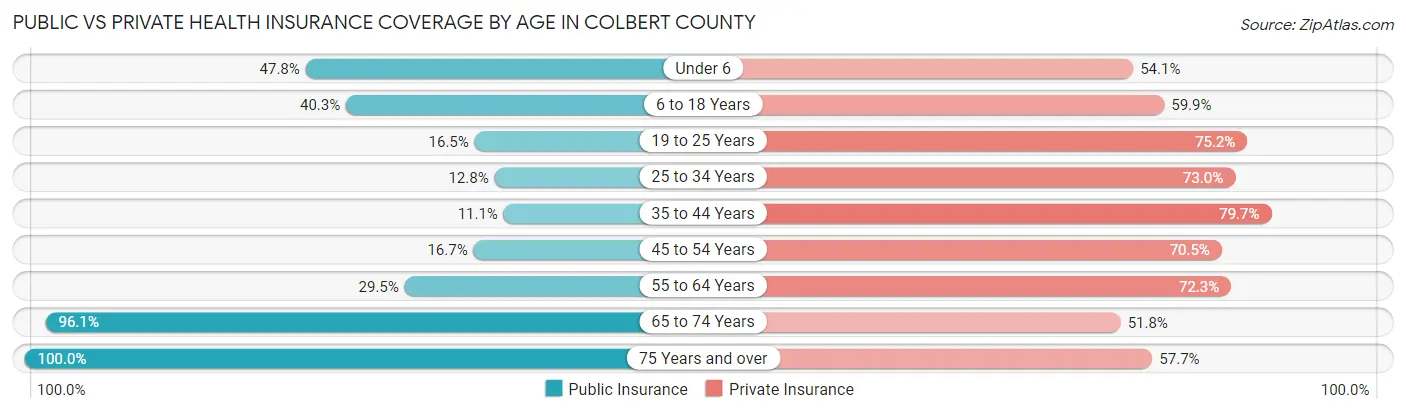
| Age Bracket | Public Insurance | Private Insurance |
| Under 6 | 1,798 (47.8%) | 2,033 (54.1%) |
| 6 to 18 Years | 3,608 (40.3%) | 5,353 (59.9%) |
| 19 to 25 Years | 733 (16.5%) | 3,348 (75.2%) |
| 25 to 34 Years | 804 (12.8%) | 4,593 (73.0%) |
| 35 to 44 Years | 749 (11.1%) | 5,395 (79.7%) |
| 45 to 54 Years | 1,224 (16.7%) | 5,173 (70.5%) |
| 55 to 64 Years | 2,361 (29.5%) | 5,789 (72.3%) |
| 65 to 74 Years | 6,289 (96.1%) | 3,388 (51.8%) |
| 75 Years and over | 4,678 (100.0%) | 2,697 (57.7%) |
| Total | 22,244 (39.2%) | 37,769 (66.5%) |
Disability Status by Sex by Age in Colbert County
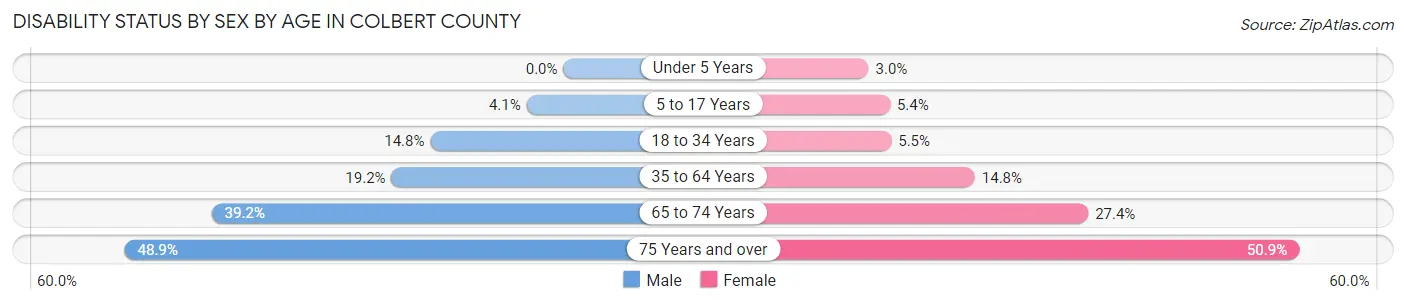
| Age Bracket | Male | Female |
| Under 5 Years | 0 (0.0%) | 37 (3.0%) |
| 5 to 17 Years | 181 (4.1%) | 236 (5.4%) |
| 18 to 34 Years | 847 (14.8%) | 317 (5.5%) |
| 35 to 64 Years | 2,062 (19.2%) | 1,682 (14.8%) |
| 65 to 74 Years | 1,170 (39.2%) | 976 (27.4%) |
| 75 Years and over | 940 (48.9%) | 1,402 (50.9%) |
Disability Class by Sex by Age in Colbert County
Disability Class: Hearing Difficulty
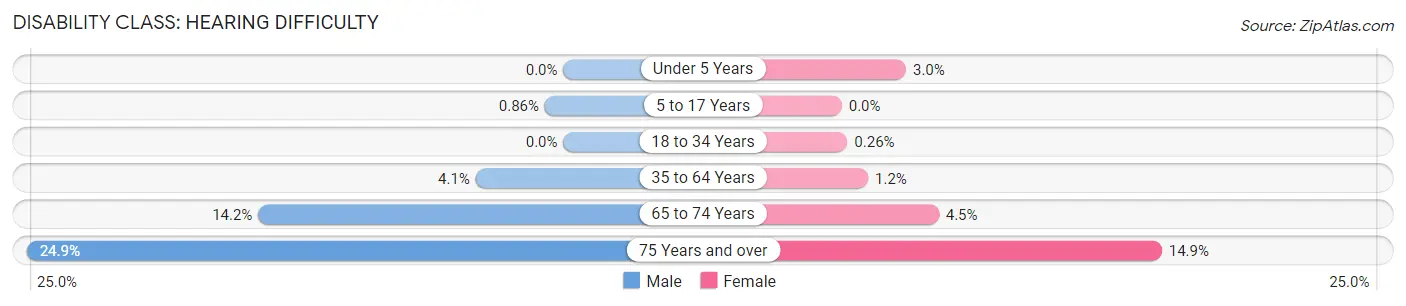
| Age Bracket | Male | Female |
| Under 5 Years | 0 (0.0%) | 37 (3.0%) |
| 5 to 17 Years | 38 (0.9%) | 0 (0.0%) |
| 18 to 34 Years | 0 (0.0%) | 15 (0.3%) |
| 35 to 64 Years | 438 (4.1%) | 139 (1.2%) |
| 65 to 74 Years | 423 (14.2%) | 160 (4.5%) |
| 75 Years and over | 479 (24.9%) | 409 (14.8%) |
Disability Class: Vision Difficulty

| Age Bracket | Male | Female |
| Under 5 Years | 0 (0.0%) | 0 (0.0%) |
| 5 to 17 Years | 31 (0.7%) | 20 (0.4%) |
| 18 to 34 Years | 274 (4.8%) | 24 (0.4%) |
| 35 to 64 Years | 263 (2.4%) | 156 (1.4%) |
| 65 to 74 Years | 322 (10.8%) | 131 (3.7%) |
| 75 Years and over | 152 (7.9%) | 219 (8.0%) |
Disability Class: Cognitive Difficulty
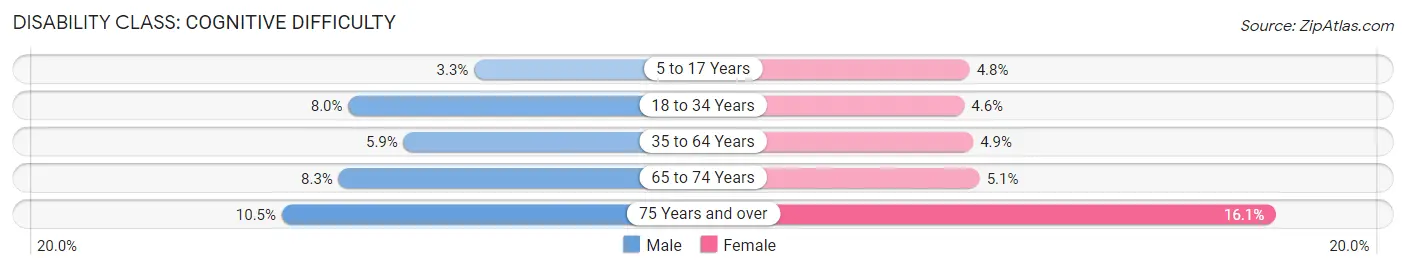
| Age Bracket | Male | Female |
| 5 to 17 Years | 146 (3.3%) | 209 (4.8%) |
| 18 to 34 Years | 456 (8.0%) | 262 (4.5%) |
| 35 to 64 Years | 638 (5.9%) | 554 (4.9%) |
| 65 to 74 Years | 249 (8.3%) | 182 (5.1%) |
| 75 Years and over | 201 (10.4%) | 444 (16.1%) |
Disability Class: Ambulatory Difficulty
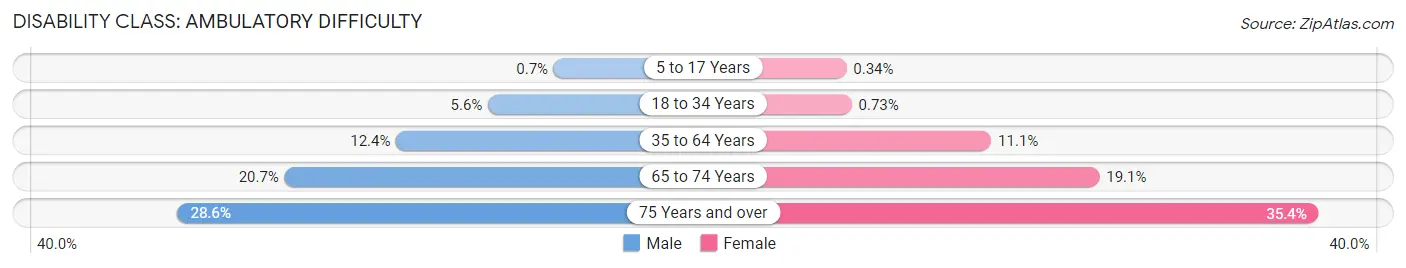
| Age Bracket | Male | Female |
| 5 to 17 Years | 31 (0.7%) | 15 (0.3%) |
| 18 to 34 Years | 319 (5.6%) | 42 (0.7%) |
| 35 to 64 Years | 1,335 (12.4%) | 1,259 (11.1%) |
| 65 to 74 Years | 618 (20.7%) | 680 (19.1%) |
| 75 Years and over | 551 (28.6%) | 975 (35.4%) |
Disability Class: Self-Care Difficulty
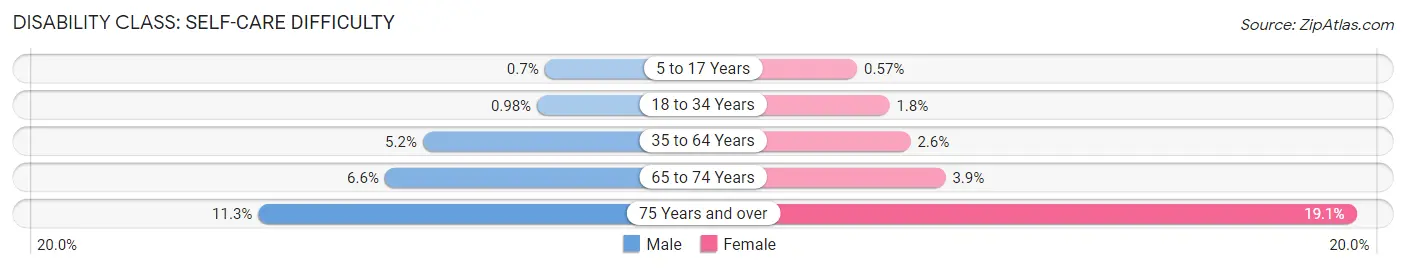
| Age Bracket | Male | Female |
| 5 to 17 Years | 31 (0.7%) | 25 (0.6%) |
| 18 to 34 Years | 56 (1.0%) | 102 (1.8%) |
| 35 to 64 Years | 562 (5.2%) | 290 (2.5%) |
| 65 to 74 Years | 198 (6.6%) | 137 (3.8%) |
| 75 Years and over | 218 (11.3%) | 526 (19.1%) |
Technology Access in Colbert County
Computing Device Access in Colbert County
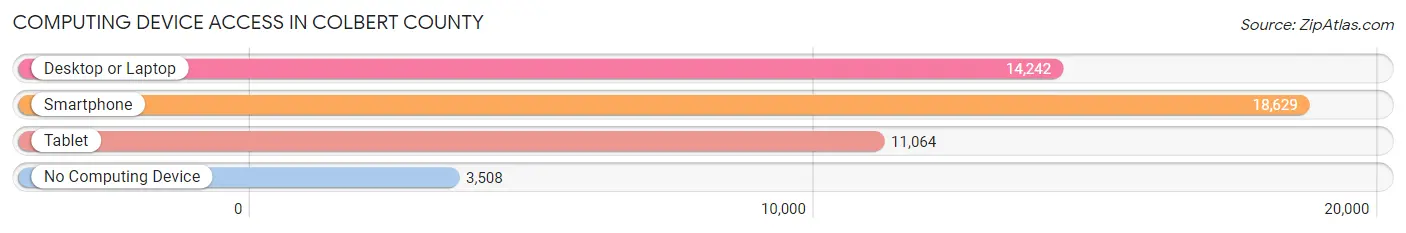
| Device Type | # Households | % Households |
| Desktop or Laptop | 14,242 | 61.2% |
| Smartphone | 18,629 | 80.1% |
| Tablet | 11,064 | 47.5% |
| No Computing Device | 3,508 | 15.1% |
| Total | 23,266 | 100.0% |
Internet Access in Colbert County
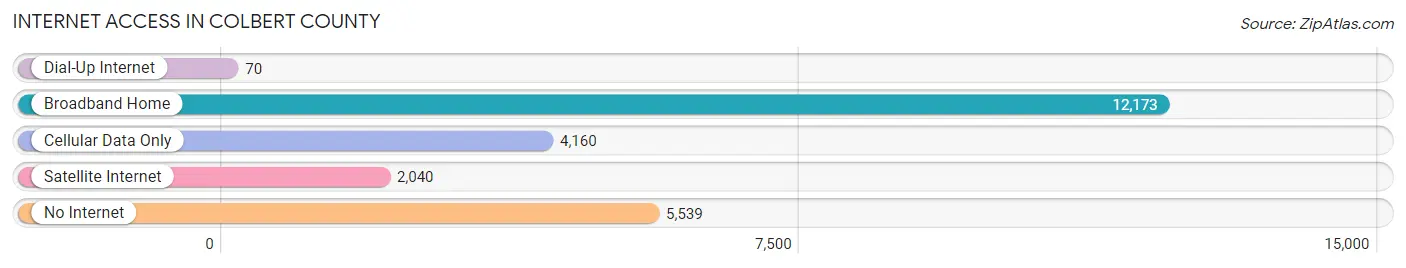
| Internet Type | # Households | % Households |
| Dial-Up Internet | 70 | 0.3% |
| Broadband Home | 12,173 | 52.3% |
| Cellular Data Only | 4,160 | 17.9% |
| Satellite Internet | 2,040 | 8.8% |
| No Internet | 5,539 | 23.8% |
| Total | 23,266 | 100.0% |
Colbert County Summary
Colbert County is located in the northwestern corner of the state of Alabama, and is part of the Shoals region. It is bordered by Lauderdale County to the east, Franklin County to the south, and Lawrence and Limestone counties to the west. The county seat is Tuscumbia, and the largest city is Muscle Shoals. The county was named for George Colbert, a Chickasaw chief who lived in the area.
Geography
Colbert County covers an area of 576 square miles, and is located in the Appalachian foothills. The terrain is mostly hilly, with the highest point being Sand Mountain at 1,099 feet. The county is drained by the Tennessee River, which forms its northern border. The county also contains several small lakes, including Pickwick Lake, Wilson Lake, and Bear Creek Lake.
Climate
Colbert County has a humid subtropical climate, with hot, humid summers and mild winters. The average annual temperature is 64°F, and the average annual precipitation is 51 inches.
Demographics
As of the 2010 census, Colbert County had a population of 54,428. The racial makeup of the county was 79.2% White, 17.7% Black or African American, 0.4% Native American, 0.6% Asian, 0.1% Pacific Islander, 0.7% from other races, and 1.4% from two or more races. Hispanic or Latino of any race were 2.2% of the population.
The median household income was $37,845, and the median family income was $45,945. The per capita income was $20,845. About 16.2% of the population was below the poverty line.
Economy
The economy of Colbert County is largely based on manufacturing and agriculture. The county is home to several large manufacturing plants, including a Goodyear Tire and Rubber plant, a 3M plant, and a Tyson Foods plant. The county is also home to several large farms, which produce cotton, soybeans, corn, and other crops.
The county is also home to several tourist attractions, including the Alabama Music Hall of Fame, the Tennessee Valley Authority's Wilson Dam, and the Muscle Shoals Sound Studio.
Education
Colbert County is served by the Colbert County School District, which operates 15 elementary schools, four middle schools, and four high schools. The county is also home to several private schools, including Colbert Heights High School, Shoals Christian School, and Shoals Christian Academy.
Colbert County is also home to several higher education institutions, including the University of North Alabama, Northwest-Shoals Community College, and the Shoals Campus of the University of Alabama.
Conclusion
Colbert County is a rural county located in the northwestern corner of Alabama. It is home to several large manufacturing plants and farms, as well as several tourist attractions. The county is served by the Colbert County School District, as well as several higher education institutions. The county has a humid subtropical climate, and the median household income is $37,845.
Common Questions
What is Per Capita Income in Colbert County?
Per Capita income in Colbert County is $30,724.
What is the Median Family Income in Colbert County?
Median Family Income in Colbert County is $69,400.
What is the Median Household income in Colbert County?
Median Household Income in Colbert County is $56,149.
What is Income or Wage Gap in Colbert County?
Income or Wage Gap in Colbert County is 38.2%.
Women in Colbert County earn 61.8 cents for every dollar earned by a man.
What is Family Income Deficit in Colbert County?
Family Income Deficit in Colbert County is $12,885.
Families that are below poverty line in Colbert County earn $12,885 less on average than the poverty threshold level.
What is Inequality or Gini Index in Colbert County?
Inequality or Gini Index in Colbert County is 0.45.
What is the Total Population of Colbert County?
Total Population of Colbert County is 57,270.
What is the Total Male Population of Colbert County?
Total Male Population of Colbert County is 27,911.
What is the Total Female Population of Colbert County?
Total Female Population of Colbert County is 29,359.
What is the Ratio of Males per 100 Females in Colbert County?
There are 95.07 Males per 100 Females in Colbert County.
What is the Ratio of Females per 100 Males in Colbert County?
There are 105.19 Females per 100 Males in Colbert County.
What is the Median Population Age in Colbert County?
Median Population Age in Colbert County is 42.0 Years.
What is the Average Family Size in Colbert County
Average Family Size in Colbert County is 3.0 People.
What is the Average Household Size in Colbert County
Average Household Size in Colbert County is 2.4 People.
How Large is the Labor Force in Colbert County?
There are 26,568 People in the Labor Forcein in Colbert County.
What is the Percentage of People in the Labor Force in Colbert County?
56.9% of People are in the Labor Force in Colbert County.
What is the Unemployment Rate in Colbert County?
Unemployment Rate in Colbert County is 3.4%.