Morgan County, AL Map & Demographics
Morgan County Map
Morgan County Overview
$33,223
PER CAPITA INCOME
$79,360
AVG FAMILY INCOME
$61,588
AVG HOUSEHOLD INCOME
35.3%
WAGE / INCOME GAP [ % ]
64.7¢/ $1
WAGE / INCOME GAP [ $ ]
$8,848
FAMILY INCOME DEFICIT
0.45
INEQUALITY / GINI INDEX
123,102
TOTAL POPULATION
60,953
MALE POPULATION
62,149
FEMALE POPULATION
98.08
MALES / 100 FEMALES
101.96
FEMALES / 100 MALES
40.6
MEDIAN AGE
3.1
AVG FAMILY SIZE
2.5
AVG HOUSEHOLD SIZE
57,529
LABOR FORCE [ PEOPLE ]
58.5%
PERCENT IN LABOR FORCE
4.2%
UNEMPLOYMENT RATE
Morgan County Area Codes
Income in Morgan County
Income Overview in Morgan County
Per Capita Income in Morgan County is $33,223, while median incomes of families and households are $79,360 and $61,588 respectively.
| Characteristic | Number | Measure |
| Per Capita Income | 123,102 | $33,223 |
| Median Family Income | 31,864 | $79,360 |
| Mean Family Income | 31,864 | $98,305 |
| Median Household Income | 48,004 | $61,588 |
| Mean Household Income | 48,004 | $82,600 |
| Income Deficit | 31,864 | $8,848 |
| Wage / Income Gap (%) | 123,102 | 35.28% |
| Wage / Income Gap ($) | 123,102 | 64.72¢ per $1 |
| Gini / Inequality Index | 123,102 | 0.45 |
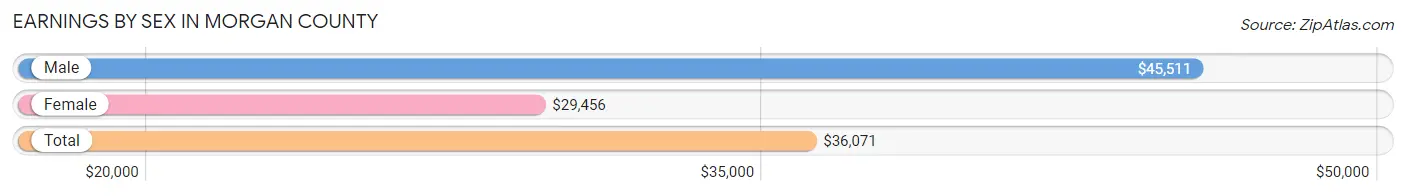
Earnings by Sex in Morgan County
Average Earnings in Morgan County are $36,071, $45,511 for men and $29,456 for women, a difference of 35.3%.
| Sex | Number | Average Earnings |
| Male | 32,925 (55.4%) | $45,511 |
| Female | 26,549 (44.6%) | $29,456 |
| Total | 59,474 (100.0%) | $36,071 |
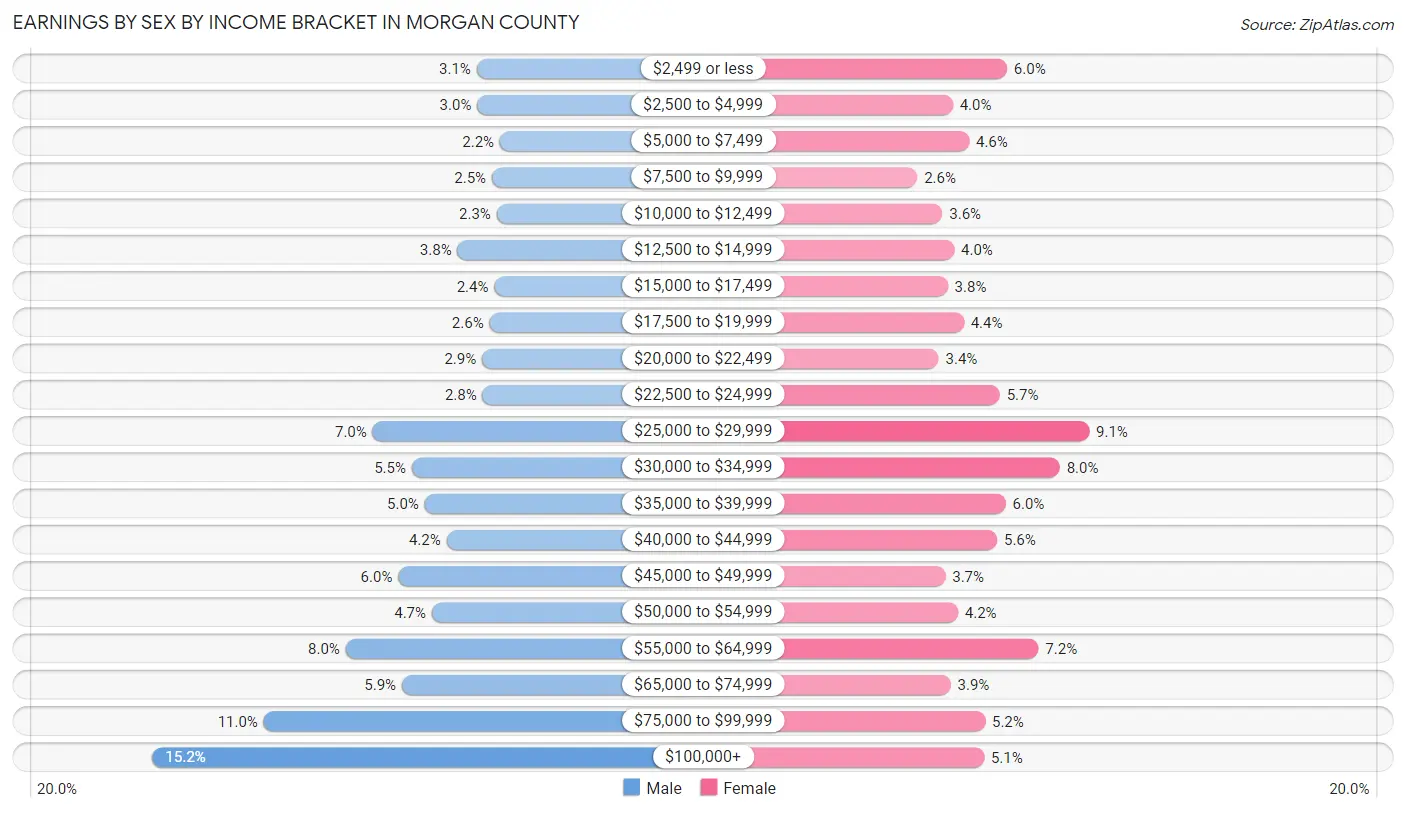
Earnings by Sex by Income Bracket in Morgan County
The most common earnings brackets in Morgan County are $100,000+ for men (5,007 | 15.2%) and $25,000 to $29,999 for women (2,410 | 9.1%).
| Income | Male | Female |
| $2,499 or less | 1,008 (3.1%) | 1,594 (6.0%) |
| $2,500 to $4,999 | 1,000 (3.0%) | 1,053 (4.0%) |
| $5,000 to $7,499 | 721 (2.2%) | 1,217 (4.6%) |
| $7,500 to $9,999 | 819 (2.5%) | 701 (2.6%) |
| $10,000 to $12,499 | 759 (2.3%) | 951 (3.6%) |
| $12,500 to $14,999 | 1,243 (3.8%) | 1,067 (4.0%) |
| $15,000 to $17,499 | 789 (2.4%) | 1,003 (3.8%) |
| $17,500 to $19,999 | 848 (2.6%) | 1,162 (4.4%) |
| $20,000 to $22,499 | 943 (2.9%) | 914 (3.4%) |
| $22,500 to $24,999 | 934 (2.8%) | 1,521 (5.7%) |
| $25,000 to $29,999 | 2,293 (7.0%) | 2,410 (9.1%) |
| $30,000 to $34,999 | 1,808 (5.5%) | 2,118 (8.0%) |
| $35,000 to $39,999 | 1,649 (5.0%) | 1,579 (5.9%) |
| $40,000 to $44,999 | 1,380 (4.2%) | 1,494 (5.6%) |
| $45,000 to $49,999 | 1,976 (6.0%) | 980 (3.7%) |
| $50,000 to $54,999 | 1,559 (4.7%) | 1,104 (4.2%) |
| $55,000 to $64,999 | 2,623 (8.0%) | 1,907 (7.2%) |
| $65,000 to $74,999 | 1,931 (5.9%) | 1,034 (3.9%) |
| $75,000 to $99,999 | 3,635 (11.0%) | 1,376 (5.2%) |
| $100,000+ | 5,007 (15.2%) | 1,364 (5.1%) |
| Total | 32,925 (100.0%) | 26,549 (100.0%) |
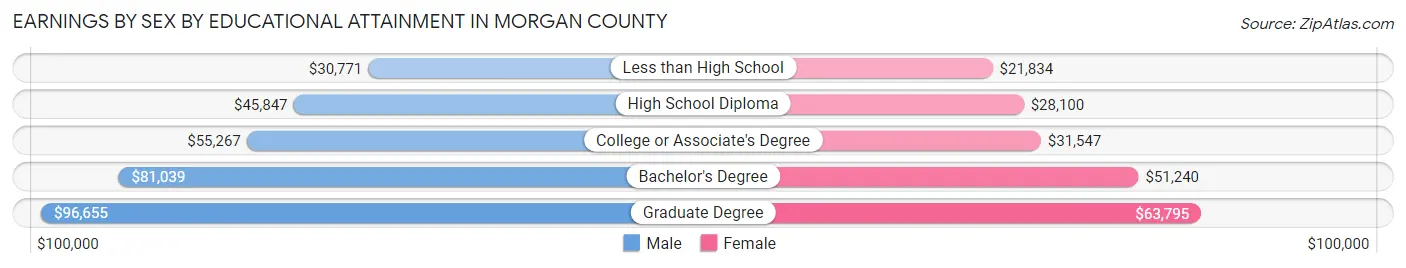
Earnings by Sex by Educational Attainment in Morgan County
Average earnings in Morgan County are $50,643 for men and $33,749 for women, a difference of 33.4%. Men with an educational attainment of graduate degree enjoy the highest average annual earnings of $96,655, while those with less than high school education earn the least with $30,771. Women with an educational attainment of graduate degree earn the most with the average annual earnings of $63,795, while those with less than high school education have the smallest earnings of $21,834.
| Educational Attainment | Male Income | Female Income |
| Less than High School | $30,771 | $21,834 |
| High School Diploma | $45,847 | $28,100 |
| College or Associate's Degree | $55,267 | $31,547 |
| Bachelor's Degree | $81,039 | $51,240 |
| Graduate Degree | $96,655 | $63,795 |
| Total | $50,643 | $33,749 |
Family Income in Morgan County
Family Income Brackets in Morgan County
According to the Morgan County family income data, there are 6,277 families falling into the $100,000 to $149,999 income range, which is the most common income bracket and makes up 19.7% of all families. Conversely, the $10,000 to $14,999 income bracket is the least frequent group with only 797 families (2.5%) belonging to this category.
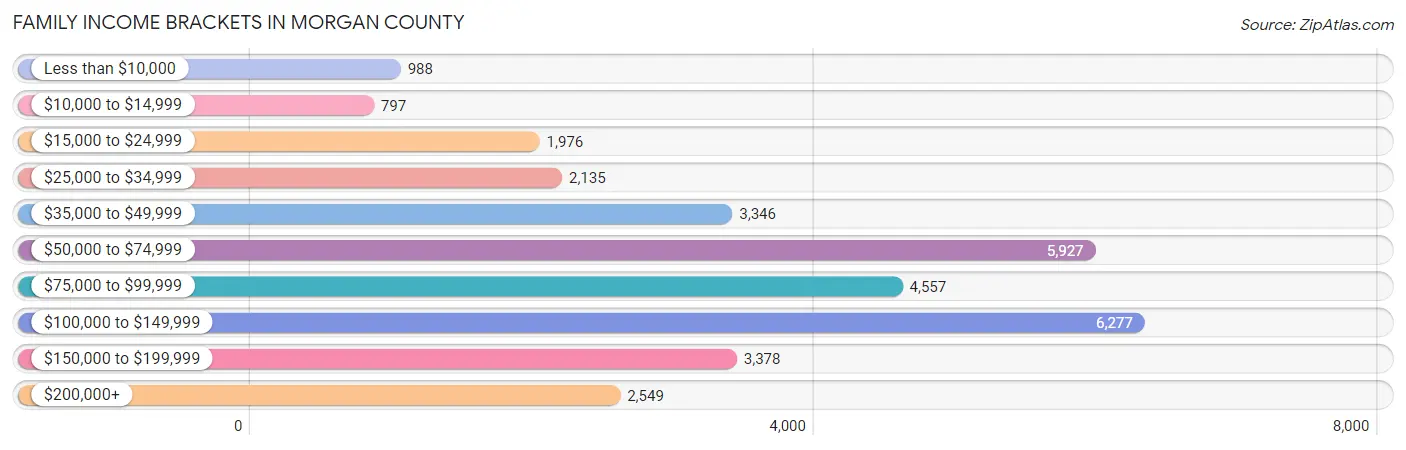
| Income Bracket | # Families | % Families |
| Less than $10,000 | 988 | 3.1% |
| $10,000 to $14,999 | 797 | 2.5% |
| $15,000 to $24,999 | 1,976 | 6.2% |
| $25,000 to $34,999 | 2,135 | 6.7% |
| $35,000 to $49,999 | 3,346 | 10.5% |
| $50,000 to $74,999 | 5,927 | 18.6% |
| $75,000 to $99,999 | 4,557 | 14.3% |
| $100,000 to $149,999 | 6,277 | 19.7% |
| $150,000 to $199,999 | 3,378 | 10.6% |
| $200,000+ | 2,549 | 8.0% |
Family Income by Famaliy Size in Morgan County
6-person families (943 | 3.0%) account for the highest median family income in Morgan County with $115,409 per family, while 2-person families (16,129 | 50.6%) have the highest median income of $35,257 per family member.
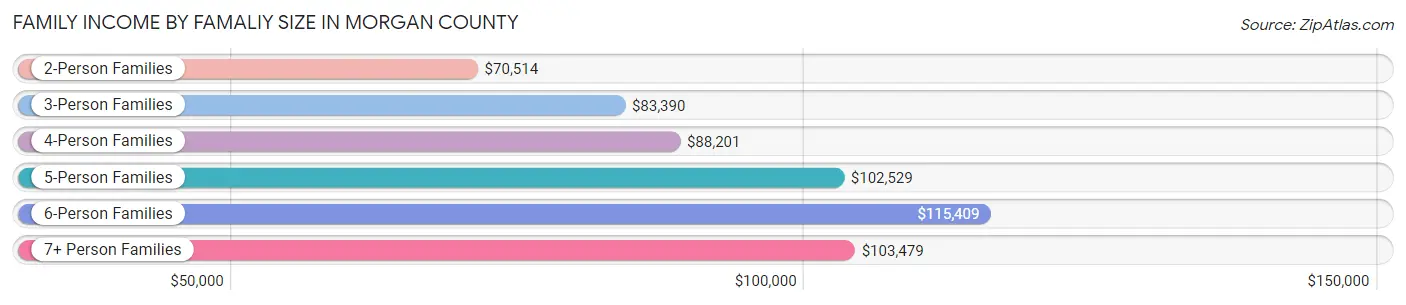
| Income Bracket | # Families | Median Income |
| 2-Person Families | 16,129 (50.6%) | $70,514 |
| 3-Person Families | 7,041 (22.1%) | $83,390 |
| 4-Person Families | 4,989 (15.7%) | $88,201 |
| 5-Person Families | 2,181 (6.8%) | $102,529 |
| 6-Person Families | 943 (3.0%) | $115,409 |
| 7+ Person Families | 581 (1.8%) | $103,479 |
| Total | 31,864 (100.0%) | $79,360 |
Family Income by Number of Earners in Morgan County
The median family income in Morgan County is $79,360, with families comprising 3+ earners (3,080) having the highest median family income of $122,708, while families with 1 earner (10,224) have the lowest median family income of $54,432, accounting for 9.7% and 32.1% of families, respectively.
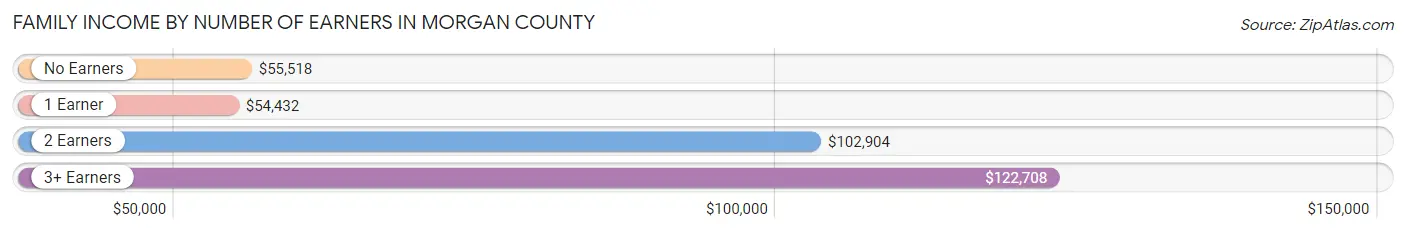
| Number of Earners | # Families | Median Income |
| No Earners | 6,222 (19.5%) | $55,518 |
| 1 Earner | 10,224 (32.1%) | $54,432 |
| 2 Earners | 12,338 (38.7%) | $102,904 |
| 3+ Earners | 3,080 (9.7%) | $122,708 |
| Total | 31,864 (100.0%) | $79,360 |
Household Income in Morgan County
Household Income Brackets in Morgan County
With 8,305 households falling in the category, the $50,000 to $74,999 income range is the most frequent in Morgan County, accounting for 17.3% of all households. In contrast, only 2,160 households (4.5%) fall into the $10,000 to $14,999 income bracket, making it the least populous group.
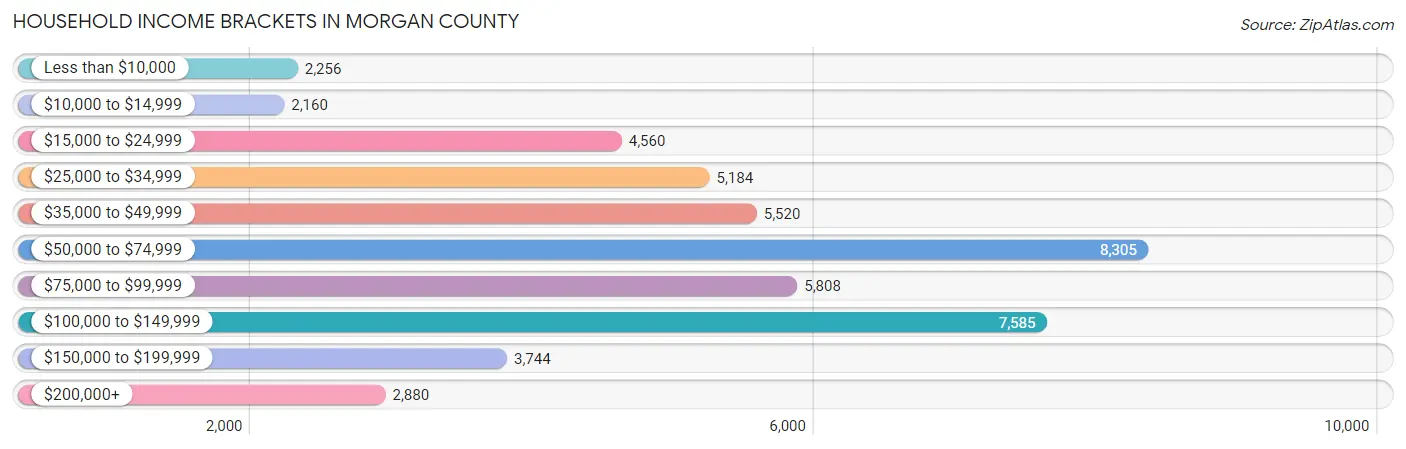
| Income Bracket | # Households | % Households |
| Less than $10,000 | 2,256 | 4.7% |
| $10,000 to $14,999 | 2,160 | 4.5% |
| $15,000 to $24,999 | 4,560 | 9.5% |
| $25,000 to $34,999 | 5,184 | 10.8% |
| $35,000 to $49,999 | 5,520 | 11.5% |
| $50,000 to $74,999 | 8,305 | 17.3% |
| $75,000 to $99,999 | 5,808 | 12.1% |
| $100,000 to $149,999 | 7,585 | 15.8% |
| $150,000 to $199,999 | 3,744 | 7.8% |
| $200,000+ | 2,880 | 6.0% |
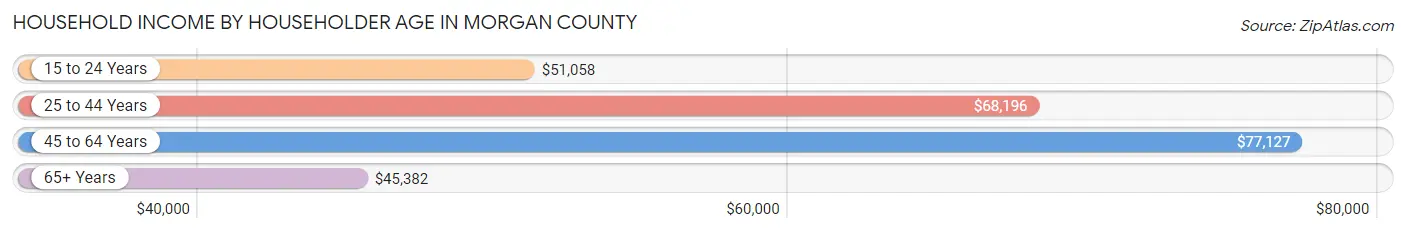
Household Income by Householder Age in Morgan County
The median household income in Morgan County is $61,588, with the highest median household income of $77,127 found in the 45 to 64 years age bracket for the primary householder. A total of 18,738 households (39.0%) fall into this category. Meanwhile, the 65+ years age bracket for the primary householder has the lowest median household income of $45,382, with 14,420 households (30.0%) in this group.
| Income Bracket | # Households | Median Income |
| 15 to 24 Years | 1,519 (3.2%) | $51,058 |
| 25 to 44 Years | 13,327 (27.8%) | $68,196 |
| 45 to 64 Years | 18,738 (39.0%) | $77,127 |
| 65+ Years | 14,420 (30.0%) | $45,382 |
| Total | 48,004 (100.0%) | $61,588 |
Poverty in Morgan County
Income Below Poverty by Sex and Age in Morgan County
With 11.8% poverty level for males and 15.5% for females among the residents of Morgan County, under 5 year old males and under 5 year old females are the most vulnerable to poverty, with 1,004 males (27.2%) and 1,055 females (30.7%) in their respective age groups living below the poverty level.
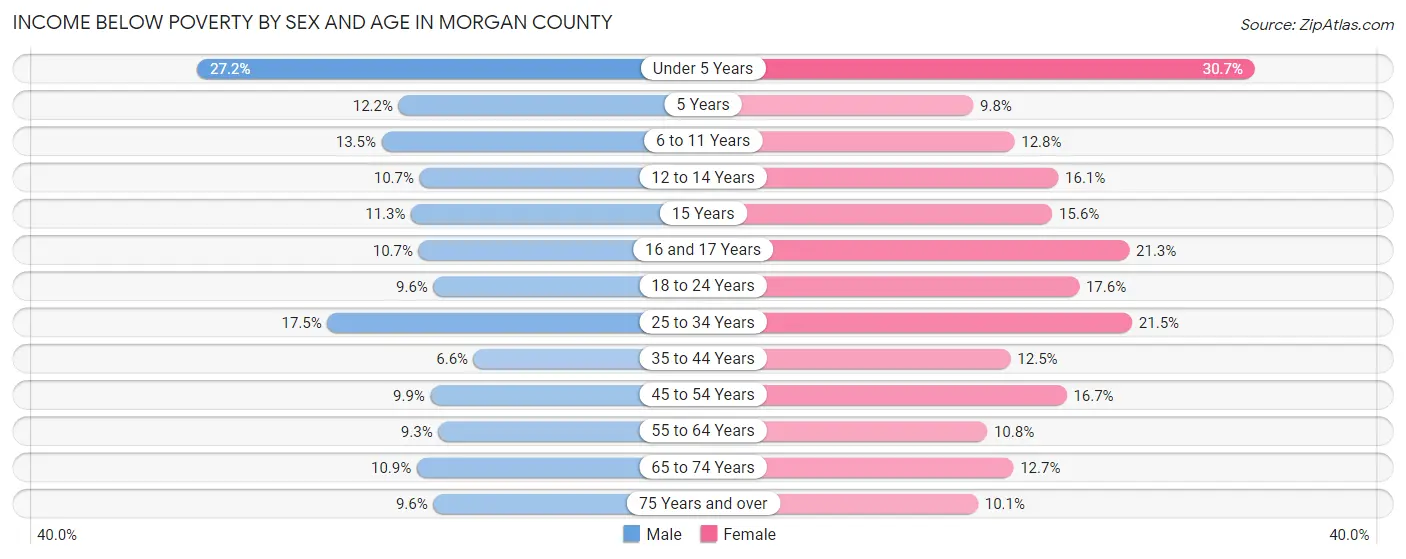
| Age Bracket | Male | Female |
| Under 5 Years | 1,004 (27.2%) | 1,055 (30.7%) |
| 5 Years | 94 (12.2%) | 46 (9.8%) |
| 6 to 11 Years | 675 (13.5%) | 622 (12.8%) |
| 12 to 14 Years | 242 (10.7%) | 362 (16.1%) |
| 15 Years | 108 (11.3%) | 105 (15.6%) |
| 16 and 17 Years | 173 (10.7%) | 382 (21.3%) |
| 18 to 24 Years | 499 (9.6%) | 846 (17.6%) |
| 25 to 34 Years | 1,263 (17.5%) | 1,557 (21.5%) |
| 35 to 44 Years | 493 (6.6%) | 947 (12.5%) |
| 45 to 54 Years | 756 (9.9%) | 1,301 (16.7%) |
| 55 to 64 Years | 764 (9.3%) | 915 (10.8%) |
| 65 to 74 Years | 632 (10.9%) | 881 (12.7%) |
| 75 Years and over | 348 (9.6%) | 509 (10.1%) |
| Total | 7,051 (11.8%) | 9,528 (15.5%) |
Income Above Poverty by Sex and Age in Morgan County
According to the poverty statistics in Morgan County, males aged 35 to 44 years and females aged 5 years are the age groups that are most secure financially, with 93.4% of males and 90.2% of females in these age groups living above the poverty line.
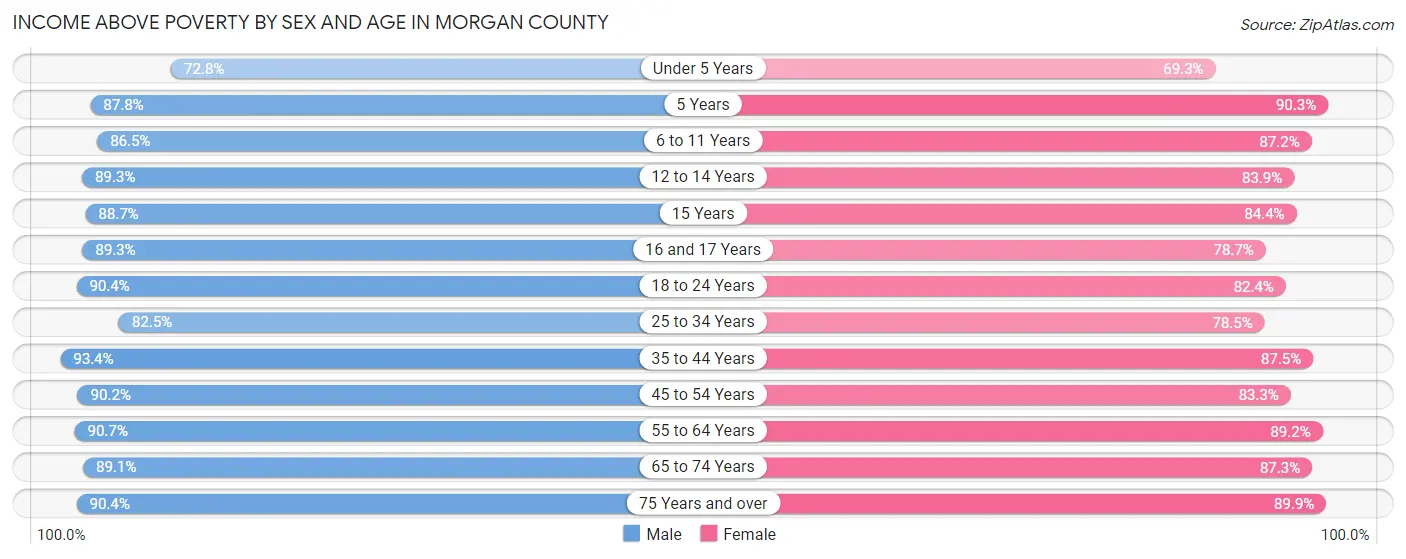
| Age Bracket | Male | Female |
| Under 5 Years | 2,689 (72.8%) | 2,386 (69.3%) |
| 5 Years | 675 (87.8%) | 426 (90.2%) |
| 6 to 11 Years | 4,332 (86.5%) | 4,235 (87.2%) |
| 12 to 14 Years | 2,028 (89.3%) | 1,892 (83.9%) |
| 15 Years | 849 (88.7%) | 567 (84.4%) |
| 16 and 17 Years | 1,439 (89.3%) | 1,409 (78.7%) |
| 18 to 24 Years | 4,684 (90.4%) | 3,959 (82.4%) |
| 25 to 34 Years | 5,949 (82.5%) | 5,670 (78.5%) |
| 35 to 44 Years | 6,936 (93.4%) | 6,616 (87.5%) |
| 45 to 54 Years | 6,920 (90.1%) | 6,501 (83.3%) |
| 55 to 64 Years | 7,480 (90.7%) | 7,573 (89.2%) |
| 65 to 74 Years | 5,186 (89.1%) | 6,038 (87.3%) |
| 75 Years and over | 3,262 (90.4%) | 4,531 (89.9%) |
| Total | 52,429 (88.1%) | 51,803 (84.5%) |
Income Below Poverty Among Married-Couple Families in Morgan County
The poverty statistics for married-couple families in Morgan County show that 6.3% or 1,516 of the total 23,915 families live below the poverty line. Families with 3 or 4 children have the highest poverty rate of 12.9%, comprising of 250 families. On the other hand, families with 5 or more children have the lowest poverty rate of 0.7%, which includes 2 families.
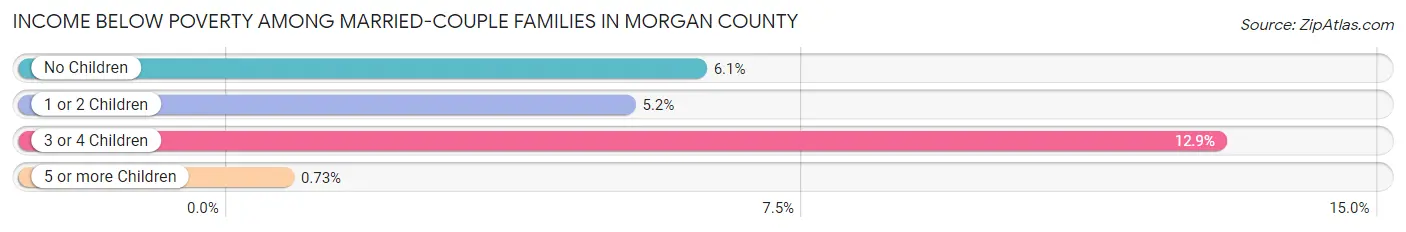
| Children | Above Poverty | Below Poverty |
| No Children | 13,814 (93.9%) | 901 (6.1%) |
| 1 or 2 Children | 6,626 (94.8%) | 363 (5.2%) |
| 3 or 4 Children | 1,686 (87.1%) | 250 (12.9%) |
| 5 or more Children | 273 (99.3%) | 2 (0.7%) |
| Total | 22,399 (93.7%) | 1,516 (6.3%) |
Income Below Poverty Among Single-Parent Households in Morgan County
According to the poverty data in Morgan County, 9.7% or 197 single-father households and 28.6% or 1,692 single-mother households are living below the poverty line. Among single-father households, those with 5 or more children have the highest poverty rate, with 2 households (100.0%) experiencing poverty. Likewise, among single-mother households, those with 5 or more children have the highest poverty rate, with 32 households (94.1%) falling below the poverty line.
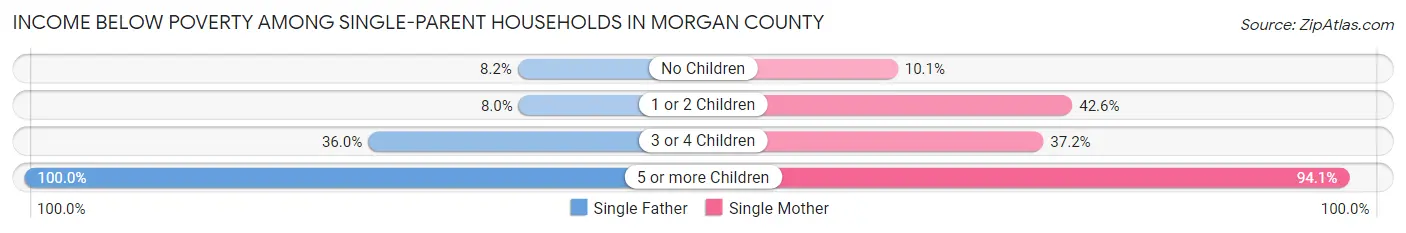
| Children | Single Father | Single Mother |
| No Children | 79 (8.2%) | 255 (10.1%) |
| 1 or 2 Children | 76 (8.0%) | 1,248 (42.6%) |
| 3 or 4 Children | 40 (36.0%) | 157 (37.2%) |
| 5 or more Children | 2 (100.0%) | 32 (94.1%) |
| Total | 197 (9.7%) | 1,692 (28.6%) |
Income Below Poverty Among Married-Couple vs Single-Parent Households in Morgan County
The poverty data for Morgan County shows that 1,516 of the married-couple family households (6.3%) and 1,889 of the single-parent households (23.8%) are living below the poverty level. Within the married-couple family households, those with 3 or 4 children have the highest poverty rate, with 250 households (12.9%) falling below the poverty line. Among the single-parent households, those with 5 or more children have the highest poverty rate, with 34 household (94.4%) living below poverty.
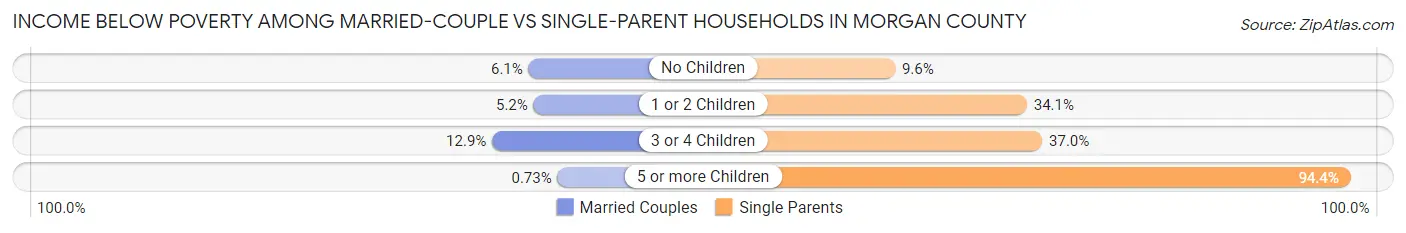
| Children | Married-Couple Families | Single-Parent Households |
| No Children | 901 (6.1%) | 334 (9.6%) |
| 1 or 2 Children | 363 (5.2%) | 1,324 (34.1%) |
| 3 or 4 Children | 250 (12.9%) | 197 (37.0%) |
| 5 or more Children | 2 (0.7%) | 34 (94.4%) |
| Total | 1,516 (6.3%) | 1,889 (23.8%) |
Race in Morgan County
The most populous races in Morgan County are White / Caucasian (94,056 | 76.4%), Black / African American (16,631 | 13.5%), and Hispanic or Latino (10,845 | 8.8%).
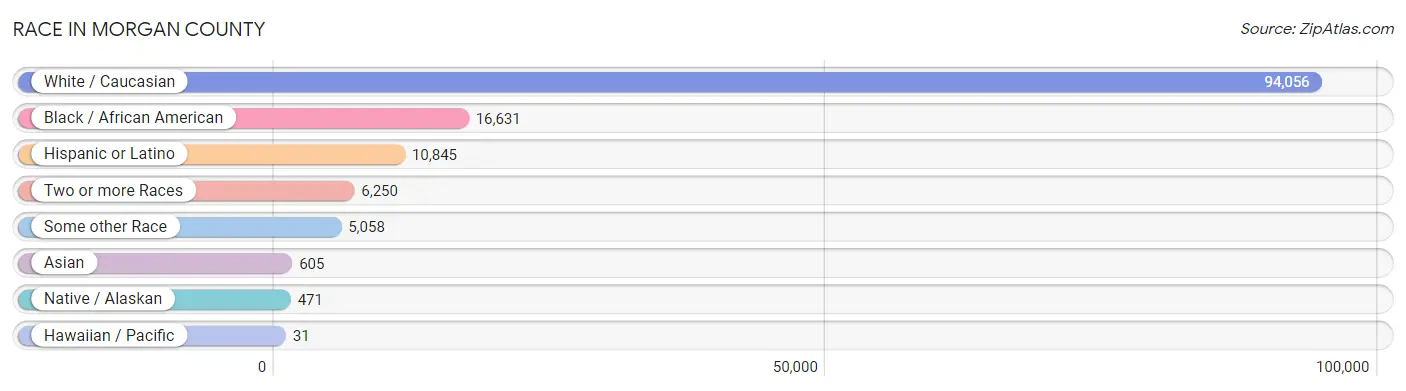
| Race | # Population | % Population |
| Asian | 605 | 0.5% |
| Black / African American | 16,631 | 13.5% |
| Hawaiian / Pacific | 31 | 0.0% |
| Hispanic or Latino | 10,845 | 8.8% |
| Native / Alaskan | 471 | 0.4% |
| White / Caucasian | 94,056 | 76.4% |
| Two or more Races | 6,250 | 5.1% |
| Some other Race | 5,058 | 4.1% |
| Total | 123,102 | 100.0% |
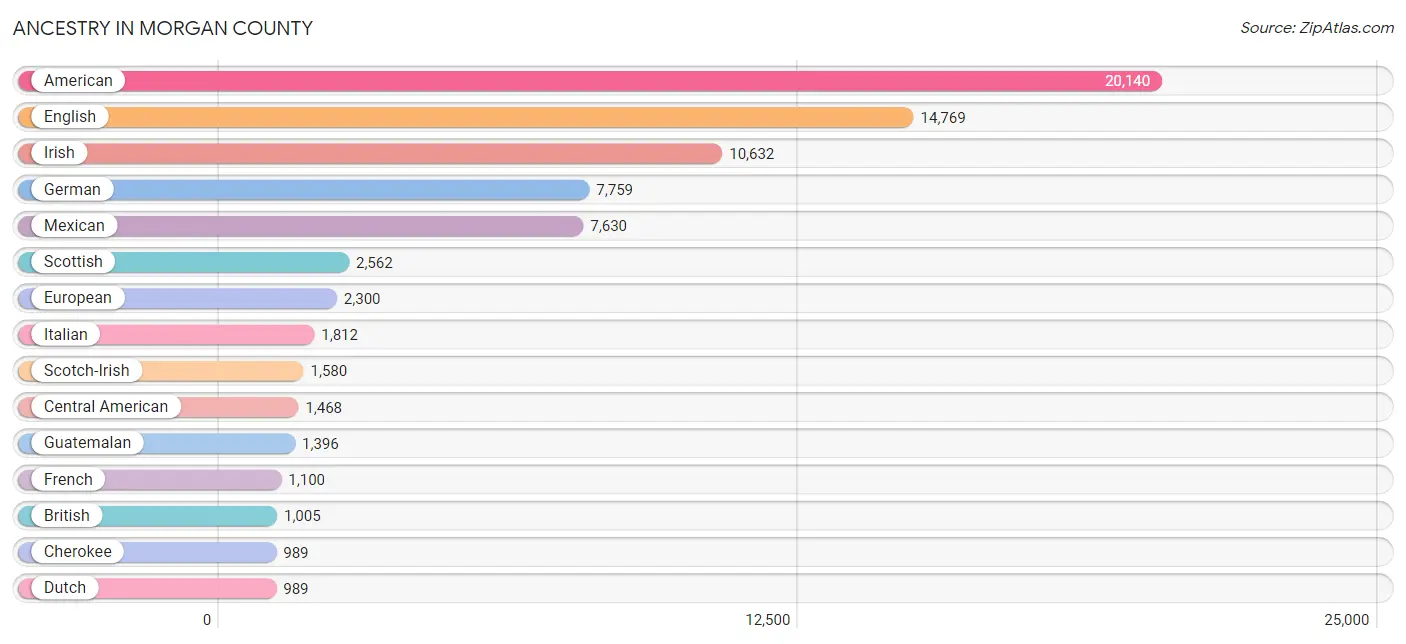
Ancestry in Morgan County
The most populous ancestries reported in Morgan County are American (20,140 | 16.4%), English (14,769 | 12.0%), Irish (10,632 | 8.6%), German (7,759 | 6.3%), and Mexican (7,630 | 6.2%), together accounting for 49.5% of all Morgan County residents.
| Ancestry | # Population | % Population |
| African | 254 | 0.2% |
| Albanian | 22 | 0.0% |
| American | 20,140 | 16.4% |
| Apache | 185 | 0.2% |
| Arab | 907 | 0.7% |
| Armenian | 31 | 0.0% |
| Belgian | 24 | 0.0% |
| Bhutanese | 53 | 0.0% |
| Blackfeet | 61 | 0.1% |
| Brazilian | 23 | 0.0% |
| British | 1,005 | 0.8% |
| Bulgarian | 3 | 0.0% |
| Burmese | 136 | 0.1% |
| Canadian | 14 | 0.0% |
| Celtic | 11 | 0.0% |
| Central American | 1,468 | 1.2% |
| Central American Indian | 55 | 0.0% |
| Cherokee | 989 | 0.8% |
| Chickasaw | 8 | 0.0% |
| Chilean | 20 | 0.0% |
| Colombian | 34 | 0.0% |
| Creek | 83 | 0.1% |
| Croatian | 27 | 0.0% |
| Cuban | 310 | 0.3% |
| Czech | 78 | 0.1% |
| Danish | 104 | 0.1% |
| Dominican | 22 | 0.0% |
| Dutch | 989 | 0.8% |
| Dutch West Indian | 9 | 0.0% |
| Eastern European | 156 | 0.1% |
| Ecuadorian | 23 | 0.0% |
| Egyptian | 12 | 0.0% |
| English | 14,769 | 12.0% |
| European | 2,300 | 1.9% |
| Finnish | 144 | 0.1% |
| French | 1,100 | 0.9% |
| French Canadian | 346 | 0.3% |
| German | 7,759 | 6.3% |
| Greek | 369 | 0.3% |
| Guamanian / Chamorro | 22 | 0.0% |
| Guatemalan | 1,396 | 1.1% |
| Honduran | 42 | 0.0% |
| Houma | 5 | 0.0% |
| Hungarian | 25 | 0.0% |
| Indian (Asian) | 70 | 0.1% |
| Iranian | 87 | 0.1% |
| Irish | 10,632 | 8.6% |
| Iroquois | 12 | 0.0% |
| Israeli | 21 | 0.0% |
| Italian | 1,812 | 1.5% |
| Jamaican | 45 | 0.0% |
| Korean | 241 | 0.2% |
| Laotian | 83 | 0.1% |
| Lebanese | 102 | 0.1% |
| Liberian | 16 | 0.0% |
| Lithuanian | 19 | 0.0% |
| Mexican | 7,630 | 6.2% |
| Mexican American Indian | 63 | 0.1% |
| Native Hawaiian | 70 | 0.1% |
| Nigerian | 43 | 0.0% |
| Northern European | 227 | 0.2% |
| Norwegian | 346 | 0.3% |
| Pakistani | 249 | 0.2% |
| Palestinian | 1 | 0.0% |
| Pennsylvania German | 9 | 0.0% |
| Polish | 543 | 0.4% |
| Portuguese | 196 | 0.2% |
| Puerto Rican | 544 | 0.4% |
| Romanian | 268 | 0.2% |
| Russian | 62 | 0.1% |
| Salvadoran | 5 | 0.0% |
| Samoan | 56 | 0.1% |
| Scandinavian | 229 | 0.2% |
| Scotch-Irish | 1,580 | 1.3% |
| Scottish | 2,562 | 2.1% |
| Serbian | 9 | 0.0% |
| Sioux | 16 | 0.0% |
| Slovak | 18 | 0.0% |
| South American | 94 | 0.1% |
| Spaniard | 193 | 0.2% |
| Spanish | 91 | 0.1% |
| Sri Lankan | 130 | 0.1% |
| Subsaharan African | 343 | 0.3% |
| Swedish | 294 | 0.2% |
| Swiss | 154 | 0.1% |
| Syrian | 5 | 0.0% |
| Thai | 197 | 0.2% |
| Trinidadian and Tobagonian | 79 | 0.1% |
| Turkish | 7 | 0.0% |
| U.S. Virgin Islander | 15 | 0.0% |
| Ugandan | 30 | 0.0% |
| Ukrainian | 105 | 0.1% |
| Ute | 16 | 0.0% |
| Venezuelan | 17 | 0.0% |
| Welsh | 774 | 0.6% |
| Yugoslavian | 79 | 0.1% | View All 96 Rows |
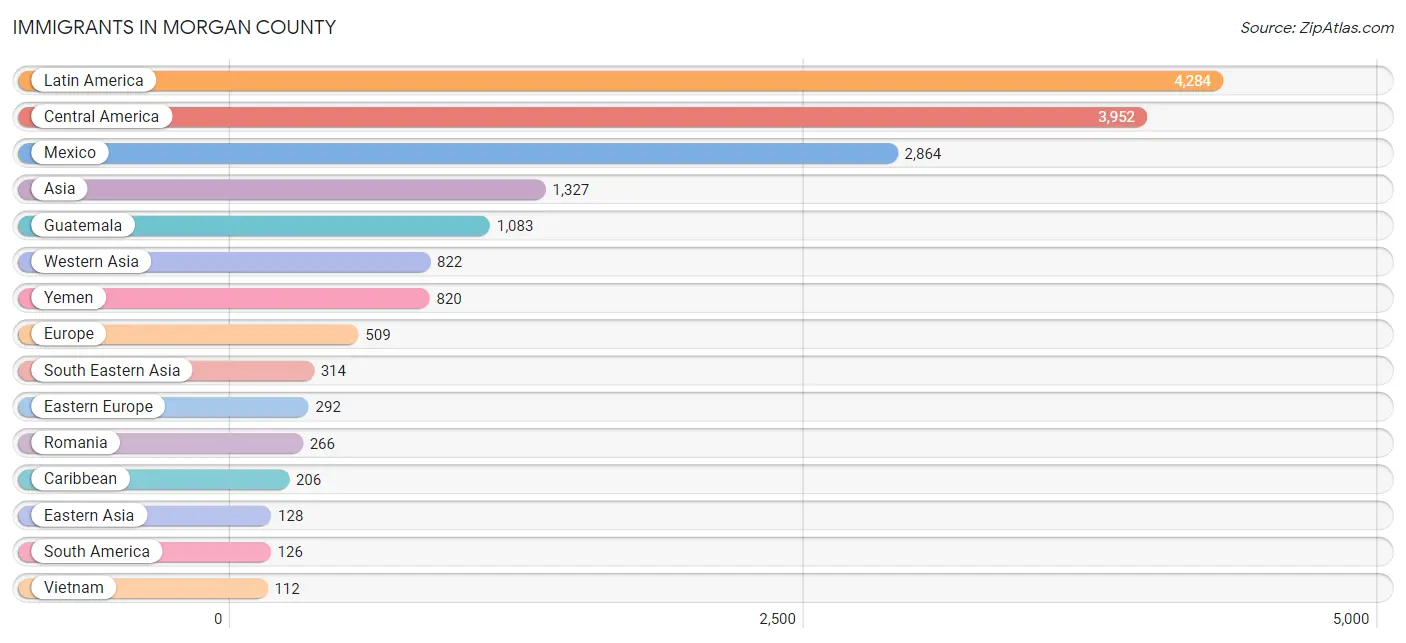
Immigrants in Morgan County
The most numerous immigrant groups reported in Morgan County came from Latin America (4,284 | 3.5%), Central America (3,952 | 3.2%), Mexico (2,864 | 2.3%), Asia (1,327 | 1.1%), and Guatemala (1,083 | 0.9%), together accounting for 11.0% of all Morgan County residents.
| Immigration Origin | # Population | % Population |
| Africa | 97 | 0.1% |
| Asia | 1,327 | 1.1% |
| Belgium | 18 | 0.0% |
| Cameroon | 10 | 0.0% |
| Canada | 71 | 0.1% |
| Caribbean | 206 | 0.2% |
| Central America | 3,952 | 3.2% |
| Chile | 10 | 0.0% |
| China | 51 | 0.0% |
| Colombia | 17 | 0.0% |
| Cuba | 89 | 0.1% |
| Dominican Republic | 22 | 0.0% |
| Eastern Africa | 30 | 0.0% |
| Eastern Asia | 128 | 0.1% |
| Eastern Europe | 292 | 0.2% |
| Ecuador | 50 | 0.0% |
| El Salvador | 5 | 0.0% |
| England | 71 | 0.1% |
| Europe | 509 | 0.4% |
| France | 20 | 0.0% |
| Germany | 45 | 0.0% |
| Guatemala | 1,083 | 0.9% |
| India | 41 | 0.0% |
| Indonesia | 35 | 0.0% |
| Iran | 22 | 0.0% |
| Italy | 6 | 0.0% |
| Korea | 77 | 0.1% |
| Latin America | 4,284 | 3.5% |
| Liberia | 16 | 0.0% |
| Mexico | 2,864 | 2.3% |
| Micronesia | 38 | 0.0% |
| Middle Africa | 10 | 0.0% |
| Nigeria | 31 | 0.0% |
| Northern Europe | 81 | 0.1% |
| Oceania | 38 | 0.0% |
| Philippines | 96 | 0.1% |
| Romania | 266 | 0.2% |
| South Africa | 10 | 0.0% |
| South America | 126 | 0.1% |
| South Central Asia | 63 | 0.1% |
| South Eastern Asia | 314 | 0.3% |
| Southern Europe | 53 | 0.0% |
| Spain | 47 | 0.0% |
| Taiwan | 6 | 0.0% |
| Thailand | 71 | 0.1% |
| Turkey | 2 | 0.0% |
| Uganda | 30 | 0.0% |
| Ukraine | 26 | 0.0% |
| Venezuela | 30 | 0.0% |
| Vietnam | 112 | 0.1% |
| Western Africa | 47 | 0.0% |
| Western Asia | 822 | 0.7% |
| Western Europe | 83 | 0.1% |
| Yemen | 820 | 0.7% | View All 54 Rows |
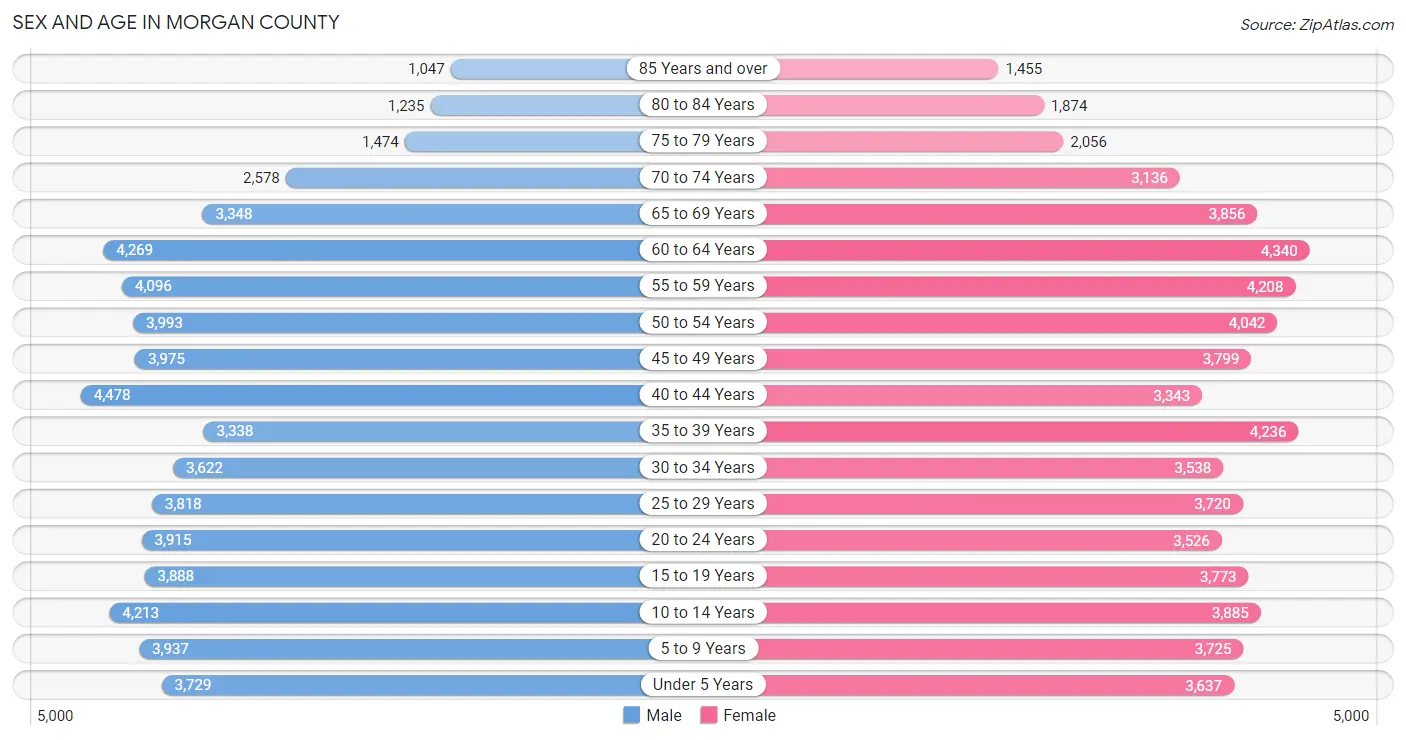
Sex and Age in Morgan County
Sex and Age in Morgan County
The most populous age groups in Morgan County are 40 to 44 Years (4,478 | 7.3%) for men and 60 to 64 Years (4,340 | 7.0%) for women.
| Age Bracket | Male | Female |
| Under 5 Years | 3,729 (6.1%) | 3,637 (5.9%) |
| 5 to 9 Years | 3,937 (6.5%) | 3,725 (6.0%) |
| 10 to 14 Years | 4,213 (6.9%) | 3,885 (6.2%) |
| 15 to 19 Years | 3,888 (6.4%) | 3,773 (6.1%) |
| 20 to 24 Years | 3,915 (6.4%) | 3,526 (5.7%) |
| 25 to 29 Years | 3,818 (6.3%) | 3,720 (6.0%) |
| 30 to 34 Years | 3,622 (5.9%) | 3,538 (5.7%) |
| 35 to 39 Years | 3,338 (5.5%) | 4,236 (6.8%) |
| 40 to 44 Years | 4,478 (7.3%) | 3,343 (5.4%) |
| 45 to 49 Years | 3,975 (6.5%) | 3,799 (6.1%) |
| 50 to 54 Years | 3,993 (6.6%) | 4,042 (6.5%) |
| 55 to 59 Years | 4,096 (6.7%) | 4,208 (6.8%) |
| 60 to 64 Years | 4,269 (7.0%) | 4,340 (7.0%) |
| 65 to 69 Years | 3,348 (5.5%) | 3,856 (6.2%) |
| 70 to 74 Years | 2,578 (4.2%) | 3,136 (5.1%) |
| 75 to 79 Years | 1,474 (2.4%) | 2,056 (3.3%) |
| 80 to 84 Years | 1,235 (2.0%) | 1,874 (3.0%) |
| 85 Years and over | 1,047 (1.7%) | 1,455 (2.3%) |
| Total | 60,953 (100.0%) | 62,149 (100.0%) |
Families and Households in Morgan County
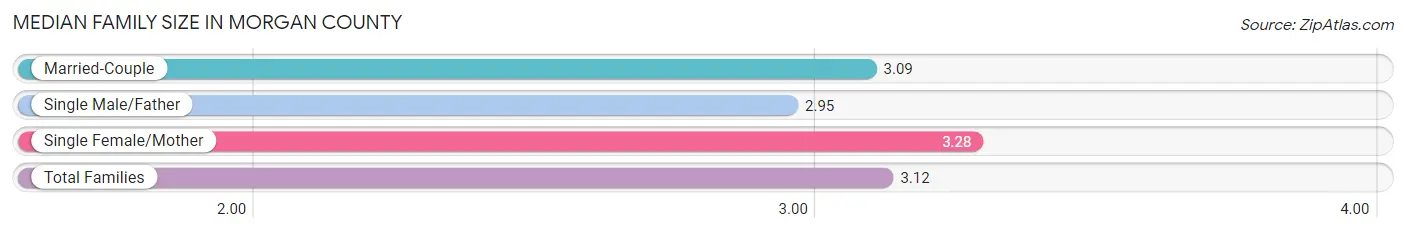
Median Family Size in Morgan County
The median family size in Morgan County is 3.12 persons per family, with single female/mother families (5,916 | 18.6%) accounting for the largest median family size of 3.28 persons per family. On the other hand, single male/father families (2,033 | 6.4%) represent the smallest median family size with 2.95 persons per family.
| Family Type | # Families | Family Size |
| Married-Couple | 23,915 (75.0%) | 3.09 |
| Single Male/Father | 2,033 (6.4%) | 2.95 |
| Single Female/Mother | 5,916 (18.6%) | 3.28 |
| Total Families | 31,864 (100.0%) | 3.12 |
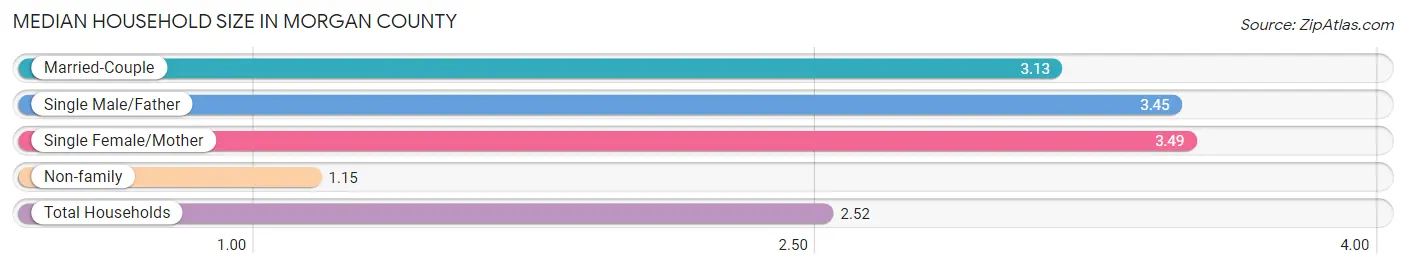
Median Household Size in Morgan County
The median household size in Morgan County is 2.52 persons per household, with single female/mother households (5,916 | 12.3%) accounting for the largest median household size of 3.49 persons per household. non-family households (16,140 | 33.6%) represent the smallest median household size with 1.15 persons per household.
| Household Type | # Households | Household Size |
| Married-Couple | 23,915 (49.8%) | 3.13 |
| Single Male/Father | 2,033 (4.2%) | 3.45 |
| Single Female/Mother | 5,916 (12.3%) | 3.49 |
| Non-family | 16,140 (33.6%) | 1.15 |
| Total Households | 48,004 (100.0%) | 2.52 |
Household Size by Marriage Status in Morgan County
Out of a total of 48,004 households in Morgan County, 31,864 (66.4%) are family households, while 16,140 (33.6%) are nonfamily households. The most numerous type of family households are 2-person households, comprising 15,050, and the most common type of nonfamily households are 1-person households, comprising 14,177.
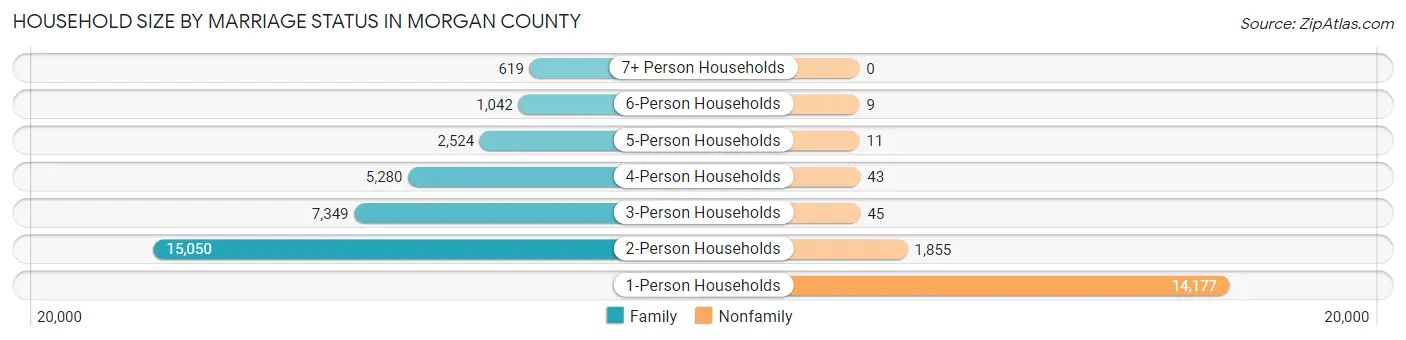
| Household Size | Family Households | Nonfamily Households |
| 1-Person Households | - | 14,177 (29.5%) |
| 2-Person Households | 15,050 (31.4%) | 1,855 (3.9%) |
| 3-Person Households | 7,349 (15.3%) | 45 (0.1%) |
| 4-Person Households | 5,280 (11.0%) | 43 (0.1%) |
| 5-Person Households | 2,524 (5.3%) | 11 (0.0%) |
| 6-Person Households | 1,042 (2.2%) | 9 (0.0%) |
| 7+ Person Households | 619 (1.3%) | 0 (0.0%) |
| Total | 31,864 (66.4%) | 16,140 (33.6%) |
Female Fertility in Morgan County
Fertility by Age in Morgan County
Average fertility rate in Morgan County is 50.0 births per 1,000 women. Women in the age bracket of 20 to 34 years have the highest fertility rate with 110.0 births per 1,000 women. Women in the age bracket of 20 to 34 years acount for 87.9% of all women with births.
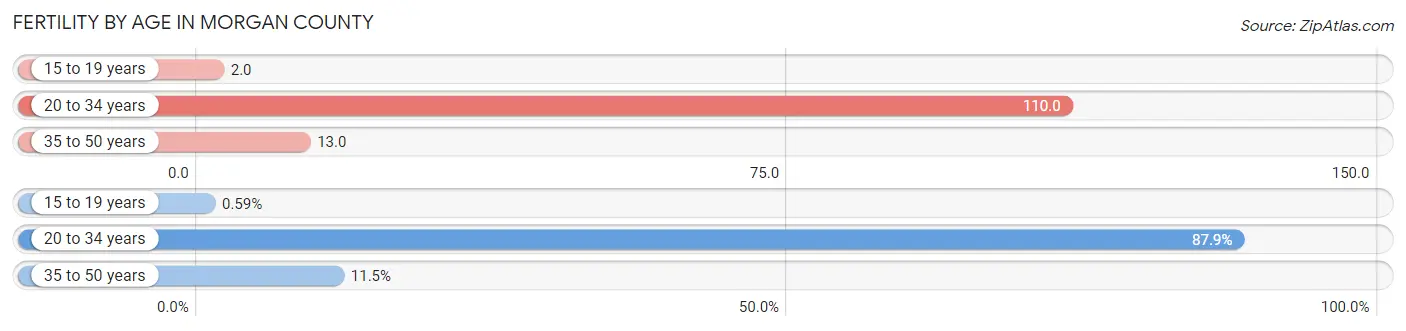
| Age Bracket | Women with Births | Births / 1,000 Women |
| 15 to 19 years | 8 (0.6%) | 2.0 |
| 20 to 34 years | 1,183 (87.9%) | 110.0 |
| 35 to 50 years | 155 (11.5%) | 13.0 |
| Total | 1,346 (100.0%) | 50.0 |
Fertility by Age by Marriage Status in Morgan County
68.6% of women with births (1,346) in Morgan County are married. The highest percentage of unmarried women with births falls into 20 to 34 years age bracket with 34.7% of them unmarried at the time of birth, while the lowest percentage of unmarried women with births belong to 15 to 19 years age bracket with 0.0% of them unmarried.
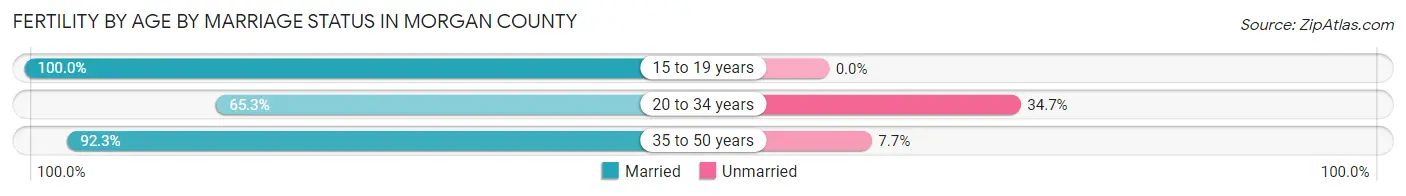
| Age Bracket | Married | Unmarried |
| 15 to 19 years | 8 (100.0%) | 0 (0.0%) |
| 20 to 34 years | 772 (65.3%) | 411 (34.7%) |
| 35 to 50 years | 143 (92.3%) | 12 (7.7%) |
| Total | 923 (68.6%) | 423 (31.4%) |
Fertility by Education in Morgan County
Average fertility rate in Morgan County is 50.0 births per 1,000 women. Women with the education attainment of high school diploma have the highest fertility rate of 69.0 births per 1,000 women, while women with the education attainment of graduate degree have the lowest fertility at 28.0 births per 1,000 women. Women with the education attainment of high school diploma represent 36.2% of all women with births.
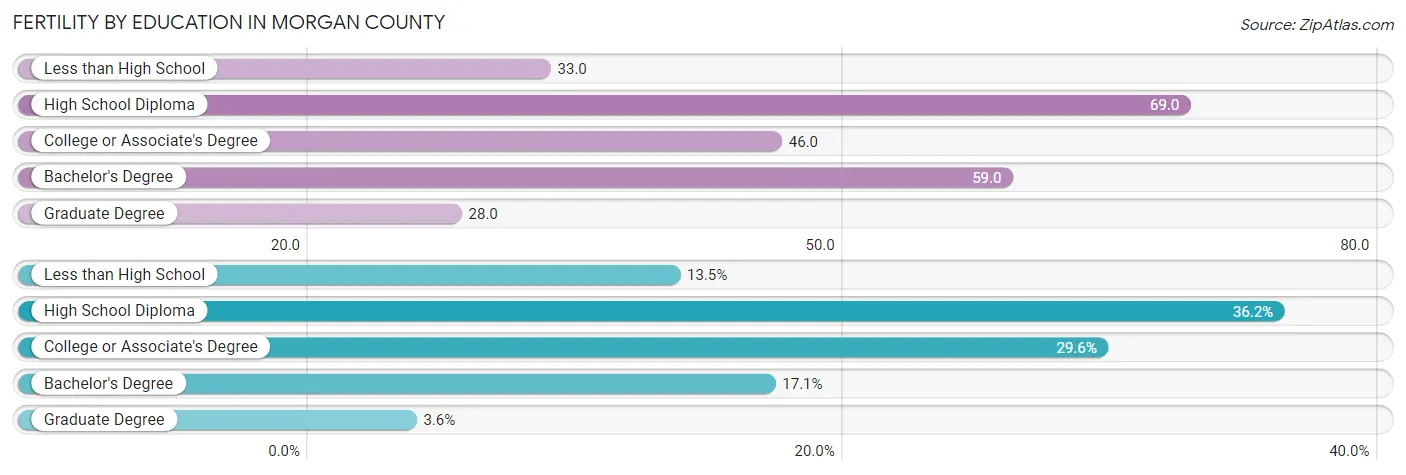
| Educational Attainment | Women with Births | Births / 1,000 Women |
| Less than High School | 182 (13.5%) | 33.0 |
| High School Diploma | 487 (36.2%) | 69.0 |
| College or Associate's Degree | 398 (29.6%) | 46.0 |
| Bachelor's Degree | 230 (17.1%) | 59.0 |
| Graduate Degree | 49 (3.6%) | 28.0 |
| Total | 1,346 (100.0%) | 50.0 |
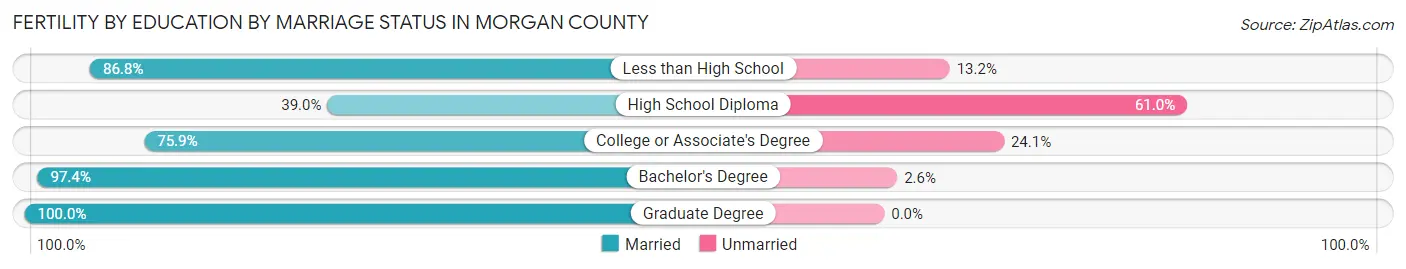
Fertility by Education by Marriage Status in Morgan County
31.4% of women with births in Morgan County are unmarried. Women with the educational attainment of graduate degree are most likely to be married with 100.0% of them married at childbirth, while women with the educational attainment of high school diploma are least likely to be married with 61.0% of them unmarried at childbirth.
| Educational Attainment | Married | Unmarried |
| Less than High School | 158 (86.8%) | 24 (13.2%) |
| High School Diploma | 190 (39.0%) | 297 (61.0%) |
| College or Associate's Degree | 302 (75.9%) | 96 (24.1%) |
| Bachelor's Degree | 224 (97.4%) | 6 (2.6%) |
| Graduate Degree | 49 (100.0%) | 0 (0.0%) |
| Total | 923 (68.6%) | 423 (31.4%) |
Employment Characteristics in Morgan County
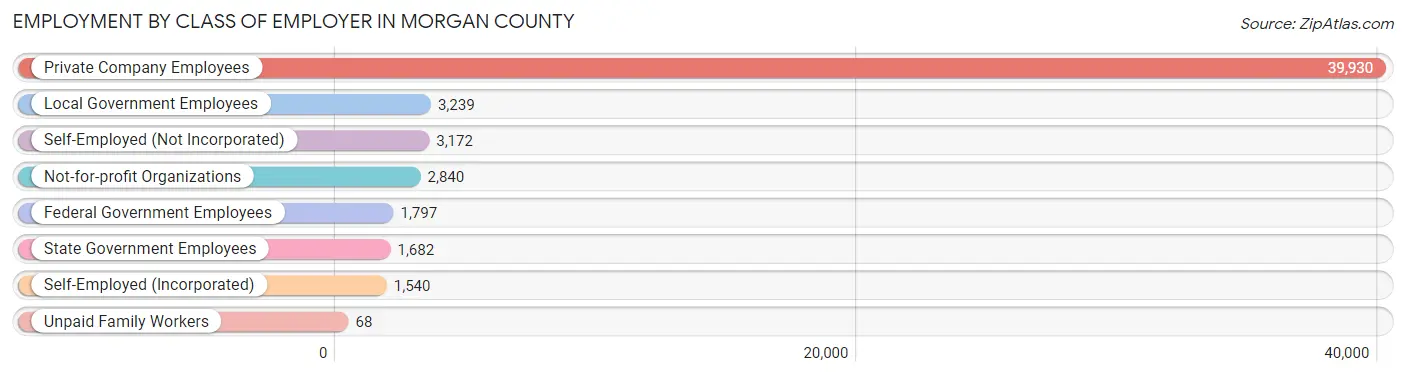
Employment by Class of Employer in Morgan County
Among the 54,268 employed individuals in Morgan County, private company employees (39,930 | 73.6%), local government employees (3,239 | 6.0%), and self-employed (not incorporated) (3,172 | 5.9%) make up the most common classes of employment.
| Employer Class | # Employees | % Employees |
| Private Company Employees | 39,930 | 73.6% |
| Self-Employed (Incorporated) | 1,540 | 2.8% |
| Self-Employed (Not Incorporated) | 3,172 | 5.9% |
| Not-for-profit Organizations | 2,840 | 5.2% |
| Local Government Employees | 3,239 | 6.0% |
| State Government Employees | 1,682 | 3.1% |
| Federal Government Employees | 1,797 | 3.3% |
| Unpaid Family Workers | 68 | 0.1% |
| Total | 54,268 | 100.0% |
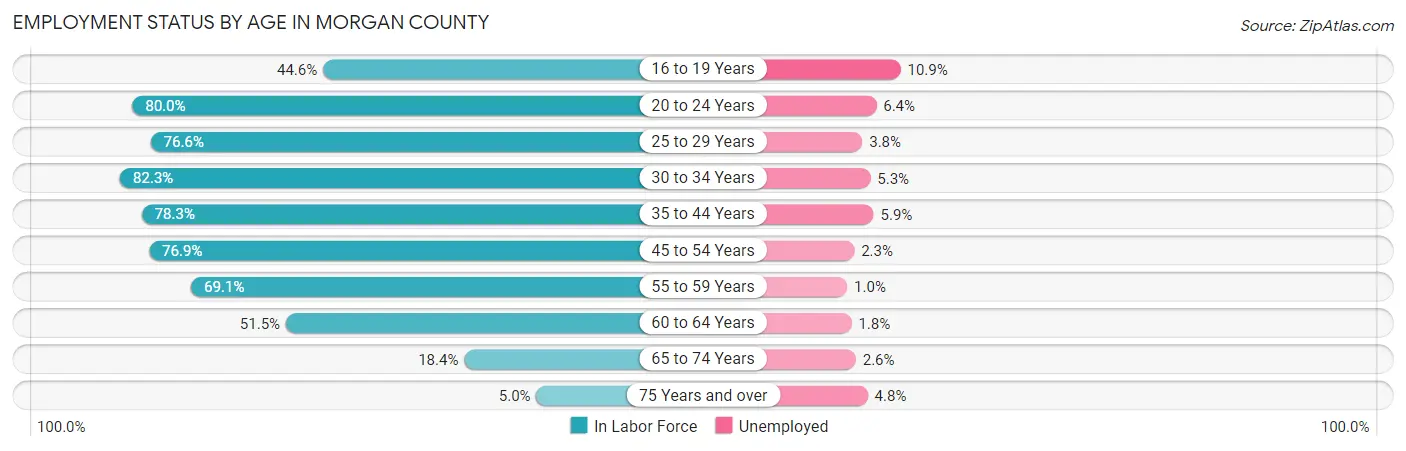
Employment Status by Age in Morgan County
According to the labor force statistics for Morgan County, out of the total population over 16 years of age (98,341), 58.5% or 57,529 individuals are in the labor force, with 4.2% or 2,416 of them unemployed. The age group with the highest labor force participation rate is 30 to 34 years, with 82.3% or 5,893 individuals in the labor force. Within the labor force, the 16 to 19 years age range has the highest percentage of unemployed individuals, with 10.9% or 293 of them being unemployed.
| Age Bracket | In Labor Force | Unemployed |
| 16 to 19 Years | 2,688 (44.6%) | 293 (10.9%) |
| 20 to 24 Years | 5,953 (80.0%) | 381 (6.4%) |
| 25 to 29 Years | 5,774 (76.6%) | 219 (3.8%) |
| 30 to 34 Years | 5,893 (82.3%) | 312 (5.3%) |
| 35 to 44 Years | 12,054 (78.3%) | 711 (5.9%) |
| 45 to 54 Years | 12,157 (76.9%) | 280 (2.3%) |
| 55 to 59 Years | 5,738 (69.1%) | 57 (1.0%) |
| 60 to 64 Years | 4,434 (51.5%) | 80 (1.8%) |
| 65 to 74 Years | 2,377 (18.4%) | 62 (2.6%) |
| 75 Years and over | 457 (5.0%) | 22 (4.8%) |
| Total | 57,529 (58.5%) | 2,416 (4.2%) |
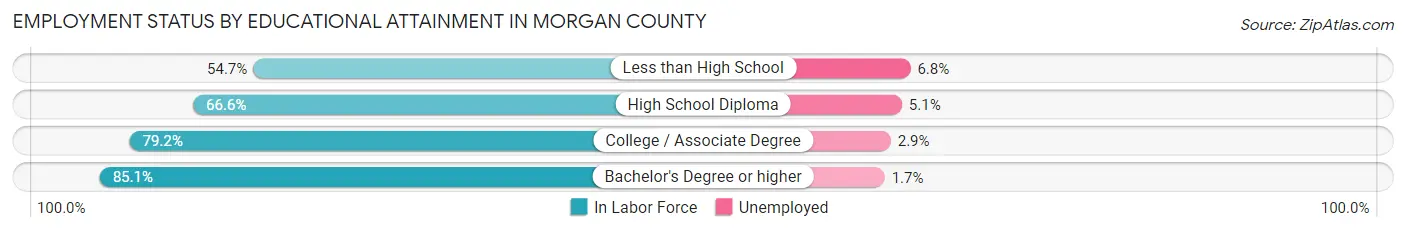
Employment Status by Educational Attainment in Morgan County
According to labor force statistics for Morgan County, 73.3% of individuals (46,043) out of the total population between 25 and 64 years of age (62,815) are in the labor force, with 3.6% or 1,658 of them being unemployed. The group with the highest labor force participation rate are those with the educational attainment of bachelor's degree or higher, with 85.1% or 12,957 individuals in the labor force. Within the labor force, individuals with less than high school education have the highest percentage of unemployment, with 6.8% or 343 of them being unemployed.
| Educational Attainment | In Labor Force | Unemployed |
| Less than High School | 5,048 (54.7%) | 628 (6.8%) |
| High School Diploma | 12,353 (66.6%) | 946 (5.1%) |
| College / Associate Degree | 15,692 (79.2%) | 575 (2.9%) |
| Bachelor's Degree or higher | 12,957 (85.1%) | 259 (1.7%) |
| Total | 46,043 (73.3%) | 2,261 (3.6%) |
Employment Occupations by Sex in Morgan County
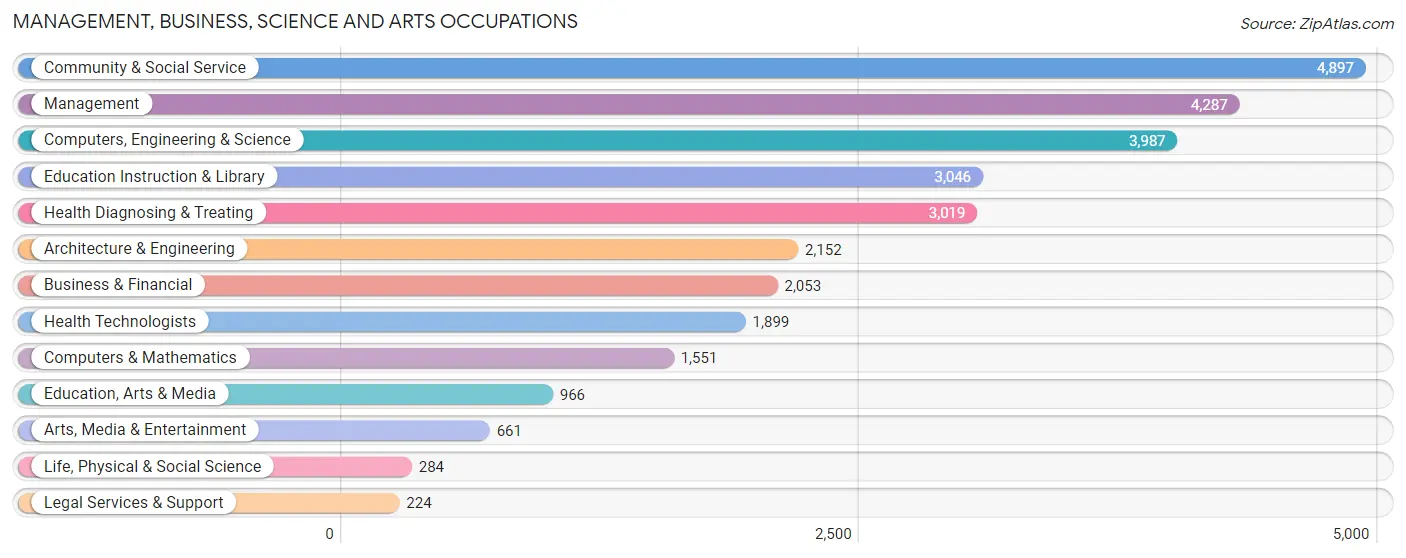
Management, Business, Science and Arts Occupations
The most common Management, Business, Science and Arts occupations in Morgan County are Community & Social Service (4,897 | 8.9%), Management (4,287 | 7.8%), Computers, Engineering & Science (3,987 | 7.2%), Education Instruction & Library (3,046 | 5.5%), and Health Diagnosing & Treating (3,019 | 5.5%).
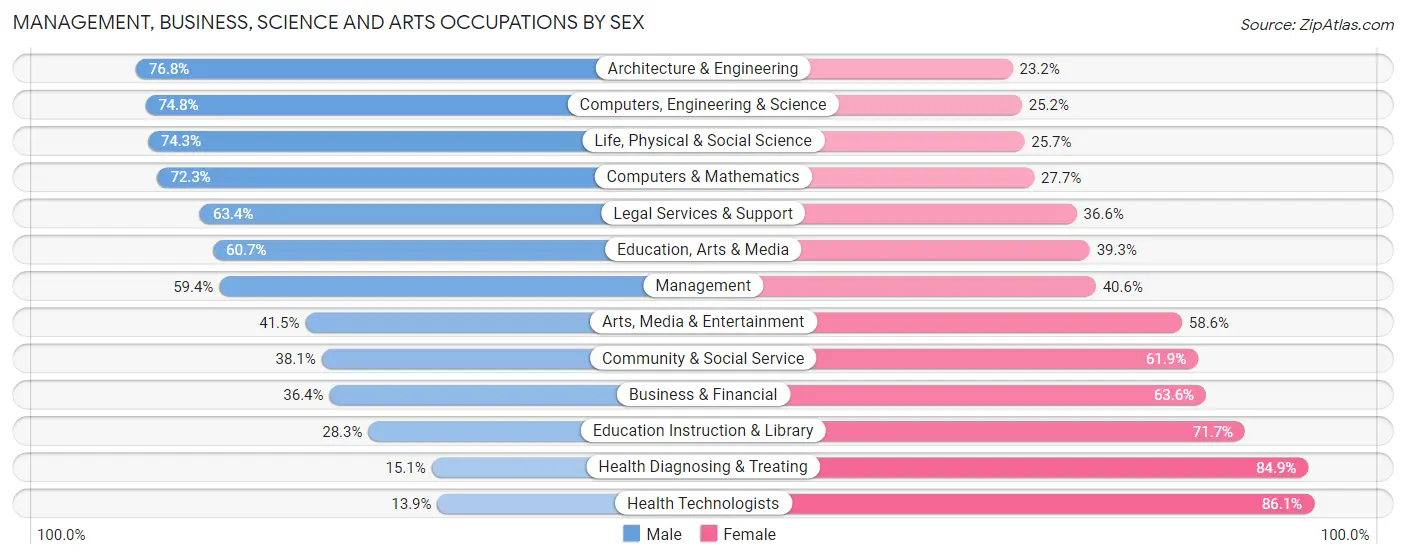
Management, Business, Science and Arts Occupations by Sex
Within the Management, Business, Science and Arts occupations in Morgan County, the most male-oriented occupations are Architecture & Engineering (76.8%), Computers, Engineering & Science (74.8%), and Life, Physical & Social Science (74.3%), while the most female-oriented occupations are Health Technologists (86.1%), Health Diagnosing & Treating (84.9%), and Education Instruction & Library (71.7%).
| Occupation | Male | Female |
| Management | 2,547 (59.4%) | 1,740 (40.6%) |
| Business & Financial | 748 (36.4%) | 1,305 (63.6%) |
| Computers, Engineering & Science | 2,984 (74.8%) | 1,003 (25.2%) |
| Computers & Mathematics | 1,121 (72.3%) | 430 (27.7%) |
| Architecture & Engineering | 1,652 (76.8%) | 500 (23.2%) |
| Life, Physical & Social Science | 211 (74.3%) | 73 (25.7%) |
| Community & Social Service | 1,864 (38.1%) | 3,033 (61.9%) |
| Education, Arts & Media | 586 (60.7%) | 380 (39.3%) |
| Legal Services & Support | 142 (63.4%) | 82 (36.6%) |
| Education Instruction & Library | 862 (28.3%) | 2,184 (71.7%) |
| Arts, Media & Entertainment | 274 (41.4%) | 387 (58.6%) |
| Health Diagnosing & Treating | 456 (15.1%) | 2,563 (84.9%) |
| Health Technologists | 264 (13.9%) | 1,635 (86.1%) |
| Total (Category) | 8,599 (47.1%) | 9,644 (52.9%) |
| Total (Overall) | 30,562 (55.5%) | 24,530 (44.5%) |
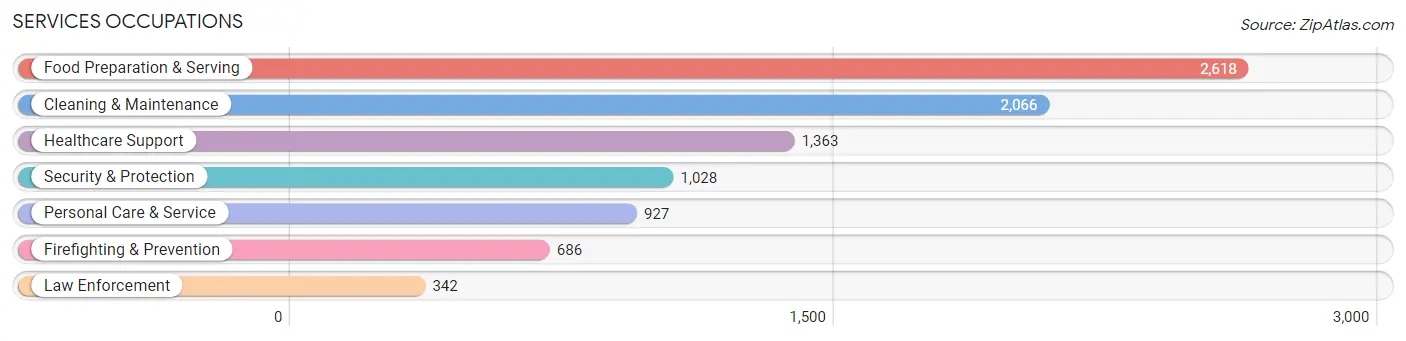
Services Occupations
The most common Services occupations in Morgan County are Food Preparation & Serving (2,618 | 4.8%), Cleaning & Maintenance (2,066 | 3.7%), Healthcare Support (1,363 | 2.5%), Security & Protection (1,028 | 1.9%), and Personal Care & Service (927 | 1.7%).
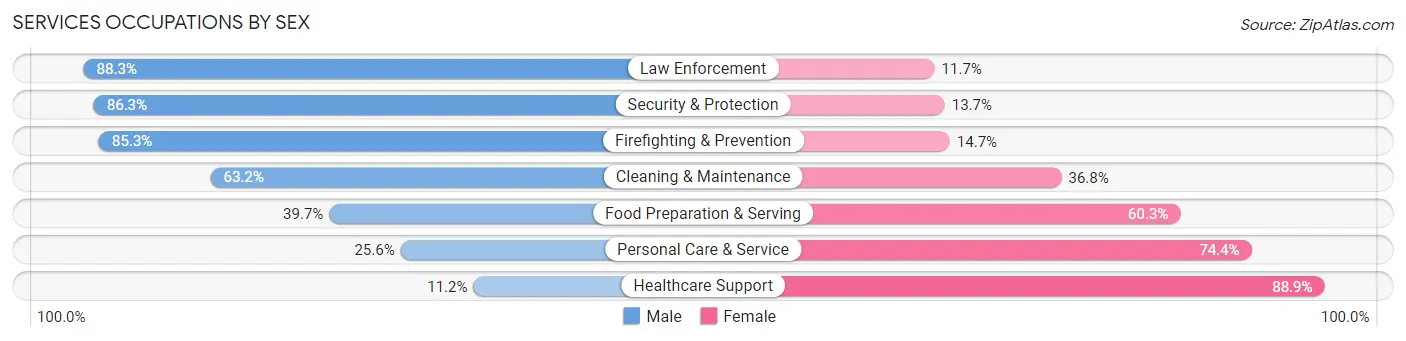
Services Occupations by Sex
Within the Services occupations in Morgan County, the most male-oriented occupations are Law Enforcement (88.3%), Security & Protection (86.3%), and Firefighting & Prevention (85.3%), while the most female-oriented occupations are Healthcare Support (88.8%), Personal Care & Service (74.4%), and Food Preparation & Serving (60.3%).
| Occupation | Male | Female |
| Healthcare Support | 152 (11.2%) | 1,211 (88.8%) |
| Security & Protection | 887 (86.3%) | 141 (13.7%) |
| Firefighting & Prevention | 585 (85.3%) | 101 (14.7%) |
| Law Enforcement | 302 (88.3%) | 40 (11.7%) |
| Food Preparation & Serving | 1,039 (39.7%) | 1,579 (60.3%) |
| Cleaning & Maintenance | 1,305 (63.2%) | 761 (36.8%) |
| Personal Care & Service | 237 (25.6%) | 690 (74.4%) |
| Total (Category) | 3,620 (45.2%) | 4,382 (54.8%) |
| Total (Overall) | 30,562 (55.5%) | 24,530 (44.5%) |
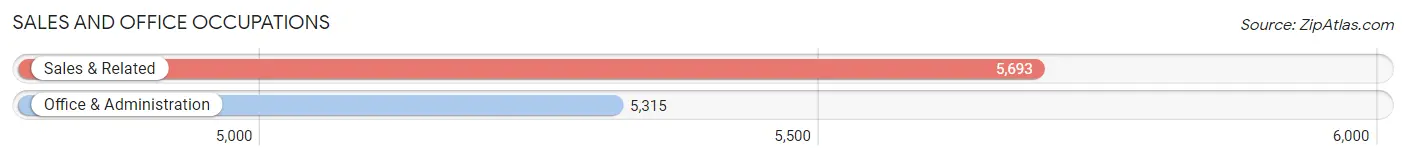
Sales and Office Occupations
The most common Sales and Office occupations in Morgan County are Sales & Related (5,693 | 10.3%), and Office & Administration (5,315 | 9.7%).
Sales and Office Occupations by Sex
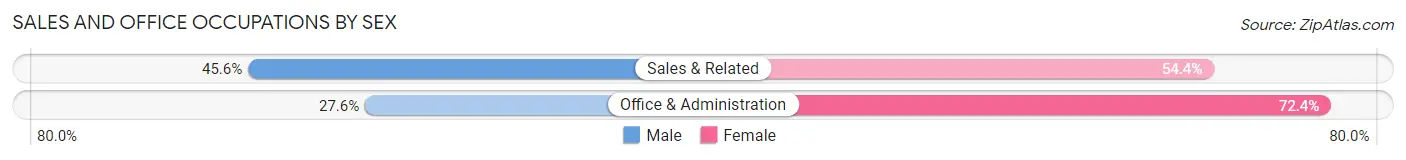
| Occupation | Male | Female |
| Sales & Related | 2,597 (45.6%) | 3,096 (54.4%) |
| Office & Administration | 1,468 (27.6%) | 3,847 (72.4%) |
| Total (Category) | 4,065 (36.9%) | 6,943 (63.1%) |
| Total (Overall) | 30,562 (55.5%) | 24,530 (44.5%) |
Natural Resources, Construction and Maintenance Occupations
The most common Natural Resources, Construction and Maintenance occupations in Morgan County are Construction & Extraction (4,127 | 7.5%), Installation, Maintenance & Repair (1,968 | 3.6%), and Farming, Fishing & Forestry (248 | 0.4%).

Natural Resources, Construction and Maintenance Occupations by Sex
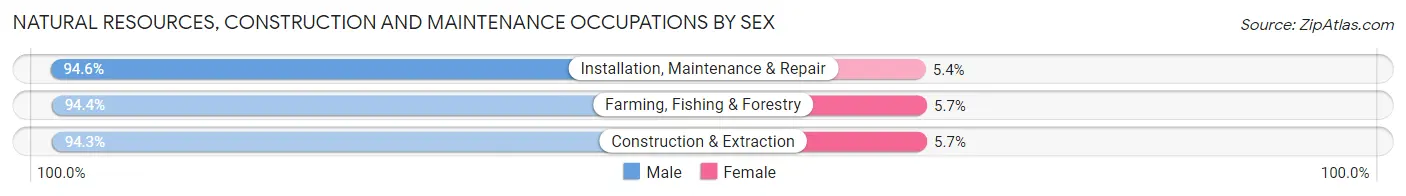
| Occupation | Male | Female |
| Farming, Fishing & Forestry | 234 (94.4%) | 14 (5.7%) |
| Construction & Extraction | 3,893 (94.3%) | 234 (5.7%) |
| Installation, Maintenance & Repair | 1,862 (94.6%) | 106 (5.4%) |
| Total (Category) | 5,989 (94.4%) | 354 (5.6%) |
| Total (Overall) | 30,562 (55.5%) | 24,530 (44.5%) |
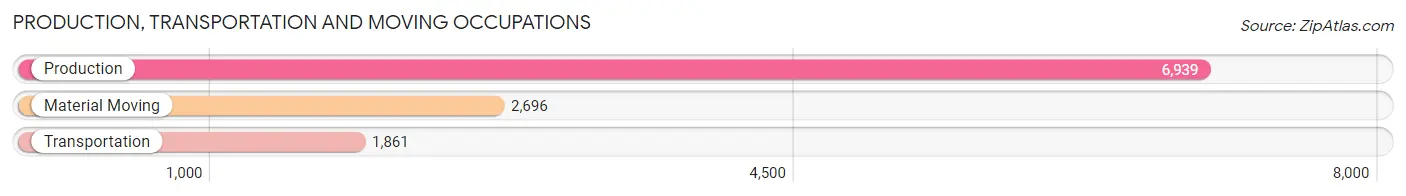
Production, Transportation and Moving Occupations
The most common Production, Transportation and Moving occupations in Morgan County are Production (6,939 | 12.6%), Material Moving (2,696 | 4.9%), and Transportation (1,861 | 3.4%).
Production, Transportation and Moving Occupations by Sex
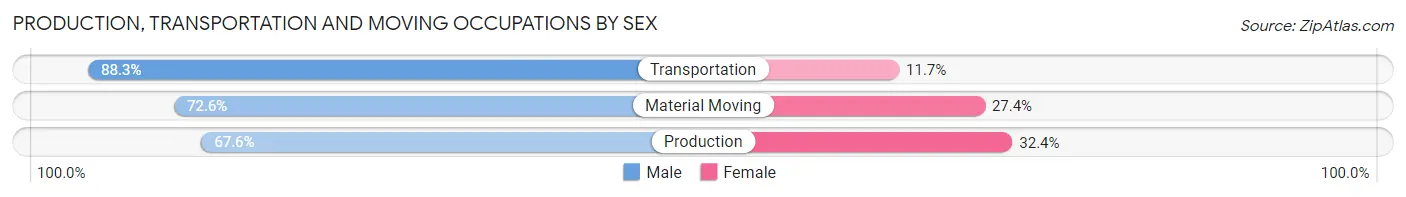
| Occupation | Male | Female |
| Production | 4,688 (67.6%) | 2,251 (32.4%) |
| Transportation | 1,644 (88.3%) | 217 (11.7%) |
| Material Moving | 1,957 (72.6%) | 739 (27.4%) |
| Total (Category) | 8,289 (72.1%) | 3,207 (27.9%) |
| Total (Overall) | 30,562 (55.5%) | 24,530 (44.5%) |
Employment Industries by Sex in Morgan County
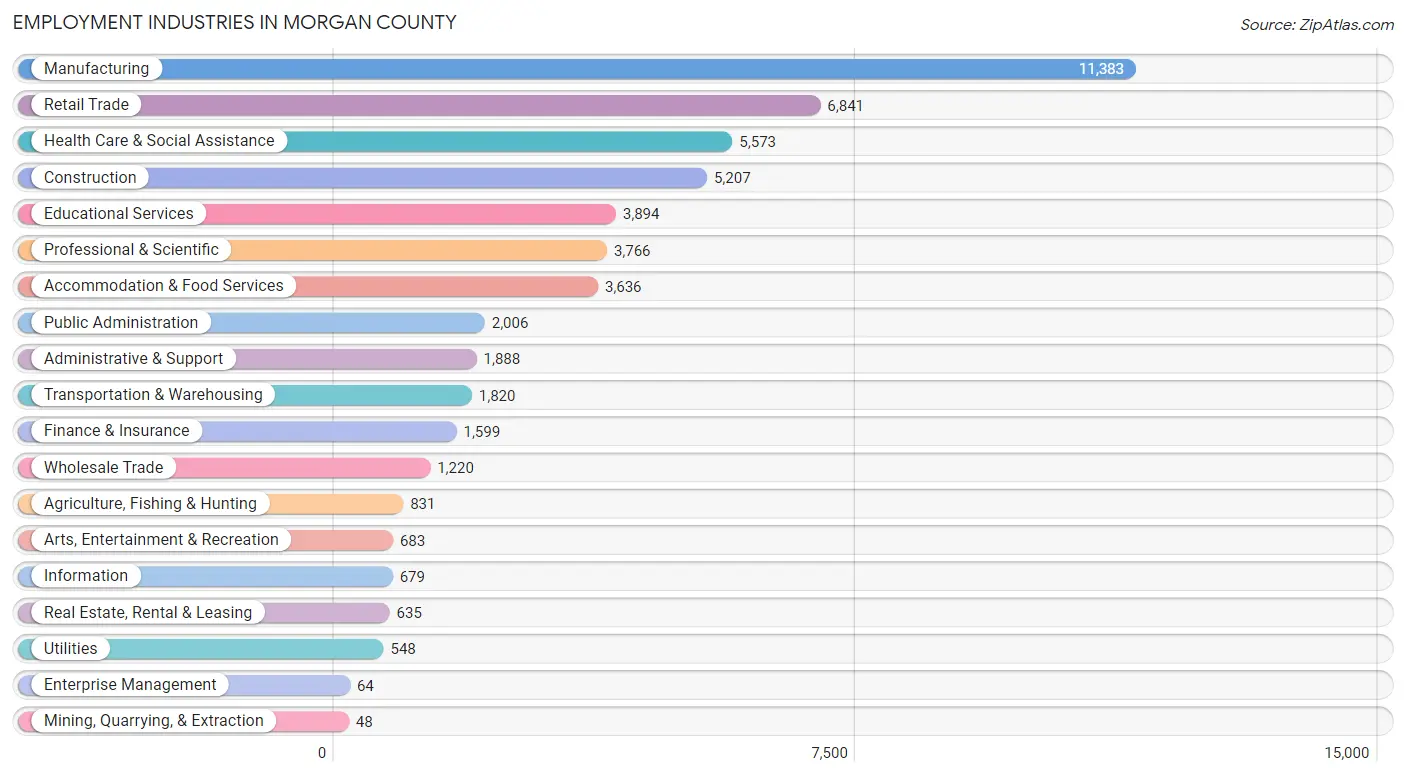
Employment Industries in Morgan County
The major employment industries in Morgan County include Manufacturing (11,383 | 20.7%), Retail Trade (6,841 | 12.4%), Health Care & Social Assistance (5,573 | 10.1%), Construction (5,207 | 9.5%), and Educational Services (3,894 | 7.1%).
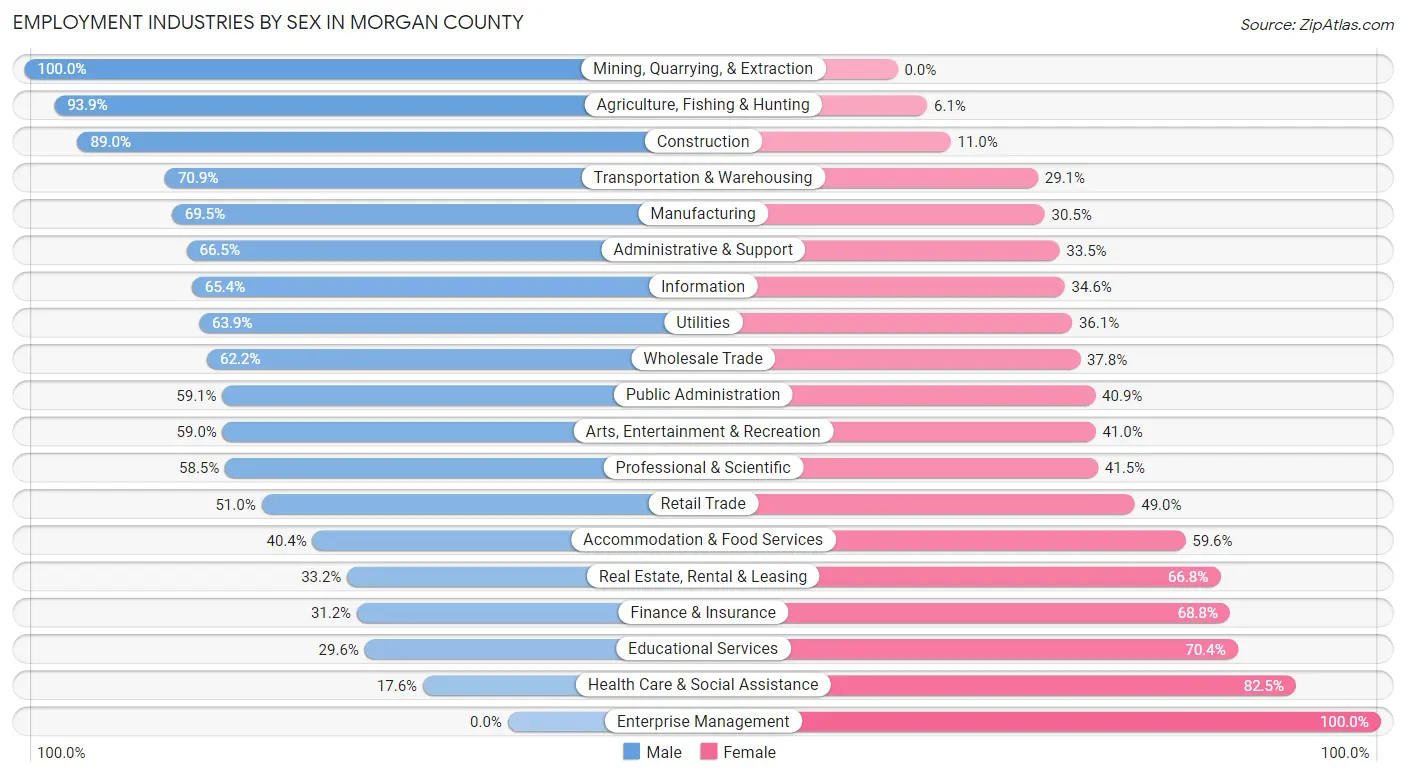
Employment Industries by Sex in Morgan County
The Morgan County industries that see more men than women are Mining, Quarrying, & Extraction (100.0%), Agriculture, Fishing & Hunting (93.9%), and Construction (89.0%), whereas the industries that tend to have a higher number of women are Enterprise Management (100.0%), Health Care & Social Assistance (82.5%), and Educational Services (70.4%).
| Industry | Male | Female |
| Agriculture, Fishing & Hunting | 780 (93.9%) | 51 (6.1%) |
| Mining, Quarrying, & Extraction | 48 (100.0%) | 0 (0.0%) |
| Construction | 4,635 (89.0%) | 572 (11.0%) |
| Manufacturing | 7,915 (69.5%) | 3,468 (30.5%) |
| Wholesale Trade | 759 (62.2%) | 461 (37.8%) |
| Retail Trade | 3,487 (51.0%) | 3,354 (49.0%) |
| Transportation & Warehousing | 1,291 (70.9%) | 529 (29.1%) |
| Utilities | 350 (63.9%) | 198 (36.1%) |
| Information | 444 (65.4%) | 235 (34.6%) |
| Finance & Insurance | 499 (31.2%) | 1,100 (68.8%) |
| Real Estate, Rental & Leasing | 211 (33.2%) | 424 (66.8%) |
| Professional & Scientific | 2,203 (58.5%) | 1,563 (41.5%) |
| Enterprise Management | 0 (0.0%) | 64 (100.0%) |
| Administrative & Support | 1,255 (66.5%) | 633 (33.5%) |
| Educational Services | 1,153 (29.6%) | 2,741 (70.4%) |
| Health Care & Social Assistance | 978 (17.5%) | 4,595 (82.5%) |
| Arts, Entertainment & Recreation | 403 (59.0%) | 280 (41.0%) |
| Accommodation & Food Services | 1,469 (40.4%) | 2,167 (59.6%) |
| Public Administration | 1,185 (59.1%) | 821 (40.9%) |
| Total | 30,562 (55.5%) | 24,530 (44.5%) |
Education in Morgan County
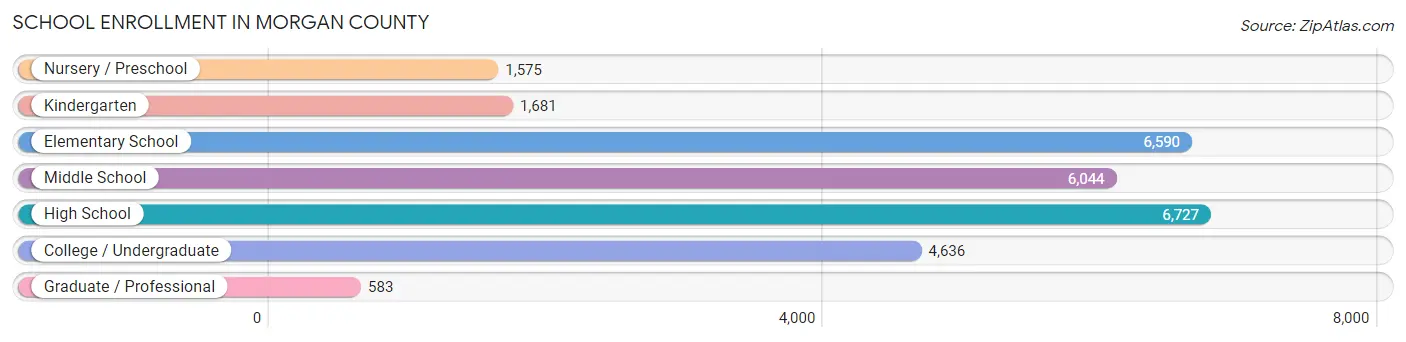
School Enrollment in Morgan County
The most common levels of schooling among the 27,836 students in Morgan County are high school (6,727 | 24.2%), elementary school (6,590 | 23.7%), and middle school (6,044 | 21.7%).
| School Level | # Students | % Students |
| Nursery / Preschool | 1,575 | 5.7% |
| Kindergarten | 1,681 | 6.0% |
| Elementary School | 6,590 | 23.7% |
| Middle School | 6,044 | 21.7% |
| High School | 6,727 | 24.2% |
| College / Undergraduate | 4,636 | 16.7% |
| Graduate / Professional | 583 | 2.1% |
| Total | 27,836 | 100.0% |
School Enrollment by Age by Funding Source in Morgan County
Out of a total of 27,836 students who are enrolled in schools in Morgan County, 3,145 (11.3%) attend a private institution, while the remaining 24,691 (88.7%) are enrolled in public schools. The age group of 3 to 4 year olds has the highest likelihood of being enrolled in private schools, with 476 (37.1% in the age bracket) enrolled. Conversely, the age group of 18 to 19 year olds has the lowest likelihood of being enrolled in a private school, with 1,543 (93.3% in the age bracket) attending a public institution.
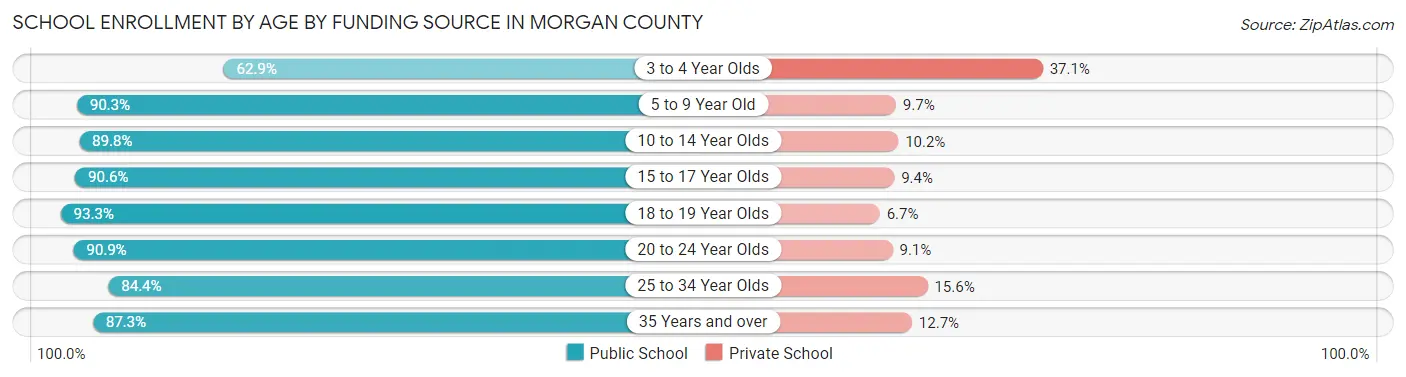
| Age Bracket | Public School | Private School |
| 3 to 4 Year Olds | 808 (62.9%) | 476 (37.1%) |
| 5 to 9 Year Old | 6,784 (90.3%) | 731 (9.7%) |
| 10 to 14 Year Olds | 7,021 (89.8%) | 794 (10.2%) |
| 15 to 17 Year Olds | 4,435 (90.6%) | 461 (9.4%) |
| 18 to 19 Year Olds | 1,543 (93.3%) | 111 (6.7%) |
| 20 to 24 Year Olds | 1,728 (90.9%) | 173 (9.1%) |
| 25 to 34 Year Olds | 1,276 (84.4%) | 236 (15.6%) |
| 35 Years and over | 1,099 (87.3%) | 160 (12.7%) |
| Total | 24,691 (88.7%) | 3,145 (11.3%) |
Educational Attainment by Field of Study in Morgan County
Business (5,036 | 23.5%), education (3,783 | 17.7%), engineering (2,592 | 12.1%), science & technology (2,107 | 9.8%), and arts & humanities (1,418 | 6.6%) are the most common fields of study among 21,422 individuals in Morgan County who have obtained a bachelor's degree or higher.
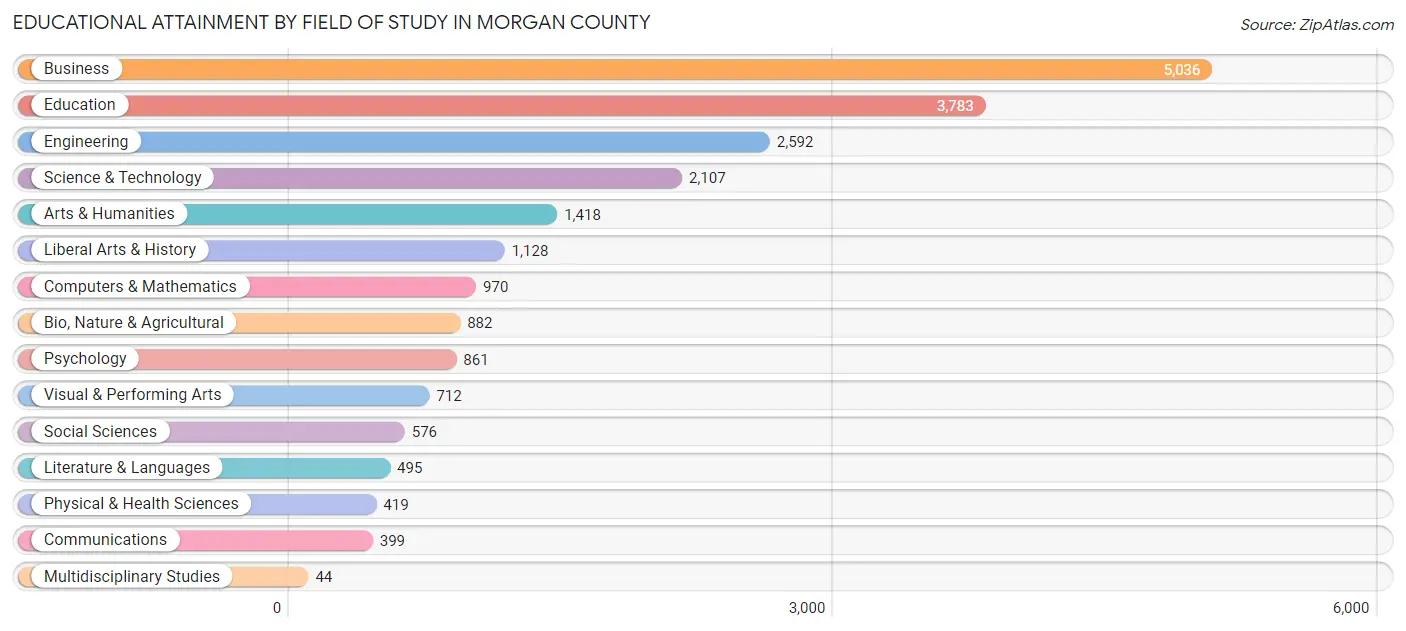
| Field of Study | # Graduates | % Graduates |
| Computers & Mathematics | 970 | 4.5% |
| Bio, Nature & Agricultural | 882 | 4.1% |
| Physical & Health Sciences | 419 | 2.0% |
| Psychology | 861 | 4.0% |
| Social Sciences | 576 | 2.7% |
| Engineering | 2,592 | 12.1% |
| Multidisciplinary Studies | 44 | 0.2% |
| Science & Technology | 2,107 | 9.8% |
| Business | 5,036 | 23.5% |
| Education | 3,783 | 17.7% |
| Literature & Languages | 495 | 2.3% |
| Liberal Arts & History | 1,128 | 5.3% |
| Visual & Performing Arts | 712 | 3.3% |
| Communications | 399 | 1.9% |
| Arts & Humanities | 1,418 | 6.6% |
| Total | 21,422 | 100.0% |
Transportation & Commute in Morgan County
Vehicle Availability by Sex in Morgan County
The most prevalent vehicle ownership categories in Morgan County are males with 2 vehicles (11,099, accounting for 37.0%) and females with 2 vehicles (9,372, making up 45.8%).
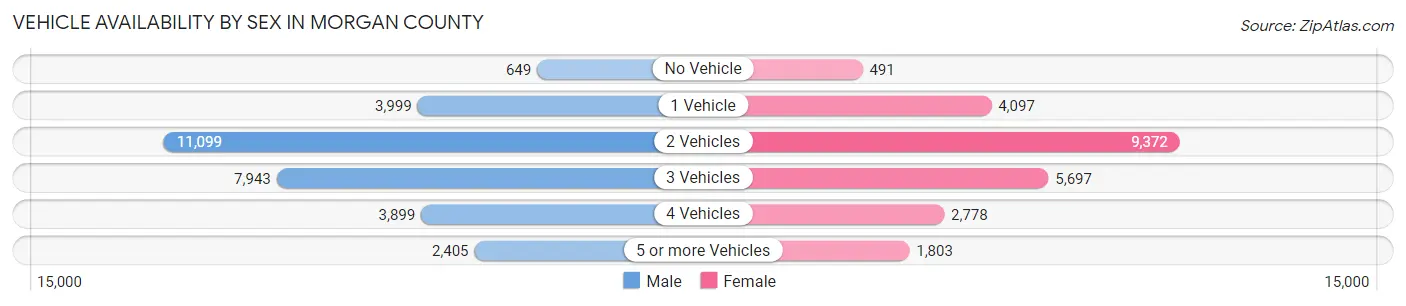
| Vehicles Available | Male | Female |
| No Vehicle | 649 (2.2%) | 491 (2.0%) |
| 1 Vehicle | 3,999 (13.3%) | 4,097 (16.9%) |
| 2 Vehicles | 11,099 (37.0%) | 9,372 (38.7%) |
| 3 Vehicles | 7,943 (26.5%) | 5,697 (23.5%) |
| 4 Vehicles | 3,899 (13.0%) | 2,778 (11.5%) |
| 5 or more Vehicles | 2,405 (8.0%) | 1,803 (7.4%) |
| Total | 29,994 (100.0%) | 24,238 (100.0%) |
Commute Time in Morgan County
The most frequently occuring commute durations in Morgan County are 10 to 14 minutes (7,730 commuters, 15.0%), 15 to 19 minutes (7,474 commuters, 14.5%), and 30 to 34 minutes (7,075 commuters, 13.7%).
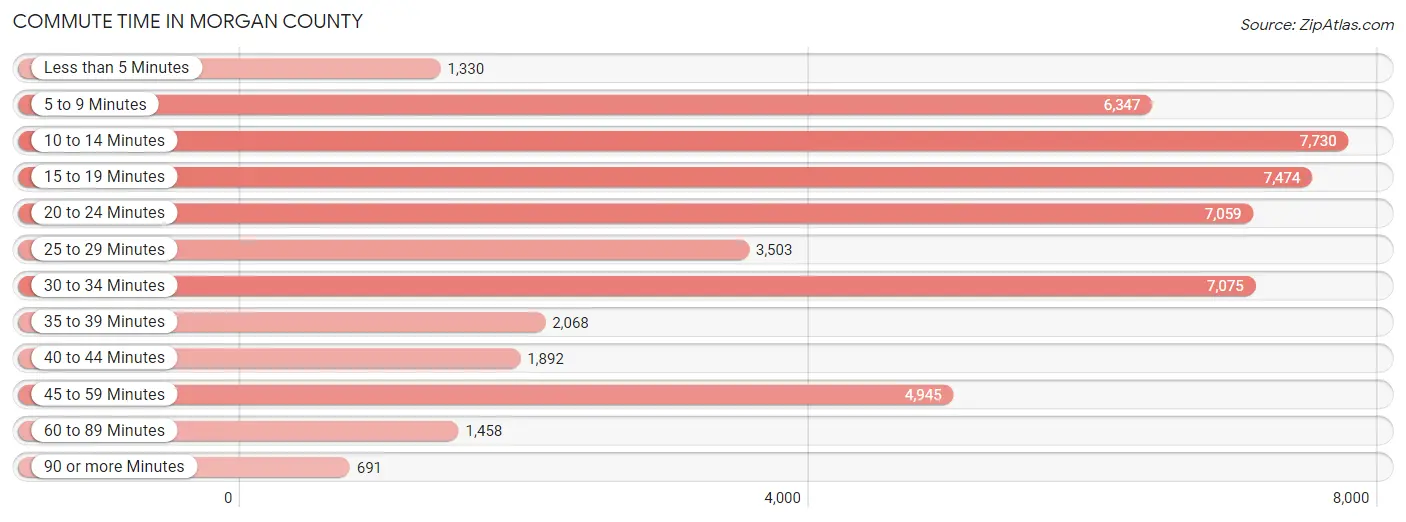
| Commute Time | # Commuters | % Commuters |
| Less than 5 Minutes | 1,330 | 2.6% |
| 5 to 9 Minutes | 6,347 | 12.3% |
| 10 to 14 Minutes | 7,730 | 15.0% |
| 15 to 19 Minutes | 7,474 | 14.5% |
| 20 to 24 Minutes | 7,059 | 13.7% |
| 25 to 29 Minutes | 3,503 | 6.8% |
| 30 to 34 Minutes | 7,075 | 13.7% |
| 35 to 39 Minutes | 2,068 | 4.0% |
| 40 to 44 Minutes | 1,892 | 3.7% |
| 45 to 59 Minutes | 4,945 | 9.6% |
| 60 to 89 Minutes | 1,458 | 2.8% |
| 90 or more Minutes | 691 | 1.3% |
Commute Time by Sex in Morgan County
The most common commute times in Morgan County are 30 to 34 minutes (4,315 commuters, 15.1%) for males and 10 to 14 minutes (3,790 commuters, 16.5%) for females.
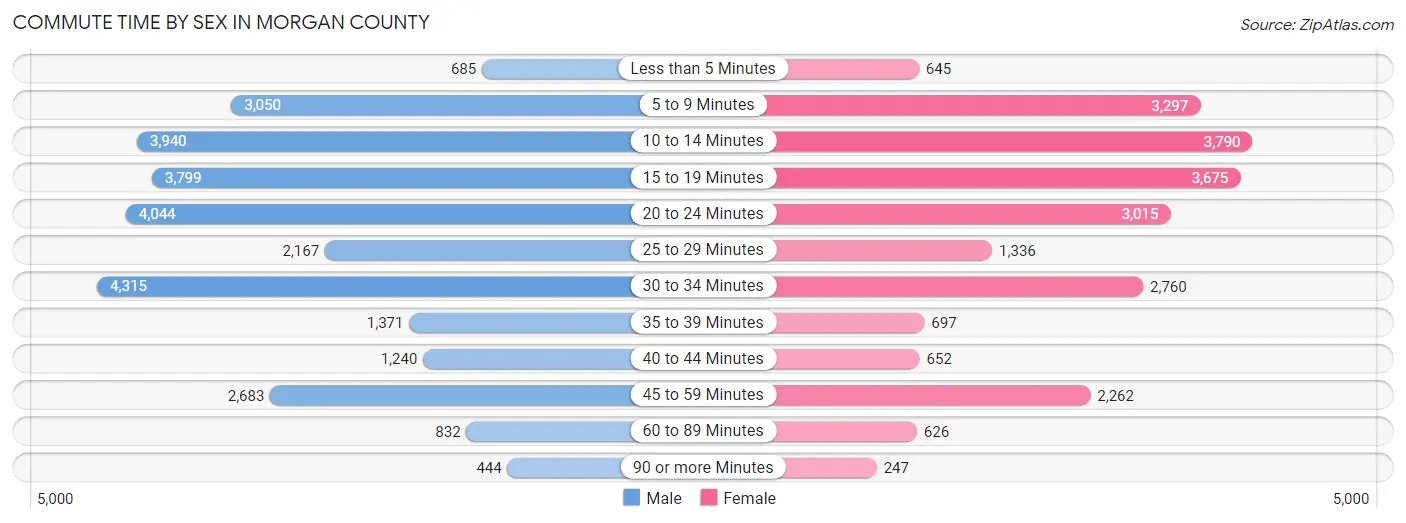
| Commute Time | Male | Female |
| Less than 5 Minutes | 685 (2.4%) | 645 (2.8%) |
| 5 to 9 Minutes | 3,050 (10.7%) | 3,297 (14.3%) |
| 10 to 14 Minutes | 3,940 (13.8%) | 3,790 (16.5%) |
| 15 to 19 Minutes | 3,799 (13.3%) | 3,675 (16.0%) |
| 20 to 24 Minutes | 4,044 (14.1%) | 3,015 (13.1%) |
| 25 to 29 Minutes | 2,167 (7.6%) | 1,336 (5.8%) |
| 30 to 34 Minutes | 4,315 (15.1%) | 2,760 (12.0%) |
| 35 to 39 Minutes | 1,371 (4.8%) | 697 (3.0%) |
| 40 to 44 Minutes | 1,240 (4.3%) | 652 (2.8%) |
| 45 to 59 Minutes | 2,683 (9.4%) | 2,262 (9.8%) |
| 60 to 89 Minutes | 832 (2.9%) | 626 (2.7%) |
| 90 or more Minutes | 444 (1.5%) | 247 (1.1%) |
Time of Departure to Work by Sex in Morgan County
The most frequent times of departure to work in Morgan County are 6:00 AM to 6:29 AM (4,174, 14.6%) for males and 7:00 AM to 7:29 AM (4,135, 18.0%) for females.
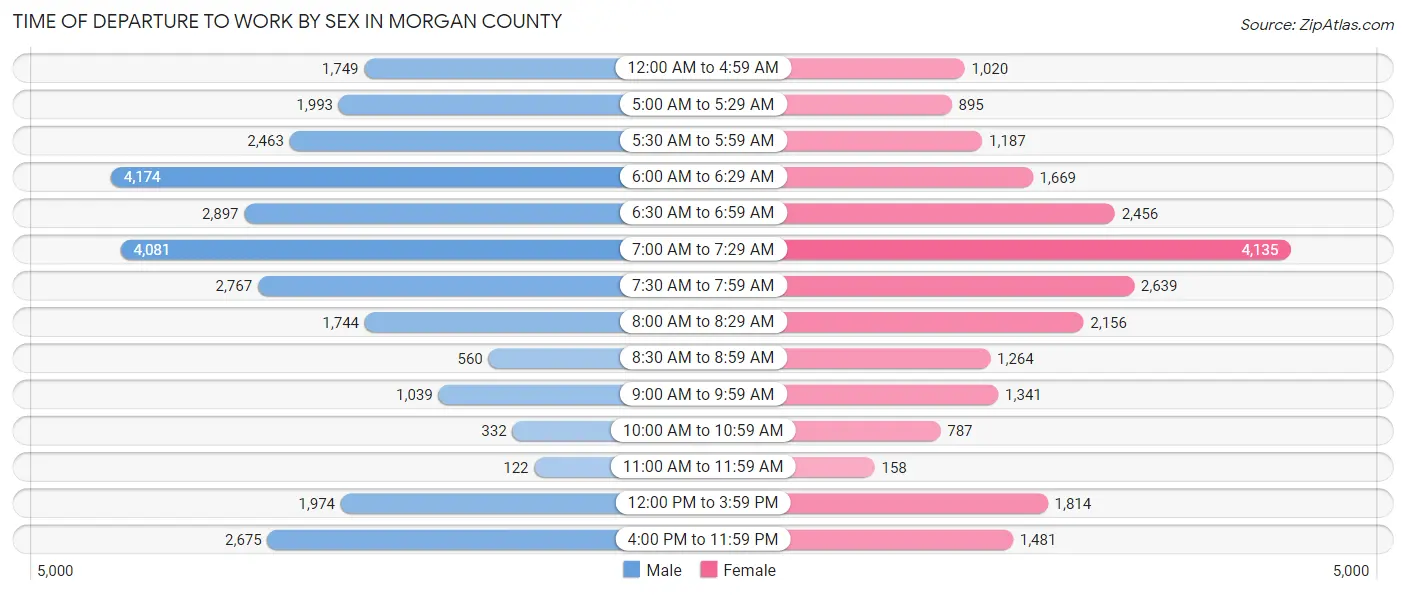
| Time of Departure | Male | Female |
| 12:00 AM to 4:59 AM | 1,749 (6.1%) | 1,020 (4.4%) |
| 5:00 AM to 5:29 AM | 1,993 (7.0%) | 895 (3.9%) |
| 5:30 AM to 5:59 AM | 2,463 (8.6%) | 1,187 (5.2%) |
| 6:00 AM to 6:29 AM | 4,174 (14.6%) | 1,669 (7.3%) |
| 6:30 AM to 6:59 AM | 2,897 (10.1%) | 2,456 (10.7%) |
| 7:00 AM to 7:29 AM | 4,081 (14.3%) | 4,135 (18.0%) |
| 7:30 AM to 7:59 AM | 2,767 (9.7%) | 2,639 (11.5%) |
| 8:00 AM to 8:29 AM | 1,744 (6.1%) | 2,156 (9.4%) |
| 8:30 AM to 8:59 AM | 560 (2.0%) | 1,264 (5.5%) |
| 9:00 AM to 9:59 AM | 1,039 (3.6%) | 1,341 (5.8%) |
| 10:00 AM to 10:59 AM | 332 (1.2%) | 787 (3.4%) |
| 11:00 AM to 11:59 AM | 122 (0.4%) | 158 (0.7%) |
| 12:00 PM to 3:59 PM | 1,974 (6.9%) | 1,814 (7.9%) |
| 4:00 PM to 11:59 PM | 2,675 (9.4%) | 1,481 (6.4%) |
| Total | 28,570 (100.0%) | 23,002 (100.0%) |
Housing Occupancy in Morgan County
Occupancy by Ownership in Morgan County
Of the total 48,004 dwellings in Morgan County, owner-occupied units account for 34,922 (72.8%), while renter-occupied units make up 13,082 (27.3%).
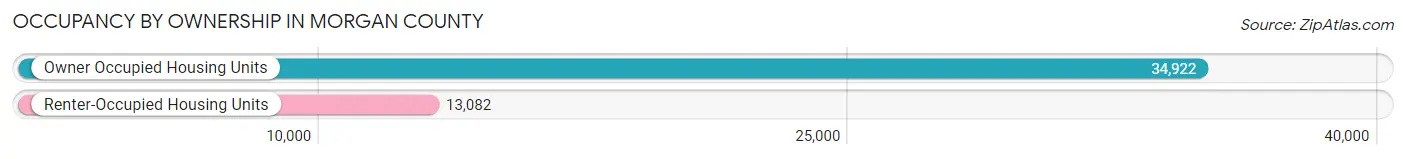
| Occupancy | # Housing Units | % Housing Units |
| Owner Occupied Housing Units | 34,922 | 72.8% |
| Renter-Occupied Housing Units | 13,082 | 27.3% |
| Total Occupied Housing Units | 48,004 | 100.0% |
Occupancy by Household Size in Morgan County
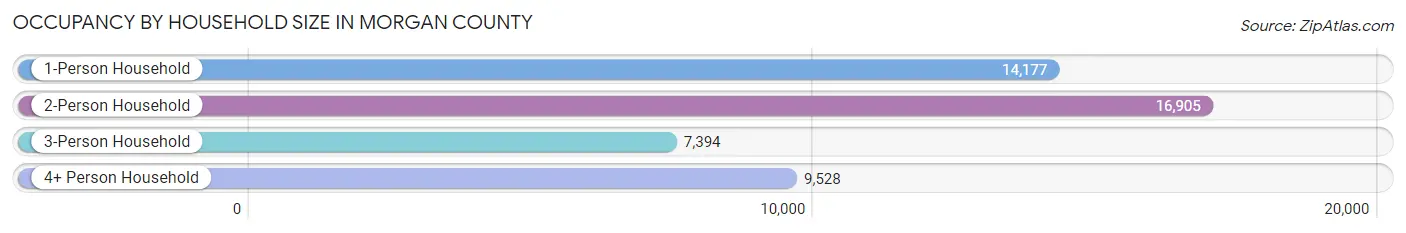
| Household Size | # Housing Units | % Housing Units |
| 1-Person Household | 14,177 | 29.5% |
| 2-Person Household | 16,905 | 35.2% |
| 3-Person Household | 7,394 | 15.4% |
| 4+ Person Household | 9,528 | 19.9% |
| Total Housing Units | 48,004 | 100.0% |
Occupancy by Ownership by Household Size in Morgan County
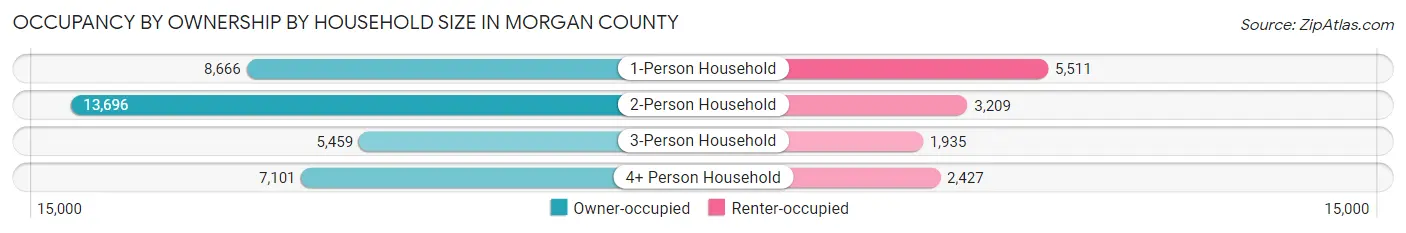
| Household Size | Owner-occupied | Renter-occupied |
| 1-Person Household | 8,666 (61.1%) | 5,511 (38.9%) |
| 2-Person Household | 13,696 (81.0%) | 3,209 (19.0%) |
| 3-Person Household | 5,459 (73.8%) | 1,935 (26.2%) |
| 4+ Person Household | 7,101 (74.5%) | 2,427 (25.5%) |
| Total Housing Units | 34,922 (72.8%) | 13,082 (27.3%) |
Occupancy by Educational Attainment in Morgan County
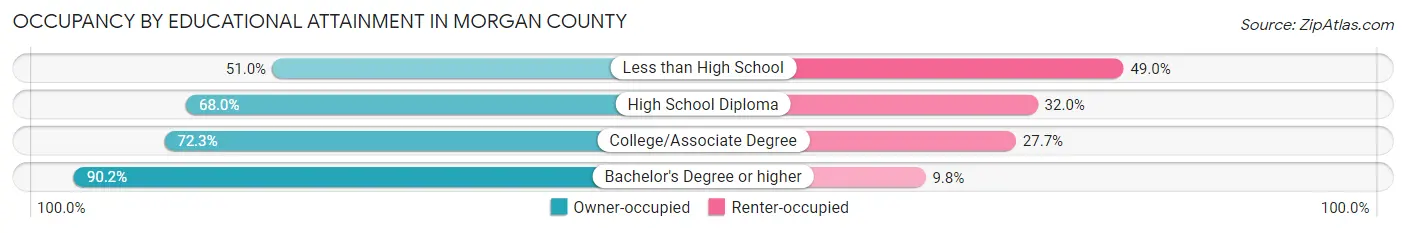
| Household Size | Owner-occupied | Renter-occupied |
| Less than High School | 3,339 (51.0%) | 3,212 (49.0%) |
| High School Diploma | 9,308 (68.0%) | 4,385 (32.0%) |
| College/Associate Degree | 11,171 (72.3%) | 4,283 (27.7%) |
| Bachelor's Degree or higher | 11,104 (90.2%) | 1,202 (9.8%) |
Occupancy by Age of Householder in Morgan County
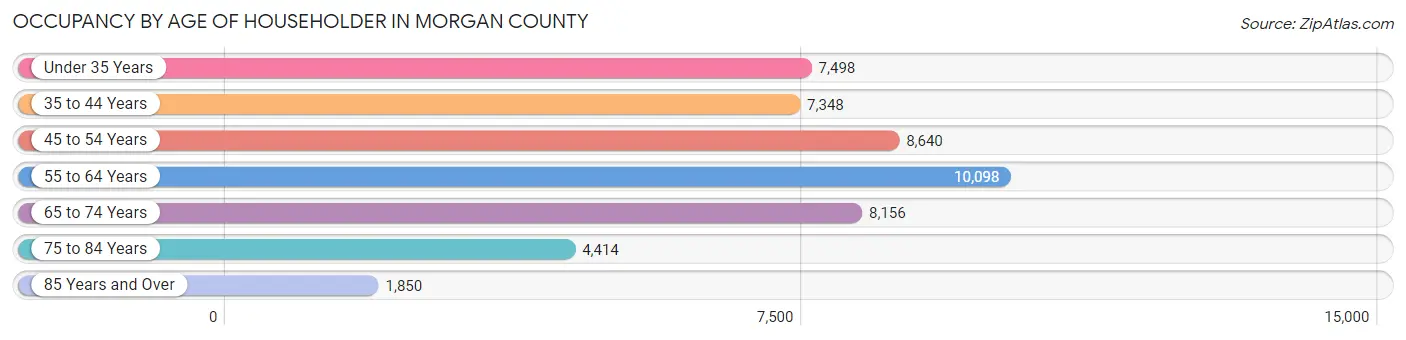
| Age Bracket | # Households | % Households |
| Under 35 Years | 7,498 | 15.6% |
| 35 to 44 Years | 7,348 | 15.3% |
| 45 to 54 Years | 8,640 | 18.0% |
| 55 to 64 Years | 10,098 | 21.0% |
| 65 to 74 Years | 8,156 | 17.0% |
| 75 to 84 Years | 4,414 | 9.2% |
| 85 Years and Over | 1,850 | 3.8% |
| Total | 48,004 | 100.0% |
Housing Finances in Morgan County
Median Income by Occupancy in Morgan County
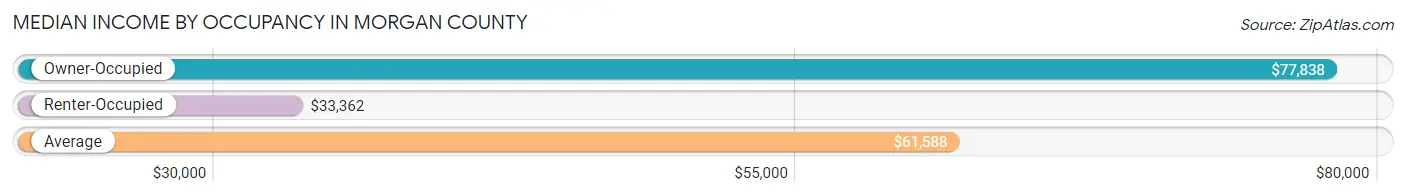
| Occupancy Type | # Households | Median Income |
| Owner-Occupied | 34,922 (72.8%) | $77,838 |
| Renter-Occupied | 13,082 (27.3%) | $33,362 |
| Average | 48,004 (100.0%) | $61,588 |
Occupancy by Householder Income Bracket in Morgan County
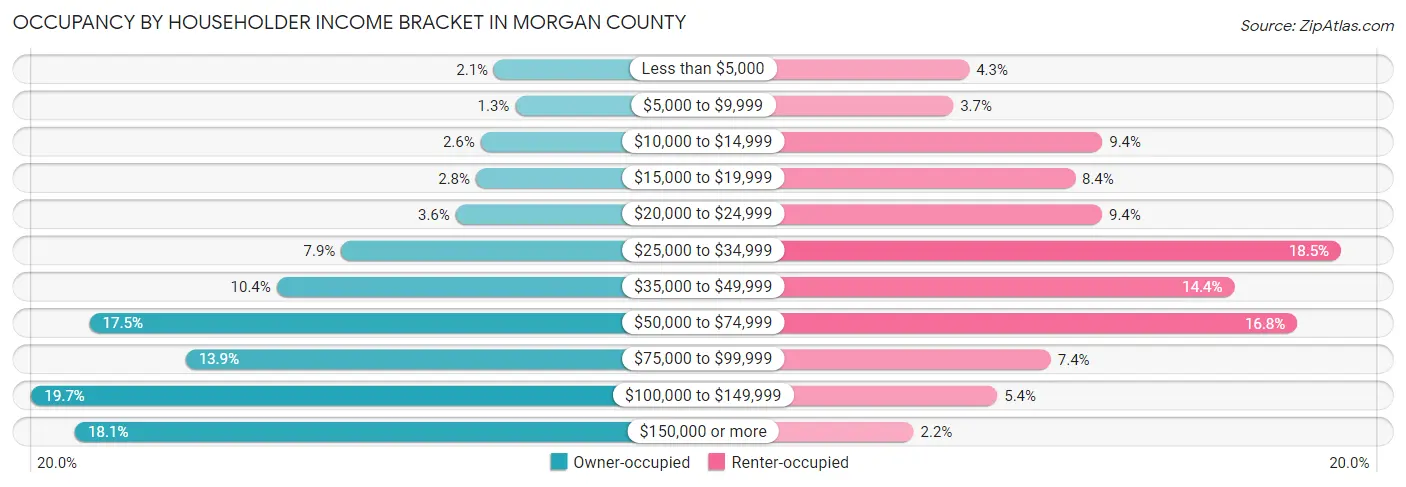
| Income Bracket | Owner-occupied | Renter-occupied |
| Less than $5,000 | 742 (2.1%) | 566 (4.3%) |
| $5,000 to $9,999 | 458 (1.3%) | 486 (3.7%) |
| $10,000 to $14,999 | 920 (2.6%) | 1,230 (9.4%) |
| $15,000 to $19,999 | 983 (2.8%) | 1,094 (8.4%) |
| $20,000 to $24,999 | 1,251 (3.6%) | 1,229 (9.4%) |
| $25,000 to $34,999 | 2,774 (7.9%) | 2,419 (18.5%) |
| $35,000 to $49,999 | 3,631 (10.4%) | 1,888 (14.4%) |
| $50,000 to $74,999 | 6,117 (17.5%) | 2,201 (16.8%) |
| $75,000 to $99,999 | 4,839 (13.9%) | 973 (7.4%) |
| $100,000 to $149,999 | 6,892 (19.7%) | 707 (5.4%) |
| $150,000 or more | 6,315 (18.1%) | 289 (2.2%) |
| Total | 34,922 (100.0%) | 13,082 (100.0%) |
Monthly Housing Cost Tiers in Morgan County
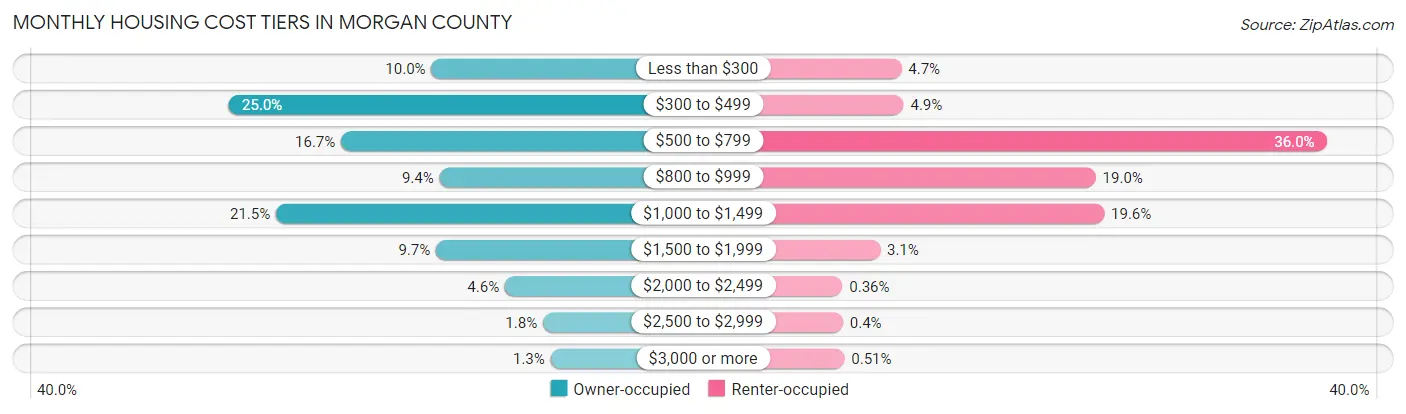
| Monthly Cost | Owner-occupied | Renter-occupied |
| Less than $300 | 3,507 (10.0%) | 616 (4.7%) |
| $300 to $499 | 8,712 (24.9%) | 637 (4.9%) |
| $500 to $799 | 5,828 (16.7%) | 4,711 (36.0%) |
| $800 to $999 | 3,297 (9.4%) | 2,488 (19.0%) |
| $1,000 to $1,499 | 7,501 (21.5%) | 2,569 (19.6%) |
| $1,500 to $1,999 | 3,386 (9.7%) | 411 (3.1%) |
| $2,000 to $2,499 | 1,615 (4.6%) | 47 (0.4%) |
| $2,500 to $2,999 | 635 (1.8%) | 52 (0.4%) |
| $3,000 or more | 441 (1.3%) | 67 (0.5%) |
| Total | 34,922 (100.0%) | 13,082 (100.0%) |
Physical Housing Characteristics in Morgan County
Housing Structures in Morgan County
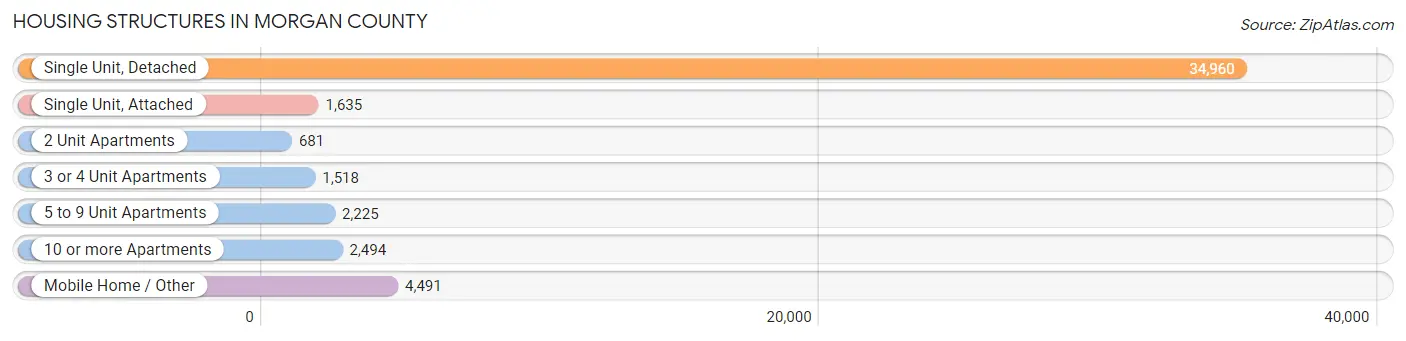
| Structure Type | # Housing Units | % Housing Units |
| Single Unit, Detached | 34,960 | 72.8% |
| Single Unit, Attached | 1,635 | 3.4% |
| 2 Unit Apartments | 681 | 1.4% |
| 3 or 4 Unit Apartments | 1,518 | 3.2% |
| 5 to 9 Unit Apartments | 2,225 | 4.6% |
| 10 or more Apartments | 2,494 | 5.2% |
| Mobile Home / Other | 4,491 | 9.4% |
| Total | 48,004 | 100.0% |
Housing Structures by Occupancy in Morgan County
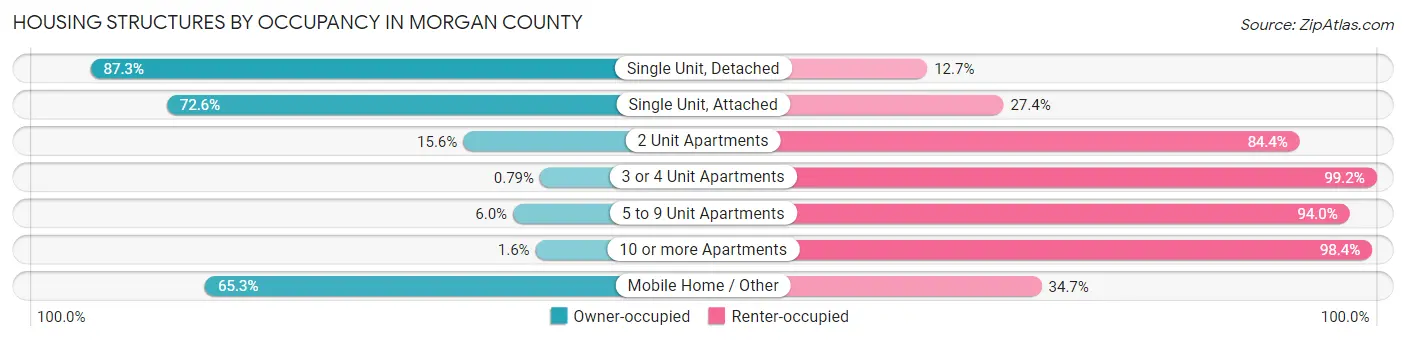
| Structure Type | Owner-occupied | Renter-occupied |
| Single Unit, Detached | 30,512 (87.3%) | 4,448 (12.7%) |
| Single Unit, Attached | 1,187 (72.6%) | 448 (27.4%) |
| 2 Unit Apartments | 106 (15.6%) | 575 (84.4%) |
| 3 or 4 Unit Apartments | 12 (0.8%) | 1,506 (99.2%) |
| 5 to 9 Unit Apartments | 133 (6.0%) | 2,092 (94.0%) |
| 10 or more Apartments | 41 (1.6%) | 2,453 (98.4%) |
| Mobile Home / Other | 2,931 (65.3%) | 1,560 (34.7%) |
| Total | 34,922 (72.8%) | 13,082 (27.3%) |
Housing Structures by Number of Rooms in Morgan County
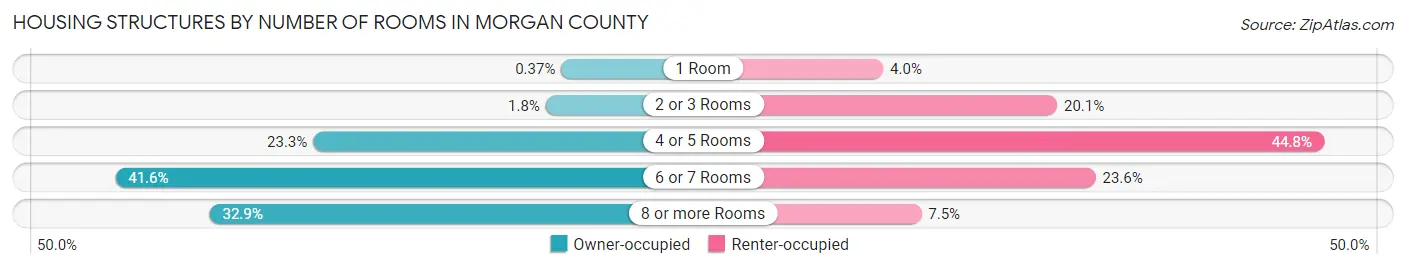
| Number of Rooms | Owner-occupied | Renter-occupied |
| 1 Room | 129 (0.4%) | 523 (4.0%) |
| 2 or 3 Rooms | 633 (1.8%) | 2,627 (20.1%) |
| 4 or 5 Rooms | 8,143 (23.3%) | 5,854 (44.8%) |
| 6 or 7 Rooms | 14,532 (41.6%) | 3,093 (23.6%) |
| 8 or more Rooms | 11,485 (32.9%) | 985 (7.5%) |
| Total | 34,922 (100.0%) | 13,082 (100.0%) |
Housing Structure by Heating Type in Morgan County
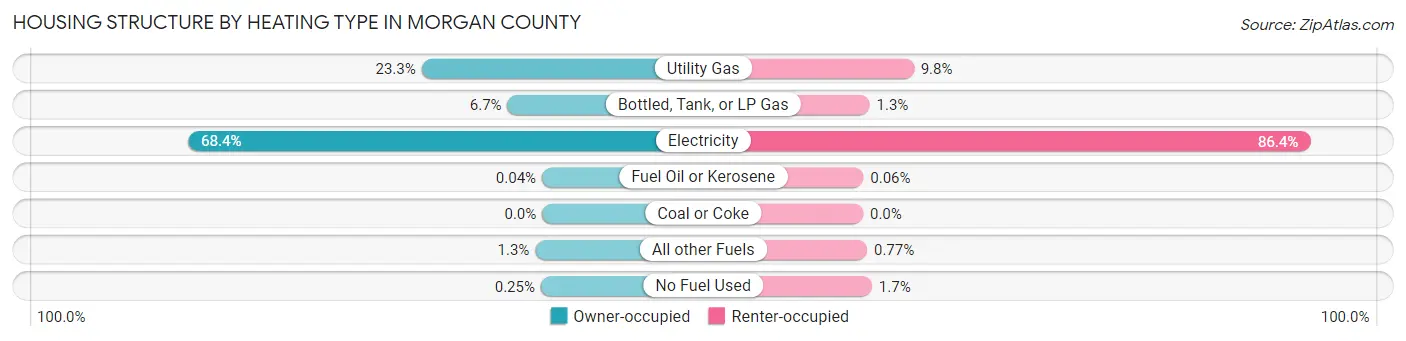
| Heating Type | Owner-occupied | Renter-occupied |
| Utility Gas | 8,136 (23.3%) | 1,281 (9.8%) |
| Bottled, Tank, or LP Gas | 2,339 (6.7%) | 166 (1.3%) |
| Electricity | 23,882 (68.4%) | 11,302 (86.4%) |
| Fuel Oil or Kerosene | 13 (0.0%) | 8 (0.1%) |
| Coal or Coke | 0 (0.0%) | 0 (0.0%) |
| All other Fuels | 464 (1.3%) | 101 (0.8%) |
| No Fuel Used | 88 (0.3%) | 224 (1.7%) |
| Total | 34,922 (100.0%) | 13,082 (100.0%) |
Household Vehicle Usage in Morgan County
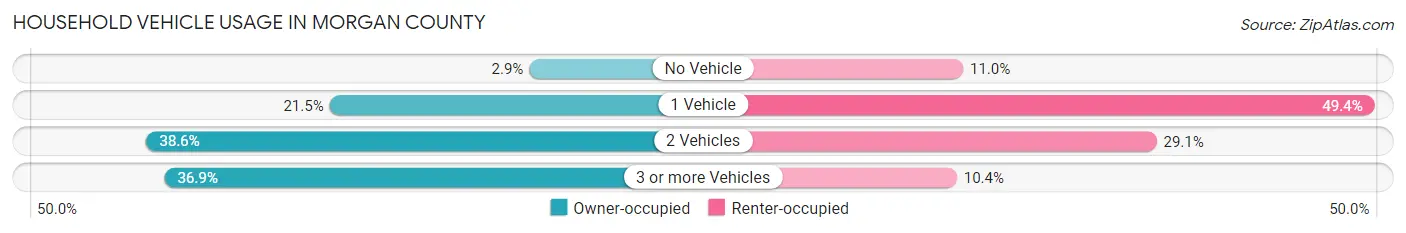
| Vehicles per Household | Owner-occupied | Renter-occupied |
| No Vehicle | 1,011 (2.9%) | 1,443 (11.0%) |
| 1 Vehicle | 7,521 (21.5%) | 6,467 (49.4%) |
| 2 Vehicles | 13,490 (38.6%) | 3,806 (29.1%) |
| 3 or more Vehicles | 12,900 (36.9%) | 1,366 (10.4%) |
| Total | 34,922 (100.0%) | 13,082 (100.0%) |
Real Estate & Mortgages in Morgan County
Real Estate and Mortgage Overview in Morgan County
| Characteristic | Without Mortgage | With Mortgage |
| Housing Units | 16,823 | 18,099 |
| Median Property Value | $158,600 | $187,800 |
| Median Household Income | $57,280 | $4,053 |
| Monthly Housing Costs | $409 | $420 |
| Real Estate Taxes | $560 | $1,691 |
Property Value by Mortgage Status in Morgan County
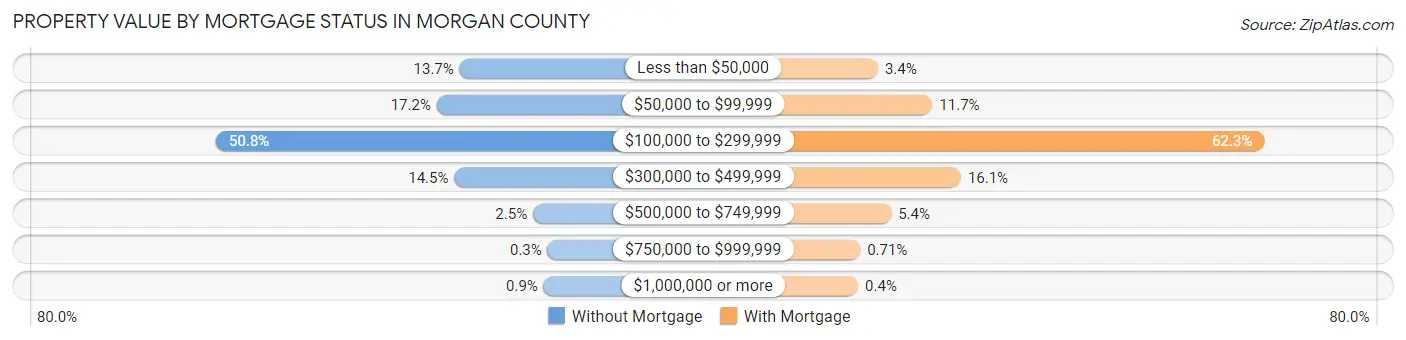
| Property Value | Without Mortgage | With Mortgage |
| Less than $50,000 | 2,307 (13.7%) | 619 (3.4%) |
| $50,000 to $99,999 | 2,893 (17.2%) | 2,119 (11.7%) |
| $100,000 to $299,999 | 8,552 (50.8%) | 11,270 (62.3%) |
| $300,000 to $499,999 | 2,442 (14.5%) | 2,906 (16.1%) |
| $500,000 to $749,999 | 426 (2.5%) | 984 (5.4%) |
| $750,000 to $999,999 | 51 (0.3%) | 129 (0.7%) |
| $1,000,000 or more | 152 (0.9%) | 72 (0.4%) |
| Total | 16,823 (100.0%) | 18,099 (100.0%) |
Household Income by Mortgage Status in Morgan County
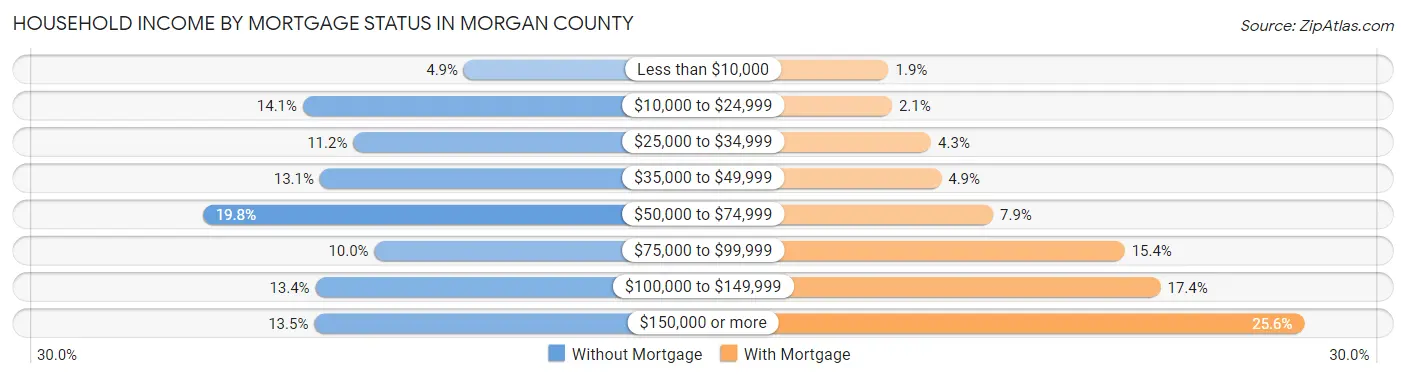
| Household Income | Without Mortgage | With Mortgage |
| Less than $10,000 | 824 (4.9%) | 342 (1.9%) |
| $10,000 to $24,999 | 2,372 (14.1%) | 376 (2.1%) |
| $25,000 to $34,999 | 1,887 (11.2%) | 782 (4.3%) |
| $35,000 to $49,999 | 2,209 (13.1%) | 887 (4.9%) |
| $50,000 to $74,999 | 3,334 (19.8%) | 1,422 (7.9%) |
| $75,000 to $99,999 | 1,684 (10.0%) | 2,783 (15.4%) |
| $100,000 to $149,999 | 2,251 (13.4%) | 3,155 (17.4%) |
| $150,000 or more | 2,262 (13.5%) | 4,641 (25.6%) |
| Total | 16,823 (100.0%) | 18,099 (100.0%) |
Property Value to Household Income Ratio in Morgan County
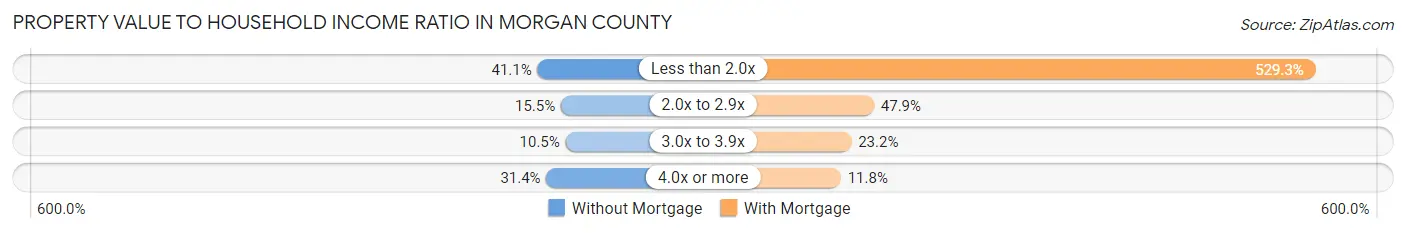
| Value-to-Income Ratio | Without Mortgage | With Mortgage |
| Less than 2.0x | 6,910 (41.1%) | 95,795 (529.3%) |
| 2.0x to 2.9x | 2,604 (15.5%) | 8,661 (47.8%) |
| 3.0x to 3.9x | 1,761 (10.5%) | 4,204 (23.2%) |
| 4.0x or more | 5,277 (31.4%) | 2,135 (11.8%) |
| Total | 16,823 (100.0%) | 18,099 (100.0%) |
Real Estate Taxes by Mortgage Status in Morgan County
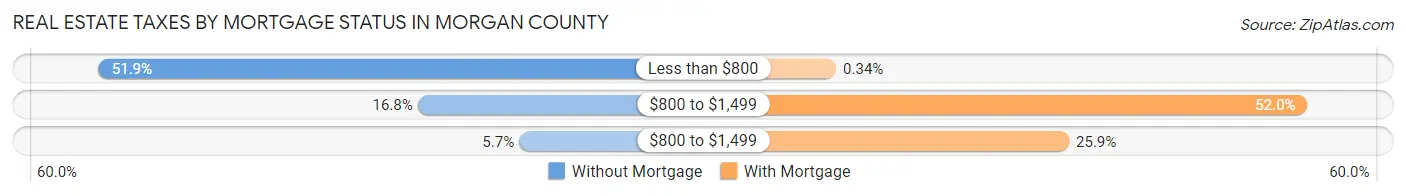
| Property Taxes | Without Mortgage | With Mortgage |
| Less than $800 | 8,725 (51.9%) | 61 (0.3%) |
| $800 to $1,499 | 2,832 (16.8%) | 9,408 (52.0%) |
| $800 to $1,499 | 960 (5.7%) | 4,683 (25.9%) |
| Total | 16,823 (100.0%) | 18,099 (100.0%) |
Health & Disability in Morgan County
Health Insurance Coverage by Age in Morgan County
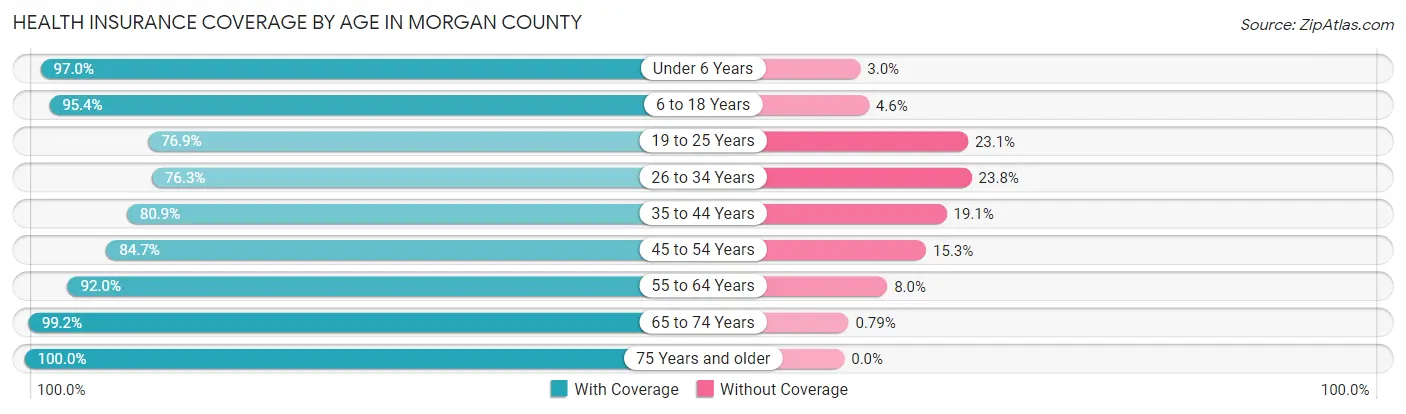
| Age Bracket | With Coverage | Without Coverage |
| Under 6 Years | 8,361 (97.0%) | 258 (3.0%) |
| 6 to 18 Years | 19,915 (95.4%) | 958 (4.6%) |
| 19 to 25 Years | 7,845 (76.9%) | 2,351 (23.1%) |
| 26 to 34 Years | 9,812 (76.2%) | 3,057 (23.7%) |
| 35 to 44 Years | 12,134 (80.9%) | 2,858 (19.1%) |
| 45 to 54 Years | 13,108 (84.7%) | 2,360 (15.3%) |
| 55 to 64 Years | 15,391 (92.0%) | 1,341 (8.0%) |
| 65 to 74 Years | 12,636 (99.2%) | 101 (0.8%) |
| 75 Years and older | 8,650 (100.0%) | 0 (0.0%) |
| Total | 107,852 (89.0%) | 13,284 (11.0%) |
Health Insurance Coverage by Citizenship Status in Morgan County
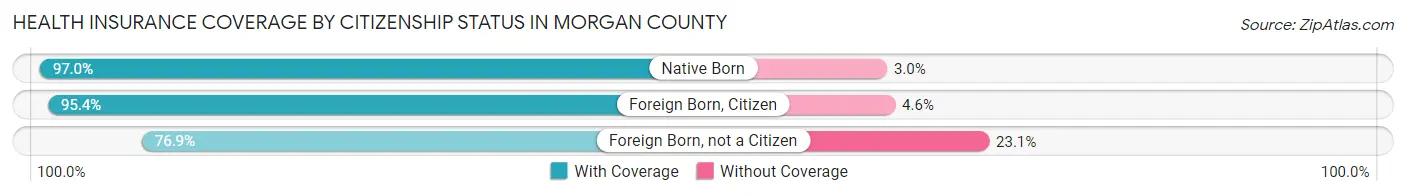
| Citizenship Status | With Coverage | Without Coverage |
| Native Born | 8,361 (97.0%) | 258 (3.0%) |
| Foreign Born, Citizen | 19,915 (95.4%) | 958 (4.6%) |
| Foreign Born, not a Citizen | 7,845 (76.9%) | 2,351 (23.1%) |
Health Insurance Coverage by Household Income in Morgan County
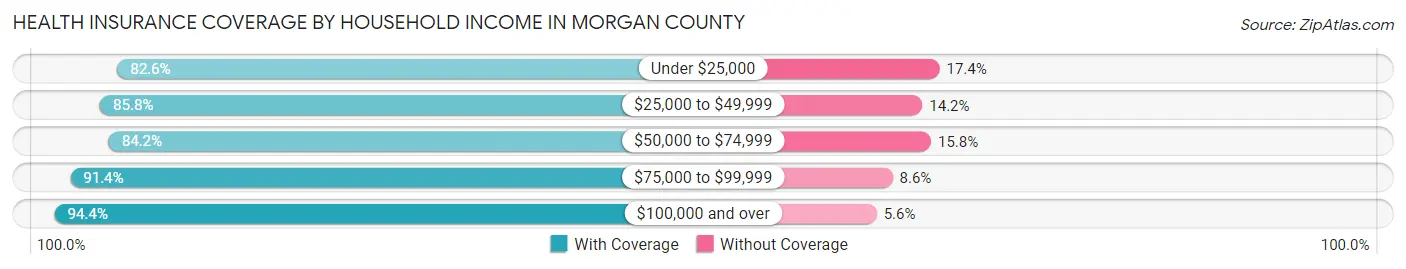
| Household Income | With Coverage | Without Coverage |
| Under $25,000 | 13,091 (82.6%) | 2,754 (17.4%) |
| $25,000 to $49,999 | 19,353 (85.8%) | 3,193 (14.2%) |
| $50,000 to $74,999 | 18,000 (84.2%) | 3,372 (15.8%) |
| $75,000 to $99,999 | 14,927 (91.4%) | 1,401 (8.6%) |
| $100,000 and over | 42,369 (94.4%) | 2,520 (5.6%) |
Public vs Private Health Insurance Coverage by Age in Morgan County
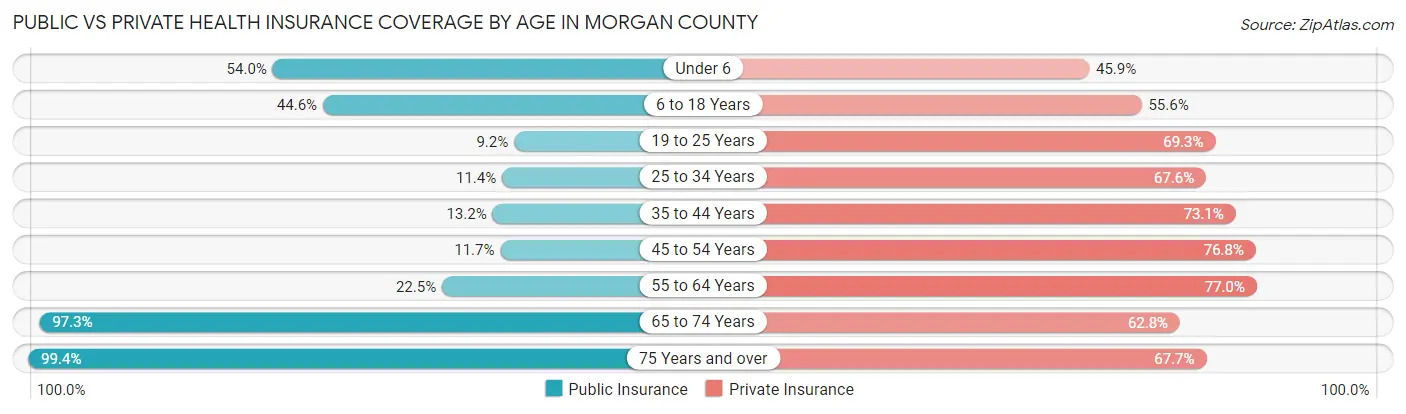
| Age Bracket | Public Insurance | Private Insurance |
| Under 6 | 4,651 (54.0%) | 3,955 (45.9%) |
| 6 to 18 Years | 9,316 (44.6%) | 11,611 (55.6%) |
| 19 to 25 Years | 933 (9.1%) | 7,068 (69.3%) |
| 25 to 34 Years | 1,464 (11.4%) | 8,699 (67.6%) |
| 35 to 44 Years | 1,972 (13.2%) | 10,960 (73.1%) |
| 45 to 54 Years | 1,810 (11.7%) | 11,885 (76.8%) |
| 55 to 64 Years | 3,770 (22.5%) | 12,887 (77.0%) |
| 65 to 74 Years | 12,390 (97.3%) | 7,994 (62.8%) |
| 75 Years and over | 8,594 (99.4%) | 5,853 (67.7%) |
| Total | 44,900 (37.1%) | 80,912 (66.8%) |
Disability Status by Sex by Age in Morgan County
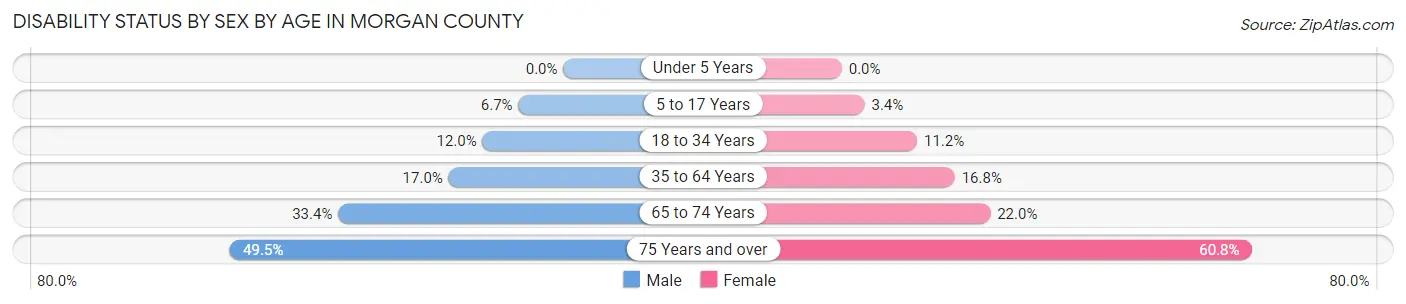
| Age Bracket | Male | Female |
| Under 5 Years | 0 (0.0%) | 0 (0.0%) |
| 5 to 17 Years | 715 (6.7%) | 340 (3.4%) |
| 18 to 34 Years | 1,486 (12.0%) | 1,344 (11.2%) |
| 35 to 64 Years | 3,977 (17.0%) | 3,998 (16.8%) |
| 65 to 74 Years | 1,945 (33.4%) | 1,525 (22.0%) |
| 75 Years and over | 1,787 (49.5%) | 3,065 (60.8%) |
Disability Class by Sex by Age in Morgan County
Disability Class: Hearing Difficulty
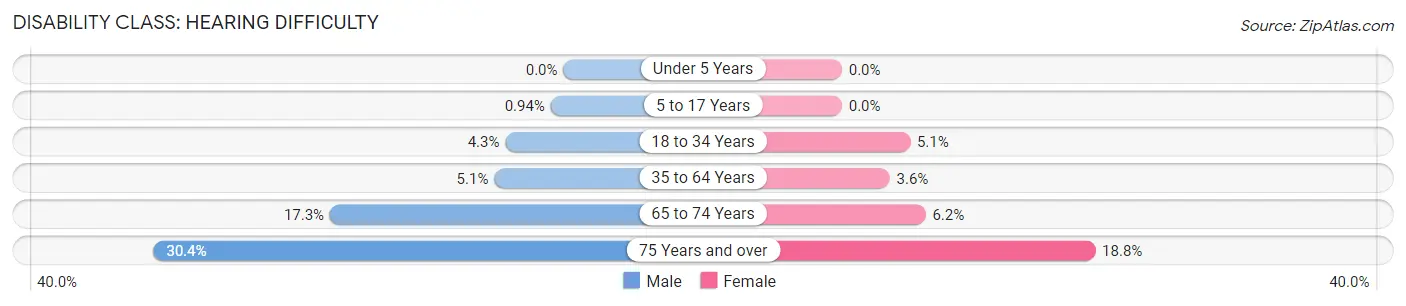
| Age Bracket | Male | Female |
| Under 5 Years | 0 (0.0%) | 0 (0.0%) |
| 5 to 17 Years | 101 (0.9%) | 0 (0.0%) |
| 18 to 34 Years | 534 (4.3%) | 608 (5.1%) |
| 35 to 64 Years | 1,198 (5.1%) | 847 (3.5%) |
| 65 to 74 Years | 1,008 (17.3%) | 430 (6.2%) |
| 75 Years and over | 1,099 (30.4%) | 948 (18.8%) |
Disability Class: Vision Difficulty
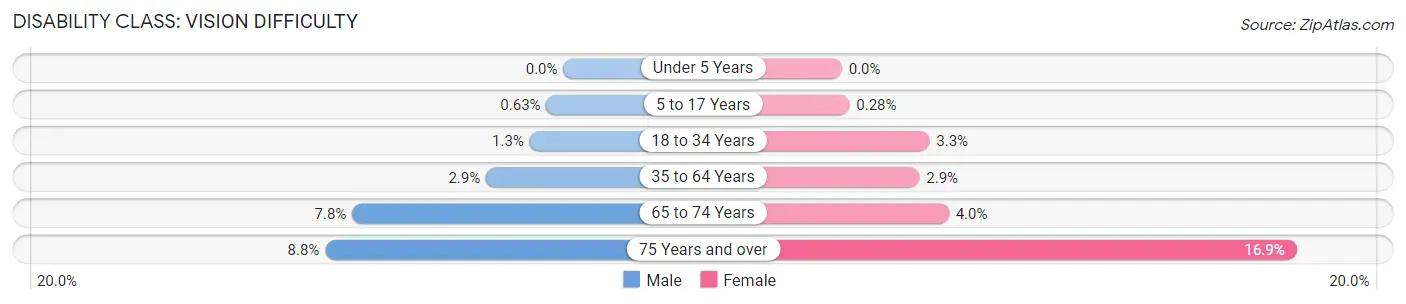
| Age Bracket | Male | Female |
| Under 5 Years | 0 (0.0%) | 0 (0.0%) |
| 5 to 17 Years | 67 (0.6%) | 28 (0.3%) |
| 18 to 34 Years | 155 (1.3%) | 391 (3.3%) |
| 35 to 64 Years | 670 (2.9%) | 686 (2.9%) |
| 65 to 74 Years | 456 (7.8%) | 275 (4.0%) |
| 75 Years and over | 319 (8.8%) | 851 (16.9%) |
Disability Class: Cognitive Difficulty
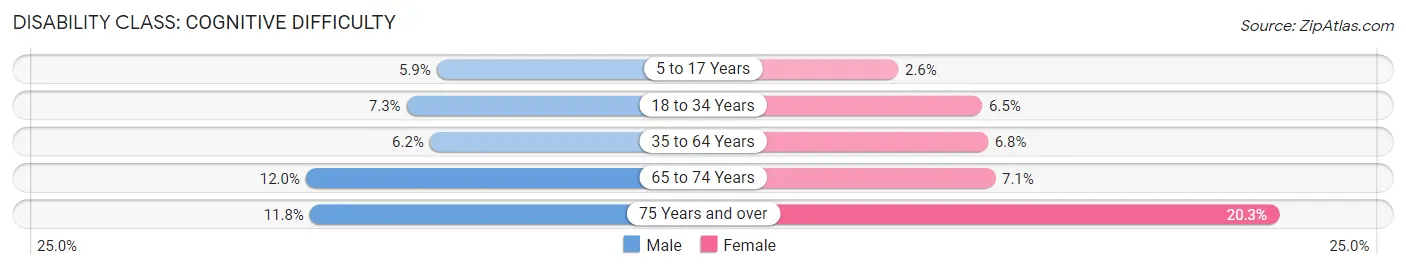
| Age Bracket | Male | Female |
| 5 to 17 Years | 630 (5.9%) | 263 (2.6%) |
| 18 to 34 Years | 902 (7.3%) | 783 (6.5%) |
| 35 to 64 Years | 1,447 (6.2%) | 1,613 (6.8%) |
| 65 to 74 Years | 695 (11.9%) | 492 (7.1%) |
| 75 Years and over | 425 (11.8%) | 1,022 (20.3%) |
Disability Class: Ambulatory Difficulty
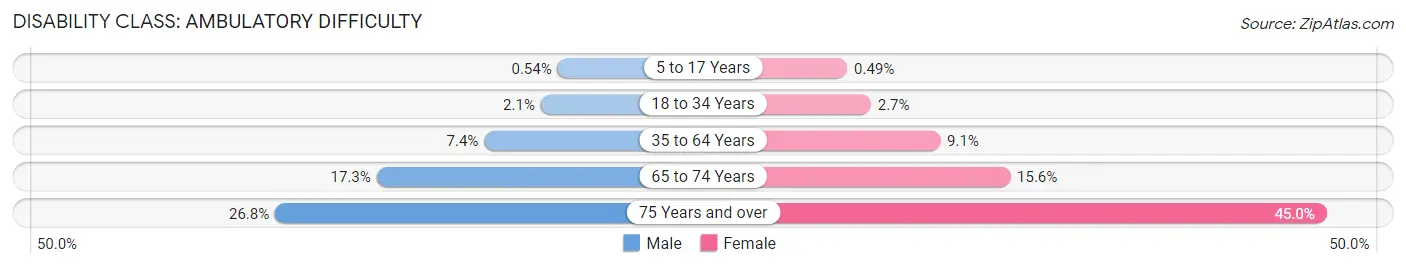
| Age Bracket | Male | Female |
| 5 to 17 Years | 58 (0.5%) | 49 (0.5%) |
| 18 to 34 Years | 260 (2.1%) | 323 (2.7%) |
| 35 to 64 Years | 1,715 (7.3%) | 2,175 (9.1%) |
| 65 to 74 Years | 1,008 (17.3%) | 1,081 (15.6%) |
| 75 Years and over | 966 (26.8%) | 2,268 (45.0%) |
Disability Class: Self-Care Difficulty
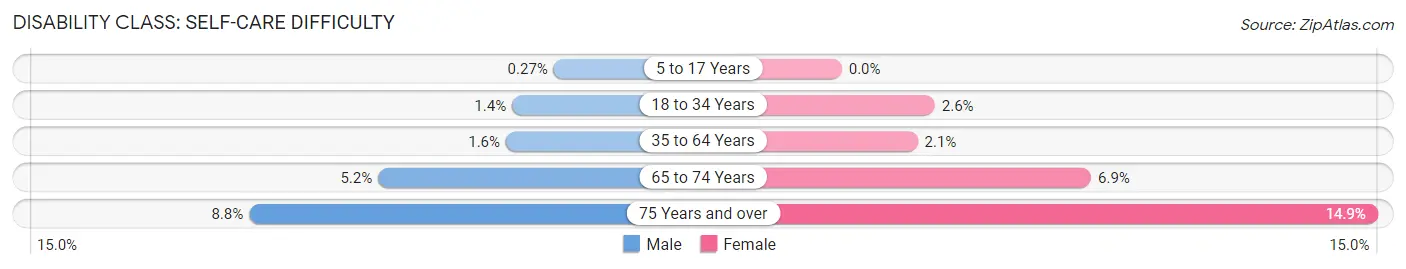
| Age Bracket | Male | Female |
| 5 to 17 Years | 29 (0.3%) | 0 (0.0%) |
| 18 to 34 Years | 177 (1.4%) | 311 (2.6%) |
| 35 to 64 Years | 374 (1.6%) | 503 (2.1%) |
| 65 to 74 Years | 300 (5.2%) | 480 (6.9%) |
| 75 Years and over | 316 (8.7%) | 752 (14.9%) |
Technology Access in Morgan County
Computing Device Access in Morgan County
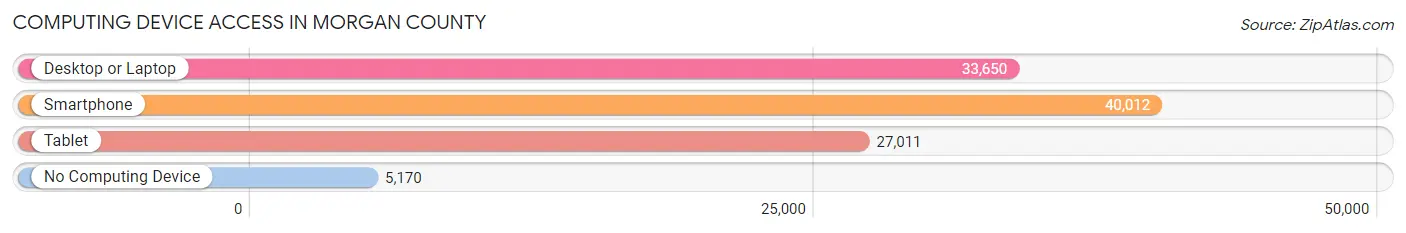
| Device Type | # Households | % Households |
| Desktop or Laptop | 33,650 | 70.1% |
| Smartphone | 40,012 | 83.4% |
| Tablet | 27,011 | 56.3% |
| No Computing Device | 5,170 | 10.8% |
| Total | 48,004 | 100.0% |
Internet Access in Morgan County
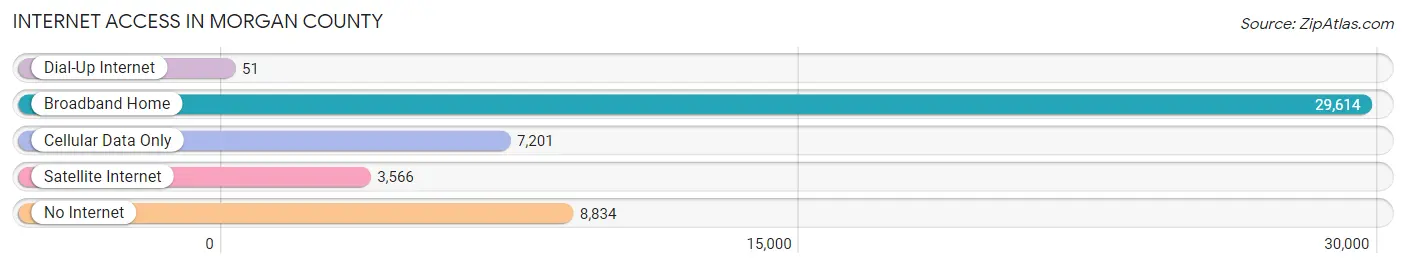
| Internet Type | # Households | % Households |
| Dial-Up Internet | 51 | 0.1% |
| Broadband Home | 29,614 | 61.7% |
| Cellular Data Only | 7,201 | 15.0% |
| Satellite Internet | 3,566 | 7.4% |
| No Internet | 8,834 | 18.4% |
| Total | 48,004 | 100.0% |
Morgan County Summary
Morgan County is located in the north-central part of the state of Alabama, and is part of the Huntsville-Decatur Combined Statistical Area. The county was established in 1818 and named for General Daniel Morgan, a Revolutionary War hero. The county seat is Decatur, which is also the largest city in the county.
Geography
Morgan County is located in the Tennessee Valley region of Alabama, and is bordered by Limestone County to the north, Madison County to the east, Lawrence County to the south, and Cullman County to the west. The county covers an area of 583 square miles, and is mostly composed of rolling hills and valleys. The Tennessee River forms the western border of the county, and the Flint River forms the eastern border. The county is home to several state parks, including Bankhead National Forest, Joe Wheeler State Park, and Point Mallard Park.
Demographics
As of the 2010 census, Morgan County had a population of 119,490, making it the fourth most populous county in the state. The population was spread out with 24.3% under the age of 18, 8.7% from 18 to 24, 28.2% from 25 to 44, 24.2% from 45 to 64, and 14.6% who were 65 years of age or older. The median age was 37.2 years. The racial makeup of the county was 79.2% White, 15.7% Black or African American, 0.4% Native American, 1.3% Asian, 0.1% Pacific Islander, 1.7% from other races, and 2.0% from two or more races.
Economy
Morgan County is home to a diverse economy, with a variety of industries providing employment opportunities. The largest employers in the county are the Decatur City Schools, the Decatur-Morgan County Hospital, and the Huntsville-Decatur Combined Statistical Area. Other major employers include the U.S. Army Redstone Arsenal, the Tennessee Valley Authority, and the Marshall Space Flight Center. The county is also home to several manufacturing companies, including 3M, General Electric, and Goodyear Tire and Rubber Company.
Agriculture is also an important part of the economy, with the county producing a variety of crops, including corn, soybeans, cotton, and hay. Livestock production is also important, with the county producing beef cattle, dairy cattle, and poultry.
The county is also home to several tourist attractions, including the Point Mallard Park, the Wheeler National Wildlife Refuge, and the Bankhead National Forest. These attractions bring in visitors from all over the state and the country, providing a boost to the local economy.
Conclusion
Morgan County is a diverse and vibrant county located in the north-central part of Alabama. The county is home to a variety of industries, including manufacturing, agriculture, and tourism. The county is also home to several state parks and tourist attractions, providing a boost to the local economy. With its diverse economy and population, Morgan County is an important part of the state of Alabama.
Common Questions
What is Per Capita Income in Morgan County?
Per Capita income in Morgan County is $33,223.
What is the Median Family Income in Morgan County?
Median Family Income in Morgan County is $79,360.
What is the Median Household income in Morgan County?
Median Household Income in Morgan County is $61,588.
What is Income or Wage Gap in Morgan County?
Income or Wage Gap in Morgan County is 35.3%.
Women in Morgan County earn 64.7 cents for every dollar earned by a man.
What is Family Income Deficit in Morgan County?
Family Income Deficit in Morgan County is $8,848.
Families that are below poverty line in Morgan County earn $8,848 less on average than the poverty threshold level.
What is Inequality or Gini Index in Morgan County?
Inequality or Gini Index in Morgan County is 0.45.
What is the Total Population of Morgan County?
Total Population of Morgan County is 123,102.
What is the Total Male Population of Morgan County?
Total Male Population of Morgan County is 60,953.
What is the Total Female Population of Morgan County?
Total Female Population of Morgan County is 62,149.
What is the Ratio of Males per 100 Females in Morgan County?
There are 98.08 Males per 100 Females in Morgan County.
What is the Ratio of Females per 100 Males in Morgan County?
There are 101.96 Females per 100 Males in Morgan County.
What is the Median Population Age in Morgan County?
Median Population Age in Morgan County is 40.6 Years.
What is the Average Family Size in Morgan County
Average Family Size in Morgan County is 3.1 People.
What is the Average Household Size in Morgan County
Average Household Size in Morgan County is 2.5 People.
How Large is the Labor Force in Morgan County?
There are 57,529 People in the Labor Forcein in Morgan County.
What is the Percentage of People in the Labor Force in Morgan County?
58.5% of People are in the Labor Force in Morgan County.
What is the Unemployment Rate in Morgan County?
Unemployment Rate in Morgan County is 4.2%.