Mobile County, AL Map & Demographics
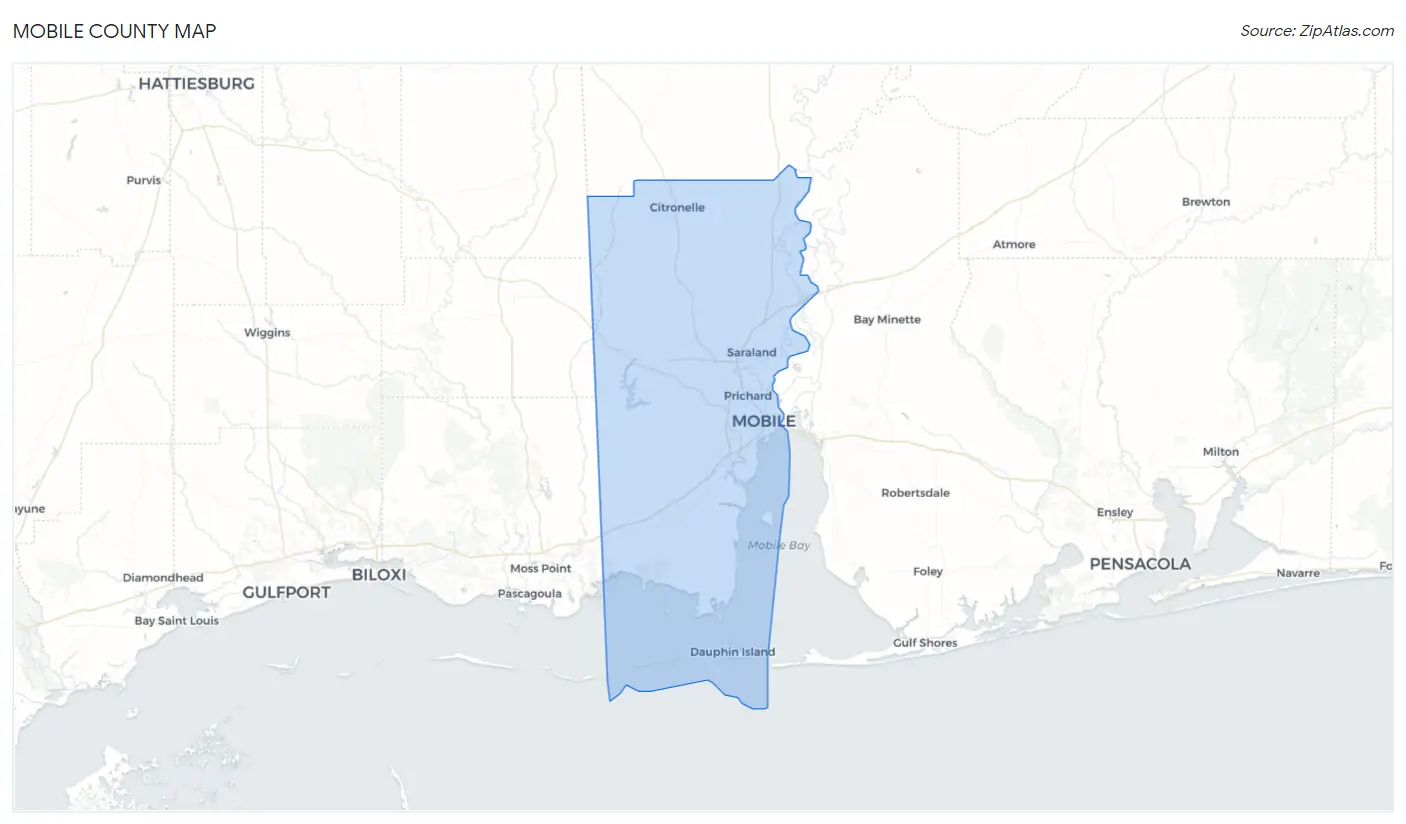
Mobile County Map
Mobile County Overview
$30,482
PER CAPITA INCOME
$70,688
AVG FAMILY INCOME
$55,352
AVG HOUSEHOLD INCOME
36.8%
WAGE / INCOME GAP [ % ]
63.2¢/ $1
WAGE / INCOME GAP [ $ ]
$11,465
FAMILY INCOME DEFICIT
0.47
INEQUALITY / GINI INDEX
413,878
TOTAL POPULATION
198,642
MALE POPULATION
215,236
FEMALE POPULATION
92.29
MALES / 100 FEMALES
108.35
FEMALES / 100 MALES
38.2
MEDIAN AGE
3.2
AVG FAMILY SIZE
2.5
AVG HOUSEHOLD SIZE
188,490
LABOR FORCE [ PEOPLE ]
57.4%
PERCENT IN LABOR FORCE
5.9%
UNEMPLOYMENT RATE
Mobile County Area Codes
Income in Mobile County
Income Overview in Mobile County
Per Capita Income in Mobile County is $30,482, while median incomes of families and households are $70,688 and $55,352 respectively.
| Characteristic | Number | Measure |
| Per Capita Income | 413,878 | $30,482 |
| Median Family Income | 101,130 | $70,688 |
| Mean Family Income | 101,130 | $91,475 |
| Median Household Income | 159,605 | $55,352 |
| Mean Household Income | 159,605 | $75,532 |
| Income Deficit | 101,130 | $11,465 |
| Wage / Income Gap (%) | 413,878 | 36.83% |
| Wage / Income Gap ($) | 413,878 | 63.17¢ per $1 |
| Gini / Inequality Index | 413,878 | 0.47 |
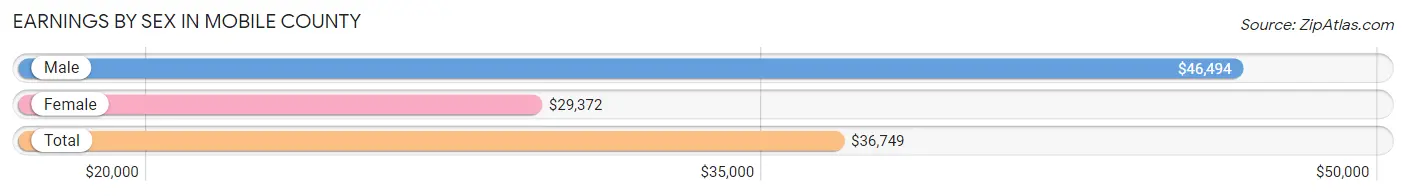
Earnings by Sex in Mobile County
Average Earnings in Mobile County are $36,749, $46,494 for men and $29,372 for women, a difference of 36.8%.
| Sex | Number | Average Earnings |
| Male | 99,930 (51.4%) | $46,494 |
| Female | 94,289 (48.5%) | $29,372 |
| Total | 194,219 (100.0%) | $36,749 |
Earnings by Sex by Income Bracket in Mobile County
The most common earnings brackets in Mobile County are $100,000+ for men (14,497 | 14.5%) and $25,000 to $29,999 for women (8,172 | 8.7%).
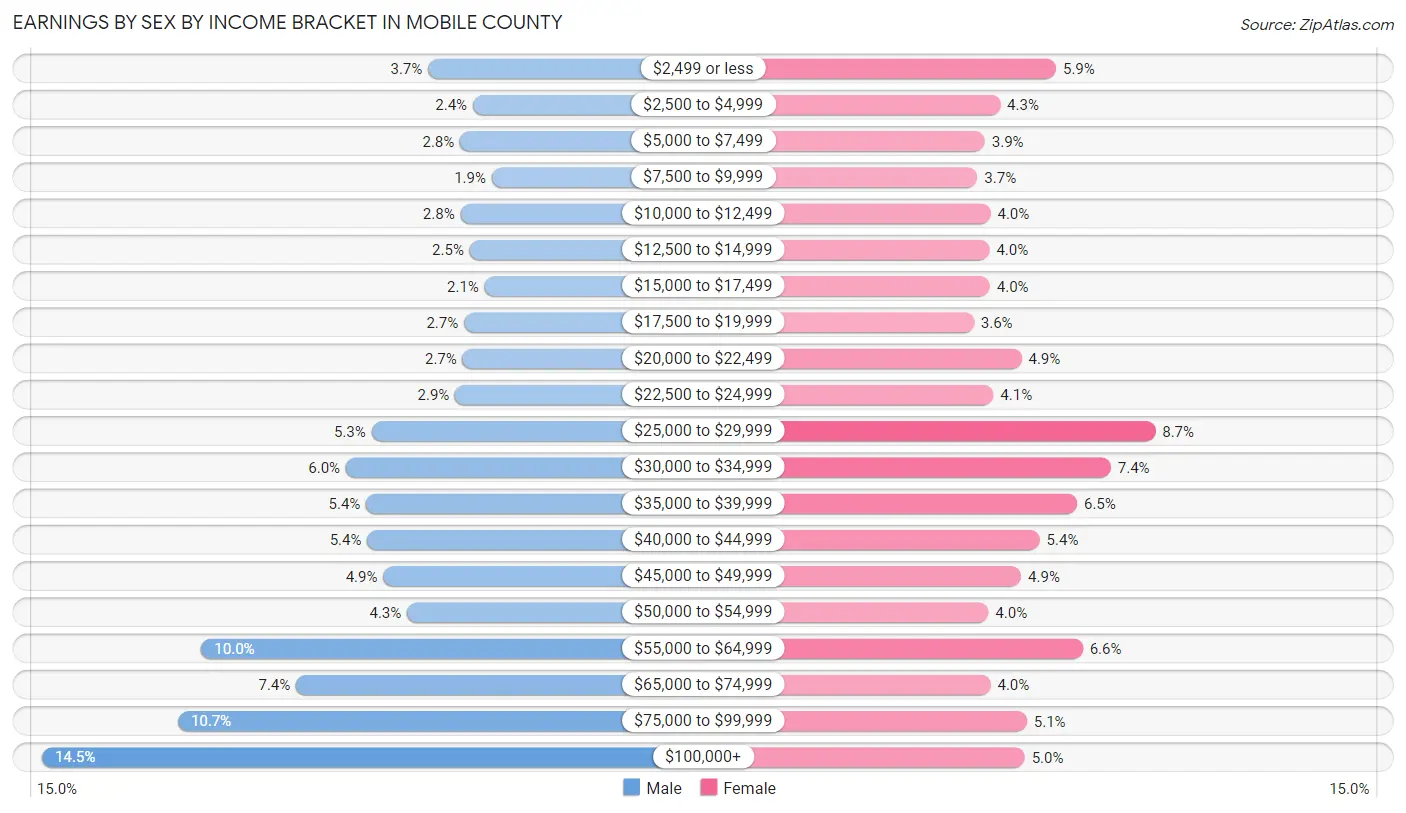
| Income | Male | Female |
| $2,499 or less | 3,653 (3.7%) | 5,547 (5.9%) |
| $2,500 to $4,999 | 2,397 (2.4%) | 4,068 (4.3%) |
| $5,000 to $7,499 | 2,756 (2.8%) | 3,660 (3.9%) |
| $7,500 to $9,999 | 1,873 (1.9%) | 3,460 (3.7%) |
| $10,000 to $12,499 | 2,749 (2.8%) | 3,805 (4.0%) |
| $12,500 to $14,999 | 2,484 (2.5%) | 3,778 (4.0%) |
| $15,000 to $17,499 | 2,071 (2.1%) | 3,793 (4.0%) |
| $17,500 to $19,999 | 2,646 (2.6%) | 3,363 (3.6%) |
| $20,000 to $22,499 | 2,693 (2.7%) | 4,633 (4.9%) |
| $22,500 to $24,999 | 2,901 (2.9%) | 3,888 (4.1%) |
| $25,000 to $29,999 | 5,250 (5.2%) | 8,172 (8.7%) |
| $30,000 to $34,999 | 5,967 (6.0%) | 6,994 (7.4%) |
| $35,000 to $39,999 | 5,392 (5.4%) | 6,102 (6.5%) |
| $40,000 to $44,999 | 5,370 (5.4%) | 5,115 (5.4%) |
| $45,000 to $49,999 | 4,921 (4.9%) | 4,617 (4.9%) |
| $50,000 to $54,999 | 4,249 (4.3%) | 3,749 (4.0%) |
| $55,000 to $64,999 | 10,021 (10.0%) | 6,253 (6.6%) |
| $65,000 to $74,999 | 7,360 (7.4%) | 3,813 (4.0%) |
| $75,000 to $99,999 | 10,680 (10.7%) | 4,769 (5.1%) |
| $100,000+ | 14,497 (14.5%) | 4,710 (5.0%) |
| Total | 99,930 (100.0%) | 94,289 (100.0%) |
Earnings by Sex by Educational Attainment in Mobile County
Average earnings in Mobile County are $54,023 for men and $33,459 for women, a difference of 38.1%. Men with an educational attainment of graduate degree enjoy the highest average annual earnings of $85,151, while those with less than high school education earn the least with $34,642. Women with an educational attainment of graduate degree earn the most with the average annual earnings of $57,601, while those with less than high school education have the smallest earnings of $20,284.
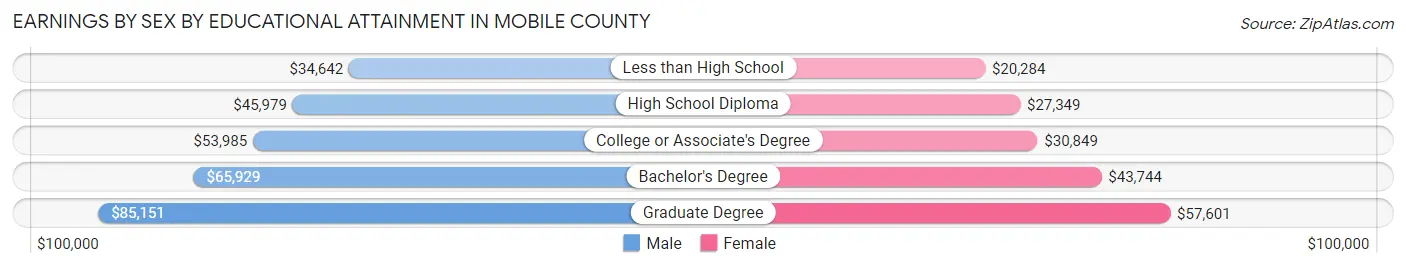
| Educational Attainment | Male Income | Female Income |
| Less than High School | $34,642 | $20,284 |
| High School Diploma | $45,979 | $27,349 |
| College or Associate's Degree | $53,985 | $30,849 |
| Bachelor's Degree | $65,929 | $43,744 |
| Graduate Degree | $85,151 | $57,601 |
| Total | $54,023 | $33,459 |
Family Income in Mobile County
Family Income Brackets in Mobile County
According to the Mobile County family income data, there are 18,810 families falling into the $50,000 to $74,999 income range, which is the most common income bracket and makes up 18.6% of all families. Conversely, the $10,000 to $14,999 income bracket is the least frequent group with only 2,731 families (2.7%) belonging to this category.
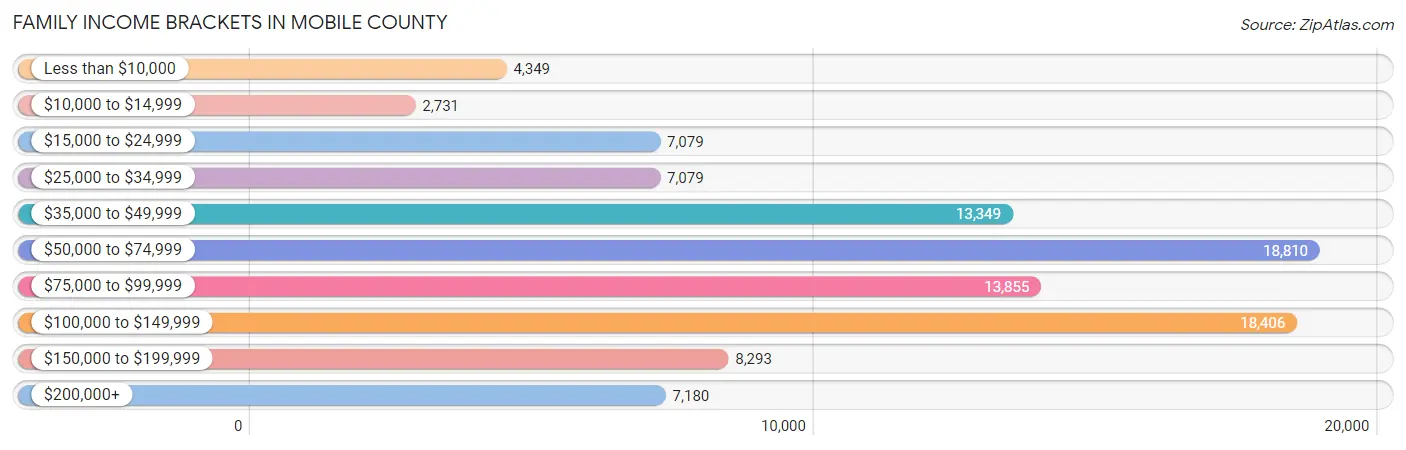
| Income Bracket | # Families | % Families |
| Less than $10,000 | 4,349 | 4.3% |
| $10,000 to $14,999 | 2,731 | 2.7% |
| $15,000 to $24,999 | 7,079 | 7.0% |
| $25,000 to $34,999 | 7,079 | 7.0% |
| $35,000 to $49,999 | 13,349 | 13.2% |
| $50,000 to $74,999 | 18,810 | 18.6% |
| $75,000 to $99,999 | 13,855 | 13.7% |
| $100,000 to $149,999 | 18,406 | 18.2% |
| $150,000 to $199,999 | 8,293 | 8.2% |
| $200,000+ | 7,180 | 7.1% |
Family Income by Famaliy Size in Mobile County
7+ person families (1,297 | 1.3%) account for the highest median family income in Mobile County with $89,980 per family, while 2-person families (49,112 | 48.6%) have the highest median income of $31,897 per family member.
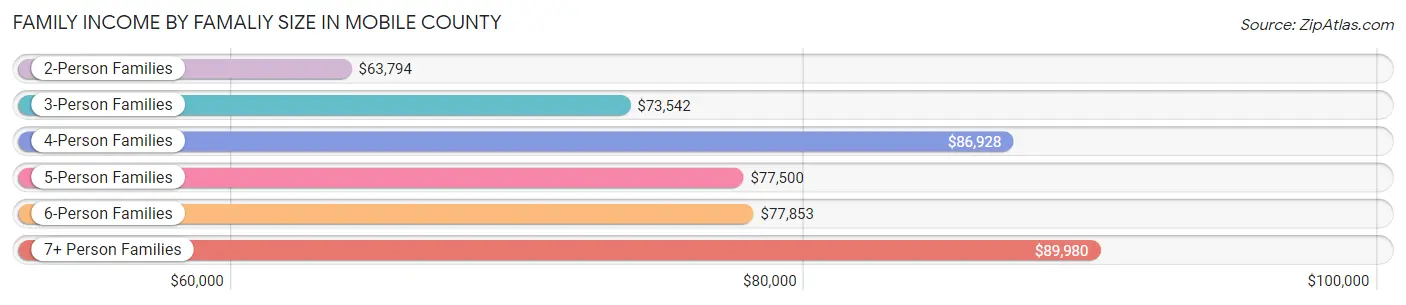
| Income Bracket | # Families | Median Income |
| 2-Person Families | 49,112 (48.6%) | $63,794 |
| 3-Person Families | 23,303 (23.0%) | $73,542 |
| 4-Person Families | 16,359 (16.2%) | $86,928 |
| 5-Person Families | 7,762 (7.7%) | $77,500 |
| 6-Person Families | 3,297 (3.3%) | $77,853 |
| 7+ Person Families | 1,297 (1.3%) | $89,980 |
| Total | 101,130 (100.0%) | $70,688 |
Family Income by Number of Earners in Mobile County
The median family income in Mobile County is $70,688, with families comprising 3+ earners (7,565) having the highest median family income of $124,985, while families with no earners (18,542) have the lowest median family income of $37,088, accounting for 7.5% and 18.3% of families, respectively.
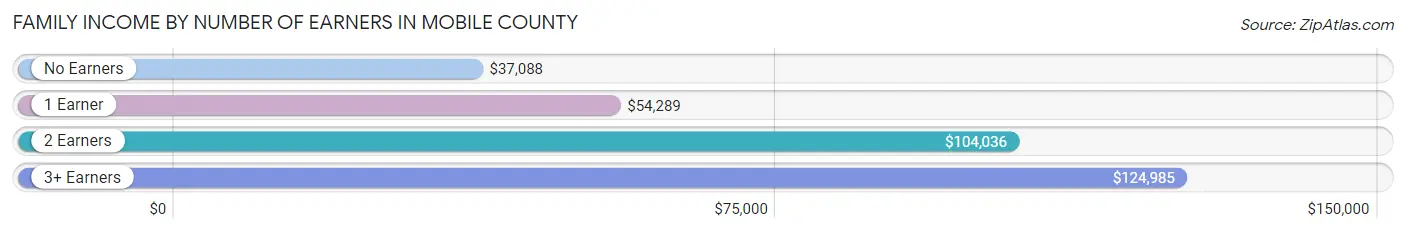
| Number of Earners | # Families | Median Income |
| No Earners | 18,542 (18.3%) | $37,088 |
| 1 Earner | 38,269 (37.8%) | $54,289 |
| 2 Earners | 36,754 (36.3%) | $104,036 |
| 3+ Earners | 7,565 (7.5%) | $124,985 |
| Total | 101,130 (100.0%) | $70,688 |
Household Income in Mobile County
Household Income Brackets in Mobile County
With 27,931 households falling in the category, the $50,000 to $74,999 income range is the most frequent in Mobile County, accounting for 17.5% of all households. In contrast, only 7,980 households (5.0%) fall into the $200,000+ income bracket, making it the least populous group.
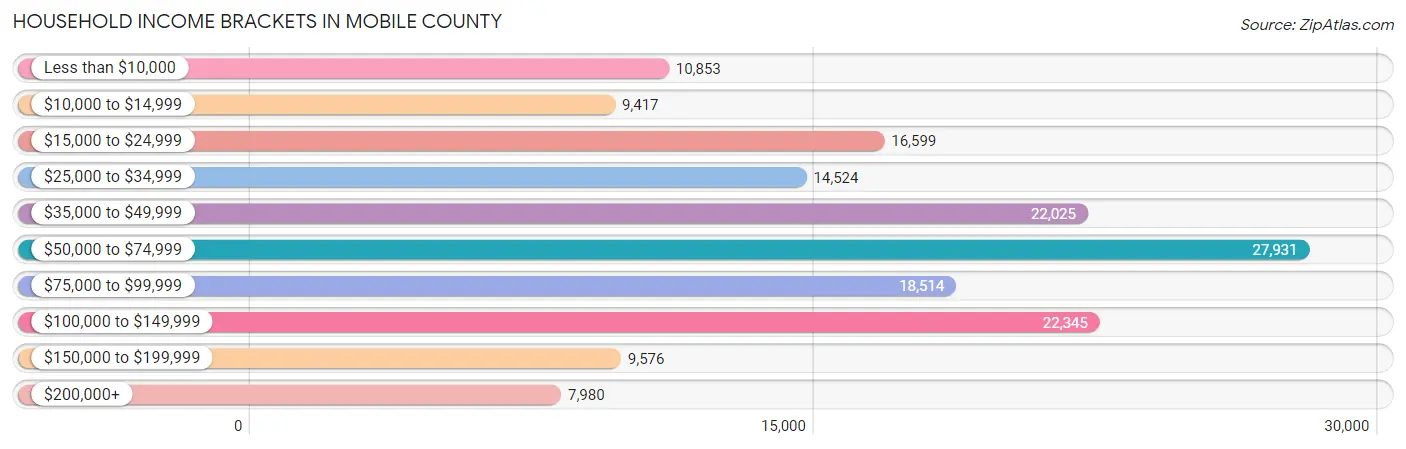
| Income Bracket | # Households | % Households |
| Less than $10,000 | 10,853 | 6.8% |
| $10,000 to $14,999 | 9,417 | 5.9% |
| $15,000 to $24,999 | 16,599 | 10.4% |
| $25,000 to $34,999 | 14,524 | 9.1% |
| $35,000 to $49,999 | 22,025 | 13.8% |
| $50,000 to $74,999 | 27,931 | 17.5% |
| $75,000 to $99,999 | 18,514 | 11.6% |
| $100,000 to $149,999 | 22,345 | 14.0% |
| $150,000 to $199,999 | 9,576 | 6.0% |
| $200,000+ | 7,980 | 5.0% |
Household Income by Householder Age in Mobile County
The median household income in Mobile County is $55,352, with the highest median household income of $65,902 found in the 45 to 64 years age bracket for the primary householder. A total of 57,315 households (35.9%) fall into this category. Meanwhile, the 15 to 24 years age bracket for the primary householder has the lowest median household income of $25,583, with 6,523 households (4.1%) in this group.
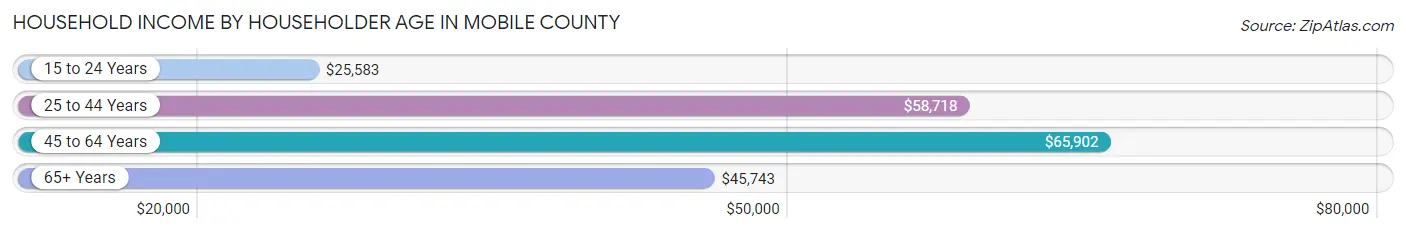
| Income Bracket | # Households | Median Income |
| 15 to 24 Years | 6,523 (4.1%) | $25,583 |
| 25 to 44 Years | 52,332 (32.8%) | $58,718 |
| 45 to 64 Years | 57,315 (35.9%) | $65,902 |
| 65+ Years | 43,435 (27.2%) | $45,743 |
| Total | 159,605 (100.0%) | $55,352 |
Poverty in Mobile County
Income Below Poverty by Sex and Age in Mobile County
With 15.2% poverty level for males and 19.8% for females among the residents of Mobile County, under 5 year old males and under 5 year old females are the most vulnerable to poverty, with 4,089 males (30.2%) and 3,934 females (31.4%) in their respective age groups living below the poverty level.
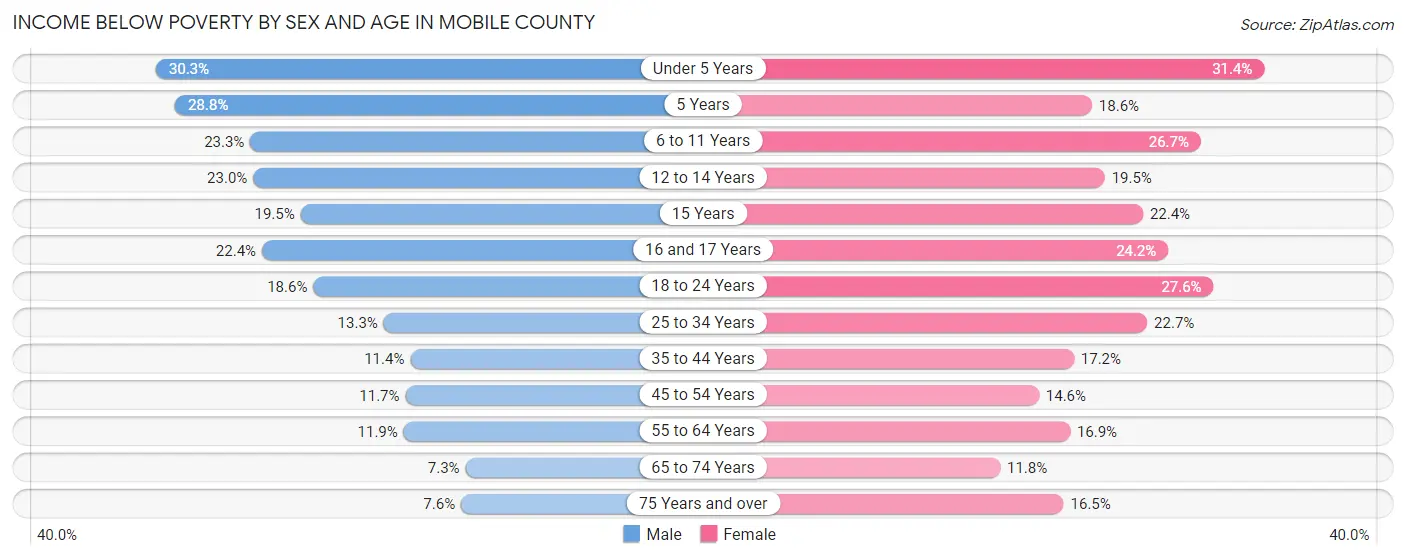
| Age Bracket | Male | Female |
| Under 5 Years | 4,089 (30.2%) | 3,934 (31.4%) |
| 5 Years | 546 (28.8%) | 465 (18.6%) |
| 6 to 11 Years | 3,696 (23.3%) | 4,317 (26.7%) |
| 12 to 14 Years | 2,004 (23.0%) | 1,469 (19.5%) |
| 15 Years | 608 (19.5%) | 564 (22.4%) |
| 16 and 17 Years | 1,165 (22.4%) | 1,316 (24.2%) |
| 18 to 24 Years | 3,245 (18.6%) | 4,756 (27.6%) |
| 25 to 34 Years | 3,591 (13.3%) | 6,708 (22.7%) |
| 35 to 44 Years | 2,690 (11.4%) | 4,529 (17.2%) |
| 45 to 54 Years | 2,738 (11.7%) | 3,718 (14.6%) |
| 55 to 64 Years | 3,017 (11.9%) | 4,794 (16.9%) |
| 65 to 74 Years | 1,392 (7.3%) | 2,576 (11.7%) |
| 75 Years and over | 795 (7.6%) | 2,631 (16.5%) |
| Total | 29,576 (15.2%) | 41,777 (19.8%) |
Income Above Poverty by Sex and Age in Mobile County
According to the poverty statistics in Mobile County, males aged 65 to 74 years and females aged 65 to 74 years are the age groups that are most secure financially, with 92.7% of males and 88.2% of females in these age groups living above the poverty line.
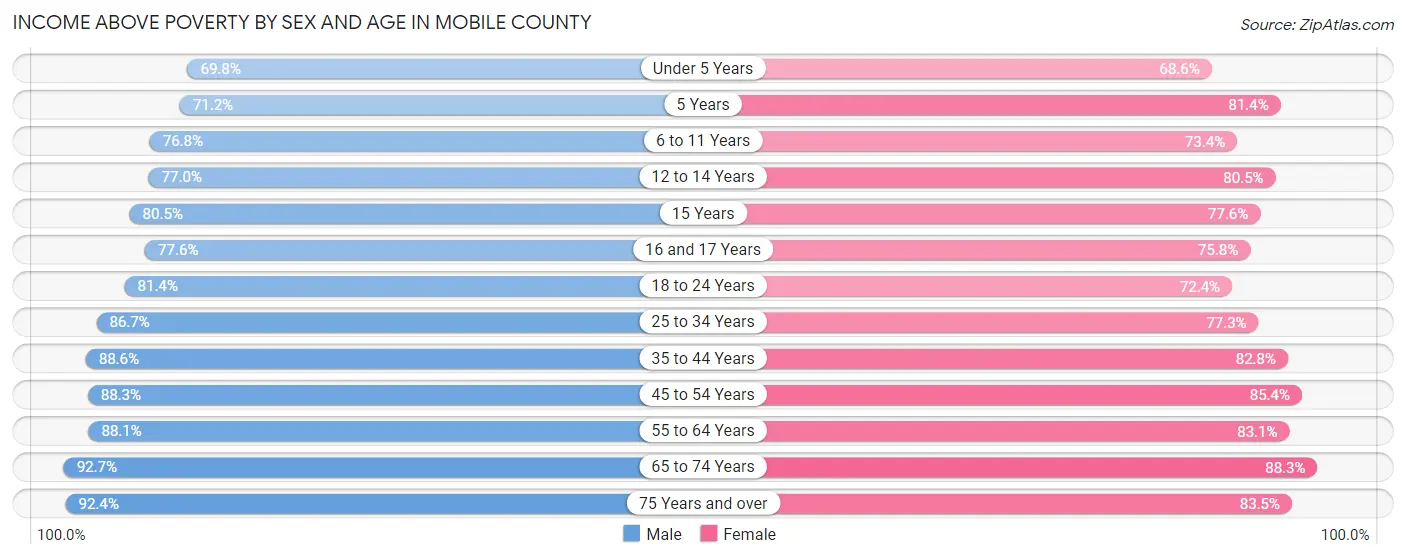
| Age Bracket | Male | Female |
| Under 5 Years | 9,430 (69.8%) | 8,610 (68.6%) |
| 5 Years | 1,348 (71.2%) | 2,039 (81.4%) |
| 6 to 11 Years | 12,198 (76.7%) | 11,882 (73.4%) |
| 12 to 14 Years | 6,696 (77.0%) | 6,057 (80.5%) |
| 15 Years | 2,508 (80.5%) | 1,958 (77.6%) |
| 16 and 17 Years | 4,041 (77.6%) | 4,115 (75.8%) |
| 18 to 24 Years | 14,229 (81.4%) | 12,480 (72.4%) |
| 25 to 34 Years | 23,329 (86.7%) | 22,884 (77.3%) |
| 35 to 44 Years | 20,962 (88.6%) | 21,749 (82.8%) |
| 45 to 54 Years | 20,602 (88.3%) | 21,687 (85.4%) |
| 55 to 64 Years | 22,430 (88.1%) | 23,510 (83.1%) |
| 65 to 74 Years | 17,744 (92.7%) | 19,351 (88.2%) |
| 75 Years and over | 9,662 (92.4%) | 13,345 (83.5%) |
| Total | 165,179 (84.8%) | 169,667 (80.2%) |
Income Below Poverty Among Married-Couple Families in Mobile County
The poverty statistics for married-couple families in Mobile County show that 4.7% or 3,216 of the total 68,525 families live below the poverty line. Families with 5 or more children have the highest poverty rate of 19.5%, comprising of 64 families. On the other hand, families with no children have the lowest poverty rate of 2.9%, which includes 1,179 families.
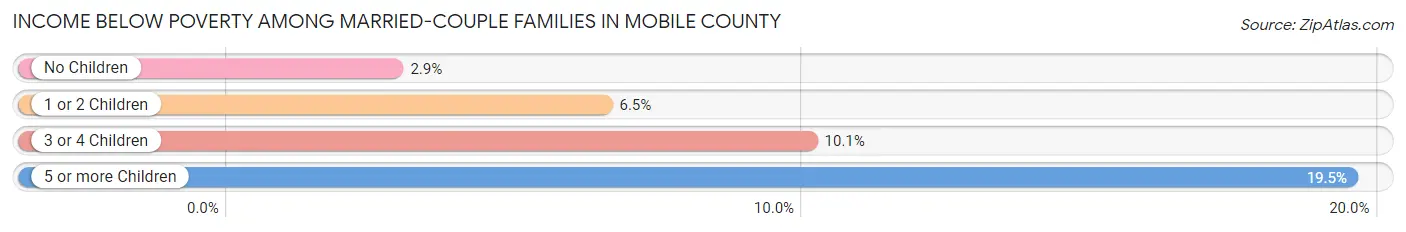
| Children | Above Poverty | Below Poverty |
| No Children | 39,729 (97.1%) | 1,179 (2.9%) |
| 1 or 2 Children | 20,416 (93.5%) | 1,423 (6.5%) |
| 3 or 4 Children | 4,900 (89.9%) | 550 (10.1%) |
| 5 or more Children | 264 (80.5%) | 64 (19.5%) |
| Total | 65,309 (95.3%) | 3,216 (4.7%) |
Income Below Poverty Among Single-Parent Households in Mobile County
According to the poverty data in Mobile County, 17.1% or 1,252 single-father households and 32.8% or 8,275 single-mother households are living below the poverty line. Among single-father households, those with 5 or more children have the highest poverty rate, with 52 households (50.5%) experiencing poverty. Likewise, among single-mother households, those with 5 or more children have the highest poverty rate, with 236 households (73.1%) falling below the poverty line.
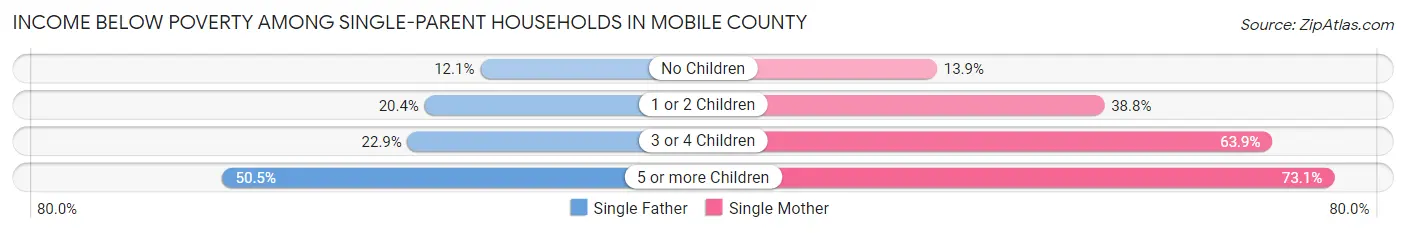
| Children | Single Father | Single Mother |
| No Children | 424 (12.1%) | 1,318 (13.9%) |
| 1 or 2 Children | 654 (20.4%) | 4,871 (38.8%) |
| 3 or 4 Children | 122 (22.9%) | 1,850 (63.9%) |
| 5 or more Children | 52 (50.5%) | 236 (73.1%) |
| Total | 1,252 (17.1%) | 8,275 (32.8%) |
Income Below Poverty Among Married-Couple vs Single-Parent Households in Mobile County
The poverty data for Mobile County shows that 3,216 of the married-couple family households (4.7%) and 9,527 of the single-parent households (29.2%) are living below the poverty level. Within the married-couple family households, those with 5 or more children have the highest poverty rate, with 64 households (19.5%) falling below the poverty line. Among the single-parent households, those with 5 or more children have the highest poverty rate, with 288 household (67.6%) living below poverty.
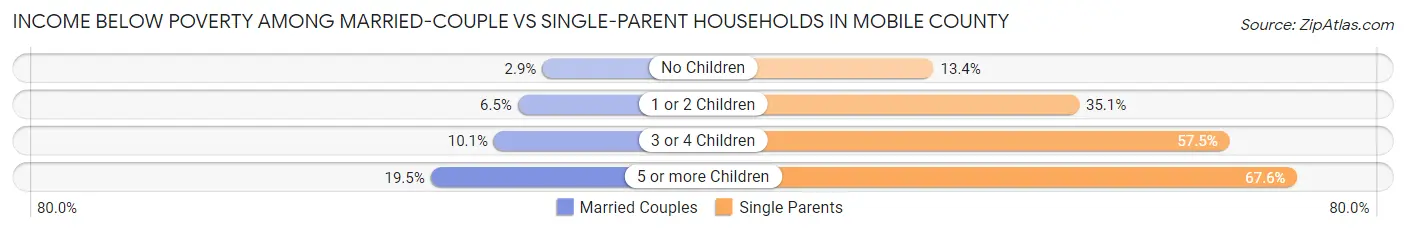
| Children | Married-Couple Families | Single-Parent Households |
| No Children | 1,179 (2.9%) | 1,742 (13.4%) |
| 1 or 2 Children | 1,423 (6.5%) | 5,525 (35.1%) |
| 3 or 4 Children | 550 (10.1%) | 1,972 (57.5%) |
| 5 or more Children | 64 (19.5%) | 288 (67.6%) |
| Total | 3,216 (4.7%) | 9,527 (29.2%) |
Race in Mobile County
The most populous races in Mobile County are White / Caucasian (234,657 | 56.7%), Black / African American (150,071 | 36.3%), and Two or more Races (13,940 | 3.4%).
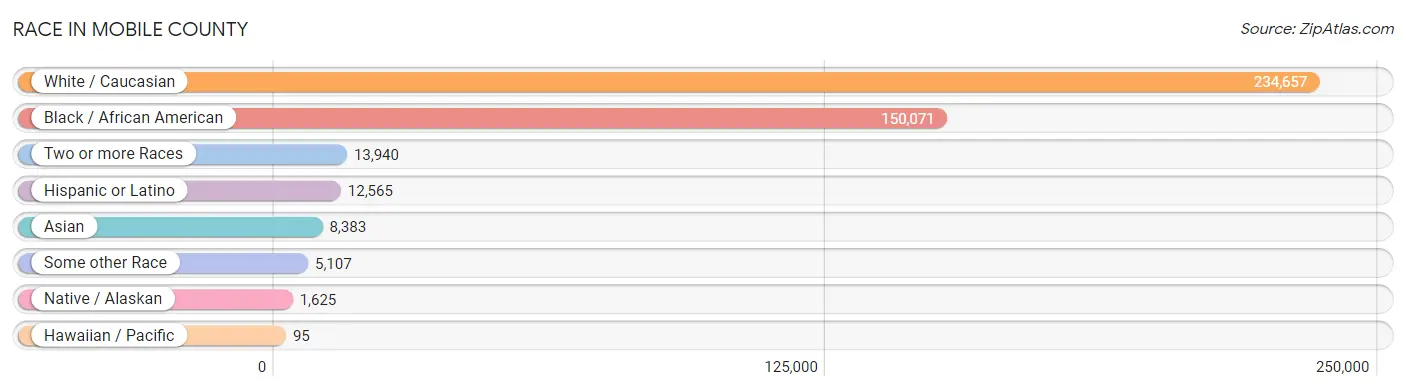
| Race | # Population | % Population |
| Asian | 8,383 | 2.0% |
| Black / African American | 150,071 | 36.3% |
| Hawaiian / Pacific | 95 | 0.0% |
| Hispanic or Latino | 12,565 | 3.0% |
| Native / Alaskan | 1,625 | 0.4% |
| White / Caucasian | 234,657 | 56.7% |
| Two or more Races | 13,940 | 3.4% |
| Some other Race | 5,107 | 1.2% |
| Total | 413,878 | 100.0% |
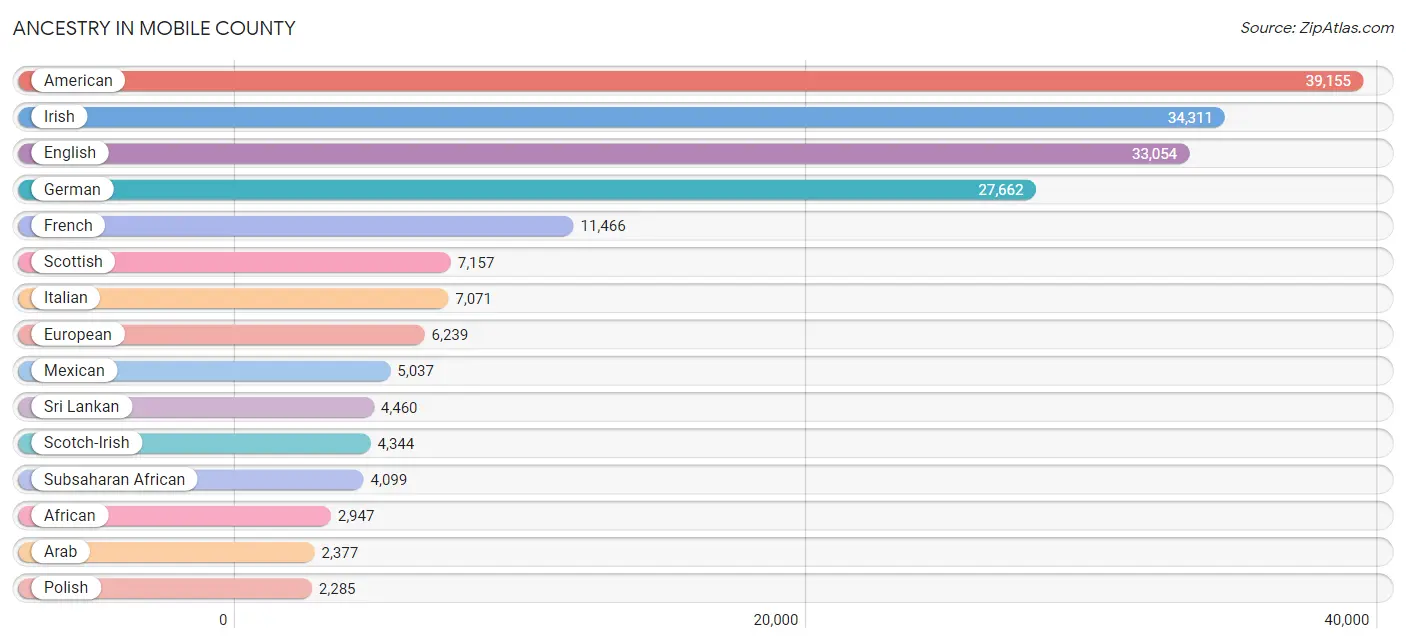
Ancestry in Mobile County
The most populous ancestries reported in Mobile County are American (39,155 | 9.5%), Irish (34,311 | 8.3%), English (33,054 | 8.0%), German (27,662 | 6.7%), and French (11,466 | 2.8%), together accounting for 35.2% of all Mobile County residents.
| Ancestry | # Population | % Population |
| African | 2,947 | 0.7% |
| American | 39,155 | 9.5% |
| Apache | 30 | 0.0% |
| Arab | 2,377 | 0.6% |
| Argentinean | 59 | 0.0% |
| Armenian | 27 | 0.0% |
| Australian | 33 | 0.0% |
| Austrian | 290 | 0.1% |
| Bahamian | 70 | 0.0% |
| Bangladeshi | 24 | 0.0% |
| Belgian | 22 | 0.0% |
| Belizean | 94 | 0.0% |
| Bhutanese | 474 | 0.1% |
| Blackfeet | 55 | 0.0% |
| Brazilian | 56 | 0.0% |
| British | 2,071 | 0.5% |
| British West Indian | 5 | 0.0% |
| Bulgarian | 25 | 0.0% |
| Burmese | 345 | 0.1% |
| Cajun | 184 | 0.0% |
| Canadian | 96 | 0.0% |
| Cape Verdean | 13 | 0.0% |
| Carpatho Rusyn | 12 | 0.0% |
| Celtic | 36 | 0.0% |
| Central American | 2,066 | 0.5% |
| Central American Indian | 159 | 0.0% |
| Cherokee | 1,274 | 0.3% |
| Chickasaw | 42 | 0.0% |
| Chilean | 235 | 0.1% |
| Chinese | 3 | 0.0% |
| Chippewa | 28 | 0.0% |
| Choctaw | 1,737 | 0.4% |
| Colombian | 99 | 0.0% |
| Comanche | 8 | 0.0% |
| Costa Rican | 22 | 0.0% |
| Creek | 530 | 0.1% |
| Croatian | 92 | 0.0% |
| Cuban | 656 | 0.2% |
| Czech | 416 | 0.1% |
| Czechoslovakian | 121 | 0.0% |
| Danish | 580 | 0.1% |
| Dominican | 603 | 0.2% |
| Dutch | 1,564 | 0.4% |
| Dutch West Indian | 9 | 0.0% |
| Eastern European | 314 | 0.1% |
| Ecuadorian | 68 | 0.0% |
| Egyptian | 84 | 0.0% |
| English | 33,054 | 8.0% |
| Estonian | 4 | 0.0% |
| European | 6,239 | 1.5% |
| Filipino | 27 | 0.0% |
| Finnish | 249 | 0.1% |
| French | 11,466 | 2.8% |
| French American Indian | 46 | 0.0% |
| French Canadian | 1,057 | 0.3% |
| German | 27,662 | 6.7% |
| Ghanaian | 10 | 0.0% |
| Greek | 1,627 | 0.4% |
| Guatemalan | 988 | 0.2% |
| Guyanese | 6 | 0.0% |
| Honduran | 294 | 0.1% |
| Houma | 9 | 0.0% |
| Hungarian | 326 | 0.1% |
| Indian (Asian) | 1,440 | 0.4% |
| Iranian | 46 | 0.0% |
| Iraqi | 83 | 0.0% |
| Irish | 34,311 | 8.3% |
| Iroquois | 15 | 0.0% |
| Italian | 7,071 | 1.7% |
| Jamaican | 570 | 0.1% |
| Japanese | 735 | 0.2% |
| Jordanian | 8 | 0.0% |
| Kenyan | 22 | 0.0% |
| Korean | 1,370 | 0.3% |
| Laotian | 61 | 0.0% |
| Lebanese | 732 | 0.2% |
| Lithuanian | 105 | 0.0% |
| Lumbee | 16 | 0.0% |
| Malaysian | 674 | 0.2% |
| Maltese | 10 | 0.0% |
| Mexican | 5,037 | 1.2% |
| Mexican American Indian | 5 | 0.0% |
| Mongolian | 101 | 0.0% |
| Moroccan | 50 | 0.0% |
| Native Hawaiian | 88 | 0.0% |
| Navajo | 33 | 0.0% |
| Nicaraguan | 298 | 0.1% |
| Nigerian | 136 | 0.0% |
| Northern European | 450 | 0.1% |
| Norwegian | 1,703 | 0.4% |
| Ottawa | 29 | 0.0% |
| Pakistani | 222 | 0.1% |
| Palestinian | 542 | 0.1% |
| Panamanian | 132 | 0.0% |
| Paraguayan | 47 | 0.0% |
| Pennsylvania German | 8 | 0.0% |
| Peruvian | 183 | 0.0% |
| Polish | 2,285 | 0.5% |
| Portuguese | 255 | 0.1% |
| Potawatomi | 17 | 0.0% |
| Puerto Rican | 2,210 | 0.5% |
| Romanian | 141 | 0.0% |
| Russian | 679 | 0.2% |
| Salvadoran | 279 | 0.1% |
| Samoan | 53 | 0.0% |
| Scandinavian | 959 | 0.2% |
| Scotch-Irish | 4,344 | 1.1% |
| Scottish | 7,157 | 1.7% |
| Seminole | 1 | 0.0% |
| Senegalese | 199 | 0.1% |
| Serbian | 29 | 0.0% |
| Sioux | 59 | 0.0% |
| Slovak | 161 | 0.0% |
| Slovene | 13 | 0.0% |
| South African | 312 | 0.1% |
| South American | 745 | 0.2% |
| South American Indian | 14 | 0.0% |
| Spaniard | 309 | 0.1% |
| Spanish | 340 | 0.1% |
| Sri Lankan | 4,460 | 1.1% |
| Subsaharan African | 4,099 | 1.0% |
| Swedish | 986 | 0.2% |
| Swiss | 115 | 0.0% |
| Syrian | 251 | 0.1% |
| Thai | 702 | 0.2% |
| Trinidadian and Tobagonian | 86 | 0.0% |
| Turkish | 25 | 0.0% |
| Ukrainian | 216 | 0.1% |
| Venezuelan | 54 | 0.0% |
| Vietnamese | 52 | 0.0% |
| Welsh | 1,875 | 0.4% |
| West Indian | 198 | 0.1% |
| Yugoslavian | 140 | 0.0% |
| Zimbabwean | 7 | 0.0% | View All 134 Rows |
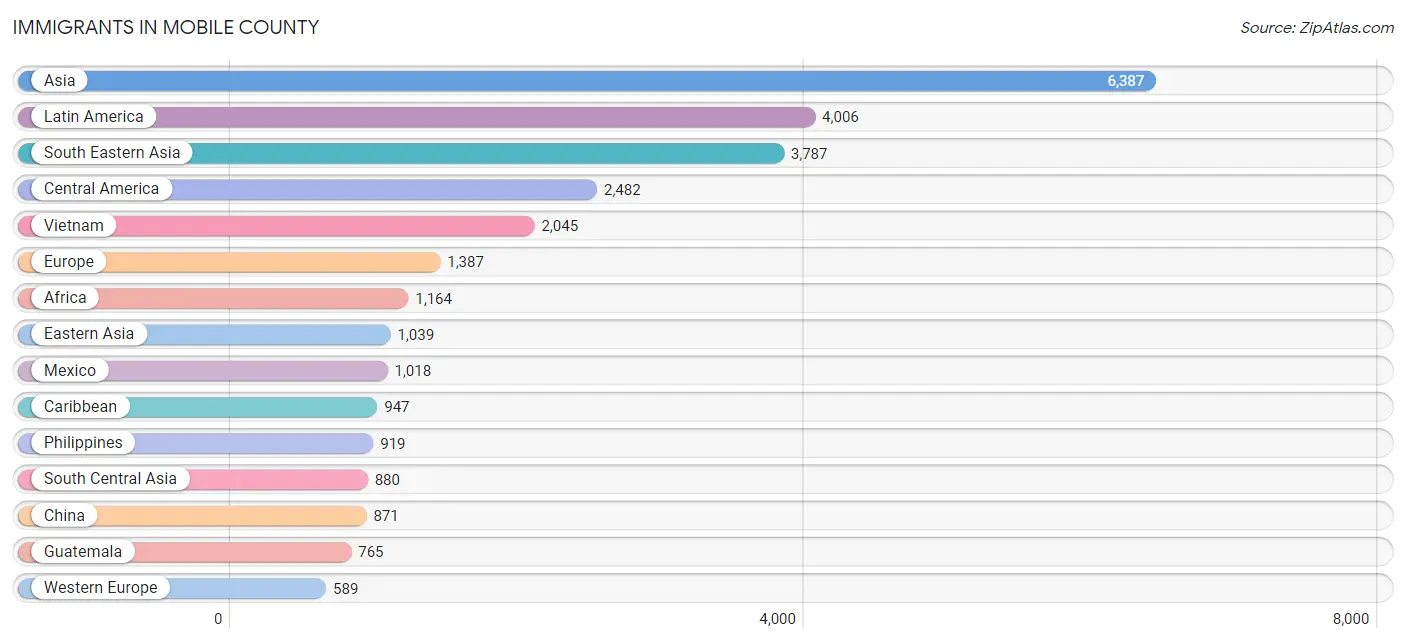
Immigrants in Mobile County
The most numerous immigrant groups reported in Mobile County came from Asia (6,387 | 1.5%), Latin America (4,006 | 1.0%), South Eastern Asia (3,787 | 0.9%), Central America (2,482 | 0.6%), and Vietnam (2,045 | 0.5%), together accounting for 4.5% of all Mobile County residents.
| Immigration Origin | # Population | % Population |
| Africa | 1,164 | 0.3% |
| Argentina | 23 | 0.0% |
| Asia | 6,387 | 1.5% |
| Australia | 43 | 0.0% |
| Austria | 29 | 0.0% |
| Bangladesh | 102 | 0.0% |
| Belize | 26 | 0.0% |
| Bosnia and Herzegovina | 59 | 0.0% |
| Brazil | 61 | 0.0% |
| Cambodia | 251 | 0.1% |
| Canada | 143 | 0.0% |
| Caribbean | 947 | 0.2% |
| Central America | 2,482 | 0.6% |
| Chile | 235 | 0.1% |
| China | 871 | 0.2% |
| Colombia | 107 | 0.0% |
| Congo | 160 | 0.0% |
| Croatia | 16 | 0.0% |
| Cuba | 157 | 0.0% |
| Czechoslovakia | 7 | 0.0% |
| Denmark | 8 | 0.0% |
| Dominican Republic | 346 | 0.1% |
| Eastern Africa | 333 | 0.1% |
| Eastern Asia | 1,039 | 0.3% |
| Eastern Europe | 368 | 0.1% |
| Ecuador | 7 | 0.0% |
| Egypt | 74 | 0.0% |
| El Salvador | 291 | 0.1% |
| England | 184 | 0.0% |
| Ethiopia | 33 | 0.0% |
| Europe | 1,387 | 0.3% |
| Fiji | 14 | 0.0% |
| France | 79 | 0.0% |
| Germany | 435 | 0.1% |
| Greece | 18 | 0.0% |
| Grenada | 7 | 0.0% |
| Guatemala | 765 | 0.2% |
| Haiti | 6 | 0.0% |
| Honduras | 177 | 0.0% |
| Hungary | 13 | 0.0% |
| India | 478 | 0.1% |
| Indonesia | 74 | 0.0% |
| Iran | 41 | 0.0% |
| Iraq | 116 | 0.0% |
| Ireland | 35 | 0.0% |
| Israel | 7 | 0.0% |
| Italy | 21 | 0.0% |
| Jamaica | 311 | 0.1% |
| Japan | 64 | 0.0% |
| Jordan | 47 | 0.0% |
| Kazakhstan | 22 | 0.0% |
| Kenya | 89 | 0.0% |
| Korea | 104 | 0.0% |
| Kuwait | 6 | 0.0% |
| Laos | 182 | 0.0% |
| Latin America | 4,006 | 1.0% |
| Lebanon | 39 | 0.0% |
| Malaysia | 103 | 0.0% |
| Mexico | 1,018 | 0.3% |
| Micronesia | 41 | 0.0% |
| Middle Africa | 393 | 0.1% |
| Moldova | 40 | 0.0% |
| Nepal | 35 | 0.0% |
| Netherlands | 46 | 0.0% |
| Nicaragua | 188 | 0.1% |
| Nigeria | 68 | 0.0% |
| Northern Africa | 148 | 0.0% |
| Northern Europe | 360 | 0.1% |
| Norway | 13 | 0.0% |
| Oceania | 106 | 0.0% |
| Pakistan | 196 | 0.1% |
| Panama | 17 | 0.0% |
| Peru | 53 | 0.0% |
| Philippines | 919 | 0.2% |
| Poland | 15 | 0.0% |
| Portugal | 31 | 0.0% |
| Russia | 22 | 0.0% |
| Saudi Arabia | 6 | 0.0% |
| Senegal | 104 | 0.0% |
| South Africa | 47 | 0.0% |
| South America | 577 | 0.1% |
| South Central Asia | 880 | 0.2% |
| South Eastern Asia | 3,787 | 0.9% |
| Southern Europe | 70 | 0.0% |
| Sri Lanka | 6 | 0.0% |
| Syria | 49 | 0.0% |
| Taiwan | 187 | 0.1% |
| Thailand | 213 | 0.1% |
| Trinidad and Tobago | 32 | 0.0% |
| Turkey | 30 | 0.0% |
| Ukraine | 101 | 0.0% |
| Venezuela | 58 | 0.0% |
| Vietnam | 2,045 | 0.5% |
| West Indies | 49 | 0.0% |
| Western Africa | 181 | 0.0% |
| Western Asia | 339 | 0.1% |
| Western Europe | 589 | 0.1% |
| Zaire | 180 | 0.0% |
| Zimbabwe | 7 | 0.0% | View All 99 Rows |
Sex and Age in Mobile County
Sex and Age in Mobile County
The most populous age groups in Mobile County are 10 to 14 Years (14,408 | 7.2%) for men and 25 to 29 Years (14,916 | 6.9%) for women.
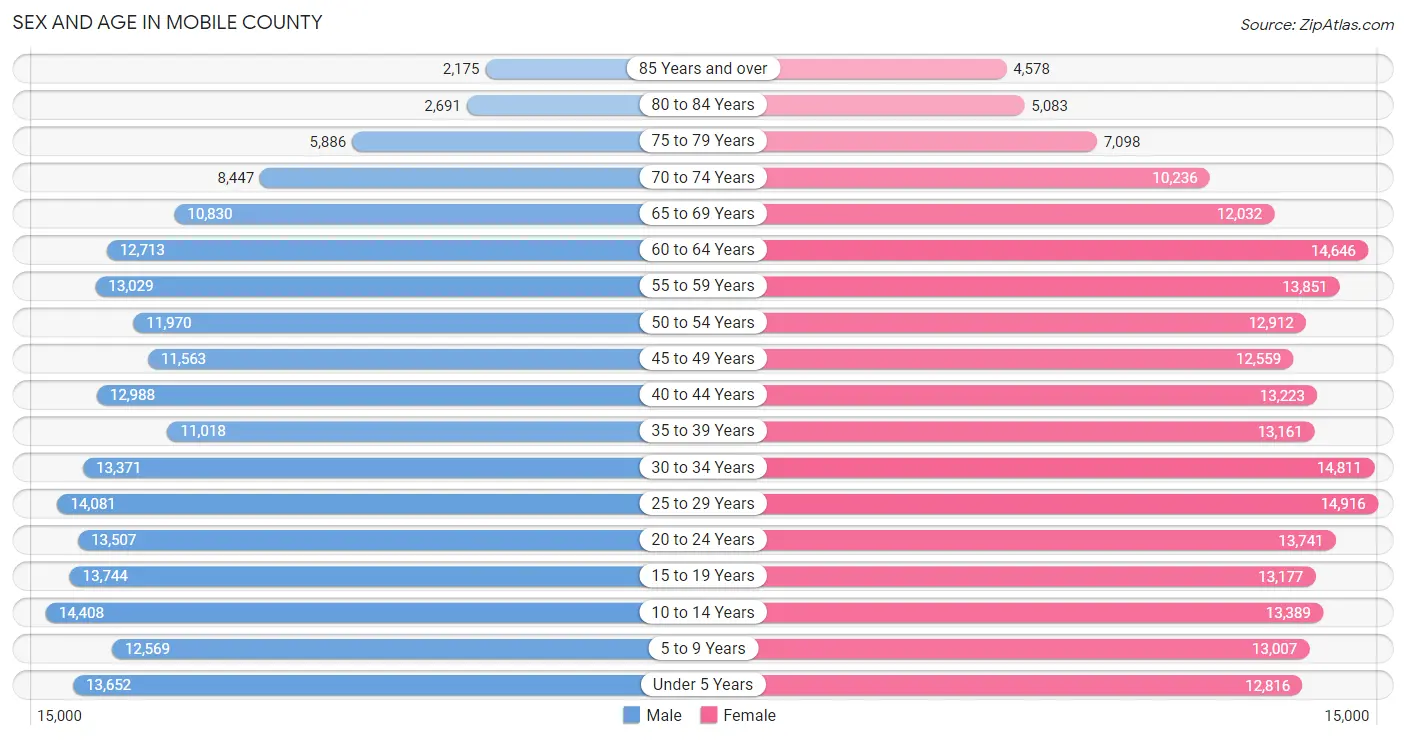
| Age Bracket | Male | Female |
| Under 5 Years | 13,652 (6.9%) | 12,816 (5.9%) |
| 5 to 9 Years | 12,569 (6.3%) | 13,007 (6.0%) |
| 10 to 14 Years | 14,408 (7.2%) | 13,389 (6.2%) |
| 15 to 19 Years | 13,744 (6.9%) | 13,177 (6.1%) |
| 20 to 24 Years | 13,507 (6.8%) | 13,741 (6.4%) |
| 25 to 29 Years | 14,081 (7.1%) | 14,916 (6.9%) |
| 30 to 34 Years | 13,371 (6.7%) | 14,811 (6.9%) |
| 35 to 39 Years | 11,018 (5.6%) | 13,161 (6.1%) |
| 40 to 44 Years | 12,988 (6.5%) | 13,223 (6.1%) |
| 45 to 49 Years | 11,563 (5.8%) | 12,559 (5.8%) |
| 50 to 54 Years | 11,970 (6.0%) | 12,912 (6.0%) |
| 55 to 59 Years | 13,029 (6.6%) | 13,851 (6.4%) |
| 60 to 64 Years | 12,713 (6.4%) | 14,646 (6.8%) |
| 65 to 69 Years | 10,830 (5.4%) | 12,032 (5.6%) |
| 70 to 74 Years | 8,447 (4.3%) | 10,236 (4.8%) |
| 75 to 79 Years | 5,886 (3.0%) | 7,098 (3.3%) |
| 80 to 84 Years | 2,691 (1.3%) | 5,083 (2.4%) |
| 85 Years and over | 2,175 (1.1%) | 4,578 (2.1%) |
| Total | 198,642 (100.0%) | 215,236 (100.0%) |
Families and Households in Mobile County
Median Family Size in Mobile County
The median family size in Mobile County is 3.25 persons per family, with single female/mother families (25,260 | 25.0%) accounting for the largest median family size of 3.5 persons per family. On the other hand, single male/father families (7,345 | 7.3%) represent the smallest median family size with 3.06 persons per family.
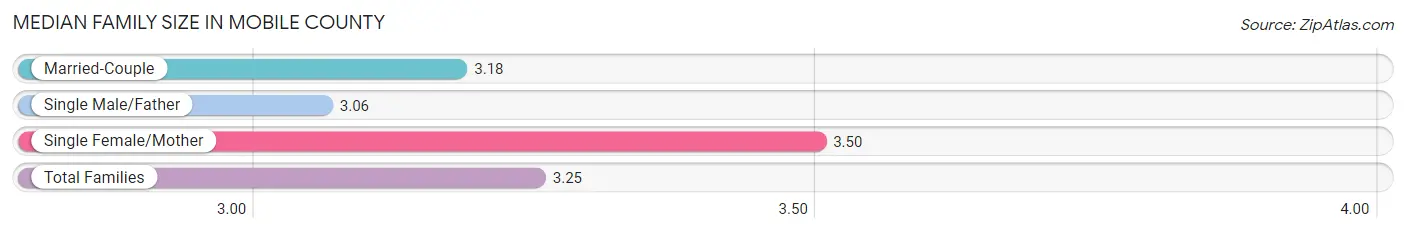
| Family Type | # Families | Family Size |
| Married-Couple | 68,525 (67.8%) | 3.18 |
| Single Male/Father | 7,345 (7.3%) | 3.06 |
| Single Female/Mother | 25,260 (25.0%) | 3.50 |
| Total Families | 101,130 (100.0%) | 3.25 |
Median Household Size in Mobile County
The median household size in Mobile County is 2.54 persons per household, with single female/mother households (25,260 | 15.8%) accounting for the largest median household size of 3.7 persons per household. non-family households (58,475 | 36.6%) represent the smallest median household size with 1.17 persons per household.
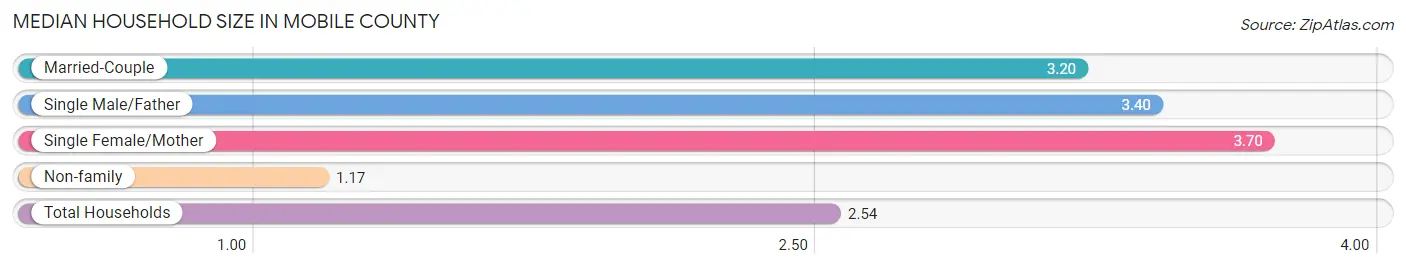
| Household Type | # Households | Household Size |
| Married-Couple | 68,525 (42.9%) | 3.20 |
| Single Male/Father | 7,345 (4.6%) | 3.40 |
| Single Female/Mother | 25,260 (15.8%) | 3.70 |
| Non-family | 58,475 (36.6%) | 1.17 |
| Total Households | 159,605 (100.0%) | 2.54 |
Household Size by Marriage Status in Mobile County
Out of a total of 159,605 households in Mobile County, 101,130 (63.4%) are family households, while 58,475 (36.6%) are nonfamily households. The most numerous type of family households are 2-person households, comprising 45,737, and the most common type of nonfamily households are 1-person households, comprising 51,545.
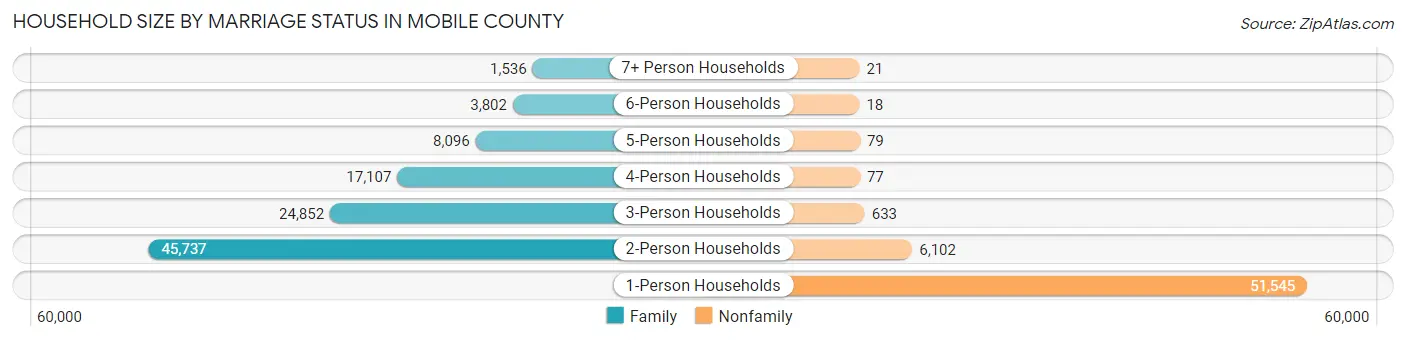
| Household Size | Family Households | Nonfamily Households |
| 1-Person Households | - | 51,545 (32.3%) |
| 2-Person Households | 45,737 (28.7%) | 6,102 (3.8%) |
| 3-Person Households | 24,852 (15.6%) | 633 (0.4%) |
| 4-Person Households | 17,107 (10.7%) | 77 (0.1%) |
| 5-Person Households | 8,096 (5.1%) | 79 (0.1%) |
| 6-Person Households | 3,802 (2.4%) | 18 (0.0%) |
| 7+ Person Households | 1,536 (1.0%) | 21 (0.0%) |
| Total | 101,130 (63.4%) | 58,475 (36.6%) |
Female Fertility in Mobile County
Fertility by Age in Mobile County
Average fertility rate in Mobile County is 60.0 births per 1,000 women. Women in the age bracket of 20 to 34 years have the highest fertility rate with 113.0 births per 1,000 women. Women in the age bracket of 20 to 34 years acount for 83.0% of all women with births.
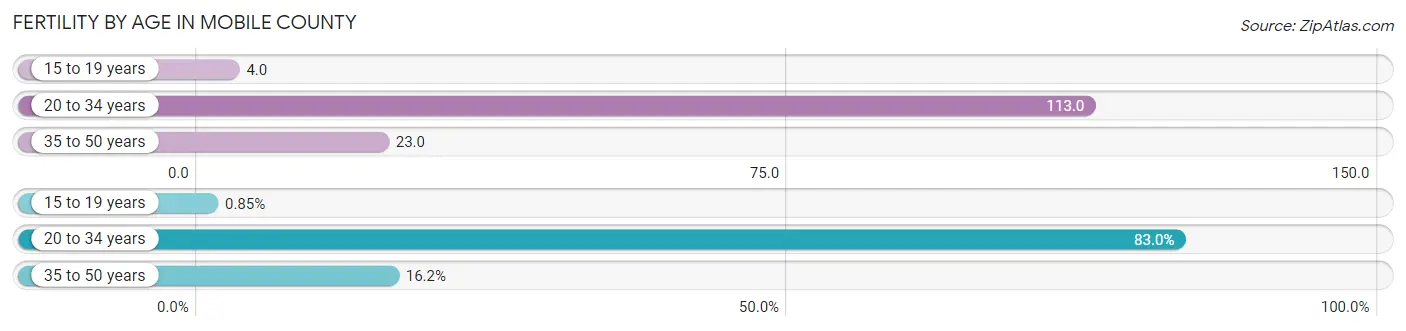
| Age Bracket | Women with Births | Births / 1,000 Women |
| 15 to 19 years | 50 (0.9%) | 4.0 |
| 20 to 34 years | 4,901 (83.0%) | 113.0 |
| 35 to 50 years | 956 (16.2%) | 23.0 |
| Total | 5,907 (100.0%) | 60.0 |
Fertility by Age by Marriage Status in Mobile County
51.3% of women with births (5,907) in Mobile County are married. The highest percentage of unmarried women with births falls into 15 to 19 years age bracket with 64.0% of them unmarried at the time of birth, while the lowest percentage of unmarried women with births belong to 35 to 50 years age bracket with 24.9% of them unmarried.
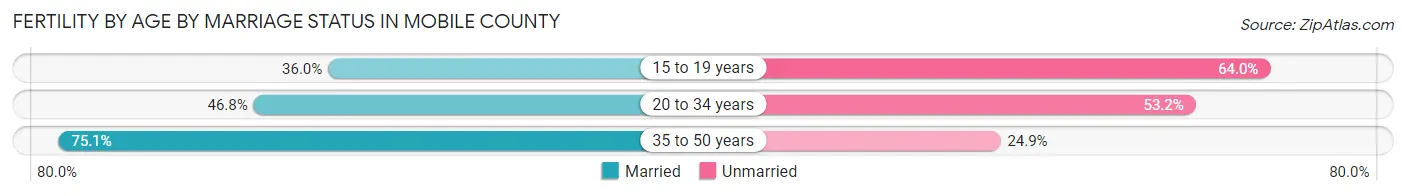
| Age Bracket | Married | Unmarried |
| 15 to 19 years | 18 (36.0%) | 32 (64.0%) |
| 20 to 34 years | 2,294 (46.8%) | 2,607 (53.2%) |
| 35 to 50 years | 718 (75.1%) | 238 (24.9%) |
| Total | 3,030 (51.3%) | 2,877 (48.7%) |
Fertility by Education in Mobile County
Average fertility rate in Mobile County is 60.0 births per 1,000 women. Women with the education attainment of high school diploma have the highest fertility rate of 68.0 births per 1,000 women, while women with the education attainment of bachelor's degree have the lowest fertility at 49.0 births per 1,000 women. Women with the education attainment of college or associate's degree represent 36.0% of all women with births.
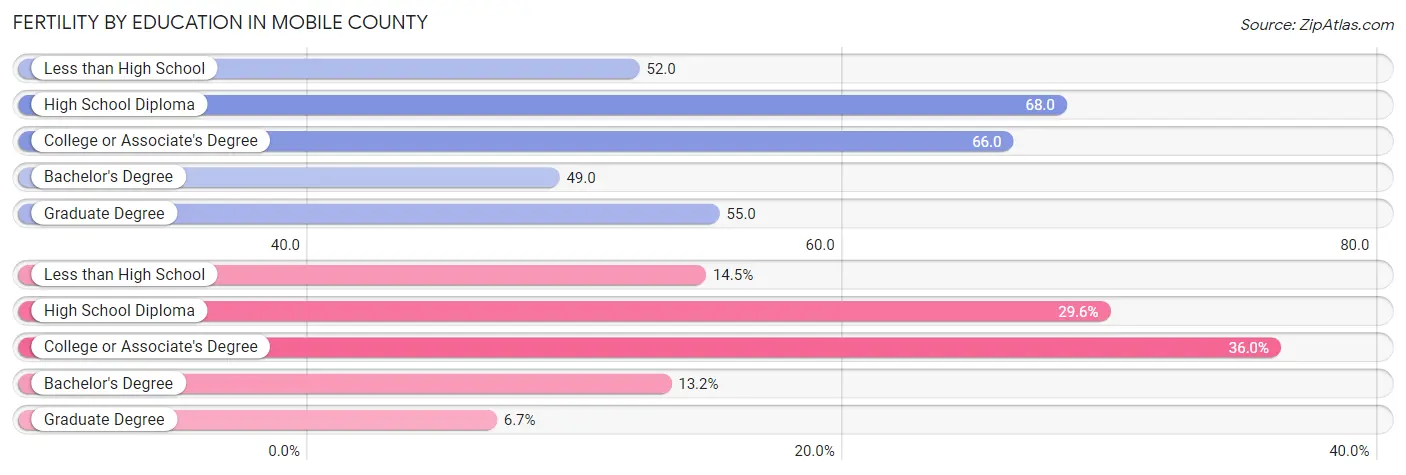
| Educational Attainment | Women with Births | Births / 1,000 Women |
| Less than High School | 856 (14.5%) | 52.0 |
| High School Diploma | 1,751 (29.6%) | 68.0 |
| College or Associate's Degree | 2,128 (36.0%) | 66.0 |
| Bachelor's Degree | 779 (13.2%) | 49.0 |
| Graduate Degree | 393 (6.7%) | 55.0 |
| Total | 5,907 (100.0%) | 60.0 |
Fertility by Education by Marriage Status in Mobile County
48.7% of women with births in Mobile County are unmarried. Women with the educational attainment of bachelor's degree are most likely to be married with 87.2% of them married at childbirth, while women with the educational attainment of high school diploma are least likely to be married with 70.6% of them unmarried at childbirth.
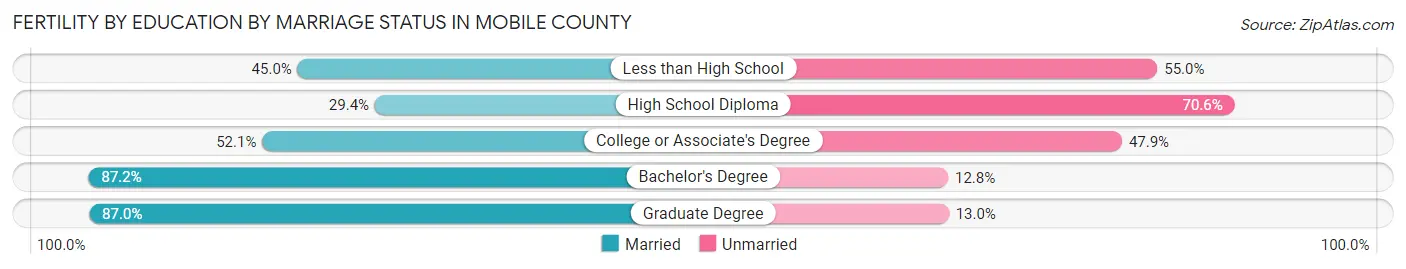
| Educational Attainment | Married | Unmarried |
| Less than High School | 385 (45.0%) | 471 (55.0%) |
| High School Diploma | 515 (29.4%) | 1,236 (70.6%) |
| College or Associate's Degree | 1,109 (52.1%) | 1,019 (47.9%) |
| Bachelor's Degree | 679 (87.2%) | 100 (12.8%) |
| Graduate Degree | 342 (87.0%) | 51 (13.0%) |
| Total | 3,030 (51.3%) | 2,877 (48.7%) |
Employment Characteristics in Mobile County
Employment by Class of Employer in Mobile County
Among the 173,909 employed individuals in Mobile County, private company employees (120,291 | 69.2%), local government employees (12,356 | 7.1%), and not-for-profit organizations (12,213 | 7.0%) make up the most common classes of employment.
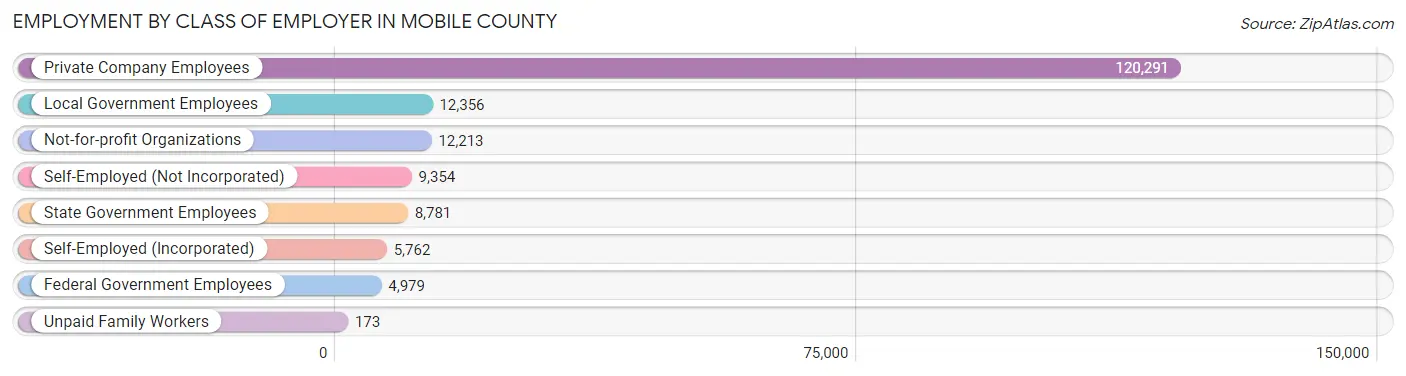
| Employer Class | # Employees | % Employees |
| Private Company Employees | 120,291 | 69.2% |
| Self-Employed (Incorporated) | 5,762 | 3.3% |
| Self-Employed (Not Incorporated) | 9,354 | 5.4% |
| Not-for-profit Organizations | 12,213 | 7.0% |
| Local Government Employees | 12,356 | 7.1% |
| State Government Employees | 8,781 | 5.1% |
| Federal Government Employees | 4,979 | 2.9% |
| Unpaid Family Workers | 173 | 0.1% |
| Total | 173,909 | 100.0% |
Employment Status by Age in Mobile County
According to the labor force statistics for Mobile County, out of the total population over 16 years of age (328,379), 57.4% or 188,490 individuals are in the labor force, with 5.9% or 11,121 of them unemployed. The age group with the highest labor force participation rate is 35 to 44 years, with 79.4% or 40,010 individuals in the labor force. Within the labor force, the 16 to 19 years age range has the highest percentage of unemployed individuals, with 14.6% or 1,006 of them being unemployed.
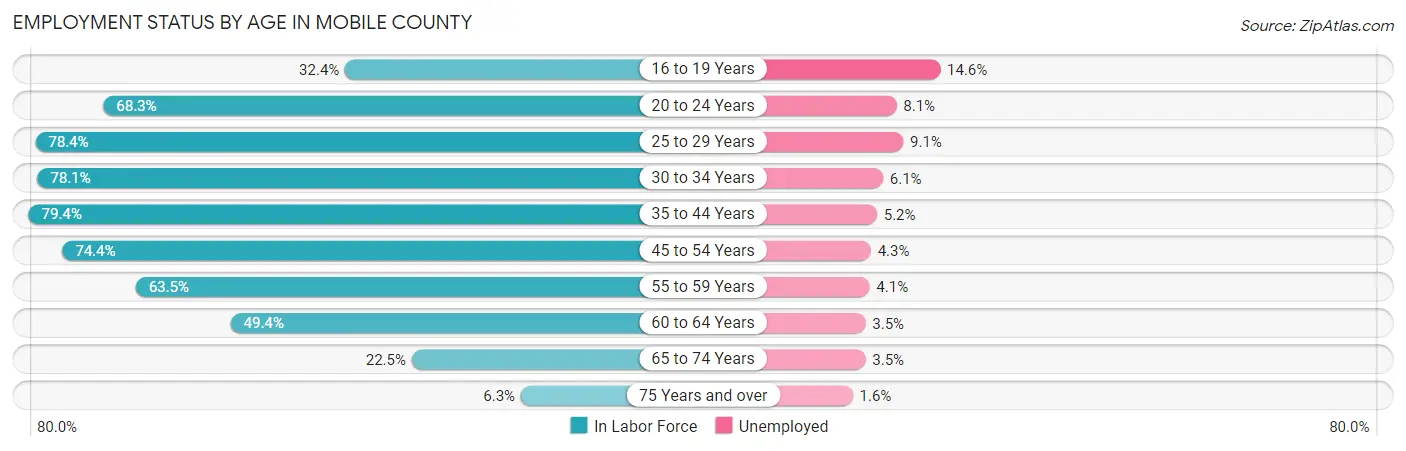
| Age Bracket | In Labor Force | Unemployed |
| 16 to 19 Years | 6,889 (32.4%) | 1,006 (14.6%) |
| 20 to 24 Years | 18,610 (68.3%) | 1,507 (8.1%) |
| 25 to 29 Years | 22,734 (78.4%) | 2,069 (9.1%) |
| 30 to 34 Years | 22,010 (78.1%) | 1,343 (6.1%) |
| 35 to 44 Years | 40,010 (79.4%) | 2,081 (5.2%) |
| 45 to 54 Years | 36,459 (74.4%) | 1,568 (4.3%) |
| 55 to 59 Years | 17,069 (63.5%) | 700 (4.1%) |
| 60 to 64 Years | 13,515 (49.4%) | 473 (3.5%) |
| 65 to 74 Years | 9,348 (22.5%) | 327 (3.5%) |
| 75 Years and over | 1,733 (6.3%) | 28 (1.6%) |
| Total | 188,490 (57.4%) | 11,121 (5.9%) |
Employment Status by Educational Attainment in Mobile County
According to labor force statistics for Mobile County, 72.0% of individuals (151,785) out of the total population between 25 and 64 years of age (210,812) are in the labor force, with 5.4% or 8,196 of them being unemployed. The group with the highest labor force participation rate are those with the educational attainment of bachelor's degree or higher, with 86.0% or 44,895 individuals in the labor force. Within the labor force, individuals with less than high school education have the highest percentage of unemployment, with 15.7% or 1,909 of them being unemployed.
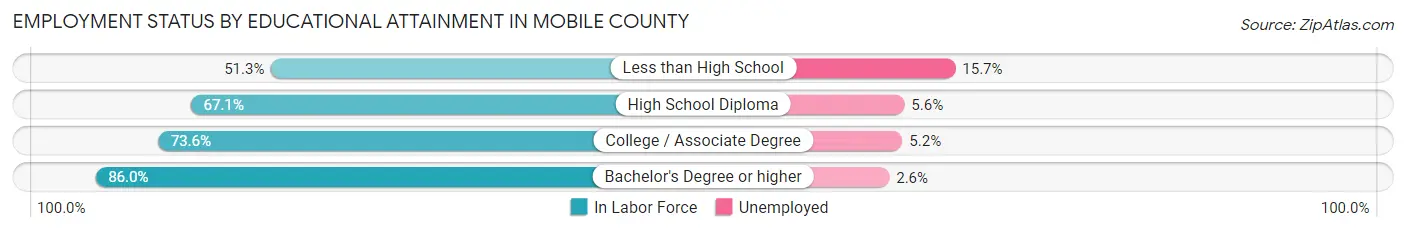
| Educational Attainment | In Labor Force | Unemployed |
| Less than High School | 12,159 (51.3%) | 3,721 (15.7%) |
| High School Diploma | 47,065 (67.1%) | 3,928 (5.6%) |
| College / Associate Degree | 47,668 (73.6%) | 3,368 (5.2%) |
| Bachelor's Degree or higher | 44,895 (86.0%) | 1,357 (2.6%) |
| Total | 151,785 (72.0%) | 11,384 (5.4%) |
Employment Occupations by Sex in Mobile County
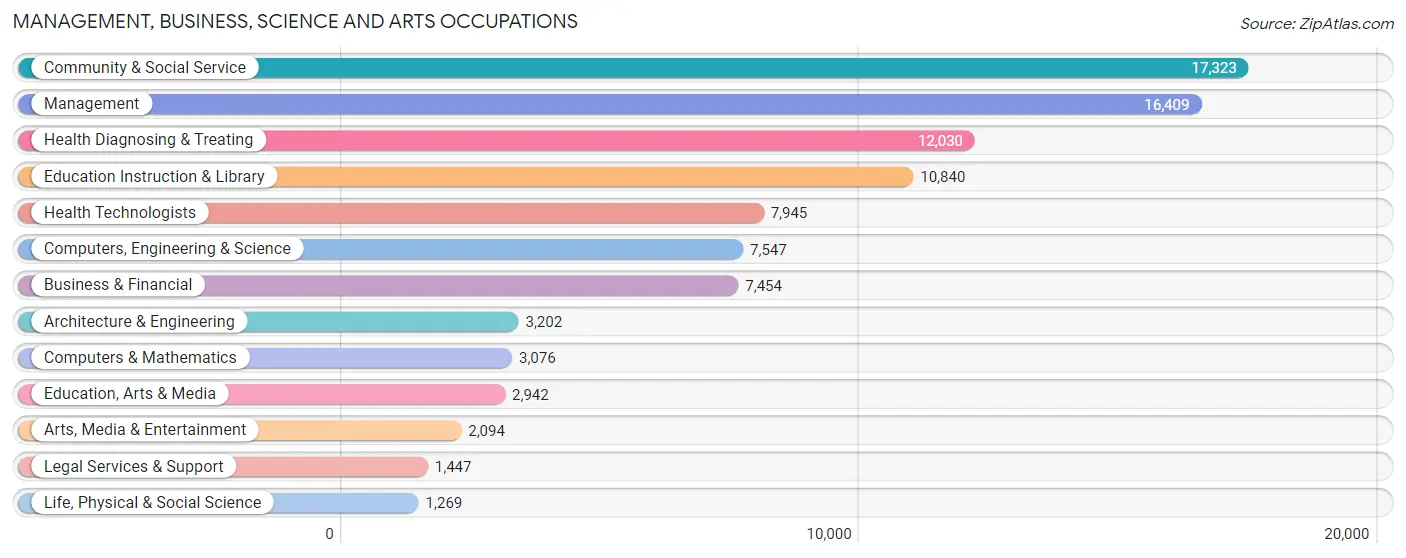
Management, Business, Science and Arts Occupations
The most common Management, Business, Science and Arts occupations in Mobile County are Community & Social Service (17,323 | 9.8%), Management (16,409 | 9.3%), Health Diagnosing & Treating (12,030 | 6.8%), Education Instruction & Library (10,840 | 6.1%), and Health Technologists (7,945 | 4.5%).
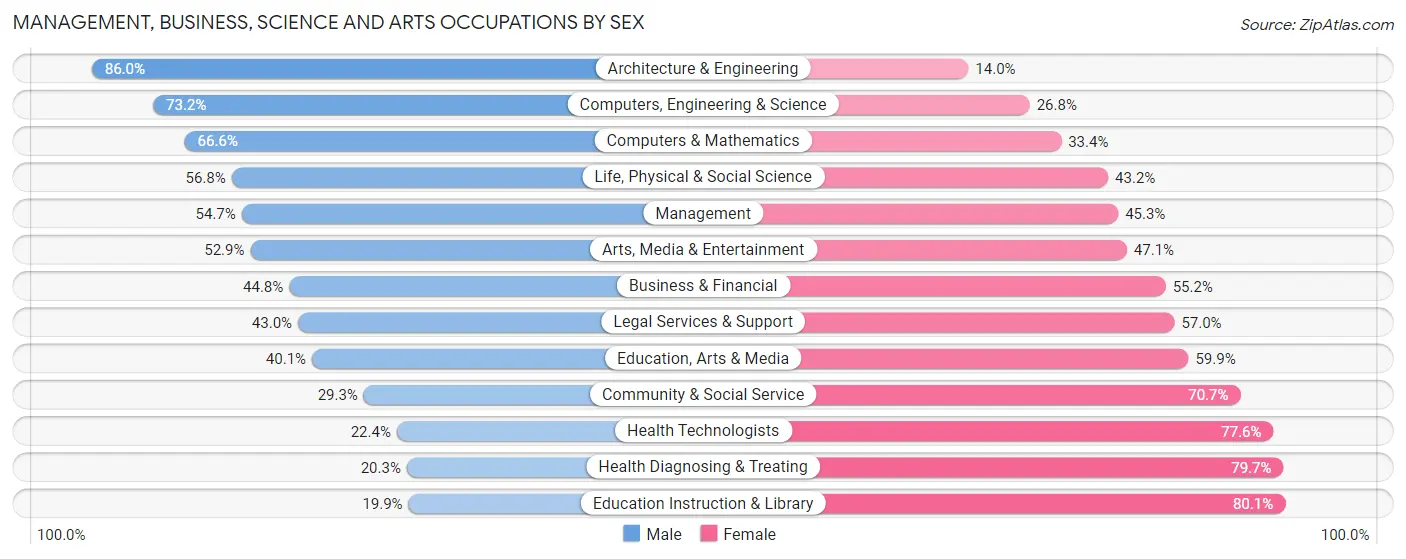
Management, Business, Science and Arts Occupations by Sex
Within the Management, Business, Science and Arts occupations in Mobile County, the most male-oriented occupations are Architecture & Engineering (86.0%), Computers, Engineering & Science (73.2%), and Computers & Mathematics (66.6%), while the most female-oriented occupations are Education Instruction & Library (80.1%), Health Diagnosing & Treating (79.7%), and Health Technologists (77.6%).
| Occupation | Male | Female |
| Management | 8,980 (54.7%) | 7,429 (45.3%) |
| Business & Financial | 3,341 (44.8%) | 4,113 (55.2%) |
| Computers, Engineering & Science | 5,523 (73.2%) | 2,024 (26.8%) |
| Computers & Mathematics | 2,049 (66.6%) | 1,027 (33.4%) |
| Architecture & Engineering | 2,753 (86.0%) | 449 (14.0%) |
| Life, Physical & Social Science | 721 (56.8%) | 548 (43.2%) |
| Community & Social Service | 5,069 (29.3%) | 12,254 (70.7%) |
| Education, Arts & Media | 1,179 (40.1%) | 1,763 (59.9%) |
| Legal Services & Support | 622 (43.0%) | 825 (57.0%) |
| Education Instruction & Library | 2,160 (19.9%) | 8,680 (80.1%) |
| Arts, Media & Entertainment | 1,108 (52.9%) | 986 (47.1%) |
| Health Diagnosing & Treating | 2,441 (20.3%) | 9,589 (79.7%) |
| Health Technologists | 1,777 (22.4%) | 6,168 (77.6%) |
| Total (Category) | 25,354 (41.7%) | 35,409 (58.3%) |
| Total (Overall) | 90,633 (51.4%) | 85,656 (48.6%) |
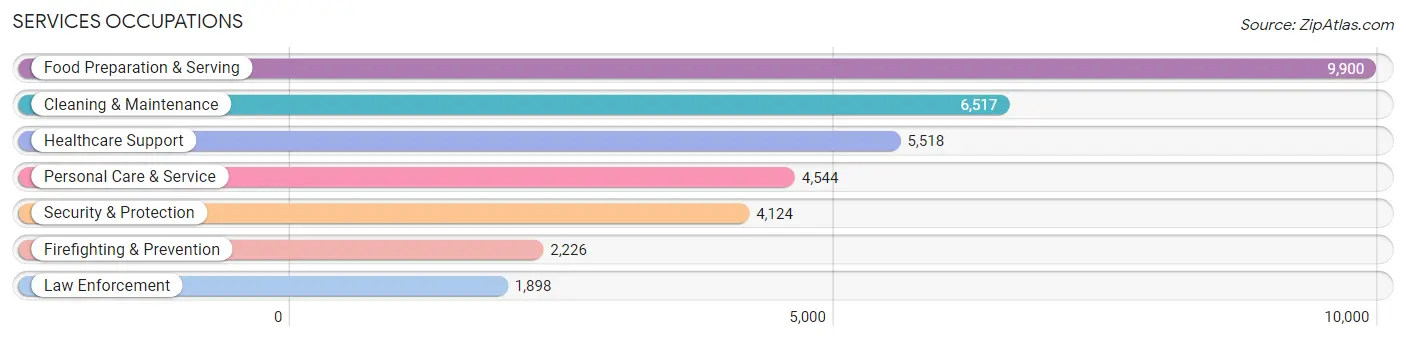
Services Occupations
The most common Services occupations in Mobile County are Food Preparation & Serving (9,900 | 5.6%), Cleaning & Maintenance (6,517 | 3.7%), Healthcare Support (5,518 | 3.1%), Personal Care & Service (4,544 | 2.6%), and Security & Protection (4,124 | 2.3%).
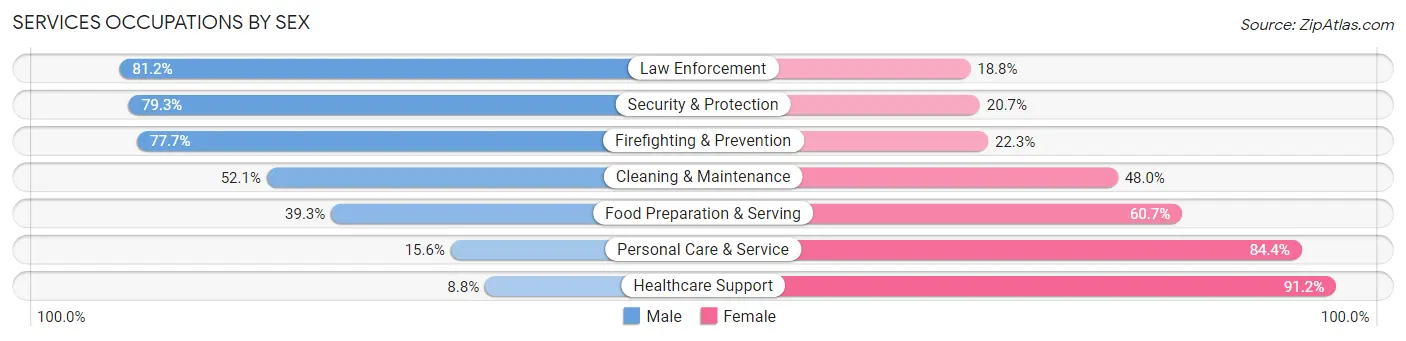
Services Occupations by Sex
Within the Services occupations in Mobile County, the most male-oriented occupations are Law Enforcement (81.2%), Security & Protection (79.3%), and Firefighting & Prevention (77.7%), while the most female-oriented occupations are Healthcare Support (91.2%), Personal Care & Service (84.4%), and Food Preparation & Serving (60.7%).
| Occupation | Male | Female |
| Healthcare Support | 487 (8.8%) | 5,031 (91.2%) |
| Security & Protection | 3,272 (79.3%) | 852 (20.7%) |
| Firefighting & Prevention | 1,730 (77.7%) | 496 (22.3%) |
| Law Enforcement | 1,542 (81.2%) | 356 (18.8%) |
| Food Preparation & Serving | 3,892 (39.3%) | 6,008 (60.7%) |
| Cleaning & Maintenance | 3,392 (52.0%) | 3,125 (47.9%) |
| Personal Care & Service | 710 (15.6%) | 3,834 (84.4%) |
| Total (Category) | 11,753 (38.4%) | 18,850 (61.6%) |
| Total (Overall) | 90,633 (51.4%) | 85,656 (48.6%) |
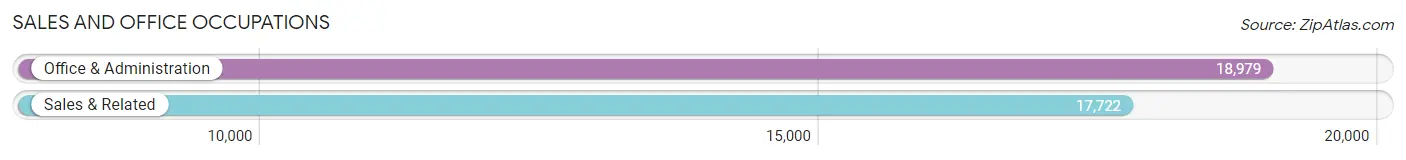
Sales and Office Occupations
The most common Sales and Office occupations in Mobile County are Office & Administration (18,979 | 10.8%), and Sales & Related (17,722 | 10.1%).
Sales and Office Occupations by Sex
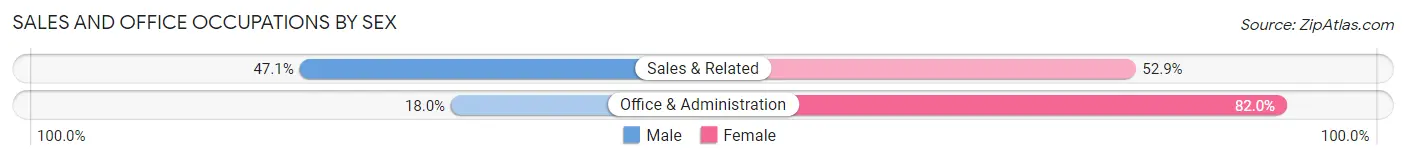
| Occupation | Male | Female |
| Sales & Related | 8,355 (47.1%) | 9,367 (52.9%) |
| Office & Administration | 3,418 (18.0%) | 15,561 (82.0%) |
| Total (Category) | 11,773 (32.1%) | 24,928 (67.9%) |
| Total (Overall) | 90,633 (51.4%) | 85,656 (48.6%) |
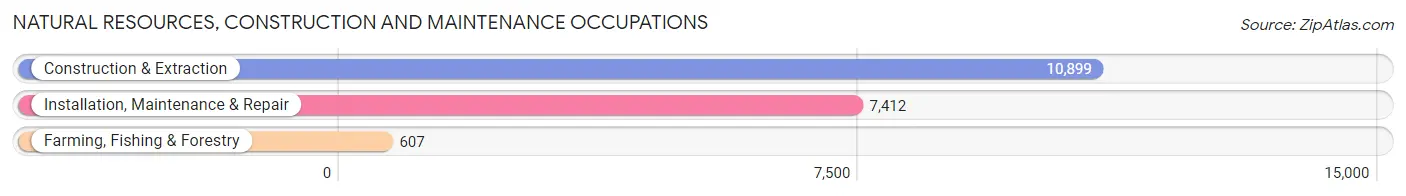
Natural Resources, Construction and Maintenance Occupations
The most common Natural Resources, Construction and Maintenance occupations in Mobile County are Construction & Extraction (10,899 | 6.2%), Installation, Maintenance & Repair (7,412 | 4.2%), and Farming, Fishing & Forestry (607 | 0.3%).
Natural Resources, Construction and Maintenance Occupations by Sex
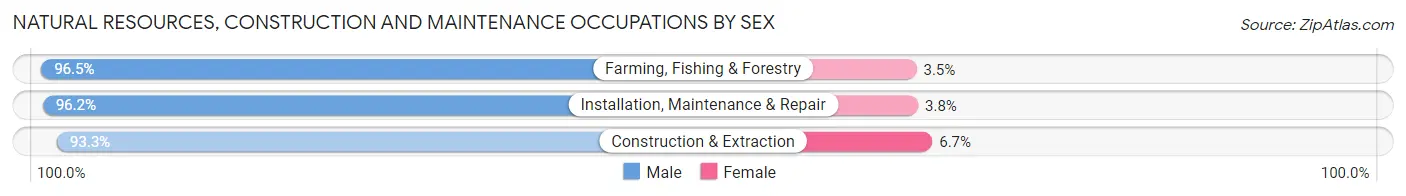
| Occupation | Male | Female |
| Farming, Fishing & Forestry | 586 (96.5%) | 21 (3.5%) |
| Construction & Extraction | 10,165 (93.3%) | 734 (6.7%) |
| Installation, Maintenance & Repair | 7,132 (96.2%) | 280 (3.8%) |
| Total (Category) | 17,883 (94.5%) | 1,035 (5.5%) |
| Total (Overall) | 90,633 (51.4%) | 85,656 (48.6%) |
Production, Transportation and Moving Occupations
The most common Production, Transportation and Moving occupations in Mobile County are Production (12,893 | 7.3%), Material Moving (8,363 | 4.7%), and Transportation (8,048 | 4.6%).
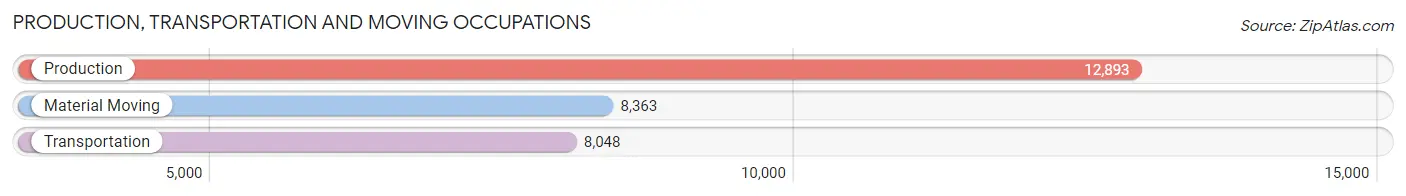
Production, Transportation and Moving Occupations by Sex
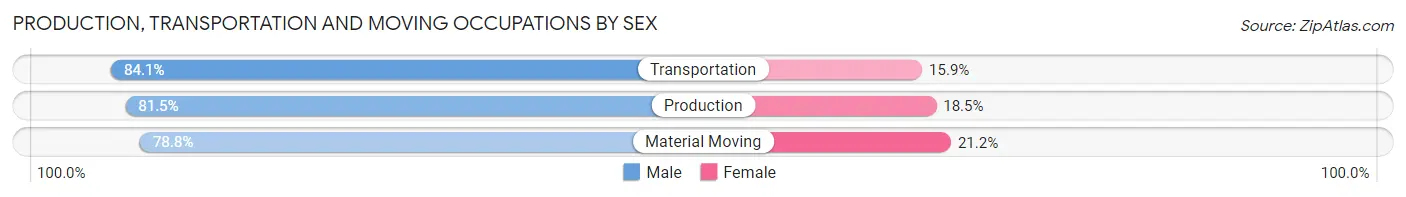
| Occupation | Male | Female |
| Production | 10,509 (81.5%) | 2,384 (18.5%) |
| Transportation | 6,769 (84.1%) | 1,279 (15.9%) |
| Material Moving | 6,592 (78.8%) | 1,771 (21.2%) |
| Total (Category) | 23,870 (81.5%) | 5,434 (18.5%) |
| Total (Overall) | 90,633 (51.4%) | 85,656 (48.6%) |
Employment Industries by Sex in Mobile County
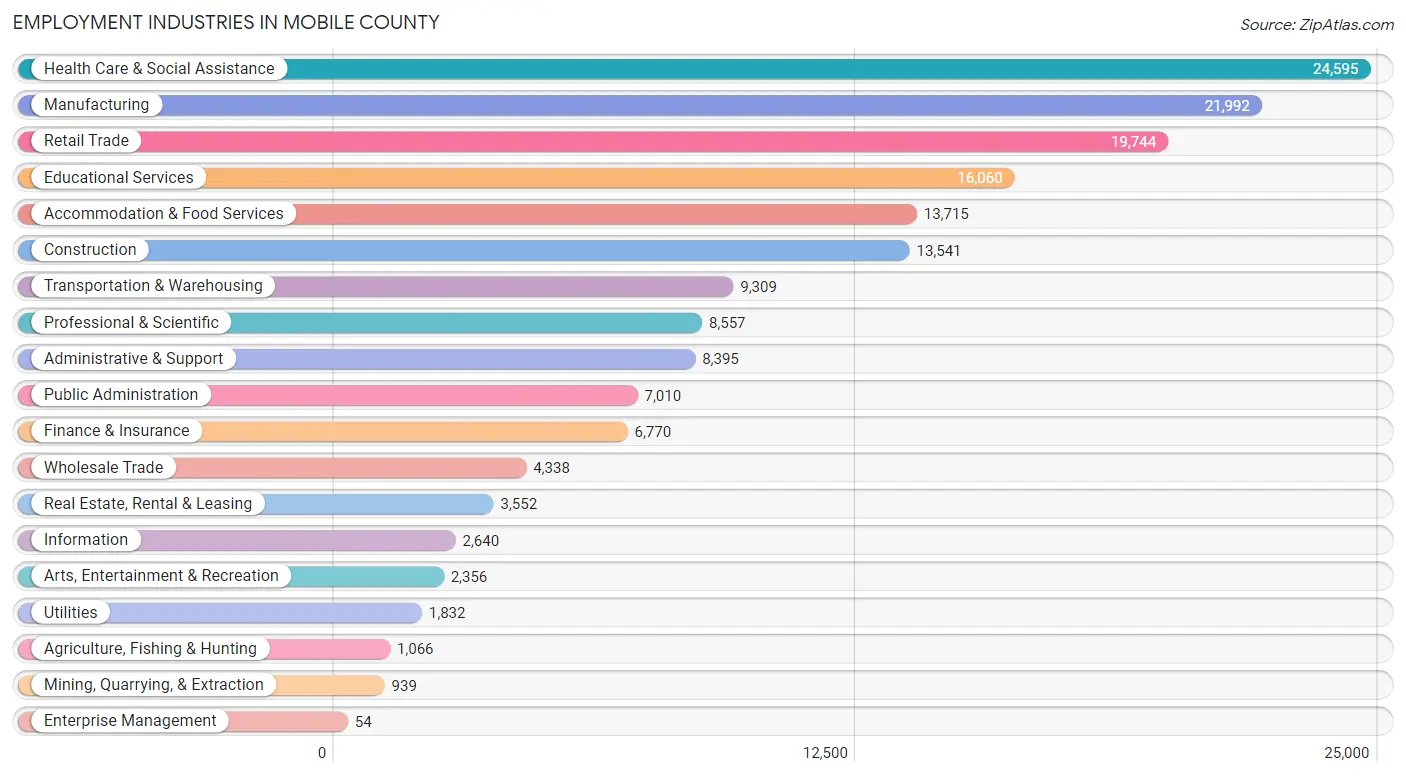
Employment Industries in Mobile County
The major employment industries in Mobile County include Health Care & Social Assistance (24,595 | 14.0%), Manufacturing (21,992 | 12.5%), Retail Trade (19,744 | 11.2%), Educational Services (16,060 | 9.1%), and Accommodation & Food Services (13,715 | 7.8%).
Employment Industries by Sex in Mobile County
The Mobile County industries that see more men than women are Mining, Quarrying, & Extraction (91.2%), Construction (87.5%), and Utilities (78.8%), whereas the industries that tend to have a higher number of women are Health Care & Social Assistance (80.9%), Educational Services (74.8%), and Finance & Insurance (65.8%).
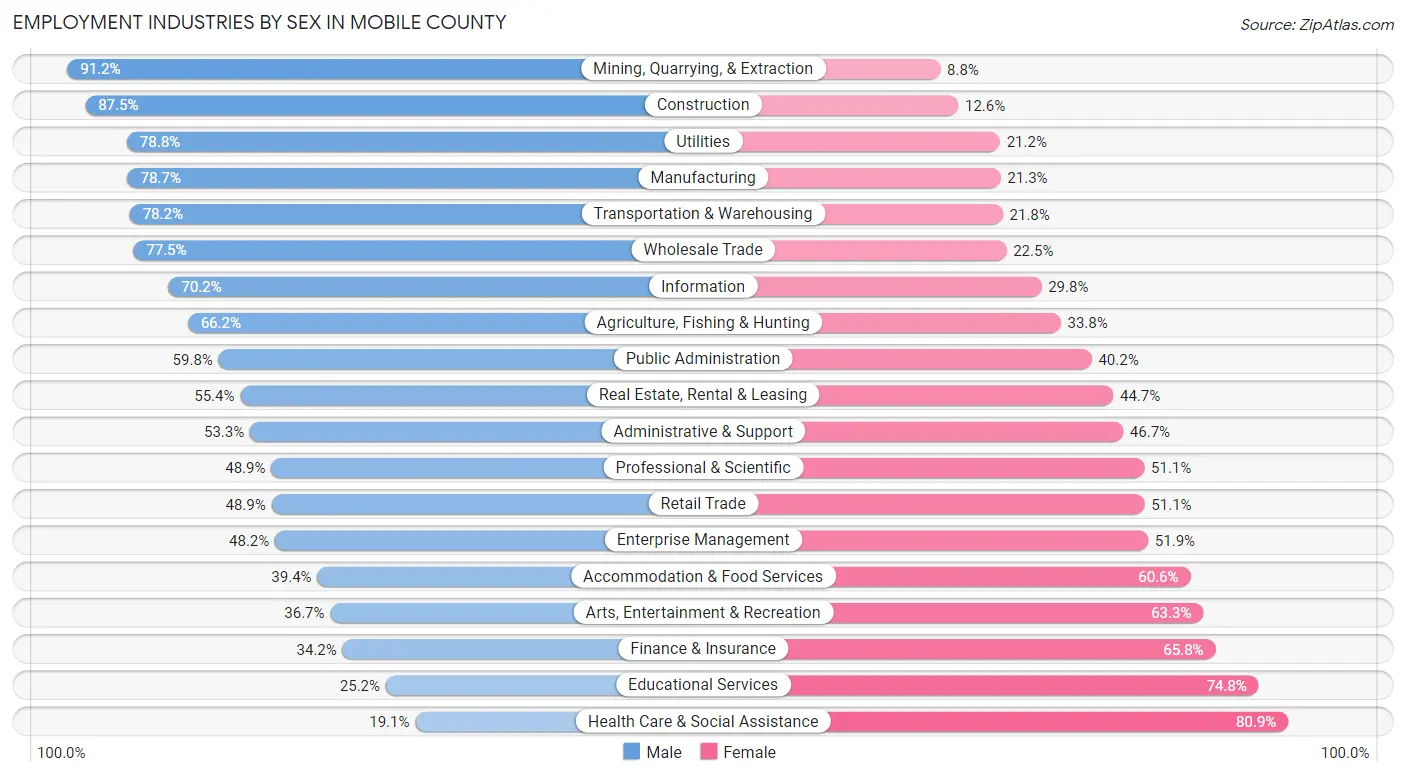
| Industry | Male | Female |
| Agriculture, Fishing & Hunting | 706 (66.2%) | 360 (33.8%) |
| Mining, Quarrying, & Extraction | 856 (91.2%) | 83 (8.8%) |
| Construction | 11,841 (87.5%) | 1,700 (12.6%) |
| Manufacturing | 17,303 (78.7%) | 4,689 (21.3%) |
| Wholesale Trade | 3,361 (77.5%) | 977 (22.5%) |
| Retail Trade | 9,650 (48.9%) | 10,094 (51.1%) |
| Transportation & Warehousing | 7,282 (78.2%) | 2,027 (21.8%) |
| Utilities | 1,444 (78.8%) | 388 (21.2%) |
| Information | 1,854 (70.2%) | 786 (29.8%) |
| Finance & Insurance | 2,314 (34.2%) | 4,456 (65.8%) |
| Real Estate, Rental & Leasing | 1,966 (55.3%) | 1,586 (44.7%) |
| Professional & Scientific | 4,188 (48.9%) | 4,369 (51.1%) |
| Enterprise Management | 26 (48.1%) | 28 (51.8%) |
| Administrative & Support | 4,477 (53.3%) | 3,918 (46.7%) |
| Educational Services | 4,052 (25.2%) | 12,008 (74.8%) |
| Health Care & Social Assistance | 4,705 (19.1%) | 19,890 (80.9%) |
| Arts, Entertainment & Recreation | 865 (36.7%) | 1,491 (63.3%) |
| Accommodation & Food Services | 5,402 (39.4%) | 8,313 (60.6%) |
| Public Administration | 4,194 (59.8%) | 2,816 (40.2%) |
| Total | 90,633 (51.4%) | 85,656 (48.6%) |
Education in Mobile County
School Enrollment in Mobile County
The most common levels of schooling among the 95,944 students in Mobile County are high school (21,603 | 22.5%), middle school (21,254 | 22.2%), and elementary school (20,326 | 21.2%).
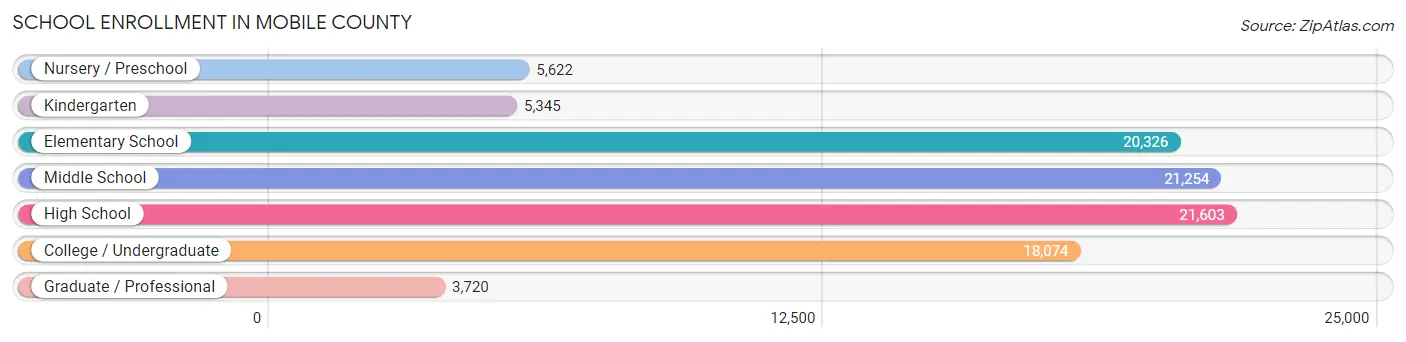
| School Level | # Students | % Students |
| Nursery / Preschool | 5,622 | 5.9% |
| Kindergarten | 5,345 | 5.6% |
| Elementary School | 20,326 | 21.2% |
| Middle School | 21,254 | 22.2% |
| High School | 21,603 | 22.5% |
| College / Undergraduate | 18,074 | 18.8% |
| Graduate / Professional | 3,720 | 3.9% |
| Total | 95,944 | 100.0% |
School Enrollment by Age by Funding Source in Mobile County
Out of a total of 95,944 students who are enrolled in schools in Mobile County, 18,517 (19.3%) attend a private institution, while the remaining 77,427 (80.7%) are enrolled in public schools. The age group of 3 to 4 year olds has the highest likelihood of being enrolled in private schools, with 1,789 (38.1% in the age bracket) enrolled. Conversely, the age group of 5 to 9 year old has the lowest likelihood of being enrolled in a private school, with 19,838 (83.6% in the age bracket) attending a public institution.
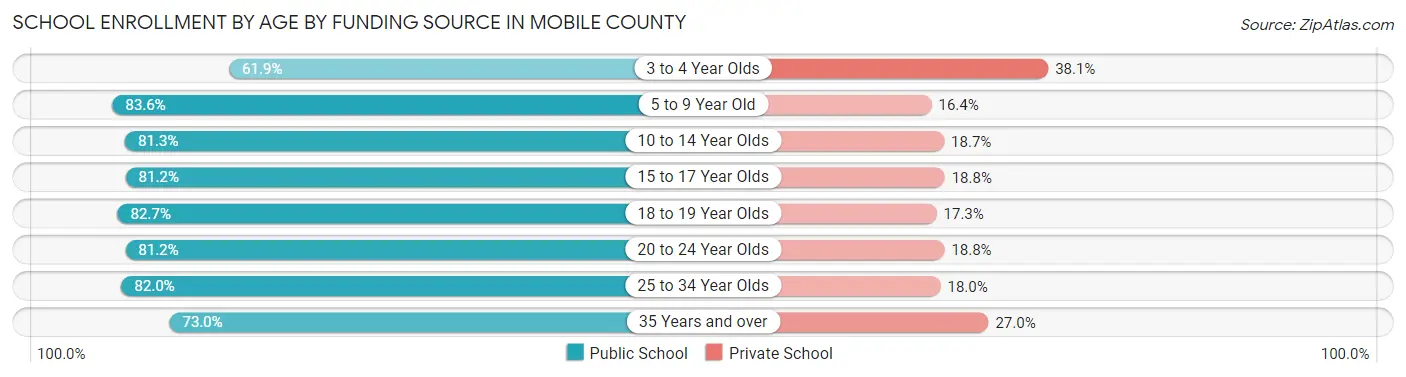
| Age Bracket | Public School | Private School |
| 3 to 4 Year Olds | 2,907 (61.9%) | 1,789 (38.1%) |
| 5 to 9 Year Old | 19,838 (83.6%) | 3,881 (16.4%) |
| 10 to 14 Year Olds | 22,031 (81.3%) | 5,073 (18.7%) |
| 15 to 17 Year Olds | 12,529 (81.2%) | 2,904 (18.8%) |
| 18 to 19 Year Olds | 5,978 (82.7%) | 1,251 (17.3%) |
| 20 to 24 Year Olds | 7,976 (81.2%) | 1,843 (18.8%) |
| 25 to 34 Year Olds | 3,381 (82.0%) | 744 (18.0%) |
| 35 Years and over | 2,789 (73.0%) | 1,030 (27.0%) |
| Total | 77,427 (80.7%) | 18,517 (19.3%) |
Educational Attainment by Field of Study in Mobile County
Business (16,313 | 22.7%), education (11,497 | 16.0%), science & technology (8,514 | 11.8%), arts & humanities (5,138 | 7.1%), and engineering (4,924 | 6.9%) are the most common fields of study among 71,842 individuals in Mobile County who have obtained a bachelor's degree or higher.
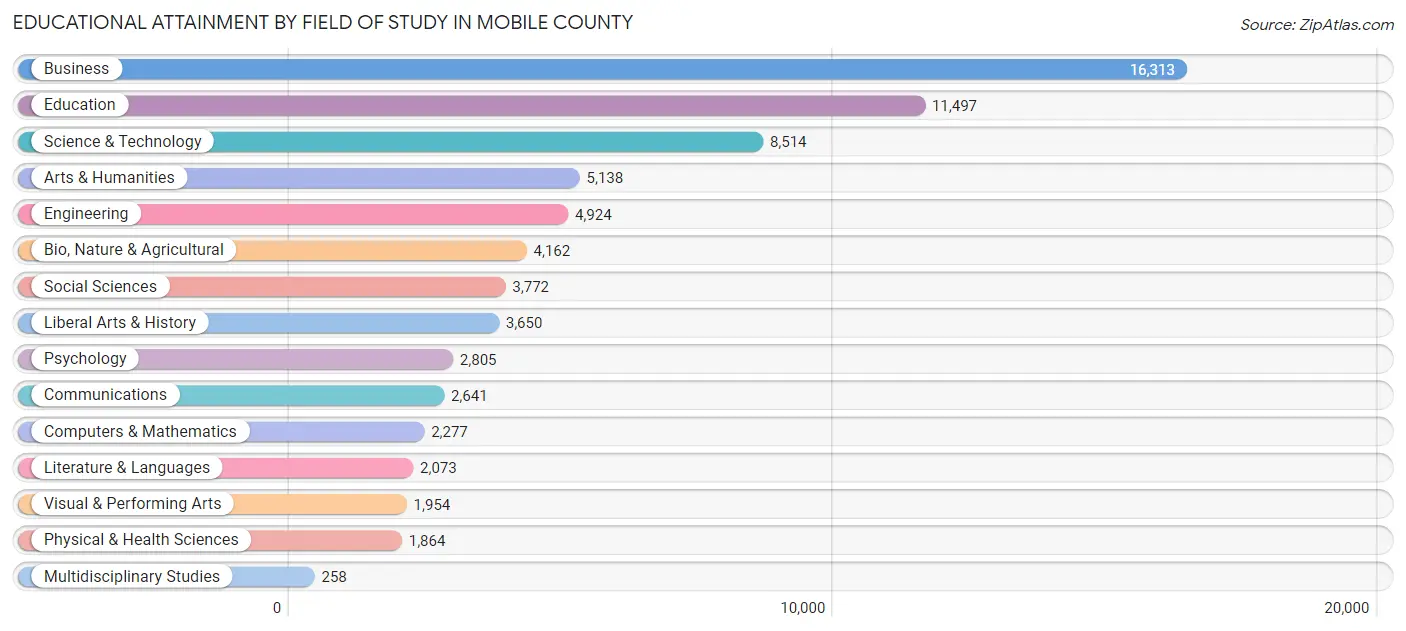
| Field of Study | # Graduates | % Graduates |
| Computers & Mathematics | 2,277 | 3.2% |
| Bio, Nature & Agricultural | 4,162 | 5.8% |
| Physical & Health Sciences | 1,864 | 2.6% |
| Psychology | 2,805 | 3.9% |
| Social Sciences | 3,772 | 5.2% |
| Engineering | 4,924 | 6.9% |
| Multidisciplinary Studies | 258 | 0.4% |
| Science & Technology | 8,514 | 11.8% |
| Business | 16,313 | 22.7% |
| Education | 11,497 | 16.0% |
| Literature & Languages | 2,073 | 2.9% |
| Liberal Arts & History | 3,650 | 5.1% |
| Visual & Performing Arts | 1,954 | 2.7% |
| Communications | 2,641 | 3.7% |
| Arts & Humanities | 5,138 | 7.1% |
| Total | 71,842 | 100.0% |
Transportation & Commute in Mobile County
Vehicle Availability by Sex in Mobile County
The most prevalent vehicle ownership categories in Mobile County are males with 2 vehicles (37,986, accounting for 42.2%) and females with 2 vehicles (32,597, making up 45.9%).
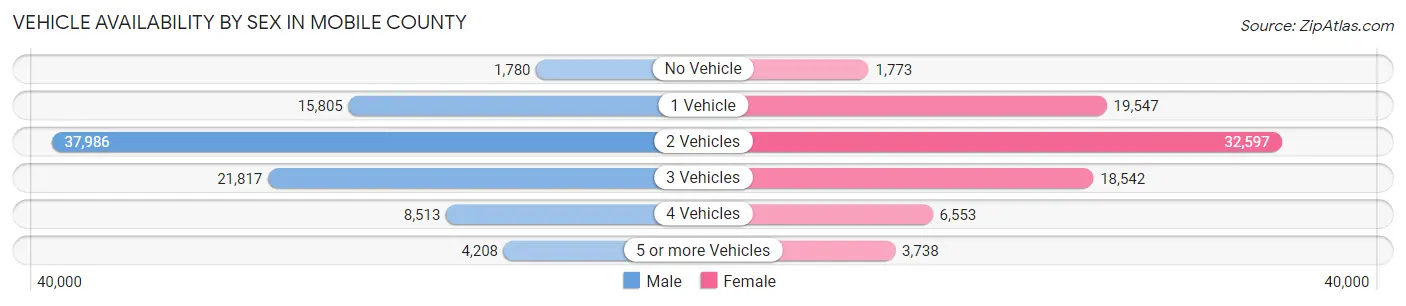
| Vehicles Available | Male | Female |
| No Vehicle | 1,780 (2.0%) | 1,773 (2.1%) |
| 1 Vehicle | 15,805 (17.5%) | 19,547 (23.6%) |
| 2 Vehicles | 37,986 (42.2%) | 32,597 (39.4%) |
| 3 Vehicles | 21,817 (24.2%) | 18,542 (22.4%) |
| 4 Vehicles | 8,513 (9.5%) | 6,553 (7.9%) |
| 5 or more Vehicles | 4,208 (4.7%) | 3,738 (4.5%) |
| Total | 90,109 (100.0%) | 82,750 (100.0%) |
Commute Time in Mobile County
The most frequently occuring commute durations in Mobile County are 20 to 24 minutes (30,238 commuters, 18.6%), 15 to 19 minutes (30,121 commuters, 18.5%), and 30 to 34 minutes (27,967 commuters, 17.2%).
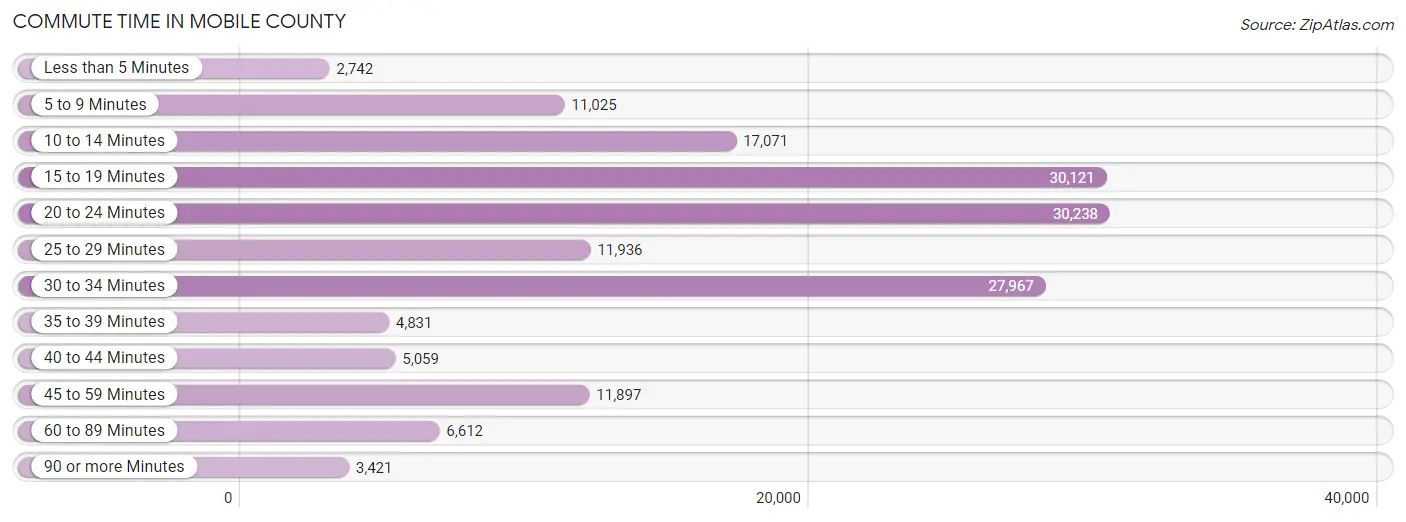
| Commute Time | # Commuters | % Commuters |
| Less than 5 Minutes | 2,742 | 1.7% |
| 5 to 9 Minutes | 11,025 | 6.8% |
| 10 to 14 Minutes | 17,071 | 10.5% |
| 15 to 19 Minutes | 30,121 | 18.5% |
| 20 to 24 Minutes | 30,238 | 18.6% |
| 25 to 29 Minutes | 11,936 | 7.3% |
| 30 to 34 Minutes | 27,967 | 17.2% |
| 35 to 39 Minutes | 4,831 | 3.0% |
| 40 to 44 Minutes | 5,059 | 3.1% |
| 45 to 59 Minutes | 11,897 | 7.3% |
| 60 to 89 Minutes | 6,612 | 4.1% |
| 90 or more Minutes | 3,421 | 2.1% |
Commute Time by Sex in Mobile County
The most common commute times in Mobile County are 30 to 34 minutes (16,271 commuters, 19.0%) for males and 20 to 24 minutes (15,003 commuters, 19.4%) for females.
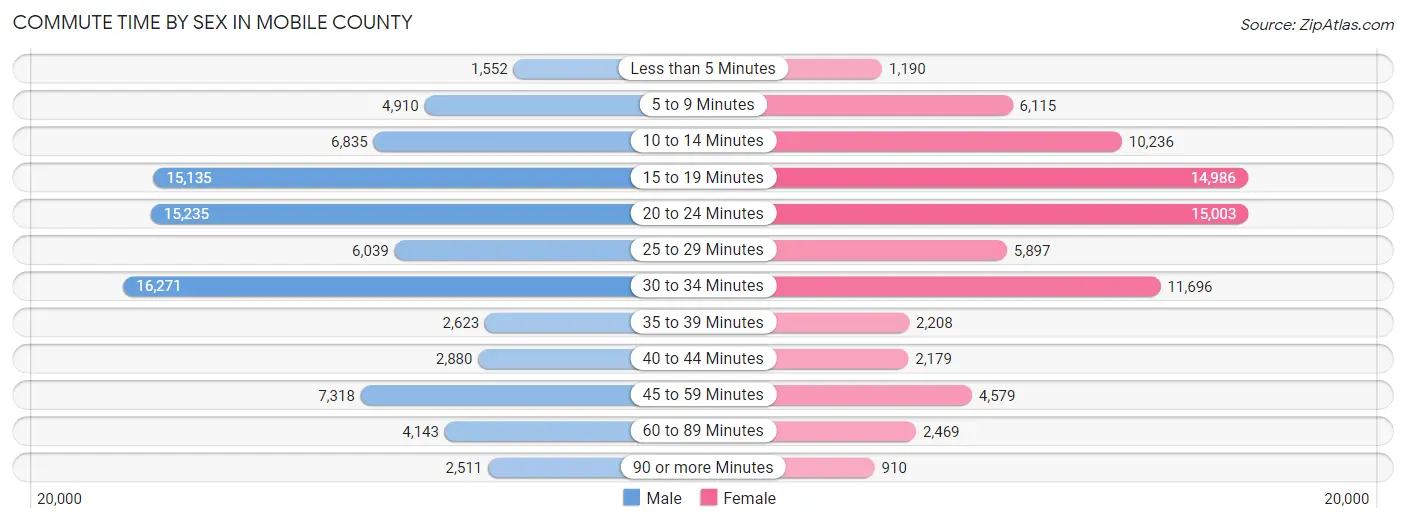
| Commute Time | Male | Female |
| Less than 5 Minutes | 1,552 (1.8%) | 1,190 (1.5%) |
| 5 to 9 Minutes | 4,910 (5.8%) | 6,115 (7.9%) |
| 10 to 14 Minutes | 6,835 (8.0%) | 10,236 (13.2%) |
| 15 to 19 Minutes | 15,135 (17.7%) | 14,986 (19.3%) |
| 20 to 24 Minutes | 15,235 (17.8%) | 15,003 (19.4%) |
| 25 to 29 Minutes | 6,039 (7.1%) | 5,897 (7.6%) |
| 30 to 34 Minutes | 16,271 (19.0%) | 11,696 (15.1%) |
| 35 to 39 Minutes | 2,623 (3.1%) | 2,208 (2.9%) |
| 40 to 44 Minutes | 2,880 (3.4%) | 2,179 (2.8%) |
| 45 to 59 Minutes | 7,318 (8.6%) | 4,579 (5.9%) |
| 60 to 89 Minutes | 4,143 (4.9%) | 2,469 (3.2%) |
| 90 or more Minutes | 2,511 (2.9%) | 910 (1.2%) |
Time of Departure to Work by Sex in Mobile County
The most frequent times of departure to work in Mobile County are 7:00 AM to 7:29 AM (11,831, 13.9%) for males and 7:00 AM to 7:29 AM (13,023, 16.8%) for females.
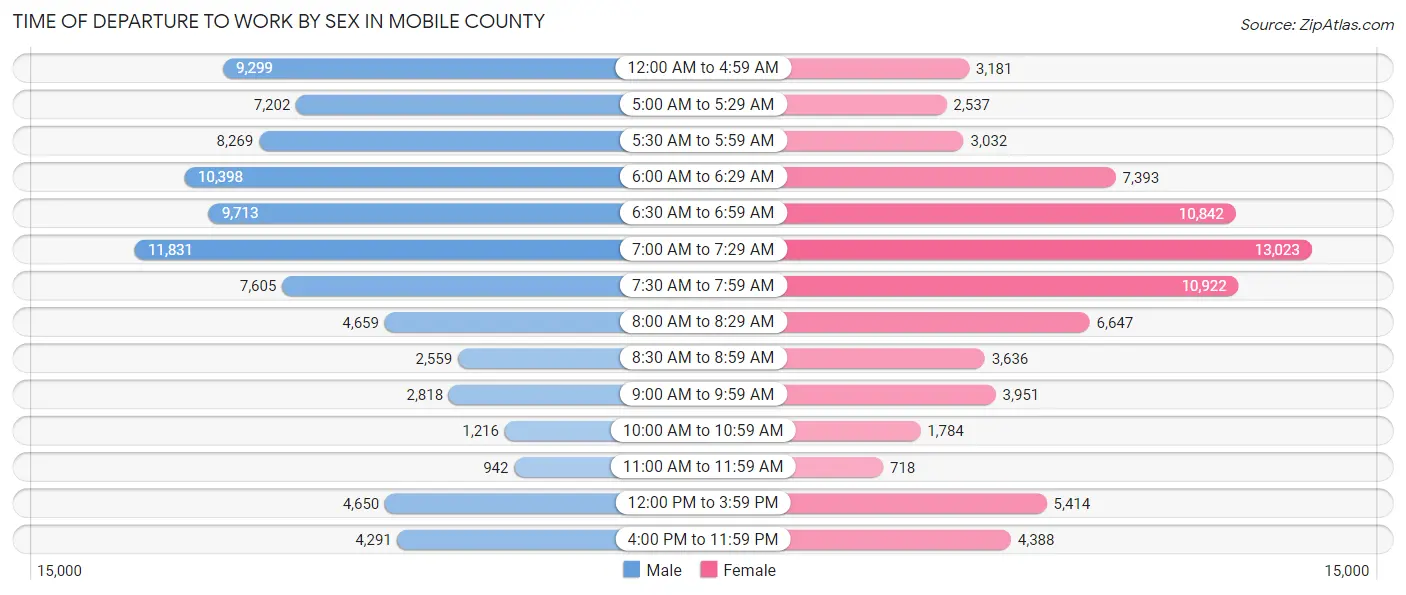
| Time of Departure | Male | Female |
| 12:00 AM to 4:59 AM | 9,299 (10.9%) | 3,181 (4.1%) |
| 5:00 AM to 5:29 AM | 7,202 (8.4%) | 2,537 (3.3%) |
| 5:30 AM to 5:59 AM | 8,269 (9.7%) | 3,032 (3.9%) |
| 6:00 AM to 6:29 AM | 10,398 (12.2%) | 7,393 (9.5%) |
| 6:30 AM to 6:59 AM | 9,713 (11.4%) | 10,842 (14.0%) |
| 7:00 AM to 7:29 AM | 11,831 (13.9%) | 13,023 (16.8%) |
| 7:30 AM to 7:59 AM | 7,605 (8.9%) | 10,922 (14.1%) |
| 8:00 AM to 8:29 AM | 4,659 (5.4%) | 6,647 (8.6%) |
| 8:30 AM to 8:59 AM | 2,559 (3.0%) | 3,636 (4.7%) |
| 9:00 AM to 9:59 AM | 2,818 (3.3%) | 3,951 (5.1%) |
| 10:00 AM to 10:59 AM | 1,216 (1.4%) | 1,784 (2.3%) |
| 11:00 AM to 11:59 AM | 942 (1.1%) | 718 (0.9%) |
| 12:00 PM to 3:59 PM | 4,650 (5.4%) | 5,414 (7.0%) |
| 4:00 PM to 11:59 PM | 4,291 (5.0%) | 4,388 (5.7%) |
| Total | 85,452 (100.0%) | 77,468 (100.0%) |
Housing Occupancy in Mobile County
Occupancy by Ownership in Mobile County
Of the total 159,605 dwellings in Mobile County, owner-occupied units account for 101,334 (63.5%), while renter-occupied units make up 58,271 (36.5%).
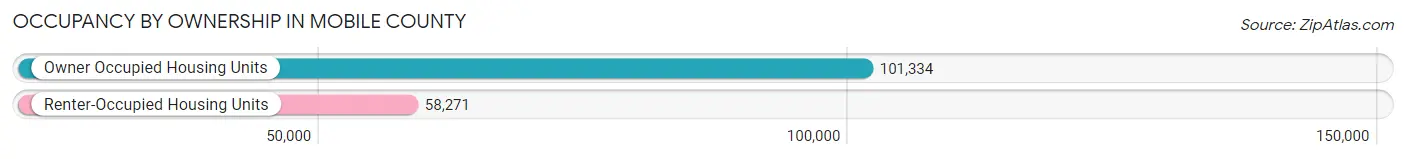
| Occupancy | # Housing Units | % Housing Units |
| Owner Occupied Housing Units | 101,334 | 63.5% |
| Renter-Occupied Housing Units | 58,271 | 36.5% |
| Total Occupied Housing Units | 159,605 | 100.0% |
Occupancy by Household Size in Mobile County
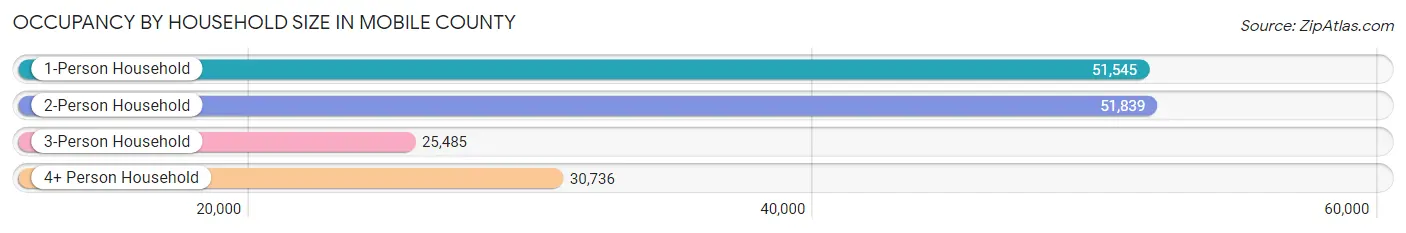
| Household Size | # Housing Units | % Housing Units |
| 1-Person Household | 51,545 | 32.3% |
| 2-Person Household | 51,839 | 32.5% |
| 3-Person Household | 25,485 | 16.0% |
| 4+ Person Household | 30,736 | 19.3% |
| Total Housing Units | 159,605 | 100.0% |
Occupancy by Ownership by Household Size in Mobile County
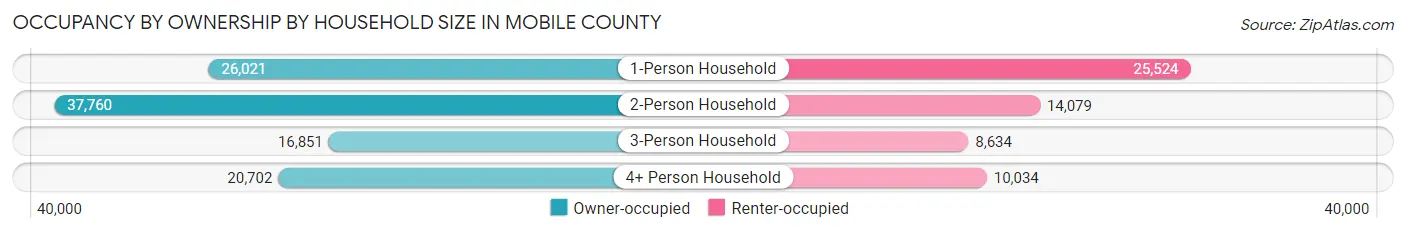
| Household Size | Owner-occupied | Renter-occupied |
| 1-Person Household | 26,021 (50.5%) | 25,524 (49.5%) |
| 2-Person Household | 37,760 (72.8%) | 14,079 (27.2%) |
| 3-Person Household | 16,851 (66.1%) | 8,634 (33.9%) |
| 4+ Person Household | 20,702 (67.3%) | 10,034 (32.7%) |
| Total Housing Units | 101,334 (63.5%) | 58,271 (36.5%) |
Occupancy by Educational Attainment in Mobile County
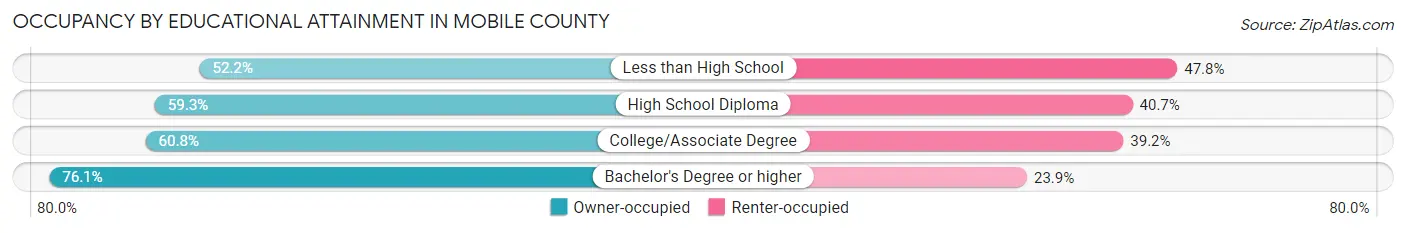
| Household Size | Owner-occupied | Renter-occupied |
| Less than High School | 8,222 (52.2%) | 7,517 (47.8%) |
| High School Diploma | 29,695 (59.3%) | 20,355 (40.7%) |
| College/Associate Degree | 31,620 (60.8%) | 20,395 (39.2%) |
| Bachelor's Degree or higher | 31,797 (76.1%) | 10,004 (23.9%) |
Occupancy by Age of Householder in Mobile County
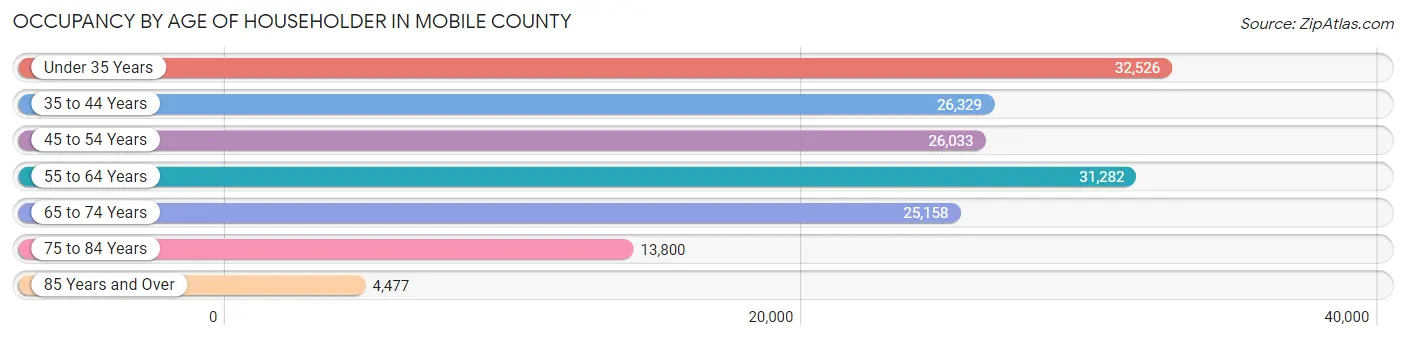
| Age Bracket | # Households | % Households |
| Under 35 Years | 32,526 | 20.4% |
| 35 to 44 Years | 26,329 | 16.5% |
| 45 to 54 Years | 26,033 | 16.3% |
| 55 to 64 Years | 31,282 | 19.6% |
| 65 to 74 Years | 25,158 | 15.8% |
| 75 to 84 Years | 13,800 | 8.6% |
| 85 Years and Over | 4,477 | 2.8% |
| Total | 159,605 | 100.0% |
Housing Finances in Mobile County
Median Income by Occupancy in Mobile County
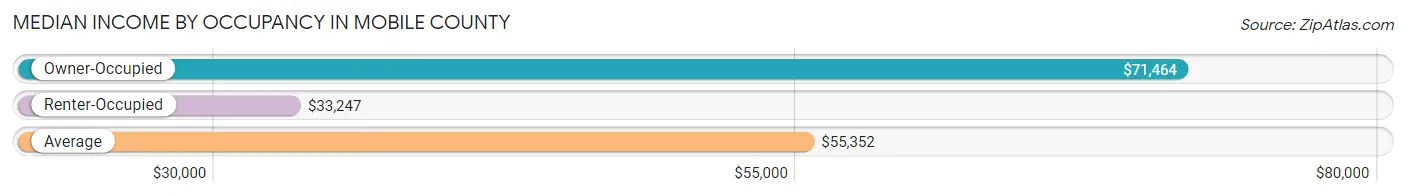
| Occupancy Type | # Households | Median Income |
| Owner-Occupied | 101,334 (63.5%) | $71,464 |
| Renter-Occupied | 58,271 (36.5%) | $33,247 |
| Average | 159,605 (100.0%) | $55,352 |
Occupancy by Householder Income Bracket in Mobile County
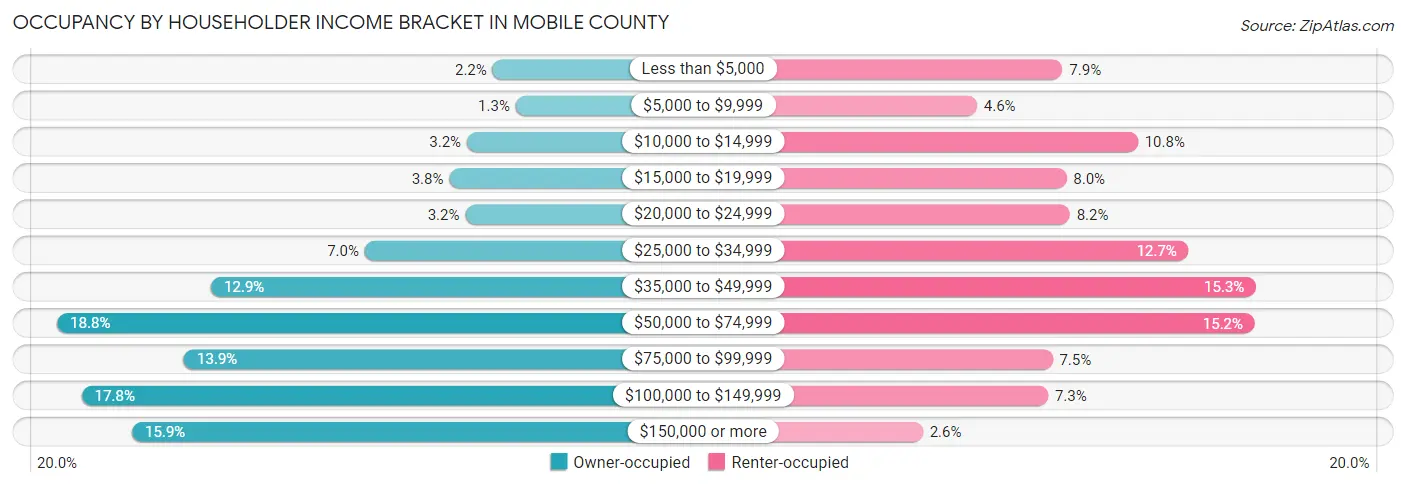
| Income Bracket | Owner-occupied | Renter-occupied |
| Less than $5,000 | 2,203 (2.2%) | 4,594 (7.9%) |
| $5,000 to $9,999 | 1,303 (1.3%) | 2,695 (4.6%) |
| $10,000 to $14,999 | 3,189 (3.2%) | 6,267 (10.7%) |
| $15,000 to $19,999 | 3,874 (3.8%) | 4,678 (8.0%) |
| $20,000 to $24,999 | 3,251 (3.2%) | 4,755 (8.2%) |
| $25,000 to $34,999 | 7,131 (7.0%) | 7,396 (12.7%) |
| $35,000 to $49,999 | 13,070 (12.9%) | 8,891 (15.3%) |
| $50,000 to $74,999 | 19,012 (18.8%) | 8,864 (15.2%) |
| $75,000 to $99,999 | 14,111 (13.9%) | 4,370 (7.5%) |
| $100,000 to $149,999 | 18,072 (17.8%) | 4,269 (7.3%) |
| $150,000 or more | 16,118 (15.9%) | 1,492 (2.6%) |
| Total | 101,334 (100.0%) | 58,271 (100.0%) |
Monthly Housing Cost Tiers in Mobile County
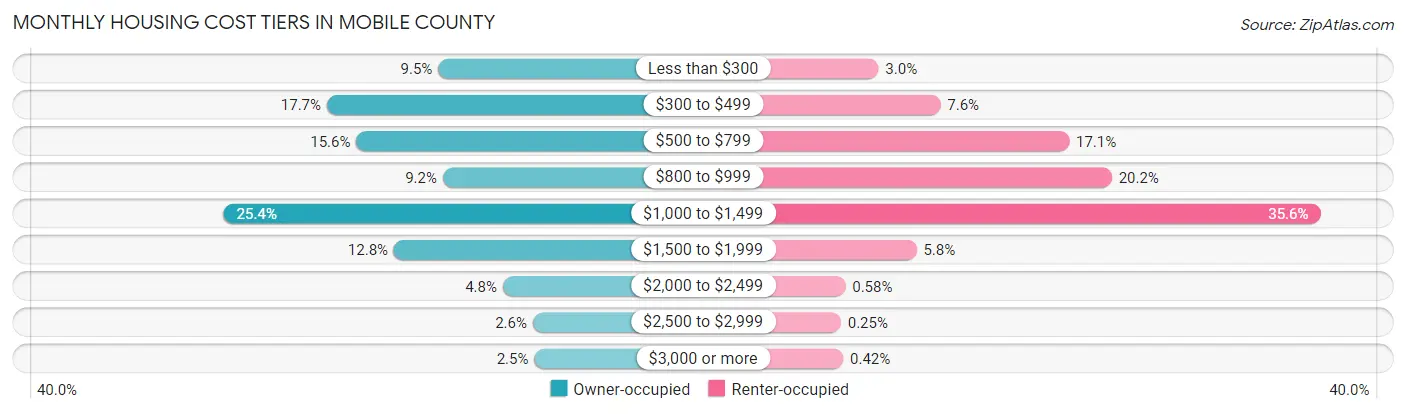
| Monthly Cost | Owner-occupied | Renter-occupied |
| Less than $300 | 9,665 (9.5%) | 1,759 (3.0%) |
| $300 to $499 | 17,979 (17.7%) | 4,419 (7.6%) |
| $500 to $799 | 15,779 (15.6%) | 9,939 (17.1%) |
| $800 to $999 | 9,319 (9.2%) | 11,773 (20.2%) |
| $1,000 to $1,499 | 25,688 (25.4%) | 20,723 (35.6%) |
| $1,500 to $1,999 | 12,969 (12.8%) | 3,391 (5.8%) |
| $2,000 to $2,499 | 4,841 (4.8%) | 340 (0.6%) |
| $2,500 to $2,999 | 2,600 (2.6%) | 148 (0.3%) |
| $3,000 or more | 2,494 (2.5%) | 242 (0.4%) |
| Total | 101,334 (100.0%) | 58,271 (100.0%) |
Physical Housing Characteristics in Mobile County
Housing Structures in Mobile County
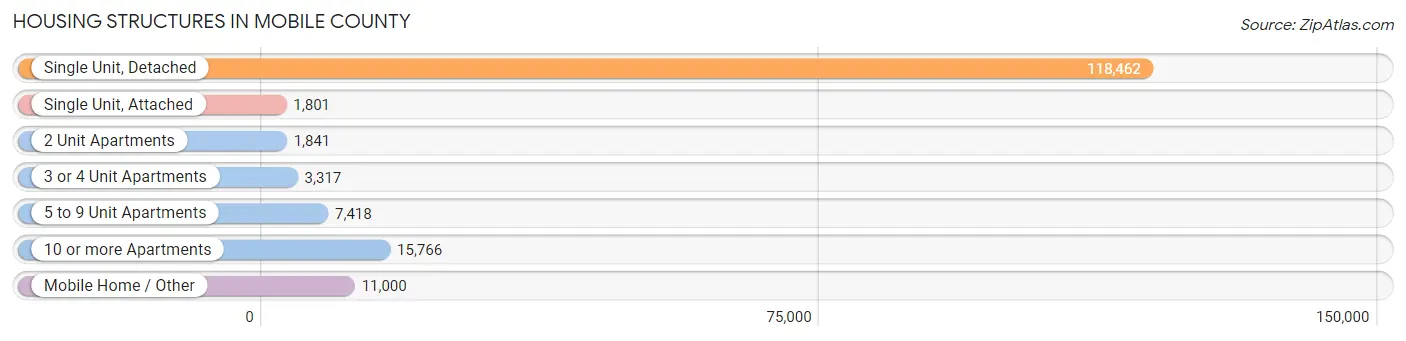
| Structure Type | # Housing Units | % Housing Units |
| Single Unit, Detached | 118,462 | 74.2% |
| Single Unit, Attached | 1,801 | 1.1% |
| 2 Unit Apartments | 1,841 | 1.1% |
| 3 or 4 Unit Apartments | 3,317 | 2.1% |
| 5 to 9 Unit Apartments | 7,418 | 4.6% |
| 10 or more Apartments | 15,766 | 9.9% |
| Mobile Home / Other | 11,000 | 6.9% |
| Total | 159,605 | 100.0% |
Housing Structures by Occupancy in Mobile County
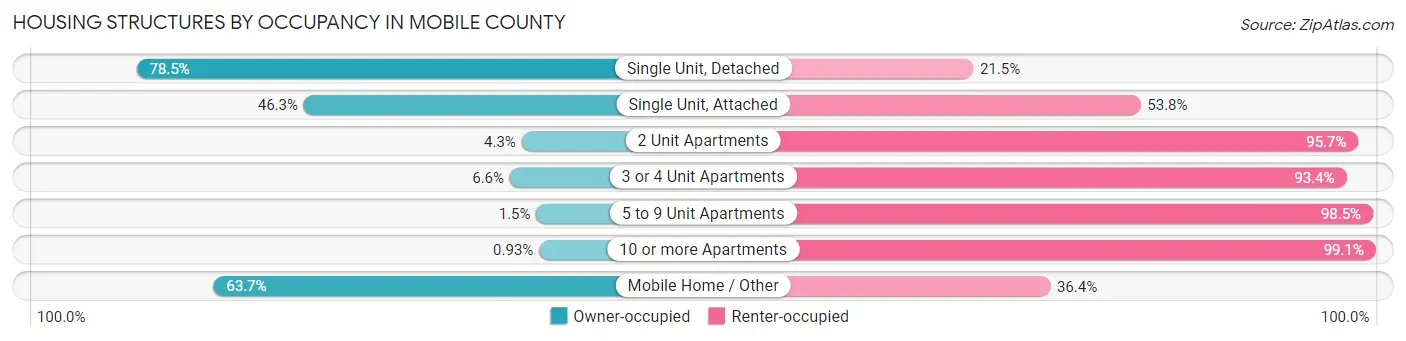
| Structure Type | Owner-occupied | Renter-occupied |
| Single Unit, Detached | 92,947 (78.5%) | 25,515 (21.5%) |
| Single Unit, Attached | 833 (46.3%) | 968 (53.7%) |
| 2 Unit Apartments | 79 (4.3%) | 1,762 (95.7%) |
| 3 or 4 Unit Apartments | 218 (6.6%) | 3,099 (93.4%) |
| 5 to 9 Unit Apartments | 109 (1.5%) | 7,309 (98.5%) |
| 10 or more Apartments | 147 (0.9%) | 15,619 (99.1%) |
| Mobile Home / Other | 7,001 (63.6%) | 3,999 (36.3%) |
| Total | 101,334 (63.5%) | 58,271 (36.5%) |
Housing Structures by Number of Rooms in Mobile County
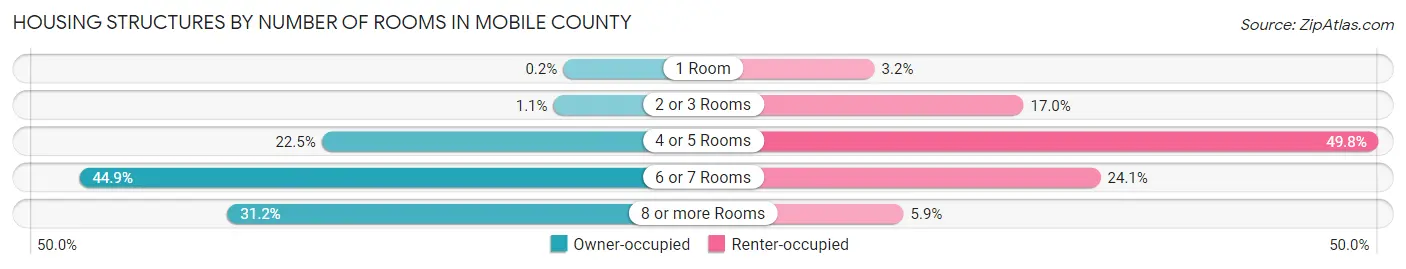
| Number of Rooms | Owner-occupied | Renter-occupied |
| 1 Room | 206 (0.2%) | 1,869 (3.2%) |
| 2 or 3 Rooms | 1,114 (1.1%) | 9,899 (17.0%) |
| 4 or 5 Rooms | 22,841 (22.5%) | 29,024 (49.8%) |
| 6 or 7 Rooms | 45,515 (44.9%) | 14,049 (24.1%) |
| 8 or more Rooms | 31,658 (31.2%) | 3,430 (5.9%) |
| Total | 101,334 (100.0%) | 58,271 (100.0%) |
Housing Structure by Heating Type in Mobile County
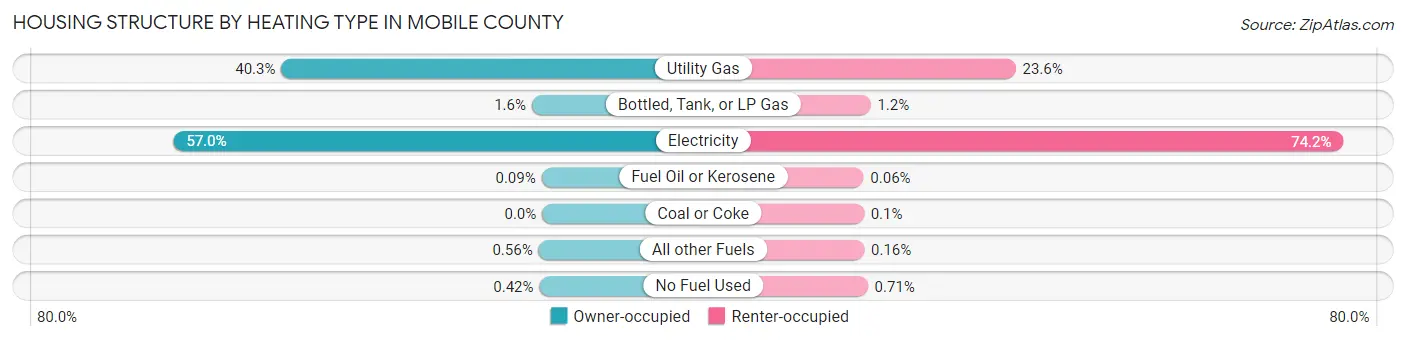
| Heating Type | Owner-occupied | Renter-occupied |
| Utility Gas | 40,859 (40.3%) | 13,741 (23.6%) |
| Bottled, Tank, or LP Gas | 1,613 (1.6%) | 673 (1.1%) |
| Electricity | 57,769 (57.0%) | 43,260 (74.2%) |
| Fuel Oil or Kerosene | 96 (0.1%) | 34 (0.1%) |
| Coal or Coke | 0 (0.0%) | 58 (0.1%) |
| All other Fuels | 570 (0.6%) | 94 (0.2%) |
| No Fuel Used | 427 (0.4%) | 411 (0.7%) |
| Total | 101,334 (100.0%) | 58,271 (100.0%) |
Household Vehicle Usage in Mobile County
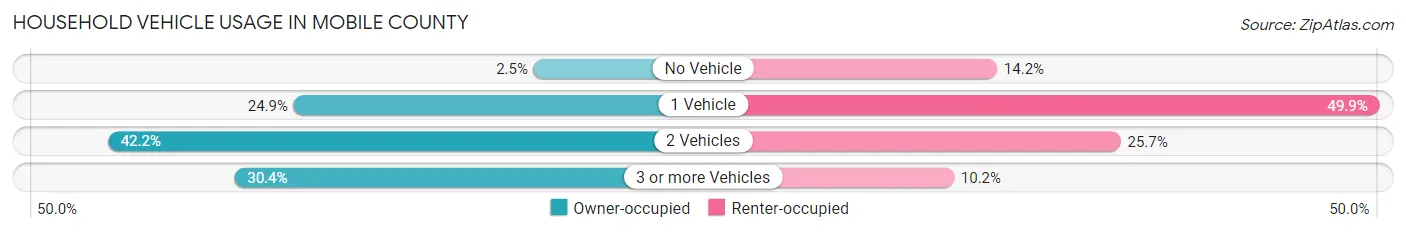
| Vehicles per Household | Owner-occupied | Renter-occupied |
| No Vehicle | 2,503 (2.5%) | 8,270 (14.2%) |
| 1 Vehicle | 25,198 (24.9%) | 29,084 (49.9%) |
| 2 Vehicles | 42,803 (42.2%) | 14,991 (25.7%) |
| 3 or more Vehicles | 30,830 (30.4%) | 5,926 (10.2%) |
| Total | 101,334 (100.0%) | 58,271 (100.0%) |
Real Estate & Mortgages in Mobile County
Real Estate and Mortgage Overview in Mobile County
| Characteristic | Without Mortgage | With Mortgage |
| Housing Units | 41,309 | 60,025 |
| Median Property Value | $135,900 | $179,900 |
| Median Household Income | $54,500 | $11,969 |
| Monthly Housing Costs | $424 | $2,410 |
| Real Estate Taxes | $678 | $6,935 |
Property Value by Mortgage Status in Mobile County
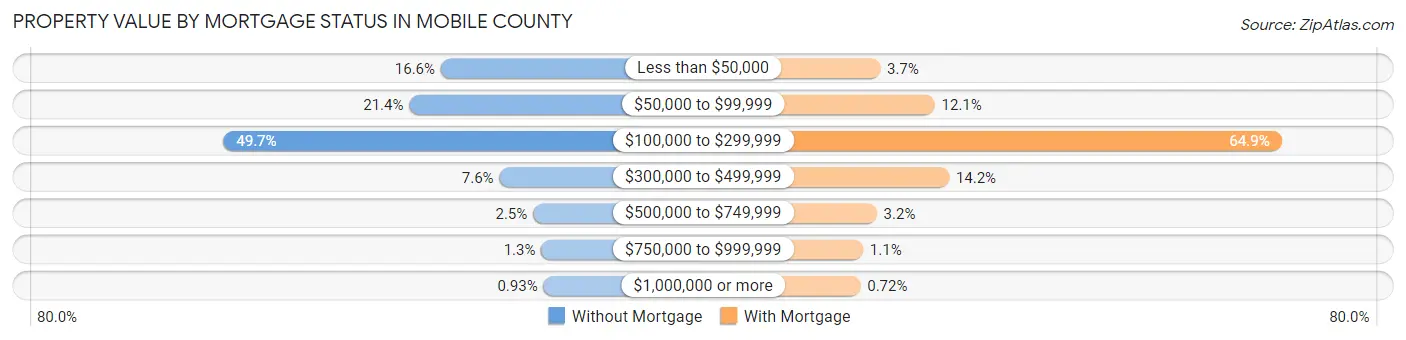
| Property Value | Without Mortgage | With Mortgage |
| Less than $50,000 | 6,846 (16.6%) | 2,239 (3.7%) |
| $50,000 to $99,999 | 8,833 (21.4%) | 7,233 (12.0%) |
| $100,000 to $299,999 | 20,534 (49.7%) | 38,965 (64.9%) |
| $300,000 to $499,999 | 3,155 (7.6%) | 8,544 (14.2%) |
| $500,000 to $749,999 | 1,037 (2.5%) | 1,934 (3.2%) |
| $750,000 to $999,999 | 519 (1.3%) | 675 (1.1%) |
| $1,000,000 or more | 385 (0.9%) | 435 (0.7%) |
| Total | 41,309 (100.0%) | 60,025 (100.0%) |
Household Income by Mortgage Status in Mobile County
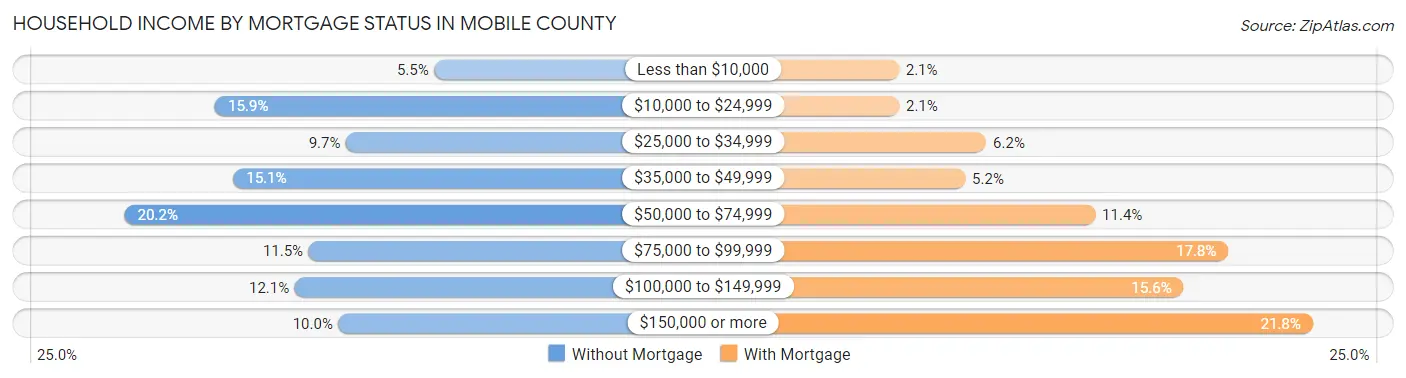
| Household Income | Without Mortgage | With Mortgage |
| Less than $10,000 | 2,262 (5.5%) | 1,234 (2.1%) |
| $10,000 to $24,999 | 6,581 (15.9%) | 1,244 (2.1%) |
| $25,000 to $34,999 | 3,997 (9.7%) | 3,733 (6.2%) |
| $35,000 to $49,999 | 6,221 (15.1%) | 3,134 (5.2%) |
| $50,000 to $74,999 | 8,359 (20.2%) | 6,849 (11.4%) |
| $75,000 to $99,999 | 4,735 (11.5%) | 10,653 (17.7%) |
| $100,000 to $149,999 | 5,005 (12.1%) | 9,376 (15.6%) |
| $150,000 or more | 4,149 (10.0%) | 13,067 (21.8%) |
| Total | 41,309 (100.0%) | 60,025 (100.0%) |
Property Value to Household Income Ratio in Mobile County
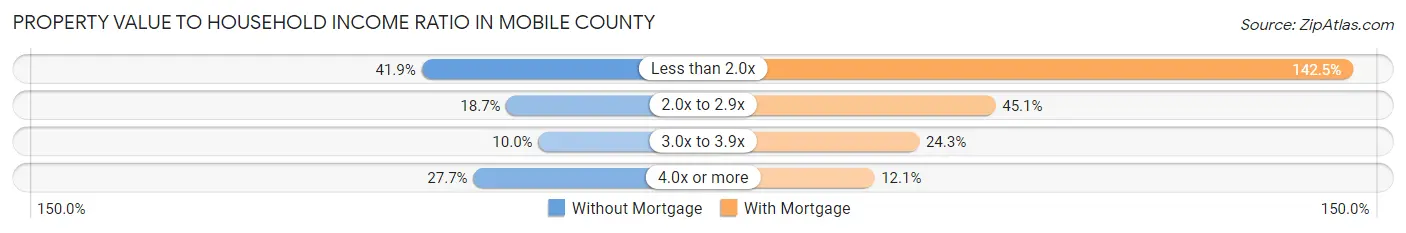
| Value-to-Income Ratio | Without Mortgage | With Mortgage |
| Less than 2.0x | 17,298 (41.9%) | 85,536 (142.5%) |
| 2.0x to 2.9x | 7,741 (18.7%) | 27,039 (45.1%) |
| 3.0x to 3.9x | 4,144 (10.0%) | 14,560 (24.3%) |
| 4.0x or more | 11,461 (27.7%) | 7,248 (12.1%) |
| Total | 41,309 (100.0%) | 60,025 (100.0%) |
Real Estate Taxes by Mortgage Status in Mobile County
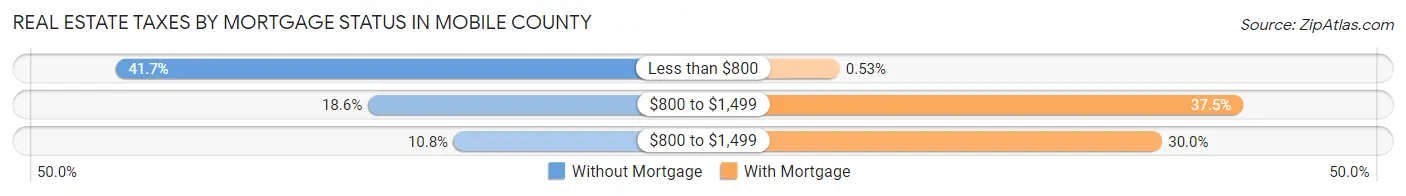
| Property Taxes | Without Mortgage | With Mortgage |
| Less than $800 | 17,226 (41.7%) | 321 (0.5%) |
| $800 to $1,499 | 7,701 (18.6%) | 22,481 (37.4%) |
| $800 to $1,499 | 4,459 (10.8%) | 17,994 (30.0%) |
| Total | 41,309 (100.0%) | 60,025 (100.0%) |
Health & Disability in Mobile County
Health Insurance Coverage by Age in Mobile County
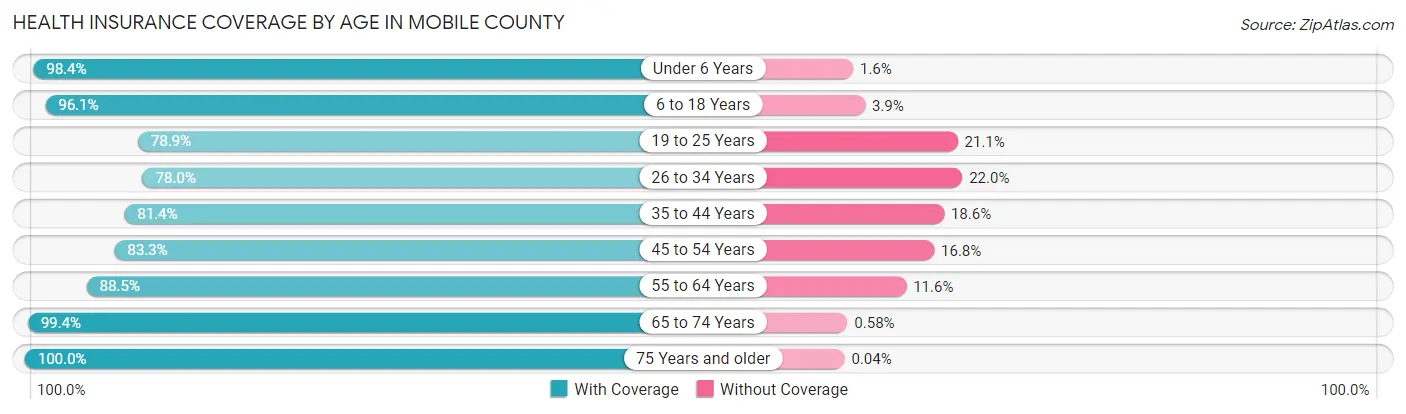
| Age Bracket | With Coverage | Without Coverage |
| Under 6 Years | 30,461 (98.4%) | 504 (1.6%) |
| 6 to 18 Years | 68,136 (96.1%) | 2,732 (3.9%) |
| 19 to 25 Years | 29,447 (78.9%) | 7,891 (21.1%) |
| 26 to 34 Years | 39,518 (78.0%) | 11,140 (22.0%) |
| 35 to 44 Years | 40,282 (81.4%) | 9,199 (18.6%) |
| 45 to 54 Years | 40,509 (83.3%) | 8,148 (16.8%) |
| 55 to 64 Years | 47,531 (88.4%) | 6,207 (11.6%) |
| 65 to 74 Years | 40,826 (99.4%) | 237 (0.6%) |
| 75 Years and older | 26,423 (100.0%) | 10 (0.0%) |
| Total | 363,133 (88.7%) | 46,068 (11.3%) |
Health Insurance Coverage by Citizenship Status in Mobile County
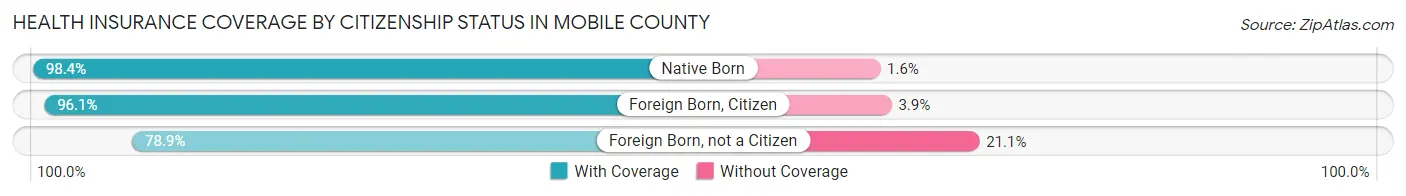
| Citizenship Status | With Coverage | Without Coverage |
| Native Born | 30,461 (98.4%) | 504 (1.6%) |
| Foreign Born, Citizen | 68,136 (96.1%) | 2,732 (3.9%) |
| Foreign Born, not a Citizen | 29,447 (78.9%) | 7,891 (21.1%) |
Health Insurance Coverage by Household Income in Mobile County
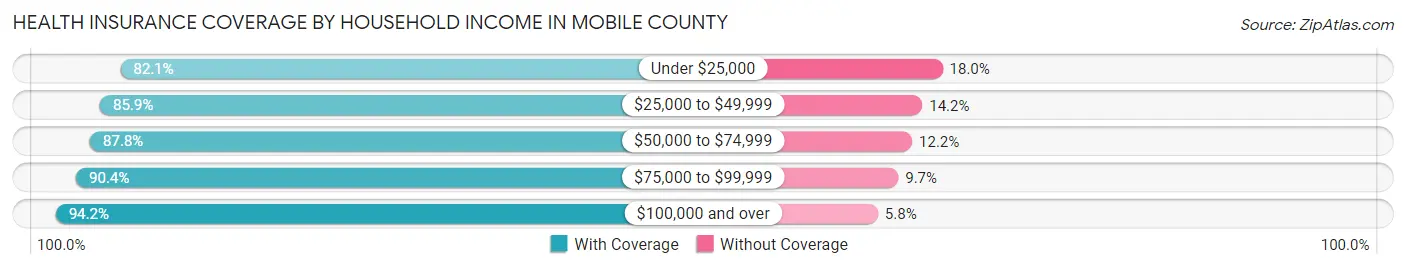
| Household Income | With Coverage | Without Coverage |
| Under $25,000 | 57,807 (82.1%) | 12,643 (17.9%) |
| $25,000 to $49,999 | 69,171 (85.9%) | 11,399 (14.1%) |
| $50,000 to $74,999 | 64,496 (87.8%) | 8,992 (12.2%) |
| $75,000 to $99,999 | 48,777 (90.3%) | 5,207 (9.7%) |
| $100,000 and over | 119,269 (94.2%) | 7,390 (5.8%) |
Public vs Private Health Insurance Coverage by Age in Mobile County
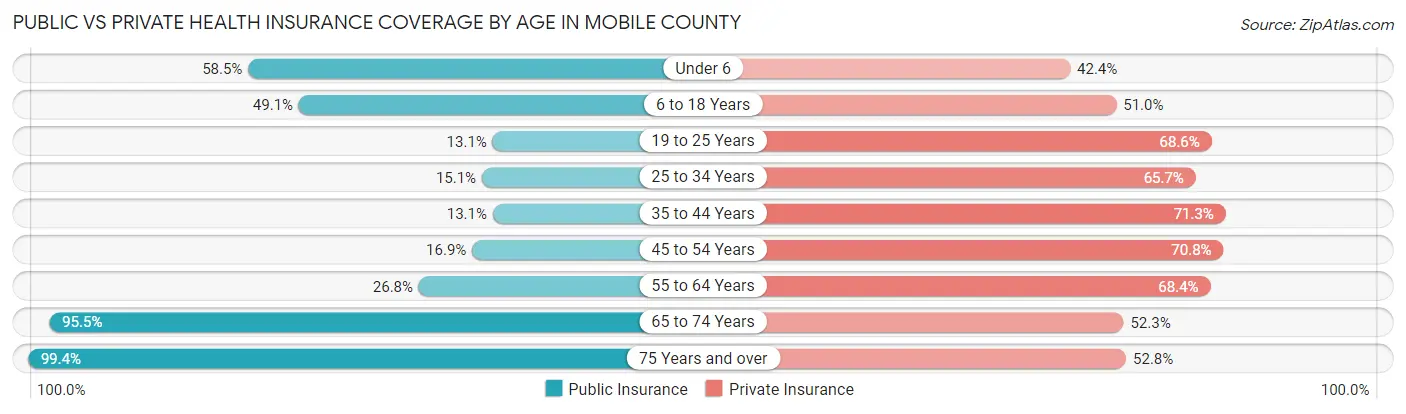
| Age Bracket | Public Insurance | Private Insurance |
| Under 6 | 18,114 (58.5%) | 13,124 (42.4%) |
| 6 to 18 Years | 34,783 (49.1%) | 36,104 (50.9%) |
| 19 to 25 Years | 4,898 (13.1%) | 25,627 (68.6%) |
| 25 to 34 Years | 7,653 (15.1%) | 33,273 (65.7%) |
| 35 to 44 Years | 6,479 (13.1%) | 35,255 (71.3%) |
| 45 to 54 Years | 8,239 (16.9%) | 34,464 (70.8%) |
| 55 to 64 Years | 14,413 (26.8%) | 36,763 (68.4%) |
| 65 to 74 Years | 39,199 (95.5%) | 21,472 (52.3%) |
| 75 Years and over | 26,280 (99.4%) | 13,949 (52.8%) |
| Total | 160,058 (39.1%) | 250,031 (61.1%) |
Disability Status by Sex by Age in Mobile County
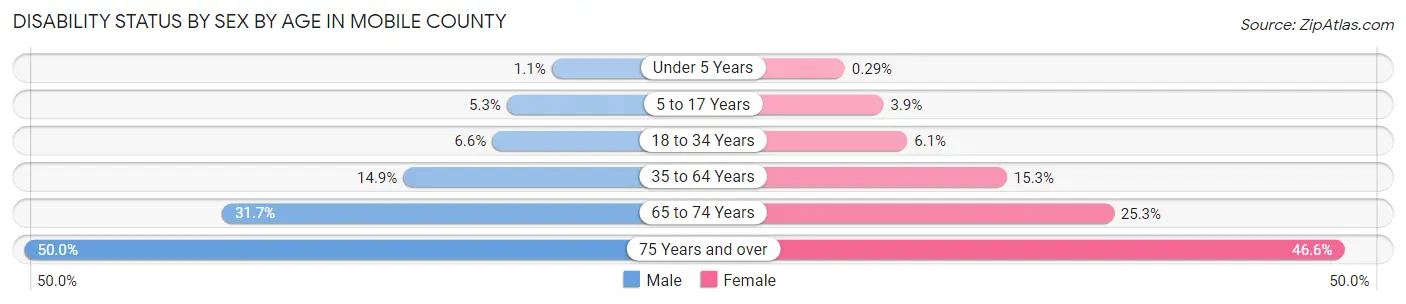
| Age Bracket | Male | Female |
| Under 5 Years | 150 (1.1%) | 37 (0.3%) |
| 5 to 17 Years | 1,856 (5.3%) | 1,329 (3.9%) |
| 18 to 34 Years | 2,997 (6.6%) | 2,947 (6.1%) |
| 35 to 64 Years | 10,689 (14.9%) | 12,253 (15.3%) |
| 65 to 74 Years | 6,063 (31.7%) | 5,536 (25.3%) |
| 75 Years and over | 5,228 (50.0%) | 7,451 (46.6%) |
Disability Class by Sex by Age in Mobile County
Disability Class: Hearing Difficulty
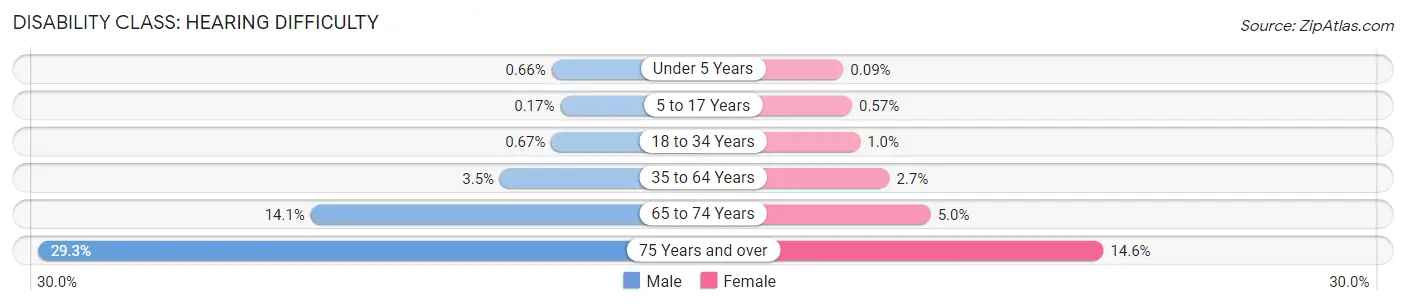
| Age Bracket | Male | Female |
| Under 5 Years | 90 (0.7%) | 11 (0.1%) |
| 5 to 17 Years | 61 (0.2%) | 197 (0.6%) |
| 18 to 34 Years | 302 (0.7%) | 498 (1.0%) |
| 35 to 64 Years | 2,536 (3.5%) | 2,124 (2.7%) |
| 65 to 74 Years | 2,692 (14.1%) | 1,085 (5.0%) |
| 75 Years and over | 3,061 (29.3%) | 2,327 (14.6%) |
Disability Class: Vision Difficulty
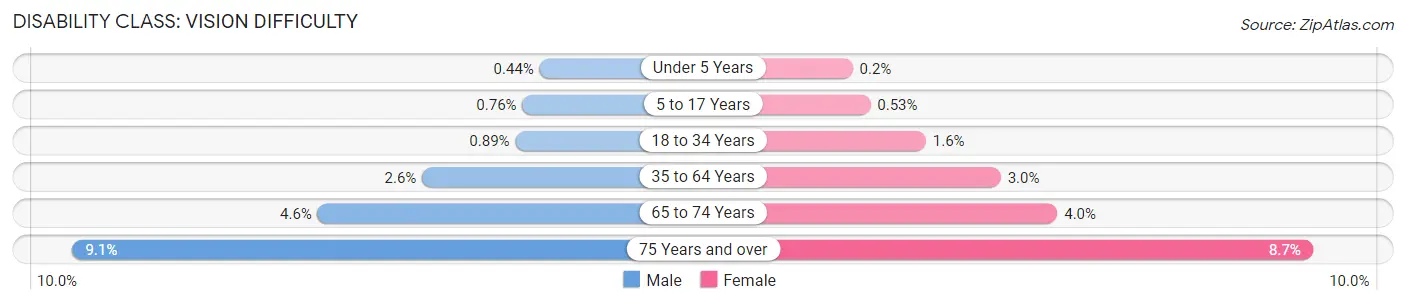
| Age Bracket | Male | Female |
| Under 5 Years | 60 (0.4%) | 26 (0.2%) |
| 5 to 17 Years | 268 (0.8%) | 181 (0.5%) |
| 18 to 34 Years | 404 (0.9%) | 756 (1.6%) |
| 35 to 64 Years | 1,883 (2.6%) | 2,362 (2.9%) |
| 65 to 74 Years | 873 (4.6%) | 878 (4.0%) |
| 75 Years and over | 953 (9.1%) | 1,397 (8.7%) |
Disability Class: Cognitive Difficulty
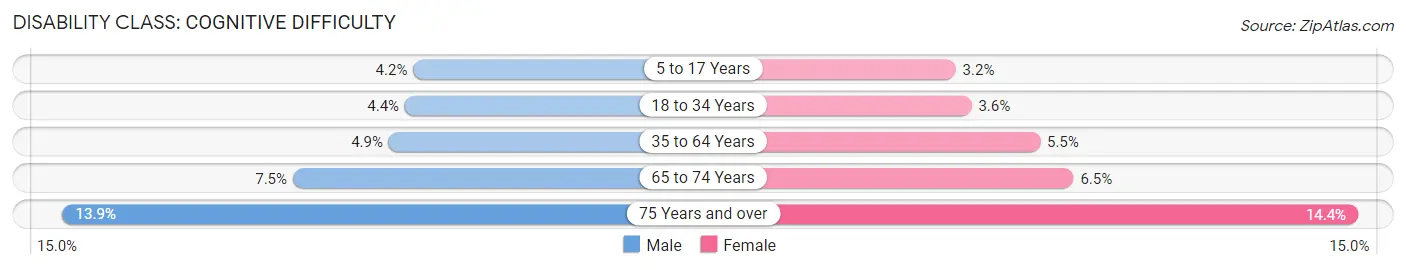
| Age Bracket | Male | Female |
| 5 to 17 Years | 1,475 (4.2%) | 1,090 (3.2%) |
| 18 to 34 Years | 1,999 (4.4%) | 1,748 (3.6%) |
| 35 to 64 Years | 3,491 (4.9%) | 4,414 (5.5%) |
| 65 to 74 Years | 1,440 (7.5%) | 1,415 (6.5%) |
| 75 Years and over | 1,458 (13.9%) | 2,295 (14.4%) |
Disability Class: Ambulatory Difficulty
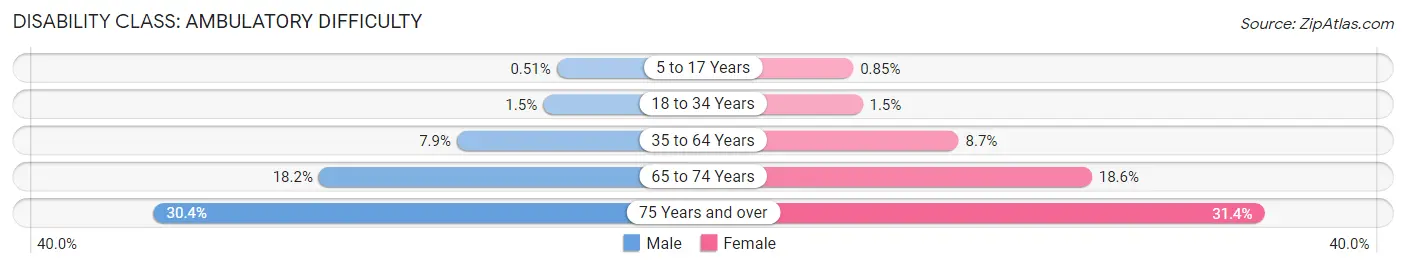
| Age Bracket | Male | Female |
| 5 to 17 Years | 180 (0.5%) | 291 (0.9%) |
| 18 to 34 Years | 685 (1.5%) | 745 (1.5%) |
| 35 to 64 Years | 5,689 (7.9%) | 6,938 (8.7%) |
| 65 to 74 Years | 3,475 (18.2%) | 4,070 (18.6%) |
| 75 Years and over | 3,181 (30.4%) | 5,012 (31.4%) |
Disability Class: Self-Care Difficulty
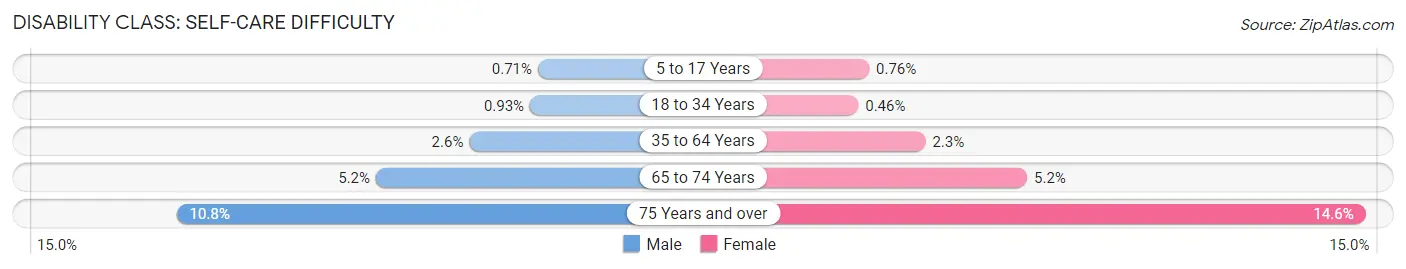
| Age Bracket | Male | Female |
| 5 to 17 Years | 250 (0.7%) | 260 (0.8%) |
| 18 to 34 Years | 422 (0.9%) | 223 (0.5%) |
| 35 to 64 Years | 1,884 (2.6%) | 1,863 (2.3%) |
| 65 to 74 Years | 998 (5.2%) | 1,132 (5.2%) |
| 75 Years and over | 1,126 (10.8%) | 2,329 (14.6%) |
Technology Access in Mobile County
Computing Device Access in Mobile County
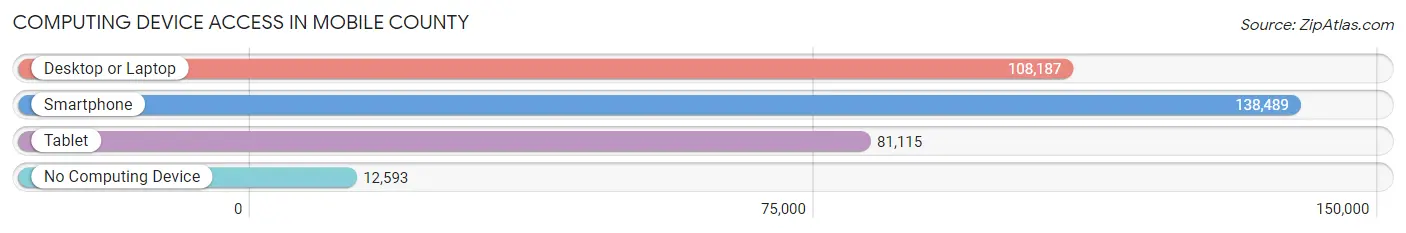
| Device Type | # Households | % Households |
| Desktop or Laptop | 108,187 | 67.8% |
| Smartphone | 138,489 | 86.8% |
| Tablet | 81,115 | 50.8% |
| No Computing Device | 12,593 | 7.9% |
| Total | 159,605 | 100.0% |
Internet Access in Mobile County
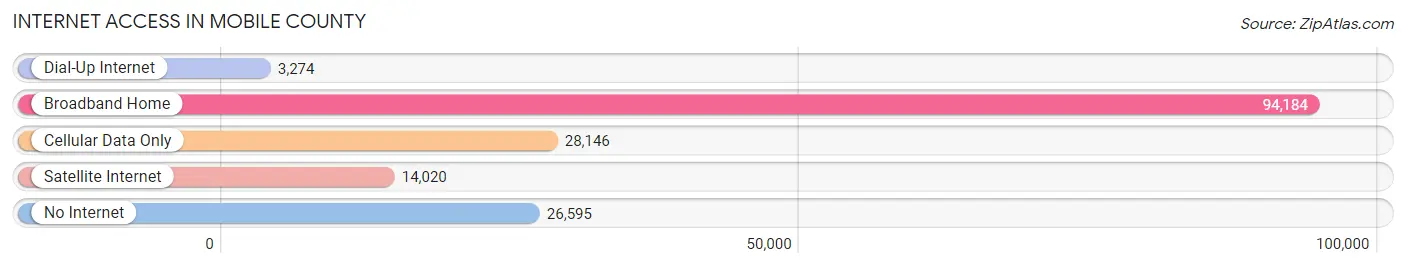
| Internet Type | # Households | % Households |
| Dial-Up Internet | 3,274 | 2.1% |
| Broadband Home | 94,184 | 59.0% |
| Cellular Data Only | 28,146 | 17.6% |
| Satellite Internet | 14,020 | 8.8% |
| No Internet | 26,595 | 16.7% |
| Total | 159,605 | 100.0% |
Mobile County Summary
Mobile County is located in the southwestern corner of the state of Alabama, and is the second most populous county in the state. It is bordered by Baldwin County to the east, Washington County to the north, and Clarke County to the west. The county seat is Mobile, which is also the largest city in the county. The county is part of the Mobile metropolitan area, which is the second largest metropolitan area in the state.
History
Mobile County was established in 1812, and is named after the city of Mobile, which was founded by French colonists in 1702. The area was originally part of the French colony of Louisiana, and was ceded to the United States in 1803 as part of the Louisiana Purchase. The county was originally part of the Mississippi Territory, and was later part of the Alabama Territory before becoming part of the state of Alabama in 1819.
During the Civil War, Mobile County was a major port for the Confederate States of America, and was the site of several battles. After the war, the county was occupied by Union forces until 1868.
Geography
Mobile County covers an area of 1,644 square miles, and is located in the southwestern corner of the state. The county is mostly flat, with some rolling hills in the northern part of the county. The Mobile-Tensaw River Delta is located in the northern part of the county, and is the largest river delta in the United States. The county is also home to several large lakes, including Big Creek Lake, Lake Purdy, and Lake Forest.
The climate of Mobile County is humid subtropical, with hot, humid summers and mild winters. The average annual temperature is around 70°F, and the average annual precipitation is around 56 inches.
Economy
The economy of Mobile County is largely based on manufacturing, with the largest employers being the shipbuilding and aerospace industries. The county is also home to several large military installations, including the Brookley Aeroplex and the Mobile Army Airfield.
The county is also home to several large universities, including the University of South Alabama, Spring Hill College, and the University of Mobile. Tourism is also an important part of the economy, with the city of Mobile being a popular destination for visitors.
Demographics
As of the 2010 census, Mobile County had a population of 412,992. The racial makeup of the county was 57.3% White, 37.2% Black or African American, 0.7% Native American, 1.7% Asian, 0.1% Pacific Islander, 1.3% from other races, and 2.0% from two or more races. Hispanic or Latino of any race were 4.2% of the population.
The median income for a household in the county was $41,945, and the median income for a family was $50,945. The per capita income for the county was $21,945. About 17.2% of the population was below the poverty line.
Common Questions
What is Per Capita Income in Mobile County?
Per Capita income in Mobile County is $30,482.
What is the Median Family Income in Mobile County?
Median Family Income in Mobile County is $70,688.
What is the Median Household income in Mobile County?
Median Household Income in Mobile County is $55,352.
What is Income or Wage Gap in Mobile County?
Income or Wage Gap in Mobile County is 36.8%.
Women in Mobile County earn 63.2 cents for every dollar earned by a man.
What is Family Income Deficit in Mobile County?
Family Income Deficit in Mobile County is $11,465.
Families that are below poverty line in Mobile County earn $11,465 less on average than the poverty threshold level.
What is Inequality or Gini Index in Mobile County?
Inequality or Gini Index in Mobile County is 0.47.
What is the Total Population of Mobile County?
Total Population of Mobile County is 413,878.
What is the Total Male Population of Mobile County?
Total Male Population of Mobile County is 198,642.
What is the Total Female Population of Mobile County?
Total Female Population of Mobile County is 215,236.
What is the Ratio of Males per 100 Females in Mobile County?
There are 92.29 Males per 100 Females in Mobile County.
What is the Ratio of Females per 100 Males in Mobile County?
There are 108.35 Females per 100 Males in Mobile County.
What is the Median Population Age in Mobile County?
Median Population Age in Mobile County is 38.2 Years.
What is the Average Family Size in Mobile County
Average Family Size in Mobile County is 3.2 People.
What is the Average Household Size in Mobile County
Average Household Size in Mobile County is 2.5 People.
How Large is the Labor Force in Mobile County?
There are 188,490 People in the Labor Forcein in Mobile County.
What is the Percentage of People in the Labor Force in Mobile County?
57.4% of People are in the Labor Force in Mobile County.
What is the Unemployment Rate in Mobile County?
Unemployment Rate in Mobile County is 5.9%.