Shelby County, AL Map & Demographics
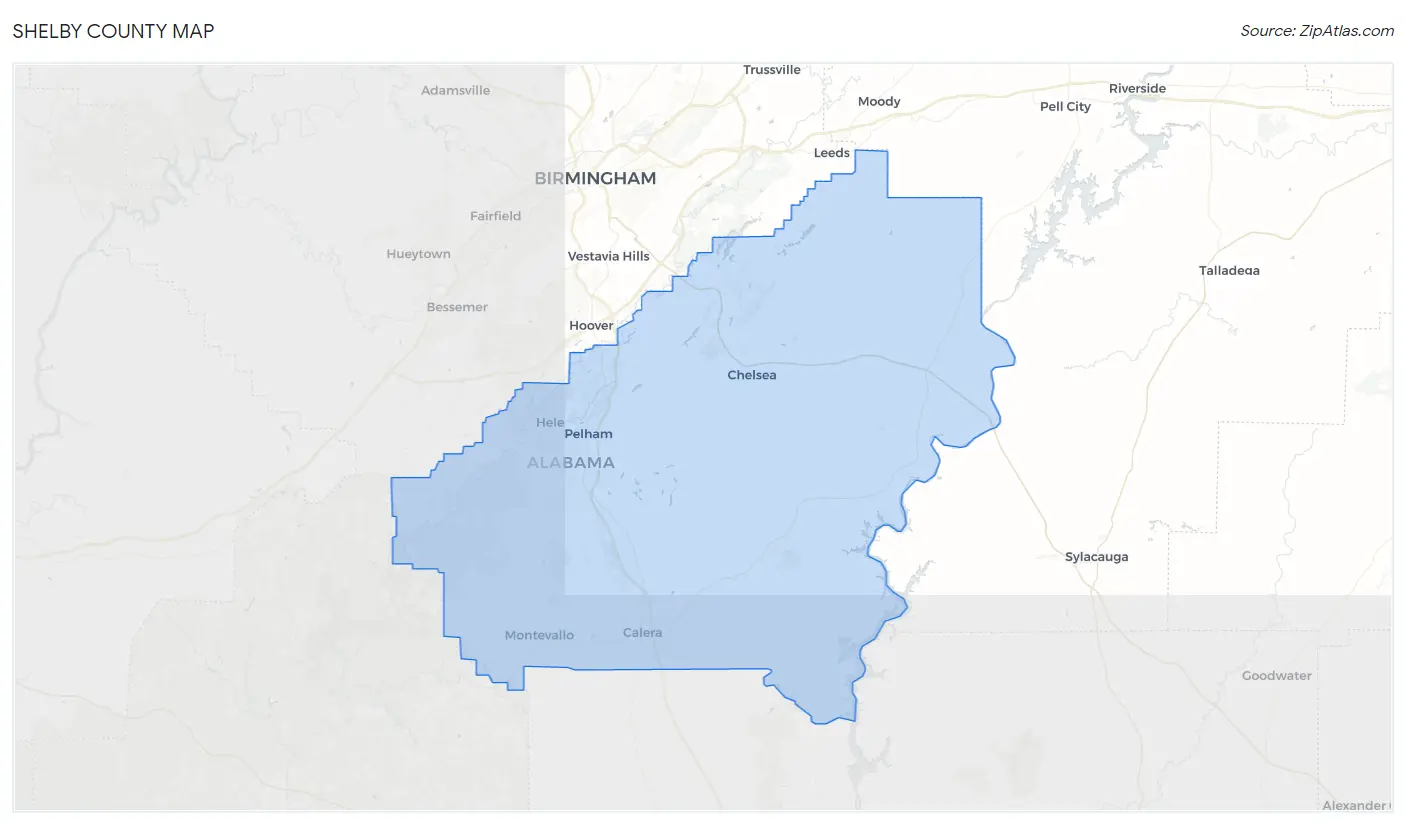
Shelby County Map
Shelby County Overview
$45,701
PER CAPITA INCOME
$112,123
AVG FAMILY INCOME
$90,618
AVG HOUSEHOLD INCOME
34.1%
WAGE / INCOME GAP [ % ]
65.9¢/ $1
WAGE / INCOME GAP [ $ ]
$10,737
FAMILY INCOME DEFICIT
0.44
INEQUALITY / GINI INDEX
223,916
TOTAL POPULATION
109,226
MALE POPULATION
114,690
FEMALE POPULATION
95.24
MALES / 100 FEMALES
105.00
FEMALES / 100 MALES
40.0
MEDIAN AGE
3.1
AVG FAMILY SIZE
2.6
AVG HOUSEHOLD SIZE
117,441
LABOR FORCE [ PEOPLE ]
65.5%
PERCENT IN LABOR FORCE
3.1%
UNEMPLOYMENT RATE
Shelby County Area Codes
Income in Shelby County
Income Overview in Shelby County
Per Capita Income in Shelby County is $45,701, while median incomes of families and households are $112,123 and $90,618 respectively.
| Characteristic | Number | Measure |
| Per Capita Income | 223,916 | $45,701 |
| Median Family Income | 59,991 | $112,123 |
| Mean Family Income | 59,991 | $138,591 |
| Median Household Income | 83,776 | $90,618 |
| Mean Household Income | 83,776 | $118,066 |
| Income Deficit | 59,991 | $10,737 |
| Wage / Income Gap (%) | 223,916 | 34.13% |
| Wage / Income Gap ($) | 223,916 | 65.87¢ per $1 |
| Gini / Inequality Index | 223,916 | 0.44 |
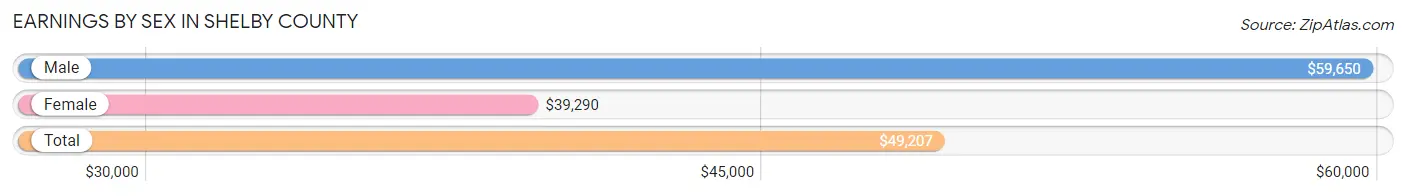
Earnings by Sex in Shelby County
Average Earnings in Shelby County are $49,207, $59,650 for men and $39,290 for women, a difference of 34.1%.
| Sex | Number | Average Earnings |
| Male | 64,625 (52.7%) | $59,650 |
| Female | 57,962 (47.3%) | $39,290 |
| Total | 122,587 (100.0%) | $49,207 |
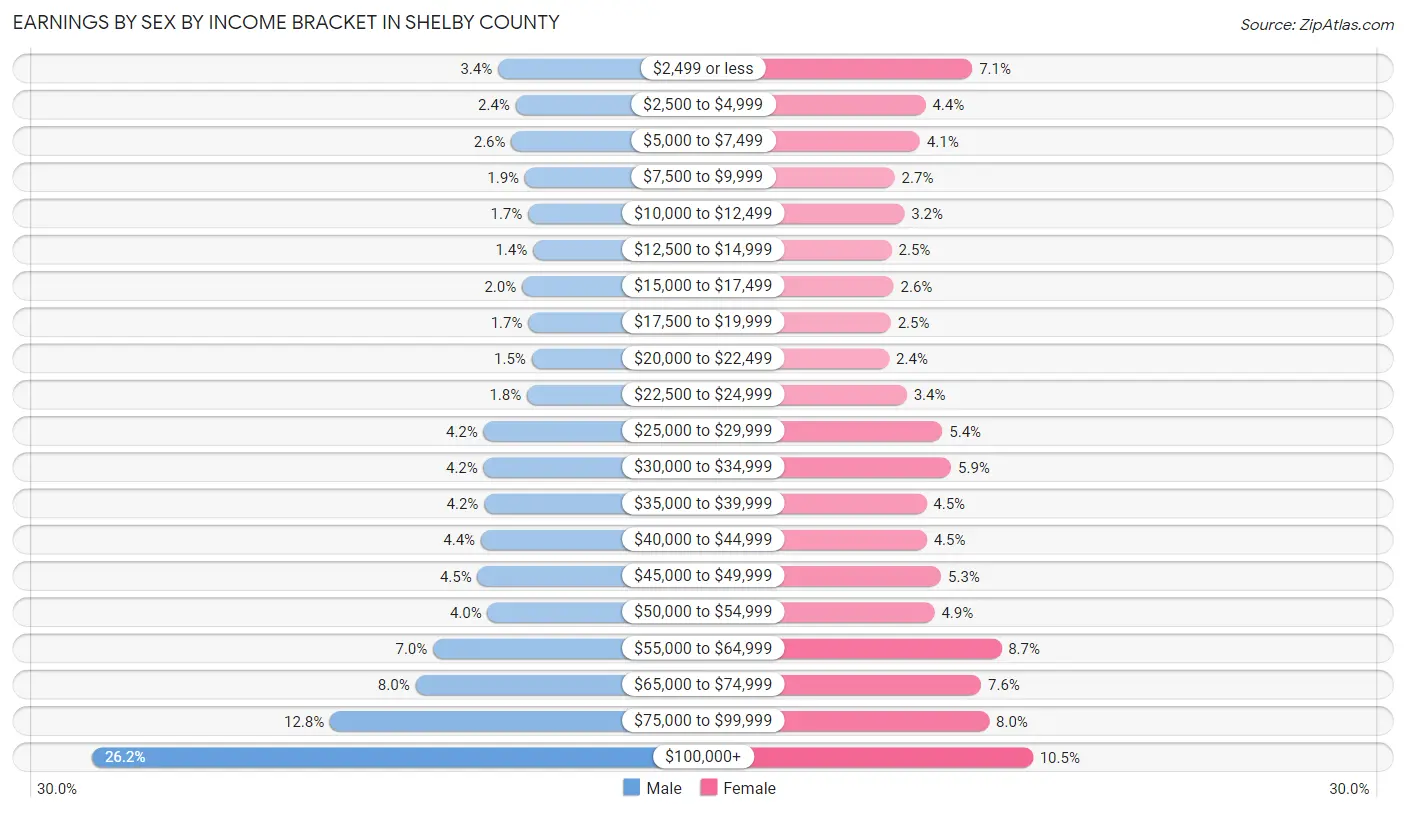
Earnings by Sex by Income Bracket in Shelby County
The most common earnings brackets in Shelby County are $100,000+ for men (16,940 | 26.2%) and $100,000+ for women (6,058 | 10.4%).
| Income | Male | Female |
| $2,499 or less | 2,193 (3.4%) | 4,086 (7.0%) |
| $2,500 to $4,999 | 1,554 (2.4%) | 2,564 (4.4%) |
| $5,000 to $7,499 | 1,708 (2.6%) | 2,383 (4.1%) |
| $7,500 to $9,999 | 1,213 (1.9%) | 1,558 (2.7%) |
| $10,000 to $12,499 | 1,101 (1.7%) | 1,873 (3.2%) |
| $12,500 to $14,999 | 920 (1.4%) | 1,462 (2.5%) |
| $15,000 to $17,499 | 1,319 (2.0%) | 1,523 (2.6%) |
| $17,500 to $19,999 | 1,090 (1.7%) | 1,433 (2.5%) |
| $20,000 to $22,499 | 972 (1.5%) | 1,379 (2.4%) |
| $22,500 to $24,999 | 1,137 (1.8%) | 1,955 (3.4%) |
| $25,000 to $29,999 | 2,712 (4.2%) | 3,115 (5.4%) |
| $30,000 to $34,999 | 2,716 (4.2%) | 3,399 (5.9%) |
| $35,000 to $39,999 | 2,694 (4.2%) | 2,593 (4.5%) |
| $40,000 to $44,999 | 2,809 (4.3%) | 2,604 (4.5%) |
| $45,000 to $49,999 | 2,936 (4.5%) | 3,072 (5.3%) |
| $50,000 to $54,999 | 2,575 (4.0%) | 2,857 (4.9%) |
| $55,000 to $64,999 | 4,552 (7.0%) | 5,031 (8.7%) |
| $65,000 to $74,999 | 5,190 (8.0%) | 4,378 (7.5%) |
| $75,000 to $99,999 | 8,294 (12.8%) | 4,639 (8.0%) |
| $100,000+ | 16,940 (26.2%) | 6,058 (10.4%) |
| Total | 64,625 (100.0%) | 57,962 (100.0%) |
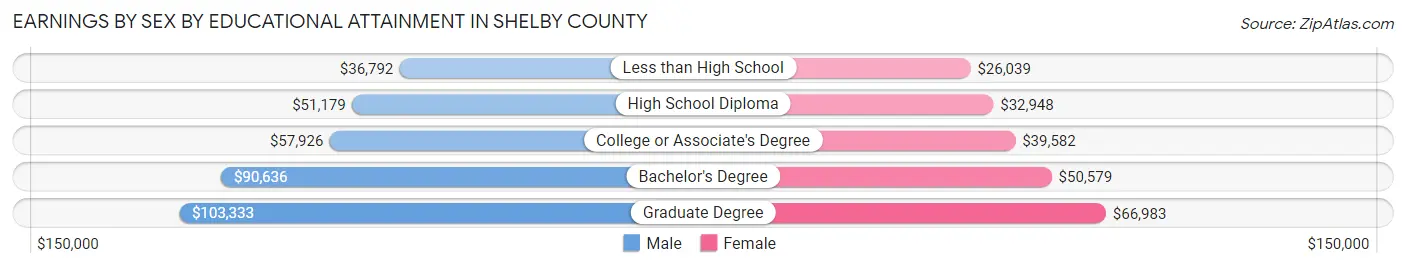
Earnings by Sex by Educational Attainment in Shelby County
Average earnings in Shelby County are $69,053 for men and $46,204 for women, a difference of 33.1%. Men with an educational attainment of graduate degree enjoy the highest average annual earnings of $103,333, while those with less than high school education earn the least with $36,792. Women with an educational attainment of graduate degree earn the most with the average annual earnings of $66,983, while those with less than high school education have the smallest earnings of $26,039.
| Educational Attainment | Male Income | Female Income |
| Less than High School | $36,792 | $26,039 |
| High School Diploma | $51,179 | $32,948 |
| College or Associate's Degree | $57,926 | $39,582 |
| Bachelor's Degree | $90,636 | $50,579 |
| Graduate Degree | $103,333 | $66,983 |
| Total | $69,053 | $46,204 |
Family Income in Shelby County
Family Income Brackets in Shelby County
According to the Shelby County family income data, there are 14,878 families falling into the $100,000 to $149,999 income range, which is the most common income bracket and makes up 24.8% of all families. Conversely, the $10,000 to $14,999 income bracket is the least frequent group with only 720 families (1.2%) belonging to this category.
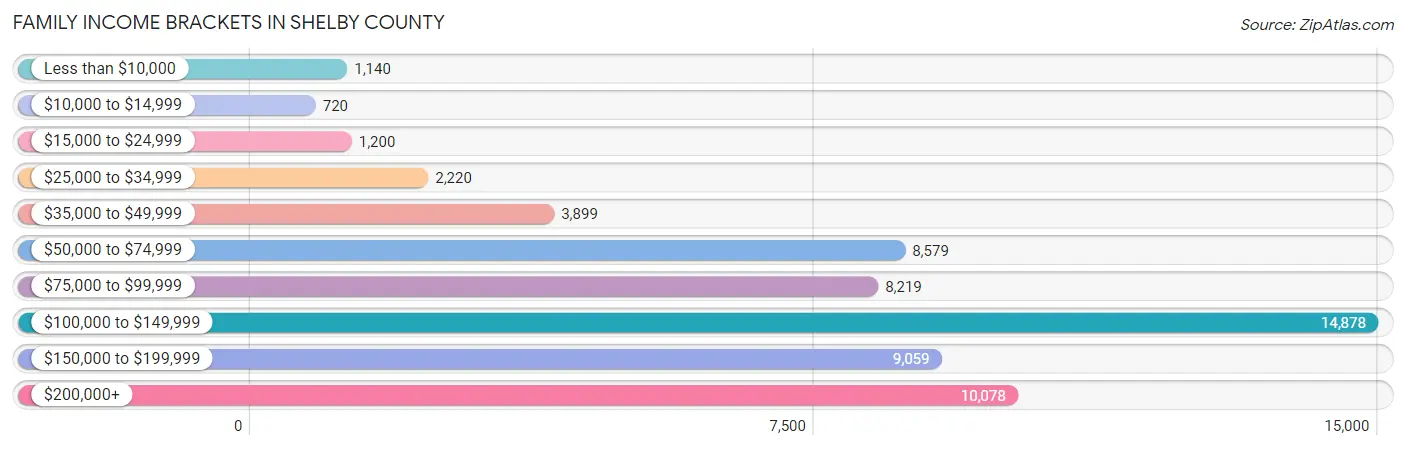
| Income Bracket | # Families | % Families |
| Less than $10,000 | 1,140 | 1.9% |
| $10,000 to $14,999 | 720 | 1.2% |
| $15,000 to $24,999 | 1,200 | 2.0% |
| $25,000 to $34,999 | 2,220 | 3.7% |
| $35,000 to $49,999 | 3,899 | 6.5% |
| $50,000 to $74,999 | 8,579 | 14.3% |
| $75,000 to $99,999 | 8,219 | 13.7% |
| $100,000 to $149,999 | 14,878 | 24.8% |
| $150,000 to $199,999 | 9,059 | 15.1% |
| $200,000+ | 10,078 | 16.8% |
Family Income by Famaliy Size in Shelby County
4-person families (11,548 | 19.3%) account for the highest median family income in Shelby County with $132,422 per family, while 2-person families (28,651 | 47.8%) have the highest median income of $47,448 per family member.
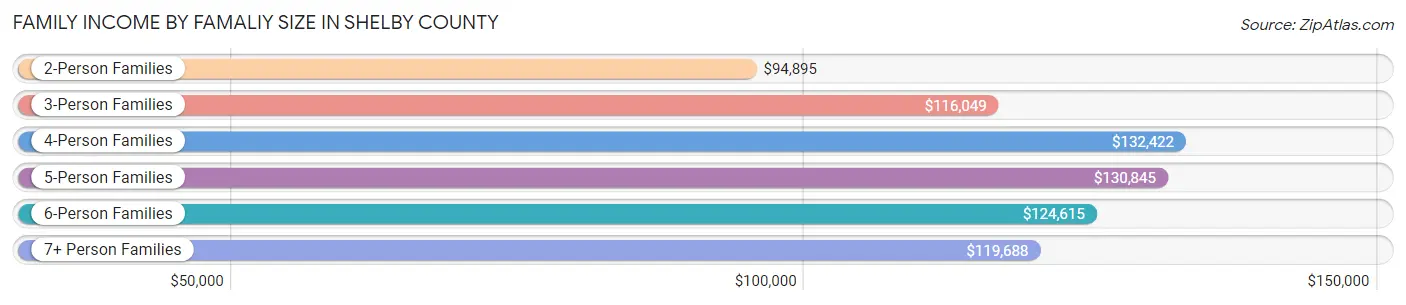
| Income Bracket | # Families | Median Income |
| 2-Person Families | 28,651 (47.8%) | $94,895 |
| 3-Person Families | 13,886 (23.2%) | $116,049 |
| 4-Person Families | 11,548 (19.3%) | $132,422 |
| 5-Person Families | 3,991 (6.7%) | $130,845 |
| 6-Person Families | 1,394 (2.3%) | $124,615 |
| 7+ Person Families | 521 (0.9%) | $119,688 |
| Total | 59,991 (100.0%) | $112,123 |
Family Income by Number of Earners in Shelby County
The median family income in Shelby County is $112,123, with families comprising 3+ earners (6,469) having the highest median family income of $164,306, while families with no earners (8,013) have the lowest median family income of $61,018, accounting for 10.8% and 13.4% of families, respectively.
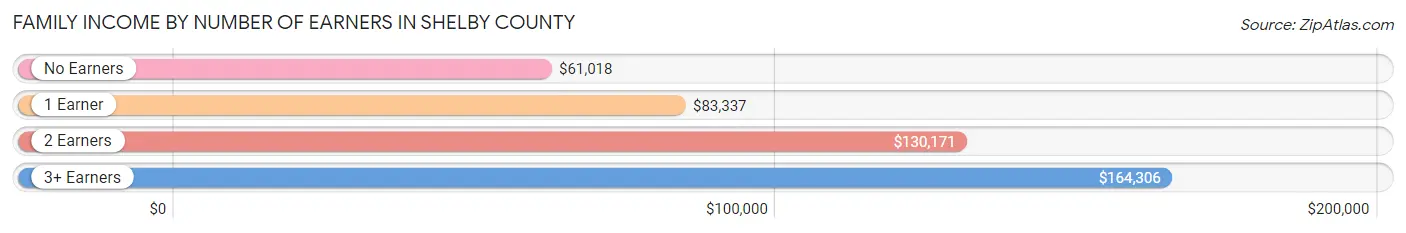
| Number of Earners | # Families | Median Income |
| No Earners | 8,013 (13.4%) | $61,018 |
| 1 Earner | 17,328 (28.9%) | $83,337 |
| 2 Earners | 28,181 (47.0%) | $130,171 |
| 3+ Earners | 6,469 (10.8%) | $164,306 |
| Total | 59,991 (100.0%) | $112,123 |
Household Income in Shelby County
Household Income Brackets in Shelby County
With 17,342 households falling in the category, the $100,000 to $149,999 income range is the most frequent in Shelby County, accounting for 20.7% of all households. In contrast, only 1,927 households (2.3%) fall into the $10,000 to $14,999 income bracket, making it the least populous group.
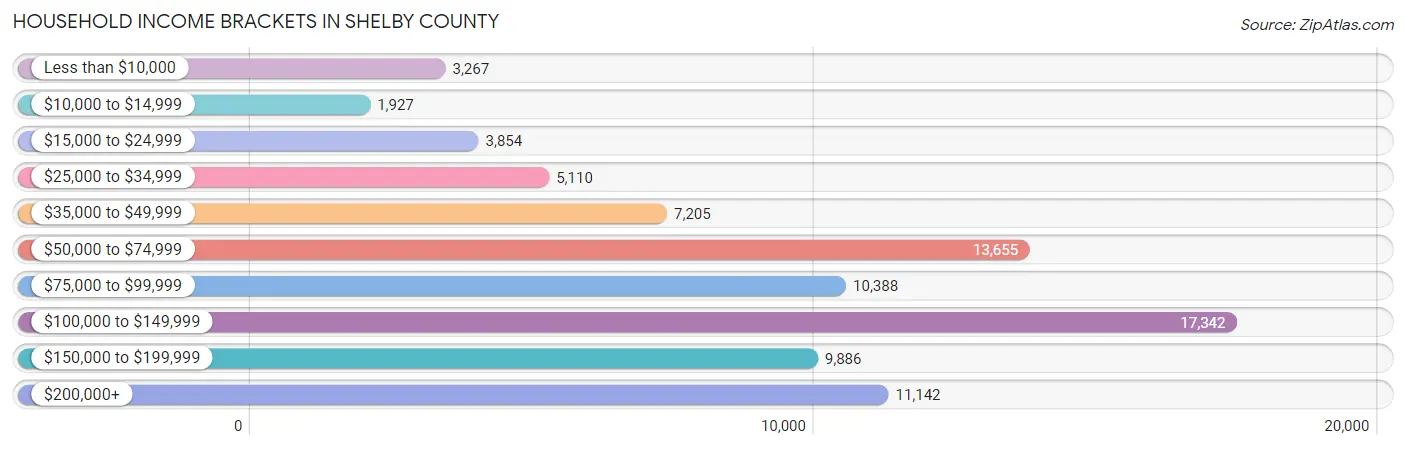
| Income Bracket | # Households | % Households |
| Less than $10,000 | 3,267 | 3.9% |
| $10,000 to $14,999 | 1,927 | 2.3% |
| $15,000 to $24,999 | 3,854 | 4.6% |
| $25,000 to $34,999 | 5,110 | 6.1% |
| $35,000 to $49,999 | 7,205 | 8.6% |
| $50,000 to $74,999 | 13,655 | 16.3% |
| $75,000 to $99,999 | 10,388 | 12.4% |
| $100,000 to $149,999 | 17,342 | 20.7% |
| $150,000 to $199,999 | 9,886 | 11.8% |
| $200,000+ | 11,142 | 13.3% |
Household Income by Householder Age in Shelby County
The median household income in Shelby County is $90,618, with the highest median household income of $116,117 found in the 45 to 64 years age bracket for the primary householder. A total of 33,182 households (39.6%) fall into this category. Meanwhile, the 15 to 24 years age bracket for the primary householder has the lowest median household income of $54,324, with 2,029 households (2.4%) in this group.
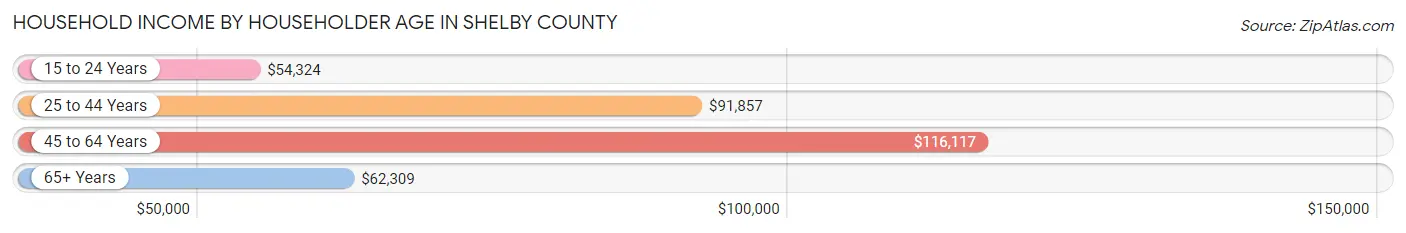
| Income Bracket | # Households | Median Income |
| 15 to 24 Years | 2,029 (2.4%) | $54,324 |
| 25 to 44 Years | 27,046 (32.3%) | $91,857 |
| 45 to 64 Years | 33,182 (39.6%) | $116,117 |
| 65+ Years | 21,519 (25.7%) | $62,309 |
| Total | 83,776 (100.0%) | $90,618 |
Poverty in Shelby County
Income Below Poverty by Sex and Age in Shelby County
With 6.2% poverty level for males and 7.5% for females among the residents of Shelby County, 5 year old males and 18 to 24 year old females are the most vulnerable to poverty, with 160 males (11.6%) and 1,036 females (12.4%) in their respective age groups living below the poverty level.
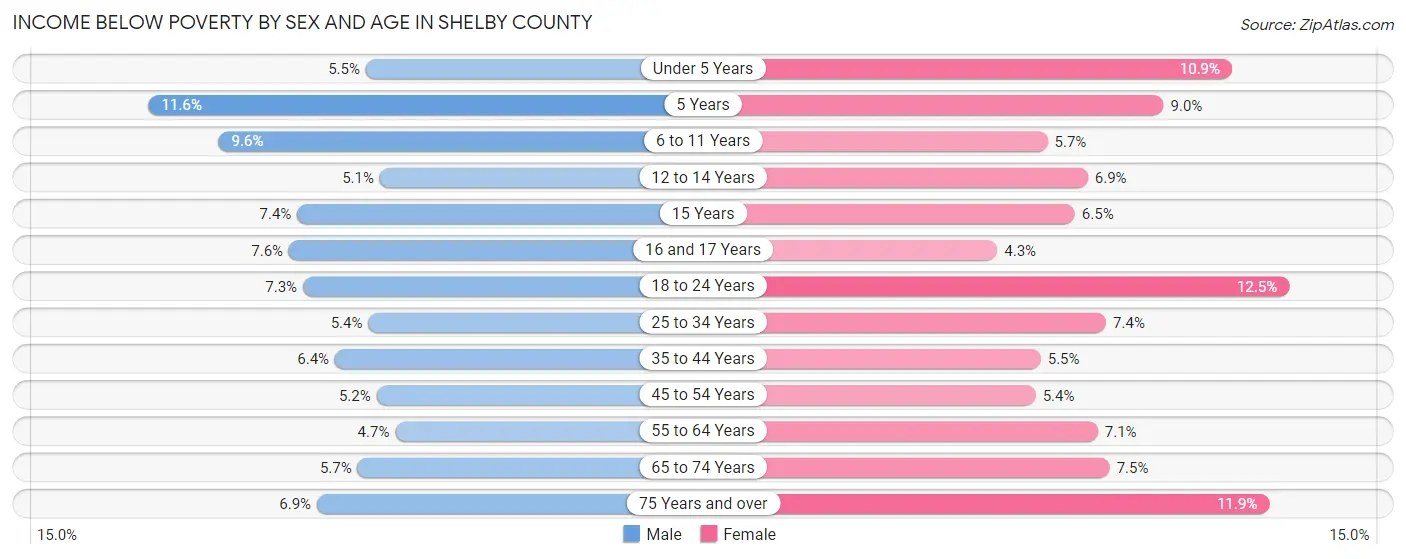
| Age Bracket | Male | Female |
| Under 5 Years | 327 (5.5%) | 641 (10.9%) |
| 5 Years | 160 (11.6%) | 106 (9.0%) |
| 6 to 11 Years | 866 (9.6%) | 496 (5.7%) |
| 12 to 14 Years | 226 (5.1%) | 305 (6.9%) |
| 15 Years | 127 (7.4%) | 99 (6.5%) |
| 16 and 17 Years | 246 (7.6%) | 139 (4.3%) |
| 18 to 24 Years | 659 (7.2%) | 1,036 (12.4%) |
| 25 to 34 Years | 700 (5.4%) | 1,010 (7.4%) |
| 35 to 44 Years | 934 (6.4%) | 857 (5.5%) |
| 45 to 54 Years | 798 (5.2%) | 845 (5.4%) |
| 55 to 64 Years | 647 (4.7%) | 1,049 (7.1%) |
| 65 to 74 Years | 583 (5.7%) | 877 (7.5%) |
| 75 Years and over | 388 (6.9%) | 959 (11.9%) |
| Total | 6,661 (6.2%) | 8,419 (7.5%) |
Income Above Poverty by Sex and Age in Shelby County
According to the poverty statistics in Shelby County, males aged 55 to 64 years and females aged 16 and 17 years are the age groups that are most secure financially, with 95.3% of males and 95.7% of females in these age groups living above the poverty line.
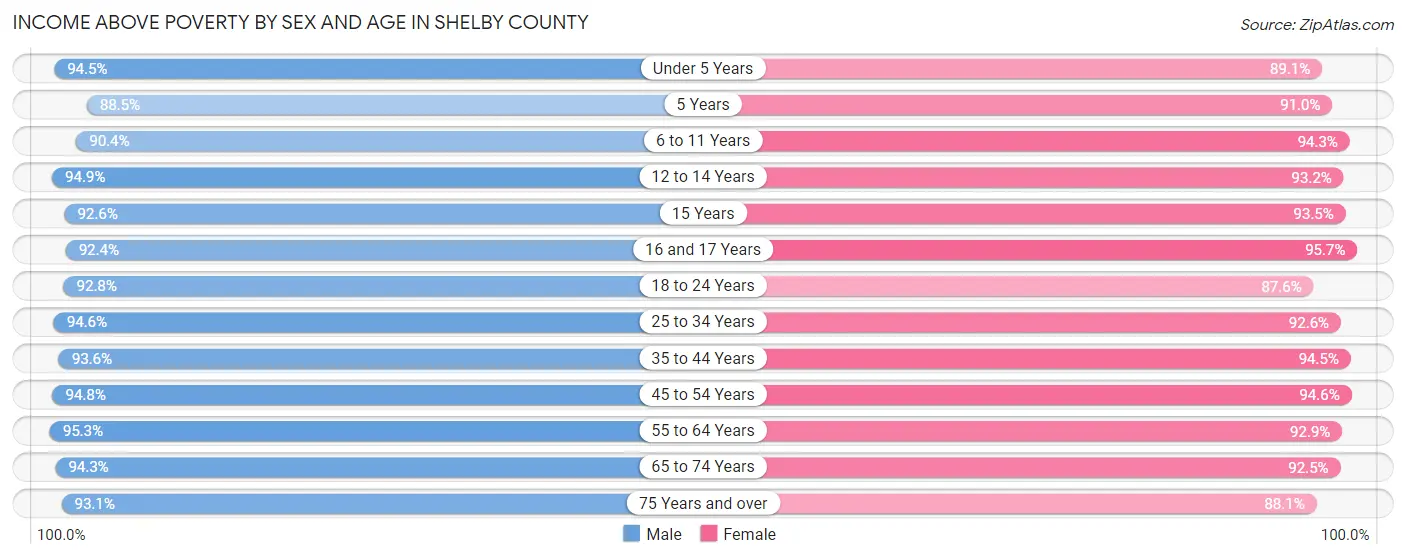
| Age Bracket | Male | Female |
| Under 5 Years | 5,621 (94.5%) | 5,264 (89.1%) |
| 5 Years | 1,225 (88.4%) | 1,077 (91.0%) |
| 6 to 11 Years | 8,153 (90.4%) | 8,164 (94.3%) |
| 12 to 14 Years | 4,197 (94.9%) | 4,145 (93.1%) |
| 15 Years | 1,586 (92.6%) | 1,426 (93.5%) |
| 16 and 17 Years | 2,972 (92.4%) | 3,072 (95.7%) |
| 18 to 24 Years | 8,436 (92.7%) | 7,286 (87.5%) |
| 25 to 34 Years | 12,184 (94.6%) | 12,716 (92.6%) |
| 35 to 44 Years | 13,763 (93.6%) | 14,609 (94.5%) |
| 45 to 54 Years | 14,562 (94.8%) | 14,808 (94.6%) |
| 55 to 64 Years | 13,191 (95.3%) | 13,655 (92.9%) |
| 65 to 74 Years | 9,588 (94.3%) | 10,882 (92.5%) |
| 75 Years and over | 5,267 (93.1%) | 7,100 (88.1%) |
| Total | 100,745 (93.8%) | 104,204 (92.5%) |
Income Below Poverty Among Married-Couple Families in Shelby County
The poverty statistics for married-couple families in Shelby County show that 2.9% or 1,453 of the total 49,691 families live below the poverty line. Families with 3 or 4 children have the highest poverty rate of 5.9%, comprising of 193 families. On the other hand, families with 5 or more children have the lowest poverty rate of 0.0%, which includes 0 families.
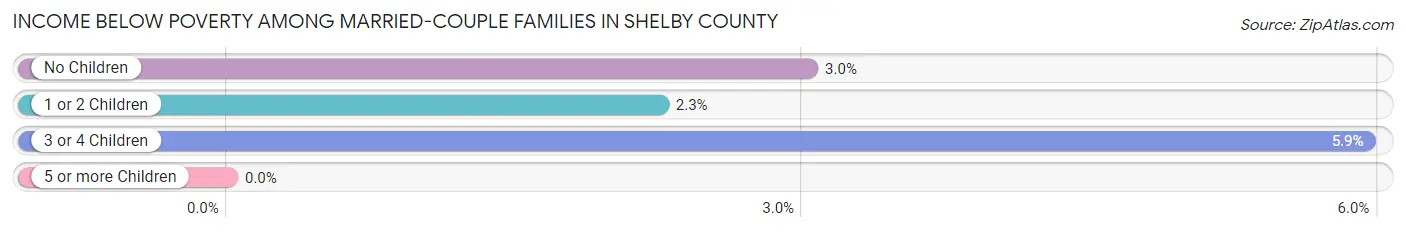
| Children | Above Poverty | Below Poverty |
| No Children | 27,236 (97.0%) | 850 (3.0%) |
| 1 or 2 Children | 17,778 (97.8%) | 410 (2.2%) |
| 3 or 4 Children | 3,057 (94.1%) | 193 (5.9%) |
| 5 or more Children | 167 (100.0%) | 0 (0.0%) |
| Total | 48,238 (97.1%) | 1,453 (2.9%) |
Income Below Poverty Among Single-Parent Households in Shelby County
According to the poverty data in Shelby County, 9.0% or 248 single-father households and 14.9% or 1,126 single-mother households are living below the poverty line. Among single-father households, those with 1 or 2 children have the highest poverty rate, with 117 households (10.9%) experiencing poverty. Likewise, among single-mother households, those with 5 or more children have the highest poverty rate, with 33 households (37.9%) falling below the poverty line.
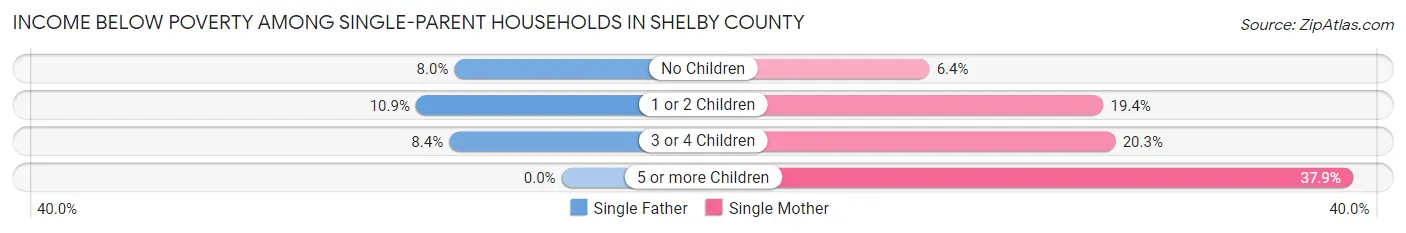
| Children | Single Father | Single Mother |
| No Children | 115 (8.0%) | 177 (6.4%) |
| 1 or 2 Children | 117 (10.9%) | 796 (19.4%) |
| 3 or 4 Children | 16 (8.4%) | 120 (20.3%) |
| 5 or more Children | 0 (0.0%) | 33 (37.9%) |
| Total | 248 (9.0%) | 1,126 (14.9%) |
Income Below Poverty Among Married-Couple vs Single-Parent Households in Shelby County
The poverty data for Shelby County shows that 1,453 of the married-couple family households (2.9%) and 1,374 of the single-parent households (13.3%) are living below the poverty level. Within the married-couple family households, those with 3 or 4 children have the highest poverty rate, with 193 households (5.9%) falling below the poverty line. Among the single-parent households, those with 5 or more children have the highest poverty rate, with 33 household (25.4%) living below poverty.
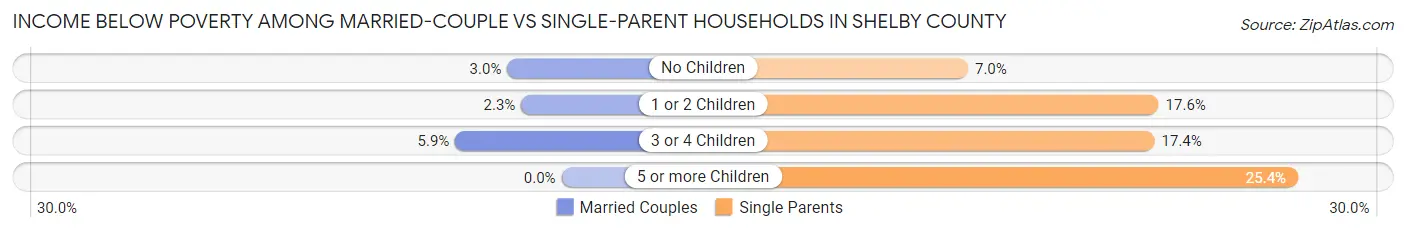
| Children | Married-Couple Families | Single-Parent Households |
| No Children | 850 (3.0%) | 292 (7.0%) |
| 1 or 2 Children | 410 (2.2%) | 913 (17.6%) |
| 3 or 4 Children | 193 (5.9%) | 136 (17.4%) |
| 5 or more Children | 0 (0.0%) | 33 (25.4%) |
| Total | 1,453 (2.9%) | 1,374 (13.3%) |
Race in Shelby County
The most populous races in Shelby County are White / Caucasian (174,752 | 78.0%), Black / African American (29,118 | 13.0%), and Hispanic or Latino (13,195 | 5.9%).
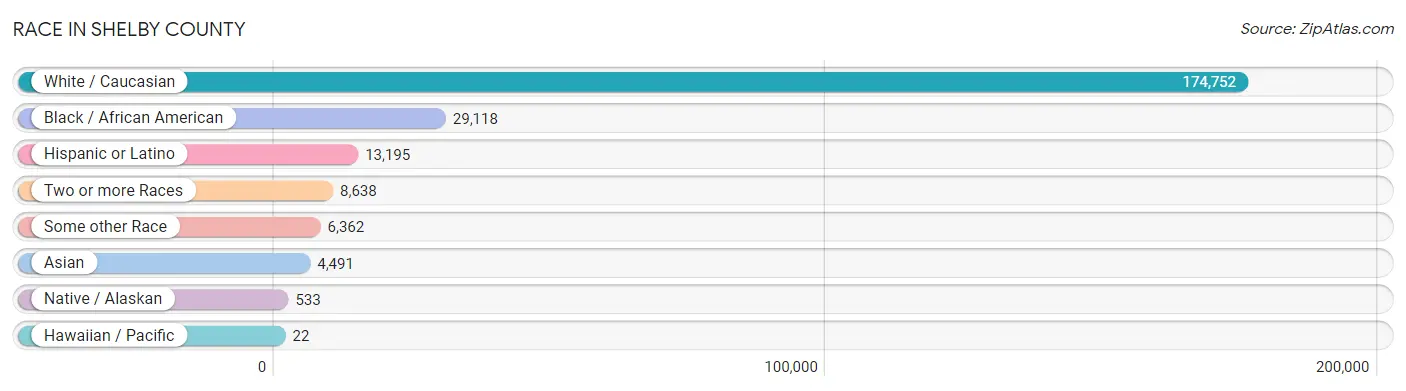
| Race | # Population | % Population |
| Asian | 4,491 | 2.0% |
| Black / African American | 29,118 | 13.0% |
| Hawaiian / Pacific | 22 | 0.0% |
| Hispanic or Latino | 13,195 | 5.9% |
| Native / Alaskan | 533 | 0.2% |
| White / Caucasian | 174,752 | 78.0% |
| Two or more Races | 8,638 | 3.9% |
| Some other Race | 6,362 | 2.8% |
| Total | 223,916 | 100.0% |
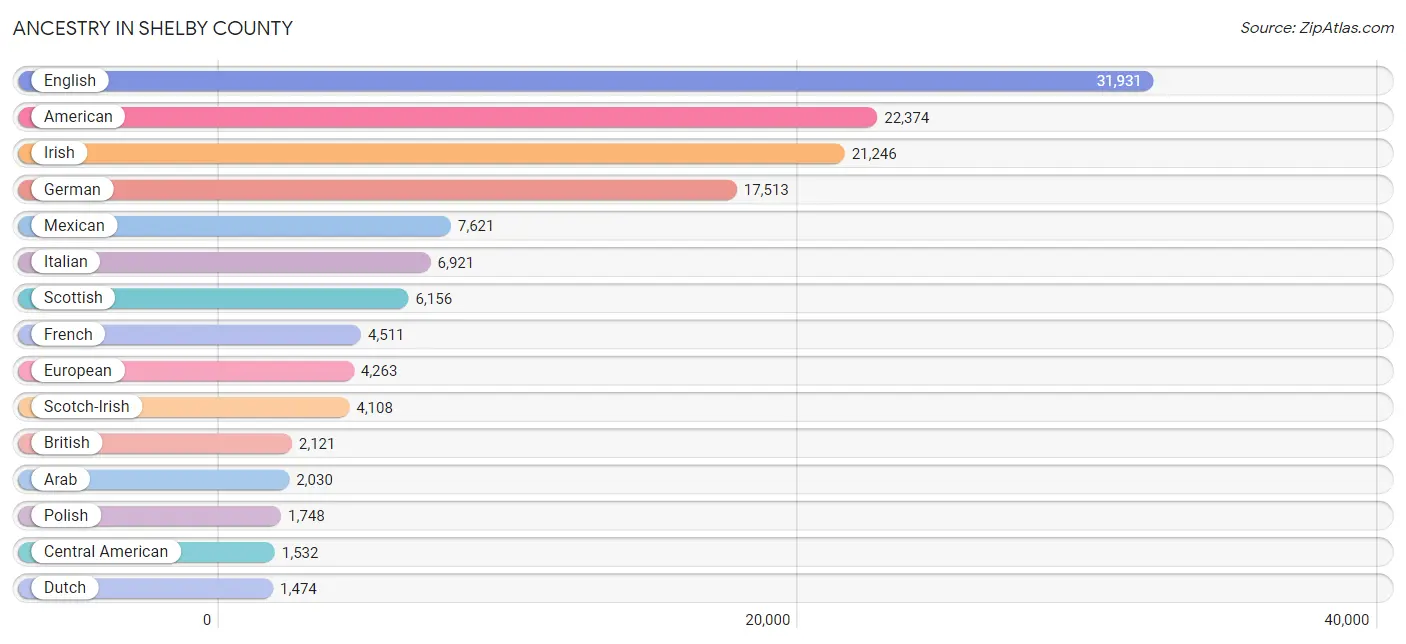
Ancestry in Shelby County
The most populous ancestries reported in Shelby County are English (31,931 | 14.3%), American (22,374 | 10.0%), Irish (21,246 | 9.5%), German (17,513 | 7.8%), and Mexican (7,621 | 3.4%), together accounting for 45.0% of all Shelby County residents.
| Ancestry | # Population | % Population |
| Afghan | 9 | 0.0% |
| African | 750 | 0.3% |
| Albanian | 53 | 0.0% |
| American | 22,374 | 10.0% |
| Apache | 3 | 0.0% |
| Arab | 2,030 | 0.9% |
| Argentinean | 110 | 0.1% |
| Armenian | 7 | 0.0% |
| Australian | 12 | 0.0% |
| Austrian | 238 | 0.1% |
| Belgian | 51 | 0.0% |
| Bhutanese | 469 | 0.2% |
| Blackfeet | 7 | 0.0% |
| Brazilian | 56 | 0.0% |
| British | 2,121 | 0.9% |
| Bulgarian | 3 | 0.0% |
| Burmese | 582 | 0.3% |
| Cajun | 241 | 0.1% |
| Canadian | 221 | 0.1% |
| Cape Verdean | 22 | 0.0% |
| Central American | 1,532 | 0.7% |
| Central American Indian | 103 | 0.1% |
| Cherokee | 516 | 0.2% |
| Chickasaw | 31 | 0.0% |
| Chilean | 58 | 0.0% |
| Chippewa | 5 | 0.0% |
| Choctaw | 83 | 0.0% |
| Colombian | 196 | 0.1% |
| Costa Rican | 28 | 0.0% |
| Creek | 187 | 0.1% |
| Croatian | 141 | 0.1% |
| Cuban | 673 | 0.3% |
| Czech | 248 | 0.1% |
| Czechoslovakian | 72 | 0.0% |
| Danish | 855 | 0.4% |
| Dominican | 68 | 0.0% |
| Dutch | 1,474 | 0.7% |
| Eastern European | 436 | 0.2% |
| Ecuadorian | 141 | 0.1% |
| Egyptian | 169 | 0.1% |
| English | 31,931 | 14.3% |
| European | 4,263 | 1.9% |
| Filipino | 75 | 0.0% |
| Finnish | 169 | 0.1% |
| French | 4,511 | 2.0% |
| French Canadian | 358 | 0.2% |
| German | 17,513 | 7.8% |
| Greek | 724 | 0.3% |
| Guamanian / Chamorro | 70 | 0.0% |
| Guatemalan | 424 | 0.2% |
| Haitian | 62 | 0.0% |
| Honduran | 341 | 0.2% |
| Houma | 11 | 0.0% |
| Hungarian | 552 | 0.3% |
| Indian (Asian) | 1,049 | 0.5% |
| Inupiat | 20 | 0.0% |
| Iranian | 266 | 0.1% |
| Irish | 21,246 | 9.5% |
| Iroquois | 60 | 0.0% |
| Israeli | 7 | 0.0% |
| Italian | 6,921 | 3.1% |
| Jamaican | 73 | 0.0% |
| Japanese | 20 | 0.0% |
| Jordanian | 3 | 0.0% |
| Kenyan | 44 | 0.0% |
| Korean | 897 | 0.4% |
| Laotian | 123 | 0.1% |
| Latvian | 15 | 0.0% |
| Lebanese | 1,252 | 0.6% |
| Lithuanian | 79 | 0.0% |
| Macedonian | 28 | 0.0% |
| Malaysian | 13 | 0.0% |
| Mexican | 7,621 | 3.4% |
| Mexican American Indian | 38 | 0.0% |
| Moroccan | 50 | 0.0% |
| Native Hawaiian | 112 | 0.1% |
| Navajo | 12 | 0.0% |
| Nicaraguan | 28 | 0.0% |
| Nigerian | 433 | 0.2% |
| Northern European | 386 | 0.2% |
| Norwegian | 1,361 | 0.6% |
| Pakistani | 169 | 0.1% |
| Palestinian | 117 | 0.1% |
| Panamanian | 79 | 0.0% |
| Peruvian | 26 | 0.0% |
| Polish | 1,748 | 0.8% |
| Portuguese | 254 | 0.1% |
| Puerto Rican | 1,114 | 0.5% |
| Romanian | 131 | 0.1% |
| Russian | 601 | 0.3% |
| Salvadoran | 632 | 0.3% |
| Scandinavian | 542 | 0.2% |
| Scotch-Irish | 4,108 | 1.8% |
| Scottish | 6,156 | 2.8% |
| Seminole | 4 | 0.0% |
| Shoshone | 14 | 0.0% |
| Sierra Leonean | 22 | 0.0% |
| Sioux | 18 | 0.0% |
| Slavic | 120 | 0.1% |
| Slovak | 136 | 0.1% |
| Slovene | 12 | 0.0% |
| South African | 102 | 0.1% |
| South American | 1,012 | 0.4% |
| Spaniard | 158 | 0.1% |
| Spanish | 329 | 0.2% |
| Sri Lankan | 1,290 | 0.6% |
| Subsaharan African | 1,361 | 0.6% |
| Swedish | 981 | 0.4% |
| Swiss | 345 | 0.2% |
| Syrian | 243 | 0.1% |
| Thai | 1,037 | 0.5% |
| Tongan | 16 | 0.0% |
| Trinidadian and Tobagonian | 10 | 0.0% |
| Turkish | 7 | 0.0% |
| Ukrainian | 340 | 0.2% |
| Venezuelan | 481 | 0.2% |
| Vietnamese | 20 | 0.0% |
| Welsh | 1,446 | 0.6% |
| West Indian | 22 | 0.0% |
| Yugoslavian | 46 | 0.0% | View All 120 Rows |
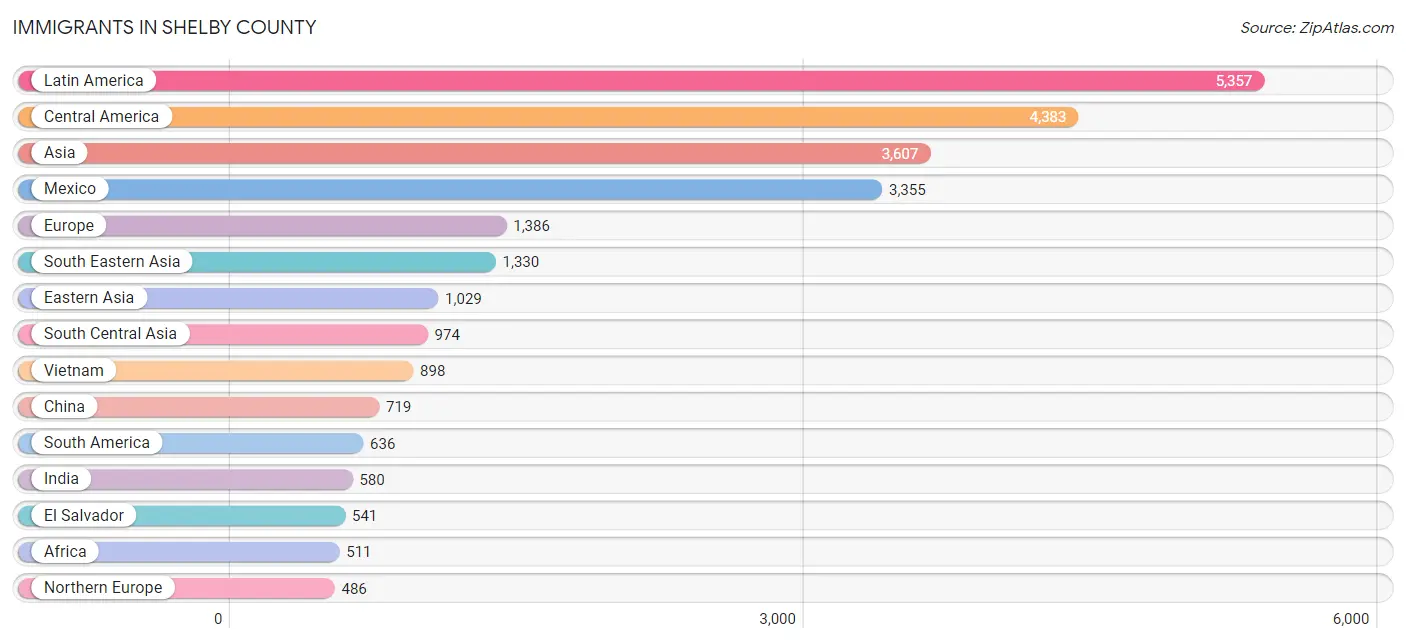
Immigrants in Shelby County
The most numerous immigrant groups reported in Shelby County came from Latin America (5,357 | 2.4%), Central America (4,383 | 2.0%), Asia (3,607 | 1.6%), Mexico (3,355 | 1.5%), and Europe (1,386 | 0.6%), together accounting for 8.1% of all Shelby County residents.
| Immigration Origin | # Population | % Population |
| Afghanistan | 9 | 0.0% |
| Africa | 511 | 0.2% |
| Asia | 3,607 | 1.6% |
| Austria | 62 | 0.0% |
| Bahamas | 13 | 0.0% |
| Bangladesh | 34 | 0.0% |
| Belarus | 106 | 0.1% |
| Belize | 16 | 0.0% |
| Bosnia and Herzegovina | 34 | 0.0% |
| Brazil | 59 | 0.0% |
| Cambodia | 20 | 0.0% |
| Cameroon | 10 | 0.0% |
| Canada | 291 | 0.1% |
| Caribbean | 338 | 0.2% |
| Central America | 4,383 | 2.0% |
| Chile | 69 | 0.0% |
| China | 719 | 0.3% |
| Colombia | 89 | 0.0% |
| Cuba | 280 | 0.1% |
| Czechoslovakia | 10 | 0.0% |
| Denmark | 10 | 0.0% |
| Dominican Republic | 5 | 0.0% |
| Eastern Africa | 106 | 0.1% |
| Eastern Asia | 1,029 | 0.5% |
| Eastern Europe | 434 | 0.2% |
| Ecuador | 82 | 0.0% |
| Egypt | 146 | 0.1% |
| El Salvador | 541 | 0.2% |
| England | 135 | 0.1% |
| Europe | 1,386 | 0.6% |
| France | 26 | 0.0% |
| Germany | 155 | 0.1% |
| Greece | 22 | 0.0% |
| Guatemala | 295 | 0.1% |
| Honduras | 107 | 0.1% |
| Hong Kong | 30 | 0.0% |
| India | 580 | 0.3% |
| Indonesia | 82 | 0.0% |
| Iran | 162 | 0.1% |
| Israel | 14 | 0.0% |
| Italy | 78 | 0.0% |
| Jamaica | 40 | 0.0% |
| Japan | 52 | 0.0% |
| Jordan | 3 | 0.0% |
| Kenya | 91 | 0.0% |
| Korea | 258 | 0.1% |
| Kuwait | 14 | 0.0% |
| Laos | 9 | 0.0% |
| Latin America | 5,357 | 2.4% |
| Lebanon | 132 | 0.1% |
| Mexico | 3,355 | 1.5% |
| Middle Africa | 10 | 0.0% |
| Moldova | 12 | 0.0% |
| Morocco | 9 | 0.0% |
| Nepal | 82 | 0.0% |
| Netherlands | 43 | 0.0% |
| Nicaragua | 8 | 0.0% |
| Nigeria | 131 | 0.1% |
| Northern Africa | 155 | 0.1% |
| Northern Europe | 486 | 0.2% |
| Oceania | 19 | 0.0% |
| Pakistan | 75 | 0.0% |
| Panama | 61 | 0.0% |
| Peru | 15 | 0.0% |
| Philippines | 266 | 0.1% |
| Poland | 31 | 0.0% |
| Portugal | 80 | 0.0% |
| Romania | 23 | 0.0% |
| Russia | 119 | 0.1% |
| Scotland | 19 | 0.0% |
| Sierra Leone | 22 | 0.0% |
| South Africa | 87 | 0.0% |
| South America | 636 | 0.3% |
| South Central Asia | 974 | 0.4% |
| South Eastern Asia | 1,330 | 0.6% |
| Southern Europe | 180 | 0.1% |
| Sri Lanka | 13 | 0.0% |
| Syria | 63 | 0.0% |
| Taiwan | 114 | 0.1% |
| Thailand | 55 | 0.0% |
| Turkey | 7 | 0.0% |
| Uganda | 12 | 0.0% |
| Ukraine | 89 | 0.0% |
| Venezuela | 322 | 0.1% |
| Vietnam | 898 | 0.4% |
| Western Africa | 153 | 0.1% |
| Western Asia | 256 | 0.1% |
| Western Europe | 286 | 0.1% |
| Zimbabwe | 3 | 0.0% | View All 89 Rows |
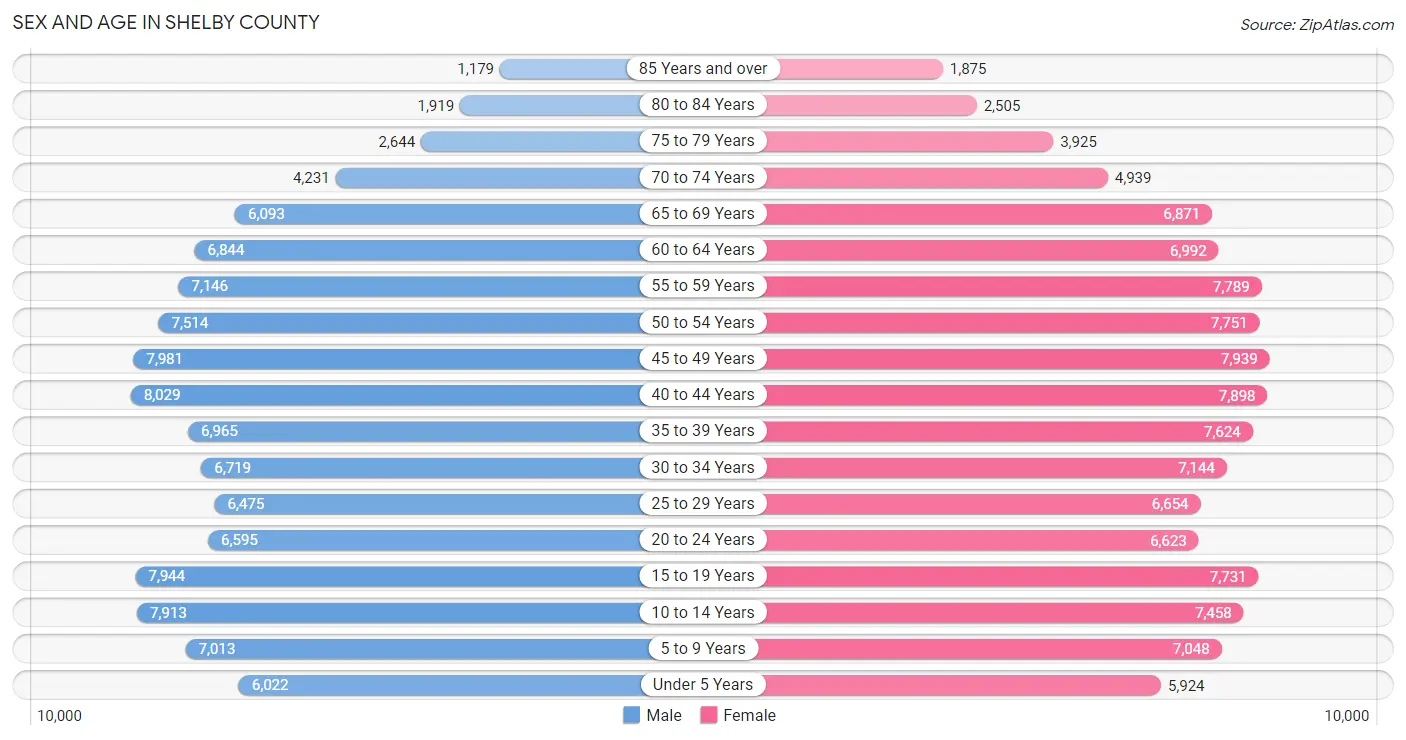
Sex and Age in Shelby County
Sex and Age in Shelby County
The most populous age groups in Shelby County are 40 to 44 Years (8,029 | 7.3%) for men and 45 to 49 Years (7,939 | 6.9%) for women.
| Age Bracket | Male | Female |
| Under 5 Years | 6,022 (5.5%) | 5,924 (5.2%) |
| 5 to 9 Years | 7,013 (6.4%) | 7,048 (6.1%) |
| 10 to 14 Years | 7,913 (7.2%) | 7,458 (6.5%) |
| 15 to 19 Years | 7,944 (7.3%) | 7,731 (6.7%) |
| 20 to 24 Years | 6,595 (6.0%) | 6,623 (5.8%) |
| 25 to 29 Years | 6,475 (5.9%) | 6,654 (5.8%) |
| 30 to 34 Years | 6,719 (6.1%) | 7,144 (6.2%) |
| 35 to 39 Years | 6,965 (6.4%) | 7,624 (6.7%) |
| 40 to 44 Years | 8,029 (7.3%) | 7,898 (6.9%) |
| 45 to 49 Years | 7,981 (7.3%) | 7,939 (6.9%) |
| 50 to 54 Years | 7,514 (6.9%) | 7,751 (6.8%) |
| 55 to 59 Years | 7,146 (6.5%) | 7,789 (6.8%) |
| 60 to 64 Years | 6,844 (6.3%) | 6,992 (6.1%) |
| 65 to 69 Years | 6,093 (5.6%) | 6,871 (6.0%) |
| 70 to 74 Years | 4,231 (3.9%) | 4,939 (4.3%) |
| 75 to 79 Years | 2,644 (2.4%) | 3,925 (3.4%) |
| 80 to 84 Years | 1,919 (1.8%) | 2,505 (2.2%) |
| 85 Years and over | 1,179 (1.1%) | 1,875 (1.6%) |
| Total | 109,226 (100.0%) | 114,690 (100.0%) |
Families and Households in Shelby County
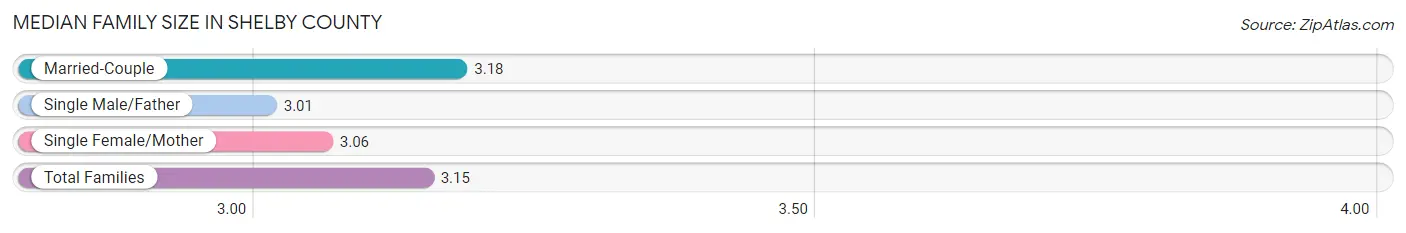
Median Family Size in Shelby County
The median family size in Shelby County is 3.15 persons per family, with married-couple families (49,691 | 82.8%) accounting for the largest median family size of 3.18 persons per family. On the other hand, single male/father families (2,751 | 4.6%) represent the smallest median family size with 3.01 persons per family.
| Family Type | # Families | Family Size |
| Married-Couple | 49,691 (82.8%) | 3.18 |
| Single Male/Father | 2,751 (4.6%) | 3.01 |
| Single Female/Mother | 7,549 (12.6%) | 3.06 |
| Total Families | 59,991 (100.0%) | 3.15 |
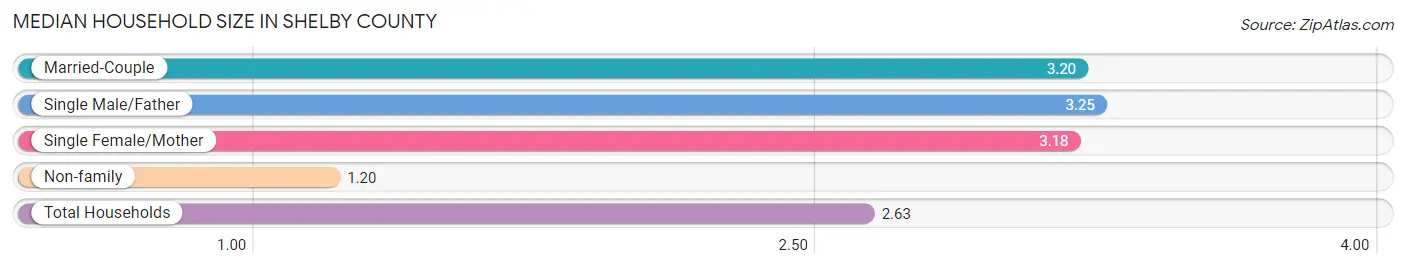
Median Household Size in Shelby County
The median household size in Shelby County is 2.63 persons per household, with single male/father households (2,751 | 3.3%) accounting for the largest median household size of 3.25 persons per household. non-family households (23,785 | 28.4%) represent the smallest median household size with 1.20 persons per household.
| Household Type | # Households | Household Size |
| Married-Couple | 49,691 (59.3%) | 3.20 |
| Single Male/Father | 2,751 (3.3%) | 3.25 |
| Single Female/Mother | 7,549 (9.0%) | 3.18 |
| Non-family | 23,785 (28.4%) | 1.20 |
| Total Households | 83,776 (100.0%) | 2.63 |
Household Size by Marriage Status in Shelby County
Out of a total of 83,776 households in Shelby County, 59,991 (71.6%) are family households, while 23,785 (28.4%) are nonfamily households. The most numerous type of family households are 2-person households, comprising 27,960, and the most common type of nonfamily households are 1-person households, comprising 20,538.
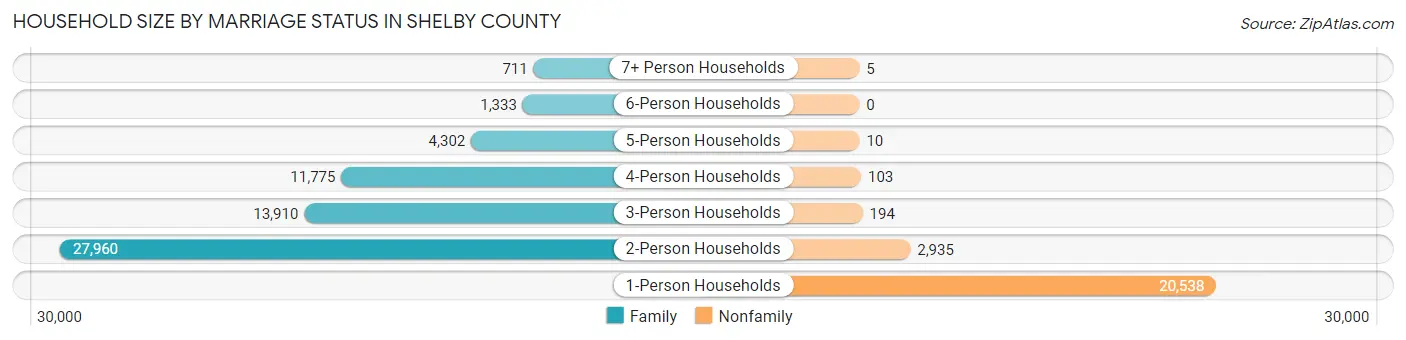
| Household Size | Family Households | Nonfamily Households |
| 1-Person Households | - | 20,538 (24.5%) |
| 2-Person Households | 27,960 (33.4%) | 2,935 (3.5%) |
| 3-Person Households | 13,910 (16.6%) | 194 (0.2%) |
| 4-Person Households | 11,775 (14.1%) | 103 (0.1%) |
| 5-Person Households | 4,302 (5.1%) | 10 (0.0%) |
| 6-Person Households | 1,333 (1.6%) | 0 (0.0%) |
| 7+ Person Households | 711 (0.9%) | 5 (0.0%) |
| Total | 59,991 (71.6%) | 23,785 (28.4%) |
Female Fertility in Shelby County
Fertility by Age in Shelby County
Average fertility rate in Shelby County is 47.0 births per 1,000 women. Women in the age bracket of 20 to 34 years have the highest fertility rate with 94.0 births per 1,000 women. Women in the age bracket of 20 to 34 years acount for 77.5% of all women with births.
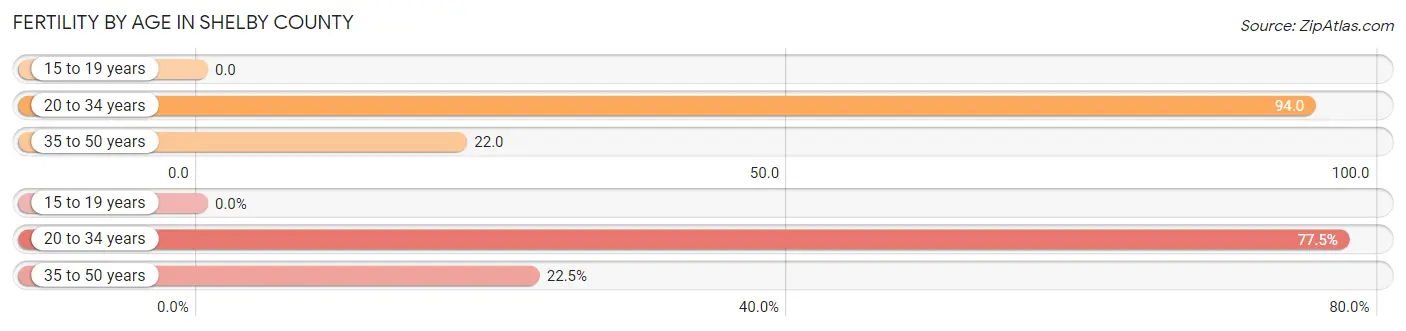
| Age Bracket | Women with Births | Births / 1,000 Women |
| 15 to 19 years | 0 (0.0%) | 0.0 |
| 20 to 34 years | 1,920 (77.5%) | 94.0 |
| 35 to 50 years | 558 (22.5%) | 22.0 |
| Total | 2,478 (100.0%) | 47.0 |
Fertility by Age by Marriage Status in Shelby County
80.8% of women with births (2,478) in Shelby County are married. The highest percentage of unmarried women with births falls into 20 to 34 years age bracket with 21.6% of them unmarried at the time of birth, while the lowest percentage of unmarried women with births belong to 35 to 50 years age bracket with 10.9% of them unmarried.
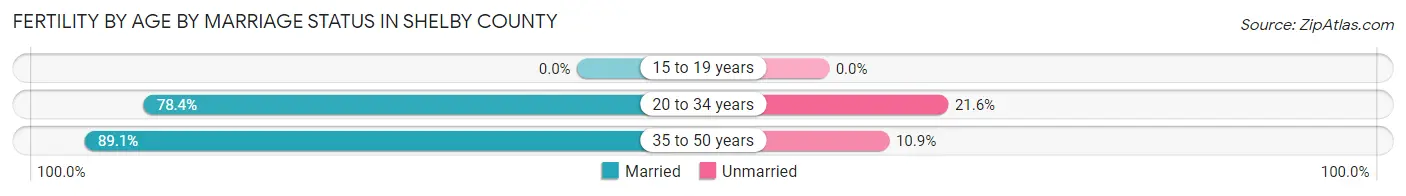
| Age Bracket | Married | Unmarried |
| 15 to 19 years | 0 (0.0%) | 0 (0.0%) |
| 20 to 34 years | 1,505 (78.4%) | 415 (21.6%) |
| 35 to 50 years | 497 (89.1%) | 61 (10.9%) |
| Total | 2,002 (80.8%) | 476 (19.2%) |
Fertility by Education in Shelby County
Average fertility rate in Shelby County is 47.0 births per 1,000 women. Women with the education attainment of high school diploma have the highest fertility rate of 63.0 births per 1,000 women, while women with the education attainment of less than high school have the lowest fertility at 17.0 births per 1,000 women. Women with the education attainment of college or associate's degree represent 35.7% of all women with births.
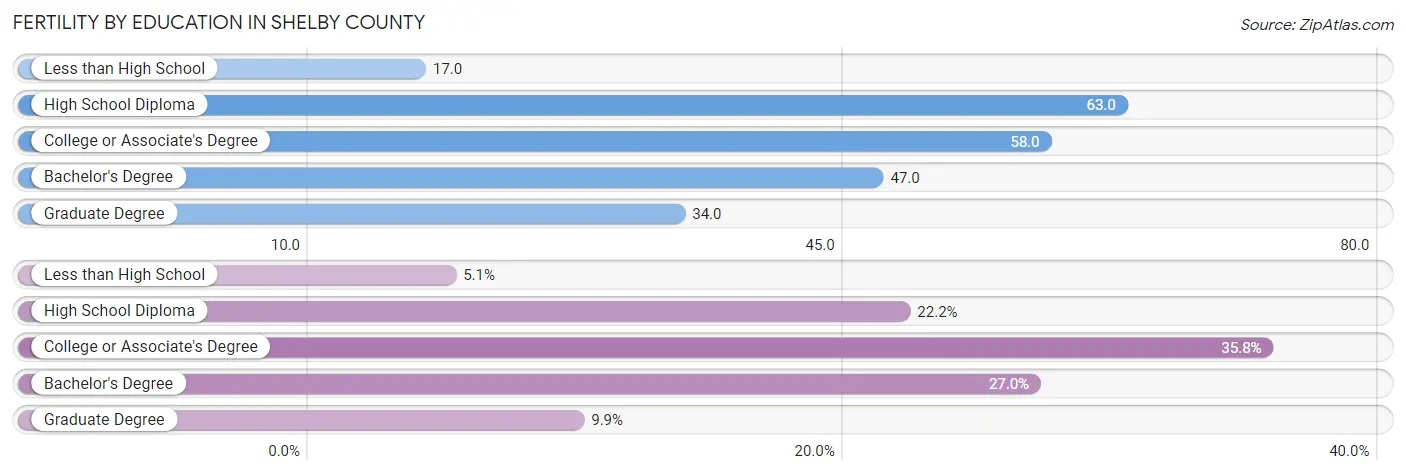
| Educational Attainment | Women with Births | Births / 1,000 Women |
| Less than High School | 127 (5.1%) | 17.0 |
| High School Diploma | 549 (22.2%) | 63.0 |
| College or Associate's Degree | 886 (35.7%) | 58.0 |
| Bachelor's Degree | 670 (27.0%) | 47.0 |
| Graduate Degree | 246 (9.9%) | 34.0 |
| Total | 2,478 (100.0%) | 47.0 |
Fertility by Education by Marriage Status in Shelby County
19.2% of women with births in Shelby County are unmarried. Women with the educational attainment of bachelor's degree are most likely to be married with 94.9% of them married at childbirth, while women with the educational attainment of high school diploma are least likely to be married with 28.8% of them unmarried at childbirth.
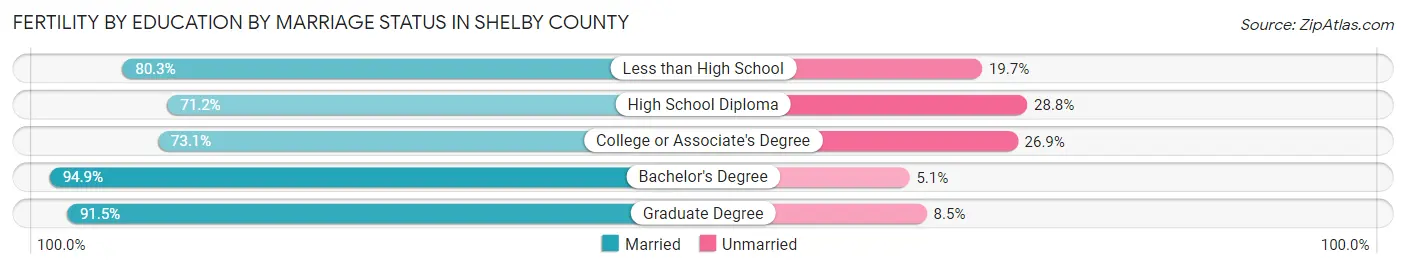
| Educational Attainment | Married | Unmarried |
| Less than High School | 102 (80.3%) | 25 (19.7%) |
| High School Diploma | 391 (71.2%) | 158 (28.8%) |
| College or Associate's Degree | 648 (73.1%) | 238 (26.9%) |
| Bachelor's Degree | 636 (94.9%) | 34 (5.1%) |
| Graduate Degree | 225 (91.5%) | 21 (8.5%) |
| Total | 2,002 (80.8%) | 476 (19.2%) |
Employment Characteristics in Shelby County
Employment by Class of Employer in Shelby County
Among the 112,772 employed individuals in Shelby County, private company employees (77,151 | 68.4%), not-for-profit organizations (9,475 | 8.4%), and local government employees (7,841 | 7.0%) make up the most common classes of employment.
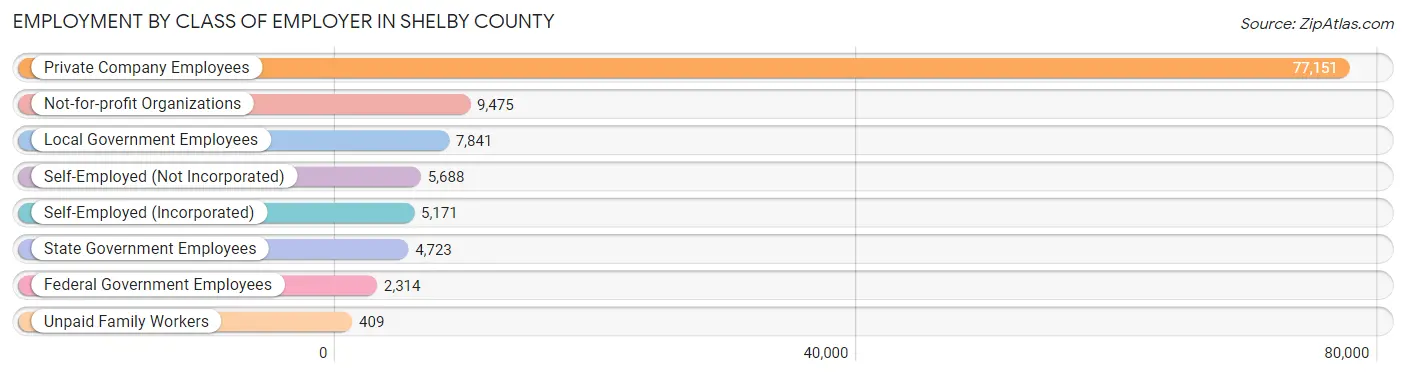
| Employer Class | # Employees | % Employees |
| Private Company Employees | 77,151 | 68.4% |
| Self-Employed (Incorporated) | 5,171 | 4.6% |
| Self-Employed (Not Incorporated) | 5,688 | 5.0% |
| Not-for-profit Organizations | 9,475 | 8.4% |
| Local Government Employees | 7,841 | 7.0% |
| State Government Employees | 4,723 | 4.2% |
| Federal Government Employees | 2,314 | 2.1% |
| Unpaid Family Workers | 409 | 0.4% |
| Total | 112,772 | 100.0% |
Employment Status by Age in Shelby County
According to the labor force statistics for Shelby County, out of the total population over 16 years of age (179,299), 65.5% or 117,441 individuals are in the labor force, with 3.1% or 3,641 of them unemployed. The age group with the highest labor force participation rate is 30 to 34 years, with 87.9% or 12,186 individuals in the labor force. Within the labor force, the 16 to 19 years age range has the highest percentage of unemployed individuals, with 10.6% or 556 of them being unemployed.
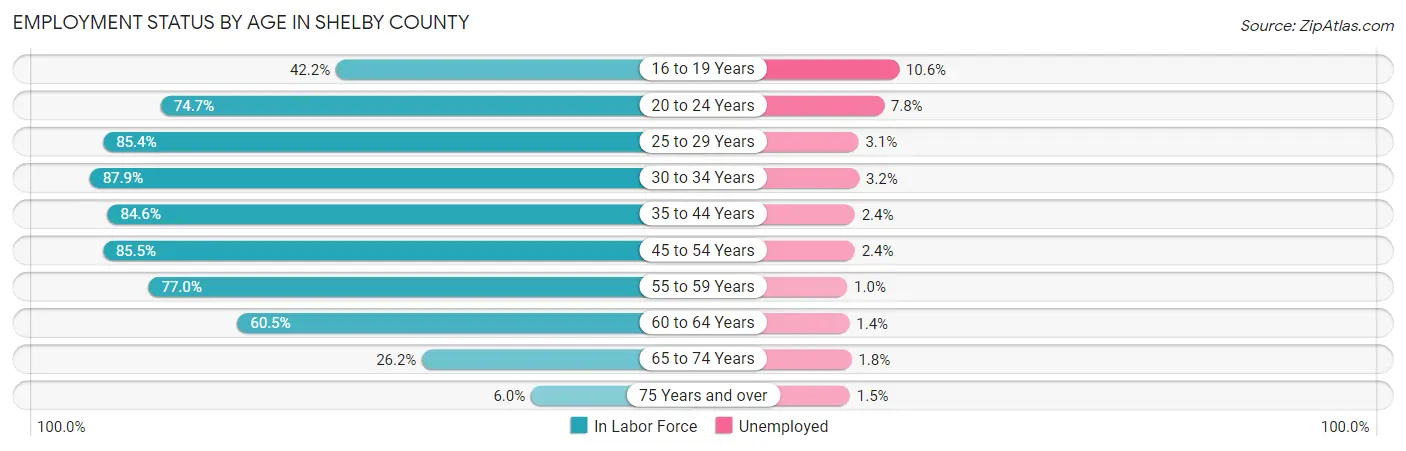
| Age Bracket | In Labor Force | Unemployed |
| 16 to 19 Years | 5,248 (42.2%) | 556 (10.6%) |
| 20 to 24 Years | 9,874 (74.7%) | 770 (7.8%) |
| 25 to 29 Years | 11,212 (85.4%) | 348 (3.1%) |
| 30 to 34 Years | 12,186 (87.9%) | 390 (3.2%) |
| 35 to 44 Years | 25,817 (84.6%) | 620 (2.4%) |
| 45 to 54 Years | 26,663 (85.5%) | 640 (2.4%) |
| 55 to 59 Years | 11,500 (77.0%) | 115 (1.0%) |
| 60 to 64 Years | 8,371 (60.5%) | 117 (1.4%) |
| 65 to 74 Years | 5,799 (26.2%) | 104 (1.8%) |
| 75 Years and over | 843 (6.0%) | 13 (1.5%) |
| Total | 117,441 (65.5%) | 3,641 (3.1%) |
Employment Status by Educational Attainment in Shelby County
According to labor force statistics for Shelby County, 81.5% of individuals (95,733) out of the total population between 25 and 64 years of age (117,464) are in the labor force, with 2.3% or 2,202 of them being unemployed. The group with the highest labor force participation rate are those with the educational attainment of bachelor's degree or higher, with 87.6% or 49,537 individuals in the labor force. Within the labor force, individuals with less than high school education have the highest percentage of unemployment, with 3.4% or 128 of them being unemployed.
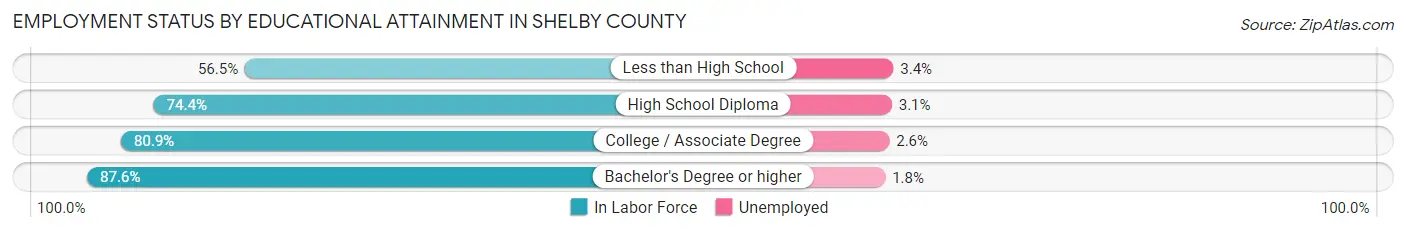
| Educational Attainment | In Labor Force | Unemployed |
| Less than High School | 3,761 (56.5%) | 226 (3.4%) |
| High School Diploma | 15,993 (74.4%) | 666 (3.1%) |
| College / Associate Degree | 26,504 (80.9%) | 852 (2.6%) |
| Bachelor's Degree or higher | 49,537 (87.6%) | 1,018 (1.8%) |
| Total | 95,733 (81.5%) | 2,702 (2.3%) |
Employment Occupations by Sex in Shelby County
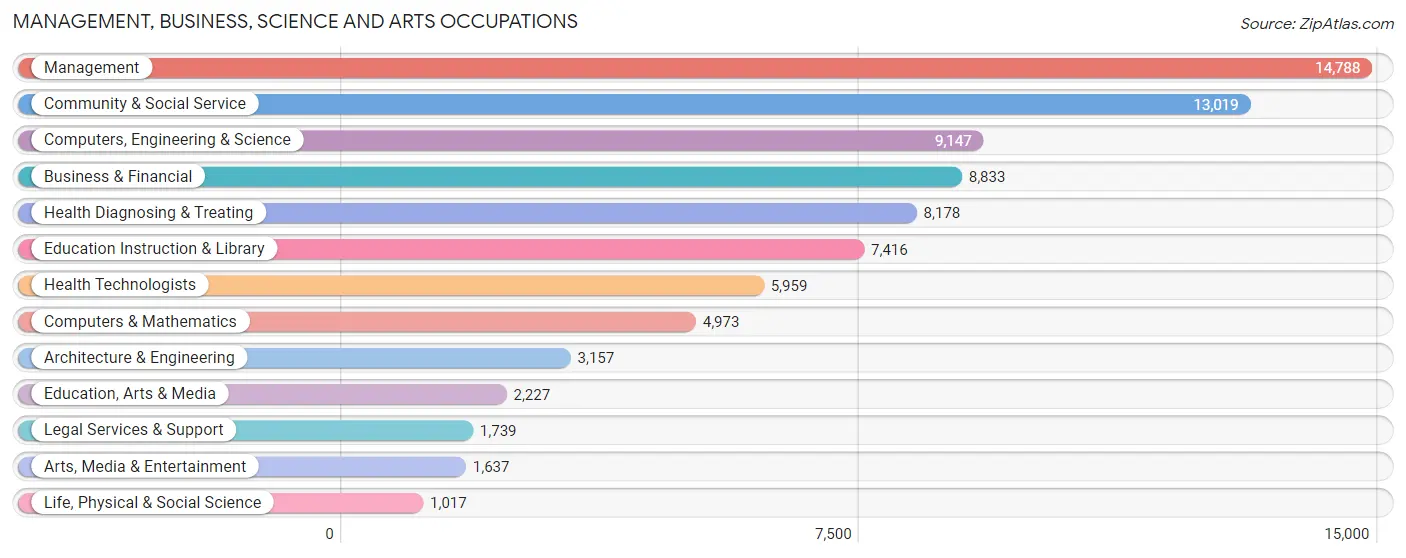
Management, Business, Science and Arts Occupations
The most common Management, Business, Science and Arts occupations in Shelby County are Management (14,788 | 13.0%), Community & Social Service (13,019 | 11.5%), Computers, Engineering & Science (9,147 | 8.1%), Business & Financial (8,833 | 7.8%), and Health Diagnosing & Treating (8,178 | 7.2%).
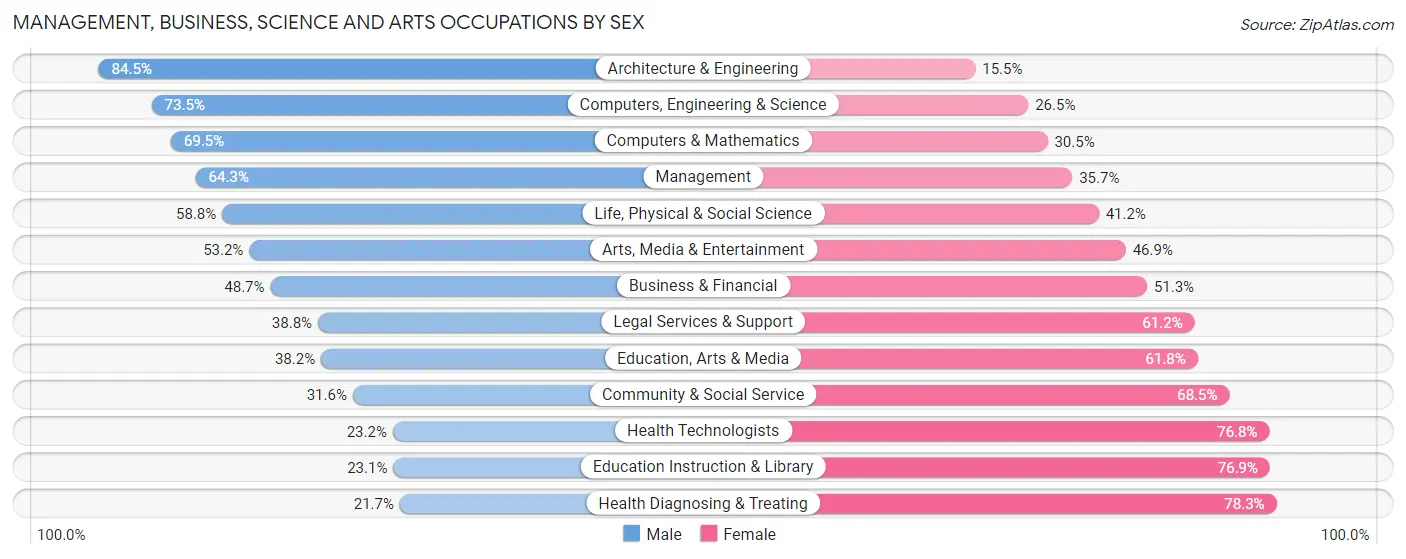
Management, Business, Science and Arts Occupations by Sex
Within the Management, Business, Science and Arts occupations in Shelby County, the most male-oriented occupations are Architecture & Engineering (84.5%), Computers, Engineering & Science (73.5%), and Computers & Mathematics (69.5%), while the most female-oriented occupations are Health Diagnosing & Treating (78.3%), Education Instruction & Library (76.9%), and Health Technologists (76.8%).
| Occupation | Male | Female |
| Management | 9,512 (64.3%) | 5,276 (35.7%) |
| Business & Financial | 4,304 (48.7%) | 4,529 (51.3%) |
| Computers, Engineering & Science | 6,722 (73.5%) | 2,425 (26.5%) |
| Computers & Mathematics | 3,455 (69.5%) | 1,518 (30.5%) |
| Architecture & Engineering | 2,669 (84.5%) | 488 (15.5%) |
| Life, Physical & Social Science | 598 (58.8%) | 419 (41.2%) |
| Community & Social Service | 4,108 (31.6%) | 8,911 (68.4%) |
| Education, Arts & Media | 850 (38.2%) | 1,377 (61.8%) |
| Legal Services & Support | 675 (38.8%) | 1,064 (61.2%) |
| Education Instruction & Library | 1,713 (23.1%) | 5,703 (76.9%) |
| Arts, Media & Entertainment | 870 (53.1%) | 767 (46.9%) |
| Health Diagnosing & Treating | 1,777 (21.7%) | 6,401 (78.3%) |
| Health Technologists | 1,383 (23.2%) | 4,576 (76.8%) |
| Total (Category) | 26,423 (49.0%) | 27,542 (51.0%) |
| Total (Overall) | 60,665 (53.4%) | 52,877 (46.6%) |
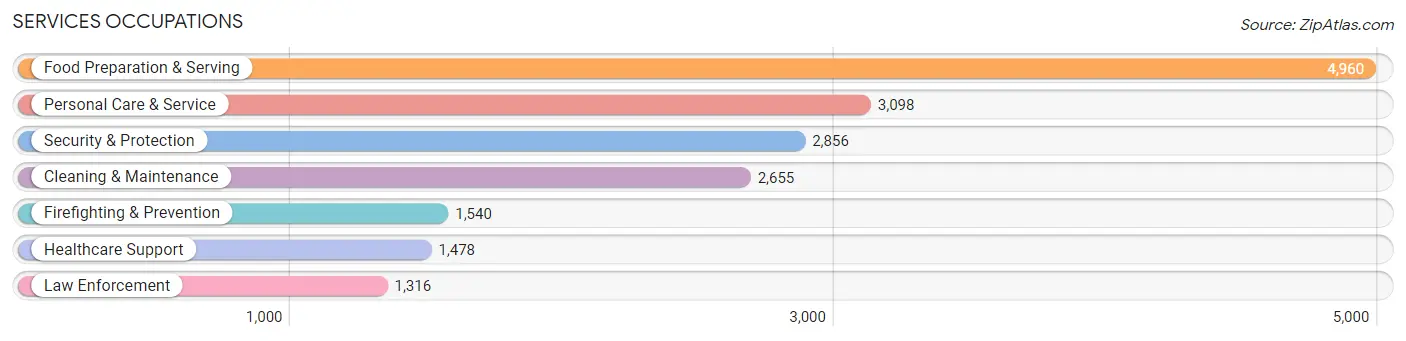
Services Occupations
The most common Services occupations in Shelby County are Food Preparation & Serving (4,960 | 4.4%), Personal Care & Service (3,098 | 2.7%), Security & Protection (2,856 | 2.5%), Cleaning & Maintenance (2,655 | 2.3%), and Firefighting & Prevention (1,540 | 1.4%).
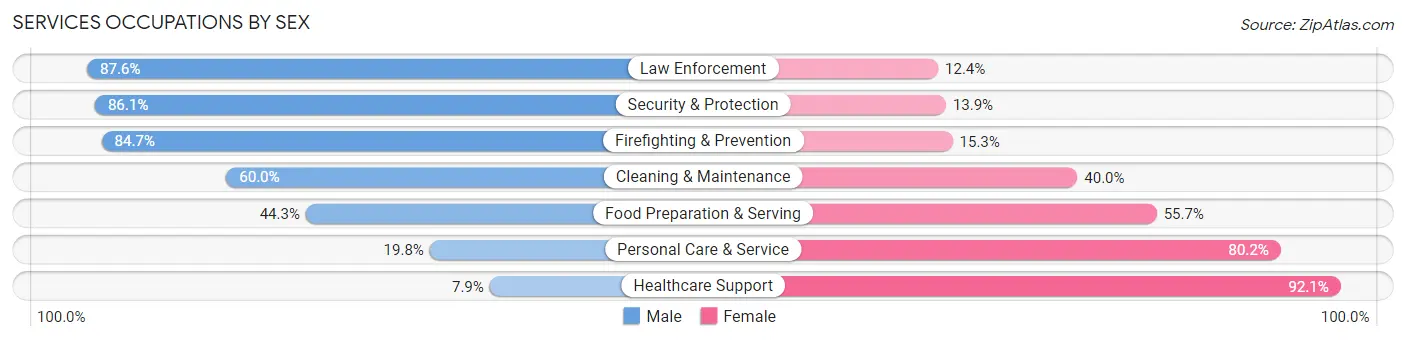
Services Occupations by Sex
Within the Services occupations in Shelby County, the most male-oriented occupations are Law Enforcement (87.6%), Security & Protection (86.1%), and Firefighting & Prevention (84.7%), while the most female-oriented occupations are Healthcare Support (92.1%), Personal Care & Service (80.2%), and Food Preparation & Serving (55.7%).
| Occupation | Male | Female |
| Healthcare Support | 117 (7.9%) | 1,361 (92.1%) |
| Security & Protection | 2,458 (86.1%) | 398 (13.9%) |
| Firefighting & Prevention | 1,305 (84.7%) | 235 (15.3%) |
| Law Enforcement | 1,153 (87.6%) | 163 (12.4%) |
| Food Preparation & Serving | 2,199 (44.3%) | 2,761 (55.7%) |
| Cleaning & Maintenance | 1,594 (60.0%) | 1,061 (40.0%) |
| Personal Care & Service | 613 (19.8%) | 2,485 (80.2%) |
| Total (Category) | 6,981 (46.4%) | 8,066 (53.6%) |
| Total (Overall) | 60,665 (53.4%) | 52,877 (46.6%) |
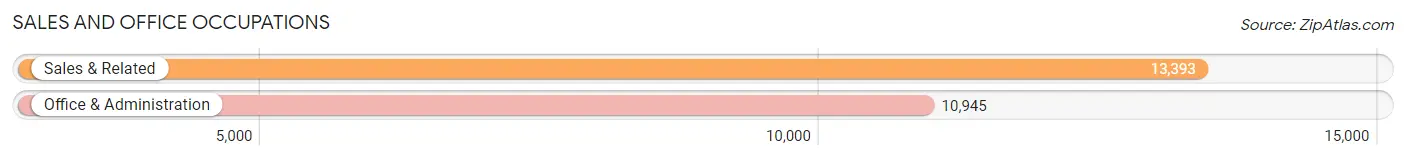
Sales and Office Occupations
The most common Sales and Office occupations in Shelby County are Sales & Related (13,393 | 11.8%), and Office & Administration (10,945 | 9.6%).
Sales and Office Occupations by Sex
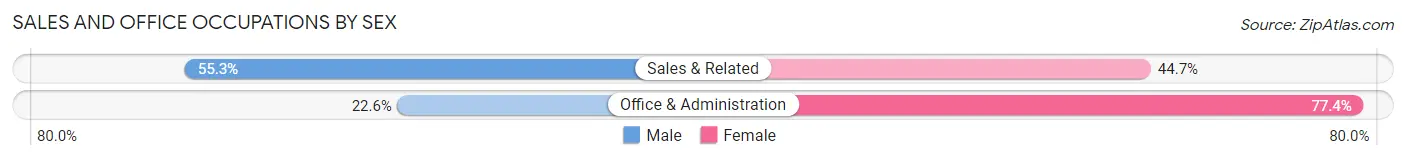
| Occupation | Male | Female |
| Sales & Related | 7,411 (55.3%) | 5,982 (44.7%) |
| Office & Administration | 2,474 (22.6%) | 8,471 (77.4%) |
| Total (Category) | 9,885 (40.6%) | 14,453 (59.4%) |
| Total (Overall) | 60,665 (53.4%) | 52,877 (46.6%) |
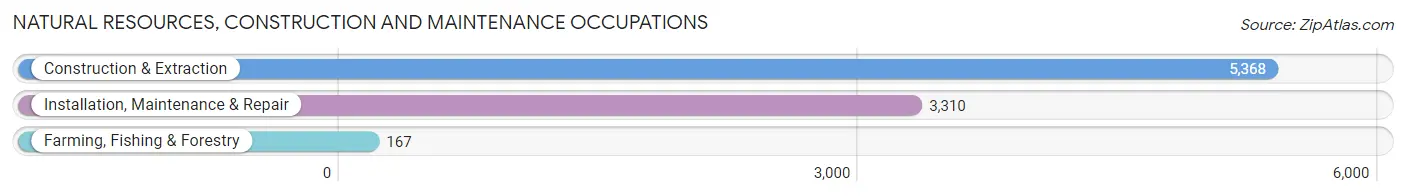
Natural Resources, Construction and Maintenance Occupations
The most common Natural Resources, Construction and Maintenance occupations in Shelby County are Construction & Extraction (5,368 | 4.7%), Installation, Maintenance & Repair (3,310 | 2.9%), and Farming, Fishing & Forestry (167 | 0.2%).
Natural Resources, Construction and Maintenance Occupations by Sex
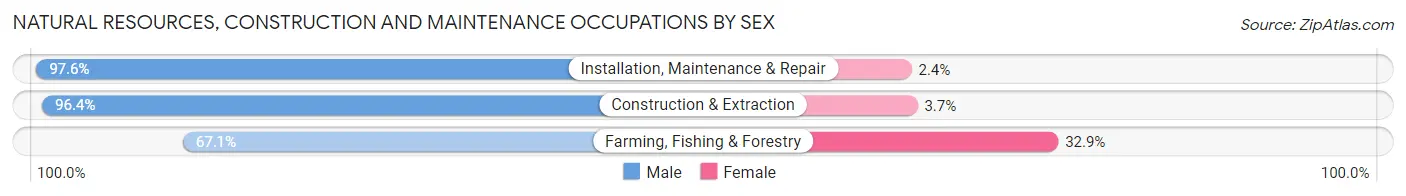
| Occupation | Male | Female |
| Farming, Fishing & Forestry | 112 (67.1%) | 55 (32.9%) |
| Construction & Extraction | 5,172 (96.4%) | 196 (3.6%) |
| Installation, Maintenance & Repair | 3,230 (97.6%) | 80 (2.4%) |
| Total (Category) | 8,514 (96.3%) | 331 (3.7%) |
| Total (Overall) | 60,665 (53.4%) | 52,877 (46.6%) |
Production, Transportation and Moving Occupations
The most common Production, Transportation and Moving occupations in Shelby County are Production (4,643 | 4.1%), Transportation (3,686 | 3.3%), and Material Moving (3,018 | 2.7%).
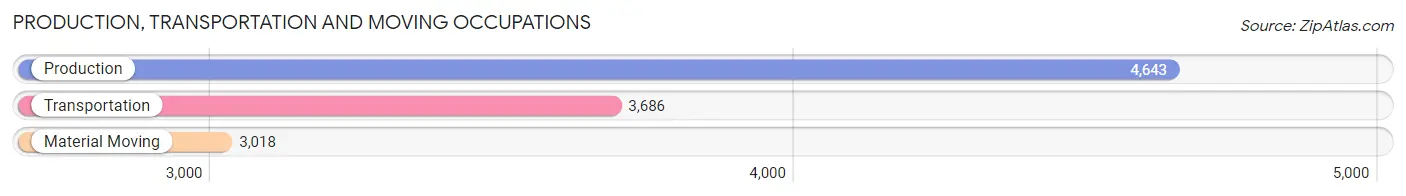
Production, Transportation and Moving Occupations by Sex
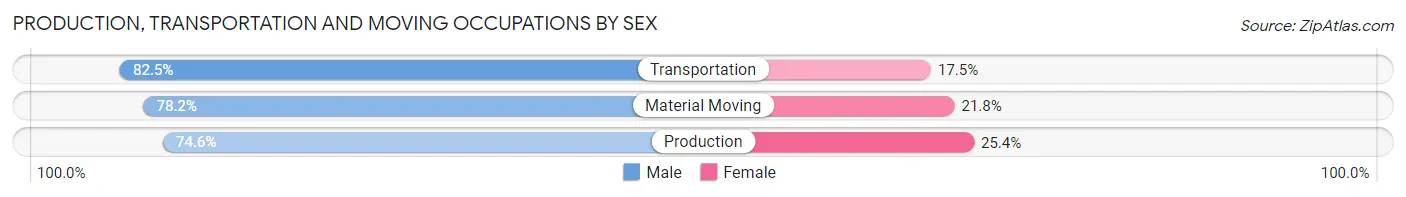
| Occupation | Male | Female |
| Production | 3,463 (74.6%) | 1,180 (25.4%) |
| Transportation | 3,040 (82.5%) | 646 (17.5%) |
| Material Moving | 2,359 (78.2%) | 659 (21.8%) |
| Total (Category) | 8,862 (78.1%) | 2,485 (21.9%) |
| Total (Overall) | 60,665 (53.4%) | 52,877 (46.6%) |
Employment Industries by Sex in Shelby County
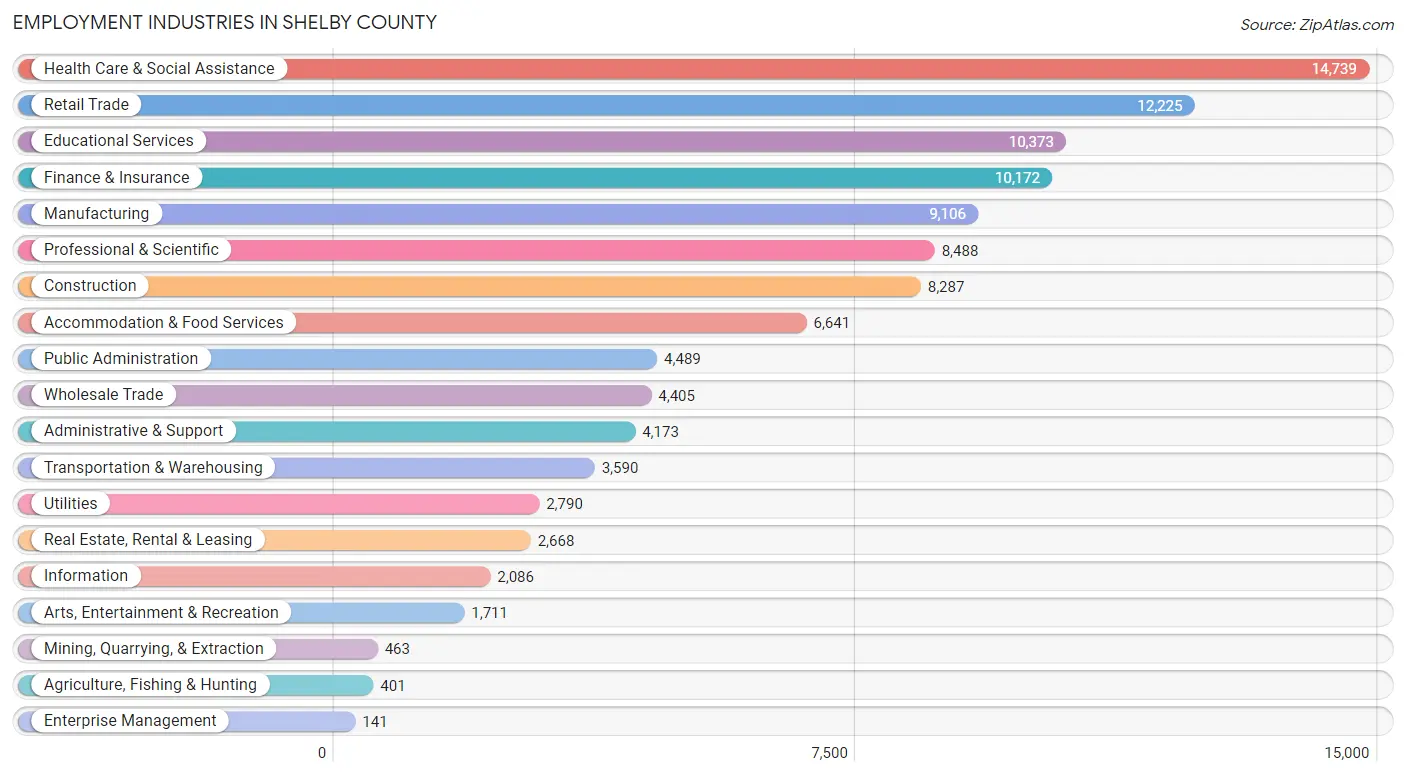
Employment Industries in Shelby County
The major employment industries in Shelby County include Health Care & Social Assistance (14,739 | 13.0%), Retail Trade (12,225 | 10.8%), Educational Services (10,373 | 9.1%), Finance & Insurance (10,172 | 9.0%), and Manufacturing (9,106 | 8.0%).
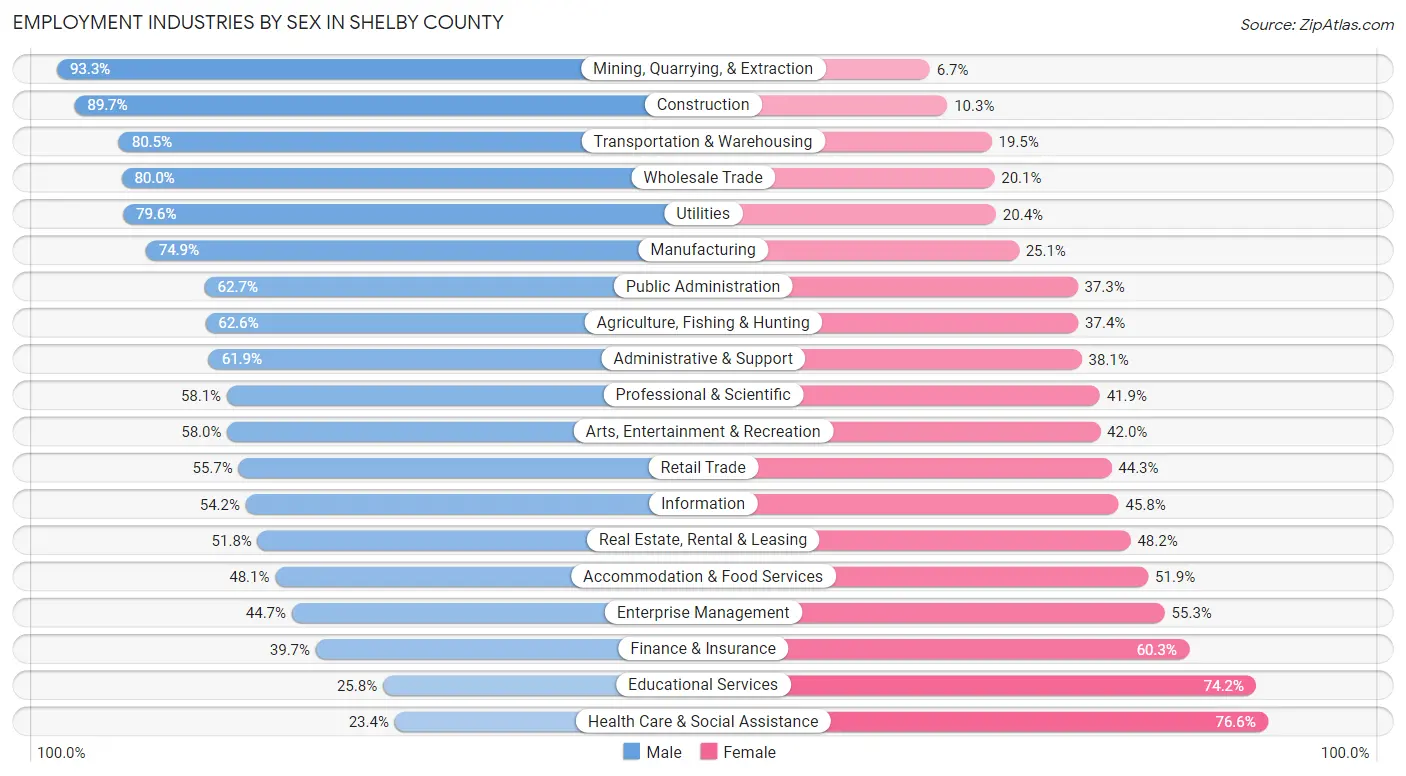
Employment Industries by Sex in Shelby County
The Shelby County industries that see more men than women are Mining, Quarrying, & Extraction (93.3%), Construction (89.7%), and Transportation & Warehousing (80.5%), whereas the industries that tend to have a higher number of women are Health Care & Social Assistance (76.6%), Educational Services (74.2%), and Finance & Insurance (60.3%).
| Industry | Male | Female |
| Agriculture, Fishing & Hunting | 251 (62.6%) | 150 (37.4%) |
| Mining, Quarrying, & Extraction | 432 (93.3%) | 31 (6.7%) |
| Construction | 7,433 (89.7%) | 854 (10.3%) |
| Manufacturing | 6,820 (74.9%) | 2,286 (25.1%) |
| Wholesale Trade | 3,522 (79.9%) | 883 (20.1%) |
| Retail Trade | 6,812 (55.7%) | 5,413 (44.3%) |
| Transportation & Warehousing | 2,890 (80.5%) | 700 (19.5%) |
| Utilities | 2,221 (79.6%) | 569 (20.4%) |
| Information | 1,131 (54.2%) | 955 (45.8%) |
| Finance & Insurance | 4,039 (39.7%) | 6,133 (60.3%) |
| Real Estate, Rental & Leasing | 1,381 (51.8%) | 1,287 (48.2%) |
| Professional & Scientific | 4,933 (58.1%) | 3,555 (41.9%) |
| Enterprise Management | 63 (44.7%) | 78 (55.3%) |
| Administrative & Support | 2,582 (61.9%) | 1,591 (38.1%) |
| Educational Services | 2,678 (25.8%) | 7,695 (74.2%) |
| Health Care & Social Assistance | 3,448 (23.4%) | 11,291 (76.6%) |
| Arts, Entertainment & Recreation | 993 (58.0%) | 718 (42.0%) |
| Accommodation & Food Services | 3,195 (48.1%) | 3,446 (51.9%) |
| Public Administration | 2,816 (62.7%) | 1,673 (37.3%) |
| Total | 60,665 (53.4%) | 52,877 (46.6%) |
Education in Shelby County
School Enrollment in Shelby County
The most common levels of schooling among the 56,168 students in Shelby County are high school (13,423 | 23.9%), middle school (11,644 | 20.7%), and elementary school (11,593 | 20.6%).
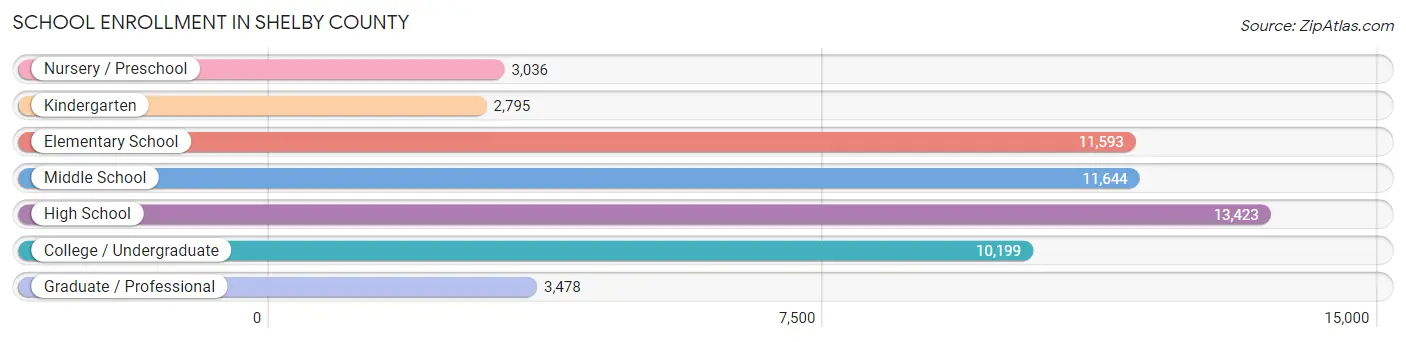
| School Level | # Students | % Students |
| Nursery / Preschool | 3,036 | 5.4% |
| Kindergarten | 2,795 | 5.0% |
| Elementary School | 11,593 | 20.6% |
| Middle School | 11,644 | 20.7% |
| High School | 13,423 | 23.9% |
| College / Undergraduate | 10,199 | 18.2% |
| Graduate / Professional | 3,478 | 6.2% |
| Total | 56,168 | 100.0% |
School Enrollment by Age by Funding Source in Shelby County
Out of a total of 56,168 students who are enrolled in schools in Shelby County, 10,223 (18.2%) attend a private institution, while the remaining 45,945 (81.8%) are enrolled in public schools. The age group of 3 to 4 year olds has the highest likelihood of being enrolled in private schools, with 1,706 (70.8% in the age bracket) enrolled. Conversely, the age group of 18 to 19 year olds has the lowest likelihood of being enrolled in a private school, with 3,975 (89.9% in the age bracket) attending a public institution.
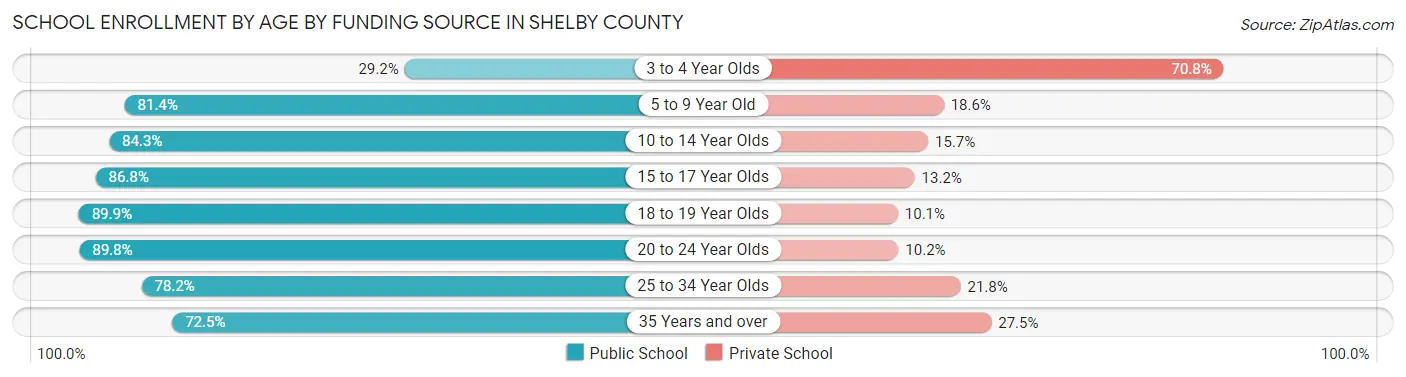
| Age Bracket | Public School | Private School |
| 3 to 4 Year Olds | 705 (29.2%) | 1,706 (70.8%) |
| 5 to 9 Year Old | 10,810 (81.4%) | 2,475 (18.6%) |
| 10 to 14 Year Olds | 12,695 (84.3%) | 2,369 (15.7%) |
| 15 to 17 Year Olds | 8,189 (86.8%) | 1,248 (13.2%) |
| 18 to 19 Year Olds | 3,975 (89.9%) | 446 (10.1%) |
| 20 to 24 Year Olds | 5,210 (89.8%) | 591 (10.2%) |
| 25 to 34 Year Olds | 2,512 (78.2%) | 699 (21.8%) |
| 35 Years and over | 1,840 (72.5%) | 698 (27.5%) |
| Total | 45,945 (81.8%) | 10,223 (18.2%) |
Educational Attainment by Field of Study in Shelby County
Business (19,740 | 26.3%), education (9,094 | 12.1%), science & technology (7,937 | 10.6%), engineering (5,523 | 7.4%), and arts & humanities (4,986 | 6.6%) are the most common fields of study among 75,089 individuals in Shelby County who have obtained a bachelor's degree or higher.
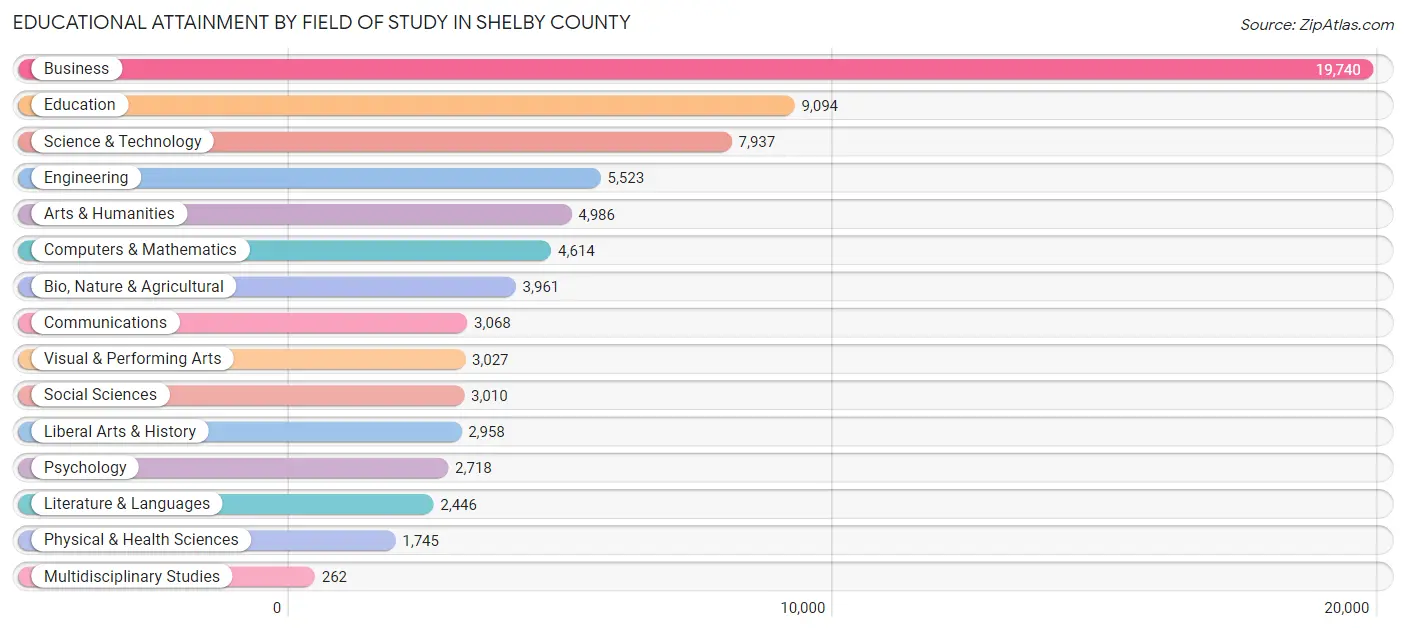
| Field of Study | # Graduates | % Graduates |
| Computers & Mathematics | 4,614 | 6.1% |
| Bio, Nature & Agricultural | 3,961 | 5.3% |
| Physical & Health Sciences | 1,745 | 2.3% |
| Psychology | 2,718 | 3.6% |
| Social Sciences | 3,010 | 4.0% |
| Engineering | 5,523 | 7.4% |
| Multidisciplinary Studies | 262 | 0.4% |
| Science & Technology | 7,937 | 10.6% |
| Business | 19,740 | 26.3% |
| Education | 9,094 | 12.1% |
| Literature & Languages | 2,446 | 3.3% |
| Liberal Arts & History | 2,958 | 3.9% |
| Visual & Performing Arts | 3,027 | 4.0% |
| Communications | 3,068 | 4.1% |
| Arts & Humanities | 4,986 | 6.6% |
| Total | 75,089 | 100.0% |
Transportation & Commute in Shelby County
Vehicle Availability by Sex in Shelby County
The most prevalent vehicle ownership categories in Shelby County are males with 2 vehicles (26,260, accounting for 43.5%) and females with 2 vehicles (21,881, making up 50.7%).
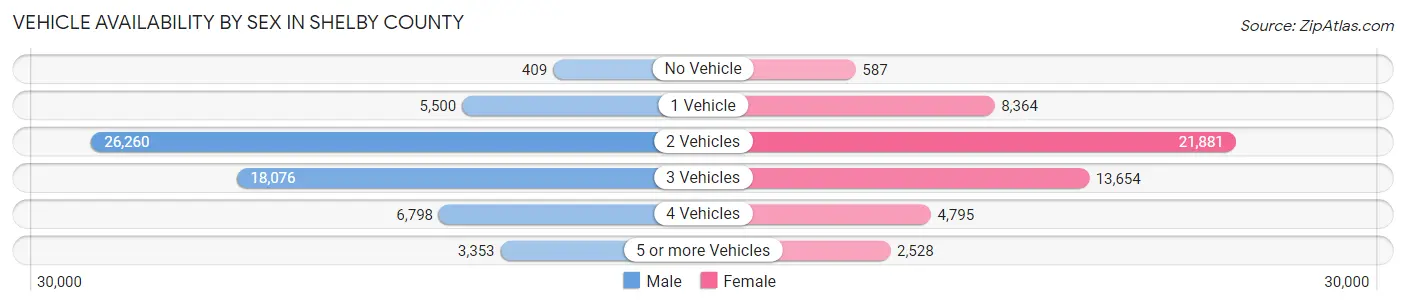
| Vehicles Available | Male | Female |
| No Vehicle | 409 (0.7%) | 587 (1.1%) |
| 1 Vehicle | 5,500 (9.1%) | 8,364 (16.1%) |
| 2 Vehicles | 26,260 (43.5%) | 21,881 (42.2%) |
| 3 Vehicles | 18,076 (29.9%) | 13,654 (26.4%) |
| 4 Vehicles | 6,798 (11.3%) | 4,795 (9.3%) |
| 5 or more Vehicles | 3,353 (5.6%) | 2,528 (4.9%) |
| Total | 60,396 (100.0%) | 51,809 (100.0%) |
Commute Time in Shelby County
The most frequently occuring commute durations in Shelby County are 30 to 34 minutes (18,141 commuters, 18.5%), 20 to 24 minutes (12,810 commuters, 13.1%), and 45 to 59 minutes (12,005 commuters, 12.2%).
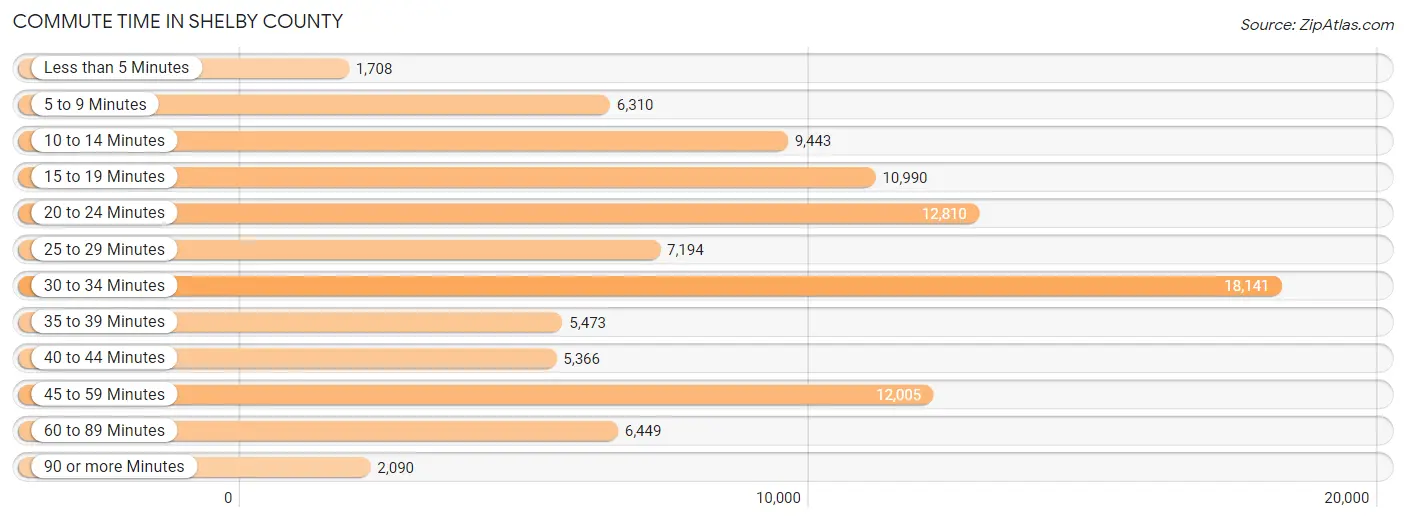
| Commute Time | # Commuters | % Commuters |
| Less than 5 Minutes | 1,708 | 1.7% |
| 5 to 9 Minutes | 6,310 | 6.4% |
| 10 to 14 Minutes | 9,443 | 9.6% |
| 15 to 19 Minutes | 10,990 | 11.2% |
| 20 to 24 Minutes | 12,810 | 13.1% |
| 25 to 29 Minutes | 7,194 | 7.3% |
| 30 to 34 Minutes | 18,141 | 18.5% |
| 35 to 39 Minutes | 5,473 | 5.6% |
| 40 to 44 Minutes | 5,366 | 5.5% |
| 45 to 59 Minutes | 12,005 | 12.2% |
| 60 to 89 Minutes | 6,449 | 6.6% |
| 90 or more Minutes | 2,090 | 2.1% |
Commute Time by Sex in Shelby County
The most common commute times in Shelby County are 30 to 34 minutes (10,297 commuters, 19.3%) for males and 30 to 34 minutes (7,844 commuters, 17.5%) for females.
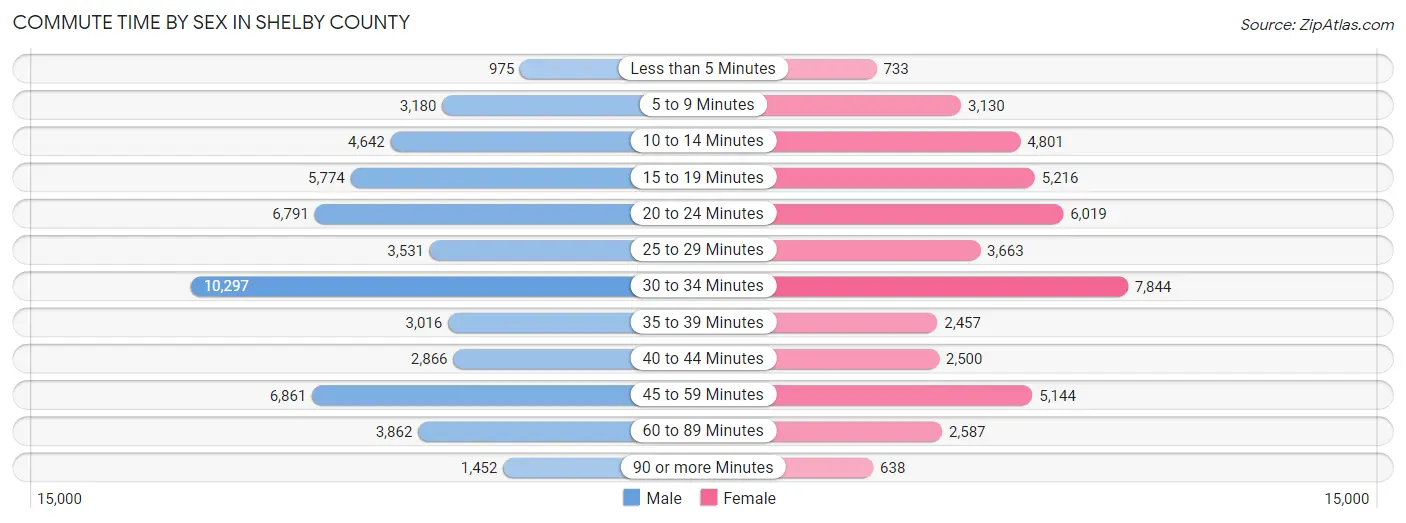
| Commute Time | Male | Female |
| Less than 5 Minutes | 975 (1.8%) | 733 (1.6%) |
| 5 to 9 Minutes | 3,180 (6.0%) | 3,130 (7.0%) |
| 10 to 14 Minutes | 4,642 (8.7%) | 4,801 (10.7%) |
| 15 to 19 Minutes | 5,774 (10.8%) | 5,216 (11.7%) |
| 20 to 24 Minutes | 6,791 (12.8%) | 6,019 (13.5%) |
| 25 to 29 Minutes | 3,531 (6.6%) | 3,663 (8.2%) |
| 30 to 34 Minutes | 10,297 (19.3%) | 7,844 (17.5%) |
| 35 to 39 Minutes | 3,016 (5.7%) | 2,457 (5.5%) |
| 40 to 44 Minutes | 2,866 (5.4%) | 2,500 (5.6%) |
| 45 to 59 Minutes | 6,861 (12.9%) | 5,144 (11.5%) |
| 60 to 89 Minutes | 3,862 (7.2%) | 2,587 (5.8%) |
| 90 or more Minutes | 1,452 (2.7%) | 638 (1.4%) |
Time of Departure to Work by Sex in Shelby County
The most frequent times of departure to work in Shelby County are 7:00 AM to 7:29 AM (8,454, 15.9%) for males and 7:00 AM to 7:29 AM (8,679, 19.4%) for females.
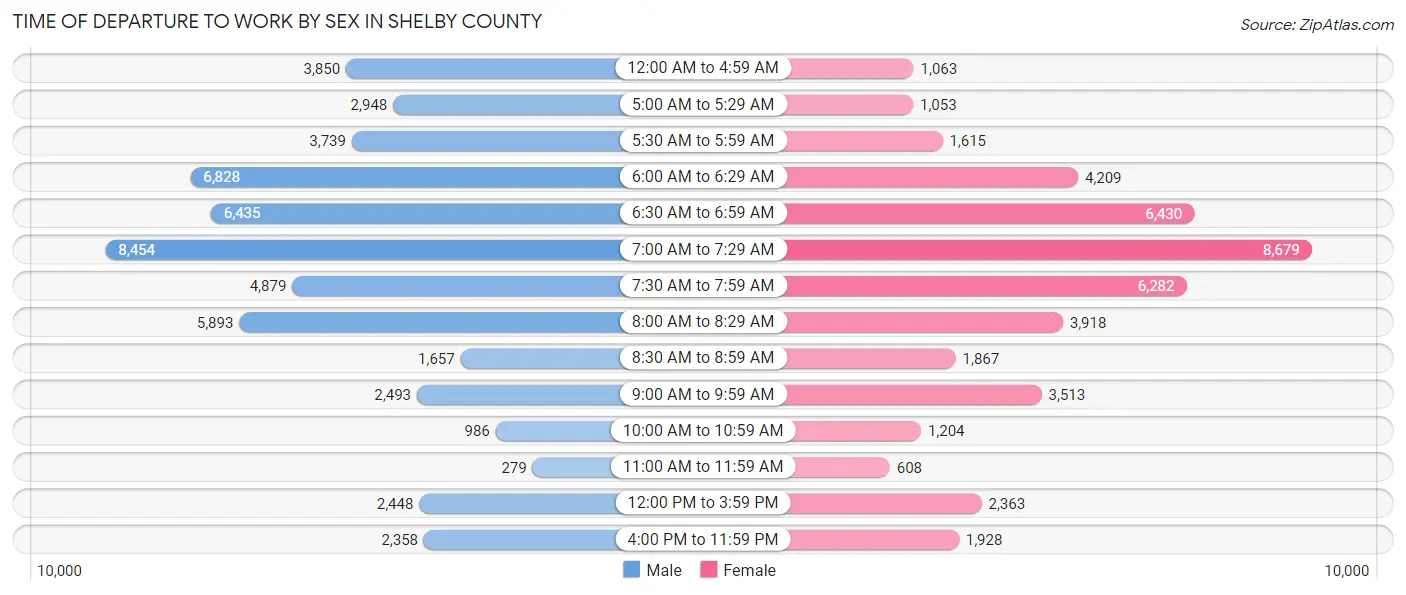
| Time of Departure | Male | Female |
| 12:00 AM to 4:59 AM | 3,850 (7.2%) | 1,063 (2.4%) |
| 5:00 AM to 5:29 AM | 2,948 (5.5%) | 1,053 (2.4%) |
| 5:30 AM to 5:59 AM | 3,739 (7.0%) | 1,615 (3.6%) |
| 6:00 AM to 6:29 AM | 6,828 (12.8%) | 4,209 (9.4%) |
| 6:30 AM to 6:59 AM | 6,435 (12.1%) | 6,430 (14.4%) |
| 7:00 AM to 7:29 AM | 8,454 (15.9%) | 8,679 (19.4%) |
| 7:30 AM to 7:59 AM | 4,879 (9.2%) | 6,282 (14.0%) |
| 8:00 AM to 8:29 AM | 5,893 (11.1%) | 3,918 (8.8%) |
| 8:30 AM to 8:59 AM | 1,657 (3.1%) | 1,867 (4.2%) |
| 9:00 AM to 9:59 AM | 2,493 (4.7%) | 3,513 (7.9%) |
| 10:00 AM to 10:59 AM | 986 (1.8%) | 1,204 (2.7%) |
| 11:00 AM to 11:59 AM | 279 (0.5%) | 608 (1.4%) |
| 12:00 PM to 3:59 PM | 2,448 (4.6%) | 2,363 (5.3%) |
| 4:00 PM to 11:59 PM | 2,358 (4.4%) | 1,928 (4.3%) |
| Total | 53,247 (100.0%) | 44,732 (100.0%) |
Housing Occupancy in Shelby County
Occupancy by Ownership in Shelby County
Of the total 83,776 dwellings in Shelby County, owner-occupied units account for 67,810 (80.9%), while renter-occupied units make up 15,966 (19.1%).
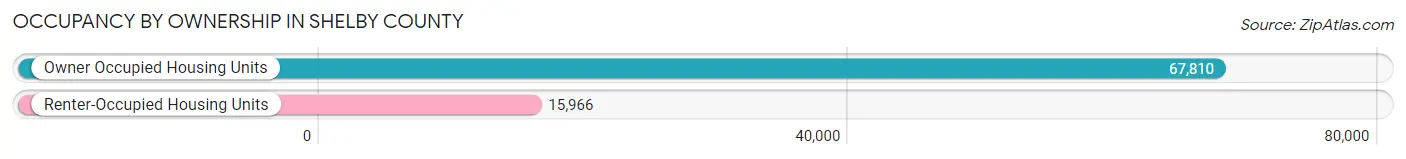
| Occupancy | # Housing Units | % Housing Units |
| Owner Occupied Housing Units | 67,810 | 80.9% |
| Renter-Occupied Housing Units | 15,966 | 19.1% |
| Total Occupied Housing Units | 83,776 | 100.0% |
Occupancy by Household Size in Shelby County
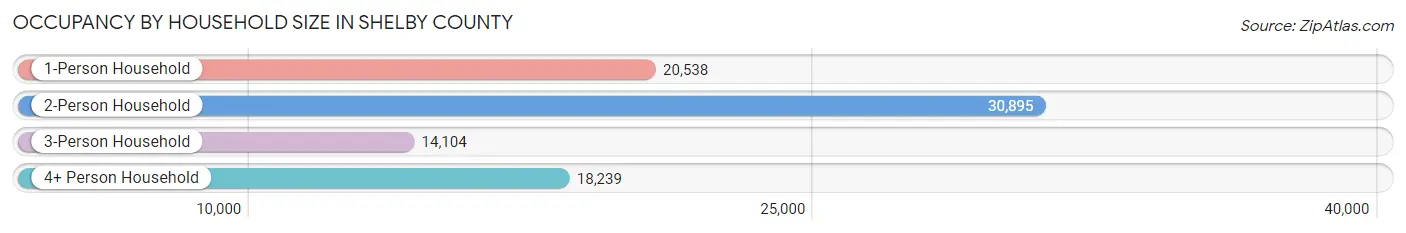
| Household Size | # Housing Units | % Housing Units |
| 1-Person Household | 20,538 | 24.5% |
| 2-Person Household | 30,895 | 36.9% |
| 3-Person Household | 14,104 | 16.8% |
| 4+ Person Household | 18,239 | 21.8% |
| Total Housing Units | 83,776 | 100.0% |
Occupancy by Ownership by Household Size in Shelby County
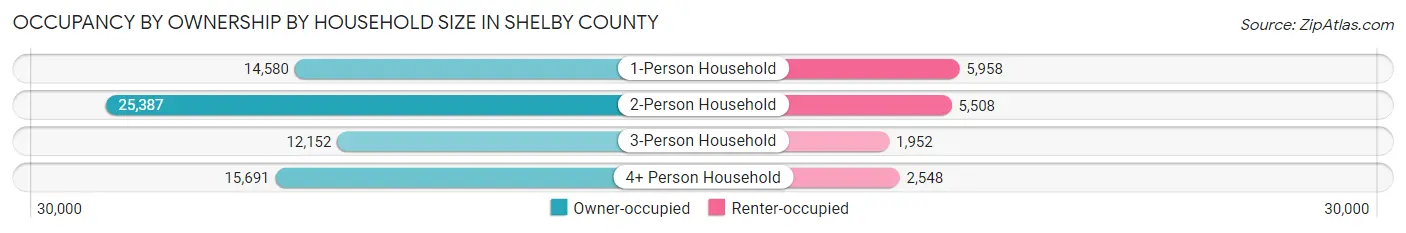
| Household Size | Owner-occupied | Renter-occupied |
| 1-Person Household | 14,580 (71.0%) | 5,958 (29.0%) |
| 2-Person Household | 25,387 (82.2%) | 5,508 (17.8%) |
| 3-Person Household | 12,152 (86.2%) | 1,952 (13.8%) |
| 4+ Person Household | 15,691 (86.0%) | 2,548 (14.0%) |
| Total Housing Units | 67,810 (80.9%) | 15,966 (19.1%) |
Occupancy by Educational Attainment in Shelby County
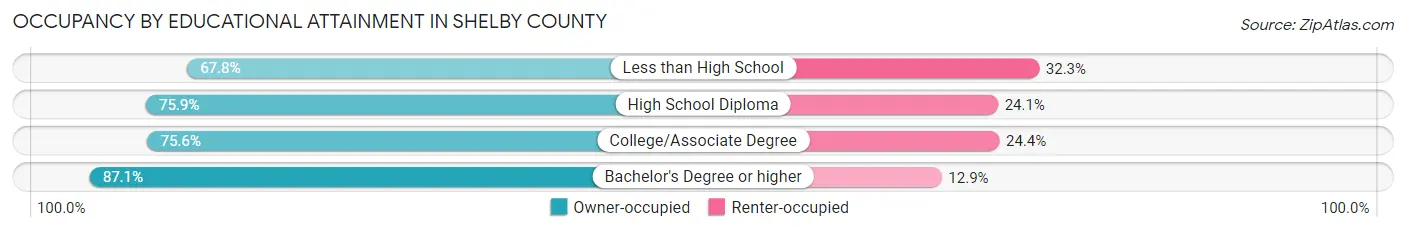
| Household Size | Owner-occupied | Renter-occupied |
| Less than High School | 2,951 (67.7%) | 1,405 (32.3%) |
| High School Diploma | 10,924 (75.9%) | 3,466 (24.1%) |
| College/Associate Degree | 17,748 (75.6%) | 5,722 (24.4%) |
| Bachelor's Degree or higher | 36,187 (87.1%) | 5,373 (12.9%) |
Occupancy by Age of Householder in Shelby County
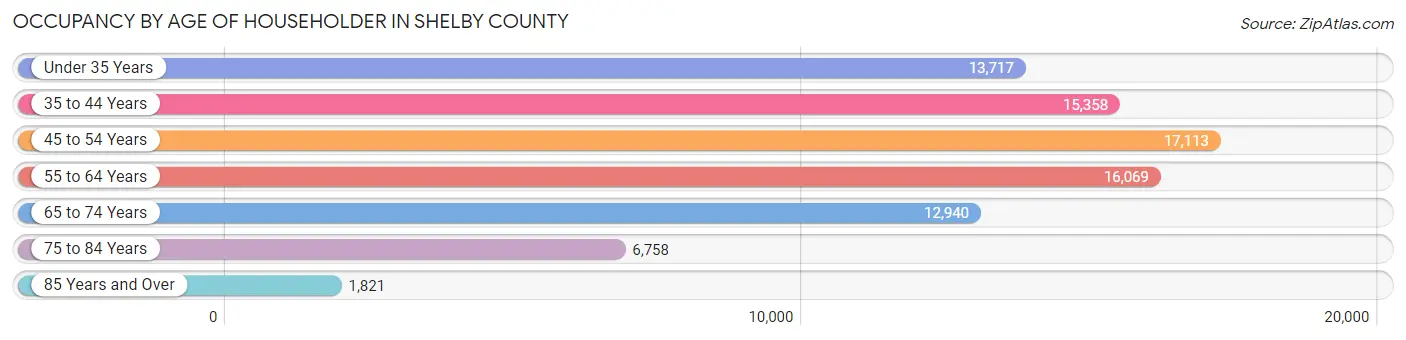
| Age Bracket | # Households | % Households |
| Under 35 Years | 13,717 | 16.4% |
| 35 to 44 Years | 15,358 | 18.3% |
| 45 to 54 Years | 17,113 | 20.4% |
| 55 to 64 Years | 16,069 | 19.2% |
| 65 to 74 Years | 12,940 | 15.4% |
| 75 to 84 Years | 6,758 | 8.1% |
| 85 Years and Over | 1,821 | 2.2% |
| Total | 83,776 | 100.0% |
Housing Finances in Shelby County
Median Income by Occupancy in Shelby County
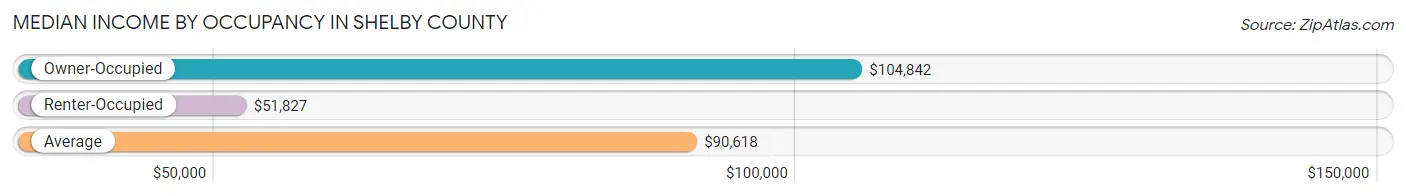
| Occupancy Type | # Households | Median Income |
| Owner-Occupied | 67,810 (80.9%) | $104,842 |
| Renter-Occupied | 15,966 (19.1%) | $51,827 |
| Average | 83,776 (100.0%) | $90,618 |
Occupancy by Householder Income Bracket in Shelby County
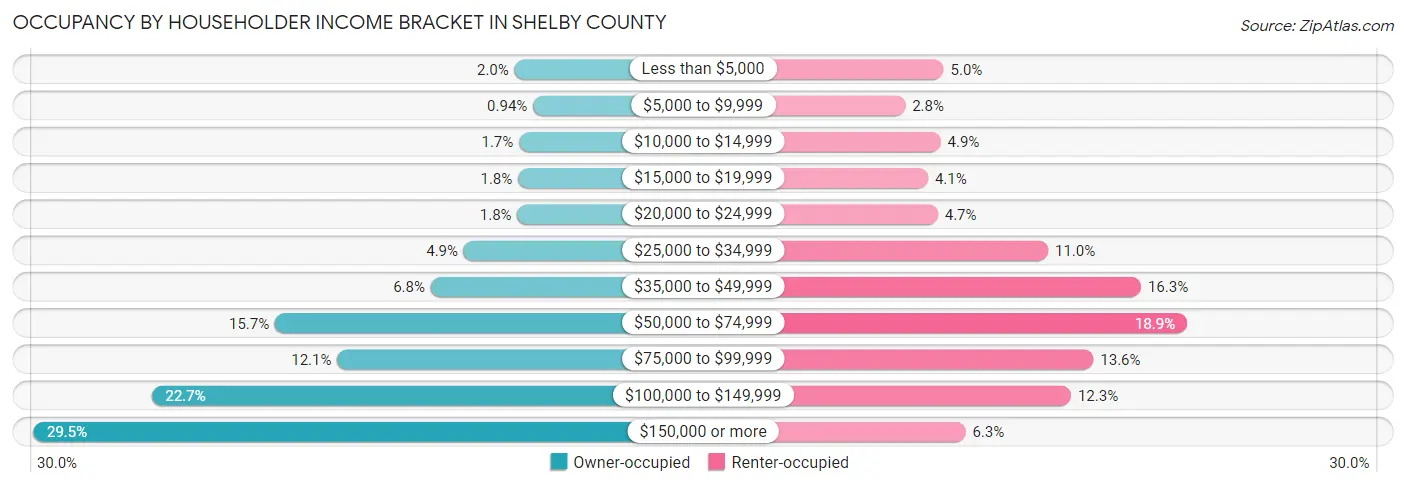
| Income Bracket | Owner-occupied | Renter-occupied |
| Less than $5,000 | 1,356 (2.0%) | 803 (5.0%) |
| $5,000 to $9,999 | 639 (0.9%) | 453 (2.8%) |
| $10,000 to $14,999 | 1,179 (1.7%) | 776 (4.9%) |
| $15,000 to $19,999 | 1,223 (1.8%) | 661 (4.1%) |
| $20,000 to $24,999 | 1,248 (1.8%) | 751 (4.7%) |
| $25,000 to $34,999 | 3,323 (4.9%) | 1,756 (11.0%) |
| $35,000 to $49,999 | 4,601 (6.8%) | 2,604 (16.3%) |
| $50,000 to $74,999 | 10,637 (15.7%) | 3,024 (18.9%) |
| $75,000 to $99,999 | 8,224 (12.1%) | 2,170 (13.6%) |
| $100,000 to $149,999 | 15,395 (22.7%) | 1,966 (12.3%) |
| $150,000 or more | 19,985 (29.5%) | 1,002 (6.3%) |
| Total | 67,810 (100.0%) | 15,966 (100.0%) |
Monthly Housing Cost Tiers in Shelby County
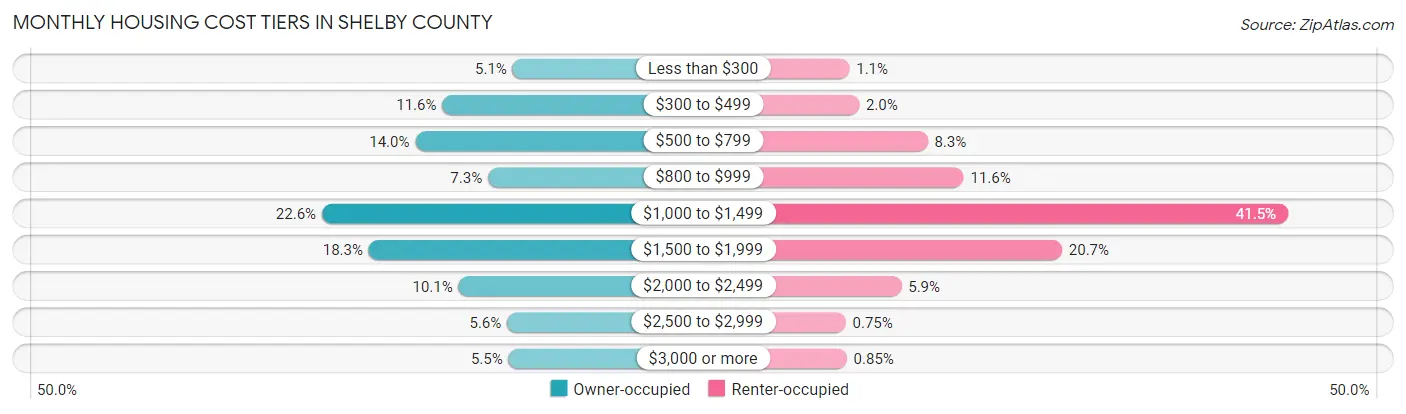
| Monthly Cost | Owner-occupied | Renter-occupied |
| Less than $300 | 3,435 (5.1%) | 174 (1.1%) |
| $300 to $499 | 7,834 (11.6%) | 316 (2.0%) |
| $500 to $799 | 9,514 (14.0%) | 1,324 (8.3%) |
| $800 to $999 | 4,974 (7.3%) | 1,854 (11.6%) |
| $1,000 to $1,499 | 15,343 (22.6%) | 6,621 (41.5%) |
| $1,500 to $1,999 | 12,415 (18.3%) | 3,298 (20.7%) |
| $2,000 to $2,499 | 6,814 (10.1%) | 939 (5.9%) |
| $2,500 to $2,999 | 3,785 (5.6%) | 120 (0.7%) |
| $3,000 or more | 3,696 (5.4%) | 136 (0.9%) |
| Total | 67,810 (100.0%) | 15,966 (100.0%) |
Physical Housing Characteristics in Shelby County
Housing Structures in Shelby County
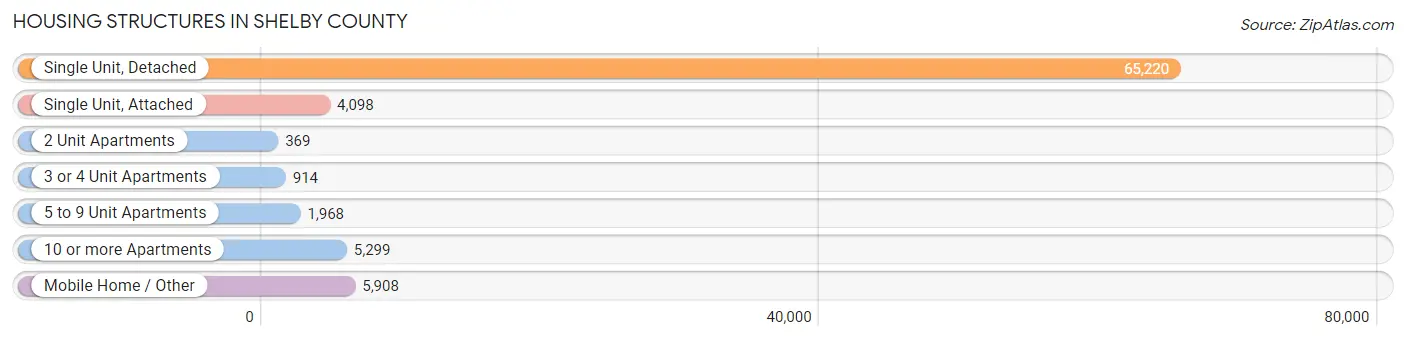
| Structure Type | # Housing Units | % Housing Units |
| Single Unit, Detached | 65,220 | 77.8% |
| Single Unit, Attached | 4,098 | 4.9% |
| 2 Unit Apartments | 369 | 0.4% |
| 3 or 4 Unit Apartments | 914 | 1.1% |
| 5 to 9 Unit Apartments | 1,968 | 2.4% |
| 10 or more Apartments | 5,299 | 6.3% |
| Mobile Home / Other | 5,908 | 7.0% |
| Total | 83,776 | 100.0% |
Housing Structures by Occupancy in Shelby County
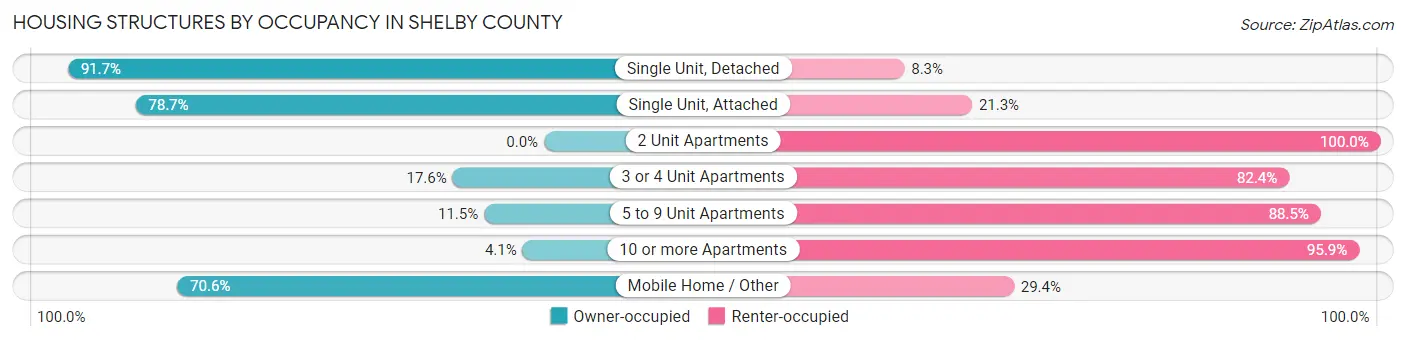
| Structure Type | Owner-occupied | Renter-occupied |
| Single Unit, Detached | 59,807 (91.7%) | 5,413 (8.3%) |
| Single Unit, Attached | 3,224 (78.7%) | 874 (21.3%) |
| 2 Unit Apartments | 0 (0.0%) | 369 (100.0%) |
| 3 or 4 Unit Apartments | 161 (17.6%) | 753 (82.4%) |
| 5 to 9 Unit Apartments | 227 (11.5%) | 1,741 (88.5%) |
| 10 or more Apartments | 219 (4.1%) | 5,080 (95.9%) |
| Mobile Home / Other | 4,172 (70.6%) | 1,736 (29.4%) |
| Total | 67,810 (80.9%) | 15,966 (19.1%) |
Housing Structures by Number of Rooms in Shelby County
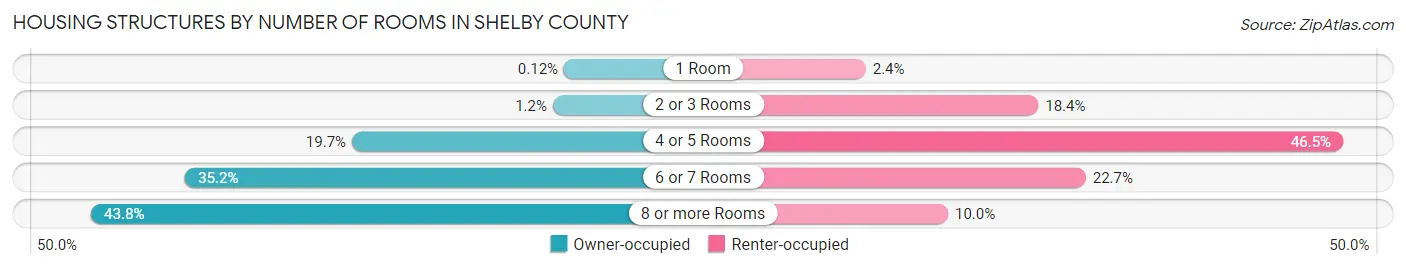
| Number of Rooms | Owner-occupied | Renter-occupied |
| 1 Room | 78 (0.1%) | 381 (2.4%) |
| 2 or 3 Rooms | 783 (1.1%) | 2,930 (18.3%) |
| 4 or 5 Rooms | 13,379 (19.7%) | 7,428 (46.5%) |
| 6 or 7 Rooms | 23,844 (35.2%) | 3,630 (22.7%) |
| 8 or more Rooms | 29,726 (43.8%) | 1,597 (10.0%) |
| Total | 67,810 (100.0%) | 15,966 (100.0%) |
Housing Structure by Heating Type in Shelby County
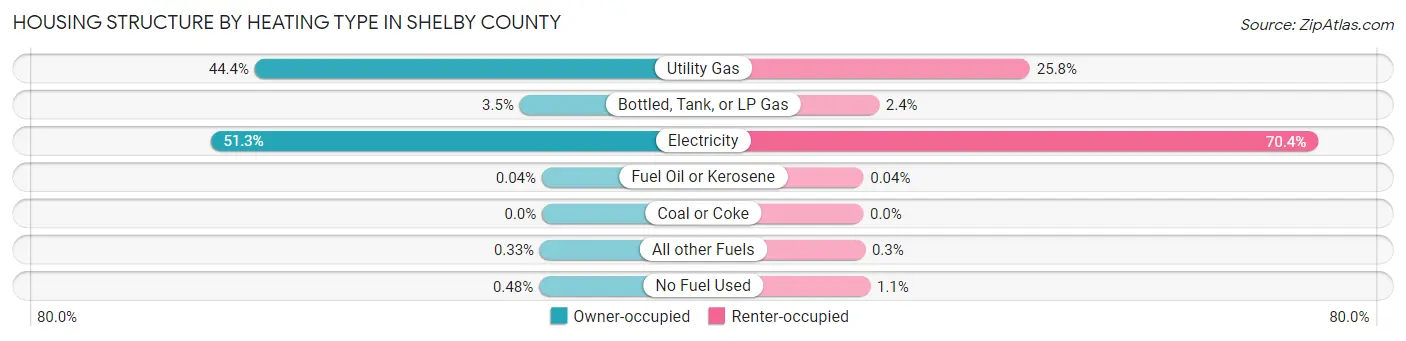
| Heating Type | Owner-occupied | Renter-occupied |
| Utility Gas | 30,117 (44.4%) | 4,118 (25.8%) |
| Bottled, Tank, or LP Gas | 2,348 (3.5%) | 389 (2.4%) |
| Electricity | 34,772 (51.3%) | 11,232 (70.4%) |
| Fuel Oil or Kerosene | 29 (0.0%) | 6 (0.0%) |
| Coal or Coke | 0 (0.0%) | 0 (0.0%) |
| All other Fuels | 221 (0.3%) | 48 (0.3%) |
| No Fuel Used | 323 (0.5%) | 173 (1.1%) |
| Total | 67,810 (100.0%) | 15,966 (100.0%) |
Household Vehicle Usage in Shelby County
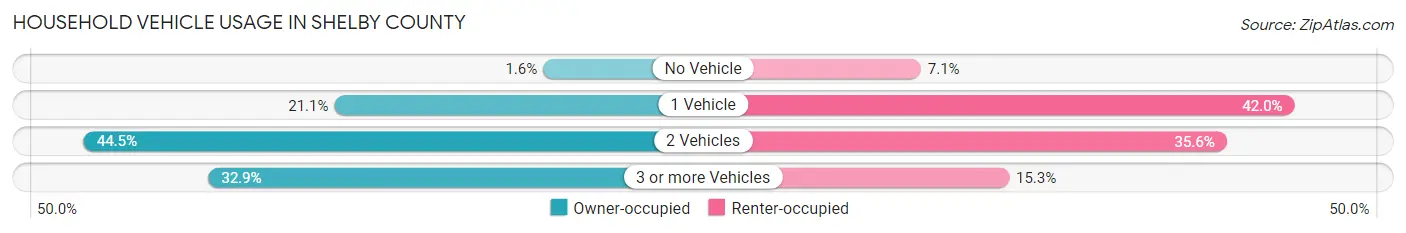
| Vehicles per Household | Owner-occupied | Renter-occupied |
| No Vehicle | 1,086 (1.6%) | 1,132 (7.1%) |
| 1 Vehicle | 14,298 (21.1%) | 6,699 (42.0%) |
| 2 Vehicles | 30,152 (44.5%) | 5,689 (35.6%) |
| 3 or more Vehicles | 22,274 (32.9%) | 2,446 (15.3%) |
| Total | 67,810 (100.0%) | 15,966 (100.0%) |
Real Estate & Mortgages in Shelby County
Real Estate and Mortgage Overview in Shelby County
| Characteristic | Without Mortgage | With Mortgage |
| Housing Units | 21,751 | 46,059 |
| Median Property Value | $268,300 | $279,600 |
| Median Household Income | $75,777 | $15,536 |
| Monthly Housing Costs | $500 | $3,671 |
| Real Estate Taxes | $1,225 | $3,572 |
Property Value by Mortgage Status in Shelby County
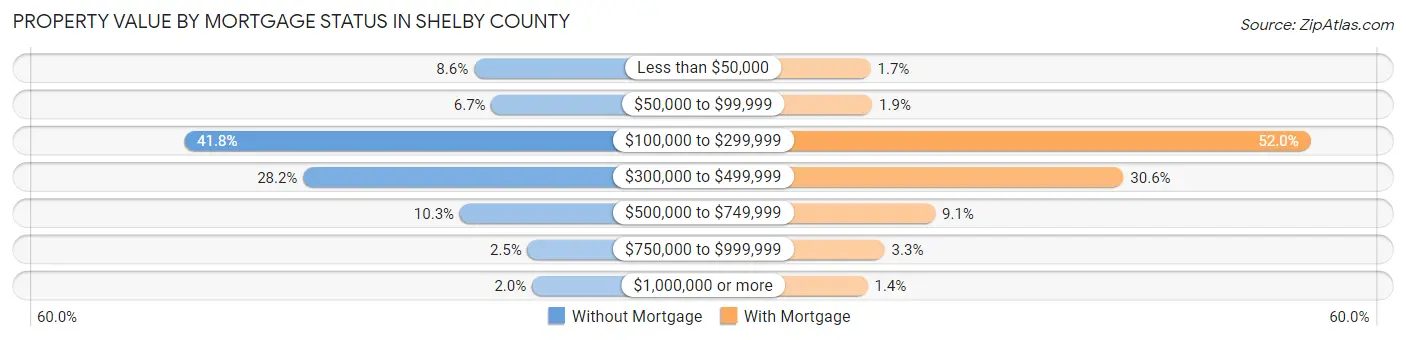
| Property Value | Without Mortgage | With Mortgage |
| Less than $50,000 | 1,880 (8.6%) | 790 (1.7%) |
| $50,000 to $99,999 | 1,446 (6.7%) | 873 (1.9%) |
| $100,000 to $299,999 | 9,086 (41.8%) | 23,949 (52.0%) |
| $300,000 to $499,999 | 6,125 (28.2%) | 14,097 (30.6%) |
| $500,000 to $749,999 | 2,230 (10.2%) | 4,186 (9.1%) |
| $750,000 to $999,999 | 546 (2.5%) | 1,533 (3.3%) |
| $1,000,000 or more | 438 (2.0%) | 631 (1.4%) |
| Total | 21,751 (100.0%) | 46,059 (100.0%) |
Household Income by Mortgage Status in Shelby County
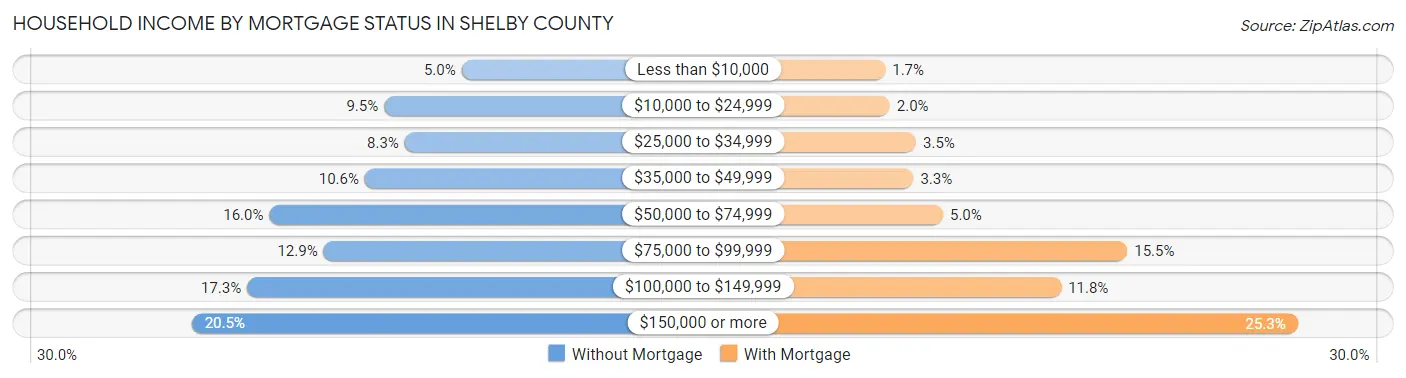
| Household Income | Without Mortgage | With Mortgage |
| Less than $10,000 | 1,094 (5.0%) | 782 (1.7%) |
| $10,000 to $24,999 | 2,057 (9.5%) | 901 (2.0%) |
| $25,000 to $34,999 | 1,800 (8.3%) | 1,593 (3.5%) |
| $35,000 to $49,999 | 2,297 (10.6%) | 1,523 (3.3%) |
| $50,000 to $74,999 | 3,484 (16.0%) | 2,304 (5.0%) |
| $75,000 to $99,999 | 2,810 (12.9%) | 7,153 (15.5%) |
| $100,000 to $149,999 | 3,760 (17.3%) | 5,414 (11.7%) |
| $150,000 or more | 4,449 (20.4%) | 11,635 (25.3%) |
| Total | 21,751 (100.0%) | 46,059 (100.0%) |
Property Value to Household Income Ratio in Shelby County
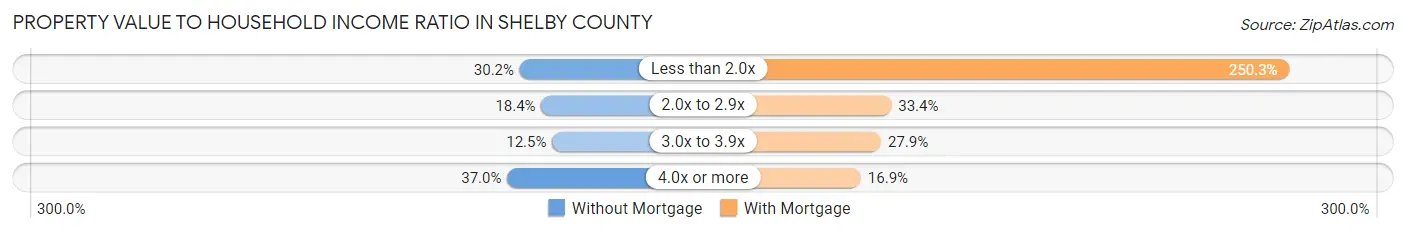
| Value-to-Income Ratio | Without Mortgage | With Mortgage |
| Less than 2.0x | 6,558 (30.1%) | 115,303 (250.3%) |
| 2.0x to 2.9x | 4,002 (18.4%) | 15,395 (33.4%) |
| 3.0x to 3.9x | 2,716 (12.5%) | 12,833 (27.9%) |
| 4.0x or more | 8,048 (37.0%) | 7,778 (16.9%) |
| Total | 21,751 (100.0%) | 46,059 (100.0%) |
Real Estate Taxes by Mortgage Status in Shelby County
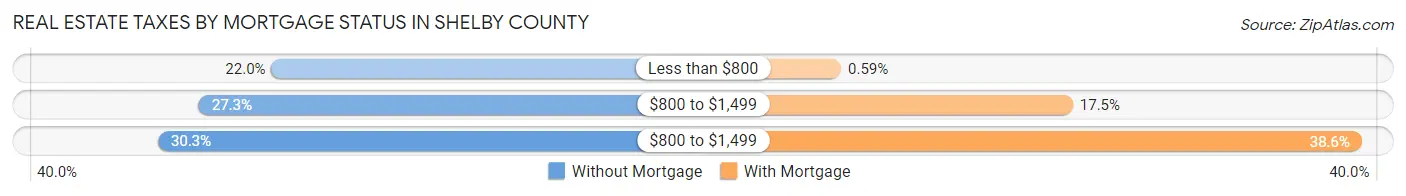
| Property Taxes | Without Mortgage | With Mortgage |
| Less than $800 | 4,778 (22.0%) | 274 (0.6%) |
| $800 to $1,499 | 5,932 (27.3%) | 8,071 (17.5%) |
| $800 to $1,499 | 6,581 (30.3%) | 17,792 (38.6%) |
| Total | 21,751 (100.0%) | 46,059 (100.0%) |
Health & Disability in Shelby County
Health Insurance Coverage by Age in Shelby County
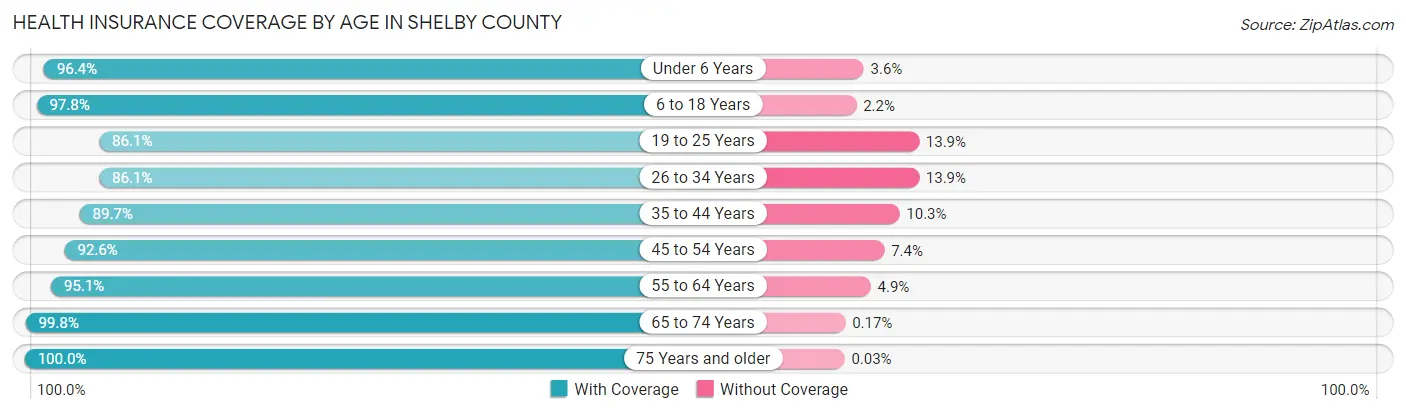
| Age Bracket | With Coverage | Without Coverage |
| Under 6 Years | 14,023 (96.4%) | 523 (3.6%) |
| 6 to 18 Years | 39,018 (97.8%) | 886 (2.2%) |
| 19 to 25 Years | 15,573 (86.1%) | 2,515 (13.9%) |
| 26 to 34 Years | 20,710 (86.1%) | 3,343 (13.9%) |
| 35 to 44 Years | 26,967 (89.7%) | 3,088 (10.3%) |
| 45 to 54 Years | 28,688 (92.6%) | 2,307 (7.4%) |
| 55 to 64 Years | 27,107 (95.1%) | 1,401 (4.9%) |
| 65 to 74 Years | 21,893 (99.8%) | 37 (0.2%) |
| 75 Years and older | 13,710 (100.0%) | 4 (0.0%) |
| Total | 207,689 (93.6%) | 14,104 (6.4%) |
Health Insurance Coverage by Citizenship Status in Shelby County
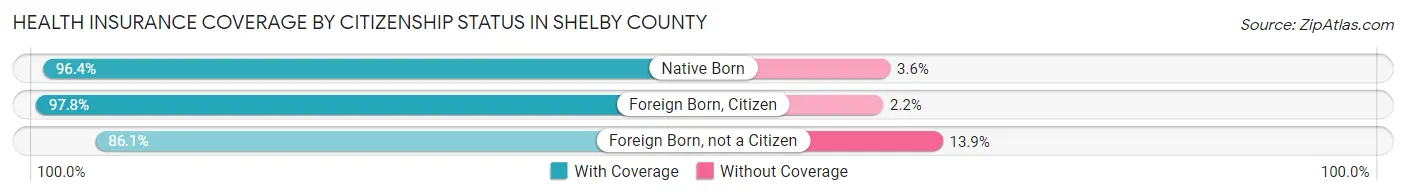
| Citizenship Status | With Coverage | Without Coverage |
| Native Born | 14,023 (96.4%) | 523 (3.6%) |
| Foreign Born, Citizen | 39,018 (97.8%) | 886 (2.2%) |
| Foreign Born, not a Citizen | 15,573 (86.1%) | 2,515 (13.9%) |
Health Insurance Coverage by Household Income in Shelby County
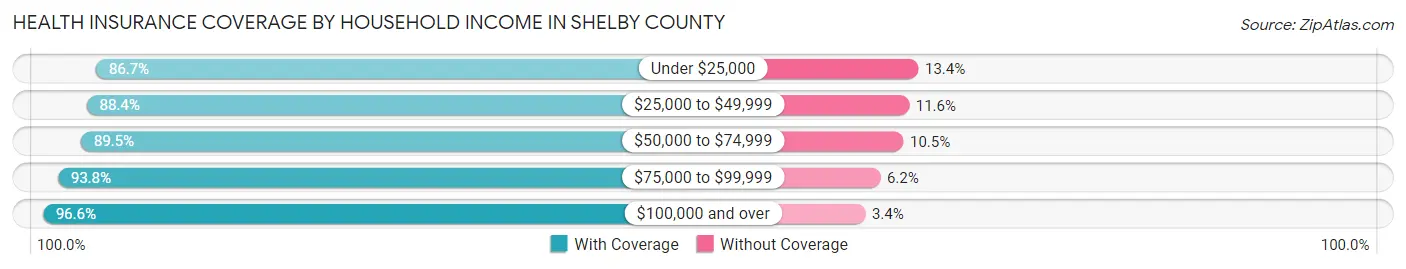
| Household Income | With Coverage | Without Coverage |
| Under $25,000 | 12,886 (86.7%) | 1,985 (13.4%) |
| $25,000 to $49,999 | 21,500 (88.4%) | 2,824 (11.6%) |
| $50,000 to $74,999 | 27,704 (89.5%) | 3,265 (10.5%) |
| $75,000 to $99,999 | 27,032 (93.8%) | 1,793 (6.2%) |
| $100,000 and over | 116,816 (96.6%) | 4,114 (3.4%) |
Public vs Private Health Insurance Coverage by Age in Shelby County
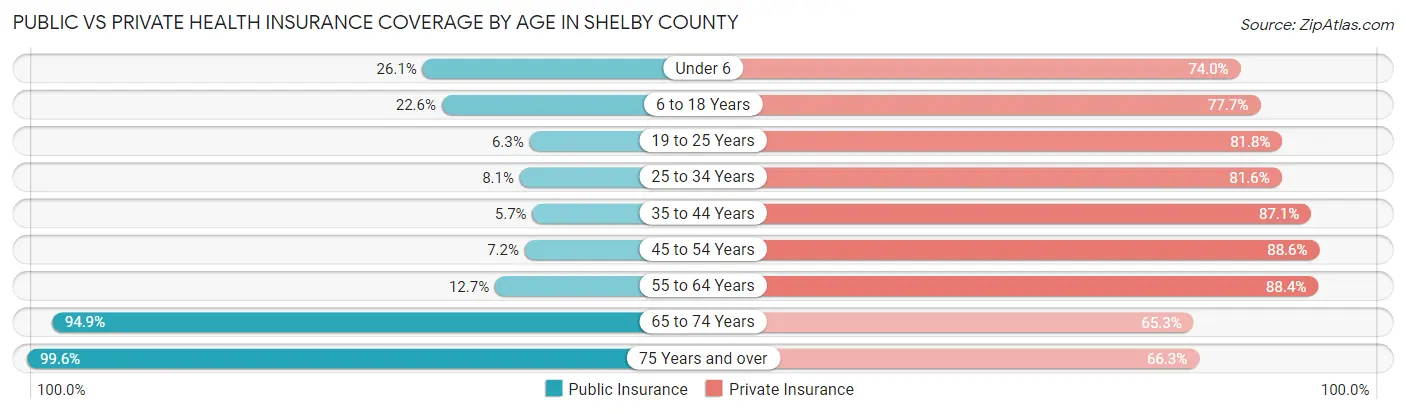
| Age Bracket | Public Insurance | Private Insurance |
| Under 6 | 3,798 (26.1%) | 10,762 (74.0%) |
| 6 to 18 Years | 9,007 (22.6%) | 30,987 (77.6%) |
| 19 to 25 Years | 1,134 (6.3%) | 14,787 (81.8%) |
| 25 to 34 Years | 1,943 (8.1%) | 19,632 (81.6%) |
| 35 to 44 Years | 1,724 (5.7%) | 26,179 (87.1%) |
| 45 to 54 Years | 2,220 (7.2%) | 27,472 (88.6%) |
| 55 to 64 Years | 3,619 (12.7%) | 25,205 (88.4%) |
| 65 to 74 Years | 20,819 (94.9%) | 14,318 (65.3%) |
| 75 Years and over | 13,654 (99.6%) | 9,094 (66.3%) |
| Total | 57,918 (26.1%) | 178,436 (80.4%) |
Disability Status by Sex by Age in Shelby County
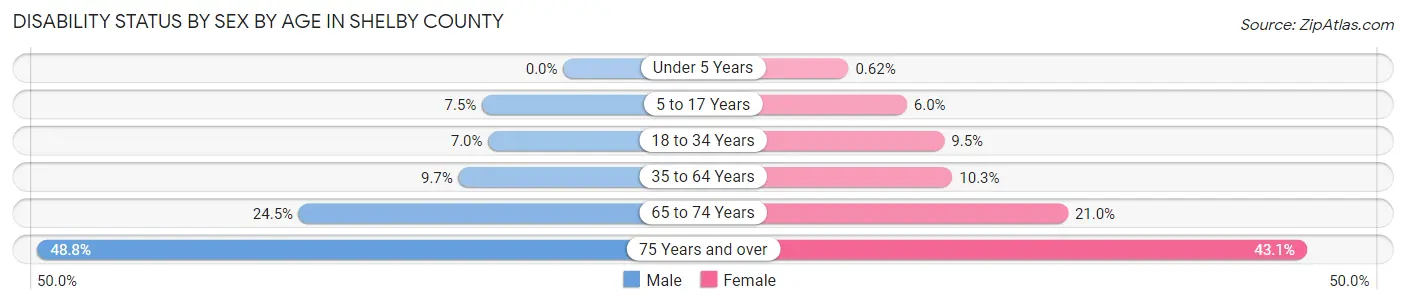
| Age Bracket | Male | Female |
| Under 5 Years | 0 (0.0%) | 37 (0.6%) |
| 5 to 17 Years | 1,495 (7.5%) | 1,161 (6.0%) |
| 18 to 34 Years | 1,547 (7.0%) | 2,223 (9.5%) |
| 35 to 64 Years | 4,253 (9.7%) | 4,699 (10.3%) |
| 65 to 74 Years | 2,496 (24.5%) | 2,468 (21.0%) |
| 75 Years and over | 2,759 (48.8%) | 3,477 (43.1%) |
Disability Class by Sex by Age in Shelby County
Disability Class: Hearing Difficulty
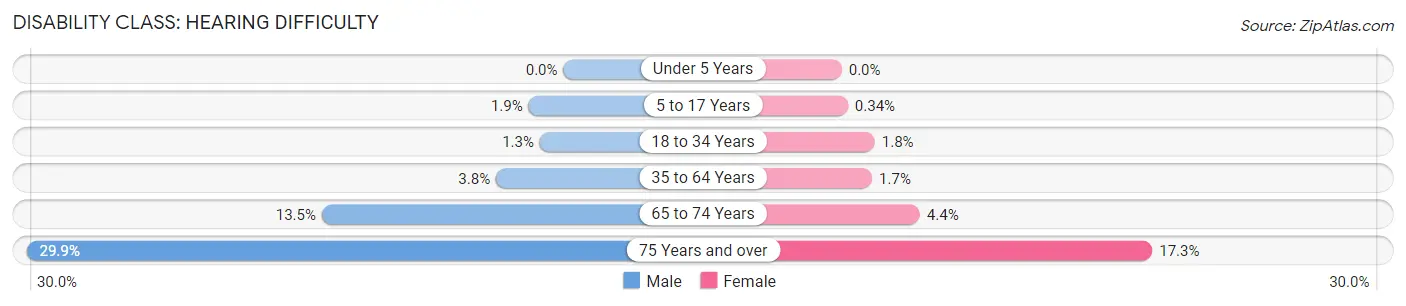
| Age Bracket | Male | Female |
| Under 5 Years | 0 (0.0%) | 0 (0.0%) |
| 5 to 17 Years | 386 (1.9%) | 65 (0.3%) |
| 18 to 34 Years | 291 (1.3%) | 430 (1.8%) |
| 35 to 64 Years | 1,642 (3.7%) | 773 (1.7%) |
| 65 to 74 Years | 1,368 (13.5%) | 512 (4.3%) |
| 75 Years and over | 1,690 (29.9%) | 1,393 (17.3%) |
Disability Class: Vision Difficulty
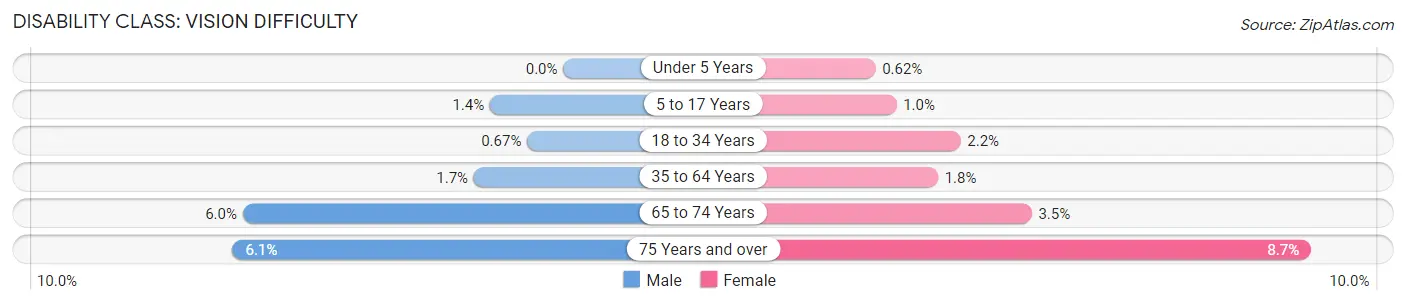
| Age Bracket | Male | Female |
| Under 5 Years | 0 (0.0%) | 37 (0.6%) |
| 5 to 17 Years | 270 (1.4%) | 194 (1.0%) |
| 18 to 34 Years | 148 (0.7%) | 514 (2.2%) |
| 35 to 64 Years | 725 (1.7%) | 815 (1.8%) |
| 65 to 74 Years | 605 (5.9%) | 414 (3.5%) |
| 75 Years and over | 347 (6.1%) | 702 (8.7%) |
Disability Class: Cognitive Difficulty
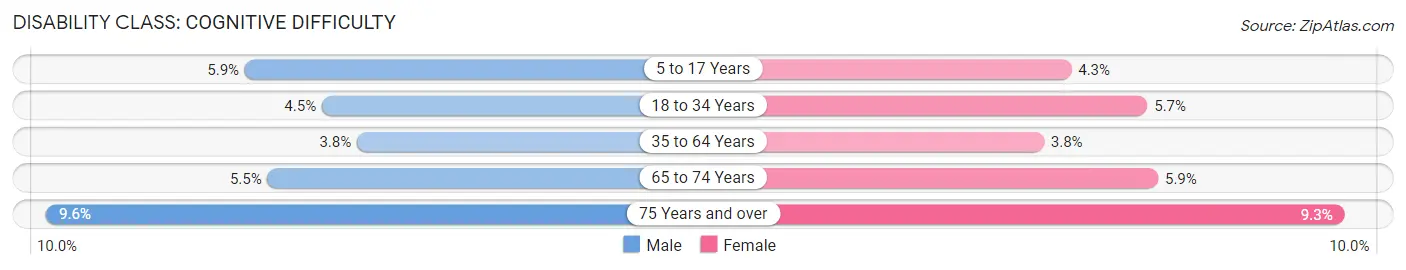
| Age Bracket | Male | Female |
| 5 to 17 Years | 1,173 (5.9%) | 819 (4.3%) |
| 18 to 34 Years | 996 (4.5%) | 1,324 (5.7%) |
| 35 to 64 Years | 1,675 (3.8%) | 1,717 (3.7%) |
| 65 to 74 Years | 558 (5.5%) | 690 (5.9%) |
| 75 Years and over | 543 (9.6%) | 752 (9.3%) |
Disability Class: Ambulatory Difficulty
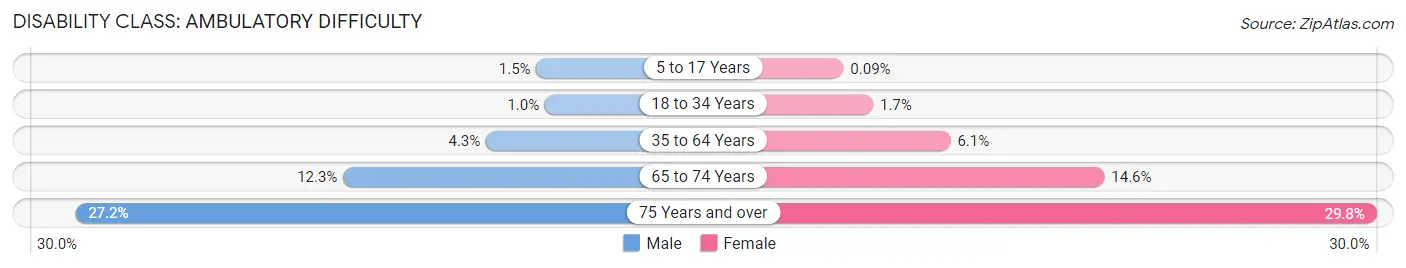
| Age Bracket | Male | Female |
| 5 to 17 Years | 297 (1.5%) | 17 (0.1%) |
| 18 to 34 Years | 227 (1.0%) | 406 (1.7%) |
| 35 to 64 Years | 1,881 (4.3%) | 2,769 (6.0%) |
| 65 to 74 Years | 1,247 (12.3%) | 1,719 (14.6%) |
| 75 Years and over | 1,537 (27.2%) | 2,401 (29.8%) |
Disability Class: Self-Care Difficulty
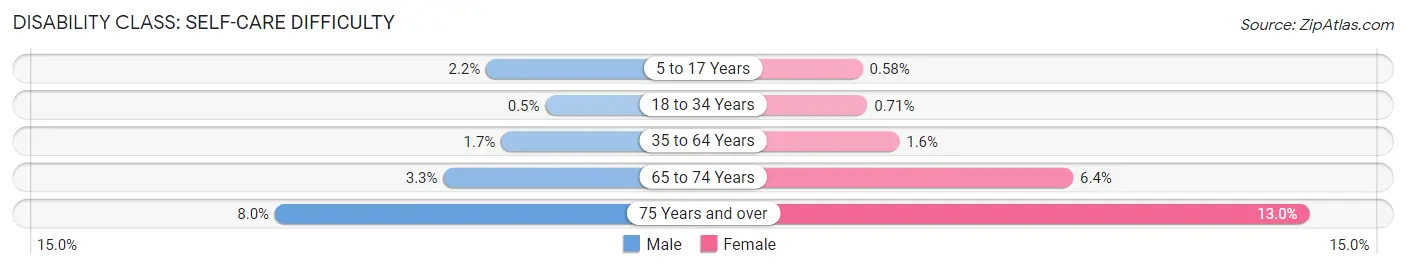
| Age Bracket | Male | Female |
| 5 to 17 Years | 426 (2.1%) | 112 (0.6%) |
| 18 to 34 Years | 110 (0.5%) | 167 (0.7%) |
| 35 to 64 Years | 759 (1.7%) | 734 (1.6%) |
| 65 to 74 Years | 340 (3.3%) | 757 (6.4%) |
| 75 Years and over | 454 (8.0%) | 1,049 (13.0%) |
Technology Access in Shelby County
Computing Device Access in Shelby County
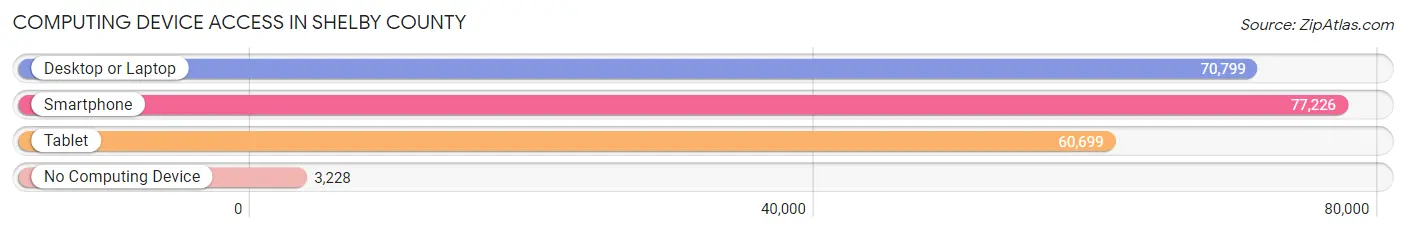
| Device Type | # Households | % Households |
| Desktop or Laptop | 70,799 | 84.5% |
| Smartphone | 77,226 | 92.2% |
| Tablet | 60,699 | 72.5% |
| No Computing Device | 3,228 | 3.8% |
| Total | 83,776 | 100.0% |
Internet Access in Shelby County
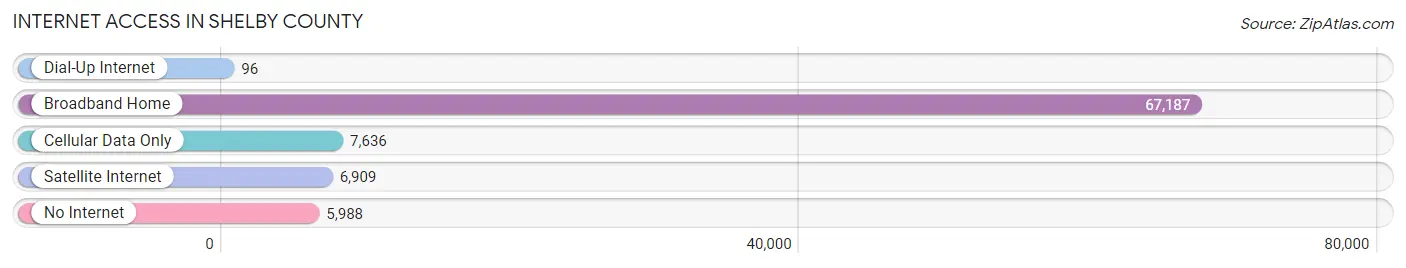
| Internet Type | # Households | % Households |
| Dial-Up Internet | 96 | 0.1% |
| Broadband Home | 67,187 | 80.2% |
| Cellular Data Only | 7,636 | 9.1% |
| Satellite Internet | 6,909 | 8.3% |
| No Internet | 5,988 | 7.1% |
| Total | 83,776 | 100.0% |
Shelby County Summary
Shelby County is located in the central part of the state of Alabama, and is part of the Birmingham-Hoover Metropolitan Statistical Area. It is bordered by Jefferson County to the north, St. Clair County to the east, Chilton County to the south, and Bibb County to the west. The county seat is Columbiana, and the largest city is Alabaster. As of the 2010 census, the population of Shelby County was 195,085.
History
Shelby County was established on February 7, 1818, and was named for Isaac Shelby, the first governor of Kentucky. The county was originally part of the Creek Nation, and was ceded to the United States in the Treaty of Fort Jackson in 1814. The first settlers arrived in the area in the early 1800s, and the county was officially organized in 1820.
During the Civil War, Shelby County was a major supplier of food and other supplies to the Confederate Army. After the war, the county experienced a period of economic growth, with the development of the coal and iron industries. The county also became a major agricultural center, with cotton, corn, and other crops being grown in the area.
Geography
Shelby County covers an area of 805 square miles, and is located in the central part of the state. The county is mostly flat, with some rolling hills in the northern and western parts. The Cahaba River runs through the county, and there are several small lakes and ponds scattered throughout the area. The county is mostly covered in forests, with some open fields and pastures.
The climate of Shelby County is humid subtropical, with hot, humid summers and mild winters. The average annual temperature is around 64°F, and the average annual precipitation is around 50 inches.
Economy
Shelby County has a diverse economy, with a mix of manufacturing, retail, and service industries. The county is home to several large companies, including Honda Manufacturing of Alabama, Mercedes-Benz U.S. International, and O’Neal Steel. The county is also home to several smaller businesses, including restaurants, retail stores, and professional services.
Agriculture is also an important part of the economy, with cotton, corn, soybeans, and other crops being grown in the area. The county is also home to several wineries and vineyards, and is a popular destination for wine tourism.
Demographics
As of the 2010 census, the population of Shelby County was 195,085, making it the sixth most populous county in Alabama. The population is spread out, with the largest cities being Alabaster (30,352), Pelham (21,352), and Chelsea (10,183).
The racial makeup of the county is 87.3% White, 8.7% Black or African American, 0.7% Native American, 1.2% Asian, 0.1% Pacific Islander, 0.7% from other races, and 1.5% from two or more races. The median household income is $63,845, and the median family income is $76,845. The per capita income is $30,845.
Common Questions
What is Per Capita Income in Shelby County?
Per Capita income in Shelby County is $45,701.
What is the Median Family Income in Shelby County?
Median Family Income in Shelby County is $112,123.
What is the Median Household income in Shelby County?
Median Household Income in Shelby County is $90,618.
What is Income or Wage Gap in Shelby County?
Income or Wage Gap in Shelby County is 34.1%.
Women in Shelby County earn 65.9 cents for every dollar earned by a man.
What is Family Income Deficit in Shelby County?
Family Income Deficit in Shelby County is $10,737.
Families that are below poverty line in Shelby County earn $10,737 less on average than the poverty threshold level.
What is Inequality or Gini Index in Shelby County?
Inequality or Gini Index in Shelby County is 0.44.
What is the Total Population of Shelby County?
Total Population of Shelby County is 223,916.
What is the Total Male Population of Shelby County?
Total Male Population of Shelby County is 109,226.
What is the Total Female Population of Shelby County?
Total Female Population of Shelby County is 114,690.
What is the Ratio of Males per 100 Females in Shelby County?
There are 95.24 Males per 100 Females in Shelby County.
What is the Ratio of Females per 100 Males in Shelby County?
There are 105.00 Females per 100 Males in Shelby County.
What is the Median Population Age in Shelby County?
Median Population Age in Shelby County is 40.0 Years.
What is the Average Family Size in Shelby County
Average Family Size in Shelby County is 3.1 People.
What is the Average Household Size in Shelby County
Average Household Size in Shelby County is 2.6 People.
How Large is the Labor Force in Shelby County?
There are 117,441 People in the Labor Forcein in Shelby County.
What is the Percentage of People in the Labor Force in Shelby County?
65.5% of People are in the Labor Force in Shelby County.
What is the Unemployment Rate in Shelby County?
Unemployment Rate in Shelby County is 3.1%.