Oxford, AL Map & Demographics
Oxford Map
Oxford Overview
$33,518
PER CAPITA INCOME
$73,868
AVG FAMILY INCOME
$66,031
AVG HOUSEHOLD INCOME
24.3%
WAGE / INCOME GAP [ % ]
75.7¢/ $1
WAGE / INCOME GAP [ $ ]
$12,916
FAMILY INCOME DEFICIT
0.43
INEQUALITY / GINI INDEX
22,019
TOTAL POPULATION
11,338
MALE POPULATION
10,681
FEMALE POPULATION
106.15
MALES / 100 FEMALES
94.21
FEMALES / 100 MALES
37.4
MEDIAN AGE
3.2
AVG FAMILY SIZE
2.6
AVG HOUSEHOLD SIZE
10,988
LABOR FORCE [ PEOPLE ]
62.6%
PERCENT IN LABOR FORCE
4.6%
UNEMPLOYMENT RATE
Oxford Zip Codes
Oxford Area Codes
Income in Oxford
Income Overview in Oxford
Per Capita Income in Oxford is $33,518, while median incomes of families and households are $73,868 and $66,031 respectively.
| Characteristic | Number | Measure |
| Per Capita Income | 22,019 | $33,518 |
| Median Family Income | 5,435 | $73,868 |
| Mean Family Income | 5,435 | $94,690 |
| Median Household Income | 8,177 | $66,031 |
| Mean Household Income | 8,177 | $82,259 |
| Income Deficit | 5,435 | $12,916 |
| Wage / Income Gap (%) | 22,019 | 24.35% |
| Wage / Income Gap ($) | 22,019 | 75.65¢ per $1 |
| Gini / Inequality Index | 22,019 | 0.43 |
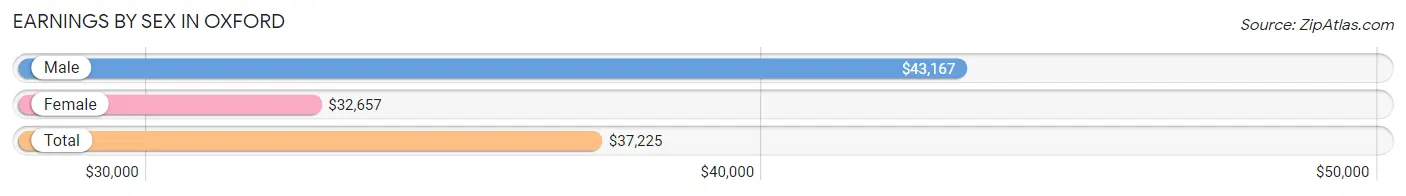
Earnings by Sex in Oxford
Average Earnings in Oxford are $37,225, $43,167 for men and $32,657 for women, a difference of 24.3%.
| Sex | Number | Average Earnings |
| Male | 6,175 (55.1%) | $43,167 |
| Female | 5,031 (44.9%) | $32,657 |
| Total | 11,206 (100.0%) | $37,225 |
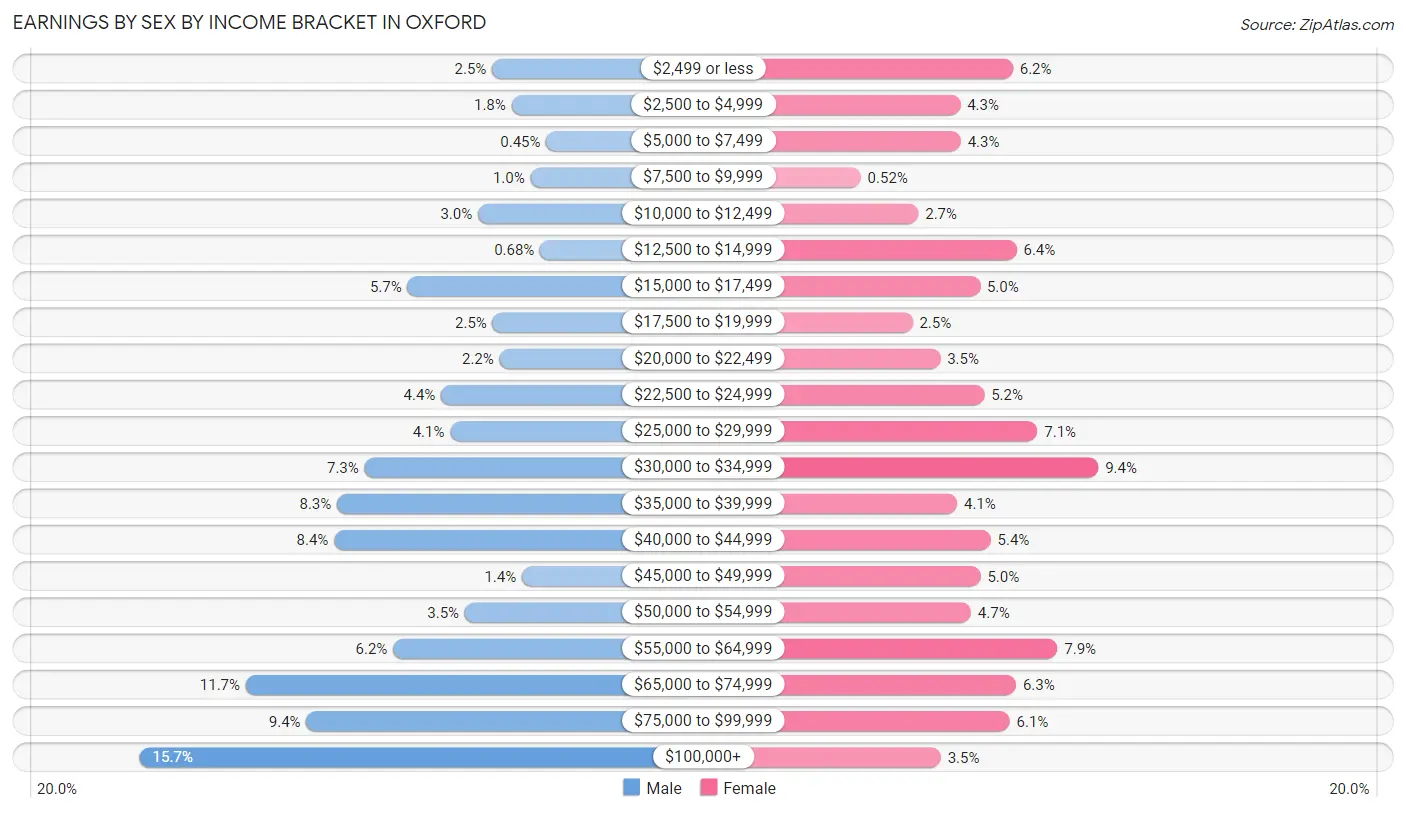
Earnings by Sex by Income Bracket in Oxford
The most common earnings brackets in Oxford are $100,000+ for men (969 | 15.7%) and $30,000 to $34,999 for women (474 | 9.4%).
| Income | Male | Female |
| $2,499 or less | 153 (2.5%) | 313 (6.2%) |
| $2,500 to $4,999 | 108 (1.8%) | 214 (4.3%) |
| $5,000 to $7,499 | 28 (0.4%) | 215 (4.3%) |
| $7,500 to $9,999 | 64 (1.0%) | 26 (0.5%) |
| $10,000 to $12,499 | 186 (3.0%) | 135 (2.7%) |
| $12,500 to $14,999 | 42 (0.7%) | 320 (6.4%) |
| $15,000 to $17,499 | 349 (5.7%) | 251 (5.0%) |
| $17,500 to $19,999 | 152 (2.5%) | 124 (2.5%) |
| $20,000 to $22,499 | 136 (2.2%) | 176 (3.5%) |
| $22,500 to $24,999 | 271 (4.4%) | 259 (5.1%) |
| $25,000 to $29,999 | 250 (4.1%) | 359 (7.1%) |
| $30,000 to $34,999 | 448 (7.3%) | 474 (9.4%) |
| $35,000 to $39,999 | 512 (8.3%) | 208 (4.1%) |
| $40,000 to $44,999 | 519 (8.4%) | 271 (5.4%) |
| $45,000 to $49,999 | 84 (1.4%) | 252 (5.0%) |
| $50,000 to $54,999 | 216 (3.5%) | 234 (4.6%) |
| $55,000 to $64,999 | 382 (6.2%) | 397 (7.9%) |
| $65,000 to $74,999 | 723 (11.7%) | 319 (6.3%) |
| $75,000 to $99,999 | 583 (9.4%) | 307 (6.1%) |
| $100,000+ | 969 (15.7%) | 177 (3.5%) |
| Total | 6,175 (100.0%) | 5,031 (100.0%) |
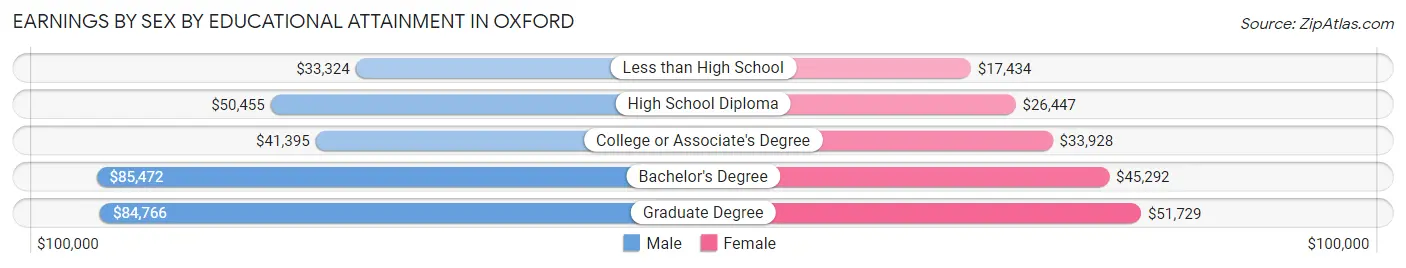
Earnings by Sex by Educational Attainment in Oxford
Average earnings in Oxford are $48,468 for men and $34,853 for women, a difference of 28.1%. Men with an educational attainment of bachelor's degree enjoy the highest average annual earnings of $85,472, while those with less than high school education earn the least with $33,324. Women with an educational attainment of graduate degree earn the most with the average annual earnings of $51,729, while those with less than high school education have the smallest earnings of $17,434.
| Educational Attainment | Male Income | Female Income |
| Less than High School | $33,324 | $17,434 |
| High School Diploma | $50,455 | $26,447 |
| College or Associate's Degree | $41,395 | $33,928 |
| Bachelor's Degree | $85,472 | $45,292 |
| Graduate Degree | $84,766 | $51,729 |
| Total | $48,468 | $34,853 |
Family Income in Oxford
Family Income Brackets in Oxford
According to the Oxford family income data, there are 1,239 families falling into the $50,000 to $74,999 income range, which is the most common income bracket and makes up 22.8% of all families. Conversely, the $10,000 to $14,999 income bracket is the least frequent group with only 125 families (2.3%) belonging to this category.
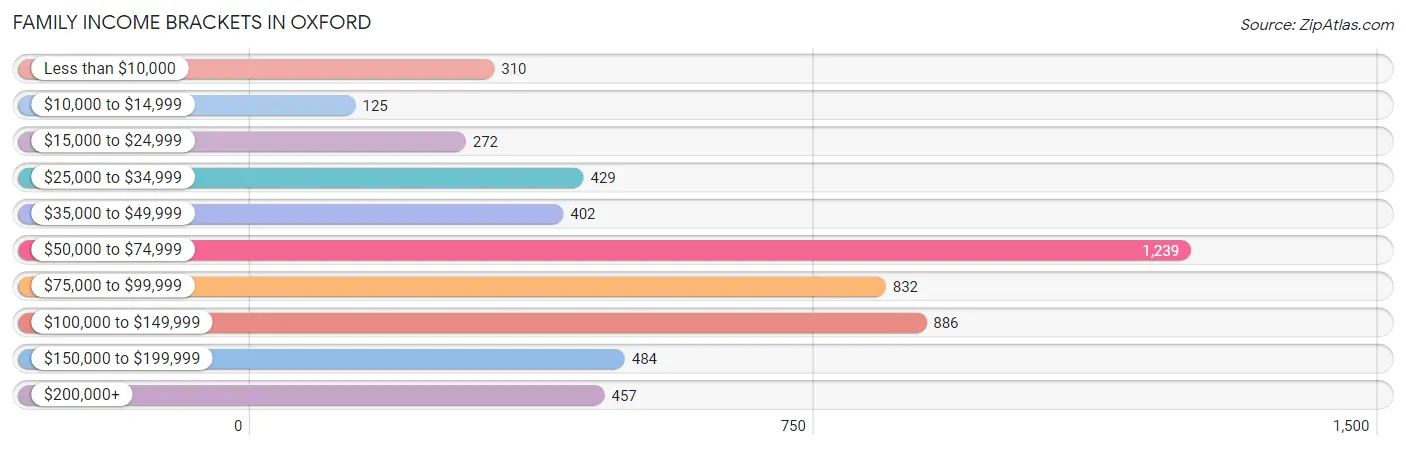
| Income Bracket | # Families | % Families |
| Less than $10,000 | 310 | 5.7% |
| $10,000 to $14,999 | 125 | 2.3% |
| $15,000 to $24,999 | 272 | 5.0% |
| $25,000 to $34,999 | 429 | 7.9% |
| $35,000 to $49,999 | 402 | 7.4% |
| $50,000 to $74,999 | 1,239 | 22.8% |
| $75,000 to $99,999 | 832 | 15.3% |
| $100,000 to $149,999 | 886 | 16.3% |
| $150,000 to $199,999 | 484 | 8.9% |
| $200,000+ | 457 | 8.4% |
Family Income by Famaliy Size in Oxford
6-person families (149 | 2.7%) account for the highest median family income in Oxford with $99,653 per family, while 2-person families (2,722 | 50.1%) have the highest median income of $33,188 per family member.
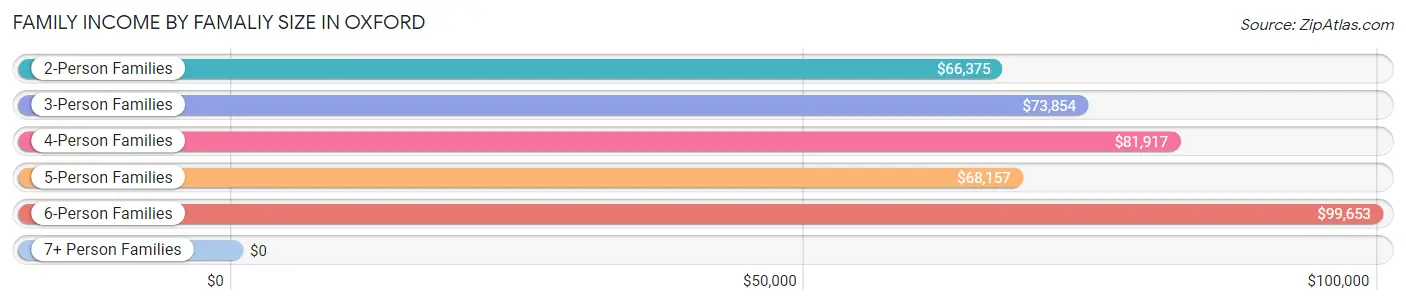
| Income Bracket | # Families | Median Income |
| 2-Person Families | 2,722 (50.1%) | $66,375 |
| 3-Person Families | 1,172 (21.6%) | $73,854 |
| 4-Person Families | 723 (13.3%) | $81,917 |
| 5-Person Families | 657 (12.1%) | $68,157 |
| 6-Person Families | 149 (2.7%) | $99,653 |
| 7+ Person Families | 12 (0.2%) | $0 |
| Total | 5,435 (100.0%) | $73,868 |
Family Income by Number of Earners in Oxford
The median family income in Oxford is $73,868, with families comprising 3+ earners (528) having the highest median family income of $151,607, while families with no earners (943) have the lowest median family income of $45,052, accounting for 9.7% and 17.3% of families, respectively.
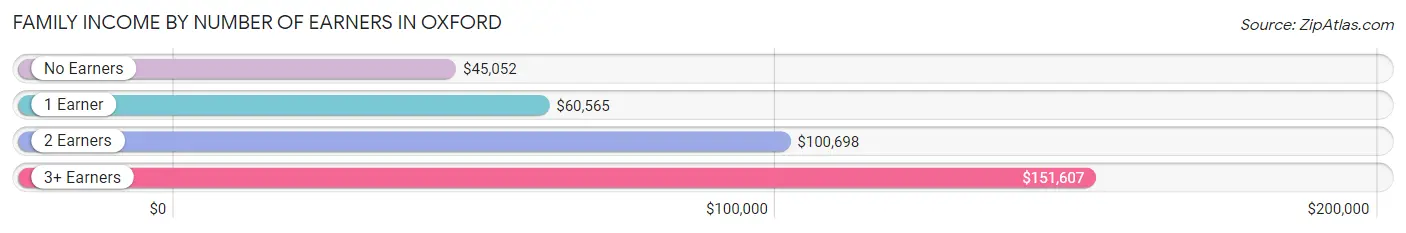
| Number of Earners | # Families | Median Income |
| No Earners | 943 (17.3%) | $45,052 |
| 1 Earner | 2,214 (40.7%) | $60,565 |
| 2 Earners | 1,750 (32.2%) | $100,698 |
| 3+ Earners | 528 (9.7%) | $151,607 |
| Total | 5,435 (100.0%) | $73,868 |
Household Income in Oxford
Household Income Brackets in Oxford
With 2,003 households falling in the category, the $50,000 to $74,999 income range is the most frequent in Oxford, accounting for 24.5% of all households. In contrast, only 213 households (2.6%) fall into the $10,000 to $14,999 income bracket, making it the least populous group.
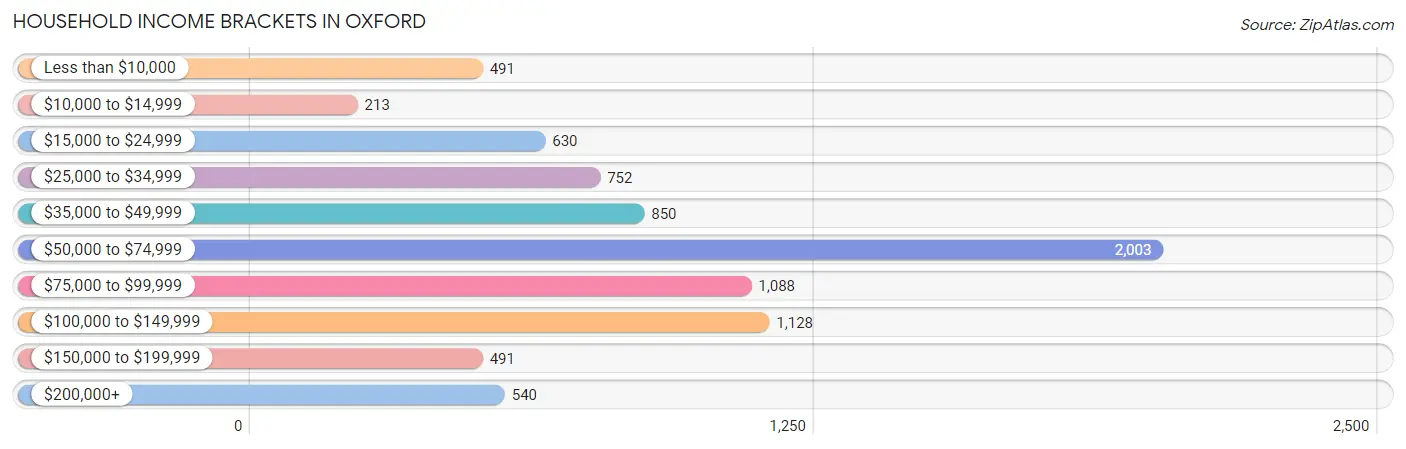
| Income Bracket | # Households | % Households |
| Less than $10,000 | 491 | 6.0% |
| $10,000 to $14,999 | 213 | 2.6% |
| $15,000 to $24,999 | 630 | 7.7% |
| $25,000 to $34,999 | 752 | 9.2% |
| $35,000 to $49,999 | 850 | 10.4% |
| $50,000 to $74,999 | 2,003 | 24.5% |
| $75,000 to $99,999 | 1,088 | 13.3% |
| $100,000 to $149,999 | 1,128 | 13.8% |
| $150,000 to $199,999 | 491 | 6.0% |
| $200,000+ | 540 | 6.6% |
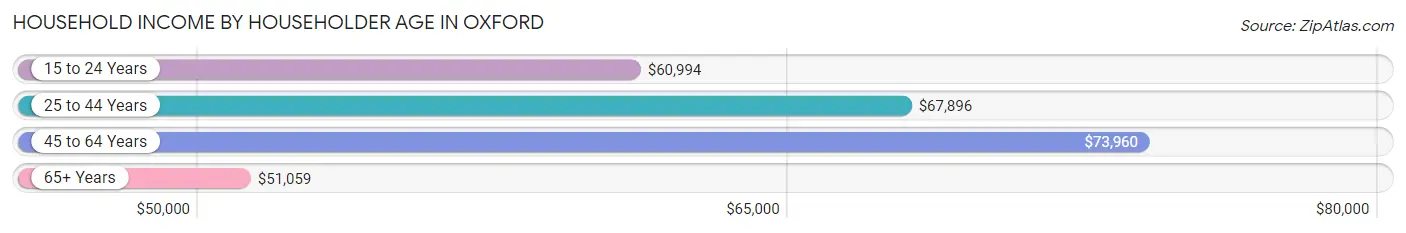
Household Income by Householder Age in Oxford
The median household income in Oxford is $66,031, with the highest median household income of $73,960 found in the 45 to 64 years age bracket for the primary householder. A total of 2,824 households (34.5%) fall into this category. Meanwhile, the 65+ years age bracket for the primary householder has the lowest median household income of $51,059, with 2,146 households (26.2%) in this group.
| Income Bracket | # Households | Median Income |
| 15 to 24 Years | 179 (2.2%) | $60,994 |
| 25 to 44 Years | 3,028 (37.0%) | $67,896 |
| 45 to 64 Years | 2,824 (34.5%) | $73,960 |
| 65+ Years | 2,146 (26.2%) | $51,059 |
| Total | 8,177 (100.0%) | $66,031 |
Poverty in Oxford
Income Below Poverty by Sex and Age in Oxford
With 11.6% poverty level for males and 14.2% for females among the residents of Oxford, 5 year old males and 16 and 17 year old females are the most vulnerable to poverty, with 38 males (42.2%) and 103 females (34.7%) in their respective age groups living below the poverty level.
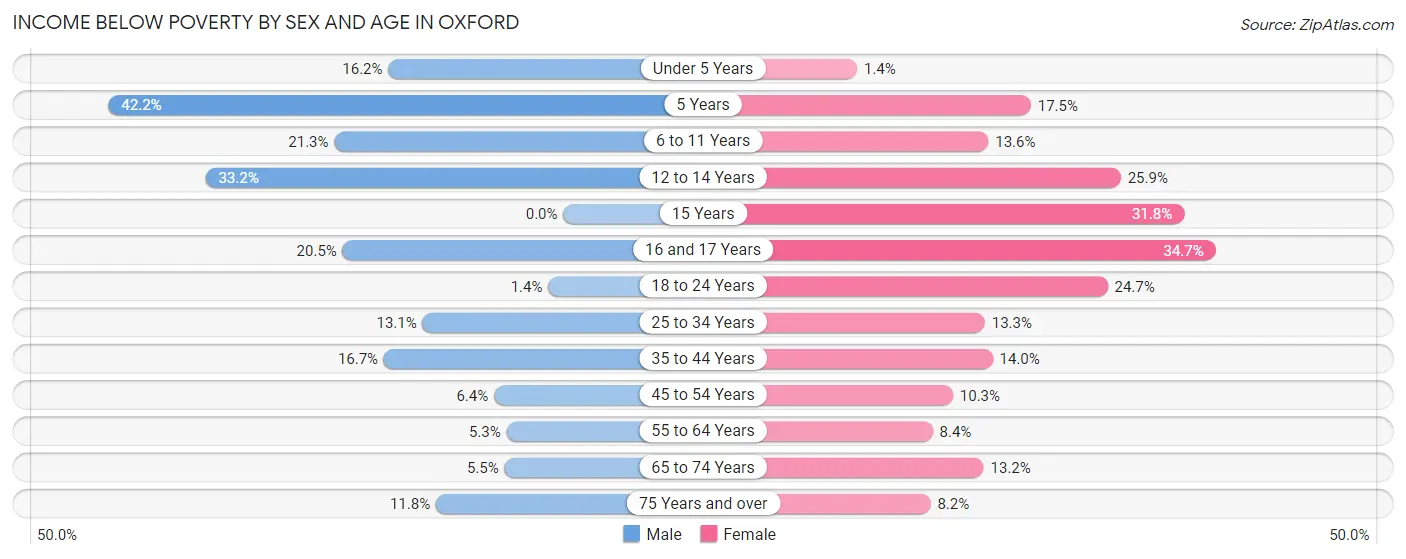
| Age Bracket | Male | Female |
| Under 5 Years | 121 (16.2%) | 6 (1.4%) |
| 5 Years | 38 (42.2%) | 30 (17.5%) |
| 6 to 11 Years | 232 (21.2%) | 85 (13.6%) |
| 12 to 14 Years | 91 (33.2%) | 109 (25.9%) |
| 15 Years | 0 (0.0%) | 74 (31.8%) |
| 16 and 17 Years | 51 (20.5%) | 103 (34.7%) |
| 18 to 24 Years | 7 (1.4%) | 219 (24.7%) |
| 25 to 34 Years | 274 (13.1%) | 240 (13.3%) |
| 35 to 44 Years | 161 (16.7%) | 209 (14.0%) |
| 45 to 54 Years | 127 (6.4%) | 123 (10.3%) |
| 55 to 64 Years | 71 (5.3%) | 96 (8.4%) |
| 65 to 74 Years | 56 (5.4%) | 137 (13.2%) |
| 75 Years and over | 61 (11.8%) | 69 (8.2%) |
| Total | 1,290 (11.6%) | 1,500 (14.2%) |
Income Above Poverty by Sex and Age in Oxford
According to the poverty statistics in Oxford, males aged 15 years and females aged under 5 years are the age groups that are most secure financially, with 100.0% of males and 98.6% of females in these age groups living above the poverty line.
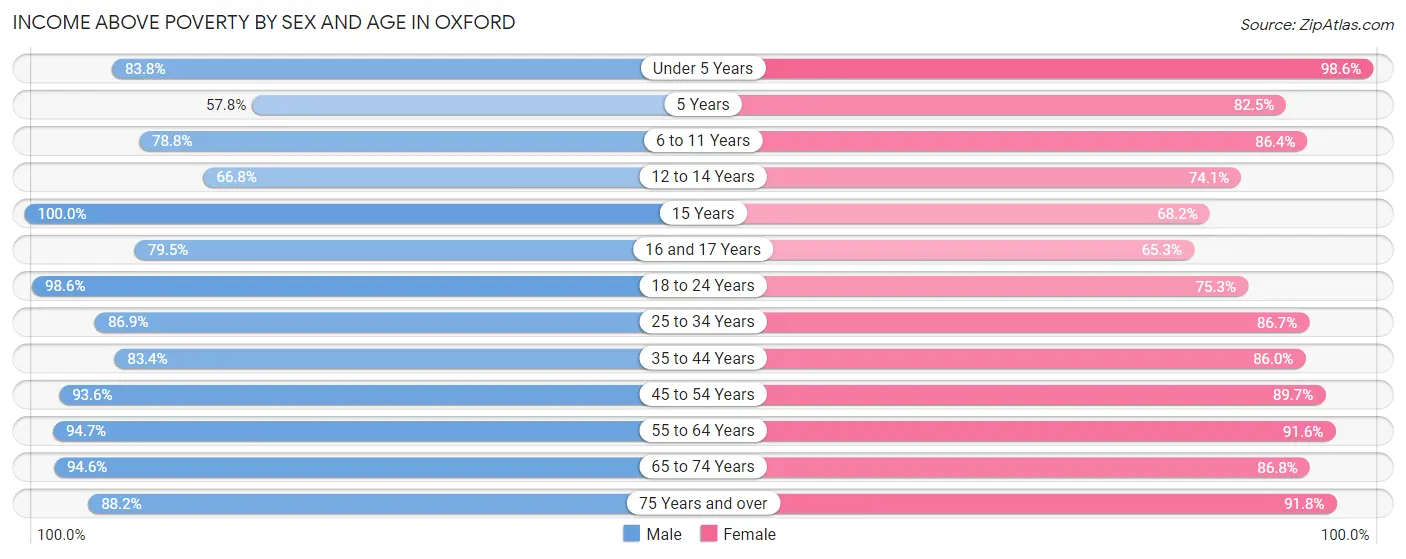
| Age Bracket | Male | Female |
| Under 5 Years | 624 (83.8%) | 421 (98.6%) |
| 5 Years | 52 (57.8%) | 141 (82.5%) |
| 6 to 11 Years | 860 (78.7%) | 540 (86.4%) |
| 12 to 14 Years | 183 (66.8%) | 312 (74.1%) |
| 15 Years | 279 (100.0%) | 159 (68.2%) |
| 16 and 17 Years | 198 (79.5%) | 194 (65.3%) |
| 18 to 24 Years | 493 (98.6%) | 669 (75.3%) |
| 25 to 34 Years | 1,822 (86.9%) | 1,568 (86.7%) |
| 35 to 44 Years | 806 (83.4%) | 1,285 (86.0%) |
| 45 to 54 Years | 1,847 (93.6%) | 1,070 (89.7%) |
| 55 to 64 Years | 1,277 (94.7%) | 1,043 (91.6%) |
| 65 to 74 Years | 971 (94.6%) | 904 (86.8%) |
| 75 Years and over | 455 (88.2%) | 769 (91.8%) |
| Total | 9,867 (88.4%) | 9,075 (85.8%) |
Income Below Poverty Among Married-Couple Families in Oxford
The poverty statistics for married-couple families in Oxford show that 7.9% or 303 of the total 3,834 families live below the poverty line. Families with 3 or 4 children have the highest poverty rate of 27.9%, comprising of 130 families. On the other hand, families with no children have the lowest poverty rate of 5.0%, which includes 121 families.
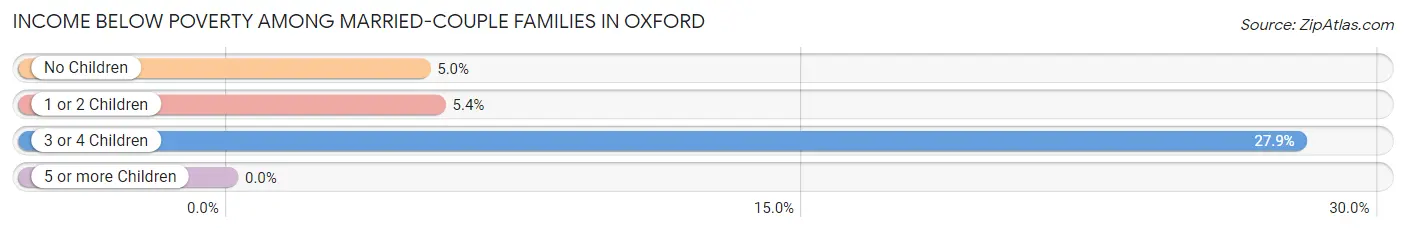
| Children | Above Poverty | Below Poverty |
| No Children | 2,288 (95.0%) | 121 (5.0%) |
| 1 or 2 Children | 907 (94.6%) | 52 (5.4%) |
| 3 or 4 Children | 336 (72.1%) | 130 (27.9%) |
| 5 or more Children | 0 (0.0%) | 0 (0.0%) |
| Total | 3,531 (92.1%) | 303 (7.9%) |
Income Below Poverty Among Single-Parent Households in Oxford
According to the poverty data in Oxford, 20.5% or 62 single-father households and 22.9% or 297 single-mother households are living below the poverty line. Among single-father households, those with 1 or 2 children have the highest poverty rate, with 62 households (42.8%) experiencing poverty. Likewise, among single-mother households, those with 3 or 4 children have the highest poverty rate, with 49 households (40.5%) falling below the poverty line.
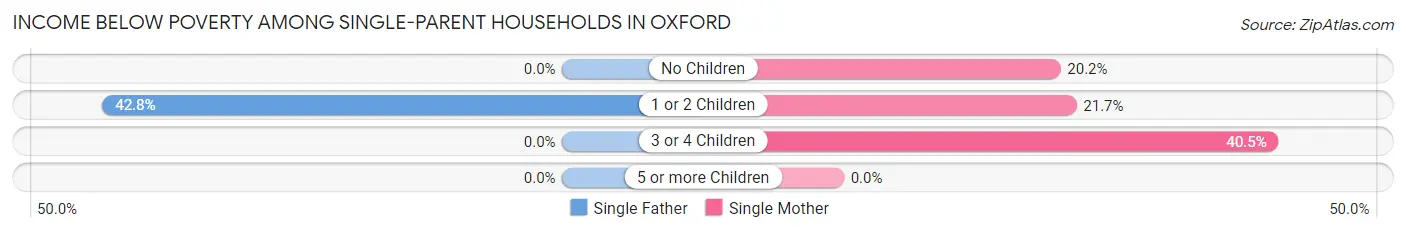
| Children | Single Father | Single Mother |
| No Children | 0 (0.0%) | 66 (20.2%) |
| 1 or 2 Children | 62 (42.8%) | 182 (21.7%) |
| 3 or 4 Children | 0 (0.0%) | 49 (40.5%) |
| 5 or more Children | 0 (0.0%) | 0 (0.0%) |
| Total | 62 (20.5%) | 297 (22.9%) |
Income Below Poverty Among Married-Couple vs Single-Parent Households in Oxford
The poverty data for Oxford shows that 303 of the married-couple family households (7.9%) and 359 of the single-parent households (22.4%) are living below the poverty level. Within the married-couple family households, those with 3 or 4 children have the highest poverty rate, with 130 households (27.9%) falling below the poverty line. Among the single-parent households, those with 3 or 4 children have the highest poverty rate, with 49 household (33.3%) living below poverty.
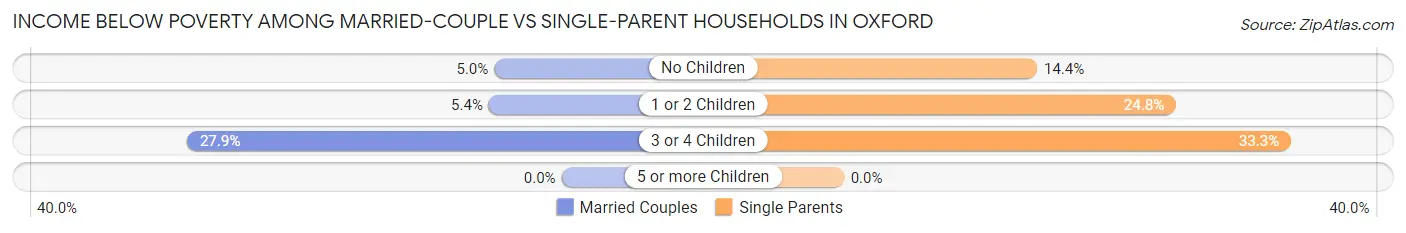
| Children | Married-Couple Families | Single-Parent Households |
| No Children | 121 (5.0%) | 66 (14.4%) |
| 1 or 2 Children | 52 (5.4%) | 244 (24.8%) |
| 3 or 4 Children | 130 (27.9%) | 49 (33.3%) |
| 5 or more Children | 0 (0.0%) | 0 (0.0%) |
| Total | 303 (7.9%) | 359 (22.4%) |
Race in Oxford
The most populous races in Oxford are White / Caucasian (16,319 | 74.1%), Black / African American (3,598 | 16.3%), and Hispanic or Latino (1,453 | 6.6%).
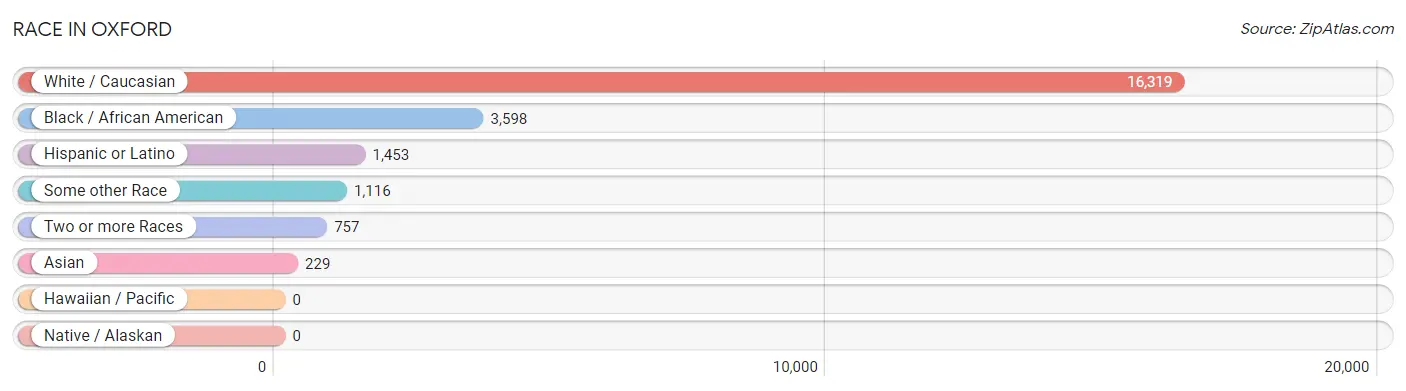
| Race | # Population | % Population |
| Asian | 229 | 1.0% |
| Black / African American | 3,598 | 16.3% |
| Hawaiian / Pacific | 0 | 0.0% |
| Hispanic or Latino | 1,453 | 6.6% |
| Native / Alaskan | 0 | 0.0% |
| White / Caucasian | 16,319 | 74.1% |
| Two or more Races | 757 | 3.4% |
| Some other Race | 1,116 | 5.1% |
| Total | 22,019 | 100.0% |
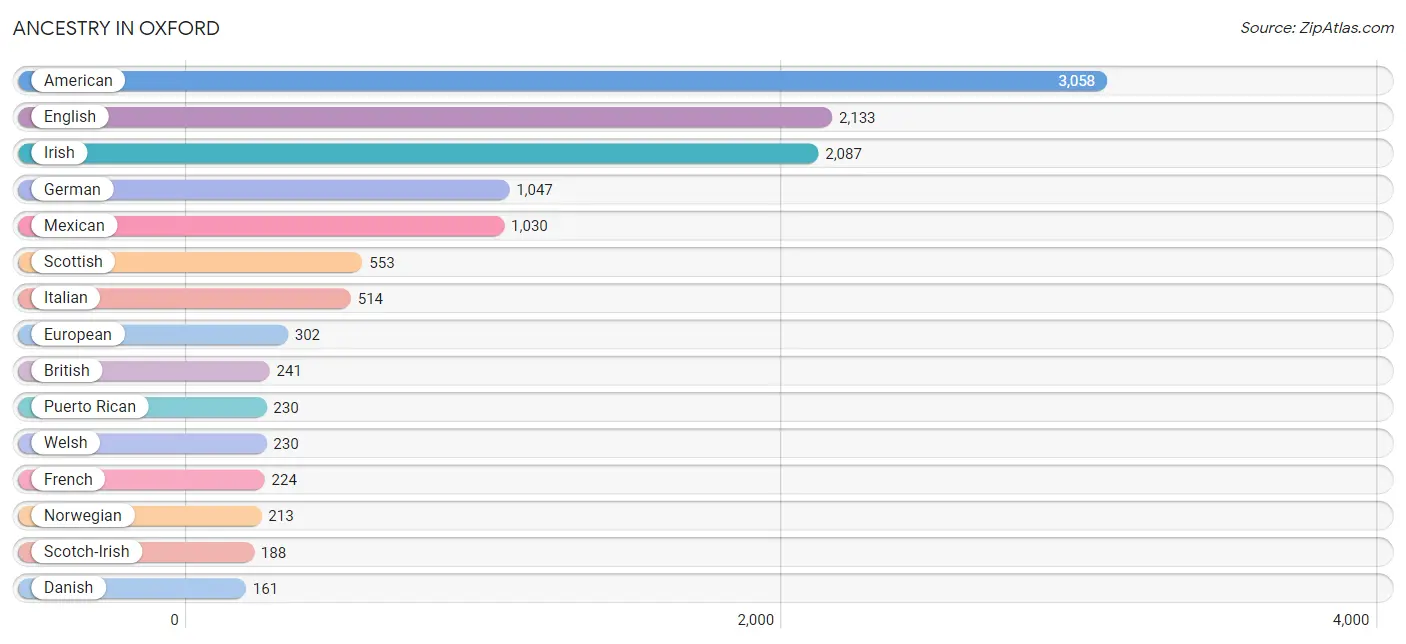
Ancestry in Oxford
The most populous ancestries reported in Oxford are American (3,058 | 13.9%), English (2,133 | 9.7%), Irish (2,087 | 9.5%), German (1,047 | 4.8%), and Mexican (1,030 | 4.7%), together accounting for 42.5% of all Oxford residents.
| Ancestry | # Population | % Population |
| African | 111 | 0.5% |
| American | 3,058 | 13.9% |
| Armenian | 16 | 0.1% |
| British | 241 | 1.1% |
| Burmese | 132 | 0.6% |
| Canadian | 27 | 0.1% |
| Central American | 110 | 0.5% |
| Central American Indian | 25 | 0.1% |
| Cherokee | 78 | 0.4% |
| Colombian | 4 | 0.0% |
| Comanche | 4 | 0.0% |
| Cuban | 11 | 0.1% |
| Czech | 20 | 0.1% |
| Danish | 161 | 0.7% |
| Dutch | 100 | 0.4% |
| Eastern European | 50 | 0.2% |
| English | 2,133 | 9.7% |
| European | 302 | 1.4% |
| French | 224 | 1.0% |
| German | 1,047 | 4.8% |
| Greek | 49 | 0.2% |
| Guatemalan | 1 | 0.0% |
| Honduran | 109 | 0.5% |
| Iranian | 30 | 0.1% |
| Irish | 2,087 | 9.5% |
| Italian | 514 | 2.3% |
| Korean | 74 | 0.3% |
| Laotian | 46 | 0.2% |
| Lithuanian | 75 | 0.3% |
| Mexican | 1,030 | 4.7% |
| Norwegian | 213 | 1.0% |
| Polish | 151 | 0.7% |
| Puerto Rican | 230 | 1.0% |
| Russian | 15 | 0.1% |
| Scandinavian | 26 | 0.1% |
| Scotch-Irish | 188 | 0.9% |
| Scottish | 553 | 2.5% |
| South American | 4 | 0.0% |
| Spaniard | 55 | 0.3% |
| Spanish | 13 | 0.1% |
| Sri Lankan | 40 | 0.2% |
| Subsaharan African | 158 | 0.7% |
| Swedish | 31 | 0.1% |
| Thai | 27 | 0.1% |
| Welsh | 230 | 1.0% |
| West Indian | 127 | 0.6% | View All 46 Rows |
Immigrants in Oxford
The most numerous immigrant groups reported in Oxford came from Latin America (654 | 3.0%), Central America (616 | 2.8%), Mexico (541 | 2.5%), Asia (151 | 0.7%), and Europe (104 | 0.5%), together accounting for 9.4% of all Oxford residents.
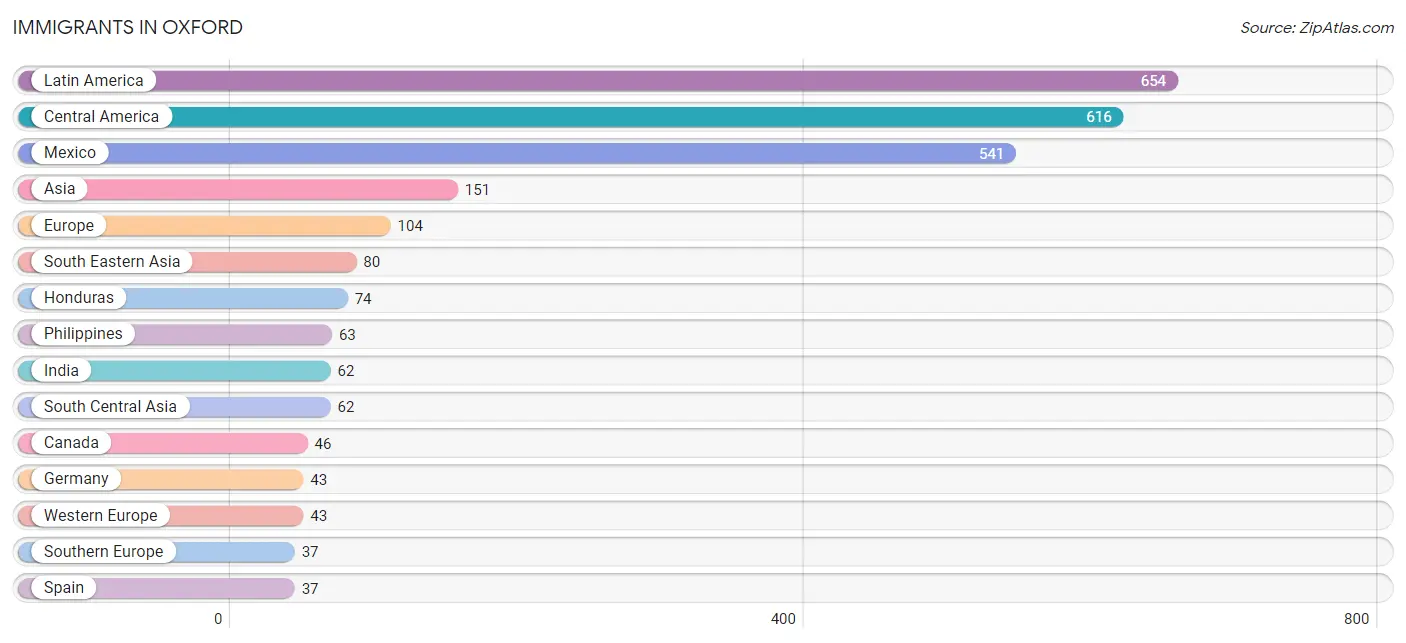
| Immigration Origin | # Population | % Population |
| Asia | 151 | 0.7% |
| Canada | 46 | 0.2% |
| Caribbean | 34 | 0.2% |
| Central America | 616 | 2.8% |
| Colombia | 4 | 0.0% |
| Cuba | 6 | 0.0% |
| Eastern Asia | 9 | 0.0% |
| Europe | 104 | 0.5% |
| Germany | 43 | 0.2% |
| Grenada | 28 | 0.1% |
| Guatemala | 1 | 0.0% |
| Honduras | 74 | 0.3% |
| India | 62 | 0.3% |
| Ireland | 8 | 0.0% |
| Korea | 9 | 0.0% |
| Latin America | 654 | 3.0% |
| Mexico | 541 | 2.5% |
| Northern Europe | 24 | 0.1% |
| Philippines | 63 | 0.3% |
| South America | 4 | 0.0% |
| South Central Asia | 62 | 0.3% |
| South Eastern Asia | 80 | 0.4% |
| Southern Europe | 37 | 0.2% |
| Spain | 37 | 0.2% |
| Vietnam | 17 | 0.1% |
| Western Europe | 43 | 0.2% | View All 26 Rows |
Sex and Age in Oxford
Sex and Age in Oxford
The most populous age groups in Oxford are 25 to 29 Years (1,213 | 10.7%) for men and 25 to 29 Years (911 | 8.5%) for women.
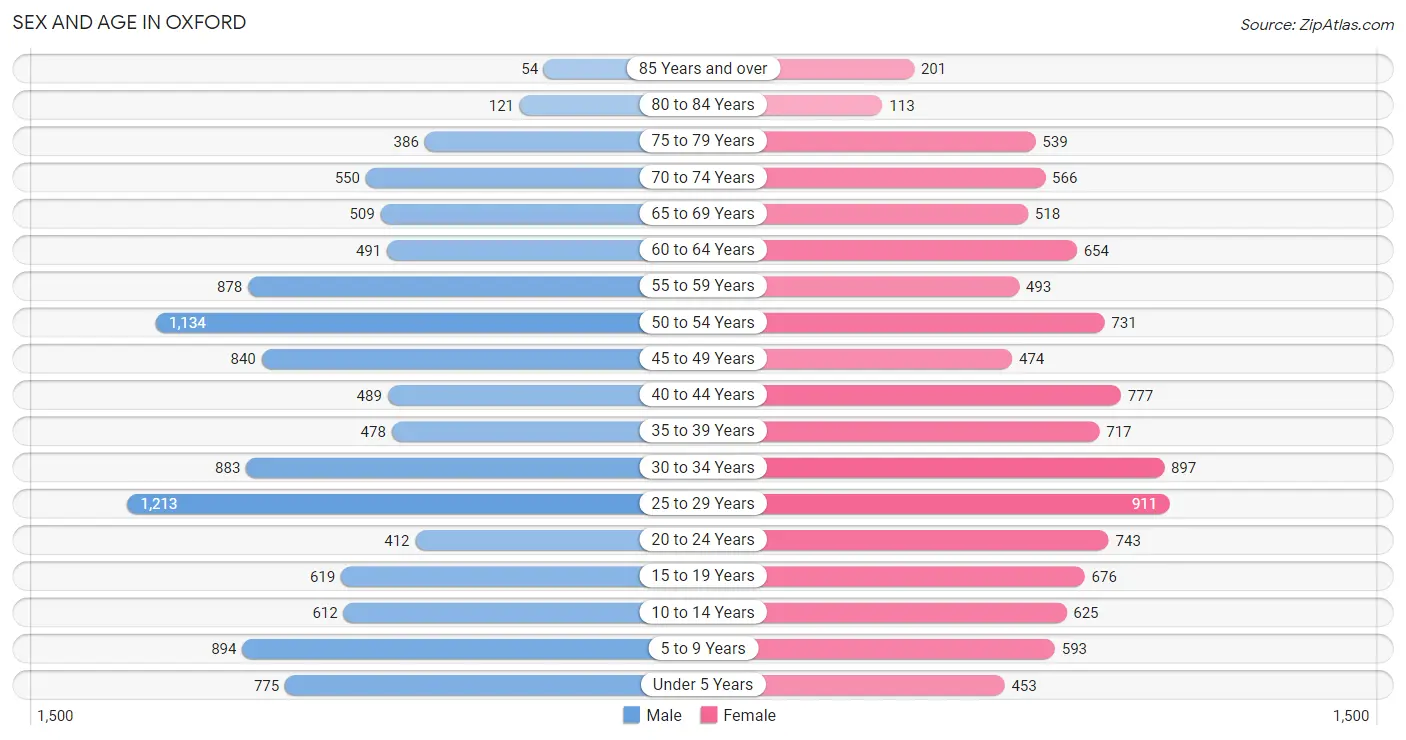
| Age Bracket | Male | Female |
| Under 5 Years | 775 (6.8%) | 453 (4.2%) |
| 5 to 9 Years | 894 (7.9%) | 593 (5.6%) |
| 10 to 14 Years | 612 (5.4%) | 625 (5.9%) |
| 15 to 19 Years | 619 (5.5%) | 676 (6.3%) |
| 20 to 24 Years | 412 (3.6%) | 743 (7.0%) |
| 25 to 29 Years | 1,213 (10.7%) | 911 (8.5%) |
| 30 to 34 Years | 883 (7.8%) | 897 (8.4%) |
| 35 to 39 Years | 478 (4.2%) | 717 (6.7%) |
| 40 to 44 Years | 489 (4.3%) | 777 (7.3%) |
| 45 to 49 Years | 840 (7.4%) | 474 (4.4%) |
| 50 to 54 Years | 1,134 (10.0%) | 731 (6.8%) |
| 55 to 59 Years | 878 (7.7%) | 493 (4.6%) |
| 60 to 64 Years | 491 (4.3%) | 654 (6.1%) |
| 65 to 69 Years | 509 (4.5%) | 518 (4.9%) |
| 70 to 74 Years | 550 (4.9%) | 566 (5.3%) |
| 75 to 79 Years | 386 (3.4%) | 539 (5.1%) |
| 80 to 84 Years | 121 (1.1%) | 113 (1.1%) |
| 85 Years and over | 54 (0.5%) | 201 (1.9%) |
| Total | 11,338 (100.0%) | 10,681 (100.0%) |
Families and Households in Oxford
Median Family Size in Oxford
The median family size in Oxford is 3.20 persons per family, with married-couple families (3,834 | 70.5%) accounting for the largest median family size of 3.24 persons per family. On the other hand, single male/father families (302 | 5.6%) represent the smallest median family size with 2.80 persons per family.
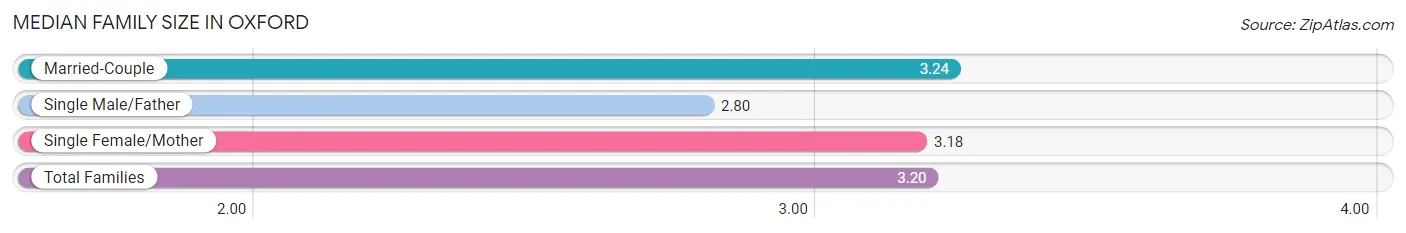
| Family Type | # Families | Family Size |
| Married-Couple | 3,834 (70.5%) | 3.24 |
| Single Male/Father | 302 (5.6%) | 2.80 |
| Single Female/Mother | 1,299 (23.9%) | 3.18 |
| Total Families | 5,435 (100.0%) | 3.20 |
Median Household Size in Oxford
The median household size in Oxford is 2.65 persons per household, with single female/mother households (1,299 | 15.9%) accounting for the largest median household size of 3.46 persons per household. non-family households (2,742 | 33.5%) represent the smallest median household size with 1.30 persons per household.
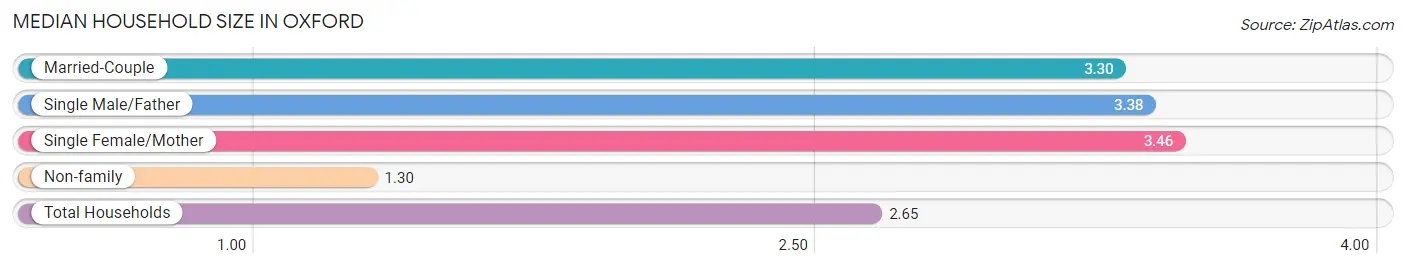
| Household Type | # Households | Household Size |
| Married-Couple | 3,834 (46.9%) | 3.30 |
| Single Male/Father | 302 (3.7%) | 3.38 |
| Single Female/Mother | 1,299 (15.9%) | 3.46 |
| Non-family | 2,742 (33.5%) | 1.30 |
| Total Households | 8,177 (100.0%) | 2.65 |
Household Size by Marriage Status in Oxford
Out of a total of 8,177 households in Oxford, 5,435 (66.5%) are family households, while 2,742 (33.5%) are nonfamily households. The most numerous type of family households are 2-person households, comprising 2,444, and the most common type of nonfamily households are 1-person households, comprising 2,307.
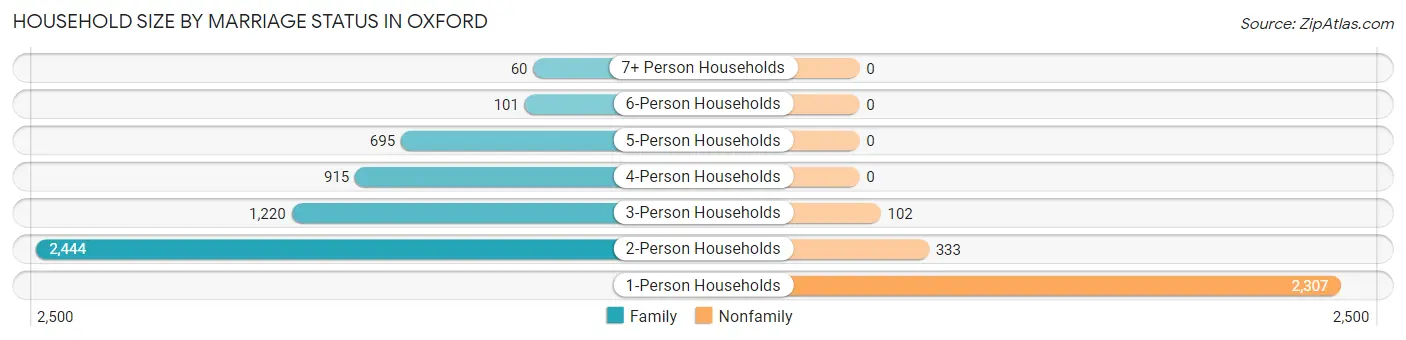
| Household Size | Family Households | Nonfamily Households |
| 1-Person Households | - | 2,307 (28.2%) |
| 2-Person Households | 2,444 (29.9%) | 333 (4.1%) |
| 3-Person Households | 1,220 (14.9%) | 102 (1.3%) |
| 4-Person Households | 915 (11.2%) | 0 (0.0%) |
| 5-Person Households | 695 (8.5%) | 0 (0.0%) |
| 6-Person Households | 101 (1.2%) | 0 (0.0%) |
| 7+ Person Households | 60 (0.7%) | 0 (0.0%) |
| Total | 5,435 (66.5%) | 2,742 (33.5%) |
Female Fertility in Oxford
Fertility by Age in Oxford
Average fertility rate in Oxford is 39.0 births per 1,000 women. Women in the age bracket of 20 to 34 years have the highest fertility rate with 79.0 births per 1,000 women. Women in the age bracket of 20 to 34 years acount for 94.8% of all women with births.
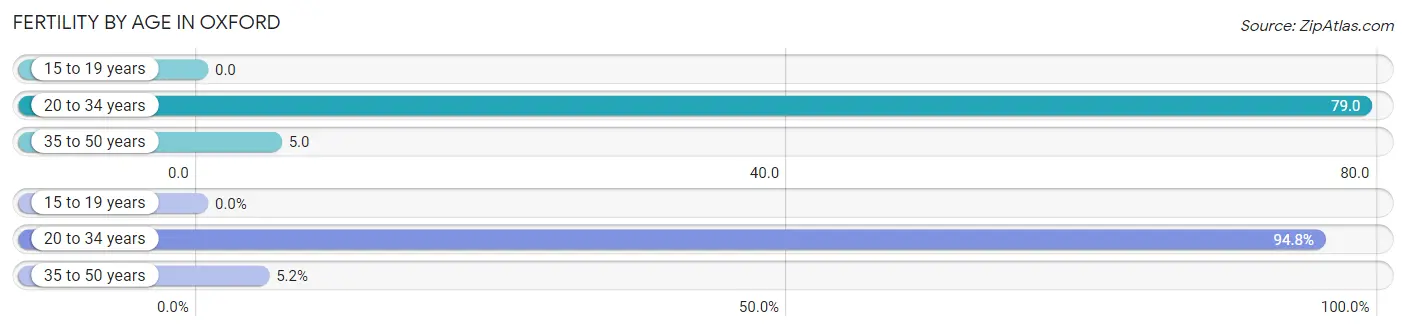
| Age Bracket | Women with Births | Births / 1,000 Women |
| 15 to 19 years | 0 (0.0%) | 0.0 |
| 20 to 34 years | 201 (94.8%) | 79.0 |
| 35 to 50 years | 11 (5.2%) | 5.0 |
| Total | 212 (100.0%) | 39.0 |
Fertility by Age by Marriage Status in Oxford
46.7% of women with births (212) in Oxford are married. The highest percentage of unmarried women with births falls into 35 to 50 years age bracket with 100.0% of them unmarried at the time of birth, while the lowest percentage of unmarried women with births belong to 20 to 34 years age bracket with 50.8% of them unmarried.
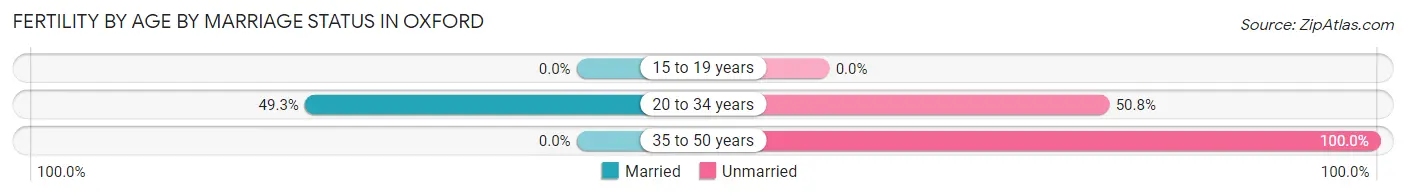
| Age Bracket | Married | Unmarried |
| 15 to 19 years | 0 (0.0%) | 0 (0.0%) |
| 20 to 34 years | 99 (49.2%) | 102 (50.7%) |
| 35 to 50 years | 0 (0.0%) | 11 (100.0%) |
| Total | 99 (46.7%) | 113 (53.3%) |
Fertility by Education in Oxford
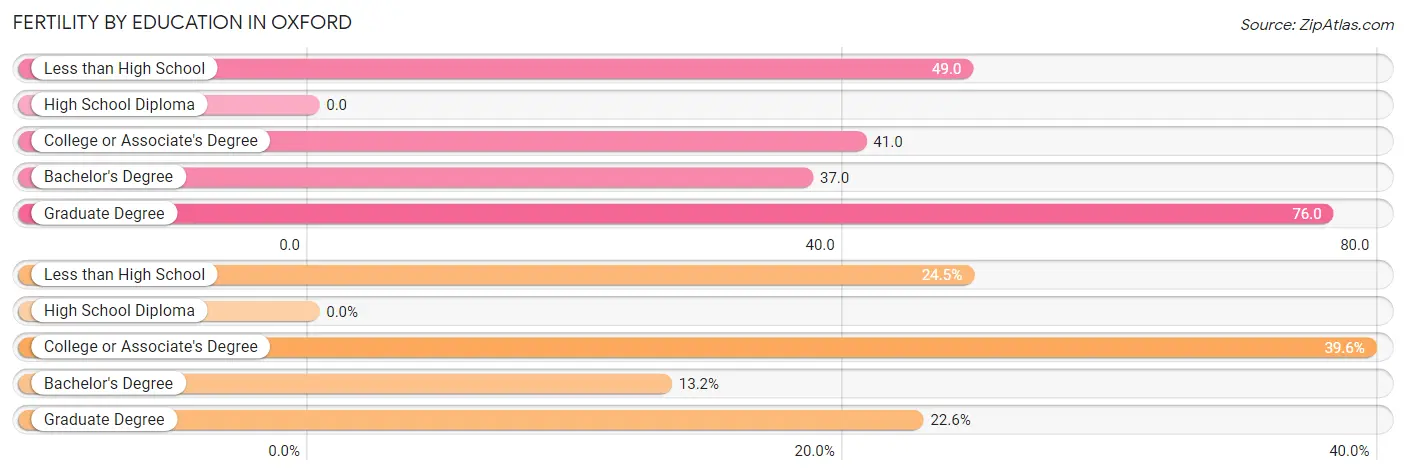
| Educational Attainment | Women with Births | Births / 1,000 Women |
| Less than High School | 52 (24.5%) | 49.0 |
| High School Diploma | 0 (0.0%) | 0.0 |
| College or Associate's Degree | 84 (39.6%) | 41.0 |
| Bachelor's Degree | 28 (13.2%) | 37.0 |
| Graduate Degree | 48 (22.6%) | 76.0 |
| Total | 212 (100.0%) | 39.0 |
Fertility by Education by Marriage Status in Oxford
53.3% of women with births in Oxford are unmarried. Women with the educational attainment of less than high school are most likely to be married with 98.1% of them married at childbirth, while women with the educational attainment of bachelor's degree are least likely to be married with 100.0% of them unmarried at childbirth.
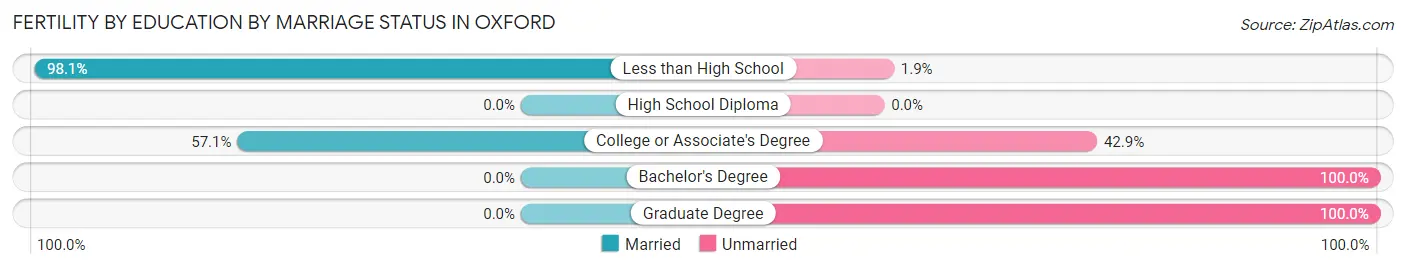
| Educational Attainment | Married | Unmarried |
| Less than High School | 51 (98.1%) | 1 (1.9%) |
| High School Diploma | 0 (0.0%) | 0 (0.0%) |
| College or Associate's Degree | 48 (57.1%) | 36 (42.9%) |
| Bachelor's Degree | 0 (0.0%) | 28 (100.0%) |
| Graduate Degree | 0 (0.0%) | 48 (100.0%) |
| Total | 99 (46.7%) | 113 (53.3%) |
Employment Characteristics in Oxford
Employment by Class of Employer in Oxford
Among the 10,373 employed individuals in Oxford, private company employees (7,335 | 70.7%), not-for-profit organizations (648 | 6.2%), and self-employed (not incorporated) (622 | 6.0%) make up the most common classes of employment.
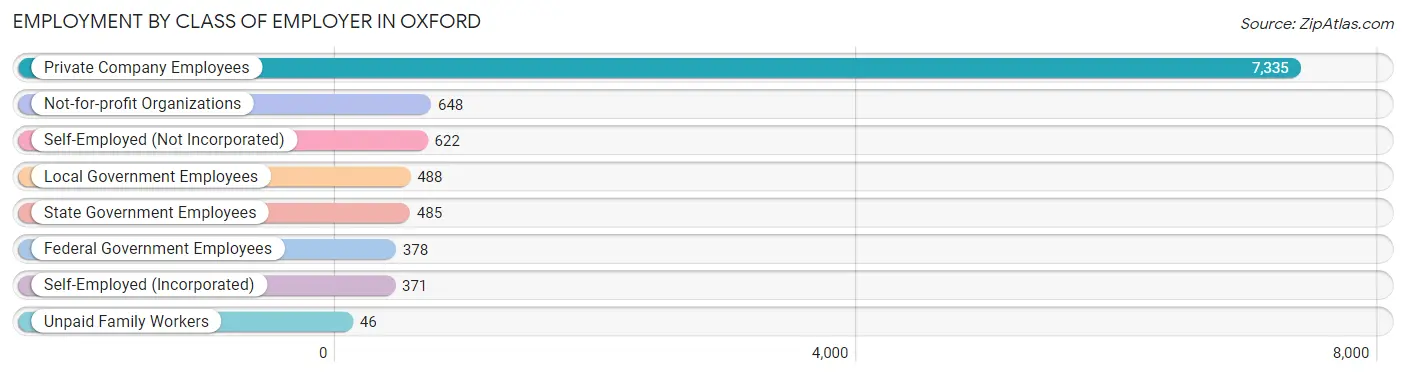
| Employer Class | # Employees | % Employees |
| Private Company Employees | 7,335 | 70.7% |
| Self-Employed (Incorporated) | 371 | 3.6% |
| Self-Employed (Not Incorporated) | 622 | 6.0% |
| Not-for-profit Organizations | 648 | 6.2% |
| Local Government Employees | 488 | 4.7% |
| State Government Employees | 485 | 4.7% |
| Federal Government Employees | 378 | 3.6% |
| Unpaid Family Workers | 46 | 0.4% |
| Total | 10,373 | 100.0% |
Employment Status by Age in Oxford
According to the labor force statistics for Oxford, out of the total population over 16 years of age (17,552), 62.6% or 10,988 individuals are in the labor force, with 4.6% or 505 of them unemployed. The age group with the highest labor force participation rate is 25 to 29 years, with 89.9% or 1,909 individuals in the labor force. Within the labor force, the 20 to 24 years age range has the highest percentage of unemployed individuals, with 10.9% or 96 of them being unemployed.
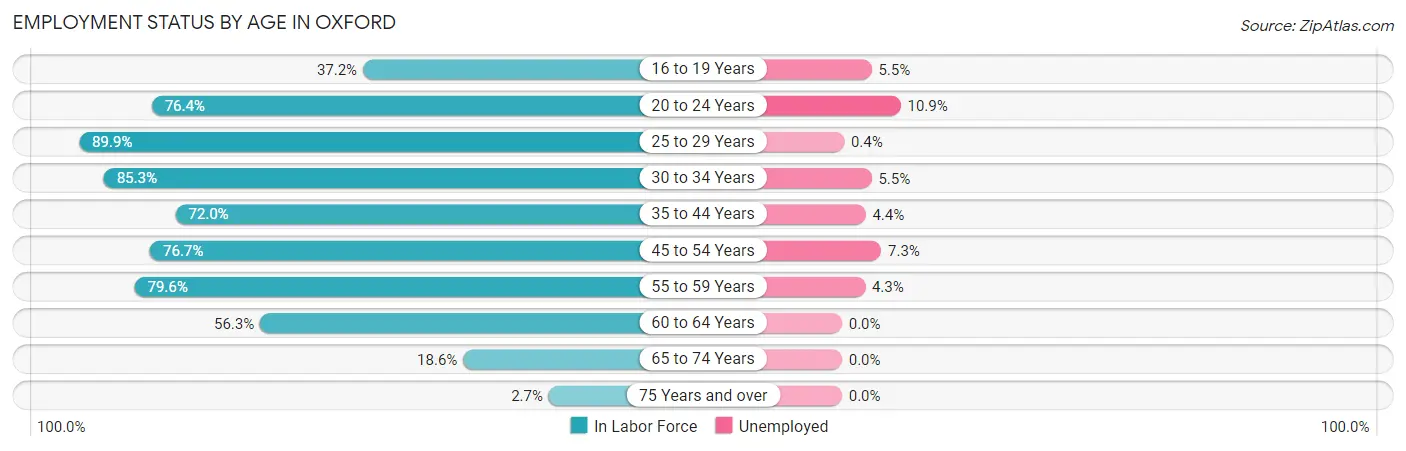
| Age Bracket | In Labor Force | Unemployed |
| 16 to 19 Years | 290 (37.2%) | 16 (5.5%) |
| 20 to 24 Years | 882 (76.4%) | 96 (10.9%) |
| 25 to 29 Years | 1,909 (89.9%) | 8 (0.4%) |
| 30 to 34 Years | 1,518 (85.3%) | 83 (5.5%) |
| 35 to 44 Years | 1,772 (72.0%) | 78 (4.4%) |
| 45 to 54 Years | 2,438 (76.7%) | 178 (7.3%) |
| 55 to 59 Years | 1,091 (79.6%) | 47 (4.3%) |
| 60 to 64 Years | 645 (56.3%) | 0 (0.0%) |
| 65 to 74 Years | 399 (18.6%) | 0 (0.0%) |
| 75 Years and over | 38 (2.7%) | 0 (0.0%) |
| Total | 10,988 (62.6%) | 505 (4.6%) |
Employment Status by Educational Attainment in Oxford
According to labor force statistics for Oxford, 77.7% of individuals (9,371) out of the total population between 25 and 64 years of age (12,060) are in the labor force, with 4.2% or 394 of them being unemployed. The group with the highest labor force participation rate are those with the educational attainment of bachelor's degree or higher, with 86.6% or 2,381 individuals in the labor force. Within the labor force, individuals with less than high school education have the highest percentage of unemployment, with 10.4% or 89 of them being unemployed.
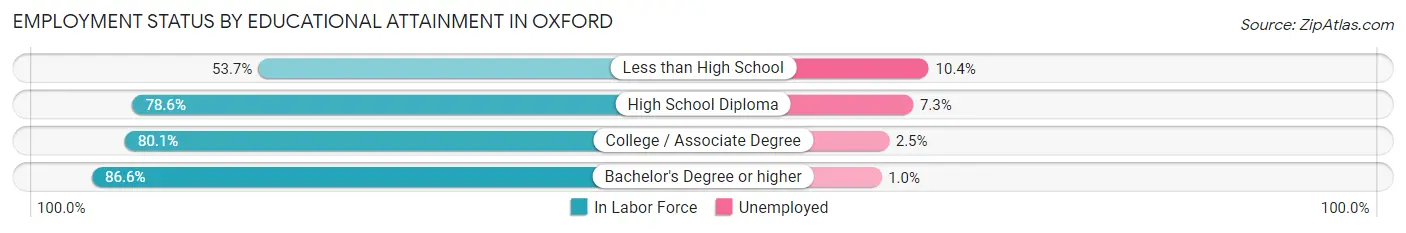
| Educational Attainment | In Labor Force | Unemployed |
| Less than High School | 853 (53.7%) | 165 (10.4%) |
| High School Diploma | 2,606 (78.6%) | 242 (7.3%) |
| College / Associate Degree | 3,530 (80.1%) | 110 (2.5%) |
| Bachelor's Degree or higher | 2,381 (86.6%) | 27 (1.0%) |
| Total | 9,371 (77.7%) | 507 (4.2%) |
Employment Occupations by Sex in Oxford
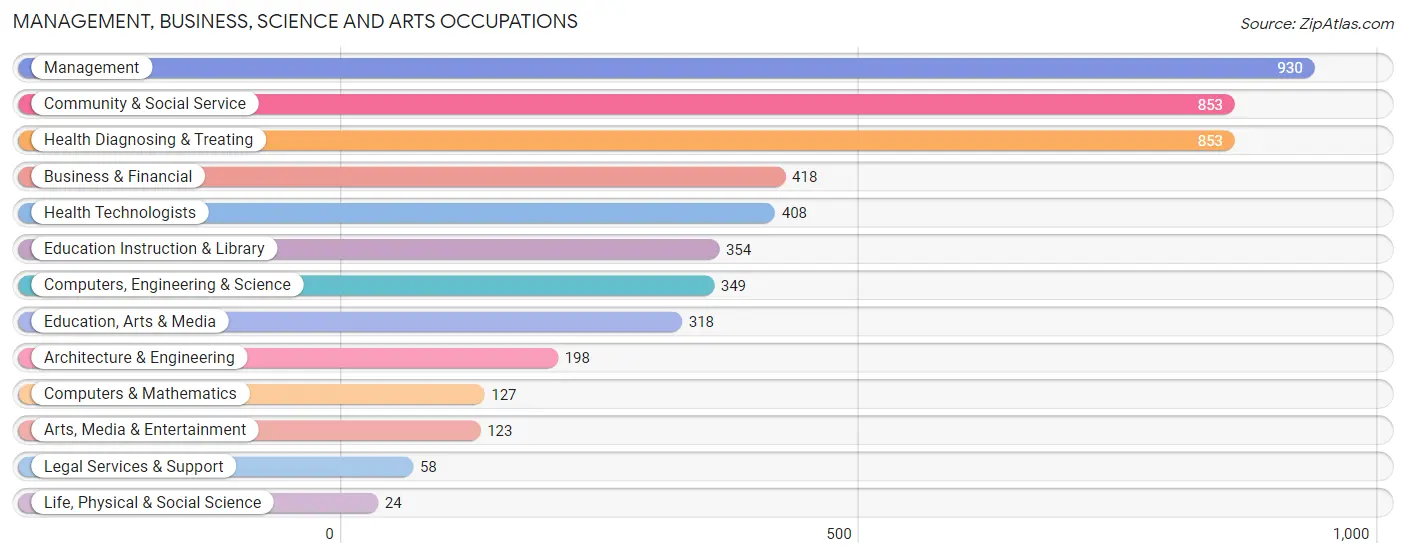
Management, Business, Science and Arts Occupations
The most common Management, Business, Science and Arts occupations in Oxford are Management (930 | 8.9%), Community & Social Service (853 | 8.2%), Health Diagnosing & Treating (853 | 8.2%), Business & Financial (418 | 4.0%), and Health Technologists (408 | 3.9%).
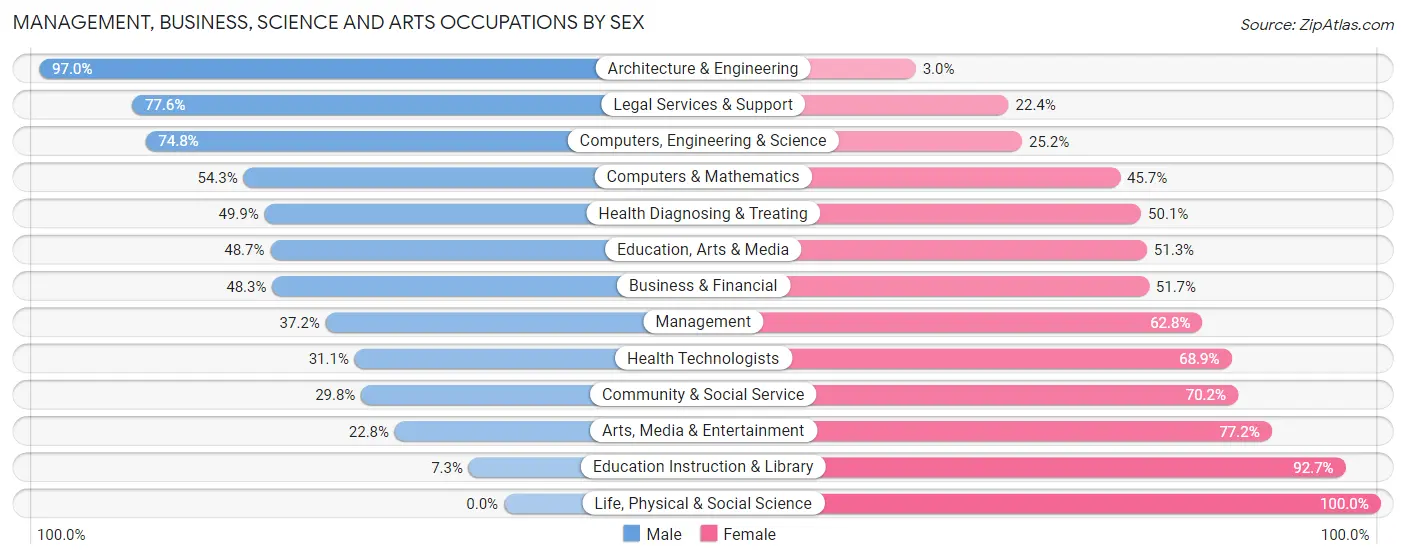
Management, Business, Science and Arts Occupations by Sex
Within the Management, Business, Science and Arts occupations in Oxford, the most male-oriented occupations are Architecture & Engineering (97.0%), Legal Services & Support (77.6%), and Computers, Engineering & Science (74.8%), while the most female-oriented occupations are Life, Physical & Social Science (100.0%), Education Instruction & Library (92.7%), and Arts, Media & Entertainment (77.2%).
| Occupation | Male | Female |
| Management | 346 (37.2%) | 584 (62.8%) |
| Business & Financial | 202 (48.3%) | 216 (51.7%) |
| Computers, Engineering & Science | 261 (74.8%) | 88 (25.2%) |
| Computers & Mathematics | 69 (54.3%) | 58 (45.7%) |
| Architecture & Engineering | 192 (97.0%) | 6 (3.0%) |
| Life, Physical & Social Science | 0 (0.0%) | 24 (100.0%) |
| Community & Social Service | 254 (29.8%) | 599 (70.2%) |
| Education, Arts & Media | 155 (48.7%) | 163 (51.3%) |
| Legal Services & Support | 45 (77.6%) | 13 (22.4%) |
| Education Instruction & Library | 26 (7.3%) | 328 (92.7%) |
| Arts, Media & Entertainment | 28 (22.8%) | 95 (77.2%) |
| Health Diagnosing & Treating | 426 (49.9%) | 427 (50.1%) |
| Health Technologists | 127 (31.1%) | 281 (68.9%) |
| Total (Category) | 1,489 (43.8%) | 1,914 (56.2%) |
| Total (Overall) | 5,811 (55.6%) | 4,639 (44.4%) |
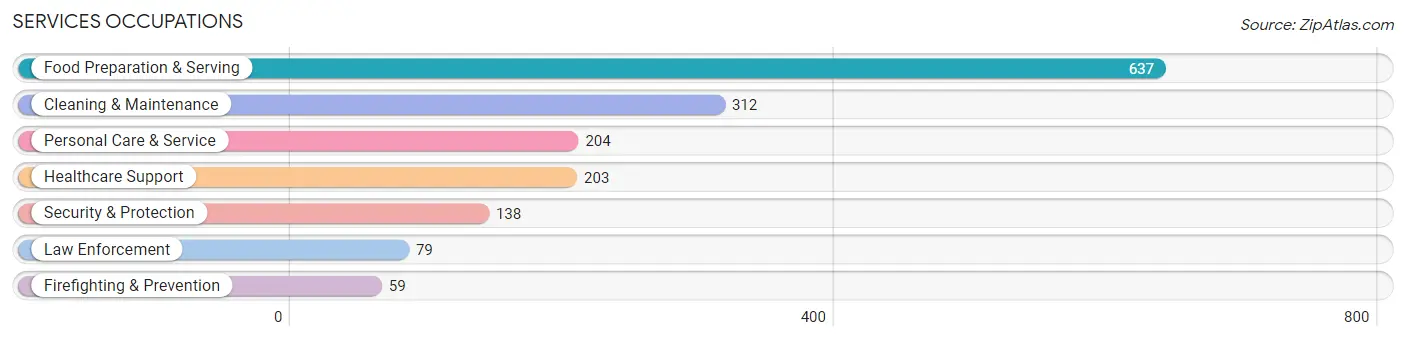
Services Occupations
The most common Services occupations in Oxford are Food Preparation & Serving (637 | 6.1%), Cleaning & Maintenance (312 | 3.0%), Personal Care & Service (204 | 1.9%), Healthcare Support (203 | 1.9%), and Security & Protection (138 | 1.3%).
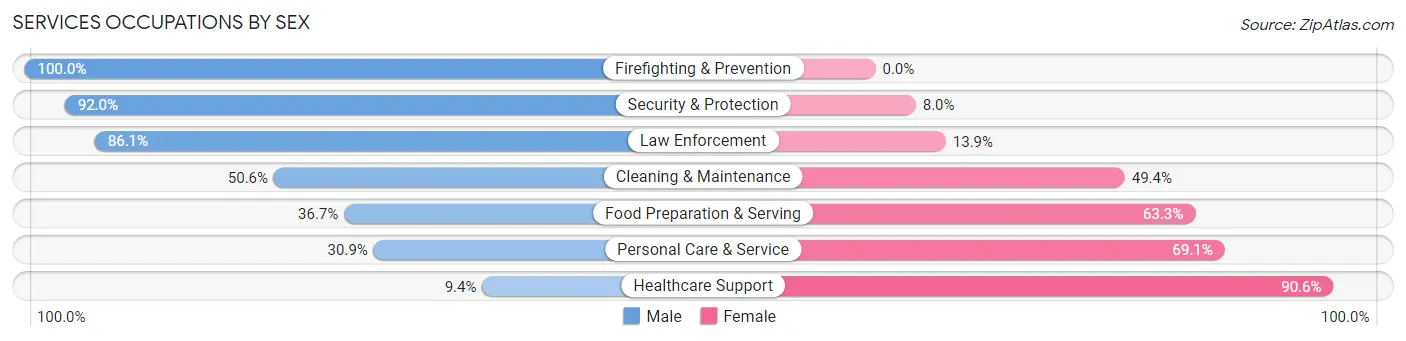
Services Occupations by Sex
Within the Services occupations in Oxford, the most male-oriented occupations are Firefighting & Prevention (100.0%), Security & Protection (92.0%), and Law Enforcement (86.1%), while the most female-oriented occupations are Healthcare Support (90.6%), Personal Care & Service (69.1%), and Food Preparation & Serving (63.3%).
| Occupation | Male | Female |
| Healthcare Support | 19 (9.4%) | 184 (90.6%) |
| Security & Protection | 127 (92.0%) | 11 (8.0%) |
| Firefighting & Prevention | 59 (100.0%) | 0 (0.0%) |
| Law Enforcement | 68 (86.1%) | 11 (13.9%) |
| Food Preparation & Serving | 234 (36.7%) | 403 (63.3%) |
| Cleaning & Maintenance | 158 (50.6%) | 154 (49.4%) |
| Personal Care & Service | 63 (30.9%) | 141 (69.1%) |
| Total (Category) | 601 (40.2%) | 893 (59.8%) |
| Total (Overall) | 5,811 (55.6%) | 4,639 (44.4%) |
Sales and Office Occupations
The most common Sales and Office occupations in Oxford are Sales & Related (1,141 | 10.9%), and Office & Administration (978 | 9.4%).
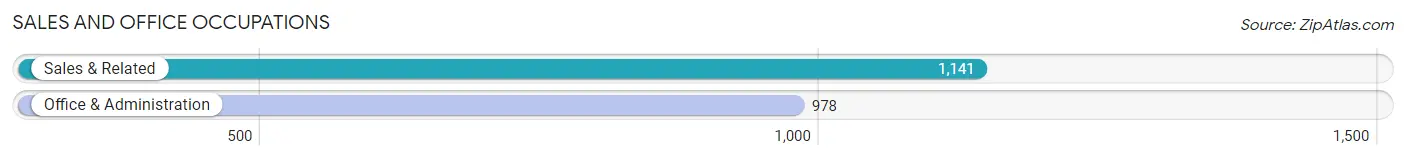
Sales and Office Occupations by Sex
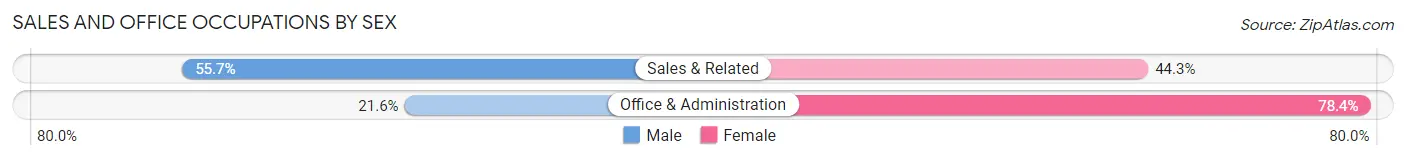
| Occupation | Male | Female |
| Sales & Related | 636 (55.7%) | 505 (44.3%) |
| Office & Administration | 211 (21.6%) | 767 (78.4%) |
| Total (Category) | 847 (40.0%) | 1,272 (60.0%) |
| Total (Overall) | 5,811 (55.6%) | 4,639 (44.4%) |
Natural Resources, Construction and Maintenance Occupations
The most common Natural Resources, Construction and Maintenance occupations in Oxford are Installation, Maintenance & Repair (890 | 8.5%), and Construction & Extraction (364 | 3.5%).
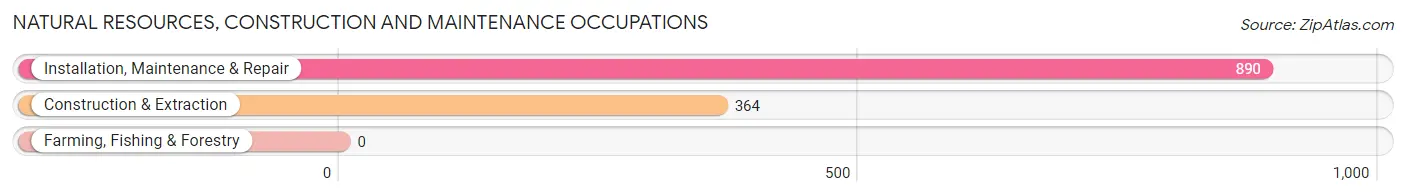
Natural Resources, Construction and Maintenance Occupations by Sex
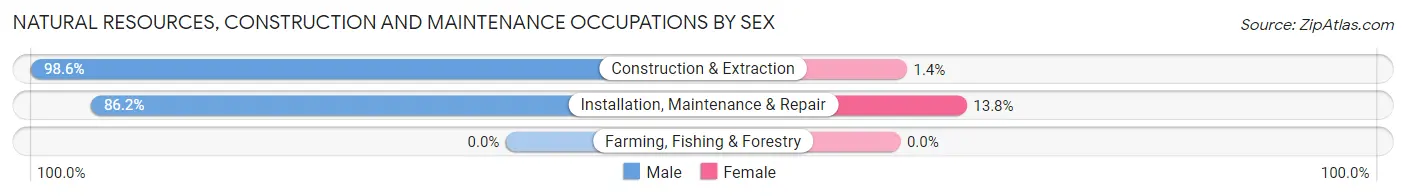
| Occupation | Male | Female |
| Farming, Fishing & Forestry | 0 (0.0%) | 0 (0.0%) |
| Construction & Extraction | 359 (98.6%) | 5 (1.4%) |
| Installation, Maintenance & Repair | 767 (86.2%) | 123 (13.8%) |
| Total (Category) | 1,126 (89.8%) | 128 (10.2%) |
| Total (Overall) | 5,811 (55.6%) | 4,639 (44.4%) |
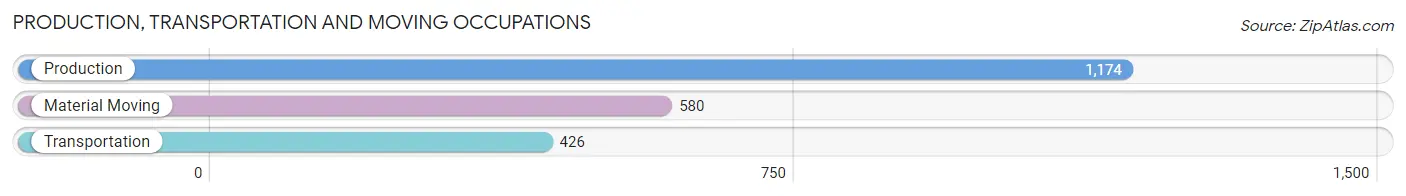
Production, Transportation and Moving Occupations
The most common Production, Transportation and Moving occupations in Oxford are Production (1,174 | 11.2%), Material Moving (580 | 5.6%), and Transportation (426 | 4.1%).
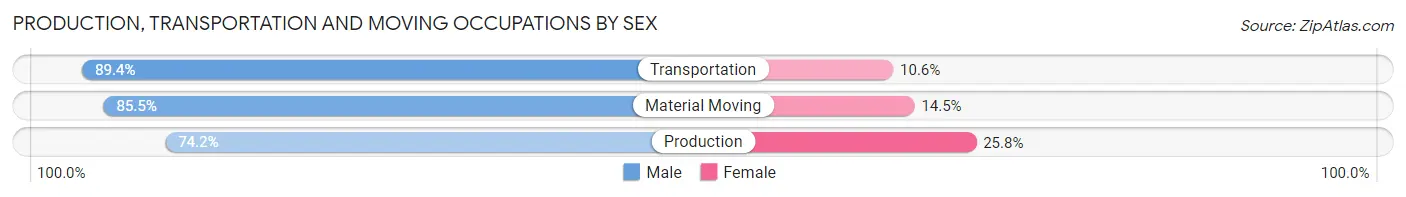
Production, Transportation and Moving Occupations by Sex
| Occupation | Male | Female |
| Production | 871 (74.2%) | 303 (25.8%) |
| Transportation | 381 (89.4%) | 45 (10.6%) |
| Material Moving | 496 (85.5%) | 84 (14.5%) |
| Total (Category) | 1,748 (80.2%) | 432 (19.8%) |
| Total (Overall) | 5,811 (55.6%) | 4,639 (44.4%) |
Employment Industries by Sex in Oxford
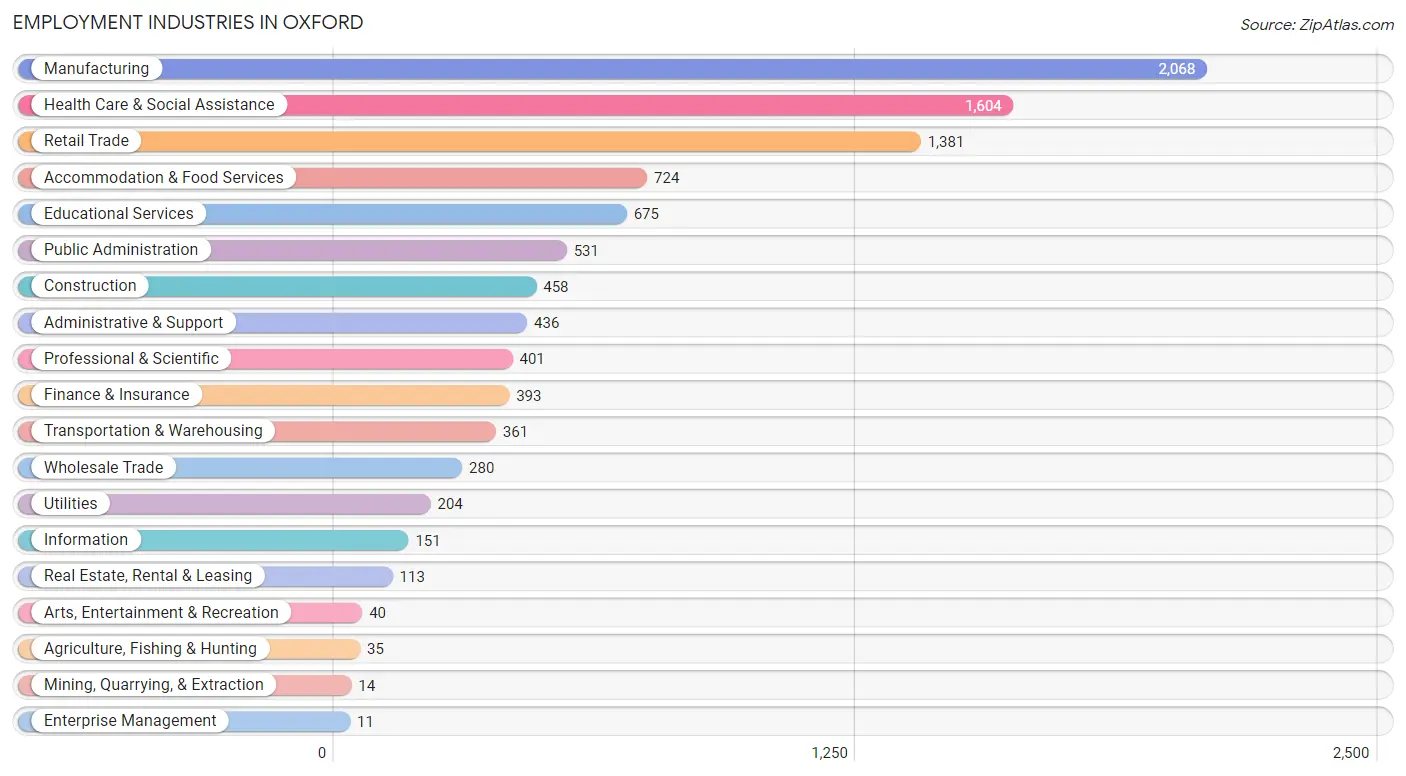
Employment Industries in Oxford
The major employment industries in Oxford include Manufacturing (2,068 | 19.8%), Health Care & Social Assistance (1,604 | 15.3%), Retail Trade (1,381 | 13.2%), Accommodation & Food Services (724 | 6.9%), and Educational Services (675 | 6.5%).
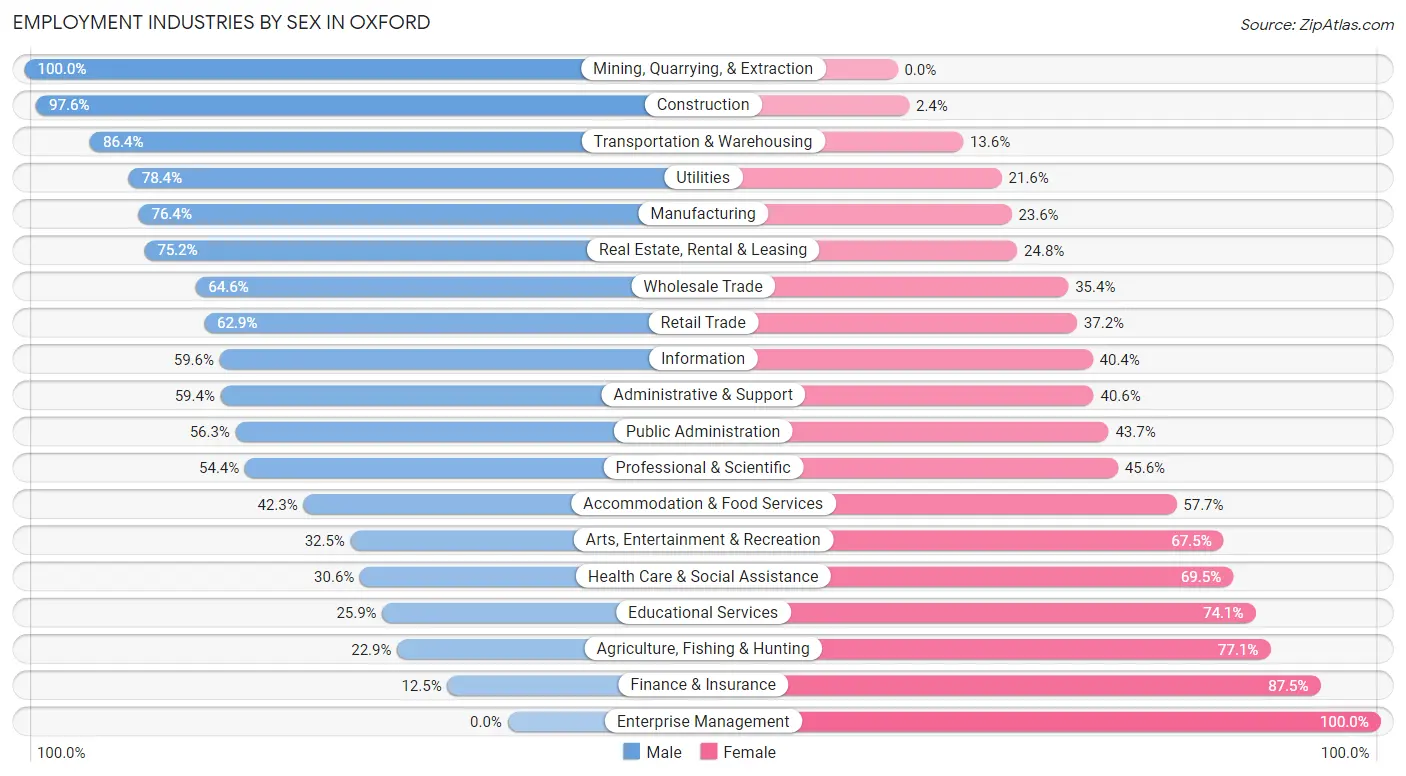
Employment Industries by Sex in Oxford
The Oxford industries that see more men than women are Mining, Quarrying, & Extraction (100.0%), Construction (97.6%), and Transportation & Warehousing (86.4%), whereas the industries that tend to have a higher number of women are Enterprise Management (100.0%), Finance & Insurance (87.5%), and Agriculture, Fishing & Hunting (77.1%).
| Industry | Male | Female |
| Agriculture, Fishing & Hunting | 8 (22.9%) | 27 (77.1%) |
| Mining, Quarrying, & Extraction | 14 (100.0%) | 0 (0.0%) |
| Construction | 447 (97.6%) | 11 (2.4%) |
| Manufacturing | 1,580 (76.4%) | 488 (23.6%) |
| Wholesale Trade | 181 (64.6%) | 99 (35.4%) |
| Retail Trade | 868 (62.8%) | 513 (37.1%) |
| Transportation & Warehousing | 312 (86.4%) | 49 (13.6%) |
| Utilities | 160 (78.4%) | 44 (21.6%) |
| Information | 90 (59.6%) | 61 (40.4%) |
| Finance & Insurance | 49 (12.5%) | 344 (87.5%) |
| Real Estate, Rental & Leasing | 85 (75.2%) | 28 (24.8%) |
| Professional & Scientific | 218 (54.4%) | 183 (45.6%) |
| Enterprise Management | 0 (0.0%) | 11 (100.0%) |
| Administrative & Support | 259 (59.4%) | 177 (40.6%) |
| Educational Services | 175 (25.9%) | 500 (74.1%) |
| Health Care & Social Assistance | 490 (30.5%) | 1,114 (69.5%) |
| Arts, Entertainment & Recreation | 13 (32.5%) | 27 (67.5%) |
| Accommodation & Food Services | 306 (42.3%) | 418 (57.7%) |
| Public Administration | 299 (56.3%) | 232 (43.7%) |
| Total | 5,811 (55.6%) | 4,639 (44.4%) |
Education in Oxford
School Enrollment in Oxford
The most common levels of schooling among the 5,059 students in Oxford are high school (1,201 | 23.7%), elementary school (1,168 | 23.1%), and middle school (1,025 | 20.3%).
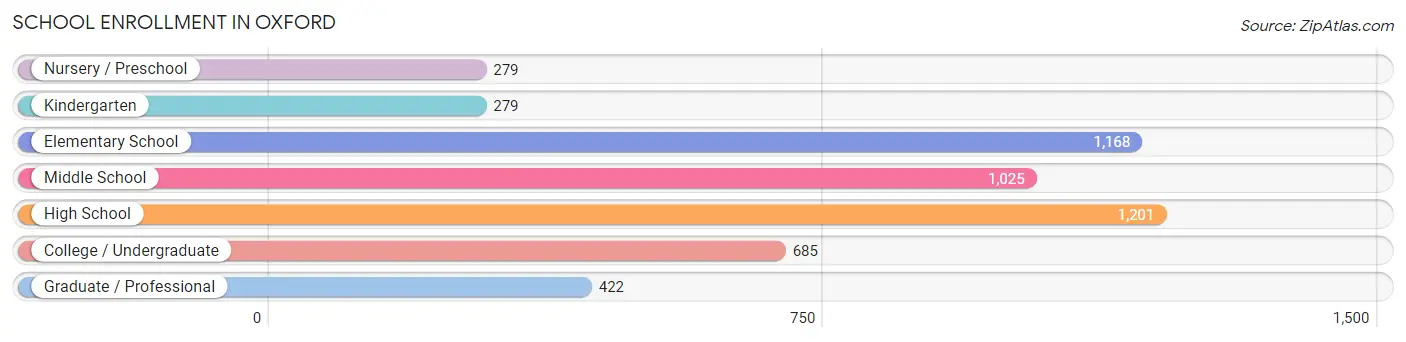
| School Level | # Students | % Students |
| Nursery / Preschool | 279 | 5.5% |
| Kindergarten | 279 | 5.5% |
| Elementary School | 1,168 | 23.1% |
| Middle School | 1,025 | 20.3% |
| High School | 1,201 | 23.7% |
| College / Undergraduate | 685 | 13.5% |
| Graduate / Professional | 422 | 8.3% |
| Total | 5,059 | 100.0% |
School Enrollment by Age by Funding Source in Oxford
Out of a total of 5,059 students who are enrolled in schools in Oxford, 708 (14.0%) attend a private institution, while the remaining 4,351 (86.0%) are enrolled in public schools. The age group of 20 to 24 year olds has the highest likelihood of being enrolled in private schools, with 126 (30.7% in the age bracket) enrolled. Conversely, the age group of 18 to 19 year olds has the lowest likelihood of being enrolled in a private school, with 165 (100.0% in the age bracket) attending a public institution.
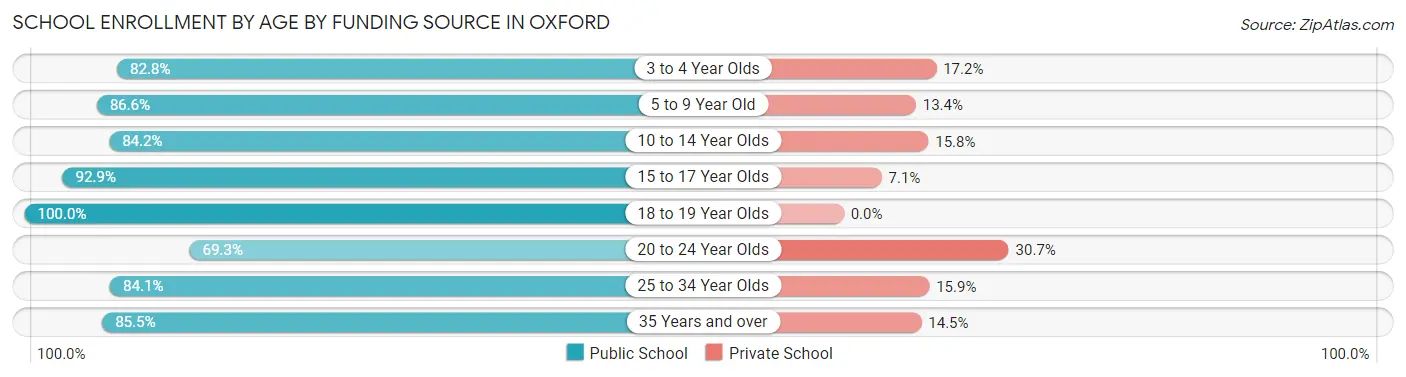
| Age Bracket | Public School | Private School |
| 3 to 4 Year Olds | 120 (82.8%) | 25 (17.2%) |
| 5 to 9 Year Old | 1,211 (86.6%) | 188 (13.4%) |
| 10 to 14 Year Olds | 1,042 (84.2%) | 195 (15.8%) |
| 15 to 17 Year Olds | 986 (92.9%) | 75 (7.1%) |
| 18 to 19 Year Olds | 165 (100.0%) | 0 (0.0%) |
| 20 to 24 Year Olds | 284 (69.3%) | 126 (30.7%) |
| 25 to 34 Year Olds | 406 (84.1%) | 77 (15.9%) |
| 35 Years and over | 136 (85.5%) | 23 (14.5%) |
| Total | 4,351 (86.0%) | 708 (14.0%) |
Educational Attainment by Field of Study in Oxford
Education (927 | 24.6%), business (811 | 21.6%), arts & humanities (418 | 11.1%), science & technology (417 | 11.1%), and bio, nature & agricultural (219 | 5.8%) are the most common fields of study among 3,761 individuals in Oxford who have obtained a bachelor's degree or higher.
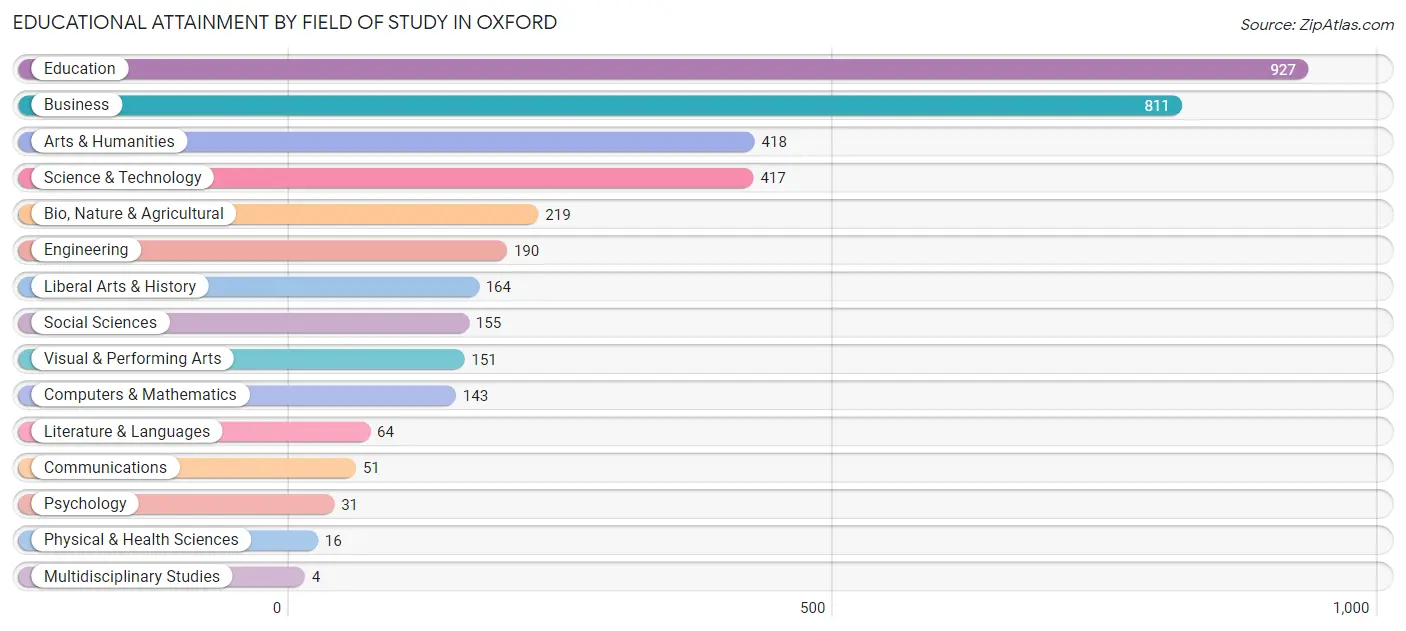
| Field of Study | # Graduates | % Graduates |
| Computers & Mathematics | 143 | 3.8% |
| Bio, Nature & Agricultural | 219 | 5.8% |
| Physical & Health Sciences | 16 | 0.4% |
| Psychology | 31 | 0.8% |
| Social Sciences | 155 | 4.1% |
| Engineering | 190 | 5.1% |
| Multidisciplinary Studies | 4 | 0.1% |
| Science & Technology | 417 | 11.1% |
| Business | 811 | 21.6% |
| Education | 927 | 24.6% |
| Literature & Languages | 64 | 1.7% |
| Liberal Arts & History | 164 | 4.4% |
| Visual & Performing Arts | 151 | 4.0% |
| Communications | 51 | 1.4% |
| Arts & Humanities | 418 | 11.1% |
| Total | 3,761 | 100.0% |
Transportation & Commute in Oxford
Vehicle Availability by Sex in Oxford
The most prevalent vehicle ownership categories in Oxford are males with 2 vehicles (2,133, accounting for 37.3%) and females with 2 vehicles (1,711, making up 46.5%).
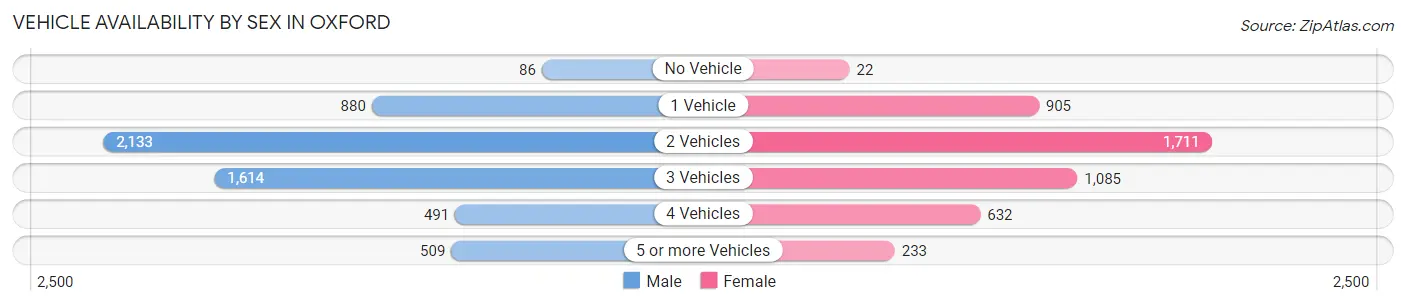
| Vehicles Available | Male | Female |
| No Vehicle | 86 (1.5%) | 22 (0.5%) |
| 1 Vehicle | 880 (15.4%) | 905 (19.7%) |
| 2 Vehicles | 2,133 (37.3%) | 1,711 (37.3%) |
| 3 Vehicles | 1,614 (28.2%) | 1,085 (23.6%) |
| 4 Vehicles | 491 (8.6%) | 632 (13.8%) |
| 5 or more Vehicles | 509 (8.9%) | 233 (5.1%) |
| Total | 5,713 (100.0%) | 4,588 (100.0%) |
Commute Time in Oxford
The most frequently occuring commute durations in Oxford are 15 to 19 minutes (2,905 commuters, 28.9%), 20 to 24 minutes (1,710 commuters, 17.0%), and 10 to 14 minutes (1,568 commuters, 15.6%).
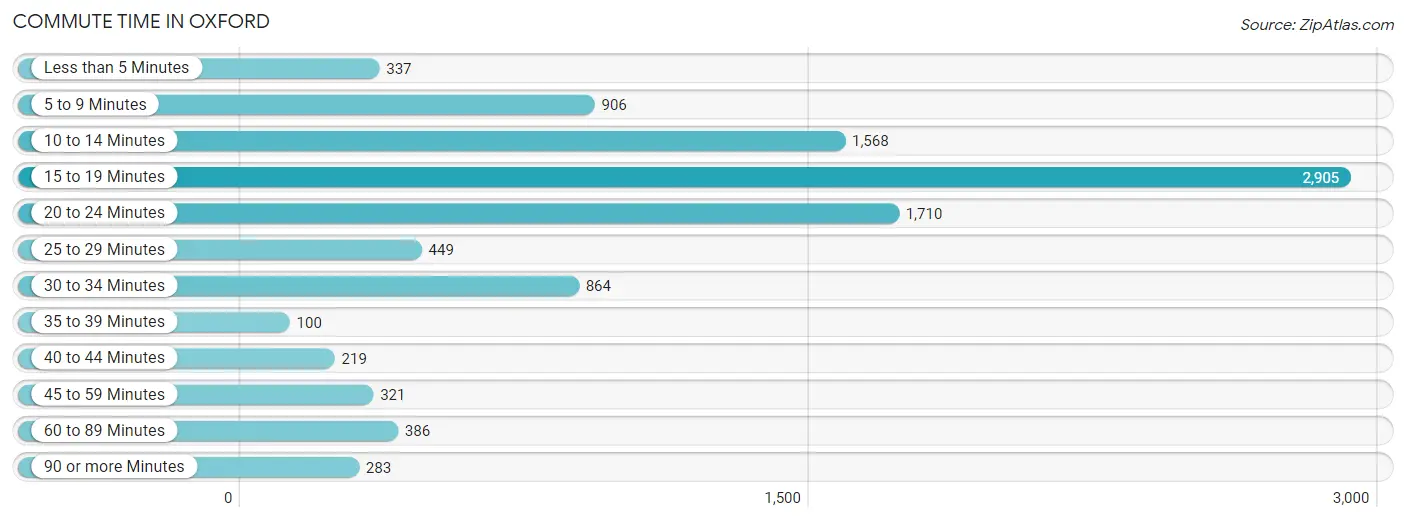
| Commute Time | # Commuters | % Commuters |
| Less than 5 Minutes | 337 | 3.4% |
| 5 to 9 Minutes | 906 | 9.0% |
| 10 to 14 Minutes | 1,568 | 15.6% |
| 15 to 19 Minutes | 2,905 | 28.9% |
| 20 to 24 Minutes | 1,710 | 17.0% |
| 25 to 29 Minutes | 449 | 4.5% |
| 30 to 34 Minutes | 864 | 8.6% |
| 35 to 39 Minutes | 100 | 1.0% |
| 40 to 44 Minutes | 219 | 2.2% |
| 45 to 59 Minutes | 321 | 3.2% |
| 60 to 89 Minutes | 386 | 3.8% |
| 90 or more Minutes | 283 | 2.8% |
Commute Time by Sex in Oxford
The most common commute times in Oxford are 15 to 19 minutes (1,536 commuters, 27.1%) for males and 15 to 19 minutes (1,369 commuters, 31.3%) for females.
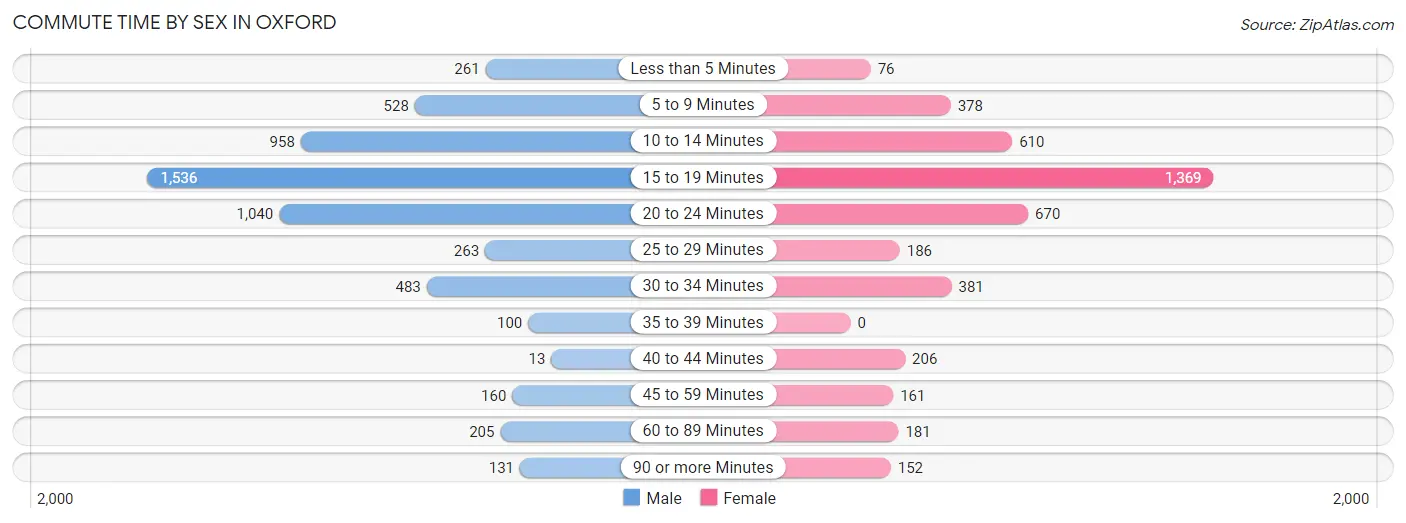
| Commute Time | Male | Female |
| Less than 5 Minutes | 261 (4.6%) | 76 (1.7%) |
| 5 to 9 Minutes | 528 (9.3%) | 378 (8.6%) |
| 10 to 14 Minutes | 958 (16.9%) | 610 (14.0%) |
| 15 to 19 Minutes | 1,536 (27.1%) | 1,369 (31.3%) |
| 20 to 24 Minutes | 1,040 (18.3%) | 670 (15.3%) |
| 25 to 29 Minutes | 263 (4.6%) | 186 (4.3%) |
| 30 to 34 Minutes | 483 (8.5%) | 381 (8.7%) |
| 35 to 39 Minutes | 100 (1.8%) | 0 (0.0%) |
| 40 to 44 Minutes | 13 (0.2%) | 206 (4.7%) |
| 45 to 59 Minutes | 160 (2.8%) | 161 (3.7%) |
| 60 to 89 Minutes | 205 (3.6%) | 181 (4.1%) |
| 90 or more Minutes | 131 (2.3%) | 152 (3.5%) |
Time of Departure to Work by Sex in Oxford
The most frequent times of departure to work in Oxford are 7:00 AM to 7:29 AM (792, 14.0%) for males and 7:00 AM to 7:29 AM (890, 20.4%) for females.
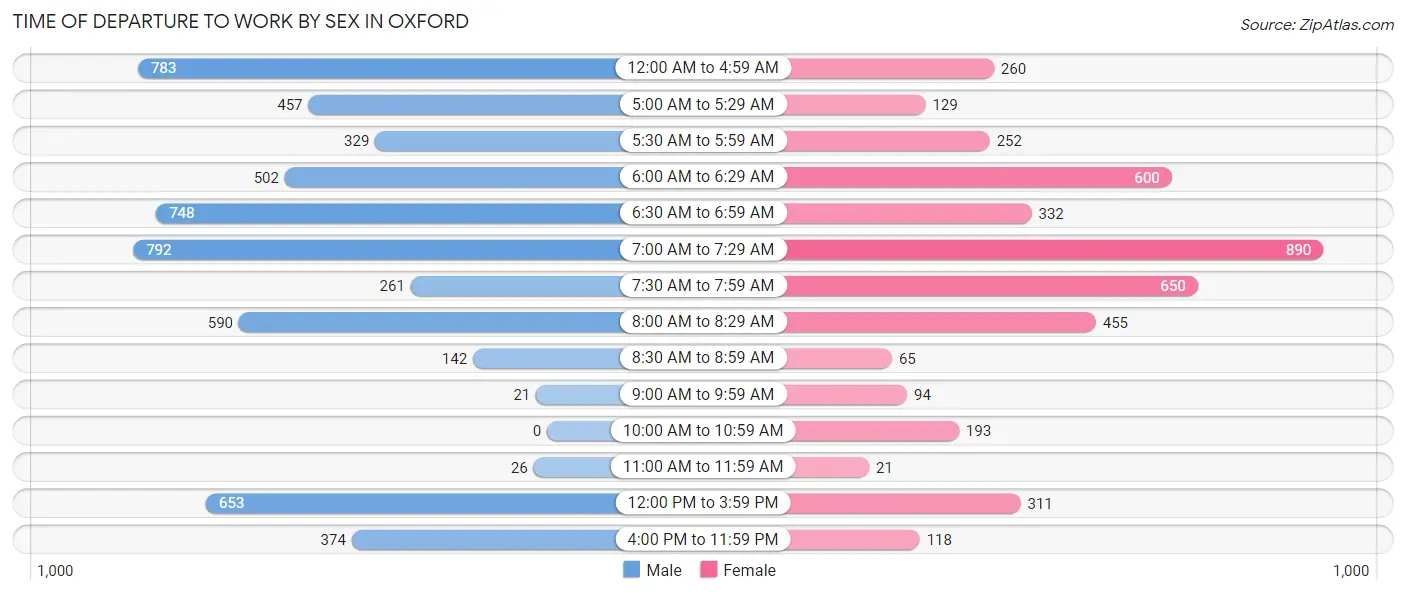
| Time of Departure | Male | Female |
| 12:00 AM to 4:59 AM | 783 (13.8%) | 260 (5.9%) |
| 5:00 AM to 5:29 AM | 457 (8.1%) | 129 (2.9%) |
| 5:30 AM to 5:59 AM | 329 (5.8%) | 252 (5.8%) |
| 6:00 AM to 6:29 AM | 502 (8.8%) | 600 (13.7%) |
| 6:30 AM to 6:59 AM | 748 (13.2%) | 332 (7.6%) |
| 7:00 AM to 7:29 AM | 792 (14.0%) | 890 (20.4%) |
| 7:30 AM to 7:59 AM | 261 (4.6%) | 650 (14.9%) |
| 8:00 AM to 8:29 AM | 590 (10.4%) | 455 (10.4%) |
| 8:30 AM to 8:59 AM | 142 (2.5%) | 65 (1.5%) |
| 9:00 AM to 9:59 AM | 21 (0.4%) | 94 (2.1%) |
| 10:00 AM to 10:59 AM | 0 (0.0%) | 193 (4.4%) |
| 11:00 AM to 11:59 AM | 26 (0.5%) | 21 (0.5%) |
| 12:00 PM to 3:59 PM | 653 (11.5%) | 311 (7.1%) |
| 4:00 PM to 11:59 PM | 374 (6.6%) | 118 (2.7%) |
| Total | 5,678 (100.0%) | 4,370 (100.0%) |
Housing Occupancy in Oxford
Occupancy by Ownership in Oxford
Of the total 8,177 dwellings in Oxford, owner-occupied units account for 6,024 (73.7%), while renter-occupied units make up 2,153 (26.3%).
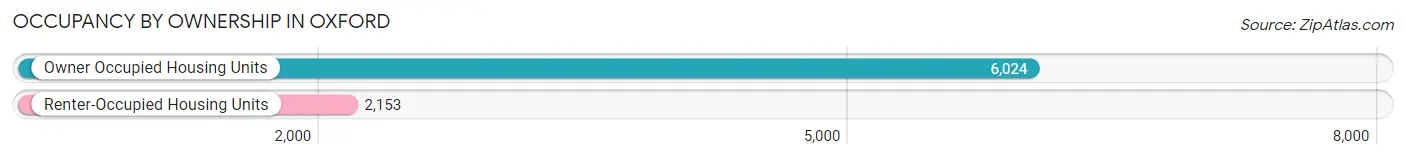
| Occupancy | # Housing Units | % Housing Units |
| Owner Occupied Housing Units | 6,024 | 73.7% |
| Renter-Occupied Housing Units | 2,153 | 26.3% |
| Total Occupied Housing Units | 8,177 | 100.0% |
Occupancy by Household Size in Oxford
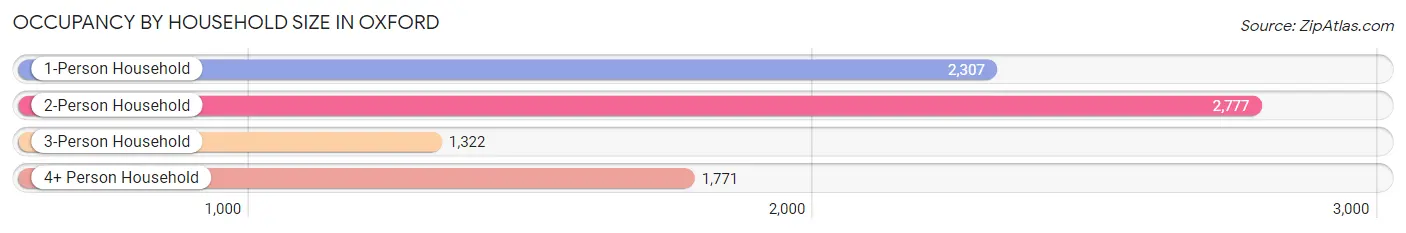
| Household Size | # Housing Units | % Housing Units |
| 1-Person Household | 2,307 | 28.2% |
| 2-Person Household | 2,777 | 34.0% |
| 3-Person Household | 1,322 | 16.2% |
| 4+ Person Household | 1,771 | 21.7% |
| Total Housing Units | 8,177 | 100.0% |
Occupancy by Ownership by Household Size in Oxford
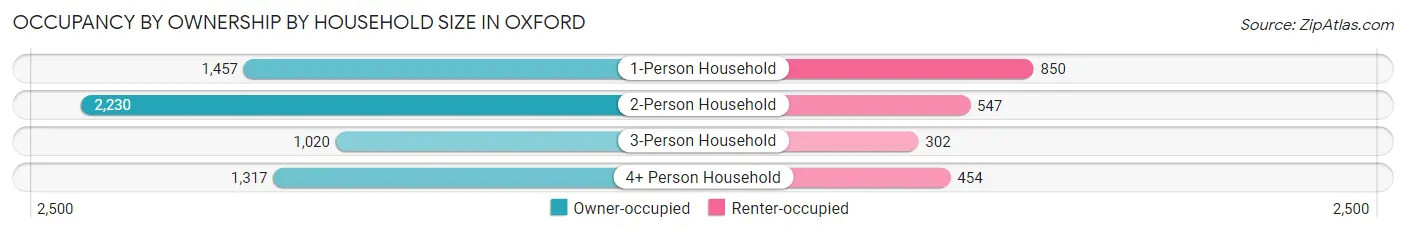
| Household Size | Owner-occupied | Renter-occupied |
| 1-Person Household | 1,457 (63.2%) | 850 (36.8%) |
| 2-Person Household | 2,230 (80.3%) | 547 (19.7%) |
| 3-Person Household | 1,020 (77.2%) | 302 (22.8%) |
| 4+ Person Household | 1,317 (74.4%) | 454 (25.6%) |
| Total Housing Units | 6,024 (73.7%) | 2,153 (26.3%) |
Occupancy by Educational Attainment in Oxford
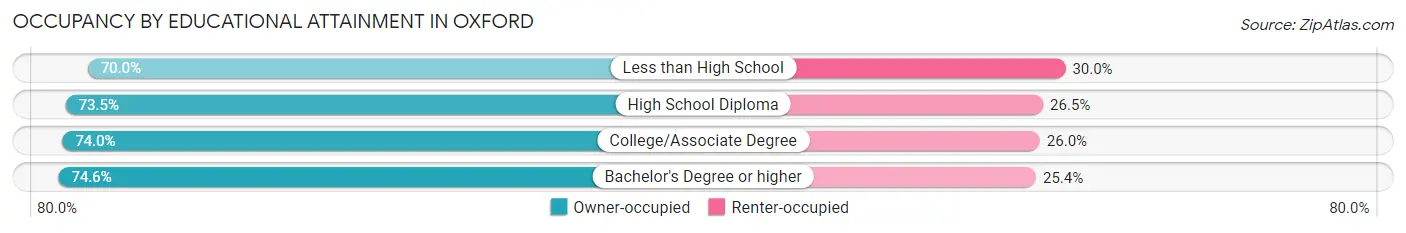
| Household Size | Owner-occupied | Renter-occupied |
| Less than High School | 564 (70.0%) | 242 (30.0%) |
| High School Diploma | 1,682 (73.5%) | 606 (26.5%) |
| College/Associate Degree | 1,927 (74.0%) | 676 (26.0%) |
| Bachelor's Degree or higher | 1,851 (74.6%) | 629 (25.4%) |
Occupancy by Age of Householder in Oxford
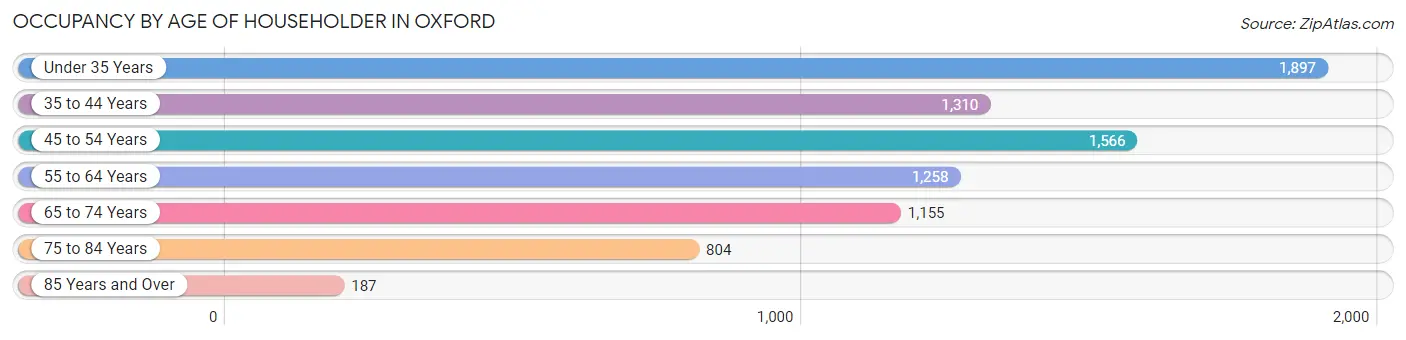
| Age Bracket | # Households | % Households |
| Under 35 Years | 1,897 | 23.2% |
| 35 to 44 Years | 1,310 | 16.0% |
| 45 to 54 Years | 1,566 | 19.2% |
| 55 to 64 Years | 1,258 | 15.4% |
| 65 to 74 Years | 1,155 | 14.1% |
| 75 to 84 Years | 804 | 9.8% |
| 85 Years and Over | 187 | 2.3% |
| Total | 8,177 | 100.0% |
Housing Finances in Oxford
Median Income by Occupancy in Oxford
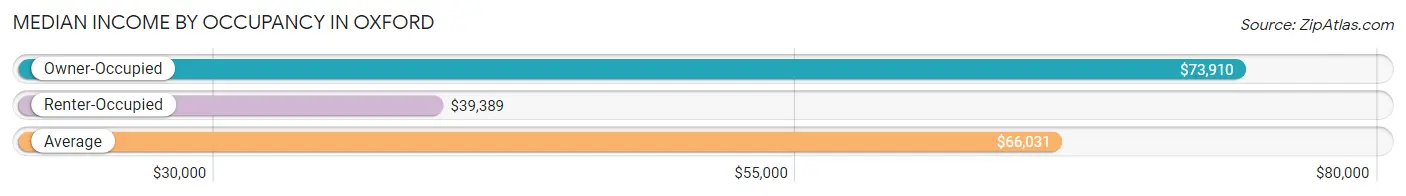
| Occupancy Type | # Households | Median Income |
| Owner-Occupied | 6,024 (73.7%) | $73,910 |
| Renter-Occupied | 2,153 (26.3%) | $39,389 |
| Average | 8,177 (100.0%) | $66,031 |
Occupancy by Householder Income Bracket in Oxford
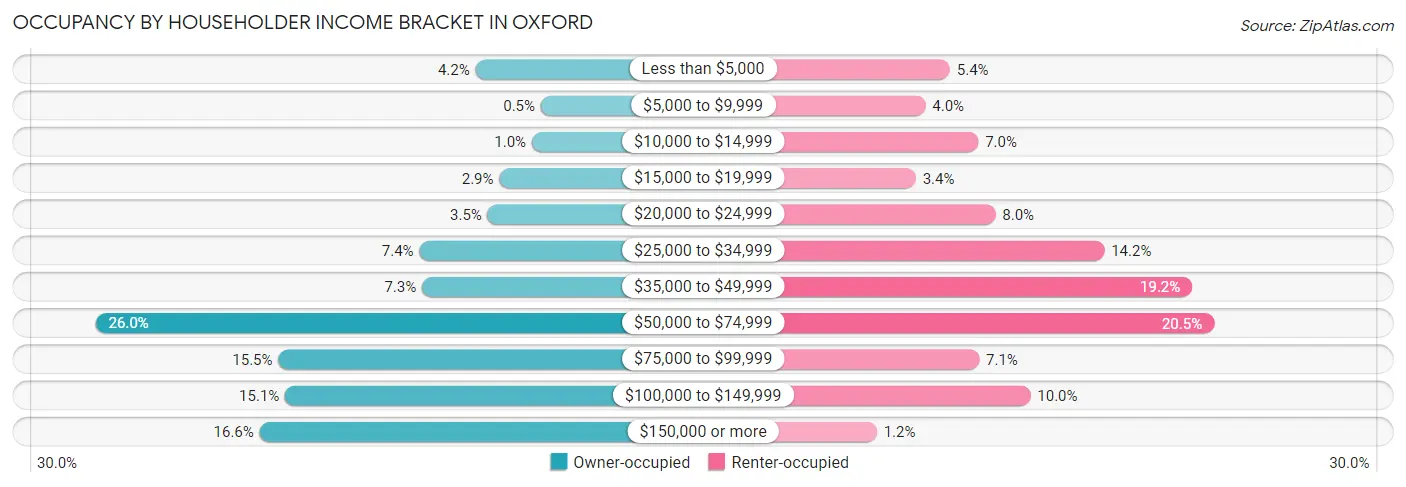
| Income Bracket | Owner-occupied | Renter-occupied |
| Less than $5,000 | 255 (4.2%) | 116 (5.4%) |
| $5,000 to $9,999 | 30 (0.5%) | 86 (4.0%) |
| $10,000 to $14,999 | 61 (1.0%) | 151 (7.0%) |
| $15,000 to $19,999 | 173 (2.9%) | 74 (3.4%) |
| $20,000 to $24,999 | 213 (3.5%) | 172 (8.0%) |
| $25,000 to $34,999 | 448 (7.4%) | 306 (14.2%) |
| $35,000 to $49,999 | 439 (7.3%) | 414 (19.2%) |
| $50,000 to $74,999 | 1,563 (26.0%) | 441 (20.5%) |
| $75,000 to $99,999 | 934 (15.5%) | 152 (7.1%) |
| $100,000 to $149,999 | 910 (15.1%) | 215 (10.0%) |
| $150,000 or more | 998 (16.6%) | 26 (1.2%) |
| Total | 6,024 (100.0%) | 2,153 (100.0%) |
Monthly Housing Cost Tiers in Oxford
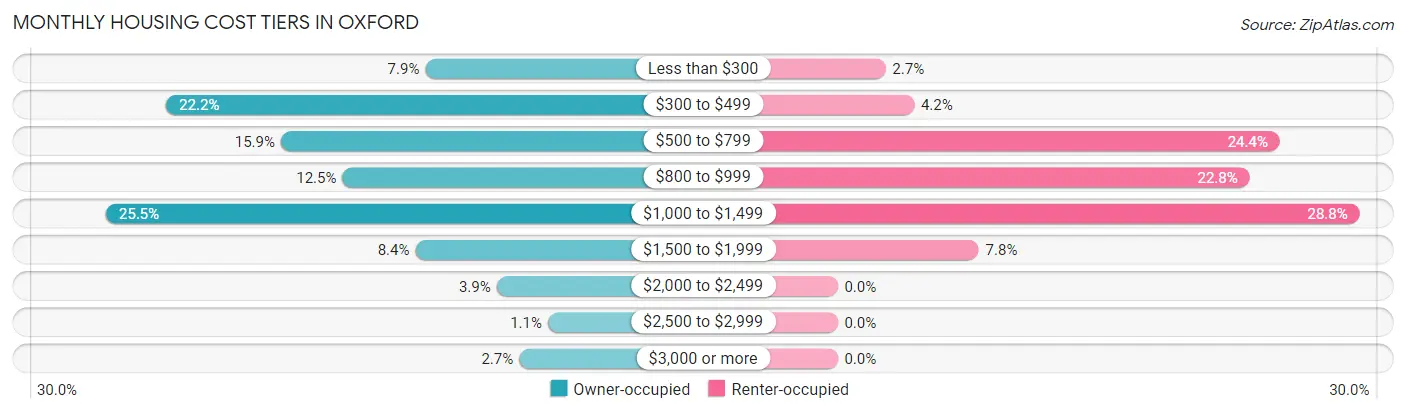
| Monthly Cost | Owner-occupied | Renter-occupied |
| Less than $300 | 474 (7.9%) | 57 (2.6%) |
| $300 to $499 | 1,336 (22.2%) | 91 (4.2%) |
| $500 to $799 | 955 (15.9%) | 526 (24.4%) |
| $800 to $999 | 750 (12.4%) | 490 (22.8%) |
| $1,000 to $1,499 | 1,537 (25.5%) | 621 (28.8%) |
| $1,500 to $1,999 | 507 (8.4%) | 168 (7.8%) |
| $2,000 to $2,499 | 237 (3.9%) | 0 (0.0%) |
| $2,500 to $2,999 | 66 (1.1%) | 0 (0.0%) |
| $3,000 or more | 162 (2.7%) | 0 (0.0%) |
| Total | 6,024 (100.0%) | 2,153 (100.0%) |
Physical Housing Characteristics in Oxford
Housing Structures in Oxford
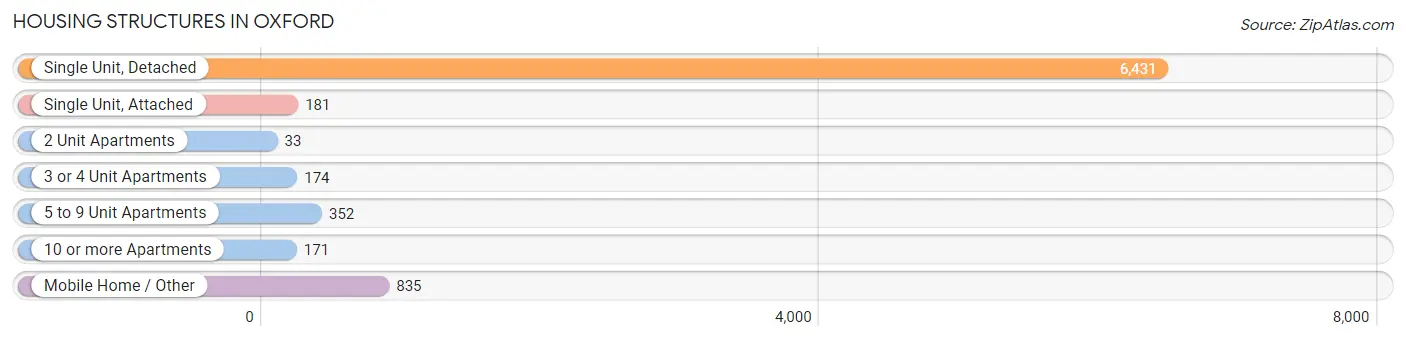
| Structure Type | # Housing Units | % Housing Units |
| Single Unit, Detached | 6,431 | 78.6% |
| Single Unit, Attached | 181 | 2.2% |
| 2 Unit Apartments | 33 | 0.4% |
| 3 or 4 Unit Apartments | 174 | 2.1% |
| 5 to 9 Unit Apartments | 352 | 4.3% |
| 10 or more Apartments | 171 | 2.1% |
| Mobile Home / Other | 835 | 10.2% |
| Total | 8,177 | 100.0% |
Housing Structures by Occupancy in Oxford
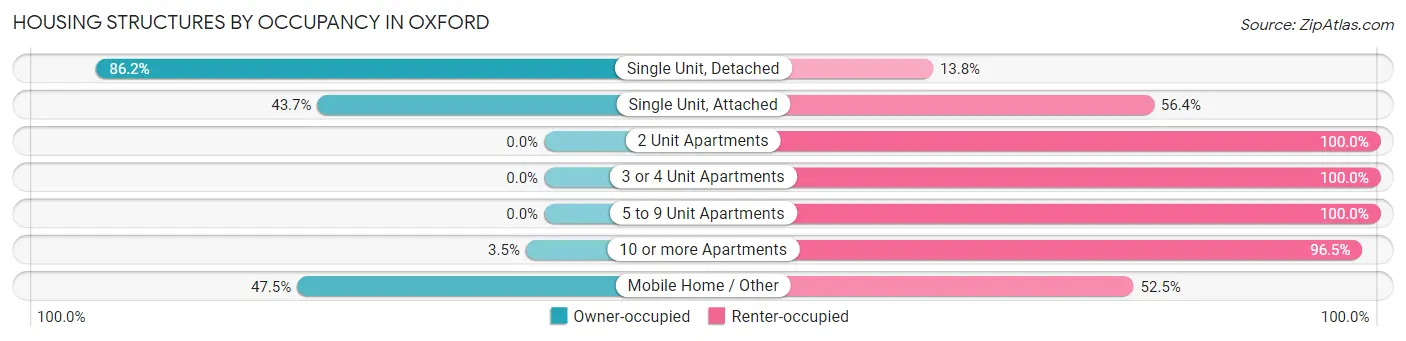
| Structure Type | Owner-occupied | Renter-occupied |
| Single Unit, Detached | 5,542 (86.2%) | 889 (13.8%) |
| Single Unit, Attached | 79 (43.6%) | 102 (56.4%) |
| 2 Unit Apartments | 0 (0.0%) | 33 (100.0%) |
| 3 or 4 Unit Apartments | 0 (0.0%) | 174 (100.0%) |
| 5 to 9 Unit Apartments | 0 (0.0%) | 352 (100.0%) |
| 10 or more Apartments | 6 (3.5%) | 165 (96.5%) |
| Mobile Home / Other | 397 (47.5%) | 438 (52.5%) |
| Total | 6,024 (73.7%) | 2,153 (26.3%) |
Housing Structures by Number of Rooms in Oxford
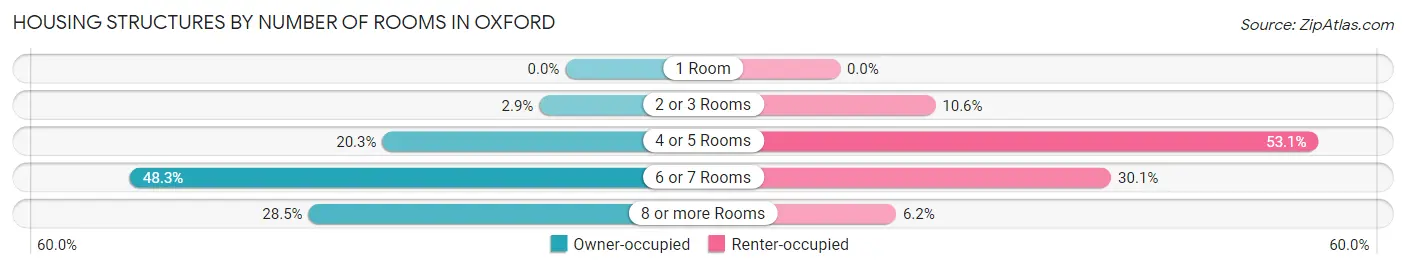
| Number of Rooms | Owner-occupied | Renter-occupied |
| 1 Room | 0 (0.0%) | 0 (0.0%) |
| 2 or 3 Rooms | 174 (2.9%) | 228 (10.6%) |
| 4 or 5 Rooms | 1,223 (20.3%) | 1,143 (53.1%) |
| 6 or 7 Rooms | 2,910 (48.3%) | 648 (30.1%) |
| 8 or more Rooms | 1,717 (28.5%) | 134 (6.2%) |
| Total | 6,024 (100.0%) | 2,153 (100.0%) |
Housing Structure by Heating Type in Oxford
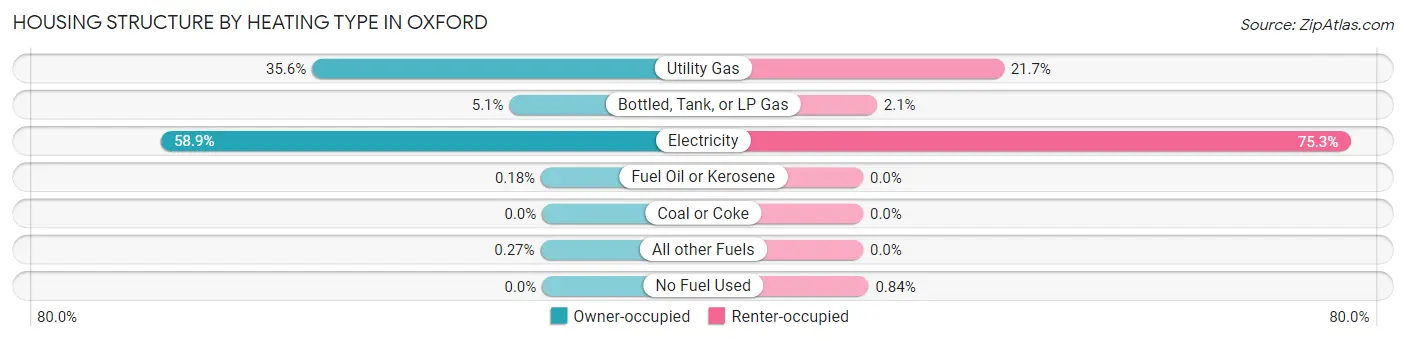
| Heating Type | Owner-occupied | Renter-occupied |
| Utility Gas | 2,143 (35.6%) | 468 (21.7%) |
| Bottled, Tank, or LP Gas | 305 (5.1%) | 46 (2.1%) |
| Electricity | 3,549 (58.9%) | 1,621 (75.3%) |
| Fuel Oil or Kerosene | 11 (0.2%) | 0 (0.0%) |
| Coal or Coke | 0 (0.0%) | 0 (0.0%) |
| All other Fuels | 16 (0.3%) | 0 (0.0%) |
| No Fuel Used | 0 (0.0%) | 18 (0.8%) |
| Total | 6,024 (100.0%) | 2,153 (100.0%) |
Household Vehicle Usage in Oxford
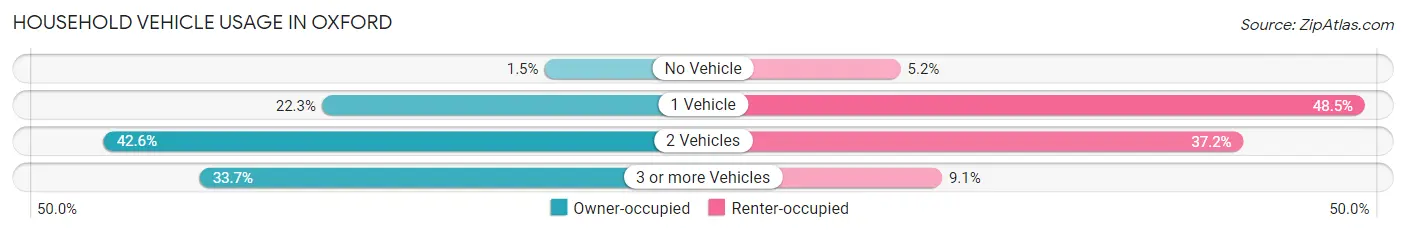
| Vehicles per Household | Owner-occupied | Renter-occupied |
| No Vehicle | 89 (1.5%) | 112 (5.2%) |
| 1 Vehicle | 1,341 (22.3%) | 1,045 (48.5%) |
| 2 Vehicles | 2,567 (42.6%) | 801 (37.2%) |
| 3 or more Vehicles | 2,027 (33.7%) | 195 (9.1%) |
| Total | 6,024 (100.0%) | 2,153 (100.0%) |
Real Estate & Mortgages in Oxford
Real Estate and Mortgage Overview in Oxford
| Characteristic | Without Mortgage | With Mortgage |
| Housing Units | 2,337 | 3,687 |
| Median Property Value | $165,500 | $156,800 |
| Median Household Income | $59,435 | $737 |
| Monthly Housing Costs | $418 | $162 |
| Real Estate Taxes | $626 | $482 |
Property Value by Mortgage Status in Oxford
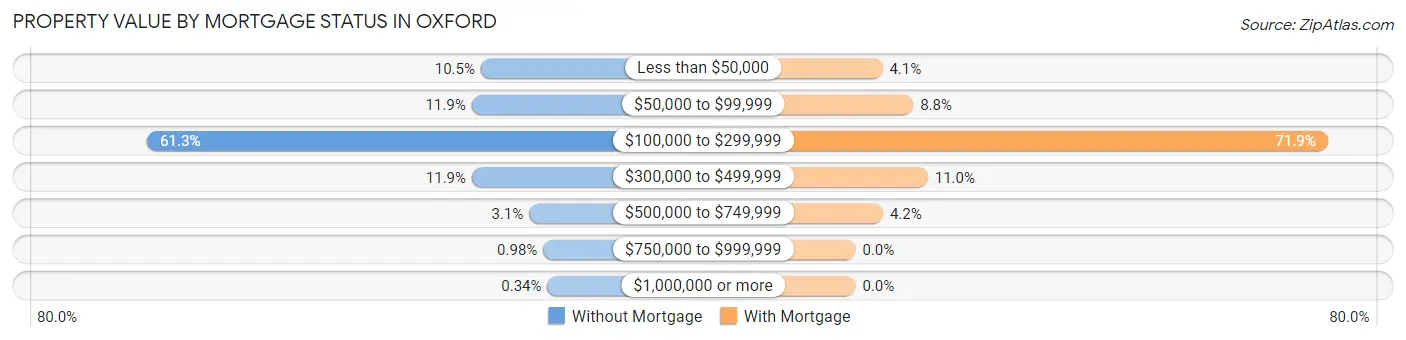
| Property Value | Without Mortgage | With Mortgage |
| Less than $50,000 | 245 (10.5%) | 151 (4.1%) |
| $50,000 to $99,999 | 278 (11.9%) | 324 (8.8%) |
| $100,000 to $299,999 | 1,433 (61.3%) | 2,652 (71.9%) |
| $300,000 to $499,999 | 277 (11.8%) | 406 (11.0%) |
| $500,000 to $749,999 | 73 (3.1%) | 154 (4.2%) |
| $750,000 to $999,999 | 23 (1.0%) | 0 (0.0%) |
| $1,000,000 or more | 8 (0.3%) | 0 (0.0%) |
| Total | 2,337 (100.0%) | 3,687 (100.0%) |
Household Income by Mortgage Status in Oxford
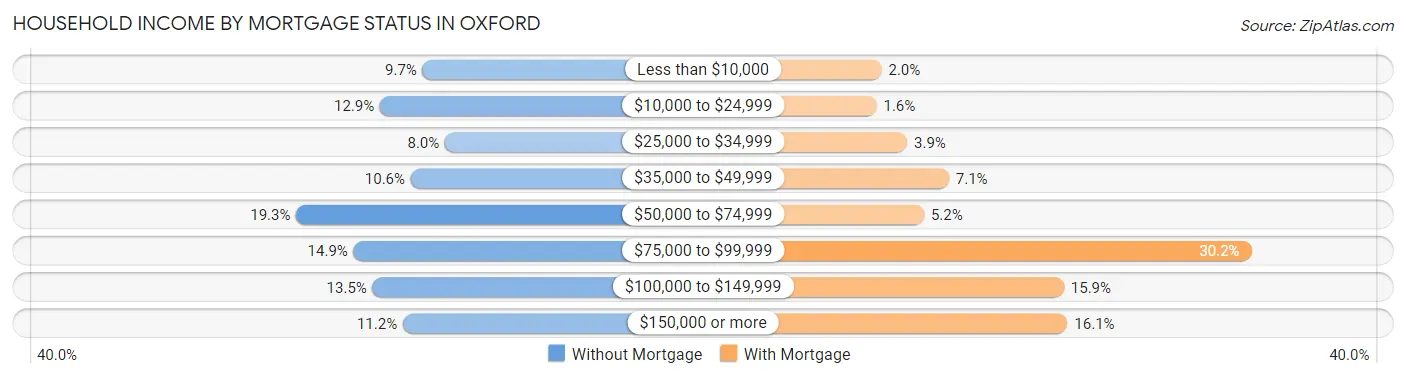
| Household Income | Without Mortgage | With Mortgage |
| Less than $10,000 | 226 (9.7%) | 73 (2.0%) |
| $10,000 to $24,999 | 302 (12.9%) | 59 (1.6%) |
| $25,000 to $34,999 | 186 (8.0%) | 145 (3.9%) |
| $35,000 to $49,999 | 247 (10.6%) | 262 (7.1%) |
| $50,000 to $74,999 | 451 (19.3%) | 192 (5.2%) |
| $75,000 to $99,999 | 349 (14.9%) | 1,112 (30.2%) |
| $100,000 to $149,999 | 315 (13.5%) | 585 (15.9%) |
| $150,000 or more | 261 (11.2%) | 595 (16.1%) |
| Total | 2,337 (100.0%) | 3,687 (100.0%) |
Property Value to Household Income Ratio in Oxford
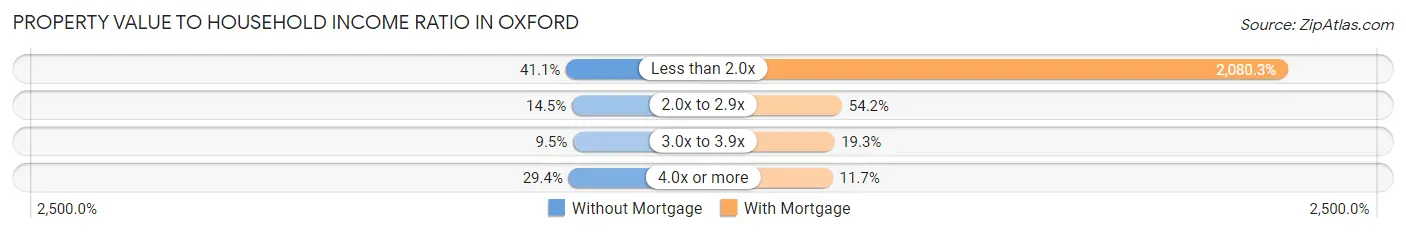
| Value-to-Income Ratio | Without Mortgage | With Mortgage |
| Less than 2.0x | 960 (41.1%) | 76,701 (2,080.3%) |
| 2.0x to 2.9x | 338 (14.5%) | 1,998 (54.2%) |
| 3.0x to 3.9x | 222 (9.5%) | 713 (19.3%) |
| 4.0x or more | 688 (29.4%) | 432 (11.7%) |
| Total | 2,337 (100.0%) | 3,687 (100.0%) |
Real Estate Taxes by Mortgage Status in Oxford
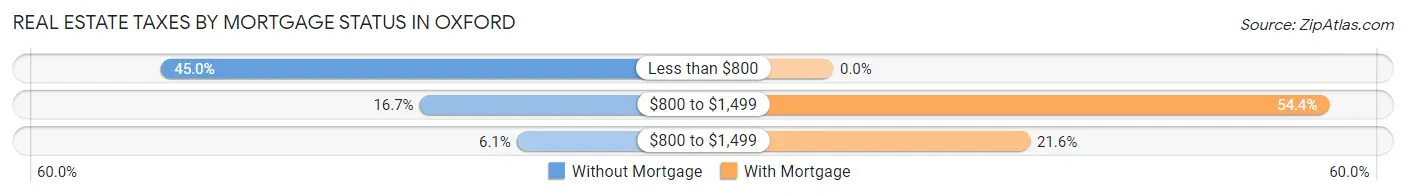
| Property Taxes | Without Mortgage | With Mortgage |
| Less than $800 | 1,052 (45.0%) | 0 (0.0%) |
| $800 to $1,499 | 391 (16.7%) | 2,005 (54.4%) |
| $800 to $1,499 | 142 (6.1%) | 796 (21.6%) |
| Total | 2,337 (100.0%) | 3,687 (100.0%) |
Health & Disability in Oxford
Health Insurance Coverage by Age in Oxford
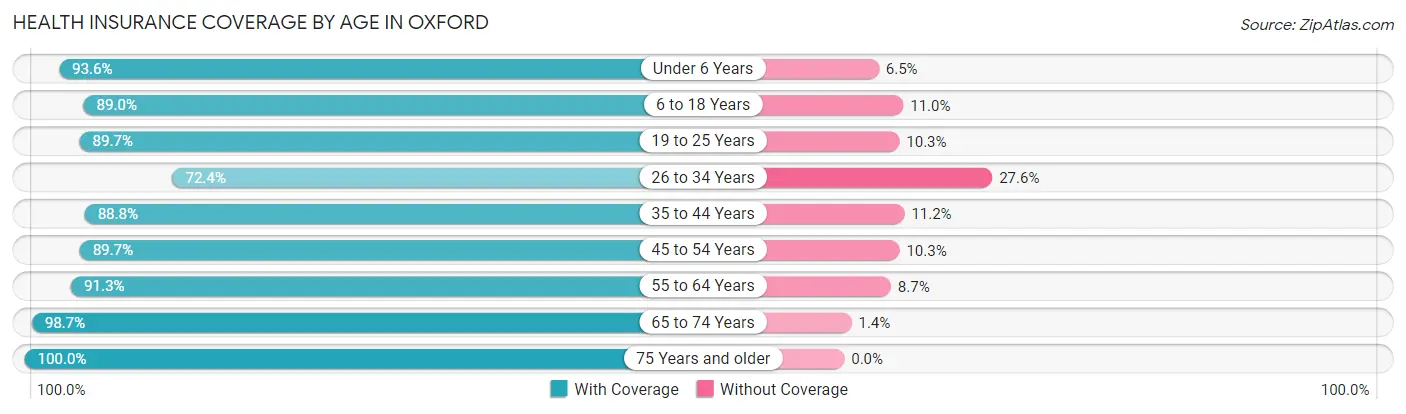
| Age Bracket | With Coverage | Without Coverage |
| Under 6 Years | 1,393 (93.5%) | 96 (6.5%) |
| 6 to 18 Years | 3,244 (89.0%) | 401 (11.0%) |
| 19 to 25 Years | 1,625 (89.7%) | 186 (10.3%) |
| 26 to 34 Years | 2,430 (72.4%) | 926 (27.6%) |
| 35 to 44 Years | 2,160 (88.8%) | 273 (11.2%) |
| 45 to 54 Years | 2,841 (89.7%) | 326 (10.3%) |
| 55 to 64 Years | 2,271 (91.3%) | 216 (8.7%) |
| 65 to 74 Years | 2,040 (98.7%) | 28 (1.3%) |
| 75 Years and older | 1,354 (100.0%) | 0 (0.0%) |
| Total | 19,358 (88.8%) | 2,452 (11.2%) |
Health Insurance Coverage by Citizenship Status in Oxford
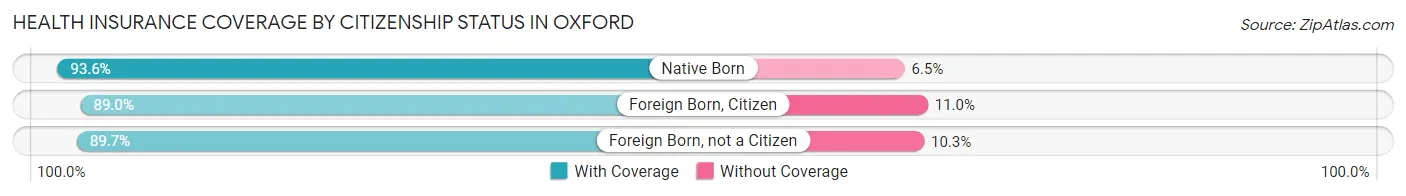
| Citizenship Status | With Coverage | Without Coverage |
| Native Born | 1,393 (93.5%) | 96 (6.5%) |
| Foreign Born, Citizen | 3,244 (89.0%) | 401 (11.0%) |
| Foreign Born, not a Citizen | 1,625 (89.7%) | 186 (10.3%) |
Health Insurance Coverage by Household Income in Oxford
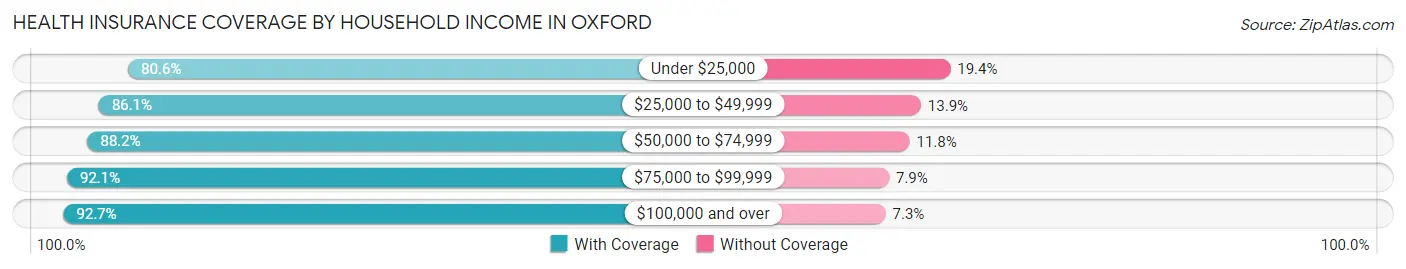
| Household Income | With Coverage | Without Coverage |
| Under $25,000 | 1,900 (80.6%) | 457 (19.4%) |
| $25,000 to $49,999 | 3,572 (86.1%) | 576 (13.9%) |
| $50,000 to $74,999 | 3,910 (88.2%) | 521 (11.8%) |
| $75,000 to $99,999 | 2,560 (92.1%) | 220 (7.9%) |
| $100,000 and over | 7,383 (92.7%) | 579 (7.3%) |
Public vs Private Health Insurance Coverage by Age in Oxford
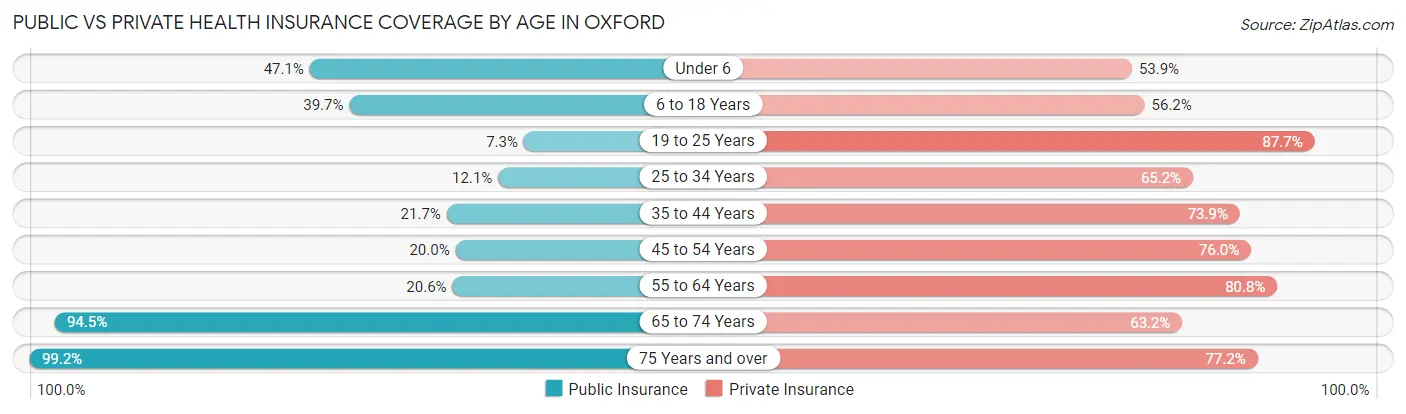
| Age Bracket | Public Insurance | Private Insurance |
| Under 6 | 701 (47.1%) | 802 (53.9%) |
| 6 to 18 Years | 1,448 (39.7%) | 2,049 (56.2%) |
| 19 to 25 Years | 133 (7.3%) | 1,589 (87.7%) |
| 25 to 34 Years | 406 (12.1%) | 2,187 (65.2%) |
| 35 to 44 Years | 527 (21.7%) | 1,797 (73.9%) |
| 45 to 54 Years | 634 (20.0%) | 2,406 (76.0%) |
| 55 to 64 Years | 512 (20.6%) | 2,010 (80.8%) |
| 65 to 74 Years | 1,955 (94.5%) | 1,307 (63.2%) |
| 75 Years and over | 1,343 (99.2%) | 1,045 (77.2%) |
| Total | 7,659 (35.1%) | 15,192 (69.7%) |
Disability Status by Sex by Age in Oxford
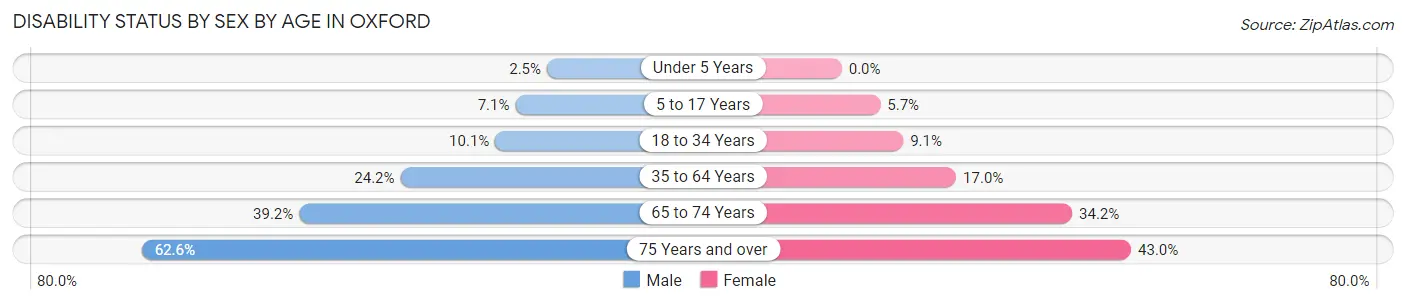
| Age Bracket | Male | Female |
| Under 5 Years | 19 (2.5%) | 0 (0.0%) |
| 5 to 17 Years | 145 (7.1%) | 100 (5.7%) |
| 18 to 34 Years | 263 (10.1%) | 246 (9.1%) |
| 35 to 64 Years | 1,038 (24.2%) | 645 (17.0%) |
| 65 to 74 Years | 403 (39.2%) | 356 (34.2%) |
| 75 Years and over | 323 (62.6%) | 360 (43.0%) |
Disability Class by Sex by Age in Oxford
Disability Class: Hearing Difficulty
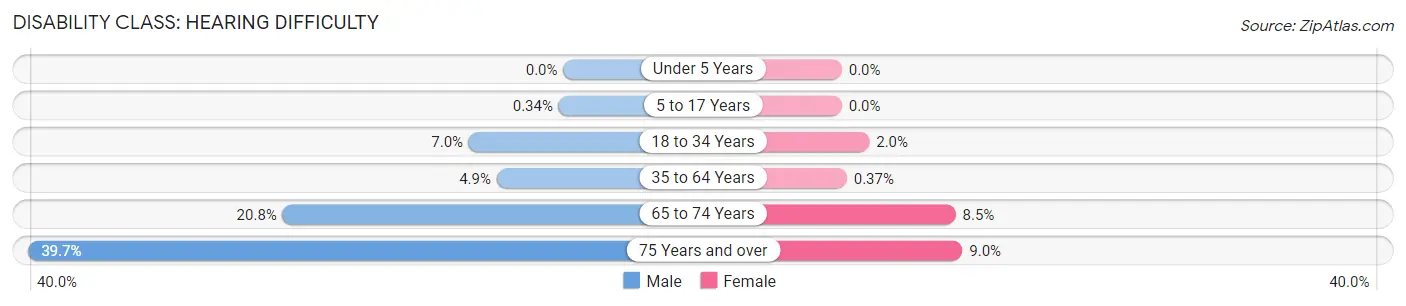
| Age Bracket | Male | Female |
| Under 5 Years | 0 (0.0%) | 0 (0.0%) |
| 5 to 17 Years | 7 (0.3%) | 0 (0.0%) |
| 18 to 34 Years | 182 (7.0%) | 55 (2.0%) |
| 35 to 64 Years | 212 (4.9%) | 14 (0.4%) |
| 65 to 74 Years | 214 (20.8%) | 88 (8.5%) |
| 75 Years and over | 205 (39.7%) | 75 (8.9%) |
Disability Class: Vision Difficulty
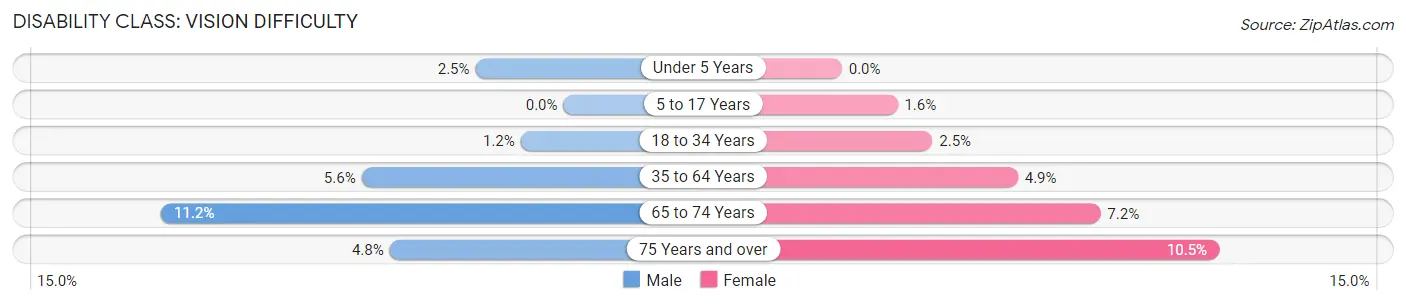
| Age Bracket | Male | Female |
| Under 5 Years | 19 (2.5%) | 0 (0.0%) |
| 5 to 17 Years | 0 (0.0%) | 27 (1.5%) |
| 18 to 34 Years | 31 (1.2%) | 68 (2.5%) |
| 35 to 64 Years | 241 (5.6%) | 186 (4.9%) |
| 65 to 74 Years | 115 (11.2%) | 75 (7.2%) |
| 75 Years and over | 25 (4.8%) | 88 (10.5%) |
Disability Class: Cognitive Difficulty
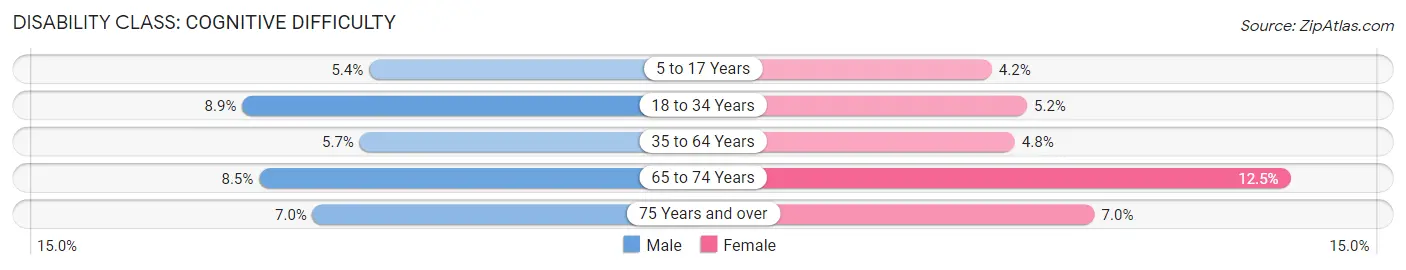
| Age Bracket | Male | Female |
| 5 to 17 Years | 110 (5.4%) | 73 (4.2%) |
| 18 to 34 Years | 232 (8.9%) | 139 (5.2%) |
| 35 to 64 Years | 243 (5.7%) | 183 (4.8%) |
| 65 to 74 Years | 87 (8.5%) | 130 (12.5%) |
| 75 Years and over | 36 (7.0%) | 59 (7.0%) |
Disability Class: Ambulatory Difficulty
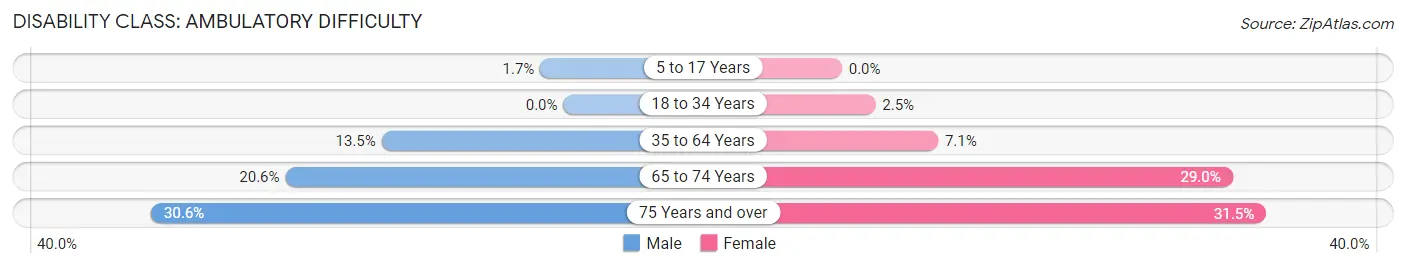
| Age Bracket | Male | Female |
| 5 to 17 Years | 35 (1.7%) | 0 (0.0%) |
| 18 to 34 Years | 0 (0.0%) | 67 (2.5%) |
| 35 to 64 Years | 579 (13.5%) | 271 (7.1%) |
| 65 to 74 Years | 212 (20.6%) | 302 (29.0%) |
| 75 Years and over | 158 (30.6%) | 264 (31.5%) |
Disability Class: Self-Care Difficulty
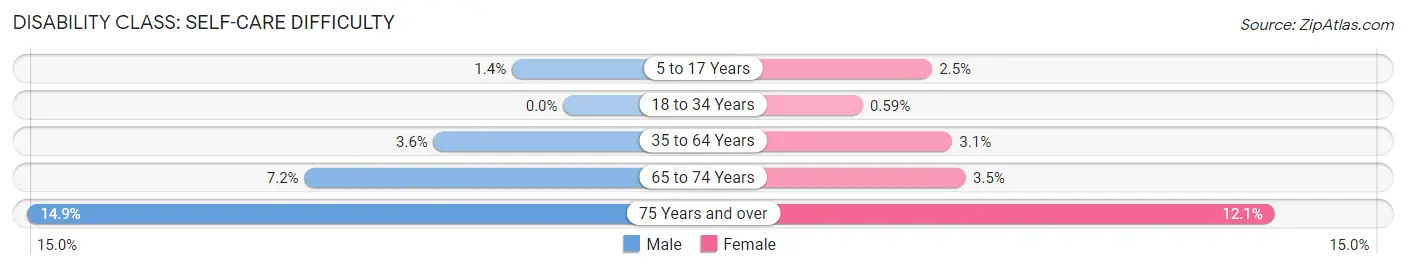
| Age Bracket | Male | Female |
| 5 to 17 Years | 29 (1.4%) | 44 (2.5%) |
| 18 to 34 Years | 0 (0.0%) | 16 (0.6%) |
| 35 to 64 Years | 155 (3.6%) | 117 (3.1%) |
| 65 to 74 Years | 74 (7.2%) | 36 (3.5%) |
| 75 Years and over | 77 (14.9%) | 101 (12.0%) |
Technology Access in Oxford
Computing Device Access in Oxford
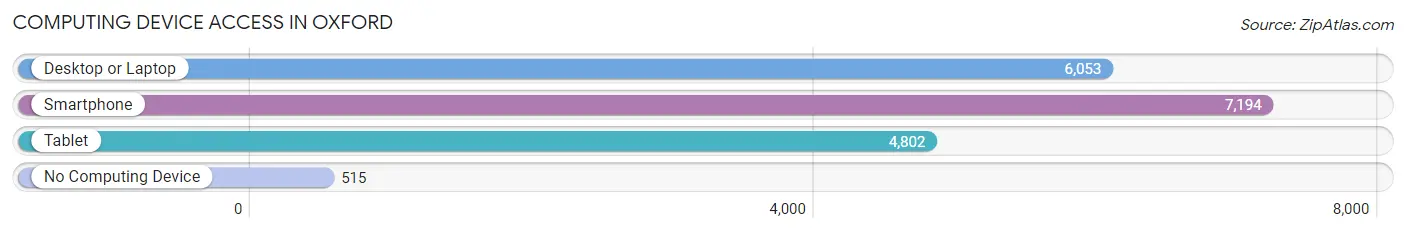
| Device Type | # Households | % Households |
| Desktop or Laptop | 6,053 | 74.0% |
| Smartphone | 7,194 | 88.0% |
| Tablet | 4,802 | 58.7% |
| No Computing Device | 515 | 6.3% |
| Total | 8,177 | 100.0% |
Internet Access in Oxford
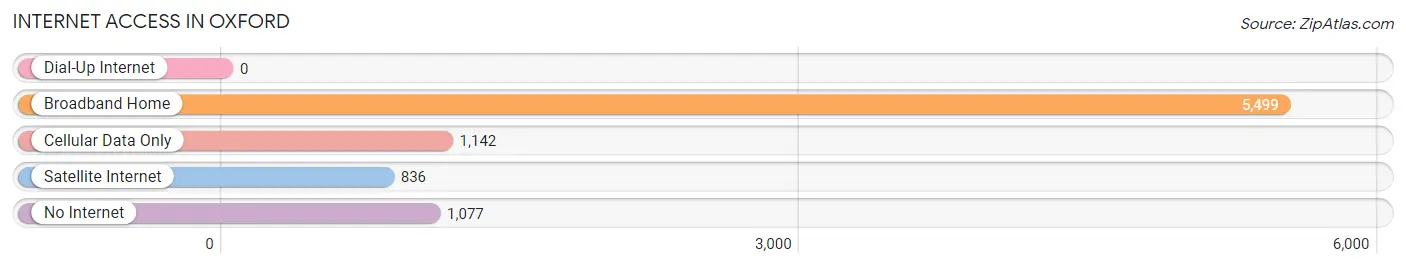
| Internet Type | # Households | % Households |
| Dial-Up Internet | 0 | 0.0% |
| Broadband Home | 5,499 | 67.2% |
| Cellular Data Only | 1,142 | 14.0% |
| Satellite Internet | 836 | 10.2% |
| No Internet | 1,077 | 13.2% |
| Total | 8,177 | 100.0% |
Oxford Summary
Oxford, Alabama is a city located in Calhoun County, Alabama, United States. It is the county seat of Calhoun County and is located in the foothills of the Appalachian Mountains. The population of Oxford was 21,348 as of the 2010 census.
History
Oxford was founded in 1852 and was originally known as Lickskillet. The name was changed to Oxford in 1855 in honor of the English university. The city was incorporated in 1872.
Oxford was an important center of the cotton industry in the 19th century. The city was home to several cotton mills, including the Oxford Cotton Mill, which was the largest cotton mill in the state. The mill was destroyed by fire in 1891.
Oxford was also home to several other industries, including a furniture factory, a brickyard, and a canning factory. The city was also home to several educational institutions, including Oxford College, which was founded in 1852.
Geography
Oxford is located at 33°37'N 85°51'W (33.6167, -85.85). The city is situated in the foothills of the Appalachian Mountains and is located in the northeastern corner of Calhoun County.
Oxford has a total area of 16.2 square miles, of which 16.1 square miles is land and 0.1 square miles is water. The city is located along the Choccolocco Creek, which flows through the city.
Economy
Oxford's economy is largely based on manufacturing and retail. The city is home to several manufacturing companies, including Oxford Industries, which produces apparel and home furnishings. The city is also home to several retail stores, including Walmart, Target, and Lowe's.
Oxford is also home to several educational institutions, including Oxford College, which is part of the University of Alabama system. The city is also home to several medical facilities, including Regional Medical Center and the Anniston Army Depot.
Demographics
As of the 2010 census, there were 21,348 people, 8,717 households, and 5,717 families residing in the city. The population density was 1,323.2 people per square mile. There were 9,845 housing units at an average density of 609.7 per square mile.
The racial makeup of the city was 73.2% White, 22.3% African American, 0.3% Native American, 1.2% Asian, 0.1% Pacific Islander, 1.2% from other races, and 1.8% from two or more races. Hispanic or Latino of any race were 3.2% of the population.
The median income for a household in the city was $37,945, and the median income for a family was $45,945. Males had a median income of $35,945 versus $25,945 for females. The per capita income for the city was $19,945. About 11.2% of families and 14.2% of the population were below the poverty line, including 19.2% of those under age 18 and 11.2% of those age 65 or over.
Common Questions
What is Per Capita Income in Oxford?
Per Capita income in Oxford is $33,518.
What is the Median Family Income in Oxford?
Median Family Income in Oxford is $73,868.
What is the Median Household income in Oxford?
Median Household Income in Oxford is $66,031.
What is Income or Wage Gap in Oxford?
Income or Wage Gap in Oxford is 24.3%.
Women in Oxford earn 75.7 cents for every dollar earned by a man.
What is Family Income Deficit in Oxford?
Family Income Deficit in Oxford is $12,916.
Families that are below poverty line in Oxford earn $12,916 less on average than the poverty threshold level.
What is Inequality or Gini Index in Oxford?
Inequality or Gini Index in Oxford is 0.43.
What is the Total Population of Oxford?
Total Population of Oxford is 22,019.
What is the Total Male Population of Oxford?
Total Male Population of Oxford is 11,338.
What is the Total Female Population of Oxford?
Total Female Population of Oxford is 10,681.
What is the Ratio of Males per 100 Females in Oxford?
There are 106.15 Males per 100 Females in Oxford.
What is the Ratio of Females per 100 Males in Oxford?
There are 94.21 Females per 100 Males in Oxford.
What is the Median Population Age in Oxford?
Median Population Age in Oxford is 37.4 Years.
What is the Average Family Size in Oxford
Average Family Size in Oxford is 3.2 People.
What is the Average Household Size in Oxford
Average Household Size in Oxford is 2.6 People.
How Large is the Labor Force in Oxford?
There are 10,988 People in the Labor Forcein in Oxford.
What is the Percentage of People in the Labor Force in Oxford?
62.6% of People are in the Labor Force in Oxford.
What is the Unemployment Rate in Oxford?
Unemployment Rate in Oxford is 4.6%.