Limestone County, AL Map & Demographics
Limestone County Map
Limestone County Overview
$37,504
PER CAPITA INCOME
$95,707
AVG FAMILY INCOME
$80,146
AVG HOUSEHOLD INCOME
36.0%
WAGE / INCOME GAP [ % ]
64.0¢/ $1
WAGE / INCOME GAP [ $ ]
$11,015
FAMILY INCOME DEFICIT
0.43
INEQUALITY / GINI INDEX
104,199
TOTAL POPULATION
52,385
MALE POPULATION
51,814
FEMALE POPULATION
101.10
MALES / 100 FEMALES
98.91
FEMALES / 100 MALES
40.2
MEDIAN AGE
3.1
AVG FAMILY SIZE
2.6
AVG HOUSEHOLD SIZE
50,251
LABOR FORCE [ PEOPLE ]
59.7%
PERCENT IN LABOR FORCE
4.1%
UNEMPLOYMENT RATE
Limestone County Area Codes
Income in Limestone County
Income Overview in Limestone County
Per Capita Income in Limestone County is $37,504, while median incomes of families and households are $95,707 and $80,146 respectively.
| Characteristic | Number | Measure |
| Per Capita Income | 104,199 | $37,504 |
| Median Family Income | 27,092 | $95,707 |
| Mean Family Income | 27,092 | $115,404 |
| Median Household Income | 38,572 | $80,146 |
| Mean Household Income | 38,572 | $99,315 |
| Income Deficit | 27,092 | $11,015 |
| Wage / Income Gap (%) | 104,199 | 36.03% |
| Wage / Income Gap ($) | 104,199 | 63.97¢ per $1 |
| Gini / Inequality Index | 104,199 | 0.43 |
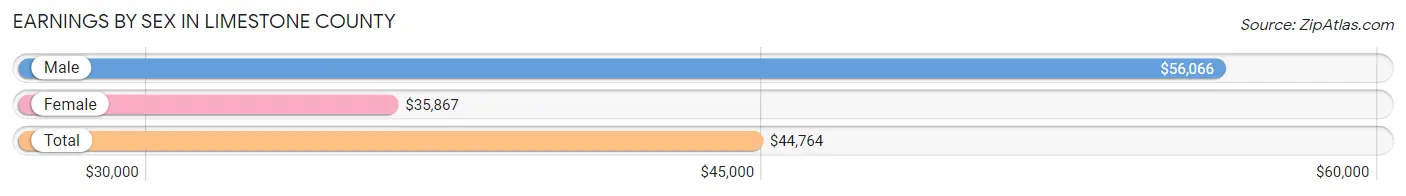
Earnings by Sex in Limestone County
Average Earnings in Limestone County are $44,764, $56,066 for men and $35,867 for women, a difference of 36.0%.
| Sex | Number | Average Earnings |
| Male | 29,631 (56.8%) | $56,066 |
| Female | 22,497 (43.2%) | $35,867 |
| Total | 52,128 (100.0%) | $44,764 |
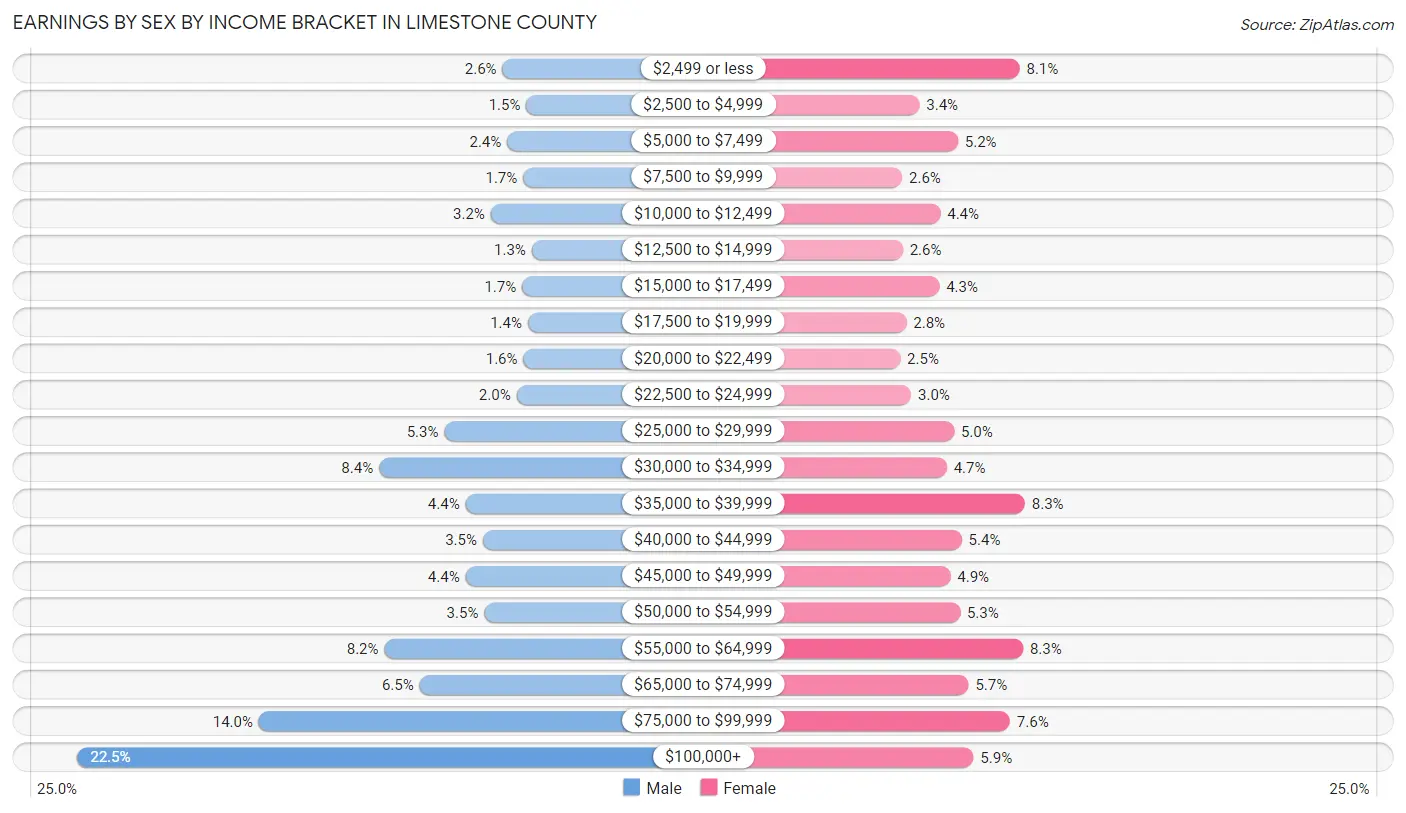
Earnings by Sex by Income Bracket in Limestone County
The most common earnings brackets in Limestone County are $100,000+ for men (6,677 | 22.5%) and $35,000 to $39,999 for women (1,877 | 8.3%).
| Income | Male | Female |
| $2,499 or less | 775 (2.6%) | 1,819 (8.1%) |
| $2,500 to $4,999 | 445 (1.5%) | 764 (3.4%) |
| $5,000 to $7,499 | 712 (2.4%) | 1,169 (5.2%) |
| $7,500 to $9,999 | 488 (1.7%) | 583 (2.6%) |
| $10,000 to $12,499 | 940 (3.2%) | 985 (4.4%) |
| $12,500 to $14,999 | 370 (1.3%) | 590 (2.6%) |
| $15,000 to $17,499 | 504 (1.7%) | 974 (4.3%) |
| $17,500 to $19,999 | 424 (1.4%) | 628 (2.8%) |
| $20,000 to $22,499 | 487 (1.6%) | 563 (2.5%) |
| $22,500 to $24,999 | 580 (2.0%) | 678 (3.0%) |
| $25,000 to $29,999 | 1,582 (5.3%) | 1,129 (5.0%) |
| $30,000 to $34,999 | 2,490 (8.4%) | 1,053 (4.7%) |
| $35,000 to $39,999 | 1,290 (4.3%) | 1,877 (8.3%) |
| $40,000 to $44,999 | 1,049 (3.5%) | 1,211 (5.4%) |
| $45,000 to $49,999 | 1,289 (4.3%) | 1,091 (4.9%) |
| $50,000 to $54,999 | 1,029 (3.5%) | 1,192 (5.3%) |
| $55,000 to $64,999 | 2,416 (8.2%) | 1,856 (8.3%) |
| $65,000 to $74,999 | 1,927 (6.5%) | 1,282 (5.7%) |
| $75,000 to $99,999 | 4,157 (14.0%) | 1,719 (7.6%) |
| $100,000+ | 6,677 (22.5%) | 1,334 (5.9%) |
| Total | 29,631 (100.0%) | 22,497 (100.0%) |
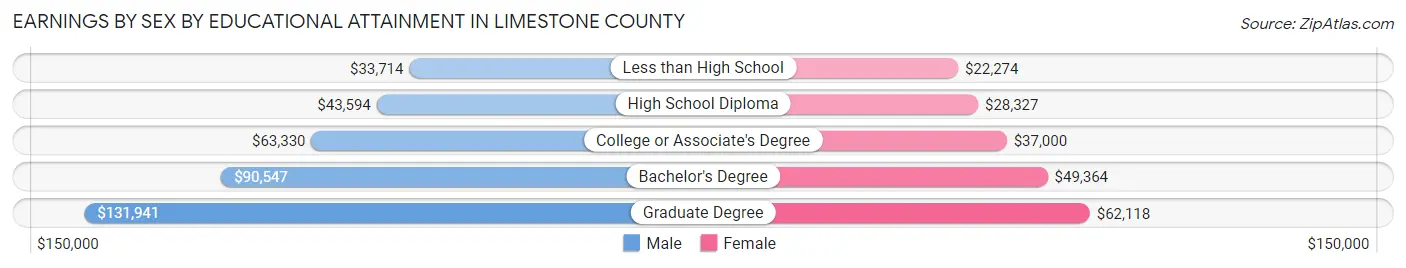
Earnings by Sex by Educational Attainment in Limestone County
Average earnings in Limestone County are $63,122 for men and $39,422 for women, a difference of 37.6%. Men with an educational attainment of graduate degree enjoy the highest average annual earnings of $131,941, while those with less than high school education earn the least with $33,714. Women with an educational attainment of graduate degree earn the most with the average annual earnings of $62,118, while those with less than high school education have the smallest earnings of $22,274.
| Educational Attainment | Male Income | Female Income |
| Less than High School | $33,714 | $22,274 |
| High School Diploma | $43,594 | $28,327 |
| College or Associate's Degree | $63,330 | $37,000 |
| Bachelor's Degree | $90,547 | $49,364 |
| Graduate Degree | $131,941 | $62,118 |
| Total | $63,122 | $39,422 |
Family Income in Limestone County
Family Income Brackets in Limestone County
According to the Limestone County family income data, there are 5,689 families falling into the $100,000 to $149,999 income range, which is the most common income bracket and makes up 21.0% of all families. Conversely, the $10,000 to $14,999 income bracket is the least frequent group with only 542 families (2.0%) belonging to this category.
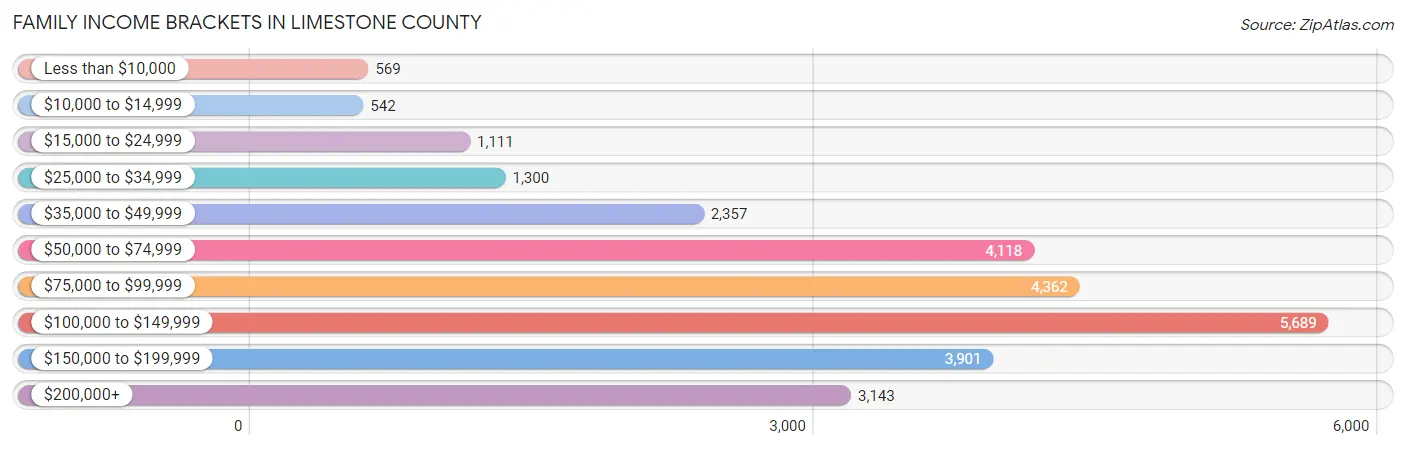
| Income Bracket | # Families | % Families |
| Less than $10,000 | 569 | 2.1% |
| $10,000 to $14,999 | 542 | 2.0% |
| $15,000 to $24,999 | 1,111 | 4.1% |
| $25,000 to $34,999 | 1,300 | 4.8% |
| $35,000 to $49,999 | 2,357 | 8.7% |
| $50,000 to $74,999 | 4,118 | 15.2% |
| $75,000 to $99,999 | 4,362 | 16.1% |
| $100,000 to $149,999 | 5,689 | 21.0% |
| $150,000 to $199,999 | 3,901 | 14.4% |
| $200,000+ | 3,143 | 11.6% |
Family Income by Famaliy Size in Limestone County
3-person families (5,256 | 19.4%) account for the highest median family income in Limestone County with $118,039 per family, while 2-person families (12,588 | 46.5%) have the highest median income of $42,216 per family member.
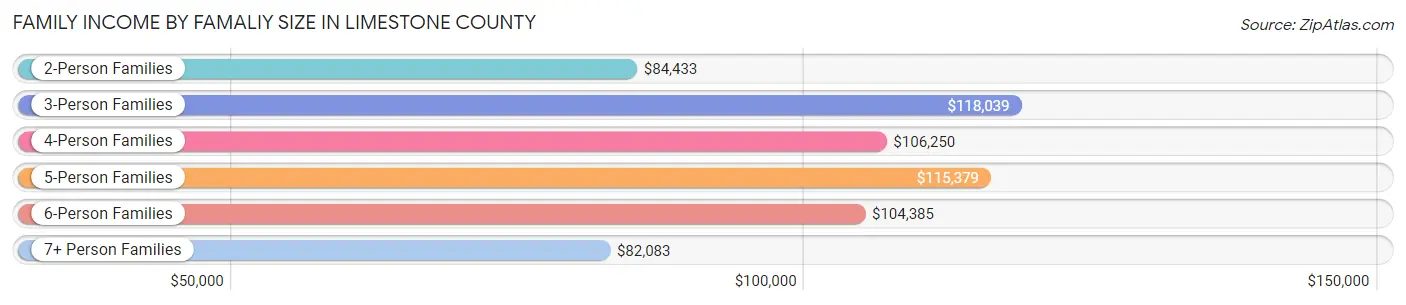
| Income Bracket | # Families | Median Income |
| 2-Person Families | 12,588 (46.5%) | $84,433 |
| 3-Person Families | 5,256 (19.4%) | $118,039 |
| 4-Person Families | 6,231 (23.0%) | $106,250 |
| 5-Person Families | 2,035 (7.5%) | $115,379 |
| 6-Person Families | 802 (3.0%) | $104,385 |
| 7+ Person Families | 180 (0.7%) | $82,083 |
| Total | 27,092 (100.0%) | $95,707 |
Family Income by Number of Earners in Limestone County
The median family income in Limestone County is $95,707, with families comprising 3+ earners (2,656) having the highest median family income of $153,377, while families with no earners (3,812) have the lowest median family income of $45,947, accounting for 9.8% and 14.1% of families, respectively.
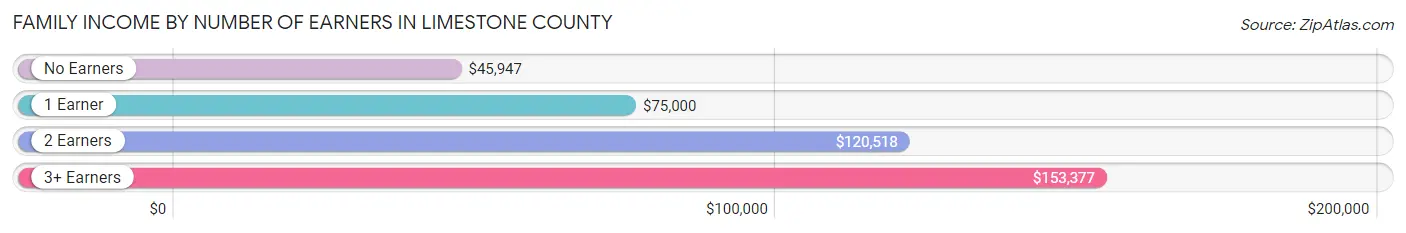
| Number of Earners | # Families | Median Income |
| No Earners | 3,812 (14.1%) | $45,947 |
| 1 Earner | 9,806 (36.2%) | $75,000 |
| 2 Earners | 10,818 (39.9%) | $120,518 |
| 3+ Earners | 2,656 (9.8%) | $153,377 |
| Total | 27,092 (100.0%) | $95,707 |
Household Income in Limestone County
Household Income Brackets in Limestone County
With 6,904 households falling in the category, the $100,000 to $149,999 income range is the most frequent in Limestone County, accounting for 17.9% of all households. In contrast, only 1,273 households (3.3%) fall into the less than $10,000 income bracket, making it the least populous group.
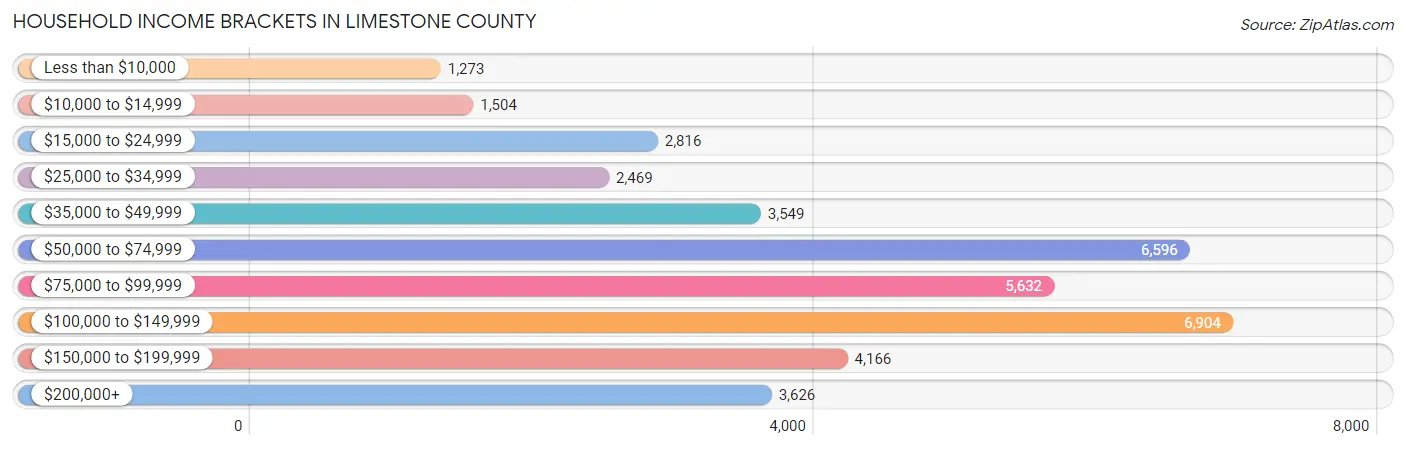
| Income Bracket | # Households | % Households |
| Less than $10,000 | 1,273 | 3.3% |
| $10,000 to $14,999 | 1,504 | 3.9% |
| $15,000 to $24,999 | 2,816 | 7.3% |
| $25,000 to $34,999 | 2,469 | 6.4% |
| $35,000 to $49,999 | 3,549 | 9.2% |
| $50,000 to $74,999 | 6,596 | 17.1% |
| $75,000 to $99,999 | 5,632 | 14.6% |
| $100,000 to $149,999 | 6,904 | 17.9% |
| $150,000 to $199,999 | 4,166 | 10.8% |
| $200,000+ | 3,626 | 9.4% |
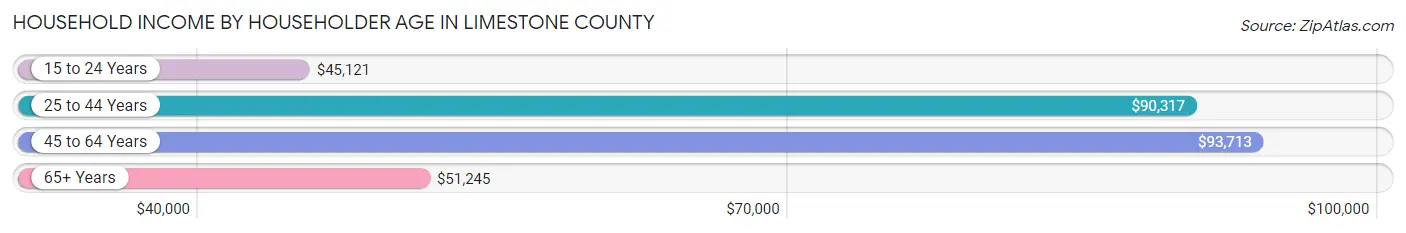
Household Income by Householder Age in Limestone County
The median household income in Limestone County is $80,146, with the highest median household income of $93,713 found in the 45 to 64 years age bracket for the primary householder. A total of 14,656 households (38.0%) fall into this category. Meanwhile, the 15 to 24 years age bracket for the primary householder has the lowest median household income of $45,121, with 1,089 households (2.8%) in this group.
| Income Bracket | # Households | Median Income |
| 15 to 24 Years | 1,089 (2.8%) | $45,121 |
| 25 to 44 Years | 12,685 (32.9%) | $90,317 |
| 45 to 64 Years | 14,656 (38.0%) | $93,713 |
| 65+ Years | 10,142 (26.3%) | $51,245 |
| Total | 38,572 (100.0%) | $80,146 |
Poverty in Limestone County
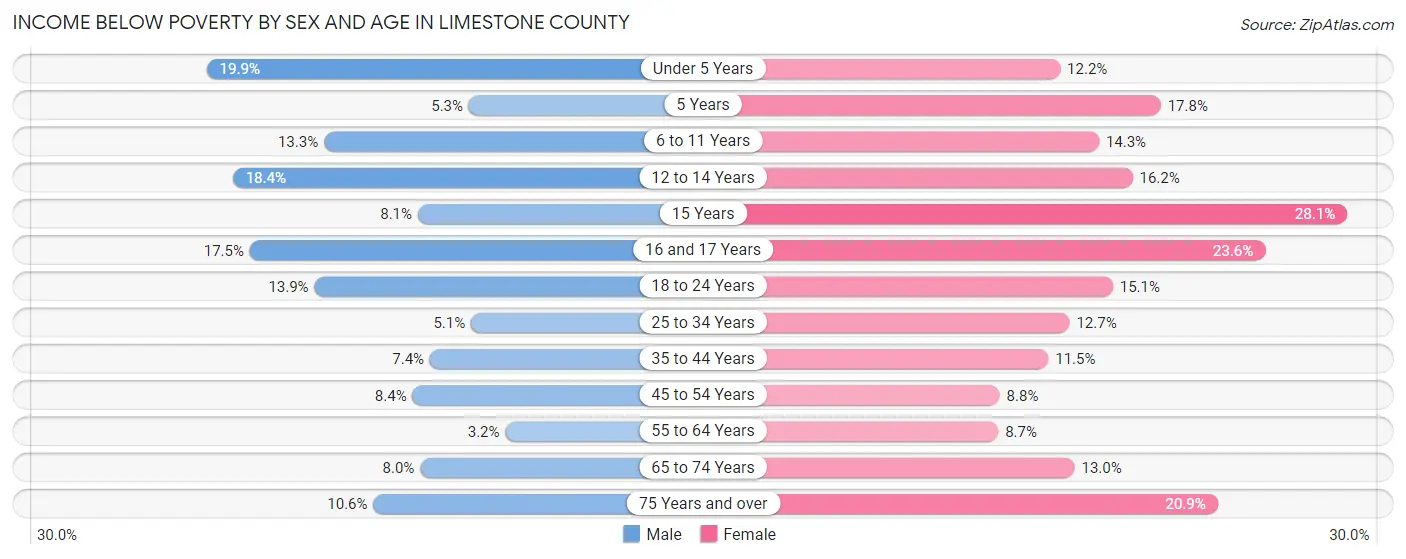
Income Below Poverty by Sex and Age in Limestone County
With 9.3% poverty level for males and 13.1% for females among the residents of Limestone County, under 5 year old males and 15 year old females are the most vulnerable to poverty, with 563 males (19.9%) and 157 females (28.1%) in their respective age groups living below the poverty level.
| Age Bracket | Male | Female |
| Under 5 Years | 563 (19.9%) | 331 (12.2%) |
| 5 Years | 45 (5.3%) | 89 (17.8%) |
| 6 to 11 Years | 476 (13.3%) | 552 (14.3%) |
| 12 to 14 Years | 371 (18.4%) | 323 (16.2%) |
| 15 Years | 54 (8.1%) | 157 (28.1%) |
| 16 and 17 Years | 252 (17.5%) | 359 (23.6%) |
| 18 to 24 Years | 563 (13.9%) | 599 (15.1%) |
| 25 to 34 Years | 332 (5.1%) | 838 (12.7%) |
| 35 to 44 Years | 483 (7.4%) | 835 (11.5%) |
| 45 to 54 Years | 602 (8.4%) | 585 (8.8%) |
| 55 to 64 Years | 225 (3.2%) | 609 (8.7%) |
| 65 to 74 Years | 349 (8.0%) | 656 (13.0%) |
| 75 Years and over | 267 (10.6%) | 772 (20.9%) |
| Total | 4,582 (9.3%) | 6,705 (13.1%) |
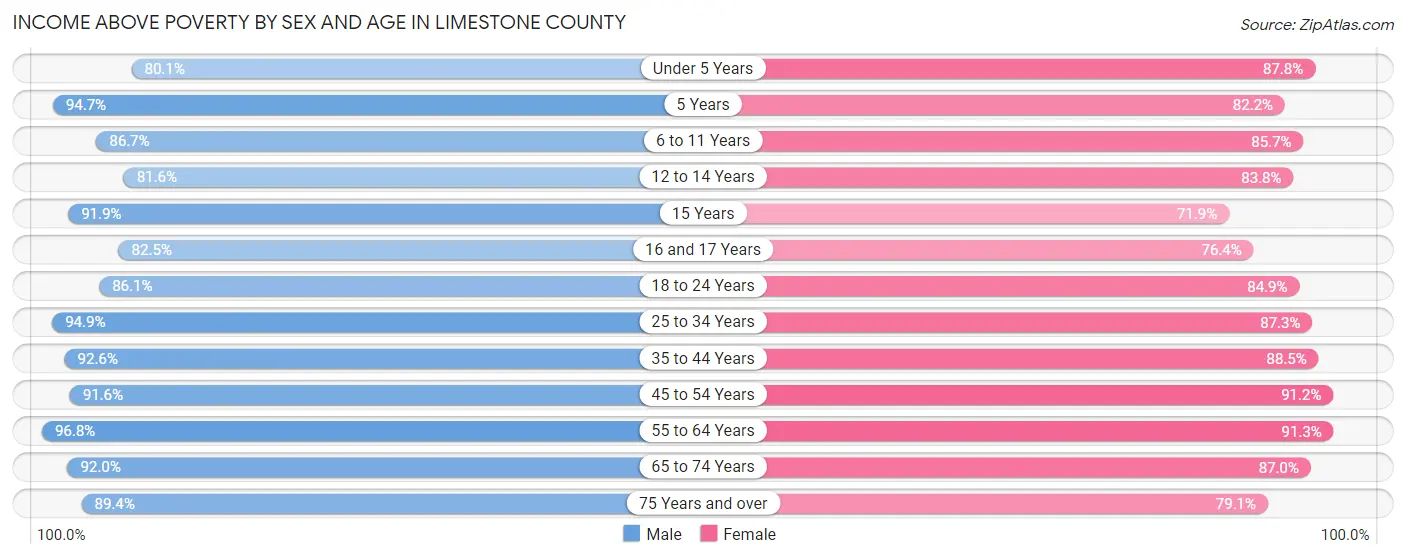
Income Above Poverty by Sex and Age in Limestone County
According to the poverty statistics in Limestone County, males aged 55 to 64 years and females aged 55 to 64 years are the age groups that are most secure financially, with 96.8% of males and 91.3% of females in these age groups living above the poverty line.
| Age Bracket | Male | Female |
| Under 5 Years | 2,272 (80.1%) | 2,390 (87.8%) |
| 5 Years | 810 (94.7%) | 412 (82.2%) |
| 6 to 11 Years | 3,096 (86.7%) | 3,302 (85.7%) |
| 12 to 14 Years | 1,644 (81.6%) | 1,672 (83.8%) |
| 15 Years | 613 (91.9%) | 401 (71.9%) |
| 16 and 17 Years | 1,191 (82.5%) | 1,164 (76.4%) |
| 18 to 24 Years | 3,500 (86.1%) | 3,371 (84.9%) |
| 25 to 34 Years | 6,129 (94.9%) | 5,771 (87.3%) |
| 35 to 44 Years | 6,016 (92.6%) | 6,426 (88.5%) |
| 45 to 54 Years | 6,562 (91.6%) | 6,068 (91.2%) |
| 55 to 64 Years | 6,738 (96.8%) | 6,385 (91.3%) |
| 65 to 74 Years | 4,032 (92.0%) | 4,404 (87.0%) |
| 75 Years and over | 2,256 (89.4%) | 2,919 (79.1%) |
| Total | 44,859 (90.7%) | 44,685 (87.0%) |
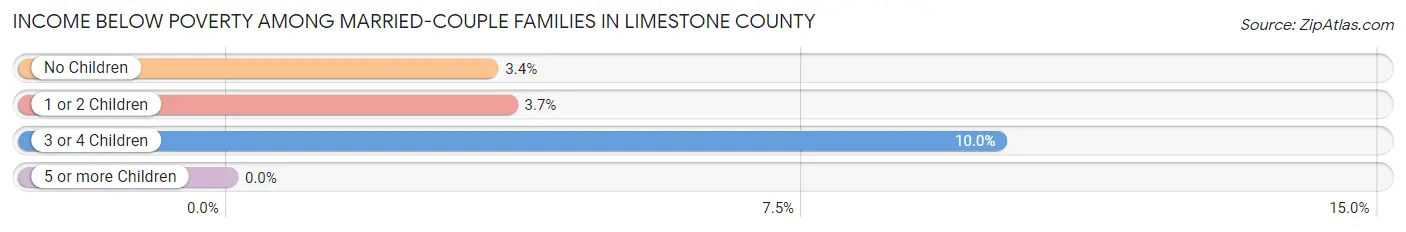
Income Below Poverty Among Married-Couple Families in Limestone County
The poverty statistics for married-couple families in Limestone County show that 4.0% or 871 of the total 21,758 families live below the poverty line. Families with 3 or 4 children have the highest poverty rate of 10.0%, comprising of 170 families. On the other hand, families with 5 or more children have the lowest poverty rate of 0.0%, which includes 0 families.
| Children | Above Poverty | Below Poverty |
| No Children | 11,748 (96.6%) | 414 (3.4%) |
| 1 or 2 Children | 7,572 (96.4%) | 287 (3.6%) |
| 3 or 4 Children | 1,524 (90.0%) | 170 (10.0%) |
| 5 or more Children | 43 (100.0%) | 0 (0.0%) |
| Total | 20,887 (96.0%) | 871 (4.0%) |
Income Below Poverty Among Single-Parent Households in Limestone County
According to the poverty data in Limestone County, 9.5% or 149 single-father households and 27.2% or 1,025 single-mother households are living below the poverty line. Among single-father households, those with 3 or 4 children have the highest poverty rate, with 28 households (36.8%) experiencing poverty. Likewise, among single-mother households, those with 3 or 4 children have the highest poverty rate, with 174 households (59.4%) falling below the poverty line.
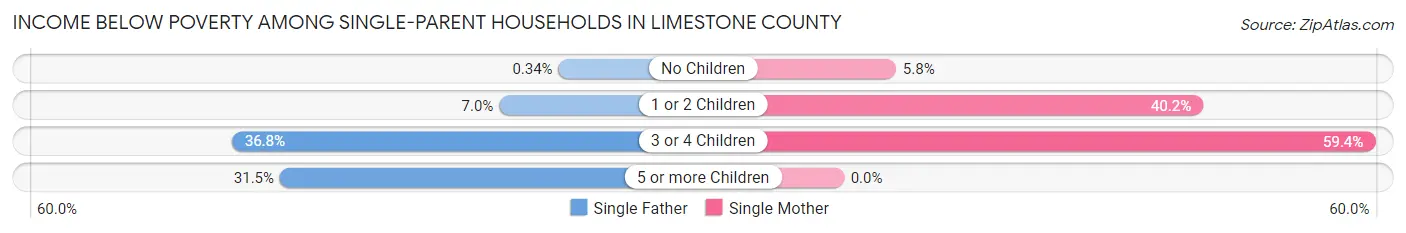
| Children | Single Father | Single Mother |
| No Children | 2 (0.3%) | 92 (5.8%) |
| 1 or 2 Children | 46 (7.0%) | 759 (40.2%) |
| 3 or 4 Children | 28 (36.8%) | 174 (59.4%) |
| 5 or more Children | 73 (31.5%) | 0 (0.0%) |
| Total | 149 (9.5%) | 1,025 (27.2%) |
Income Below Poverty Among Married-Couple vs Single-Parent Households in Limestone County
The poverty data for Limestone County shows that 871 of the married-couple family households (4.0%) and 1,174 of the single-parent households (22.0%) are living below the poverty level. Within the married-couple family households, those with 3 or 4 children have the highest poverty rate, with 170 households (10.0%) falling below the poverty line. Among the single-parent households, those with 3 or 4 children have the highest poverty rate, with 202 household (54.7%) living below poverty.
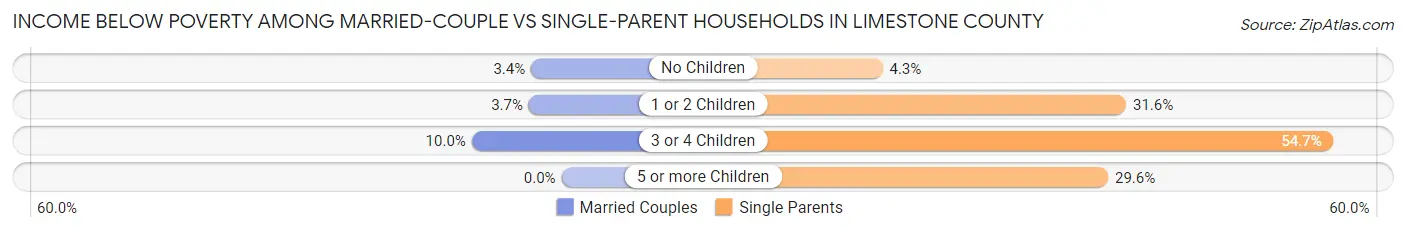
| Children | Married-Couple Families | Single-Parent Households |
| No Children | 414 (3.4%) | 94 (4.3%) |
| 1 or 2 Children | 287 (3.6%) | 805 (31.6%) |
| 3 or 4 Children | 170 (10.0%) | 202 (54.7%) |
| 5 or more Children | 0 (0.0%) | 73 (29.5%) |
| Total | 871 (4.0%) | 1,174 (22.0%) |
Race in Limestone County
The most populous races in Limestone County are White / Caucasian (80,040 | 76.8%), Black / African American (13,714 | 13.2%), and Hispanic or Latino (6,588 | 6.3%).
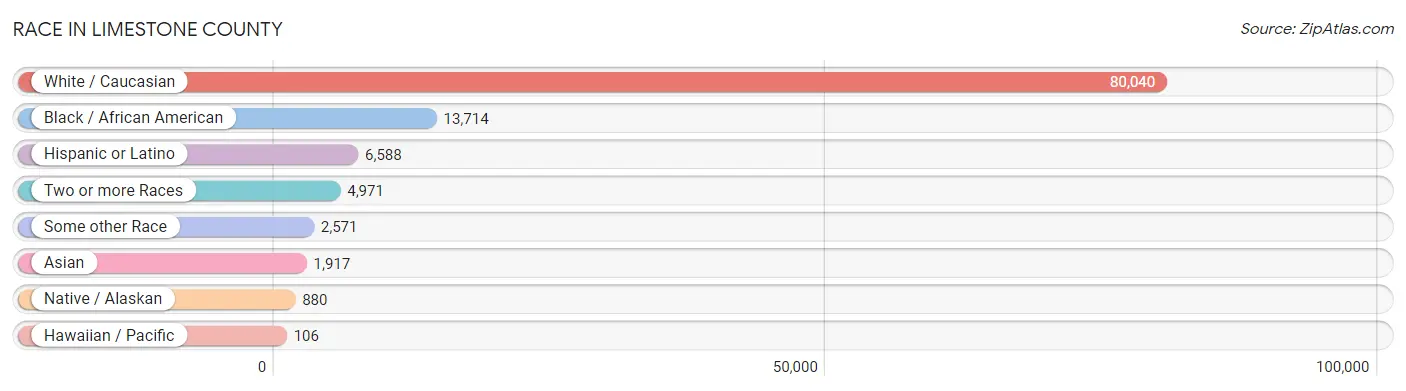
| Race | # Population | % Population |
| Asian | 1,917 | 1.8% |
| Black / African American | 13,714 | 13.2% |
| Hawaiian / Pacific | 106 | 0.1% |
| Hispanic or Latino | 6,588 | 6.3% |
| Native / Alaskan | 880 | 0.8% |
| White / Caucasian | 80,040 | 76.8% |
| Two or more Races | 4,971 | 4.8% |
| Some other Race | 2,571 | 2.5% |
| Total | 104,199 | 100.0% |
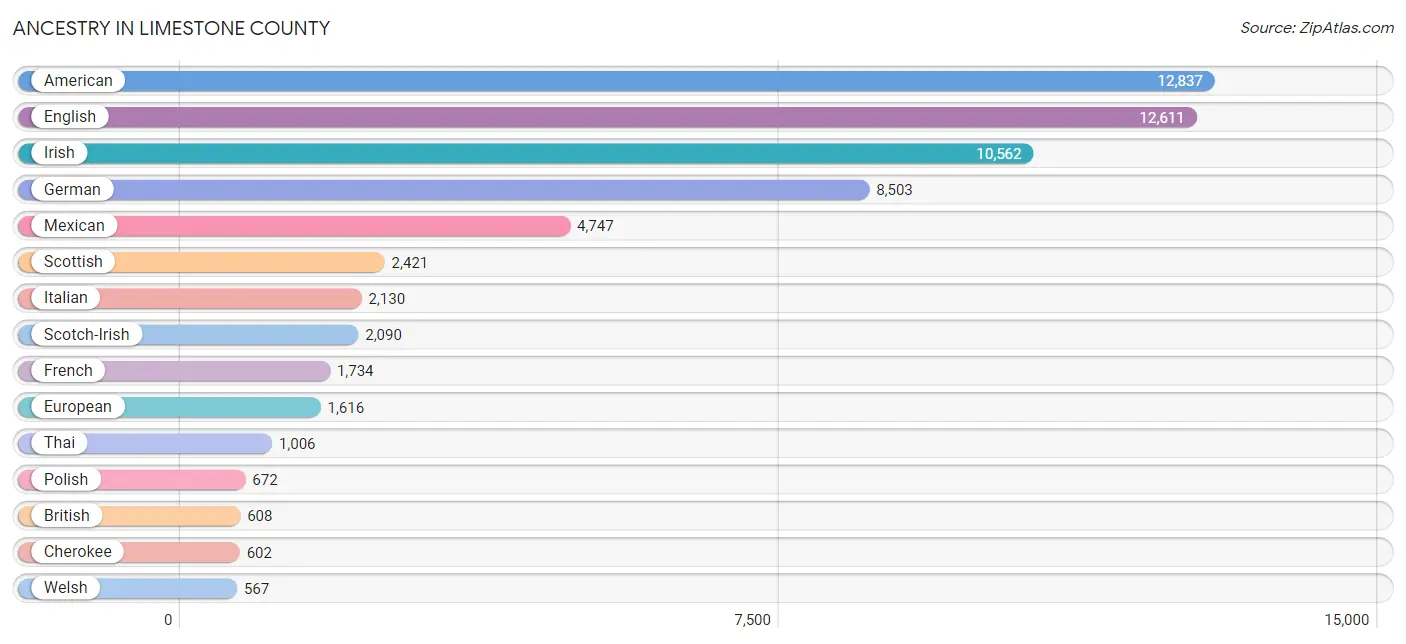
Ancestry in Limestone County
The most populous ancestries reported in Limestone County are American (12,837 | 12.3%), English (12,611 | 12.1%), Irish (10,562 | 10.1%), German (8,503 | 8.2%), and Mexican (4,747 | 4.6%), together accounting for 47.3% of all Limestone County residents.
| Ancestry | # Population | % Population |
| African | 326 | 0.3% |
| American | 12,837 | 12.3% |
| Arab | 282 | 0.3% |
| Argentinean | 31 | 0.0% |
| Austrian | 106 | 0.1% |
| Belgian | 1 | 0.0% |
| Bhutanese | 134 | 0.1% |
| Blackfeet | 36 | 0.0% |
| Brazilian | 117 | 0.1% |
| British | 608 | 0.6% |
| Bulgarian | 23 | 0.0% |
| Burmese | 163 | 0.2% |
| Canadian | 59 | 0.1% |
| Central American | 491 | 0.5% |
| Cherokee | 602 | 0.6% |
| Chickasaw | 5 | 0.0% |
| Choctaw | 39 | 0.0% |
| Colombian | 24 | 0.0% |
| Creek | 107 | 0.1% |
| Cuban | 149 | 0.1% |
| Czech | 82 | 0.1% |
| Czechoslovakian | 2 | 0.0% |
| Danish | 199 | 0.2% |
| Dominican | 209 | 0.2% |
| Dutch | 541 | 0.5% |
| Dutch West Indian | 11 | 0.0% |
| Eastern European | 339 | 0.3% |
| English | 12,611 | 12.1% |
| European | 1,616 | 1.5% |
| Finnish | 97 | 0.1% |
| French | 1,734 | 1.7% |
| French Canadian | 234 | 0.2% |
| German | 8,503 | 8.2% |
| Greek | 290 | 0.3% |
| Guatemalan | 251 | 0.2% |
| Haitian | 20 | 0.0% |
| Honduran | 180 | 0.2% |
| Hungarian | 13 | 0.0% |
| Indian (Asian) | 343 | 0.3% |
| Irish | 10,562 | 10.1% |
| Iroquois | 18 | 0.0% |
| Italian | 2,130 | 2.0% |
| Jamaican | 7 | 0.0% |
| Japanese | 20 | 0.0% |
| Korean | 283 | 0.3% |
| Laotian | 12 | 0.0% |
| Latvian | 159 | 0.2% |
| Lebanese | 140 | 0.1% |
| Lithuanian | 41 | 0.0% |
| Mexican | 4,747 | 4.6% |
| Mexican American Indian | 355 | 0.3% |
| Moroccan | 142 | 0.1% |
| Native Hawaiian | 371 | 0.4% |
| Northern European | 131 | 0.1% |
| Norwegian | 557 | 0.5% |
| Ottawa | 21 | 0.0% |
| Panamanian | 47 | 0.1% |
| Pennsylvania German | 31 | 0.0% |
| Polish | 672 | 0.6% |
| Portuguese | 39 | 0.0% |
| Puerto Rican | 519 | 0.5% |
| Romanian | 136 | 0.1% |
| Russian | 168 | 0.2% |
| Salvadoran | 13 | 0.0% |
| Samoan | 73 | 0.1% |
| Scandinavian | 458 | 0.4% |
| Scotch-Irish | 2,090 | 2.0% |
| Scottish | 2,421 | 2.3% |
| Seminole | 19 | 0.0% |
| Serbian | 11 | 0.0% |
| Sioux | 132 | 0.1% |
| Slovak | 29 | 0.0% |
| South American | 55 | 0.1% |
| Spaniard | 34 | 0.0% |
| Spanish | 96 | 0.1% |
| Sri Lankan | 245 | 0.2% |
| Subsaharan African | 326 | 0.3% |
| Swedish | 254 | 0.2% |
| Swiss | 17 | 0.0% |
| Thai | 1,006 | 1.0% |
| Ukrainian | 57 | 0.1% |
| Ute | 8 | 0.0% |
| Welsh | 567 | 0.5% |
| West Indian | 19 | 0.0% |
| Yugoslavian | 23 | 0.0% | View All 85 Rows |
Immigrants in Limestone County
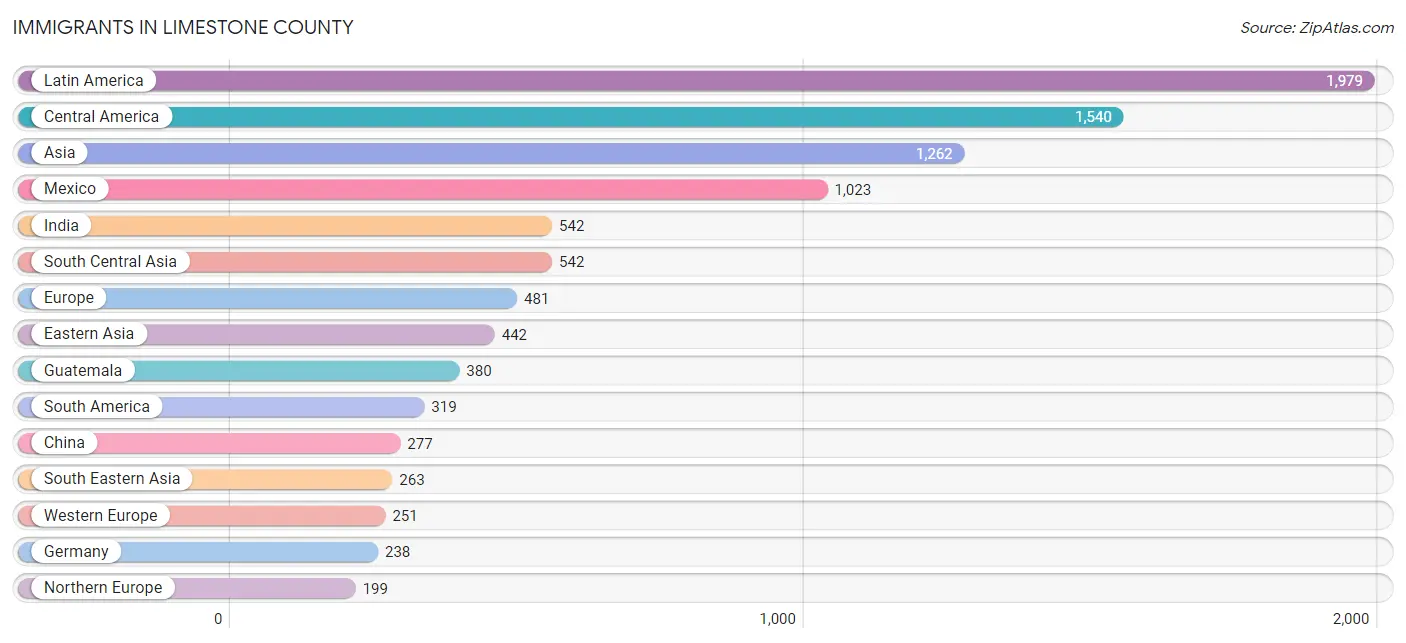
The most numerous immigrant groups reported in Limestone County came from Latin America (1,979 | 1.9%), Central America (1,540 | 1.5%), Asia (1,262 | 1.2%), Mexico (1,023 | 1.0%), and India (542 | 0.5%), together accounting for 6.1% of all Limestone County residents.
| Immigration Origin | # Population | % Population |
| Africa | 164 | 0.2% |
| Argentina | 31 | 0.0% |
| Asia | 1,262 | 1.2% |
| Brazil | 164 | 0.2% |
| Bulgaria | 23 | 0.0% |
| Cambodia | 20 | 0.0% |
| Canada | 76 | 0.1% |
| Caribbean | 120 | 0.1% |
| Central America | 1,540 | 1.5% |
| China | 277 | 0.3% |
| Colombia | 82 | 0.1% |
| Cuba | 20 | 0.0% |
| Dominican Republic | 100 | 0.1% |
| Eastern Asia | 442 | 0.4% |
| Eastern Europe | 31 | 0.0% |
| El Salvador | 2 | 0.0% |
| England | 11 | 0.0% |
| Europe | 481 | 0.5% |
| France | 13 | 0.0% |
| Germany | 238 | 0.2% |
| Guatemala | 380 | 0.4% |
| Honduras | 60 | 0.1% |
| India | 542 | 0.5% |
| Indonesia | 12 | 0.0% |
| Ireland | 4 | 0.0% |
| Japan | 71 | 0.1% |
| Korea | 94 | 0.1% |
| Latin America | 1,979 | 1.9% |
| Mexico | 1,023 | 1.0% |
| Morocco | 142 | 0.1% |
| Northern Africa | 142 | 0.1% |
| Northern Europe | 199 | 0.2% |
| Oceania | 2 | 0.0% |
| Panama | 47 | 0.1% |
| Philippines | 76 | 0.1% |
| Poland | 8 | 0.0% |
| Singapore | 14 | 0.0% |
| South America | 319 | 0.3% |
| South Central Asia | 542 | 0.5% |
| South Eastern Asia | 263 | 0.3% |
| Sweden | 12 | 0.0% |
| Turkey | 15 | 0.0% |
| Vietnam | 141 | 0.1% |
| Western Asia | 15 | 0.0% |
| Western Europe | 251 | 0.2% | View All 45 Rows |
Sex and Age in Limestone County
Sex and Age in Limestone County
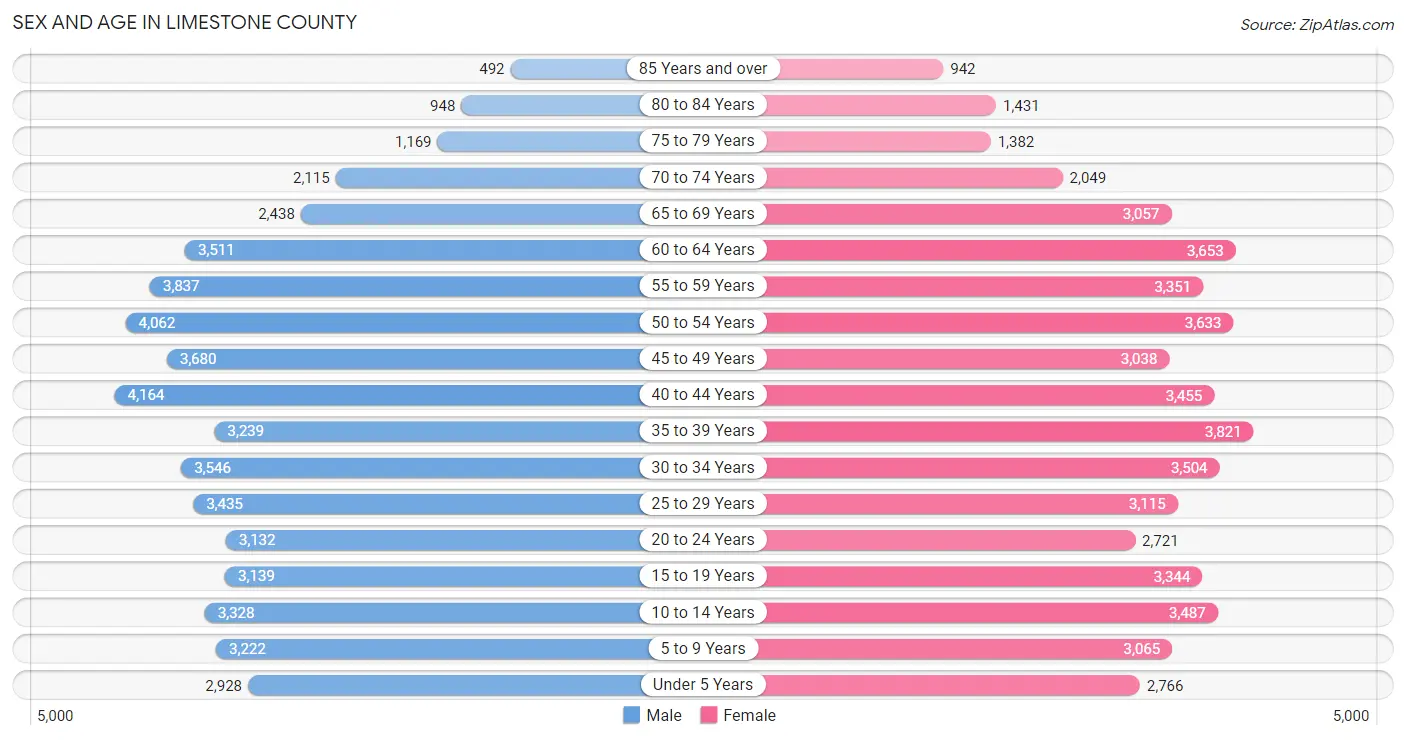
The most populous age groups in Limestone County are 40 to 44 Years (4,164 | 8.0%) for men and 35 to 39 Years (3,821 | 7.4%) for women.
| Age Bracket | Male | Female |
| Under 5 Years | 2,928 (5.6%) | 2,766 (5.3%) |
| 5 to 9 Years | 3,222 (6.1%) | 3,065 (5.9%) |
| 10 to 14 Years | 3,328 (6.4%) | 3,487 (6.7%) |
| 15 to 19 Years | 3,139 (6.0%) | 3,344 (6.5%) |
| 20 to 24 Years | 3,132 (6.0%) | 2,721 (5.2%) |
| 25 to 29 Years | 3,435 (6.6%) | 3,115 (6.0%) |
| 30 to 34 Years | 3,546 (6.8%) | 3,504 (6.8%) |
| 35 to 39 Years | 3,239 (6.2%) | 3,821 (7.4%) |
| 40 to 44 Years | 4,164 (8.0%) | 3,455 (6.7%) |
| 45 to 49 Years | 3,680 (7.0%) | 3,038 (5.9%) |
| 50 to 54 Years | 4,062 (7.7%) | 3,633 (7.0%) |
| 55 to 59 Years | 3,837 (7.3%) | 3,351 (6.5%) |
| 60 to 64 Years | 3,511 (6.7%) | 3,653 (7.0%) |
| 65 to 69 Years | 2,438 (4.6%) | 3,057 (5.9%) |
| 70 to 74 Years | 2,115 (4.0%) | 2,049 (4.0%) |
| 75 to 79 Years | 1,169 (2.2%) | 1,382 (2.7%) |
| 80 to 84 Years | 948 (1.8%) | 1,431 (2.8%) |
| 85 Years and over | 492 (0.9%) | 942 (1.8%) |
| Total | 52,385 (100.0%) | 51,814 (100.0%) |
Families and Households in Limestone County
Median Family Size in Limestone County
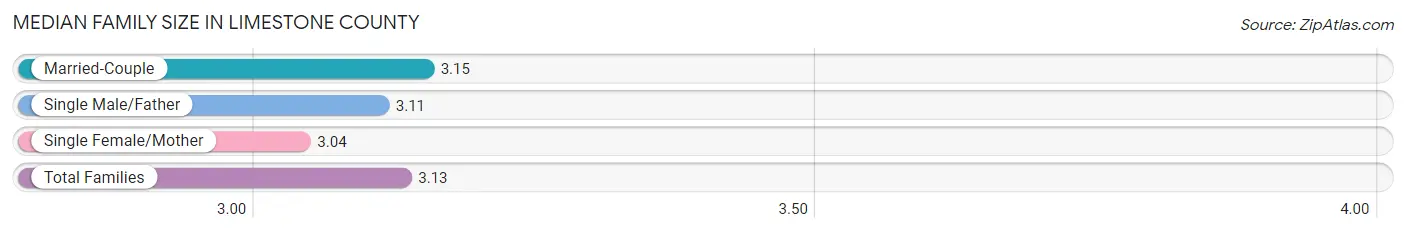
The median family size in Limestone County is 3.13 persons per family, with married-couple families (21,758 | 80.3%) accounting for the largest median family size of 3.15 persons per family. On the other hand, single female/mother families (3,772 | 13.9%) represent the smallest median family size with 3.04 persons per family.
| Family Type | # Families | Family Size |
| Married-Couple | 21,758 (80.3%) | 3.15 |
| Single Male/Father | 1,562 (5.8%) | 3.11 |
| Single Female/Mother | 3,772 (13.9%) | 3.04 |
| Total Families | 27,092 (100.0%) | 3.13 |
Median Household Size in Limestone County
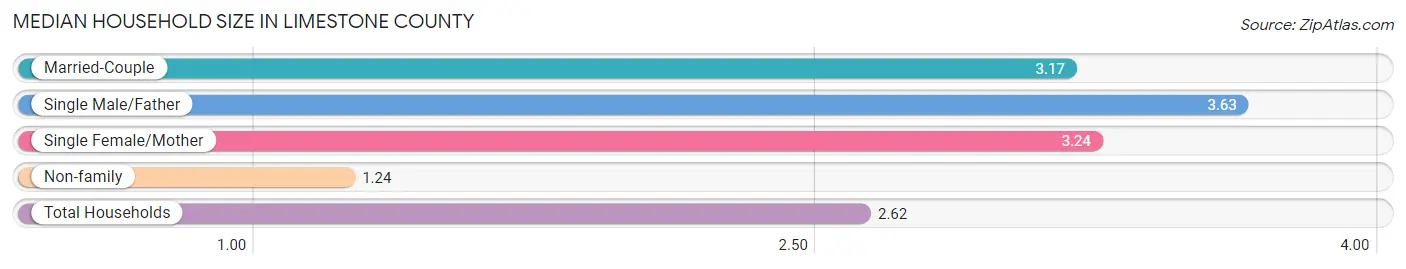
The median household size in Limestone County is 2.62 persons per household, with single male/father households (1,562 | 4.1%) accounting for the largest median household size of 3.63 persons per household. non-family households (11,480 | 29.8%) represent the smallest median household size with 1.24 persons per household.
| Household Type | # Households | Household Size |
| Married-Couple | 21,758 (56.4%) | 3.17 |
| Single Male/Father | 1,562 (4.1%) | 3.63 |
| Single Female/Mother | 3,772 (9.8%) | 3.24 |
| Non-family | 11,480 (29.8%) | 1.24 |
| Total Households | 38,572 (100.0%) | 2.62 |
Household Size by Marriage Status in Limestone County
Out of a total of 38,572 households in Limestone County, 27,092 (70.2%) are family households, while 11,480 (29.8%) are nonfamily households. The most numerous type of family households are 2-person households, comprising 12,102, and the most common type of nonfamily households are 1-person households, comprising 9,416.
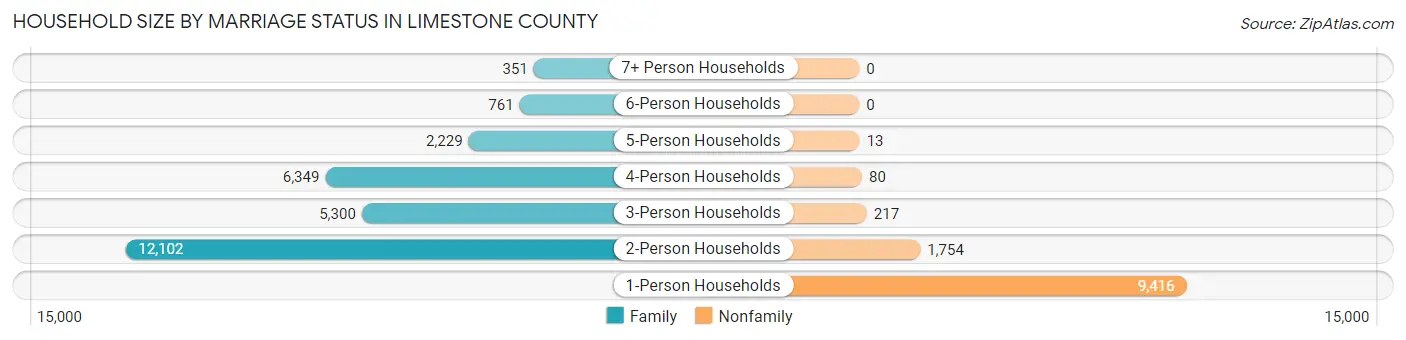
| Household Size | Family Households | Nonfamily Households |
| 1-Person Households | - | 9,416 (24.4%) |
| 2-Person Households | 12,102 (31.4%) | 1,754 (4.5%) |
| 3-Person Households | 5,300 (13.7%) | 217 (0.6%) |
| 4-Person Households | 6,349 (16.5%) | 80 (0.2%) |
| 5-Person Households | 2,229 (5.8%) | 13 (0.0%) |
| 6-Person Households | 761 (2.0%) | 0 (0.0%) |
| 7+ Person Households | 351 (0.9%) | 0 (0.0%) |
| Total | 27,092 (70.2%) | 11,480 (29.8%) |
Female Fertility in Limestone County
Fertility by Age in Limestone County
Average fertility rate in Limestone County is 38.0 births per 1,000 women. Women in the age bracket of 20 to 34 years have the highest fertility rate with 75.0 births per 1,000 women. Women in the age bracket of 20 to 34 years acount for 76.8% of all women with births.
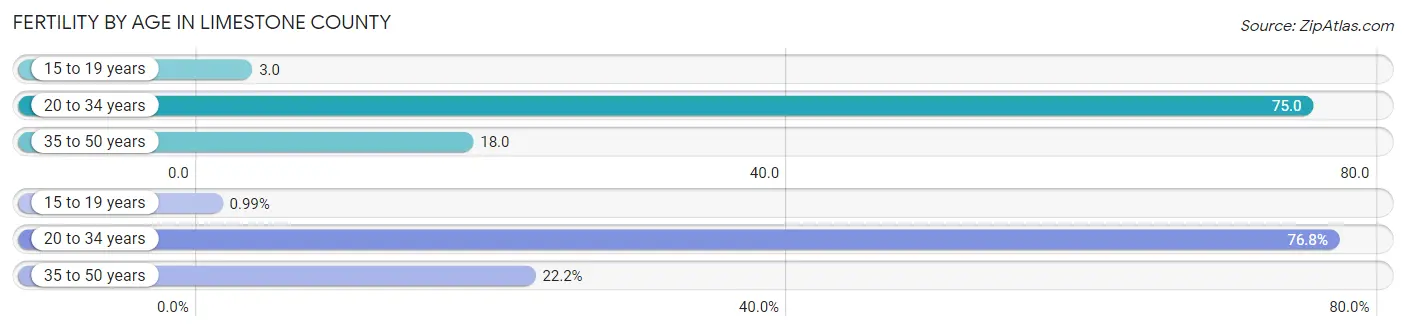
| Age Bracket | Women with Births | Births / 1,000 Women |
| 15 to 19 years | 9 (1.0%) | 3.0 |
| 20 to 34 years | 698 (76.8%) | 75.0 |
| 35 to 50 years | 202 (22.2%) | 18.0 |
| Total | 909 (100.0%) | 38.0 |
Fertility by Age by Marriage Status in Limestone County
87.3% of women with births (909) in Limestone County are married. The highest percentage of unmarried women with births falls into 15 to 19 years age bracket with 100.0% of them unmarried at the time of birth, while the lowest percentage of unmarried women with births belong to 20 to 34 years age bracket with 10.2% of them unmarried.
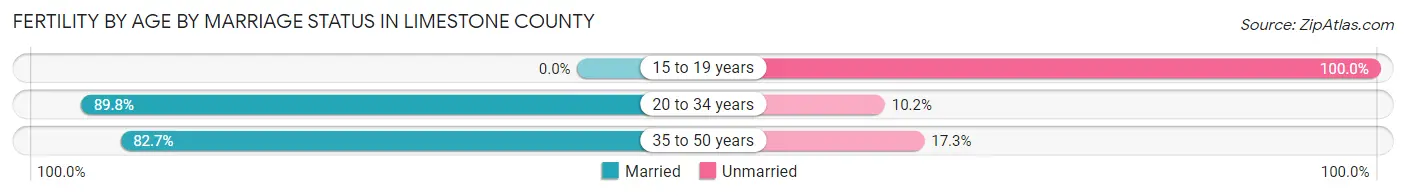
| Age Bracket | Married | Unmarried |
| 15 to 19 years | 0 (0.0%) | 9 (100.0%) |
| 20 to 34 years | 627 (89.8%) | 71 (10.2%) |
| 35 to 50 years | 167 (82.7%) | 35 (17.3%) |
| Total | 794 (87.4%) | 115 (12.7%) |
Fertility by Education in Limestone County
Average fertility rate in Limestone County is 38.0 births per 1,000 women. Women with the education attainment of bachelor's degree have the highest fertility rate of 69.0 births per 1,000 women, while women with the education attainment of less than high school have the lowest fertility at 23.0 births per 1,000 women. Women with the education attainment of bachelor's degree represent 36.5% of all women with births.
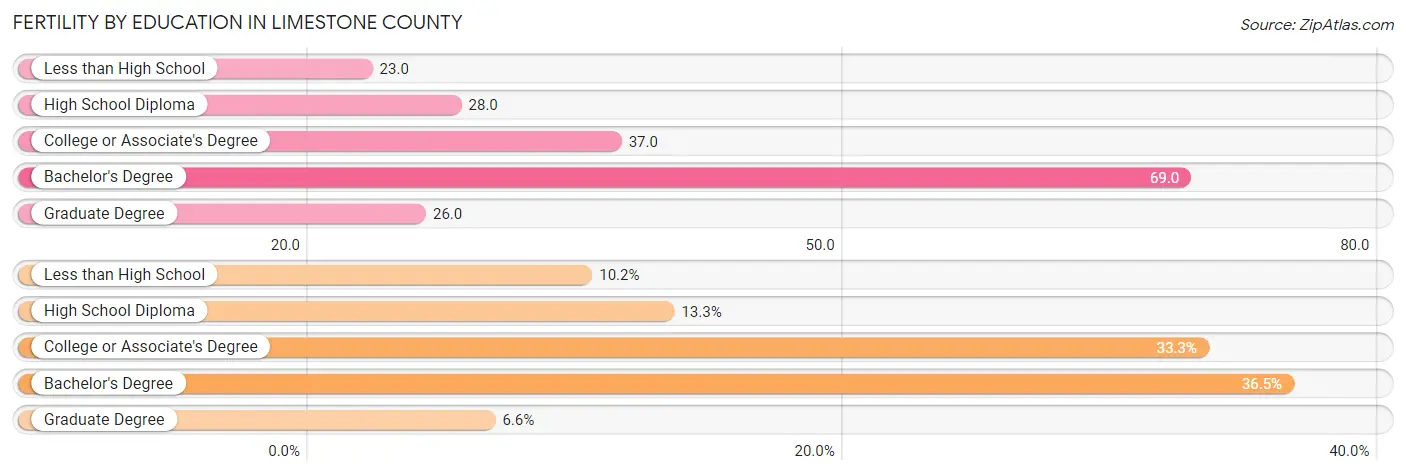
| Educational Attainment | Women with Births | Births / 1,000 Women |
| Less than High School | 93 (10.2%) | 23.0 |
| High School Diploma | 121 (13.3%) | 28.0 |
| College or Associate's Degree | 303 (33.3%) | 37.0 |
| Bachelor's Degree | 332 (36.5%) | 69.0 |
| Graduate Degree | 60 (6.6%) | 26.0 |
| Total | 909 (100.0%) | 38.0 |
Fertility by Education by Marriage Status in Limestone County
12.7% of women with births in Limestone County are unmarried. Women with the educational attainment of graduate degree are most likely to be married with 100.0% of them married at childbirth, while women with the educational attainment of high school diploma are least likely to be married with 38.8% of them unmarried at childbirth.
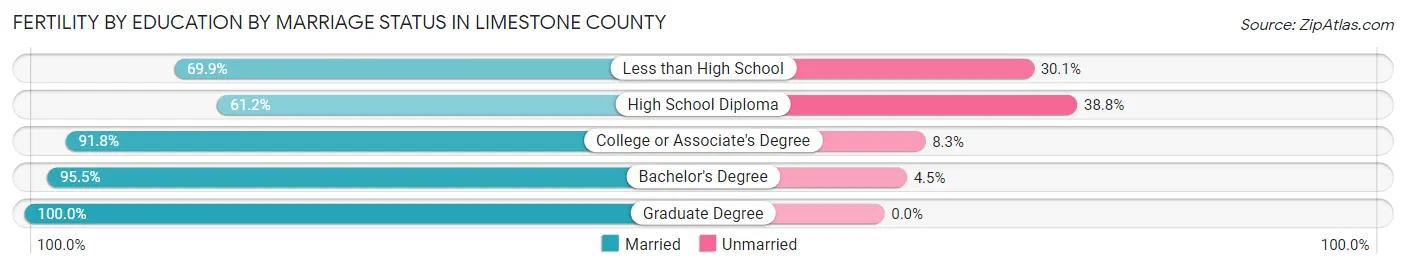
| Educational Attainment | Married | Unmarried |
| Less than High School | 65 (69.9%) | 28 (30.1%) |
| High School Diploma | 74 (61.2%) | 47 (38.8%) |
| College or Associate's Degree | 278 (91.7%) | 25 (8.3%) |
| Bachelor's Degree | 317 (95.5%) | 15 (4.5%) |
| Graduate Degree | 60 (100.0%) | 0 (0.0%) |
| Total | 794 (87.4%) | 115 (12.7%) |
Employment Characteristics in Limestone County
Employment by Class of Employer in Limestone County
Among the 47,315 employed individuals in Limestone County, private company employees (31,910 | 67.4%), local government employees (2,952 | 6.2%), and not-for-profit organizations (2,907 | 6.1%) make up the most common classes of employment.
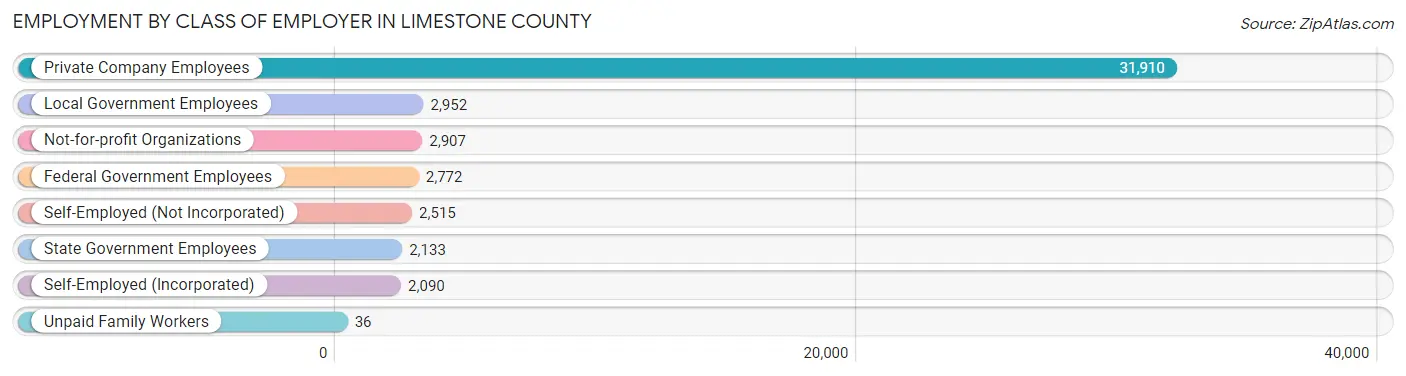
| Employer Class | # Employees | % Employees |
| Private Company Employees | 31,910 | 67.4% |
| Self-Employed (Incorporated) | 2,090 | 4.4% |
| Self-Employed (Not Incorporated) | 2,515 | 5.3% |
| Not-for-profit Organizations | 2,907 | 6.1% |
| Local Government Employees | 2,952 | 6.2% |
| State Government Employees | 2,133 | 4.5% |
| Federal Government Employees | 2,772 | 5.9% |
| Unpaid Family Workers | 36 | 0.1% |
| Total | 47,315 | 100.0% |
Employment Status by Age in Limestone County
According to the labor force statistics for Limestone County, out of the total population over 16 years of age (84,173), 59.7% or 50,251 individuals are in the labor force, with 4.1% or 2,060 of them unemployed. The age group with the highest labor force participation rate is 20 to 24 years, with 80.6% or 4,718 individuals in the labor force. Within the labor force, the 16 to 19 years age range has the highest percentage of unemployed individuals, with 16.1% or 303 of them being unemployed.
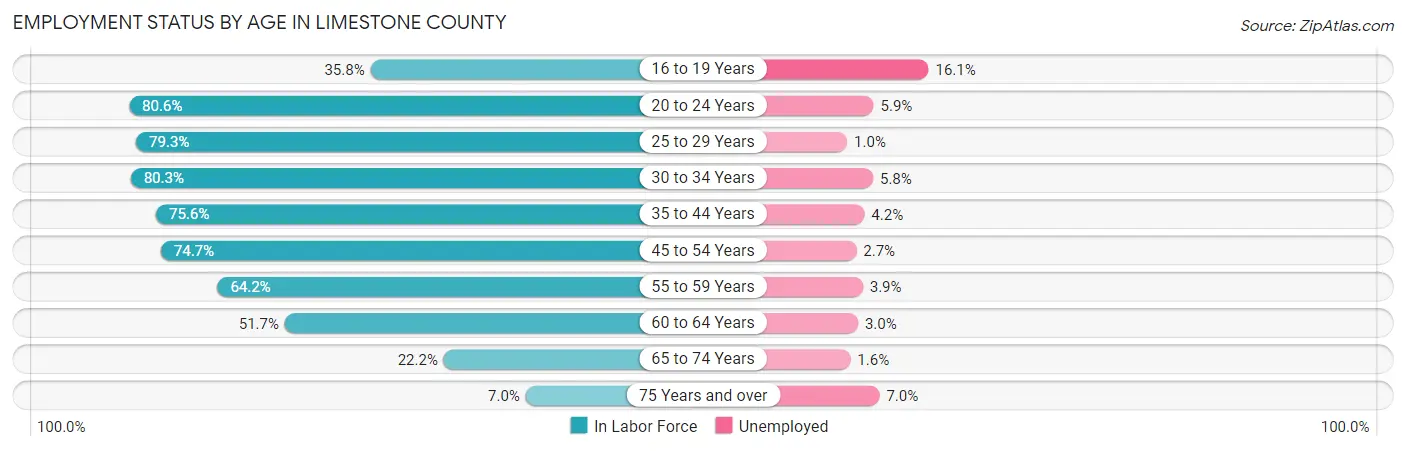
| Age Bracket | In Labor Force | Unemployed |
| 16 to 19 Years | 1,881 (35.8%) | 303 (16.1%) |
| 20 to 24 Years | 4,718 (80.6%) | 278 (5.9%) |
| 25 to 29 Years | 5,194 (79.3%) | 52 (1.0%) |
| 30 to 34 Years | 5,661 (80.3%) | 328 (5.8%) |
| 35 to 44 Years | 11,097 (75.6%) | 466 (4.2%) |
| 45 to 54 Years | 10,767 (74.7%) | 291 (2.7%) |
| 55 to 59 Years | 4,615 (64.2%) | 180 (3.9%) |
| 60 to 64 Years | 3,704 (51.7%) | 111 (3.0%) |
| 65 to 74 Years | 2,144 (22.2%) | 34 (1.6%) |
| 75 Years and over | 445 (7.0%) | 31 (7.0%) |
| Total | 50,251 (59.7%) | 2,060 (4.1%) |
Employment Status by Educational Attainment in Limestone County
According to labor force statistics for Limestone County, 71.9% of individuals (41,015) out of the total population between 25 and 64 years of age (57,044) are in the labor force, with 3.5% or 1,436 of them being unemployed. The group with the highest labor force participation rate are those with the educational attainment of bachelor's degree or higher, with 85.1% or 14,938 individuals in the labor force. Within the labor force, individuals with less than high school education have the highest percentage of unemployment, with 8.0% or 250 of them being unemployed.
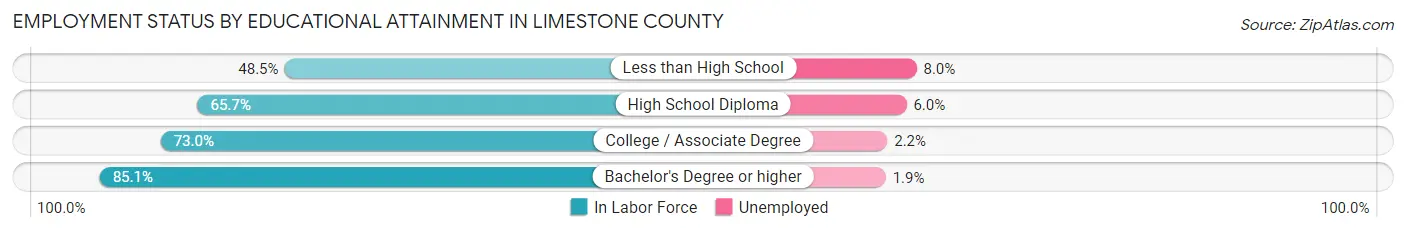
| Educational Attainment | In Labor Force | Unemployed |
| Less than High School | 3,122 (48.5%) | 515 (8.0%) |
| High School Diploma | 10,285 (65.7%) | 939 (6.0%) |
| College / Associate Degree | 12,702 (73.0%) | 383 (2.2%) |
| Bachelor's Degree or higher | 14,938 (85.1%) | 334 (1.9%) |
| Total | 41,015 (71.9%) | 1,997 (3.5%) |
Employment Occupations by Sex in Limestone County
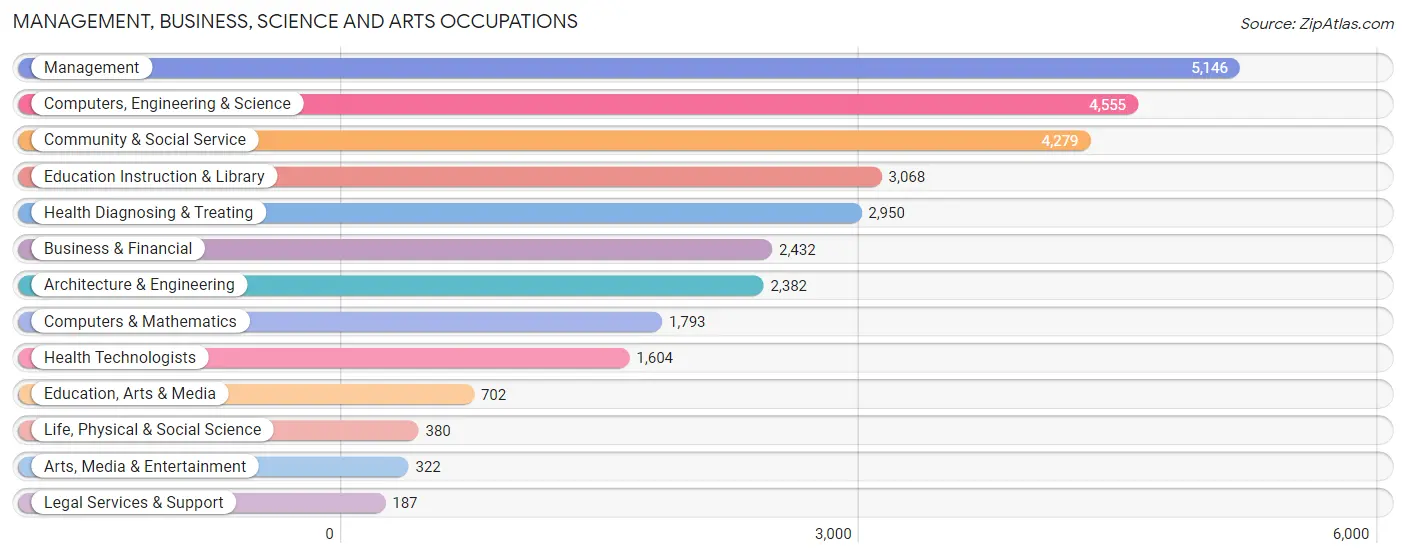
Management, Business, Science and Arts Occupations
The most common Management, Business, Science and Arts occupations in Limestone County are Management (5,146 | 10.7%), Computers, Engineering & Science (4,555 | 9.5%), Community & Social Service (4,279 | 8.9%), Education Instruction & Library (3,068 | 6.4%), and Health Diagnosing & Treating (2,950 | 6.1%).
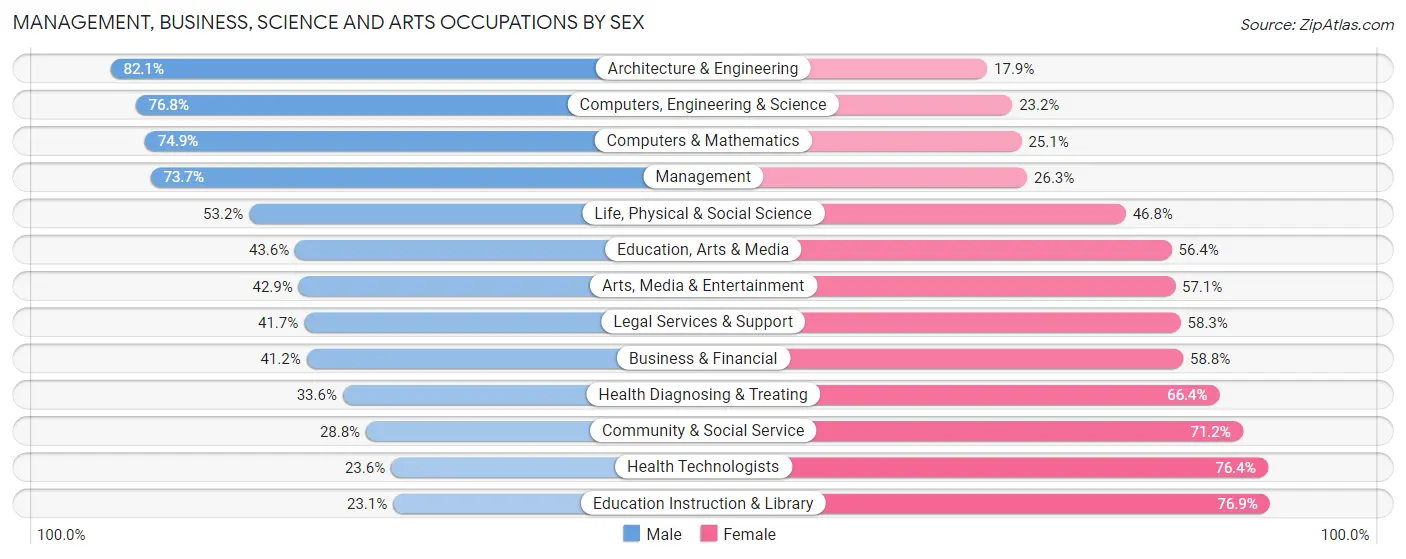
Management, Business, Science and Arts Occupations by Sex
Within the Management, Business, Science and Arts occupations in Limestone County, the most male-oriented occupations are Architecture & Engineering (82.1%), Computers, Engineering & Science (76.8%), and Computers & Mathematics (74.9%), while the most female-oriented occupations are Education Instruction & Library (76.9%), Health Technologists (76.4%), and Community & Social Service (71.2%).
| Occupation | Male | Female |
| Management | 3,794 (73.7%) | 1,352 (26.3%) |
| Business & Financial | 1,002 (41.2%) | 1,430 (58.8%) |
| Computers, Engineering & Science | 3,500 (76.8%) | 1,055 (23.2%) |
| Computers & Mathematics | 1,343 (74.9%) | 450 (25.1%) |
| Architecture & Engineering | 1,955 (82.1%) | 427 (17.9%) |
| Life, Physical & Social Science | 202 (53.2%) | 178 (46.8%) |
| Community & Social Service | 1,232 (28.8%) | 3,047 (71.2%) |
| Education, Arts & Media | 306 (43.6%) | 396 (56.4%) |
| Legal Services & Support | 78 (41.7%) | 109 (58.3%) |
| Education Instruction & Library | 710 (23.1%) | 2,358 (76.9%) |
| Arts, Media & Entertainment | 138 (42.9%) | 184 (57.1%) |
| Health Diagnosing & Treating | 992 (33.6%) | 1,958 (66.4%) |
| Health Technologists | 378 (23.6%) | 1,226 (76.4%) |
| Total (Category) | 10,520 (54.3%) | 8,842 (45.7%) |
| Total (Overall) | 27,844 (57.9%) | 20,246 (42.1%) |
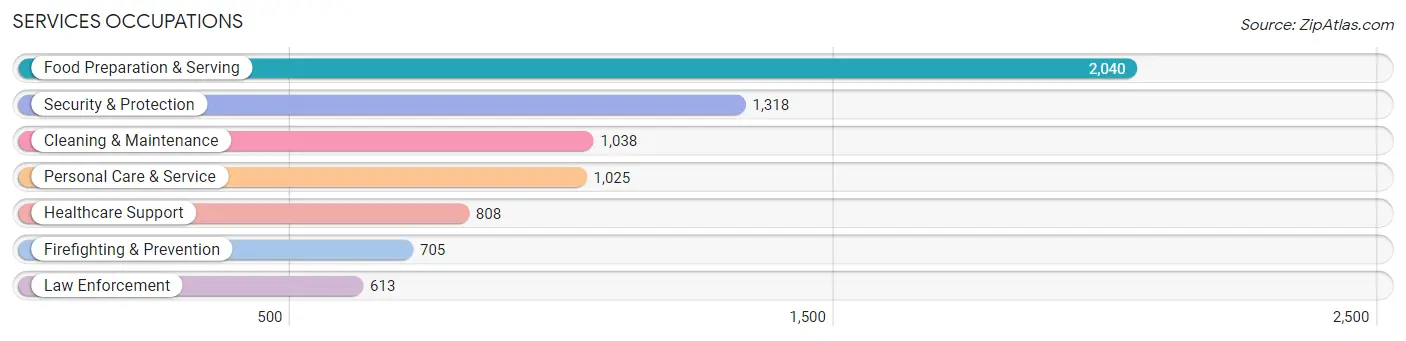
Services Occupations
The most common Services occupations in Limestone County are Food Preparation & Serving (2,040 | 4.2%), Security & Protection (1,318 | 2.7%), Cleaning & Maintenance (1,038 | 2.2%), Personal Care & Service (1,025 | 2.1%), and Healthcare Support (808 | 1.7%).
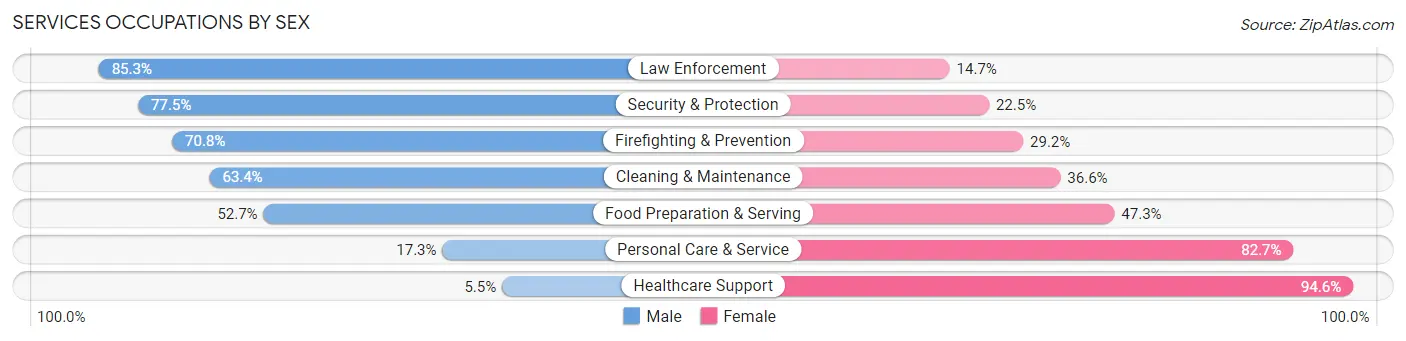
Services Occupations by Sex
Within the Services occupations in Limestone County, the most male-oriented occupations are Law Enforcement (85.3%), Security & Protection (77.5%), and Firefighting & Prevention (70.8%), while the most female-oriented occupations are Healthcare Support (94.6%), Personal Care & Service (82.7%), and Food Preparation & Serving (47.3%).
| Occupation | Male | Female |
| Healthcare Support | 44 (5.4%) | 764 (94.6%) |
| Security & Protection | 1,022 (77.5%) | 296 (22.5%) |
| Firefighting & Prevention | 499 (70.8%) | 206 (29.2%) |
| Law Enforcement | 523 (85.3%) | 90 (14.7%) |
| Food Preparation & Serving | 1,075 (52.7%) | 965 (47.3%) |
| Cleaning & Maintenance | 658 (63.4%) | 380 (36.6%) |
| Personal Care & Service | 177 (17.3%) | 848 (82.7%) |
| Total (Category) | 2,976 (47.8%) | 3,253 (52.2%) |
| Total (Overall) | 27,844 (57.9%) | 20,246 (42.1%) |
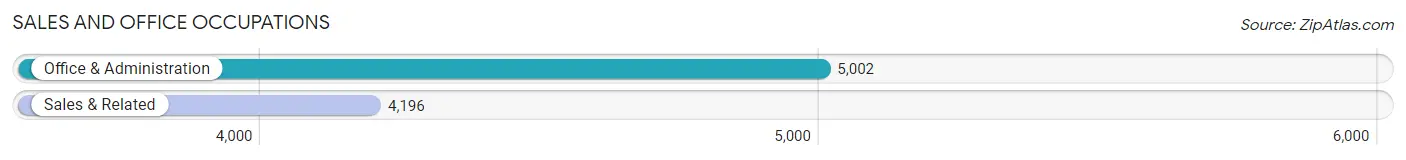
Sales and Office Occupations
The most common Sales and Office occupations in Limestone County are Office & Administration (5,002 | 10.4%), and Sales & Related (4,196 | 8.7%).
Sales and Office Occupations by Sex
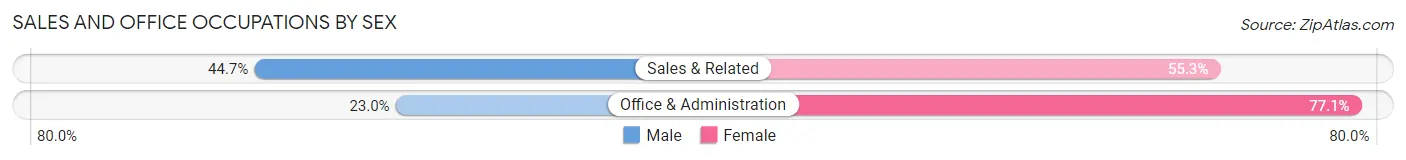
| Occupation | Male | Female |
| Sales & Related | 1,875 (44.7%) | 2,321 (55.3%) |
| Office & Administration | 1,148 (23.0%) | 3,854 (77.0%) |
| Total (Category) | 3,023 (32.9%) | 6,175 (67.1%) |
| Total (Overall) | 27,844 (57.9%) | 20,246 (42.1%) |
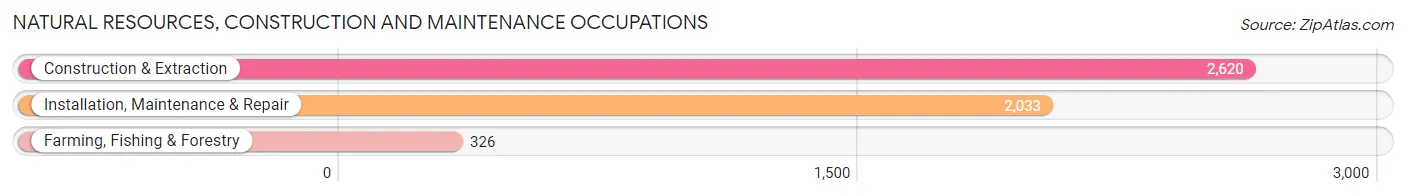
Natural Resources, Construction and Maintenance Occupations
The most common Natural Resources, Construction and Maintenance occupations in Limestone County are Construction & Extraction (2,620 | 5.4%), Installation, Maintenance & Repair (2,033 | 4.2%), and Farming, Fishing & Forestry (326 | 0.7%).
Natural Resources, Construction and Maintenance Occupations by Sex
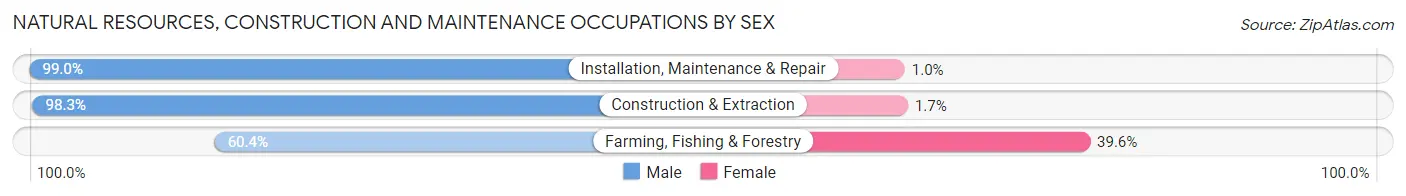
| Occupation | Male | Female |
| Farming, Fishing & Forestry | 197 (60.4%) | 129 (39.6%) |
| Construction & Extraction | 2,576 (98.3%) | 44 (1.7%) |
| Installation, Maintenance & Repair | 2,012 (99.0%) | 21 (1.0%) |
| Total (Category) | 4,785 (96.1%) | 194 (3.9%) |
| Total (Overall) | 27,844 (57.9%) | 20,246 (42.1%) |
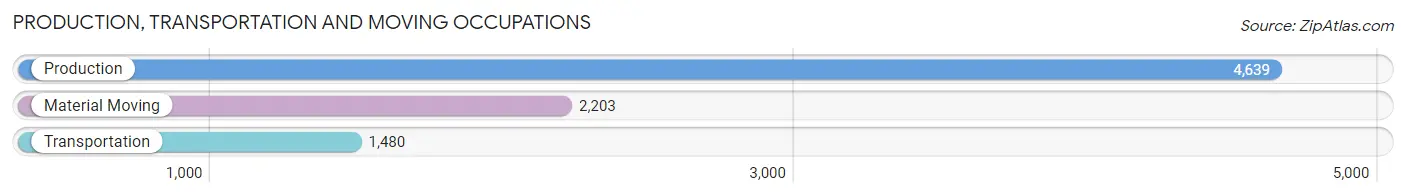
Production, Transportation and Moving Occupations
The most common Production, Transportation and Moving occupations in Limestone County are Production (4,639 | 9.7%), Material Moving (2,203 | 4.6%), and Transportation (1,480 | 3.1%).
Production, Transportation and Moving Occupations by Sex
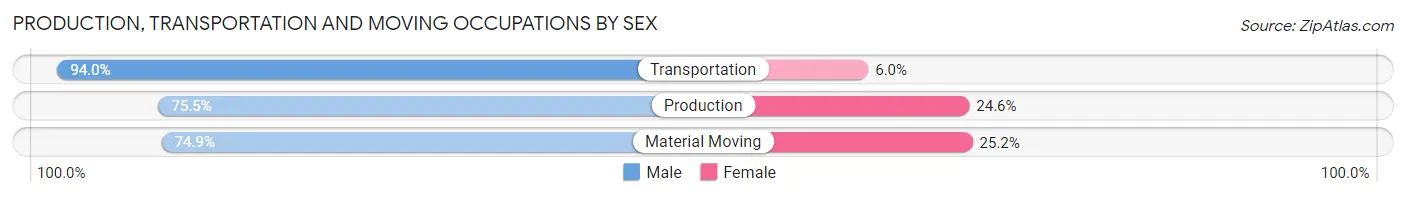
| Occupation | Male | Female |
| Production | 3,500 (75.4%) | 1,139 (24.5%) |
| Transportation | 1,391 (94.0%) | 89 (6.0%) |
| Material Moving | 1,649 (74.9%) | 554 (25.2%) |
| Total (Category) | 6,540 (78.6%) | 1,782 (21.4%) |
| Total (Overall) | 27,844 (57.9%) | 20,246 (42.1%) |
Employment Industries by Sex in Limestone County
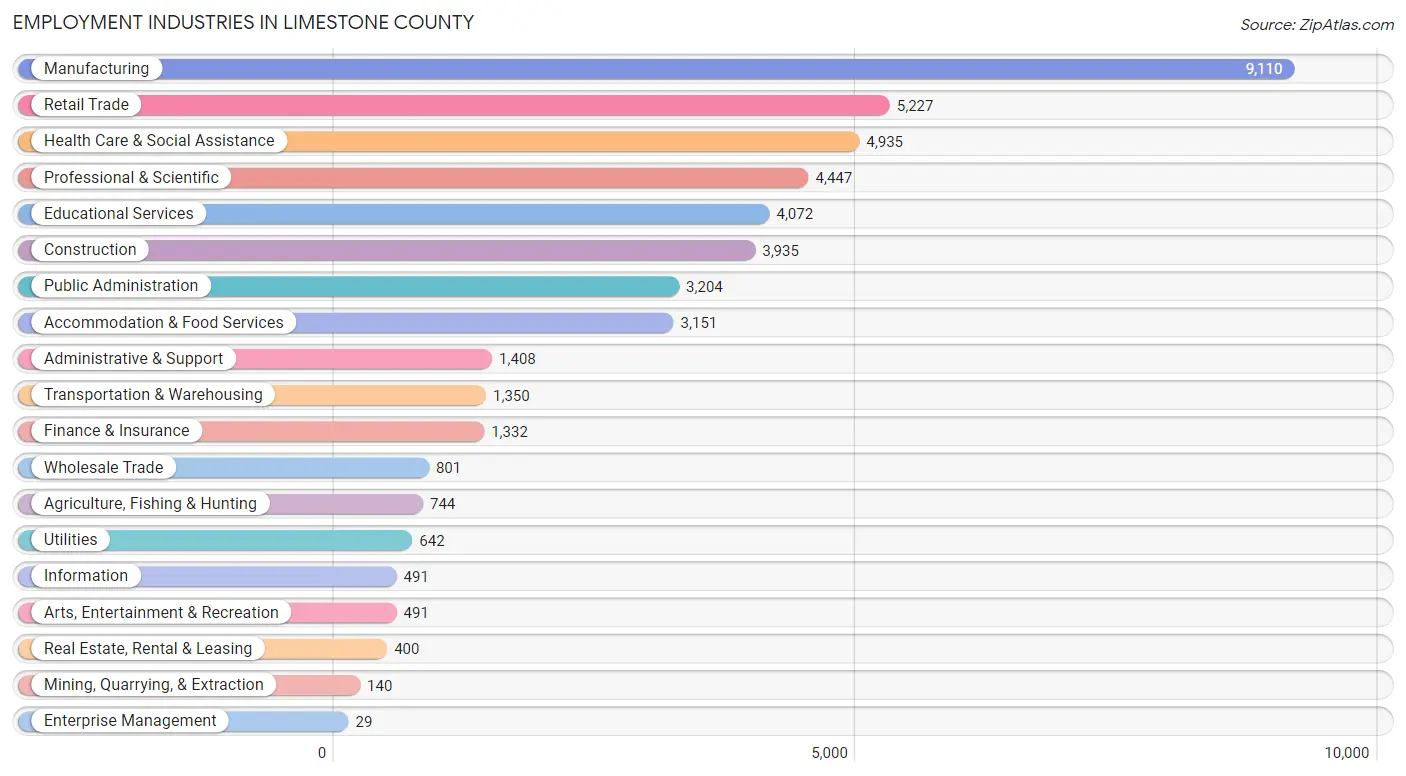
Employment Industries in Limestone County
The major employment industries in Limestone County include Manufacturing (9,110 | 18.9%), Retail Trade (5,227 | 10.9%), Health Care & Social Assistance (4,935 | 10.3%), Professional & Scientific (4,447 | 9.2%), and Educational Services (4,072 | 8.5%).
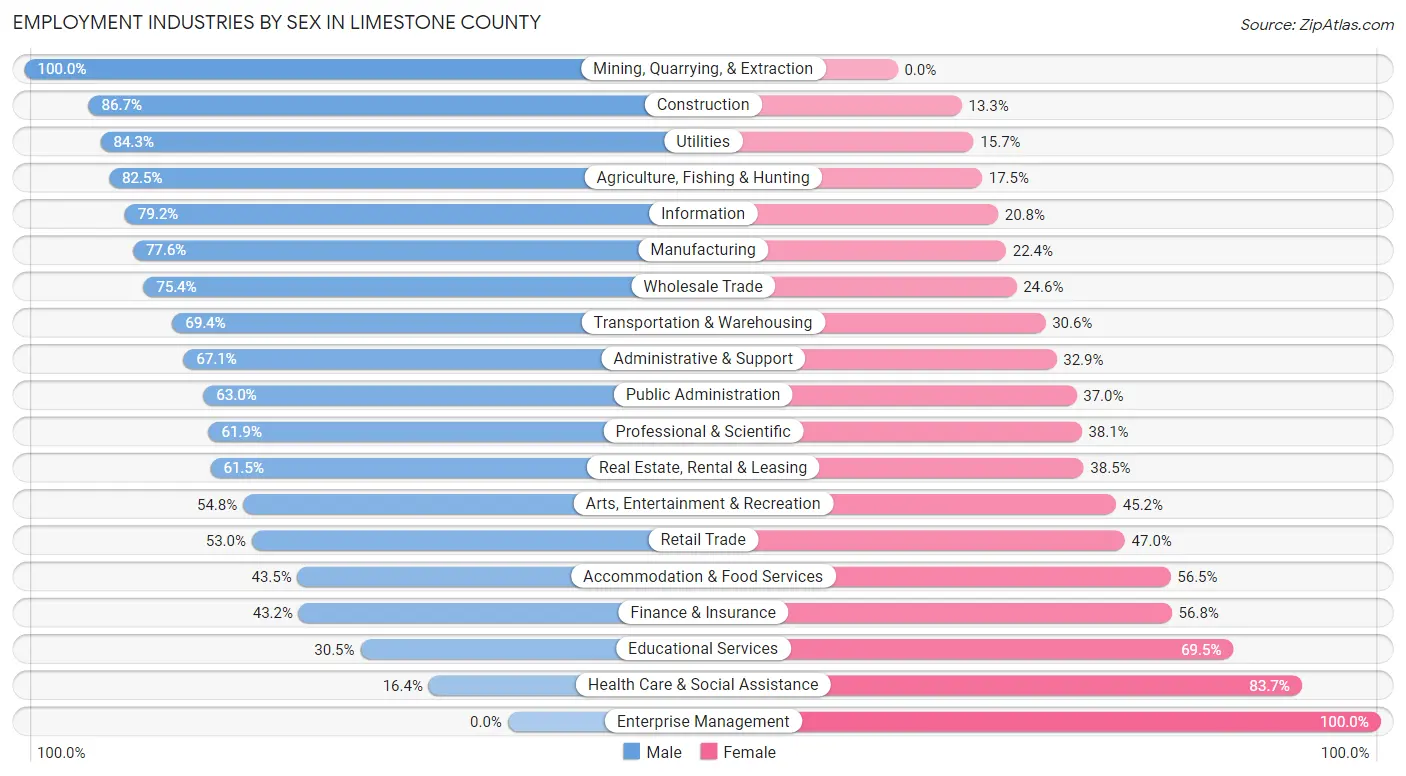
Employment Industries by Sex in Limestone County
The Limestone County industries that see more men than women are Mining, Quarrying, & Extraction (100.0%), Construction (86.7%), and Utilities (84.3%), whereas the industries that tend to have a higher number of women are Enterprise Management (100.0%), Health Care & Social Assistance (83.7%), and Educational Services (69.5%).
| Industry | Male | Female |
| Agriculture, Fishing & Hunting | 614 (82.5%) | 130 (17.5%) |
| Mining, Quarrying, & Extraction | 140 (100.0%) | 0 (0.0%) |
| Construction | 3,413 (86.7%) | 522 (13.3%) |
| Manufacturing | 7,067 (77.6%) | 2,043 (22.4%) |
| Wholesale Trade | 604 (75.4%) | 197 (24.6%) |
| Retail Trade | 2,769 (53.0%) | 2,458 (47.0%) |
| Transportation & Warehousing | 937 (69.4%) | 413 (30.6%) |
| Utilities | 541 (84.3%) | 101 (15.7%) |
| Information | 389 (79.2%) | 102 (20.8%) |
| Finance & Insurance | 576 (43.2%) | 756 (56.8%) |
| Real Estate, Rental & Leasing | 246 (61.5%) | 154 (38.5%) |
| Professional & Scientific | 2,753 (61.9%) | 1,694 (38.1%) |
| Enterprise Management | 0 (0.0%) | 29 (100.0%) |
| Administrative & Support | 945 (67.1%) | 463 (32.9%) |
| Educational Services | 1,242 (30.5%) | 2,830 (69.5%) |
| Health Care & Social Assistance | 807 (16.4%) | 4,128 (83.7%) |
| Arts, Entertainment & Recreation | 269 (54.8%) | 222 (45.2%) |
| Accommodation & Food Services | 1,371 (43.5%) | 1,780 (56.5%) |
| Public Administration | 2,018 (63.0%) | 1,186 (37.0%) |
| Total | 27,844 (57.9%) | 20,246 (42.1%) |
Education in Limestone County
School Enrollment in Limestone County
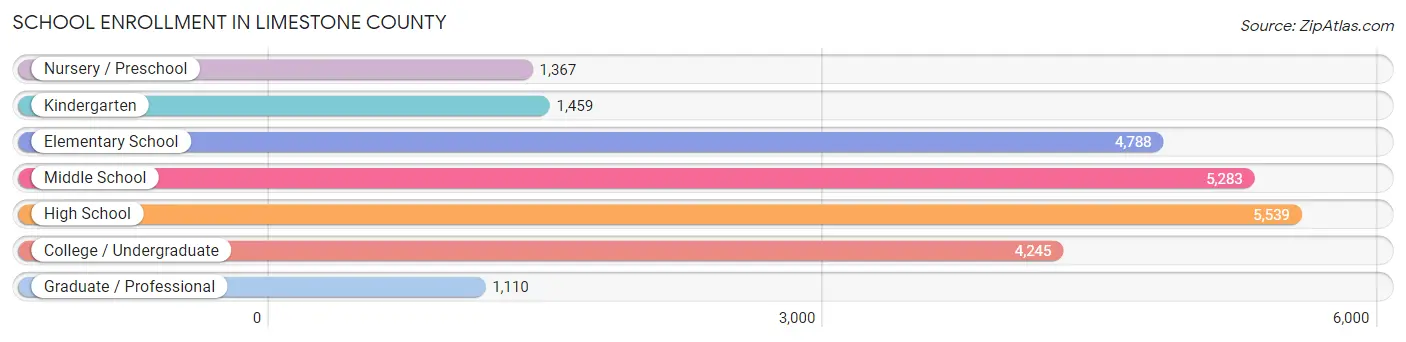
The most common levels of schooling among the 23,791 students in Limestone County are high school (5,539 | 23.3%), middle school (5,283 | 22.2%), and elementary school (4,788 | 20.1%).
| School Level | # Students | % Students |
| Nursery / Preschool | 1,367 | 5.8% |
| Kindergarten | 1,459 | 6.1% |
| Elementary School | 4,788 | 20.1% |
| Middle School | 5,283 | 22.2% |
| High School | 5,539 | 23.3% |
| College / Undergraduate | 4,245 | 17.8% |
| Graduate / Professional | 1,110 | 4.7% |
| Total | 23,791 | 100.0% |
School Enrollment by Age by Funding Source in Limestone County
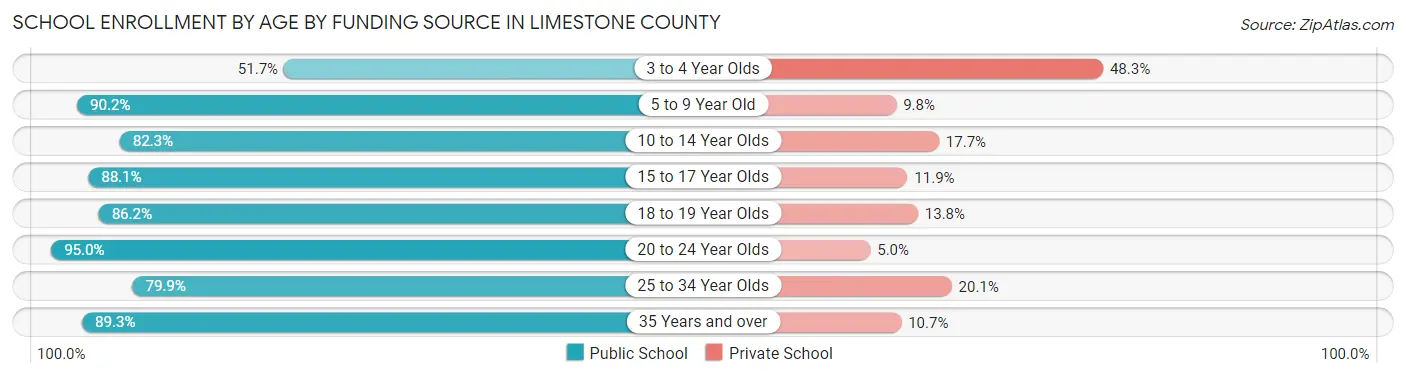
Out of a total of 23,791 students who are enrolled in schools in Limestone County, 3,473 (14.6%) attend a private institution, while the remaining 20,318 (85.4%) are enrolled in public schools. The age group of 3 to 4 year olds has the highest likelihood of being enrolled in private schools, with 539 (48.3% in the age bracket) enrolled. Conversely, the age group of 20 to 24 year olds has the lowest likelihood of being enrolled in a private school, with 2,014 (95.0% in the age bracket) attending a public institution.
| Age Bracket | Public School | Private School |
| 3 to 4 Year Olds | 577 (51.7%) | 539 (48.3%) |
| 5 to 9 Year Old | 5,245 (90.2%) | 569 (9.8%) |
| 10 to 14 Year Olds | 5,380 (82.3%) | 1,160 (17.7%) |
| 15 to 17 Year Olds | 3,506 (88.1%) | 472 (11.9%) |
| 18 to 19 Year Olds | 1,278 (86.2%) | 205 (13.8%) |
| 20 to 24 Year Olds | 2,014 (95.0%) | 105 (5.0%) |
| 25 to 34 Year Olds | 1,124 (79.9%) | 283 (20.1%) |
| 35 Years and over | 1,191 (89.3%) | 143 (10.7%) |
| Total | 20,318 (85.4%) | 3,473 (14.6%) |
Educational Attainment by Field of Study in Limestone County
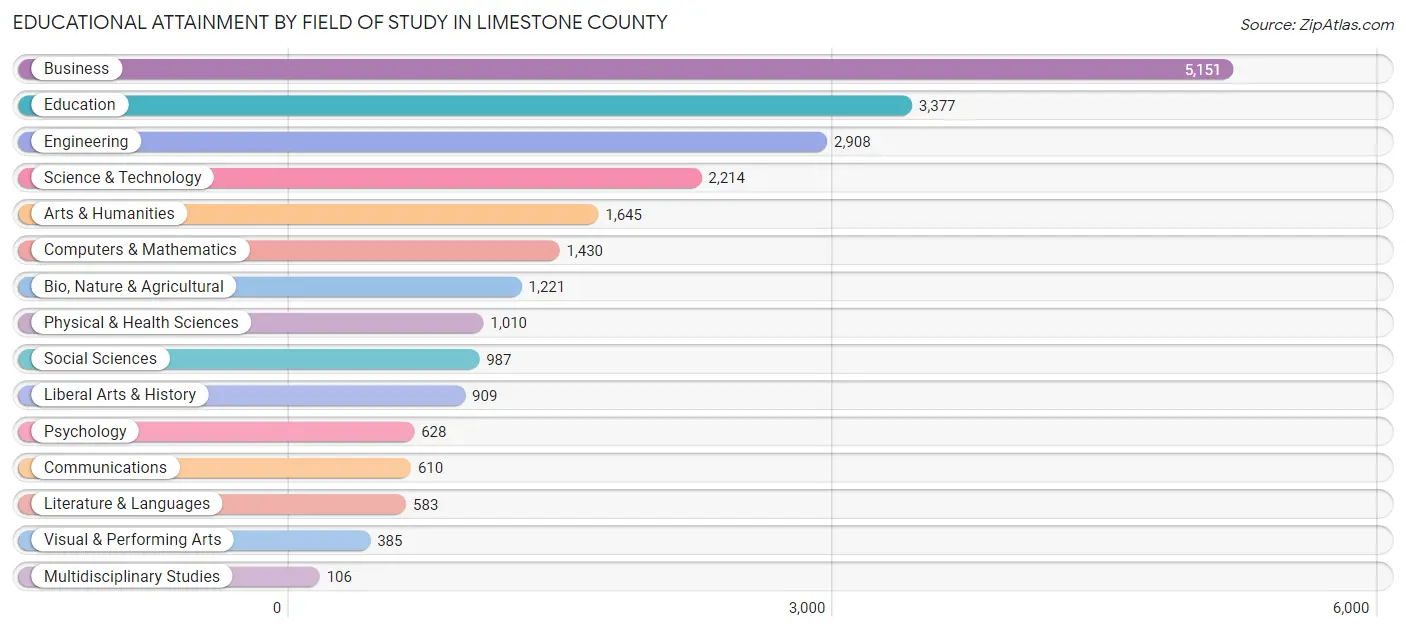
Business (5,151 | 22.2%), education (3,377 | 14.6%), engineering (2,908 | 12.6%), science & technology (2,214 | 9.6%), and arts & humanities (1,645 | 7.1%) are the most common fields of study among 23,164 individuals in Limestone County who have obtained a bachelor's degree or higher.
| Field of Study | # Graduates | % Graduates |
| Computers & Mathematics | 1,430 | 6.2% |
| Bio, Nature & Agricultural | 1,221 | 5.3% |
| Physical & Health Sciences | 1,010 | 4.4% |
| Psychology | 628 | 2.7% |
| Social Sciences | 987 | 4.3% |
| Engineering | 2,908 | 12.6% |
| Multidisciplinary Studies | 106 | 0.5% |
| Science & Technology | 2,214 | 9.6% |
| Business | 5,151 | 22.2% |
| Education | 3,377 | 14.6% |
| Literature & Languages | 583 | 2.5% |
| Liberal Arts & History | 909 | 3.9% |
| Visual & Performing Arts | 385 | 1.7% |
| Communications | 610 | 2.6% |
| Arts & Humanities | 1,645 | 7.1% |
| Total | 23,164 | 100.0% |
Transportation & Commute in Limestone County
Vehicle Availability by Sex in Limestone County
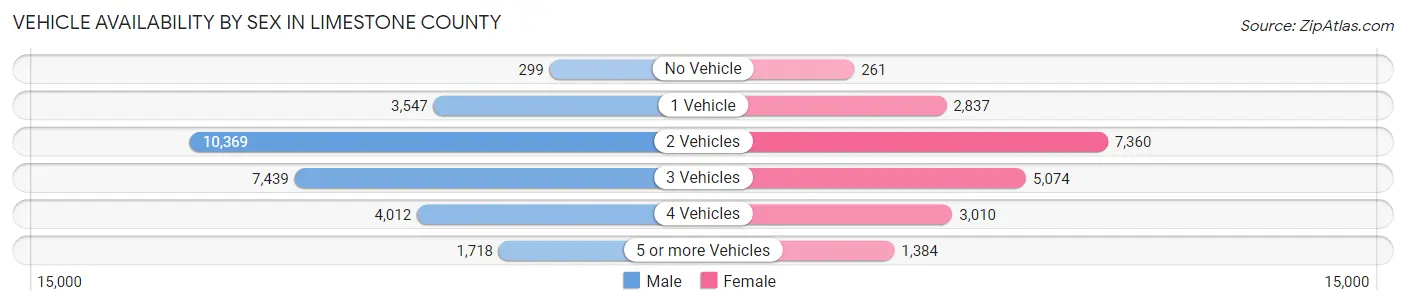
The most prevalent vehicle ownership categories in Limestone County are males with 2 vehicles (10,369, accounting for 37.9%) and females with 2 vehicles (7,360, making up 52.0%).
| Vehicles Available | Male | Female |
| No Vehicle | 299 (1.1%) | 261 (1.3%) |
| 1 Vehicle | 3,547 (13.0%) | 2,837 (14.2%) |
| 2 Vehicles | 10,369 (37.9%) | 7,360 (36.9%) |
| 3 Vehicles | 7,439 (27.2%) | 5,074 (25.5%) |
| 4 Vehicles | 4,012 (14.6%) | 3,010 (15.1%) |
| 5 or more Vehicles | 1,718 (6.3%) | 1,384 (7.0%) |
| Total | 27,384 (100.0%) | 19,926 (100.0%) |
Commute Time in Limestone County
The most frequently occuring commute durations in Limestone County are 20 to 24 minutes (7,042 commuters, 16.2%), 30 to 34 minutes (7,037 commuters, 16.1%), and 15 to 19 minutes (6,070 commuters, 13.9%).
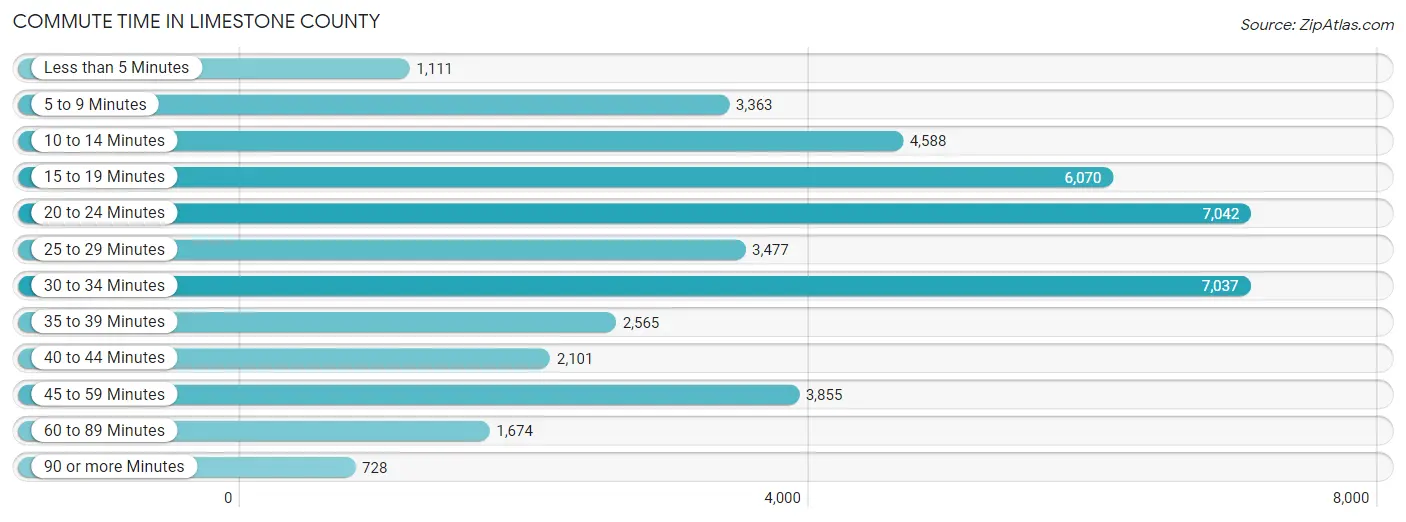
| Commute Time | # Commuters | % Commuters |
| Less than 5 Minutes | 1,111 | 2.5% |
| 5 to 9 Minutes | 3,363 | 7.7% |
| 10 to 14 Minutes | 4,588 | 10.5% |
| 15 to 19 Minutes | 6,070 | 13.9% |
| 20 to 24 Minutes | 7,042 | 16.2% |
| 25 to 29 Minutes | 3,477 | 8.0% |
| 30 to 34 Minutes | 7,037 | 16.1% |
| 35 to 39 Minutes | 2,565 | 5.9% |
| 40 to 44 Minutes | 2,101 | 4.8% |
| 45 to 59 Minutes | 3,855 | 8.8% |
| 60 to 89 Minutes | 1,674 | 3.8% |
| 90 or more Minutes | 728 | 1.7% |
Commute Time by Sex in Limestone County
The most common commute times in Limestone County are 30 to 34 minutes (4,556 commuters, 18.0%) for males and 20 to 24 minutes (3,468 commuters, 19.0%) for females.
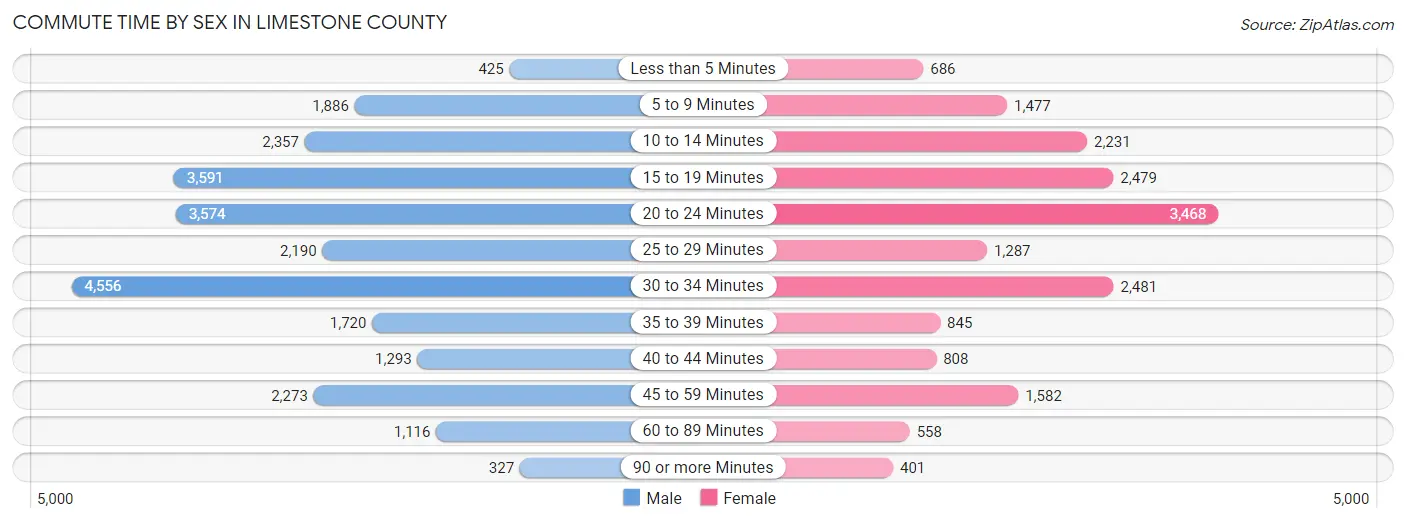
| Commute Time | Male | Female |
| Less than 5 Minutes | 425 (1.7%) | 686 (3.7%) |
| 5 to 9 Minutes | 1,886 (7.4%) | 1,477 (8.1%) |
| 10 to 14 Minutes | 2,357 (9.3%) | 2,231 (12.2%) |
| 15 to 19 Minutes | 3,591 (14.2%) | 2,479 (13.5%) |
| 20 to 24 Minutes | 3,574 (14.1%) | 3,468 (19.0%) |
| 25 to 29 Minutes | 2,190 (8.6%) | 1,287 (7.0%) |
| 30 to 34 Minutes | 4,556 (18.0%) | 2,481 (13.6%) |
| 35 to 39 Minutes | 1,720 (6.8%) | 845 (4.6%) |
| 40 to 44 Minutes | 1,293 (5.1%) | 808 (4.4%) |
| 45 to 59 Minutes | 2,273 (9.0%) | 1,582 (8.6%) |
| 60 to 89 Minutes | 1,116 (4.4%) | 558 (3.0%) |
| 90 or more Minutes | 327 (1.3%) | 401 (2.2%) |
Time of Departure to Work by Sex in Limestone County
The most frequent times of departure to work in Limestone County are 7:00 AM to 7:29 AM (3,871, 15.3%) for males and 7:00 AM to 7:29 AM (3,385, 18.5%) for females.
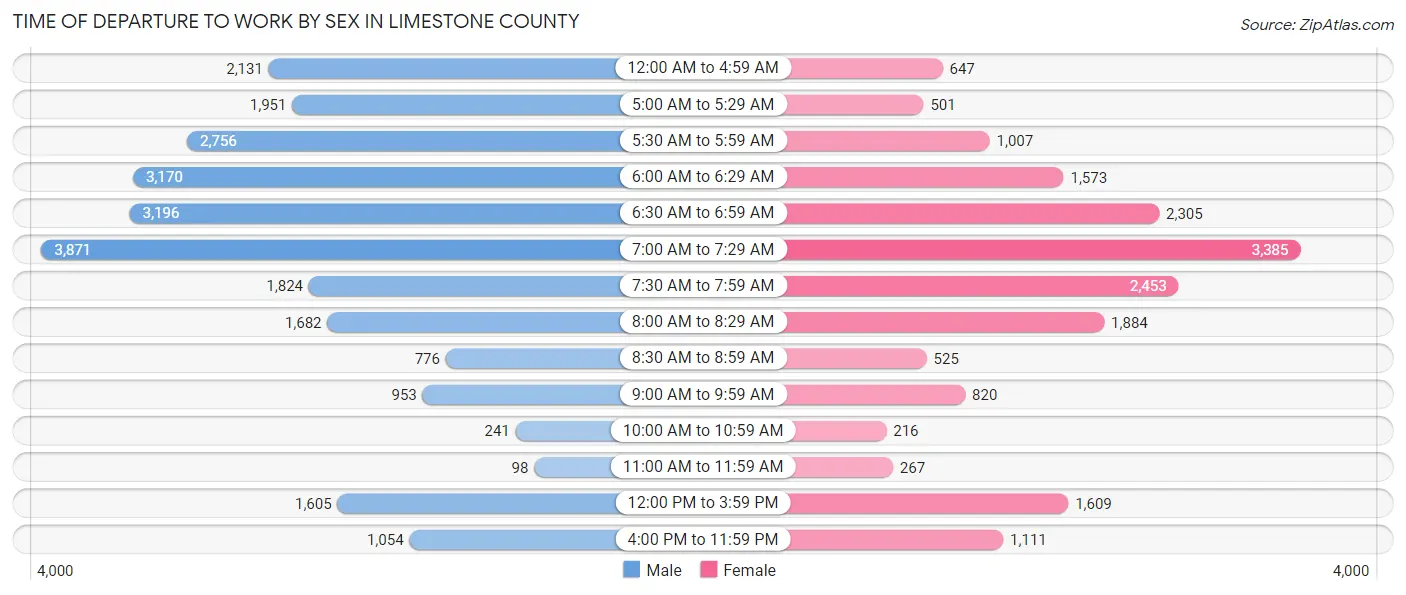
| Time of Departure | Male | Female |
| 12:00 AM to 4:59 AM | 2,131 (8.4%) | 647 (3.5%) |
| 5:00 AM to 5:29 AM | 1,951 (7.7%) | 501 (2.7%) |
| 5:30 AM to 5:59 AM | 2,756 (10.9%) | 1,007 (5.5%) |
| 6:00 AM to 6:29 AM | 3,170 (12.5%) | 1,573 (8.6%) |
| 6:30 AM to 6:59 AM | 3,196 (12.6%) | 2,305 (12.6%) |
| 7:00 AM to 7:29 AM | 3,871 (15.3%) | 3,385 (18.5%) |
| 7:30 AM to 7:59 AM | 1,824 (7.2%) | 2,453 (13.4%) |
| 8:00 AM to 8:29 AM | 1,682 (6.7%) | 1,884 (10.3%) |
| 8:30 AM to 8:59 AM | 776 (3.1%) | 525 (2.9%) |
| 9:00 AM to 9:59 AM | 953 (3.8%) | 820 (4.5%) |
| 10:00 AM to 10:59 AM | 241 (0.9%) | 216 (1.2%) |
| 11:00 AM to 11:59 AM | 98 (0.4%) | 267 (1.5%) |
| 12:00 PM to 3:59 PM | 1,605 (6.3%) | 1,609 (8.8%) |
| 4:00 PM to 11:59 PM | 1,054 (4.2%) | 1,111 (6.1%) |
| Total | 25,308 (100.0%) | 18,303 (100.0%) |
Housing Occupancy in Limestone County
Occupancy by Ownership in Limestone County
Of the total 38,572 dwellings in Limestone County, owner-occupied units account for 29,968 (77.7%), while renter-occupied units make up 8,604 (22.3%).
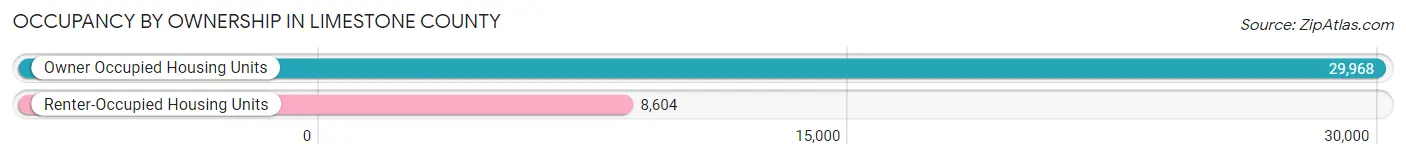
| Occupancy | # Housing Units | % Housing Units |
| Owner Occupied Housing Units | 29,968 | 77.7% |
| Renter-Occupied Housing Units | 8,604 | 22.3% |
| Total Occupied Housing Units | 38,572 | 100.0% |
Occupancy by Household Size in Limestone County
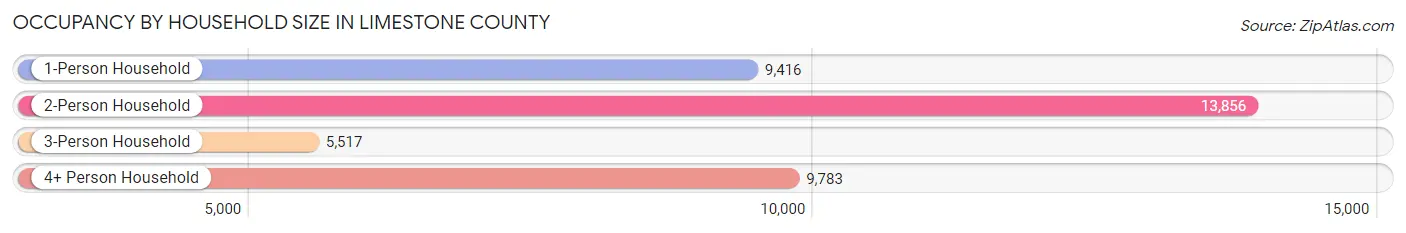
| Household Size | # Housing Units | % Housing Units |
| 1-Person Household | 9,416 | 24.4% |
| 2-Person Household | 13,856 | 35.9% |
| 3-Person Household | 5,517 | 14.3% |
| 4+ Person Household | 9,783 | 25.4% |
| Total Housing Units | 38,572 | 100.0% |
Occupancy by Ownership by Household Size in Limestone County
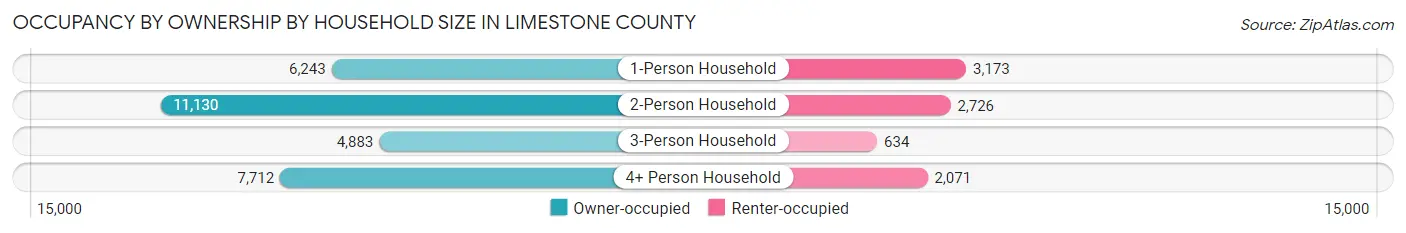
| Household Size | Owner-occupied | Renter-occupied |
| 1-Person Household | 6,243 (66.3%) | 3,173 (33.7%) |
| 2-Person Household | 11,130 (80.3%) | 2,726 (19.7%) |
| 3-Person Household | 4,883 (88.5%) | 634 (11.5%) |
| 4+ Person Household | 7,712 (78.8%) | 2,071 (21.2%) |
| Total Housing Units | 29,968 (77.7%) | 8,604 (22.3%) |
Occupancy by Educational Attainment in Limestone County
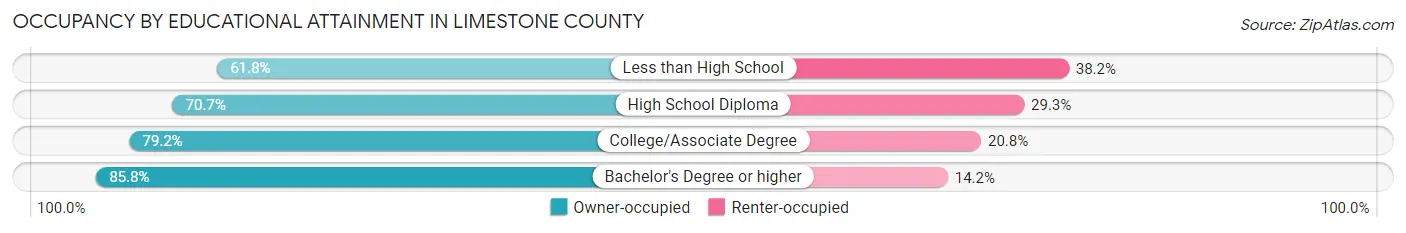
| Household Size | Owner-occupied | Renter-occupied |
| Less than High School | 2,408 (61.8%) | 1,488 (38.2%) |
| High School Diploma | 6,649 (70.7%) | 2,760 (29.3%) |
| College/Associate Degree | 9,233 (79.2%) | 2,424 (20.8%) |
| Bachelor's Degree or higher | 11,678 (85.8%) | 1,932 (14.2%) |
Occupancy by Age of Householder in Limestone County
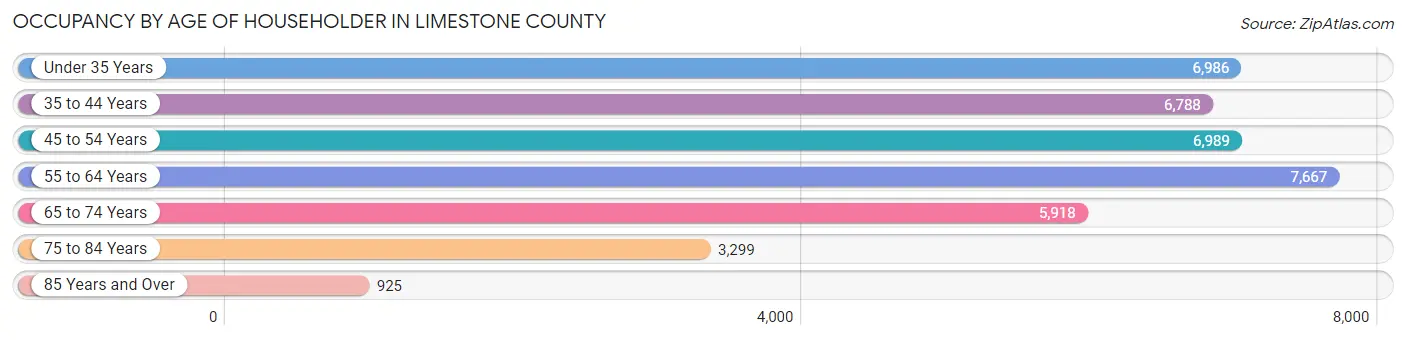
| Age Bracket | # Households | % Households |
| Under 35 Years | 6,986 | 18.1% |
| 35 to 44 Years | 6,788 | 17.6% |
| 45 to 54 Years | 6,989 | 18.1% |
| 55 to 64 Years | 7,667 | 19.9% |
| 65 to 74 Years | 5,918 | 15.3% |
| 75 to 84 Years | 3,299 | 8.6% |
| 85 Years and Over | 925 | 2.4% |
| Total | 38,572 | 100.0% |
Housing Finances in Limestone County
Median Income by Occupancy in Limestone County
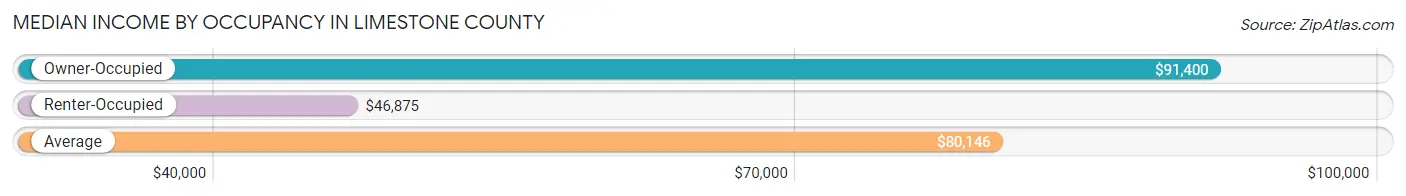
| Occupancy Type | # Households | Median Income |
| Owner-Occupied | 29,968 (77.7%) | $91,400 |
| Renter-Occupied | 8,604 (22.3%) | $46,875 |
| Average | 38,572 (100.0%) | $80,146 |
Occupancy by Householder Income Bracket in Limestone County
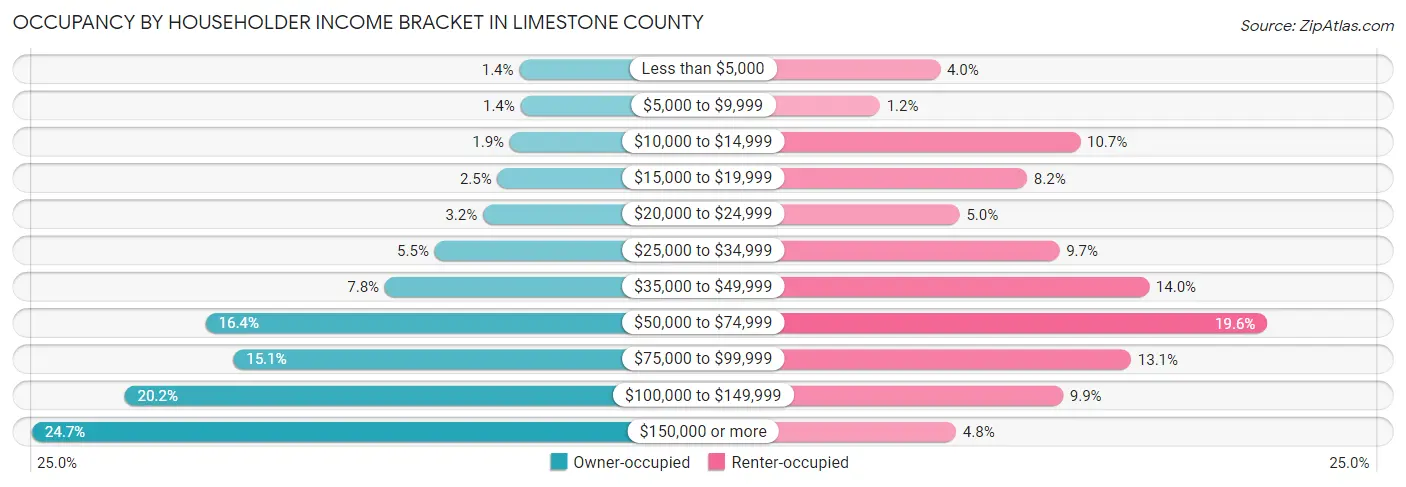
| Income Bracket | Owner-occupied | Renter-occupied |
| Less than $5,000 | 432 (1.4%) | 346 (4.0%) |
| $5,000 to $9,999 | 415 (1.4%) | 99 (1.1%) |
| $10,000 to $14,999 | 567 (1.9%) | 920 (10.7%) |
| $15,000 to $19,999 | 742 (2.5%) | 702 (8.2%) |
| $20,000 to $24,999 | 951 (3.2%) | 426 (5.0%) |
| $25,000 to $34,999 | 1,638 (5.5%) | 835 (9.7%) |
| $35,000 to $49,999 | 2,348 (7.8%) | 1,202 (14.0%) |
| $50,000 to $74,999 | 4,908 (16.4%) | 1,686 (19.6%) |
| $75,000 to $99,999 | 4,513 (15.1%) | 1,128 (13.1%) |
| $100,000 to $149,999 | 6,066 (20.2%) | 849 (9.9%) |
| $150,000 or more | 7,388 (24.6%) | 411 (4.8%) |
| Total | 29,968 (100.0%) | 8,604 (100.0%) |
Monthly Housing Cost Tiers in Limestone County
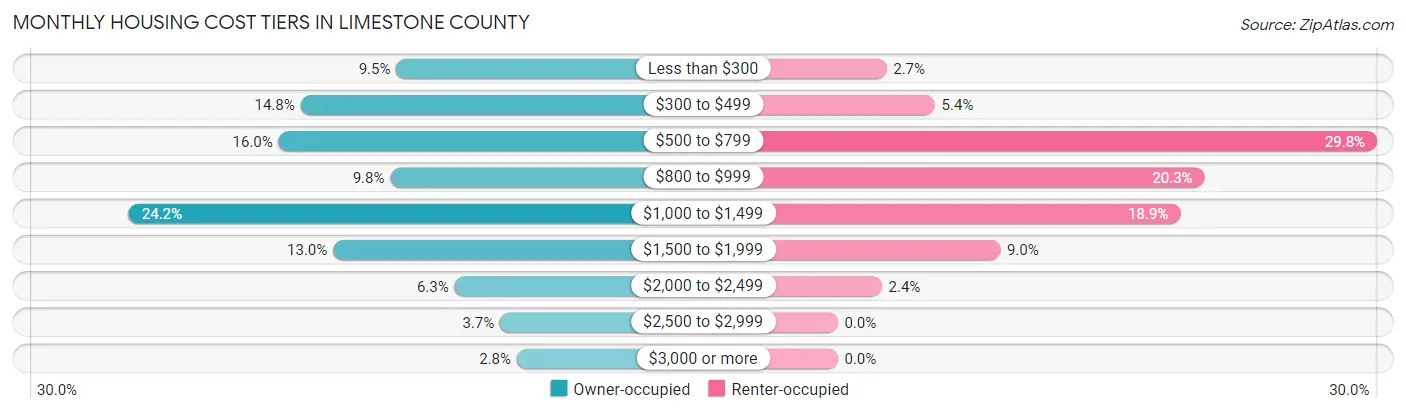
| Monthly Cost | Owner-occupied | Renter-occupied |
| Less than $300 | 2,837 (9.5%) | 232 (2.7%) |
| $300 to $499 | 4,423 (14.8%) | 462 (5.4%) |
| $500 to $799 | 4,787 (16.0%) | 2,564 (29.8%) |
| $800 to $999 | 2,938 (9.8%) | 1,744 (20.3%) |
| $1,000 to $1,499 | 7,265 (24.2%) | 1,629 (18.9%) |
| $1,500 to $1,999 | 3,883 (13.0%) | 773 (9.0%) |
| $2,000 to $2,499 | 1,873 (6.2%) | 210 (2.4%) |
| $2,500 to $2,999 | 1,121 (3.7%) | 0 (0.0%) |
| $3,000 or more | 841 (2.8%) | 0 (0.0%) |
| Total | 29,968 (100.0%) | 8,604 (100.0%) |
Physical Housing Characteristics in Limestone County
Housing Structures in Limestone County
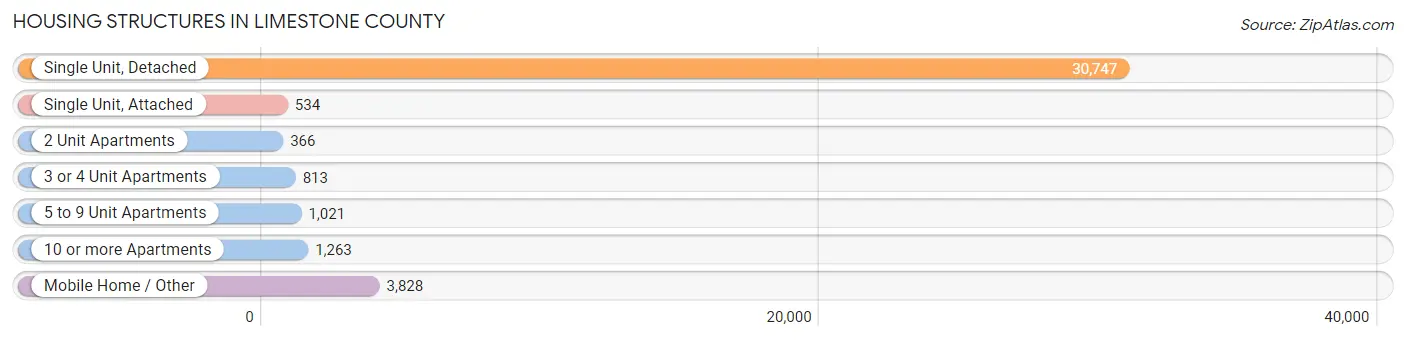
| Structure Type | # Housing Units | % Housing Units |
| Single Unit, Detached | 30,747 | 79.7% |
| Single Unit, Attached | 534 | 1.4% |
| 2 Unit Apartments | 366 | 0.9% |
| 3 or 4 Unit Apartments | 813 | 2.1% |
| 5 to 9 Unit Apartments | 1,021 | 2.6% |
| 10 or more Apartments | 1,263 | 3.3% |
| Mobile Home / Other | 3,828 | 9.9% |
| Total | 38,572 | 100.0% |
Housing Structures by Occupancy in Limestone County
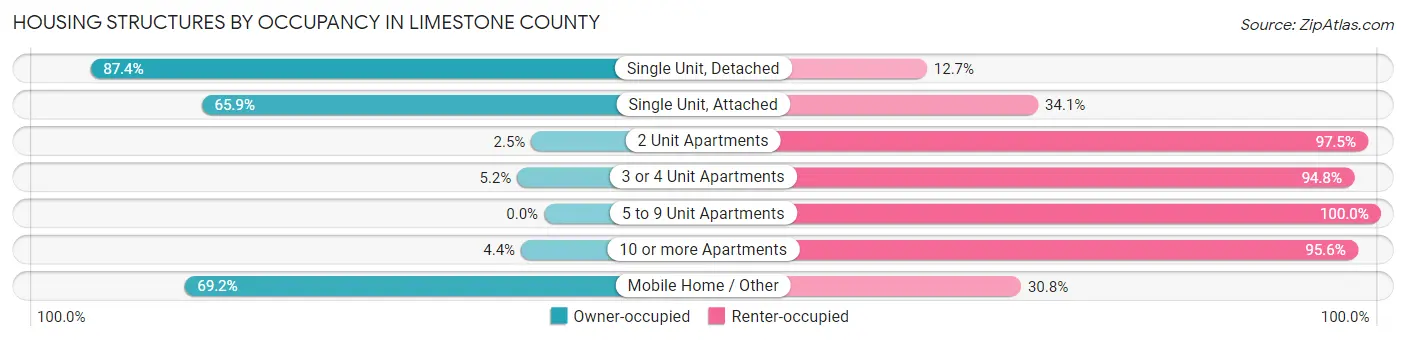
| Structure Type | Owner-occupied | Renter-occupied |
| Single Unit, Detached | 26,859 (87.4%) | 3,888 (12.7%) |
| Single Unit, Attached | 352 (65.9%) | 182 (34.1%) |
| 2 Unit Apartments | 9 (2.5%) | 357 (97.5%) |
| 3 or 4 Unit Apartments | 42 (5.2%) | 771 (94.8%) |
| 5 to 9 Unit Apartments | 0 (0.0%) | 1,021 (100.0%) |
| 10 or more Apartments | 56 (4.4%) | 1,207 (95.6%) |
| Mobile Home / Other | 2,650 (69.2%) | 1,178 (30.8%) |
| Total | 29,968 (77.7%) | 8,604 (22.3%) |
Housing Structures by Number of Rooms in Limestone County
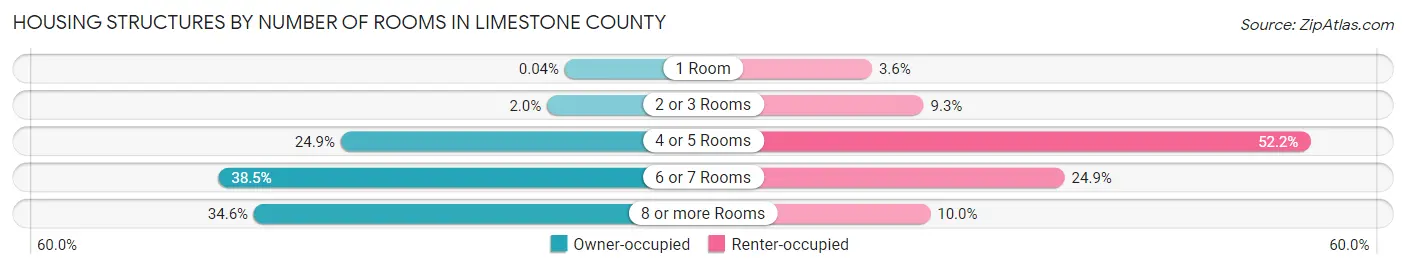
| Number of Rooms | Owner-occupied | Renter-occupied |
| 1 Room | 13 (0.0%) | 306 (3.6%) |
| 2 or 3 Rooms | 604 (2.0%) | 799 (9.3%) |
| 4 or 5 Rooms | 7,462 (24.9%) | 4,490 (52.2%) |
| 6 or 7 Rooms | 11,534 (38.5%) | 2,146 (24.9%) |
| 8 or more Rooms | 10,355 (34.5%) | 863 (10.0%) |
| Total | 29,968 (100.0%) | 8,604 (100.0%) |
Housing Structure by Heating Type in Limestone County
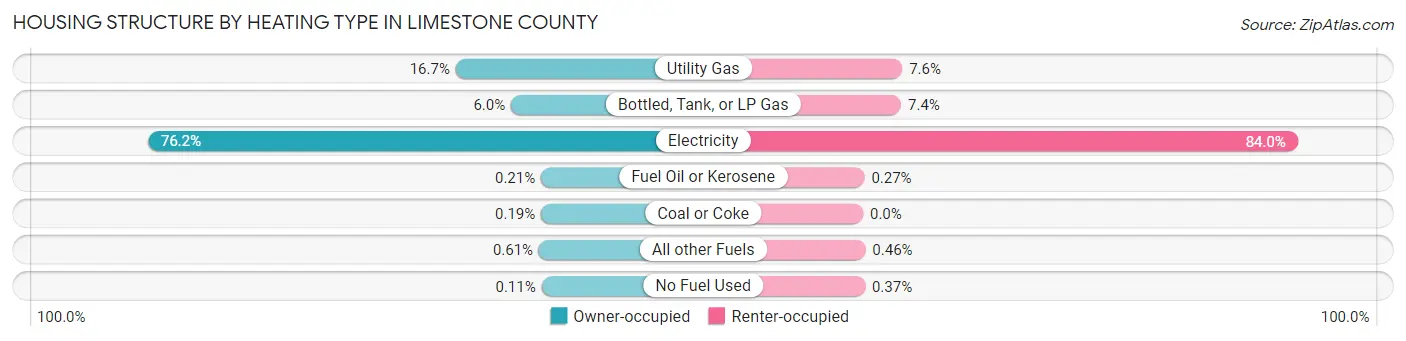
| Heating Type | Owner-occupied | Renter-occupied |
| Utility Gas | 5,003 (16.7%) | 651 (7.6%) |
| Bottled, Tank, or LP Gas | 1,797 (6.0%) | 632 (7.3%) |
| Electricity | 22,833 (76.2%) | 7,226 (84.0%) |
| Fuel Oil or Kerosene | 62 (0.2%) | 23 (0.3%) |
| Coal or Coke | 57 (0.2%) | 0 (0.0%) |
| All other Fuels | 182 (0.6%) | 40 (0.5%) |
| No Fuel Used | 34 (0.1%) | 32 (0.4%) |
| Total | 29,968 (100.0%) | 8,604 (100.0%) |
Household Vehicle Usage in Limestone County
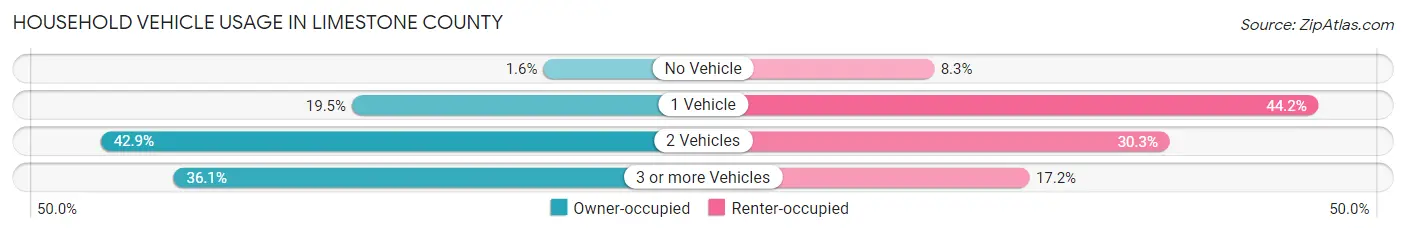
| Vehicles per Household | Owner-occupied | Renter-occupied |
| No Vehicle | 473 (1.6%) | 713 (8.3%) |
| 1 Vehicle | 5,828 (19.5%) | 3,804 (44.2%) |
| 2 Vehicles | 12,853 (42.9%) | 2,609 (30.3%) |
| 3 or more Vehicles | 10,814 (36.1%) | 1,478 (17.2%) |
| Total | 29,968 (100.0%) | 8,604 (100.0%) |
Real Estate & Mortgages in Limestone County
Real Estate and Mortgage Overview in Limestone County
| Characteristic | Without Mortgage | With Mortgage |
| Housing Units | 11,580 | 18,388 |
| Median Property Value | $201,500 | $244,100 |
| Median Household Income | $63,449 | $5,393 |
| Monthly Housing Costs | $442 | $833 |
| Real Estate Taxes | $620 | $1,211 |
Property Value by Mortgage Status in Limestone County
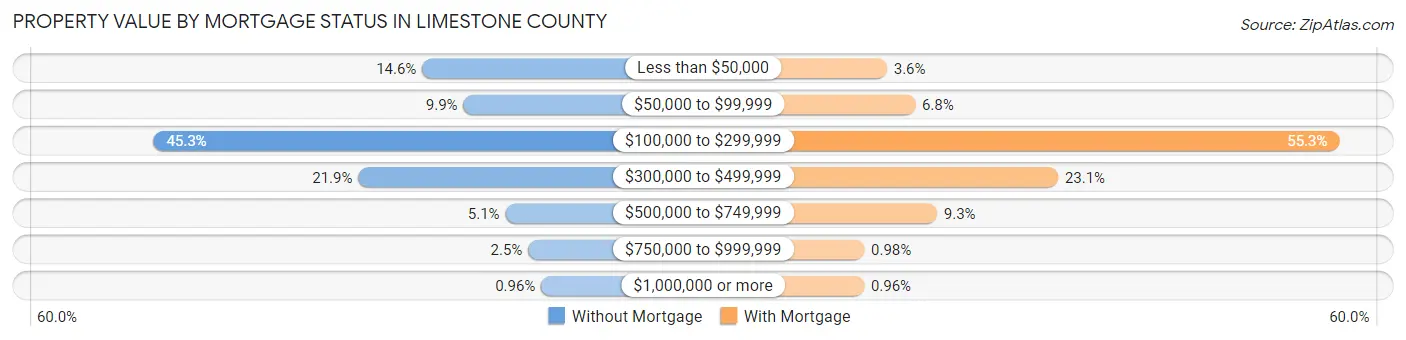
| Property Value | Without Mortgage | With Mortgage |
| Less than $50,000 | 1,686 (14.6%) | 656 (3.6%) |
| $50,000 to $99,999 | 1,141 (9.9%) | 1,249 (6.8%) |
| $100,000 to $299,999 | 5,242 (45.3%) | 10,166 (55.3%) |
| $300,000 to $499,999 | 2,531 (21.9%) | 4,253 (23.1%) |
| $500,000 to $749,999 | 585 (5.1%) | 1,708 (9.3%) |
| $750,000 to $999,999 | 284 (2.5%) | 180 (1.0%) |
| $1,000,000 or more | 111 (1.0%) | 176 (1.0%) |
| Total | 11,580 (100.0%) | 18,388 (100.0%) |
Household Income by Mortgage Status in Limestone County
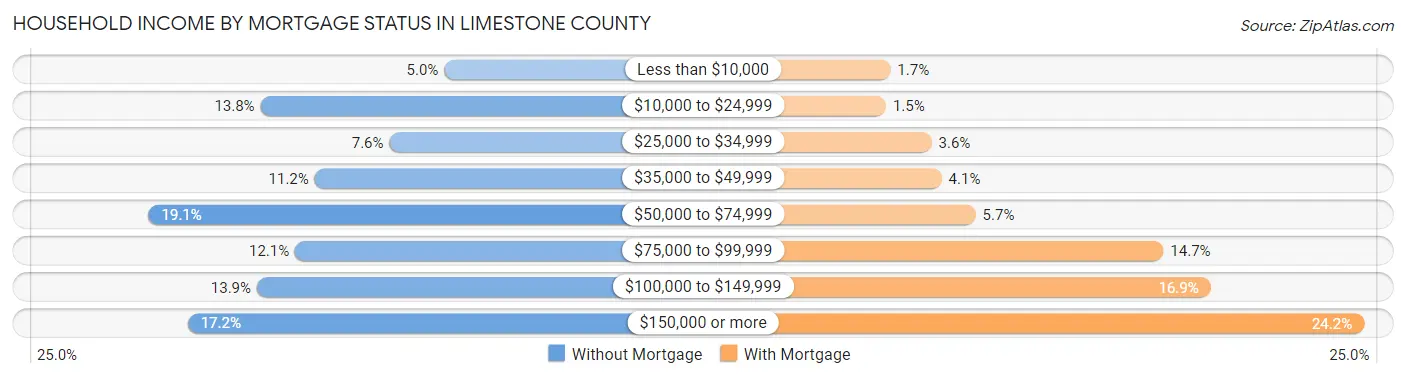
| Household Income | Without Mortgage | With Mortgage |
| Less than $10,000 | 581 (5.0%) | 306 (1.7%) |
| $10,000 to $24,999 | 1,594 (13.8%) | 266 (1.5%) |
| $25,000 to $34,999 | 884 (7.6%) | 666 (3.6%) |
| $35,000 to $49,999 | 1,296 (11.2%) | 754 (4.1%) |
| $50,000 to $74,999 | 2,212 (19.1%) | 1,052 (5.7%) |
| $75,000 to $99,999 | 1,404 (12.1%) | 2,696 (14.7%) |
| $100,000 to $149,999 | 1,614 (13.9%) | 3,109 (16.9%) |
| $150,000 or more | 1,995 (17.2%) | 4,452 (24.2%) |
| Total | 11,580 (100.0%) | 18,388 (100.0%) |
Property Value to Household Income Ratio in Limestone County
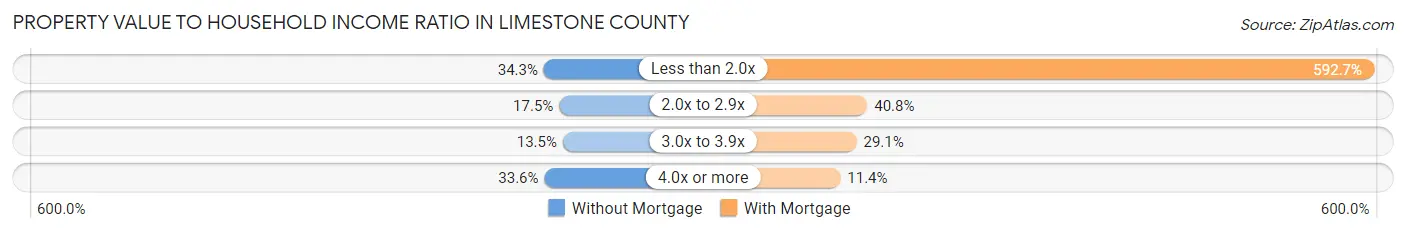
| Value-to-Income Ratio | Without Mortgage | With Mortgage |
| Less than 2.0x | 3,970 (34.3%) | 108,976 (592.6%) |
| 2.0x to 2.9x | 2,030 (17.5%) | 7,497 (40.8%) |
| 3.0x to 3.9x | 1,563 (13.5%) | 5,342 (29.0%) |
| 4.0x or more | 3,893 (33.6%) | 2,093 (11.4%) |
| Total | 11,580 (100.0%) | 18,388 (100.0%) |
Real Estate Taxes by Mortgage Status in Limestone County
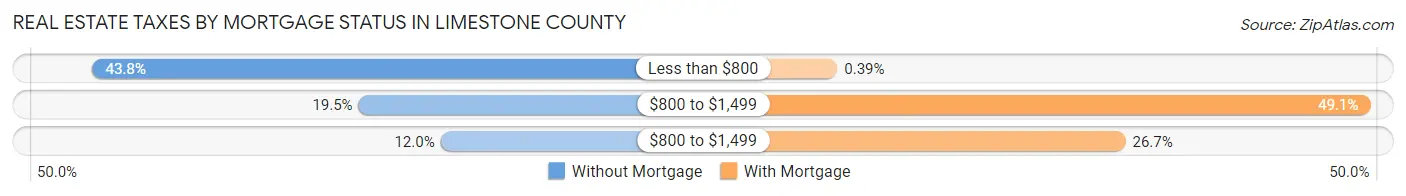
| Property Taxes | Without Mortgage | With Mortgage |
| Less than $800 | 5,071 (43.8%) | 72 (0.4%) |
| $800 to $1,499 | 2,259 (19.5%) | 9,022 (49.1%) |
| $800 to $1,499 | 1,392 (12.0%) | 4,912 (26.7%) |
| Total | 11,580 (100.0%) | 18,388 (100.0%) |
Health & Disability in Limestone County
Health Insurance Coverage by Age in Limestone County
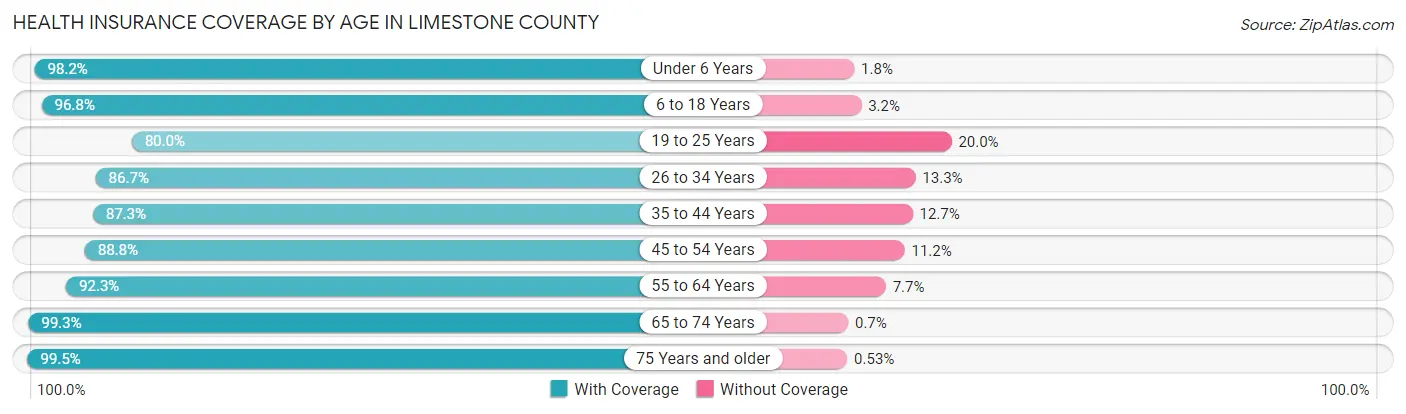
| Age Bracket | With Coverage | Without Coverage |
| Under 6 Years | 6,948 (98.2%) | 130 (1.8%) |
| 6 to 18 Years | 16,598 (96.8%) | 542 (3.2%) |
| 19 to 25 Years | 6,111 (80.0%) | 1,526 (20.0%) |
| 26 to 34 Years | 10,586 (86.7%) | 1,618 (13.3%) |
| 35 to 44 Years | 11,985 (87.3%) | 1,746 (12.7%) |
| 45 to 54 Years | 12,261 (88.8%) | 1,551 (11.2%) |
| 55 to 64 Years | 12,880 (92.3%) | 1,077 (7.7%) |
| 65 to 74 Years | 9,375 (99.3%) | 66 (0.7%) |
| 75 Years and older | 6,181 (99.5%) | 33 (0.5%) |
| Total | 92,925 (91.8%) | 8,289 (8.2%) |
Health Insurance Coverage by Citizenship Status in Limestone County
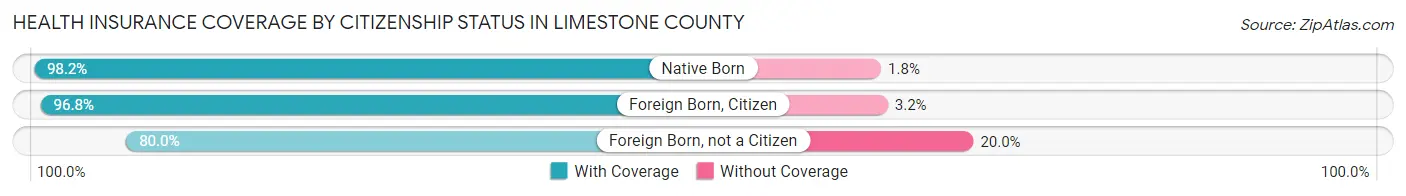
| Citizenship Status | With Coverage | Without Coverage |
| Native Born | 6,948 (98.2%) | 130 (1.8%) |
| Foreign Born, Citizen | 16,598 (96.8%) | 542 (3.2%) |
| Foreign Born, not a Citizen | 6,111 (80.0%) | 1,526 (20.0%) |
Health Insurance Coverage by Household Income in Limestone County
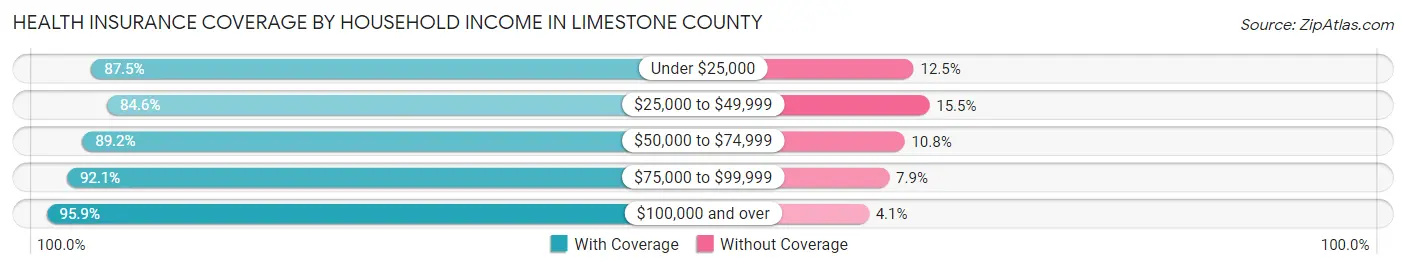
| Household Income | With Coverage | Without Coverage |
| Under $25,000 | 9,040 (87.5%) | 1,292 (12.5%) |
| $25,000 to $49,999 | 11,556 (84.6%) | 2,112 (15.4%) |
| $50,000 to $74,999 | 14,943 (89.2%) | 1,811 (10.8%) |
| $75,000 to $99,999 | 14,210 (92.1%) | 1,225 (7.9%) |
| $100,000 and over | 43,122 (95.9%) | 1,849 (4.1%) |
Public vs Private Health Insurance Coverage by Age in Limestone County
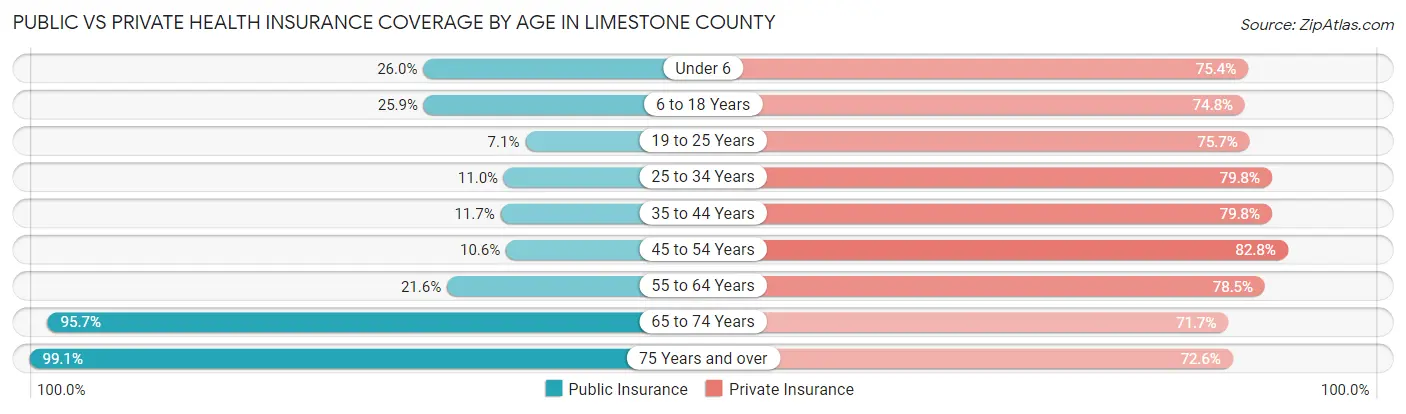
| Age Bracket | Public Insurance | Private Insurance |
| Under 6 | 1,841 (26.0%) | 5,337 (75.4%) |
| 6 to 18 Years | 4,439 (25.9%) | 12,825 (74.8%) |
| 19 to 25 Years | 540 (7.1%) | 5,780 (75.7%) |
| 25 to 34 Years | 1,346 (11.0%) | 9,741 (79.8%) |
| 35 to 44 Years | 1,603 (11.7%) | 10,960 (79.8%) |
| 45 to 54 Years | 1,470 (10.6%) | 11,430 (82.8%) |
| 55 to 64 Years | 3,015 (21.6%) | 10,959 (78.5%) |
| 65 to 74 Years | 9,037 (95.7%) | 6,773 (71.7%) |
| 75 Years and over | 6,156 (99.1%) | 4,508 (72.6%) |
| Total | 29,447 (29.1%) | 78,313 (77.4%) |
Disability Status by Sex by Age in Limestone County
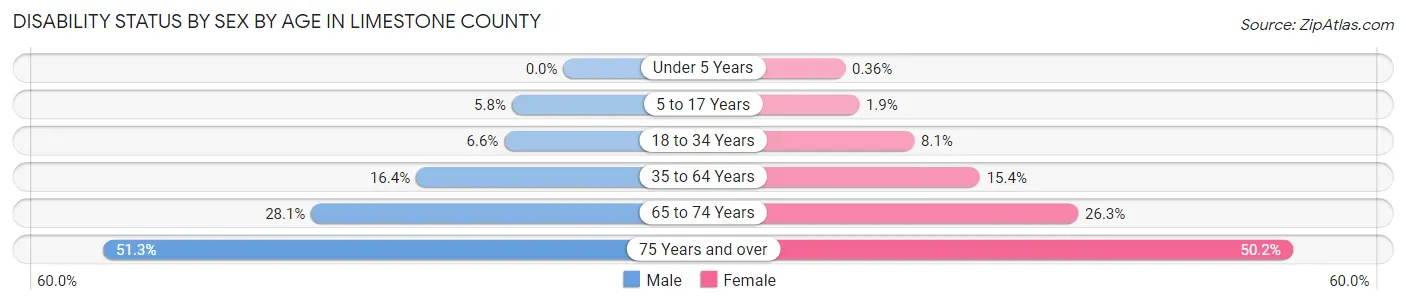
| Age Bracket | Male | Female |
| Under 5 Years | 0 (0.0%) | 10 (0.4%) |
| 5 to 17 Years | 498 (5.8%) | 165 (1.9%) |
| 18 to 34 Years | 692 (6.6%) | 852 (8.1%) |
| 35 to 64 Years | 3,380 (16.4%) | 3,212 (15.4%) |
| 65 to 74 Years | 1,230 (28.1%) | 1,332 (26.3%) |
| 75 Years and over | 1,293 (51.2%) | 1,853 (50.2%) |
Disability Class by Sex by Age in Limestone County
Disability Class: Hearing Difficulty
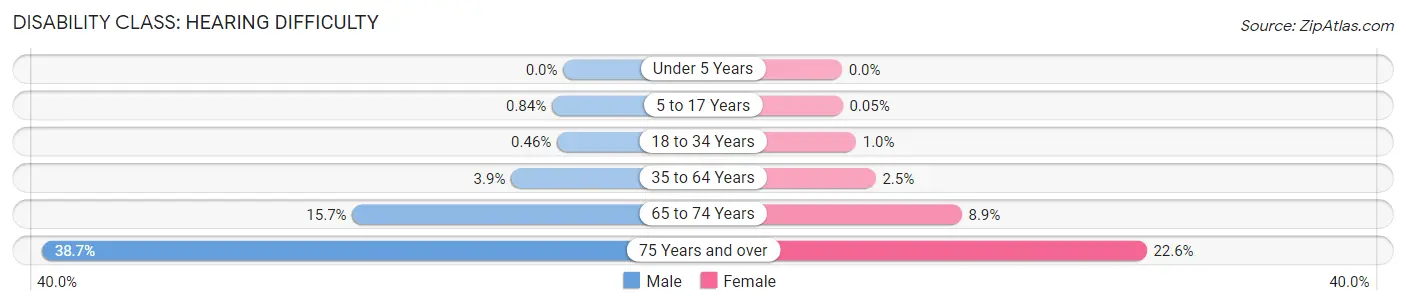
| Age Bracket | Male | Female |
| Under 5 Years | 0 (0.0%) | 0 (0.0%) |
| 5 to 17 Years | 73 (0.8%) | 4 (0.1%) |
| 18 to 34 Years | 48 (0.5%) | 110 (1.0%) |
| 35 to 64 Years | 796 (3.9%) | 523 (2.5%) |
| 65 to 74 Years | 686 (15.7%) | 450 (8.9%) |
| 75 Years and over | 977 (38.7%) | 835 (22.6%) |
Disability Class: Vision Difficulty
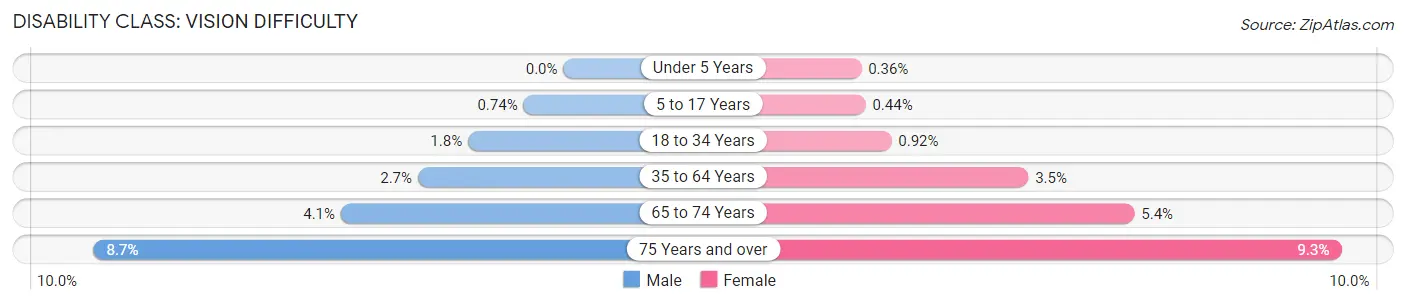
| Age Bracket | Male | Female |
| Under 5 Years | 0 (0.0%) | 10 (0.4%) |
| 5 to 17 Years | 64 (0.7%) | 38 (0.4%) |
| 18 to 34 Years | 186 (1.8%) | 97 (0.9%) |
| 35 to 64 Years | 557 (2.7%) | 724 (3.5%) |
| 65 to 74 Years | 181 (4.1%) | 275 (5.4%) |
| 75 Years and over | 220 (8.7%) | 342 (9.3%) |
Disability Class: Cognitive Difficulty
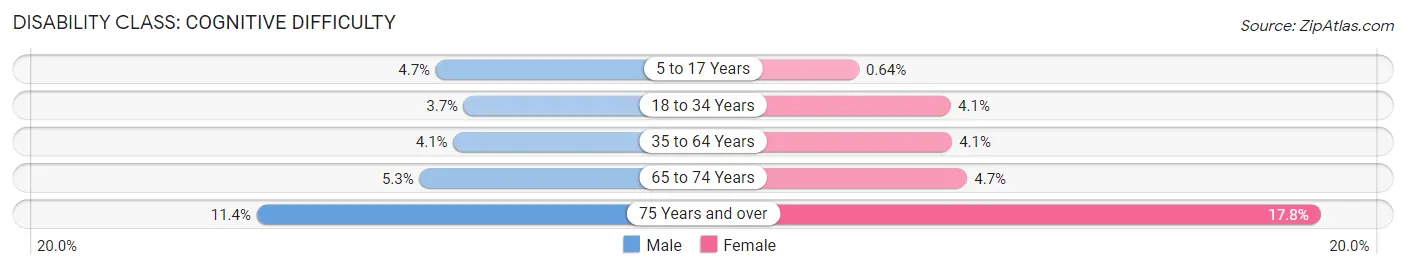
| Age Bracket | Male | Female |
| 5 to 17 Years | 410 (4.7%) | 55 (0.6%) |
| 18 to 34 Years | 388 (3.7%) | 429 (4.1%) |
| 35 to 64 Years | 840 (4.1%) | 857 (4.1%) |
| 65 to 74 Years | 234 (5.3%) | 236 (4.7%) |
| 75 Years and over | 287 (11.4%) | 656 (17.8%) |
Disability Class: Ambulatory Difficulty
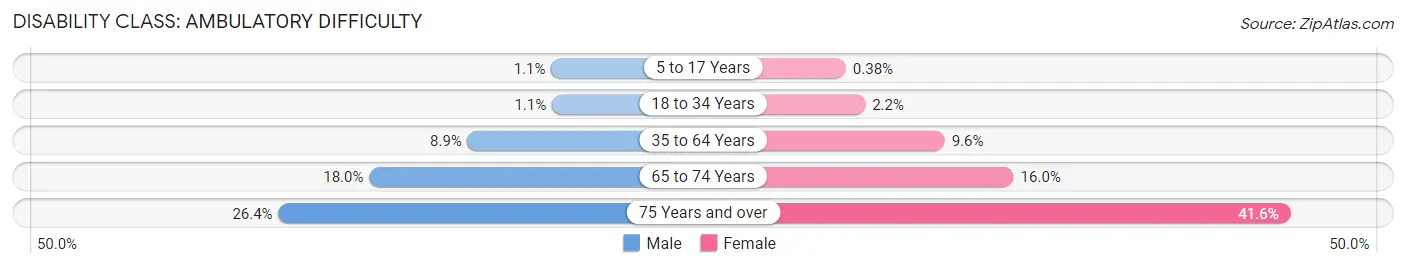
| Age Bracket | Male | Female |
| 5 to 17 Years | 97 (1.1%) | 33 (0.4%) |
| 18 to 34 Years | 110 (1.1%) | 230 (2.2%) |
| 35 to 64 Years | 1,829 (8.9%) | 1,997 (9.6%) |
| 65 to 74 Years | 789 (18.0%) | 807 (16.0%) |
| 75 Years and over | 667 (26.4%) | 1,537 (41.6%) |
Disability Class: Self-Care Difficulty
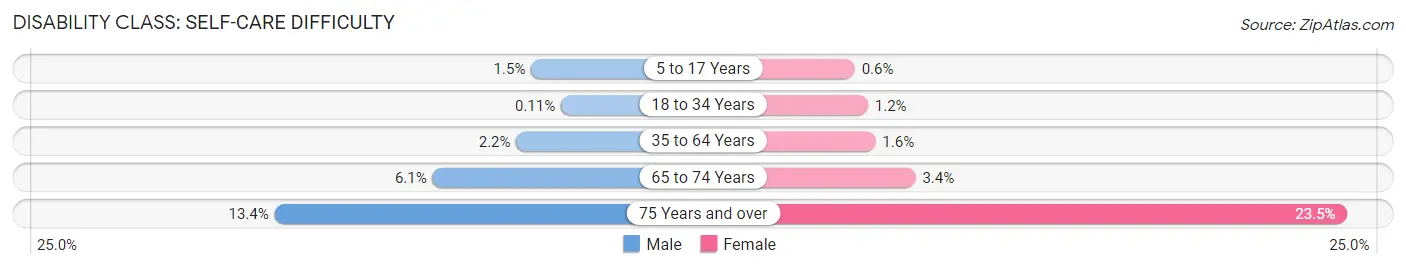
| Age Bracket | Male | Female |
| 5 to 17 Years | 129 (1.5%) | 52 (0.6%) |
| 18 to 34 Years | 12 (0.1%) | 128 (1.2%) |
| 35 to 64 Years | 449 (2.2%) | 326 (1.6%) |
| 65 to 74 Years | 266 (6.1%) | 173 (3.4%) |
| 75 Years and over | 338 (13.4%) | 866 (23.5%) |
Technology Access in Limestone County
Computing Device Access in Limestone County
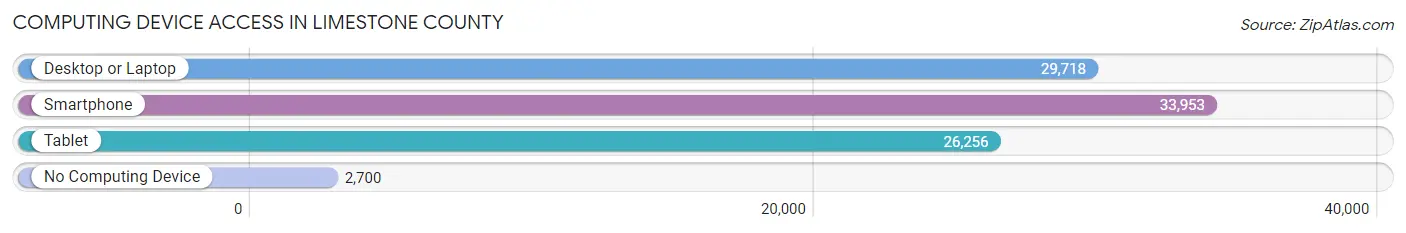
| Device Type | # Households | % Households |
| Desktop or Laptop | 29,718 | 77.0% |
| Smartphone | 33,953 | 88.0% |
| Tablet | 26,256 | 68.1% |
| No Computing Device | 2,700 | 7.0% |
| Total | 38,572 | 100.0% |
Internet Access in Limestone County
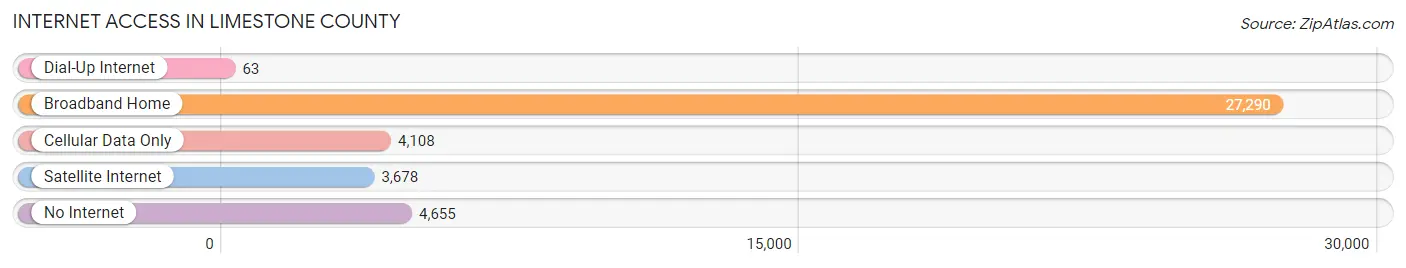
| Internet Type | # Households | % Households |
| Dial-Up Internet | 63 | 0.2% |
| Broadband Home | 27,290 | 70.8% |
| Cellular Data Only | 4,108 | 10.6% |
| Satellite Internet | 3,678 | 9.5% |
| No Internet | 4,655 | 12.1% |
| Total | 38,572 | 100.0% |
Limestone County Summary
Limestone County is located in the northern part of the state of Alabama, in the United States. It is bordered by Madison County to the north, Morgan County to the east, Lawrence County to the south, and Lauderdale County to the west. The county seat is Athens, and the largest city is Huntsville. The county was created in 1818 and named for the limestone deposits found in the area.
Geography
Limestone County covers an area of 602 square miles, making it the 33rd largest county in Alabama. The terrain is mostly flat, with some rolling hills in the northern part of the county. The county is drained by the Tennessee River, which forms its northern border. The county is part of the Tennessee Valley, and is located in the Cumberland Plateau region. The climate is humid subtropical, with hot summers and mild winters.
Demographics
As of the 2010 census, Limestone County had a population of 82,782. The racial makeup of the county was 79.2% White, 15.7% Black or African American, 0.4% Native American, 1.7% Asian, 0.1% Pacific Islander, 1.3% from other races, and 1.6% from two or more races. 3.7% of the population were Hispanic or Latino of any race.
The median household income was $45,845, and the median family income was $54,845. The per capita income was $22,845. About 11.2% of the population was below the poverty line.
Economy
Limestone County has a diverse economy, with a mix of manufacturing, agriculture, and services. The county is home to several large employers, including Redstone Arsenal, Huntsville Hospital, and Toyota Motor Manufacturing Alabama. The county is also home to several smaller businesses, including a number of technology companies.
Agriculture is an important part of the economy, with the county producing a variety of crops, including corn, soybeans, cotton, and hay. Livestock production is also important, with the county producing beef cattle, dairy cattle, and poultry.
Limestone County is also home to several tourist attractions, including the U.S. Space & Rocket Center, the Huntsville Botanical Garden, and the Alabama Constitution Village.
History
Limestone County was created in 1818 from land taken from the Cherokee Nation. The county was named for the limestone deposits found in the area. The county seat was originally located in the town of St. Stephens, but was moved to Athens in 1822.
The county was largely rural until the 1950s, when the city of Huntsville began to grow rapidly due to the presence of the Redstone Arsenal and the Marshall Space Flight Center. The growth of Huntsville has continued to the present day, and the city is now the largest in the county.
Limestone County has a long history of civil rights activism. In the 1950s and 1960s, the county was the site of several protests and demonstrations, including the Freedom Rides and the Selma to Montgomery marches. The county was also the site of the first sit-in in the state of Alabama, which took place in 1960.
Common Questions
What is Per Capita Income in Limestone County?
Per Capita income in Limestone County is $37,504.
What is the Median Family Income in Limestone County?
Median Family Income in Limestone County is $95,707.
What is the Median Household income in Limestone County?
Median Household Income in Limestone County is $80,146.
What is Income or Wage Gap in Limestone County?
Income or Wage Gap in Limestone County is 36.0%.
Women in Limestone County earn 64.0 cents for every dollar earned by a man.
What is Family Income Deficit in Limestone County?
Family Income Deficit in Limestone County is $11,015.
Families that are below poverty line in Limestone County earn $11,015 less on average than the poverty threshold level.
What is Inequality or Gini Index in Limestone County?
Inequality or Gini Index in Limestone County is 0.43.
What is the Total Population of Limestone County?
Total Population of Limestone County is 104,199.
What is the Total Male Population of Limestone County?
Total Male Population of Limestone County is 52,385.
What is the Total Female Population of Limestone County?
Total Female Population of Limestone County is 51,814.
What is the Ratio of Males per 100 Females in Limestone County?
There are 101.10 Males per 100 Females in Limestone County.
What is the Ratio of Females per 100 Males in Limestone County?
There are 98.91 Females per 100 Males in Limestone County.
What is the Median Population Age in Limestone County?
Median Population Age in Limestone County is 40.2 Years.
What is the Average Family Size in Limestone County
Average Family Size in Limestone County is 3.1 People.
What is the Average Household Size in Limestone County
Average Household Size in Limestone County is 2.6 People.
How Large is the Labor Force in Limestone County?
There are 50,251 People in the Labor Forcein in Limestone County.
What is the Percentage of People in the Labor Force in Limestone County?
59.7% of People are in the Labor Force in Limestone County.
What is the Unemployment Rate in Limestone County?
Unemployment Rate in Limestone County is 4.1%.