Baldwin County, AL Map & Demographics
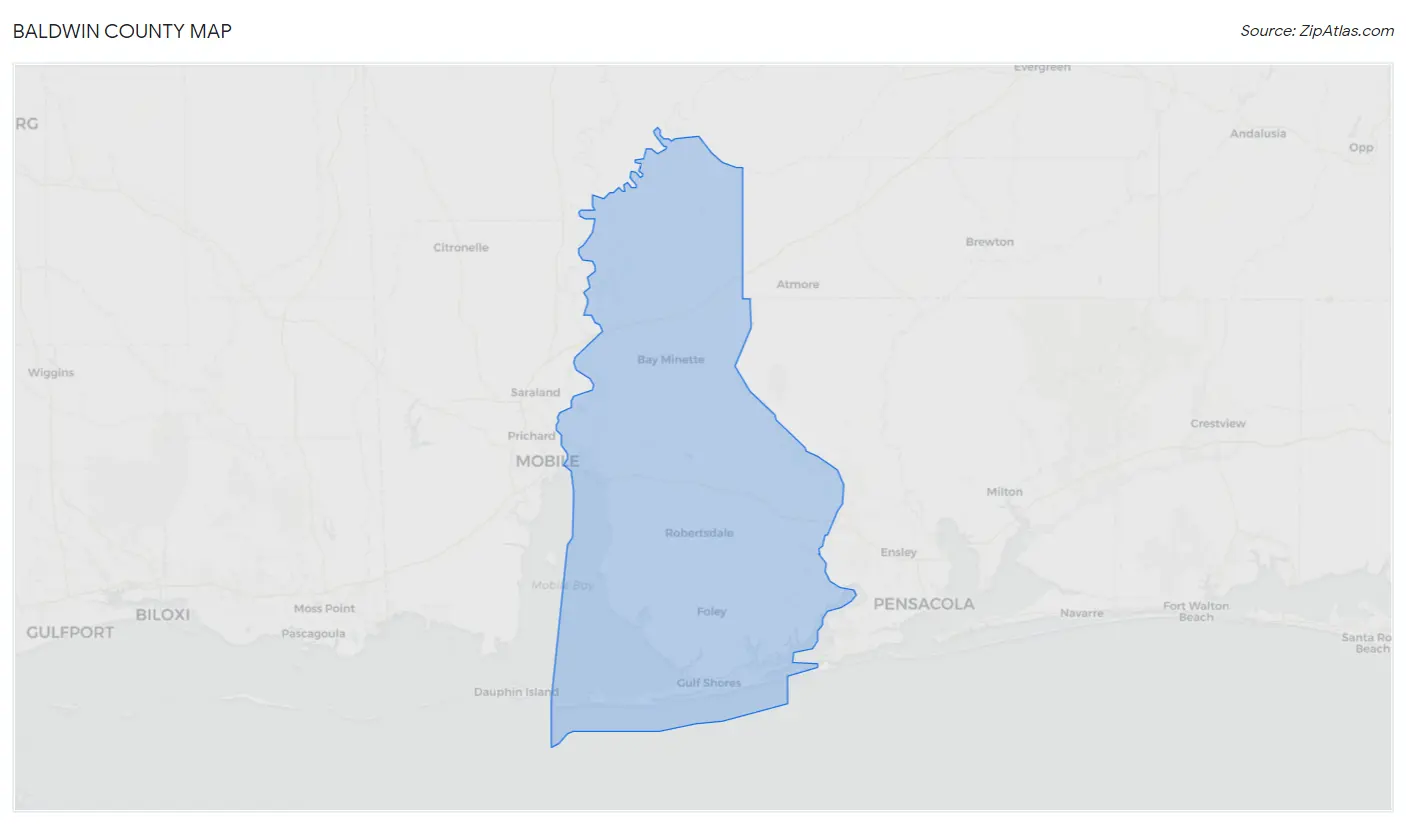
Baldwin County Map
Baldwin County Overview
$38,907
PER CAPITA INCOME
$89,953
AVG FAMILY INCOME
$71,039
AVG HOUSEHOLD INCOME
37.4%
WAGE / INCOME GAP [ % ]
62.6¢/ $1
WAGE / INCOME GAP [ $ ]
$10,026
FAMILY INCOME DEFICIT
0.46
INEQUALITY / GINI INDEX
233,420
TOTAL POPULATION
114,077
MALE POPULATION
119,343
FEMALE POPULATION
95.59
MALES / 100 FEMALES
104.62
FEMALES / 100 MALES
43.7
MEDIAN AGE
3.1
AVG FAMILY SIZE
2.5
AVG HOUSEHOLD SIZE
111,846
LABOR FORCE [ PEOPLE ]
59.0%
PERCENT IN LABOR FORCE
3.4%
UNEMPLOYMENT RATE
Baldwin County Area Codes
Income in Baldwin County
Income Overview in Baldwin County
Per Capita Income in Baldwin County is $38,907, while median incomes of families and households are $89,953 and $71,039 respectively.
| Characteristic | Number | Measure |
| Per Capita Income | 233,420 | $38,907 |
| Median Family Income | 61,277 | $89,953 |
| Mean Family Income | 61,277 | $115,729 |
| Median Household Income | 90,802 | $71,039 |
| Mean Household Income | 90,802 | $96,027 |
| Income Deficit | 61,277 | $10,026 |
| Wage / Income Gap (%) | 233,420 | 37.38% |
| Wage / Income Gap ($) | 233,420 | 62.62¢ per $1 |
| Gini / Inequality Index | 233,420 | 0.46 |
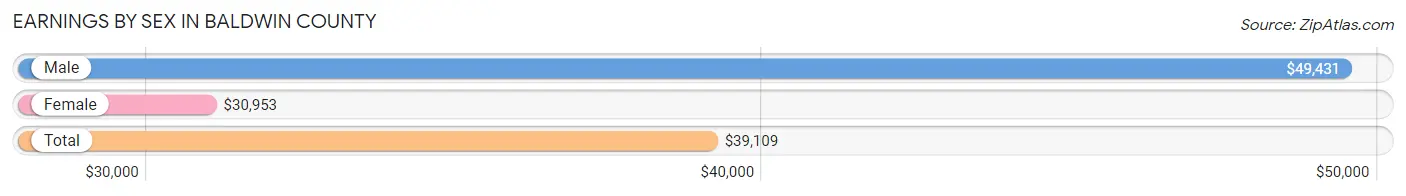
Earnings by Sex in Baldwin County
Average Earnings in Baldwin County are $39,109, $49,431 for men and $30,953 for women, a difference of 37.4%.
| Sex | Number | Average Earnings |
| Male | 60,977 (52.1%) | $49,431 |
| Female | 56,155 (47.9%) | $30,953 |
| Total | 117,132 (100.0%) | $39,109 |
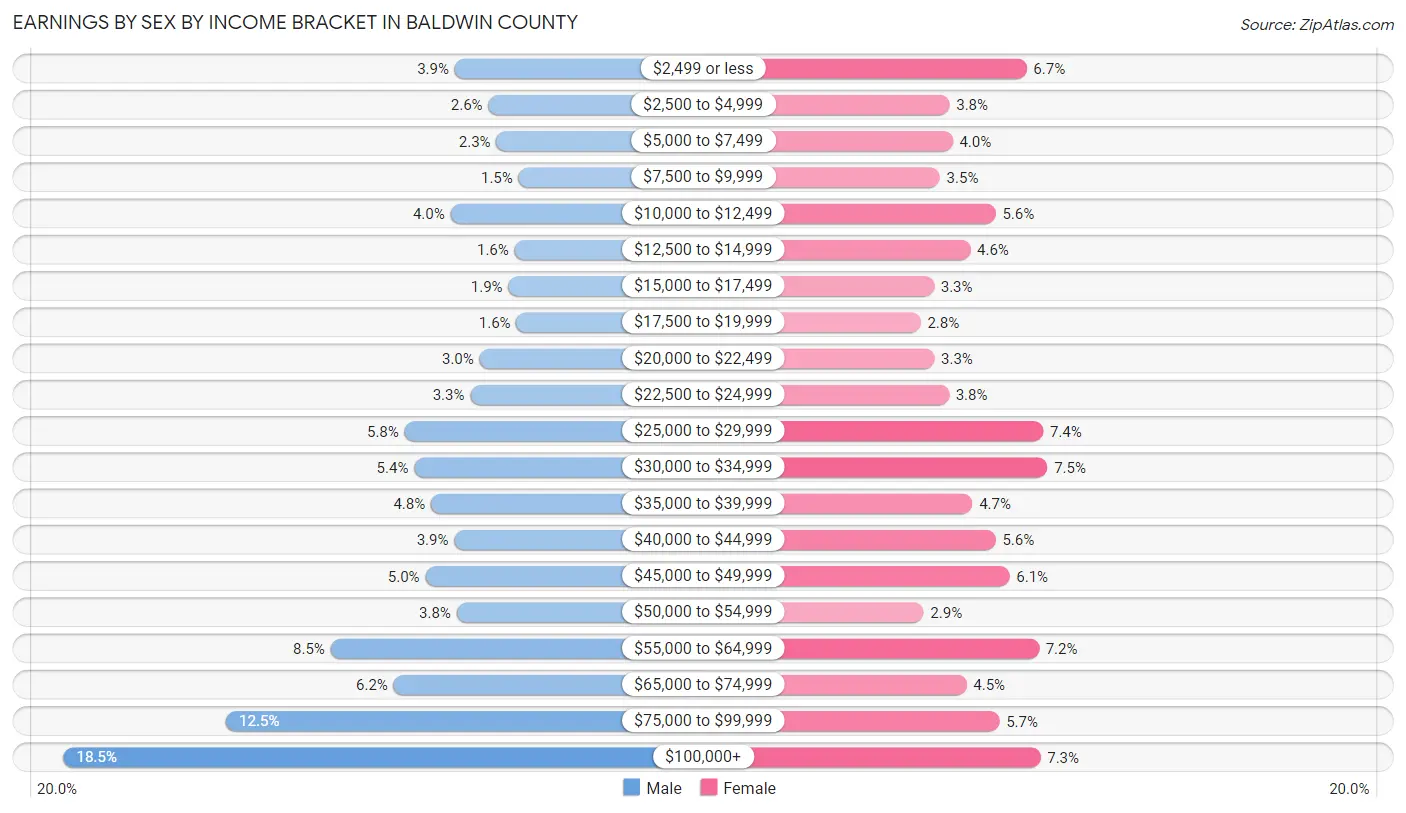
Earnings by Sex by Income Bracket in Baldwin County
The most common earnings brackets in Baldwin County are $100,000+ for men (11,307 | 18.5%) and $30,000 to $34,999 for women (4,220 | 7.5%).
| Income | Male | Female |
| $2,499 or less | 2,368 (3.9%) | 3,777 (6.7%) |
| $2,500 to $4,999 | 1,595 (2.6%) | 2,155 (3.8%) |
| $5,000 to $7,499 | 1,417 (2.3%) | 2,223 (4.0%) |
| $7,500 to $9,999 | 906 (1.5%) | 1,953 (3.5%) |
| $10,000 to $12,499 | 2,463 (4.0%) | 3,126 (5.6%) |
| $12,500 to $14,999 | 998 (1.6%) | 2,592 (4.6%) |
| $15,000 to $17,499 | 1,143 (1.9%) | 1,829 (3.3%) |
| $17,500 to $19,999 | 959 (1.6%) | 1,551 (2.8%) |
| $20,000 to $22,499 | 1,799 (2.9%) | 1,834 (3.3%) |
| $22,500 to $24,999 | 2,015 (3.3%) | 2,143 (3.8%) |
| $25,000 to $29,999 | 3,513 (5.8%) | 4,129 (7.3%) |
| $30,000 to $34,999 | 3,294 (5.4%) | 4,220 (7.5%) |
| $35,000 to $39,999 | 2,907 (4.8%) | 2,642 (4.7%) |
| $40,000 to $44,999 | 2,379 (3.9%) | 3,126 (5.6%) |
| $45,000 to $49,999 | 3,036 (5.0%) | 3,419 (6.1%) |
| $50,000 to $54,999 | 2,322 (3.8%) | 1,613 (2.9%) |
| $55,000 to $64,999 | 5,202 (8.5%) | 4,035 (7.2%) |
| $65,000 to $74,999 | 3,760 (6.2%) | 2,515 (4.5%) |
| $75,000 to $99,999 | 7,594 (12.4%) | 3,204 (5.7%) |
| $100,000+ | 11,307 (18.5%) | 4,069 (7.2%) |
| Total | 60,977 (100.0%) | 56,155 (100.0%) |
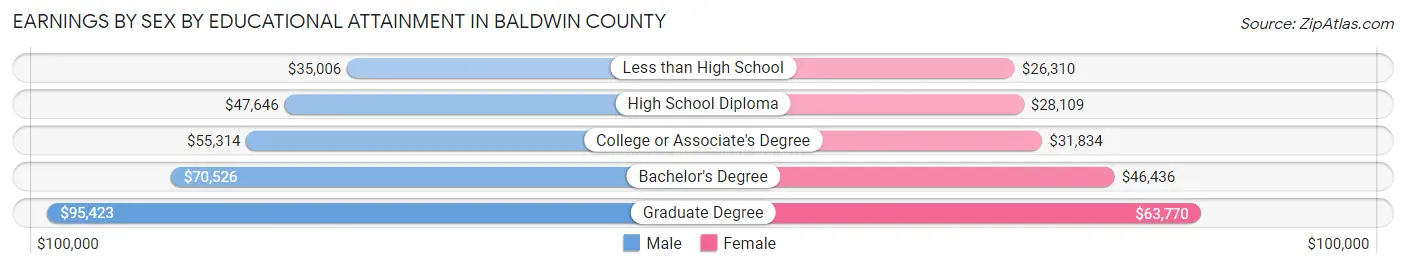
Earnings by Sex by Educational Attainment in Baldwin County
Average earnings in Baldwin County are $56,336 for men and $35,547 for women, a difference of 36.9%. Men with an educational attainment of graduate degree enjoy the highest average annual earnings of $95,423, while those with less than high school education earn the least with $35,006. Women with an educational attainment of graduate degree earn the most with the average annual earnings of $63,770, while those with less than high school education have the smallest earnings of $26,310.
| Educational Attainment | Male Income | Female Income |
| Less than High School | $35,006 | $26,310 |
| High School Diploma | $47,646 | $28,109 |
| College or Associate's Degree | $55,314 | $31,834 |
| Bachelor's Degree | $70,526 | $46,436 |
| Graduate Degree | $95,423 | $63,770 |
| Total | $56,336 | $35,547 |
Family Income in Baldwin County
Family Income Brackets in Baldwin County
According to the Baldwin County family income data, there are 12,991 families falling into the $100,000 to $149,999 income range, which is the most common income bracket and makes up 21.2% of all families. Conversely, the $10,000 to $14,999 income bracket is the least frequent group with only 1,164 families (1.9%) belonging to this category.
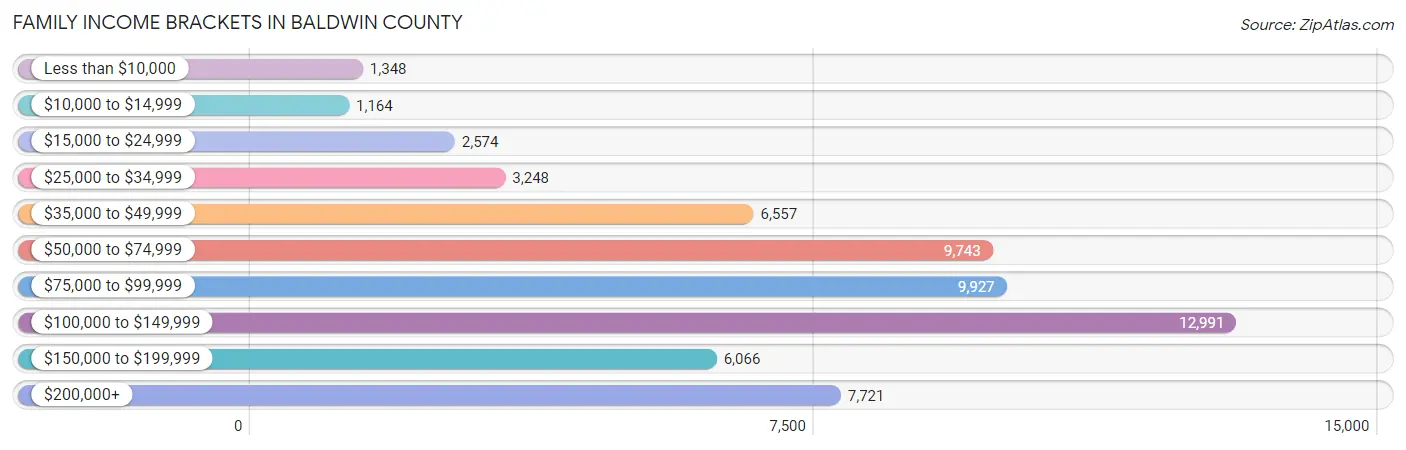
| Income Bracket | # Families | % Families |
| Less than $10,000 | 1,348 | 2.2% |
| $10,000 to $14,999 | 1,164 | 1.9% |
| $15,000 to $24,999 | 2,574 | 4.2% |
| $25,000 to $34,999 | 3,248 | 5.3% |
| $35,000 to $49,999 | 6,557 | 10.7% |
| $50,000 to $74,999 | 9,743 | 15.9% |
| $75,000 to $99,999 | 9,927 | 16.2% |
| $100,000 to $149,999 | 12,991 | 21.2% |
| $150,000 to $199,999 | 6,066 | 9.9% |
| $200,000+ | 7,721 | 12.6% |
Family Income by Famaliy Size in Baldwin County
5-person families (4,343 | 7.1%) account for the highest median family income in Baldwin County with $117,530 per family, while 2-person families (32,922 | 53.7%) have the highest median income of $41,034 per family member.
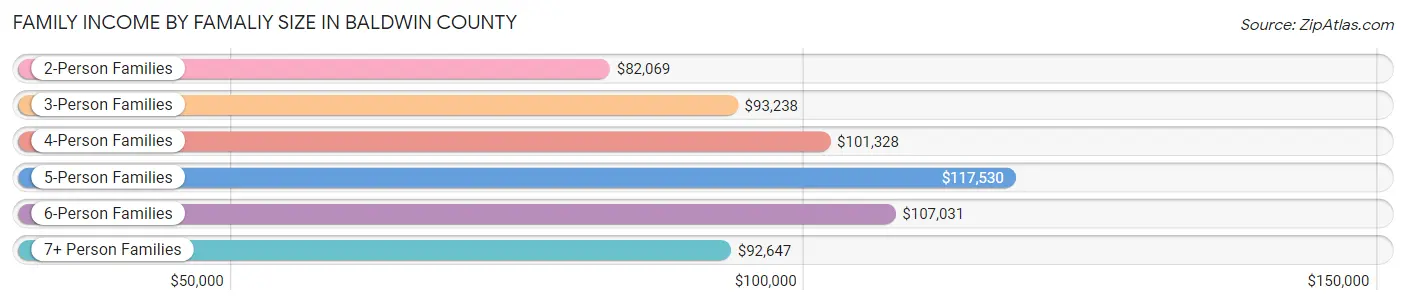
| Income Bracket | # Families | Median Income |
| 2-Person Families | 32,922 (53.7%) | $82,069 |
| 3-Person Families | 12,193 (19.9%) | $93,238 |
| 4-Person Families | 9,551 (15.6%) | $101,328 |
| 5-Person Families | 4,343 (7.1%) | $117,530 |
| 6-Person Families | 1,844 (3.0%) | $107,031 |
| 7+ Person Families | 424 (0.7%) | $92,647 |
| Total | 61,277 (100.0%) | $89,953 |
Family Income by Number of Earners in Baldwin County
The median family income in Baldwin County is $89,953, with families comprising 3+ earners (5,701) having the highest median family income of $131,520, while families with no earners (12,440) have the lowest median family income of $60,117, accounting for 9.3% and 20.3% of families, respectively.
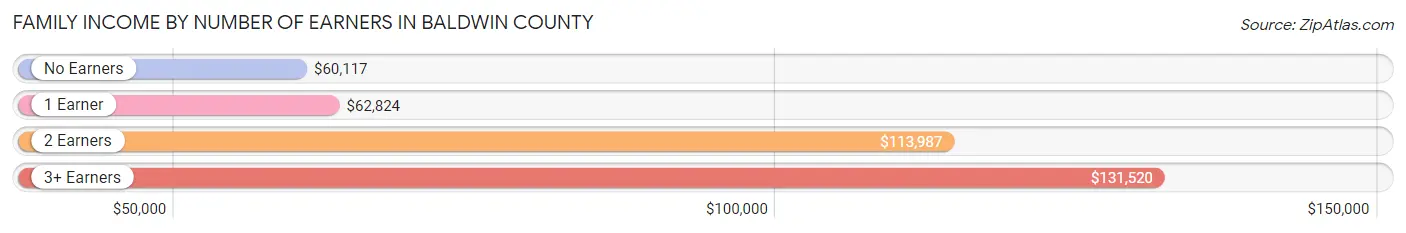
| Number of Earners | # Families | Median Income |
| No Earners | 12,440 (20.3%) | $60,117 |
| 1 Earner | 18,281 (29.8%) | $62,824 |
| 2 Earners | 24,855 (40.6%) | $113,987 |
| 3+ Earners | 5,701 (9.3%) | $131,520 |
| Total | 61,277 (100.0%) | $89,953 |
Household Income in Baldwin County
Household Income Brackets in Baldwin County
With 15,436 households falling in the category, the $100,000 to $149,999 income range is the most frequent in Baldwin County, accounting for 17.0% of all households. In contrast, only 3,814 households (4.2%) fall into the $10,000 to $14,999 income bracket, making it the least populous group.
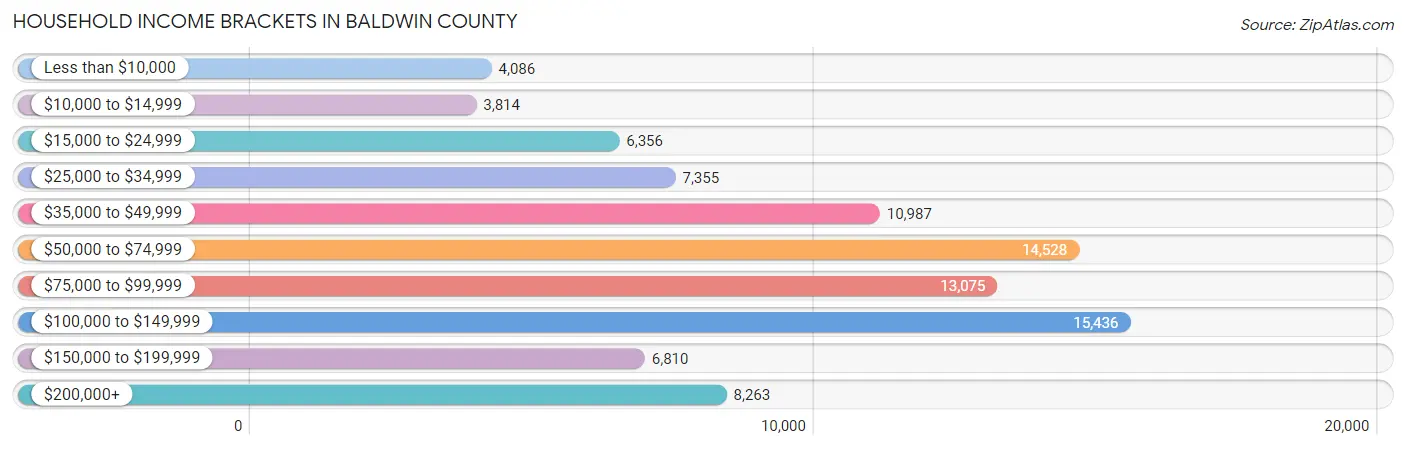
| Income Bracket | # Households | % Households |
| Less than $10,000 | 4,086 | 4.5% |
| $10,000 to $14,999 | 3,814 | 4.2% |
| $15,000 to $24,999 | 6,356 | 7.0% |
| $25,000 to $34,999 | 7,355 | 8.1% |
| $35,000 to $49,999 | 10,987 | 12.1% |
| $50,000 to $74,999 | 14,528 | 16.0% |
| $75,000 to $99,999 | 13,075 | 14.4% |
| $100,000 to $149,999 | 15,436 | 17.0% |
| $150,000 to $199,999 | 6,810 | 7.5% |
| $200,000+ | 8,263 | 9.1% |
Household Income by Householder Age in Baldwin County
The median household income in Baldwin County is $71,039, with the highest median household income of $82,944 found in the 25 to 44 years age bracket for the primary householder. A total of 24,738 households (27.2%) fall into this category. Meanwhile, the 15 to 24 years age bracket for the primary householder has the lowest median household income of $28,313, with 1,564 households (1.7%) in this group.
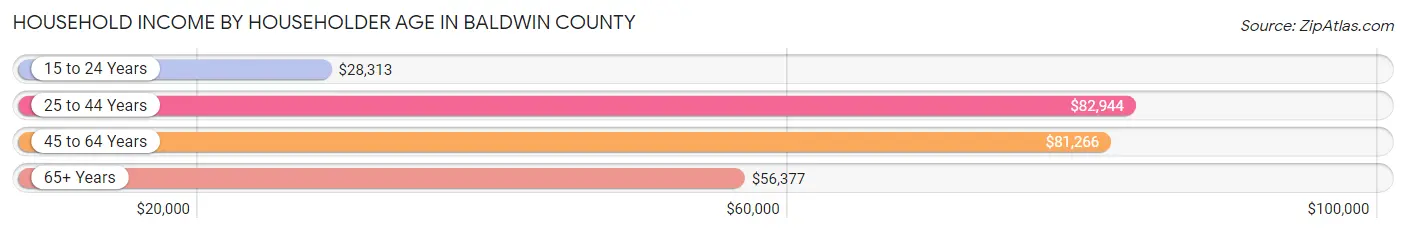
| Income Bracket | # Households | Median Income |
| 15 to 24 Years | 1,564 (1.7%) | $28,313 |
| 25 to 44 Years | 24,738 (27.2%) | $82,944 |
| 45 to 64 Years | 35,004 (38.6%) | $81,266 |
| 65+ Years | 29,496 (32.5%) | $56,377 |
| Total | 90,802 (100.0%) | $71,039 |
Poverty in Baldwin County
Income Below Poverty by Sex and Age in Baldwin County
With 8.8% poverty level for males and 11.5% for females among the residents of Baldwin County, 5 year old males and 18 to 24 year old females are the most vulnerable to poverty, with 323 males (22.0%) and 1,503 females (18.6%) in their respective age groups living below the poverty level.
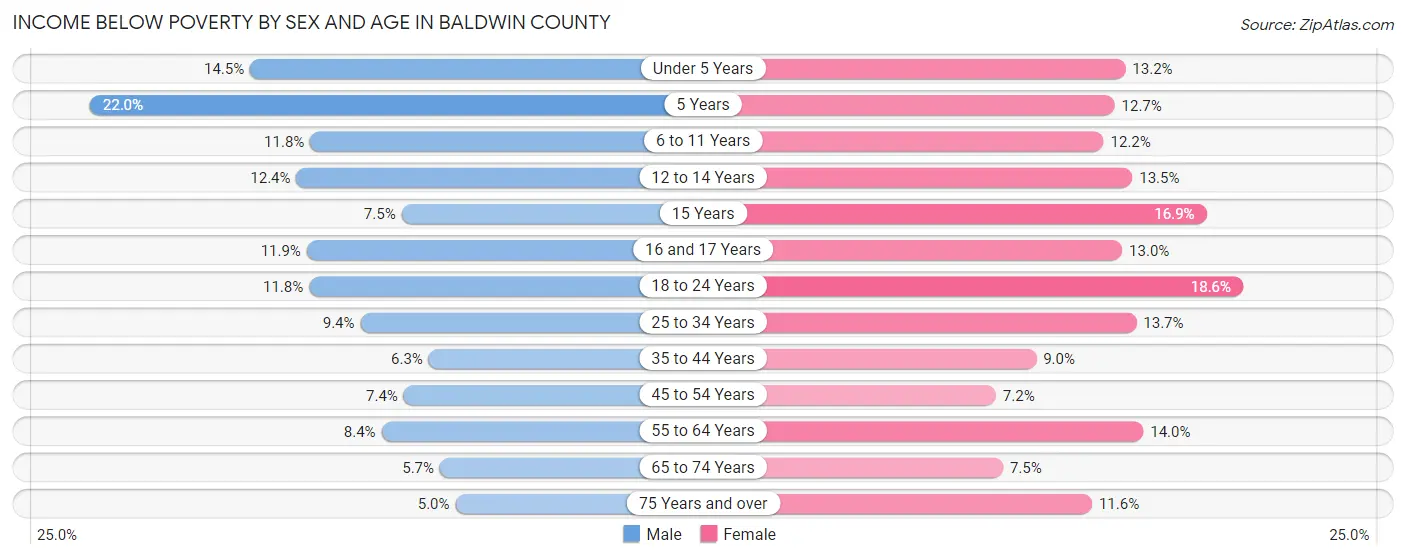
| Age Bracket | Male | Female |
| Under 5 Years | 893 (14.5%) | 738 (13.2%) |
| 5 Years | 323 (22.0%) | 170 (12.7%) |
| 6 to 11 Years | 897 (11.7%) | 852 (12.1%) |
| 12 to 14 Years | 639 (12.4%) | 708 (13.5%) |
| 15 Years | 133 (7.5%) | 278 (16.9%) |
| 16 and 17 Years | 330 (11.9%) | 357 (13.0%) |
| 18 to 24 Years | 994 (11.8%) | 1,503 (18.6%) |
| 25 to 34 Years | 1,162 (9.4%) | 1,782 (13.7%) |
| 35 to 44 Years | 848 (6.2%) | 1,279 (9.0%) |
| 45 to 54 Years | 1,061 (7.4%) | 1,101 (7.1%) |
| 55 to 64 Years | 1,329 (8.4%) | 2,461 (14.0%) |
| 65 to 74 Years | 793 (5.7%) | 1,161 (7.5%) |
| 75 Years and over | 417 (5.0%) | 1,236 (11.6%) |
| Total | 9,819 (8.8%) | 13,626 (11.5%) |
Income Above Poverty by Sex and Age in Baldwin County
According to the poverty statistics in Baldwin County, males aged 75 years and over and females aged 45 to 54 years are the age groups that are most secure financially, with 95.0% of males and 92.8% of females in these age groups living above the poverty line.
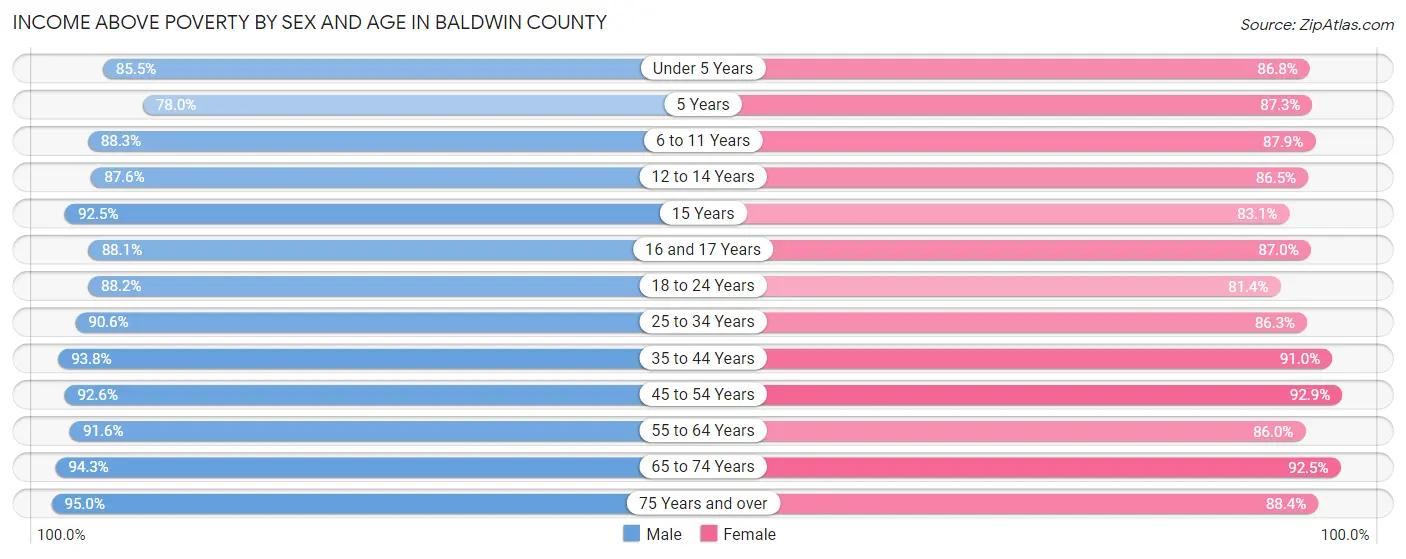
| Age Bracket | Male | Female |
| Under 5 Years | 5,248 (85.5%) | 4,870 (86.8%) |
| 5 Years | 1,147 (78.0%) | 1,173 (87.3%) |
| 6 to 11 Years | 6,734 (88.2%) | 6,161 (87.8%) |
| 12 to 14 Years | 4,517 (87.6%) | 4,545 (86.5%) |
| 15 Years | 1,637 (92.5%) | 1,365 (83.1%) |
| 16 and 17 Years | 2,440 (88.1%) | 2,388 (87.0%) |
| 18 to 24 Years | 7,428 (88.2%) | 6,572 (81.4%) |
| 25 to 34 Years | 11,168 (90.6%) | 11,257 (86.3%) |
| 35 to 44 Years | 12,721 (93.8%) | 12,899 (91.0%) |
| 45 to 54 Years | 13,254 (92.6%) | 14,301 (92.8%) |
| 55 to 64 Years | 14,412 (91.6%) | 15,133 (86.0%) |
| 65 to 74 Years | 13,050 (94.3%) | 14,356 (92.5%) |
| 75 Years and over | 7,909 (95.0%) | 9,409 (88.4%) |
| Total | 101,665 (91.2%) | 104,429 (88.5%) |
Income Below Poverty Among Married-Couple Families in Baldwin County
The poverty statistics for married-couple families in Baldwin County show that 3.6% or 1,840 of the total 51,019 families live below the poverty line. Families with 5 or more children have the highest poverty rate of 32.4%, comprising of 73 families. On the other hand, families with no children have the lowest poverty rate of 2.8%, which includes 901 families.
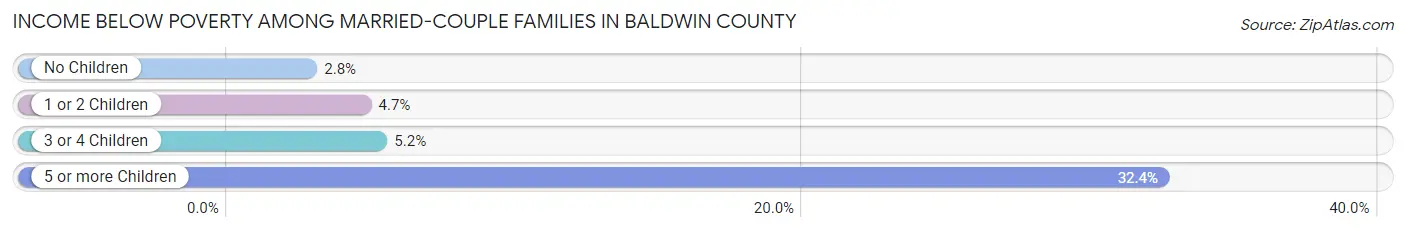
| Children | Above Poverty | Below Poverty |
| No Children | 31,735 (97.2%) | 901 (2.8%) |
| 1 or 2 Children | 13,648 (95.4%) | 666 (4.6%) |
| 3 or 4 Children | 3,644 (94.8%) | 200 (5.2%) |
| 5 or more Children | 152 (67.6%) | 73 (32.4%) |
| Total | 49,179 (96.4%) | 1,840 (3.6%) |
Income Below Poverty Among Single-Parent Households in Baldwin County
According to the poverty data in Baldwin County, 20.6% or 585 single-father households and 25.4% or 1,888 single-mother households are living below the poverty line. Among single-father households, those with 1 or 2 children have the highest poverty rate, with 519 households (30.7%) experiencing poverty. Likewise, among single-mother households, those with 5 or more children have the highest poverty rate, with 43 households (91.5%) falling below the poverty line.
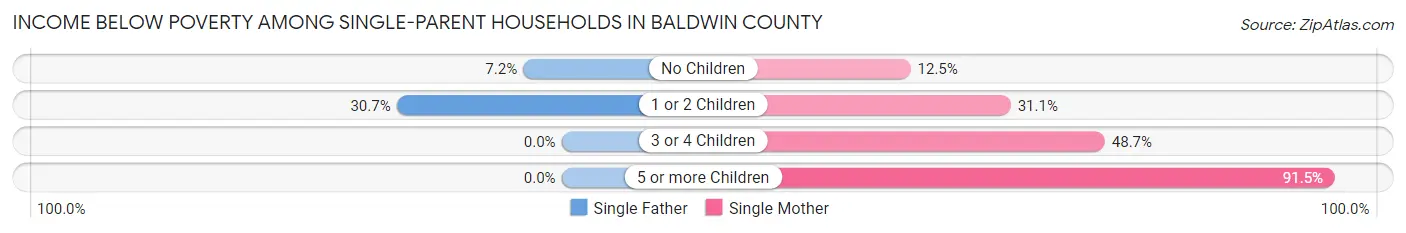
| Children | Single Father | Single Mother |
| No Children | 66 (7.2%) | 367 (12.5%) |
| 1 or 2 Children | 519 (30.7%) | 1,207 (31.1%) |
| 3 or 4 Children | 0 (0.0%) | 271 (48.6%) |
| 5 or more Children | 0 (0.0%) | 43 (91.5%) |
| Total | 585 (20.6%) | 1,888 (25.4%) |
Income Below Poverty Among Married-Couple vs Single-Parent Households in Baldwin County
The poverty data for Baldwin County shows that 1,840 of the married-couple family households (3.6%) and 2,473 of the single-parent households (24.1%) are living below the poverty level. Within the married-couple family households, those with 5 or more children have the highest poverty rate, with 73 households (32.4%) falling below the poverty line. Among the single-parent households, those with 5 or more children have the highest poverty rate, with 43 household (40.2%) living below poverty.
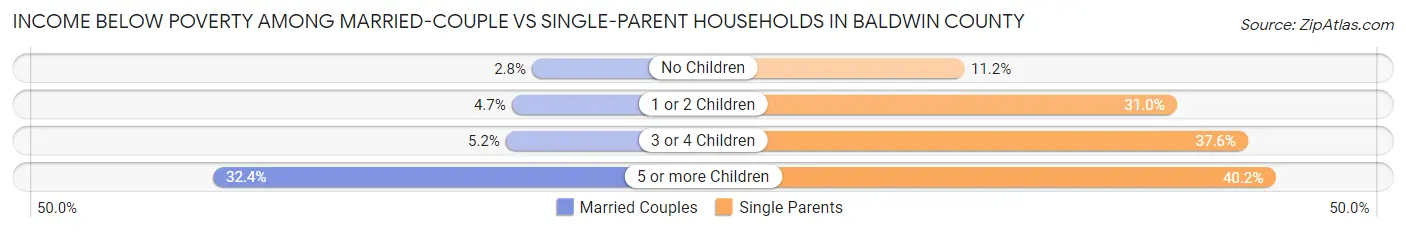
| Children | Married-Couple Families | Single-Parent Households |
| No Children | 901 (2.8%) | 433 (11.2%) |
| 1 or 2 Children | 666 (4.6%) | 1,726 (31.0%) |
| 3 or 4 Children | 200 (5.2%) | 271 (37.6%) |
| 5 or more Children | 73 (32.4%) | 43 (40.2%) |
| Total | 1,840 (3.6%) | 2,473 (24.1%) |
Race in Baldwin County
The most populous races in Baldwin County are White / Caucasian (195,998 | 84.0%), Black / African American (19,445 | 8.3%), and Hispanic or Latino (11,210 | 4.8%).
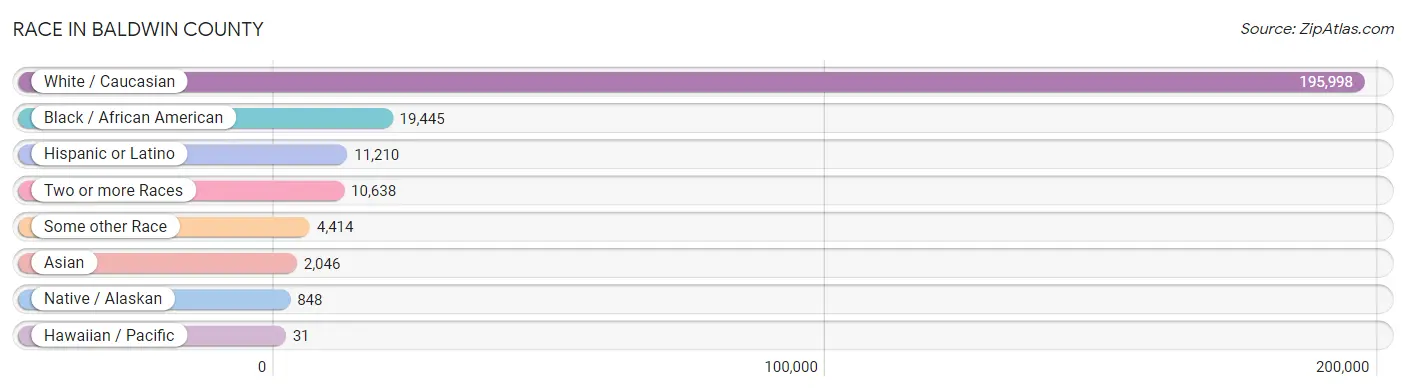
| Race | # Population | % Population |
| Asian | 2,046 | 0.9% |
| Black / African American | 19,445 | 8.3% |
| Hawaiian / Pacific | 31 | 0.0% |
| Hispanic or Latino | 11,210 | 4.8% |
| Native / Alaskan | 848 | 0.4% |
| White / Caucasian | 195,998 | 84.0% |
| Two or more Races | 10,638 | 4.6% |
| Some other Race | 4,414 | 1.9% |
| Total | 233,420 | 100.0% |
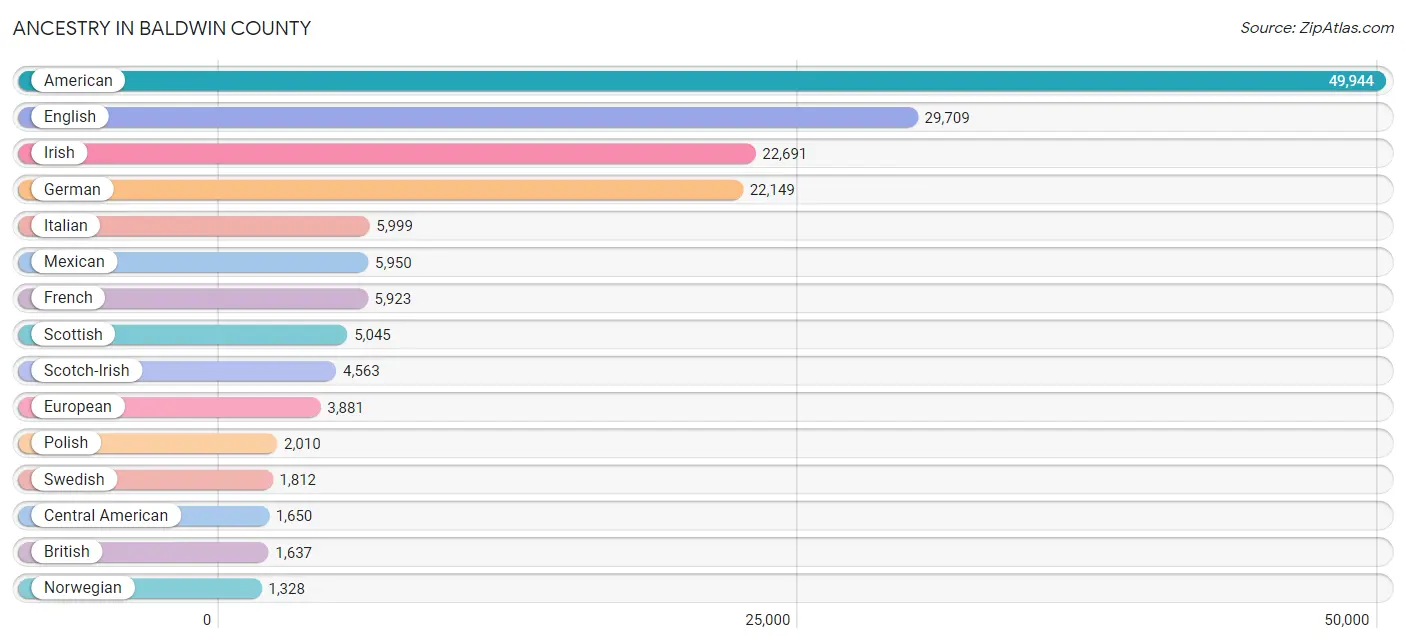
Ancestry in Baldwin County
The most populous ancestries reported in Baldwin County are American (49,944 | 21.4%), English (29,709 | 12.7%), Irish (22,691 | 9.7%), German (22,149 | 9.5%), and Italian (5,999 | 2.6%), together accounting for 55.9% of all Baldwin County residents.
| Ancestry | # Population | % Population |
| African | 360 | 0.2% |
| Alaska Native | 9 | 0.0% |
| American | 49,944 | 21.4% |
| Apache | 17 | 0.0% |
| Arab | 318 | 0.1% |
| Argentinean | 102 | 0.0% |
| Armenian | 17 | 0.0% |
| Austrian | 210 | 0.1% |
| Belgian | 105 | 0.0% |
| Bhutanese | 505 | 0.2% |
| Blackfeet | 30 | 0.0% |
| Brazilian | 1,053 | 0.4% |
| British | 1,637 | 0.7% |
| British West Indian | 14 | 0.0% |
| Burmese | 270 | 0.1% |
| Cajun | 56 | 0.0% |
| Canadian | 250 | 0.1% |
| Celtic | 47 | 0.0% |
| Central American | 1,650 | 0.7% |
| Central American Indian | 242 | 0.1% |
| Cherokee | 1,127 | 0.5% |
| Cheyenne | 22 | 0.0% |
| Chippewa | 33 | 0.0% |
| Choctaw | 509 | 0.2% |
| Colombian | 76 | 0.0% |
| Cree | 10 | 0.0% |
| Creek | 471 | 0.2% |
| Croatian | 74 | 0.0% |
| Cuban | 518 | 0.2% |
| Czech | 1,244 | 0.5% |
| Czechoslovakian | 387 | 0.2% |
| Danish | 392 | 0.2% |
| Dominican | 1 | 0.0% |
| Dutch | 1,063 | 0.5% |
| Dutch West Indian | 20 | 0.0% |
| Eastern European | 593 | 0.3% |
| Ecuadorian | 80 | 0.0% |
| Egyptian | 17 | 0.0% |
| English | 29,709 | 12.7% |
| Ethiopian | 21 | 0.0% |
| European | 3,881 | 1.7% |
| Filipino | 9 | 0.0% |
| Finnish | 216 | 0.1% |
| French | 5,923 | 2.5% |
| French Canadian | 839 | 0.4% |
| German | 22,149 | 9.5% |
| Greek | 730 | 0.3% |
| Guamanian / Chamorro | 57 | 0.0% |
| Guatemalan | 513 | 0.2% |
| Haitian | 157 | 0.1% |
| Honduran | 605 | 0.3% |
| Hungarian | 544 | 0.2% |
| Indian (Asian) | 511 | 0.2% |
| Iranian | 46 | 0.0% |
| Irish | 22,691 | 9.7% |
| Iroquois | 20 | 0.0% |
| Israeli | 9 | 0.0% |
| Italian | 5,999 | 2.6% |
| Jamaican | 322 | 0.1% |
| Korean | 793 | 0.3% |
| Laotian | 209 | 0.1% |
| Latvian | 8 | 0.0% |
| Lebanese | 207 | 0.1% |
| Lithuanian | 208 | 0.1% |
| Lumbee | 50 | 0.0% |
| Macedonian | 36 | 0.0% |
| Maltese | 24 | 0.0% |
| Mexican | 5,950 | 2.5% |
| Mexican American Indian | 200 | 0.1% |
| Mongolian | 50 | 0.0% |
| Moroccan | 22 | 0.0% |
| Native Hawaiian | 546 | 0.2% |
| New Zealander | 19 | 0.0% |
| Nigerian | 41 | 0.0% |
| Northern European | 299 | 0.1% |
| Norwegian | 1,328 | 0.6% |
| Pakistani | 484 | 0.2% |
| Palestinian | 2 | 0.0% |
| Panamanian | 371 | 0.2% |
| Peruvian | 59 | 0.0% |
| Polish | 2,010 | 0.9% |
| Portuguese | 153 | 0.1% |
| Puerto Rican | 967 | 0.4% |
| Romanian | 120 | 0.1% |
| Russian | 394 | 0.2% |
| Salvadoran | 161 | 0.1% |
| Scandinavian | 420 | 0.2% |
| Scotch-Irish | 4,563 | 1.9% |
| Scottish | 5,045 | 2.2% |
| Serbian | 22 | 0.0% |
| Sioux | 9 | 0.0% |
| Slavic | 40 | 0.0% |
| Slovak | 90 | 0.0% |
| South American | 383 | 0.2% |
| Spaniard | 712 | 0.3% |
| Spanish | 128 | 0.1% |
| Spanish American Indian | 13 | 0.0% |
| Sri Lankan | 163 | 0.1% |
| Subsaharan African | 451 | 0.2% |
| Swedish | 1,812 | 0.8% |
| Swiss | 213 | 0.1% |
| Syrian | 3 | 0.0% |
| Thai | 525 | 0.2% |
| Tongan | 117 | 0.1% |
| Turkish | 93 | 0.0% |
| Ukrainian | 338 | 0.1% |
| Welsh | 1,296 | 0.6% |
| West Indian | 23 | 0.0% |
| Yugoslavian | 138 | 0.1% | View All 109 Rows |
Immigrants in Baldwin County
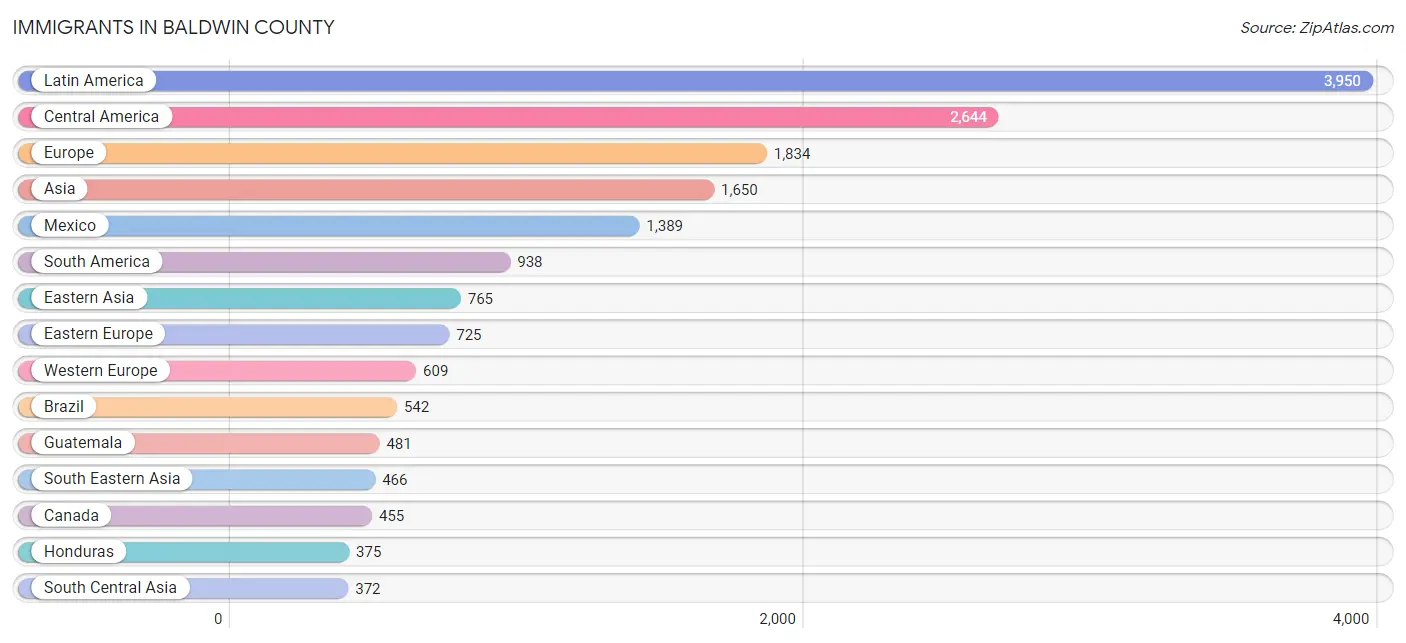
The most numerous immigrant groups reported in Baldwin County came from Latin America (3,950 | 1.7%), Central America (2,644 | 1.1%), Europe (1,834 | 0.8%), Asia (1,650 | 0.7%), and Mexico (1,389 | 0.6%), together accounting for 4.9% of all Baldwin County residents.
| Immigration Origin | # Population | % Population |
| Africa | 155 | 0.1% |
| Argentina | 13 | 0.0% |
| Asia | 1,650 | 0.7% |
| Australia | 62 | 0.0% |
| Austria | 12 | 0.0% |
| Bolivia | 66 | 0.0% |
| Bosnia and Herzegovina | 115 | 0.1% |
| Brazil | 542 | 0.2% |
| Bulgaria | 8 | 0.0% |
| Cambodia | 14 | 0.0% |
| Canada | 455 | 0.2% |
| Caribbean | 368 | 0.2% |
| Central America | 2,644 | 1.1% |
| China | 216 | 0.1% |
| Colombia | 98 | 0.0% |
| Cuba | 73 | 0.0% |
| Czechoslovakia | 92 | 0.0% |
| Denmark | 3 | 0.0% |
| Eastern Africa | 68 | 0.0% |
| Eastern Asia | 765 | 0.3% |
| Eastern Europe | 725 | 0.3% |
| Ecuador | 63 | 0.0% |
| Egypt | 17 | 0.0% |
| El Salvador | 248 | 0.1% |
| England | 115 | 0.1% |
| Ethiopia | 21 | 0.0% |
| Europe | 1,834 | 0.8% |
| France | 227 | 0.1% |
| Germany | 356 | 0.2% |
| Greece | 12 | 0.0% |
| Guatemala | 481 | 0.2% |
| Haiti | 15 | 0.0% |
| Honduras | 375 | 0.2% |
| Hong Kong | 15 | 0.0% |
| Hungary | 15 | 0.0% |
| India | 238 | 0.1% |
| Iran | 35 | 0.0% |
| Italy | 123 | 0.1% |
| Jamaica | 279 | 0.1% |
| Japan | 270 | 0.1% |
| Korea | 279 | 0.1% |
| Latin America | 3,950 | 1.7% |
| Malaysia | 33 | 0.0% |
| Mexico | 1,389 | 0.6% |
| Moldova | 112 | 0.1% |
| Netherlands | 14 | 0.0% |
| Nigeria | 29 | 0.0% |
| Northern Africa | 17 | 0.0% |
| Northern Europe | 282 | 0.1% |
| Norway | 16 | 0.0% |
| Oceania | 62 | 0.0% |
| Pakistan | 99 | 0.0% |
| Panama | 151 | 0.1% |
| Peru | 91 | 0.0% |
| Philippines | 162 | 0.1% |
| Poland | 101 | 0.0% |
| Romania | 75 | 0.0% |
| Russia | 41 | 0.0% |
| Scotland | 70 | 0.0% |
| Serbia | 16 | 0.0% |
| Singapore | 67 | 0.0% |
| South Africa | 12 | 0.0% |
| South America | 938 | 0.4% |
| South Central Asia | 372 | 0.2% |
| South Eastern Asia | 466 | 0.2% |
| Southern Europe | 218 | 0.1% |
| Spain | 83 | 0.0% |
| Taiwan | 9 | 0.0% |
| Thailand | 16 | 0.0% |
| Turkey | 47 | 0.0% |
| Ukraine | 150 | 0.1% |
| Uruguay | 65 | 0.0% |
| Vietnam | 174 | 0.1% |
| West Indies | 1 | 0.0% |
| Western Africa | 29 | 0.0% |
| Western Asia | 47 | 0.0% |
| Western Europe | 609 | 0.3% |
| Zimbabwe | 44 | 0.0% | View All 78 Rows |
Sex and Age in Baldwin County
Sex and Age in Baldwin County
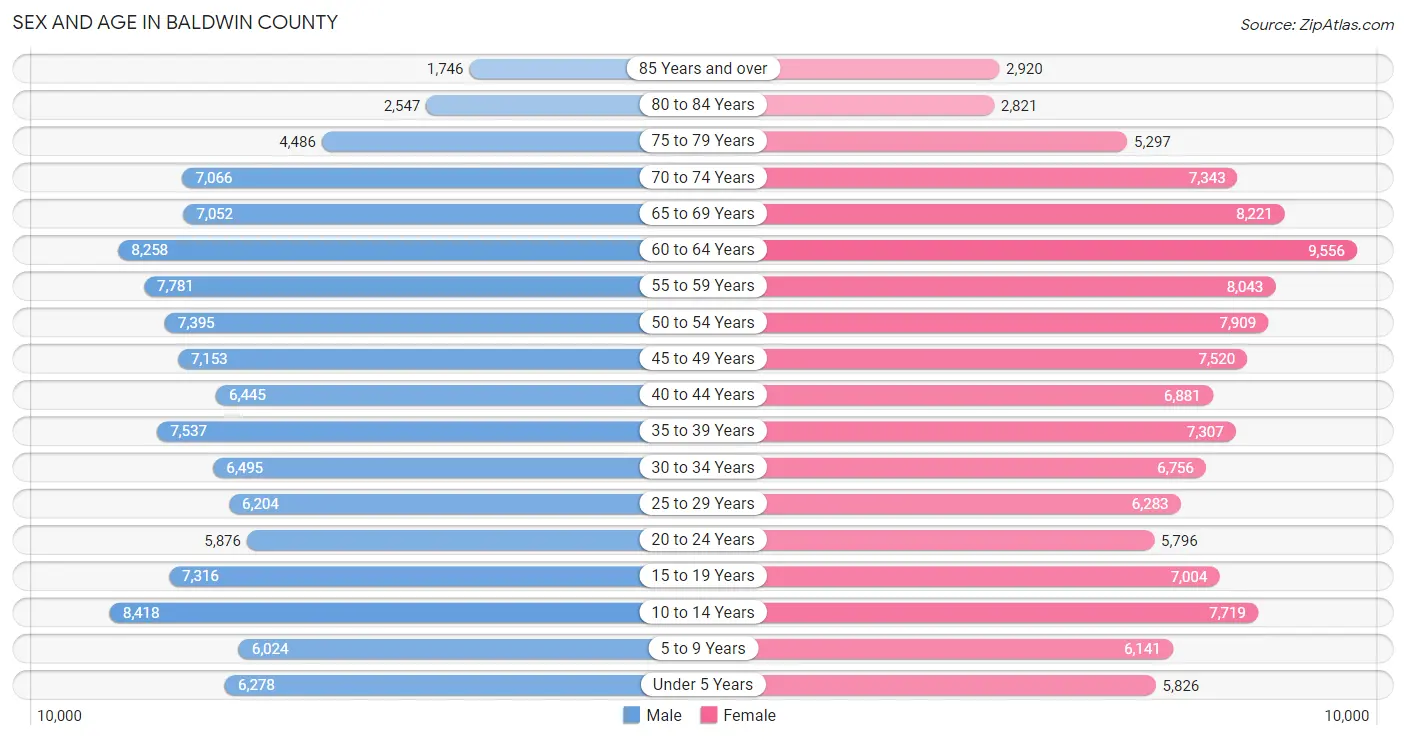
The most populous age groups in Baldwin County are 10 to 14 Years (8,418 | 7.4%) for men and 60 to 64 Years (9,556 | 8.0%) for women.
| Age Bracket | Male | Female |
| Under 5 Years | 6,278 (5.5%) | 5,826 (4.9%) |
| 5 to 9 Years | 6,024 (5.3%) | 6,141 (5.1%) |
| 10 to 14 Years | 8,418 (7.4%) | 7,719 (6.5%) |
| 15 to 19 Years | 7,316 (6.4%) | 7,004 (5.9%) |
| 20 to 24 Years | 5,876 (5.1%) | 5,796 (4.9%) |
| 25 to 29 Years | 6,204 (5.4%) | 6,283 (5.3%) |
| 30 to 34 Years | 6,495 (5.7%) | 6,756 (5.7%) |
| 35 to 39 Years | 7,537 (6.6%) | 7,307 (6.1%) |
| 40 to 44 Years | 6,445 (5.7%) | 6,881 (5.8%) |
| 45 to 49 Years | 7,153 (6.3%) | 7,520 (6.3%) |
| 50 to 54 Years | 7,395 (6.5%) | 7,909 (6.6%) |
| 55 to 59 Years | 7,781 (6.8%) | 8,043 (6.7%) |
| 60 to 64 Years | 8,258 (7.2%) | 9,556 (8.0%) |
| 65 to 69 Years | 7,052 (6.2%) | 8,221 (6.9%) |
| 70 to 74 Years | 7,066 (6.2%) | 7,343 (6.1%) |
| 75 to 79 Years | 4,486 (3.9%) | 5,297 (4.4%) |
| 80 to 84 Years | 2,547 (2.2%) | 2,821 (2.4%) |
| 85 Years and over | 1,746 (1.5%) | 2,920 (2.5%) |
| Total | 114,077 (100.0%) | 119,343 (100.0%) |
Families and Households in Baldwin County
Median Family Size in Baldwin County
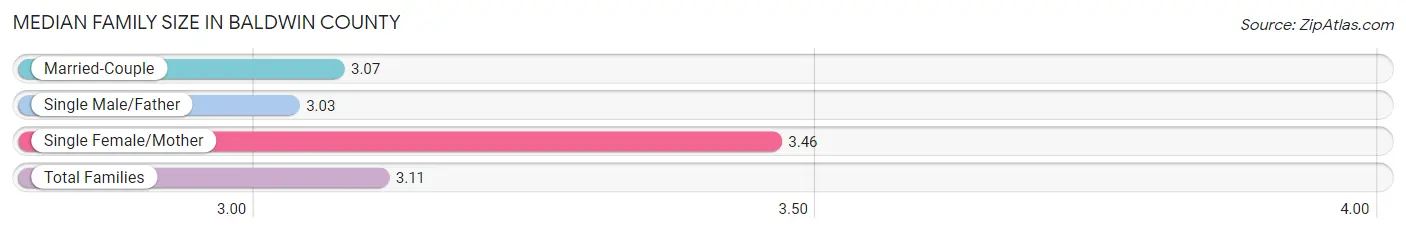
The median family size in Baldwin County is 3.11 persons per family, with single female/mother families (7,425 | 12.1%) accounting for the largest median family size of 3.46 persons per family. On the other hand, single male/father families (2,833 | 4.6%) represent the smallest median family size with 3.03 persons per family.
| Family Type | # Families | Family Size |
| Married-Couple | 51,019 (83.3%) | 3.07 |
| Single Male/Father | 2,833 (4.6%) | 3.03 |
| Single Female/Mother | 7,425 (12.1%) | 3.46 |
| Total Families | 61,277 (100.0%) | 3.11 |
Median Household Size in Baldwin County
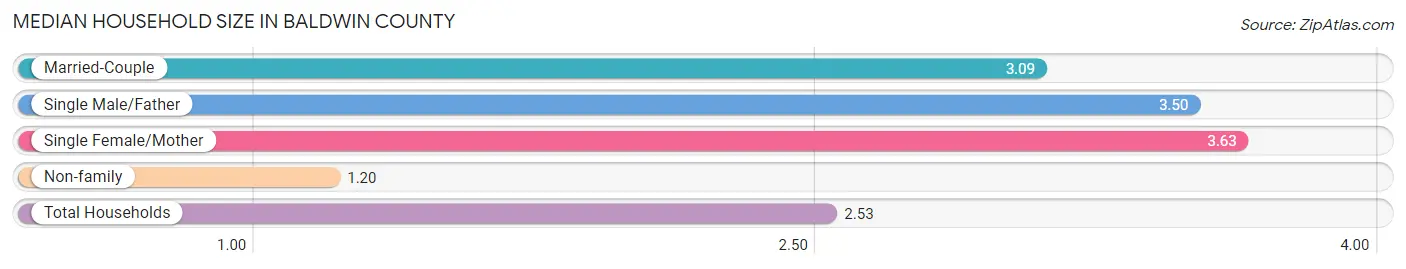
The median household size in Baldwin County is 2.53 persons per household, with single female/mother households (7,425 | 8.2%) accounting for the largest median household size of 3.63 persons per household. non-family households (29,525 | 32.5%) represent the smallest median household size with 1.20 persons per household.
| Household Type | # Households | Household Size |
| Married-Couple | 51,019 (56.2%) | 3.09 |
| Single Male/Father | 2,833 (3.1%) | 3.50 |
| Single Female/Mother | 7,425 (8.2%) | 3.63 |
| Non-family | 29,525 (32.5%) | 1.20 |
| Total Households | 90,802 (100.0%) | 2.53 |
Household Size by Marriage Status in Baldwin County
Out of a total of 90,802 households in Baldwin County, 61,277 (67.5%) are family households, while 29,525 (32.5%) are nonfamily households. The most numerous type of family households are 2-person households, comprising 31,941, and the most common type of nonfamily households are 1-person households, comprising 25,747.
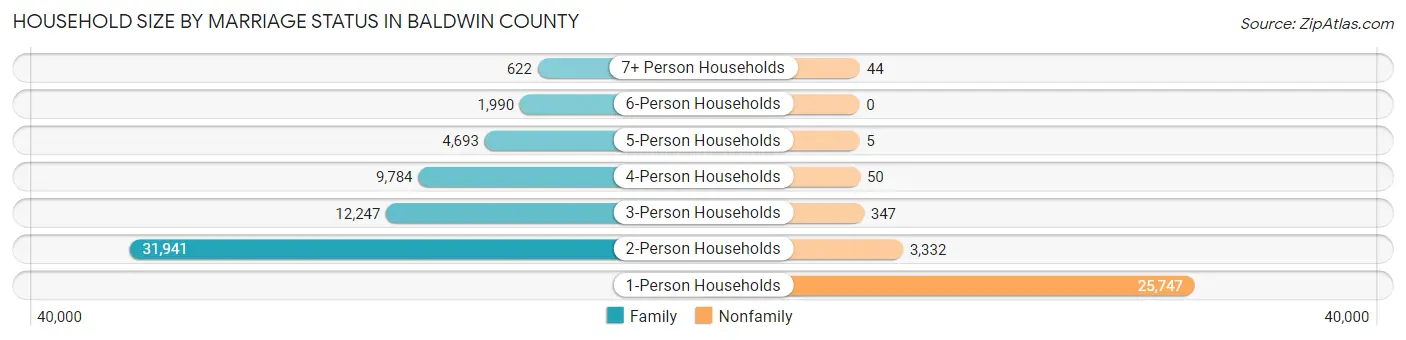
| Household Size | Family Households | Nonfamily Households |
| 1-Person Households | - | 25,747 (28.4%) |
| 2-Person Households | 31,941 (35.2%) | 3,332 (3.7%) |
| 3-Person Households | 12,247 (13.5%) | 347 (0.4%) |
| 4-Person Households | 9,784 (10.8%) | 50 (0.1%) |
| 5-Person Households | 4,693 (5.2%) | 5 (0.0%) |
| 6-Person Households | 1,990 (2.2%) | 0 (0.0%) |
| 7+ Person Households | 622 (0.7%) | 44 (0.1%) |
| Total | 61,277 (67.5%) | 29,525 (32.5%) |
Female Fertility in Baldwin County
Fertility by Age in Baldwin County
Average fertility rate in Baldwin County is 40.0 births per 1,000 women. Women in the age bracket of 20 to 34 years have the highest fertility rate with 81.0 births per 1,000 women. Women in the age bracket of 20 to 34 years acount for 77.9% of all women with births.
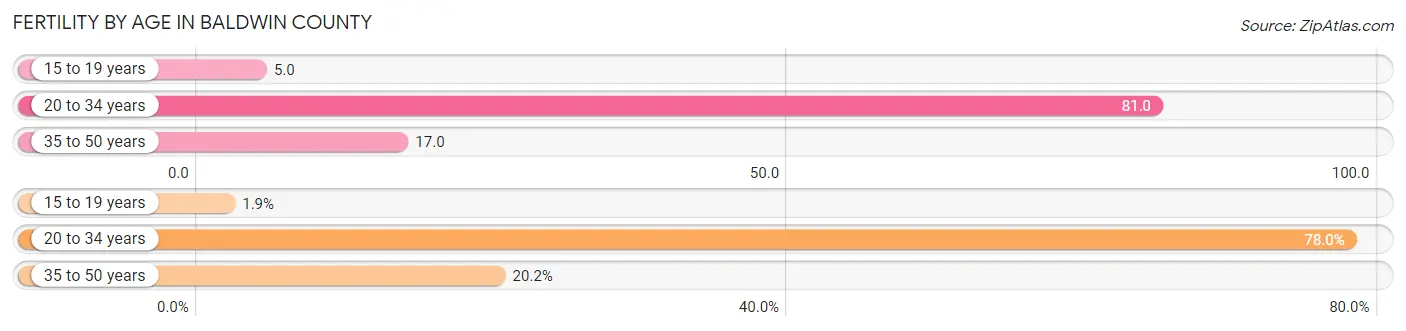
| Age Bracket | Women with Births | Births / 1,000 Women |
| 15 to 19 years | 36 (1.8%) | 5.0 |
| 20 to 34 years | 1,517 (77.9%) | 81.0 |
| 35 to 50 years | 393 (20.2%) | 17.0 |
| Total | 1,946 (100.0%) | 40.0 |
Fertility by Age by Marriage Status in Baldwin County
84.2% of women with births (1,946) in Baldwin County are married. The highest percentage of unmarried women with births falls into 15 to 19 years age bracket with 100.0% of them unmarried at the time of birth, while the lowest percentage of unmarried women with births belong to 35 to 50 years age bracket with 4.1% of them unmarried.
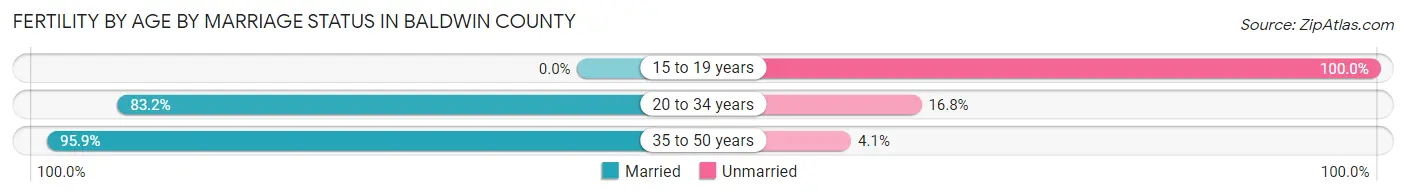
| Age Bracket | Married | Unmarried |
| 15 to 19 years | 0 (0.0%) | 36 (100.0%) |
| 20 to 34 years | 1,262 (83.2%) | 255 (16.8%) |
| 35 to 50 years | 377 (95.9%) | 16 (4.1%) |
| Total | 1,639 (84.2%) | 307 (15.8%) |
Fertility by Education in Baldwin County
Average fertility rate in Baldwin County is 40.0 births per 1,000 women. Women with the education attainment of graduate degree have the highest fertility rate of 60.0 births per 1,000 women, while women with the education attainment of less than high school have the lowest fertility at 12.0 births per 1,000 women. Women with the education attainment of college or associate's degree represent 32.5% of all women with births.
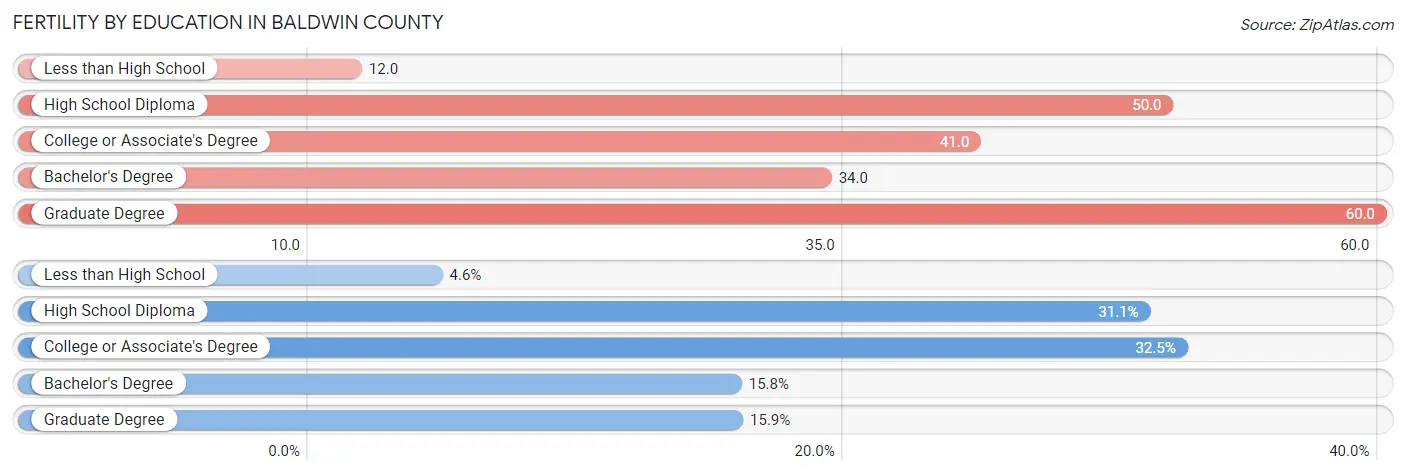
| Educational Attainment | Women with Births | Births / 1,000 Women |
| Less than High School | 90 (4.6%) | 12.0 |
| High School Diploma | 606 (31.1%) | 50.0 |
| College or Associate's Degree | 633 (32.5%) | 41.0 |
| Bachelor's Degree | 308 (15.8%) | 34.0 |
| Graduate Degree | 309 (15.9%) | 60.0 |
| Total | 1,946 (100.0%) | 40.0 |
Fertility by Education by Marriage Status in Baldwin County
15.8% of women with births in Baldwin County are unmarried. Women with the educational attainment of bachelor's degree are most likely to be married with 100.0% of them married at childbirth, while women with the educational attainment of less than high school are least likely to be married with 84.4% of them unmarried at childbirth.
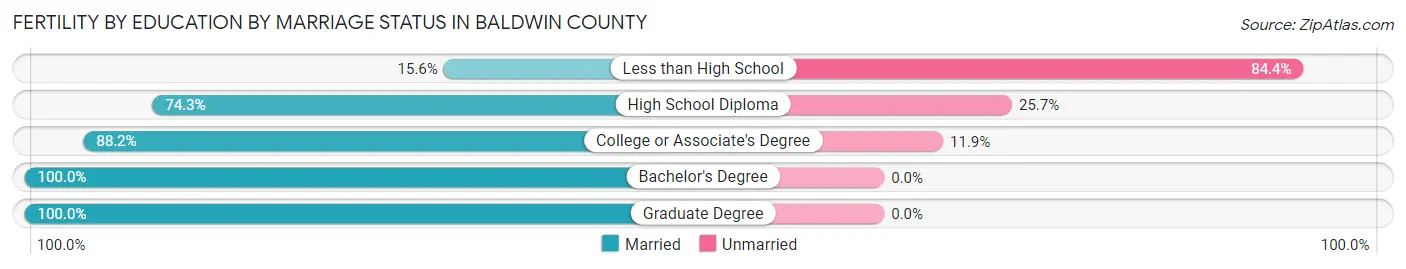
| Educational Attainment | Married | Unmarried |
| Less than High School | 14 (15.6%) | 76 (84.4%) |
| High School Diploma | 450 (74.3%) | 156 (25.7%) |
| College or Associate's Degree | 558 (88.1%) | 75 (11.8%) |
| Bachelor's Degree | 308 (100.0%) | 0 (0.0%) |
| Graduate Degree | 309 (100.0%) | 0 (0.0%) |
| Total | 1,639 (84.2%) | 307 (15.8%) |
Employment Characteristics in Baldwin County
Employment by Class of Employer in Baldwin County
Among the 105,865 employed individuals in Baldwin County, private company employees (70,484 | 66.6%), self-employed (not incorporated) (8,429 | 8.0%), and local government employees (7,941 | 7.5%) make up the most common classes of employment.
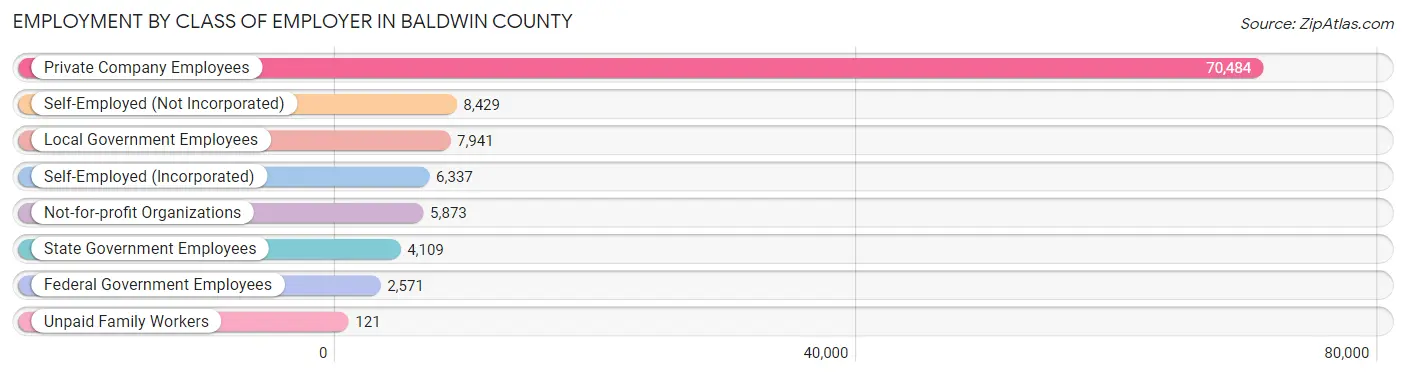
| Employer Class | # Employees | % Employees |
| Private Company Employees | 70,484 | 66.6% |
| Self-Employed (Incorporated) | 6,337 | 6.0% |
| Self-Employed (Not Incorporated) | 8,429 | 8.0% |
| Not-for-profit Organizations | 5,873 | 5.6% |
| Local Government Employees | 7,941 | 7.5% |
| State Government Employees | 4,109 | 3.9% |
| Federal Government Employees | 2,571 | 2.4% |
| Unpaid Family Workers | 121 | 0.1% |
| Total | 105,865 | 100.0% |
Employment Status by Age in Baldwin County
According to the labor force statistics for Baldwin County, out of the total population over 16 years of age (189,569), 59.0% or 111,846 individuals are in the labor force, with 3.4% or 3,803 of them unemployed. The age group with the highest labor force participation rate is 25 to 29 years, with 84.9% or 10,601 individuals in the labor force. Within the labor force, the 20 to 24 years age range has the highest percentage of unemployed individuals, with 9.2% or 827 of them being unemployed.
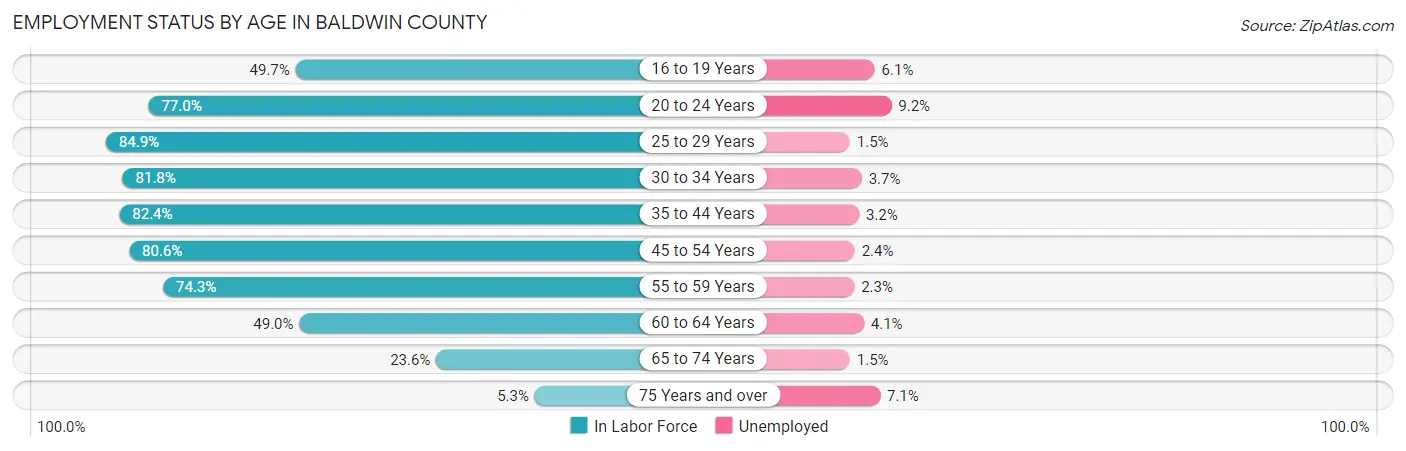
| Age Bracket | In Labor Force | Unemployed |
| 16 to 19 Years | 5,405 (49.7%) | 330 (6.1%) |
| 20 to 24 Years | 8,987 (77.0%) | 827 (9.2%) |
| 25 to 29 Years | 10,601 (84.9%) | 159 (1.5%) |
| 30 to 34 Years | 10,839 (81.8%) | 401 (3.7%) |
| 35 to 44 Years | 23,212 (82.4%) | 743 (3.2%) |
| 45 to 54 Years | 24,161 (80.6%) | 580 (2.4%) |
| 55 to 59 Years | 11,757 (74.3%) | 270 (2.3%) |
| 60 to 64 Years | 8,729 (49.0%) | 358 (4.1%) |
| 65 to 74 Years | 7,005 (23.6%) | 105 (1.5%) |
| 75 Years and over | 1,050 (5.3%) | 75 (7.1%) |
| Total | 111,846 (59.0%) | 3,803 (3.4%) |
Employment Status by Educational Attainment in Baldwin County
According to labor force statistics for Baldwin County, 76.0% of individuals (89,317) out of the total population between 25 and 64 years of age (117,523) are in the labor force, with 2.8% or 2,501 of them being unemployed. The group with the highest labor force participation rate are those with the educational attainment of bachelor's degree or higher, with 82.9% or 31,918 individuals in the labor force. Within the labor force, individuals with less than high school education have the highest percentage of unemployment, with 11.3% or 662 of them being unemployed.
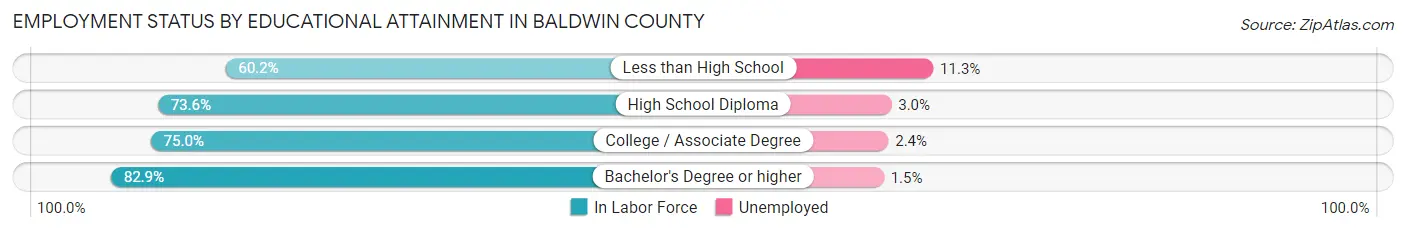
| Educational Attainment | In Labor Force | Unemployed |
| Less than High School | 5,854 (60.2%) | 1,099 (11.3%) |
| High School Diploma | 23,563 (73.6%) | 960 (3.0%) |
| College / Associate Degree | 27,961 (75.0%) | 895 (2.4%) |
| Bachelor's Degree or higher | 31,918 (82.9%) | 578 (1.5%) |
| Total | 89,317 (76.0%) | 3,291 (2.8%) |
Employment Occupations by Sex in Baldwin County
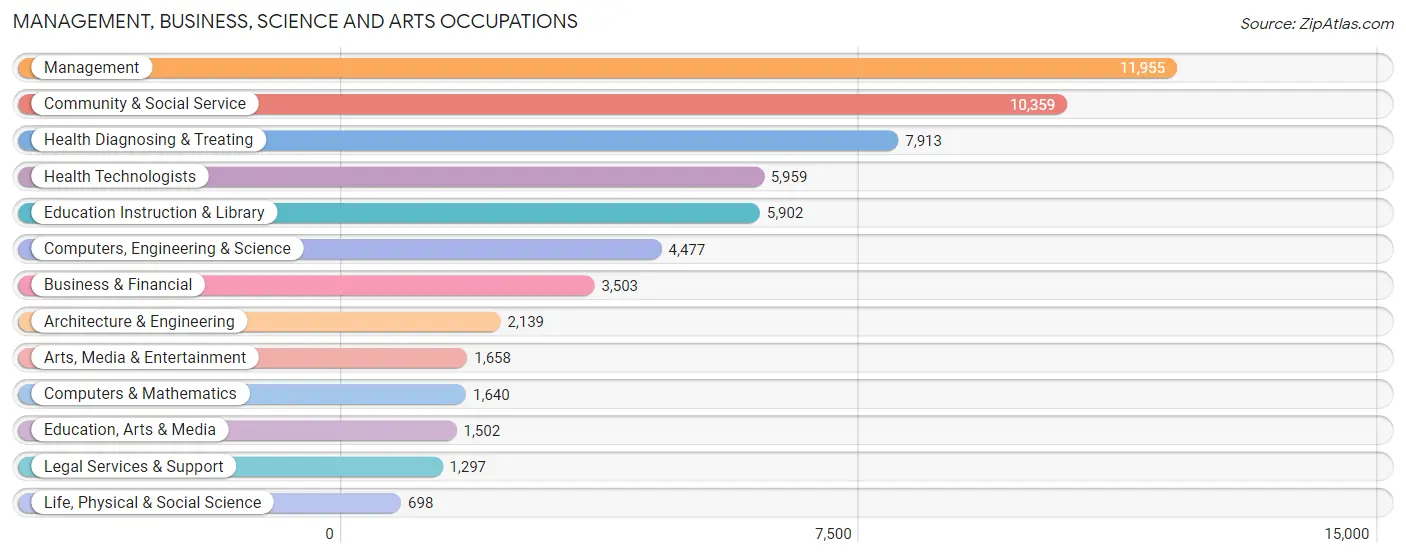
Management, Business, Science and Arts Occupations
The most common Management, Business, Science and Arts occupations in Baldwin County are Management (11,955 | 11.2%), Community & Social Service (10,359 | 9.7%), Health Diagnosing & Treating (7,913 | 7.4%), Health Technologists (5,959 | 5.6%), and Education Instruction & Library (5,902 | 5.5%).
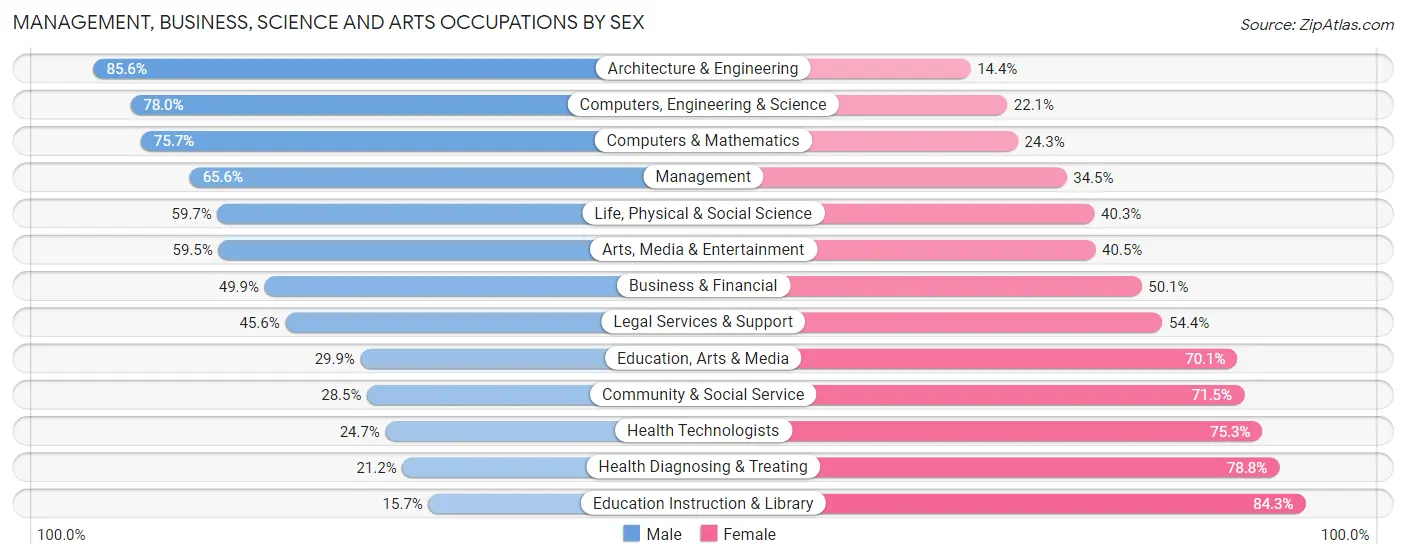
Management, Business, Science and Arts Occupations by Sex
Within the Management, Business, Science and Arts occupations in Baldwin County, the most male-oriented occupations are Architecture & Engineering (85.6%), Computers, Engineering & Science (77.9%), and Computers & Mathematics (75.7%), while the most female-oriented occupations are Education Instruction & Library (84.3%), Health Diagnosing & Treating (78.8%), and Health Technologists (75.3%).
| Occupation | Male | Female |
| Management | 7,837 (65.5%) | 4,118 (34.4%) |
| Business & Financial | 1,748 (49.9%) | 1,755 (50.1%) |
| Computers, Engineering & Science | 3,490 (77.9%) | 987 (22.1%) |
| Computers & Mathematics | 1,242 (75.7%) | 398 (24.3%) |
| Architecture & Engineering | 1,831 (85.6%) | 308 (14.4%) |
| Life, Physical & Social Science | 417 (59.7%) | 281 (40.3%) |
| Community & Social Service | 2,954 (28.5%) | 7,405 (71.5%) |
| Education, Arts & Media | 449 (29.9%) | 1,053 (70.1%) |
| Legal Services & Support | 591 (45.6%) | 706 (54.4%) |
| Education Instruction & Library | 927 (15.7%) | 4,975 (84.3%) |
| Arts, Media & Entertainment | 987 (59.5%) | 671 (40.5%) |
| Health Diagnosing & Treating | 1,675 (21.2%) | 6,238 (78.8%) |
| Health Technologists | 1,470 (24.7%) | 4,489 (75.3%) |
| Total (Category) | 17,704 (46.3%) | 20,503 (53.7%) |
| Total (Overall) | 56,117 (52.3%) | 51,137 (47.7%) |
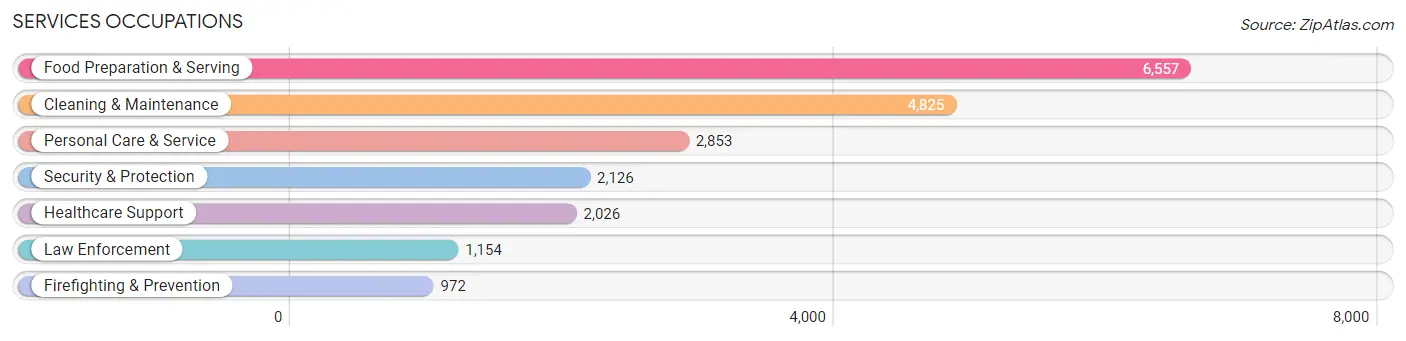
Services Occupations
The most common Services occupations in Baldwin County are Food Preparation & Serving (6,557 | 6.1%), Cleaning & Maintenance (4,825 | 4.5%), Personal Care & Service (2,853 | 2.7%), Security & Protection (2,126 | 2.0%), and Healthcare Support (2,026 | 1.9%).
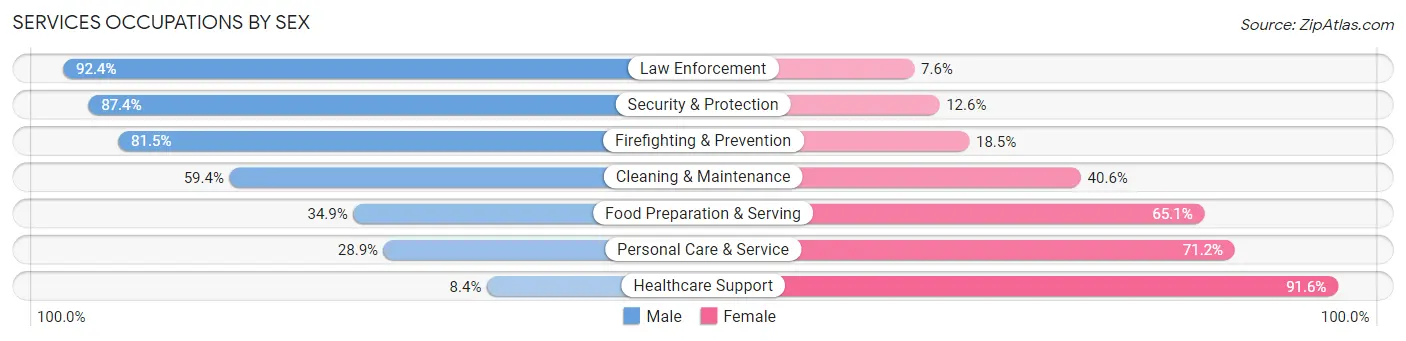
Services Occupations by Sex
Within the Services occupations in Baldwin County, the most male-oriented occupations are Law Enforcement (92.4%), Security & Protection (87.4%), and Firefighting & Prevention (81.5%), while the most female-oriented occupations are Healthcare Support (91.6%), Personal Care & Service (71.2%), and Food Preparation & Serving (65.1%).
| Occupation | Male | Female |
| Healthcare Support | 170 (8.4%) | 1,856 (91.6%) |
| Security & Protection | 1,858 (87.4%) | 268 (12.6%) |
| Firefighting & Prevention | 792 (81.5%) | 180 (18.5%) |
| Law Enforcement | 1,066 (92.4%) | 88 (7.6%) |
| Food Preparation & Serving | 2,286 (34.9%) | 4,271 (65.1%) |
| Cleaning & Maintenance | 2,865 (59.4%) | 1,960 (40.6%) |
| Personal Care & Service | 823 (28.8%) | 2,030 (71.2%) |
| Total (Category) | 8,002 (43.5%) | 10,385 (56.5%) |
| Total (Overall) | 56,117 (52.3%) | 51,137 (47.7%) |
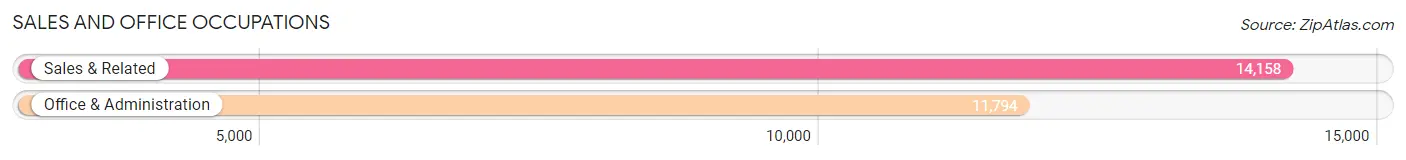
Sales and Office Occupations
The most common Sales and Office occupations in Baldwin County are Sales & Related (14,158 | 13.2%), and Office & Administration (11,794 | 11.0%).
Sales and Office Occupations by Sex

| Occupation | Male | Female |
| Sales & Related | 7,323 (51.7%) | 6,835 (48.3%) |
| Office & Administration | 2,092 (17.7%) | 9,702 (82.3%) |
| Total (Category) | 9,415 (36.3%) | 16,537 (63.7%) |
| Total (Overall) | 56,117 (52.3%) | 51,137 (47.7%) |
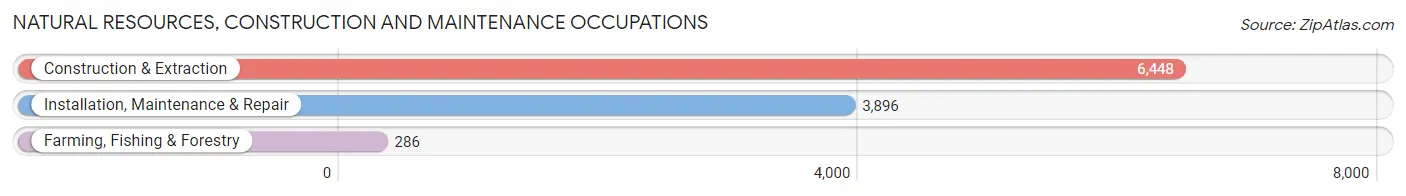
Natural Resources, Construction and Maintenance Occupations
The most common Natural Resources, Construction and Maintenance occupations in Baldwin County are Construction & Extraction (6,448 | 6.0%), Installation, Maintenance & Repair (3,896 | 3.6%), and Farming, Fishing & Forestry (286 | 0.3%).
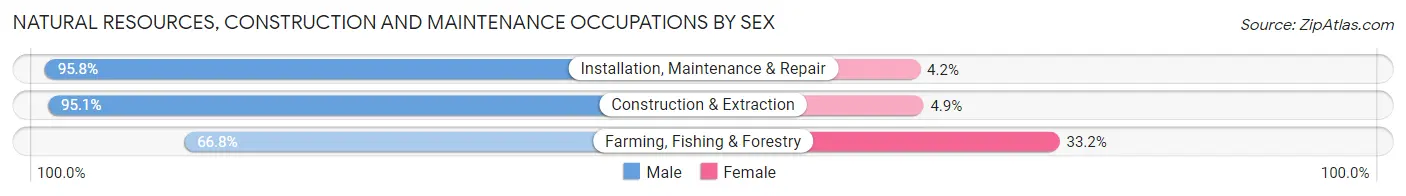
Natural Resources, Construction and Maintenance Occupations by Sex
| Occupation | Male | Female |
| Farming, Fishing & Forestry | 191 (66.8%) | 95 (33.2%) |
| Construction & Extraction | 6,132 (95.1%) | 316 (4.9%) |
| Installation, Maintenance & Repair | 3,732 (95.8%) | 164 (4.2%) |
| Total (Category) | 10,055 (94.6%) | 575 (5.4%) |
| Total (Overall) | 56,117 (52.3%) | 51,137 (47.7%) |
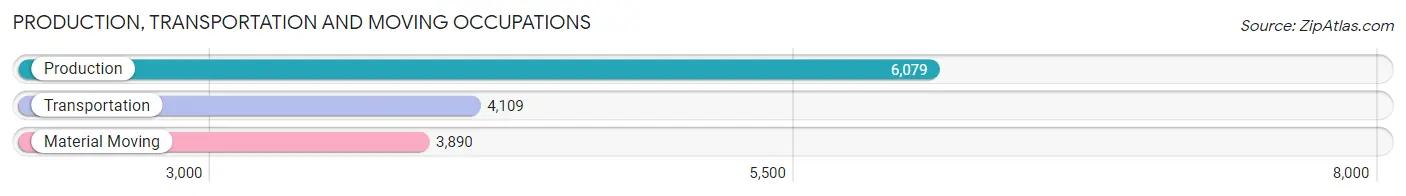
Production, Transportation and Moving Occupations
The most common Production, Transportation and Moving occupations in Baldwin County are Production (6,079 | 5.7%), Transportation (4,109 | 3.8%), and Material Moving (3,890 | 3.6%).
Production, Transportation and Moving Occupations by Sex
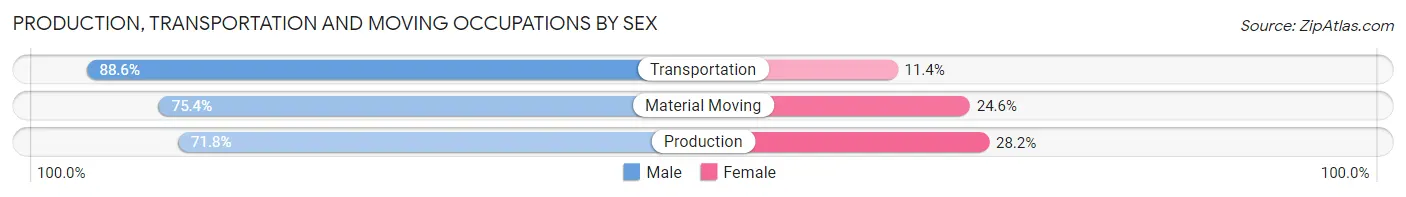
| Occupation | Male | Female |
| Production | 4,367 (71.8%) | 1,712 (28.2%) |
| Transportation | 3,642 (88.6%) | 467 (11.4%) |
| Material Moving | 2,932 (75.4%) | 958 (24.6%) |
| Total (Category) | 10,941 (77.7%) | 3,137 (22.3%) |
| Total (Overall) | 56,117 (52.3%) | 51,137 (47.7%) |
Employment Industries by Sex in Baldwin County
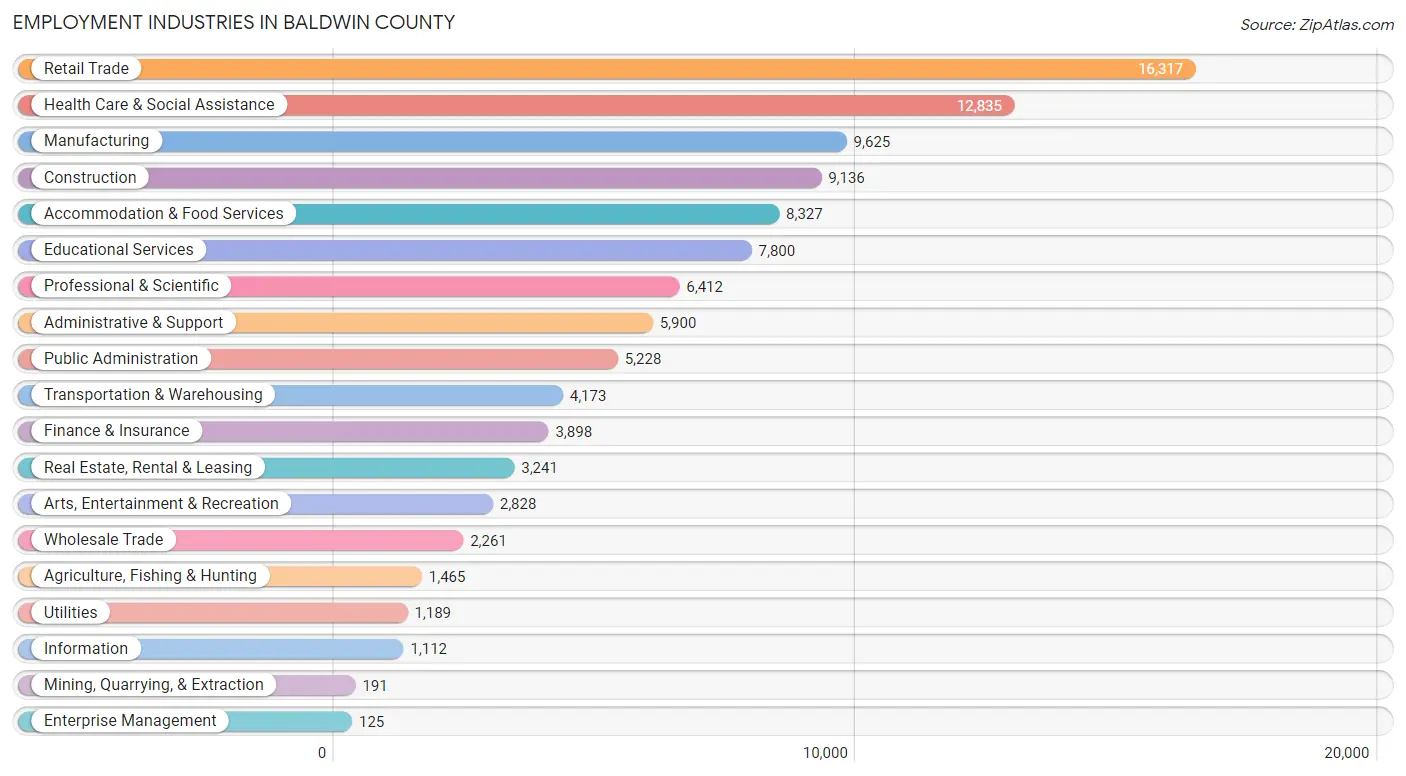
Employment Industries in Baldwin County
The major employment industries in Baldwin County include Retail Trade (16,317 | 15.2%), Health Care & Social Assistance (12,835 | 12.0%), Manufacturing (9,625 | 9.0%), Construction (9,136 | 8.5%), and Accommodation & Food Services (8,327 | 7.8%).
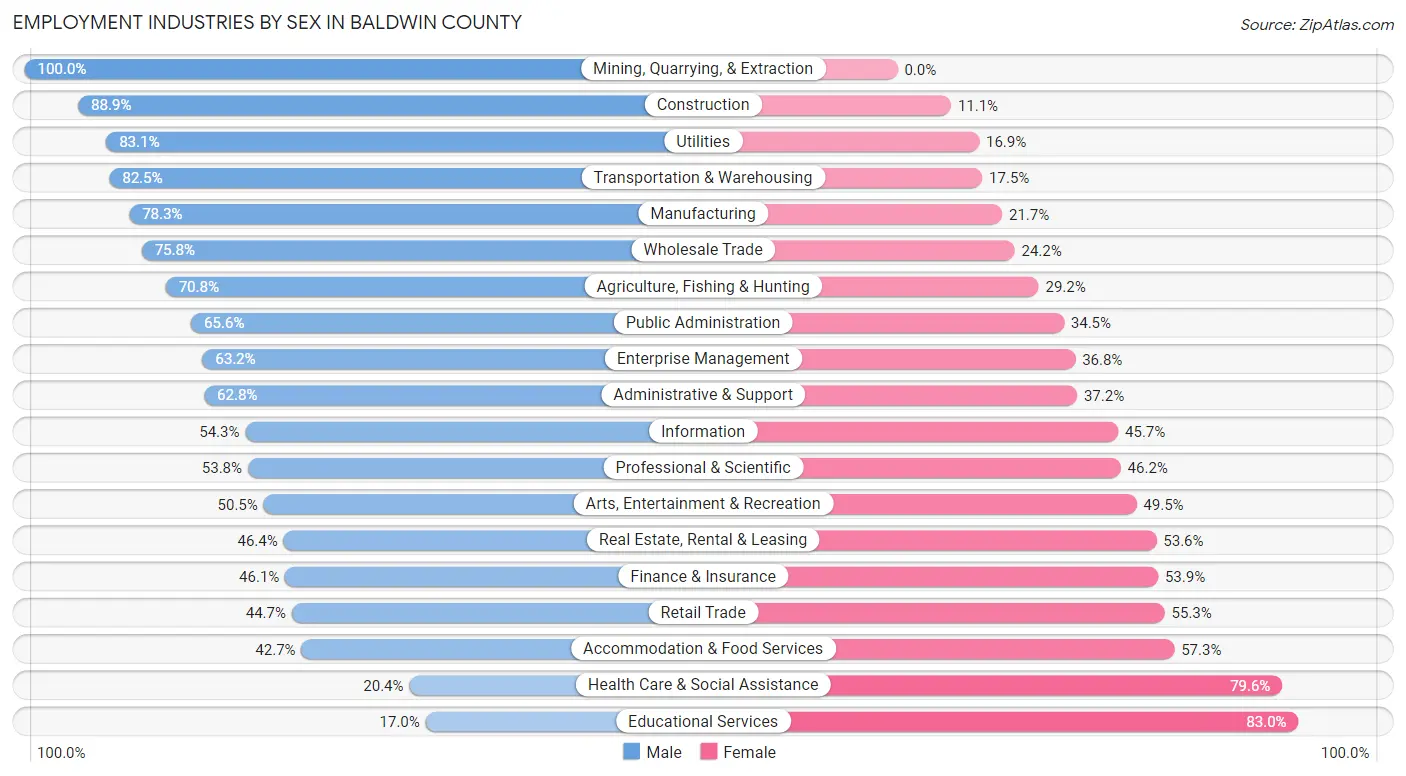
Employment Industries by Sex in Baldwin County
The Baldwin County industries that see more men than women are Mining, Quarrying, & Extraction (100.0%), Construction (88.9%), and Utilities (83.1%), whereas the industries that tend to have a higher number of women are Educational Services (83.0%), Health Care & Social Assistance (79.6%), and Accommodation & Food Services (57.3%).
| Industry | Male | Female |
| Agriculture, Fishing & Hunting | 1,037 (70.8%) | 428 (29.2%) |
| Mining, Quarrying, & Extraction | 191 (100.0%) | 0 (0.0%) |
| Construction | 8,124 (88.9%) | 1,012 (11.1%) |
| Manufacturing | 7,540 (78.3%) | 2,085 (21.7%) |
| Wholesale Trade | 1,713 (75.8%) | 548 (24.2%) |
| Retail Trade | 7,294 (44.7%) | 9,023 (55.3%) |
| Transportation & Warehousing | 3,441 (82.5%) | 732 (17.5%) |
| Utilities | 988 (83.1%) | 201 (16.9%) |
| Information | 604 (54.3%) | 508 (45.7%) |
| Finance & Insurance | 1,796 (46.1%) | 2,102 (53.9%) |
| Real Estate, Rental & Leasing | 1,504 (46.4%) | 1,737 (53.6%) |
| Professional & Scientific | 3,449 (53.8%) | 2,963 (46.2%) |
| Enterprise Management | 79 (63.2%) | 46 (36.8%) |
| Administrative & Support | 3,707 (62.8%) | 2,193 (37.2%) |
| Educational Services | 1,326 (17.0%) | 6,474 (83.0%) |
| Health Care & Social Assistance | 2,613 (20.4%) | 10,222 (79.6%) |
| Arts, Entertainment & Recreation | 1,429 (50.5%) | 1,399 (49.5%) |
| Accommodation & Food Services | 3,556 (42.7%) | 4,771 (57.3%) |
| Public Administration | 3,427 (65.5%) | 1,801 (34.4%) |
| Total | 56,117 (52.3%) | 51,137 (47.7%) |
Education in Baldwin County
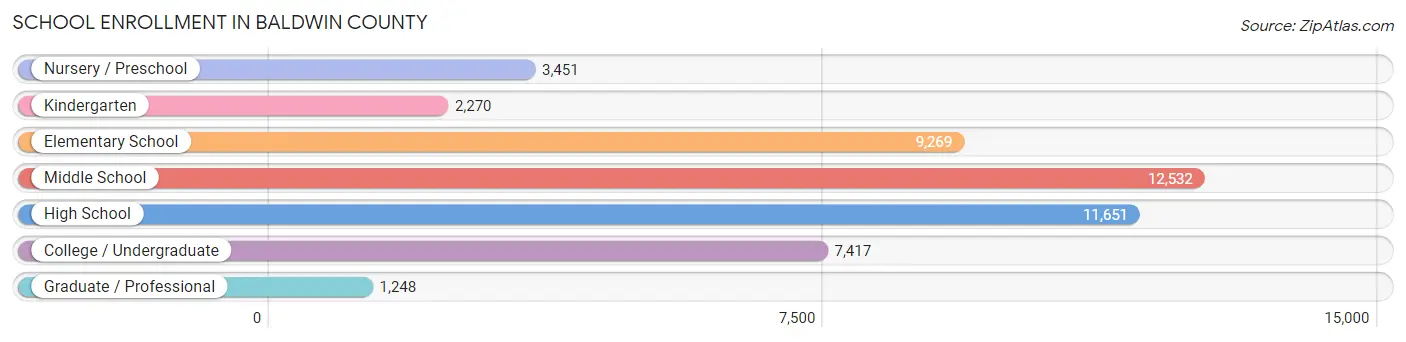
School Enrollment in Baldwin County
The most common levels of schooling among the 47,838 students in Baldwin County are middle school (12,532 | 26.2%), high school (11,651 | 24.4%), and elementary school (9,269 | 19.4%).
| School Level | # Students | % Students |
| Nursery / Preschool | 3,451 | 7.2% |
| Kindergarten | 2,270 | 4.8% |
| Elementary School | 9,269 | 19.4% |
| Middle School | 12,532 | 26.2% |
| High School | 11,651 | 24.4% |
| College / Undergraduate | 7,417 | 15.5% |
| Graduate / Professional | 1,248 | 2.6% |
| Total | 47,838 | 100.0% |
School Enrollment by Age by Funding Source in Baldwin County
Out of a total of 47,838 students who are enrolled in schools in Baldwin County, 9,376 (19.6%) attend a private institution, while the remaining 38,462 (80.4%) are enrolled in public schools. The age group of 3 to 4 year olds has the highest likelihood of being enrolled in private schools, with 1,006 (41.1% in the age bracket) enrolled. Conversely, the age group of 35 years and over has the lowest likelihood of being enrolled in a private school, with 1,497 (88.0% in the age bracket) attending a public institution.
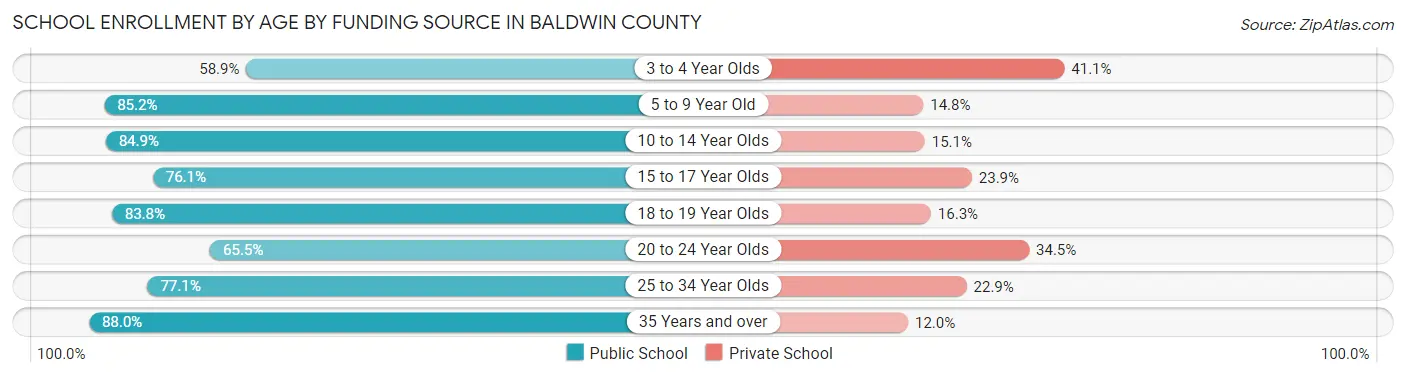
| Age Bracket | Public School | Private School |
| 3 to 4 Year Olds | 1,441 (58.9%) | 1,006 (41.1%) |
| 5 to 9 Year Old | 9,255 (85.2%) | 1,612 (14.8%) |
| 10 to 14 Year Olds | 13,229 (84.9%) | 2,355 (15.1%) |
| 15 to 17 Year Olds | 6,366 (76.1%) | 1,997 (23.9%) |
| 18 to 19 Year Olds | 3,010 (83.8%) | 584 (16.3%) |
| 20 to 24 Year Olds | 2,291 (65.5%) | 1,209 (34.5%) |
| 25 to 34 Year Olds | 1,374 (77.1%) | 408 (22.9%) |
| 35 Years and over | 1,497 (88.0%) | 204 (12.0%) |
| Total | 38,462 (80.4%) | 9,376 (19.6%) |
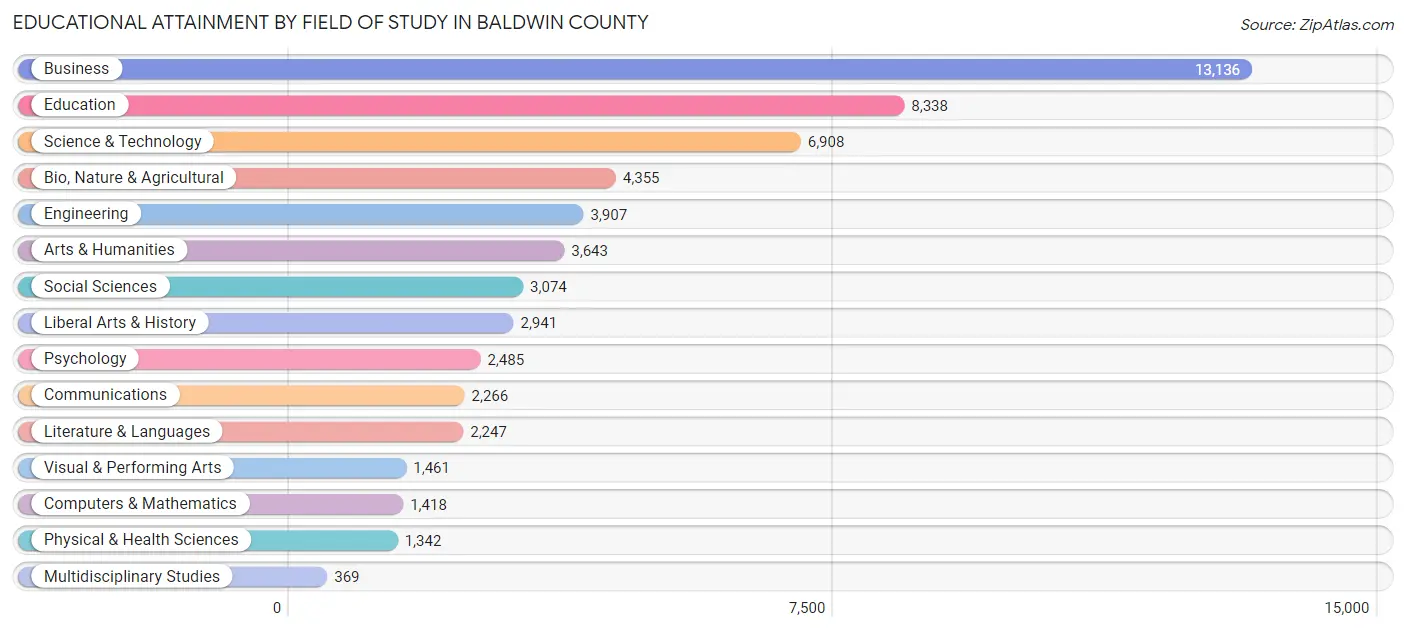
Educational Attainment by Field of Study in Baldwin County
Business (13,136 | 22.7%), education (8,338 | 14.4%), science & technology (6,908 | 11.9%), bio, nature & agricultural (4,355 | 7.5%), and engineering (3,907 | 6.8%) are the most common fields of study among 57,890 individuals in Baldwin County who have obtained a bachelor's degree or higher.
| Field of Study | # Graduates | % Graduates |
| Computers & Mathematics | 1,418 | 2.5% |
| Bio, Nature & Agricultural | 4,355 | 7.5% |
| Physical & Health Sciences | 1,342 | 2.3% |
| Psychology | 2,485 | 4.3% |
| Social Sciences | 3,074 | 5.3% |
| Engineering | 3,907 | 6.8% |
| Multidisciplinary Studies | 369 | 0.6% |
| Science & Technology | 6,908 | 11.9% |
| Business | 13,136 | 22.7% |
| Education | 8,338 | 14.4% |
| Literature & Languages | 2,247 | 3.9% |
| Liberal Arts & History | 2,941 | 5.1% |
| Visual & Performing Arts | 1,461 | 2.5% |
| Communications | 2,266 | 3.9% |
| Arts & Humanities | 3,643 | 6.3% |
| Total | 57,890 | 100.0% |
Transportation & Commute in Baldwin County
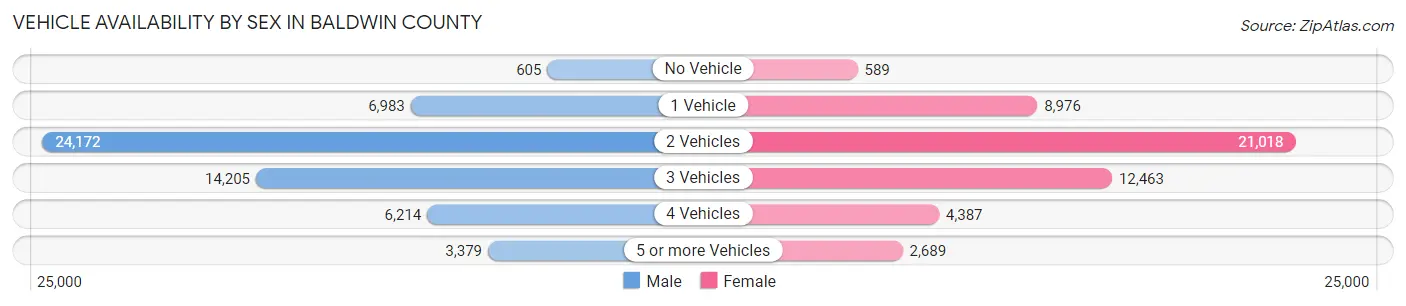
Vehicle Availability by Sex in Baldwin County
The most prevalent vehicle ownership categories in Baldwin County are males with 2 vehicles (24,172, accounting for 43.5%) and females with 2 vehicles (21,018, making up 48.2%).
| Vehicles Available | Male | Female |
| No Vehicle | 605 (1.1%) | 589 (1.2%) |
| 1 Vehicle | 6,983 (12.6%) | 8,976 (17.9%) |
| 2 Vehicles | 24,172 (43.5%) | 21,018 (41.9%) |
| 3 Vehicles | 14,205 (25.6%) | 12,463 (24.9%) |
| 4 Vehicles | 6,214 (11.2%) | 4,387 (8.7%) |
| 5 or more Vehicles | 3,379 (6.1%) | 2,689 (5.4%) |
| Total | 55,558 (100.0%) | 50,122 (100.0%) |
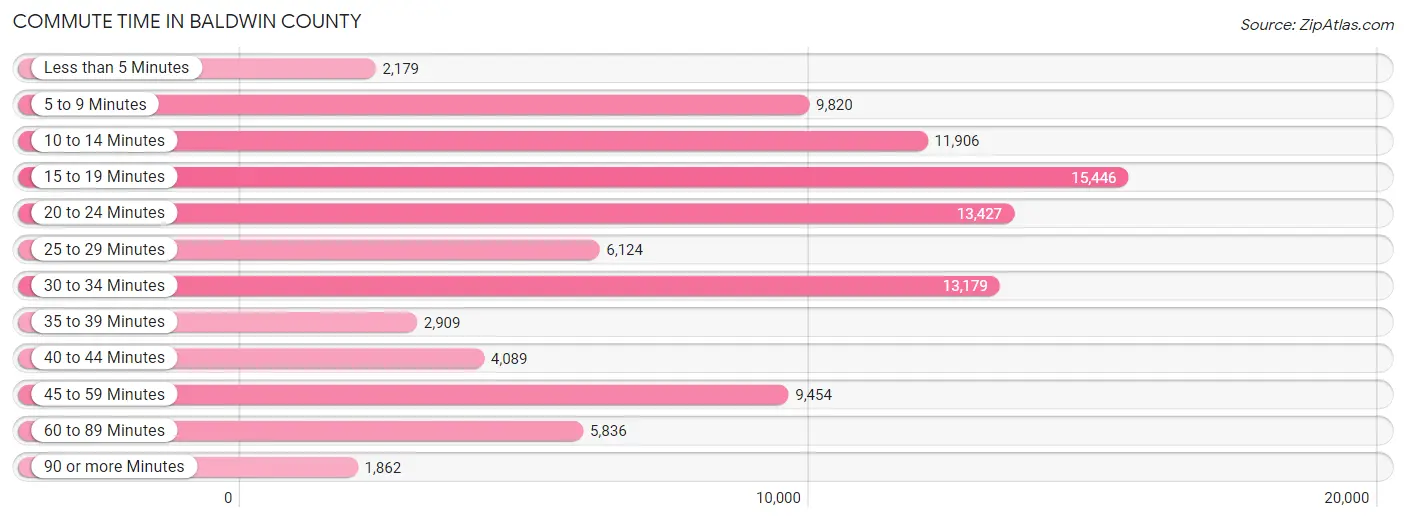
Commute Time in Baldwin County
The most frequently occuring commute durations in Baldwin County are 15 to 19 minutes (15,446 commuters, 16.1%), 20 to 24 minutes (13,427 commuters, 14.0%), and 30 to 34 minutes (13,179 commuters, 13.7%).
| Commute Time | # Commuters | % Commuters |
| Less than 5 Minutes | 2,179 | 2.3% |
| 5 to 9 Minutes | 9,820 | 10.2% |
| 10 to 14 Minutes | 11,906 | 12.4% |
| 15 to 19 Minutes | 15,446 | 16.1% |
| 20 to 24 Minutes | 13,427 | 14.0% |
| 25 to 29 Minutes | 6,124 | 6.4% |
| 30 to 34 Minutes | 13,179 | 13.7% |
| 35 to 39 Minutes | 2,909 | 3.0% |
| 40 to 44 Minutes | 4,089 | 4.3% |
| 45 to 59 Minutes | 9,454 | 9.8% |
| 60 to 89 Minutes | 5,836 | 6.1% |
| 90 or more Minutes | 1,862 | 1.9% |
Commute Time by Sex in Baldwin County
The most common commute times in Baldwin County are 15 to 19 minutes (7,853 commuters, 15.4%) for males and 15 to 19 minutes (7,593 commuters, 16.7%) for females.
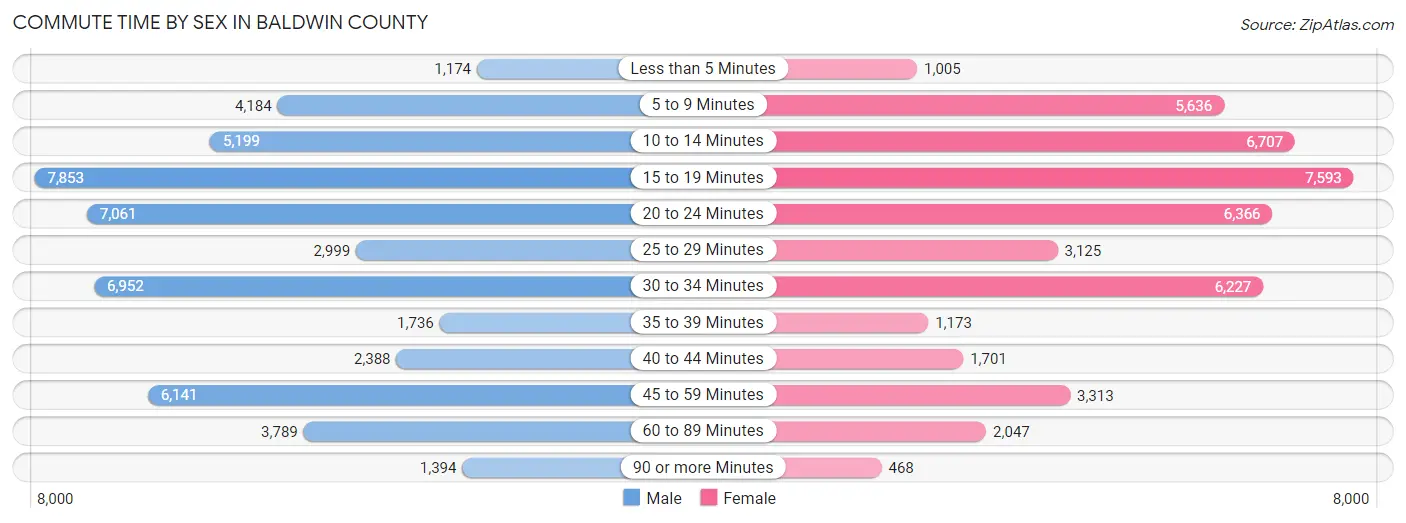
| Commute Time | Male | Female |
| Less than 5 Minutes | 1,174 (2.3%) | 1,005 (2.2%) |
| 5 to 9 Minutes | 4,184 (8.2%) | 5,636 (12.4%) |
| 10 to 14 Minutes | 5,199 (10.2%) | 6,707 (14.8%) |
| 15 to 19 Minutes | 7,853 (15.4%) | 7,593 (16.7%) |
| 20 to 24 Minutes | 7,061 (13.9%) | 6,366 (14.0%) |
| 25 to 29 Minutes | 2,999 (5.9%) | 3,125 (6.9%) |
| 30 to 34 Minutes | 6,952 (13.7%) | 6,227 (13.7%) |
| 35 to 39 Minutes | 1,736 (3.4%) | 1,173 (2.6%) |
| 40 to 44 Minutes | 2,388 (4.7%) | 1,701 (3.7%) |
| 45 to 59 Minutes | 6,141 (12.1%) | 3,313 (7.3%) |
| 60 to 89 Minutes | 3,789 (7.4%) | 2,047 (4.5%) |
| 90 or more Minutes | 1,394 (2.7%) | 468 (1.0%) |
Time of Departure to Work by Sex in Baldwin County
The most frequent times of departure to work in Baldwin County are 7:00 AM to 7:29 AM (9,207, 18.1%) for males and 7:00 AM to 7:29 AM (8,018, 17.7%) for females.
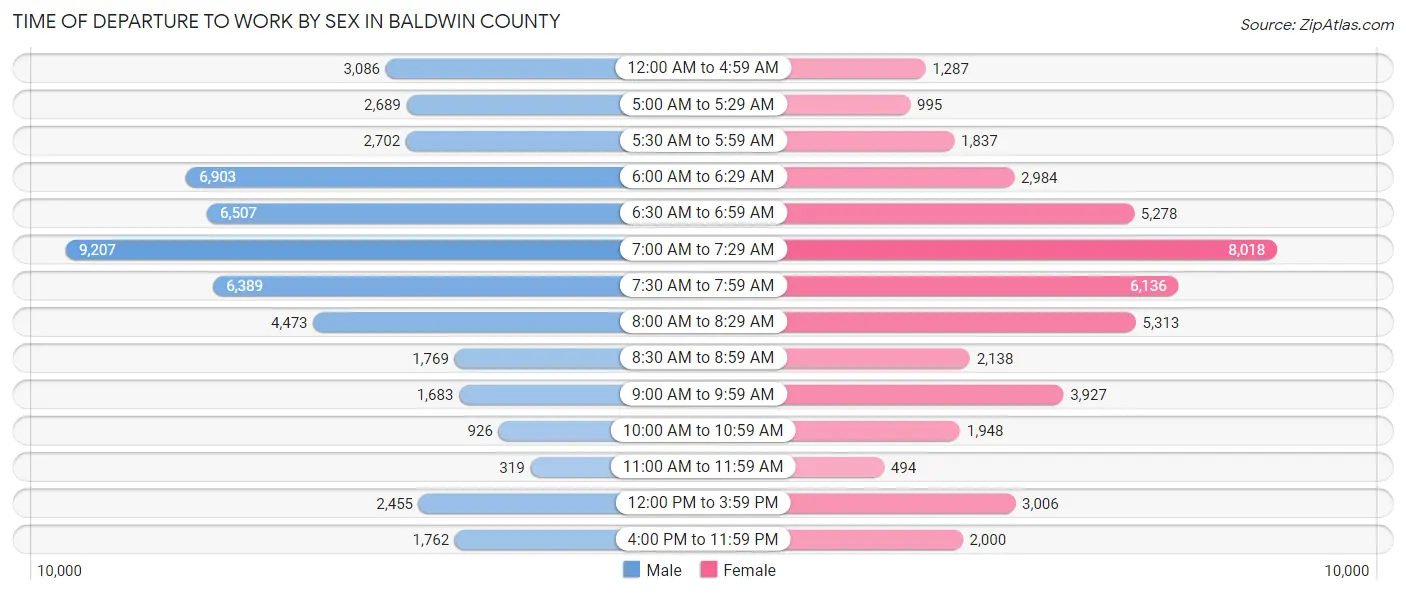
| Time of Departure | Male | Female |
| 12:00 AM to 4:59 AM | 3,086 (6.1%) | 1,287 (2.8%) |
| 5:00 AM to 5:29 AM | 2,689 (5.3%) | 995 (2.2%) |
| 5:30 AM to 5:59 AM | 2,702 (5.3%) | 1,837 (4.1%) |
| 6:00 AM to 6:29 AM | 6,903 (13.6%) | 2,984 (6.6%) |
| 6:30 AM to 6:59 AM | 6,507 (12.8%) | 5,278 (11.6%) |
| 7:00 AM to 7:29 AM | 9,207 (18.1%) | 8,018 (17.7%) |
| 7:30 AM to 7:59 AM | 6,389 (12.6%) | 6,136 (13.5%) |
| 8:00 AM to 8:29 AM | 4,473 (8.8%) | 5,313 (11.7%) |
| 8:30 AM to 8:59 AM | 1,769 (3.5%) | 2,138 (4.7%) |
| 9:00 AM to 9:59 AM | 1,683 (3.3%) | 3,927 (8.7%) |
| 10:00 AM to 10:59 AM | 926 (1.8%) | 1,948 (4.3%) |
| 11:00 AM to 11:59 AM | 319 (0.6%) | 494 (1.1%) |
| 12:00 PM to 3:59 PM | 2,455 (4.8%) | 3,006 (6.6%) |
| 4:00 PM to 11:59 PM | 1,762 (3.5%) | 2,000 (4.4%) |
| Total | 50,870 (100.0%) | 45,361 (100.0%) |
Housing Occupancy in Baldwin County
Occupancy by Ownership in Baldwin County
Of the total 90,802 dwellings in Baldwin County, owner-occupied units account for 70,708 (77.9%), while renter-occupied units make up 20,094 (22.1%).
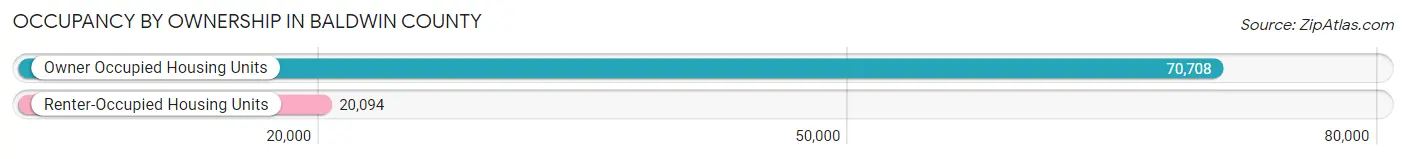
| Occupancy | # Housing Units | % Housing Units |
| Owner Occupied Housing Units | 70,708 | 77.9% |
| Renter-Occupied Housing Units | 20,094 | 22.1% |
| Total Occupied Housing Units | 90,802 | 100.0% |
Occupancy by Household Size in Baldwin County
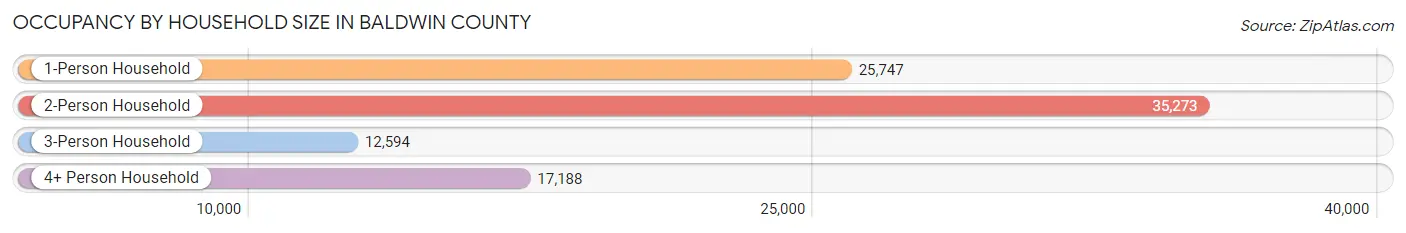
| Household Size | # Housing Units | % Housing Units |
| 1-Person Household | 25,747 | 28.4% |
| 2-Person Household | 35,273 | 38.9% |
| 3-Person Household | 12,594 | 13.9% |
| 4+ Person Household | 17,188 | 18.9% |
| Total Housing Units | 90,802 | 100.0% |
Occupancy by Ownership by Household Size in Baldwin County
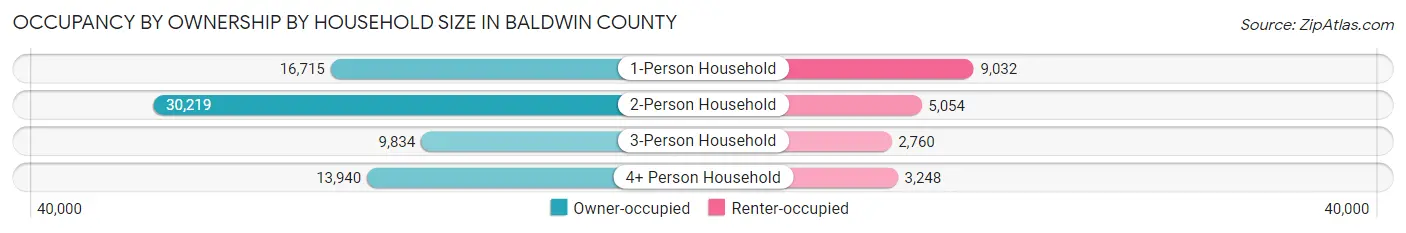
| Household Size | Owner-occupied | Renter-occupied |
| 1-Person Household | 16,715 (64.9%) | 9,032 (35.1%) |
| 2-Person Household | 30,219 (85.7%) | 5,054 (14.3%) |
| 3-Person Household | 9,834 (78.1%) | 2,760 (21.9%) |
| 4+ Person Household | 13,940 (81.1%) | 3,248 (18.9%) |
| Total Housing Units | 70,708 (77.9%) | 20,094 (22.1%) |
Occupancy by Educational Attainment in Baldwin County
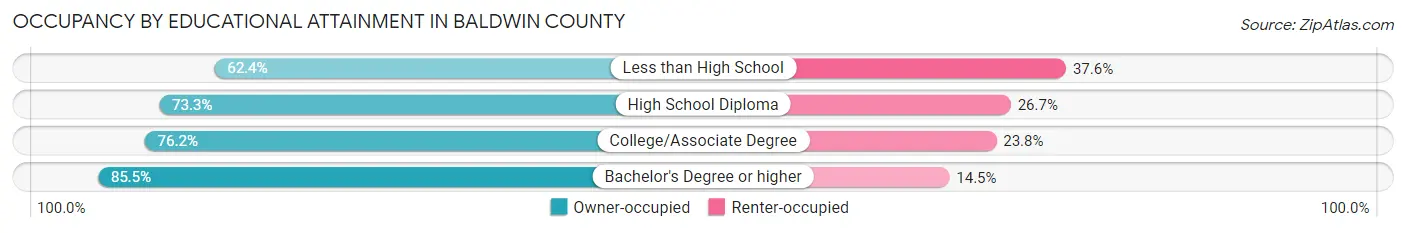
| Household Size | Owner-occupied | Renter-occupied |
| Less than High School | 3,931 (62.4%) | 2,372 (37.6%) |
| High School Diploma | 16,908 (73.3%) | 6,153 (26.7%) |
| College/Associate Degree | 21,745 (76.2%) | 6,795 (23.8%) |
| Bachelor's Degree or higher | 28,124 (85.5%) | 4,774 (14.5%) |
Occupancy by Age of Householder in Baldwin County
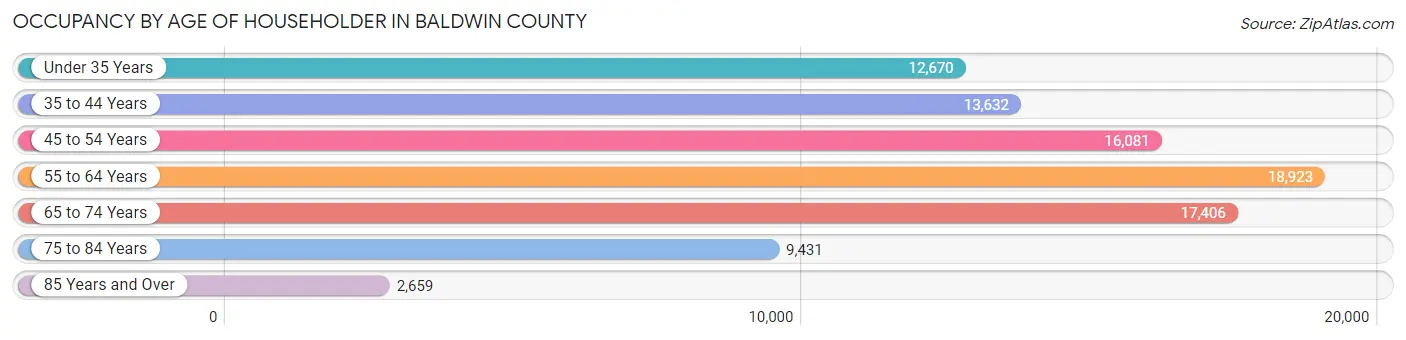
| Age Bracket | # Households | % Households |
| Under 35 Years | 12,670 | 14.0% |
| 35 to 44 Years | 13,632 | 15.0% |
| 45 to 54 Years | 16,081 | 17.7% |
| 55 to 64 Years | 18,923 | 20.8% |
| 65 to 74 Years | 17,406 | 19.2% |
| 75 to 84 Years | 9,431 | 10.4% |
| 85 Years and Over | 2,659 | 2.9% |
| Total | 90,802 | 100.0% |
Housing Finances in Baldwin County
Median Income by Occupancy in Baldwin County
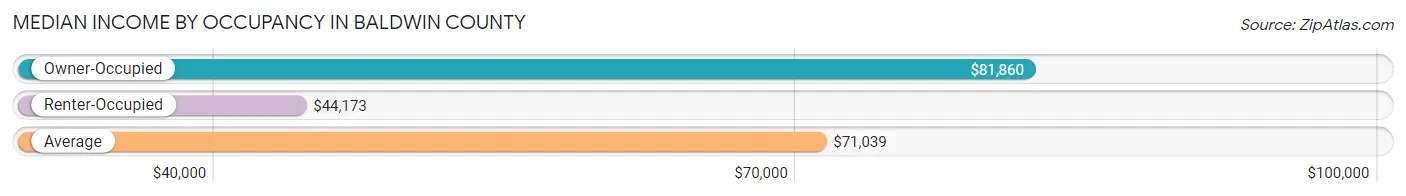
| Occupancy Type | # Households | Median Income |
| Owner-Occupied | 70,708 (77.9%) | $81,860 |
| Renter-Occupied | 20,094 (22.1%) | $44,173 |
| Average | 90,802 (100.0%) | $71,039 |
Occupancy by Householder Income Bracket in Baldwin County
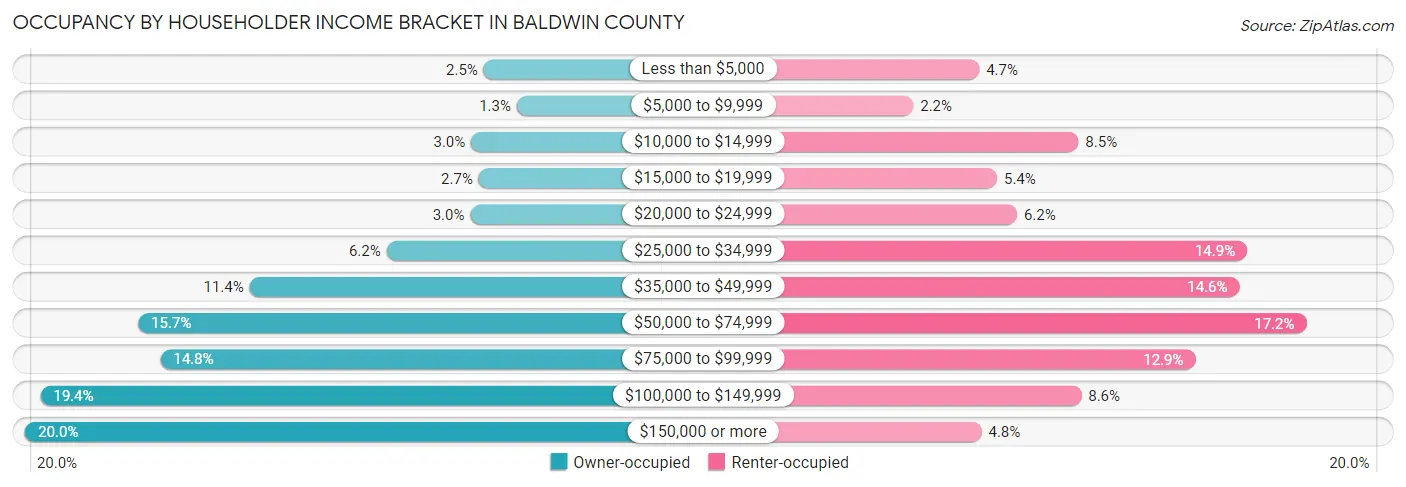
| Income Bracket | Owner-occupied | Renter-occupied |
| Less than $5,000 | 1,777 (2.5%) | 947 (4.7%) |
| $5,000 to $9,999 | 883 (1.3%) | 443 (2.2%) |
| $10,000 to $14,999 | 2,115 (3.0%) | 1,706 (8.5%) |
| $15,000 to $19,999 | 1,910 (2.7%) | 1,084 (5.4%) |
| $20,000 to $24,999 | 2,138 (3.0%) | 1,236 (6.1%) |
| $25,000 to $34,999 | 4,388 (6.2%) | 2,997 (14.9%) |
| $35,000 to $49,999 | 8,083 (11.4%) | 2,937 (14.6%) |
| $50,000 to $74,999 | 11,089 (15.7%) | 3,451 (17.2%) |
| $75,000 to $99,999 | 10,486 (14.8%) | 2,600 (12.9%) |
| $100,000 to $149,999 | 13,715 (19.4%) | 1,728 (8.6%) |
| $150,000 or more | 14,124 (20.0%) | 965 (4.8%) |
| Total | 70,708 (100.0%) | 20,094 (100.0%) |
Monthly Housing Cost Tiers in Baldwin County
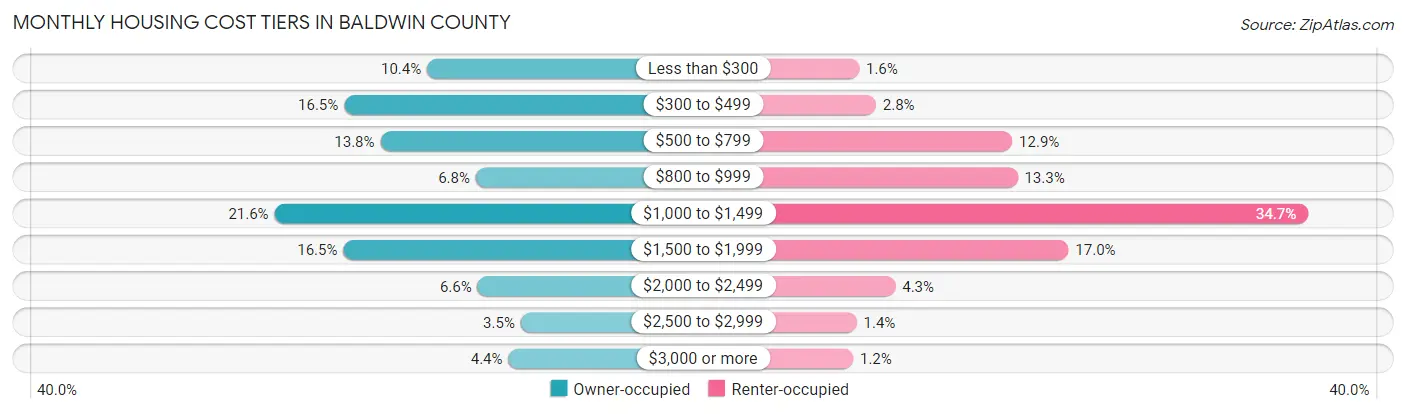
| Monthly Cost | Owner-occupied | Renter-occupied |
| Less than $300 | 7,324 (10.4%) | 320 (1.6%) |
| $300 to $499 | 11,648 (16.5%) | 569 (2.8%) |
| $500 to $799 | 9,758 (13.8%) | 2,586 (12.9%) |
| $800 to $999 | 4,788 (6.8%) | 2,665 (13.3%) |
| $1,000 to $1,499 | 15,272 (21.6%) | 6,964 (34.7%) |
| $1,500 to $1,999 | 11,688 (16.5%) | 3,418 (17.0%) |
| $2,000 to $2,499 | 4,692 (6.6%) | 856 (4.3%) |
| $2,500 to $2,999 | 2,449 (3.5%) | 283 (1.4%) |
| $3,000 or more | 3,089 (4.4%) | 231 (1.1%) |
| Total | 70,708 (100.0%) | 20,094 (100.0%) |
Physical Housing Characteristics in Baldwin County
Housing Structures in Baldwin County
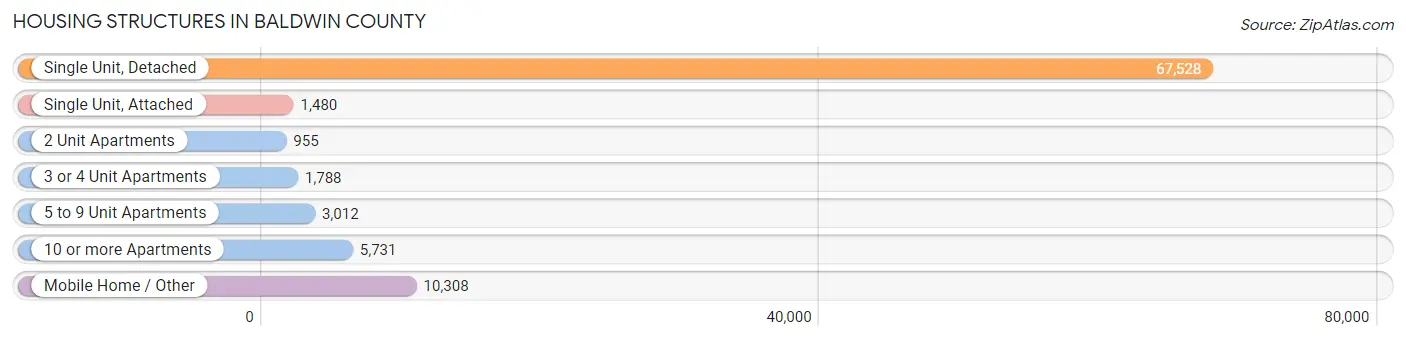
| Structure Type | # Housing Units | % Housing Units |
| Single Unit, Detached | 67,528 | 74.4% |
| Single Unit, Attached | 1,480 | 1.6% |
| 2 Unit Apartments | 955 | 1.1% |
| 3 or 4 Unit Apartments | 1,788 | 2.0% |
| 5 to 9 Unit Apartments | 3,012 | 3.3% |
| 10 or more Apartments | 5,731 | 6.3% |
| Mobile Home / Other | 10,308 | 11.4% |
| Total | 90,802 | 100.0% |
Housing Structures by Occupancy in Baldwin County
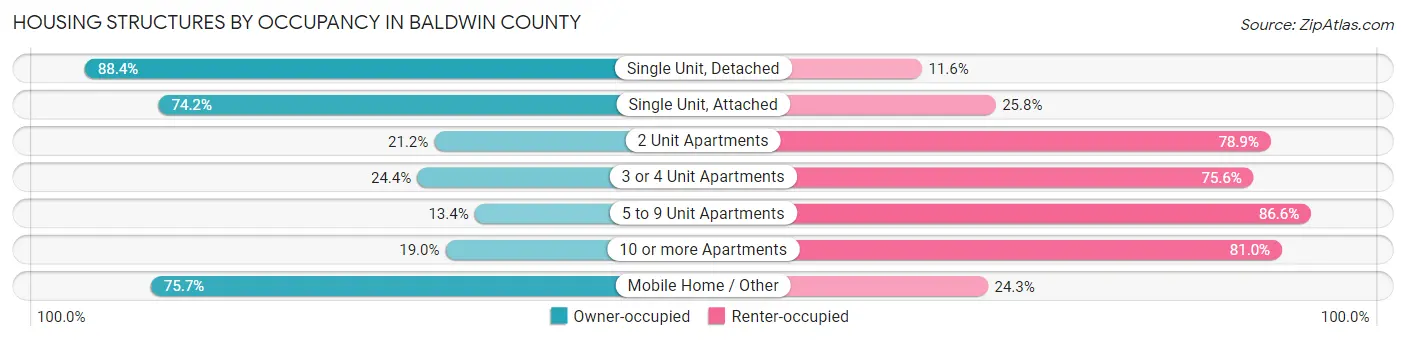
| Structure Type | Owner-occupied | Renter-occupied |
| Single Unit, Detached | 59,679 (88.4%) | 7,849 (11.6%) |
| Single Unit, Attached | 1,098 (74.2%) | 382 (25.8%) |
| 2 Unit Apartments | 202 (21.1%) | 753 (78.8%) |
| 3 or 4 Unit Apartments | 437 (24.4%) | 1,351 (75.6%) |
| 5 to 9 Unit Apartments | 403 (13.4%) | 2,609 (86.6%) |
| 10 or more Apartments | 1,089 (19.0%) | 4,642 (81.0%) |
| Mobile Home / Other | 7,800 (75.7%) | 2,508 (24.3%) |
| Total | 70,708 (77.9%) | 20,094 (22.1%) |
Housing Structures by Number of Rooms in Baldwin County
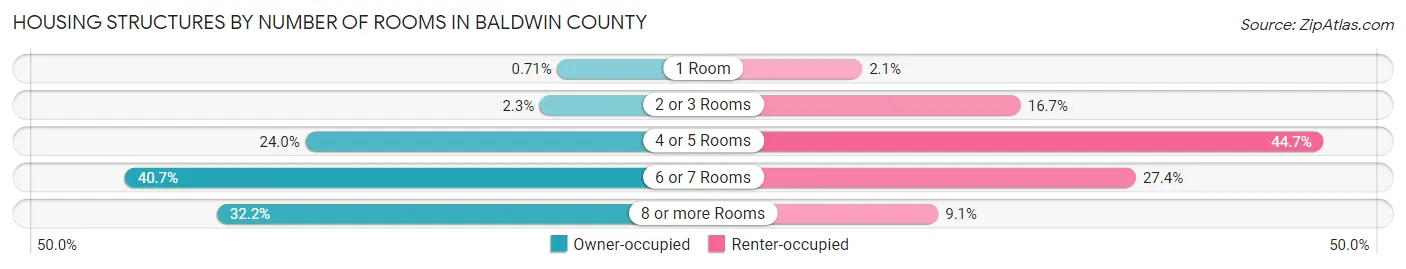
| Number of Rooms | Owner-occupied | Renter-occupied |
| 1 Room | 502 (0.7%) | 413 (2.1%) |
| 2 or 3 Rooms | 1,644 (2.3%) | 3,362 (16.7%) |
| 4 or 5 Rooms | 16,986 (24.0%) | 8,989 (44.7%) |
| 6 or 7 Rooms | 28,799 (40.7%) | 5,501 (27.4%) |
| 8 or more Rooms | 22,777 (32.2%) | 1,829 (9.1%) |
| Total | 70,708 (100.0%) | 20,094 (100.0%) |
Housing Structure by Heating Type in Baldwin County
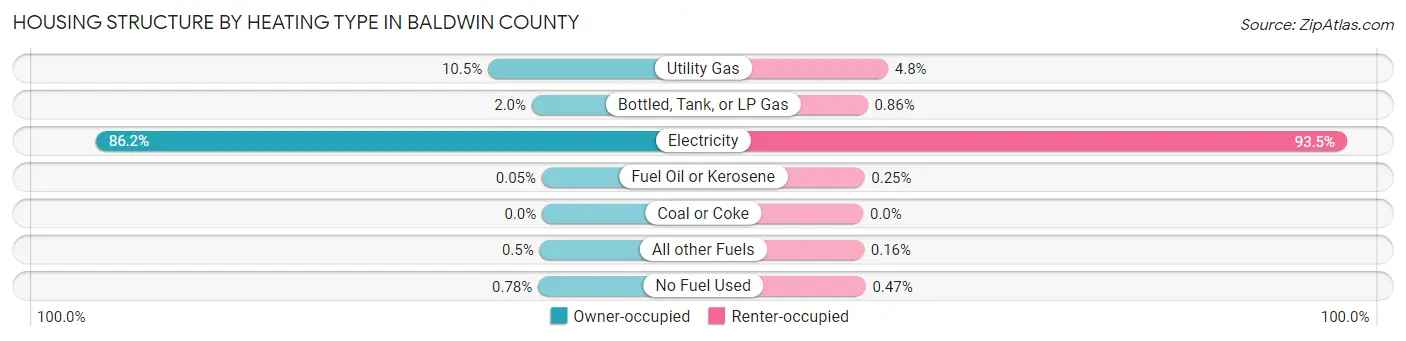
| Heating Type | Owner-occupied | Renter-occupied |
| Utility Gas | 7,394 (10.5%) | 962 (4.8%) |
| Bottled, Tank, or LP Gas | 1,398 (2.0%) | 172 (0.9%) |
| Electricity | 60,975 (86.2%) | 18,784 (93.5%) |
| Fuel Oil or Kerosene | 32 (0.1%) | 50 (0.3%) |
| Coal or Coke | 0 (0.0%) | 0 (0.0%) |
| All other Fuels | 355 (0.5%) | 32 (0.2%) |
| No Fuel Used | 554 (0.8%) | 94 (0.5%) |
| Total | 70,708 (100.0%) | 20,094 (100.0%) |
Household Vehicle Usage in Baldwin County
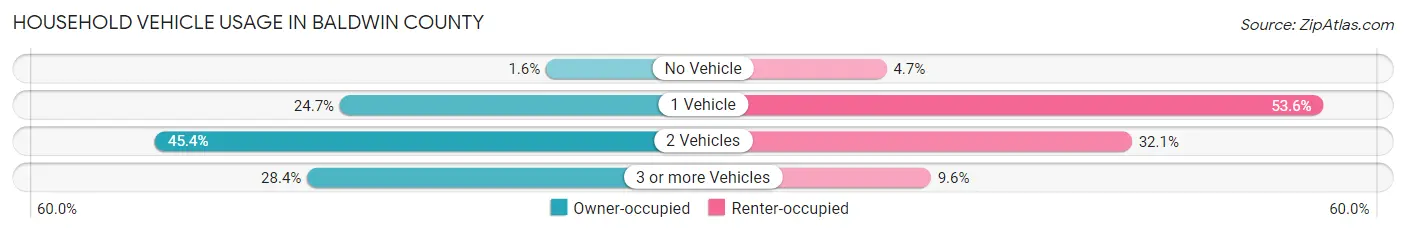
| Vehicles per Household | Owner-occupied | Renter-occupied |
| No Vehicle | 1,121 (1.6%) | 935 (4.6%) |
| 1 Vehicle | 17,453 (24.7%) | 10,770 (53.6%) |
| 2 Vehicles | 32,089 (45.4%) | 6,457 (32.1%) |
| 3 or more Vehicles | 20,045 (28.3%) | 1,932 (9.6%) |
| Total | 70,708 (100.0%) | 20,094 (100.0%) |
Real Estate & Mortgages in Baldwin County
Real Estate and Mortgage Overview in Baldwin County
| Characteristic | Without Mortgage | With Mortgage |
| Housing Units | 29,287 | 41,421 |
| Median Property Value | $253,100 | $273,800 |
| Median Household Income | $59,389 | $10,071 |
| Monthly Housing Costs | $436 | $3,057 |
| Real Estate Taxes | $710 | $5,288 |
Property Value by Mortgage Status in Baldwin County
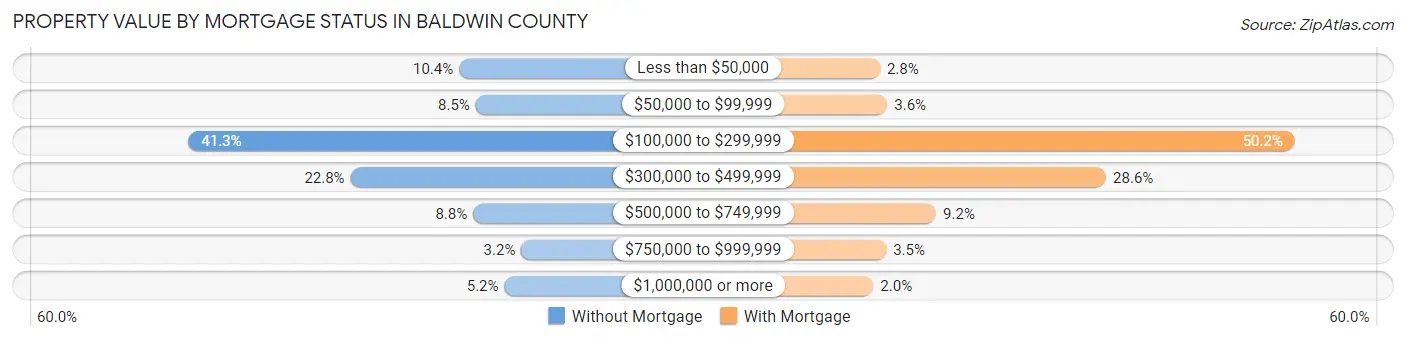
| Property Value | Without Mortgage | With Mortgage |
| Less than $50,000 | 3,031 (10.3%) | 1,157 (2.8%) |
| $50,000 to $99,999 | 2,474 (8.5%) | 1,503 (3.6%) |
| $100,000 to $299,999 | 12,090 (41.3%) | 20,790 (50.2%) |
| $300,000 to $499,999 | 6,666 (22.8%) | 11,862 (28.6%) |
| $500,000 to $749,999 | 2,563 (8.7%) | 3,815 (9.2%) |
| $750,000 to $999,999 | 950 (3.2%) | 1,450 (3.5%) |
| $1,000,000 or more | 1,513 (5.2%) | 844 (2.0%) |
| Total | 29,287 (100.0%) | 41,421 (100.0%) |
Household Income by Mortgage Status in Baldwin County
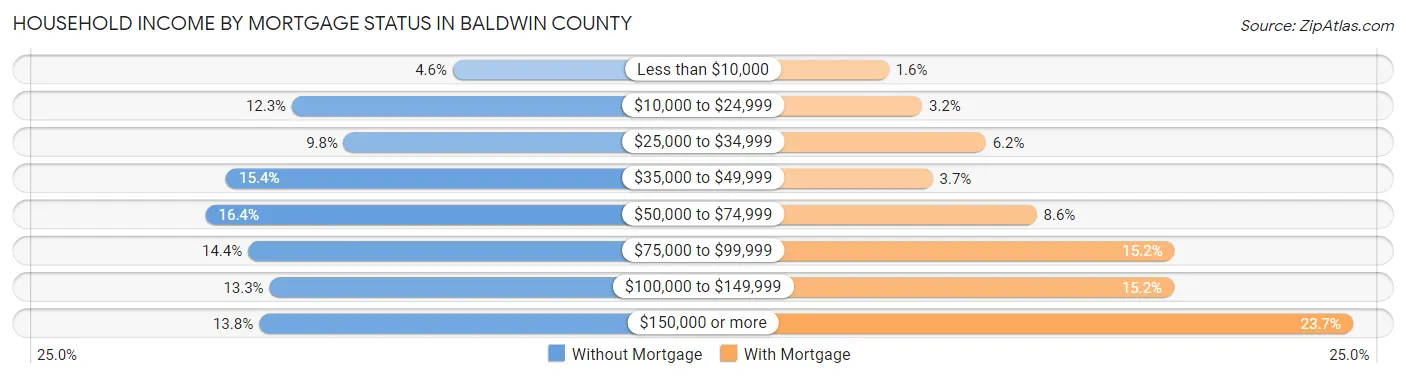
| Household Income | Without Mortgage | With Mortgage |
| Less than $10,000 | 1,349 (4.6%) | 656 (1.6%) |
| $10,000 to $24,999 | 3,594 (12.3%) | 1,311 (3.2%) |
| $25,000 to $34,999 | 2,869 (9.8%) | 2,569 (6.2%) |
| $35,000 to $49,999 | 4,511 (15.4%) | 1,519 (3.7%) |
| $50,000 to $74,999 | 4,798 (16.4%) | 3,572 (8.6%) |
| $75,000 to $99,999 | 4,205 (14.4%) | 6,291 (15.2%) |
| $100,000 to $149,999 | 3,908 (13.3%) | 6,281 (15.2%) |
| $150,000 or more | 4,053 (13.8%) | 9,807 (23.7%) |
| Total | 29,287 (100.0%) | 41,421 (100.0%) |
Property Value to Household Income Ratio in Baldwin County
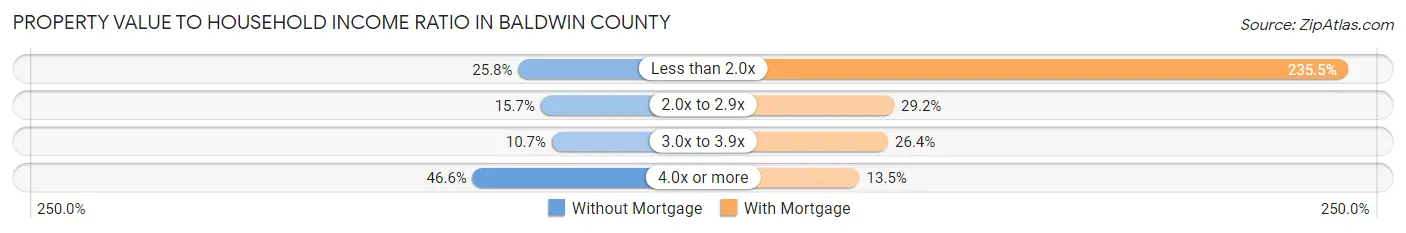
| Value-to-Income Ratio | Without Mortgage | With Mortgage |
| Less than 2.0x | 7,560 (25.8%) | 97,525 (235.4%) |
| 2.0x to 2.9x | 4,586 (15.7%) | 12,080 (29.2%) |
| 3.0x to 3.9x | 3,120 (10.6%) | 10,944 (26.4%) |
| 4.0x or more | 13,642 (46.6%) | 5,589 (13.5%) |
| Total | 29,287 (100.0%) | 41,421 (100.0%) |
Real Estate Taxes by Mortgage Status in Baldwin County
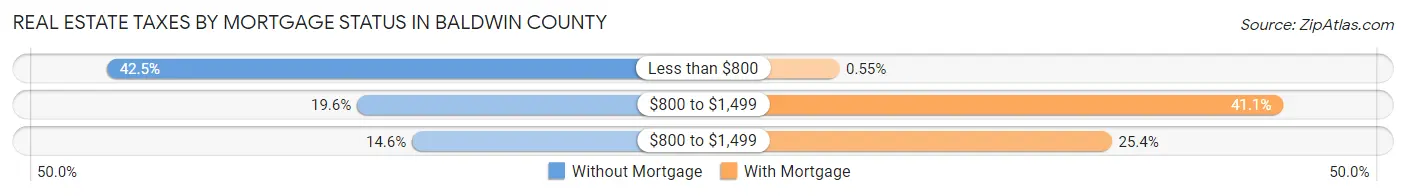
| Property Taxes | Without Mortgage | With Mortgage |
| Less than $800 | 12,446 (42.5%) | 227 (0.5%) |
| $800 to $1,499 | 5,752 (19.6%) | 17,029 (41.1%) |
| $800 to $1,499 | 4,281 (14.6%) | 10,533 (25.4%) |
| Total | 29,287 (100.0%) | 41,421 (100.0%) |
Health & Disability in Baldwin County
Health Insurance Coverage by Age in Baldwin County
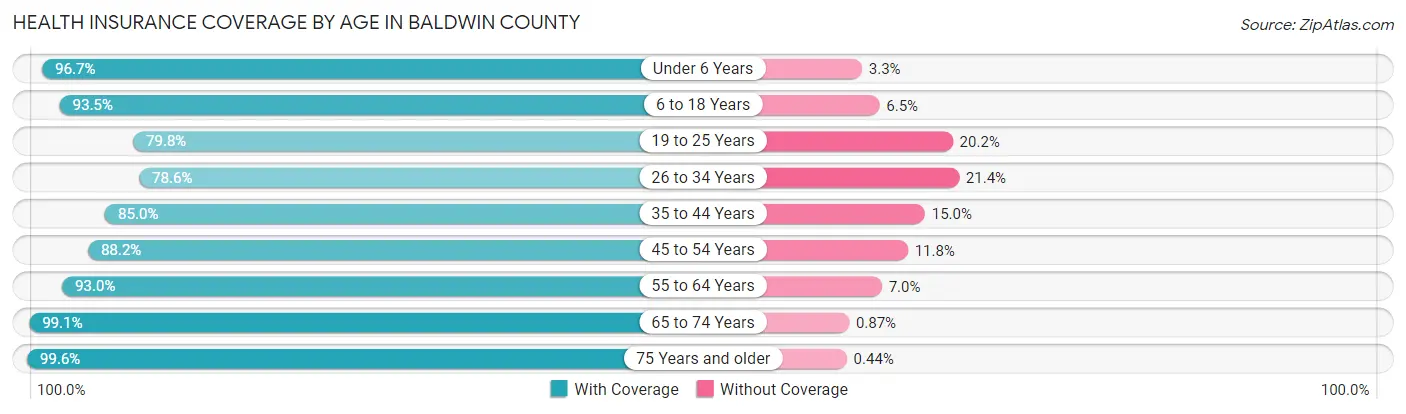
| Age Bracket | With Coverage | Without Coverage |
| Under 6 Years | 14,481 (96.7%) | 491 (3.3%) |
| 6 to 18 Years | 34,210 (93.5%) | 2,395 (6.5%) |
| 19 to 25 Years | 13,967 (79.8%) | 3,538 (20.2%) |
| 26 to 34 Years | 17,504 (78.6%) | 4,758 (21.4%) |
| 35 to 44 Years | 23,357 (85.0%) | 4,129 (15.0%) |
| 45 to 54 Years | 26,092 (88.2%) | 3,497 (11.8%) |
| 55 to 64 Years | 30,999 (93.0%) | 2,325 (7.0%) |
| 65 to 74 Years | 29,104 (99.1%) | 256 (0.9%) |
| 75 Years and older | 18,888 (99.6%) | 83 (0.4%) |
| Total | 208,602 (90.7%) | 21,472 (9.3%) |
Health Insurance Coverage by Citizenship Status in Baldwin County
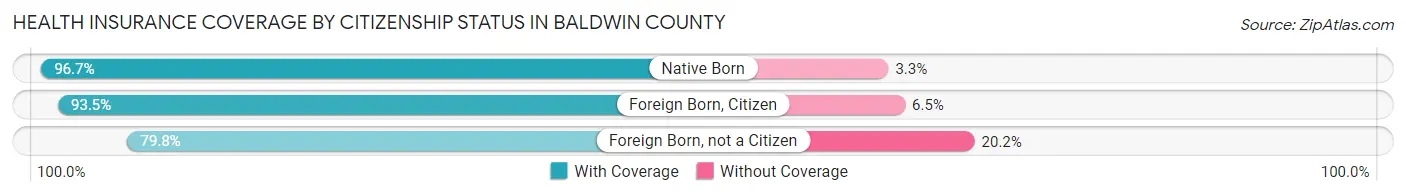
| Citizenship Status | With Coverage | Without Coverage |
| Native Born | 14,481 (96.7%) | 491 (3.3%) |
| Foreign Born, Citizen | 34,210 (93.5%) | 2,395 (6.5%) |
| Foreign Born, not a Citizen | 13,967 (79.8%) | 3,538 (20.2%) |
Health Insurance Coverage by Household Income in Baldwin County
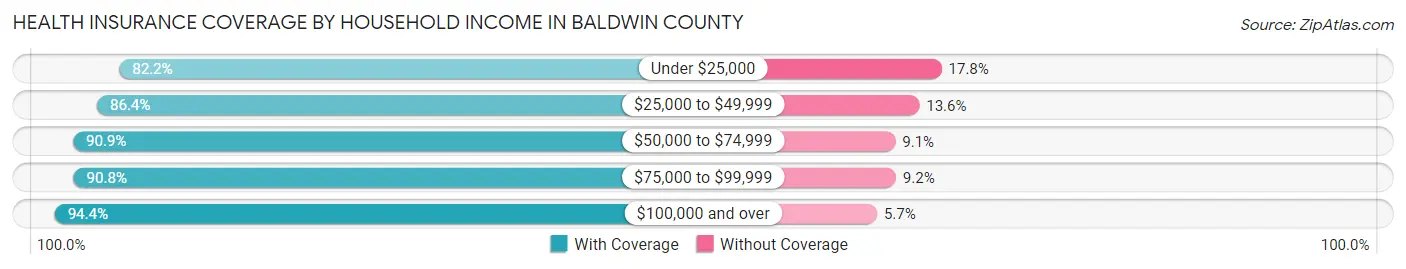
| Household Income | With Coverage | Without Coverage |
| Under $25,000 | 20,395 (82.2%) | 4,403 (17.8%) |
| $25,000 to $49,999 | 31,892 (86.4%) | 5,010 (13.6%) |
| $50,000 to $74,999 | 33,216 (90.9%) | 3,324 (9.1%) |
| $75,000 to $99,999 | 31,604 (90.8%) | 3,201 (9.2%) |
| $100,000 and over | 90,850 (94.4%) | 5,441 (5.7%) |
Public vs Private Health Insurance Coverage by Age in Baldwin County
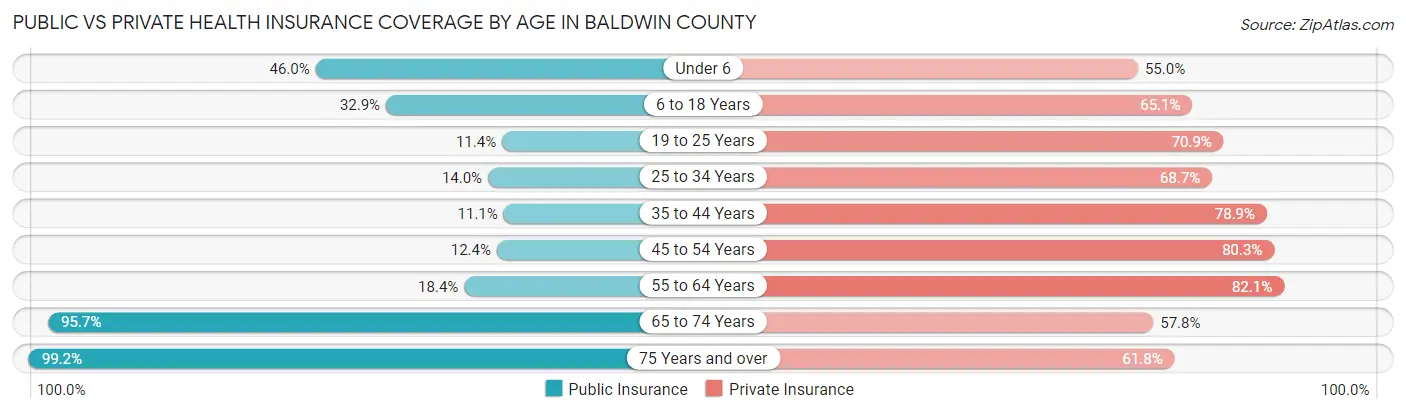
| Age Bracket | Public Insurance | Private Insurance |
| Under 6 | 6,887 (46.0%) | 8,231 (55.0%) |
| 6 to 18 Years | 12,053 (32.9%) | 23,813 (65.0%) |
| 19 to 25 Years | 1,993 (11.4%) | 12,408 (70.9%) |
| 25 to 34 Years | 3,117 (14.0%) | 15,302 (68.7%) |
| 35 to 44 Years | 3,047 (11.1%) | 21,683 (78.9%) |
| 45 to 54 Years | 3,656 (12.4%) | 23,745 (80.2%) |
| 55 to 64 Years | 6,135 (18.4%) | 27,349 (82.1%) |
| 65 to 74 Years | 28,084 (95.7%) | 16,975 (57.8%) |
| 75 Years and over | 18,823 (99.2%) | 11,717 (61.8%) |
| Total | 83,795 (36.4%) | 161,223 (70.1%) |
Disability Status by Sex by Age in Baldwin County
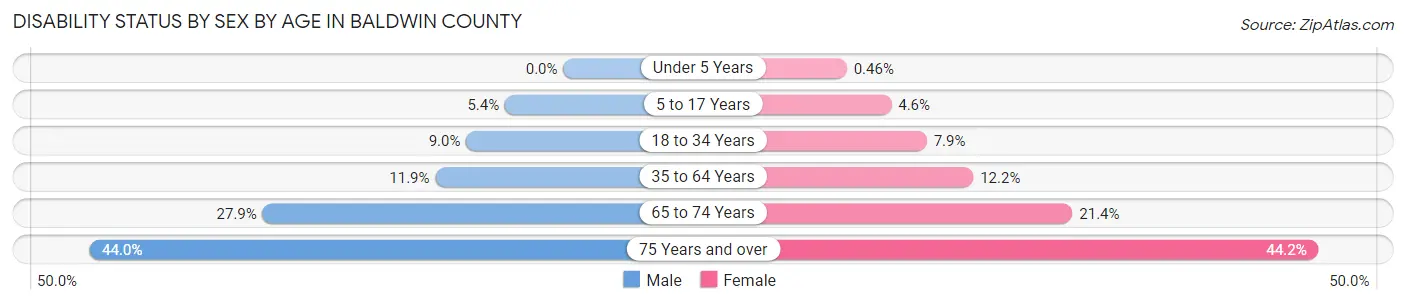
| Age Bracket | Male | Female |
| Under 5 Years | 0 (0.0%) | 27 (0.5%) |
| 5 to 17 Years | 1,026 (5.4%) | 837 (4.6%) |
| 18 to 34 Years | 1,862 (9.0%) | 1,682 (7.9%) |
| 35 to 64 Years | 5,138 (11.9%) | 5,749 (12.2%) |
| 65 to 74 Years | 3,863 (27.9%) | 3,320 (21.4%) |
| 75 Years and over | 3,665 (44.0%) | 4,709 (44.2%) |
Disability Class by Sex by Age in Baldwin County
Disability Class: Hearing Difficulty
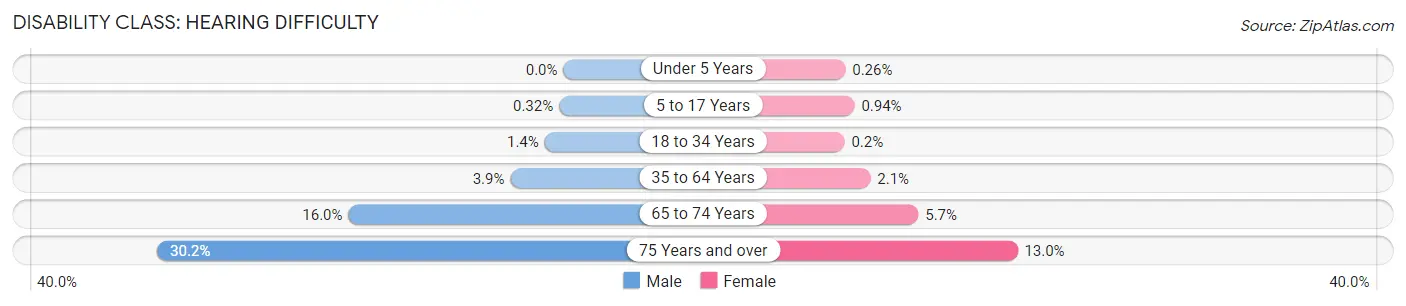
| Age Bracket | Male | Female |
| Under 5 Years | 0 (0.0%) | 15 (0.3%) |
| 5 to 17 Years | 60 (0.3%) | 171 (0.9%) |
| 18 to 34 Years | 287 (1.4%) | 42 (0.2%) |
| 35 to 64 Years | 1,705 (3.9%) | 999 (2.1%) |
| 65 to 74 Years | 2,210 (16.0%) | 881 (5.7%) |
| 75 Years and over | 2,511 (30.2%) | 1,388 (13.0%) |
Disability Class: Vision Difficulty
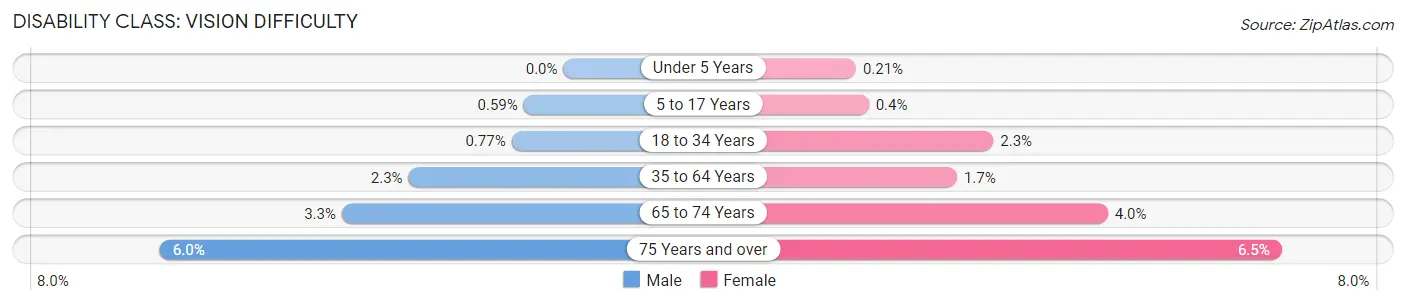
| Age Bracket | Male | Female |
| Under 5 Years | 0 (0.0%) | 12 (0.2%) |
| 5 to 17 Years | 112 (0.6%) | 73 (0.4%) |
| 18 to 34 Years | 159 (0.8%) | 481 (2.2%) |
| 35 to 64 Years | 996 (2.3%) | 804 (1.7%) |
| 65 to 74 Years | 455 (3.3%) | 613 (4.0%) |
| 75 Years and over | 499 (6.0%) | 695 (6.5%) |
Disability Class: Cognitive Difficulty
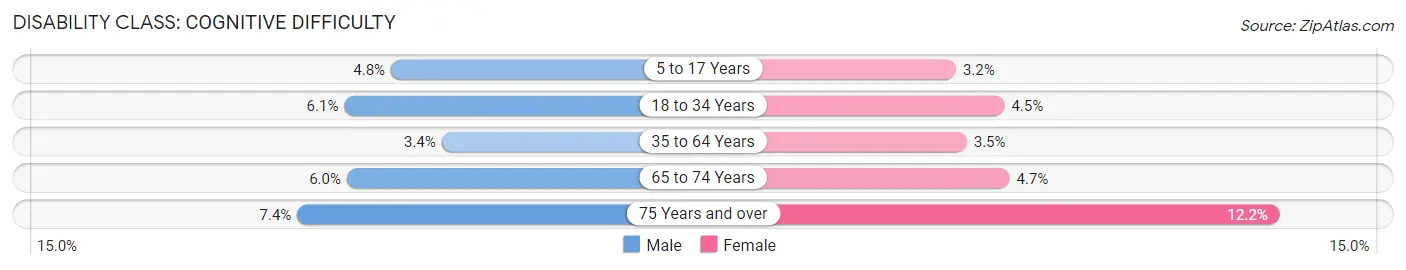
| Age Bracket | Male | Female |
| 5 to 17 Years | 911 (4.8%) | 581 (3.2%) |
| 18 to 34 Years | 1,260 (6.1%) | 967 (4.5%) |
| 35 to 64 Years | 1,468 (3.4%) | 1,639 (3.5%) |
| 65 to 74 Years | 835 (6.0%) | 724 (4.7%) |
| 75 Years and over | 617 (7.4%) | 1,298 (12.2%) |
Disability Class: Ambulatory Difficulty
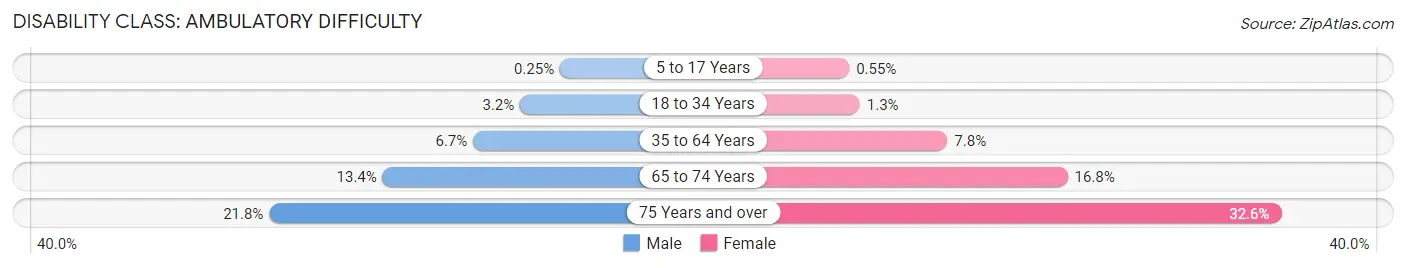
| Age Bracket | Male | Female |
| 5 to 17 Years | 47 (0.3%) | 101 (0.5%) |
| 18 to 34 Years | 664 (3.2%) | 286 (1.3%) |
| 35 to 64 Years | 2,899 (6.7%) | 3,696 (7.8%) |
| 65 to 74 Years | 1,858 (13.4%) | 2,600 (16.8%) |
| 75 Years and over | 1,818 (21.8%) | 3,473 (32.6%) |
Disability Class: Self-Care Difficulty
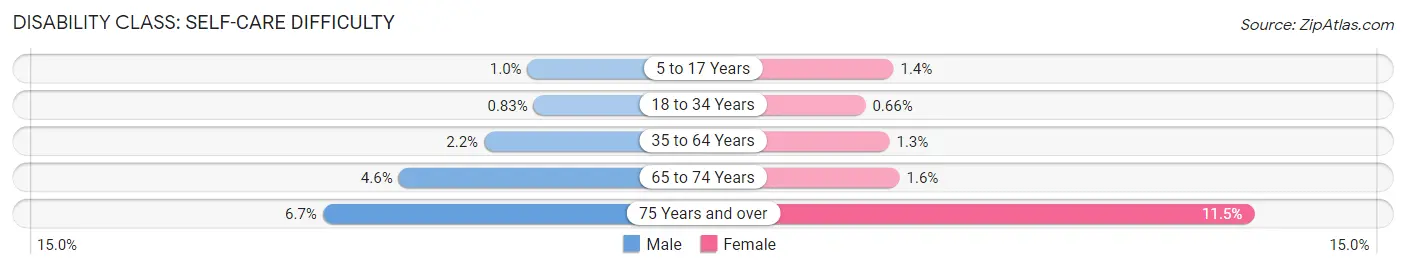
| Age Bracket | Male | Female |
| 5 to 17 Years | 189 (1.0%) | 263 (1.4%) |
| 18 to 34 Years | 172 (0.8%) | 142 (0.7%) |
| 35 to 64 Years | 958 (2.2%) | 629 (1.3%) |
| 65 to 74 Years | 636 (4.6%) | 250 (1.6%) |
| 75 Years and over | 558 (6.7%) | 1,222 (11.5%) |
Technology Access in Baldwin County
Computing Device Access in Baldwin County
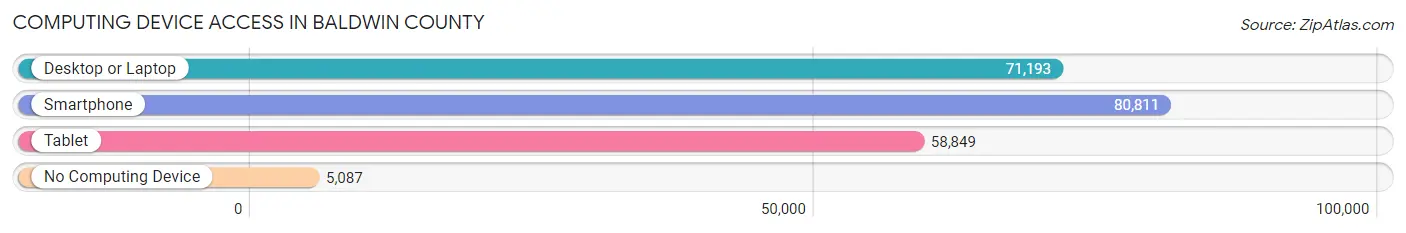
| Device Type | # Households | % Households |
| Desktop or Laptop | 71,193 | 78.4% |
| Smartphone | 80,811 | 89.0% |
| Tablet | 58,849 | 64.8% |
| No Computing Device | 5,087 | 5.6% |
| Total | 90,802 | 100.0% |
Internet Access in Baldwin County
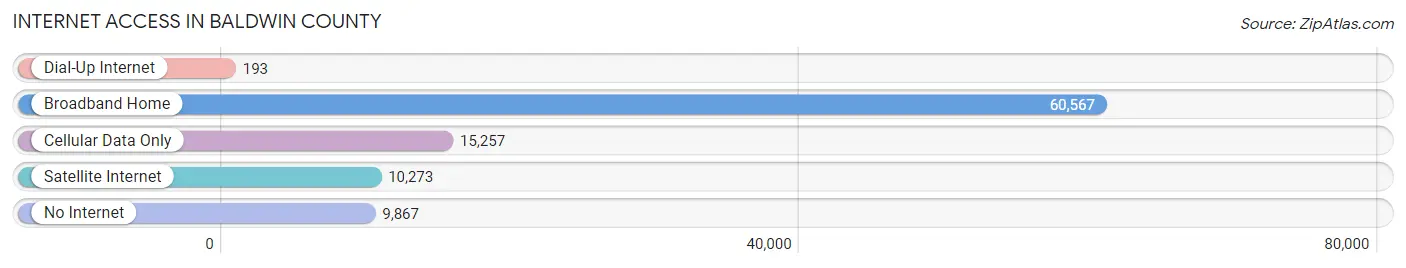
| Internet Type | # Households | % Households |
| Dial-Up Internet | 193 | 0.2% |
| Broadband Home | 60,567 | 66.7% |
| Cellular Data Only | 15,257 | 16.8% |
| Satellite Internet | 10,273 | 11.3% |
| No Internet | 9,867 | 10.9% |
| Total | 90,802 | 100.0% |
Baldwin County Summary
Baldwin County is located in the southwestern corner of the state of Alabama, and is the largest county in the state. It is bordered by Mobile County to the east, Escambia County to the west, and Monroe County to the north. The county seat is Bay Minette, and the largest city is Daphne. The county was established in 1809 and named for Abraham Baldwin, a signer of the United States Constitution.
Geography
Baldwin County covers an area of 1,590 square miles, making it the largest county in Alabama. It is located in the Gulf Coastal Plain region of the state, and is mostly flat with some rolling hills. The county is drained by the Perdido River, which forms the western boundary of the county. The eastern boundary is formed by the Mobile River and the Tensaw River. The county is home to several large lakes, including Lake Shelby, Lake Baldwin, and Lake Martin.
The climate of Baldwin County is humid subtropical, with hot, humid summers and mild winters. The average annual temperature is around 70 degrees Fahrenheit, and the average annual precipitation is around 55 inches.
Economy
Baldwin County has a diverse economy, with a mix of manufacturing, agriculture, and tourism. The county is home to several large manufacturing companies, including Austal USA, which builds military ships, and ThyssenKrupp, which produces stainless steel. The county is also home to several large agricultural operations, including poultry farms, cattle ranches, and timber operations.
Tourism is an important part of the economy of Baldwin County. The county is home to several popular tourist attractions, including Gulf Shores and Orange Beach, which are popular beach destinations. The county is also home to several state parks, including Gulf State Park and Bon Secour National Wildlife Refuge.
Demographics
As of the 2010 census, Baldwin County had a population of 182,265. The population is made up of a mix of races and ethnicities, with the largest group being white (77.3%), followed by African American (17.2%), Hispanic (3.2%), and Asian (1.3%). The median household income in the county is $50,845, and the median home value is $179,400.
The county is home to several large cities, including Daphne, Fairhope, Foley, and Gulf Shores. The county seat is Bay Minette, which has a population of 8,050. The largest city in the county is Daphne, which has a population of 21,570.
Conclusion
Baldwin County is a large and diverse county located in the southwestern corner of Alabama. It has a diverse economy, with a mix of manufacturing, agriculture, and tourism. The county is home to several large cities, including Daphne, Fairhope, Foley, and Gulf Shores. The population of the county is made up of a mix of races and ethnicities, with the largest group being white. The median household income in the county is $50,845, and the median home value is $179,400.
Common Questions
What is Per Capita Income in Baldwin County?
Per Capita income in Baldwin County is $38,907.
What is the Median Family Income in Baldwin County?
Median Family Income in Baldwin County is $89,953.
What is the Median Household income in Baldwin County?
Median Household Income in Baldwin County is $71,039.
What is Income or Wage Gap in Baldwin County?
Income or Wage Gap in Baldwin County is 37.4%.
Women in Baldwin County earn 62.6 cents for every dollar earned by a man.
What is Family Income Deficit in Baldwin County?
Family Income Deficit in Baldwin County is $10,026.
Families that are below poverty line in Baldwin County earn $10,026 less on average than the poverty threshold level.
What is Inequality or Gini Index in Baldwin County?
Inequality or Gini Index in Baldwin County is 0.46.
What is the Total Population of Baldwin County?
Total Population of Baldwin County is 233,420.
What is the Total Male Population of Baldwin County?
Total Male Population of Baldwin County is 114,077.
What is the Total Female Population of Baldwin County?
Total Female Population of Baldwin County is 119,343.
What is the Ratio of Males per 100 Females in Baldwin County?
There are 95.59 Males per 100 Females in Baldwin County.
What is the Ratio of Females per 100 Males in Baldwin County?
There are 104.62 Females per 100 Males in Baldwin County.
What is the Median Population Age in Baldwin County?
Median Population Age in Baldwin County is 43.7 Years.
What is the Average Family Size in Baldwin County
Average Family Size in Baldwin County is 3.1 People.
What is the Average Household Size in Baldwin County
Average Household Size in Baldwin County is 2.5 People.
How Large is the Labor Force in Baldwin County?
There are 111,846 People in the Labor Forcein in Baldwin County.
What is the Percentage of People in the Labor Force in Baldwin County?
59.0% of People are in the Labor Force in Baldwin County.
What is the Unemployment Rate in Baldwin County?
Unemployment Rate in Baldwin County is 3.4%.