Marshall County, AL Map & Demographics
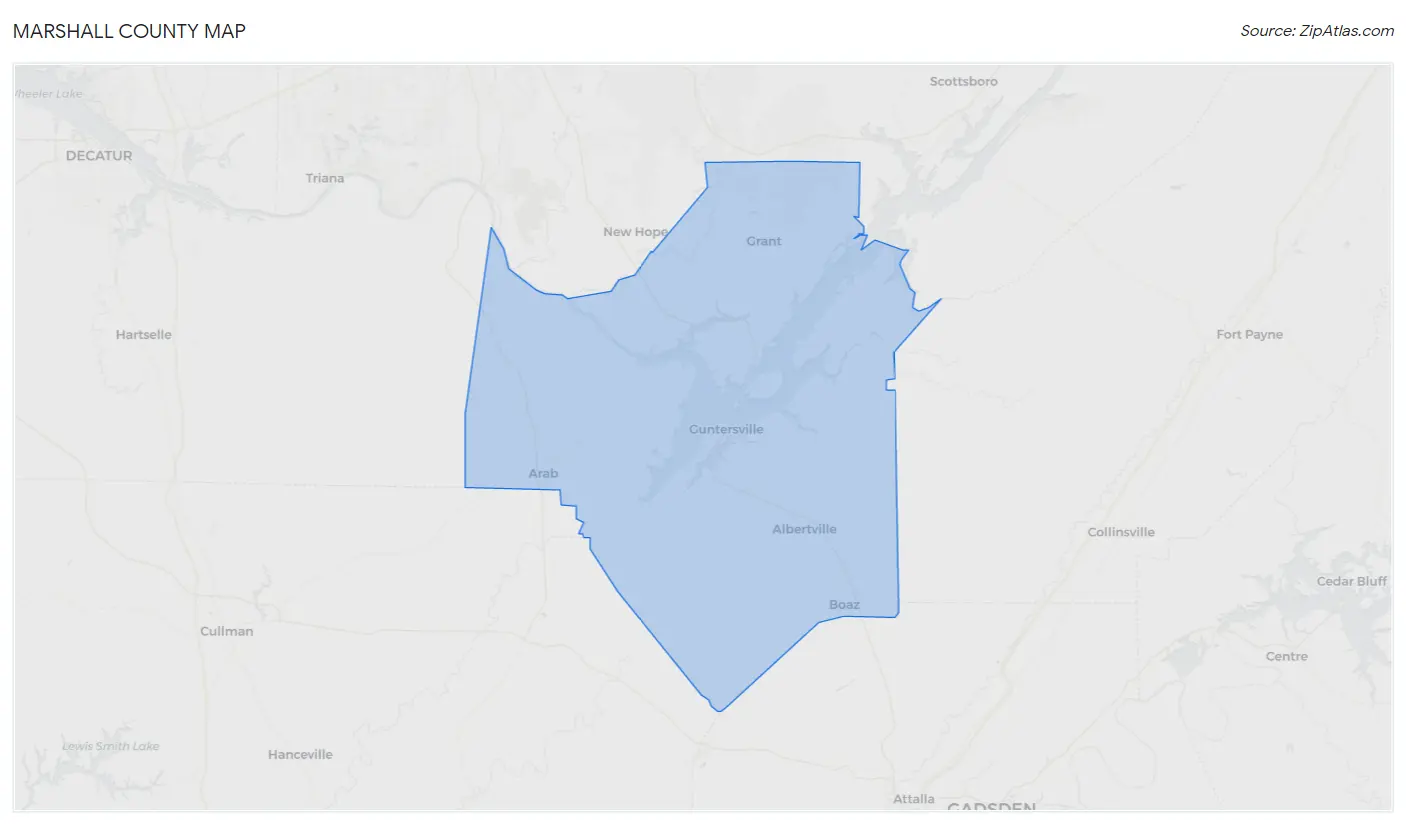
Marshall County Map
Marshall County Overview
$29,509
PER CAPITA INCOME
$71,511
AVG FAMILY INCOME
$58,272
AVG HOUSEHOLD INCOME
33.7%
WAGE / INCOME GAP [ % ]
66.3¢/ $1
WAGE / INCOME GAP [ $ ]
$11,059
FAMILY INCOME DEFICIT
0.46
INEQUALITY / GINI INDEX
97,923
TOTAL POPULATION
48,686
MALE POPULATION
49,237
FEMALE POPULATION
98.88
MALES / 100 FEMALES
101.13
FEMALES / 100 MALES
38.8
MEDIAN AGE
3.2
AVG FAMILY SIZE
2.7
AVG HOUSEHOLD SIZE
43,158
LABOR FORCE [ PEOPLE ]
56.9%
PERCENT IN LABOR FORCE
3.8%
UNEMPLOYMENT RATE
Income in Marshall County
Income Overview in Marshall County
Per Capita Income in Marshall County is $29,509, while median incomes of families and households are $71,511 and $58,272 respectively.
| Characteristic | Number | Measure |
| Per Capita Income | 97,923 | $29,509 |
| Median Family Income | 25,208 | $71,511 |
| Mean Family Income | 25,208 | $90,246 |
| Median Household Income | 35,930 | $58,272 |
| Mean Household Income | 35,930 | $77,500 |
| Income Deficit | 25,208 | $11,059 |
| Wage / Income Gap (%) | 97,923 | 33.66% |
| Wage / Income Gap ($) | 97,923 | 66.34¢ per $1 |
| Gini / Inequality Index | 97,923 | 0.46 |
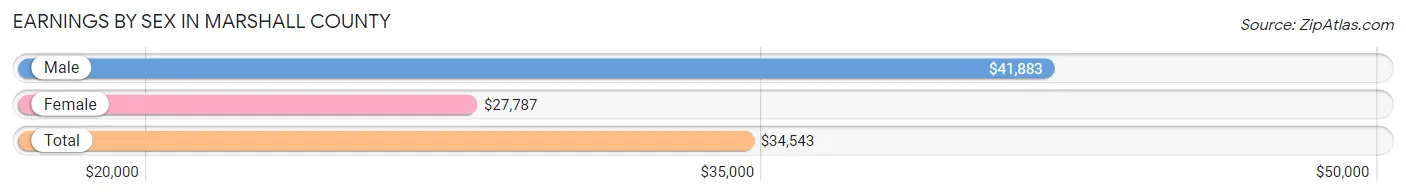
Earnings by Sex in Marshall County
Average Earnings in Marshall County are $34,543, $41,883 for men and $27,787 for women, a difference of 33.7%.
| Sex | Number | Average Earnings |
| Male | 24,993 (55.3%) | $41,883 |
| Female | 20,200 (44.7%) | $27,787 |
| Total | 45,193 (100.0%) | $34,543 |
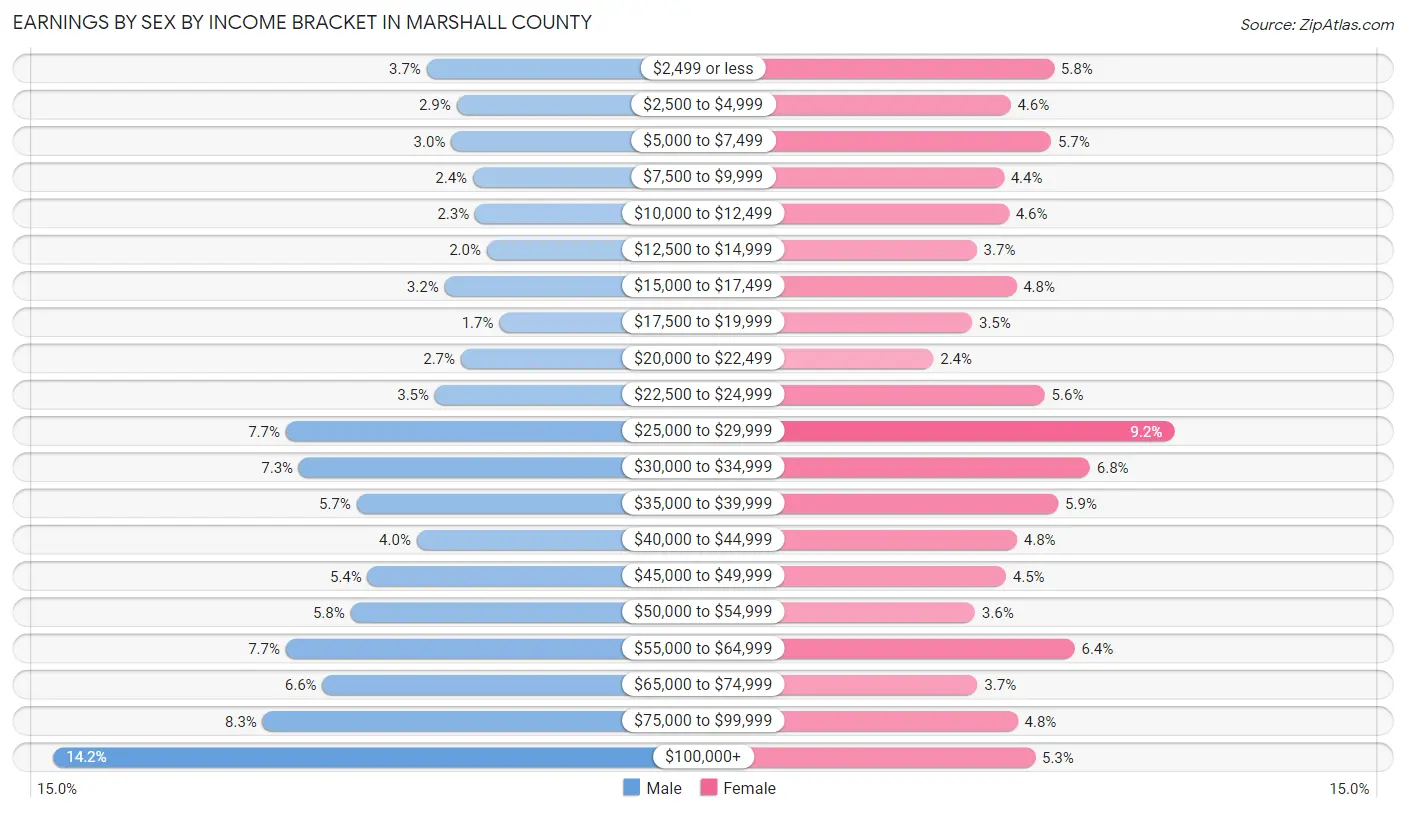
Earnings by Sex by Income Bracket in Marshall County
The most common earnings brackets in Marshall County are $100,000+ for men (3,546 | 14.2%) and $25,000 to $29,999 for women (1,858 | 9.2%).
| Income | Male | Female |
| $2,499 or less | 925 (3.7%) | 1,176 (5.8%) |
| $2,500 to $4,999 | 716 (2.9%) | 930 (4.6%) |
| $5,000 to $7,499 | 752 (3.0%) | 1,159 (5.7%) |
| $7,500 to $9,999 | 601 (2.4%) | 890 (4.4%) |
| $10,000 to $12,499 | 586 (2.3%) | 919 (4.5%) |
| $12,500 to $14,999 | 503 (2.0%) | 737 (3.6%) |
| $15,000 to $17,499 | 800 (3.2%) | 961 (4.8%) |
| $17,500 to $19,999 | 416 (1.7%) | 712 (3.5%) |
| $20,000 to $22,499 | 686 (2.7%) | 490 (2.4%) |
| $22,500 to $24,999 | 867 (3.5%) | 1,123 (5.6%) |
| $25,000 to $29,999 | 1,915 (7.7%) | 1,858 (9.2%) |
| $30,000 to $34,999 | 1,822 (7.3%) | 1,380 (6.8%) |
| $35,000 to $39,999 | 1,418 (5.7%) | 1,199 (5.9%) |
| $40,000 to $44,999 | 994 (4.0%) | 965 (4.8%) |
| $45,000 to $49,999 | 1,339 (5.4%) | 902 (4.5%) |
| $50,000 to $54,999 | 1,459 (5.8%) | 727 (3.6%) |
| $55,000 to $64,999 | 1,914 (7.7%) | 1,292 (6.4%) |
| $65,000 to $74,999 | 1,656 (6.6%) | 741 (3.7%) |
| $75,000 to $99,999 | 2,078 (8.3%) | 970 (4.8%) |
| $100,000+ | 3,546 (14.2%) | 1,069 (5.3%) |
| Total | 24,993 (100.0%) | 20,200 (100.0%) |
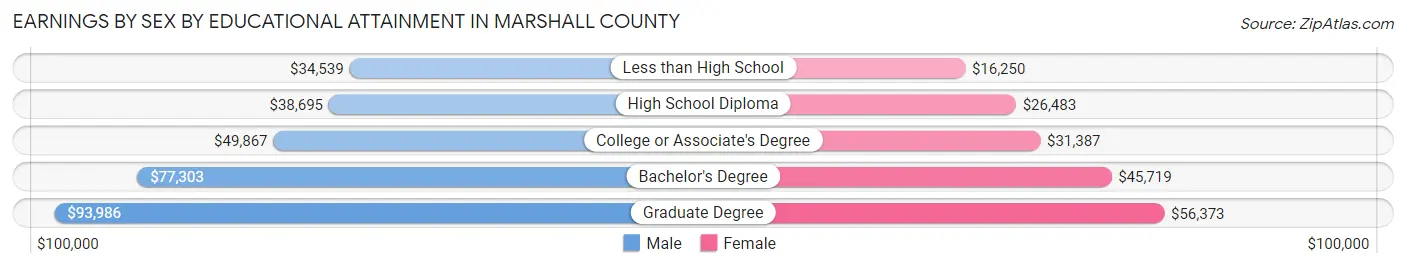
Earnings by Sex by Educational Attainment in Marshall County
Average earnings in Marshall County are $47,338 for men and $31,407 for women, a difference of 33.7%. Men with an educational attainment of graduate degree enjoy the highest average annual earnings of $93,986, while those with less than high school education earn the least with $34,539. Women with an educational attainment of graduate degree earn the most with the average annual earnings of $56,373, while those with less than high school education have the smallest earnings of $16,250.
| Educational Attainment | Male Income | Female Income |
| Less than High School | $34,539 | $16,250 |
| High School Diploma | $38,695 | $26,483 |
| College or Associate's Degree | $49,867 | $31,387 |
| Bachelor's Degree | $77,303 | $45,719 |
| Graduate Degree | $93,986 | $56,373 |
| Total | $47,338 | $31,407 |
Family Income in Marshall County
Family Income Brackets in Marshall County
According to the Marshall County family income data, there are 4,865 families falling into the $50,000 to $74,999 income range, which is the most common income bracket and makes up 19.3% of all families. Conversely, the $10,000 to $14,999 income bracket is the least frequent group with only 731 families (2.9%) belonging to this category.
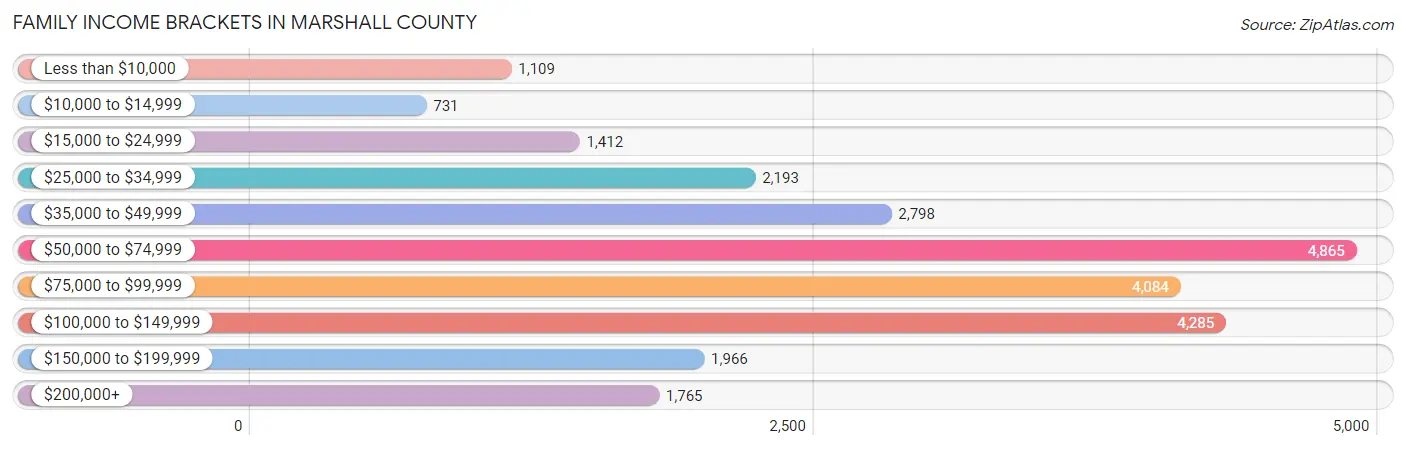
| Income Bracket | # Families | % Families |
| Less than $10,000 | 1,109 | 4.4% |
| $10,000 to $14,999 | 731 | 2.9% |
| $15,000 to $24,999 | 1,412 | 5.6% |
| $25,000 to $34,999 | 2,193 | 8.7% |
| $35,000 to $49,999 | 2,798 | 11.1% |
| $50,000 to $74,999 | 4,865 | 19.3% |
| $75,000 to $99,999 | 4,084 | 16.2% |
| $100,000 to $149,999 | 4,285 | 17.0% |
| $150,000 to $199,999 | 1,966 | 7.8% |
| $200,000+ | 1,765 | 7.0% |
Family Income by Famaliy Size in Marshall County
5-person families (2,352 | 9.3%) account for the highest median family income in Marshall County with $100,714 per family, while 2-person families (11,877 | 47.1%) have the highest median income of $31,636 per family member.
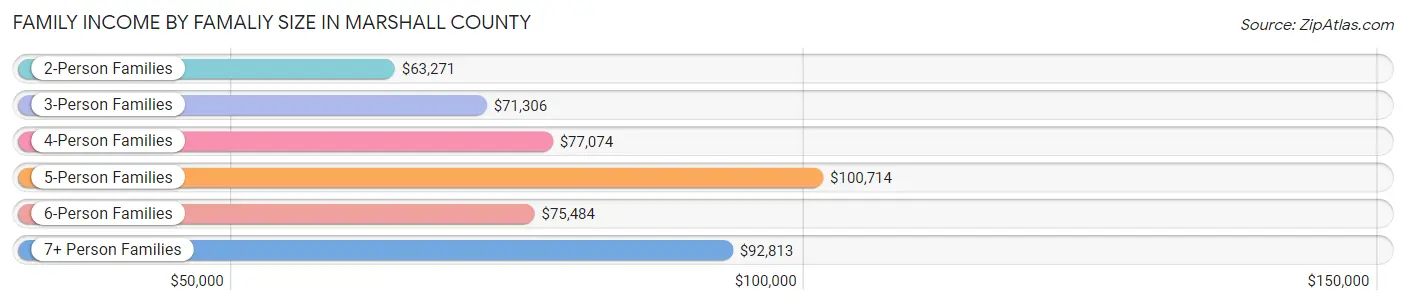
| Income Bracket | # Families | Median Income |
| 2-Person Families | 11,877 (47.1%) | $63,271 |
| 3-Person Families | 5,627 (22.3%) | $71,306 |
| 4-Person Families | 4,366 (17.3%) | $77,074 |
| 5-Person Families | 2,352 (9.3%) | $100,714 |
| 6-Person Families | 574 (2.3%) | $75,484 |
| 7+ Person Families | 412 (1.6%) | $92,813 |
| Total | 25,208 (100.0%) | $71,511 |
Family Income by Number of Earners in Marshall County
The median family income in Marshall County is $71,511, with families comprising 3+ earners (2,572) having the highest median family income of $129,000, while families with no earners (5,057) have the lowest median family income of $40,862, accounting for 10.2% and 20.1% of families, respectively.
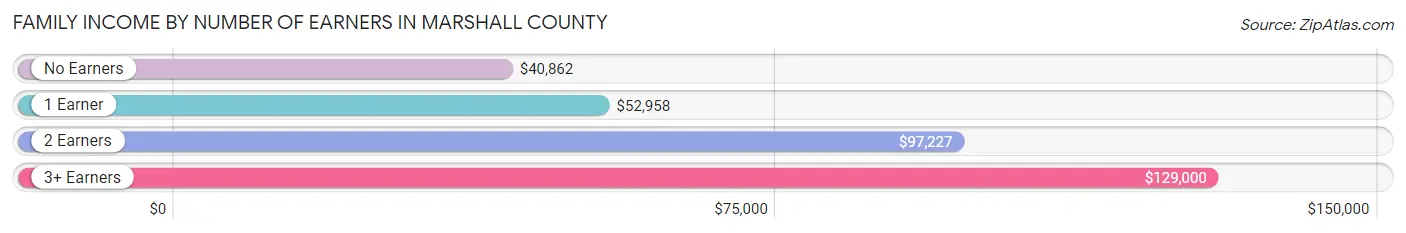
| Number of Earners | # Families | Median Income |
| No Earners | 5,057 (20.1%) | $40,862 |
| 1 Earner | 8,456 (33.5%) | $52,958 |
| 2 Earners | 9,123 (36.2%) | $97,227 |
| 3+ Earners | 2,572 (10.2%) | $129,000 |
| Total | 25,208 (100.0%) | $71,511 |
Household Income in Marshall County
Household Income Brackets in Marshall County
With 6,503 households falling in the category, the $50,000 to $74,999 income range is the most frequent in Marshall County, accounting for 18.1% of all households. In contrast, only 1,904 households (5.3%) fall into the $10,000 to $14,999 income bracket, making it the least populous group.
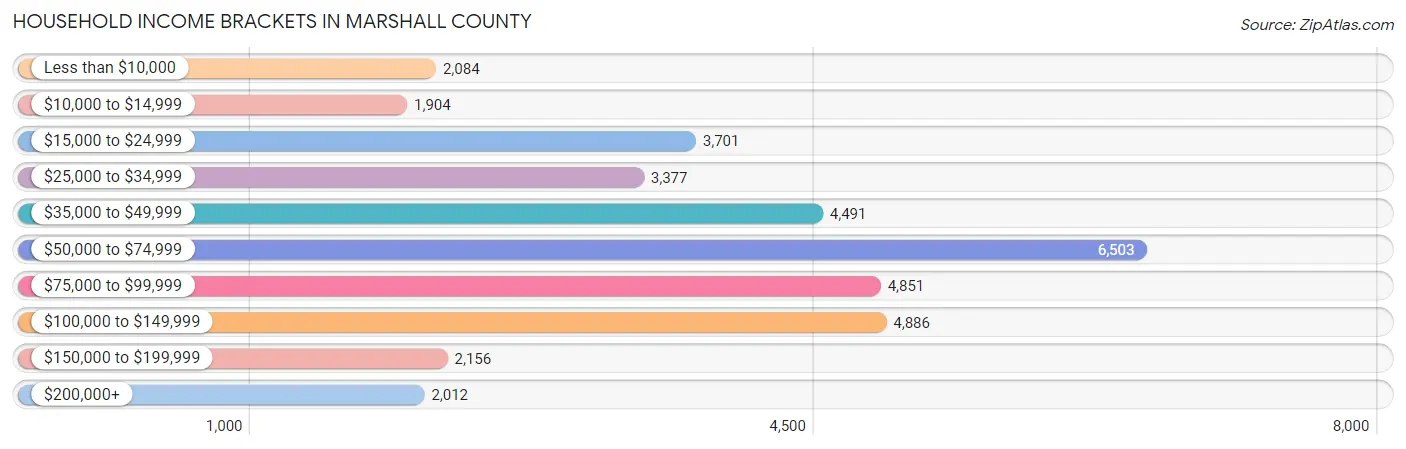
| Income Bracket | # Households | % Households |
| Less than $10,000 | 2,084 | 5.8% |
| $10,000 to $14,999 | 1,904 | 5.3% |
| $15,000 to $24,999 | 3,701 | 10.3% |
| $25,000 to $34,999 | 3,377 | 9.4% |
| $35,000 to $49,999 | 4,491 | 12.5% |
| $50,000 to $74,999 | 6,503 | 18.1% |
| $75,000 to $99,999 | 4,851 | 13.5% |
| $100,000 to $149,999 | 4,886 | 13.6% |
| $150,000 to $199,999 | 2,156 | 6.0% |
| $200,000+ | 2,012 | 5.6% |
Household Income by Householder Age in Marshall County
The median household income in Marshall County is $58,272, with the highest median household income of $68,178 found in the 45 to 64 years age bracket for the primary householder. A total of 14,042 households (39.1%) fall into this category. Meanwhile, the 15 to 24 years age bracket for the primary householder has the lowest median household income of $44,135, with 898 households (2.5%) in this group.
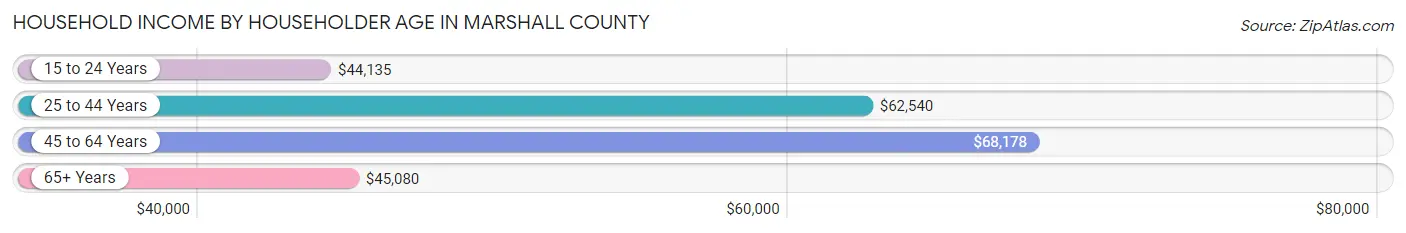
| Income Bracket | # Households | Median Income |
| 15 to 24 Years | 898 (2.5%) | $44,135 |
| 25 to 44 Years | 10,587 (29.5%) | $62,540 |
| 45 to 64 Years | 14,042 (39.1%) | $68,178 |
| 65+ Years | 10,403 (28.9%) | $45,080 |
| Total | 35,930 (100.0%) | $58,272 |
Poverty in Marshall County
Income Below Poverty by Sex and Age in Marshall County
With 14.6% poverty level for males and 18.6% for females among the residents of Marshall County, under 5 year old males and 15 year old females are the most vulnerable to poverty, with 1,079 males (31.8%) and 310 females (36.4%) in their respective age groups living below the poverty level.
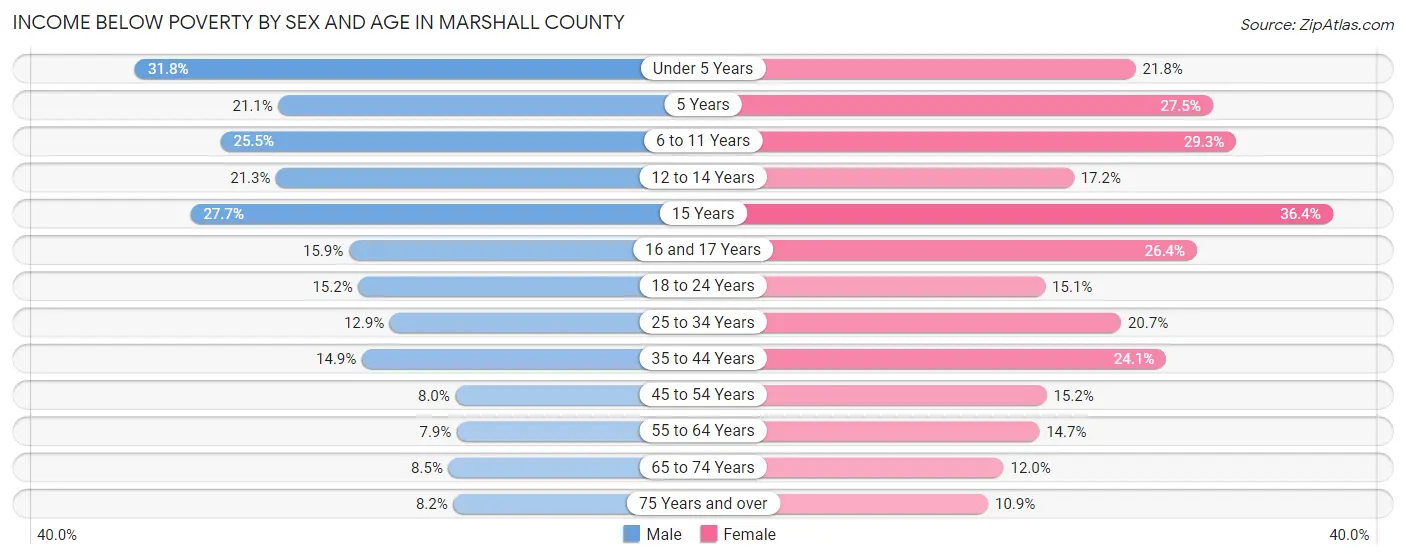
| Age Bracket | Male | Female |
| Under 5 Years | 1,079 (31.8%) | 705 (21.8%) |
| 5 Years | 145 (21.1%) | 185 (27.5%) |
| 6 to 11 Years | 991 (25.5%) | 1,081 (29.3%) |
| 12 to 14 Years | 483 (21.3%) | 358 (17.2%) |
| 15 Years | 230 (27.7%) | 310 (36.4%) |
| 16 and 17 Years | 222 (15.9%) | 330 (26.4%) |
| 18 to 24 Years | 645 (15.2%) | 579 (15.1%) |
| 25 to 34 Years | 753 (12.9%) | 1,198 (20.7%) |
| 35 to 44 Years | 873 (14.9%) | 1,373 (24.1%) |
| 45 to 54 Years | 486 (8.0%) | 906 (15.2%) |
| 55 to 64 Years | 492 (7.9%) | 917 (14.7%) |
| 65 to 74 Years | 389 (8.5%) | 634 (12.0%) |
| 75 Years and over | 220 (8.2%) | 408 (10.9%) |
| Total | 7,008 (14.6%) | 8,984 (18.6%) |
Income Above Poverty by Sex and Age in Marshall County
According to the poverty statistics in Marshall County, males aged 55 to 64 years and females aged 75 years and over are the age groups that are most secure financially, with 92.1% of males and 89.1% of females in these age groups living above the poverty line.
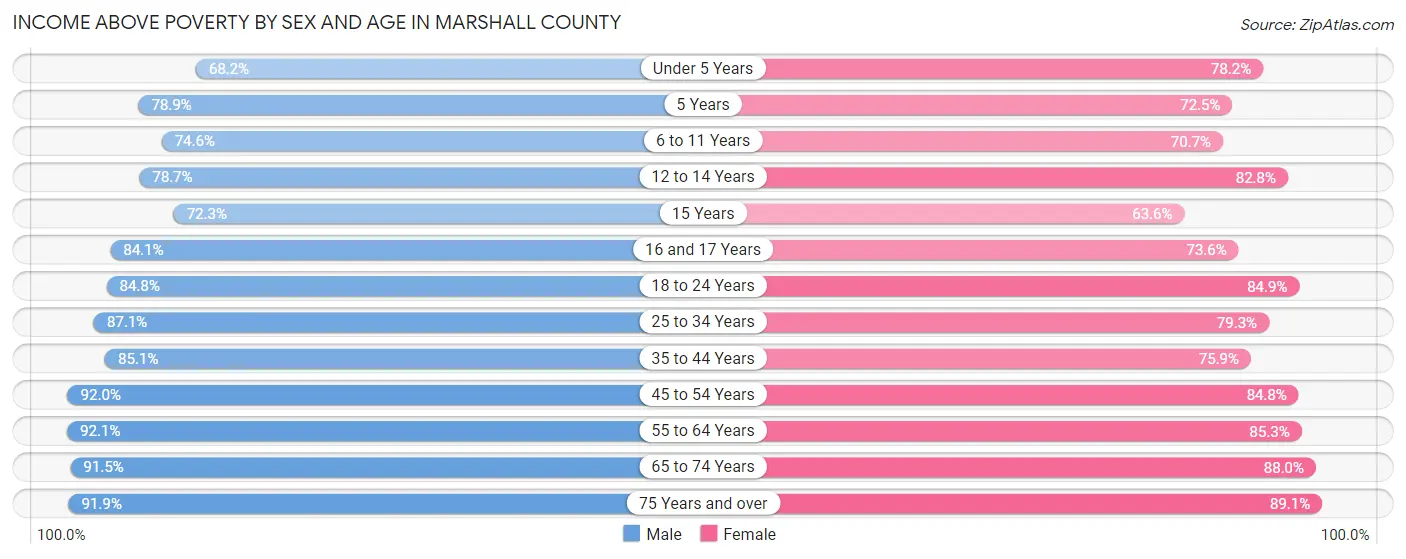
| Age Bracket | Male | Female |
| Under 5 Years | 2,315 (68.2%) | 2,528 (78.2%) |
| 5 Years | 541 (78.9%) | 487 (72.5%) |
| 6 to 11 Years | 2,903 (74.6%) | 2,612 (70.7%) |
| 12 to 14 Years | 1,784 (78.7%) | 1,721 (82.8%) |
| 15 Years | 601 (72.3%) | 541 (63.6%) |
| 16 and 17 Years | 1,173 (84.1%) | 922 (73.6%) |
| 18 to 24 Years | 3,595 (84.8%) | 3,256 (84.9%) |
| 25 to 34 Years | 5,099 (87.1%) | 4,581 (79.3%) |
| 35 to 44 Years | 4,970 (85.1%) | 4,330 (75.9%) |
| 45 to 54 Years | 5,588 (92.0%) | 5,056 (84.8%) |
| 55 to 64 Years | 5,746 (92.1%) | 5,337 (85.3%) |
| 65 to 74 Years | 4,183 (91.5%) | 4,645 (88.0%) |
| 75 Years and over | 2,479 (91.8%) | 3,350 (89.1%) |
| Total | 40,977 (85.4%) | 39,366 (81.4%) |
Income Below Poverty Among Married-Couple Families in Marshall County
The poverty statistics for married-couple families in Marshall County show that 5.8% or 1,089 of the total 18,830 families live below the poverty line. Families with 5 or more children have the highest poverty rate of 36.7%, comprising of 87 families. On the other hand, families with no children have the lowest poverty rate of 3.6%, which includes 403 families.
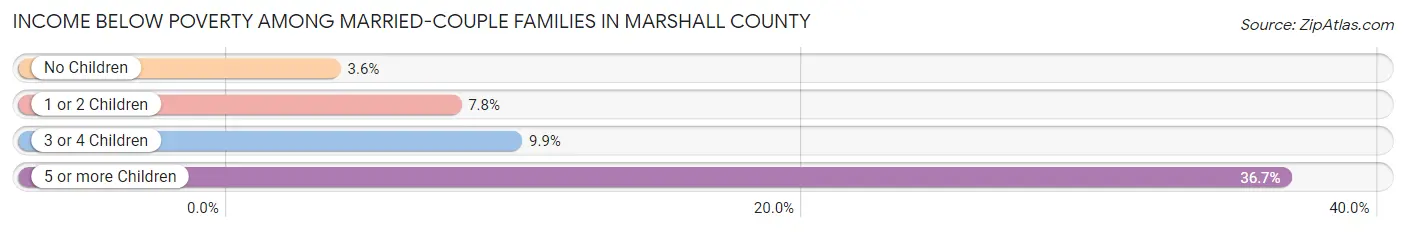
| Children | Above Poverty | Below Poverty |
| No Children | 10,895 (96.4%) | 403 (3.6%) |
| 1 or 2 Children | 5,329 (92.2%) | 449 (7.8%) |
| 3 or 4 Children | 1,367 (90.1%) | 150 (9.9%) |
| 5 or more Children | 150 (63.3%) | 87 (36.7%) |
| Total | 17,741 (94.2%) | 1,089 (5.8%) |
Income Below Poverty Among Single-Parent Households in Marshall County
According to the poverty data in Marshall County, 16.2% or 318 single-father households and 38.3% or 1,688 single-mother households are living below the poverty line. Among single-father households, those with 1 or 2 children have the highest poverty rate, with 149 households (17.6%) experiencing poverty. Likewise, among single-mother households, those with 3 or 4 children have the highest poverty rate, with 378 households (91.1%) falling below the poverty line.
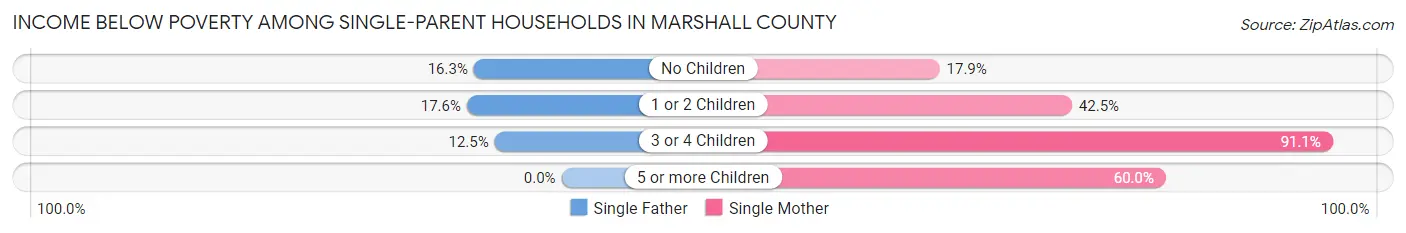
| Children | Single Father | Single Mother |
| No Children | 124 (16.3%) | 283 (17.9%) |
| 1 or 2 Children | 149 (17.6%) | 1,021 (42.5%) |
| 3 or 4 Children | 45 (12.5%) | 378 (91.1%) |
| 5 or more Children | 0 (0.0%) | 6 (60.0%) |
| Total | 318 (16.2%) | 1,688 (38.3%) |
Income Below Poverty Among Married-Couple vs Single-Parent Households in Marshall County
The poverty data for Marshall County shows that 1,089 of the married-couple family households (5.8%) and 2,006 of the single-parent households (31.5%) are living below the poverty level. Within the married-couple family households, those with 5 or more children have the highest poverty rate, with 87 households (36.7%) falling below the poverty line. Among the single-parent households, those with 3 or 4 children have the highest poverty rate, with 423 household (54.5%) living below poverty.
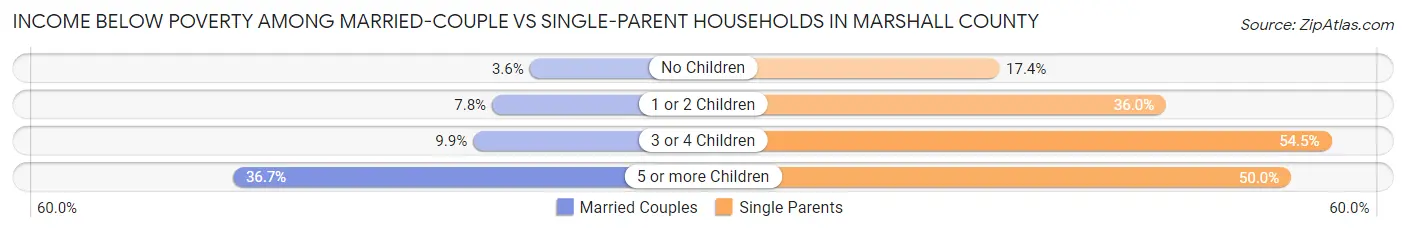
| Children | Married-Couple Families | Single-Parent Households |
| No Children | 403 (3.6%) | 407 (17.4%) |
| 1 or 2 Children | 449 (7.8%) | 1,170 (36.0%) |
| 3 or 4 Children | 150 (9.9%) | 423 (54.5%) |
| 5 or more Children | 87 (36.7%) | 6 (50.0%) |
| Total | 1,089 (5.8%) | 2,006 (31.5%) |
Race in Marshall County
The most populous races in Marshall County are White / Caucasian (83,991 | 85.8%), Hispanic or Latino (14,751 | 15.1%), and Two or more Races (5,434 | 5.6%).
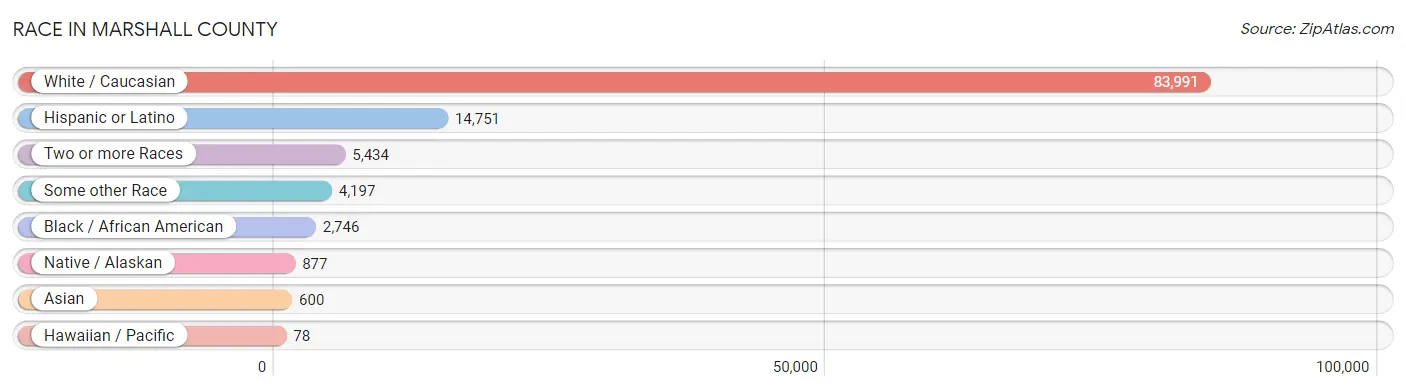
| Race | # Population | % Population |
| Asian | 600 | 0.6% |
| Black / African American | 2,746 | 2.8% |
| Hawaiian / Pacific | 78 | 0.1% |
| Hispanic or Latino | 14,751 | 15.1% |
| Native / Alaskan | 877 | 0.9% |
| White / Caucasian | 83,991 | 85.8% |
| Two or more Races | 5,434 | 5.6% |
| Some other Race | 4,197 | 4.3% |
| Total | 97,923 | 100.0% |
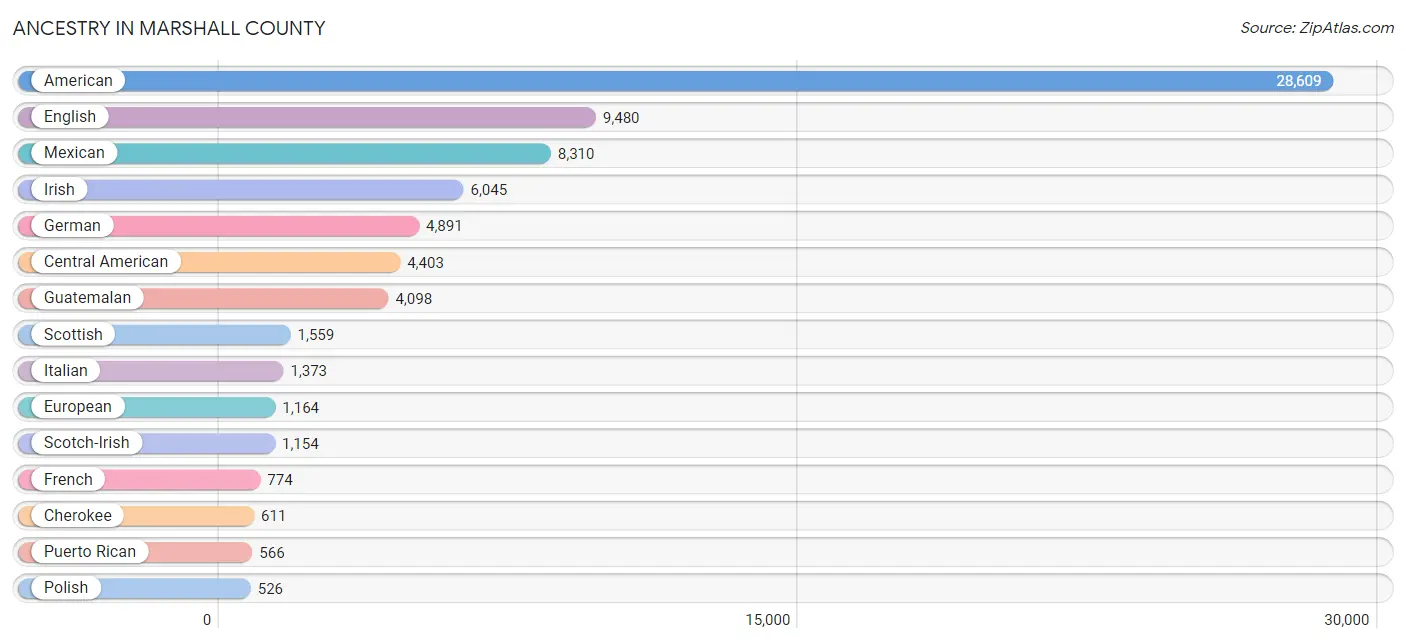
Ancestry in Marshall County
The most populous ancestries reported in Marshall County are American (28,609 | 29.2%), English (9,480 | 9.7%), Mexican (8,310 | 8.5%), Irish (6,045 | 6.2%), and German (4,891 | 5.0%), together accounting for 58.5% of all Marshall County residents.
| Ancestry | # Population | % Population |
| African | 159 | 0.2% |
| American | 28,609 | 29.2% |
| Apache | 1 | 0.0% |
| Arab | 20 | 0.0% |
| Armenian | 3 | 0.0% |
| Assyrian / Chaldean / Syriac | 7 | 0.0% |
| Australian | 1 | 0.0% |
| Austrian | 13 | 0.0% |
| Belgian | 12 | 0.0% |
| Bhutanese | 12 | 0.0% |
| Blackfeet | 98 | 0.1% |
| British | 476 | 0.5% |
| Bulgarian | 1 | 0.0% |
| Burmese | 113 | 0.1% |
| Cajun | 2 | 0.0% |
| Canadian | 8 | 0.0% |
| Celtic | 7 | 0.0% |
| Central American | 4,403 | 4.5% |
| Central American Indian | 443 | 0.4% |
| Cherokee | 611 | 0.6% |
| Chinese | 2 | 0.0% |
| Chippewa | 8 | 0.0% |
| Choctaw | 8 | 0.0% |
| Colombian | 22 | 0.0% |
| Comanche | 5 | 0.0% |
| Creek | 14 | 0.0% |
| Croatian | 140 | 0.1% |
| Cuban | 171 | 0.2% |
| Czech | 26 | 0.0% |
| Czechoslovakian | 8 | 0.0% |
| Danish | 24 | 0.0% |
| Dominican | 2 | 0.0% |
| Dutch | 432 | 0.4% |
| Eastern European | 15 | 0.0% |
| Egyptian | 1 | 0.0% |
| English | 9,480 | 9.7% |
| Ethiopian | 26 | 0.0% |
| European | 1,164 | 1.2% |
| Finnish | 24 | 0.0% |
| French | 774 | 0.8% |
| French Canadian | 131 | 0.1% |
| German | 4,891 | 5.0% |
| Greek | 166 | 0.2% |
| Guamanian / Chamorro | 4 | 0.0% |
| Guatemalan | 4,098 | 4.2% |
| Haitian | 372 | 0.4% |
| Honduran | 205 | 0.2% |
| Hungarian | 17 | 0.0% |
| Indian (Asian) | 199 | 0.2% |
| Indonesian | 6 | 0.0% |
| Iranian | 131 | 0.1% |
| Irish | 6,045 | 6.2% |
| Italian | 1,373 | 1.4% |
| Jamaican | 9 | 0.0% |
| Korean | 115 | 0.1% |
| Lebanese | 2 | 0.0% |
| Lithuanian | 14 | 0.0% |
| Mexican | 8,310 | 8.5% |
| Mexican American Indian | 494 | 0.5% |
| Moroccan | 1 | 0.0% |
| Native Hawaiian | 5 | 0.0% |
| Navajo | 1 | 0.0% |
| New Zealander | 11 | 0.0% |
| Nicaraguan | 78 | 0.1% |
| Nigerian | 2 | 0.0% |
| Northern European | 108 | 0.1% |
| Norwegian | 355 | 0.4% |
| Pakistani | 4 | 0.0% |
| Palestinian | 9 | 0.0% |
| Pennsylvania German | 8 | 0.0% |
| Polish | 526 | 0.5% |
| Portuguese | 273 | 0.3% |
| Puerto Rican | 566 | 0.6% |
| Romanian | 8 | 0.0% |
| Russian | 66 | 0.1% |
| Salvadoran | 22 | 0.0% |
| Samoan | 15 | 0.0% |
| Scandinavian | 58 | 0.1% |
| Scotch-Irish | 1,154 | 1.2% |
| Scottish | 1,559 | 1.6% |
| Seminole | 1 | 0.0% |
| Serbian | 22 | 0.0% |
| Shoshone | 1 | 0.0% |
| Slavic | 28 | 0.0% |
| Slovak | 6 | 0.0% |
| Slovene | 3 | 0.0% |
| South American | 44 | 0.0% |
| South American Indian | 1 | 0.0% |
| Spaniard | 35 | 0.0% |
| Spanish | 57 | 0.1% |
| Spanish American | 1 | 0.0% |
| Sri Lankan | 170 | 0.2% |
| Subsaharan African | 208 | 0.2% |
| Swedish | 197 | 0.2% |
| Swiss | 124 | 0.1% |
| Syrian | 4 | 0.0% |
| Thai | 147 | 0.2% |
| Tongan | 1 | 0.0% |
| U.S. Virgin Islander | 112 | 0.1% |
| Ukrainian | 17 | 0.0% |
| Venezuelan | 22 | 0.0% |
| Welsh | 277 | 0.3% |
| Yugoslavian | 9 | 0.0% | View All 103 Rows |
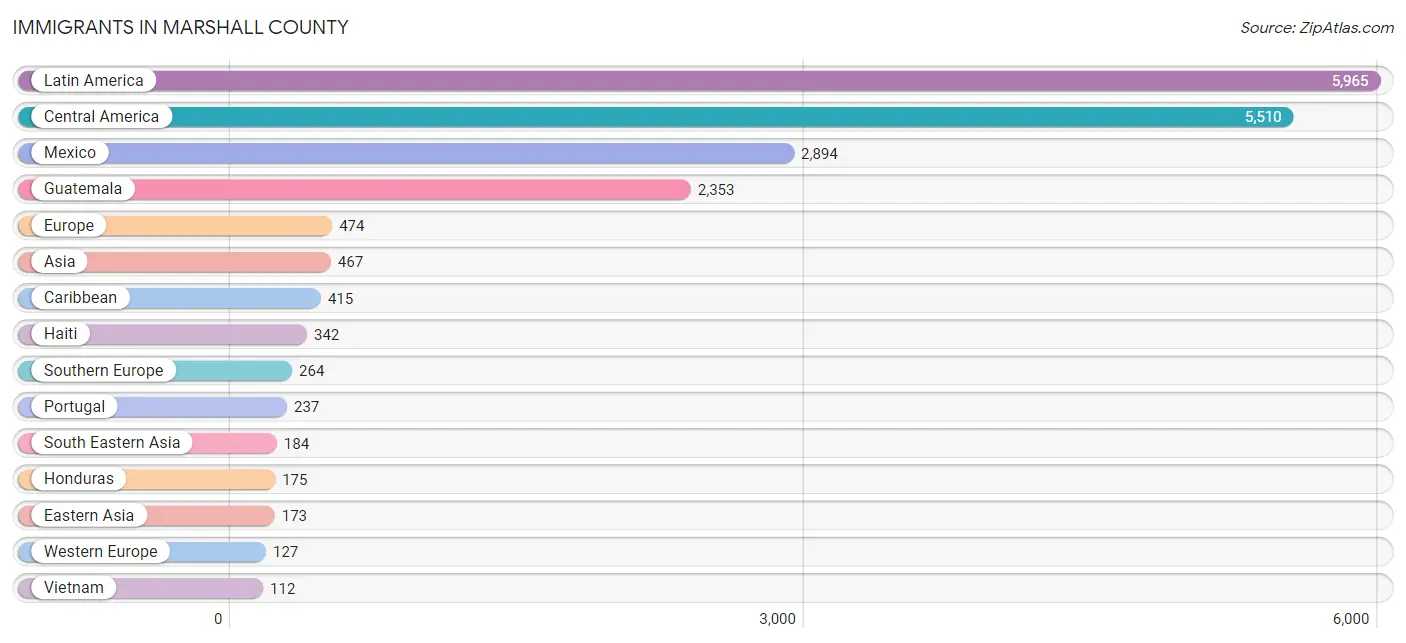
Immigrants in Marshall County
The most numerous immigrant groups reported in Marshall County came from Latin America (5,965 | 6.1%), Central America (5,510 | 5.6%), Mexico (2,894 | 3.0%), Guatemala (2,353 | 2.4%), and Europe (474 | 0.5%), together accounting for 17.6% of all Marshall County residents.
| Immigration Origin | # Population | % Population |
| Africa | 61 | 0.1% |
| Argentina | 2 | 0.0% |
| Asia | 467 | 0.5% |
| Bulgaria | 2 | 0.0% |
| Canada | 21 | 0.0% |
| Caribbean | 415 | 0.4% |
| Central America | 5,510 | 5.6% |
| China | 108 | 0.1% |
| Colombia | 16 | 0.0% |
| Cuba | 73 | 0.1% |
| Eastern Africa | 14 | 0.0% |
| Eastern Asia | 173 | 0.2% |
| Eastern Europe | 22 | 0.0% |
| El Salvador | 1 | 0.0% |
| England | 18 | 0.0% |
| Ethiopia | 13 | 0.0% |
| Europe | 474 | 0.5% |
| France | 17 | 0.0% |
| Germany | 64 | 0.1% |
| Greece | 13 | 0.0% |
| Guatemala | 2,353 | 2.4% |
| Haiti | 342 | 0.4% |
| Honduras | 175 | 0.2% |
| India | 75 | 0.1% |
| Iran | 26 | 0.0% |
| Japan | 21 | 0.0% |
| Korea | 44 | 0.0% |
| Latin America | 5,965 | 6.1% |
| Mexico | 2,894 | 3.0% |
| Netherlands | 46 | 0.1% |
| Nicaragua | 87 | 0.1% |
| Northern Europe | 61 | 0.1% |
| Oceania | 11 | 0.0% |
| Philippines | 72 | 0.1% |
| Portugal | 237 | 0.2% |
| Russia | 17 | 0.0% |
| Scotland | 6 | 0.0% |
| South America | 40 | 0.0% |
| South Central Asia | 101 | 0.1% |
| South Eastern Asia | 184 | 0.2% |
| Southern Europe | 264 | 0.3% |
| Spain | 14 | 0.0% |
| Sweden | 5 | 0.0% |
| Ukraine | 3 | 0.0% |
| Venezuela | 22 | 0.0% |
| Vietnam | 112 | 0.1% |
| Western Africa | 46 | 0.1% |
| Western Asia | 9 | 0.0% |
| Western Europe | 127 | 0.1% | View All 49 Rows |
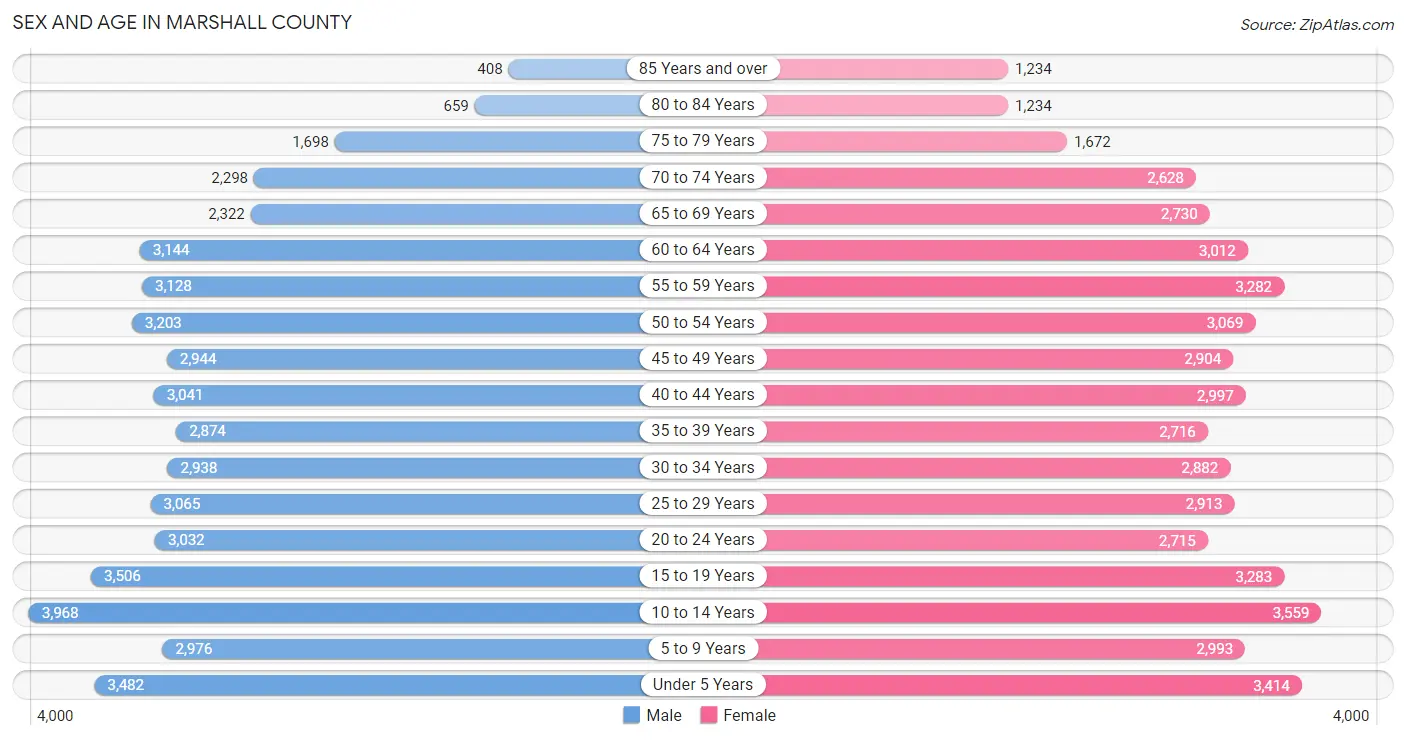
Sex and Age in Marshall County
Sex and Age in Marshall County
The most populous age groups in Marshall County are 10 to 14 Years (3,968 | 8.2%) for men and 10 to 14 Years (3,559 | 7.2%) for women.
| Age Bracket | Male | Female |
| Under 5 Years | 3,482 (7.1%) | 3,414 (6.9%) |
| 5 to 9 Years | 2,976 (6.1%) | 2,993 (6.1%) |
| 10 to 14 Years | 3,968 (8.2%) | 3,559 (7.2%) |
| 15 to 19 Years | 3,506 (7.2%) | 3,283 (6.7%) |
| 20 to 24 Years | 3,032 (6.2%) | 2,715 (5.5%) |
| 25 to 29 Years | 3,065 (6.3%) | 2,913 (5.9%) |
| 30 to 34 Years | 2,938 (6.0%) | 2,882 (5.9%) |
| 35 to 39 Years | 2,874 (5.9%) | 2,716 (5.5%) |
| 40 to 44 Years | 3,041 (6.2%) | 2,997 (6.1%) |
| 45 to 49 Years | 2,944 (6.0%) | 2,904 (5.9%) |
| 50 to 54 Years | 3,203 (6.6%) | 3,069 (6.2%) |
| 55 to 59 Years | 3,128 (6.4%) | 3,282 (6.7%) |
| 60 to 64 Years | 3,144 (6.5%) | 3,012 (6.1%) |
| 65 to 69 Years | 2,322 (4.8%) | 2,730 (5.5%) |
| 70 to 74 Years | 2,298 (4.7%) | 2,628 (5.3%) |
| 75 to 79 Years | 1,698 (3.5%) | 1,672 (3.4%) |
| 80 to 84 Years | 659 (1.3%) | 1,234 (2.5%) |
| 85 Years and over | 408 (0.8%) | 1,234 (2.5%) |
| Total | 48,686 (100.0%) | 49,237 (100.0%) |
Families and Households in Marshall County
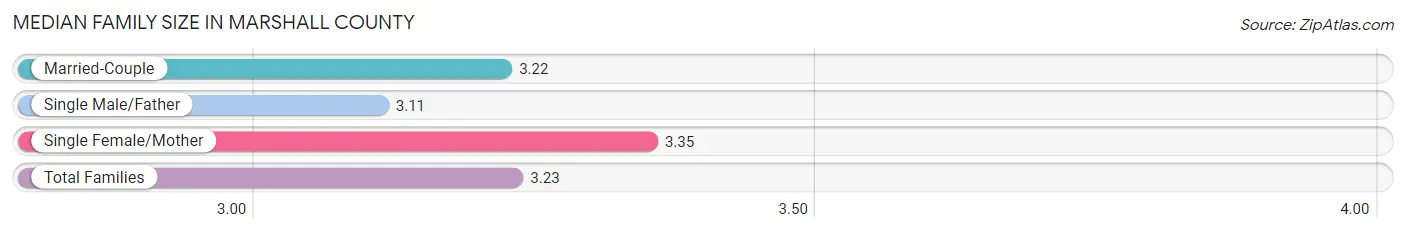
Median Family Size in Marshall County
The median family size in Marshall County is 3.23 persons per family, with single female/mother families (4,411 | 17.5%) accounting for the largest median family size of 3.35 persons per family. On the other hand, single male/father families (1,967 | 7.8%) represent the smallest median family size with 3.11 persons per family.
| Family Type | # Families | Family Size |
| Married-Couple | 18,830 (74.7%) | 3.22 |
| Single Male/Father | 1,967 (7.8%) | 3.11 |
| Single Female/Mother | 4,411 (17.5%) | 3.35 |
| Total Families | 25,208 (100.0%) | 3.23 |
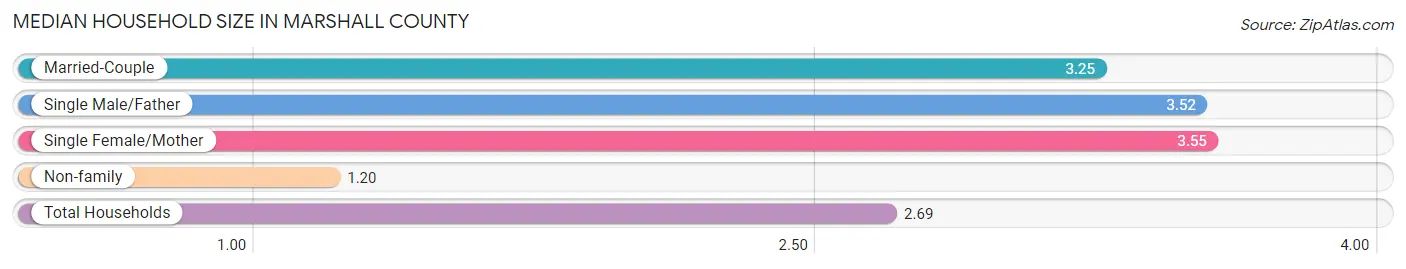
Median Household Size in Marshall County
The median household size in Marshall County is 2.69 persons per household, with single female/mother households (4,411 | 12.3%) accounting for the largest median household size of 3.55 persons per household. non-family households (10,722 | 29.8%) represent the smallest median household size with 1.20 persons per household.
| Household Type | # Households | Household Size |
| Married-Couple | 18,830 (52.4%) | 3.25 |
| Single Male/Father | 1,967 (5.5%) | 3.52 |
| Single Female/Mother | 4,411 (12.3%) | 3.55 |
| Non-family | 10,722 (29.8%) | 1.20 |
| Total Households | 35,930 (100.0%) | 2.69 |
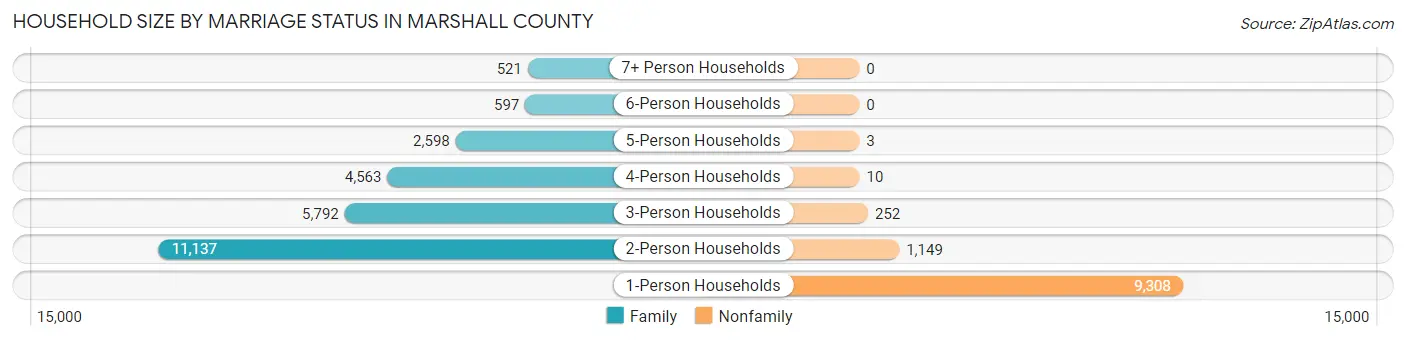
Household Size by Marriage Status in Marshall County
Out of a total of 35,930 households in Marshall County, 25,208 (70.2%) are family households, while 10,722 (29.8%) are nonfamily households. The most numerous type of family households are 2-person households, comprising 11,137, and the most common type of nonfamily households are 1-person households, comprising 9,308.
| Household Size | Family Households | Nonfamily Households |
| 1-Person Households | - | 9,308 (25.9%) |
| 2-Person Households | 11,137 (31.0%) | 1,149 (3.2%) |
| 3-Person Households | 5,792 (16.1%) | 252 (0.7%) |
| 4-Person Households | 4,563 (12.7%) | 10 (0.0%) |
| 5-Person Households | 2,598 (7.2%) | 3 (0.0%) |
| 6-Person Households | 597 (1.7%) | 0 (0.0%) |
| 7+ Person Households | 521 (1.5%) | 0 (0.0%) |
| Total | 25,208 (70.2%) | 10,722 (29.8%) |
Female Fertility in Marshall County
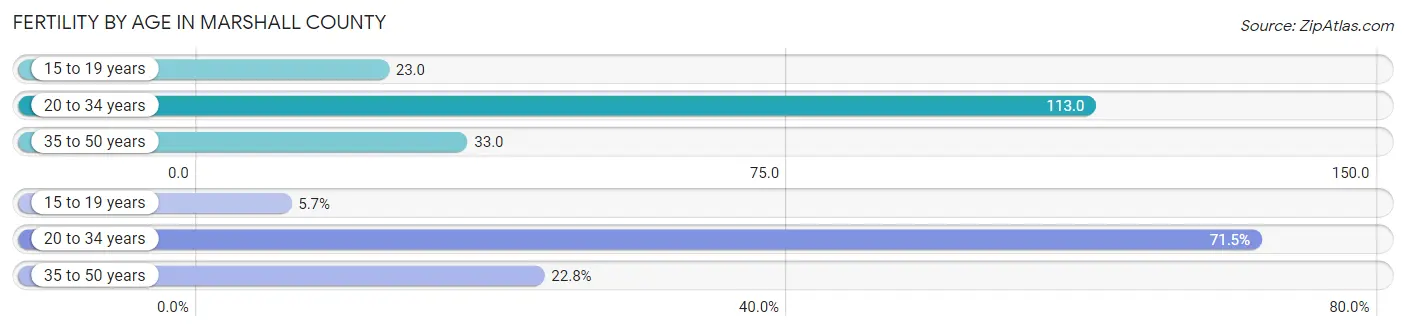
Fertility by Age in Marshall County
Average fertility rate in Marshall County is 64.0 births per 1,000 women. Women in the age bracket of 20 to 34 years have the highest fertility rate with 113.0 births per 1,000 women. Women in the age bracket of 20 to 34 years acount for 71.5% of all women with births.
| Age Bracket | Women with Births | Births / 1,000 Women |
| 15 to 19 years | 76 (5.7%) | 23.0 |
| 20 to 34 years | 962 (71.5%) | 113.0 |
| 35 to 50 years | 307 (22.8%) | 33.0 |
| Total | 1,345 (100.0%) | 64.0 |
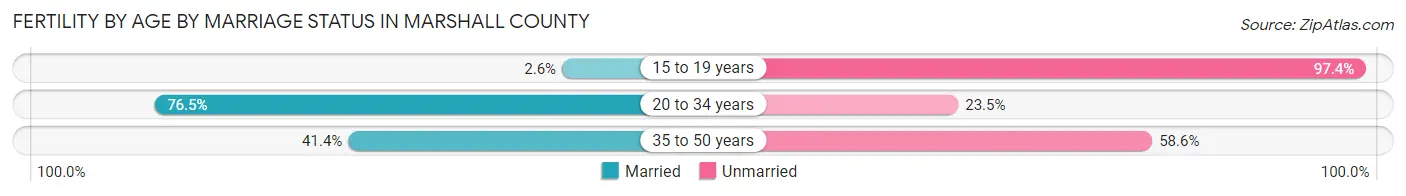
Fertility by Age by Marriage Status in Marshall County
64.3% of women with births (1,345) in Marshall County are married. The highest percentage of unmarried women with births falls into 15 to 19 years age bracket with 97.4% of them unmarried at the time of birth, while the lowest percentage of unmarried women with births belong to 20 to 34 years age bracket with 23.5% of them unmarried.
| Age Bracket | Married | Unmarried |
| 15 to 19 years | 2 (2.6%) | 74 (97.4%) |
| 20 to 34 years | 736 (76.5%) | 226 (23.5%) |
| 35 to 50 years | 127 (41.4%) | 180 (58.6%) |
| Total | 865 (64.3%) | 480 (35.7%) |
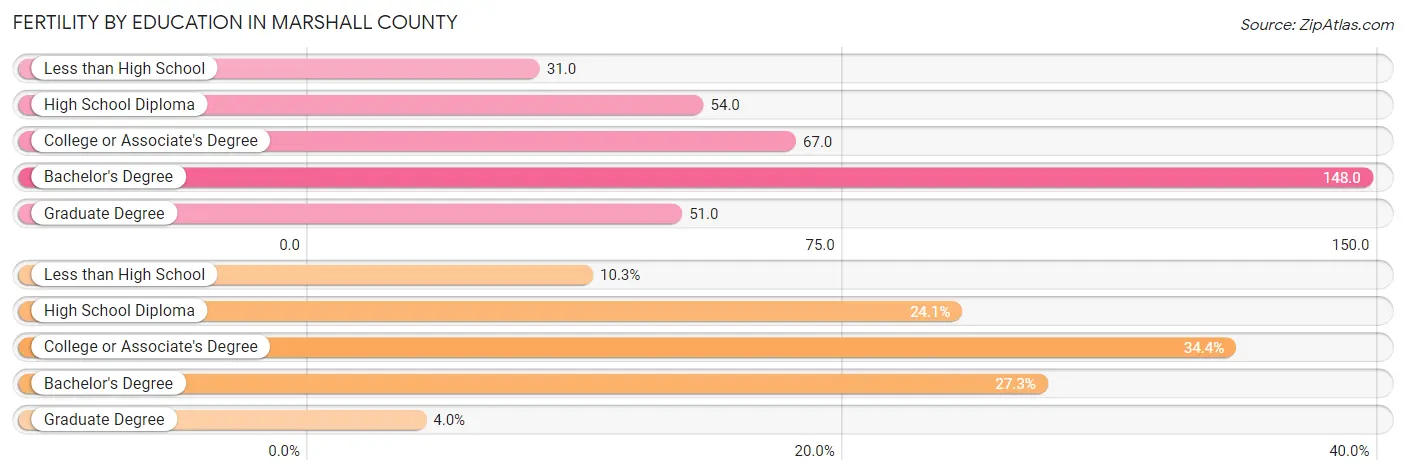
Fertility by Education in Marshall County
Average fertility rate in Marshall County is 64.0 births per 1,000 women. Women with the education attainment of bachelor's degree have the highest fertility rate of 148.0 births per 1,000 women, while women with the education attainment of less than high school have the lowest fertility at 31.0 births per 1,000 women. Women with the education attainment of college or associate's degree represent 34.4% of all women with births.
| Educational Attainment | Women with Births | Births / 1,000 Women |
| Less than High School | 138 (10.3%) | 31.0 |
| High School Diploma | 324 (24.1%) | 54.0 |
| College or Associate's Degree | 462 (34.4%) | 67.0 |
| Bachelor's Degree | 367 (27.3%) | 148.0 |
| Graduate Degree | 54 (4.0%) | 51.0 |
| Total | 1,345 (100.0%) | 64.0 |
Fertility by Education by Marriage Status in Marshall County
35.7% of women with births in Marshall County are unmarried. Women with the educational attainment of graduate degree are most likely to be married with 100.0% of them married at childbirth, while women with the educational attainment of less than high school are least likely to be married with 71.7% of them unmarried at childbirth.

| Educational Attainment | Married | Unmarried |
| Less than High School | 39 (28.3%) | 99 (71.7%) |
| High School Diploma | 203 (62.6%) | 121 (37.3%) |
| College or Associate's Degree | 237 (51.3%) | 225 (48.7%) |
| Bachelor's Degree | 332 (90.5%) | 35 (9.5%) |
| Graduate Degree | 54 (100.0%) | 0 (0.0%) |
| Total | 865 (64.3%) | 480 (35.7%) |
Employment Characteristics in Marshall County
Employment by Class of Employer in Marshall County
Among the 40,866 employed individuals in Marshall County, private company employees (28,731 | 70.3%), local government employees (3,205 | 7.8%), and self-employed (not incorporated) (2,679 | 6.6%) make up the most common classes of employment.
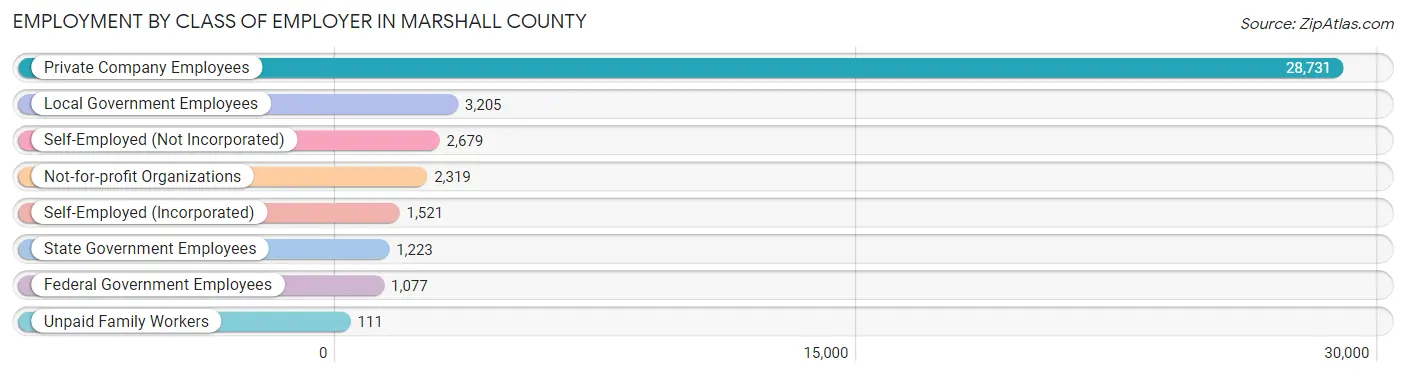
| Employer Class | # Employees | % Employees |
| Private Company Employees | 28,731 | 70.3% |
| Self-Employed (Incorporated) | 1,521 | 3.7% |
| Self-Employed (Not Incorporated) | 2,679 | 6.6% |
| Not-for-profit Organizations | 2,319 | 5.7% |
| Local Government Employees | 3,205 | 7.8% |
| State Government Employees | 1,223 | 3.0% |
| Federal Government Employees | 1,077 | 2.6% |
| Unpaid Family Workers | 111 | 0.3% |
| Total | 40,866 | 100.0% |
Employment Status by Age in Marshall County
According to the labor force statistics for Marshall County, out of the total population over 16 years of age (75,849), 56.9% or 43,158 individuals are in the labor force, with 3.8% or 1,640 of them unemployed. The age group with the highest labor force participation rate is 25 to 29 years, with 82.4% or 4,926 individuals in the labor force. Within the labor force, the 16 to 19 years age range has the highest percentage of unemployed individuals, with 14.5% or 278 of them being unemployed.
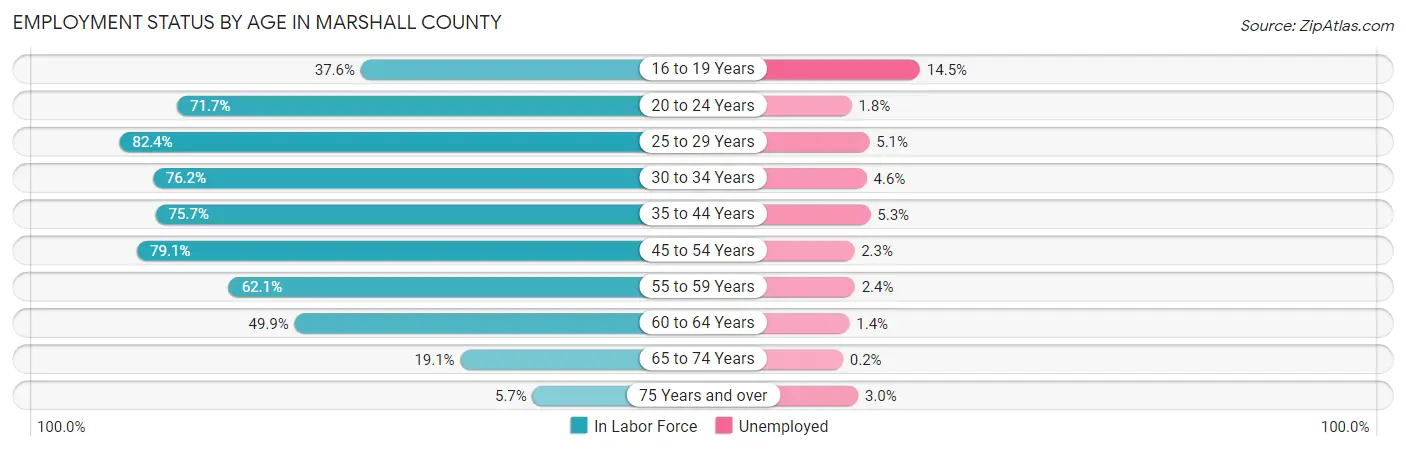
| Age Bracket | In Labor Force | Unemployed |
| 16 to 19 Years | 1,920 (37.6%) | 278 (14.5%) |
| 20 to 24 Years | 4,121 (71.7%) | 74 (1.8%) |
| 25 to 29 Years | 4,926 (82.4%) | 251 (5.1%) |
| 30 to 34 Years | 4,435 (76.2%) | 204 (4.6%) |
| 35 to 44 Years | 8,802 (75.7%) | 467 (5.3%) |
| 45 to 54 Years | 9,587 (79.1%) | 221 (2.3%) |
| 55 to 59 Years | 3,981 (62.1%) | 96 (2.4%) |
| 60 to 64 Years | 3,072 (49.9%) | 43 (1.4%) |
| 65 to 74 Years | 1,906 (19.1%) | 4 (0.2%) |
| 75 Years and over | 394 (5.7%) | 12 (3.0%) |
| Total | 43,158 (56.9%) | 1,640 (3.8%) |
Employment Status by Educational Attainment in Marshall County
According to labor force statistics for Marshall County, 72.3% of individuals (34,785) out of the total population between 25 and 64 years of age (48,112) are in the labor force, with 3.7% or 1,287 of them being unemployed. The group with the highest labor force participation rate are those with the educational attainment of bachelor's degree or higher, with 82.8% or 8,750 individuals in the labor force. Within the labor force, individuals with less than high school education have the highest percentage of unemployment, with 8.8% or 396 of them being unemployed.
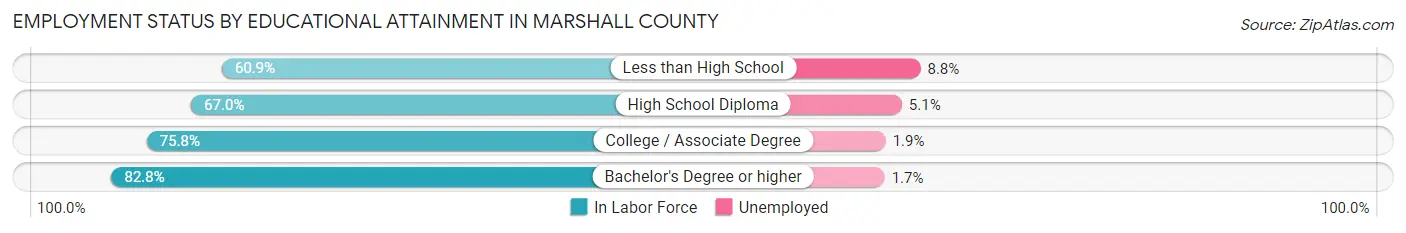
| Educational Attainment | In Labor Force | Unemployed |
| Less than High School | 4,505 (60.9%) | 651 (8.8%) |
| High School Diploma | 9,843 (67.0%) | 749 (5.1%) |
| College / Associate Degree | 11,716 (75.8%) | 294 (1.9%) |
| Bachelor's Degree or higher | 8,750 (82.8%) | 180 (1.7%) |
| Total | 34,785 (72.3%) | 1,780 (3.7%) |
Employment Occupations by Sex in Marshall County
Management, Business, Science and Arts Occupations
The most common Management, Business, Science and Arts occupations in Marshall County are Management (3,575 | 8.6%), Community & Social Service (3,296 | 8.0%), Health Diagnosing & Treating (3,166 | 7.6%), Education Instruction & Library (2,303 | 5.6%), and Computers, Engineering & Science (2,185 | 5.3%).
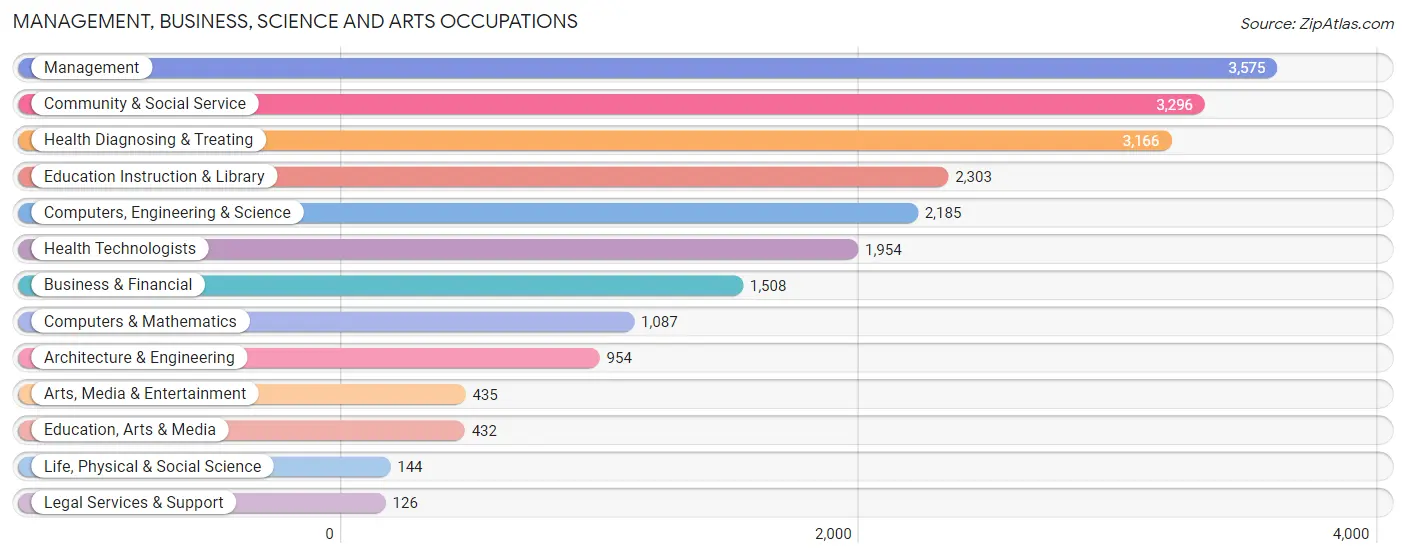
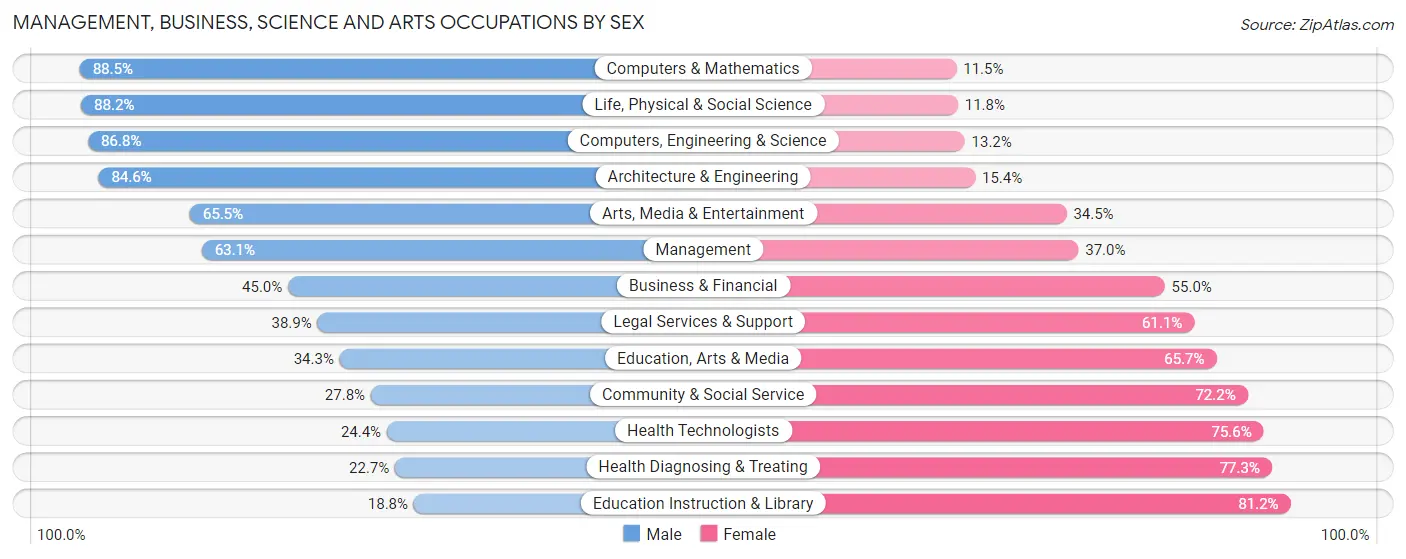
Management, Business, Science and Arts Occupations by Sex
Within the Management, Business, Science and Arts occupations in Marshall County, the most male-oriented occupations are Computers & Mathematics (88.5%), Life, Physical & Social Science (88.2%), and Computers, Engineering & Science (86.8%), while the most female-oriented occupations are Education Instruction & Library (81.2%), Health Diagnosing & Treating (77.3%), and Health Technologists (75.6%).
| Occupation | Male | Female |
| Management | 2,254 (63.0%) | 1,321 (36.9%) |
| Business & Financial | 679 (45.0%) | 829 (55.0%) |
| Computers, Engineering & Science | 1,896 (86.8%) | 289 (13.2%) |
| Computers & Mathematics | 962 (88.5%) | 125 (11.5%) |
| Architecture & Engineering | 807 (84.6%) | 147 (15.4%) |
| Life, Physical & Social Science | 127 (88.2%) | 17 (11.8%) |
| Community & Social Service | 915 (27.8%) | 2,381 (72.2%) |
| Education, Arts & Media | 148 (34.3%) | 284 (65.7%) |
| Legal Services & Support | 49 (38.9%) | 77 (61.1%) |
| Education Instruction & Library | 433 (18.8%) | 1,870 (81.2%) |
| Arts, Media & Entertainment | 285 (65.5%) | 150 (34.5%) |
| Health Diagnosing & Treating | 719 (22.7%) | 2,447 (77.3%) |
| Health Technologists | 477 (24.4%) | 1,477 (75.6%) |
| Total (Category) | 6,463 (47.1%) | 7,267 (52.9%) |
| Total (Overall) | 23,063 (55.7%) | 18,326 (44.3%) |
Services Occupations
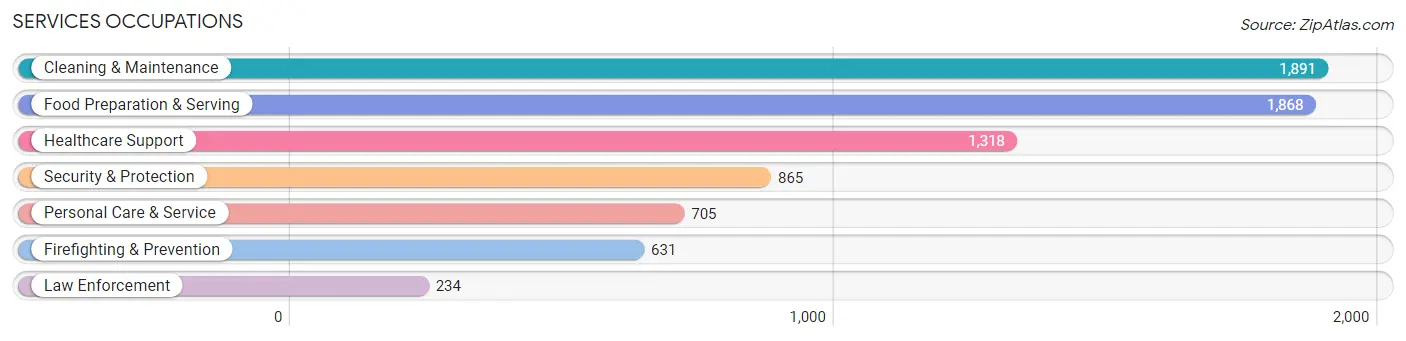
The most common Services occupations in Marshall County are Cleaning & Maintenance (1,891 | 4.6%), Food Preparation & Serving (1,868 | 4.5%), Healthcare Support (1,318 | 3.2%), Security & Protection (865 | 2.1%), and Personal Care & Service (705 | 1.7%).
Services Occupations by Sex
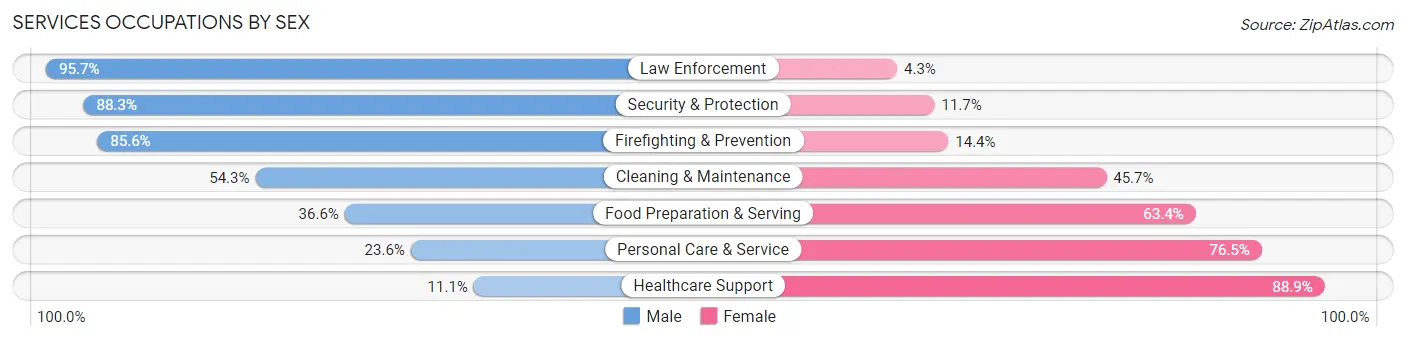
Within the Services occupations in Marshall County, the most male-oriented occupations are Law Enforcement (95.7%), Security & Protection (88.3%), and Firefighting & Prevention (85.6%), while the most female-oriented occupations are Healthcare Support (88.9%), Personal Care & Service (76.4%), and Food Preparation & Serving (63.4%).
| Occupation | Male | Female |
| Healthcare Support | 146 (11.1%) | 1,172 (88.9%) |
| Security & Protection | 764 (88.3%) | 101 (11.7%) |
| Firefighting & Prevention | 540 (85.6%) | 91 (14.4%) |
| Law Enforcement | 224 (95.7%) | 10 (4.3%) |
| Food Preparation & Serving | 684 (36.6%) | 1,184 (63.4%) |
| Cleaning & Maintenance | 1,027 (54.3%) | 864 (45.7%) |
| Personal Care & Service | 166 (23.5%) | 539 (76.4%) |
| Total (Category) | 2,787 (41.9%) | 3,860 (58.1%) |
| Total (Overall) | 23,063 (55.7%) | 18,326 (44.3%) |
Sales and Office Occupations
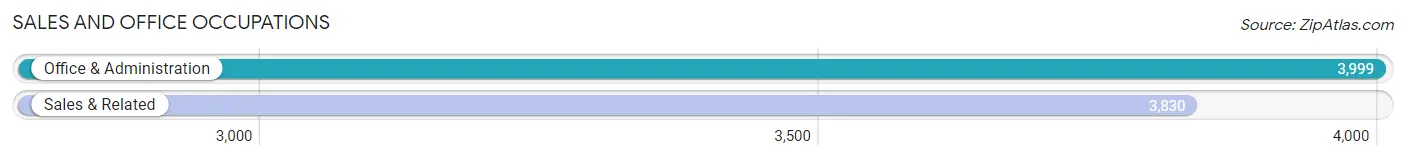
The most common Sales and Office occupations in Marshall County are Office & Administration (3,999 | 9.7%), and Sales & Related (3,830 | 9.2%).
Sales and Office Occupations by Sex
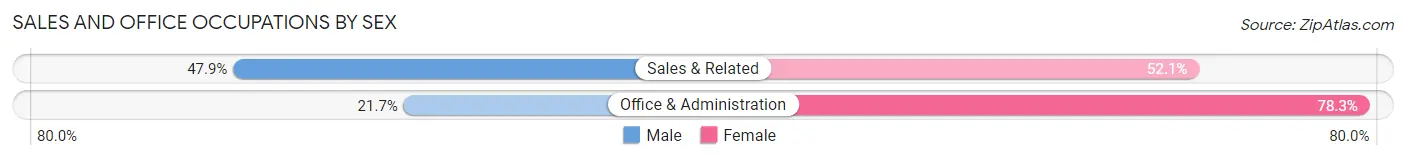
| Occupation | Male | Female |
| Sales & Related | 1,835 (47.9%) | 1,995 (52.1%) |
| Office & Administration | 867 (21.7%) | 3,132 (78.3%) |
| Total (Category) | 2,702 (34.5%) | 5,127 (65.5%) |
| Total (Overall) | 23,063 (55.7%) | 18,326 (44.3%) |
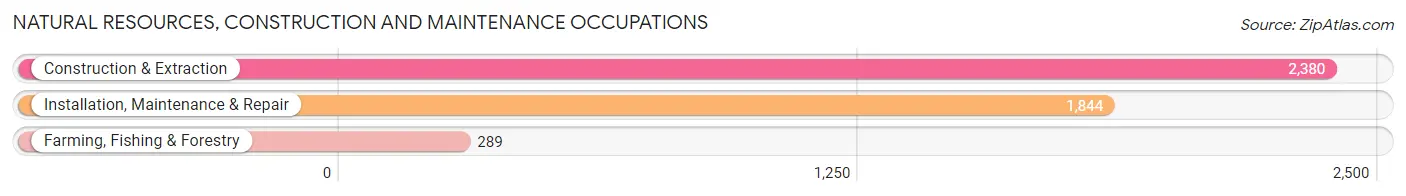
Natural Resources, Construction and Maintenance Occupations
The most common Natural Resources, Construction and Maintenance occupations in Marshall County are Construction & Extraction (2,380 | 5.8%), Installation, Maintenance & Repair (1,844 | 4.5%), and Farming, Fishing & Forestry (289 | 0.7%).
Natural Resources, Construction and Maintenance Occupations by Sex
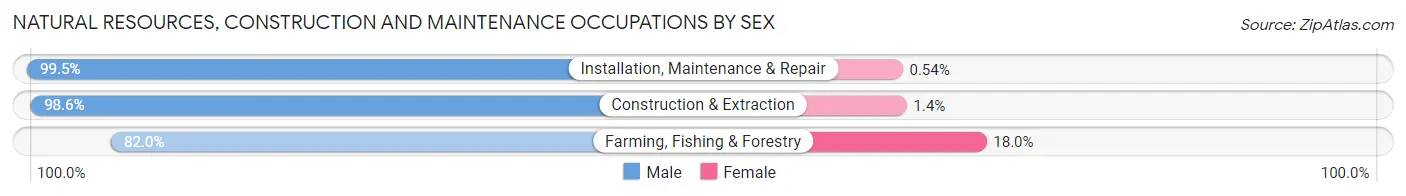
| Occupation | Male | Female |
| Farming, Fishing & Forestry | 237 (82.0%) | 52 (18.0%) |
| Construction & Extraction | 2,347 (98.6%) | 33 (1.4%) |
| Installation, Maintenance & Repair | 1,834 (99.5%) | 10 (0.5%) |
| Total (Category) | 4,418 (97.9%) | 95 (2.1%) |
| Total (Overall) | 23,063 (55.7%) | 18,326 (44.3%) |
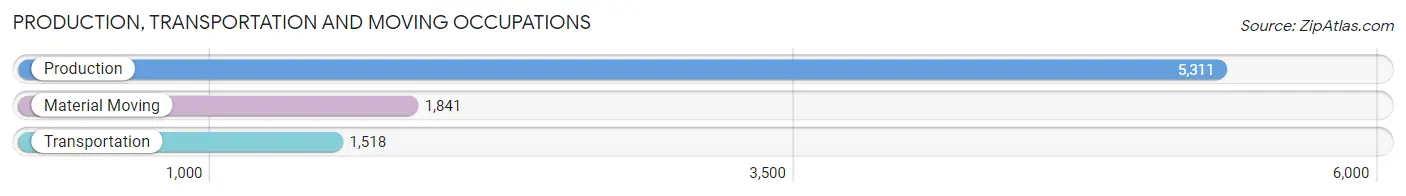
Production, Transportation and Moving Occupations
The most common Production, Transportation and Moving occupations in Marshall County are Production (5,311 | 12.8%), Material Moving (1,841 | 4.4%), and Transportation (1,518 | 3.7%).
Production, Transportation and Moving Occupations by Sex
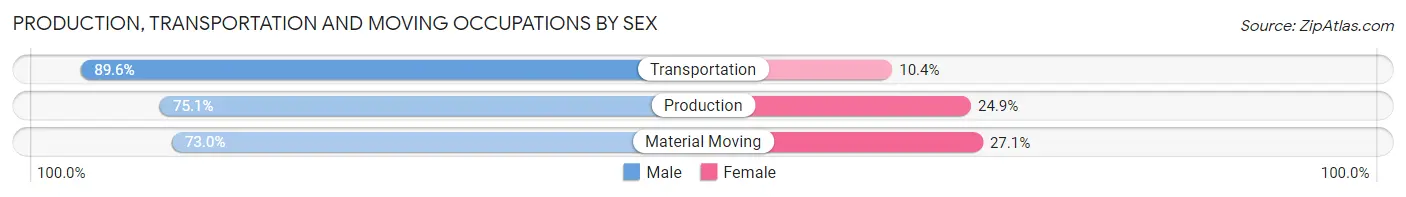
| Occupation | Male | Female |
| Production | 3,990 (75.1%) | 1,321 (24.9%) |
| Transportation | 1,360 (89.6%) | 158 (10.4%) |
| Material Moving | 1,343 (73.0%) | 498 (27.1%) |
| Total (Category) | 6,693 (77.2%) | 1,977 (22.8%) |
| Total (Overall) | 23,063 (55.7%) | 18,326 (44.3%) |
Employment Industries by Sex in Marshall County
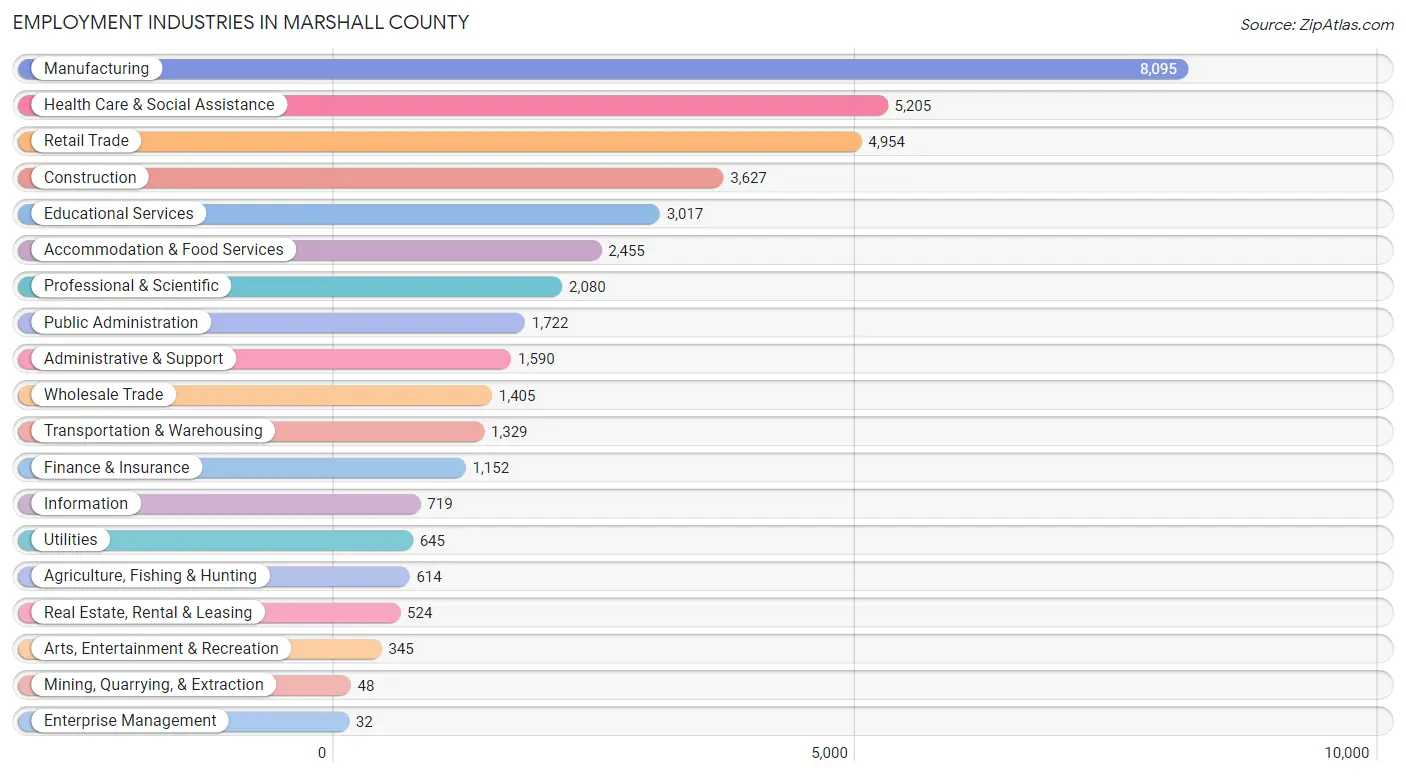
Employment Industries in Marshall County
The major employment industries in Marshall County include Manufacturing (8,095 | 19.6%), Health Care & Social Assistance (5,205 | 12.6%), Retail Trade (4,954 | 12.0%), Construction (3,627 | 8.8%), and Educational Services (3,017 | 7.3%).
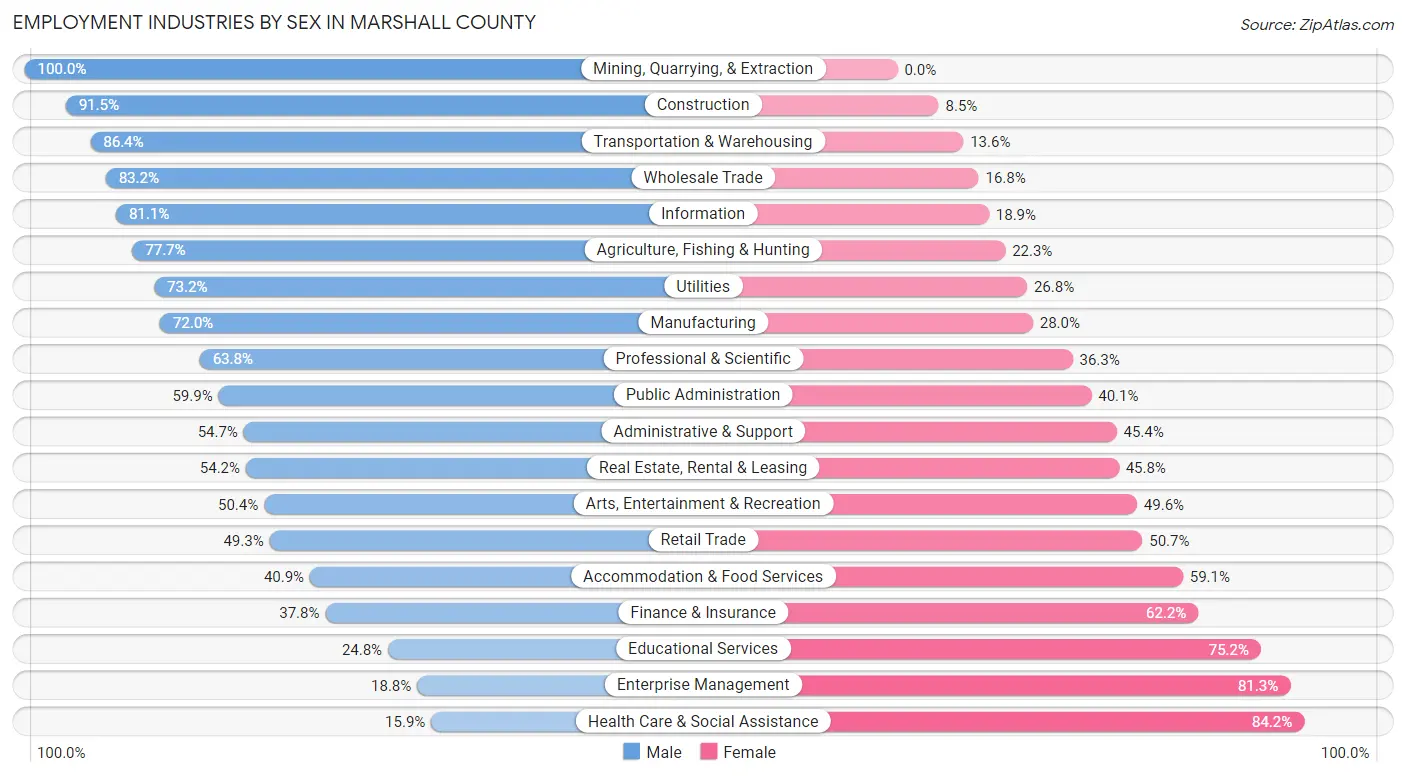
Employment Industries by Sex in Marshall County
The Marshall County industries that see more men than women are Mining, Quarrying, & Extraction (100.0%), Construction (91.5%), and Transportation & Warehousing (86.4%), whereas the industries that tend to have a higher number of women are Health Care & Social Assistance (84.2%), Enterprise Management (81.2%), and Educational Services (75.2%).
| Industry | Male | Female |
| Agriculture, Fishing & Hunting | 477 (77.7%) | 137 (22.3%) |
| Mining, Quarrying, & Extraction | 48 (100.0%) | 0 (0.0%) |
| Construction | 3,318 (91.5%) | 309 (8.5%) |
| Manufacturing | 5,827 (72.0%) | 2,268 (28.0%) |
| Wholesale Trade | 1,169 (83.2%) | 236 (16.8%) |
| Retail Trade | 2,443 (49.3%) | 2,511 (50.7%) |
| Transportation & Warehousing | 1,148 (86.4%) | 181 (13.6%) |
| Utilities | 472 (73.2%) | 173 (26.8%) |
| Information | 583 (81.1%) | 136 (18.9%) |
| Finance & Insurance | 435 (37.8%) | 717 (62.2%) |
| Real Estate, Rental & Leasing | 284 (54.2%) | 240 (45.8%) |
| Professional & Scientific | 1,326 (63.7%) | 754 (36.2%) |
| Enterprise Management | 6 (18.8%) | 26 (81.2%) |
| Administrative & Support | 869 (54.6%) | 721 (45.4%) |
| Educational Services | 748 (24.8%) | 2,269 (75.2%) |
| Health Care & Social Assistance | 825 (15.9%) | 4,380 (84.2%) |
| Arts, Entertainment & Recreation | 174 (50.4%) | 171 (49.6%) |
| Accommodation & Food Services | 1,005 (40.9%) | 1,450 (59.1%) |
| Public Administration | 1,031 (59.9%) | 691 (40.1%) |
| Total | 23,063 (55.7%) | 18,326 (44.3%) |
Education in Marshall County
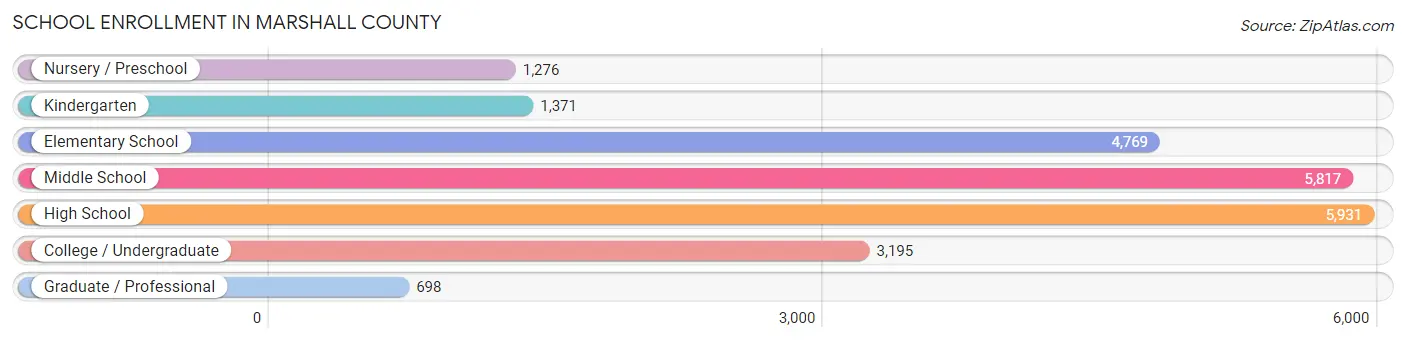
School Enrollment in Marshall County
The most common levels of schooling among the 23,057 students in Marshall County are high school (5,931 | 25.7%), middle school (5,817 | 25.2%), and elementary school (4,769 | 20.7%).
| School Level | # Students | % Students |
| Nursery / Preschool | 1,276 | 5.5% |
| Kindergarten | 1,371 | 5.9% |
| Elementary School | 4,769 | 20.7% |
| Middle School | 5,817 | 25.2% |
| High School | 5,931 | 25.7% |
| College / Undergraduate | 3,195 | 13.9% |
| Graduate / Professional | 698 | 3.0% |
| Total | 23,057 | 100.0% |
School Enrollment by Age by Funding Source in Marshall County
Out of a total of 23,057 students who are enrolled in schools in Marshall County, 1,752 (7.6%) attend a private institution, while the remaining 21,305 (92.4%) are enrolled in public schools. The age group of 3 to 4 year olds has the highest likelihood of being enrolled in private schools, with 262 (22.6% in the age bracket) enrolled. Conversely, the age group of 20 to 24 year olds has the lowest likelihood of being enrolled in a private school, with 1,667 (96.3% in the age bracket) attending a public institution.
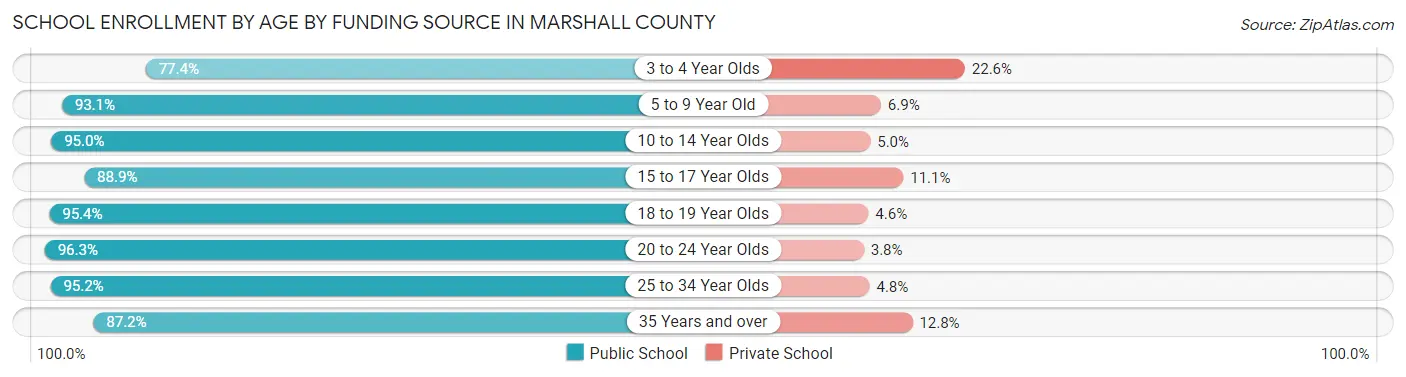
| Age Bracket | Public School | Private School |
| 3 to 4 Year Olds | 899 (77.4%) | 262 (22.6%) |
| 5 to 9 Year Old | 5,052 (93.1%) | 377 (6.9%) |
| 10 to 14 Year Olds | 6,883 (95.0%) | 359 (5.0%) |
| 15 to 17 Year Olds | 3,635 (88.9%) | 454 (11.1%) |
| 18 to 19 Year Olds | 1,698 (95.4%) | 82 (4.6%) |
| 20 to 24 Year Olds | 1,667 (96.3%) | 65 (3.7%) |
| 25 to 34 Year Olds | 691 (95.2%) | 35 (4.8%) |
| 35 Years and over | 783 (87.2%) | 115 (12.8%) |
| Total | 21,305 (92.4%) | 1,752 (7.6%) |
Educational Attainment by Field of Study in Marshall County
Business (3,545 | 24.3%), education (3,160 | 21.6%), science & technology (1,521 | 10.4%), engineering (1,158 | 7.9%), and bio, nature & agricultural (947 | 6.5%) are the most common fields of study among 14,597 individuals in Marshall County who have obtained a bachelor's degree or higher.
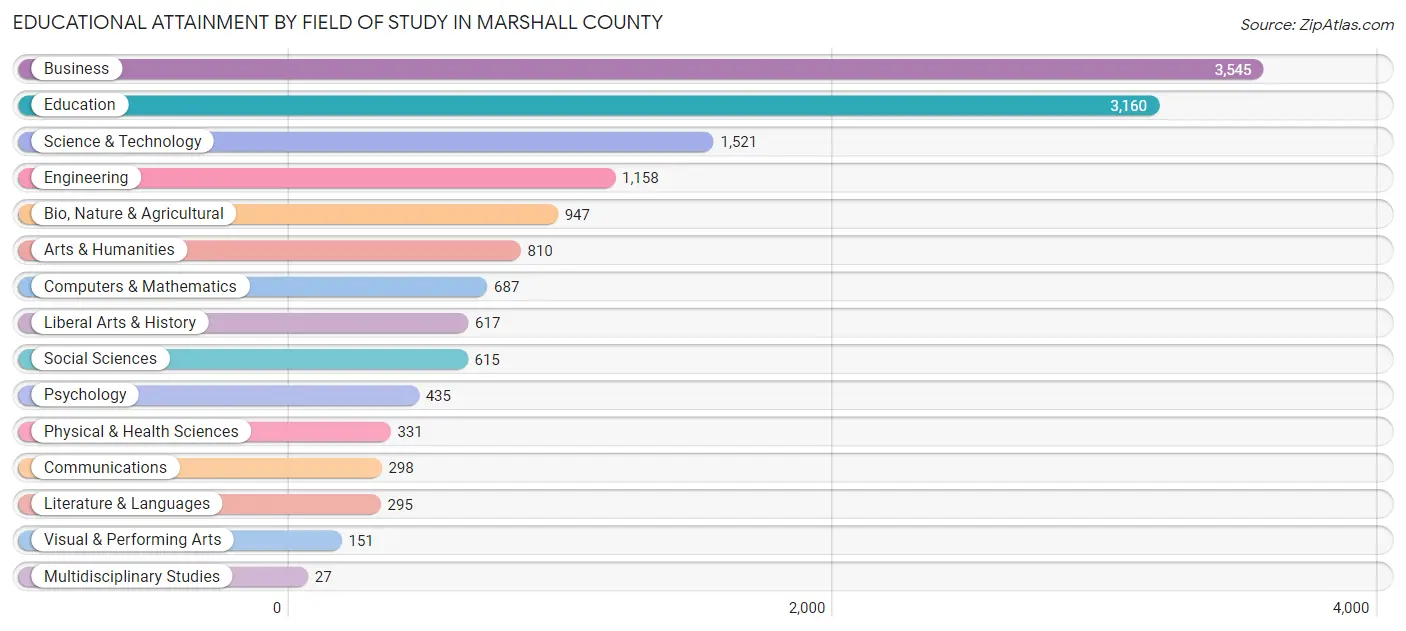
| Field of Study | # Graduates | % Graduates |
| Computers & Mathematics | 687 | 4.7% |
| Bio, Nature & Agricultural | 947 | 6.5% |
| Physical & Health Sciences | 331 | 2.3% |
| Psychology | 435 | 3.0% |
| Social Sciences | 615 | 4.2% |
| Engineering | 1,158 | 7.9% |
| Multidisciplinary Studies | 27 | 0.2% |
| Science & Technology | 1,521 | 10.4% |
| Business | 3,545 | 24.3% |
| Education | 3,160 | 21.6% |
| Literature & Languages | 295 | 2.0% |
| Liberal Arts & History | 617 | 4.2% |
| Visual & Performing Arts | 151 | 1.0% |
| Communications | 298 | 2.0% |
| Arts & Humanities | 810 | 5.6% |
| Total | 14,597 | 100.0% |
Transportation & Commute in Marshall County
Vehicle Availability by Sex in Marshall County
The most prevalent vehicle ownership categories in Marshall County are males with 2 vehicles (8,811, accounting for 38.5%) and females with 2 vehicles (6,467, making up 49.2%).
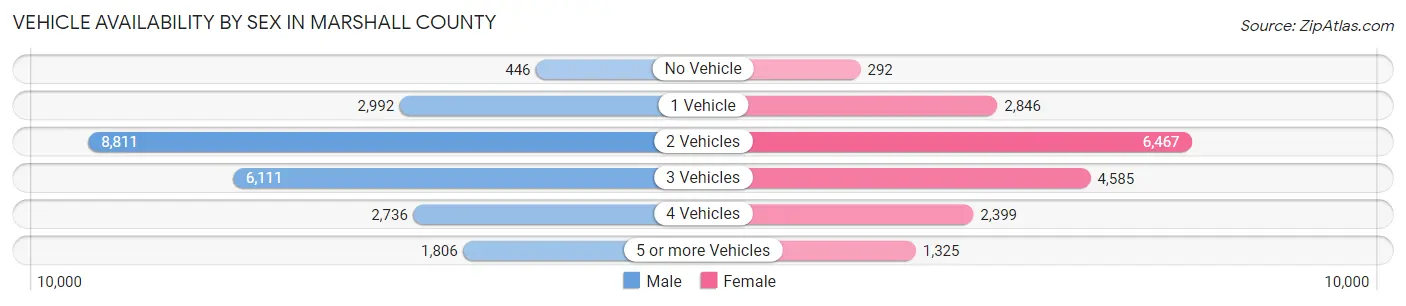
| Vehicles Available | Male | Female |
| No Vehicle | 446 (1.9%) | 292 (1.6%) |
| 1 Vehicle | 2,992 (13.1%) | 2,846 (15.9%) |
| 2 Vehicles | 8,811 (38.5%) | 6,467 (36.1%) |
| 3 Vehicles | 6,111 (26.7%) | 4,585 (25.6%) |
| 4 Vehicles | 2,736 (11.9%) | 2,399 (13.4%) |
| 5 or more Vehicles | 1,806 (7.9%) | 1,325 (7.4%) |
| Total | 22,902 (100.0%) | 17,914 (100.0%) |
Commute Time in Marshall County
The most frequently occuring commute durations in Marshall County are 10 to 14 minutes (7,099 commuters, 18.4%), 5 to 9 minutes (5,619 commuters, 14.6%), and 15 to 19 minutes (4,801 commuters, 12.5%).
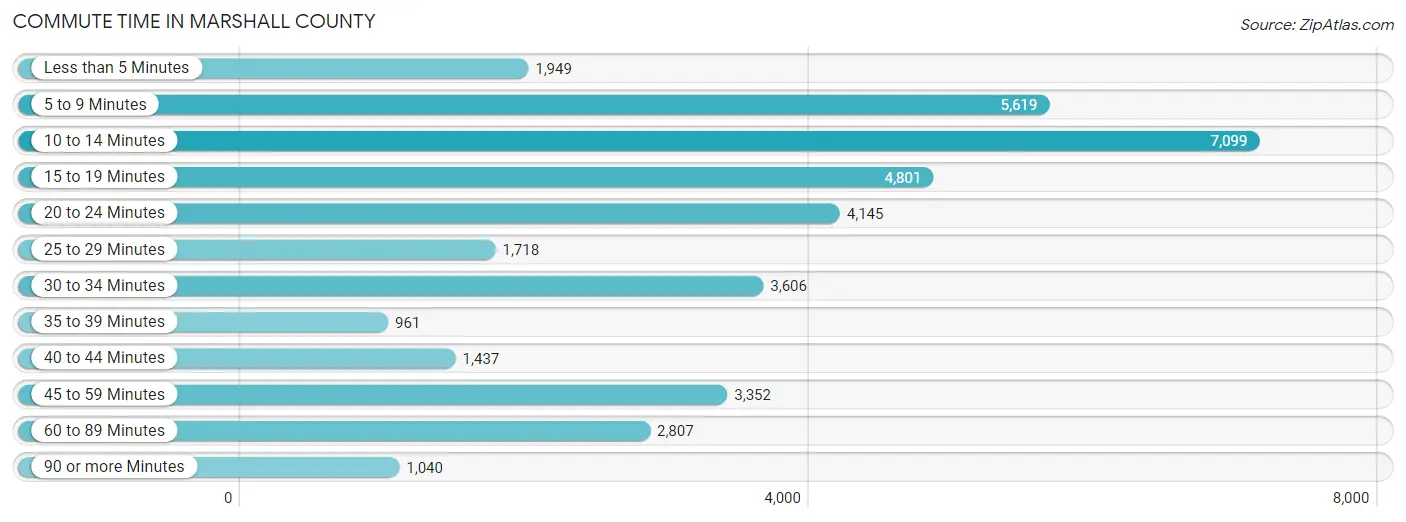
| Commute Time | # Commuters | % Commuters |
| Less than 5 Minutes | 1,949 | 5.1% |
| 5 to 9 Minutes | 5,619 | 14.6% |
| 10 to 14 Minutes | 7,099 | 18.4% |
| 15 to 19 Minutes | 4,801 | 12.5% |
| 20 to 24 Minutes | 4,145 | 10.8% |
| 25 to 29 Minutes | 1,718 | 4.5% |
| 30 to 34 Minutes | 3,606 | 9.4% |
| 35 to 39 Minutes | 961 | 2.5% |
| 40 to 44 Minutes | 1,437 | 3.7% |
| 45 to 59 Minutes | 3,352 | 8.7% |
| 60 to 89 Minutes | 2,807 | 7.3% |
| 90 or more Minutes | 1,040 | 2.7% |
Commute Time by Sex in Marshall County
The most common commute times in Marshall County are 10 to 14 minutes (3,457 commuters, 16.1%) for males and 10 to 14 minutes (3,642 commuters, 21.4%) for females.
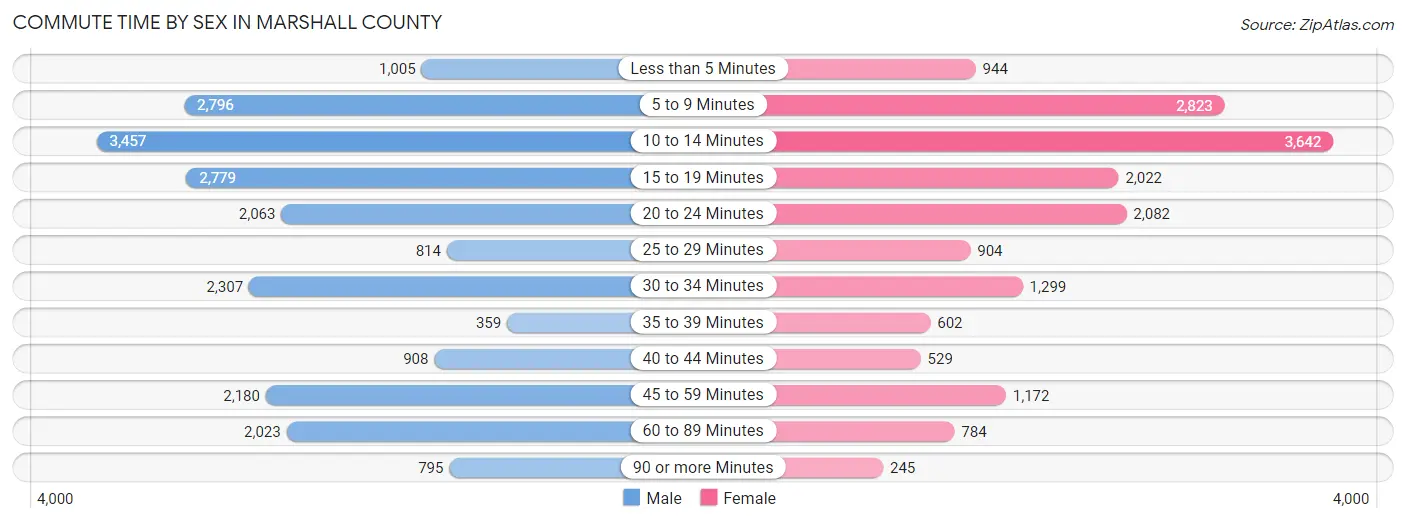
| Commute Time | Male | Female |
| Less than 5 Minutes | 1,005 (4.7%) | 944 (5.5%) |
| 5 to 9 Minutes | 2,796 (13.0%) | 2,823 (16.6%) |
| 10 to 14 Minutes | 3,457 (16.1%) | 3,642 (21.4%) |
| 15 to 19 Minutes | 2,779 (12.9%) | 2,022 (11.9%) |
| 20 to 24 Minutes | 2,063 (9.6%) | 2,082 (12.2%) |
| 25 to 29 Minutes | 814 (3.8%) | 904 (5.3%) |
| 30 to 34 Minutes | 2,307 (10.7%) | 1,299 (7.6%) |
| 35 to 39 Minutes | 359 (1.7%) | 602 (3.5%) |
| 40 to 44 Minutes | 908 (4.2%) | 529 (3.1%) |
| 45 to 59 Minutes | 2,180 (10.2%) | 1,172 (6.9%) |
| 60 to 89 Minutes | 2,023 (9.4%) | 784 (4.6%) |
| 90 or more Minutes | 795 (3.7%) | 245 (1.4%) |
Time of Departure to Work by Sex in Marshall County
The most frequent times of departure to work in Marshall County are 7:00 AM to 7:29 AM (3,381, 15.7%) for males and 7:00 AM to 7:29 AM (3,104, 18.2%) for females.
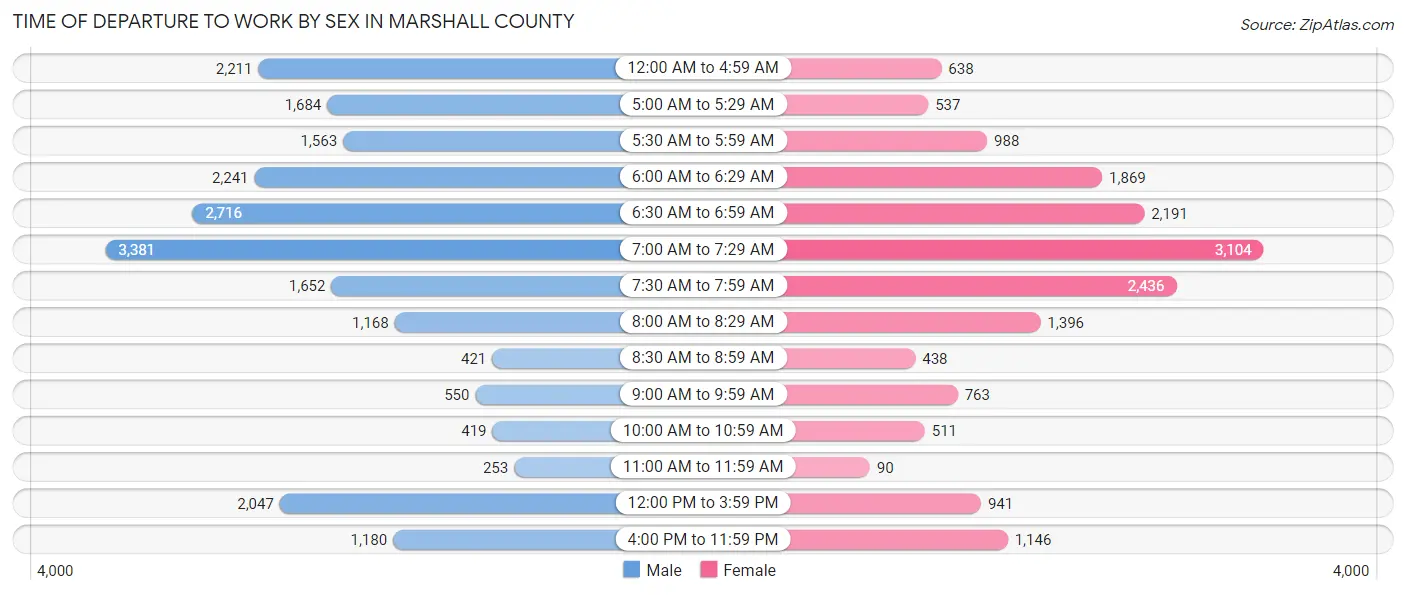
| Time of Departure | Male | Female |
| 12:00 AM to 4:59 AM | 2,211 (10.3%) | 638 (3.7%) |
| 5:00 AM to 5:29 AM | 1,684 (7.8%) | 537 (3.2%) |
| 5:30 AM to 5:59 AM | 1,563 (7.3%) | 988 (5.8%) |
| 6:00 AM to 6:29 AM | 2,241 (10.4%) | 1,869 (11.0%) |
| 6:30 AM to 6:59 AM | 2,716 (12.6%) | 2,191 (12.9%) |
| 7:00 AM to 7:29 AM | 3,381 (15.7%) | 3,104 (18.2%) |
| 7:30 AM to 7:59 AM | 1,652 (7.7%) | 2,436 (14.3%) |
| 8:00 AM to 8:29 AM | 1,168 (5.4%) | 1,396 (8.2%) |
| 8:30 AM to 8:59 AM | 421 (2.0%) | 438 (2.6%) |
| 9:00 AM to 9:59 AM | 550 (2.6%) | 763 (4.5%) |
| 10:00 AM to 10:59 AM | 419 (1.9%) | 511 (3.0%) |
| 11:00 AM to 11:59 AM | 253 (1.2%) | 90 (0.5%) |
| 12:00 PM to 3:59 PM | 2,047 (9.5%) | 941 (5.5%) |
| 4:00 PM to 11:59 PM | 1,180 (5.5%) | 1,146 (6.7%) |
| Total | 21,486 (100.0%) | 17,048 (100.0%) |
Housing Occupancy in Marshall County
Occupancy by Ownership in Marshall County
Of the total 35,930 dwellings in Marshall County, owner-occupied units account for 27,083 (75.4%), while renter-occupied units make up 8,847 (24.6%).
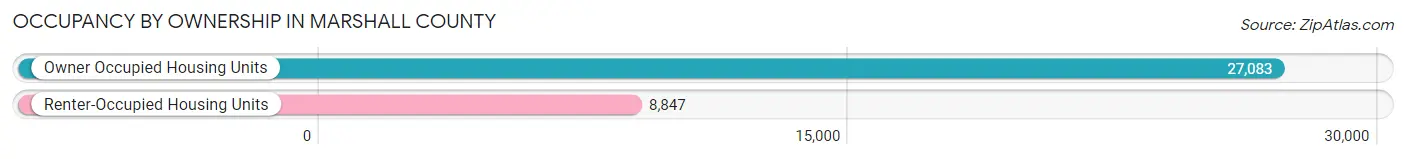
| Occupancy | # Housing Units | % Housing Units |
| Owner Occupied Housing Units | 27,083 | 75.4% |
| Renter-Occupied Housing Units | 8,847 | 24.6% |
| Total Occupied Housing Units | 35,930 | 100.0% |
Occupancy by Household Size in Marshall County
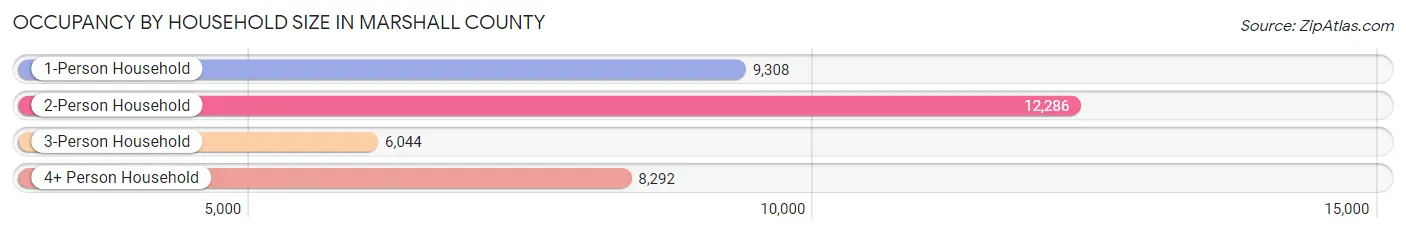
| Household Size | # Housing Units | % Housing Units |
| 1-Person Household | 9,308 | 25.9% |
| 2-Person Household | 12,286 | 34.2% |
| 3-Person Household | 6,044 | 16.8% |
| 4+ Person Household | 8,292 | 23.1% |
| Total Housing Units | 35,930 | 100.0% |
Occupancy by Ownership by Household Size in Marshall County
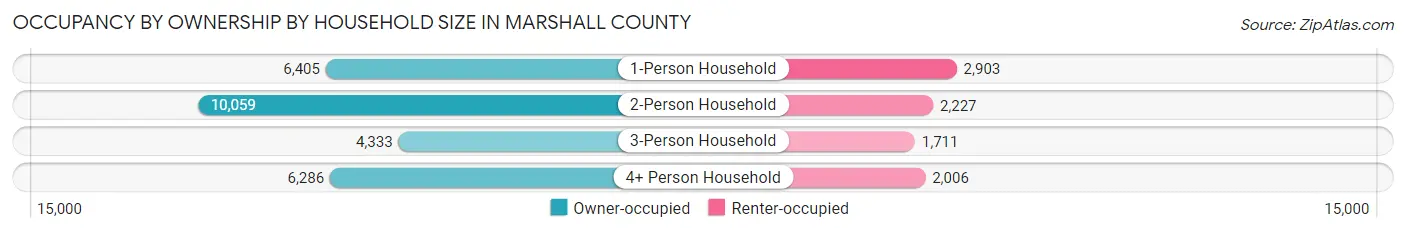
| Household Size | Owner-occupied | Renter-occupied |
| 1-Person Household | 6,405 (68.8%) | 2,903 (31.2%) |
| 2-Person Household | 10,059 (81.9%) | 2,227 (18.1%) |
| 3-Person Household | 4,333 (71.7%) | 1,711 (28.3%) |
| 4+ Person Household | 6,286 (75.8%) | 2,006 (24.2%) |
| Total Housing Units | 27,083 (75.4%) | 8,847 (24.6%) |
Occupancy by Educational Attainment in Marshall County
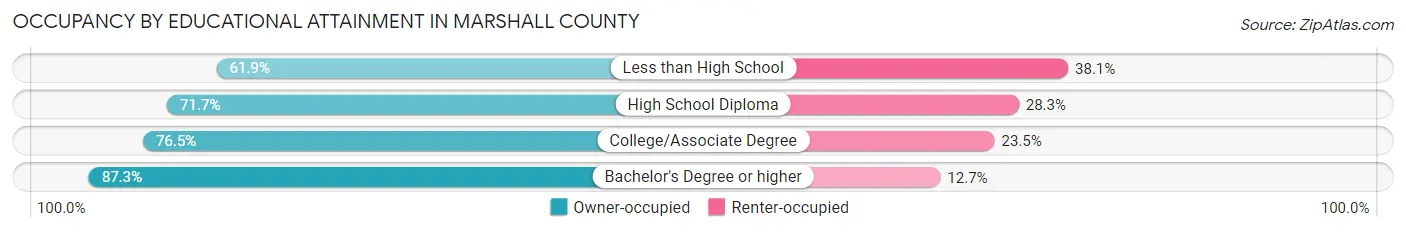
| Household Size | Owner-occupied | Renter-occupied |
| Less than High School | 3,263 (61.9%) | 2,005 (38.1%) |
| High School Diploma | 7,690 (71.7%) | 3,031 (28.3%) |
| College/Associate Degree | 9,057 (76.5%) | 2,778 (23.5%) |
| Bachelor's Degree or higher | 7,073 (87.3%) | 1,033 (12.7%) |
Occupancy by Age of Householder in Marshall County
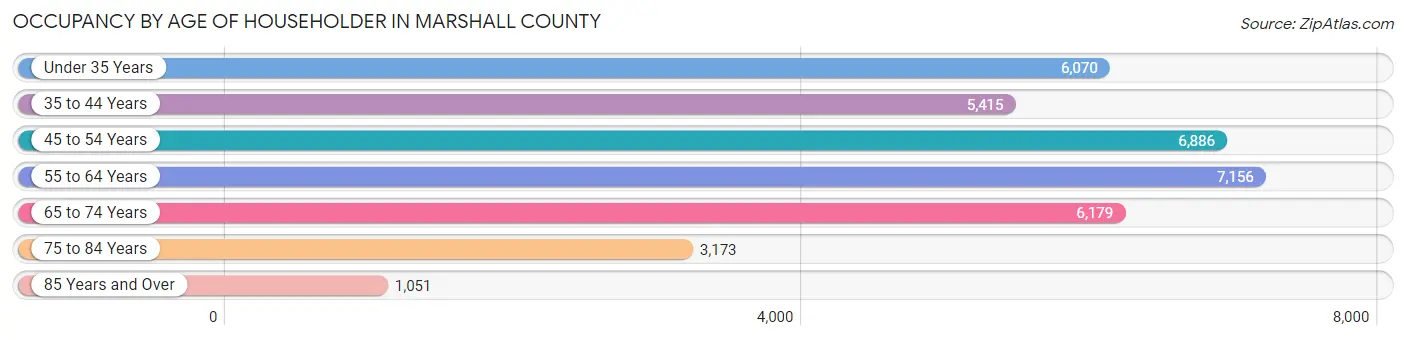
| Age Bracket | # Households | % Households |
| Under 35 Years | 6,070 | 16.9% |
| 35 to 44 Years | 5,415 | 15.1% |
| 45 to 54 Years | 6,886 | 19.2% |
| 55 to 64 Years | 7,156 | 19.9% |
| 65 to 74 Years | 6,179 | 17.2% |
| 75 to 84 Years | 3,173 | 8.8% |
| 85 Years and Over | 1,051 | 2.9% |
| Total | 35,930 | 100.0% |
Housing Finances in Marshall County
Median Income by Occupancy in Marshall County
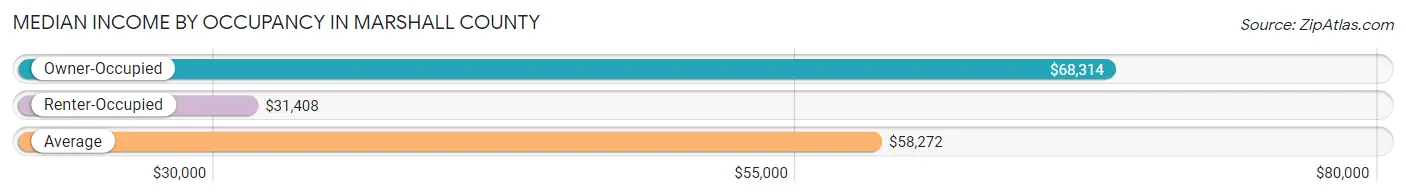
| Occupancy Type | # Households | Median Income |
| Owner-Occupied | 27,083 (75.4%) | $68,314 |
| Renter-Occupied | 8,847 (24.6%) | $31,408 |
| Average | 35,930 (100.0%) | $58,272 |
Occupancy by Householder Income Bracket in Marshall County
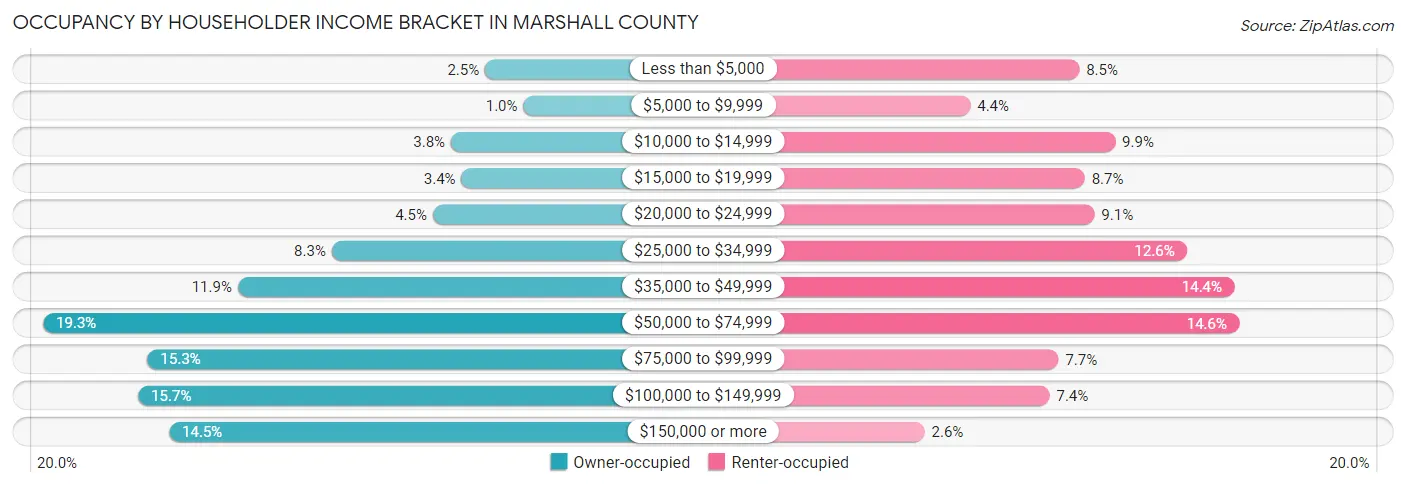
| Income Bracket | Owner-occupied | Renter-occupied |
| Less than $5,000 | 666 (2.5%) | 754 (8.5%) |
| $5,000 to $9,999 | 270 (1.0%) | 387 (4.4%) |
| $10,000 to $14,999 | 1,017 (3.8%) | 875 (9.9%) |
| $15,000 to $19,999 | 910 (3.4%) | 772 (8.7%) |
| $20,000 to $24,999 | 1,204 (4.4%) | 805 (9.1%) |
| $25,000 to $34,999 | 2,248 (8.3%) | 1,116 (12.6%) |
| $35,000 to $49,999 | 3,218 (11.9%) | 1,275 (14.4%) |
| $50,000 to $74,999 | 5,227 (19.3%) | 1,292 (14.6%) |
| $75,000 to $99,999 | 4,150 (15.3%) | 684 (7.7%) |
| $100,000 to $149,999 | 4,247 (15.7%) | 654 (7.4%) |
| $150,000 or more | 3,926 (14.5%) | 233 (2.6%) |
| Total | 27,083 (100.0%) | 8,847 (100.0%) |
Monthly Housing Cost Tiers in Marshall County
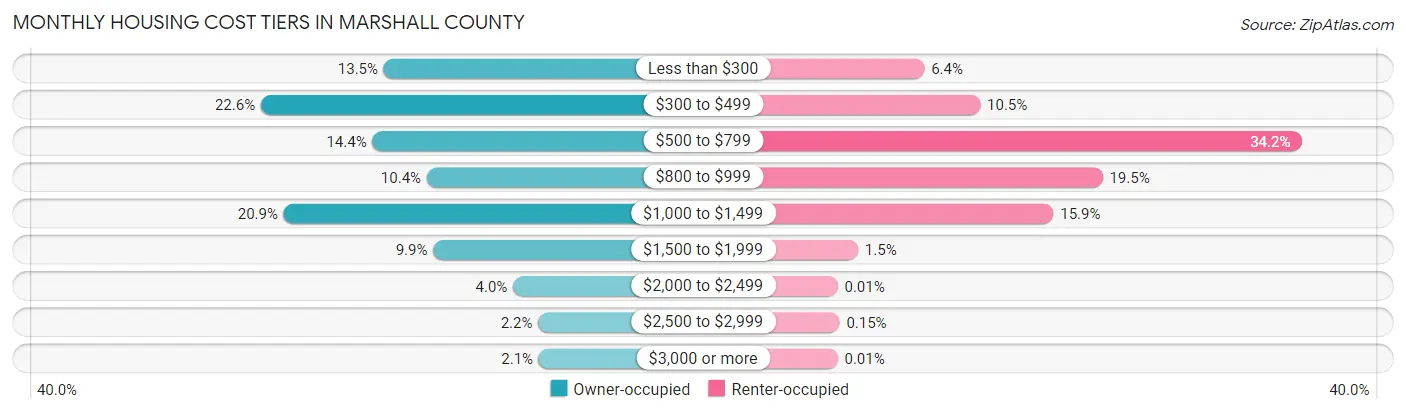
| Monthly Cost | Owner-occupied | Renter-occupied |
| Less than $300 | 3,668 (13.5%) | 565 (6.4%) |
| $300 to $499 | 6,118 (22.6%) | 930 (10.5%) |
| $500 to $799 | 3,895 (14.4%) | 3,028 (34.2%) |
| $800 to $999 | 2,809 (10.4%) | 1,727 (19.5%) |
| $1,000 to $1,499 | 5,664 (20.9%) | 1,407 (15.9%) |
| $1,500 to $1,999 | 2,680 (9.9%) | 134 (1.5%) |
| $2,000 to $2,499 | 1,088 (4.0%) | 1 (0.0%) |
| $2,500 to $2,999 | 587 (2.2%) | 13 (0.2%) |
| $3,000 or more | 574 (2.1%) | 1 (0.0%) |
| Total | 27,083 (100.0%) | 8,847 (100.0%) |
Physical Housing Characteristics in Marshall County
Housing Structures in Marshall County
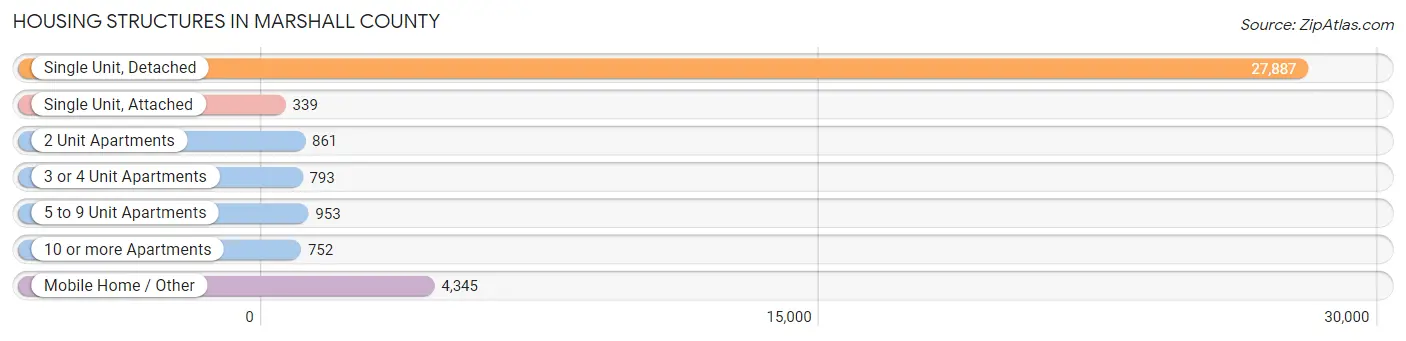
| Structure Type | # Housing Units | % Housing Units |
| Single Unit, Detached | 27,887 | 77.6% |
| Single Unit, Attached | 339 | 0.9% |
| 2 Unit Apartments | 861 | 2.4% |
| 3 or 4 Unit Apartments | 793 | 2.2% |
| 5 to 9 Unit Apartments | 953 | 2.6% |
| 10 or more Apartments | 752 | 2.1% |
| Mobile Home / Other | 4,345 | 12.1% |
| Total | 35,930 | 100.0% |
Housing Structures by Occupancy in Marshall County
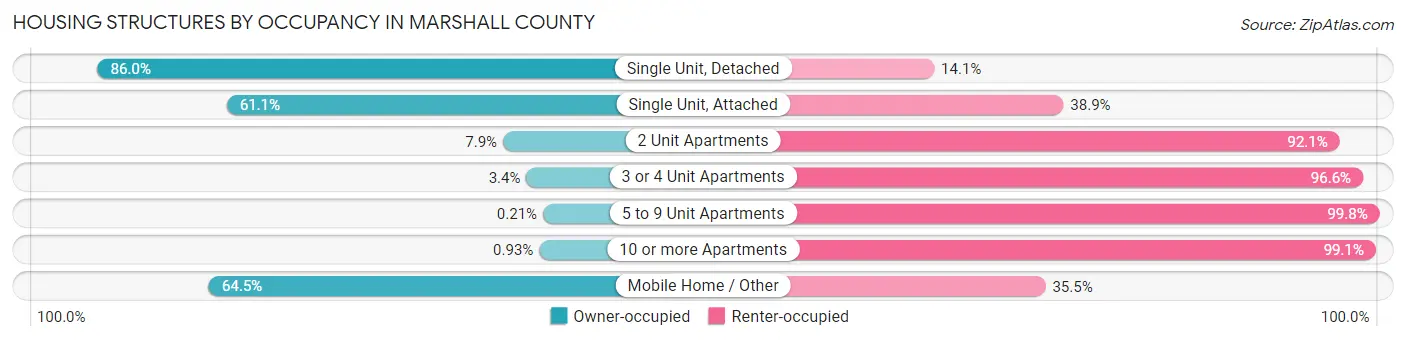
| Structure Type | Owner-occupied | Renter-occupied |
| Single Unit, Detached | 23,969 (86.0%) | 3,918 (14.1%) |
| Single Unit, Attached | 207 (61.1%) | 132 (38.9%) |
| 2 Unit Apartments | 68 (7.9%) | 793 (92.1%) |
| 3 or 4 Unit Apartments | 27 (3.4%) | 766 (96.6%) |
| 5 to 9 Unit Apartments | 2 (0.2%) | 951 (99.8%) |
| 10 or more Apartments | 7 (0.9%) | 745 (99.1%) |
| Mobile Home / Other | 2,803 (64.5%) | 1,542 (35.5%) |
| Total | 27,083 (75.4%) | 8,847 (24.6%) |
Housing Structures by Number of Rooms in Marshall County
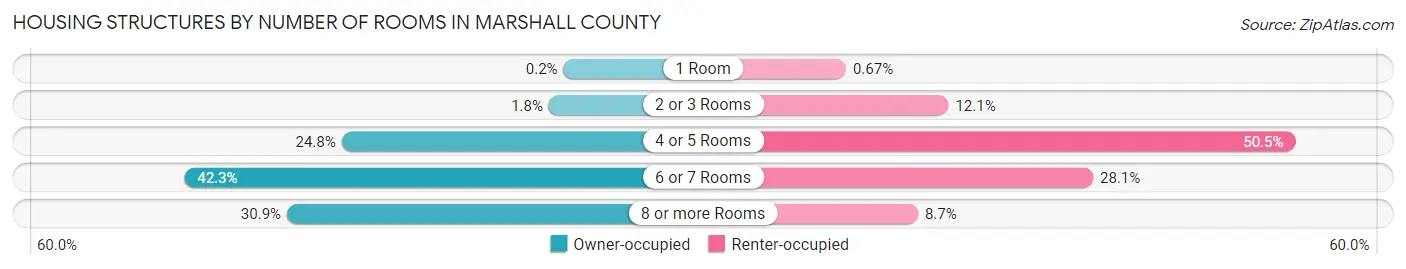
| Number of Rooms | Owner-occupied | Renter-occupied |
| 1 Room | 55 (0.2%) | 59 (0.7%) |
| 2 or 3 Rooms | 493 (1.8%) | 1,066 (12.0%) |
| 4 or 5 Rooms | 6,721 (24.8%) | 4,470 (50.5%) |
| 6 or 7 Rooms | 11,449 (42.3%) | 2,486 (28.1%) |
| 8 or more Rooms | 8,365 (30.9%) | 766 (8.7%) |
| Total | 27,083 (100.0%) | 8,847 (100.0%) |
Housing Structure by Heating Type in Marshall County
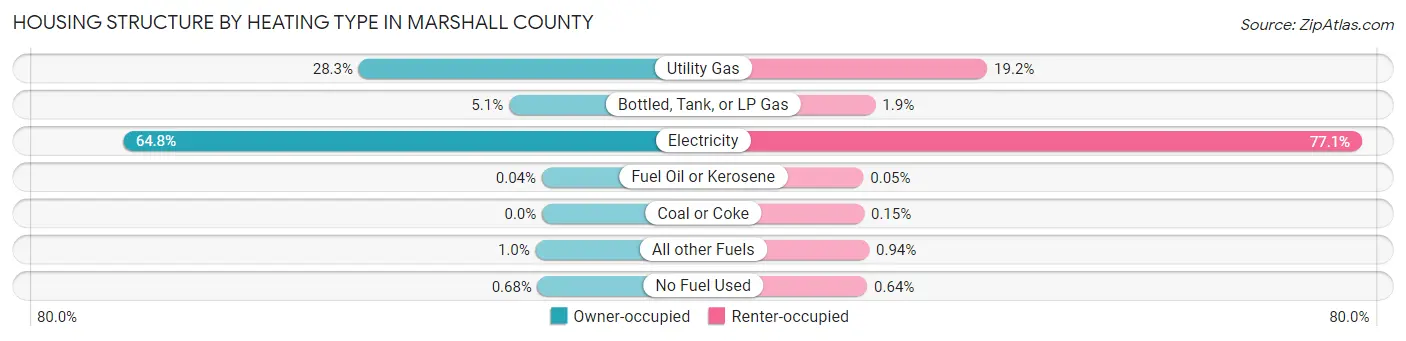
| Heating Type | Owner-occupied | Renter-occupied |
| Utility Gas | 7,675 (28.3%) | 1,698 (19.2%) |
| Bottled, Tank, or LP Gas | 1,386 (5.1%) | 169 (1.9%) |
| Electricity | 17,554 (64.8%) | 6,823 (77.1%) |
| Fuel Oil or Kerosene | 11 (0.0%) | 4 (0.1%) |
| Coal or Coke | 0 (0.0%) | 13 (0.2%) |
| All other Fuels | 273 (1.0%) | 83 (0.9%) |
| No Fuel Used | 184 (0.7%) | 57 (0.6%) |
| Total | 27,083 (100.0%) | 8,847 (100.0%) |
Household Vehicle Usage in Marshall County
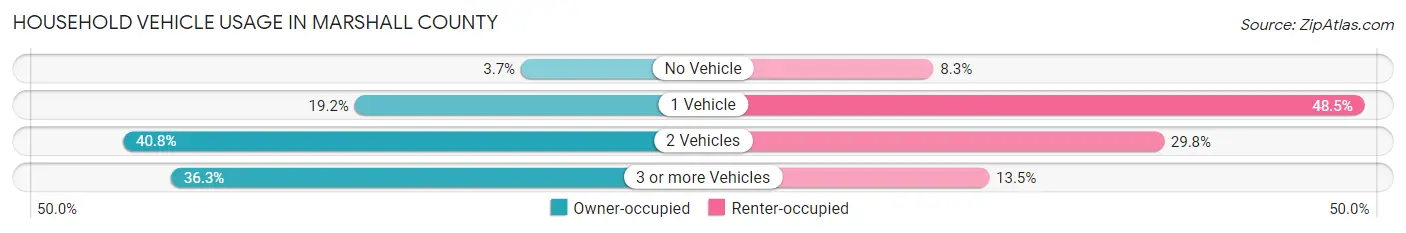
| Vehicles per Household | Owner-occupied | Renter-occupied |
| No Vehicle | 994 (3.7%) | 731 (8.3%) |
| 1 Vehicle | 5,196 (19.2%) | 4,291 (48.5%) |
| 2 Vehicles | 11,052 (40.8%) | 2,634 (29.8%) |
| 3 or more Vehicles | 9,841 (36.3%) | 1,191 (13.5%) |
| Total | 27,083 (100.0%) | 8,847 (100.0%) |
Real Estate & Mortgages in Marshall County
Real Estate and Mortgage Overview in Marshall County
| Characteristic | Without Mortgage | With Mortgage |
| Housing Units | 12,491 | 14,592 |
| Median Property Value | $143,100 | $188,400 |
| Median Household Income | $52,604 | $2,704 |
| Monthly Housing Costs | $384 | $565 |
| Real Estate Taxes | $578 | $1,834 |
Property Value by Mortgage Status in Marshall County
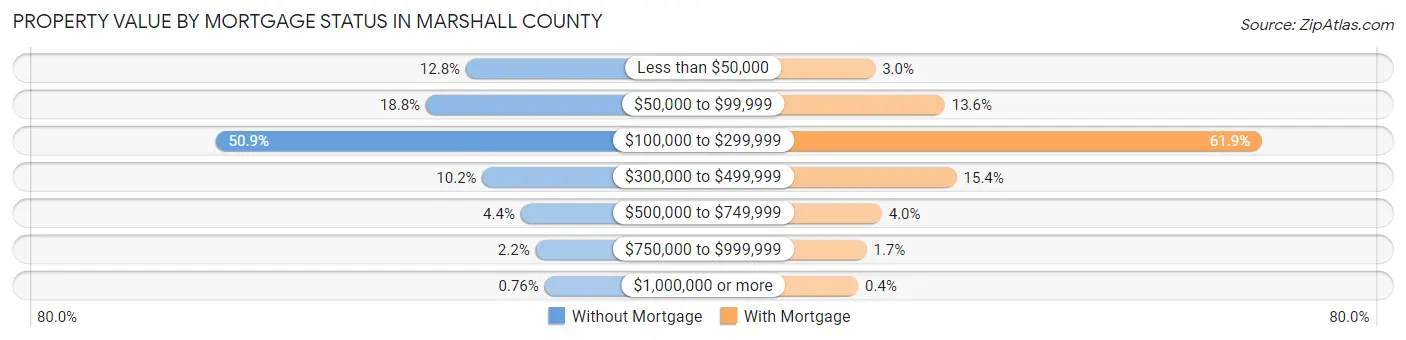
| Property Value | Without Mortgage | With Mortgage |
| Less than $50,000 | 1,592 (12.8%) | 438 (3.0%) |
| $50,000 to $99,999 | 2,353 (18.8%) | 1,984 (13.6%) |
| $100,000 to $299,999 | 6,355 (50.9%) | 9,039 (61.9%) |
| $300,000 to $499,999 | 1,279 (10.2%) | 2,247 (15.4%) |
| $500,000 to $749,999 | 549 (4.4%) | 583 (4.0%) |
| $750,000 to $999,999 | 268 (2.1%) | 243 (1.7%) |
| $1,000,000 or more | 95 (0.8%) | 58 (0.4%) |
| Total | 12,491 (100.0%) | 14,592 (100.0%) |
Household Income by Mortgage Status in Marshall County
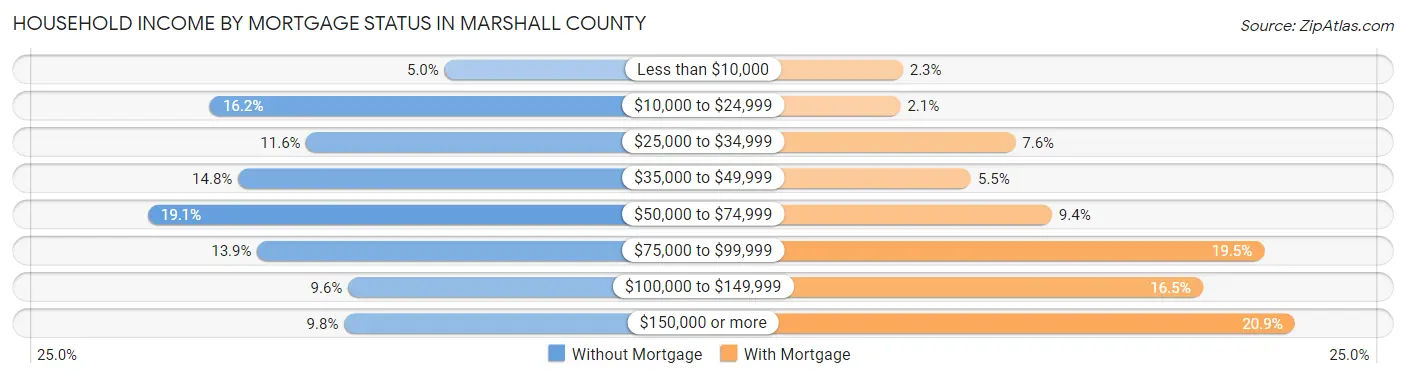
| Household Income | Without Mortgage | With Mortgage |
| Less than $10,000 | 624 (5.0%) | 328 (2.2%) |
| $10,000 to $24,999 | 2,020 (16.2%) | 312 (2.1%) |
| $25,000 to $34,999 | 1,446 (11.6%) | 1,111 (7.6%) |
| $35,000 to $49,999 | 1,853 (14.8%) | 802 (5.5%) |
| $50,000 to $74,999 | 2,389 (19.1%) | 1,365 (9.3%) |
| $75,000 to $99,999 | 1,739 (13.9%) | 2,838 (19.5%) |
| $100,000 to $149,999 | 1,198 (9.6%) | 2,411 (16.5%) |
| $150,000 or more | 1,222 (9.8%) | 3,049 (20.9%) |
| Total | 12,491 (100.0%) | 14,592 (100.0%) |
Property Value to Household Income Ratio in Marshall County
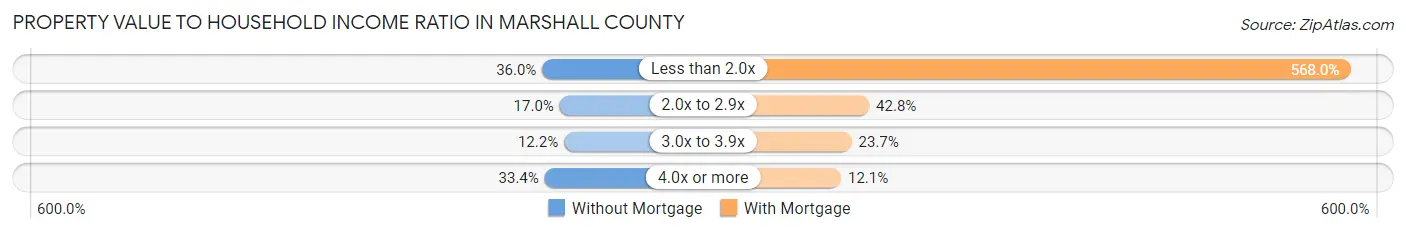
| Value-to-Income Ratio | Without Mortgage | With Mortgage |
| Less than 2.0x | 4,493 (36.0%) | 82,878 (568.0%) |
| 2.0x to 2.9x | 2,121 (17.0%) | 6,238 (42.7%) |
| 3.0x to 3.9x | 1,526 (12.2%) | 3,452 (23.7%) |
| 4.0x or more | 4,169 (33.4%) | 1,771 (12.1%) |
| Total | 12,491 (100.0%) | 14,592 (100.0%) |
Real Estate Taxes by Mortgage Status in Marshall County
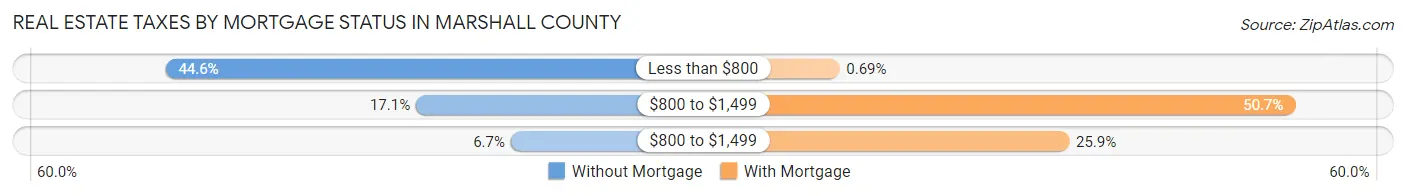
| Property Taxes | Without Mortgage | With Mortgage |
| Less than $800 | 5,566 (44.6%) | 101 (0.7%) |
| $800 to $1,499 | 2,137 (17.1%) | 7,392 (50.7%) |
| $800 to $1,499 | 840 (6.7%) | 3,773 (25.9%) |
| Total | 12,491 (100.0%) | 14,592 (100.0%) |
Health & Disability in Marshall County
Health Insurance Coverage by Age in Marshall County
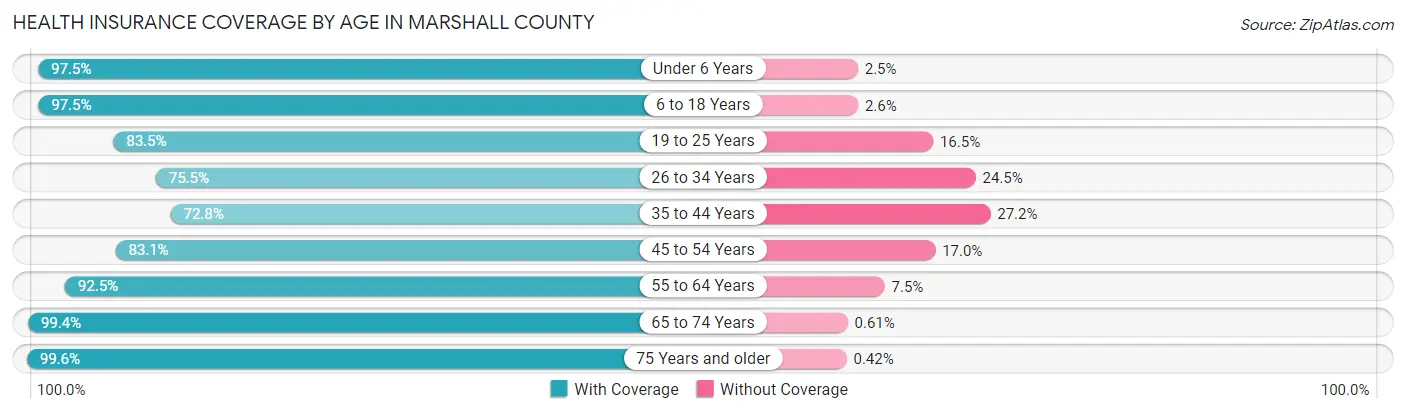
| Age Bracket | With Coverage | Without Coverage |
| Under 6 Years | 8,049 (97.5%) | 208 (2.5%) |
| 6 to 18 Years | 17,142 (97.5%) | 449 (2.5%) |
| 19 to 25 Years | 6,750 (83.5%) | 1,338 (16.5%) |
| 26 to 34 Years | 7,956 (75.5%) | 2,577 (24.5%) |
| 35 to 44 Years | 8,379 (72.8%) | 3,133 (27.2%) |
| 45 to 54 Years | 9,990 (83.1%) | 2,039 (17.0%) |
| 55 to 64 Years | 11,552 (92.5%) | 940 (7.5%) |
| 65 to 74 Years | 9,791 (99.4%) | 60 (0.6%) |
| 75 Years and older | 6,430 (99.6%) | 27 (0.4%) |
| Total | 86,039 (88.9%) | 10,771 (11.1%) |
Health Insurance Coverage by Citizenship Status in Marshall County
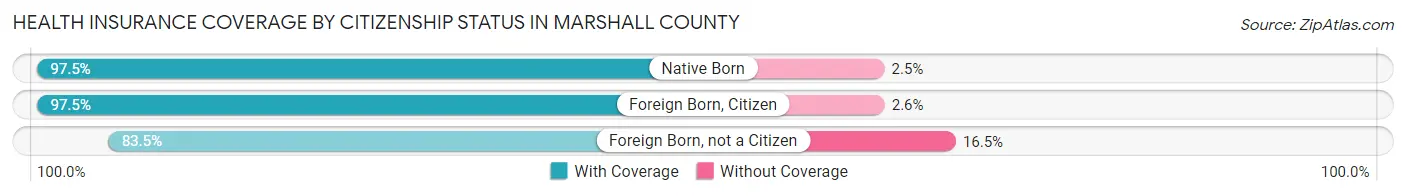
| Citizenship Status | With Coverage | Without Coverage |
| Native Born | 8,049 (97.5%) | 208 (2.5%) |
| Foreign Born, Citizen | 17,142 (97.5%) | 449 (2.5%) |
| Foreign Born, not a Citizen | 6,750 (83.5%) | 1,338 (16.5%) |
Health Insurance Coverage by Household Income in Marshall County
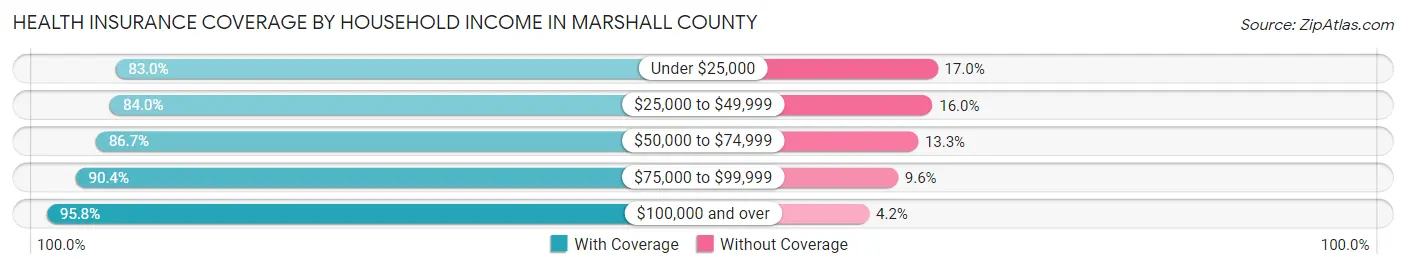
| Household Income | With Coverage | Without Coverage |
| Under $25,000 | 12,421 (83.0%) | 2,543 (17.0%) |
| $25,000 to $49,999 | 16,128 (84.0%) | 3,076 (16.0%) |
| $50,000 to $74,999 | 16,170 (86.7%) | 2,486 (13.3%) |
| $75,000 to $99,999 | 13,465 (90.4%) | 1,423 (9.6%) |
| $100,000 and over | 27,647 (95.8%) | 1,206 (4.2%) |
Public vs Private Health Insurance Coverage by Age in Marshall County
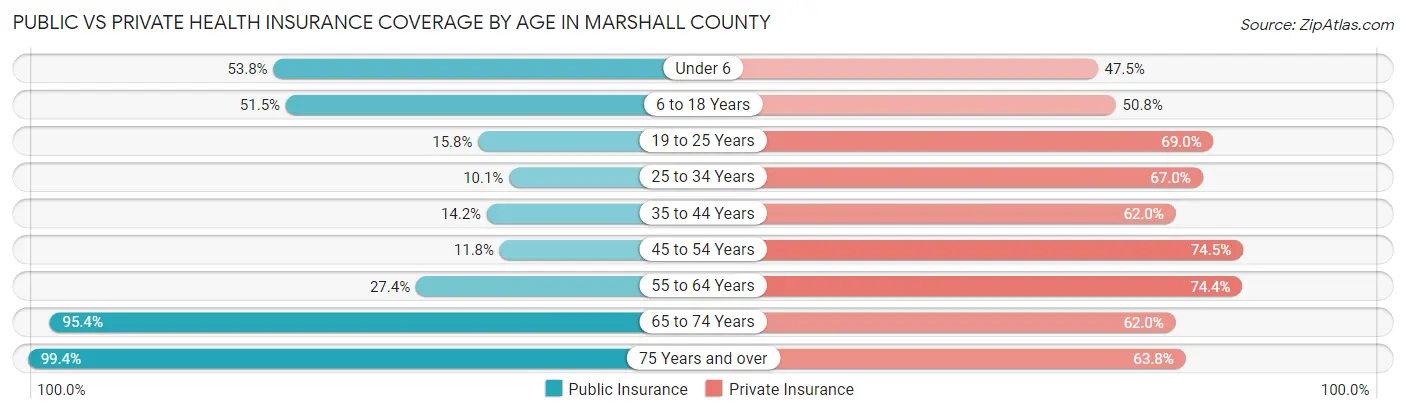
| Age Bracket | Public Insurance | Private Insurance |
| Under 6 | 4,443 (53.8%) | 3,921 (47.5%) |
| 6 to 18 Years | 9,060 (51.5%) | 8,941 (50.8%) |
| 19 to 25 Years | 1,277 (15.8%) | 5,580 (69.0%) |
| 25 to 34 Years | 1,059 (10.1%) | 7,054 (67.0%) |
| 35 to 44 Years | 1,632 (14.2%) | 7,134 (62.0%) |
| 45 to 54 Years | 1,417 (11.8%) | 8,957 (74.5%) |
| 55 to 64 Years | 3,417 (27.4%) | 9,289 (74.4%) |
| 65 to 74 Years | 9,394 (95.4%) | 6,105 (62.0%) |
| 75 Years and over | 6,419 (99.4%) | 4,120 (63.8%) |
| Total | 38,118 (39.4%) | 61,101 (63.1%) |
Disability Status by Sex by Age in Marshall County
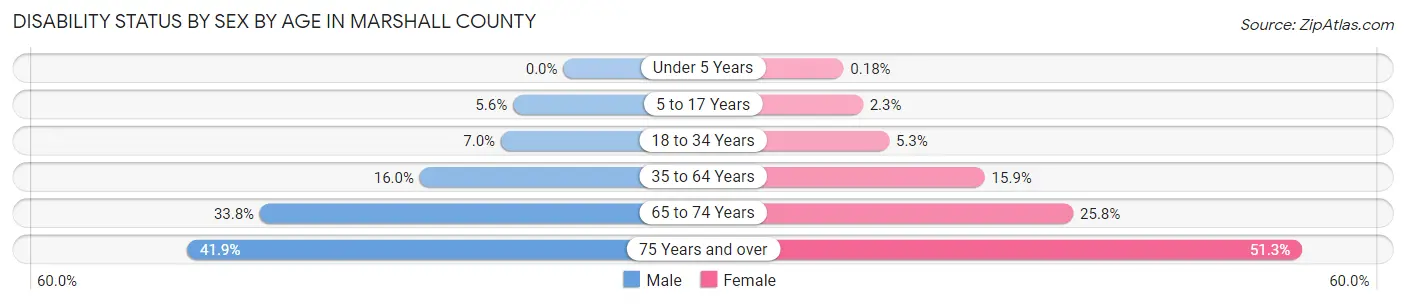
| Age Bracket | Male | Female |
| Under 5 Years | 0 (0.0%) | 6 (0.2%) |
| 5 to 17 Years | 514 (5.6%) | 202 (2.3%) |
| 18 to 34 Years | 701 (7.0%) | 509 (5.3%) |
| 35 to 64 Years | 2,897 (16.0%) | 2,851 (15.9%) |
| 65 to 74 Years | 1,545 (33.8%) | 1,360 (25.8%) |
| 75 Years and over | 1,131 (41.9%) | 1,926 (51.2%) |
Disability Class by Sex by Age in Marshall County
Disability Class: Hearing Difficulty
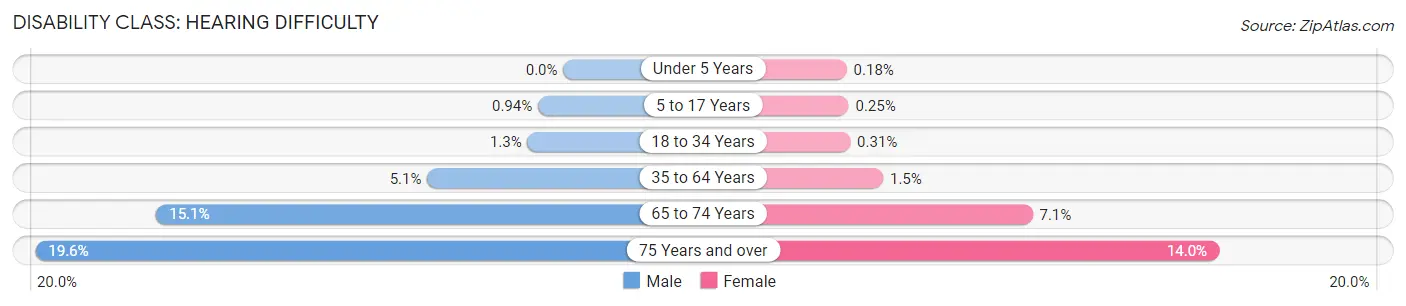
| Age Bracket | Male | Female |
| Under 5 Years | 0 (0.0%) | 6 (0.2%) |
| 5 to 17 Years | 86 (0.9%) | 22 (0.3%) |
| 18 to 34 Years | 134 (1.3%) | 30 (0.3%) |
| 35 to 64 Years | 914 (5.1%) | 275 (1.5%) |
| 65 to 74 Years | 691 (15.1%) | 374 (7.1%) |
| 75 Years and over | 529 (19.6%) | 526 (14.0%) |
Disability Class: Vision Difficulty
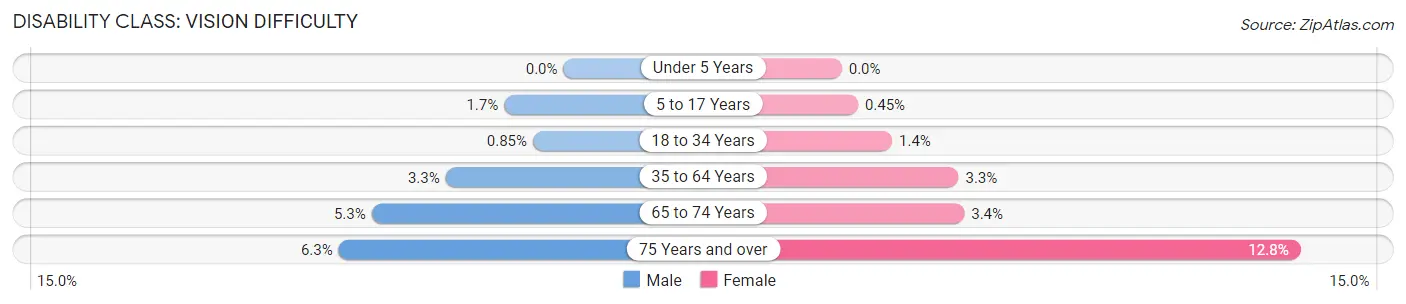
| Age Bracket | Male | Female |
| Under 5 Years | 0 (0.0%) | 0 (0.0%) |
| 5 to 17 Years | 151 (1.7%) | 39 (0.4%) |
| 18 to 34 Years | 86 (0.9%) | 135 (1.4%) |
| 35 to 64 Years | 594 (3.3%) | 582 (3.3%) |
| 65 to 74 Years | 244 (5.3%) | 180 (3.4%) |
| 75 Years and over | 169 (6.3%) | 480 (12.8%) |
Disability Class: Cognitive Difficulty
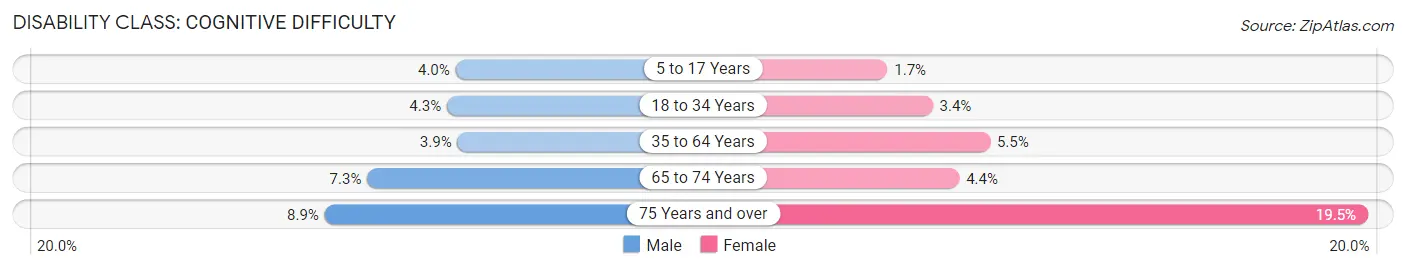
| Age Bracket | Male | Female |
| 5 to 17 Years | 367 (4.0%) | 146 (1.7%) |
| 18 to 34 Years | 435 (4.3%) | 326 (3.4%) |
| 35 to 64 Years | 712 (3.9%) | 986 (5.5%) |
| 65 to 74 Years | 333 (7.3%) | 230 (4.4%) |
| 75 Years and over | 239 (8.9%) | 734 (19.5%) |
Disability Class: Ambulatory Difficulty
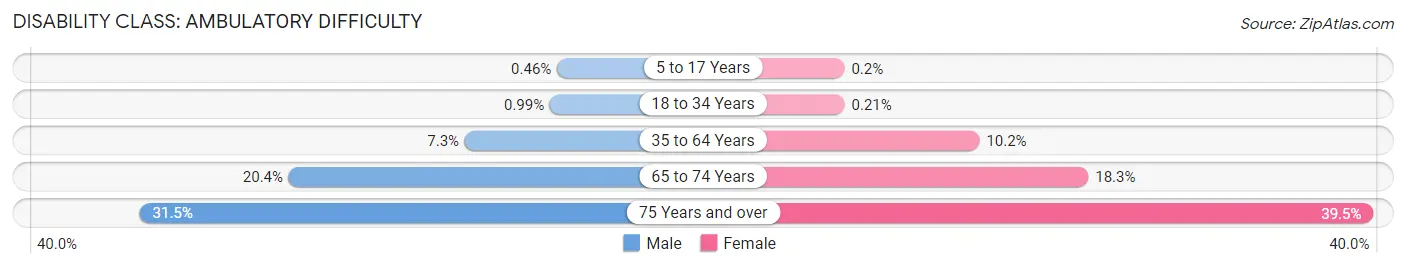
| Age Bracket | Male | Female |
| 5 to 17 Years | 42 (0.5%) | 17 (0.2%) |
| 18 to 34 Years | 100 (1.0%) | 20 (0.2%) |
| 35 to 64 Years | 1,324 (7.3%) | 1,832 (10.2%) |
| 65 to 74 Years | 932 (20.4%) | 966 (18.3%) |
| 75 Years and over | 849 (31.5%) | 1,483 (39.5%) |
Disability Class: Self-Care Difficulty
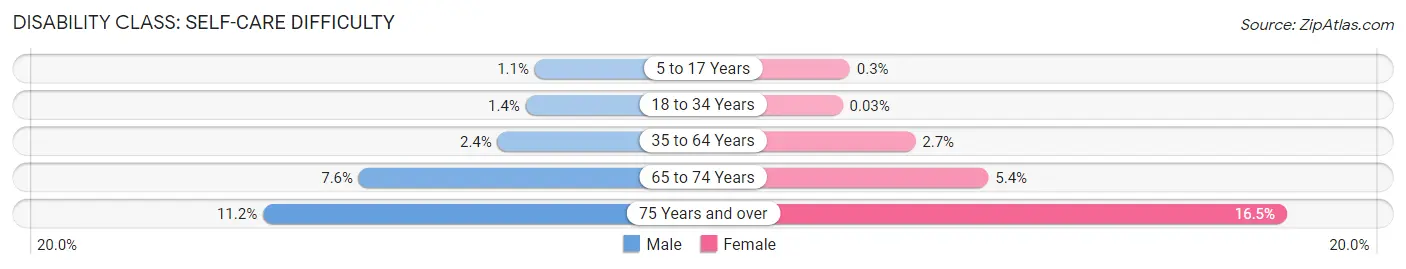
| Age Bracket | Male | Female |
| 5 to 17 Years | 97 (1.1%) | 26 (0.3%) |
| 18 to 34 Years | 141 (1.4%) | 3 (0.0%) |
| 35 to 64 Years | 442 (2.4%) | 489 (2.7%) |
| 65 to 74 Years | 347 (7.6%) | 287 (5.4%) |
| 75 Years and over | 301 (11.2%) | 621 (16.5%) |
Technology Access in Marshall County
Computing Device Access in Marshall County
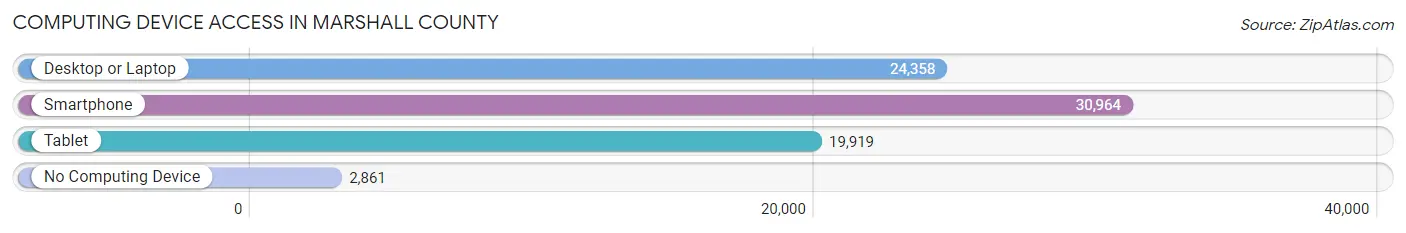
| Device Type | # Households | % Households |
| Desktop or Laptop | 24,358 | 67.8% |
| Smartphone | 30,964 | 86.2% |
| Tablet | 19,919 | 55.4% |
| No Computing Device | 2,861 | 8.0% |
| Total | 35,930 | 100.0% |
Internet Access in Marshall County
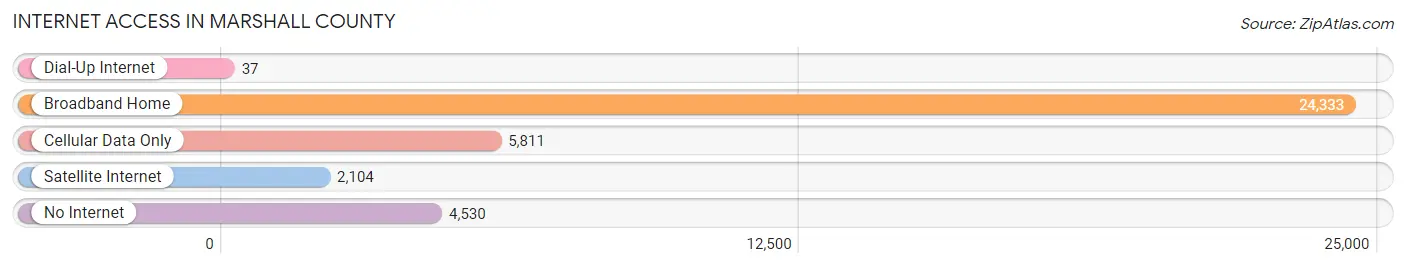
| Internet Type | # Households | % Households |
| Dial-Up Internet | 37 | 0.1% |
| Broadband Home | 24,333 | 67.7% |
| Cellular Data Only | 5,811 | 16.2% |
| Satellite Internet | 2,104 | 5.9% |
| No Internet | 4,530 | 12.6% |
| Total | 35,930 | 100.0% |
Marshall County Summary
Marshall County is located in the north-central part of the state of Alabama, and is part of the Huntsville-Decatur Combined Statistical Area. The county was established in 1836 and is named after John Marshall, the fourth Chief Justice of the United States Supreme Court. The county seat is Guntersville, and the largest city is Albertville. As of the 2010 census, the population of Marshall County was 93,019.
Geography
Marshall County is located in the Appalachian foothills of north-central Alabama. It is bordered by Jackson County to the north, DeKalb County to the east, Etowah County to the south, and Madison County to the west. The county covers an area of 576 square miles, of which 563 square miles is land and 13 square miles is water. The terrain is mostly hilly, with the highest point being Sand Mountain at 1,890 feet above sea level. The county is drained by the Tennessee River, which forms the western boundary of the county.
Climate
Marshall County has a humid subtropical climate, with hot, humid summers and mild winters. The average annual temperature is 64°F, and the average annual precipitation is 51 inches.
Demographics
As of the 2010 census, there were 93,019 people, 35,945 households, and 25,845 families residing in the county. The population density was 165 people per square mile. The racial makeup of the county was 87.3% White, 8.7% Black or African American, 0.4% Native American, 0.7% Asian, 0.1% Pacific Islander, 1.3% from other races, and 1.5% from two or more races. 3.3% of the population were Hispanic or Latino of any race.
Economy
Marshall County is a largely rural county, with the majority of its population living in small towns and rural areas. The county's economy is largely based on agriculture, with poultry, cattle, and dairy farming being the main industries. The county is also home to several manufacturing companies, including a large Tyson Foods poultry processing plant in Albertville. Tourism is also an important part of the economy, with Lake Guntersville State Park being a major attraction.
The median household income in Marshall County was $41,945 in 2017, and the median family income was $50,945. The per capita income was $21,945. About 11.3% of the population was below the poverty line.
Conclusion
Marshall County is a rural county located in north-central Alabama. It is bordered by Jackson County to the north, DeKalb County to the east, Etowah County to the south, and Madison County to the west. The county has a population of 93,019, and the economy is largely based on agriculture and manufacturing. Tourism is also an important part of the economy, with Lake Guntersville State Park being a major attraction. The median household income in Marshall County was $41,945 in 2017, and the per capita income was $21,945.
Common Questions
What is Per Capita Income in Marshall County?
Per Capita income in Marshall County is $29,509.
What is the Median Family Income in Marshall County?
Median Family Income in Marshall County is $71,511.
What is the Median Household income in Marshall County?
Median Household Income in Marshall County is $58,272.
What is Income or Wage Gap in Marshall County?
Income or Wage Gap in Marshall County is 33.7%.
Women in Marshall County earn 66.3 cents for every dollar earned by a man.
What is Family Income Deficit in Marshall County?
Family Income Deficit in Marshall County is $11,059.
Families that are below poverty line in Marshall County earn $11,059 less on average than the poverty threshold level.
What is Inequality or Gini Index in Marshall County?
Inequality or Gini Index in Marshall County is 0.46.
What is the Total Population of Marshall County?
Total Population of Marshall County is 97,923.
What is the Total Male Population of Marshall County?
Total Male Population of Marshall County is 48,686.
What is the Total Female Population of Marshall County?
Total Female Population of Marshall County is 49,237.
What is the Ratio of Males per 100 Females in Marshall County?
There are 98.88 Males per 100 Females in Marshall County.
What is the Ratio of Females per 100 Males in Marshall County?
There are 101.13 Females per 100 Males in Marshall County.
What is the Median Population Age in Marshall County?
Median Population Age in Marshall County is 38.8 Years.
What is the Average Family Size in Marshall County
Average Family Size in Marshall County is 3.2 People.
What is the Average Household Size in Marshall County
Average Household Size in Marshall County is 2.7 People.
How Large is the Labor Force in Marshall County?
There are 43,158 People in the Labor Forcein in Marshall County.
What is the Percentage of People in the Labor Force in Marshall County?
56.9% of People are in the Labor Force in Marshall County.
What is the Unemployment Rate in Marshall County?
Unemployment Rate in Marshall County is 3.8%.