Houston County, AL Map & Demographics
Houston County Map
Houston County Overview
$32,126
PER CAPITA INCOME
$72,526
AVG FAMILY INCOME
$55,064
AVG HOUSEHOLD INCOME
37.8%
WAGE / INCOME GAP [ % ]
62.2¢/ $1
WAGE / INCOME GAP [ $ ]
$10,706
FAMILY INCOME DEFICIT
0.48
INEQUALITY / GINI INDEX
107,040
TOTAL POPULATION
51,565
MALE POPULATION
55,475
FEMALE POPULATION
92.95
MALES / 100 FEMALES
107.58
FEMALES / 100 MALES
40.4
MEDIAN AGE
3.2
AVG FAMILY SIZE
2.5
AVG HOUSEHOLD SIZE
48,337
LABOR FORCE [ PEOPLE ]
56.7%
PERCENT IN LABOR FORCE
5.0%
UNEMPLOYMENT RATE
Houston County Area Codes
Income in Houston County
Income Overview in Houston County
Per Capita Income in Houston County is $32,126, while median incomes of families and households are $72,526 and $55,064 respectively.
| Characteristic | Number | Measure |
| Per Capita Income | 107,040 | $32,126 |
| Median Family Income | 26,980 | $72,526 |
| Mean Family Income | 26,980 | $95,768 |
| Median Household Income | 41,543 | $55,064 |
| Mean Household Income | 41,543 | $78,415 |
| Income Deficit | 26,980 | $10,706 |
| Wage / Income Gap (%) | 107,040 | 37.77% |
| Wage / Income Gap ($) | 107,040 | 62.23¢ per $1 |
| Gini / Inequality Index | 107,040 | 0.48 |
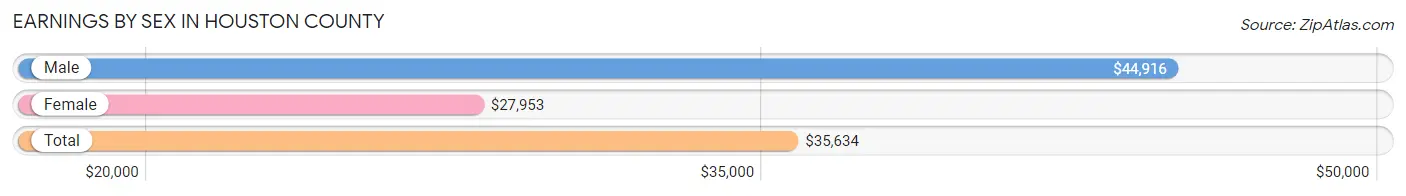
Earnings by Sex in Houston County
Average Earnings in Houston County are $35,634, $44,916 for men and $27,953 for women, a difference of 37.8%.
| Sex | Number | Average Earnings |
| Male | 26,410 (52.0%) | $44,916 |
| Female | 24,343 (48.0%) | $27,953 |
| Total | 50,753 (100.0%) | $35,634 |
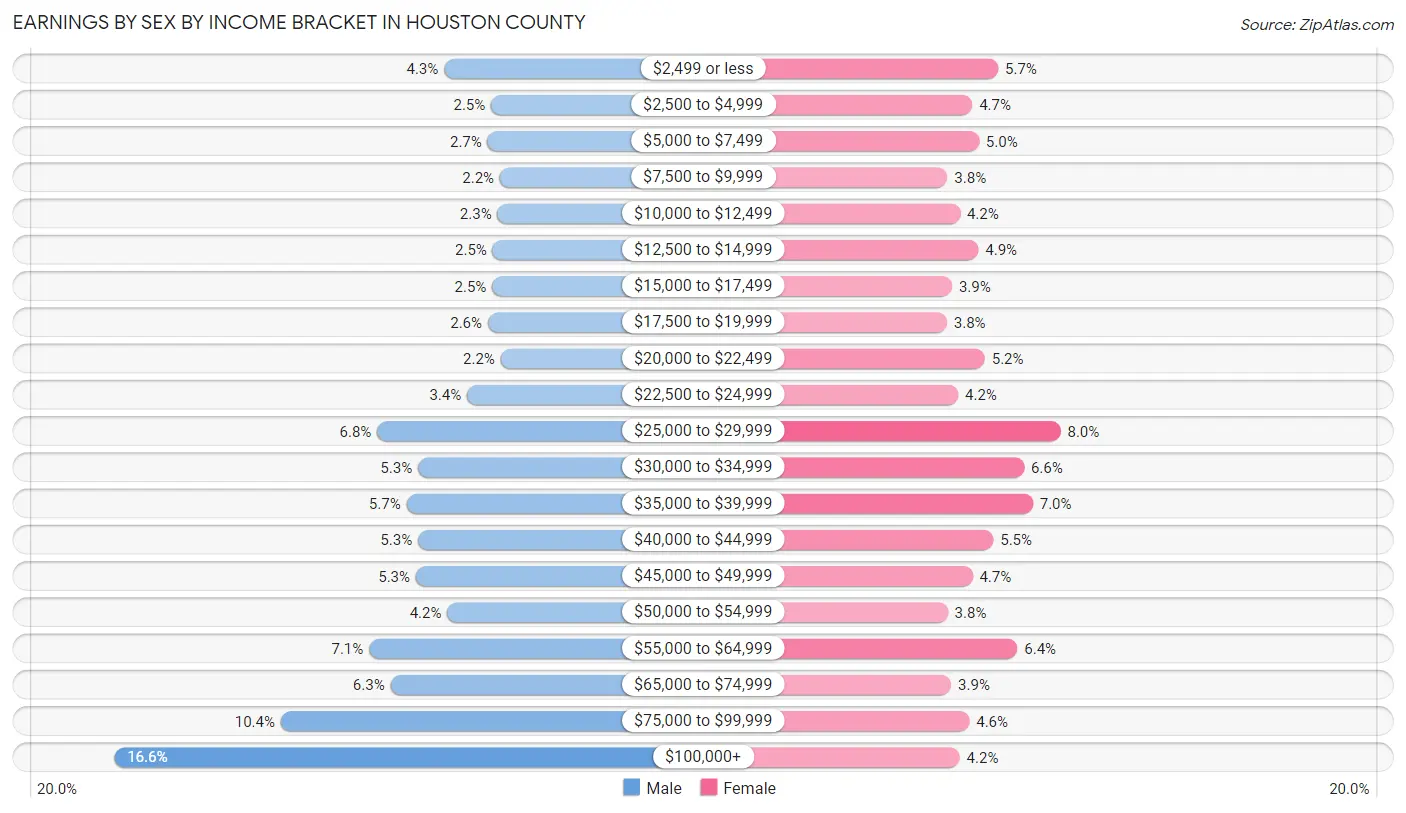
Earnings by Sex by Income Bracket in Houston County
The most common earnings brackets in Houston County are $100,000+ for men (4,395 | 16.6%) and $25,000 to $29,999 for women (1,951 | 8.0%).
| Income | Male | Female |
| $2,499 or less | 1,130 (4.3%) | 1,380 (5.7%) |
| $2,500 to $4,999 | 666 (2.5%) | 1,144 (4.7%) |
| $5,000 to $7,499 | 700 (2.6%) | 1,206 (5.0%) |
| $7,500 to $9,999 | 579 (2.2%) | 918 (3.8%) |
| $10,000 to $12,499 | 602 (2.3%) | 1,031 (4.2%) |
| $12,500 to $14,999 | 649 (2.5%) | 1,200 (4.9%) |
| $15,000 to $17,499 | 656 (2.5%) | 958 (3.9%) |
| $17,500 to $19,999 | 696 (2.6%) | 912 (3.7%) |
| $20,000 to $22,499 | 571 (2.2%) | 1,258 (5.2%) |
| $22,500 to $24,999 | 903 (3.4%) | 1,016 (4.2%) |
| $25,000 to $29,999 | 1,792 (6.8%) | 1,951 (8.0%) |
| $30,000 to $34,999 | 1,389 (5.3%) | 1,617 (6.6%) |
| $35,000 to $39,999 | 1,503 (5.7%) | 1,696 (7.0%) |
| $40,000 to $44,999 | 1,390 (5.3%) | 1,336 (5.5%) |
| $45,000 to $49,999 | 1,410 (5.3%) | 1,147 (4.7%) |
| $50,000 to $54,999 | 1,098 (4.2%) | 920 (3.8%) |
| $55,000 to $64,999 | 1,872 (7.1%) | 1,556 (6.4%) |
| $65,000 to $74,999 | 1,662 (6.3%) | 951 (3.9%) |
| $75,000 to $99,999 | 2,747 (10.4%) | 1,117 (4.6%) |
| $100,000+ | 4,395 (16.6%) | 1,029 (4.2%) |
| Total | 26,410 (100.0%) | 24,343 (100.0%) |
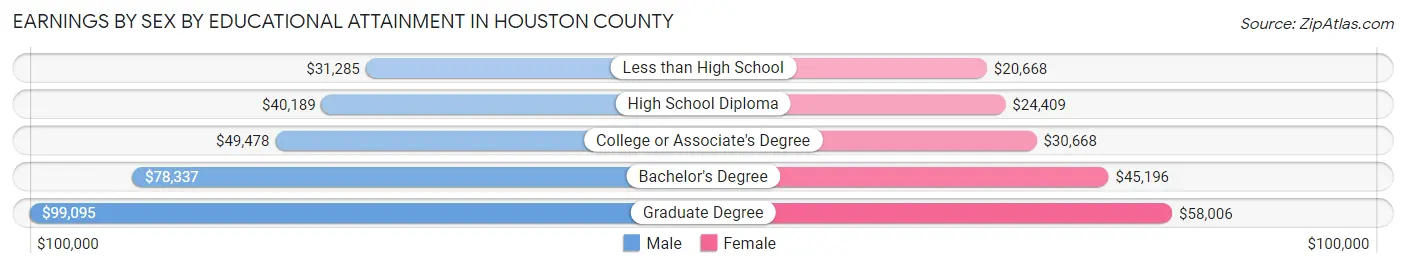
Earnings by Sex by Educational Attainment in Houston County
Average earnings in Houston County are $50,433 for men and $32,150 for women, a difference of 36.2%. Men with an educational attainment of graduate degree enjoy the highest average annual earnings of $99,095, while those with less than high school education earn the least with $31,285. Women with an educational attainment of graduate degree earn the most with the average annual earnings of $58,006, while those with less than high school education have the smallest earnings of $20,668.
| Educational Attainment | Male Income | Female Income |
| Less than High School | $31,285 | $20,668 |
| High School Diploma | $40,189 | $24,409 |
| College or Associate's Degree | $49,478 | $30,668 |
| Bachelor's Degree | $78,337 | $45,196 |
| Graduate Degree | $99,095 | $58,006 |
| Total | $50,433 | $32,150 |
Family Income in Houston County
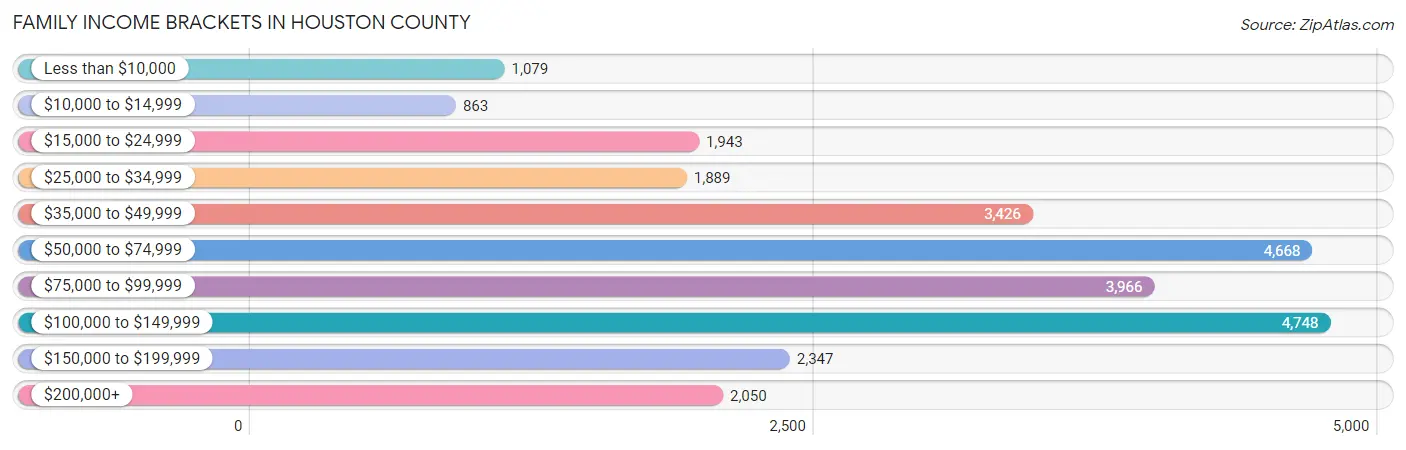
Family Income Brackets in Houston County
According to the Houston County family income data, there are 4,748 families falling into the $100,000 to $149,999 income range, which is the most common income bracket and makes up 17.6% of all families. Conversely, the $10,000 to $14,999 income bracket is the least frequent group with only 863 families (3.2%) belonging to this category.
| Income Bracket | # Families | % Families |
| Less than $10,000 | 1,079 | 4.0% |
| $10,000 to $14,999 | 863 | 3.2% |
| $15,000 to $24,999 | 1,943 | 7.2% |
| $25,000 to $34,999 | 1,889 | 7.0% |
| $35,000 to $49,999 | 3,426 | 12.7% |
| $50,000 to $74,999 | 4,668 | 17.3% |
| $75,000 to $99,999 | 3,966 | 14.7% |
| $100,000 to $149,999 | 4,748 | 17.6% |
| $150,000 to $199,999 | 2,347 | 8.7% |
| $200,000+ | 2,050 | 7.6% |
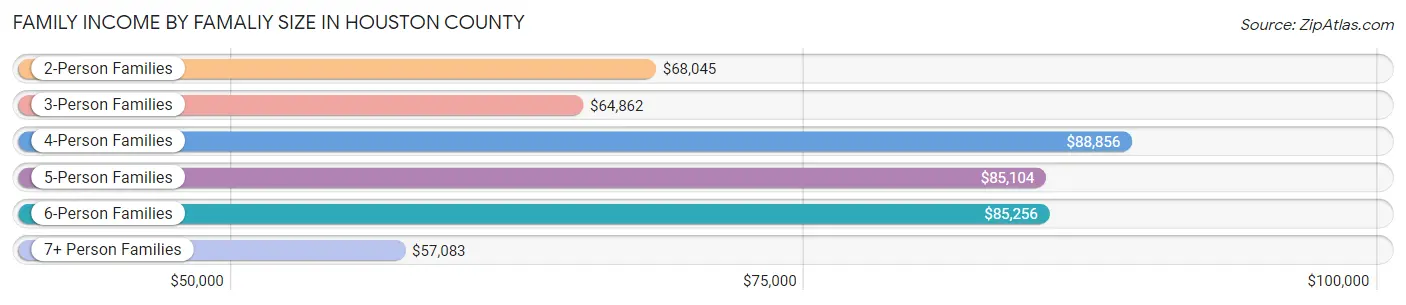
Family Income by Famaliy Size in Houston County
4-person families (4,357 | 16.2%) account for the highest median family income in Houston County with $88,856 per family, while 2-person families (13,890 | 51.5%) have the highest median income of $34,022 per family member.
| Income Bracket | # Families | Median Income |
| 2-Person Families | 13,890 (51.5%) | $68,045 |
| 3-Person Families | 5,846 (21.7%) | $64,862 |
| 4-Person Families | 4,357 (16.2%) | $88,856 |
| 5-Person Families | 1,958 (7.3%) | $85,104 |
| 6-Person Families | 710 (2.6%) | $85,256 |
| 7+ Person Families | 219 (0.8%) | $57,083 |
| Total | 26,980 (100.0%) | $72,526 |
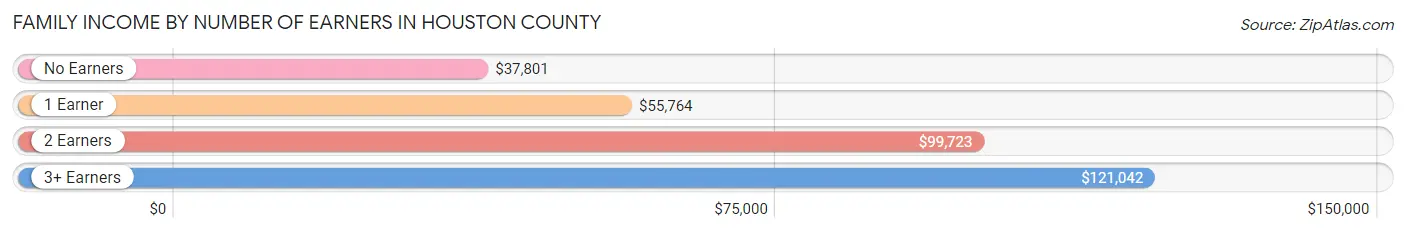
Family Income by Number of Earners in Houston County
The median family income in Houston County is $72,526, with families comprising 3+ earners (2,109) having the highest median family income of $121,042, while families with no earners (5,042) have the lowest median family income of $37,801, accounting for 7.8% and 18.7% of families, respectively.
| Number of Earners | # Families | Median Income |
| No Earners | 5,042 (18.7%) | $37,801 |
| 1 Earner | 9,790 (36.3%) | $55,764 |
| 2 Earners | 10,039 (37.2%) | $99,723 |
| 3+ Earners | 2,109 (7.8%) | $121,042 |
| Total | 26,980 (100.0%) | $72,526 |
Household Income in Houston County
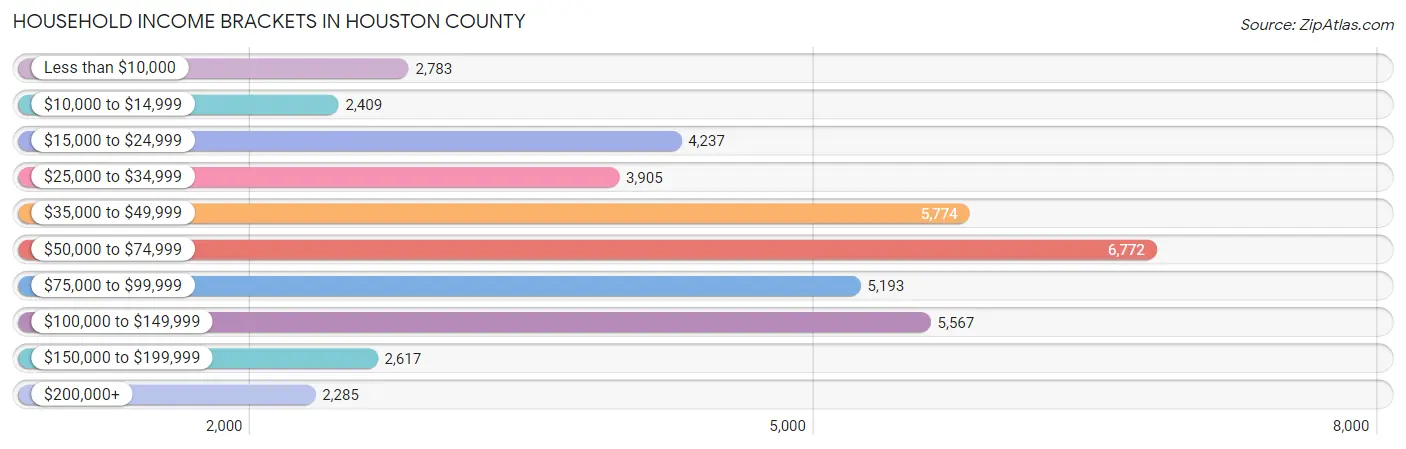
Household Income Brackets in Houston County
With 6,772 households falling in the category, the $50,000 to $74,999 income range is the most frequent in Houston County, accounting for 16.3% of all households. In contrast, only 2,285 households (5.5%) fall into the $200,000+ income bracket, making it the least populous group.
| Income Bracket | # Households | % Households |
| Less than $10,000 | 2,783 | 6.7% |
| $10,000 to $14,999 | 2,409 | 5.8% |
| $15,000 to $24,999 | 4,237 | 10.2% |
| $25,000 to $34,999 | 3,905 | 9.4% |
| $35,000 to $49,999 | 5,774 | 13.9% |
| $50,000 to $74,999 | 6,772 | 16.3% |
| $75,000 to $99,999 | 5,193 | 12.5% |
| $100,000 to $149,999 | 5,567 | 13.4% |
| $150,000 to $199,999 | 2,617 | 6.3% |
| $200,000+ | 2,285 | 5.5% |
Household Income by Householder Age in Houston County
The median household income in Houston County is $55,064, with the highest median household income of $66,420 found in the 45 to 64 years age bracket for the primary householder. A total of 15,548 households (37.4%) fall into this category. Meanwhile, the 15 to 24 years age bracket for the primary householder has the lowest median household income of $35,180, with 1,162 households (2.8%) in this group.
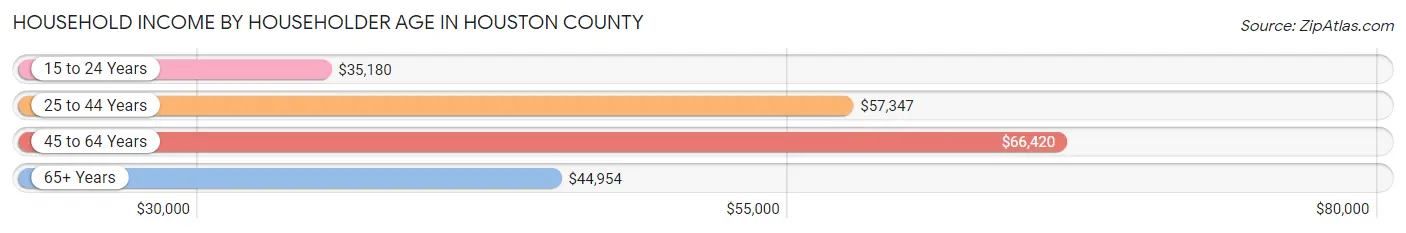
| Income Bracket | # Households | Median Income |
| 15 to 24 Years | 1,162 (2.8%) | $35,180 |
| 25 to 44 Years | 12,749 (30.7%) | $57,347 |
| 45 to 64 Years | 15,548 (37.4%) | $66,420 |
| 65+ Years | 12,084 (29.1%) | $44,954 |
| Total | 41,543 (100.0%) | $55,064 |
Poverty in Houston County
Income Below Poverty by Sex and Age in Houston County
With 15.5% poverty level for males and 20.0% for females among the residents of Houston County, under 5 year old males and 5 year old females are the most vulnerable to poverty, with 1,115 males (33.4%) and 167 females (34.9%) in their respective age groups living below the poverty level.
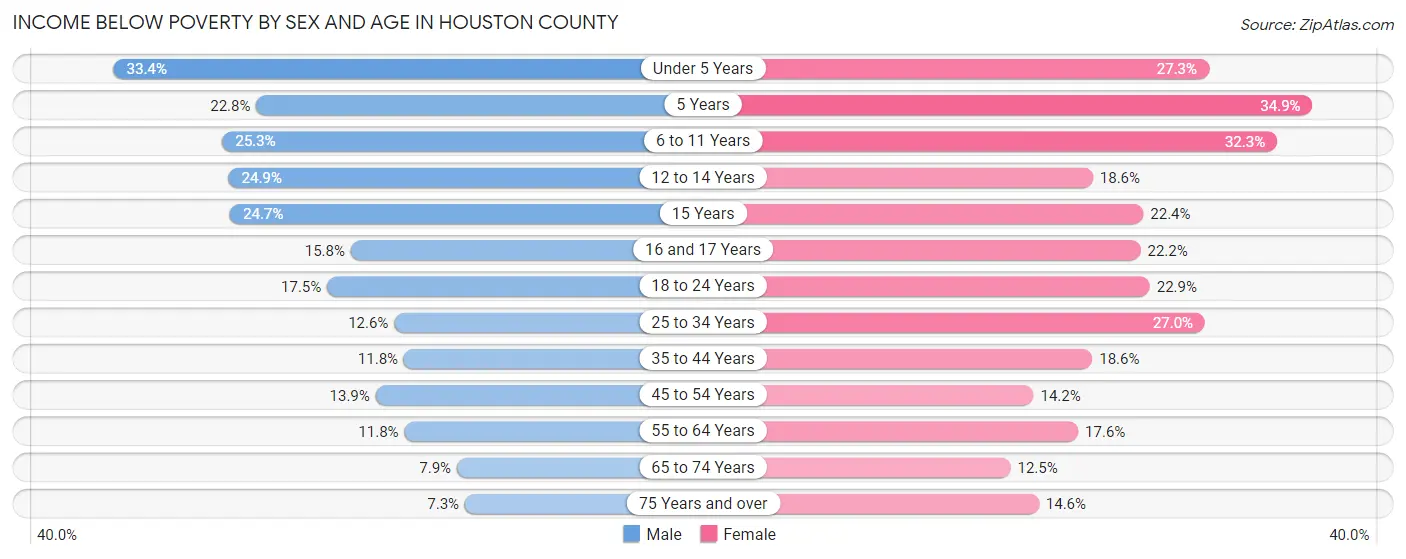
| Age Bracket | Male | Female |
| Under 5 Years | 1,115 (33.4%) | 854 (27.3%) |
| 5 Years | 171 (22.8%) | 167 (34.9%) |
| 6 to 11 Years | 1,010 (25.3%) | 1,237 (32.3%) |
| 12 to 14 Years | 552 (24.8%) | 388 (18.6%) |
| 15 Years | 166 (24.7%) | 212 (22.4%) |
| 16 and 17 Years | 248 (15.8%) | 240 (22.2%) |
| 18 to 24 Years | 746 (17.5%) | 959 (22.9%) |
| 25 to 34 Years | 793 (12.6%) | 1,917 (27.0%) |
| 35 to 44 Years | 759 (11.8%) | 1,282 (18.6%) |
| 45 to 54 Years | 882 (13.9%) | 995 (14.2%) |
| 55 to 64 Years | 797 (11.8%) | 1,306 (17.5%) |
| 65 to 74 Years | 416 (7.9%) | 764 (12.5%) |
| 75 Years and over | 224 (7.3%) | 678 (14.6%) |
| Total | 7,879 (15.5%) | 10,999 (20.0%) |
Income Above Poverty by Sex and Age in Houston County
According to the poverty statistics in Houston County, males aged 75 years and over and females aged 65 to 74 years are the age groups that are most secure financially, with 92.7% of males and 87.5% of females in these age groups living above the poverty line.
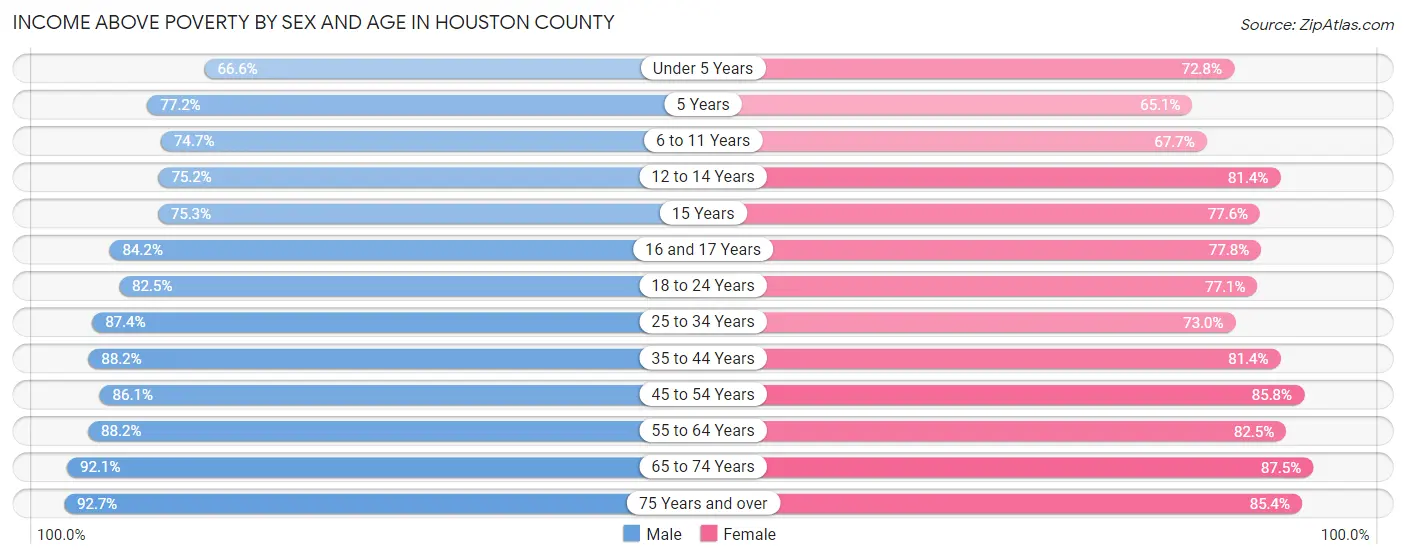
| Age Bracket | Male | Female |
| Under 5 Years | 2,224 (66.6%) | 2,280 (72.8%) |
| 5 Years | 579 (77.2%) | 311 (65.1%) |
| 6 to 11 Years | 2,979 (74.7%) | 2,592 (67.7%) |
| 12 to 14 Years | 1,669 (75.1%) | 1,694 (81.4%) |
| 15 Years | 505 (75.3%) | 735 (77.6%) |
| 16 and 17 Years | 1,324 (84.2%) | 842 (77.8%) |
| 18 to 24 Years | 3,507 (82.5%) | 3,235 (77.1%) |
| 25 to 34 Years | 5,523 (87.4%) | 5,194 (73.0%) |
| 35 to 44 Years | 5,652 (88.2%) | 5,610 (81.4%) |
| 45 to 54 Years | 5,444 (86.1%) | 5,993 (85.8%) |
| 55 to 64 Years | 5,957 (88.2%) | 6,135 (82.5%) |
| 65 to 74 Years | 4,851 (92.1%) | 5,331 (87.5%) |
| 75 Years and over | 2,840 (92.7%) | 3,957 (85.4%) |
| Total | 43,054 (84.5%) | 43,909 (80.0%) |
Income Below Poverty Among Married-Couple Families in Houston County
The poverty statistics for married-couple families in Houston County show that 5.5% or 1,024 of the total 18,737 families live below the poverty line. Families with 5 or more children have the highest poverty rate of 18.1%, comprising of 17 families. On the other hand, families with no children have the lowest poverty rate of 4.2%, which includes 494 families.
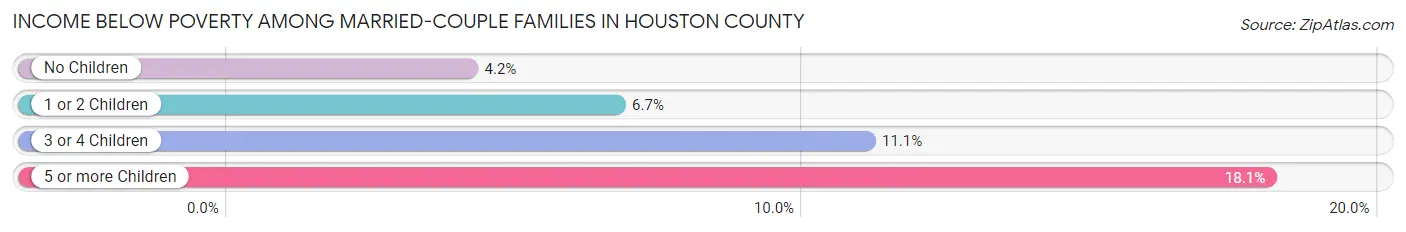
| Children | Above Poverty | Below Poverty |
| No Children | 11,361 (95.8%) | 494 (4.2%) |
| 1 or 2 Children | 5,136 (93.3%) | 371 (6.7%) |
| 3 or 4 Children | 1,139 (88.9%) | 142 (11.1%) |
| 5 or more Children | 77 (81.9%) | 17 (18.1%) |
| Total | 17,713 (94.5%) | 1,024 (5.5%) |
Income Below Poverty Among Single-Parent Households in Houston County
According to the poverty data in Houston County, 13.4% or 267 single-father households and 35.4% or 2,211 single-mother households are living below the poverty line. Among single-father households, those with 5 or more children have the highest poverty rate, with 23 households (100.0%) experiencing poverty. Likewise, among single-mother households, those with 5 or more children have the highest poverty rate, with 41 households (89.1%) falling below the poverty line.
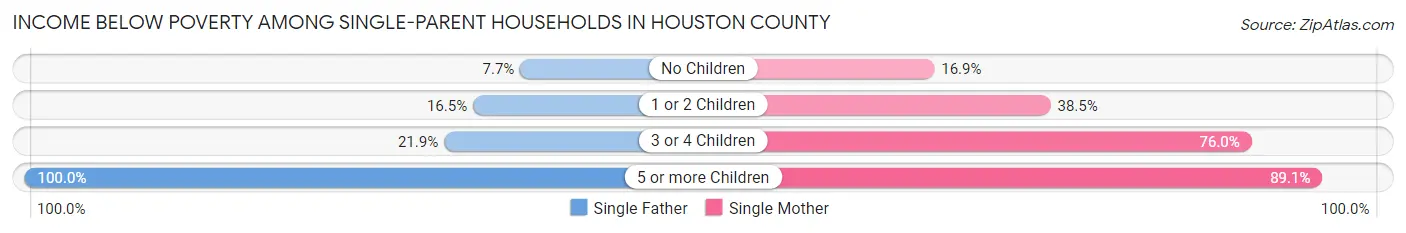
| Children | Single Father | Single Mother |
| No Children | 76 (7.7%) | 378 (16.9%) |
| 1 or 2 Children | 147 (16.5%) | 1,251 (38.5%) |
| 3 or 4 Children | 21 (21.9%) | 541 (76.0%) |
| 5 or more Children | 23 (100.0%) | 41 (89.1%) |
| Total | 267 (13.4%) | 2,211 (35.4%) |
Income Below Poverty Among Married-Couple vs Single-Parent Households in Houston County
The poverty data for Houston County shows that 1,024 of the married-couple family households (5.5%) and 2,478 of the single-parent households (30.1%) are living below the poverty level. Within the married-couple family households, those with 5 or more children have the highest poverty rate, with 17 households (18.1%) falling below the poverty line. Among the single-parent households, those with 5 or more children have the highest poverty rate, with 64 household (92.7%) living below poverty.
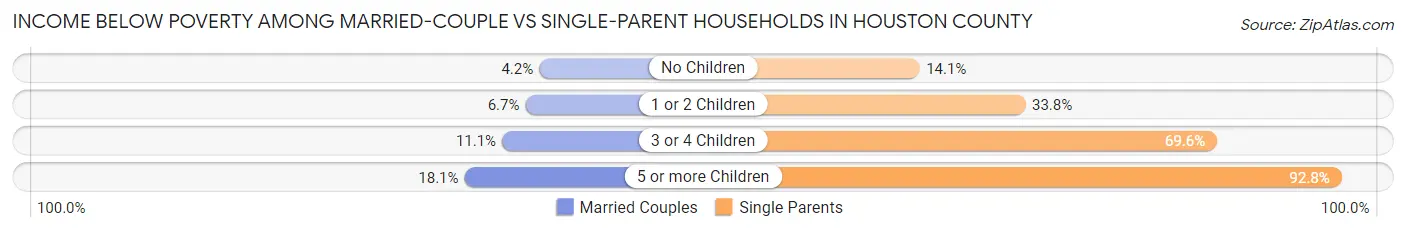
| Children | Married-Couple Families | Single-Parent Households |
| No Children | 494 (4.2%) | 454 (14.1%) |
| 1 or 2 Children | 371 (6.7%) | 1,398 (33.8%) |
| 3 or 4 Children | 142 (11.1%) | 562 (69.6%) |
| 5 or more Children | 17 (18.1%) | 64 (92.7%) |
| Total | 1,024 (5.5%) | 2,478 (30.1%) |
Race in Houston County
The most populous races in Houston County are White / Caucasian (71,260 | 66.6%), Black / African American (29,166 | 27.3%), and Two or more Races (4,312 | 4.0%).
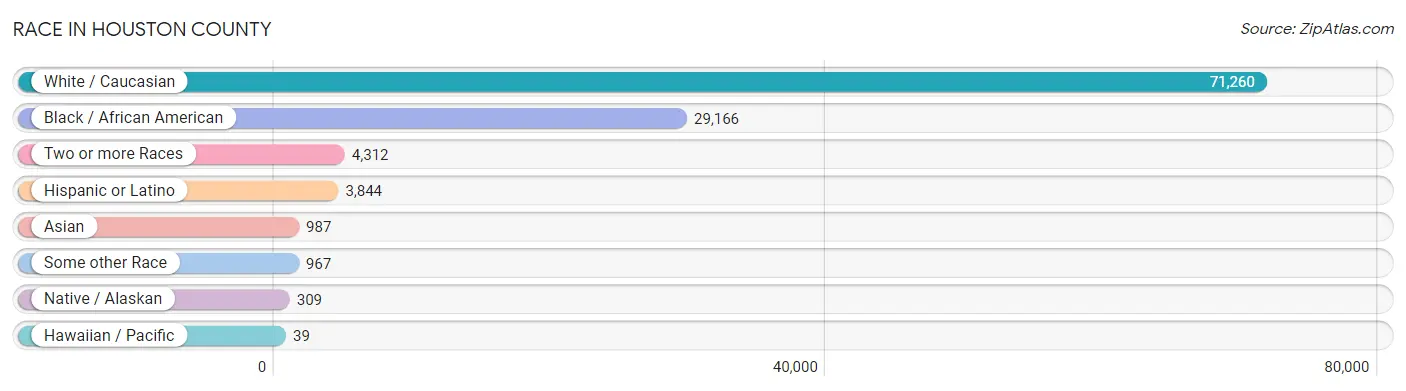
| Race | # Population | % Population |
| Asian | 987 | 0.9% |
| Black / African American | 29,166 | 27.3% |
| Hawaiian / Pacific | 39 | 0.0% |
| Hispanic or Latino | 3,844 | 3.6% |
| Native / Alaskan | 309 | 0.3% |
| White / Caucasian | 71,260 | 66.6% |
| Two or more Races | 4,312 | 4.0% |
| Some other Race | 967 | 0.9% |
| Total | 107,040 | 100.0% |
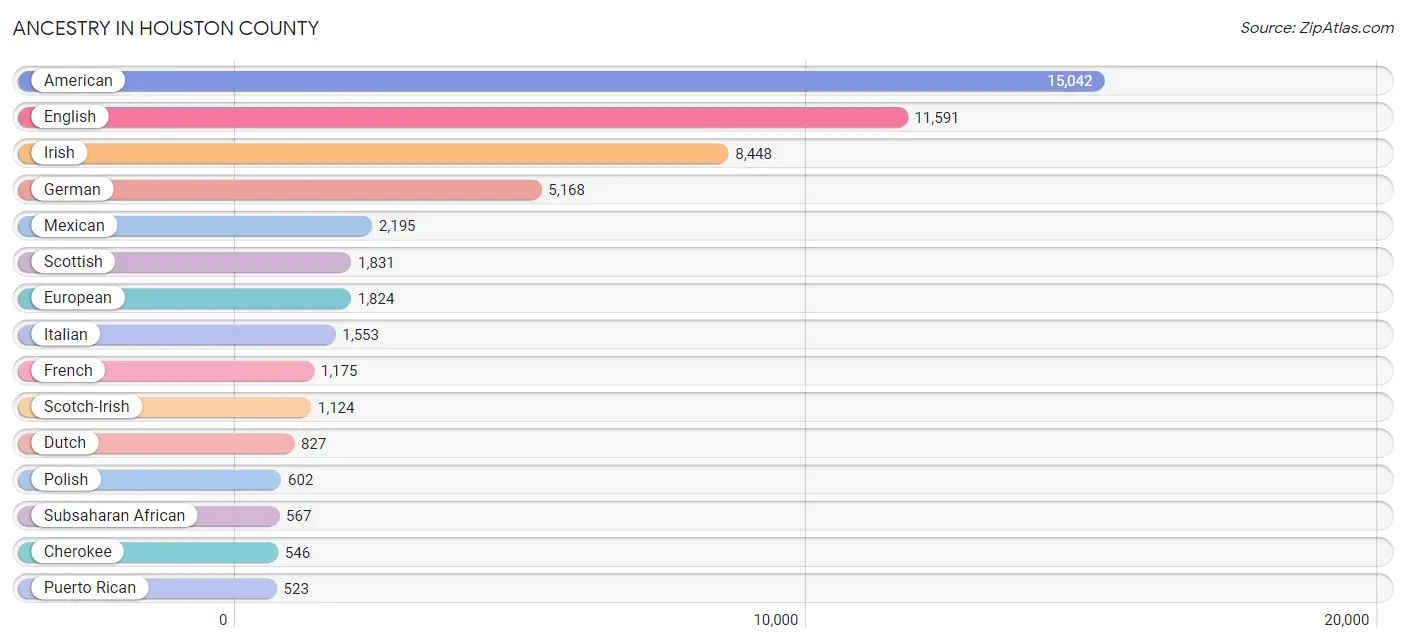
Ancestry in Houston County
The most populous ancestries reported in Houston County are American (15,042 | 14.1%), English (11,591 | 10.8%), Irish (8,448 | 7.9%), German (5,168 | 4.8%), and Mexican (2,195 | 2.1%), together accounting for 39.7% of all Houston County residents.
| Ancestry | # Population | % Population |
| African | 434 | 0.4% |
| Alaska Native | 2 | 0.0% |
| American | 15,042 | 14.1% |
| Apache | 36 | 0.0% |
| Arab | 157 | 0.2% |
| Argentinean | 3 | 0.0% |
| Australian | 5 | 0.0% |
| Austrian | 51 | 0.1% |
| Bahamian | 13 | 0.0% |
| Basque | 5 | 0.0% |
| Belgian | 20 | 0.0% |
| Belizean | 15 | 0.0% |
| Bhutanese | 116 | 0.1% |
| Blackfeet | 138 | 0.1% |
| Brazilian | 64 | 0.1% |
| British | 413 | 0.4% |
| Bulgarian | 2 | 0.0% |
| Burmese | 186 | 0.2% |
| Cajun | 58 | 0.1% |
| Canadian | 80 | 0.1% |
| Cape Verdean | 2 | 0.0% |
| Celtic | 6 | 0.0% |
| Central American | 406 | 0.4% |
| Central American Indian | 66 | 0.1% |
| Cherokee | 546 | 0.5% |
| Chilean | 5 | 0.0% |
| Chinese | 3 | 0.0% |
| Chippewa | 3 | 0.0% |
| Choctaw | 26 | 0.0% |
| Colombian | 36 | 0.0% |
| Comanche | 2 | 0.0% |
| Creek | 114 | 0.1% |
| Croatian | 14 | 0.0% |
| Cuban | 201 | 0.2% |
| Czech | 41 | 0.0% |
| Czechoslovakian | 39 | 0.0% |
| Danish | 36 | 0.0% |
| Dominican | 66 | 0.1% |
| Dutch | 827 | 0.8% |
| Dutch West Indian | 3 | 0.0% |
| Eastern European | 115 | 0.1% |
| Ecuadorian | 22 | 0.0% |
| Egyptian | 1 | 0.0% |
| English | 11,591 | 10.8% |
| Ethiopian | 44 | 0.0% |
| European | 1,824 | 1.7% |
| Filipino | 6 | 0.0% |
| Finnish | 54 | 0.1% |
| French | 1,175 | 1.1% |
| French American Indian | 19 | 0.0% |
| French Canadian | 137 | 0.1% |
| German | 5,168 | 4.8% |
| German Russian | 4 | 0.0% |
| Ghanaian | 11 | 0.0% |
| Greek | 103 | 0.1% |
| Guamanian / Chamorro | 9 | 0.0% |
| Guatemalan | 243 | 0.2% |
| Haitian | 39 | 0.0% |
| Honduran | 32 | 0.0% |
| Hungarian | 65 | 0.1% |
| Icelander | 3 | 0.0% |
| Indian (Asian) | 202 | 0.2% |
| Iranian | 3 | 0.0% |
| Irish | 8,448 | 7.9% |
| Iroquois | 8 | 0.0% |
| Italian | 1,553 | 1.5% |
| Jamaican | 178 | 0.2% |
| Japanese | 17 | 0.0% |
| Kenyan | 6 | 0.0% |
| Korean | 348 | 0.3% |
| Laotian | 19 | 0.0% |
| Lebanese | 79 | 0.1% |
| Lithuanian | 28 | 0.0% |
| Lumbee | 5 | 0.0% |
| Malaysian | 1 | 0.0% |
| Mexican | 2,195 | 2.1% |
| Mexican American Indian | 32 | 0.0% |
| Moroccan | 5 | 0.0% |
| Native Hawaiian | 64 | 0.1% |
| Navajo | 28 | 0.0% |
| Nigerian | 75 | 0.1% |
| Northern European | 66 | 0.1% |
| Norwegian | 288 | 0.3% |
| Osage | 1 | 0.0% |
| Pakistani | 39 | 0.0% |
| Palestinian | 46 | 0.0% |
| Panamanian | 78 | 0.1% |
| Pennsylvania German | 12 | 0.0% |
| Peruvian | 45 | 0.0% |
| Polish | 602 | 0.6% |
| Portuguese | 56 | 0.1% |
| Potawatomi | 3 | 0.0% |
| Puerto Rican | 523 | 0.5% |
| Romanian | 17 | 0.0% |
| Russian | 131 | 0.1% |
| Salvadoran | 51 | 0.1% |
| Samoan | 41 | 0.0% |
| Scandinavian | 84 | 0.1% |
| Scotch-Irish | 1,124 | 1.1% |
| Scottish | 1,831 | 1.7% |
| Seminole | 1 | 0.0% |
| Serbian | 3 | 0.0% |
| Shoshone | 6 | 0.0% |
| Sioux | 4 | 0.0% |
| Slavic | 6 | 0.0% |
| Slovak | 27 | 0.0% |
| South American | 162 | 0.2% |
| South American Indian | 4 | 0.0% |
| Spaniard | 76 | 0.1% |
| Spanish | 119 | 0.1% |
| Sri Lankan | 281 | 0.3% |
| Subsaharan African | 567 | 0.5% |
| Swedish | 162 | 0.2% |
| Swiss | 60 | 0.1% |
| Thai | 222 | 0.2% |
| Tongan | 23 | 0.0% |
| Trinidadian and Tobagonian | 6 | 0.0% |
| Turkish | 26 | 0.0% |
| Ukrainian | 37 | 0.0% |
| Venezuelan | 51 | 0.1% |
| Vietnamese | 2 | 0.0% |
| Welsh | 400 | 0.4% |
| West Indian | 18 | 0.0% |
| Yugoslavian | 3 | 0.0% | View All 124 Rows |
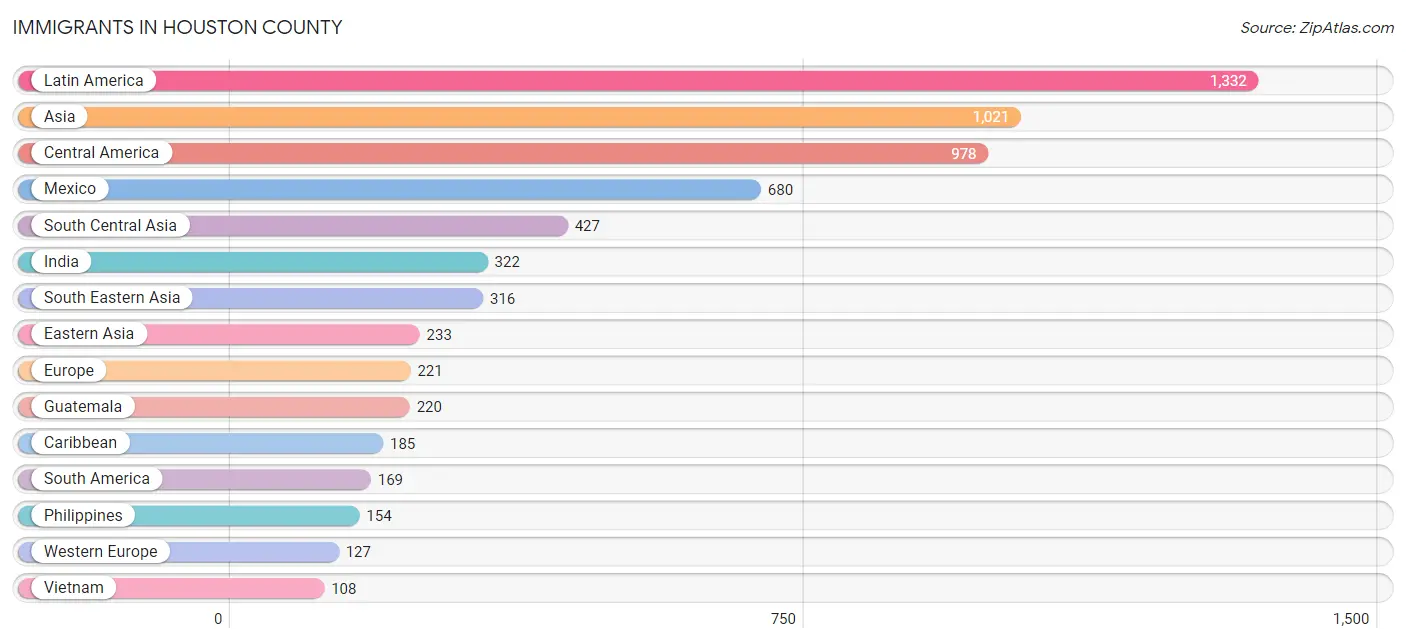
Immigrants in Houston County
The most numerous immigrant groups reported in Houston County came from Latin America (1,332 | 1.2%), Asia (1,021 | 0.9%), Central America (978 | 0.9%), Mexico (680 | 0.6%), and South Central Asia (427 | 0.4%), together accounting for 4.1% of all Houston County residents.
| Immigration Origin | # Population | % Population |
| Africa | 83 | 0.1% |
| Argentina | 7 | 0.0% |
| Asia | 1,021 | 0.9% |
| Australia | 2 | 0.0% |
| Bahamas | 3 | 0.0% |
| Bangladesh | 7 | 0.0% |
| Barbados | 24 | 0.0% |
| Belgium | 2 | 0.0% |
| Bolivia | 4 | 0.0% |
| Brazil | 30 | 0.0% |
| Canada | 66 | 0.1% |
| Caribbean | 185 | 0.2% |
| Central America | 978 | 0.9% |
| Chile | 5 | 0.0% |
| China | 103 | 0.1% |
| Colombia | 20 | 0.0% |
| Costa Rica | 6 | 0.0% |
| Cuba | 30 | 0.0% |
| Dominican Republic | 11 | 0.0% |
| Eastern Africa | 29 | 0.0% |
| Eastern Asia | 233 | 0.2% |
| Eastern Europe | 52 | 0.1% |
| Ecuador | 7 | 0.0% |
| El Salvador | 28 | 0.0% |
| England | 25 | 0.0% |
| Ethiopia | 11 | 0.0% |
| Europe | 221 | 0.2% |
| France | 12 | 0.0% |
| Germany | 100 | 0.1% |
| Greece | 1 | 0.0% |
| Guatemala | 220 | 0.2% |
| Guyana | 7 | 0.0% |
| Haiti | 16 | 0.0% |
| Honduras | 28 | 0.0% |
| Hungary | 20 | 0.0% |
| India | 322 | 0.3% |
| Indonesia | 19 | 0.0% |
| Iran | 3 | 0.0% |
| Italy | 4 | 0.0% |
| Jamaica | 97 | 0.1% |
| Japan | 39 | 0.0% |
| Jordan | 4 | 0.0% |
| Kenya | 16 | 0.0% |
| Korea | 91 | 0.1% |
| Kuwait | 3 | 0.0% |
| Latin America | 1,332 | 1.2% |
| Lebanon | 1 | 0.0% |
| Lithuania | 4 | 0.0% |
| Mexico | 680 | 0.6% |
| Morocco | 5 | 0.0% |
| Nigeria | 27 | 0.0% |
| Northern Africa | 8 | 0.0% |
| Northern Europe | 33 | 0.0% |
| Oceania | 2 | 0.0% |
| Pakistan | 81 | 0.1% |
| Panama | 16 | 0.0% |
| Peru | 40 | 0.0% |
| Philippines | 154 | 0.1% |
| Poland | 8 | 0.0% |
| Romania | 2 | 0.0% |
| Russia | 15 | 0.0% |
| South America | 169 | 0.2% |
| South Central Asia | 427 | 0.4% |
| South Eastern Asia | 316 | 0.3% |
| Southern Europe | 7 | 0.0% |
| Spain | 2 | 0.0% |
| Switzerland | 13 | 0.0% |
| Taiwan | 10 | 0.0% |
| Thailand | 35 | 0.0% |
| Turkey | 21 | 0.0% |
| Uruguay | 3 | 0.0% |
| Venezuela | 46 | 0.0% |
| Vietnam | 108 | 0.1% |
| Western Africa | 46 | 0.0% |
| Western Asia | 35 | 0.0% |
| Western Europe | 127 | 0.1% |
| Yemen | 6 | 0.0% | View All 77 Rows |
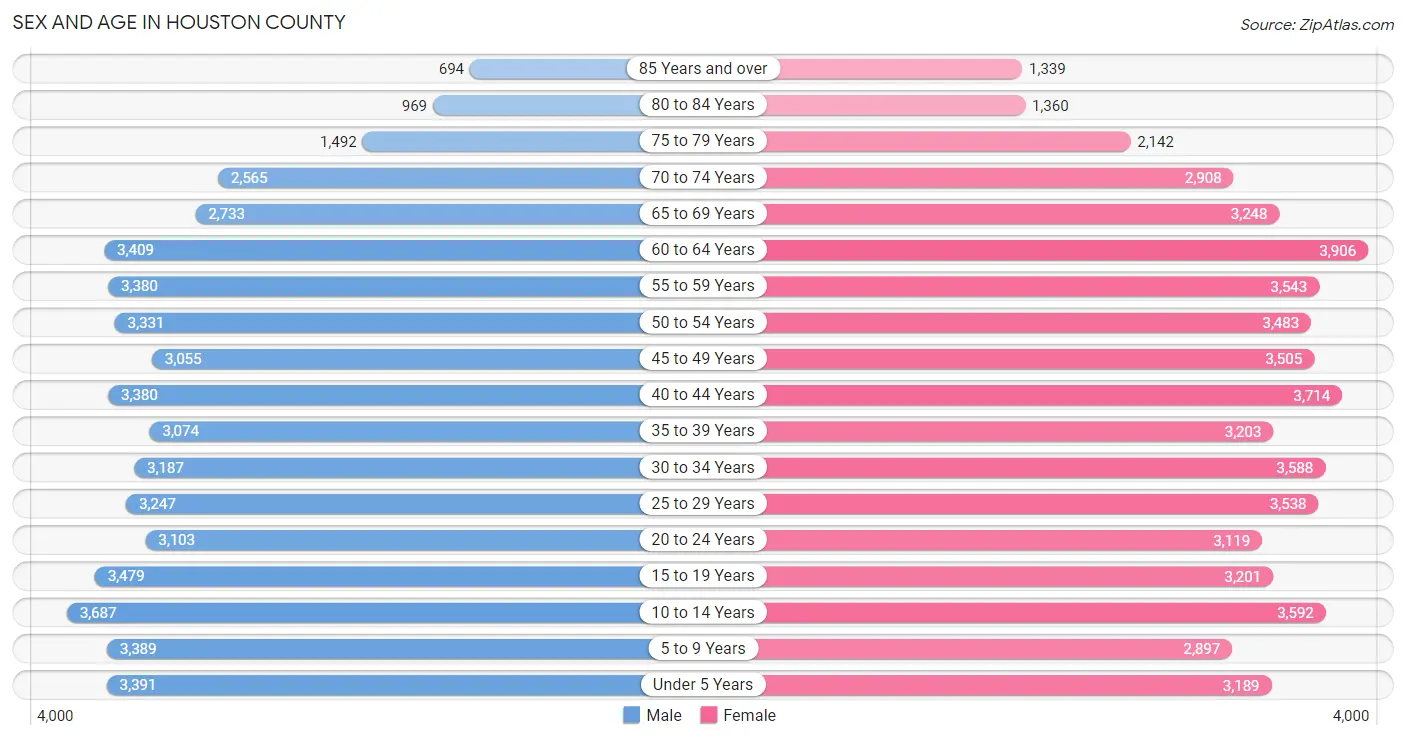
Sex and Age in Houston County
Sex and Age in Houston County
The most populous age groups in Houston County are 10 to 14 Years (3,687 | 7.1%) for men and 60 to 64 Years (3,906 | 7.0%) for women.
| Age Bracket | Male | Female |
| Under 5 Years | 3,391 (6.6%) | 3,189 (5.8%) |
| 5 to 9 Years | 3,389 (6.6%) | 2,897 (5.2%) |
| 10 to 14 Years | 3,687 (7.1%) | 3,592 (6.5%) |
| 15 to 19 Years | 3,479 (6.8%) | 3,201 (5.8%) |
| 20 to 24 Years | 3,103 (6.0%) | 3,119 (5.6%) |
| 25 to 29 Years | 3,247 (6.3%) | 3,538 (6.4%) |
| 30 to 34 Years | 3,187 (6.2%) | 3,588 (6.5%) |
| 35 to 39 Years | 3,074 (6.0%) | 3,203 (5.8%) |
| 40 to 44 Years | 3,380 (6.6%) | 3,714 (6.7%) |
| 45 to 49 Years | 3,055 (5.9%) | 3,505 (6.3%) |
| 50 to 54 Years | 3,331 (6.5%) | 3,483 (6.3%) |
| 55 to 59 Years | 3,380 (6.6%) | 3,543 (6.4%) |
| 60 to 64 Years | 3,409 (6.6%) | 3,906 (7.0%) |
| 65 to 69 Years | 2,733 (5.3%) | 3,248 (5.9%) |
| 70 to 74 Years | 2,565 (5.0%) | 2,908 (5.2%) |
| 75 to 79 Years | 1,492 (2.9%) | 2,142 (3.9%) |
| 80 to 84 Years | 969 (1.9%) | 1,360 (2.5%) |
| 85 Years and over | 694 (1.3%) | 1,339 (2.4%) |
| Total | 51,565 (100.0%) | 55,475 (100.0%) |
Families and Households in Houston County
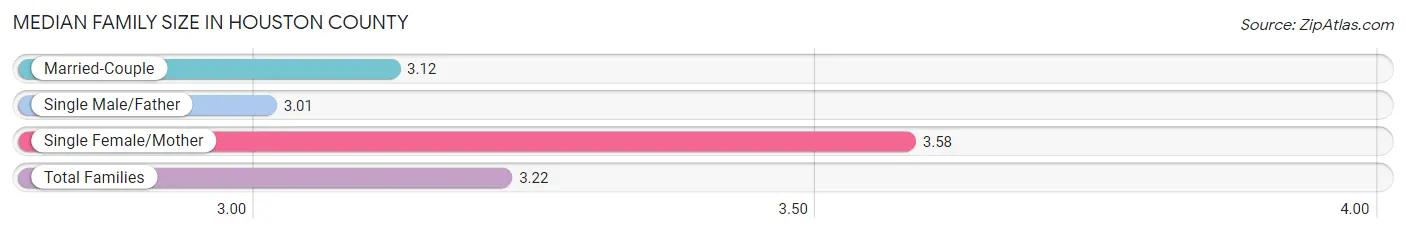
Median Family Size in Houston County
The median family size in Houston County is 3.22 persons per family, with single female/mother families (6,244 | 23.1%) accounting for the largest median family size of 3.58 persons per family. On the other hand, single male/father families (1,999 | 7.4%) represent the smallest median family size with 3.01 persons per family.
| Family Type | # Families | Family Size |
| Married-Couple | 18,737 (69.5%) | 3.12 |
| Single Male/Father | 1,999 (7.4%) | 3.01 |
| Single Female/Mother | 6,244 (23.1%) | 3.58 |
| Total Families | 26,980 (100.0%) | 3.22 |
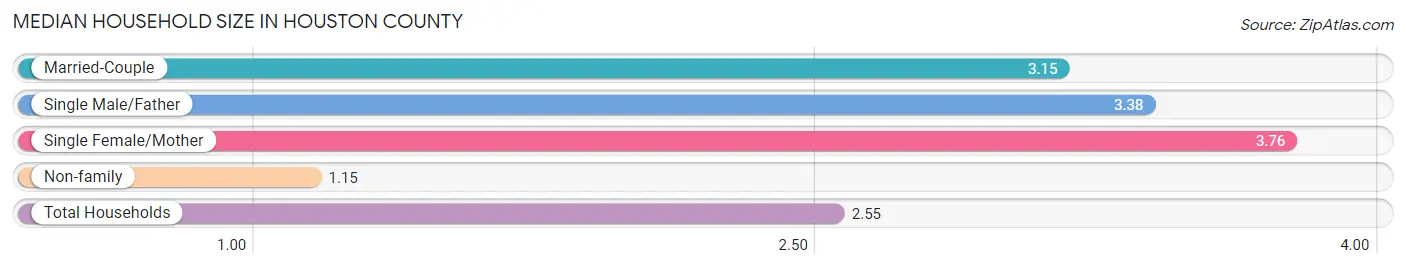
Median Household Size in Houston County
The median household size in Houston County is 2.55 persons per household, with single female/mother households (6,244 | 15.0%) accounting for the largest median household size of 3.76 persons per household. non-family households (14,563 | 35.1%) represent the smallest median household size with 1.15 persons per household.
| Household Type | # Households | Household Size |
| Married-Couple | 18,737 (45.1%) | 3.15 |
| Single Male/Father | 1,999 (4.8%) | 3.38 |
| Single Female/Mother | 6,244 (15.0%) | 3.76 |
| Non-family | 14,563 (35.1%) | 1.15 |
| Total Households | 41,543 (100.0%) | 2.55 |
Household Size by Marriage Status in Houston County
Out of a total of 41,543 households in Houston County, 26,980 (64.9%) are family households, while 14,563 (35.1%) are nonfamily households. The most numerous type of family households are 2-person households, comprising 13,359, and the most common type of nonfamily households are 1-person households, comprising 12,986.
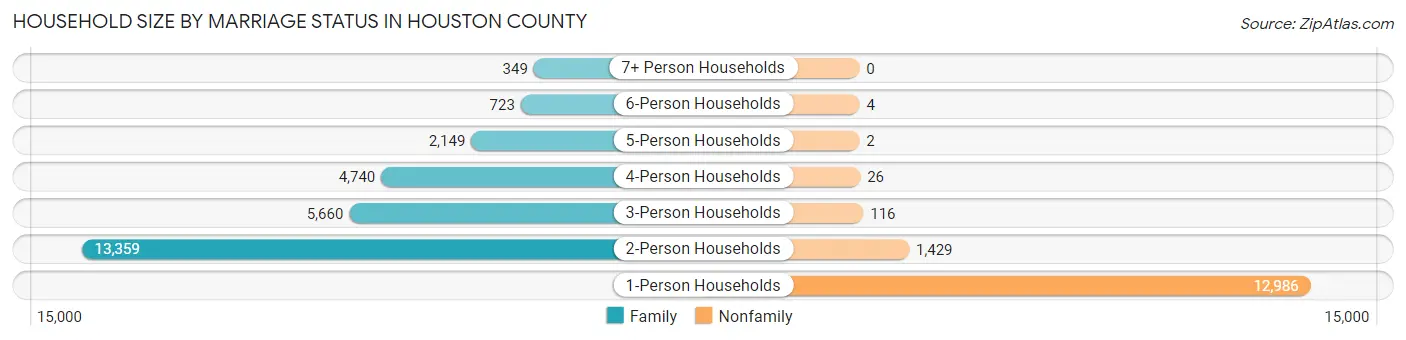
| Household Size | Family Households | Nonfamily Households |
| 1-Person Households | - | 12,986 (31.3%) |
| 2-Person Households | 13,359 (32.2%) | 1,429 (3.4%) |
| 3-Person Households | 5,660 (13.6%) | 116 (0.3%) |
| 4-Person Households | 4,740 (11.4%) | 26 (0.1%) |
| 5-Person Households | 2,149 (5.2%) | 2 (0.0%) |
| 6-Person Households | 723 (1.7%) | 4 (0.0%) |
| 7+ Person Households | 349 (0.8%) | 0 (0.0%) |
| Total | 26,980 (64.9%) | 14,563 (35.1%) |
Female Fertility in Houston County
Fertility by Age in Houston County
Average fertility rate in Houston County is 47.0 births per 1,000 women. Women in the age bracket of 20 to 34 years have the highest fertility rate with 91.0 births per 1,000 women. Women in the age bracket of 20 to 34 years acount for 81.0% of all women with births.
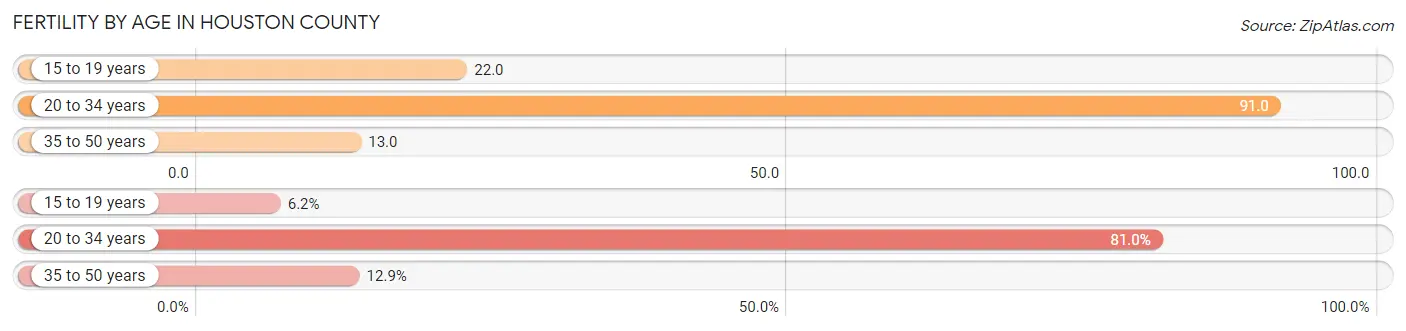
| Age Bracket | Women with Births | Births / 1,000 Women |
| 15 to 19 years | 71 (6.2%) | 22.0 |
| 20 to 34 years | 932 (81.0%) | 91.0 |
| 35 to 50 years | 148 (12.9%) | 13.0 |
| Total | 1,151 (100.0%) | 47.0 |
Fertility by Age by Marriage Status in Houston County
54.8% of women with births (1,151) in Houston County are married. The highest percentage of unmarried women with births falls into 15 to 19 years age bracket with 95.8% of them unmarried at the time of birth, while the lowest percentage of unmarried women with births belong to 35 to 50 years age bracket with 21.6% of them unmarried.
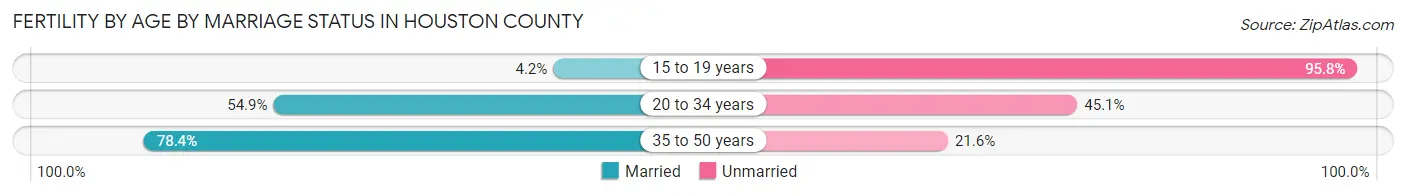
| Age Bracket | Married | Unmarried |
| 15 to 19 years | 3 (4.2%) | 68 (95.8%) |
| 20 to 34 years | 512 (54.9%) | 420 (45.1%) |
| 35 to 50 years | 116 (78.4%) | 32 (21.6%) |
| Total | 631 (54.8%) | 520 (45.2%) |
Fertility by Education in Houston County
Average fertility rate in Houston County is 47.0 births per 1,000 women. Women with the education attainment of college or associate's degree have the highest fertility rate of 54.0 births per 1,000 women, while women with the education attainment of graduate degree have the lowest fertility at 36.0 births per 1,000 women. Women with the education attainment of college or associate's degree represent 40.7% of all women with births.
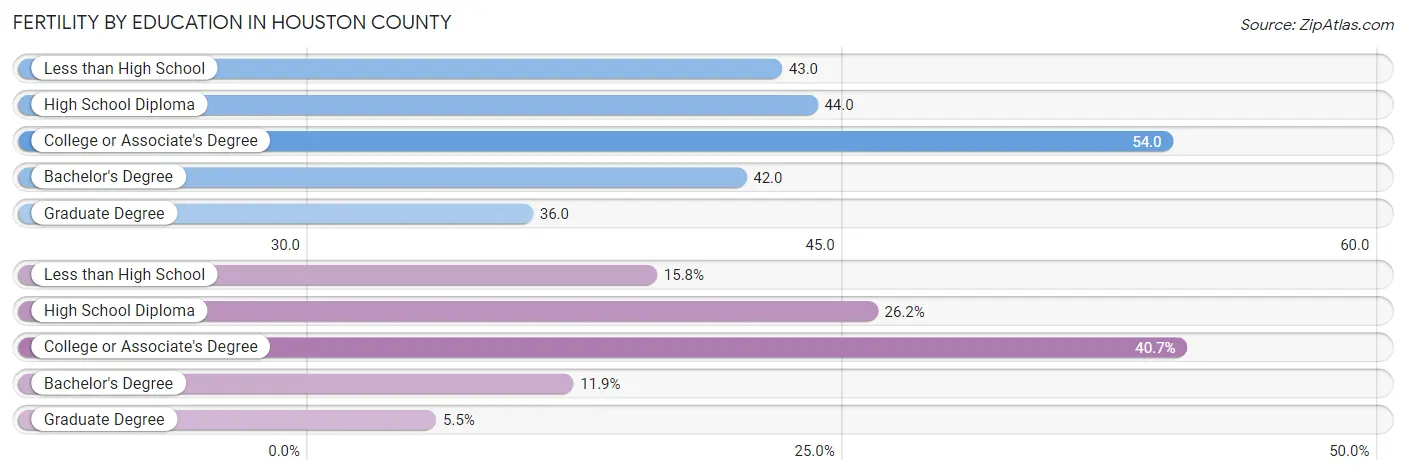
| Educational Attainment | Women with Births | Births / 1,000 Women |
| Less than High School | 182 (15.8%) | 43.0 |
| High School Diploma | 301 (26.2%) | 44.0 |
| College or Associate's Degree | 468 (40.7%) | 54.0 |
| Bachelor's Degree | 137 (11.9%) | 42.0 |
| Graduate Degree | 63 (5.5%) | 36.0 |
| Total | 1,151 (100.0%) | 47.0 |
Fertility by Education by Marriage Status in Houston County
45.2% of women with births in Houston County are unmarried. Women with the educational attainment of bachelor's degree are most likely to be married with 94.2% of them married at childbirth, while women with the educational attainment of high school diploma are least likely to be married with 61.8% of them unmarried at childbirth.
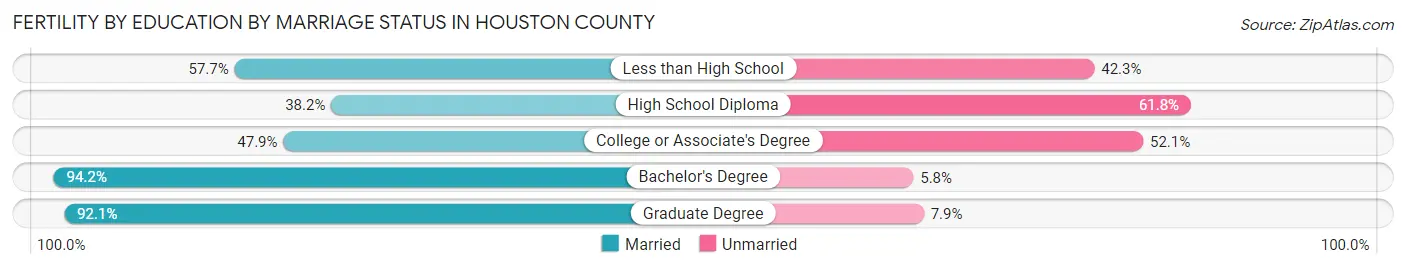
| Educational Attainment | Married | Unmarried |
| Less than High School | 105 (57.7%) | 77 (42.3%) |
| High School Diploma | 115 (38.2%) | 186 (61.8%) |
| College or Associate's Degree | 224 (47.9%) | 244 (52.1%) |
| Bachelor's Degree | 129 (94.2%) | 8 (5.8%) |
| Graduate Degree | 58 (92.1%) | 5 (7.9%) |
| Total | 631 (54.8%) | 520 (45.2%) |
Employment Characteristics in Houston County
Employment by Class of Employer in Houston County
Among the 45,364 employed individuals in Houston County, private company employees (31,159 | 68.7%), local government employees (3,044 | 6.7%), and not-for-profit organizations (2,944 | 6.5%) make up the most common classes of employment.
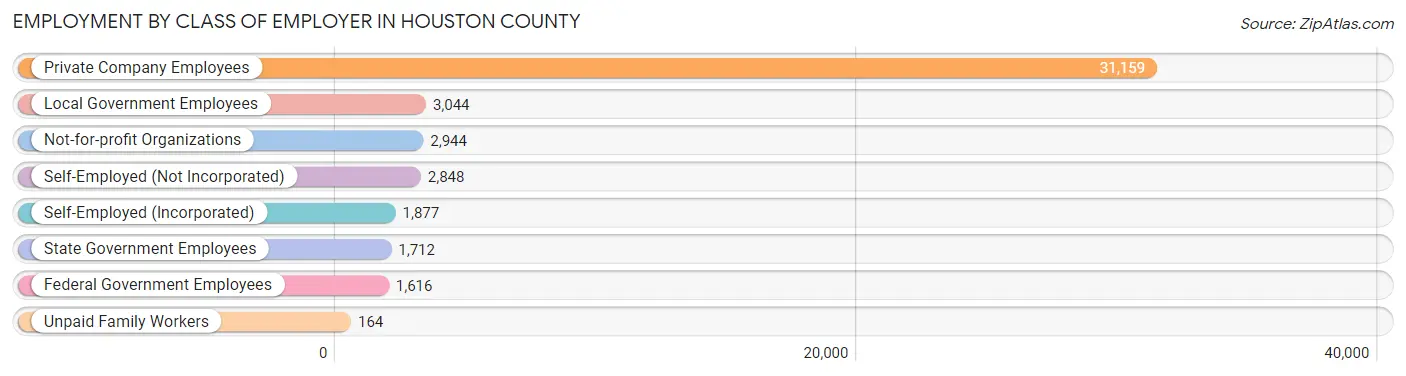
| Employer Class | # Employees | % Employees |
| Private Company Employees | 31,159 | 68.7% |
| Self-Employed (Incorporated) | 1,877 | 4.1% |
| Self-Employed (Not Incorporated) | 2,848 | 6.3% |
| Not-for-profit Organizations | 2,944 | 6.5% |
| Local Government Employees | 3,044 | 6.7% |
| State Government Employees | 1,712 | 3.8% |
| Federal Government Employees | 1,616 | 3.6% |
| Unpaid Family Workers | 164 | 0.4% |
| Total | 45,364 | 100.0% |
Employment Status by Age in Houston County
According to the labor force statistics for Houston County, out of the total population over 16 years of age (85,251), 56.7% or 48,337 individuals are in the labor force, with 5.0% or 2,417 of them unemployed. The age group with the highest labor force participation rate is 25 to 29 years, with 77.7% or 5,272 individuals in the labor force. Within the labor force, the 16 to 19 years age range has the highest percentage of unemployed individuals, with 11.5% or 218 of them being unemployed.
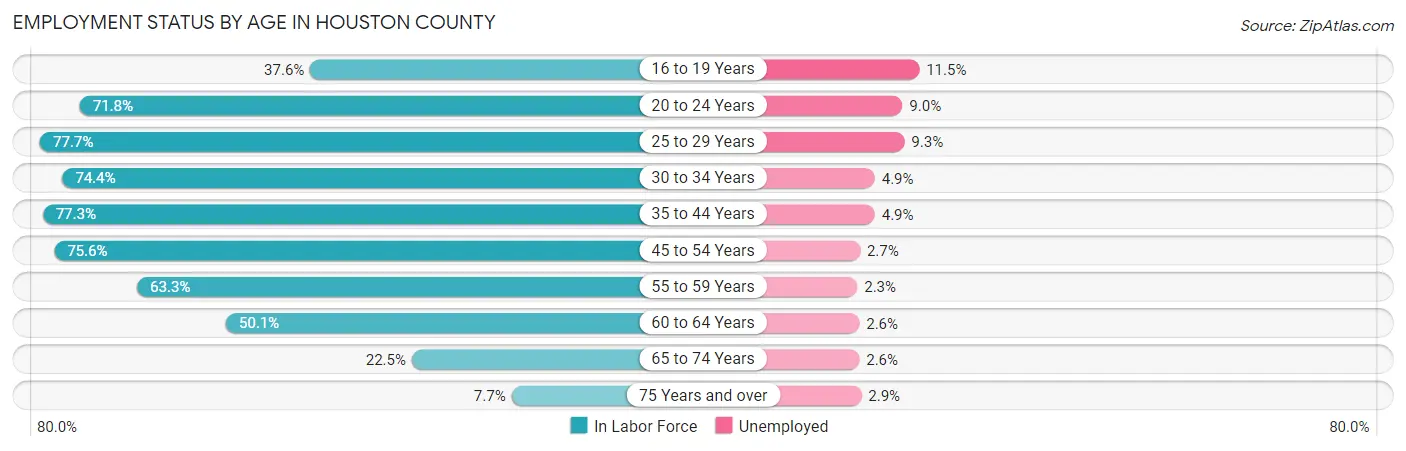
| Age Bracket | In Labor Force | Unemployed |
| 16 to 19 Years | 1,894 (37.6%) | 218 (11.5%) |
| 20 to 24 Years | 4,467 (71.8%) | 402 (9.0%) |
| 25 to 29 Years | 5,272 (77.7%) | 490 (9.3%) |
| 30 to 34 Years | 5,041 (74.4%) | 247 (4.9%) |
| 35 to 44 Years | 10,336 (77.3%) | 506 (4.9%) |
| 45 to 54 Years | 10,111 (75.6%) | 273 (2.7%) |
| 55 to 59 Years | 4,382 (63.3%) | 101 (2.3%) |
| 60 to 64 Years | 3,665 (50.1%) | 95 (2.6%) |
| 65 to 74 Years | 2,577 (22.5%) | 67 (2.6%) |
| 75 Years and over | 616 (7.7%) | 18 (2.9%) |
| Total | 48,337 (56.7%) | 2,417 (5.0%) |
Employment Status by Educational Attainment in Houston County
According to labor force statistics for Houston County, 71.1% of individuals (38,780) out of the total population between 25 and 64 years of age (54,543) are in the labor force, with 4.4% or 1,706 of them being unemployed. The group with the highest labor force participation rate are those with the educational attainment of bachelor's degree or higher, with 84.9% or 10,683 individuals in the labor force. Within the labor force, individuals with less than high school education have the highest percentage of unemployment, with 9.0% or 279 of them being unemployed.
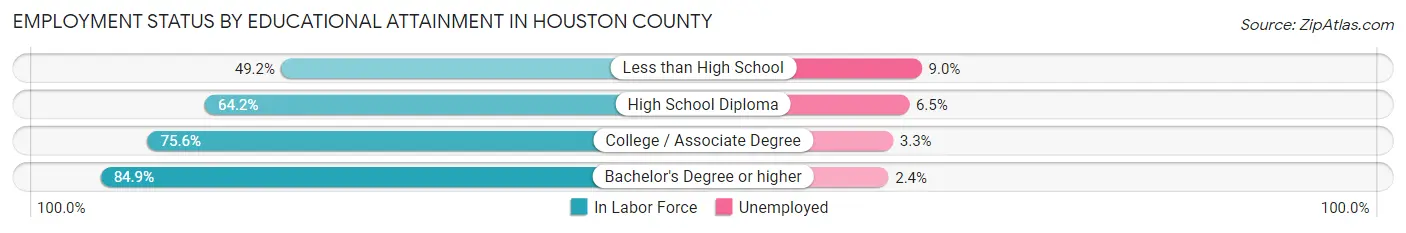
| Educational Attainment | In Labor Force | Unemployed |
| Less than High School | 3,101 (49.2%) | 567 (9.0%) |
| High School Diploma | 10,856 (64.2%) | 1,099 (6.5%) |
| College / Associate Degree | 14,173 (75.6%) | 619 (3.3%) |
| Bachelor's Degree or higher | 10,683 (84.9%) | 302 (2.4%) |
| Total | 38,780 (71.1%) | 2,400 (4.4%) |
Employment Occupations by Sex in Houston County
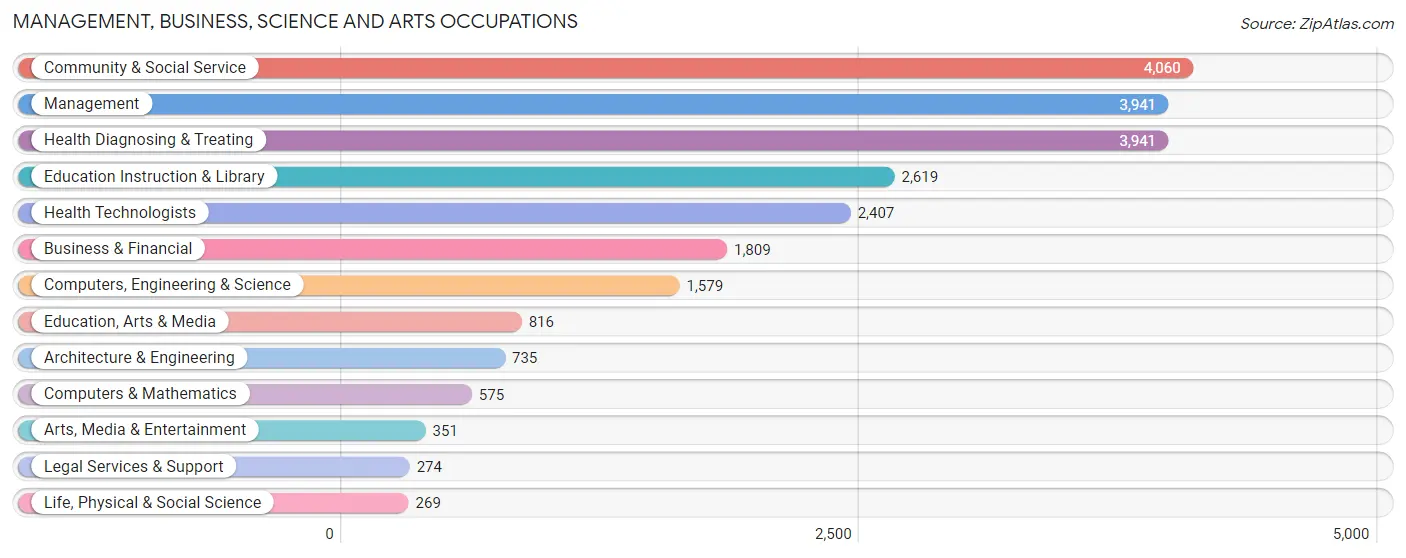
Management, Business, Science and Arts Occupations
The most common Management, Business, Science and Arts occupations in Houston County are Community & Social Service (4,060 | 8.9%), Management (3,941 | 8.6%), Health Diagnosing & Treating (3,941 | 8.6%), Education Instruction & Library (2,619 | 5.7%), and Health Technologists (2,407 | 5.3%).
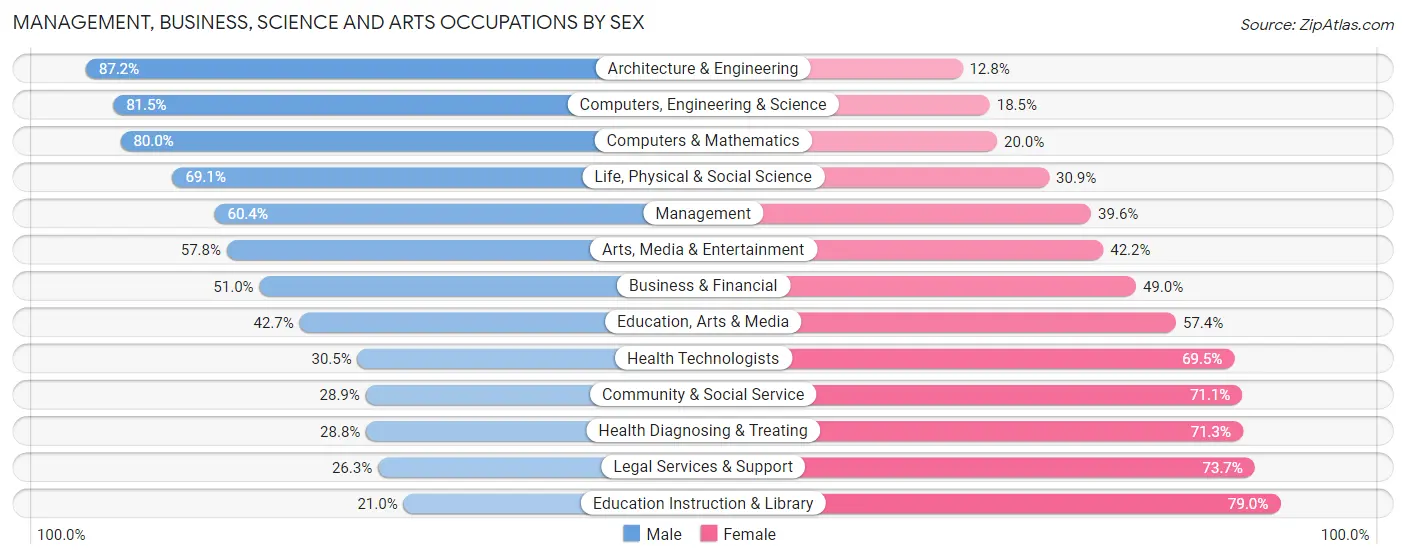
Management, Business, Science and Arts Occupations by Sex
Within the Management, Business, Science and Arts occupations in Houston County, the most male-oriented occupations are Architecture & Engineering (87.2%), Computers, Engineering & Science (81.5%), and Computers & Mathematics (80.0%), while the most female-oriented occupations are Education Instruction & Library (79.0%), Legal Services & Support (73.7%), and Health Diagnosing & Treating (71.3%).
| Occupation | Male | Female |
| Management | 2,379 (60.4%) | 1,562 (39.6%) |
| Business & Financial | 923 (51.0%) | 886 (49.0%) |
| Computers, Engineering & Science | 1,287 (81.5%) | 292 (18.5%) |
| Computers & Mathematics | 460 (80.0%) | 115 (20.0%) |
| Architecture & Engineering | 641 (87.2%) | 94 (12.8%) |
| Life, Physical & Social Science | 186 (69.1%) | 83 (30.9%) |
| Community & Social Service | 1,172 (28.9%) | 2,888 (71.1%) |
| Education, Arts & Media | 348 (42.6%) | 468 (57.4%) |
| Legal Services & Support | 72 (26.3%) | 202 (73.7%) |
| Education Instruction & Library | 549 (21.0%) | 2,070 (79.0%) |
| Arts, Media & Entertainment | 203 (57.8%) | 148 (42.2%) |
| Health Diagnosing & Treating | 1,133 (28.7%) | 2,808 (71.3%) |
| Health Technologists | 735 (30.5%) | 1,672 (69.5%) |
| Total (Category) | 6,894 (45.0%) | 8,436 (55.0%) |
| Total (Overall) | 24,070 (52.7%) | 21,638 (47.3%) |
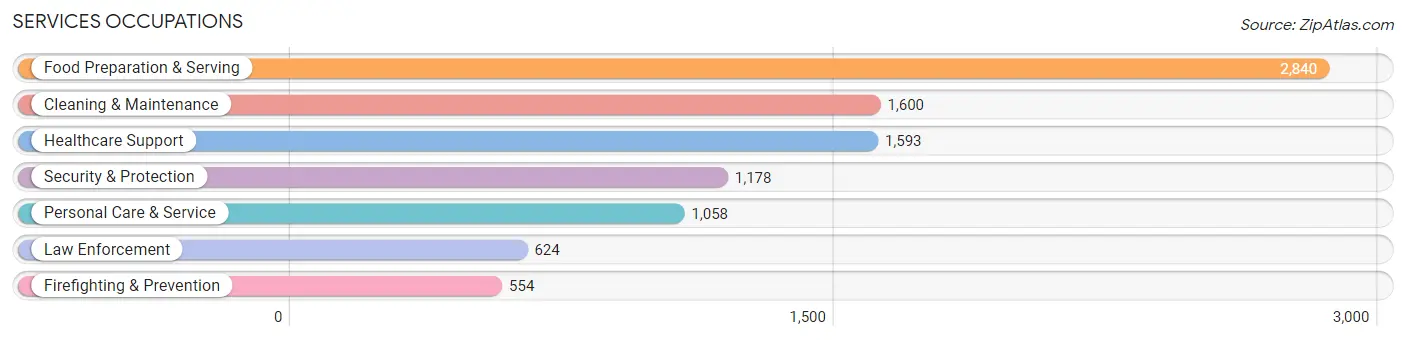
Services Occupations
The most common Services occupations in Houston County are Food Preparation & Serving (2,840 | 6.2%), Cleaning & Maintenance (1,600 | 3.5%), Healthcare Support (1,593 | 3.5%), Security & Protection (1,178 | 2.6%), and Personal Care & Service (1,058 | 2.3%).
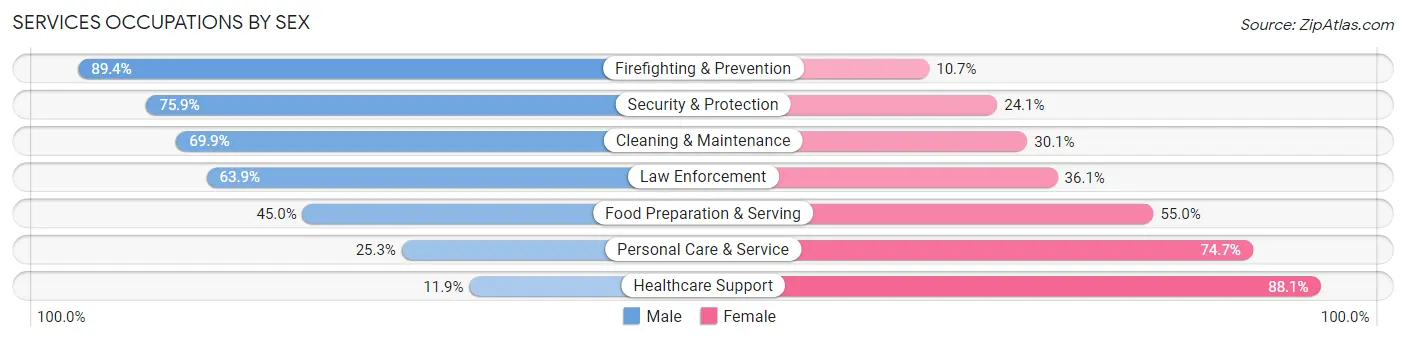
Services Occupations by Sex
Within the Services occupations in Houston County, the most male-oriented occupations are Firefighting & Prevention (89.3%), Security & Protection (75.9%), and Cleaning & Maintenance (69.9%), while the most female-oriented occupations are Healthcare Support (88.1%), Personal Care & Service (74.7%), and Food Preparation & Serving (55.0%).
| Occupation | Male | Female |
| Healthcare Support | 190 (11.9%) | 1,403 (88.1%) |
| Security & Protection | 894 (75.9%) | 284 (24.1%) |
| Firefighting & Prevention | 495 (89.3%) | 59 (10.6%) |
| Law Enforcement | 399 (63.9%) | 225 (36.1%) |
| Food Preparation & Serving | 1,277 (45.0%) | 1,563 (55.0%) |
| Cleaning & Maintenance | 1,119 (69.9%) | 481 (30.1%) |
| Personal Care & Service | 268 (25.3%) | 790 (74.7%) |
| Total (Category) | 3,748 (45.3%) | 4,521 (54.7%) |
| Total (Overall) | 24,070 (52.7%) | 21,638 (47.3%) |
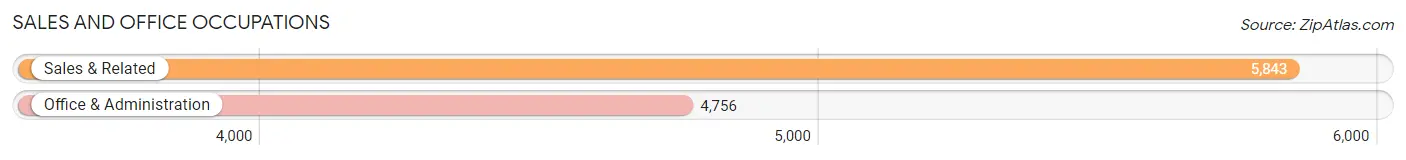
Sales and Office Occupations
The most common Sales and Office occupations in Houston County are Sales & Related (5,843 | 12.8%), and Office & Administration (4,756 | 10.4%).
Sales and Office Occupations by Sex
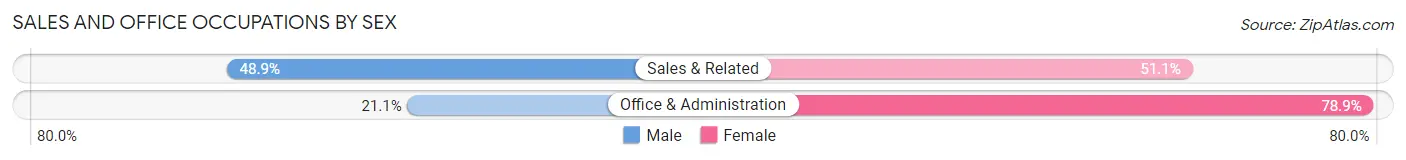
| Occupation | Male | Female |
| Sales & Related | 2,858 (48.9%) | 2,985 (51.1%) |
| Office & Administration | 1,003 (21.1%) | 3,753 (78.9%) |
| Total (Category) | 3,861 (36.4%) | 6,738 (63.6%) |
| Total (Overall) | 24,070 (52.7%) | 21,638 (47.3%) |
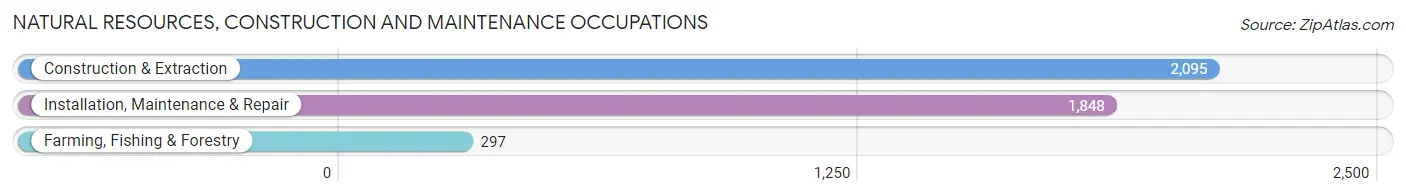
Natural Resources, Construction and Maintenance Occupations
The most common Natural Resources, Construction and Maintenance occupations in Houston County are Construction & Extraction (2,095 | 4.6%), Installation, Maintenance & Repair (1,848 | 4.0%), and Farming, Fishing & Forestry (297 | 0.6%).
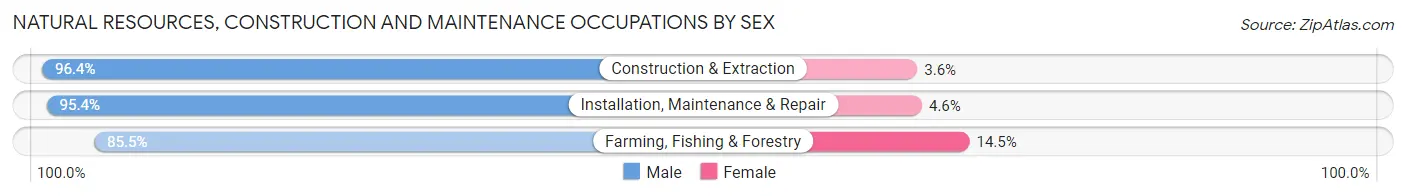
Natural Resources, Construction and Maintenance Occupations by Sex
| Occupation | Male | Female |
| Farming, Fishing & Forestry | 254 (85.5%) | 43 (14.5%) |
| Construction & Extraction | 2,019 (96.4%) | 76 (3.6%) |
| Installation, Maintenance & Repair | 1,763 (95.4%) | 85 (4.6%) |
| Total (Category) | 4,036 (95.2%) | 204 (4.8%) |
| Total (Overall) | 24,070 (52.7%) | 21,638 (47.3%) |
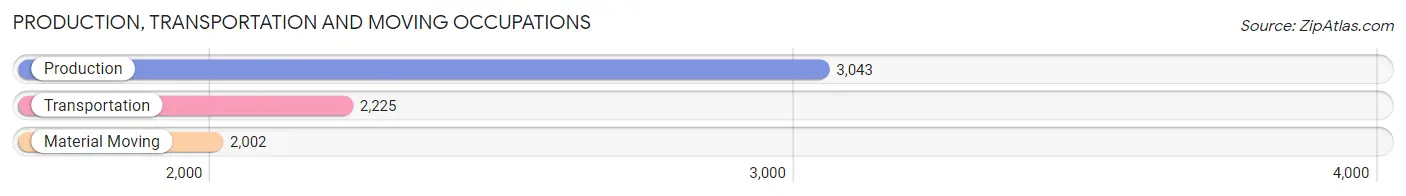
Production, Transportation and Moving Occupations
The most common Production, Transportation and Moving occupations in Houston County are Production (3,043 | 6.7%), Transportation (2,225 | 4.9%), and Material Moving (2,002 | 4.4%).
Production, Transportation and Moving Occupations by Sex
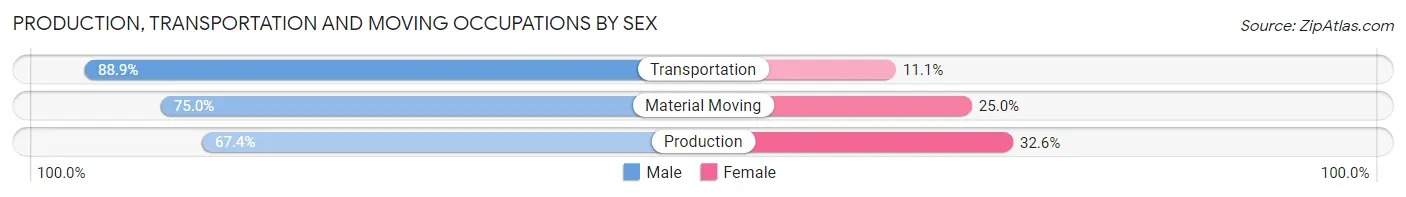
| Occupation | Male | Female |
| Production | 2,052 (67.4%) | 991 (32.6%) |
| Transportation | 1,978 (88.9%) | 247 (11.1%) |
| Material Moving | 1,501 (75.0%) | 501 (25.0%) |
| Total (Category) | 5,531 (76.1%) | 1,739 (23.9%) |
| Total (Overall) | 24,070 (52.7%) | 21,638 (47.3%) |
Employment Industries by Sex in Houston County
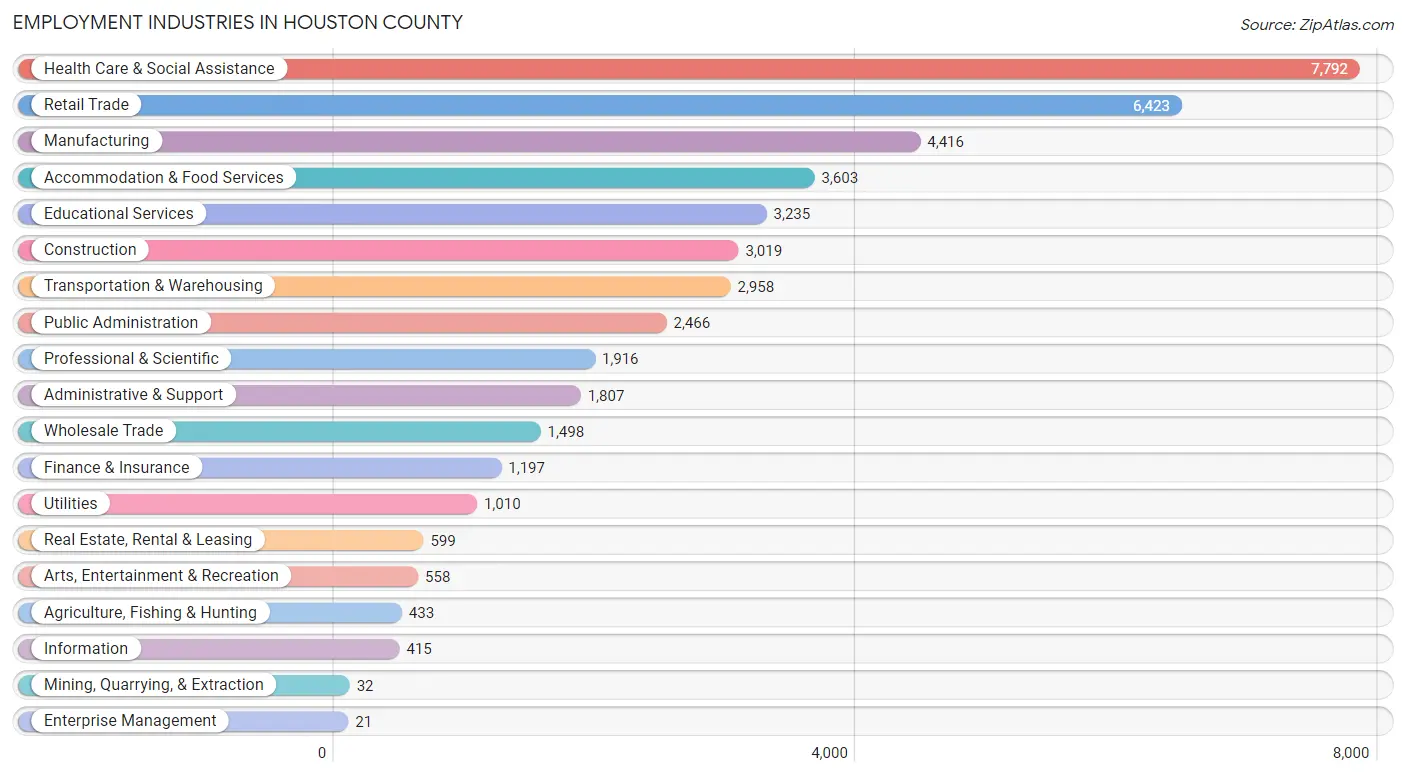
Employment Industries in Houston County
The major employment industries in Houston County include Health Care & Social Assistance (7,792 | 17.1%), Retail Trade (6,423 | 14.1%), Manufacturing (4,416 | 9.7%), Accommodation & Food Services (3,603 | 7.9%), and Educational Services (3,235 | 7.1%).
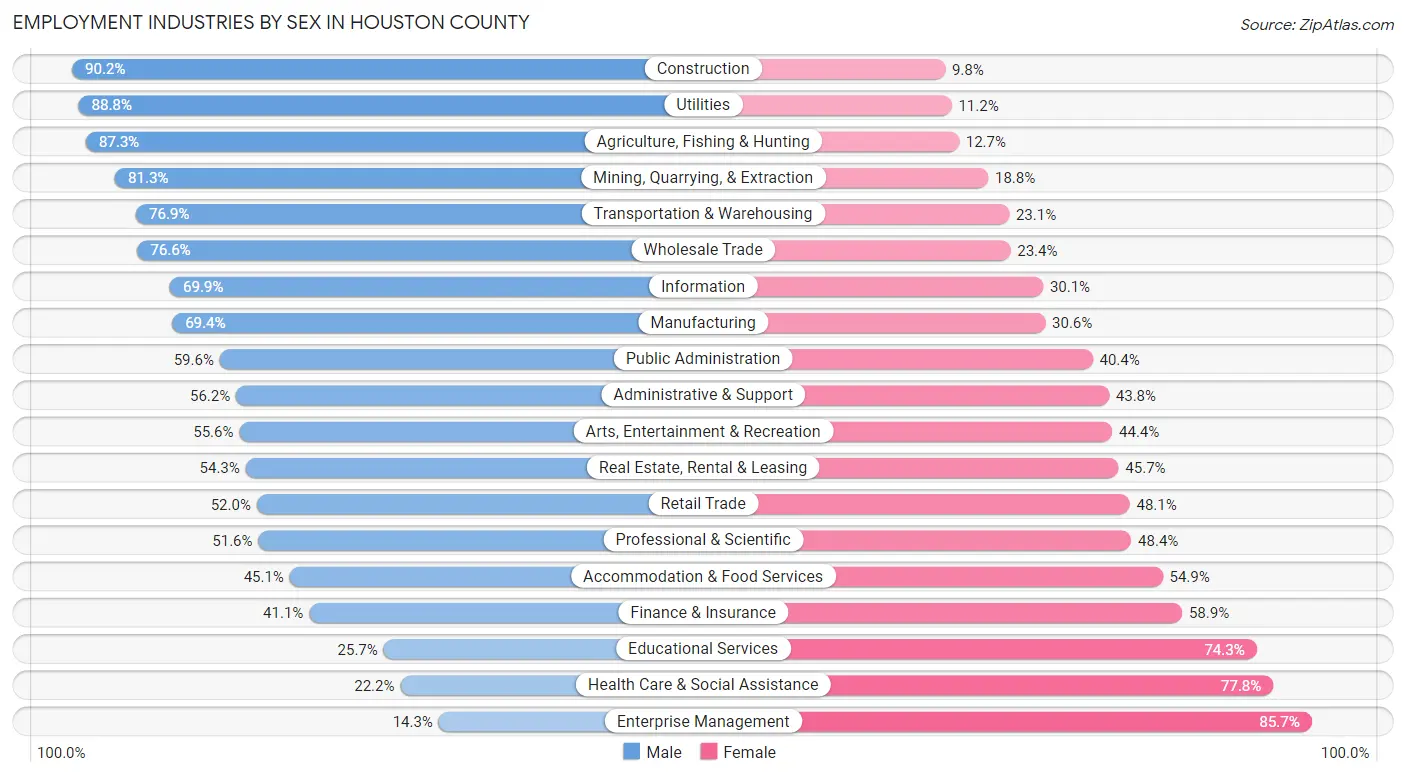
Employment Industries by Sex in Houston County
The Houston County industries that see more men than women are Construction (90.2%), Utilities (88.8%), and Agriculture, Fishing & Hunting (87.3%), whereas the industries that tend to have a higher number of women are Enterprise Management (85.7%), Health Care & Social Assistance (77.8%), and Educational Services (74.3%).
| Industry | Male | Female |
| Agriculture, Fishing & Hunting | 378 (87.3%) | 55 (12.7%) |
| Mining, Quarrying, & Extraction | 26 (81.2%) | 6 (18.8%) |
| Construction | 2,722 (90.2%) | 297 (9.8%) |
| Manufacturing | 3,066 (69.4%) | 1,350 (30.6%) |
| Wholesale Trade | 1,148 (76.6%) | 350 (23.4%) |
| Retail Trade | 3,337 (51.9%) | 3,086 (48.0%) |
| Transportation & Warehousing | 2,275 (76.9%) | 683 (23.1%) |
| Utilities | 897 (88.8%) | 113 (11.2%) |
| Information | 290 (69.9%) | 125 (30.1%) |
| Finance & Insurance | 492 (41.1%) | 705 (58.9%) |
| Real Estate, Rental & Leasing | 325 (54.3%) | 274 (45.7%) |
| Professional & Scientific | 989 (51.6%) | 927 (48.4%) |
| Enterprise Management | 3 (14.3%) | 18 (85.7%) |
| Administrative & Support | 1,016 (56.2%) | 791 (43.8%) |
| Educational Services | 831 (25.7%) | 2,404 (74.3%) |
| Health Care & Social Assistance | 1,733 (22.2%) | 6,059 (77.8%) |
| Arts, Entertainment & Recreation | 310 (55.6%) | 248 (44.4%) |
| Accommodation & Food Services | 1,626 (45.1%) | 1,977 (54.9%) |
| Public Administration | 1,470 (59.6%) | 996 (40.4%) |
| Total | 24,070 (52.7%) | 21,638 (47.3%) |
Education in Houston County
School Enrollment in Houston County
The most common levels of schooling among the 24,508 students in Houston County are middle school (5,942 | 24.2%), high school (5,302 | 21.6%), and elementary school (5,127 | 20.9%).
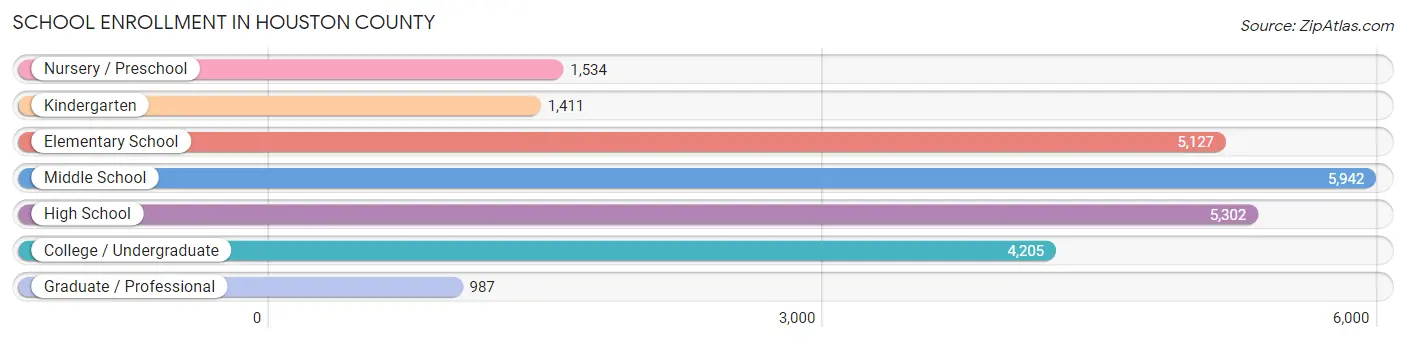
| School Level | # Students | % Students |
| Nursery / Preschool | 1,534 | 6.3% |
| Kindergarten | 1,411 | 5.8% |
| Elementary School | 5,127 | 20.9% |
| Middle School | 5,942 | 24.2% |
| High School | 5,302 | 21.6% |
| College / Undergraduate | 4,205 | 17.2% |
| Graduate / Professional | 987 | 4.0% |
| Total | 24,508 | 100.0% |
School Enrollment by Age by Funding Source in Houston County
Out of a total of 24,508 students who are enrolled in schools in Houston County, 5,147 (21.0%) attend a private institution, while the remaining 19,361 (79.0%) are enrolled in public schools. The age group of 35 years and over has the highest likelihood of being enrolled in private schools, with 380 (32.8% in the age bracket) enrolled. Conversely, the age group of 5 to 9 year old has the lowest likelihood of being enrolled in a private school, with 5,056 (85.0% in the age bracket) attending a public institution.
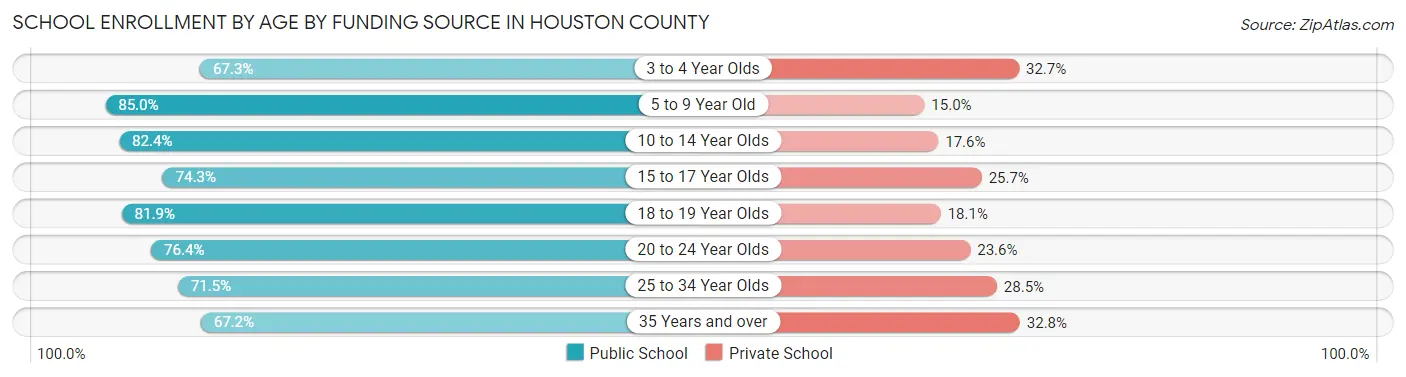
| Age Bracket | Public School | Private School |
| 3 to 4 Year Olds | 884 (67.3%) | 429 (32.7%) |
| 5 to 9 Year Old | 5,056 (85.0%) | 895 (15.0%) |
| 10 to 14 Year Olds | 5,883 (82.4%) | 1,258 (17.6%) |
| 15 to 17 Year Olds | 3,097 (74.3%) | 1,072 (25.7%) |
| 18 to 19 Year Olds | 1,332 (81.9%) | 294 (18.1%) |
| 20 to 24 Year Olds | 1,355 (76.4%) | 418 (23.6%) |
| 25 to 34 Year Olds | 984 (71.5%) | 393 (28.5%) |
| 35 Years and over | 778 (67.2%) | 380 (32.8%) |
| Total | 19,361 (79.0%) | 5,147 (21.0%) |
Educational Attainment by Field of Study in Houston County
Business (4,132 | 22.9%), education (2,913 | 16.1%), science & technology (2,066 | 11.4%), arts & humanities (1,641 | 9.1%), and bio, nature & agricultural (1,171 | 6.5%) are the most common fields of study among 18,065 individuals in Houston County who have obtained a bachelor's degree or higher.
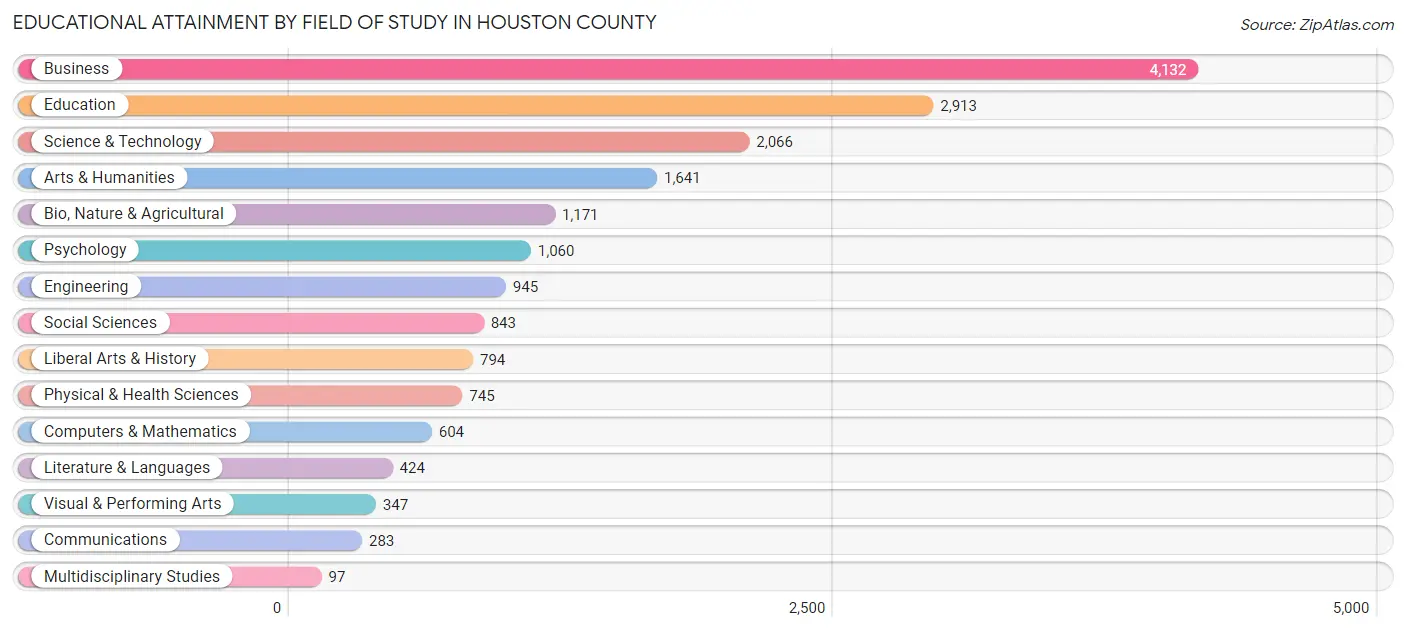
| Field of Study | # Graduates | % Graduates |
| Computers & Mathematics | 604 | 3.3% |
| Bio, Nature & Agricultural | 1,171 | 6.5% |
| Physical & Health Sciences | 745 | 4.1% |
| Psychology | 1,060 | 5.9% |
| Social Sciences | 843 | 4.7% |
| Engineering | 945 | 5.2% |
| Multidisciplinary Studies | 97 | 0.5% |
| Science & Technology | 2,066 | 11.4% |
| Business | 4,132 | 22.9% |
| Education | 2,913 | 16.1% |
| Literature & Languages | 424 | 2.4% |
| Liberal Arts & History | 794 | 4.4% |
| Visual & Performing Arts | 347 | 1.9% |
| Communications | 283 | 1.6% |
| Arts & Humanities | 1,641 | 9.1% |
| Total | 18,065 | 100.0% |
Transportation & Commute in Houston County
Vehicle Availability by Sex in Houston County
The most prevalent vehicle ownership categories in Houston County are males with 2 vehicles (10,834, accounting for 45.0%) and females with 2 vehicles (8,396, making up 50.9%).
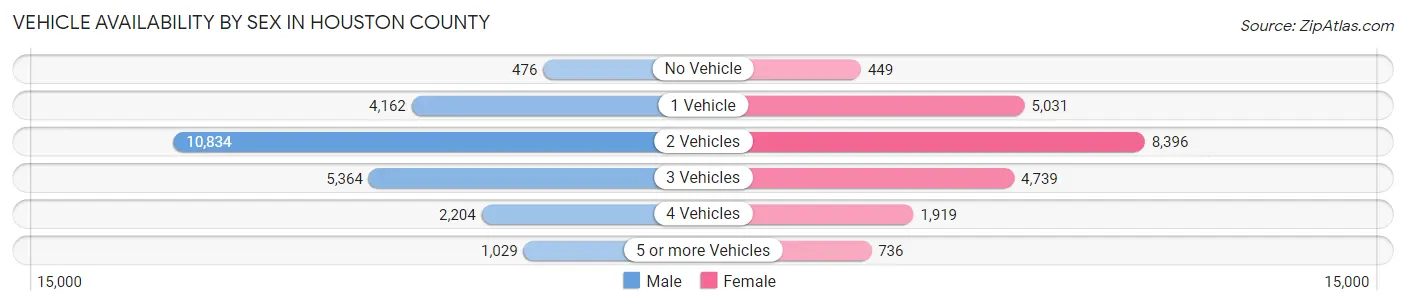
| Vehicles Available | Male | Female |
| No Vehicle | 476 (2.0%) | 449 (2.1%) |
| 1 Vehicle | 4,162 (17.3%) | 5,031 (23.6%) |
| 2 Vehicles | 10,834 (45.0%) | 8,396 (39.5%) |
| 3 Vehicles | 5,364 (22.3%) | 4,739 (22.3%) |
| 4 Vehicles | 2,204 (9.2%) | 1,919 (9.0%) |
| 5 or more Vehicles | 1,029 (4.3%) | 736 (3.5%) |
| Total | 24,069 (100.0%) | 21,270 (100.0%) |
Commute Time in Houston County
The most frequently occuring commute durations in Houston County are 15 to 19 minutes (9,231 commuters, 21.2%), 20 to 24 minutes (7,340 commuters, 16.9%), and 10 to 14 minutes (7,101 commuters, 16.4%).
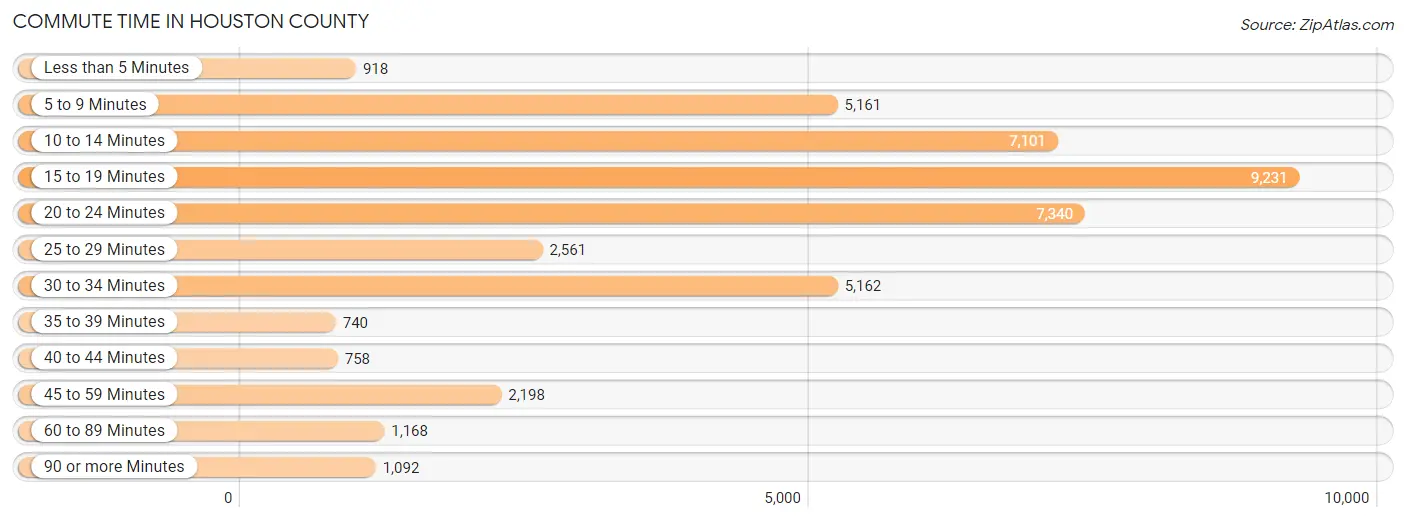
| Commute Time | # Commuters | % Commuters |
| Less than 5 Minutes | 918 | 2.1% |
| 5 to 9 Minutes | 5,161 | 11.9% |
| 10 to 14 Minutes | 7,101 | 16.4% |
| 15 to 19 Minutes | 9,231 | 21.2% |
| 20 to 24 Minutes | 7,340 | 16.9% |
| 25 to 29 Minutes | 2,561 | 5.9% |
| 30 to 34 Minutes | 5,162 | 11.9% |
| 35 to 39 Minutes | 740 | 1.7% |
| 40 to 44 Minutes | 758 | 1.8% |
| 45 to 59 Minutes | 2,198 | 5.1% |
| 60 to 89 Minutes | 1,168 | 2.7% |
| 90 or more Minutes | 1,092 | 2.5% |
Commute Time by Sex in Houston County
The most common commute times in Houston County are 15 to 19 minutes (4,491 commuters, 19.4%) for males and 15 to 19 minutes (4,740 commuters, 23.3%) for females.
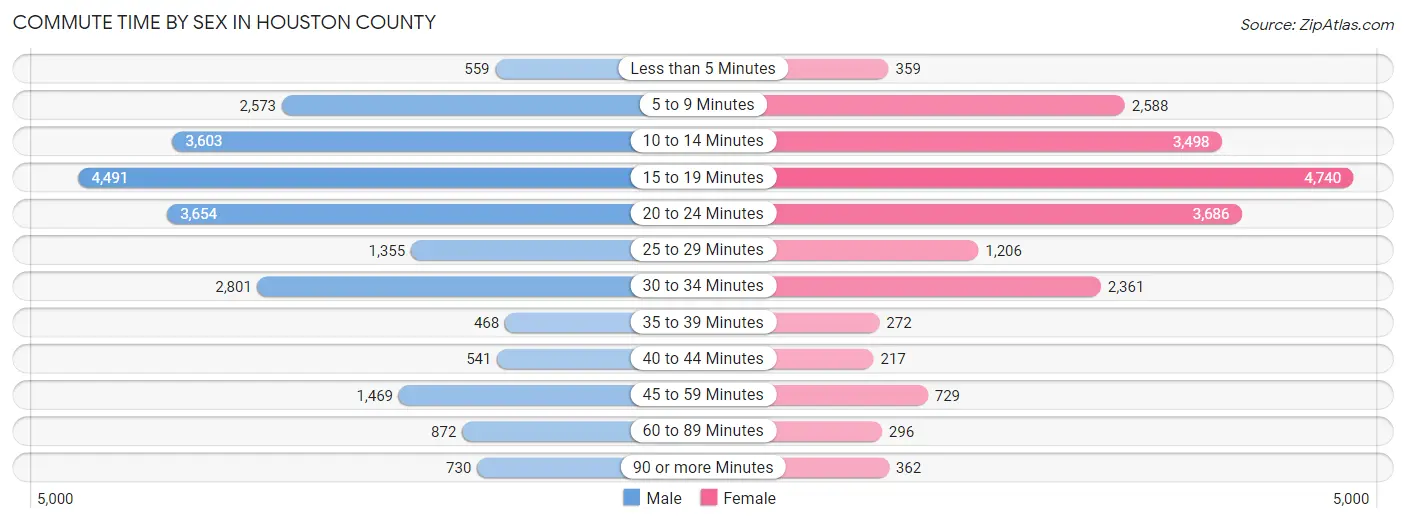
| Commute Time | Male | Female |
| Less than 5 Minutes | 559 (2.4%) | 359 (1.8%) |
| 5 to 9 Minutes | 2,573 (11.1%) | 2,588 (12.7%) |
| 10 to 14 Minutes | 3,603 (15.6%) | 3,498 (17.2%) |
| 15 to 19 Minutes | 4,491 (19.4%) | 4,740 (23.3%) |
| 20 to 24 Minutes | 3,654 (15.8%) | 3,686 (18.1%) |
| 25 to 29 Minutes | 1,355 (5.9%) | 1,206 (5.9%) |
| 30 to 34 Minutes | 2,801 (12.1%) | 2,361 (11.6%) |
| 35 to 39 Minutes | 468 (2.0%) | 272 (1.3%) |
| 40 to 44 Minutes | 541 (2.3%) | 217 (1.1%) |
| 45 to 59 Minutes | 1,469 (6.4%) | 729 (3.6%) |
| 60 to 89 Minutes | 872 (3.8%) | 296 (1.5%) |
| 90 or more Minutes | 730 (3.2%) | 362 (1.8%) |
Time of Departure to Work by Sex in Houston County
The most frequent times of departure to work in Houston County are 7:00 AM to 7:29 AM (3,499, 15.1%) for males and 7:00 AM to 7:29 AM (4,072, 20.1%) for females.
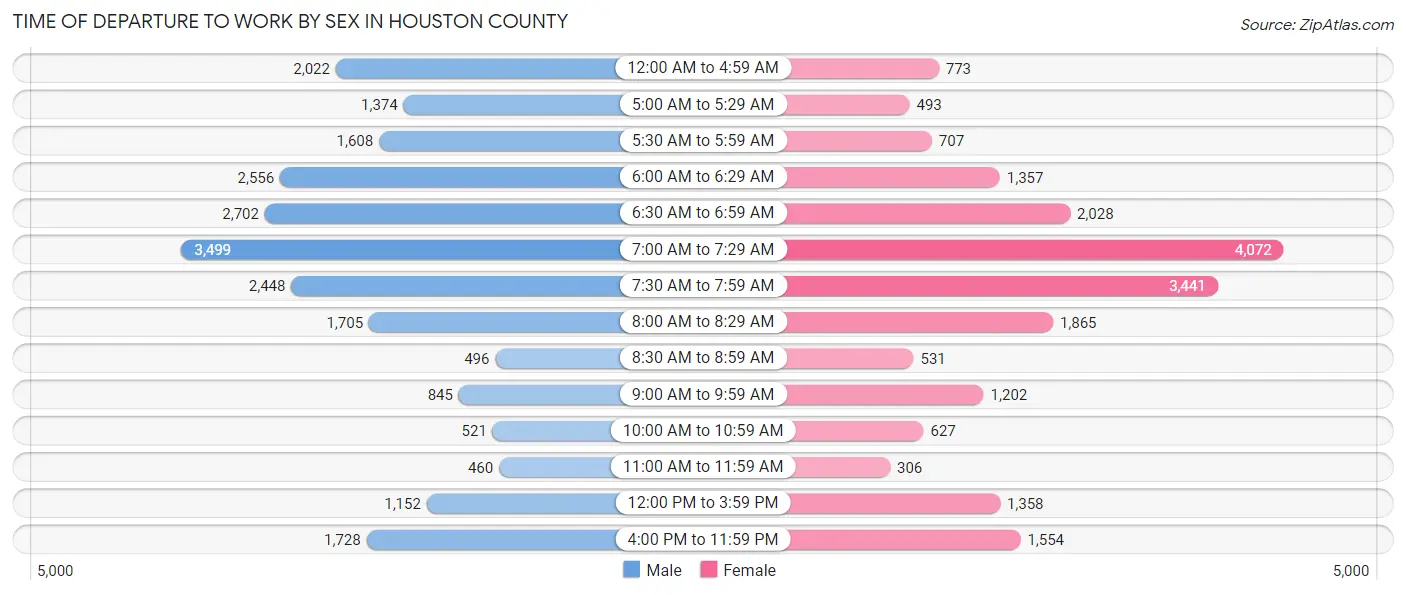
| Time of Departure | Male | Female |
| 12:00 AM to 4:59 AM | 2,022 (8.7%) | 773 (3.8%) |
| 5:00 AM to 5:29 AM | 1,374 (5.9%) | 493 (2.4%) |
| 5:30 AM to 5:59 AM | 1,608 (7.0%) | 707 (3.5%) |
| 6:00 AM to 6:29 AM | 2,556 (11.1%) | 1,357 (6.7%) |
| 6:30 AM to 6:59 AM | 2,702 (11.7%) | 2,028 (10.0%) |
| 7:00 AM to 7:29 AM | 3,499 (15.1%) | 4,072 (20.1%) |
| 7:30 AM to 7:59 AM | 2,448 (10.6%) | 3,441 (16.9%) |
| 8:00 AM to 8:29 AM | 1,705 (7.4%) | 1,865 (9.2%) |
| 8:30 AM to 8:59 AM | 496 (2.1%) | 531 (2.6%) |
| 9:00 AM to 9:59 AM | 845 (3.7%) | 1,202 (5.9%) |
| 10:00 AM to 10:59 AM | 521 (2.2%) | 627 (3.1%) |
| 11:00 AM to 11:59 AM | 460 (2.0%) | 306 (1.5%) |
| 12:00 PM to 3:59 PM | 1,152 (5.0%) | 1,358 (6.7%) |
| 4:00 PM to 11:59 PM | 1,728 (7.5%) | 1,554 (7.6%) |
| Total | 23,116 (100.0%) | 20,314 (100.0%) |
Housing Occupancy in Houston County
Occupancy by Ownership in Houston County
Of the total 41,543 dwellings in Houston County, owner-occupied units account for 27,196 (65.5%), while renter-occupied units make up 14,347 (34.5%).
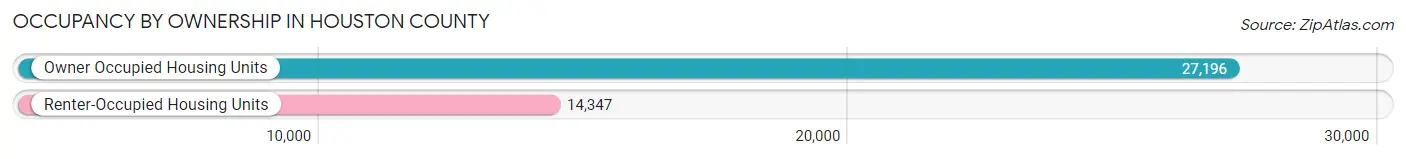
| Occupancy | # Housing Units | % Housing Units |
| Owner Occupied Housing Units | 27,196 | 65.5% |
| Renter-Occupied Housing Units | 14,347 | 34.5% |
| Total Occupied Housing Units | 41,543 | 100.0% |
Occupancy by Household Size in Houston County
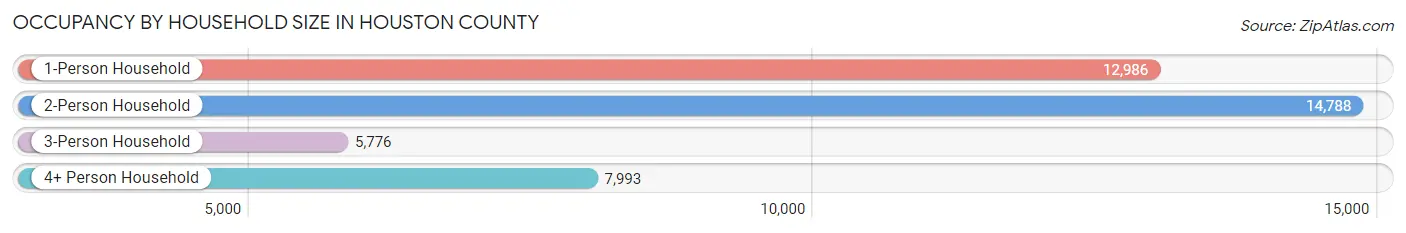
| Household Size | # Housing Units | % Housing Units |
| 1-Person Household | 12,986 | 31.3% |
| 2-Person Household | 14,788 | 35.6% |
| 3-Person Household | 5,776 | 13.9% |
| 4+ Person Household | 7,993 | 19.2% |
| Total Housing Units | 41,543 | 100.0% |
Occupancy by Ownership by Household Size in Houston County
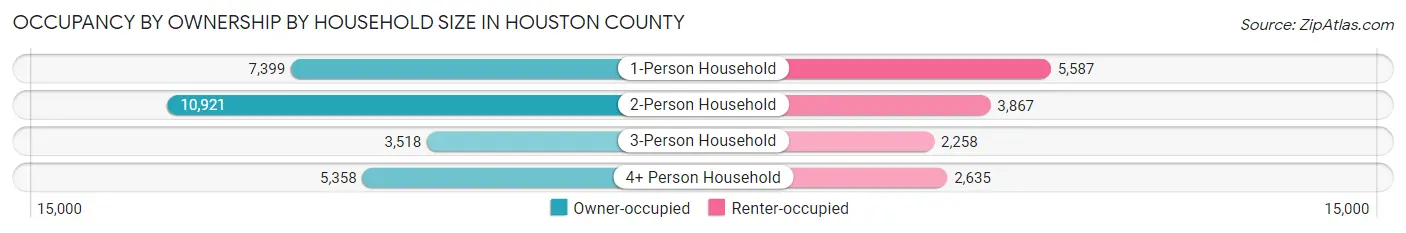
| Household Size | Owner-occupied | Renter-occupied |
| 1-Person Household | 7,399 (57.0%) | 5,587 (43.0%) |
| 2-Person Household | 10,921 (73.9%) | 3,867 (26.2%) |
| 3-Person Household | 3,518 (60.9%) | 2,258 (39.1%) |
| 4+ Person Household | 5,358 (67.0%) | 2,635 (33.0%) |
| Total Housing Units | 27,196 (65.5%) | 14,347 (34.5%) |
Occupancy by Educational Attainment in Houston County
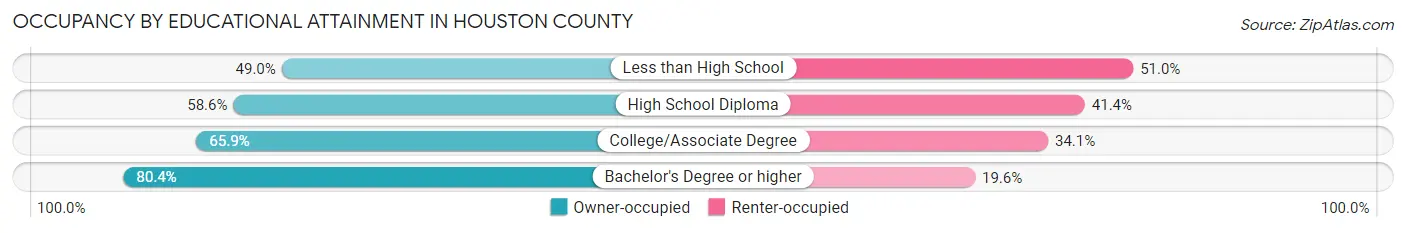
| Household Size | Owner-occupied | Renter-occupied |
| Less than High School | 2,289 (49.0%) | 2,379 (51.0%) |
| High School Diploma | 7,071 (58.6%) | 4,992 (41.4%) |
| College/Associate Degree | 9,626 (65.9%) | 4,975 (34.1%) |
| Bachelor's Degree or higher | 8,210 (80.4%) | 2,001 (19.6%) |
Occupancy by Age of Householder in Houston County
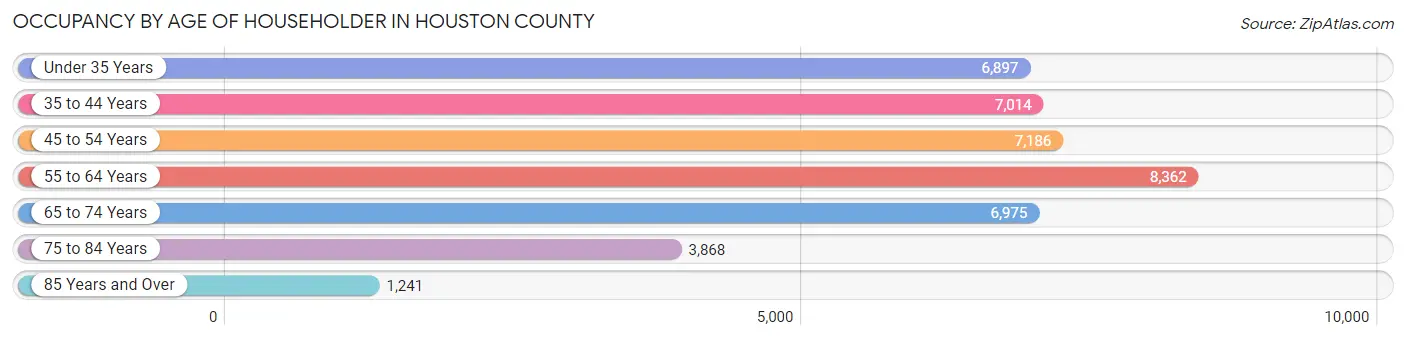
| Age Bracket | # Households | % Households |
| Under 35 Years | 6,897 | 16.6% |
| 35 to 44 Years | 7,014 | 16.9% |
| 45 to 54 Years | 7,186 | 17.3% |
| 55 to 64 Years | 8,362 | 20.1% |
| 65 to 74 Years | 6,975 | 16.8% |
| 75 to 84 Years | 3,868 | 9.3% |
| 85 Years and Over | 1,241 | 3.0% |
| Total | 41,543 | 100.0% |
Housing Finances in Houston County
Median Income by Occupancy in Houston County
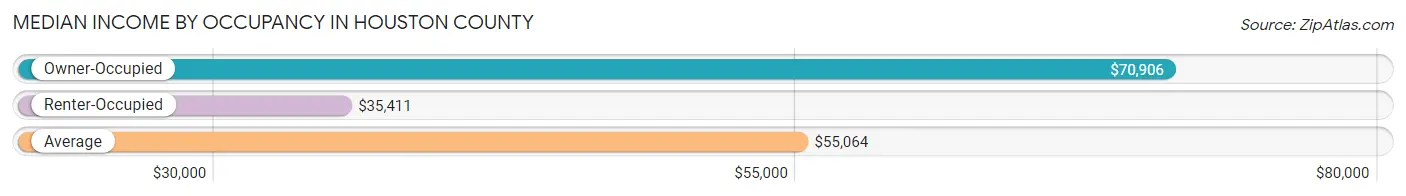
| Occupancy Type | # Households | Median Income |
| Owner-Occupied | 27,196 (65.5%) | $70,906 |
| Renter-Occupied | 14,347 (34.5%) | $35,411 |
| Average | 41,543 (100.0%) | $55,064 |
Occupancy by Householder Income Bracket in Houston County
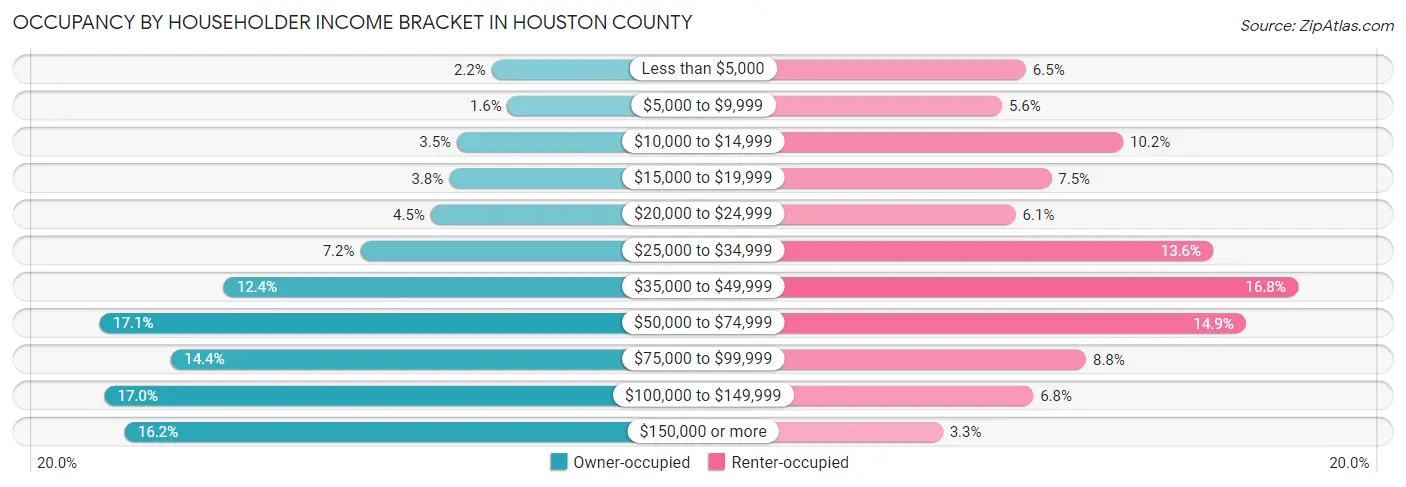
| Income Bracket | Owner-occupied | Renter-occupied |
| Less than $5,000 | 602 (2.2%) | 931 (6.5%) |
| $5,000 to $9,999 | 435 (1.6%) | 800 (5.6%) |
| $10,000 to $14,999 | 960 (3.5%) | 1,462 (10.2%) |
| $15,000 to $19,999 | 1,041 (3.8%) | 1,070 (7.5%) |
| $20,000 to $24,999 | 1,233 (4.5%) | 875 (6.1%) |
| $25,000 to $34,999 | 1,962 (7.2%) | 1,953 (13.6%) |
| $35,000 to $49,999 | 3,374 (12.4%) | 2,416 (16.8%) |
| $50,000 to $74,999 | 4,657 (17.1%) | 2,132 (14.9%) |
| $75,000 to $99,999 | 3,920 (14.4%) | 1,260 (8.8%) |
| $100,000 to $149,999 | 4,611 (17.0%) | 971 (6.8%) |
| $150,000 or more | 4,401 (16.2%) | 477 (3.3%) |
| Total | 27,196 (100.0%) | 14,347 (100.0%) |
Monthly Housing Cost Tiers in Houston County
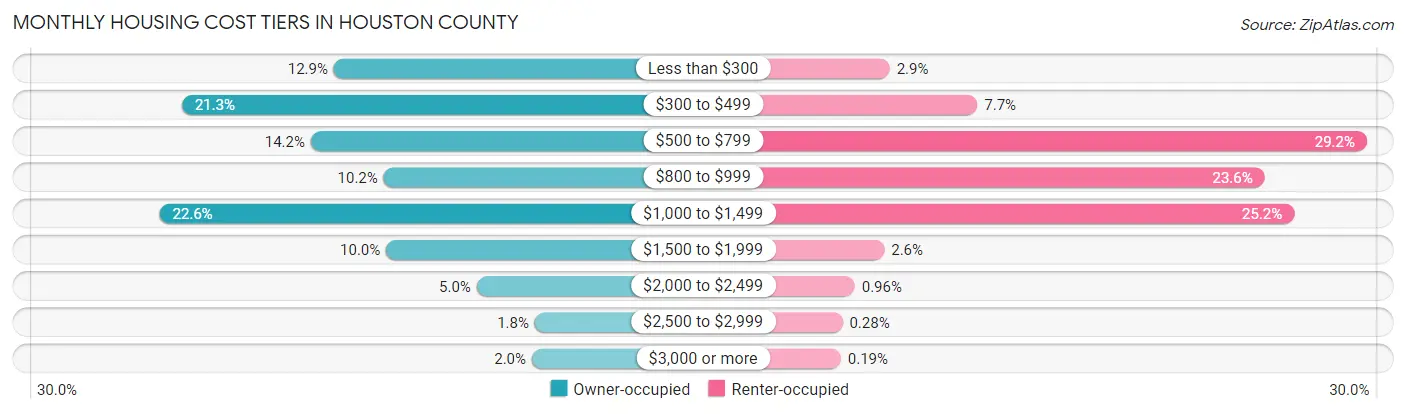
| Monthly Cost | Owner-occupied | Renter-occupied |
| Less than $300 | 3,515 (12.9%) | 415 (2.9%) |
| $300 to $499 | 5,797 (21.3%) | 1,109 (7.7%) |
| $500 to $799 | 3,858 (14.2%) | 4,195 (29.2%) |
| $800 to $999 | 2,766 (10.2%) | 3,385 (23.6%) |
| $1,000 to $1,499 | 6,132 (22.6%) | 3,618 (25.2%) |
| $1,500 to $1,999 | 2,729 (10.0%) | 372 (2.6%) |
| $2,000 to $2,499 | 1,367 (5.0%) | 138 (1.0%) |
| $2,500 to $2,999 | 494 (1.8%) | 40 (0.3%) |
| $3,000 or more | 538 (2.0%) | 27 (0.2%) |
| Total | 27,196 (100.0%) | 14,347 (100.0%) |
Physical Housing Characteristics in Houston County
Housing Structures in Houston County
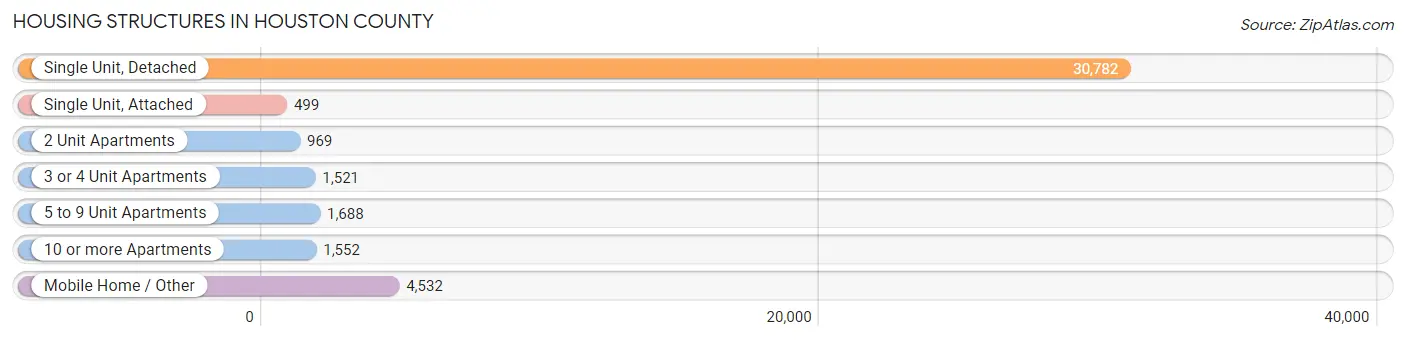
| Structure Type | # Housing Units | % Housing Units |
| Single Unit, Detached | 30,782 | 74.1% |
| Single Unit, Attached | 499 | 1.2% |
| 2 Unit Apartments | 969 | 2.3% |
| 3 or 4 Unit Apartments | 1,521 | 3.7% |
| 5 to 9 Unit Apartments | 1,688 | 4.1% |
| 10 or more Apartments | 1,552 | 3.7% |
| Mobile Home / Other | 4,532 | 10.9% |
| Total | 41,543 | 100.0% |
Housing Structures by Occupancy in Houston County
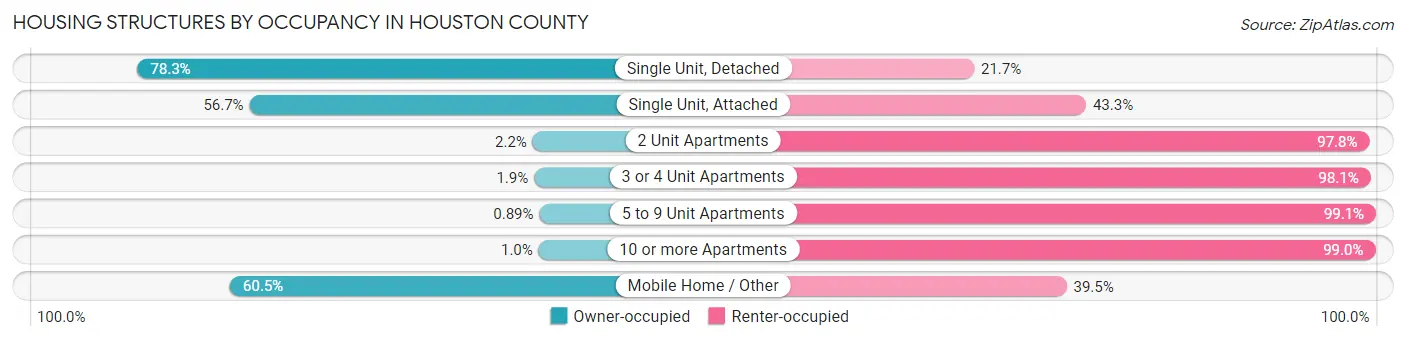
| Structure Type | Owner-occupied | Renter-occupied |
| Single Unit, Detached | 24,092 (78.3%) | 6,690 (21.7%) |
| Single Unit, Attached | 283 (56.7%) | 216 (43.3%) |
| 2 Unit Apartments | 21 (2.2%) | 948 (97.8%) |
| 3 or 4 Unit Apartments | 29 (1.9%) | 1,492 (98.1%) |
| 5 to 9 Unit Apartments | 15 (0.9%) | 1,673 (99.1%) |
| 10 or more Apartments | 16 (1.0%) | 1,536 (99.0%) |
| Mobile Home / Other | 2,740 (60.5%) | 1,792 (39.5%) |
| Total | 27,196 (65.5%) | 14,347 (34.5%) |
Housing Structures by Number of Rooms in Houston County
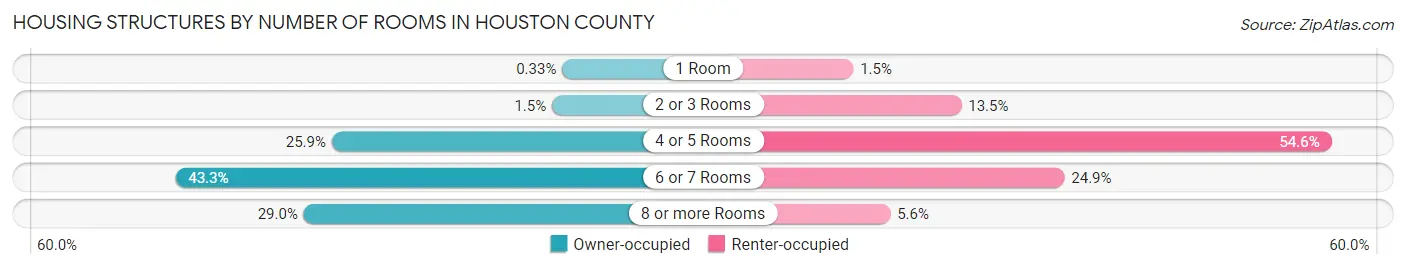
| Number of Rooms | Owner-occupied | Renter-occupied |
| 1 Room | 91 (0.3%) | 213 (1.5%) |
| 2 or 3 Rooms | 398 (1.5%) | 1,933 (13.5%) |
| 4 or 5 Rooms | 7,047 (25.9%) | 7,827 (54.5%) |
| 6 or 7 Rooms | 11,767 (43.3%) | 3,574 (24.9%) |
| 8 or more Rooms | 7,893 (29.0%) | 800 (5.6%) |
| Total | 27,196 (100.0%) | 14,347 (100.0%) |
Housing Structure by Heating Type in Houston County
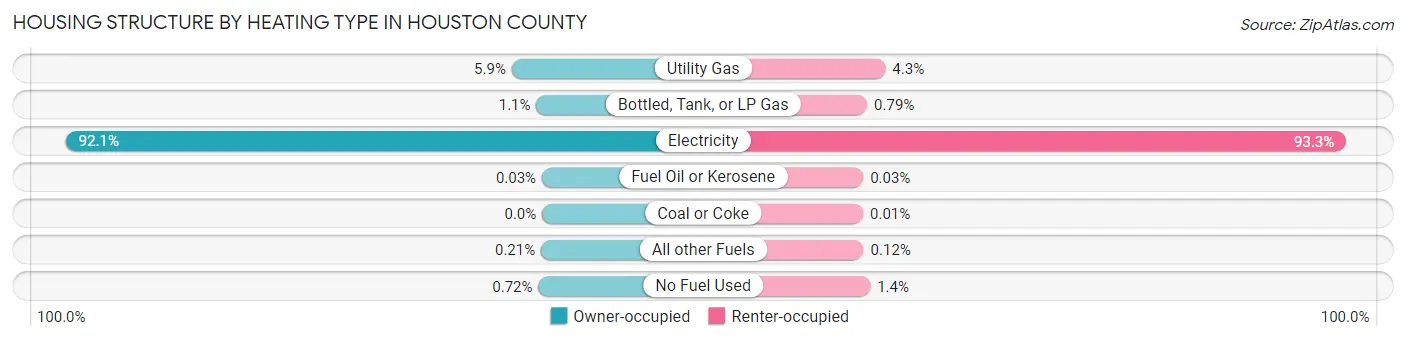
| Heating Type | Owner-occupied | Renter-occupied |
| Utility Gas | 1,597 (5.9%) | 620 (4.3%) |
| Bottled, Tank, or LP Gas | 302 (1.1%) | 114 (0.8%) |
| Electricity | 25,039 (92.1%) | 13,391 (93.3%) |
| Fuel Oil or Kerosene | 7 (0.0%) | 4 (0.0%) |
| Coal or Coke | 0 (0.0%) | 2 (0.0%) |
| All other Fuels | 56 (0.2%) | 17 (0.1%) |
| No Fuel Used | 195 (0.7%) | 199 (1.4%) |
| Total | 27,196 (100.0%) | 14,347 (100.0%) |
Household Vehicle Usage in Houston County
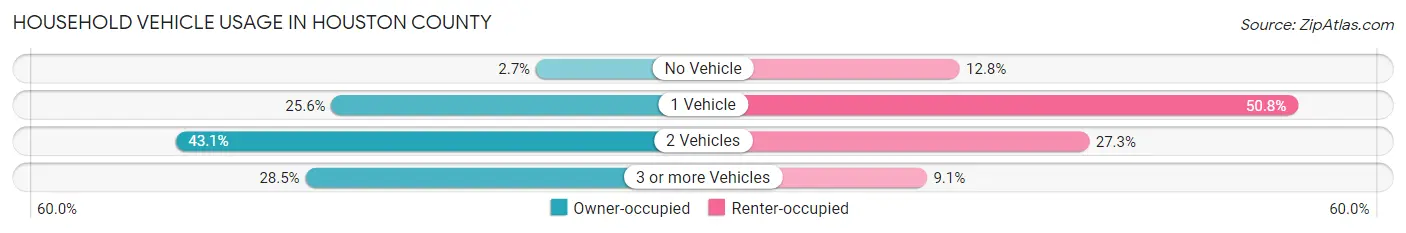
| Vehicles per Household | Owner-occupied | Renter-occupied |
| No Vehicle | 741 (2.7%) | 1,835 (12.8%) |
| 1 Vehicle | 6,971 (25.6%) | 7,282 (50.8%) |
| 2 Vehicles | 11,723 (43.1%) | 3,920 (27.3%) |
| 3 or more Vehicles | 7,761 (28.5%) | 1,310 (9.1%) |
| Total | 27,196 (100.0%) | 14,347 (100.0%) |
Real Estate & Mortgages in Houston County
Real Estate and Mortgage Overview in Houston County
| Characteristic | Without Mortgage | With Mortgage |
| Housing Units | 11,425 | 15,771 |
| Median Property Value | $137,500 | $179,600 |
| Median Household Income | $50,120 | $3,239 |
| Monthly Housing Costs | $373 | $531 |
| Real Estate Taxes | $414 | $1,744 |
Property Value by Mortgage Status in Houston County
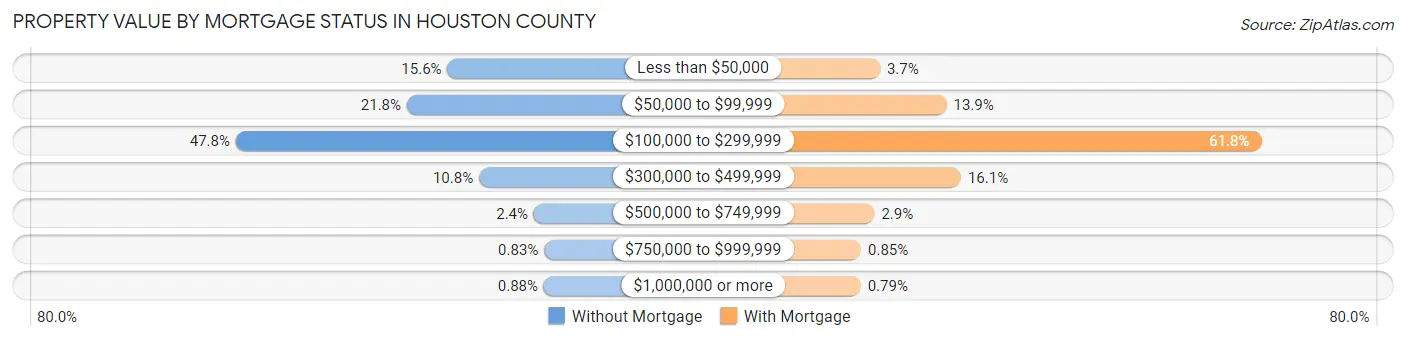
| Property Value | Without Mortgage | With Mortgage |
| Less than $50,000 | 1,779 (15.6%) | 587 (3.7%) |
| $50,000 to $99,999 | 2,485 (21.7%) | 2,187 (13.9%) |
| $100,000 to $299,999 | 5,463 (47.8%) | 9,751 (61.8%) |
| $300,000 to $499,999 | 1,229 (10.8%) | 2,534 (16.1%) |
| $500,000 to $749,999 | 274 (2.4%) | 454 (2.9%) |
| $750,000 to $999,999 | 95 (0.8%) | 134 (0.9%) |
| $1,000,000 or more | 100 (0.9%) | 124 (0.8%) |
| Total | 11,425 (100.0%) | 15,771 (100.0%) |
Household Income by Mortgage Status in Houston County
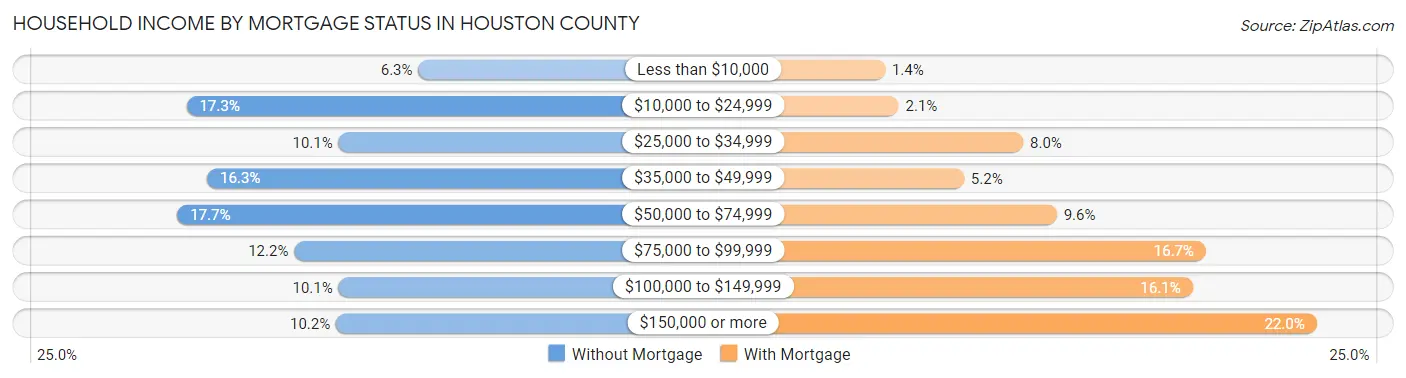
| Household Income | Without Mortgage | With Mortgage |
| Less than $10,000 | 714 (6.2%) | 221 (1.4%) |
| $10,000 to $24,999 | 1,975 (17.3%) | 323 (2.1%) |
| $25,000 to $34,999 | 1,148 (10.1%) | 1,259 (8.0%) |
| $35,000 to $49,999 | 1,863 (16.3%) | 814 (5.2%) |
| $50,000 to $74,999 | 2,026 (17.7%) | 1,511 (9.6%) |
| $75,000 to $99,999 | 1,389 (12.2%) | 2,631 (16.7%) |
| $100,000 to $149,999 | 1,148 (10.1%) | 2,531 (16.1%) |
| $150,000 or more | 1,162 (10.2%) | 3,463 (22.0%) |
| Total | 11,425 (100.0%) | 15,771 (100.0%) |
Property Value to Household Income Ratio in Houston County
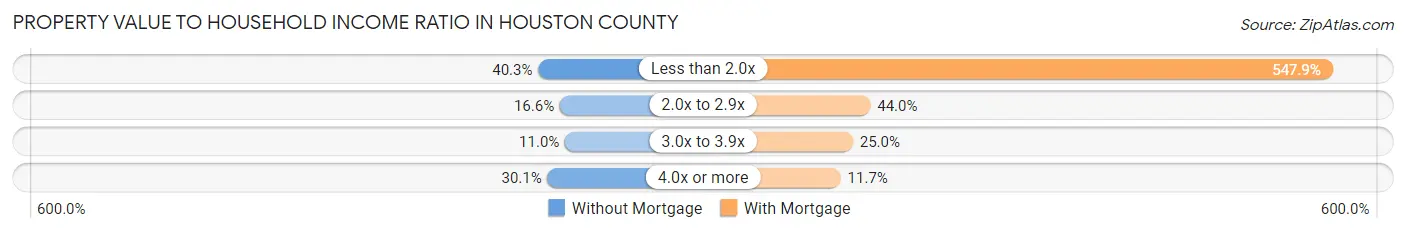
| Value-to-Income Ratio | Without Mortgage | With Mortgage |
| Less than 2.0x | 4,599 (40.3%) | 86,404 (547.9%) |
| 2.0x to 2.9x | 1,899 (16.6%) | 6,941 (44.0%) |
| 3.0x to 3.9x | 1,254 (11.0%) | 3,935 (24.9%) |
| 4.0x or more | 3,441 (30.1%) | 1,847 (11.7%) |
| Total | 11,425 (100.0%) | 15,771 (100.0%) |
Real Estate Taxes by Mortgage Status in Houston County
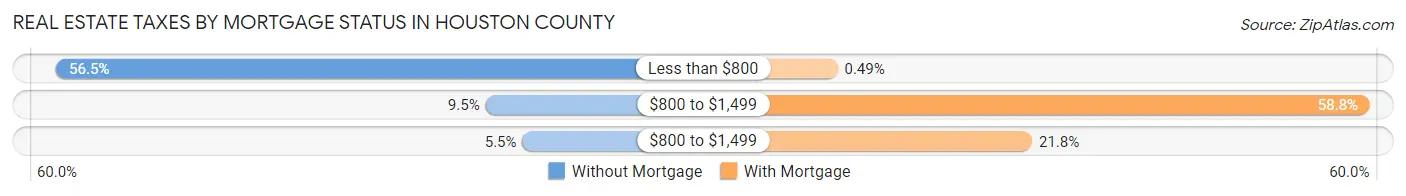
| Property Taxes | Without Mortgage | With Mortgage |
| Less than $800 | 6,460 (56.5%) | 78 (0.5%) |
| $800 to $1,499 | 1,084 (9.5%) | 9,278 (58.8%) |
| $800 to $1,499 | 623 (5.4%) | 3,440 (21.8%) |
| Total | 11,425 (100.0%) | 15,771 (100.0%) |
Health & Disability in Houston County
Health Insurance Coverage by Age in Houston County
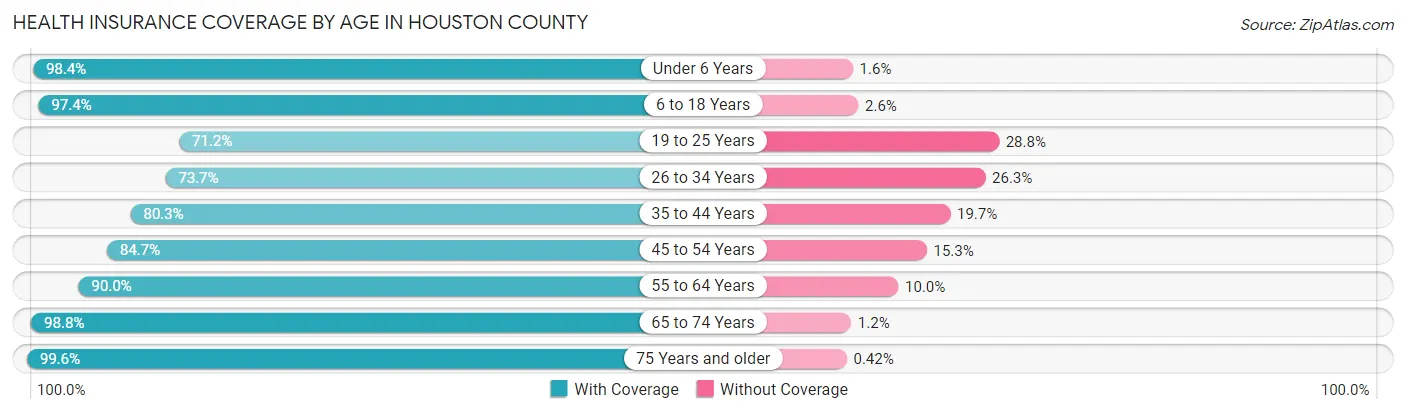
| Age Bracket | With Coverage | Without Coverage |
| Under 6 Years | 7,703 (98.4%) | 122 (1.6%) |
| 6 to 18 Years | 17,366 (97.4%) | 460 (2.6%) |
| 19 to 25 Years | 6,115 (71.2%) | 2,473 (28.8%) |
| 26 to 34 Years | 8,853 (73.7%) | 3,152 (26.3%) |
| 35 to 44 Years | 10,616 (80.3%) | 2,608 (19.7%) |
| 45 to 54 Years | 11,215 (84.7%) | 2,031 (15.3%) |
| 55 to 64 Years | 12,770 (90.0%) | 1,425 (10.0%) |
| 65 to 74 Years | 11,222 (98.8%) | 140 (1.2%) |
| 75 Years and older | 7,667 (99.6%) | 32 (0.4%) |
| Total | 93,527 (88.3%) | 12,443 (11.7%) |
Health Insurance Coverage by Citizenship Status in Houston County
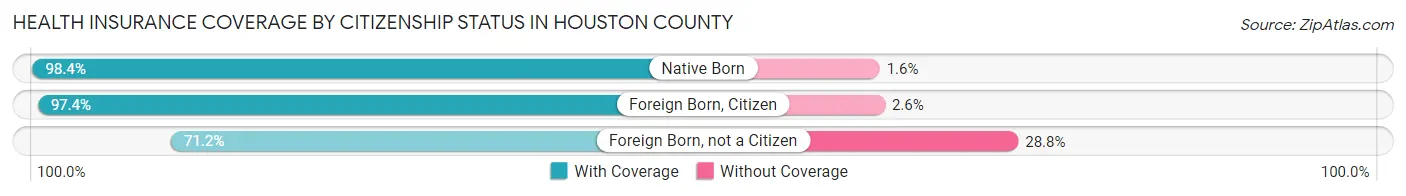
| Citizenship Status | With Coverage | Without Coverage |
| Native Born | 7,703 (98.4%) | 122 (1.6%) |
| Foreign Born, Citizen | 17,366 (97.4%) | 460 (2.6%) |
| Foreign Born, not a Citizen | 6,115 (71.2%) | 2,473 (28.8%) |
Health Insurance Coverage by Household Income in Houston County
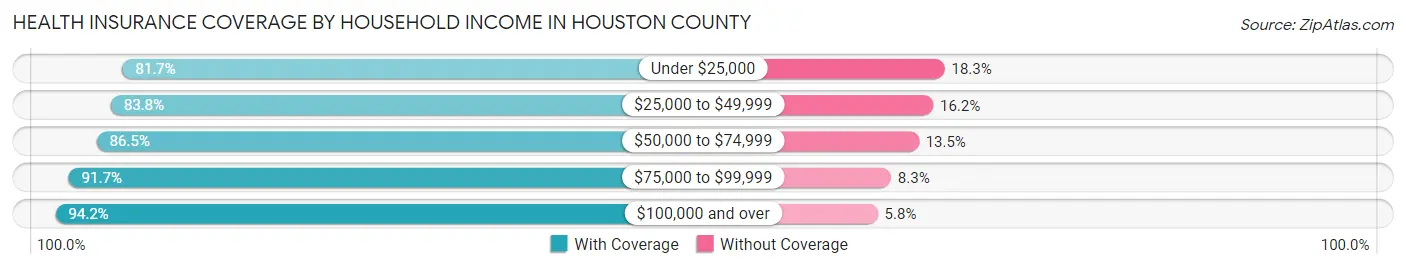
| Household Income | With Coverage | Without Coverage |
| Under $25,000 | 15,206 (81.7%) | 3,410 (18.3%) |
| $25,000 to $49,999 | 17,794 (83.8%) | 3,431 (16.2%) |
| $50,000 to $74,999 | 15,331 (86.5%) | 2,387 (13.5%) |
| $75,000 to $99,999 | 13,629 (91.7%) | 1,227 (8.3%) |
| $100,000 and over | 31,306 (94.2%) | 1,919 (5.8%) |
Public vs Private Health Insurance Coverage by Age in Houston County
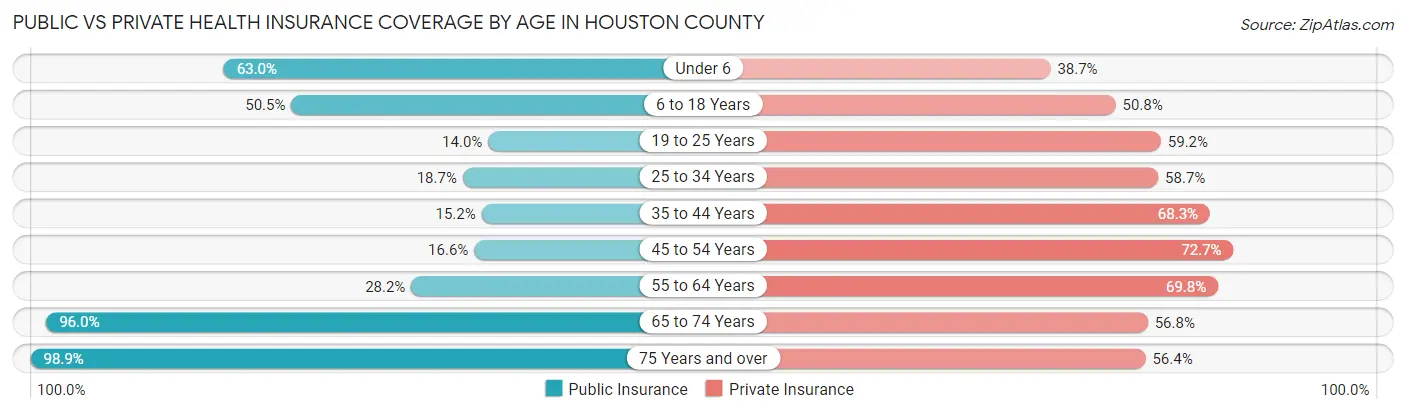
| Age Bracket | Public Insurance | Private Insurance |
| Under 6 | 4,933 (63.0%) | 3,031 (38.7%) |
| 6 to 18 Years | 9,003 (50.5%) | 9,058 (50.8%) |
| 19 to 25 Years | 1,199 (14.0%) | 5,086 (59.2%) |
| 25 to 34 Years | 2,243 (18.7%) | 7,049 (58.7%) |
| 35 to 44 Years | 2,008 (15.2%) | 9,034 (68.3%) |
| 45 to 54 Years | 2,194 (16.6%) | 9,628 (72.7%) |
| 55 to 64 Years | 4,009 (28.2%) | 9,912 (69.8%) |
| 65 to 74 Years | 10,905 (96.0%) | 6,452 (56.8%) |
| 75 Years and over | 7,615 (98.9%) | 4,340 (56.4%) |
| Total | 44,109 (41.6%) | 63,590 (60.0%) |
Disability Status by Sex by Age in Houston County
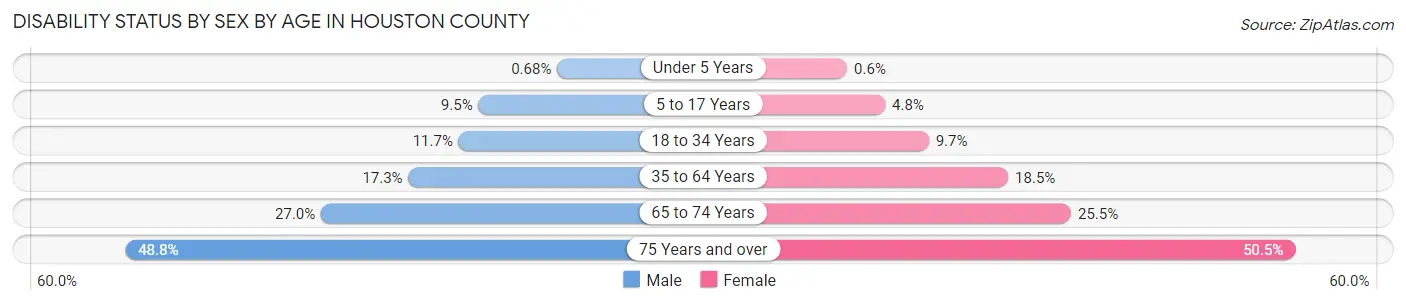
| Age Bracket | Male | Female |
| Under 5 Years | 23 (0.7%) | 19 (0.6%) |
| 5 to 17 Years | 879 (9.5%) | 410 (4.8%) |
| 18 to 34 Years | 1,224 (11.7%) | 1,098 (9.7%) |
| 35 to 64 Years | 3,338 (17.2%) | 3,950 (18.5%) |
| 65 to 74 Years | 1,421 (27.0%) | 1,556 (25.5%) |
| 75 Years and over | 1,495 (48.8%) | 2,340 (50.5%) |
Disability Class by Sex by Age in Houston County
Disability Class: Hearing Difficulty
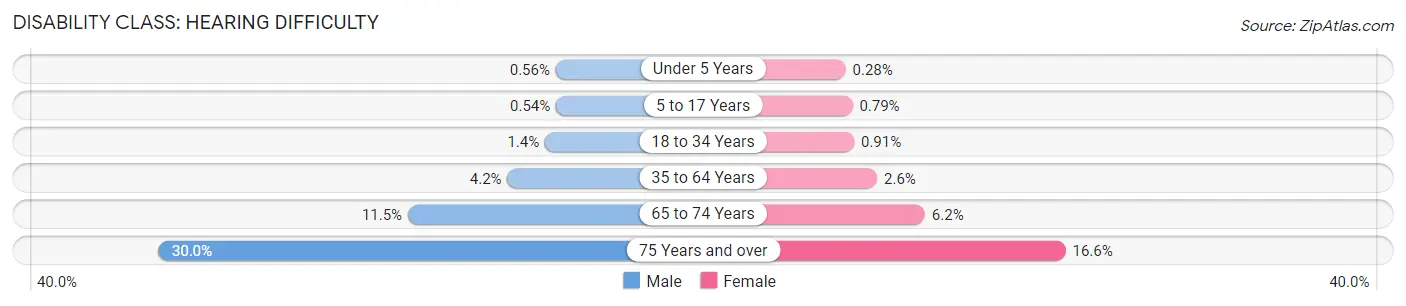
| Age Bracket | Male | Female |
| Under 5 Years | 19 (0.6%) | 9 (0.3%) |
| 5 to 17 Years | 50 (0.5%) | 67 (0.8%) |
| 18 to 34 Years | 143 (1.4%) | 103 (0.9%) |
| 35 to 64 Years | 804 (4.2%) | 558 (2.6%) |
| 65 to 74 Years | 608 (11.5%) | 376 (6.2%) |
| 75 Years and over | 920 (30.0%) | 770 (16.6%) |
Disability Class: Vision Difficulty
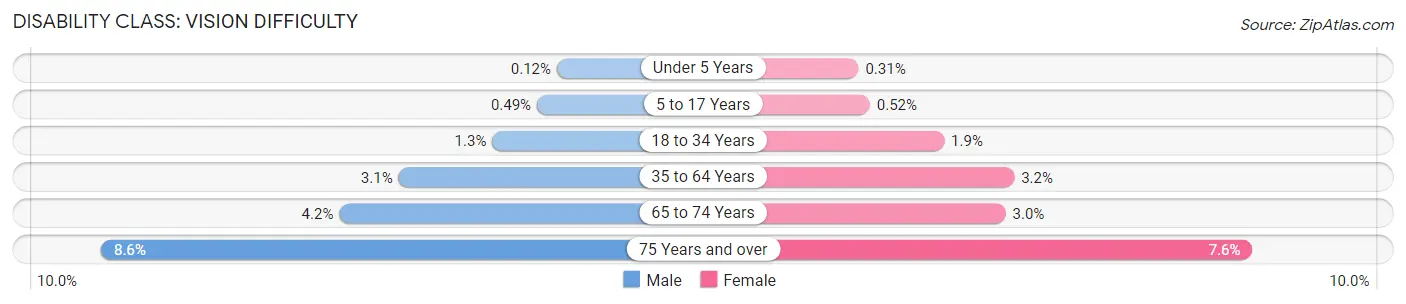
| Age Bracket | Male | Female |
| Under 5 Years | 4 (0.1%) | 10 (0.3%) |
| 5 to 17 Years | 46 (0.5%) | 44 (0.5%) |
| 18 to 34 Years | 139 (1.3%) | 215 (1.9%) |
| 35 to 64 Years | 593 (3.1%) | 681 (3.2%) |
| 65 to 74 Years | 219 (4.2%) | 185 (3.0%) |
| 75 Years and over | 263 (8.6%) | 353 (7.6%) |
Disability Class: Cognitive Difficulty
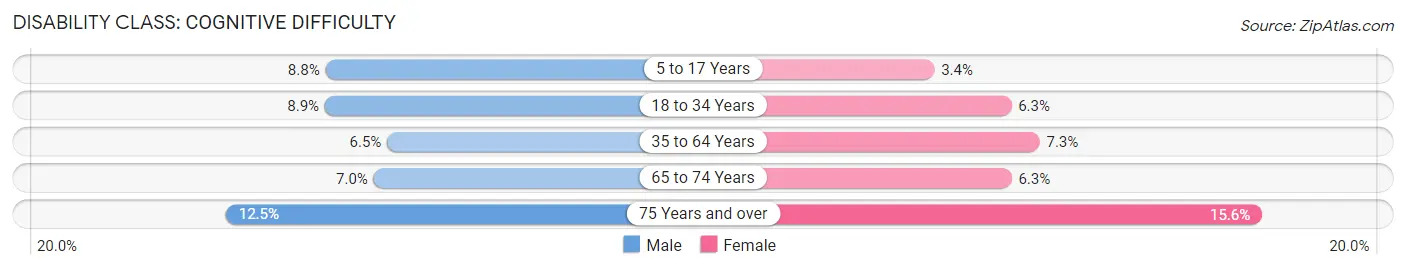
| Age Bracket | Male | Female |
| 5 to 17 Years | 821 (8.8%) | 292 (3.4%) |
| 18 to 34 Years | 930 (8.8%) | 714 (6.3%) |
| 35 to 64 Years | 1,265 (6.5%) | 1,564 (7.3%) |
| 65 to 74 Years | 371 (7.0%) | 384 (6.3%) |
| 75 Years and over | 384 (12.5%) | 723 (15.6%) |
Disability Class: Ambulatory Difficulty
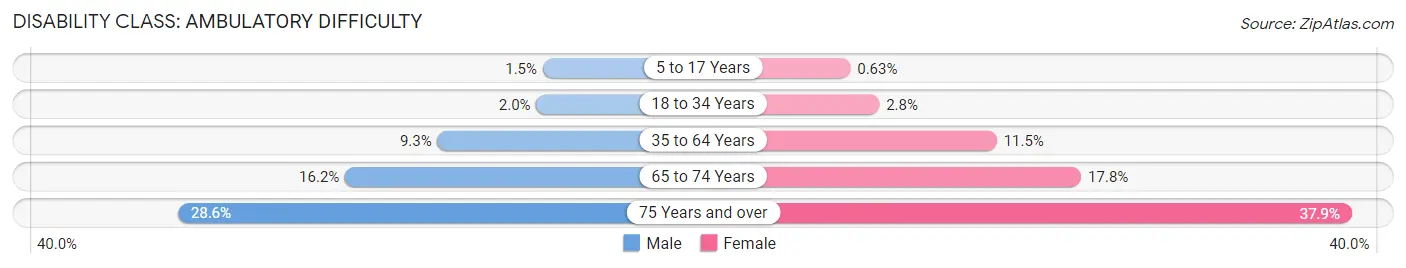
| Age Bracket | Male | Female |
| 5 to 17 Years | 141 (1.5%) | 54 (0.6%) |
| 18 to 34 Years | 210 (2.0%) | 315 (2.8%) |
| 35 to 64 Years | 1,808 (9.3%) | 2,452 (11.5%) |
| 65 to 74 Years | 853 (16.2%) | 1,083 (17.8%) |
| 75 Years and over | 877 (28.6%) | 1,755 (37.9%) |
Disability Class: Self-Care Difficulty
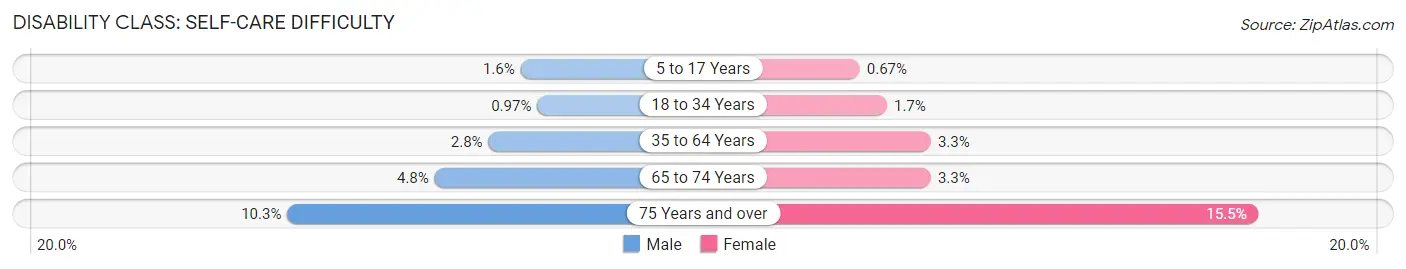
| Age Bracket | Male | Female |
| 5 to 17 Years | 148 (1.6%) | 57 (0.7%) |
| 18 to 34 Years | 102 (1.0%) | 191 (1.7%) |
| 35 to 64 Years | 538 (2.8%) | 705 (3.3%) |
| 65 to 74 Years | 252 (4.8%) | 202 (3.3%) |
| 75 Years and over | 314 (10.2%) | 717 (15.5%) |
Technology Access in Houston County
Computing Device Access in Houston County
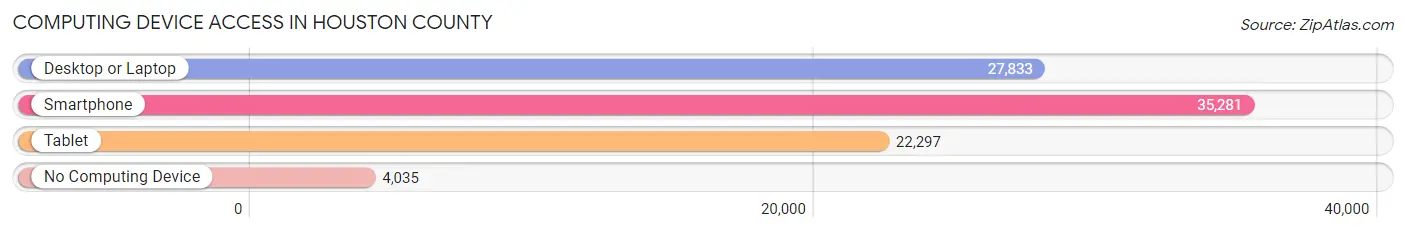
| Device Type | # Households | % Households |
| Desktop or Laptop | 27,833 | 67.0% |
| Smartphone | 35,281 | 84.9% |
| Tablet | 22,297 | 53.7% |
| No Computing Device | 4,035 | 9.7% |
| Total | 41,543 | 100.0% |
Internet Access in Houston County
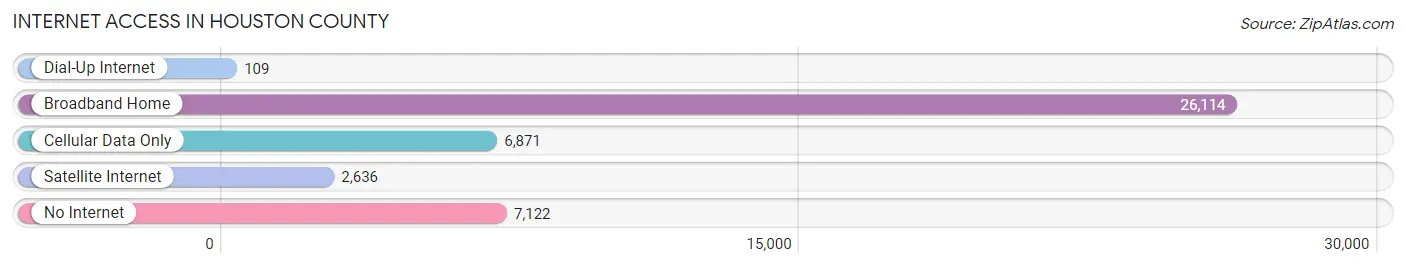
| Internet Type | # Households | % Households |
| Dial-Up Internet | 109 | 0.3% |
| Broadband Home | 26,114 | 62.9% |
| Cellular Data Only | 6,871 | 16.5% |
| Satellite Internet | 2,636 | 6.4% |
| No Internet | 7,122 | 17.1% |
| Total | 41,543 | 100.0% |
Houston County Summary
History
Houston County, Alabama is located in the southeastern corner of the state and is part of the Dothan Metropolitan Statistical Area. The county was created in 1903 from parts of Dale, Henry, and Geneva counties. It was named after George Smith Houston, who was the Governor of Alabama from 1874 to 1878.
The first settlers in the area were Native Americans, who were mostly Creek and Choctaw. The first European settlers arrived in the early 1800s, and the county was officially established in 1903.
The county has a rich history of agriculture, with cotton, peanuts, and corn being the main crops. The county also has a long history of timber production, with the first sawmill being built in the late 1800s.
The county seat is Dothan, which was founded in 1885. The city was named after the biblical city of Dothan, which was located in the region of Samaria. The city was originally a trading post and was later incorporated in 1891.
The county has a long history of military involvement, with the first military base being established in the county in 1941. Fort Rucker, which is located in the county, is the home of the United States Army Aviation Center of Excellence.
Geography
Houston County is located in the southeastern corner of Alabama and is bordered by Dale County to the north, Geneva County to the east, and Henry County to the south. The county covers an area of 545 square miles and has a population of 101,547 as of the 2010 census.
The county is mostly flat, with the highest point being located at an elevation of only 300 feet. The county is drained by the Choctawhatchee River, which flows through the county from north to south.
The county is home to several state parks, including the Houston County Lake State Park, which is located on the shores of the lake of the same name. The park offers camping, fishing, and other recreational activities.
Economy
Houston County has a diverse economy, with the largest employers being the military, healthcare, and retail. The county is home to Fort Rucker, which is the home of the United States Army Aviation Center of Excellence. The base employs over 10,000 people and is the largest employer in the county.
The county is also home to several healthcare facilities, including Southeast Alabama Medical Center, Flowers Hospital, and Southeast Alabama Medical Center. These facilities employ over 5,000 people and are the second largest employers in the county.
Retail is also a major employer in the county, with the largest employers being Walmart, Lowe’s, and Target. These companies employ over 3,000 people and are the third largest employers in the county.
Demographics
As of the 2010 census, the population of Houston County was 101,547. The population is made up of 48.3% White, 45.2% African American, 2.2% Hispanic or Latino, 1.7% Asian, 0.3% Native American, and 2.5% other.
The median household income in the county is $41,945, and the median family income is $50,945. The per capita income is $20,945. The poverty rate is 17.3%, and the unemployment rate is 5.2%.
Conclusion
Houston County, Alabama is located in the southeastern corner of the state and is part of the Dothan Metropolitan Statistical Area. The county was created in 1903 from parts of Dale, Henry, and Geneva counties and was named after George Smith Houston, who was the Governor of Alabama from 1874 to 1878. The county has a rich history of agriculture, with cotton, peanuts, and corn being the main crops. The county also has a long history of timber production, with the first sawmill being built in the late 1800s. The county seat is Dothan, which was founded in 1885. The county has a diverse economy, with the largest employers being the military, healthcare, and retail. As of the 2010 census, the population of Houston County was 101,547. The population is made up of 48.3% White, 45.2% African American, 2.2% Hispanic or Latino, 1.7% Asian, 0.3% Native American, and 2.5% other. The median household income in the county is $41,945, and the median family income is $50,945. The per capita income is $20,945. The poverty rate is 17.3%, and the unemployment rate is 5.2%.
Common Questions
What is Per Capita Income in Houston County?
Per Capita income in Houston County is $32,126.
What is the Median Family Income in Houston County?
Median Family Income in Houston County is $72,526.
What is the Median Household income in Houston County?
Median Household Income in Houston County is $55,064.
What is Income or Wage Gap in Houston County?
Income or Wage Gap in Houston County is 37.8%.
Women in Houston County earn 62.2 cents for every dollar earned by a man.
What is Family Income Deficit in Houston County?
Family Income Deficit in Houston County is $10,706.
Families that are below poverty line in Houston County earn $10,706 less on average than the poverty threshold level.
What is Inequality or Gini Index in Houston County?
Inequality or Gini Index in Houston County is 0.48.
What is the Total Population of Houston County?
Total Population of Houston County is 107,040.
What is the Total Male Population of Houston County?
Total Male Population of Houston County is 51,565.
What is the Total Female Population of Houston County?
Total Female Population of Houston County is 55,475.
What is the Ratio of Males per 100 Females in Houston County?
There are 92.95 Males per 100 Females in Houston County.
What is the Ratio of Females per 100 Males in Houston County?
There are 107.58 Females per 100 Males in Houston County.
What is the Median Population Age in Houston County?
Median Population Age in Houston County is 40.4 Years.
What is the Average Family Size in Houston County
Average Family Size in Houston County is 3.2 People.
What is the Average Household Size in Houston County
Average Household Size in Houston County is 2.5 People.
How Large is the Labor Force in Houston County?
There are 48,337 People in the Labor Forcein in Houston County.
What is the Percentage of People in the Labor Force in Houston County?
56.7% of People are in the Labor Force in Houston County.
What is the Unemployment Rate in Houston County?
Unemployment Rate in Houston County is 5.0%.