Russell County, AL Map & Demographics
Russell County Map
Russell County Overview
$25,855
PER CAPITA INCOME
$60,960
AVG FAMILY INCOME
$47,420
AVG HOUSEHOLD INCOME
37.3%
WAGE / INCOME GAP [ % ]
62.7¢/ $1
WAGE / INCOME GAP [ $ ]
$10,598
FAMILY INCOME DEFICIT
0.47
INEQUALITY / GINI INDEX
58,849
TOTAL POPULATION
28,125
MALE POPULATION
30,724
FEMALE POPULATION
91.54
MALES / 100 FEMALES
109.24
FEMALES / 100 MALES
37.2
MEDIAN AGE
3.2
AVG FAMILY SIZE
2.5
AVG HOUSEHOLD SIZE
25,600
LABOR FORCE [ PEOPLE ]
55.6%
PERCENT IN LABOR FORCE
6.5%
UNEMPLOYMENT RATE
Russell County Area Codes
Income in Russell County
Income Overview in Russell County
Per Capita Income in Russell County is $25,855, while median incomes of families and households are $60,960 and $47,420 respectively.
| Characteristic | Number | Measure |
| Per Capita Income | 58,849 | $25,855 |
| Median Family Income | 14,694 | $60,960 |
| Mean Family Income | 14,694 | $74,303 |
| Median Household Income | 23,462 | $47,420 |
| Mean Household Income | 23,462 | $62,441 |
| Income Deficit | 14,694 | $10,598 |
| Wage / Income Gap (%) | 58,849 | 37.29% |
| Wage / Income Gap ($) | 58,849 | 62.71¢ per $1 |
| Gini / Inequality Index | 58,849 | 0.47 |
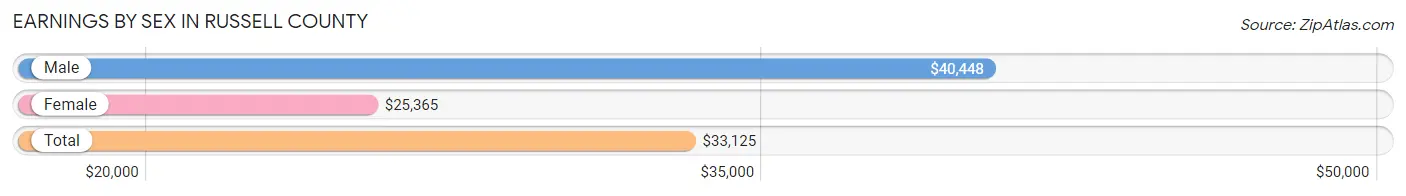
Earnings by Sex in Russell County
Average Earnings in Russell County are $33,125, $40,448 for men and $25,365 for women, a difference of 37.3%.
| Sex | Number | Average Earnings |
| Male | 13,788 (51.8%) | $40,448 |
| Female | 12,831 (48.2%) | $25,365 |
| Total | 26,619 (100.0%) | $33,125 |
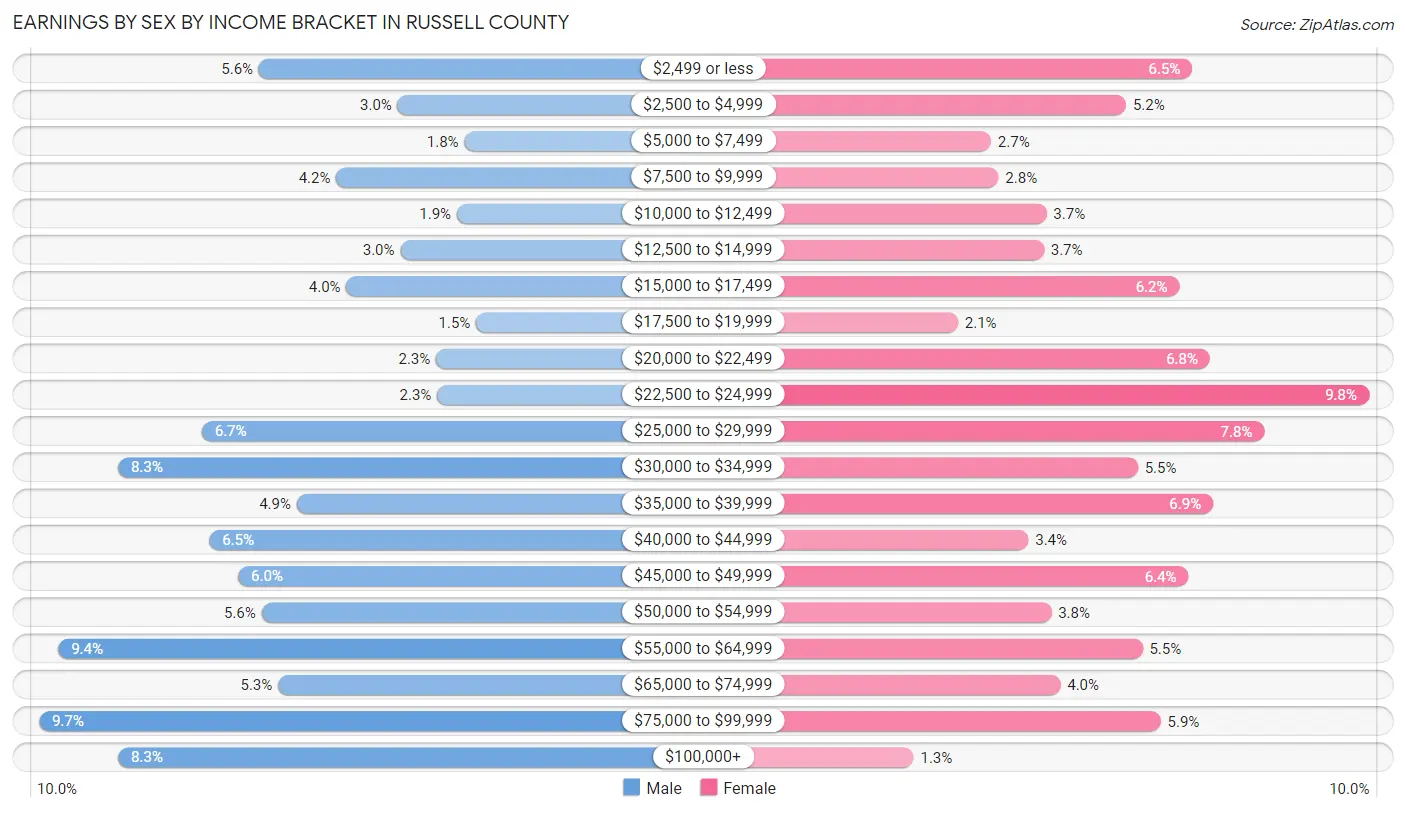
Earnings by Sex by Income Bracket in Russell County
The most common earnings brackets in Russell County are $75,000 to $99,999 for men (1,341 | 9.7%) and $22,500 to $24,999 for women (1,255 | 9.8%).
| Income | Male | Female |
| $2,499 or less | 774 (5.6%) | 830 (6.5%) |
| $2,500 to $4,999 | 415 (3.0%) | 671 (5.2%) |
| $5,000 to $7,499 | 243 (1.8%) | 347 (2.7%) |
| $7,500 to $9,999 | 573 (4.2%) | 365 (2.8%) |
| $10,000 to $12,499 | 262 (1.9%) | 480 (3.7%) |
| $12,500 to $14,999 | 408 (3.0%) | 474 (3.7%) |
| $15,000 to $17,499 | 547 (4.0%) | 800 (6.2%) |
| $17,500 to $19,999 | 213 (1.5%) | 267 (2.1%) |
| $20,000 to $22,499 | 316 (2.3%) | 872 (6.8%) |
| $22,500 to $24,999 | 313 (2.3%) | 1,255 (9.8%) |
| $25,000 to $29,999 | 921 (6.7%) | 1,004 (7.8%) |
| $30,000 to $34,999 | 1,138 (8.3%) | 699 (5.4%) |
| $35,000 to $39,999 | 676 (4.9%) | 880 (6.9%) |
| $40,000 to $44,999 | 902 (6.5%) | 436 (3.4%) |
| $45,000 to $49,999 | 827 (6.0%) | 821 (6.4%) |
| $50,000 to $54,999 | 766 (5.6%) | 491 (3.8%) |
| $55,000 to $64,999 | 1,292 (9.4%) | 711 (5.5%) |
| $65,000 to $74,999 | 724 (5.2%) | 513 (4.0%) |
| $75,000 to $99,999 | 1,341 (9.7%) | 755 (5.9%) |
| $100,000+ | 1,137 (8.3%) | 160 (1.3%) |
| Total | 13,788 (100.0%) | 12,831 (100.0%) |
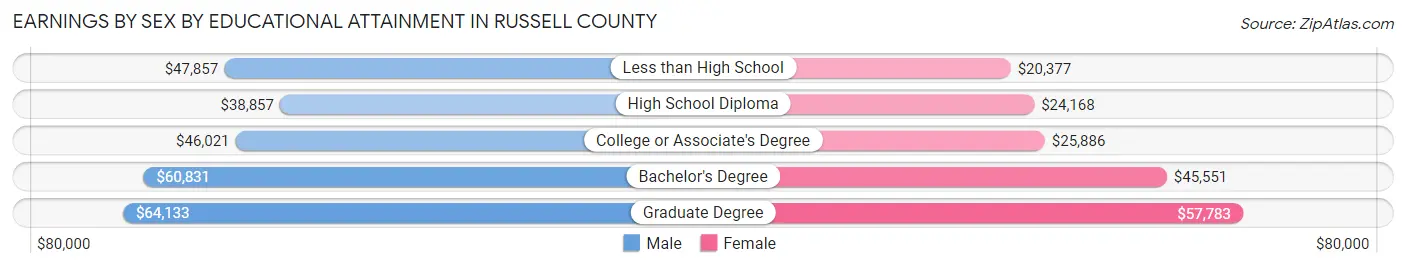
Earnings by Sex by Educational Attainment in Russell County
Average earnings in Russell County are $45,430 for men and $28,520 for women, a difference of 37.2%. Men with an educational attainment of graduate degree enjoy the highest average annual earnings of $64,133, while those with high school diploma education earn the least with $38,857. Women with an educational attainment of graduate degree earn the most with the average annual earnings of $57,783, while those with less than high school education have the smallest earnings of $20,377.
| Educational Attainment | Male Income | Female Income |
| Less than High School | $47,857 | $20,377 |
| High School Diploma | $38,857 | $24,168 |
| College or Associate's Degree | $46,021 | $25,886 |
| Bachelor's Degree | $60,831 | $45,551 |
| Graduate Degree | $64,133 | $57,783 |
| Total | $45,430 | $28,520 |
Family Income in Russell County
Family Income Brackets in Russell County
According to the Russell County family income data, there are 3,424 families falling into the $50,000 to $74,999 income range, which is the most common income bracket and makes up 23.3% of all families. Conversely, the $10,000 to $14,999 income bracket is the least frequent group with only 470 families (3.2%) belonging to this category.
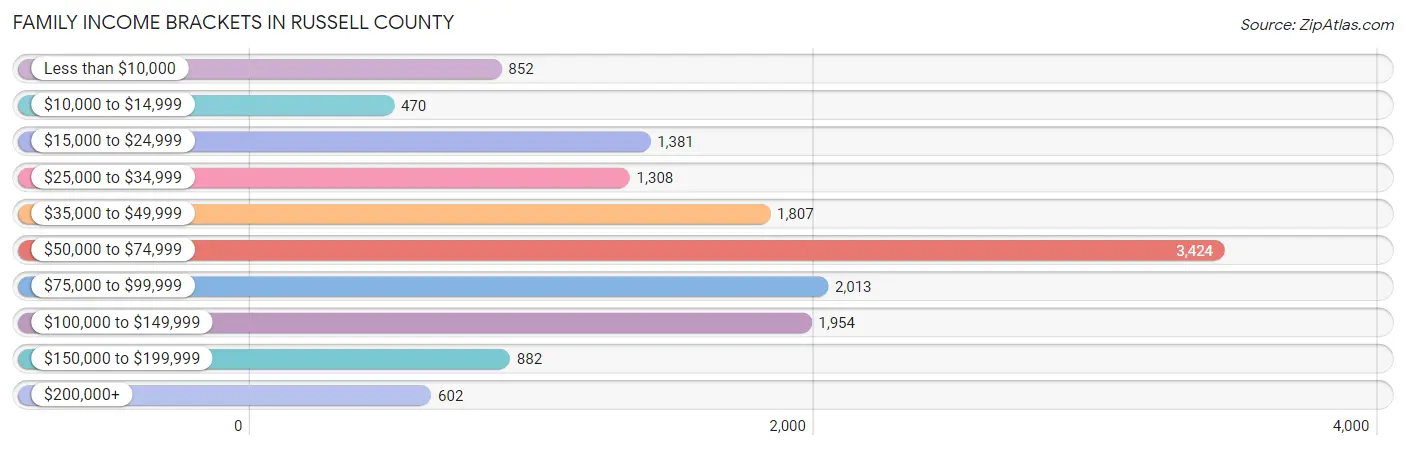
| Income Bracket | # Families | % Families |
| Less than $10,000 | 852 | 5.8% |
| $10,000 to $14,999 | 470 | 3.2% |
| $15,000 to $24,999 | 1,381 | 9.4% |
| $25,000 to $34,999 | 1,308 | 8.9% |
| $35,000 to $49,999 | 1,807 | 12.3% |
| $50,000 to $74,999 | 3,424 | 23.3% |
| $75,000 to $99,999 | 2,013 | 13.7% |
| $100,000 to $149,999 | 1,954 | 13.3% |
| $150,000 to $199,999 | 882 | 6.0% |
| $200,000+ | 602 | 4.1% |
Family Income by Famaliy Size in Russell County
6-person families (421 | 2.9%) account for the highest median family income in Russell County with $95,272 per family, while 2-person families (7,367 | 50.1%) have the highest median income of $27,246 per family member.
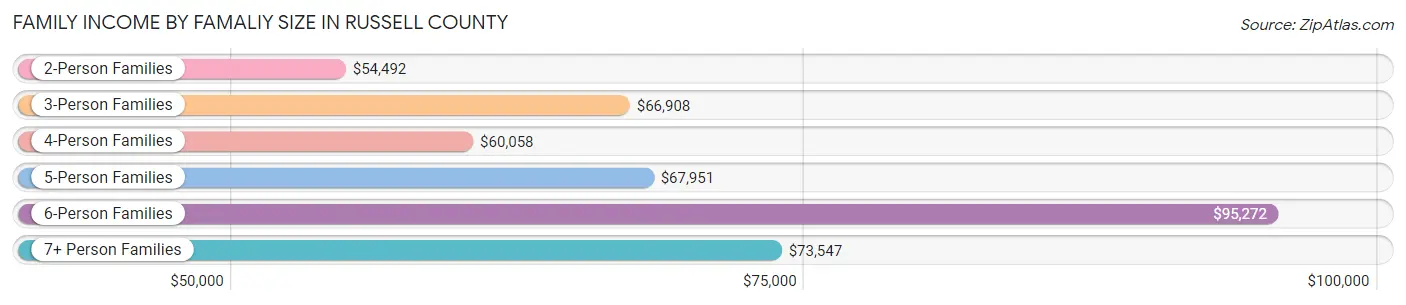
| Income Bracket | # Families | Median Income |
| 2-Person Families | 7,367 (50.1%) | $54,492 |
| 3-Person Families | 3,405 (23.2%) | $66,908 |
| 4-Person Families | 2,226 (15.1%) | $60,058 |
| 5-Person Families | 1,157 (7.9%) | $67,951 |
| 6-Person Families | 421 (2.9%) | $95,272 |
| 7+ Person Families | 118 (0.8%) | $73,547 |
| Total | 14,694 (100.0%) | $60,960 |
Family Income by Number of Earners in Russell County
The median family income in Russell County is $60,960, with families comprising 3+ earners (962) having the highest median family income of $102,955, while families with no earners (2,865) have the lowest median family income of $32,358, accounting for 6.6% and 19.5% of families, respectively.
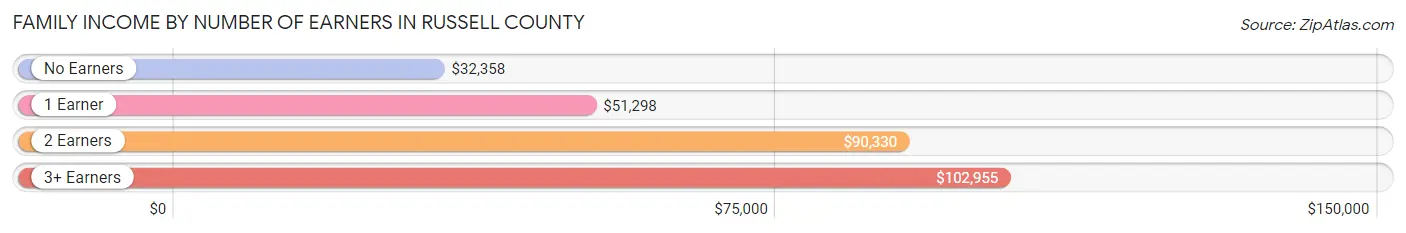
| Number of Earners | # Families | Median Income |
| No Earners | 2,865 (19.5%) | $32,358 |
| 1 Earner | 6,353 (43.2%) | $51,298 |
| 2 Earners | 4,514 (30.7%) | $90,330 |
| 3+ Earners | 962 (6.6%) | $102,955 |
| Total | 14,694 (100.0%) | $60,960 |
Household Income in Russell County
Household Income Brackets in Russell County
With 4,505 households falling in the category, the $50,000 to $74,999 income range is the most frequent in Russell County, accounting for 19.2% of all households. In contrast, only 727 households (3.1%) fall into the $200,000+ income bracket, making it the least populous group.
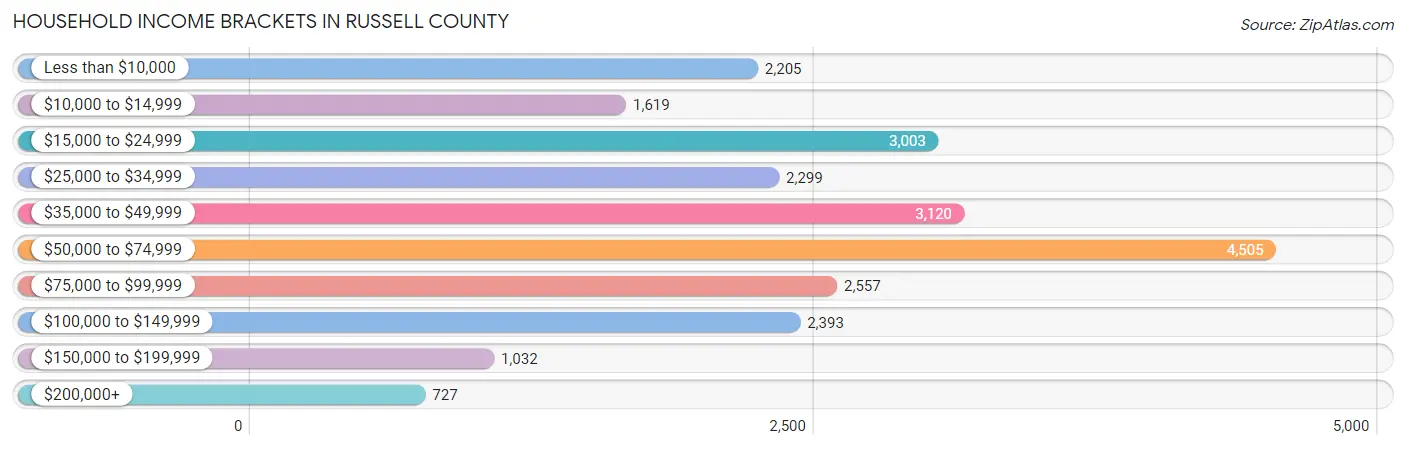
| Income Bracket | # Households | % Households |
| Less than $10,000 | 2,205 | 9.4% |
| $10,000 to $14,999 | 1,619 | 6.9% |
| $15,000 to $24,999 | 3,003 | 12.8% |
| $25,000 to $34,999 | 2,299 | 9.8% |
| $35,000 to $49,999 | 3,120 | 13.3% |
| $50,000 to $74,999 | 4,505 | 19.2% |
| $75,000 to $99,999 | 2,557 | 10.9% |
| $100,000 to $149,999 | 2,393 | 10.2% |
| $150,000 to $199,999 | 1,032 | 4.4% |
| $200,000+ | 727 | 3.1% |
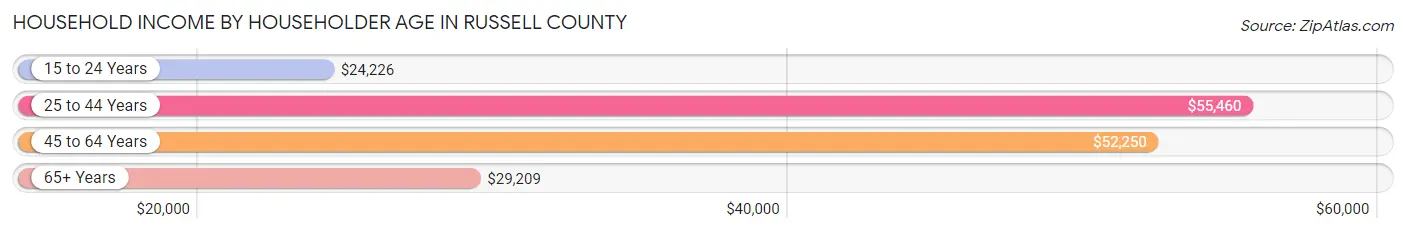
Household Income by Householder Age in Russell County
The median household income in Russell County is $47,420, with the highest median household income of $55,460 found in the 25 to 44 years age bracket for the primary householder. A total of 7,873 households (33.6%) fall into this category. Meanwhile, the 15 to 24 years age bracket for the primary householder has the lowest median household income of $24,226, with 918 households (3.9%) in this group.
| Income Bracket | # Households | Median Income |
| 15 to 24 Years | 918 (3.9%) | $24,226 |
| 25 to 44 Years | 7,873 (33.6%) | $55,460 |
| 45 to 64 Years | 9,283 (39.6%) | $52,250 |
| 65+ Years | 5,388 (23.0%) | $29,209 |
| Total | 23,462 (100.0%) | $47,420 |
Poverty in Russell County
Income Below Poverty by Sex and Age in Russell County
With 19.6% poverty level for males and 24.2% for females among the residents of Russell County, 5 year old males and 15 year old females are the most vulnerable to poverty, with 381 males (54.3%) and 333 females (50.4%) in their respective age groups living below the poverty level.
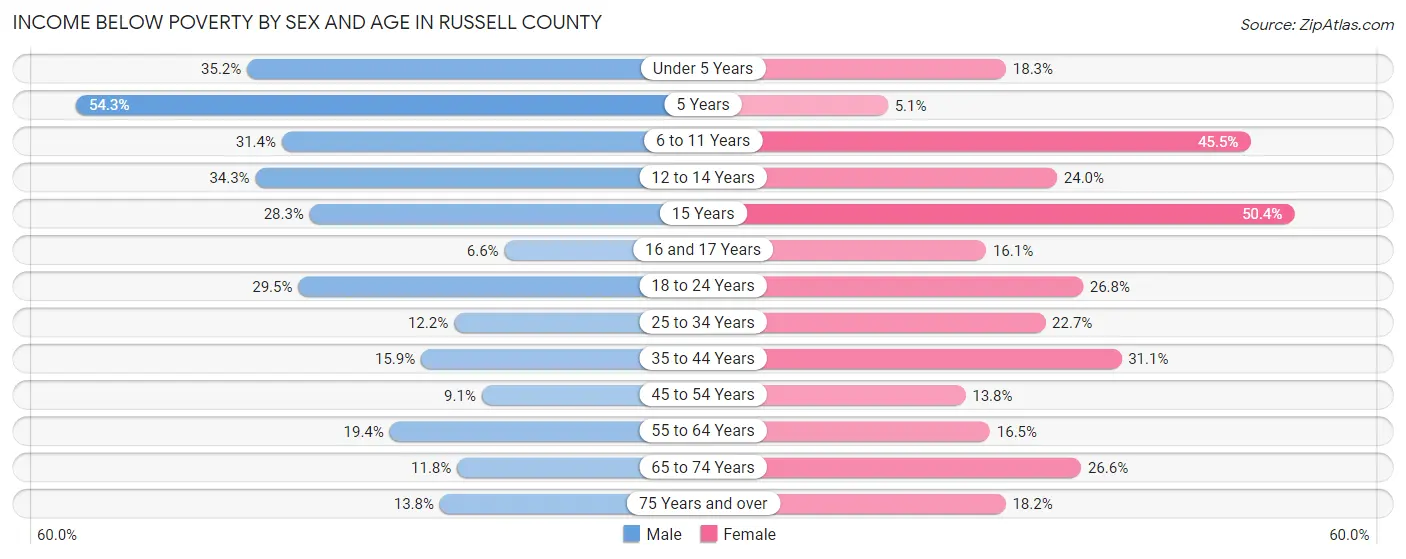
| Age Bracket | Male | Female |
| Under 5 Years | 666 (35.2%) | 380 (18.3%) |
| 5 Years | 381 (54.3%) | 12 (5.1%) |
| 6 to 11 Years | 730 (31.4%) | 1,101 (45.5%) |
| 12 to 14 Years | 286 (34.3%) | 296 (23.9%) |
| 15 Years | 63 (28.2%) | 333 (50.4%) |
| 16 and 17 Years | 56 (6.6%) | 80 (16.1%) |
| 18 to 24 Years | 709 (29.5%) | 633 (26.8%) |
| 25 to 34 Years | 491 (12.2%) | 990 (22.7%) |
| 35 to 44 Years | 552 (15.9%) | 1,242 (31.1%) |
| 45 to 54 Years | 327 (9.1%) | 512 (13.8%) |
| 55 to 64 Years | 719 (19.4%) | 654 (16.5%) |
| 65 to 74 Years | 288 (11.8%) | 789 (26.6%) |
| 75 Years and over | 168 (13.8%) | 358 (18.2%) |
| Total | 5,436 (19.6%) | 7,380 (24.2%) |
Income Above Poverty by Sex and Age in Russell County
According to the poverty statistics in Russell County, males aged 16 and 17 years and females aged 5 years are the age groups that are most secure financially, with 93.4% of males and 94.9% of females in these age groups living above the poverty line.
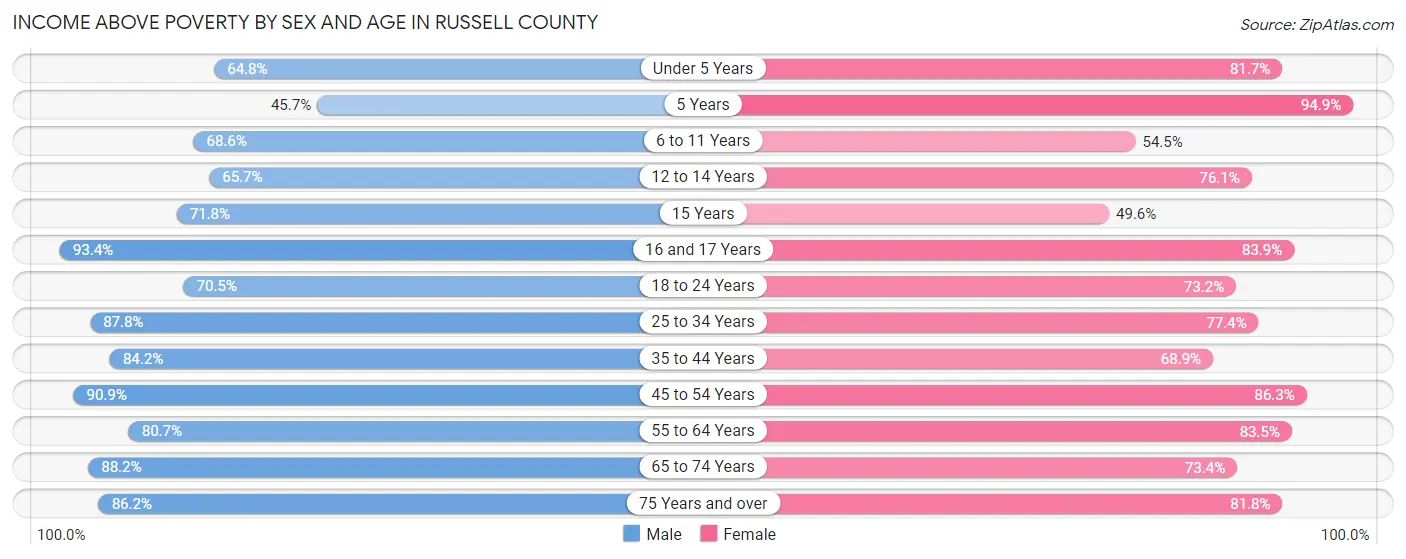
| Age Bracket | Male | Female |
| Under 5 Years | 1,225 (64.8%) | 1,700 (81.7%) |
| 5 Years | 321 (45.7%) | 223 (94.9%) |
| 6 to 11 Years | 1,598 (68.6%) | 1,320 (54.5%) |
| 12 to 14 Years | 548 (65.7%) | 940 (76.0%) |
| 15 Years | 160 (71.8%) | 328 (49.6%) |
| 16 and 17 Years | 798 (93.4%) | 418 (83.9%) |
| 18 to 24 Years | 1,693 (70.5%) | 1,725 (73.2%) |
| 25 to 34 Years | 3,540 (87.8%) | 3,381 (77.3%) |
| 35 to 44 Years | 2,931 (84.2%) | 2,749 (68.9%) |
| 45 to 54 Years | 3,269 (90.9%) | 3,211 (86.3%) |
| 55 to 64 Years | 2,997 (80.6%) | 3,311 (83.5%) |
| 65 to 74 Years | 2,147 (88.2%) | 2,173 (73.4%) |
| 75 Years and over | 1,053 (86.2%) | 1,606 (81.8%) |
| Total | 22,280 (80.4%) | 23,085 (75.8%) |
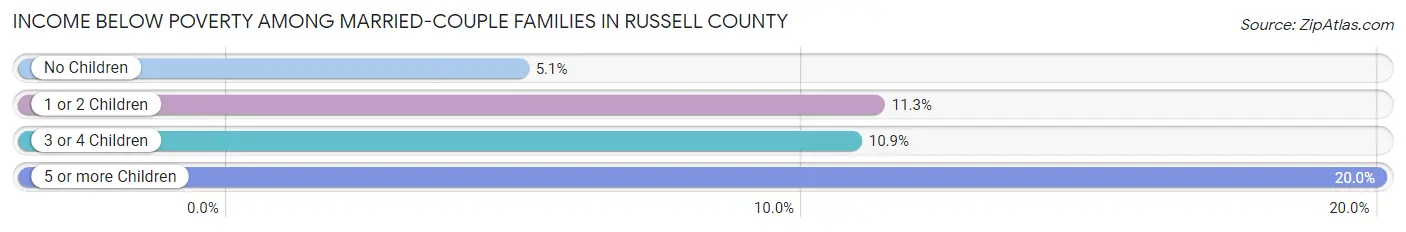
Income Below Poverty Among Married-Couple Families in Russell County
The poverty statistics for married-couple families in Russell County show that 7.5% or 737 of the total 9,827 families live below the poverty line. Families with 5 or more children have the highest poverty rate of 20.0%, comprising of 2 families. On the other hand, families with no children have the lowest poverty rate of 5.1%, which includes 299 families.
| Children | Above Poverty | Below Poverty |
| No Children | 5,607 (94.9%) | 299 (5.1%) |
| 1 or 2 Children | 2,498 (88.7%) | 317 (11.3%) |
| 3 or 4 Children | 977 (89.1%) | 119 (10.9%) |
| 5 or more Children | 8 (80.0%) | 2 (20.0%) |
| Total | 9,090 (92.5%) | 737 (7.5%) |
Income Below Poverty Among Single-Parent Households in Russell County
According to the poverty data in Russell County, 4.3% or 53 single-father households and 43.8% or 1,587 single-mother households are living below the poverty line. Among single-father households, those with 5 or more children have the highest poverty rate, with 16 households (100.0%) experiencing poverty. Likewise, among single-mother households, those with 3 or 4 children have the highest poverty rate, with 306 households (74.8%) falling below the poverty line.
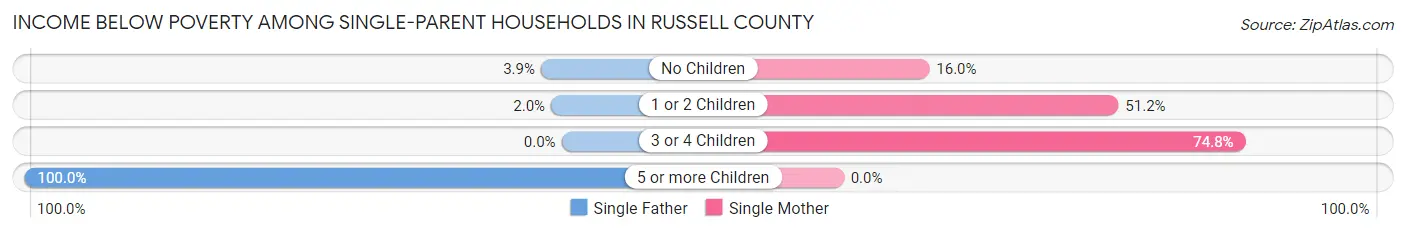
| Children | Single Father | Single Mother |
| No Children | 27 (3.8%) | 165 (16.0%) |
| 1 or 2 Children | 10 (2.0%) | 1,116 (51.2%) |
| 3 or 4 Children | 0 (0.0%) | 306 (74.8%) |
| 5 or more Children | 16 (100.0%) | 0 (0.0%) |
| Total | 53 (4.3%) | 1,587 (43.8%) |
Income Below Poverty Among Married-Couple vs Single-Parent Households in Russell County
The poverty data for Russell County shows that 737 of the married-couple family households (7.5%) and 1,640 of the single-parent households (33.7%) are living below the poverty level. Within the married-couple family households, those with 5 or more children have the highest poverty rate, with 2 households (20.0%) falling below the poverty line. Among the single-parent households, those with 5 or more children have the highest poverty rate, with 16 household (100.0%) living below poverty.
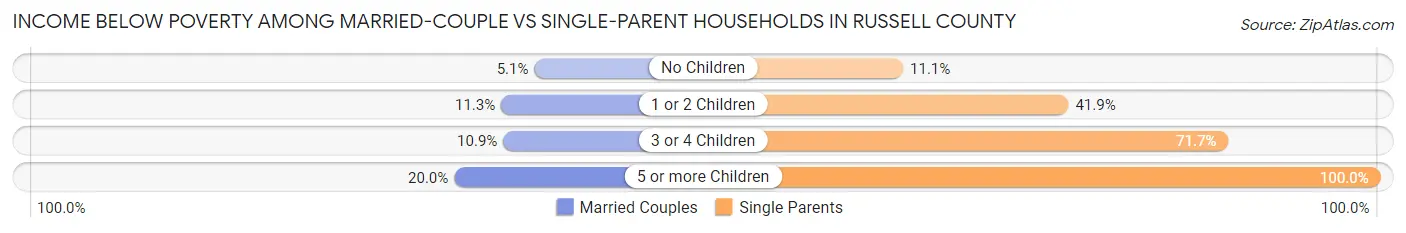
| Children | Married-Couple Families | Single-Parent Households |
| No Children | 299 (5.1%) | 192 (11.1%) |
| 1 or 2 Children | 317 (11.3%) | 1,126 (41.9%) |
| 3 or 4 Children | 119 (10.9%) | 306 (71.7%) |
| 5 or more Children | 2 (20.0%) | 16 (100.0%) |
| Total | 737 (7.5%) | 1,640 (33.7%) |
Race in Russell County
The most populous races in Russell County are White / Caucasian (27,622 | 46.9%), Black / African American (26,410 | 44.9%), and Hispanic or Latino (3,451 | 5.9%).
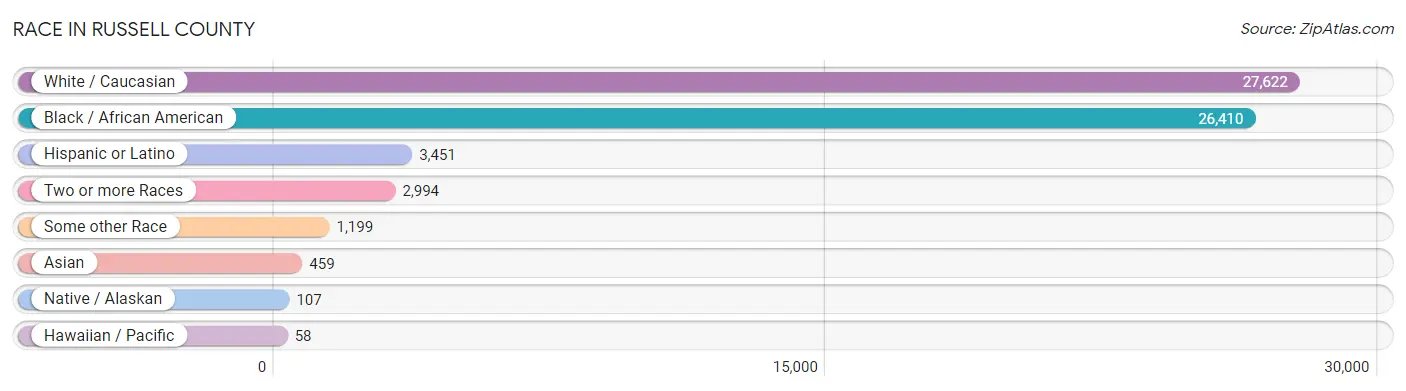
| Race | # Population | % Population |
| Asian | 459 | 0.8% |
| Black / African American | 26,410 | 44.9% |
| Hawaiian / Pacific | 58 | 0.1% |
| Hispanic or Latino | 3,451 | 5.9% |
| Native / Alaskan | 107 | 0.2% |
| White / Caucasian | 27,622 | 46.9% |
| Two or more Races | 2,994 | 5.1% |
| Some other Race | 1,199 | 2.0% |
| Total | 58,849 | 100.0% |
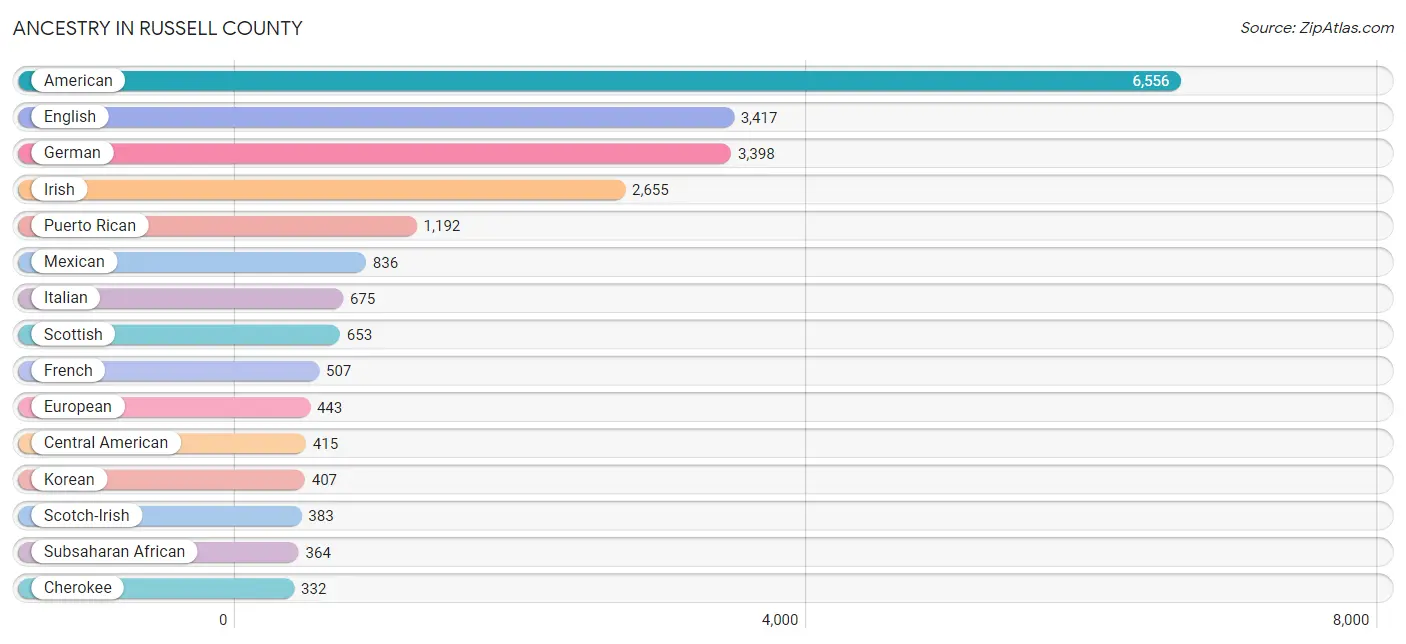
Ancestry in Russell County
The most populous ancestries reported in Russell County are American (6,556 | 11.1%), English (3,417 | 5.8%), German (3,398 | 5.8%), Irish (2,655 | 4.5%), and Puerto Rican (1,192 | 2.0%), together accounting for 29.3% of all Russell County residents.
| Ancestry | # Population | % Population |
| African | 304 | 0.5% |
| Aleut | 97 | 0.2% |
| American | 6,556 | 11.1% |
| Arab | 9 | 0.0% |
| Argentinean | 9 | 0.0% |
| Austrian | 76 | 0.1% |
| Bhutanese | 75 | 0.1% |
| Blackfeet | 51 | 0.1% |
| British | 94 | 0.2% |
| Bulgarian | 120 | 0.2% |
| Burmese | 296 | 0.5% |
| Cajun | 6 | 0.0% |
| Canadian | 23 | 0.0% |
| Cape Verdean | 5 | 0.0% |
| Central American | 415 | 0.7% |
| Cherokee | 332 | 0.6% |
| Chilean | 15 | 0.0% |
| Colombian | 30 | 0.1% |
| Creek | 90 | 0.2% |
| Cuban | 306 | 0.5% |
| Dominican | 332 | 0.6% |
| Dutch | 119 | 0.2% |
| Eastern European | 84 | 0.1% |
| Ecuadorian | 26 | 0.0% |
| English | 3,417 | 5.8% |
| European | 443 | 0.7% |
| Finnish | 2 | 0.0% |
| French | 507 | 0.9% |
| French Canadian | 38 | 0.1% |
| German | 3,398 | 5.8% |
| Greek | 56 | 0.1% |
| Guamanian / Chamorro | 18 | 0.0% |
| Guatemalan | 329 | 0.6% |
| Haitian | 179 | 0.3% |
| Indian (Asian) | 188 | 0.3% |
| Irish | 2,655 | 4.5% |
| Iroquois | 8 | 0.0% |
| Israeli | 40 | 0.1% |
| Italian | 675 | 1.1% |
| Jamaican | 223 | 0.4% |
| Korean | 407 | 0.7% |
| Lithuanian | 26 | 0.0% |
| Mexican | 836 | 1.4% |
| Native Hawaiian | 79 | 0.1% |
| Nigerian | 55 | 0.1% |
| Norwegian | 278 | 0.5% |
| Okinawan | 13 | 0.0% |
| Palestinian | 9 | 0.0% |
| Panamanian | 12 | 0.0% |
| Pennsylvania German | 7 | 0.0% |
| Polish | 227 | 0.4% |
| Portuguese | 11 | 0.0% |
| Puerto Rican | 1,192 | 2.0% |
| Russian | 55 | 0.1% |
| Salvadoran | 74 | 0.1% |
| Samoan | 18 | 0.0% |
| Scotch-Irish | 383 | 0.6% |
| Scottish | 653 | 1.1% |
| South American | 99 | 0.2% |
| Sri Lankan | 18 | 0.0% |
| Subsaharan African | 364 | 0.6% |
| Swedish | 145 | 0.3% |
| Swiss | 110 | 0.2% |
| Thai | 81 | 0.1% |
| Ukrainian | 13 | 0.0% |
| Venezuelan | 19 | 0.0% |
| Welsh | 229 | 0.4% |
| Yugoslavian | 10 | 0.0% | View All 68 Rows |
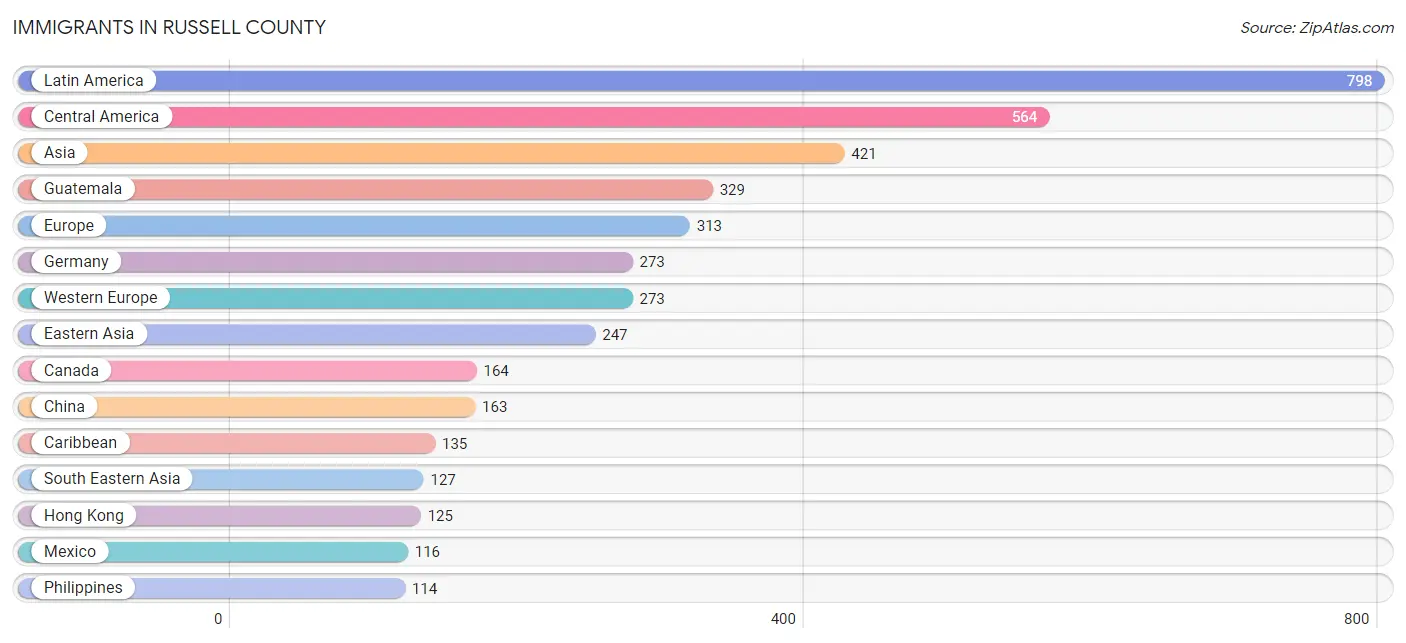
Immigrants in Russell County
The most numerous immigrant groups reported in Russell County came from Latin America (798 | 1.4%), Central America (564 | 1.0%), Asia (421 | 0.7%), Guatemala (329 | 0.6%), and Europe (313 | 0.5%), together accounting for 4.1% of all Russell County residents.
| Immigration Origin | # Population | % Population |
| Africa | 18 | 0.0% |
| Argentina | 9 | 0.0% |
| Asia | 421 | 0.7% |
| Bangladesh | 17 | 0.0% |
| Cameroon | 18 | 0.0% |
| Canada | 164 | 0.3% |
| Caribbean | 135 | 0.2% |
| Central America | 564 | 1.0% |
| Chile | 15 | 0.0% |
| China | 163 | 0.3% |
| Colombia | 30 | 0.1% |
| Eastern Asia | 247 | 0.4% |
| Ecuador | 26 | 0.0% |
| El Salvador | 18 | 0.0% |
| England | 31 | 0.1% |
| Europe | 313 | 0.5% |
| Germany | 273 | 0.5% |
| Guatemala | 329 | 0.6% |
| Haiti | 103 | 0.2% |
| Honduras | 88 | 0.2% |
| Hong Kong | 125 | 0.2% |
| India | 2 | 0.0% |
| Italy | 9 | 0.0% |
| Jamaica | 32 | 0.1% |
| Japan | 24 | 0.0% |
| Korea | 60 | 0.1% |
| Latin America | 798 | 1.4% |
| Mexico | 116 | 0.2% |
| Middle Africa | 18 | 0.0% |
| Northern Europe | 31 | 0.1% |
| Oceania | 14 | 0.0% |
| Pakistan | 28 | 0.1% |
| Panama | 13 | 0.0% |
| Philippines | 114 | 0.2% |
| Singapore | 13 | 0.0% |
| South America | 99 | 0.2% |
| South Central Asia | 47 | 0.1% |
| South Eastern Asia | 127 | 0.2% |
| Southern Europe | 9 | 0.0% |
| Venezuela | 19 | 0.0% |
| Western Europe | 273 | 0.5% | View All 41 Rows |
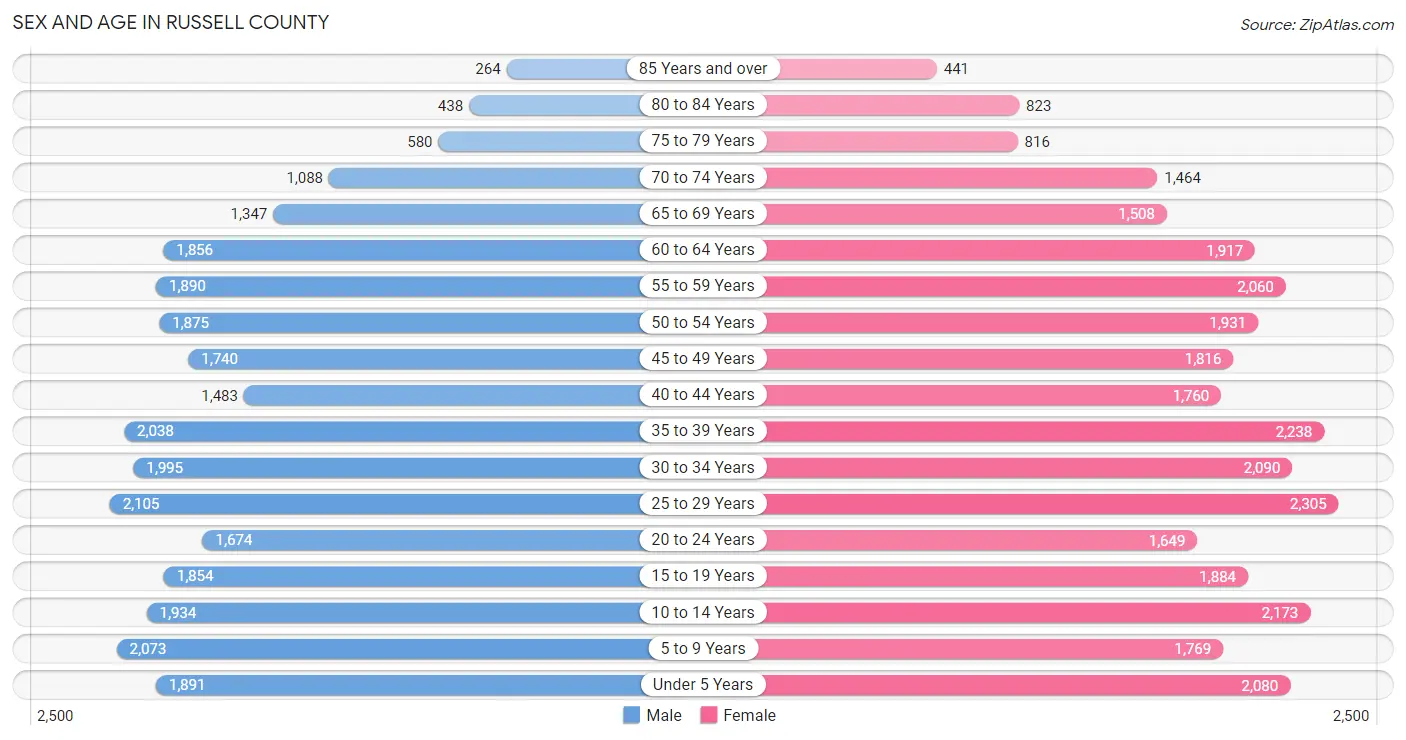
Sex and Age in Russell County
Sex and Age in Russell County
The most populous age groups in Russell County are 25 to 29 Years (2,105 | 7.5%) for men and 25 to 29 Years (2,305 | 7.5%) for women.
| Age Bracket | Male | Female |
| Under 5 Years | 1,891 (6.7%) | 2,080 (6.8%) |
| 5 to 9 Years | 2,073 (7.4%) | 1,769 (5.8%) |
| 10 to 14 Years | 1,934 (6.9%) | 2,173 (7.1%) |
| 15 to 19 Years | 1,854 (6.6%) | 1,884 (6.1%) |
| 20 to 24 Years | 1,674 (5.9%) | 1,649 (5.4%) |
| 25 to 29 Years | 2,105 (7.5%) | 2,305 (7.5%) |
| 30 to 34 Years | 1,995 (7.1%) | 2,090 (6.8%) |
| 35 to 39 Years | 2,038 (7.2%) | 2,238 (7.3%) |
| 40 to 44 Years | 1,483 (5.3%) | 1,760 (5.7%) |
| 45 to 49 Years | 1,740 (6.2%) | 1,816 (5.9%) |
| 50 to 54 Years | 1,875 (6.7%) | 1,931 (6.3%) |
| 55 to 59 Years | 1,890 (6.7%) | 2,060 (6.7%) |
| 60 to 64 Years | 1,856 (6.6%) | 1,917 (6.2%) |
| 65 to 69 Years | 1,347 (4.8%) | 1,508 (4.9%) |
| 70 to 74 Years | 1,088 (3.9%) | 1,464 (4.8%) |
| 75 to 79 Years | 580 (2.1%) | 816 (2.7%) |
| 80 to 84 Years | 438 (1.6%) | 823 (2.7%) |
| 85 Years and over | 264 (0.9%) | 441 (1.4%) |
| Total | 28,125 (100.0%) | 30,724 (100.0%) |
Families and Households in Russell County
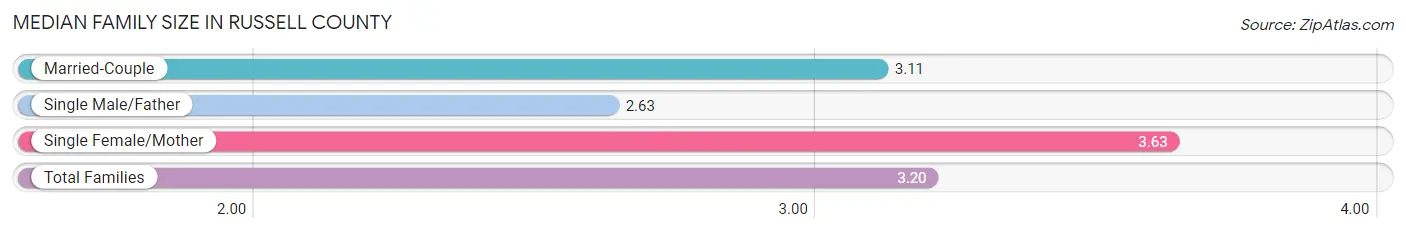
Median Family Size in Russell County
The median family size in Russell County is 3.20 persons per family, with single female/mother families (3,624 | 24.7%) accounting for the largest median family size of 3.63 persons per family. On the other hand, single male/father families (1,243 | 8.5%) represent the smallest median family size with 2.63 persons per family.
| Family Type | # Families | Family Size |
| Married-Couple | 9,827 (66.9%) | 3.11 |
| Single Male/Father | 1,243 (8.5%) | 2.63 |
| Single Female/Mother | 3,624 (24.7%) | 3.63 |
| Total Families | 14,694 (100.0%) | 3.20 |
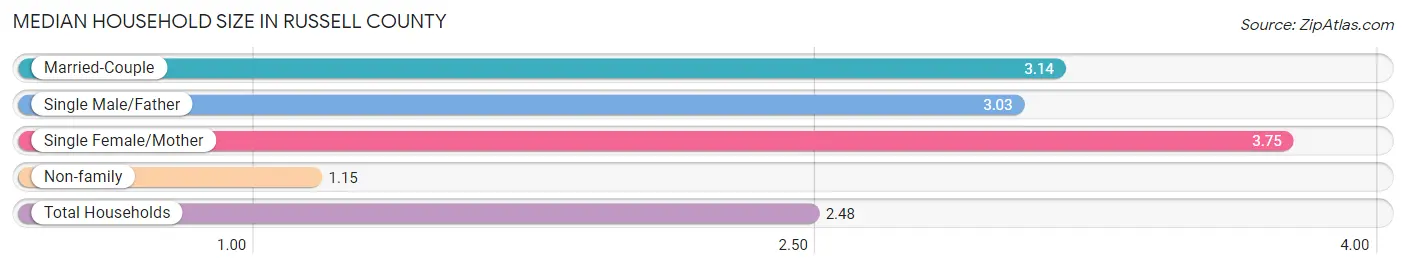
Median Household Size in Russell County
The median household size in Russell County is 2.48 persons per household, with single female/mother households (3,624 | 15.4%) accounting for the largest median household size of 3.75 persons per household. non-family households (8,768 | 37.4%) represent the smallest median household size with 1.15 persons per household.
| Household Type | # Households | Household Size |
| Married-Couple | 9,827 (41.9%) | 3.14 |
| Single Male/Father | 1,243 (5.3%) | 3.03 |
| Single Female/Mother | 3,624 (15.4%) | 3.75 |
| Non-family | 8,768 (37.4%) | 1.15 |
| Total Households | 23,462 (100.0%) | 2.48 |
Household Size by Marriage Status in Russell County
Out of a total of 23,462 households in Russell County, 14,694 (62.6%) are family households, while 8,768 (37.4%) are nonfamily households. The most numerous type of family households are 2-person households, comprising 6,859, and the most common type of nonfamily households are 1-person households, comprising 7,694.
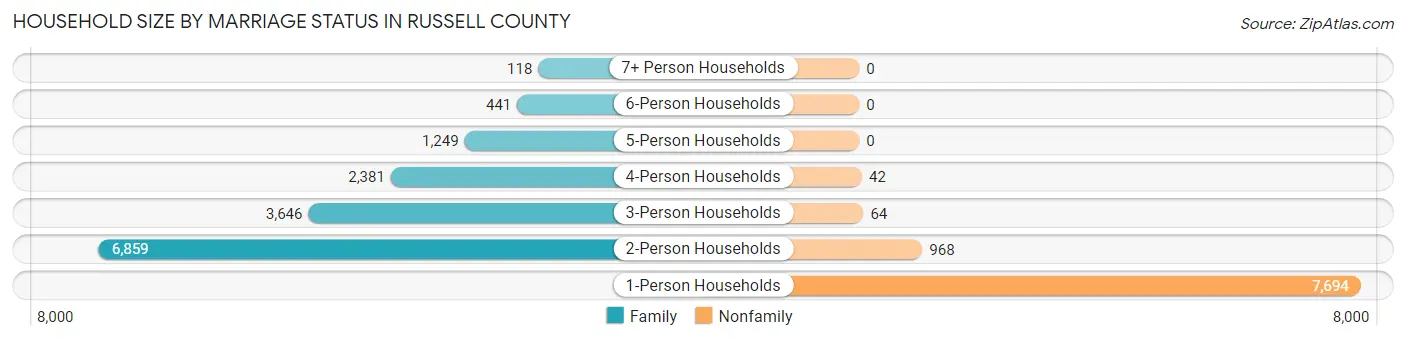
| Household Size | Family Households | Nonfamily Households |
| 1-Person Households | - | 7,694 (32.8%) |
| 2-Person Households | 6,859 (29.2%) | 968 (4.1%) |
| 3-Person Households | 3,646 (15.5%) | 64 (0.3%) |
| 4-Person Households | 2,381 (10.2%) | 42 (0.2%) |
| 5-Person Households | 1,249 (5.3%) | 0 (0.0%) |
| 6-Person Households | 441 (1.9%) | 0 (0.0%) |
| 7+ Person Households | 118 (0.5%) | 0 (0.0%) |
| Total | 14,694 (62.6%) | 8,768 (37.4%) |
Female Fertility in Russell County
Fertility by Age in Russell County
Average fertility rate in Russell County is 67.0 births per 1,000 women. Women in the age bracket of 20 to 34 years have the highest fertility rate with 113.0 births per 1,000 women. Women in the age bracket of 20 to 34 years acount for 72.7% of all women with births.
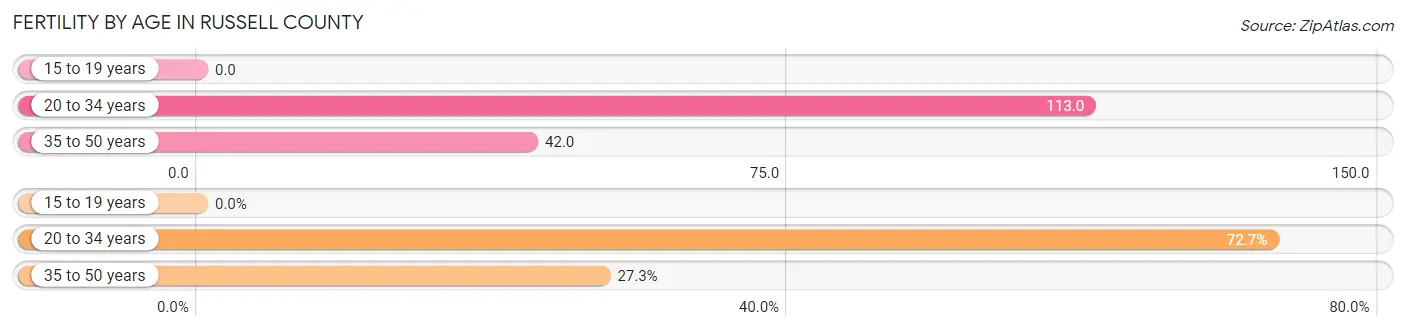
| Age Bracket | Women with Births | Births / 1,000 Women |
| 15 to 19 years | 0 (0.0%) | 0.0 |
| 20 to 34 years | 684 (72.7%) | 113.0 |
| 35 to 50 years | 257 (27.3%) | 42.0 |
| Total | 941 (100.0%) | 67.0 |
Fertility by Age by Marriage Status in Russell County
47.8% of women with births (941) in Russell County are married. The highest percentage of unmarried women with births falls into 20 to 34 years age bracket with 64.9% of them unmarried at the time of birth, while the lowest percentage of unmarried women with births belong to 35 to 50 years age bracket with 18.3% of them unmarried.
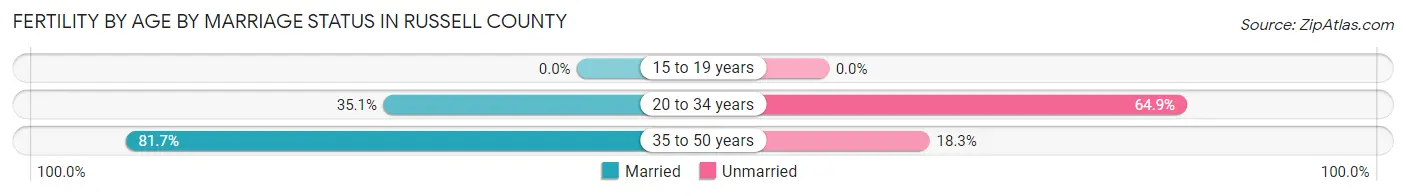
| Age Bracket | Married | Unmarried |
| 15 to 19 years | 0 (0.0%) | 0 (0.0%) |
| 20 to 34 years | 240 (35.1%) | 444 (64.9%) |
| 35 to 50 years | 210 (81.7%) | 47 (18.3%) |
| Total | 450 (47.8%) | 491 (52.2%) |
Fertility by Education in Russell County
Average fertility rate in Russell County is 67.0 births per 1,000 women. Women with the education attainment of bachelor's degree have the highest fertility rate of 96.0 births per 1,000 women, while women with the education attainment of less than high school have the lowest fertility at 25.0 births per 1,000 women. Women with the education attainment of college or associate's degree represent 40.2% of all women with births.
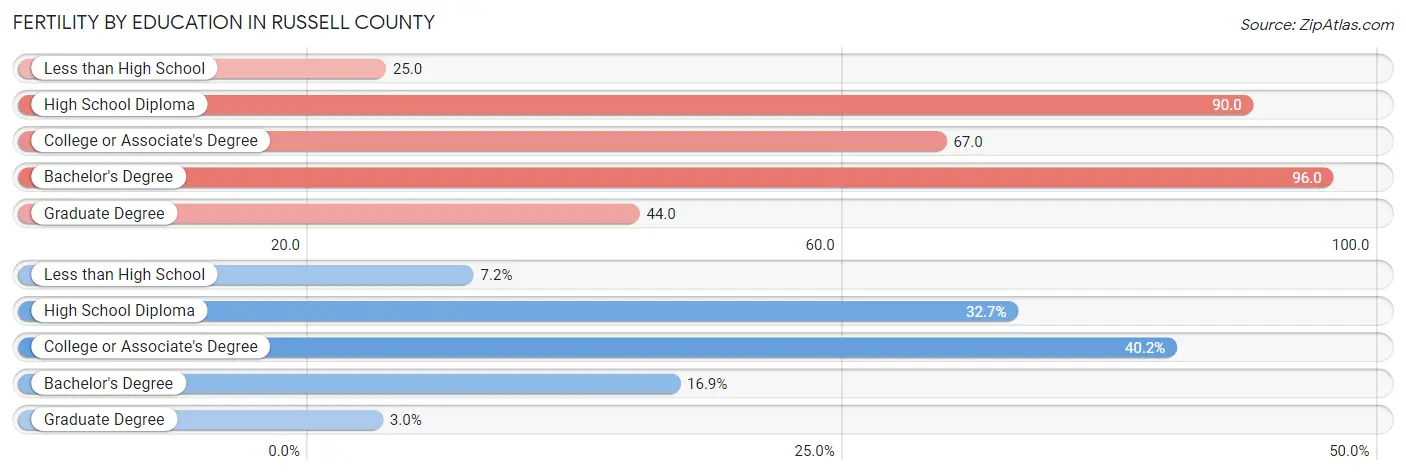
| Educational Attainment | Women with Births | Births / 1,000 Women |
| Less than High School | 68 (7.2%) | 25.0 |
| High School Diploma | 308 (32.7%) | 90.0 |
| College or Associate's Degree | 378 (40.2%) | 67.0 |
| Bachelor's Degree | 159 (16.9%) | 96.0 |
| Graduate Degree | 28 (3.0%) | 44.0 |
| Total | 941 (100.0%) | 67.0 |
Fertility by Education by Marriage Status in Russell County
52.2% of women with births in Russell County are unmarried. Women with the educational attainment of bachelor's degree are most likely to be married with 100.0% of them married at childbirth, while women with the educational attainment of less than high school are least likely to be married with 100.0% of them unmarried at childbirth.
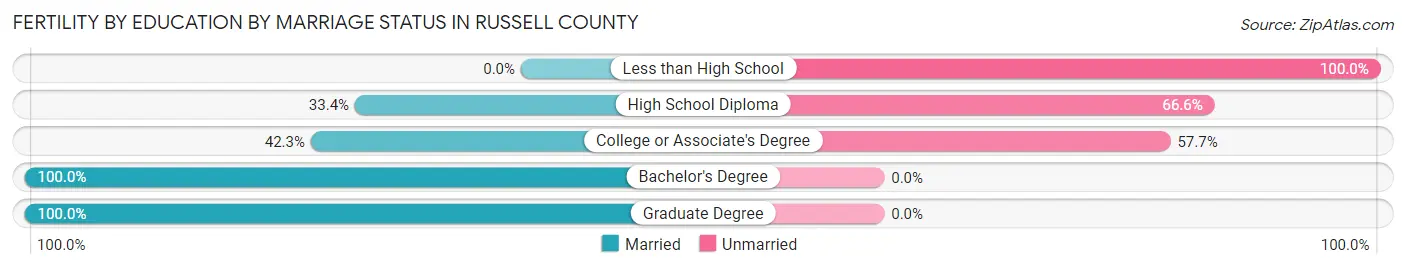
| Educational Attainment | Married | Unmarried |
| Less than High School | 0 (0.0%) | 68 (100.0%) |
| High School Diploma | 103 (33.4%) | 205 (66.6%) |
| College or Associate's Degree | 160 (42.3%) | 218 (57.7%) |
| Bachelor's Degree | 159 (100.0%) | 0 (0.0%) |
| Graduate Degree | 28 (100.0%) | 0 (0.0%) |
| Total | 450 (47.8%) | 491 (52.2%) |
Employment Characteristics in Russell County
Employment by Class of Employer in Russell County
Among the 23,566 employed individuals in Russell County, private company employees (15,308 | 65.0%), federal government employees (2,729 | 11.6%), and local government employees (1,340 | 5.7%) make up the most common classes of employment.
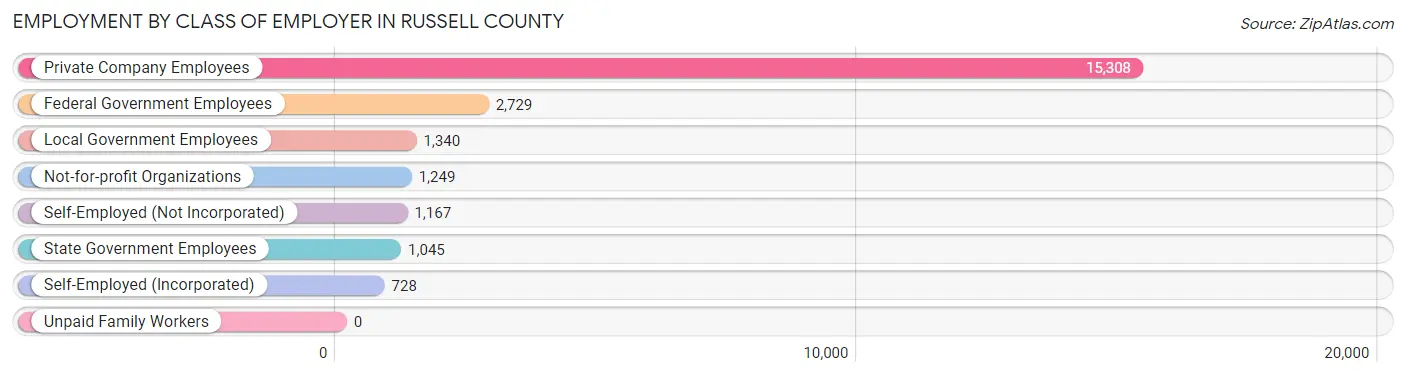
| Employer Class | # Employees | % Employees |
| Private Company Employees | 15,308 | 65.0% |
| Self-Employed (Incorporated) | 728 | 3.1% |
| Self-Employed (Not Incorporated) | 1,167 | 5.0% |
| Not-for-profit Organizations | 1,249 | 5.3% |
| Local Government Employees | 1,340 | 5.7% |
| State Government Employees | 1,045 | 4.4% |
| Federal Government Employees | 2,729 | 11.6% |
| Unpaid Family Workers | 0 | 0.0% |
| Total | 23,566 | 100.0% |
Employment Status by Age in Russell County
According to the labor force statistics for Russell County, out of the total population over 16 years of age (46,044), 55.6% or 25,600 individuals are in the labor force, with 6.5% or 1,664 of them unemployed. The age group with the highest labor force participation rate is 25 to 29 years, with 76.6% or 3,378 individuals in the labor force. Within the labor force, the 16 to 19 years age range has the highest percentage of unemployed individuals, with 16.9% or 200 of them being unemployed.
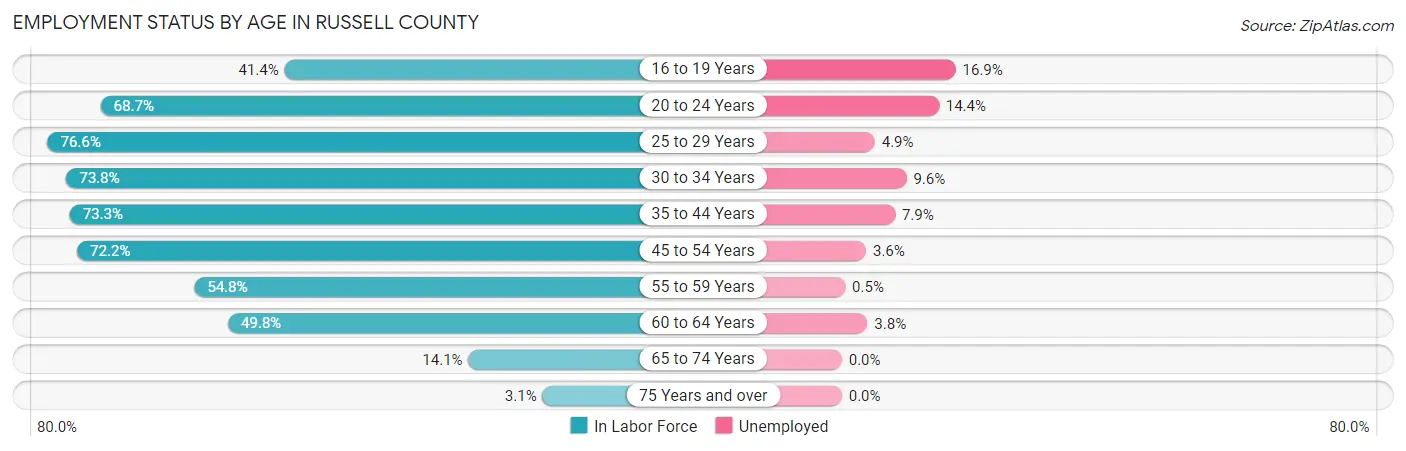
| Age Bracket | In Labor Force | Unemployed |
| 16 to 19 Years | 1,181 (41.4%) | 200 (16.9%) |
| 20 to 24 Years | 2,283 (68.7%) | 329 (14.4%) |
| 25 to 29 Years | 3,378 (76.6%) | 166 (4.9%) |
| 30 to 34 Years | 3,015 (73.8%) | 289 (9.6%) |
| 35 to 44 Years | 5,511 (73.3%) | 435 (7.9%) |
| 45 to 54 Years | 5,315 (72.2%) | 191 (3.6%) |
| 55 to 59 Years | 2,165 (54.8%) | 11 (0.5%) |
| 60 to 64 Years | 1,879 (49.8%) | 71 (3.8%) |
| 65 to 74 Years | 762 (14.1%) | 0 (0.0%) |
| 75 Years and over | 104 (3.1%) | 0 (0.0%) |
| Total | 25,600 (55.6%) | 1,664 (6.5%) |
Employment Status by Educational Attainment in Russell County
According to labor force statistics for Russell County, 68.4% of individuals (21,272) out of the total population between 25 and 64 years of age (31,099) are in the labor force, with 5.4% or 1,149 of them being unemployed. The group with the highest labor force participation rate are those with the educational attainment of bachelor's degree or higher, with 80.8% or 4,248 individuals in the labor force. Within the labor force, individuals with less than high school education have the highest percentage of unemployment, with 12.3% or 199 of them being unemployed.
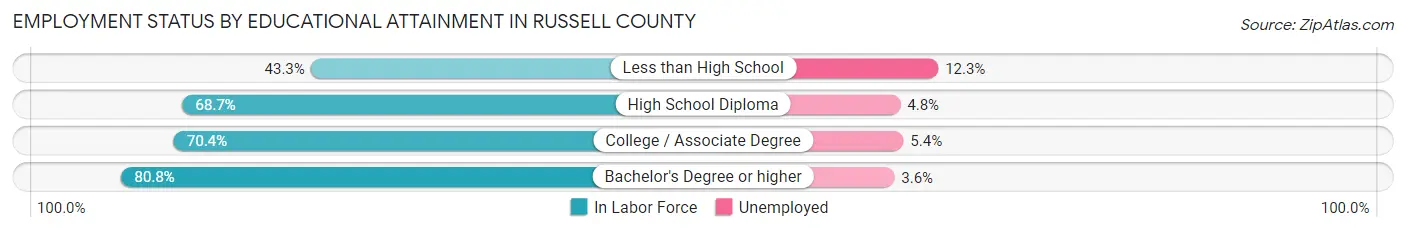
| Educational Attainment | In Labor Force | Unemployed |
| Less than High School | 1,616 (43.3%) | 459 (12.3%) |
| High School Diploma | 6,190 (68.7%) | 432 (4.8%) |
| College / Associate Degree | 9,221 (70.4%) | 707 (5.4%) |
| Bachelor's Degree or higher | 4,248 (80.8%) | 189 (3.6%) |
| Total | 21,272 (68.4%) | 1,679 (5.4%) |
Employment Occupations by Sex in Russell County
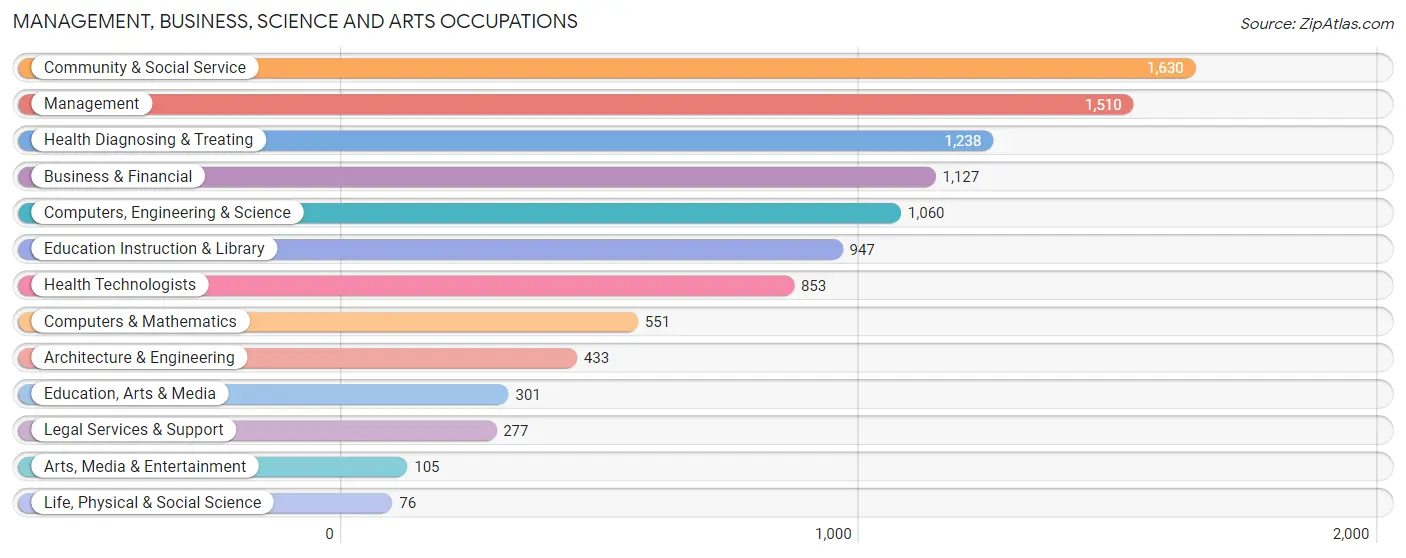
Management, Business, Science and Arts Occupations
The most common Management, Business, Science and Arts occupations in Russell County are Community & Social Service (1,630 | 7.2%), Management (1,510 | 6.7%), Health Diagnosing & Treating (1,238 | 5.5%), Business & Financial (1,127 | 5.0%), and Computers, Engineering & Science (1,060 | 4.7%).
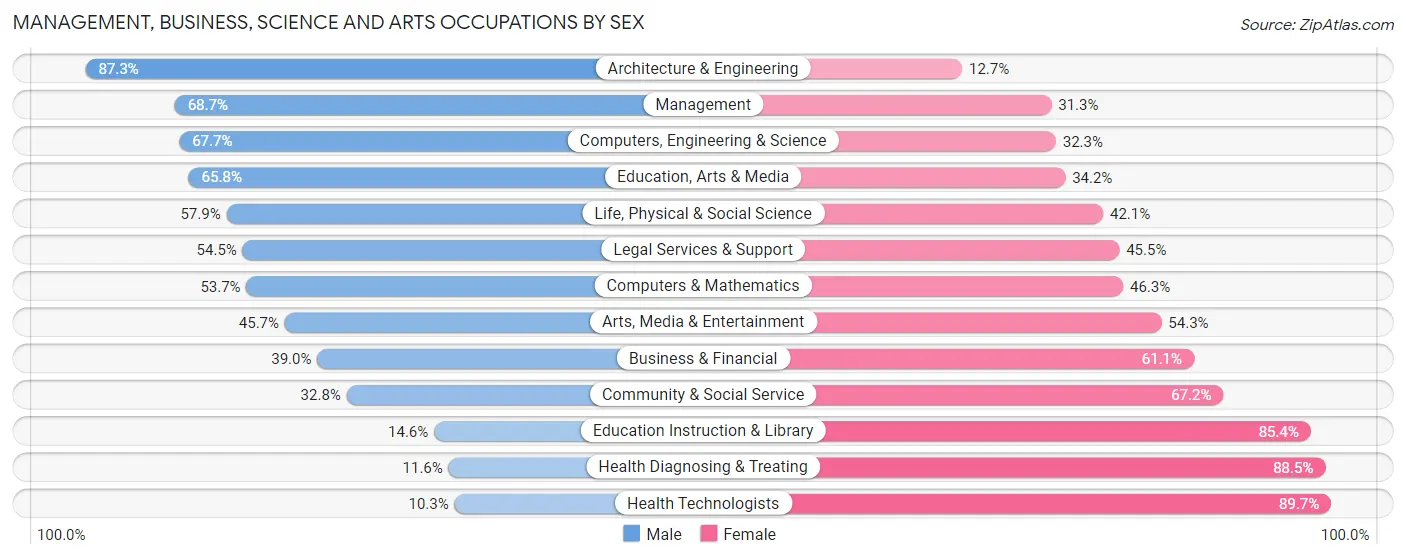
Management, Business, Science and Arts Occupations by Sex
Within the Management, Business, Science and Arts occupations in Russell County, the most male-oriented occupations are Architecture & Engineering (87.3%), Management (68.7%), and Computers, Engineering & Science (67.7%), while the most female-oriented occupations are Health Technologists (89.7%), Health Diagnosing & Treating (88.4%), and Education Instruction & Library (85.4%).
| Occupation | Male | Female |
| Management | 1,037 (68.7%) | 473 (31.3%) |
| Business & Financial | 439 (39.0%) | 688 (61.1%) |
| Computers, Engineering & Science | 718 (67.7%) | 342 (32.3%) |
| Computers & Mathematics | 296 (53.7%) | 255 (46.3%) |
| Architecture & Engineering | 378 (87.3%) | 55 (12.7%) |
| Life, Physical & Social Science | 44 (57.9%) | 32 (42.1%) |
| Community & Social Service | 535 (32.8%) | 1,095 (67.2%) |
| Education, Arts & Media | 198 (65.8%) | 103 (34.2%) |
| Legal Services & Support | 151 (54.5%) | 126 (45.5%) |
| Education Instruction & Library | 138 (14.6%) | 809 (85.4%) |
| Arts, Media & Entertainment | 48 (45.7%) | 57 (54.3%) |
| Health Diagnosing & Treating | 143 (11.6%) | 1,095 (88.4%) |
| Health Technologists | 88 (10.3%) | 765 (89.7%) |
| Total (Category) | 2,872 (43.8%) | 3,693 (56.2%) |
| Total (Overall) | 11,399 (50.4%) | 11,196 (49.5%) |
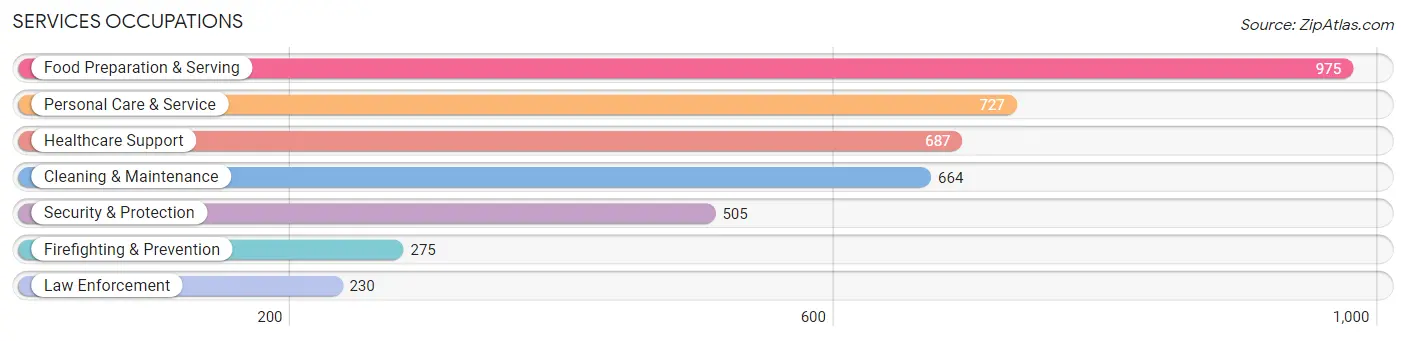
Services Occupations
The most common Services occupations in Russell County are Food Preparation & Serving (975 | 4.3%), Personal Care & Service (727 | 3.2%), Healthcare Support (687 | 3.0%), Cleaning & Maintenance (664 | 2.9%), and Security & Protection (505 | 2.2%).
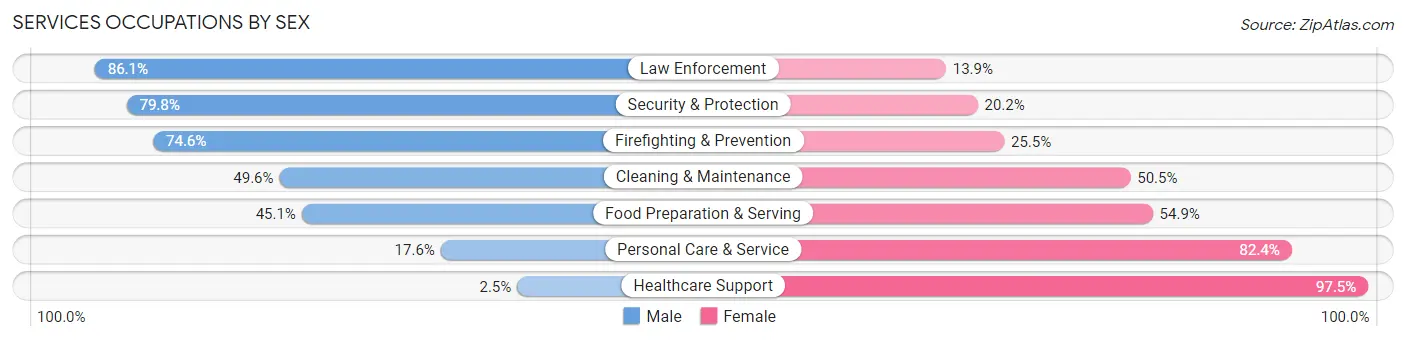
Services Occupations by Sex
Within the Services occupations in Russell County, the most male-oriented occupations are Law Enforcement (86.1%), Security & Protection (79.8%), and Firefighting & Prevention (74.6%), while the most female-oriented occupations are Healthcare Support (97.5%), Personal Care & Service (82.4%), and Food Preparation & Serving (54.9%).
| Occupation | Male | Female |
| Healthcare Support | 17 (2.5%) | 670 (97.5%) |
| Security & Protection | 403 (79.8%) | 102 (20.2%) |
| Firefighting & Prevention | 205 (74.6%) | 70 (25.5%) |
| Law Enforcement | 198 (86.1%) | 32 (13.9%) |
| Food Preparation & Serving | 440 (45.1%) | 535 (54.9%) |
| Cleaning & Maintenance | 329 (49.5%) | 335 (50.4%) |
| Personal Care & Service | 128 (17.6%) | 599 (82.4%) |
| Total (Category) | 1,317 (37.0%) | 2,241 (63.0%) |
| Total (Overall) | 11,399 (50.4%) | 11,196 (49.5%) |
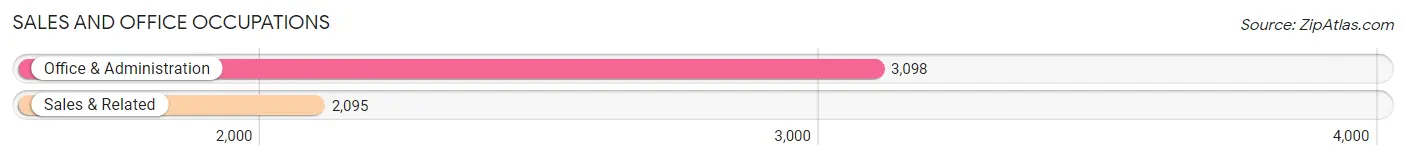
Sales and Office Occupations
The most common Sales and Office occupations in Russell County are Office & Administration (3,098 | 13.7%), and Sales & Related (2,095 | 9.3%).
Sales and Office Occupations by Sex
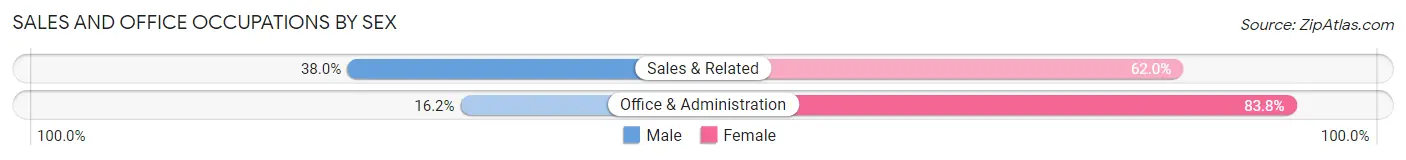
| Occupation | Male | Female |
| Sales & Related | 796 (38.0%) | 1,299 (62.0%) |
| Office & Administration | 502 (16.2%) | 2,596 (83.8%) |
| Total (Category) | 1,298 (25.0%) | 3,895 (75.0%) |
| Total (Overall) | 11,399 (50.4%) | 11,196 (49.5%) |
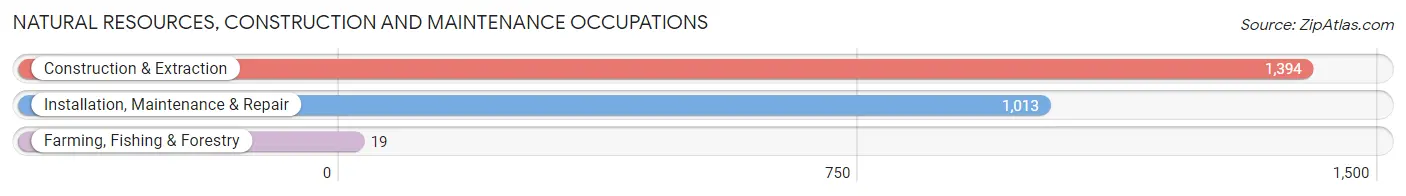
Natural Resources, Construction and Maintenance Occupations
The most common Natural Resources, Construction and Maintenance occupations in Russell County are Construction & Extraction (1,394 | 6.2%), Installation, Maintenance & Repair (1,013 | 4.5%), and Farming, Fishing & Forestry (19 | 0.1%).
Natural Resources, Construction and Maintenance Occupations by Sex
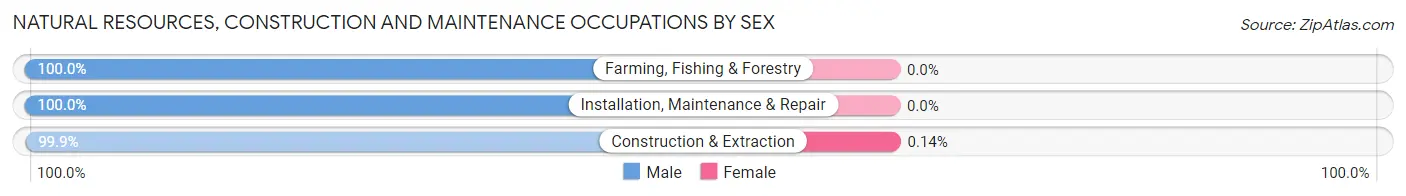
| Occupation | Male | Female |
| Farming, Fishing & Forestry | 19 (100.0%) | 0 (0.0%) |
| Construction & Extraction | 1,392 (99.9%) | 2 (0.1%) |
| Installation, Maintenance & Repair | 1,013 (100.0%) | 0 (0.0%) |
| Total (Category) | 2,424 (99.9%) | 2 (0.1%) |
| Total (Overall) | 11,399 (50.4%) | 11,196 (49.5%) |
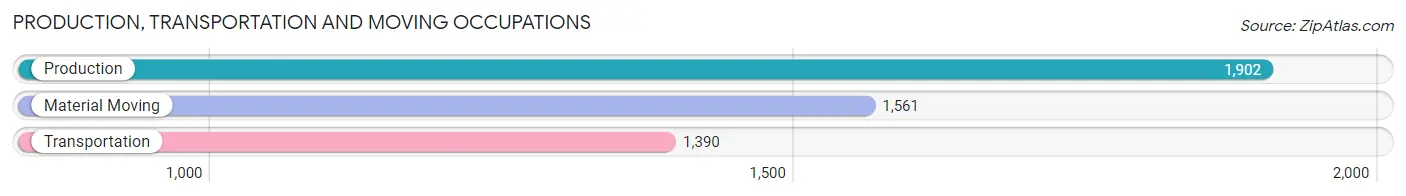
Production, Transportation and Moving Occupations
The most common Production, Transportation and Moving occupations in Russell County are Production (1,902 | 8.4%), Material Moving (1,561 | 6.9%), and Transportation (1,390 | 6.1%).
Production, Transportation and Moving Occupations by Sex
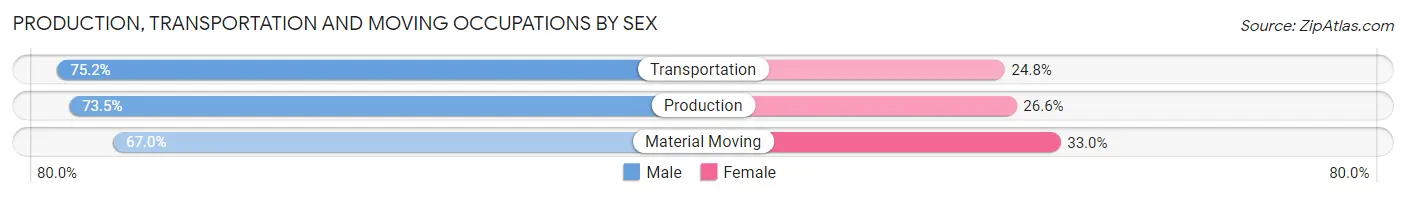
| Occupation | Male | Female |
| Production | 1,397 (73.5%) | 505 (26.6%) |
| Transportation | 1,045 (75.2%) | 345 (24.8%) |
| Material Moving | 1,046 (67.0%) | 515 (33.0%) |
| Total (Category) | 3,488 (71.9%) | 1,365 (28.1%) |
| Total (Overall) | 11,399 (50.4%) | 11,196 (49.5%) |
Employment Industries by Sex in Russell County
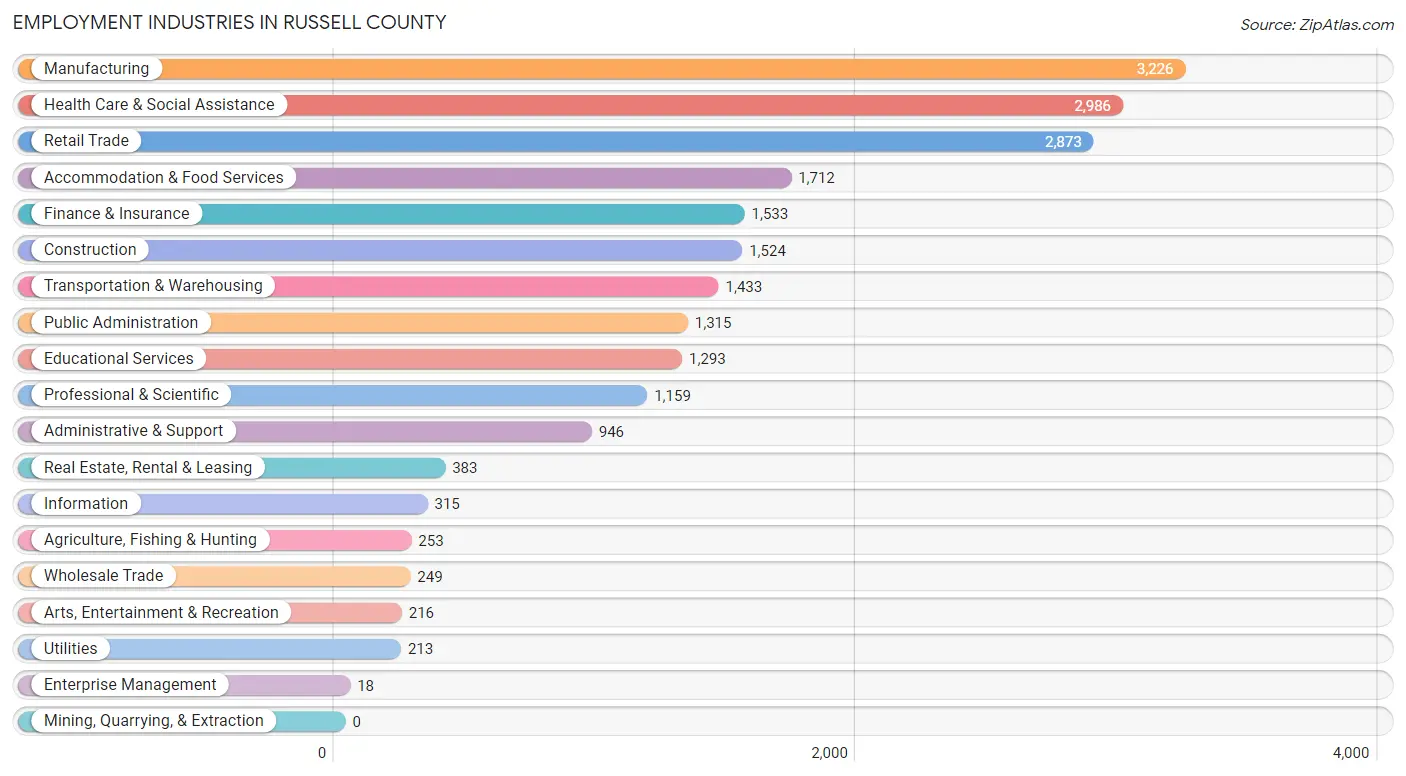
Employment Industries in Russell County
The major employment industries in Russell County include Manufacturing (3,226 | 14.3%), Health Care & Social Assistance (2,986 | 13.2%), Retail Trade (2,873 | 12.7%), Accommodation & Food Services (1,712 | 7.6%), and Finance & Insurance (1,533 | 6.8%).
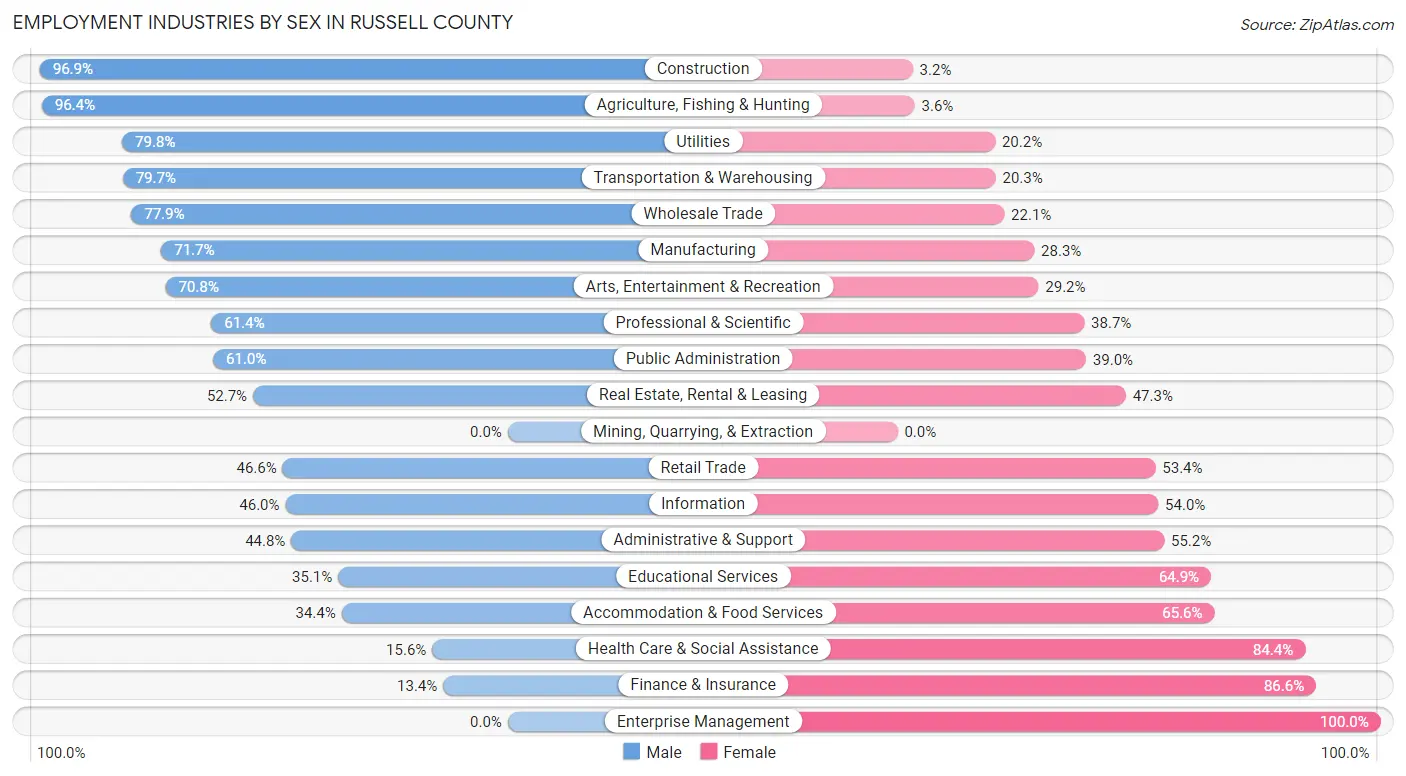
Employment Industries by Sex in Russell County
The Russell County industries that see more men than women are Construction (96.9%), Agriculture, Fishing & Hunting (96.4%), and Utilities (79.8%), whereas the industries that tend to have a higher number of women are Enterprise Management (100.0%), Finance & Insurance (86.6%), and Health Care & Social Assistance (84.4%).
| Industry | Male | Female |
| Agriculture, Fishing & Hunting | 244 (96.4%) | 9 (3.6%) |
| Mining, Quarrying, & Extraction | 0 (0.0%) | 0 (0.0%) |
| Construction | 1,476 (96.9%) | 48 (3.2%) |
| Manufacturing | 2,313 (71.7%) | 913 (28.3%) |
| Wholesale Trade | 194 (77.9%) | 55 (22.1%) |
| Retail Trade | 1,339 (46.6%) | 1,534 (53.4%) |
| Transportation & Warehousing | 1,142 (79.7%) | 291 (20.3%) |
| Utilities | 170 (79.8%) | 43 (20.2%) |
| Information | 145 (46.0%) | 170 (54.0%) |
| Finance & Insurance | 205 (13.4%) | 1,328 (86.6%) |
| Real Estate, Rental & Leasing | 202 (52.7%) | 181 (47.3%) |
| Professional & Scientific | 711 (61.4%) | 448 (38.7%) |
| Enterprise Management | 0 (0.0%) | 18 (100.0%) |
| Administrative & Support | 424 (44.8%) | 522 (55.2%) |
| Educational Services | 454 (35.1%) | 839 (64.9%) |
| Health Care & Social Assistance | 467 (15.6%) | 2,519 (84.4%) |
| Arts, Entertainment & Recreation | 153 (70.8%) | 63 (29.2%) |
| Accommodation & Food Services | 589 (34.4%) | 1,123 (65.6%) |
| Public Administration | 802 (61.0%) | 513 (39.0%) |
| Total | 11,399 (50.4%) | 11,196 (49.5%) |
Education in Russell County
School Enrollment in Russell County
The most common levels of schooling among the 15,415 students in Russell County are middle school (3,325 | 21.6%), high school (3,318 | 21.5%), and college / undergraduate (3,277 | 21.3%).
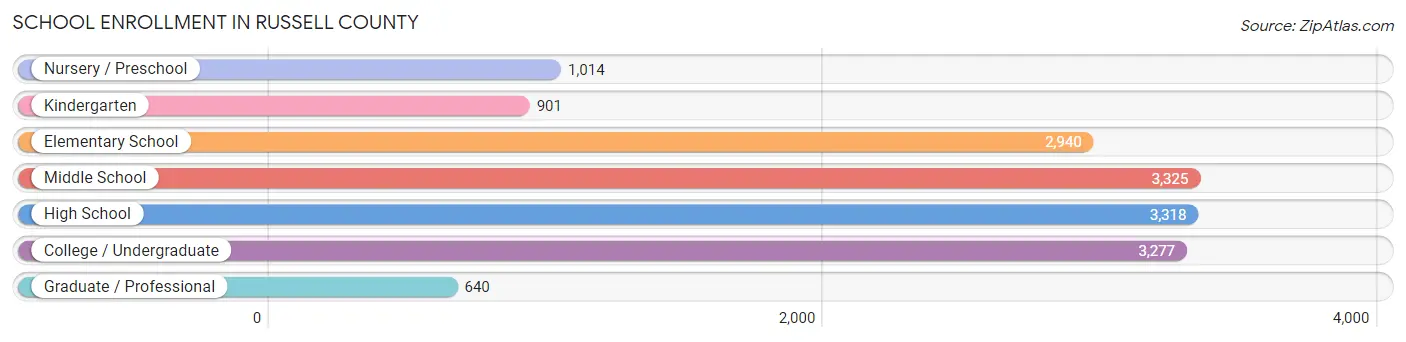
| School Level | # Students | % Students |
| Nursery / Preschool | 1,014 | 6.6% |
| Kindergarten | 901 | 5.8% |
| Elementary School | 2,940 | 19.1% |
| Middle School | 3,325 | 21.6% |
| High School | 3,318 | 21.5% |
| College / Undergraduate | 3,277 | 21.3% |
| Graduate / Professional | 640 | 4.2% |
| Total | 15,415 | 100.0% |
School Enrollment by Age by Funding Source in Russell County
Out of a total of 15,415 students who are enrolled in schools in Russell County, 1,973 (12.8%) attend a private institution, while the remaining 13,442 (87.2%) are enrolled in public schools. The age group of 25 to 34 year olds has the highest likelihood of being enrolled in private schools, with 424 (28.9% in the age bracket) enrolled. Conversely, the age group of 18 to 19 year olds has the lowest likelihood of being enrolled in a private school, with 807 (98.8% in the age bracket) attending a public institution.
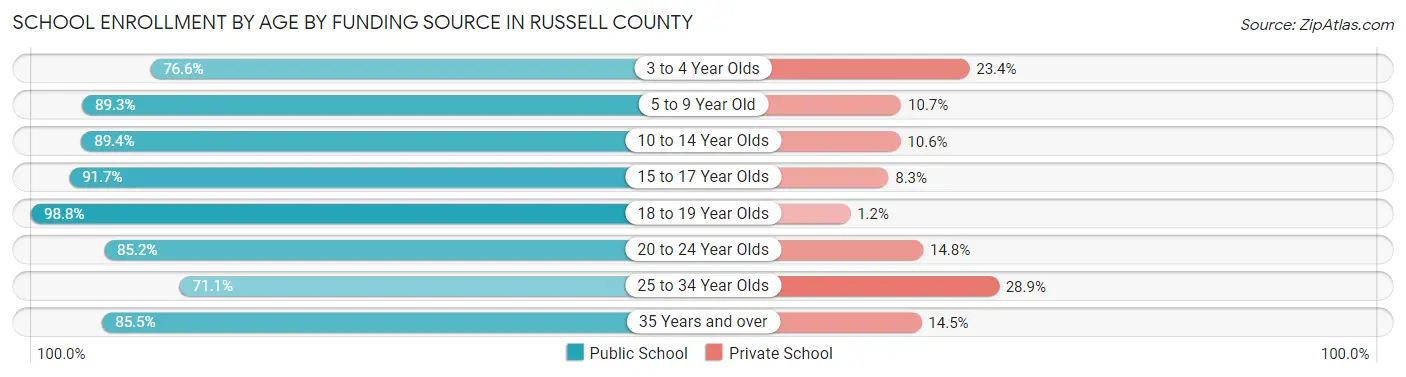
| Age Bracket | Public School | Private School |
| 3 to 4 Year Olds | 491 (76.6%) | 150 (23.4%) |
| 5 to 9 Year Old | 3,271 (89.3%) | 392 (10.7%) |
| 10 to 14 Year Olds | 3,628 (89.4%) | 429 (10.6%) |
| 15 to 17 Year Olds | 1,942 (91.7%) | 176 (8.3%) |
| 18 to 19 Year Olds | 807 (98.8%) | 10 (1.2%) |
| 20 to 24 Year Olds | 841 (85.2%) | 146 (14.8%) |
| 25 to 34 Year Olds | 1,044 (71.1%) | 424 (28.9%) |
| 35 Years and over | 1,423 (85.5%) | 241 (14.5%) |
| Total | 13,442 (87.2%) | 1,973 (12.8%) |
Educational Attainment by Field of Study in Russell County
Business (1,629 | 23.8%), science & technology (1,052 | 15.3%), education (1,014 | 14.8%), arts & humanities (992 | 14.5%), and bio, nature & agricultural (396 | 5.8%) are the most common fields of study among 6,852 individuals in Russell County who have obtained a bachelor's degree or higher.
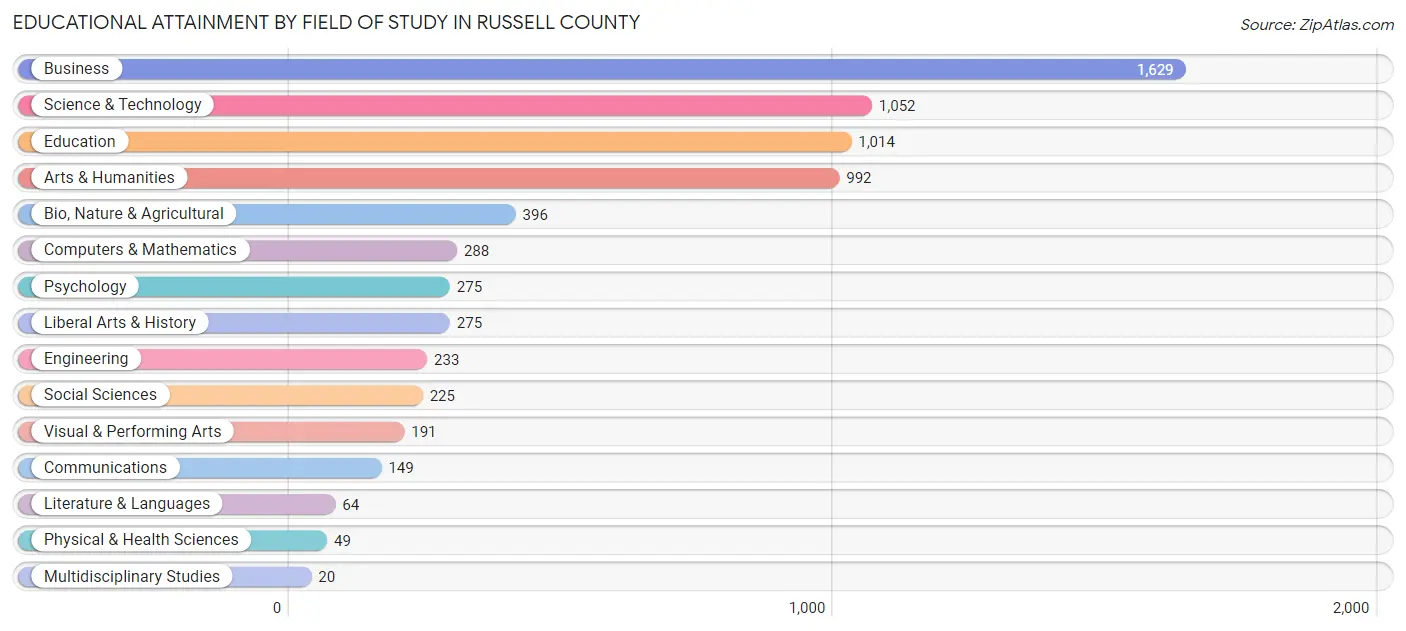
| Field of Study | # Graduates | % Graduates |
| Computers & Mathematics | 288 | 4.2% |
| Bio, Nature & Agricultural | 396 | 5.8% |
| Physical & Health Sciences | 49 | 0.7% |
| Psychology | 275 | 4.0% |
| Social Sciences | 225 | 3.3% |
| Engineering | 233 | 3.4% |
| Multidisciplinary Studies | 20 | 0.3% |
| Science & Technology | 1,052 | 15.3% |
| Business | 1,629 | 23.8% |
| Education | 1,014 | 14.8% |
| Literature & Languages | 64 | 0.9% |
| Liberal Arts & History | 275 | 4.0% |
| Visual & Performing Arts | 191 | 2.8% |
| Communications | 149 | 2.2% |
| Arts & Humanities | 992 | 14.5% |
| Total | 6,852 | 100.0% |
Transportation & Commute in Russell County
Vehicle Availability by Sex in Russell County
The most prevalent vehicle ownership categories in Russell County are males with 2 vehicles (4,718, accounting for 37.7%) and females with 2 vehicles (3,900, making up 42.8%).
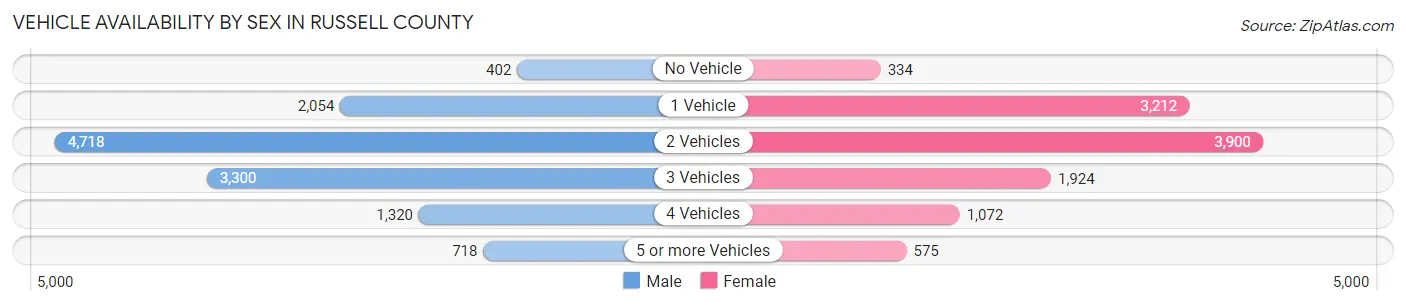
| Vehicles Available | Male | Female |
| No Vehicle | 402 (3.2%) | 334 (3.0%) |
| 1 Vehicle | 2,054 (16.4%) | 3,212 (29.1%) |
| 2 Vehicles | 4,718 (37.7%) | 3,900 (35.4%) |
| 3 Vehicles | 3,300 (26.4%) | 1,924 (17.5%) |
| 4 Vehicles | 1,320 (10.5%) | 1,072 (9.7%) |
| 5 or more Vehicles | 718 (5.7%) | 575 (5.2%) |
| Total | 12,512 (100.0%) | 11,017 (100.0%) |
Commute Time in Russell County
The most frequently occuring commute durations in Russell County are 20 to 24 minutes (3,870 commuters, 17.5%), 15 to 19 minutes (3,760 commuters, 17.0%), and 30 to 34 minutes (3,498 commuters, 15.8%).
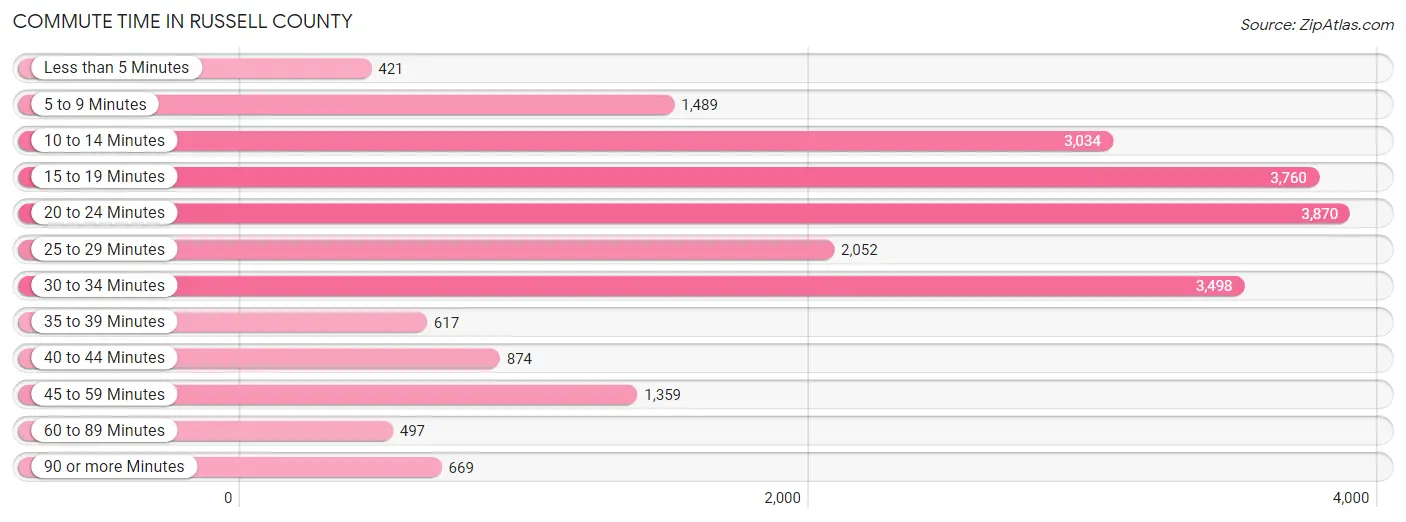
| Commute Time | # Commuters | % Commuters |
| Less than 5 Minutes | 421 | 1.9% |
| 5 to 9 Minutes | 1,489 | 6.7% |
| 10 to 14 Minutes | 3,034 | 13.7% |
| 15 to 19 Minutes | 3,760 | 17.0% |
| 20 to 24 Minutes | 3,870 | 17.5% |
| 25 to 29 Minutes | 2,052 | 9.3% |
| 30 to 34 Minutes | 3,498 | 15.8% |
| 35 to 39 Minutes | 617 | 2.8% |
| 40 to 44 Minutes | 874 | 4.0% |
| 45 to 59 Minutes | 1,359 | 6.1% |
| 60 to 89 Minutes | 497 | 2.2% |
| 90 or more Minutes | 669 | 3.0% |
Commute Time by Sex in Russell County
The most common commute times in Russell County are 30 to 34 minutes (2,196 commuters, 18.1%) for males and 20 to 24 minutes (1,812 commuters, 18.1%) for females.
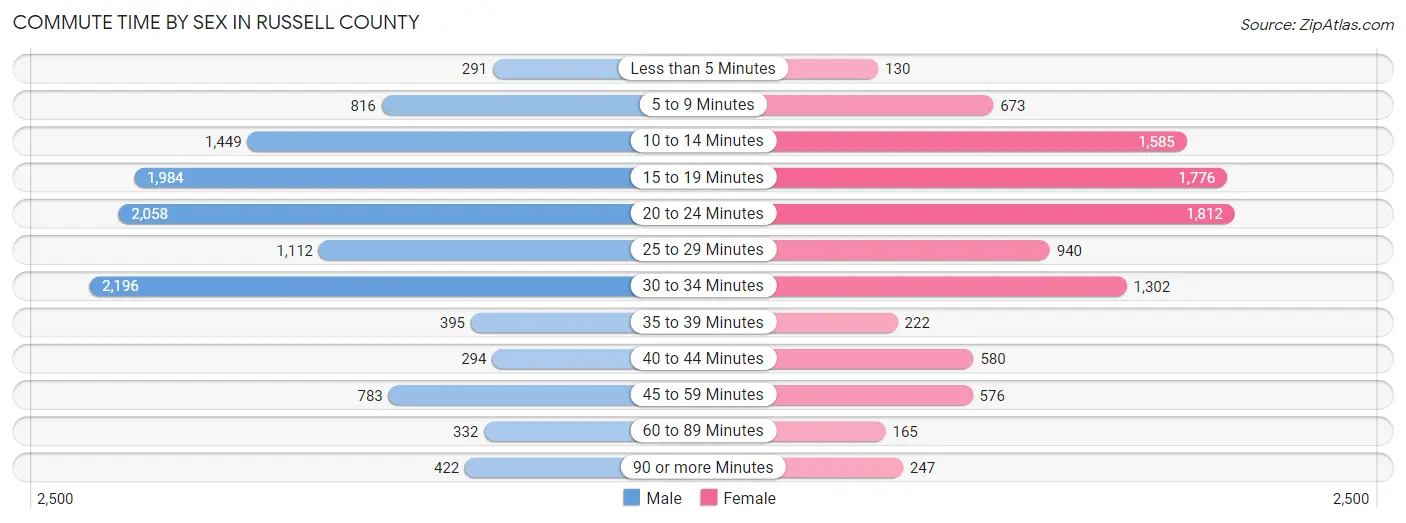
| Commute Time | Male | Female |
| Less than 5 Minutes | 291 (2.4%) | 130 (1.3%) |
| 5 to 9 Minutes | 816 (6.7%) | 673 (6.7%) |
| 10 to 14 Minutes | 1,449 (11.9%) | 1,585 (15.8%) |
| 15 to 19 Minutes | 1,984 (16.4%) | 1,776 (17.7%) |
| 20 to 24 Minutes | 2,058 (17.0%) | 1,812 (18.1%) |
| 25 to 29 Minutes | 1,112 (9.2%) | 940 (9.4%) |
| 30 to 34 Minutes | 2,196 (18.1%) | 1,302 (13.0%) |
| 35 to 39 Minutes | 395 (3.3%) | 222 (2.2%) |
| 40 to 44 Minutes | 294 (2.4%) | 580 (5.8%) |
| 45 to 59 Minutes | 783 (6.5%) | 576 (5.8%) |
| 60 to 89 Minutes | 332 (2.7%) | 165 (1.7%) |
| 90 or more Minutes | 422 (3.5%) | 247 (2.5%) |
Time of Departure to Work by Sex in Russell County
The most frequent times of departure to work in Russell County are 7:00 AM to 7:29 AM (1,732, 14.3%) for males and 7:00 AM to 7:29 AM (1,865, 18.6%) for females.
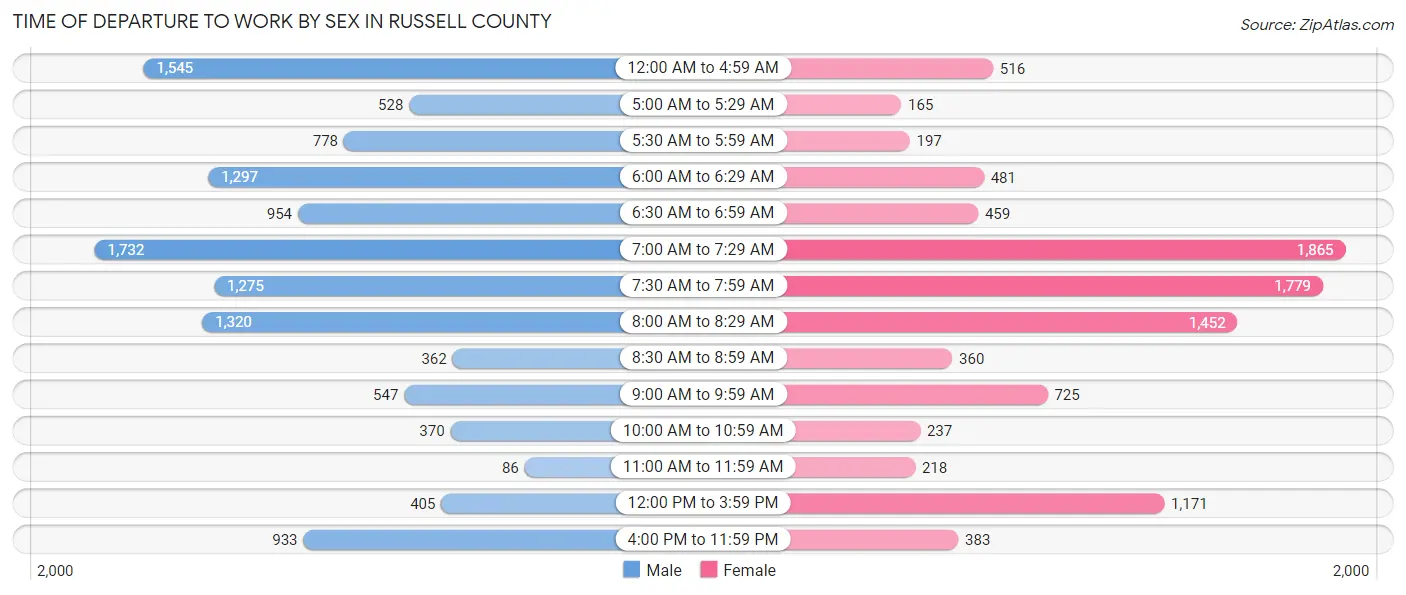
| Time of Departure | Male | Female |
| 12:00 AM to 4:59 AM | 1,545 (12.7%) | 516 (5.2%) |
| 5:00 AM to 5:29 AM | 528 (4.3%) | 165 (1.7%) |
| 5:30 AM to 5:59 AM | 778 (6.4%) | 197 (2.0%) |
| 6:00 AM to 6:29 AM | 1,297 (10.7%) | 481 (4.8%) |
| 6:30 AM to 6:59 AM | 954 (7.9%) | 459 (4.6%) |
| 7:00 AM to 7:29 AM | 1,732 (14.3%) | 1,865 (18.6%) |
| 7:30 AM to 7:59 AM | 1,275 (10.5%) | 1,779 (17.8%) |
| 8:00 AM to 8:29 AM | 1,320 (10.9%) | 1,452 (14.5%) |
| 8:30 AM to 8:59 AM | 362 (3.0%) | 360 (3.6%) |
| 9:00 AM to 9:59 AM | 547 (4.5%) | 725 (7.2%) |
| 10:00 AM to 10:59 AM | 370 (3.0%) | 237 (2.4%) |
| 11:00 AM to 11:59 AM | 86 (0.7%) | 218 (2.2%) |
| 12:00 PM to 3:59 PM | 405 (3.3%) | 1,171 (11.7%) |
| 4:00 PM to 11:59 PM | 933 (7.7%) | 383 (3.8%) |
| Total | 12,132 (100.0%) | 10,008 (100.0%) |
Housing Occupancy in Russell County
Occupancy by Ownership in Russell County
Of the total 23,462 dwellings in Russell County, owner-occupied units account for 14,351 (61.2%), while renter-occupied units make up 9,111 (38.8%).
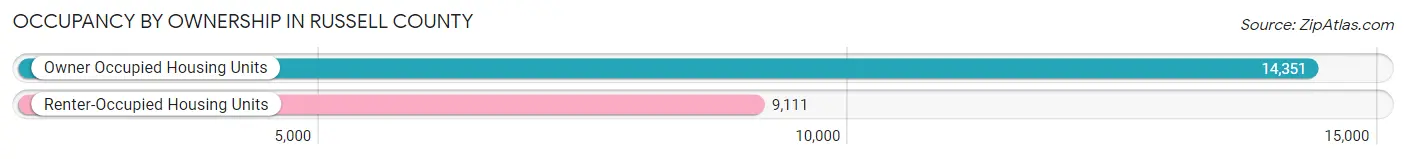
| Occupancy | # Housing Units | % Housing Units |
| Owner Occupied Housing Units | 14,351 | 61.2% |
| Renter-Occupied Housing Units | 9,111 | 38.8% |
| Total Occupied Housing Units | 23,462 | 100.0% |
Occupancy by Household Size in Russell County
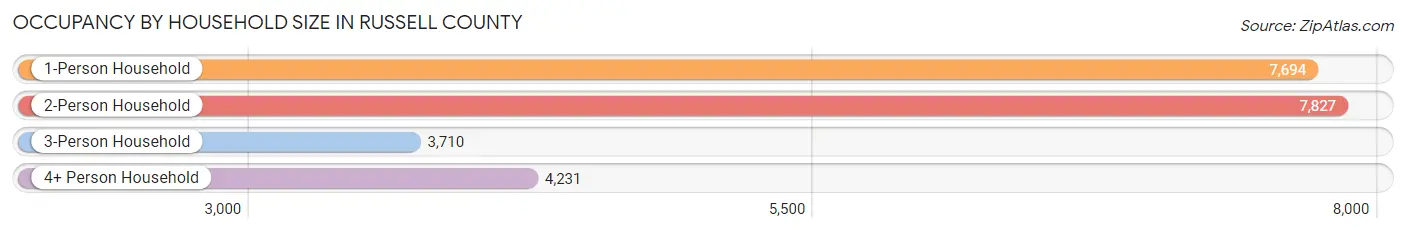
| Household Size | # Housing Units | % Housing Units |
| 1-Person Household | 7,694 | 32.8% |
| 2-Person Household | 7,827 | 33.4% |
| 3-Person Household | 3,710 | 15.8% |
| 4+ Person Household | 4,231 | 18.0% |
| Total Housing Units | 23,462 | 100.0% |
Occupancy by Ownership by Household Size in Russell County
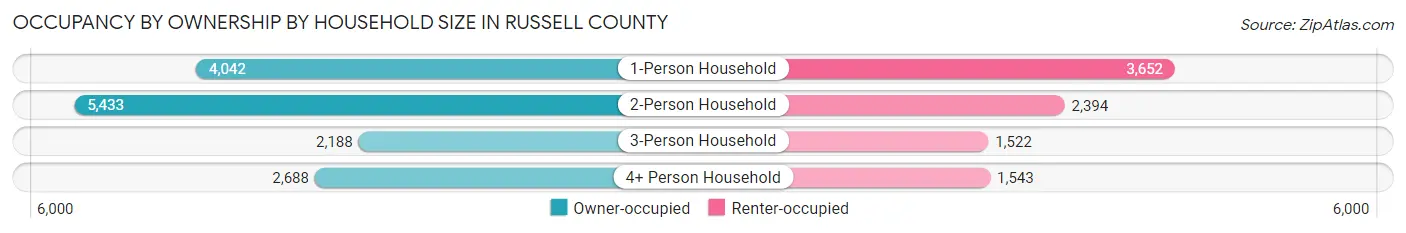
| Household Size | Owner-occupied | Renter-occupied |
| 1-Person Household | 4,042 (52.5%) | 3,652 (47.5%) |
| 2-Person Household | 5,433 (69.4%) | 2,394 (30.6%) |
| 3-Person Household | 2,188 (59.0%) | 1,522 (41.0%) |
| 4+ Person Household | 2,688 (63.5%) | 1,543 (36.5%) |
| Total Housing Units | 14,351 (61.2%) | 9,111 (38.8%) |
Occupancy by Educational Attainment in Russell County
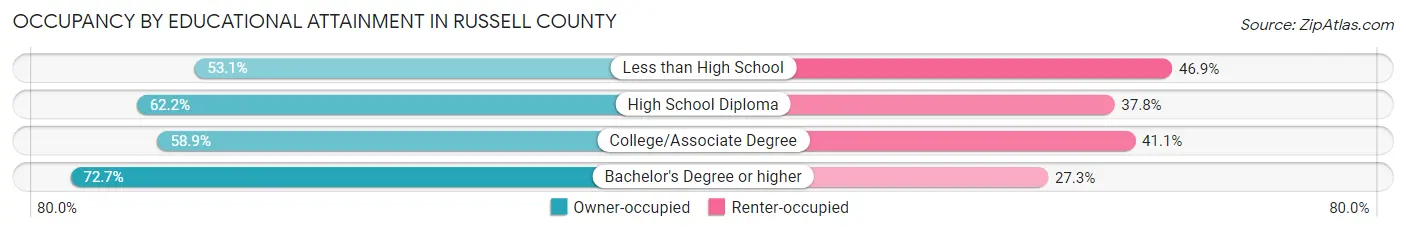
| Household Size | Owner-occupied | Renter-occupied |
| Less than High School | 1,962 (53.1%) | 1,735 (46.9%) |
| High School Diploma | 3,975 (62.2%) | 2,415 (37.8%) |
| College/Associate Degree | 5,604 (58.9%) | 3,908 (41.1%) |
| Bachelor's Degree or higher | 2,810 (72.7%) | 1,053 (27.3%) |
Occupancy by Age of Householder in Russell County
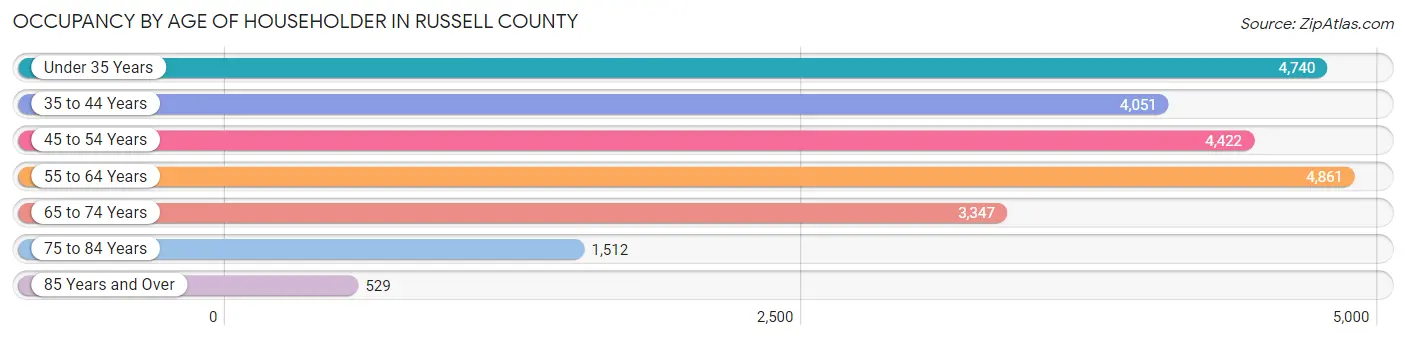
| Age Bracket | # Households | % Households |
| Under 35 Years | 4,740 | 20.2% |
| 35 to 44 Years | 4,051 | 17.3% |
| 45 to 54 Years | 4,422 | 18.9% |
| 55 to 64 Years | 4,861 | 20.7% |
| 65 to 74 Years | 3,347 | 14.3% |
| 75 to 84 Years | 1,512 | 6.4% |
| 85 Years and Over | 529 | 2.2% |
| Total | 23,462 | 100.0% |
Housing Finances in Russell County
Median Income by Occupancy in Russell County
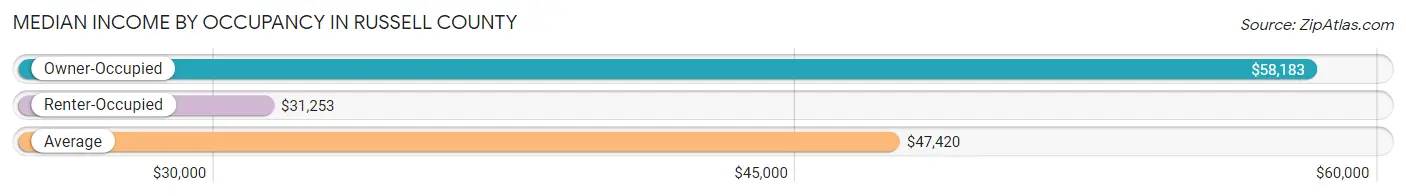
| Occupancy Type | # Households | Median Income |
| Owner-Occupied | 14,351 (61.2%) | $58,183 |
| Renter-Occupied | 9,111 (38.8%) | $31,253 |
| Average | 23,462 (100.0%) | $47,420 |
Occupancy by Householder Income Bracket in Russell County
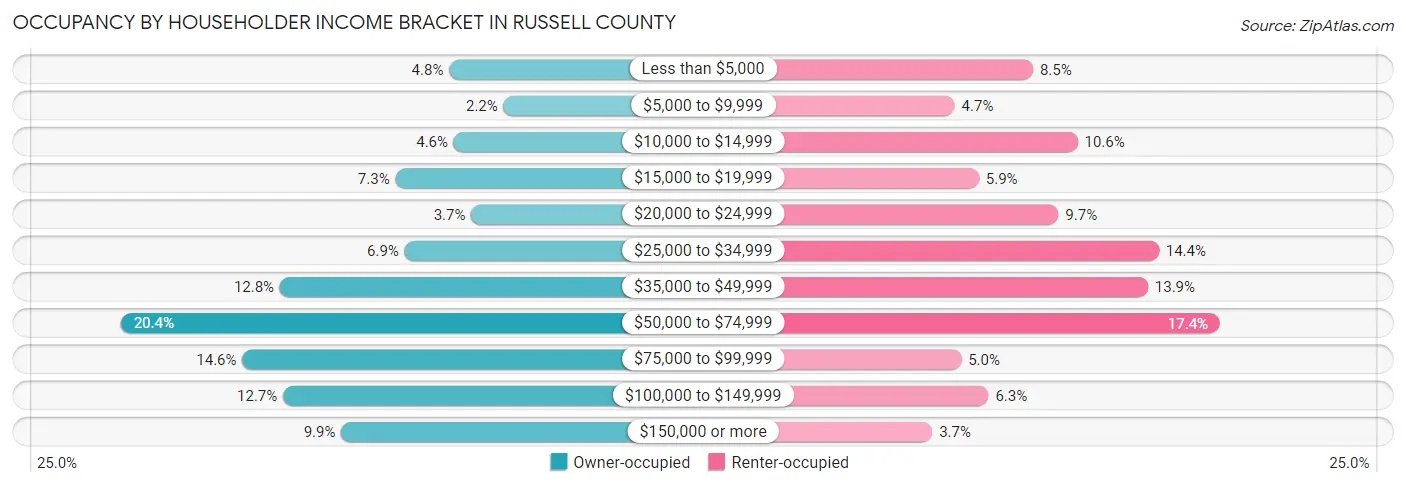
| Income Bracket | Owner-occupied | Renter-occupied |
| Less than $5,000 | 686 (4.8%) | 770 (8.5%) |
| $5,000 to $9,999 | 314 (2.2%) | 430 (4.7%) |
| $10,000 to $14,999 | 654 (4.6%) | 963 (10.6%) |
| $15,000 to $19,999 | 1,053 (7.3%) | 535 (5.9%) |
| $20,000 to $24,999 | 536 (3.7%) | 880 (9.7%) |
| $25,000 to $34,999 | 990 (6.9%) | 1,316 (14.4%) |
| $35,000 to $49,999 | 1,843 (12.8%) | 1,268 (13.9%) |
| $50,000 to $74,999 | 2,930 (20.4%) | 1,581 (17.3%) |
| $75,000 to $99,999 | 2,100 (14.6%) | 458 (5.0%) |
| $100,000 to $149,999 | 1,821 (12.7%) | 577 (6.3%) |
| $150,000 or more | 1,424 (9.9%) | 333 (3.6%) |
| Total | 14,351 (100.0%) | 9,111 (100.0%) |
Monthly Housing Cost Tiers in Russell County
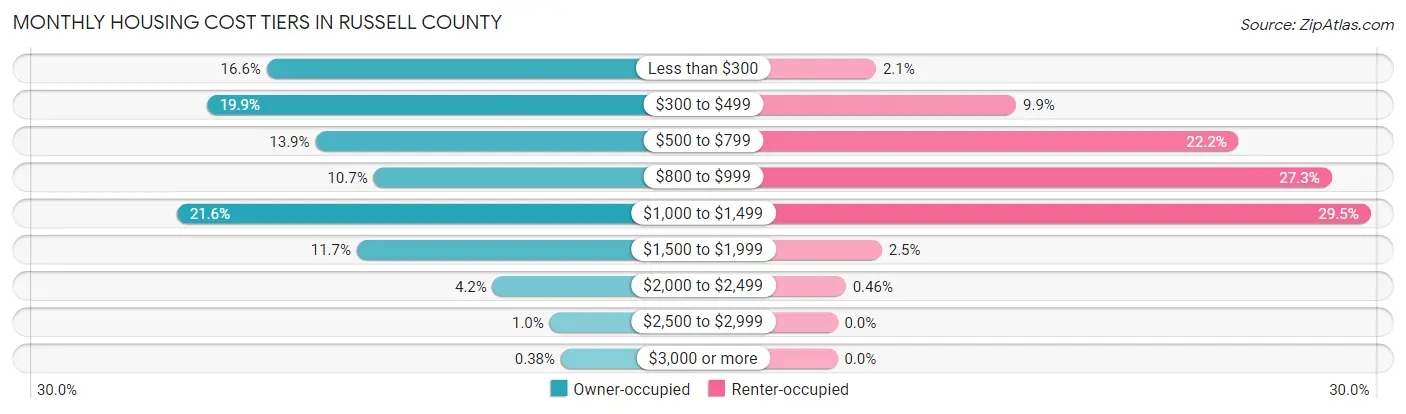
| Monthly Cost | Owner-occupied | Renter-occupied |
| Less than $300 | 2,387 (16.6%) | 194 (2.1%) |
| $300 to $499 | 2,862 (19.9%) | 899 (9.9%) |
| $500 to $799 | 2,000 (13.9%) | 2,019 (22.2%) |
| $800 to $999 | 1,540 (10.7%) | 2,486 (27.3%) |
| $1,000 to $1,499 | 3,098 (21.6%) | 2,683 (29.4%) |
| $1,500 to $1,999 | 1,672 (11.7%) | 223 (2.5%) |
| $2,000 to $2,499 | 595 (4.2%) | 42 (0.5%) |
| $2,500 to $2,999 | 143 (1.0%) | 0 (0.0%) |
| $3,000 or more | 54 (0.4%) | 0 (0.0%) |
| Total | 14,351 (100.0%) | 9,111 (100.0%) |
Physical Housing Characteristics in Russell County
Housing Structures in Russell County
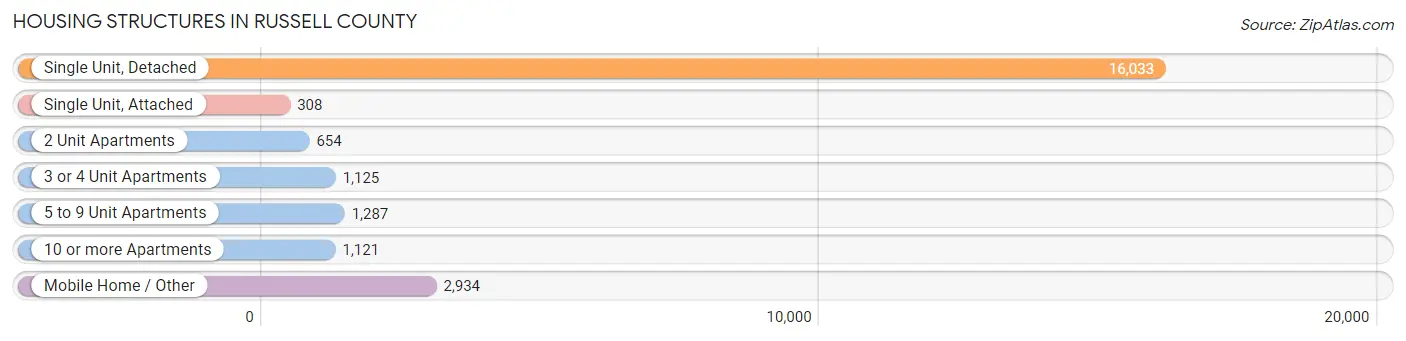
| Structure Type | # Housing Units | % Housing Units |
| Single Unit, Detached | 16,033 | 68.3% |
| Single Unit, Attached | 308 | 1.3% |
| 2 Unit Apartments | 654 | 2.8% |
| 3 or 4 Unit Apartments | 1,125 | 4.8% |
| 5 to 9 Unit Apartments | 1,287 | 5.5% |
| 10 or more Apartments | 1,121 | 4.8% |
| Mobile Home / Other | 2,934 | 12.5% |
| Total | 23,462 | 100.0% |
Housing Structures by Occupancy in Russell County
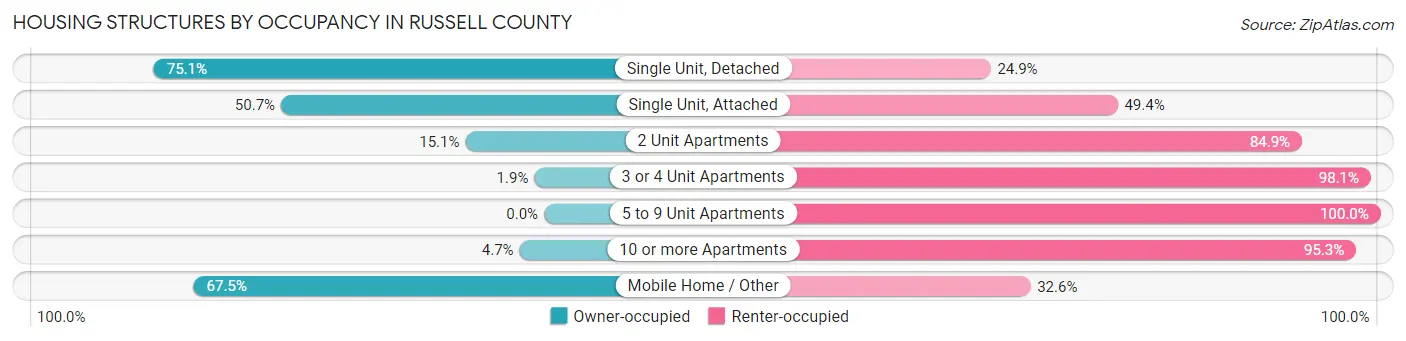
| Structure Type | Owner-occupied | Renter-occupied |
| Single Unit, Detached | 12,043 (75.1%) | 3,990 (24.9%) |
| Single Unit, Attached | 156 (50.6%) | 152 (49.3%) |
| 2 Unit Apartments | 99 (15.1%) | 555 (84.9%) |
| 3 or 4 Unit Apartments | 21 (1.9%) | 1,104 (98.1%) |
| 5 to 9 Unit Apartments | 0 (0.0%) | 1,287 (100.0%) |
| 10 or more Apartments | 53 (4.7%) | 1,068 (95.3%) |
| Mobile Home / Other | 1,979 (67.4%) | 955 (32.6%) |
| Total | 14,351 (61.2%) | 9,111 (38.8%) |
Housing Structures by Number of Rooms in Russell County
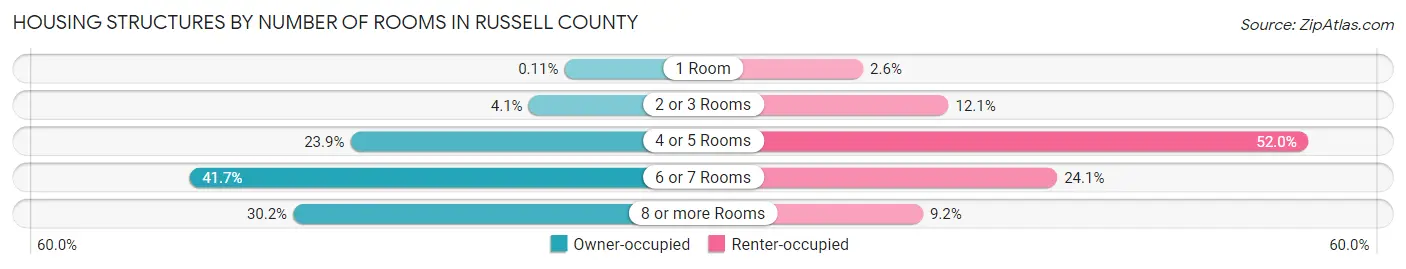
| Number of Rooms | Owner-occupied | Renter-occupied |
| 1 Room | 16 (0.1%) | 235 (2.6%) |
| 2 or 3 Rooms | 586 (4.1%) | 1,099 (12.1%) |
| 4 or 5 Rooms | 3,424 (23.9%) | 4,739 (52.0%) |
| 6 or 7 Rooms | 5,988 (41.7%) | 2,198 (24.1%) |
| 8 or more Rooms | 4,337 (30.2%) | 840 (9.2%) |
| Total | 14,351 (100.0%) | 9,111 (100.0%) |
Housing Structure by Heating Type in Russell County
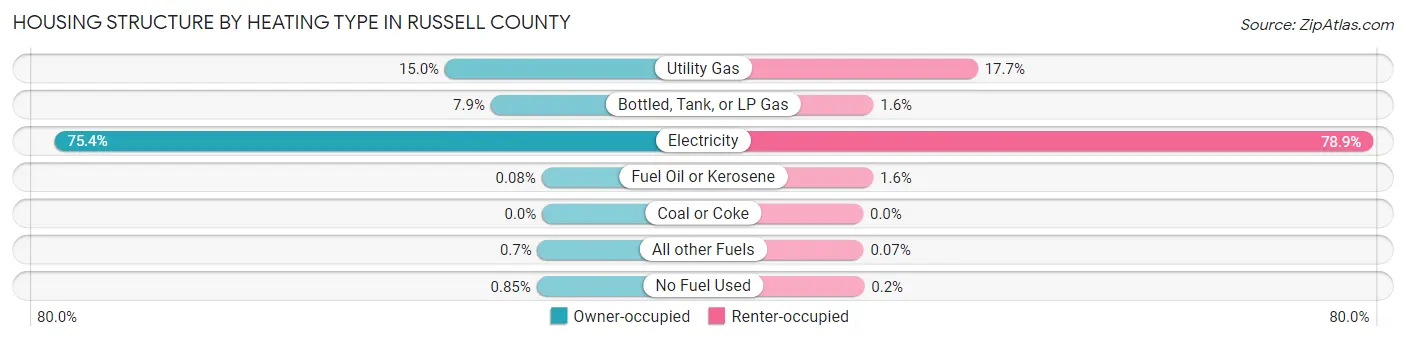
| Heating Type | Owner-occupied | Renter-occupied |
| Utility Gas | 2,155 (15.0%) | 1,615 (17.7%) |
| Bottled, Tank, or LP Gas | 1,140 (7.9%) | 145 (1.6%) |
| Electricity | 10,822 (75.4%) | 7,185 (78.9%) |
| Fuel Oil or Kerosene | 11 (0.1%) | 142 (1.6%) |
| Coal or Coke | 0 (0.0%) | 0 (0.0%) |
| All other Fuels | 101 (0.7%) | 6 (0.1%) |
| No Fuel Used | 122 (0.9%) | 18 (0.2%) |
| Total | 14,351 (100.0%) | 9,111 (100.0%) |
Household Vehicle Usage in Russell County
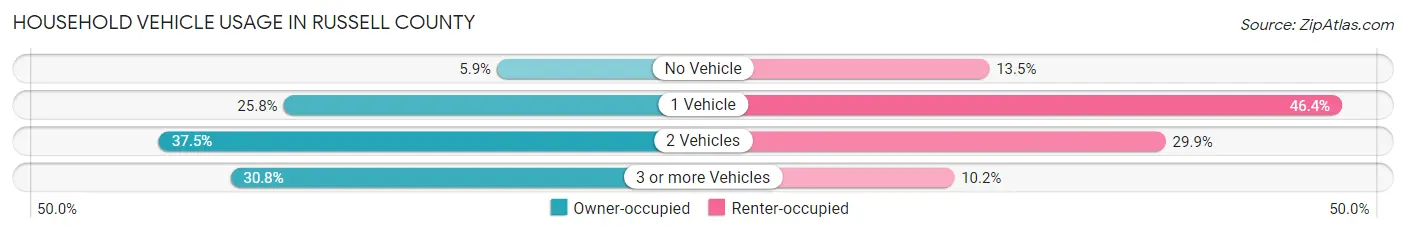
| Vehicles per Household | Owner-occupied | Renter-occupied |
| No Vehicle | 848 (5.9%) | 1,227 (13.5%) |
| 1 Vehicle | 3,708 (25.8%) | 4,227 (46.4%) |
| 2 Vehicles | 5,376 (37.5%) | 2,728 (29.9%) |
| 3 or more Vehicles | 4,419 (30.8%) | 929 (10.2%) |
| Total | 14,351 (100.0%) | 9,111 (100.0%) |
Real Estate & Mortgages in Russell County
Real Estate and Mortgage Overview in Russell County
| Characteristic | Without Mortgage | With Mortgage |
| Housing Units | 6,597 | 7,754 |
| Median Property Value | $102,600 | $177,000 |
| Median Household Income | $44,799 | $1,080 |
| Monthly Housing Costs | $362 | $54 |
| Real Estate Taxes | $436 | $1,012 |
Property Value by Mortgage Status in Russell County
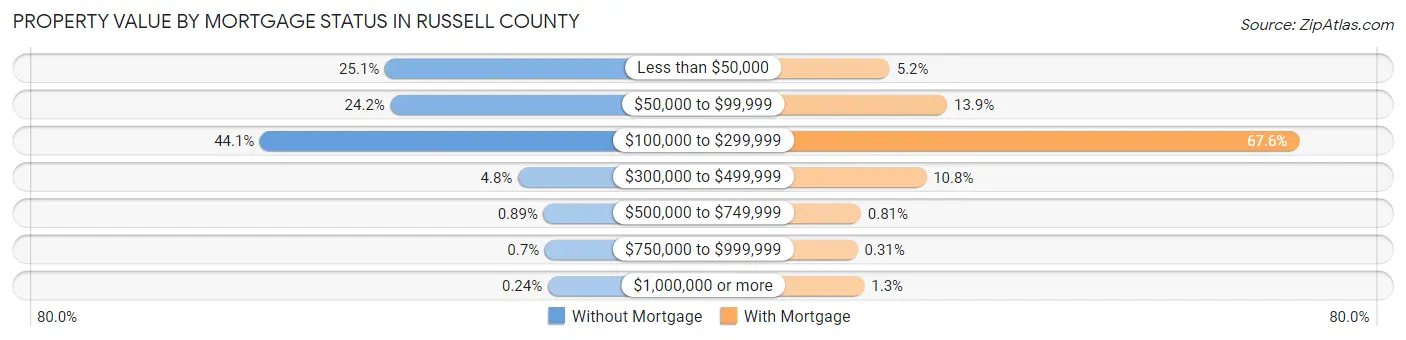
| Property Value | Without Mortgage | With Mortgage |
| Less than $50,000 | 1,653 (25.1%) | 405 (5.2%) |
| $50,000 to $99,999 | 1,598 (24.2%) | 1,081 (13.9%) |
| $100,000 to $299,999 | 2,909 (44.1%) | 5,242 (67.6%) |
| $300,000 to $499,999 | 316 (4.8%) | 835 (10.8%) |
| $500,000 to $749,999 | 59 (0.9%) | 63 (0.8%) |
| $750,000 to $999,999 | 46 (0.7%) | 24 (0.3%) |
| $1,000,000 or more | 16 (0.2%) | 104 (1.3%) |
| Total | 6,597 (100.0%) | 7,754 (100.0%) |
Household Income by Mortgage Status in Russell County
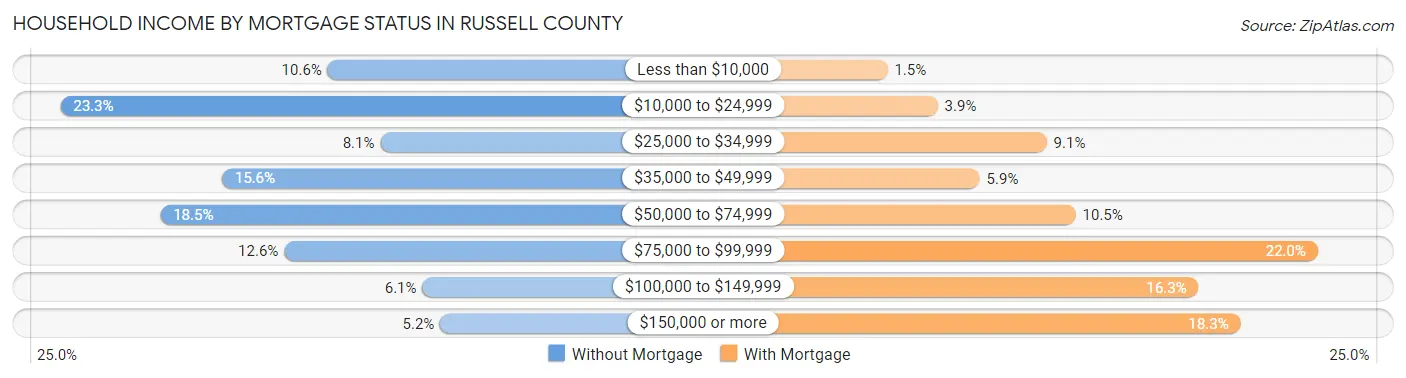
| Household Income | Without Mortgage | With Mortgage |
| Less than $10,000 | 697 (10.6%) | 118 (1.5%) |
| $10,000 to $24,999 | 1,537 (23.3%) | 303 (3.9%) |
| $25,000 to $34,999 | 532 (8.1%) | 706 (9.1%) |
| $35,000 to $49,999 | 1,030 (15.6%) | 458 (5.9%) |
| $50,000 to $74,999 | 1,223 (18.5%) | 813 (10.5%) |
| $75,000 to $99,999 | 834 (12.6%) | 1,707 (22.0%) |
| $100,000 to $149,999 | 400 (6.1%) | 1,266 (16.3%) |
| $150,000 or more | 344 (5.2%) | 1,421 (18.3%) |
| Total | 6,597 (100.0%) | 7,754 (100.0%) |
Property Value to Household Income Ratio in Russell County
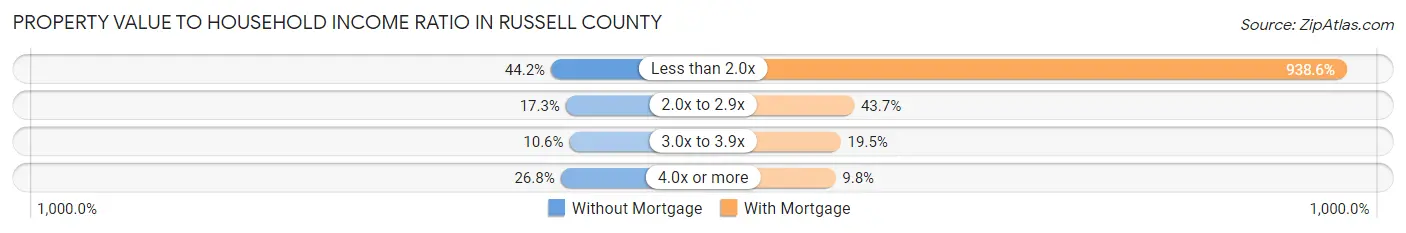
| Value-to-Income Ratio | Without Mortgage | With Mortgage |
| Less than 2.0x | 2,914 (44.2%) | 72,782 (938.6%) |
| 2.0x to 2.9x | 1,141 (17.3%) | 3,389 (43.7%) |
| 3.0x to 3.9x | 700 (10.6%) | 1,512 (19.5%) |
| 4.0x or more | 1,765 (26.8%) | 762 (9.8%) |
| Total | 6,597 (100.0%) | 7,754 (100.0%) |
Real Estate Taxes by Mortgage Status in Russell County
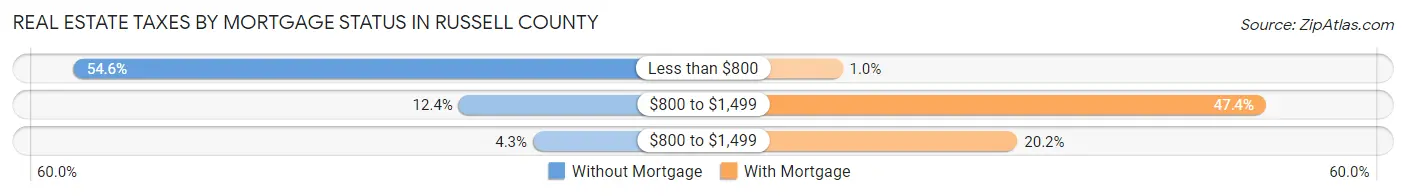
| Property Taxes | Without Mortgage | With Mortgage |
| Less than $800 | 3,602 (54.6%) | 81 (1.0%) |
| $800 to $1,499 | 820 (12.4%) | 3,678 (47.4%) |
| $800 to $1,499 | 284 (4.3%) | 1,566 (20.2%) |
| Total | 6,597 (100.0%) | 7,754 (100.0%) |
Health & Disability in Russell County
Health Insurance Coverage by Age in Russell County
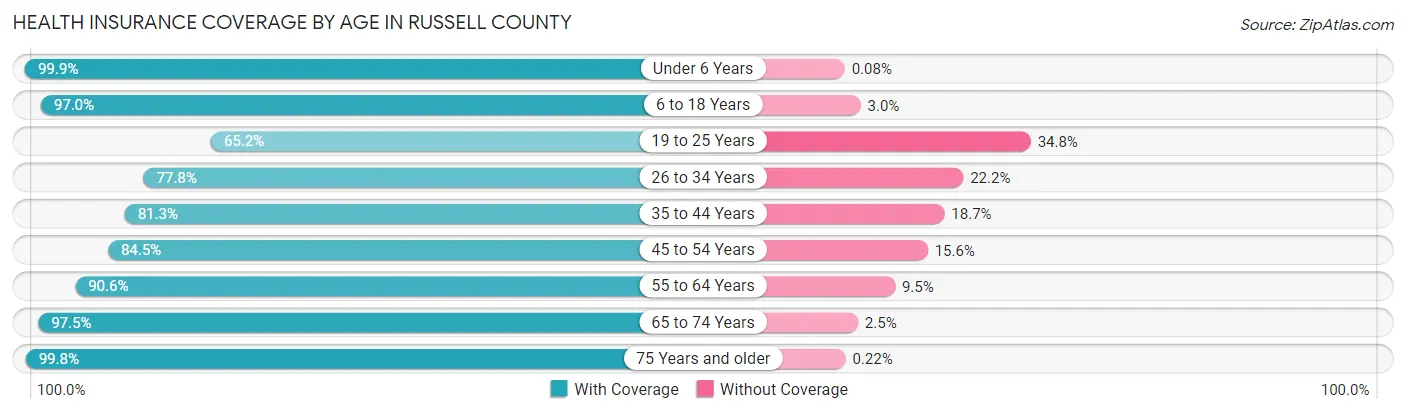
| Age Bracket | With Coverage | Without Coverage |
| Under 6 Years | 4,904 (99.9%) | 4 (0.1%) |
| 6 to 18 Years | 9,902 (97.0%) | 310 (3.0%) |
| 19 to 25 Years | 2,892 (65.2%) | 1,541 (34.8%) |
| 26 to 34 Years | 5,298 (77.8%) | 1,510 (22.2%) |
| 35 to 44 Years | 5,737 (81.3%) | 1,317 (18.7%) |
| 45 to 54 Years | 6,147 (84.5%) | 1,132 (15.5%) |
| 55 to 64 Years | 6,944 (90.5%) | 725 (9.5%) |
| 65 to 74 Years | 5,260 (97.5%) | 137 (2.5%) |
| 75 Years and older | 3,178 (99.8%) | 7 (0.2%) |
| Total | 50,262 (88.3%) | 6,683 (11.7%) |
Health Insurance Coverage by Citizenship Status in Russell County
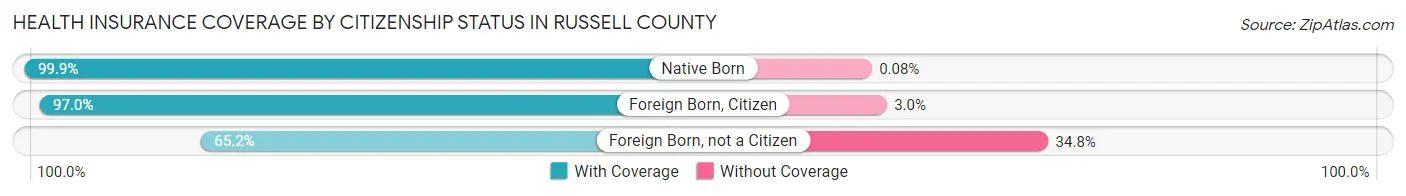
| Citizenship Status | With Coverage | Without Coverage |
| Native Born | 4,904 (99.9%) | 4 (0.1%) |
| Foreign Born, Citizen | 9,902 (97.0%) | 310 (3.0%) |
| Foreign Born, not a Citizen | 2,892 (65.2%) | 1,541 (34.8%) |
Health Insurance Coverage by Household Income in Russell County

| Household Income | With Coverage | Without Coverage |
| Under $25,000 | 10,803 (83.4%) | 2,145 (16.6%) |
| $25,000 to $49,999 | 10,053 (87.0%) | 1,509 (13.1%) |
| $50,000 to $74,999 | 11,768 (91.9%) | 1,031 (8.1%) |
| $75,000 to $99,999 | 6,469 (90.6%) | 667 (9.3%) |
| $100,000 and over | 11,091 (89.4%) | 1,319 (10.6%) |
Public vs Private Health Insurance Coverage by Age in Russell County
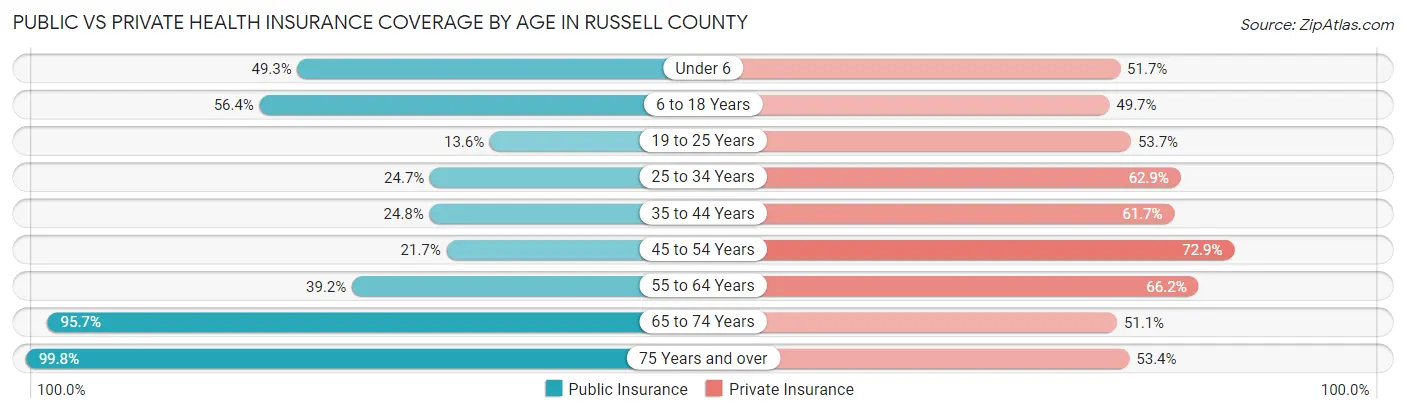
| Age Bracket | Public Insurance | Private Insurance |
| Under 6 | 2,421 (49.3%) | 2,536 (51.7%) |
| 6 to 18 Years | 5,755 (56.4%) | 5,072 (49.7%) |
| 19 to 25 Years | 603 (13.6%) | 2,379 (53.7%) |
| 25 to 34 Years | 1,683 (24.7%) | 4,282 (62.9%) |
| 35 to 44 Years | 1,751 (24.8%) | 4,355 (61.7%) |
| 45 to 54 Years | 1,577 (21.7%) | 5,303 (72.9%) |
| 55 to 64 Years | 3,007 (39.2%) | 5,077 (66.2%) |
| 65 to 74 Years | 5,166 (95.7%) | 2,756 (51.1%) |
| 75 Years and over | 3,178 (99.8%) | 1,700 (53.4%) |
| Total | 25,141 (44.2%) | 33,460 (58.8%) |
Disability Status by Sex by Age in Russell County
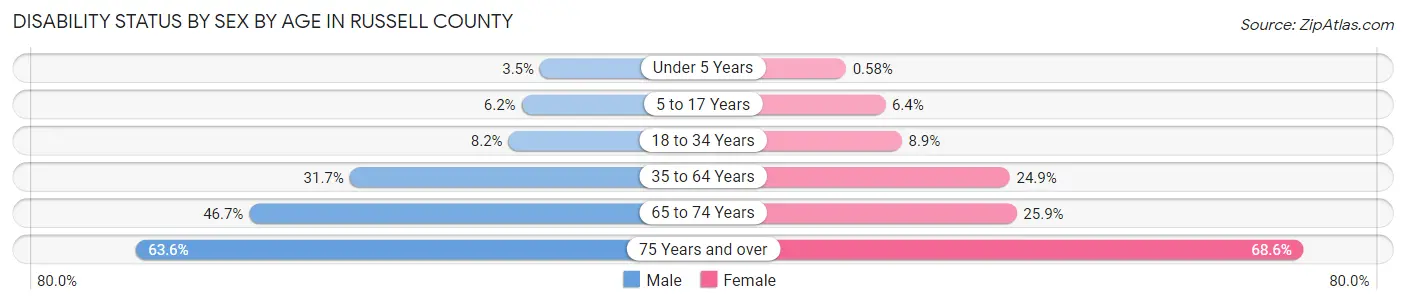
| Age Bracket | Male | Female |
| Under 5 Years | 66 (3.5%) | 12 (0.6%) |
| 5 to 17 Years | 316 (6.2%) | 327 (6.4%) |
| 18 to 34 Years | 454 (8.2%) | 589 (8.9%) |
| 35 to 64 Years | 3,277 (31.7%) | 2,909 (24.9%) |
| 65 to 74 Years | 1,136 (46.7%) | 768 (25.9%) |
| 75 Years and over | 776 (63.5%) | 1,347 (68.6%) |
Disability Class by Sex by Age in Russell County
Disability Class: Hearing Difficulty
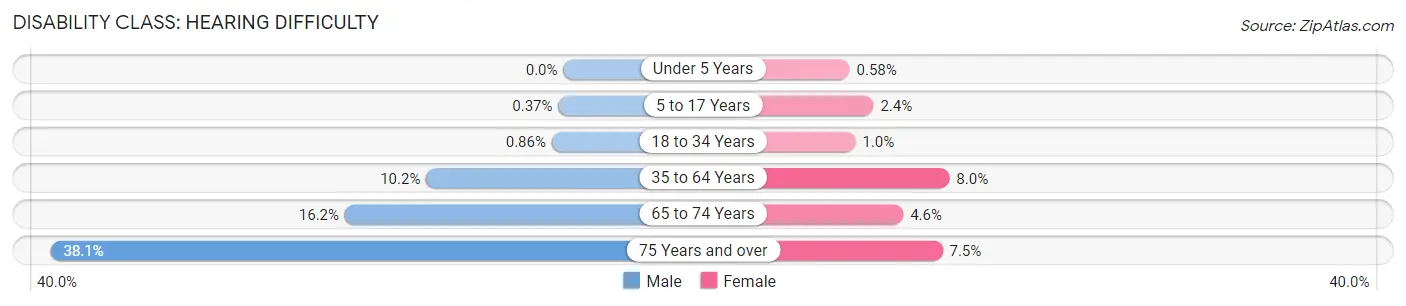
| Age Bracket | Male | Female |
| Under 5 Years | 0 (0.0%) | 12 (0.6%) |
| 5 to 17 Years | 19 (0.4%) | 120 (2.4%) |
| 18 to 34 Years | 48 (0.9%) | 68 (1.0%) |
| 35 to 64 Years | 1,051 (10.2%) | 933 (8.0%) |
| 65 to 74 Years | 395 (16.2%) | 135 (4.6%) |
| 75 Years and over | 465 (38.1%) | 147 (7.5%) |
Disability Class: Vision Difficulty
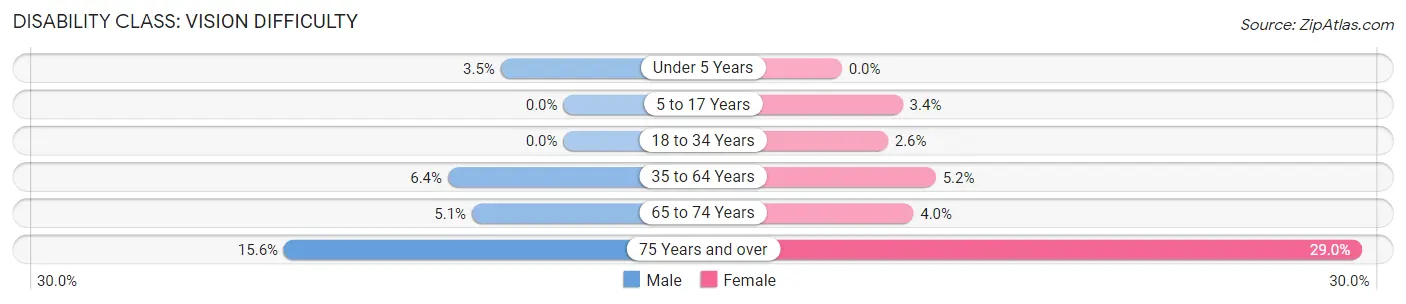
| Age Bracket | Male | Female |
| Under 5 Years | 66 (3.5%) | 0 (0.0%) |
| 5 to 17 Years | 0 (0.0%) | 173 (3.4%) |
| 18 to 34 Years | 0 (0.0%) | 170 (2.6%) |
| 35 to 64 Years | 664 (6.4%) | 611 (5.2%) |
| 65 to 74 Years | 124 (5.1%) | 118 (4.0%) |
| 75 Years and over | 190 (15.6%) | 569 (29.0%) |
Disability Class: Cognitive Difficulty
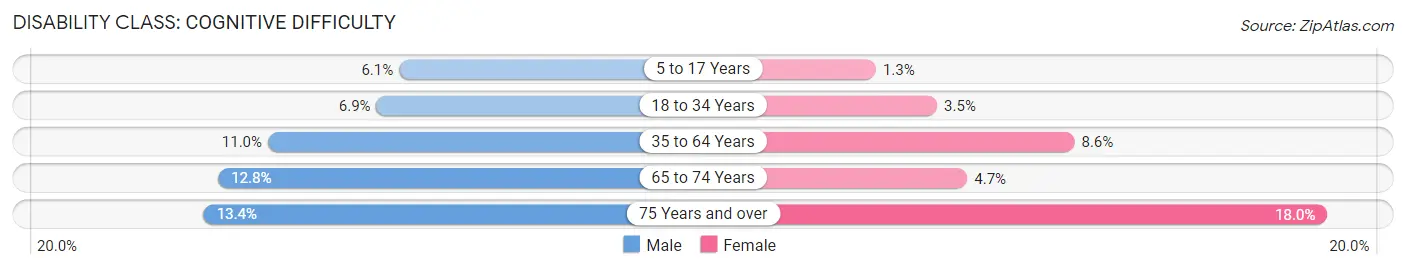
| Age Bracket | Male | Female |
| 5 to 17 Years | 310 (6.1%) | 65 (1.3%) |
| 18 to 34 Years | 386 (6.9%) | 235 (3.5%) |
| 35 to 64 Years | 1,132 (11.0%) | 1,009 (8.6%) |
| 65 to 74 Years | 312 (12.8%) | 138 (4.7%) |
| 75 Years and over | 163 (13.4%) | 354 (18.0%) |
Disability Class: Ambulatory Difficulty
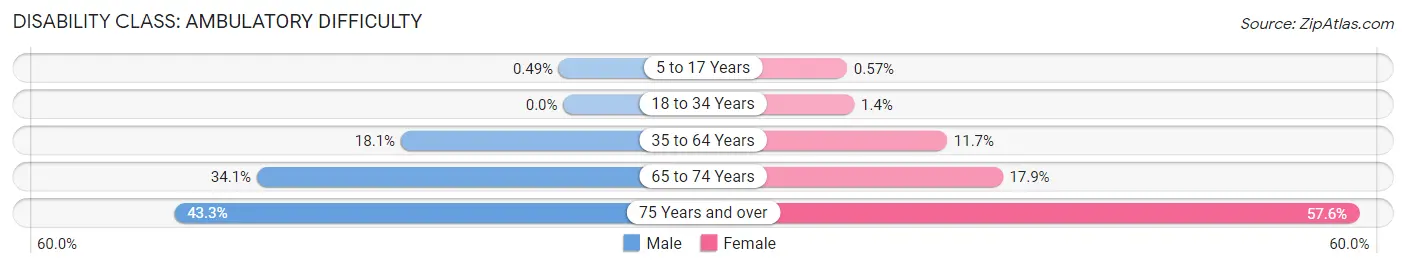
| Age Bracket | Male | Female |
| 5 to 17 Years | 25 (0.5%) | 29 (0.6%) |
| 18 to 34 Years | 0 (0.0%) | 91 (1.4%) |
| 35 to 64 Years | 1,867 (18.1%) | 1,367 (11.7%) |
| 65 to 74 Years | 831 (34.1%) | 530 (17.9%) |
| 75 Years and over | 529 (43.3%) | 1,131 (57.6%) |
Disability Class: Self-Care Difficulty
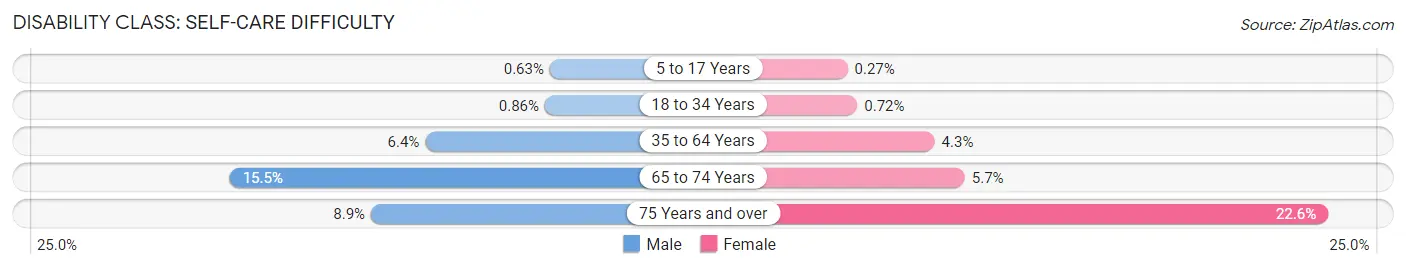
| Age Bracket | Male | Female |
| 5 to 17 Years | 32 (0.6%) | 14 (0.3%) |
| 18 to 34 Years | 48 (0.9%) | 48 (0.7%) |
| 35 to 64 Years | 662 (6.4%) | 503 (4.3%) |
| 65 to 74 Years | 377 (15.5%) | 169 (5.7%) |
| 75 Years and over | 109 (8.9%) | 443 (22.6%) |
Technology Access in Russell County
Computing Device Access in Russell County
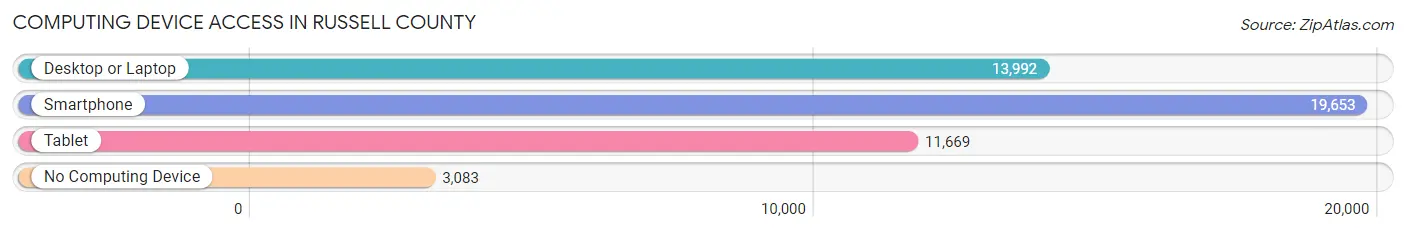
| Device Type | # Households | % Households |
| Desktop or Laptop | 13,992 | 59.6% |
| Smartphone | 19,653 | 83.8% |
| Tablet | 11,669 | 49.7% |
| No Computing Device | 3,083 | 13.1% |
| Total | 23,462 | 100.0% |
Internet Access in Russell County
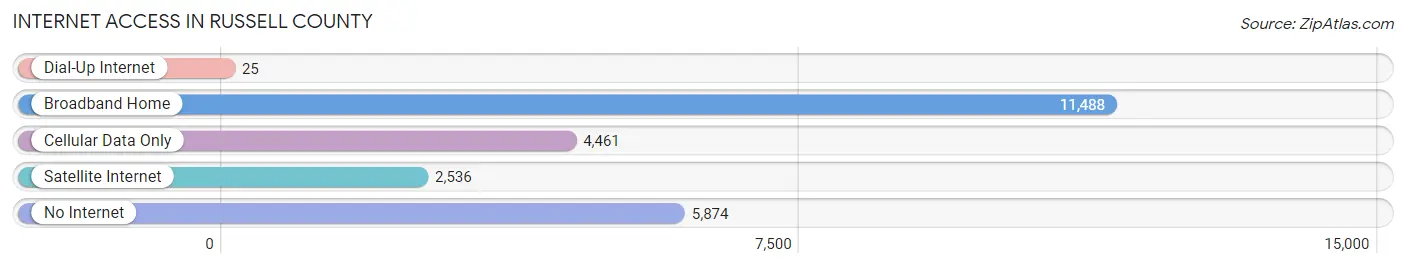
| Internet Type | # Households | % Households |
| Dial-Up Internet | 25 | 0.1% |
| Broadband Home | 11,488 | 49.0% |
| Cellular Data Only | 4,461 | 19.0% |
| Satellite Internet | 2,536 | 10.8% |
| No Internet | 5,874 | 25.0% |
| Total | 23,462 | 100.0% |
Russell County Summary
Introduction
Russell County, Alabama is located in the southeastern corner of the state and is part of the Wiregrass Region. It is bordered by the Chattahoochee River to the east, the Georgia state line to the south, and the counties of Barbour, Houston, and Dale to the west and north. The county seat is Phenix City, and the largest city is Phenix City. The county was established in 1832 and named for Colonel Gilbert C. Russell, a hero of the Creek War of 1813-14.
History
The area that is now Russell County was originally inhabited by the Creek Indians. The Creek were forcibly removed from the area in the 1830s as part of the Indian Removal Act. The area was then opened up for settlement by white settlers. The county was officially established in 1832 and named for Colonel Gilbert C. Russell, a hero of the Creek War of 1813-14.
The county was largely agricultural in the 19th century, with cotton being the main crop. The county was also home to several small towns, including Phenix City, which was founded in 1883. Phenix City quickly became the largest town in the county and the county seat.
In the early 20th century, the county experienced a period of rapid growth and development. The construction of the Chattahoochee River Bridge in 1929 connected Phenix City to Columbus, Georgia, and the area became a popular tourist destination. The area also experienced a boom in industry, with several textile mills and other factories being built in the area.
Geography
Russell County is located in the southeastern corner of Alabama and is part of the Wiregrass Region. It is bordered by the Chattahoochee River to the east, the Georgia state line to the south, and the counties of Barbour, Houston, and Dale to the west and north. The county has a total area of 545 square miles, of which 543 square miles is land and 2 square miles is water.
The terrain of the county is mostly flat, with some rolling hills in the northern part of the county. The county is drained by the Chattahoochee River and its tributaries, including the Kinchafoonee Creek and the Little Kinchafoonee Creek. The county is also home to several lakes, including Lake Harding, Lake Martin, and Lake Eufaula.
Economy
The economy of Russell County is largely based on agriculture and manufacturing. The county is home to several large farms, which produce cotton, corn, soybeans, and other crops. The county is also home to several large manufacturing plants, including a paper mill, a textile mill, and a chemical plant.
The county is also home to several military installations, including Fort Benning, which is located just across the Chattahoochee River in Georgia. The military installations provide a significant economic boost to the county, as they employ a large number of people and generate a significant amount of revenue.
Demographics
As of the 2010 census, Russell County had a population of 52,947. The racial makeup of the county was 68.3% White, 28.2% Black or African American, 0.4% Native American, 0.7% Asian, 0.1% Pacific Islander, 0.7% from other races, and 1.6% from two or more races. Hispanic or Latino of any race were 2.2% of the population.
The median income for a household in the county was $37,945, and the median income for a family was $45,945. The per capita income for the county was $19,945. About 17.3% of the population was below the poverty line.
Conclusion
Russell County, Alabama is located in the southeastern corner of the state and is part of the Wiregrass Region. It is bordered by the Chattahoochee River to the east, the Georgia state line to the south, and the counties of Barbour, Houston, and Dale to the west and north. The county was established in 1832 and named for Colonel Gilbert C. Russell, a hero of the Creek War of 1813-14. The economy of the county is largely based on agriculture and manufacturing, and the county is home to several military installations. As of the 2010 census, the population of the county was 52,947, with a median household income of $37,945.
Common Questions
What is Per Capita Income in Russell County?
Per Capita income in Russell County is $25,855.
What is the Median Family Income in Russell County?
Median Family Income in Russell County is $60,960.
What is the Median Household income in Russell County?
Median Household Income in Russell County is $47,420.
What is Income or Wage Gap in Russell County?
Income or Wage Gap in Russell County is 37.3%.
Women in Russell County earn 62.7 cents for every dollar earned by a man.
What is Family Income Deficit in Russell County?
Family Income Deficit in Russell County is $10,598.
Families that are below poverty line in Russell County earn $10,598 less on average than the poverty threshold level.
What is Inequality or Gini Index in Russell County?
Inequality or Gini Index in Russell County is 0.47.
What is the Total Population of Russell County?
Total Population of Russell County is 58,849.
What is the Total Male Population of Russell County?
Total Male Population of Russell County is 28,125.
What is the Total Female Population of Russell County?
Total Female Population of Russell County is 30,724.
What is the Ratio of Males per 100 Females in Russell County?
There are 91.54 Males per 100 Females in Russell County.
What is the Ratio of Females per 100 Males in Russell County?
There are 109.24 Females per 100 Males in Russell County.
What is the Median Population Age in Russell County?
Median Population Age in Russell County is 37.2 Years.
What is the Average Family Size in Russell County
Average Family Size in Russell County is 3.2 People.
What is the Average Household Size in Russell County
Average Household Size in Russell County is 2.5 People.
How Large is the Labor Force in Russell County?
There are 25,600 People in the Labor Forcein in Russell County.
What is the Percentage of People in the Labor Force in Russell County?
55.6% of People are in the Labor Force in Russell County.
What is the Unemployment Rate in Russell County?
Unemployment Rate in Russell County is 6.5%.