Area Code 334 Map & Demographics
Area Code 334 Map
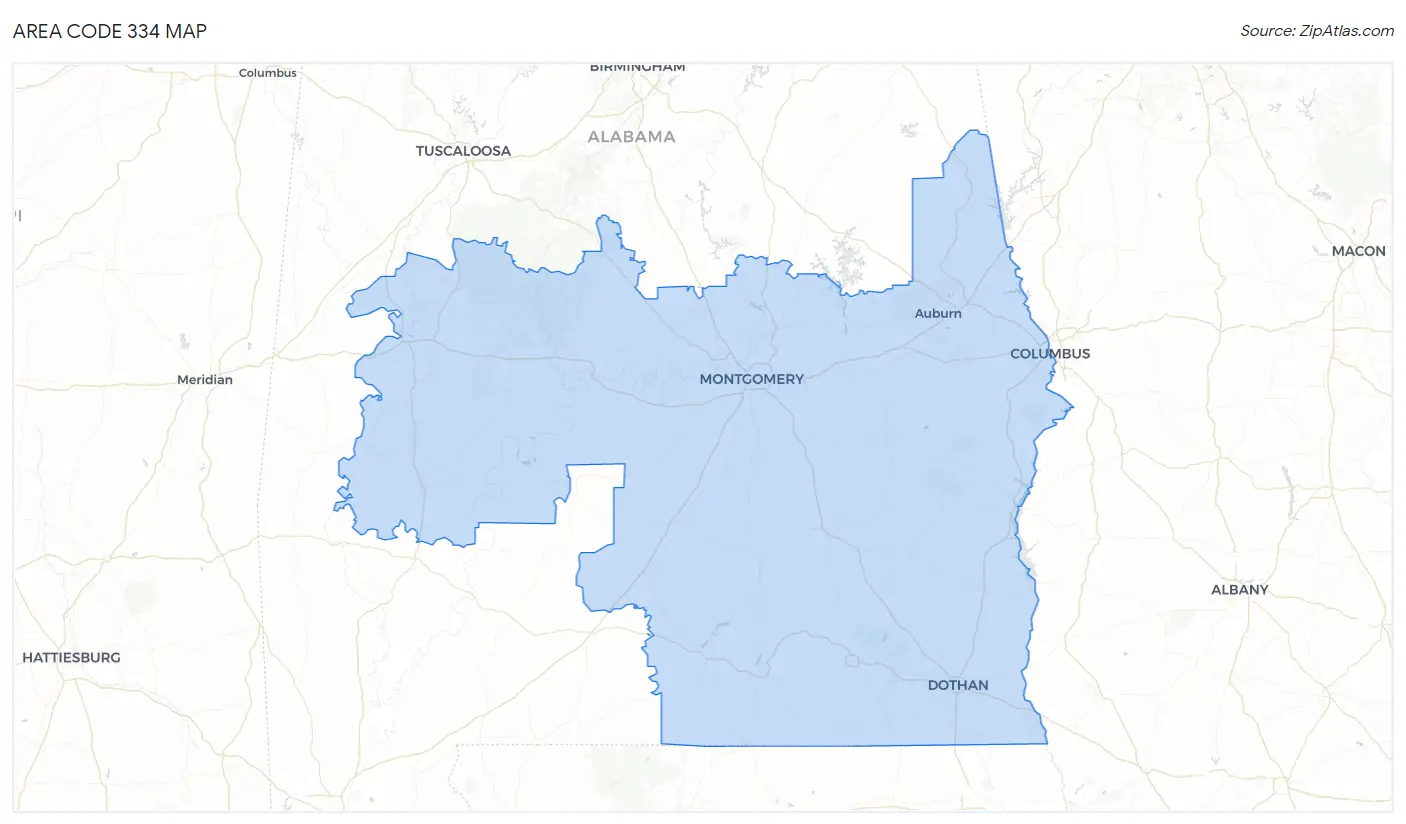
Area Code 334 Overview
$27,513
PER CAPITA INCOME
$67,119
AVG FAMILY INCOME
$51,824
AVG HOUSEHOLD INCOME
31.4%
WAGE / INCOME GAP [ % ]
68.6¢/ $1
WAGE / INCOME GAP [ $ ]
$10,732
FAMILY INCOME DEFICIT
70.46
INEQUALITY / GINI INDEX
1,136,475
TOTAL POPULATION
548,511
MALE POPULATION
587,964
FEMALE POPULATION
93.29
MALES / 100 FEMALES
107.19
FEMALES / 100 MALES
41.7
MEDIAN AGE
3.4
AVG FAMILY SIZE
2.6
AVG HOUSEHOLD SIZE
468,556
LABOR FORCE [ PEOPLE ]
51.3%
PERCENT IN LABOR FORCE
7.6%
UNEMPLOYMENT RATE
Income in Area Code 334
Income Overview in Area Code 334
Per Capita Income in Area Code 334 is $27,513, while median incomes of families and households are $67,119 and $51,824 respectively.
| Characteristic | Number | Measure |
| Per Capita Income | 1,136,475 | $27,513 |
| Median Family Income | 274,775 | $67,119 |
| Mean Family Income | 274,775 | $12,696,472 |
| Median Household Income | 434,901 | $51,824 |
| Mean Household Income | 434,901 | $10,638,817 |
| Income Deficit | 274,775 | $10,732 |
| Wage / Income Gap (%) | 1,136,475 | 31.41% |
| Wage / Income Gap ($) | 1,136,475 | 68.59¢ per $1 |
| Gini / Inequality Index | 1,136,475 | 70.46 |
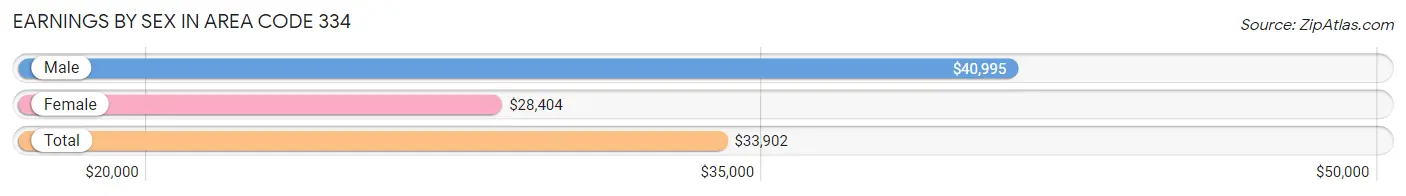
Earnings by Sex in Area Code 334
Average Earnings in Area Code 334 are $33,902, $40,995 for men and $28,404 for women, a difference of 30.7%.
| Sex | Number | Average Earnings |
| Male | 276,180 (51.0%) | $40,995 |
| Female | 264,906 (49.0%) | $28,404 |
| Total | 541,086 (100.0%) | $33,902 |
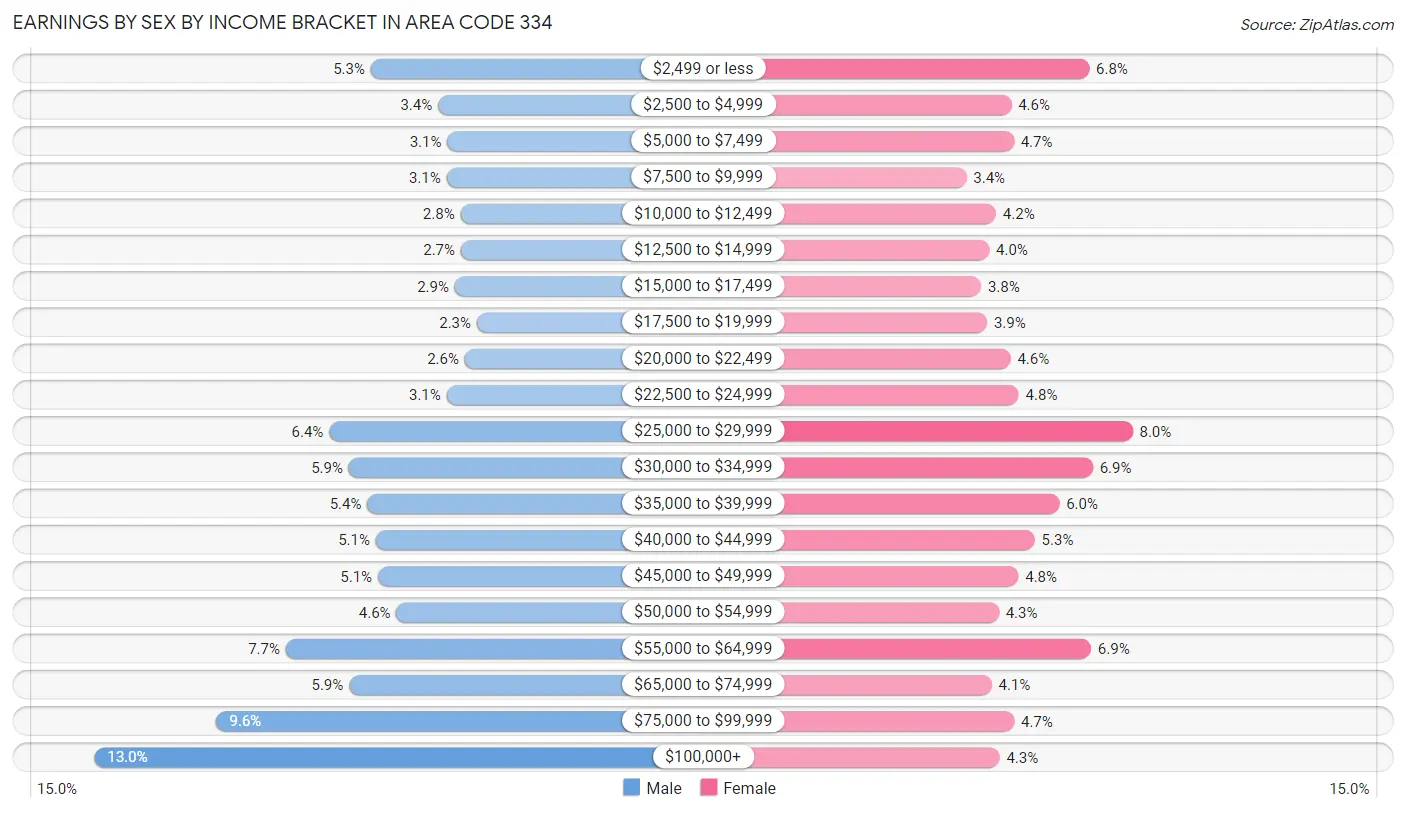
Earnings by Sex by Income Bracket in Area Code 334
The most common earnings brackets in Area Code 334 are $100,000+ for men (36,020 | 13.0%) and $25,000 to $29,999 for women (21,266 | 8.0%).
| Income | Male | Female |
| $2,499 or less | 14,554 (5.3%) | 18,027 (6.8%) |
| $2,500 to $4,999 | 9,322 (3.4%) | 12,247 (4.6%) |
| $5,000 to $7,499 | 8,620 (3.1%) | 12,423 (4.7%) |
| $7,500 to $9,999 | 8,683 (3.1%) | 8,911 (3.4%) |
| $10,000 to $12,499 | 7,585 (2.8%) | 11,107 (4.2%) |
| $12,500 to $14,999 | 7,558 (2.7%) | 10,599 (4.0%) |
| $15,000 to $17,499 | 8,032 (2.9%) | 9,998 (3.8%) |
| $17,500 to $19,999 | 6,320 (2.3%) | 10,426 (3.9%) |
| $20,000 to $22,499 | 7,277 (2.6%) | 12,175 (4.6%) |
| $22,500 to $24,999 | 8,684 (3.1%) | 12,785 (4.8%) |
| $25,000 to $29,999 | 17,790 (6.4%) | 21,266 (8.0%) |
| $30,000 to $34,999 | 16,255 (5.9%) | 18,300 (6.9%) |
| $35,000 to $39,999 | 14,818 (5.4%) | 15,814 (6.0%) |
| $40,000 to $44,999 | 14,173 (5.1%) | 13,975 (5.3%) |
| $45,000 to $49,999 | 13,997 (5.1%) | 12,779 (4.8%) |
| $50,000 to $54,999 | 12,564 (4.5%) | 11,321 (4.3%) |
| $55,000 to $64,999 | 21,143 (7.7%) | 18,168 (6.9%) |
| $65,000 to $74,999 | 16,238 (5.9%) | 10,773 (4.1%) |
| $75,000 to $99,999 | 26,547 (9.6%) | 12,448 (4.7%) |
| $100,000+ | 36,020 (13.0%) | 11,364 (4.3%) |
| Total | 276,180 (100.0%) | 264,906 (100.0%) |
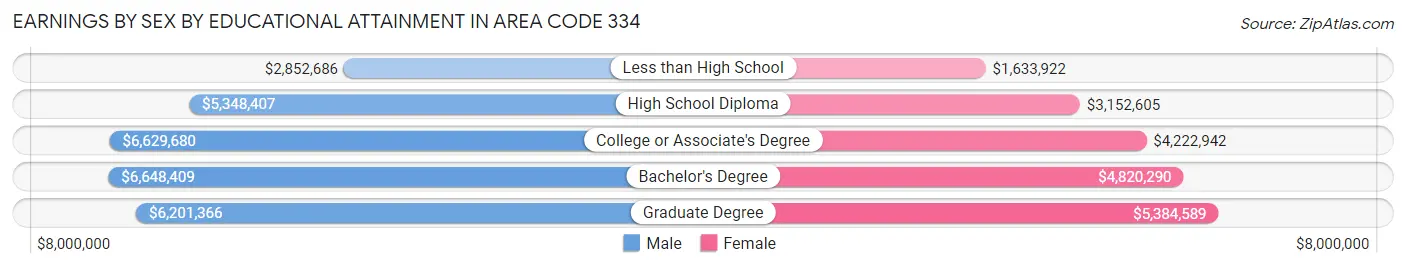
Earnings by Sex by Educational Attainment in Area Code 334
Average earnings in Area Code 334 are $6,665,630 for men and $4,909,931 for women, a difference of 26.3%. Men with an educational attainment of bachelor's degree enjoy the highest average annual earnings of $6,648,409, while those with less than high school education earn the least with $2,852,686. Women with an educational attainment of graduate degree earn the most with the average annual earnings of $5,384,589, while those with less than high school education have the smallest earnings of $1,633,922.
| Educational Attainment | Male Income | Female Income |
| Less than High School | $2,852,686 | $1,633,922 |
| High School Diploma | $5,348,407 | $3,152,605 |
| College or Associate's Degree | $6,629,680 | $4,222,942 |
| Bachelor's Degree | $6,648,409 | $4,820,290 |
| Graduate Degree | $6,201,366 | $5,384,589 |
| Total | $6,665,630 | $4,909,931 |
Family Income in Area Code 334
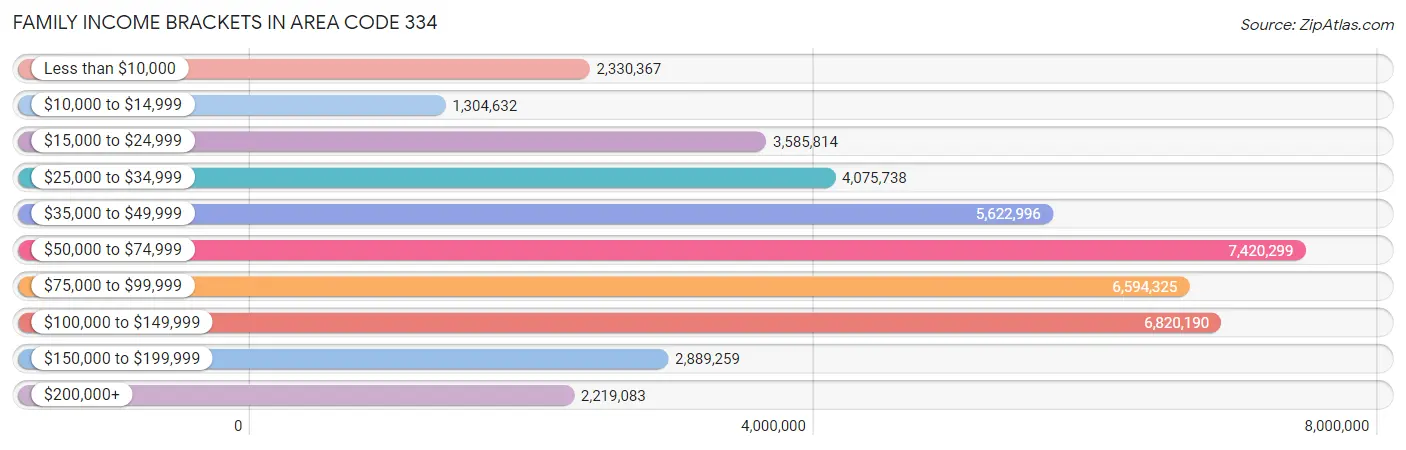
Family Income Brackets in Area Code 334
According to the Area Code 334 family income data, there are 7,420,299 families falling into the $50,000 to $74,999 income range, which is the most common income bracket and makes up 2,700.5% of all families. Conversely, the $10,000 to $14,999 income bracket is the least frequent group with only 1,304,632 families (474.8%) belonging to this category.
| Income Bracket | # Families | % Families |
| Less than $10,000 | 2,330,367 | 848.1% |
| $10,000 to $14,999 | 1,304,632 | 474.8% |
| $15,000 to $24,999 | 3,585,814 | 1,305.0% |
| $25,000 to $34,999 | 4,075,738 | 1,483.3% |
| $35,000 to $49,999 | 5,622,996 | 2,046.4% |
| $50,000 to $74,999 | 7,420,299 | 2,700.5% |
| $75,000 to $99,999 | 6,594,325 | 2,399.9% |
| $100,000 to $149,999 | 6,820,190 | 2,482.1% |
| $150,000 to $199,999 | 2,889,259 | 1,051.5% |
| $200,000+ | 2,219,083 | 807.6% |
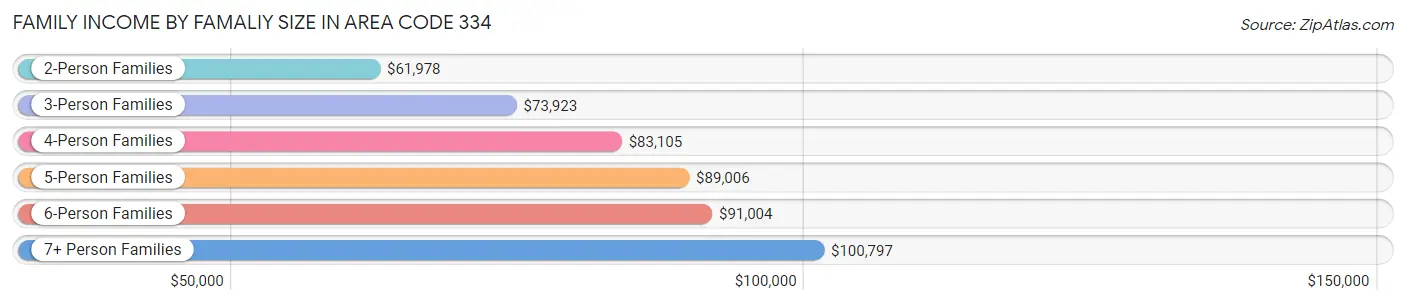
Family Income by Famaliy Size in Area Code 334
7+ person families (2,865 | 1.0%) account for the highest median family income in Area Code 334 with $100,797 per family, while 2-person families (136,387 | 49.6%) have the highest median income of $30,989 per family member.
| Income Bracket | # Families | Median Income |
| 2-Person Families | 136,387 (49.6%) | $61,978 |
| 3-Person Families | 63,431 (23.1%) | $73,923 |
| 4-Person Families | 46,319 (16.9%) | $83,105 |
| 5-Person Families | 19,616 (7.1%) | $89,006 |
| 6-Person Families | 6,157 (2.2%) | $91,004 |
| 7+ Person Families | 2,865 (1.0%) | $100,797 |
| Total | 274,775 (100.0%) | $67,119 |
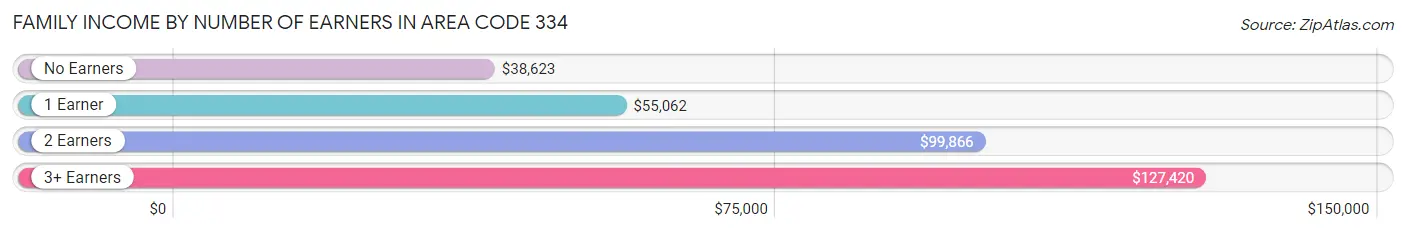
Family Income by Number of Earners in Area Code 334
The median family income in Area Code 334 is $67,119, with families comprising 3+ earners (22,006) having the highest median family income of $127,420, while families with no earners (52,087) have the lowest median family income of $38,623, accounting for 8.0% and 19.0% of families, respectively.
| Number of Earners | # Families | Median Income |
| No Earners | 52,087 (19.0%) | $38,623 |
| 1 Earner | 97,931 (35.6%) | $55,062 |
| 2 Earners | 102,751 (37.4%) | $99,866 |
| 3+ Earners | 22,006 (8.0%) | $127,420 |
| Total | 274,775 (100.0%) | $67,119 |
Household Income in Area Code 334
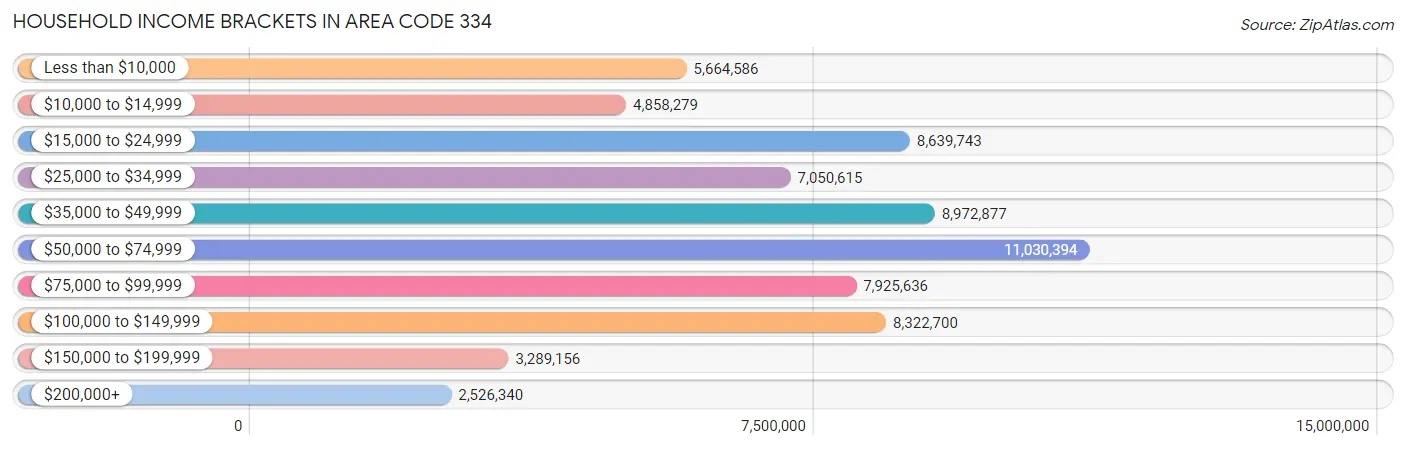
Household Income Brackets in Area Code 334
With 11,030,394 households falling in the category, the $50,000 to $74,999 income range is the most frequent in Area Code 334, accounting for 2,536.3% of all households. In contrast, only 2,526,340 households (580.9%) fall into the $200,000+ income bracket, making it the least populous group.
| Income Bracket | # Households | % Households |
| Less than $10,000 | 5,664,586 | 1,302.5% |
| $10,000 to $14,999 | 4,858,279 | 1,117.1% |
| $15,000 to $24,999 | 8,639,743 | 1,986.6% |
| $25,000 to $34,999 | 7,050,615 | 1,621.2% |
| $35,000 to $49,999 | 8,972,877 | 2,063.2% |
| $50,000 to $74,999 | 11,030,394 | 2,536.3% |
| $75,000 to $99,999 | 7,925,636 | 1,822.4% |
| $100,000 to $149,999 | 8,322,700 | 1,913.7% |
| $150,000 to $199,999 | 3,289,156 | 756.3% |
| $200,000+ | 2,526,340 | 580.9% |
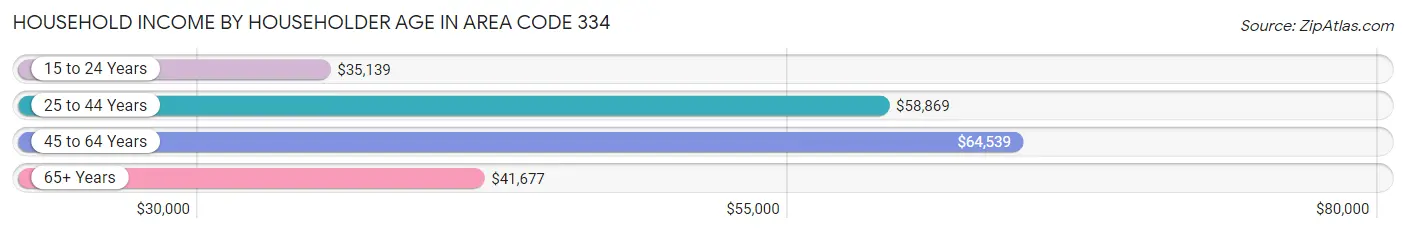
Household Income by Householder Age in Area Code 334
The median household income in Area Code 334 is $51,824, with the highest median household income of $64,539 found in the 45 to 64 years age bracket for the primary householder. A total of 159,322 households (36.6%) fall into this category. Meanwhile, the 15 to 24 years age bracket for the primary householder has the lowest median household income of $35,139, with 19,275 households (4.4%) in this group.
| Income Bracket | # Households | Median Income |
| 15 to 24 Years | 19,275 (4.4%) | $35,139 |
| 25 to 44 Years | 133,666 (30.7%) | $58,869 |
| 45 to 64 Years | 159,322 (36.6%) | $64,539 |
| 65+ Years | 122,638 (28.2%) | $41,677 |
| Total | 434,901 (100.0%) | $51,824 |
Poverty in Area Code 334
Income Below Poverty by Sex and Age in Area Code 334
With 17.0% poverty level for males and 20.6% for females among the residents of Area Code 334, under 5 year old males and 5 year old females are the most vulnerable to poverty, with 10,250 males (30.7%) and 1,992 females (34.1%) in their respective age groups living below the poverty level.
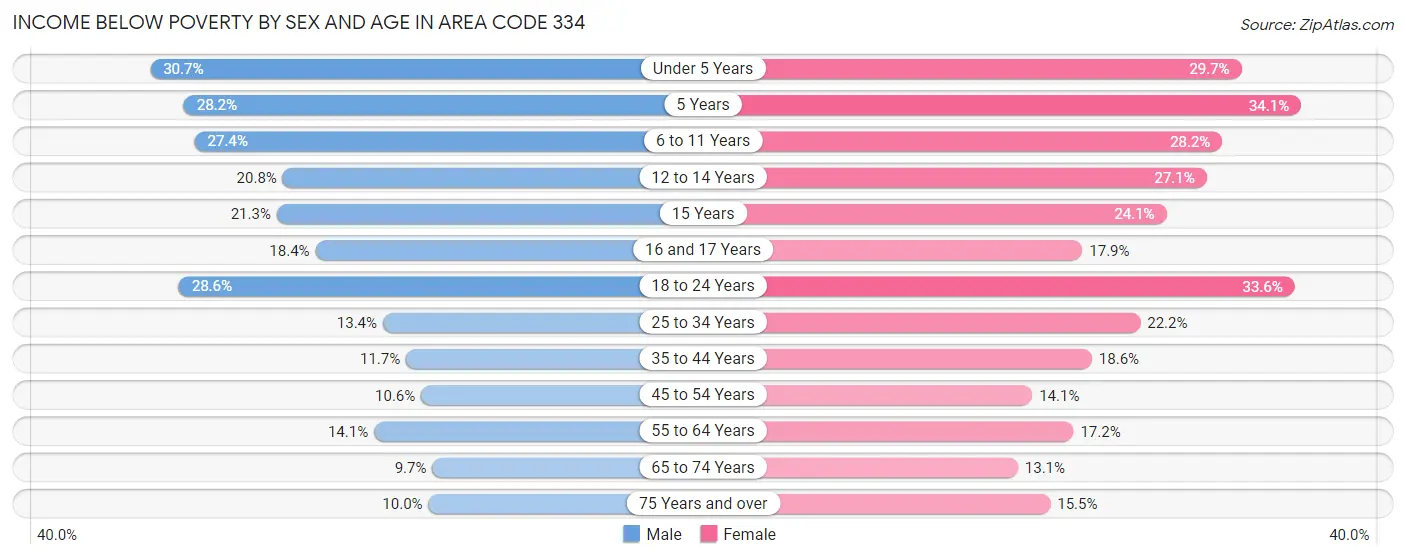
| Age Bracket | Male | Female |
| Under 5 Years | 10,250 (30.7%) | 9,650 (29.7%) |
| 5 Years | 1,933 (28.2%) | 1,992 (34.1%) |
| 6 to 11 Years | 11,805 (27.4%) | 11,437 (28.2%) |
| 12 to 14 Years | 4,393 (20.8%) | 5,879 (27.1%) |
| 15 Years | 1,558 (21.3%) | 1,640 (24.1%) |
| 16 and 17 Years | 2,694 (18.4%) | 2,605 (17.9%) |
| 18 to 24 Years | 15,665 (28.5%) | 16,919 (33.6%) |
| 25 to 34 Years | 9,398 (13.4%) | 16,498 (22.2%) |
| 35 to 44 Years | 7,354 (11.7%) | 13,190 (18.6%) |
| 45 to 54 Years | 6,738 (10.6%) | 10,153 (14.1%) |
| 55 to 64 Years | 9,455 (14.1%) | 13,078 (17.2%) |
| 65 to 74 Years | 5,016 (9.7%) | 7,992 (13.1%) |
| 75 Years and over | 2,915 (10.0%) | 6,866 (15.5%) |
| Total | 89,174 (17.0%) | 117,899 (20.6%) |
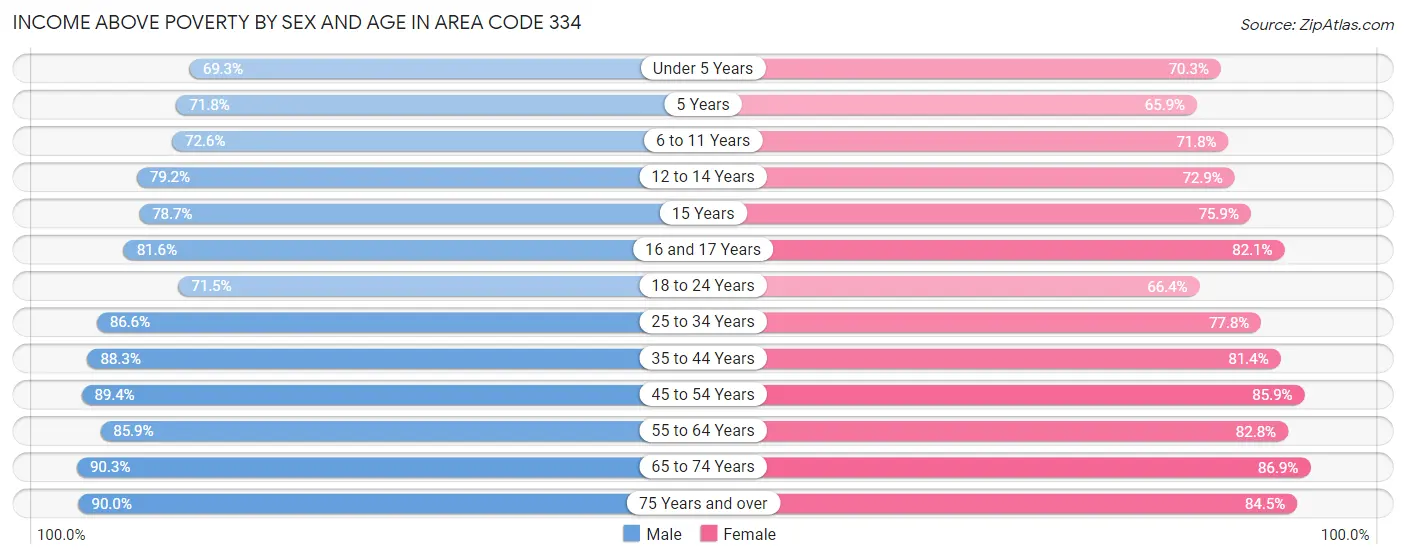
Income Above Poverty by Sex and Age in Area Code 334
According to the poverty statistics in Area Code 334, males aged 65 to 74 years and females aged 65 to 74 years are the age groups that are most secure financially, with 90.3% of males and 86.9% of females in these age groups living above the poverty line.
| Age Bracket | Male | Female |
| Under 5 Years | 23,174 (69.3%) | 22,876 (70.3%) |
| 5 Years | 4,926 (71.8%) | 3,852 (65.9%) |
| 6 to 11 Years | 31,303 (72.6%) | 29,058 (71.8%) |
| 12 to 14 Years | 16,691 (79.2%) | 15,830 (72.9%) |
| 15 Years | 5,762 (78.7%) | 5,166 (75.9%) |
| 16 and 17 Years | 11,939 (81.6%) | 11,981 (82.1%) |
| 18 to 24 Years | 39,198 (71.5%) | 33,409 (66.4%) |
| 25 to 34 Years | 60,746 (86.6%) | 57,946 (77.8%) |
| 35 to 44 Years | 55,604 (88.3%) | 57,831 (81.4%) |
| 45 to 54 Years | 57,094 (89.4%) | 61,672 (85.9%) |
| 55 to 64 Years | 57,795 (85.9%) | 62,951 (82.8%) |
| 65 to 74 Years | 46,535 (90.3%) | 53,146 (86.9%) |
| 75 Years and over | 26,181 (90.0%) | 37,475 (84.5%) |
| Total | 436,948 (83.1%) | 453,193 (79.4%) |
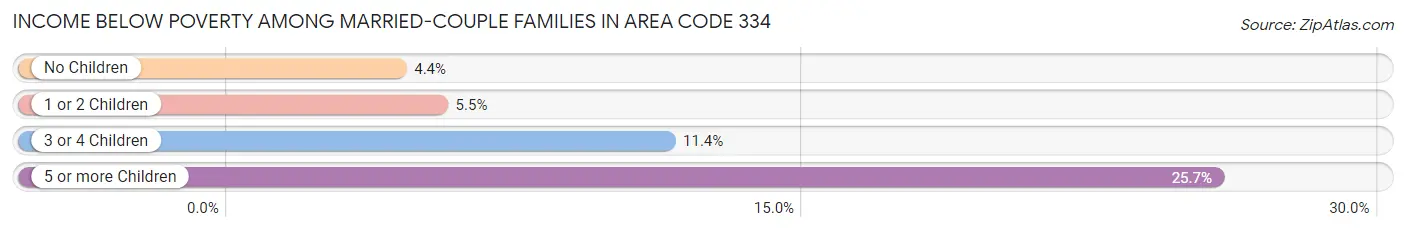
Income Below Poverty Among Married-Couple Families in Area Code 334
The poverty statistics for married-couple families in Area Code 334 show that 5.4% or 9,924 of the total 184,568 families live below the poverty line. Families with 5 or more children have the highest poverty rate of 25.7%, comprising of 306 families. On the other hand, families with no children have the lowest poverty rate of 4.4%, which includes 5,032 families.
| Children | Above Poverty | Below Poverty |
| No Children | 108,915 (95.6%) | 5,032 (4.4%) |
| 1 or 2 Children | 53,380 (94.5%) | 3,105 (5.5%) |
| 3 or 4 Children | 11,466 (88.6%) | 1,481 (11.4%) |
| 5 or more Children | 883 (74.3%) | 306 (25.7%) |
| Total | 174,644 (94.6%) | 9,924 (5.4%) |
Income Below Poverty Among Single-Parent Households in Area Code 334
According to the poverty data in Area Code 334, 17.2% or 3,199 single-father households and 34.2% or 24,465 single-mother households are living below the poverty line. Among single-father households, those with 5 or more children have the highest poverty rate, with 100 households (92.6%) experiencing poverty. Likewise, among single-mother households, those with 5 or more children have the highest poverty rate, with 459 households (83.0%) falling below the poverty line.
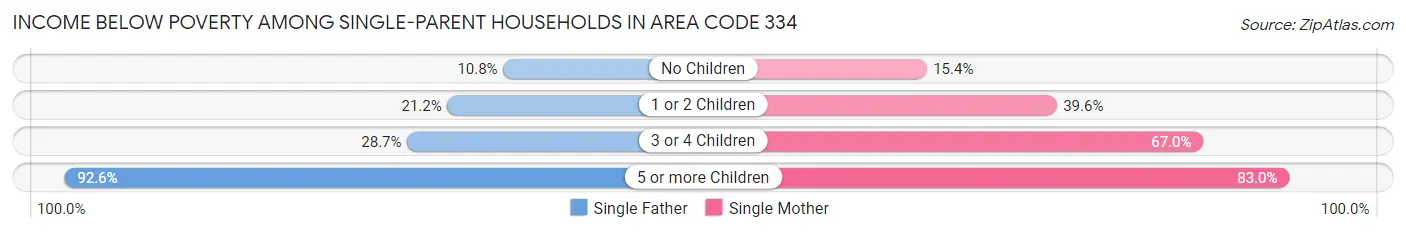
| Children | Single Father | Single Mother |
| No Children | 958 (10.8%) | 4,045 (15.4%) |
| 1 or 2 Children | 1,779 (21.2%) | 14,461 (39.6%) |
| 3 or 4 Children | 362 (28.7%) | 5,500 (67.0%) |
| 5 or more Children | 100 (92.6%) | 459 (83.0%) |
| Total | 3,199 (17.2%) | 24,465 (34.2%) |
Income Below Poverty Among Married-Couple vs Single-Parent Households in Area Code 334
The poverty data for Area Code 334 shows that 9,924 of the married-couple family households (5.4%) and 27,664 of the single-parent households (30.7%) are living below the poverty level. Within the married-couple family households, those with 5 or more children have the highest poverty rate, with 306 households (25.7%) falling below the poverty line. Among the single-parent households, those with 5 or more children have the highest poverty rate, with 559 household (84.6%) living below poverty.
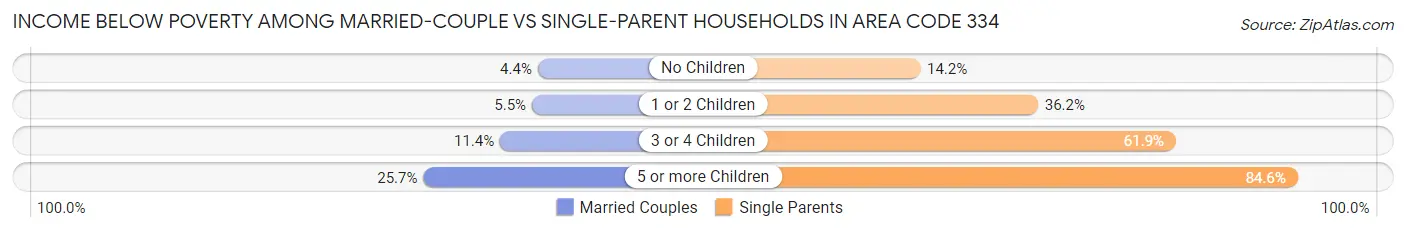
| Children | Married-Couple Families | Single-Parent Households |
| No Children | 5,032 (4.4%) | 5,003 (14.2%) |
| 1 or 2 Children | 3,105 (5.5%) | 16,240 (36.2%) |
| 3 or 4 Children | 1,481 (11.4%) | 5,862 (61.9%) |
| 5 or more Children | 306 (25.7%) | 559 (84.6%) |
| Total | 9,924 (5.4%) | 27,664 (30.7%) |
Race in Area Code 334
The most populous races in Area Code 334 are White / Caucasian (637,150 | 56.1%), Black / African American (421,708 | 37.1%), and Hispanic or Latino (43,206 | 3.8%).
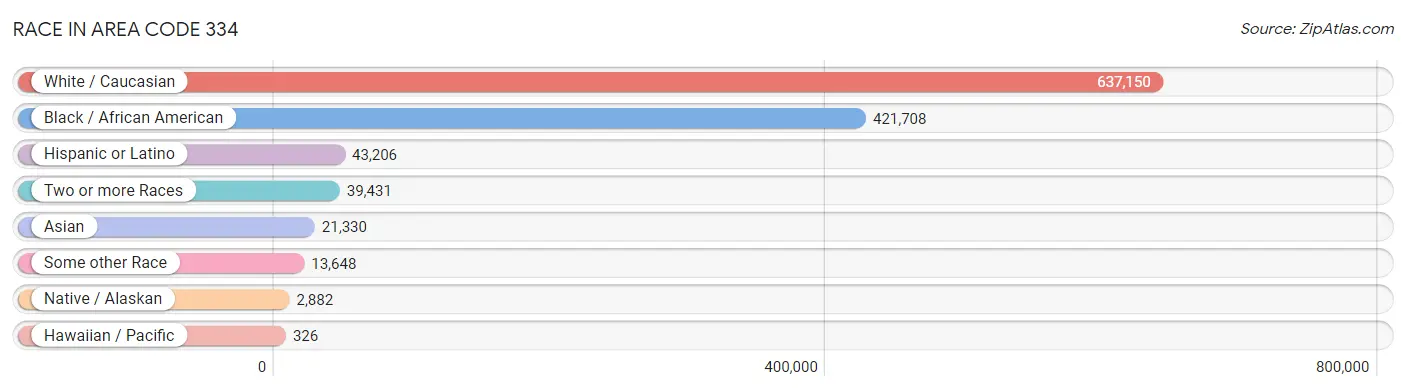
| Race | # Population | % Population |
| Asian | 21,330 | 1.9% |
| Black / African American | 421,708 | 37.1% |
| Hawaiian / Pacific | 326 | 0.0% |
| Hispanic or Latino | 43,206 | 3.8% |
| Native / Alaskan | 2,882 | 0.3% |
| White / Caucasian | 637,150 | 56.1% |
| Two or more Races | 39,431 | 3.5% |
| Some other Race | 13,648 | 1.2% |
| Total | 1,136,475 | 100.0% |
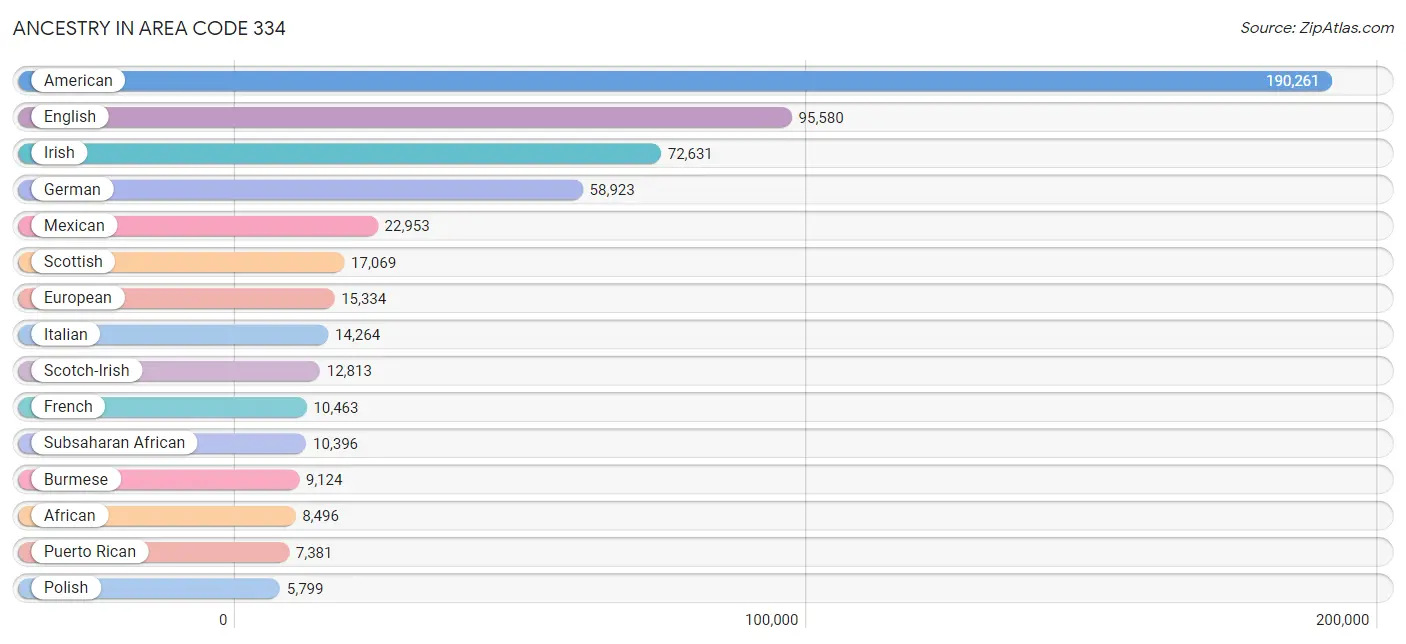
Ancestry in Area Code 334
The most populous ancestries reported in Area Code 334 are American (190,261 | 16.7%), English (95,580 | 8.4%), Irish (72,631 | 6.4%), German (58,923 | 5.2%), and Mexican (22,953 | 2.0%), together accounting for 38.7% of all Area Code 334 residents.
| Ancestry | # Population | % Population |
| Afghan | 188 | 0.0% |
| African | 8,496 | 0.7% |
| Alaska Native | 7 | 0.0% |
| Albanian | 17 | 0.0% |
| Aleut | 97 | 0.0% |
| American | 190,261 | 16.7% |
| Apache | 230 | 0.0% |
| Arab | 1,424 | 0.1% |
| Argentinean | 157 | 0.0% |
| Armenian | 110 | 0.0% |
| Assyrian / Chaldean / Syriac | 54 | 0.0% |
| Australian | 47 | 0.0% |
| Austrian | 498 | 0.0% |
| Bahamian | 121 | 0.0% |
| Barbadian | 18 | 0.0% |
| Basque | 13 | 0.0% |
| Belgian | 156 | 0.0% |
| Belizean | 30 | 0.0% |
| Bermudan | 57 | 0.0% |
| Bhutanese | 1,900 | 0.2% |
| Blackfeet | 693 | 0.1% |
| Bolivian | 30 | 0.0% |
| Brazilian | 233 | 0.0% |
| British | 4,107 | 0.4% |
| British West Indian | 16 | 0.0% |
| Bulgarian | 122 | 0.0% |
| Burmese | 9,124 | 0.8% |
| Cajun | 296 | 0.0% |
| Canadian | 815 | 0.1% |
| Cape Verdean | 7 | 0.0% |
| Celtic | 134 | 0.0% |
| Central American | 5,600 | 0.5% |
| Central American Indian | 407 | 0.0% |
| Cherokee | 4,189 | 0.4% |
| Chickasaw | 73 | 0.0% |
| Chilean | 107 | 0.0% |
| Chinese | 3 | 0.0% |
| Chippewa | 68 | 0.0% |
| Choctaw | 445 | 0.0% |
| Colombian | 424 | 0.0% |
| Comanche | 19 | 0.0% |
| Costa Rican | 231 | 0.0% |
| Creek | 1,640 | 0.1% |
| Croatian | 340 | 0.0% |
| Crow | 77 | 0.0% |
| Cuban | 1,790 | 0.2% |
| Cypriot | 26 | 0.0% |
| Czech | 683 | 0.1% |
| Czechoslovakian | 87 | 0.0% |
| Danish | 1,056 | 0.1% |
| Delaware | 19 | 0.0% |
| Dominican | 637 | 0.1% |
| Dutch | 4,581 | 0.4% |
| Dutch West Indian | 23 | 0.0% |
| Eastern European | 727 | 0.1% |
| Ecuadorian | 193 | 0.0% |
| Egyptian | 124 | 0.0% |
| English | 95,580 | 8.4% |
| Estonian | 34 | 0.0% |
| Ethiopian | 95 | 0.0% |
| European | 15,334 | 1.3% |
| Fijian | 30 | 0.0% |
| Filipino | 196 | 0.0% |
| Finnish | 265 | 0.0% |
| French | 10,463 | 0.9% |
| French American Indian | 19 | 0.0% |
| French Canadian | 1,867 | 0.2% |
| German | 58,923 | 5.2% |
| German Russian | 54 | 0.0% |
| Ghanaian | 107 | 0.0% |
| Greek | 970 | 0.1% |
| Guamanian / Chamorro | 106 | 0.0% |
| Guatemalan | 3,441 | 0.3% |
| Guyanese | 22 | 0.0% |
| Haitian | 715 | 0.1% |
| Hmong | 5 | 0.0% |
| Honduran | 783 | 0.1% |
| Houma | 7 | 0.0% |
| Hungarian | 909 | 0.1% |
| Icelander | 20 | 0.0% |
| Indian (Asian) | 4,301 | 0.4% |
| Indonesian | 12 | 0.0% |
| Iranian | 244 | 0.0% |
| Iraqi | 7 | 0.0% |
| Irish | 72,631 | 6.4% |
| Iroquois | 164 | 0.0% |
| Israeli | 105 | 0.0% |
| Italian | 14,264 | 1.3% |
| Jamaican | 1,138 | 0.1% |
| Japanese | 115 | 0.0% |
| Kenyan | 174 | 0.0% |
| Korean | 3,068 | 0.3% |
| Laotian | 72 | 0.0% |
| Latvian | 124 | 0.0% |
| Lebanese | 412 | 0.0% |
| Liberian | 100 | 0.0% |
| Lithuanian | 315 | 0.0% |
| Lumbee | 11 | 0.0% |
| Malaysian | 289 | 0.0% |
| Maltese | 1 | 0.0% |
| Mexican | 22,953 | 2.0% |
| Mexican American Indian | 260 | 0.0% |
| Mongolian | 5 | 0.0% |
| Moroccan | 58 | 0.0% |
| Native Hawaiian | 499 | 0.0% |
| Navajo | 90 | 0.0% |
| New Zealander | 47 | 0.0% |
| Nicaraguan | 126 | 0.0% |
| Nigerian | 1,051 | 0.1% |
| Northern European | 526 | 0.1% |
| Norwegian | 3,308 | 0.3% |
| Okinawan | 13 | 0.0% |
| Osage | 1 | 0.0% |
| Ottawa | 1 | 0.0% |
| Pakistani | 565 | 0.1% |
| Palestinian | 69 | 0.0% |
| Panamanian | 531 | 0.1% |
| Pennsylvania German | 156 | 0.0% |
| Peruvian | 397 | 0.0% |
| Polish | 5,799 | 0.5% |
| Portuguese | 720 | 0.1% |
| Potawatomi | 45 | 0.0% |
| Pueblo | 21 | 0.0% |
| Puerto Rican | 7,381 | 0.6% |
| Romanian | 167 | 0.0% |
| Russian | 1,196 | 0.1% |
| Salvadoran | 474 | 0.0% |
| Samoan | 128 | 0.0% |
| Scandinavian | 1,659 | 0.2% |
| Scotch-Irish | 12,813 | 1.1% |
| Scottish | 17,069 | 1.5% |
| Seminole | 134 | 0.0% |
| Serbian | 53 | 0.0% |
| Shoshone | 6 | 0.0% |
| Sioux | 173 | 0.0% |
| Slavic | 200 | 0.0% |
| Slovak | 485 | 0.0% |
| Slovene | 46 | 0.0% |
| South African | 27 | 0.0% |
| South American | 1,521 | 0.1% |
| South American Indian | 113 | 0.0% |
| Spaniard | 856 | 0.1% |
| Spanish | 638 | 0.1% |
| Spanish American Indian | 55 | 0.0% |
| Sri Lankan | 1,954 | 0.2% |
| Subsaharan African | 10,396 | 0.9% |
| Swedish | 3,113 | 0.3% |
| Swiss | 821 | 0.1% |
| Syrian | 78 | 0.0% |
| Thai | 3,890 | 0.3% |
| Tongan | 23 | 0.0% |
| Trinidadian and Tobagonian | 142 | 0.0% |
| Turkish | 403 | 0.0% |
| U.S. Virgin Islander | 30 | 0.0% |
| Ugandan | 12 | 0.0% |
| Ukrainian | 498 | 0.0% |
| Uruguayan | 19 | 0.0% |
| Ute | 10 | 0.0% |
| Venezuelan | 194 | 0.0% |
| Vietnamese | 332 | 0.0% |
| Welsh | 3,743 | 0.3% |
| West Indian | 428 | 0.0% |
| Yugoslavian | 52 | 0.0% | View All 163 Rows |
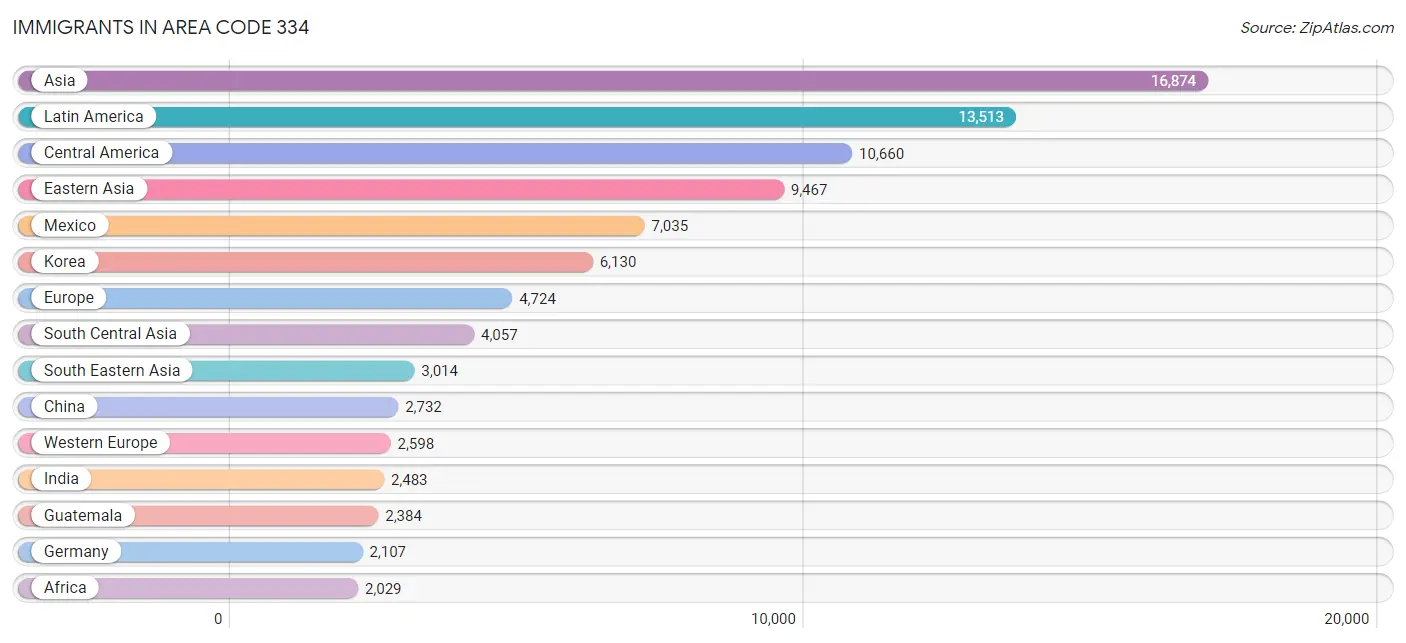
Immigrants in Area Code 334
The most numerous immigrant groups reported in Area Code 334 came from Asia (16,874 | 1.5%), Latin America (13,513 | 1.2%), Central America (10,660 | 0.9%), Eastern Asia (9,467 | 0.8%), and Mexico (7,035 | 0.6%), together accounting for 5.1% of all Area Code 334 residents.
| Immigration Origin | # Population | % Population |
| Afghanistan | 42 | 0.0% |
| Africa | 2,029 | 0.2% |
| Argentina | 30 | 0.0% |
| Armenia | 19 | 0.0% |
| Asia | 16,874 | 1.5% |
| Australia | 37 | 0.0% |
| Austria | 63 | 0.0% |
| Bahamas | 93 | 0.0% |
| Bangladesh | 416 | 0.0% |
| Barbados | 61 | 0.0% |
| Belgium | 48 | 0.0% |
| Bolivia | 15 | 0.0% |
| Bosnia and Herzegovina | 9 | 0.0% |
| Brazil | 299 | 0.0% |
| Cambodia | 98 | 0.0% |
| Cameroon | 132 | 0.0% |
| Canada | 728 | 0.1% |
| Caribbean | 1,417 | 0.1% |
| Central America | 10,660 | 0.9% |
| Chile | 54 | 0.0% |
| China | 2,732 | 0.2% |
| Colombia | 221 | 0.0% |
| Congo | 5 | 0.0% |
| Costa Rica | 82 | 0.0% |
| Croatia | 197 | 0.0% |
| Cuba | 317 | 0.0% |
| Czechoslovakia | 13 | 0.0% |
| Denmark | 18 | 0.0% |
| Dominican Republic | 127 | 0.0% |
| Eastern Africa | 538 | 0.1% |
| Eastern Asia | 9,467 | 0.8% |
| Eastern Europe | 1,031 | 0.1% |
| Ecuador | 155 | 0.0% |
| Egypt | 54 | 0.0% |
| El Salvador | 215 | 0.0% |
| England | 324 | 0.0% |
| Eritrea | 154 | 0.0% |
| Ethiopia | 81 | 0.0% |
| Europe | 4,724 | 0.4% |
| Fiji | 2 | 0.0% |
| France | 311 | 0.0% |
| Germany | 2,107 | 0.2% |
| Ghana | 105 | 0.0% |
| Greece | 3 | 0.0% |
| Guatemala | 2,384 | 0.2% |
| Guyana | 38 | 0.0% |
| Haiti | 164 | 0.0% |
| Honduras | 585 | 0.1% |
| Hong Kong | 150 | 0.0% |
| Hungary | 53 | 0.0% |
| India | 2,483 | 0.2% |
| Indonesia | 71 | 0.0% |
| Iran | 156 | 0.0% |
| Ireland | 75 | 0.0% |
| Italy | 180 | 0.0% |
| Jamaica | 458 | 0.0% |
| Japan | 591 | 0.1% |
| Jordan | 4 | 0.0% |
| Kazakhstan | 37 | 0.0% |
| Kenya | 31 | 0.0% |
| Korea | 6,130 | 0.5% |
| Kuwait | 3 | 0.0% |
| Laos | 136 | 0.0% |
| Latin America | 13,513 | 1.2% |
| Latvia | 60 | 0.0% |
| Lebanon | 110 | 0.0% |
| Liberia | 100 | 0.0% |
| Lithuania | 53 | 0.0% |
| Malaysia | 86 | 0.0% |
| Mexico | 7,035 | 0.6% |
| Middle Africa | 205 | 0.0% |
| Morocco | 5 | 0.0% |
| Nepal | 482 | 0.0% |
| Netherlands | 46 | 0.0% |
| Nicaragua | 65 | 0.0% |
| Nigeria | 387 | 0.0% |
| Northern Africa | 220 | 0.0% |
| Northern Europe | 817 | 0.1% |
| Norway | 12 | 0.0% |
| Oceania | 128 | 0.0% |
| Pakistan | 414 | 0.0% |
| Panama | 294 | 0.0% |
| Peru | 305 | 0.0% |
| Philippines | 1,231 | 0.1% |
| Poland | 31 | 0.0% |
| Portugal | 12 | 0.0% |
| Romania | 67 | 0.0% |
| Russia | 219 | 0.0% |
| Saudi Arabia | 47 | 0.0% |
| Scotland | 58 | 0.0% |
| Singapore | 13 | 0.0% |
| South Africa | 140 | 0.0% |
| South America | 1,436 | 0.1% |
| South Central Asia | 4,057 | 0.4% |
| South Eastern Asia | 3,014 | 0.3% |
| Southern Europe | 250 | 0.0% |
| Spain | 55 | 0.0% |
| Sri Lanka | 10 | 0.0% |
| St. Vincent and the Grenadines | 12 | 0.0% |
| Sudan | 114 | 0.0% |
| Sweden | 27 | 0.0% |
| Switzerland | 23 | 0.0% |
| Taiwan | 219 | 0.0% |
| Thailand | 384 | 0.0% |
| Trinidad and Tobago | 97 | 0.0% |
| Turkey | 91 | 0.0% |
| Uganda | 33 | 0.0% |
| Ukraine | 194 | 0.0% |
| Uruguay | 19 | 0.0% |
| Uzbekistan | 3 | 0.0% |
| Venezuela | 265 | 0.0% |
| Vietnam | 995 | 0.1% |
| West Indies | 42 | 0.0% |
| Western Africa | 663 | 0.1% |
| Western Asia | 326 | 0.0% |
| Western Europe | 2,598 | 0.2% |
| Yemen | 52 | 0.0% |
| Zaire | 68 | 0.0% |
| Zimbabwe | 64 | 0.0% | View All 119 Rows |
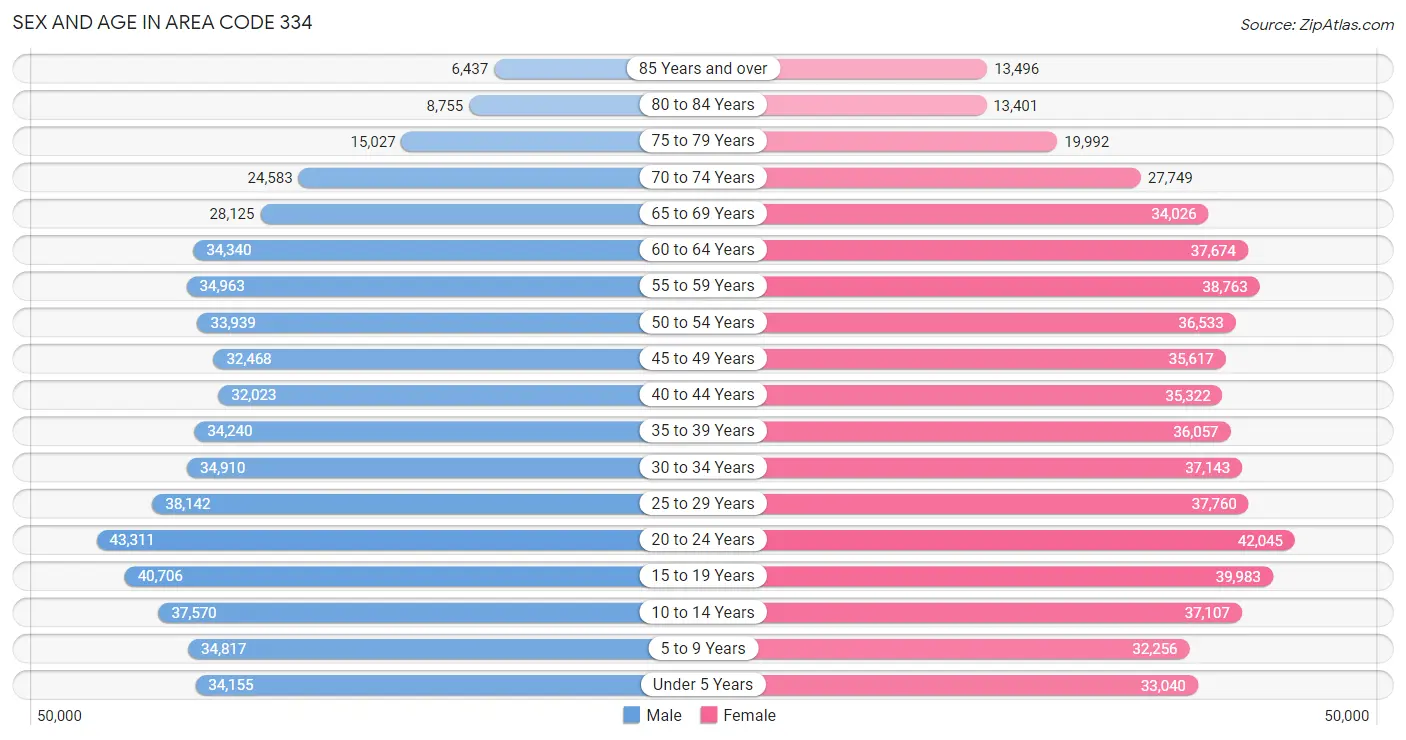
Sex and Age in Area Code 334
Sex and Age in Area Code 334
The most populous age groups in Area Code 334 are 20 to 24 Years (43,311 | 7.9%) for men and 20 to 24 Years (42,045 | 7.1%) for women.
| Age Bracket | Male | Female |
| Under 5 Years | 34,155 (6.2%) | 33,040 (5.6%) |
| 5 to 9 Years | 34,817 (6.4%) | 32,256 (5.5%) |
| 10 to 14 Years | 37,570 (6.9%) | 37,107 (6.3%) |
| 15 to 19 Years | 40,706 (7.4%) | 39,983 (6.8%) |
| 20 to 24 Years | 43,311 (7.9%) | 42,045 (7.1%) |
| 25 to 29 Years | 38,142 (7.0%) | 37,760 (6.4%) |
| 30 to 34 Years | 34,910 (6.4%) | 37,143 (6.3%) |
| 35 to 39 Years | 34,240 (6.2%) | 36,057 (6.1%) |
| 40 to 44 Years | 32,023 (5.8%) | 35,322 (6.0%) |
| 45 to 49 Years | 32,468 (5.9%) | 35,617 (6.1%) |
| 50 to 54 Years | 33,939 (6.2%) | 36,533 (6.2%) |
| 55 to 59 Years | 34,963 (6.4%) | 38,763 (6.6%) |
| 60 to 64 Years | 34,340 (6.3%) | 37,674 (6.4%) |
| 65 to 69 Years | 28,125 (5.1%) | 34,026 (5.8%) |
| 70 to 74 Years | 24,583 (4.5%) | 27,749 (4.7%) |
| 75 to 79 Years | 15,027 (2.7%) | 19,992 (3.4%) |
| 80 to 84 Years | 8,755 (1.6%) | 13,401 (2.3%) |
| 85 Years and over | 6,437 (1.2%) | 13,496 (2.3%) |
| Total | 548,511 (100.0%) | 587,964 (100.0%) |
Families and Households in Area Code 334
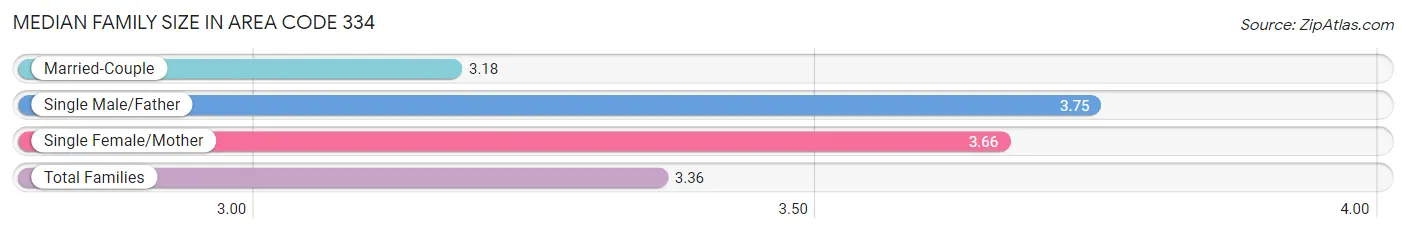
Median Family Size in Area Code 334
The median family size in Area Code 334 is 3.36 persons per family, with single male/father families (18,615 | 6.8%) accounting for the largest median family size of 3.74522 persons per family. On the other hand, married-couple families (184,568 | 67.2%) represent the smallest median family size with 3.18 persons per family.
| Family Type | # Families | Family Size |
| Married-Couple | 184,568 (67.2%) | 3.18 |
| Single Male/Father | 18,615 (6.8%) | 3.75 |
| Single Female/Mother | 71,592 (26.1%) | 3.66 |
| Total Families | 274,775 (100.0%) | 3.36 |
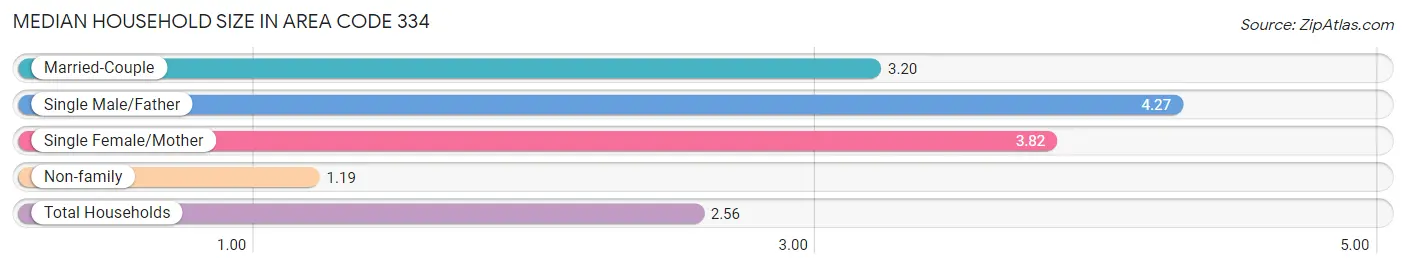
Median Household Size in Area Code 334
The median household size in Area Code 334 is 2.56 persons per household, with single male/father households (18,615 | 4.3%) accounting for the largest median household size of 4.27154 persons per household. non-family households (160,126 | 36.8%) represent the smallest median household size with 1.19 persons per household.
| Household Type | # Households | Household Size |
| Married-Couple | 184,568 (42.4%) | 3.20 |
| Single Male/Father | 18,615 (4.3%) | 4.27 |
| Single Female/Mother | 71,592 (16.5%) | 3.82 |
| Non-family | 160,126 (36.8%) | 1.19 |
| Total Households | 434,901 (100.0%) | 2.56 |
Household Size by Marriage Status in Area Code 334
Out of a total of 434,901 households in Area Code 334, 274,775 (63.2%) are family households, while 160,126 (36.8%) are nonfamily households. The most numerous type of family households are 2-person households, comprising 129,750, and the most common type of nonfamily households are 1-person households, comprising 139,906.
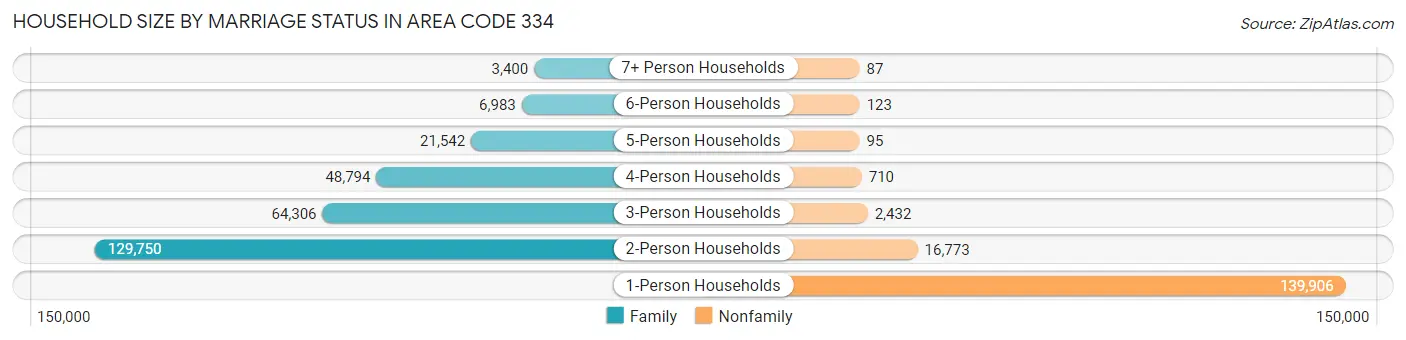
| Household Size | Family Households | Nonfamily Households |
| 1-Person Households | - | 139,906 (32.2%) |
| 2-Person Households | 129,750 (29.8%) | 16,773 (3.9%) |
| 3-Person Households | 64,306 (14.8%) | 2,432 (0.6%) |
| 4-Person Households | 48,794 (11.2%) | 710 (0.2%) |
| 5-Person Households | 21,542 (5.0%) | 95 (0.0%) |
| 6-Person Households | 6,983 (1.6%) | 123 (0.0%) |
| 7+ Person Households | 3,400 (0.8%) | 87 (0.0%) |
| Total | 274,775 (63.2%) | 160,126 (36.8%) |
Female Fertility in Area Code 334
Fertility by Age in Area Code 334
Average fertility rate in Area Code 334 is 69.3 births per 1,000 women. Women in the age bracket of 15 to 19 years have the highest fertility rate with 135.1 births per 1,000 women. Women in the age bracket of 20 to 34 years acount for 76.4% of all women with births.
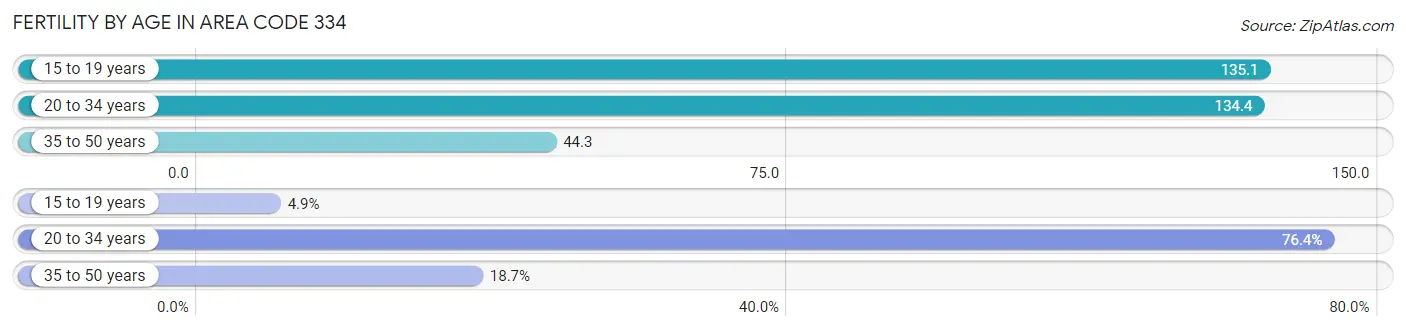
| Age Bracket | Women with Births | Births / 1,000 Women |
| 15 to 19 years | 668 (4.9%) | 135.1 |
| 20 to 34 years | 10,349 (76.4%) | 134.4 |
| 35 to 50 years | 2,525 (18.6%) | 44.3 |
| Total | 13,542 (100.0%) | 69.3 |
Fertility by Age by Marriage Status in Area Code 334
41.2% of women with births (13,542) in Area Code 334 are married. The highest percentage of unmarried women with births falls into 15 to 19 years age bracket with 96.1% of them unmarried at the time of birth, while the lowest percentage of unmarried women with births belong to 20 to 34 years age bracket with 59.6% of them unmarried.
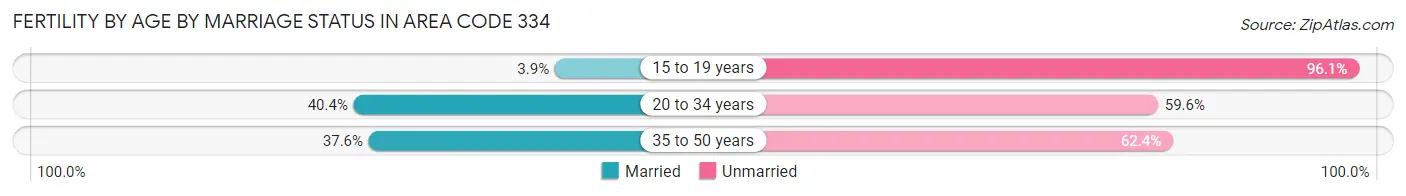
| Age Bracket | Married | Unmarried |
| 15 to 19 years | 26 (3.9%) | 642 (96.1%) |
| 20 to 34 years | 4,177 (40.4%) | 6,172 (59.6%) |
| 35 to 50 years | 950 (37.6%) | 1,575 (62.4%) |
| Total | 5,585 (41.2%) | 7,957 (58.8%) |
Fertility by Education in Area Code 334
Average fertility rate in Area Code 334 is 69.3 births per 1,000 women. Women with the education attainment of graduate degree have the highest fertility rate of 169.2 births per 1,000 women, while women with the education attainment of college or associate's degree have the lowest fertility at 99.3 births per 1,000 women. Women with the education attainment of college or associate's degree represent 41.5% of all women with births.
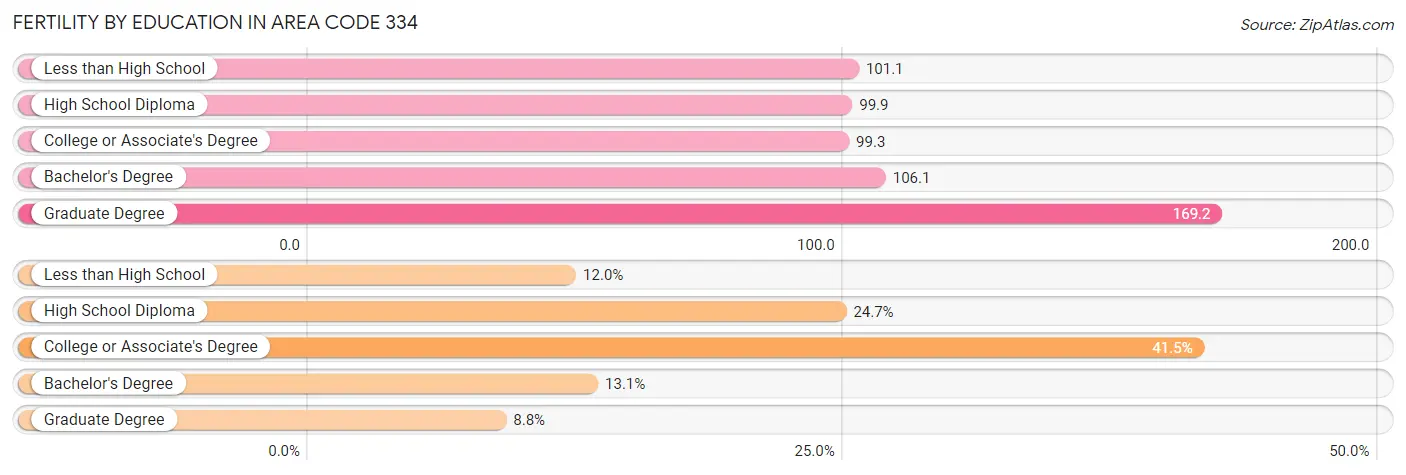
| Educational Attainment | Women with Births | Births / 1,000 Women |
| Less than High School | 1,629 (12.0%) | 101.1 |
| High School Diploma | 3,344 (24.7%) | 99.9 |
| College or Associate's Degree | 5,614 (41.5%) | 99.3 |
| Bachelor's Degree | 1,769 (13.1%) | 106.1 |
| Graduate Degree | 1,186 (8.8%) | 169.2 |
| Total | 13,542 (100.0%) | 69.3 |
Fertility by Education by Marriage Status in Area Code 334
58.8% of women with births in Area Code 334 are unmarried. Women with the educational attainment of bachelor's degree are most likely to be married with 45.3% of them married at childbirth, while women with the educational attainment of less than high school are least likely to be married with 88.9% of them unmarried at childbirth.
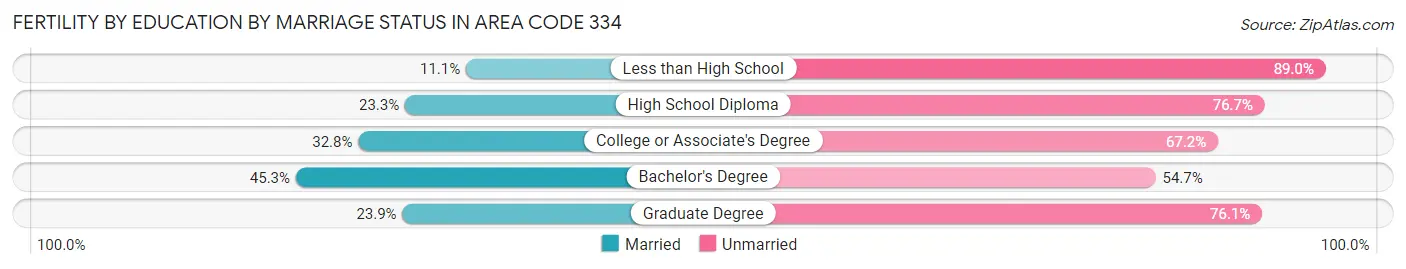
| Educational Attainment | Married | Unmarried |
| Less than High School | 180 (11.1%) | 1,449 (88.9%) |
| High School Diploma | 780 (23.3%) | 2,564 (76.7%) |
| College or Associate's Degree | 1,839 (32.8%) | 3,775 (67.2%) |
| Bachelor's Degree | 802 (45.3%) | 967 (54.7%) |
| Graduate Degree | 283 (23.9%) | 903 (76.1%) |
| Total | 5,585 (41.2%) | 7,957 (58.8%) |
Employment Characteristics in Area Code 334
Employment by Class of Employer in Area Code 334
Among the 474,142 employed individuals in Area Code 334, private company employees (304,608 | 64.2%), state government employees (35,755 | 7.5%), and local government employees (33,555 | 7.1%) make up the most common classes of employment.
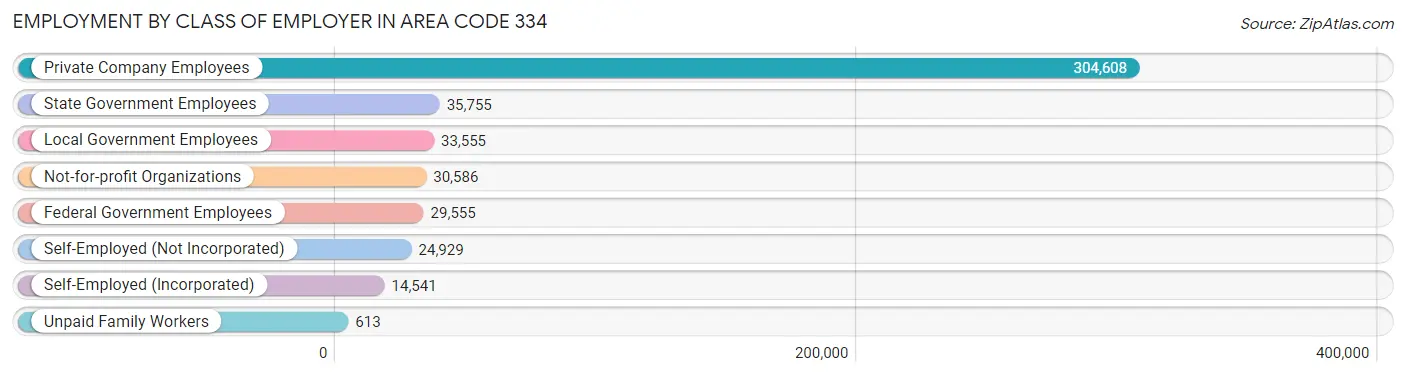
| Employer Class | # Employees | % Employees |
| Private Company Employees | 304,608 | 64.2% |
| Self-Employed (Incorporated) | 14,541 | 3.1% |
| Self-Employed (Not Incorporated) | 24,929 | 5.3% |
| Not-for-profit Organizations | 30,586 | 6.5% |
| Local Government Employees | 33,555 | 7.1% |
| State Government Employees | 35,755 | 7.5% |
| Federal Government Employees | 29,555 | 6.2% |
| Unpaid Family Workers | 613 | 0.1% |
| Total | 474,142 | 100.0% |
Employment Status by Age in Area Code 334
According to the labor force statistics for Area Code 334, out of the total population over 16 years of age (913,320), 51.3% or 468,533 individuals are in the labor force, with 7.6% or 35,749 of them unemployed. The age group with the highest labor force participation rate is 25 to 29 years, with 77.7% or 58,945 individuals in the labor force. Within the labor force, the 16 to 19 years age range has the highest percentage of unemployed individuals, with 2,466.2% or 625,478 of them being unemployed.
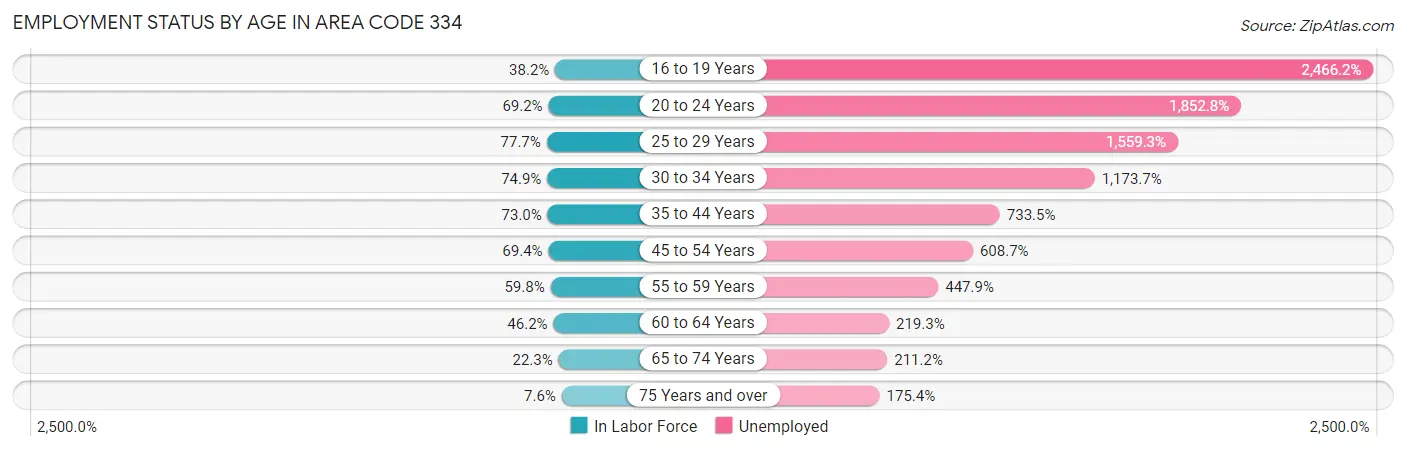
| Age Bracket | In Labor Force | Unemployed |
| 16 to 19 Years | 25,360 (38.2%) | 625,478 (2,466.2%) |
| 20 to 24 Years | 59,027 (69.2%) | 1,093,597 (1,852.8%) |
| 25 to 29 Years | 58,946 (77.7%) | 919,129 (1,559.3%) |
| 30 to 34 Years | 53,974 (74.9%) | 633,505 (1,173.7%) |
| 35 to 44 Years | 100,524 (73.0%) | 737,314 (733.5%) |
| 45 to 54 Years | 96,152 (69.4%) | 585,320 (608.7%) |
| 55 to 59 Years | 44,089 (59.8%) | 197,470 (447.9%) |
| 60 to 64 Years | 33,239 (46.2%) | 72,900 (219.3%) |
| 65 to 74 Years | 25,485 (22.3%) | 53,822 (211.2%) |
| 75 Years and over | 5,883 (7.6%) | 10,319 (175.4%) |
| Total | 468,556 (51.3%) | 35,762 (7.6%) |
Employment Status by Educational Attainment in Area Code 334
According to labor force statistics for Area Code 334, 66.1% of individuals (376,529) out of the total population between 25 and 64 years of age (569,894) are in the labor force, with 861.8% or 3,244,927 of them being unemployed. The group with the highest labor force participation rate are those with the educational attainment of bachelor's degree or higher, with 81.5% or 119,993 individuals in the labor force. Within the labor force, individuals with high school diploma education have the highest percentage of unemployment, with 1,256.0% or 1,374,654 of them being unemployed.
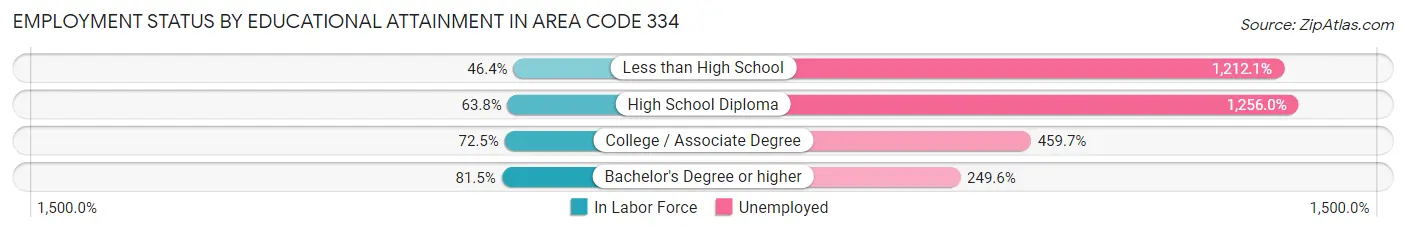
| Educational Attainment | In Labor Force | Unemployed |
| Less than High School | 30,762 (46.4%) | 804,519 (1,212.1%) |
| High School Diploma | 109,441 (63.7%) | 2,156,326 (1,256.0%) |
| College / Associate Degree | 133,721 (72.5%) | 848,307 (459.7%) |
| Bachelor's Degree or higher | 119,990 (81.5%) | 367,668 (249.6%) |
| Total | 376,505 (66.1%) | 4,911,346 (861.8%) |
Employment Occupations by Sex in Area Code 334
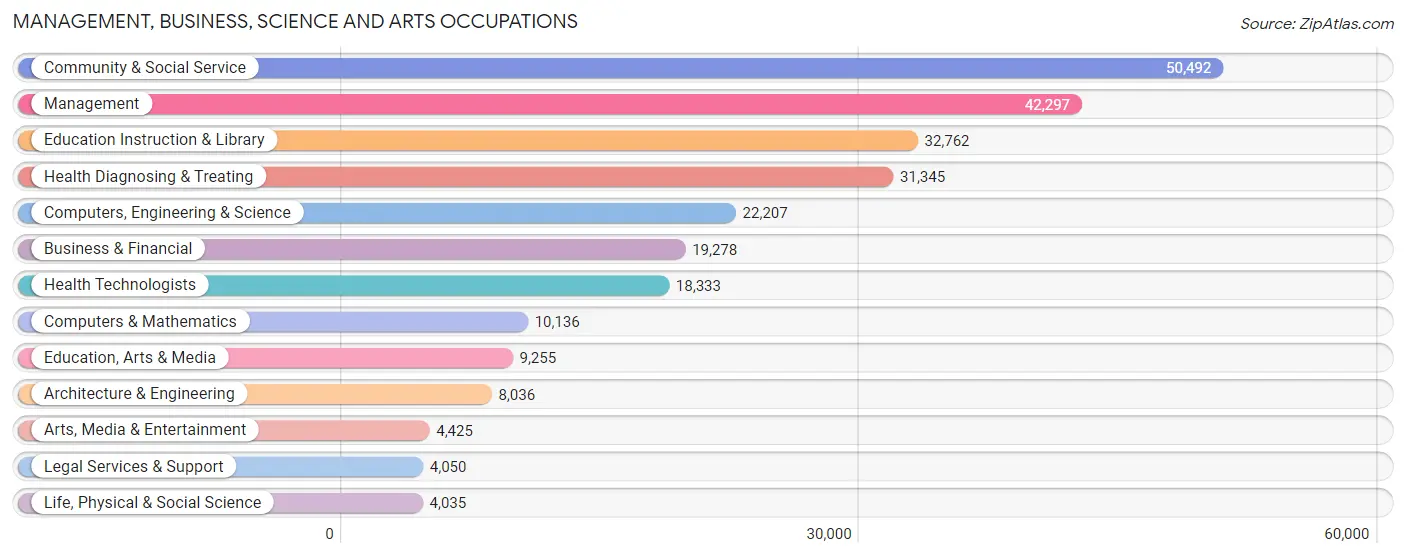
Management, Business, Science and Arts Occupations
The most common Management, Business, Science and Arts occupations in Area Code 334 are Community & Social Service (50,492 | 10.6%), Management (42,297 | 8.9%), Education Instruction & Library (32,762 | 6.9%), Health Diagnosing & Treating (31,345 | 6.6%), and Computers, Engineering & Science (22,207 | 4.7%).
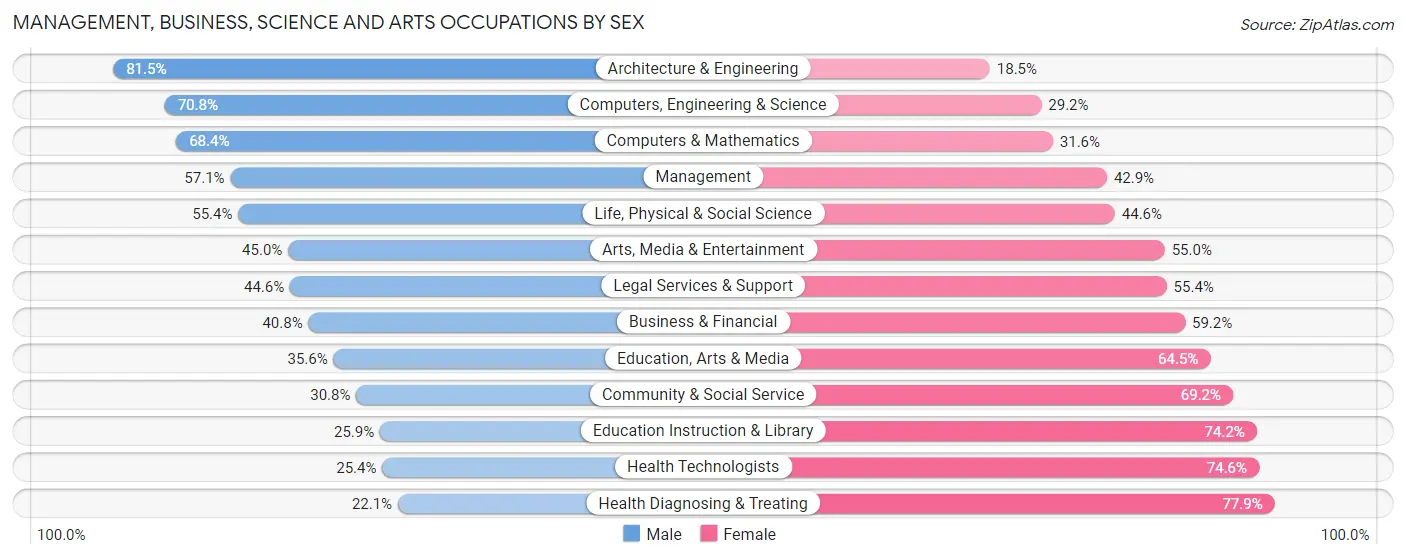
Management, Business, Science and Arts Occupations by Sex
Within the Management, Business, Science and Arts occupations in Area Code 334, the most male-oriented occupations are Architecture & Engineering (81.5%), Computers, Engineering & Science (70.8%), and Computers & Mathematics (68.4%), while the most female-oriented occupations are Health Diagnosing & Treating (77.9%), Health Technologists (74.6%), and Education Instruction & Library (74.2%).
| Occupation | Male | Female |
| Management | 24,140 (57.1%) | 18,157 (42.9%) |
| Business & Financial | 7,862 (40.8%) | 11,416 (59.2%) |
| Computers, Engineering & Science | 15,714 (70.8%) | 6,493 (29.2%) |
| Computers & Mathematics | 6,929 (68.4%) | 3,207 (31.6%) |
| Architecture & Engineering | 6,549 (81.5%) | 1,487 (18.5%) |
| Life, Physical & Social Science | 2,236 (55.4%) | 1,799 (44.6%) |
| Community & Social Service | 15,559 (30.8%) | 34,933 (69.2%) |
| Education, Arts & Media | 3,290 (35.5%) | 5,965 (64.4%) |
| Legal Services & Support | 1,807 (44.6%) | 2,243 (55.4%) |
| Education Instruction & Library | 8,470 (25.9%) | 24,292 (74.2%) |
| Arts, Media & Entertainment | 1,992 (45.0%) | 2,433 (55.0%) |
| Health Diagnosing & Treating | 6,935 (22.1%) | 24,410 (77.9%) |
| Health Technologists | 4,655 (25.4%) | 13,678 (74.6%) |
| Total (Category) | 70,210 (42.4%) | 95,409 (57.6%) |
| Total (Overall) | 239,792 (50.5%) | 234,888 (49.5%) |
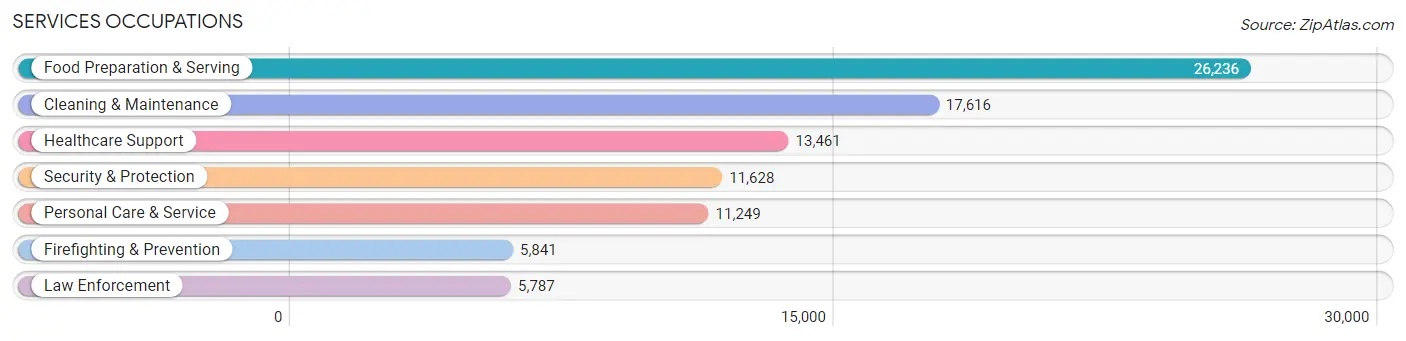
Services Occupations
The most common Services occupations in Area Code 334 are Food Preparation & Serving (26,236 | 5.5%), Cleaning & Maintenance (17,616 | 3.7%), Healthcare Support (13,461 | 2.8%), Security & Protection (11,628 | 2.5%), and Personal Care & Service (11,249 | 2.4%).
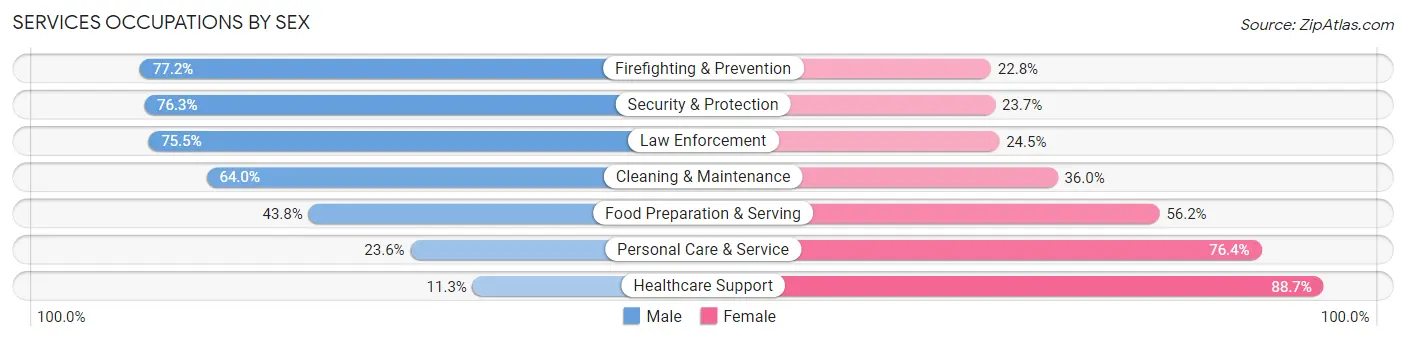
Services Occupations by Sex
Within the Services occupations in Area Code 334, the most male-oriented occupations are Firefighting & Prevention (77.2%), Security & Protection (76.3%), and Law Enforcement (75.5%), while the most female-oriented occupations are Healthcare Support (88.7%), Personal Care & Service (76.4%), and Food Preparation & Serving (56.2%).
| Occupation | Male | Female |
| Healthcare Support | 1,519 (11.3%) | 11,942 (88.7%) |
| Security & Protection | 8,877 (76.3%) | 2,751 (23.7%) |
| Firefighting & Prevention | 4,507 (77.2%) | 1,334 (22.8%) |
| Law Enforcement | 4,370 (75.5%) | 1,417 (24.5%) |
| Food Preparation & Serving | 11,487 (43.8%) | 14,749 (56.2%) |
| Cleaning & Maintenance | 11,269 (64.0%) | 6,347 (36.0%) |
| Personal Care & Service | 2,655 (23.6%) | 8,594 (76.4%) |
| Total (Category) | 35,807 (44.7%) | 44,383 (55.3%) |
| Total (Overall) | 239,792 (50.5%) | 234,888 (49.5%) |
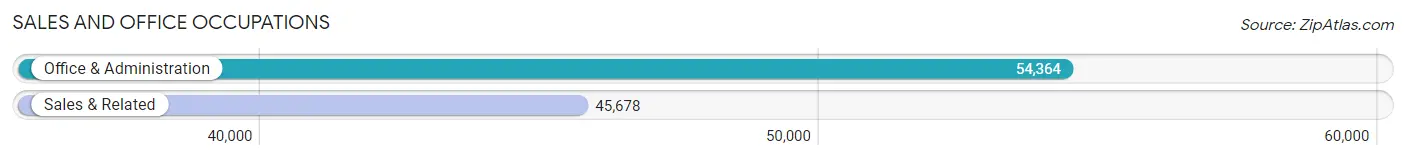
Sales and Office Occupations
The most common Sales and Office occupations in Area Code 334 are Office & Administration (54,364 | 11.5%), and Sales & Related (45,678 | 9.6%).
Sales and Office Occupations by Sex
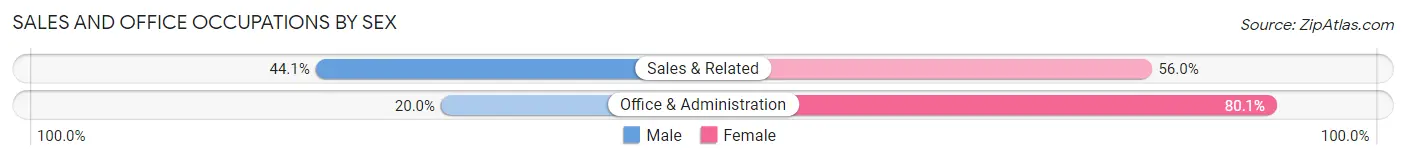
| Occupation | Male | Female |
| Sales & Related | 20,121 (44.1%) | 25,557 (55.9%) |
| Office & Administration | 10,848 (20.0%) | 43,516 (80.0%) |
| Total (Category) | 30,969 (31.0%) | 69,073 (69.0%) |
| Total (Overall) | 239,792 (50.5%) | 234,888 (49.5%) |
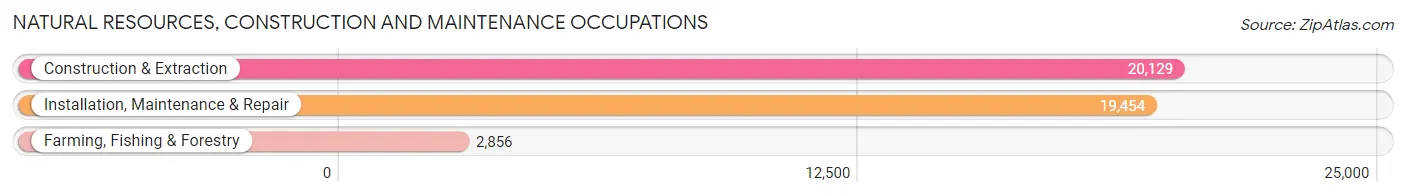
Natural Resources, Construction and Maintenance Occupations
The most common Natural Resources, Construction and Maintenance occupations in Area Code 334 are Construction & Extraction (20,129 | 4.2%), Installation, Maintenance & Repair (19,454 | 4.1%), and Farming, Fishing & Forestry (2,856 | 0.6%).
Natural Resources, Construction and Maintenance Occupations by Sex
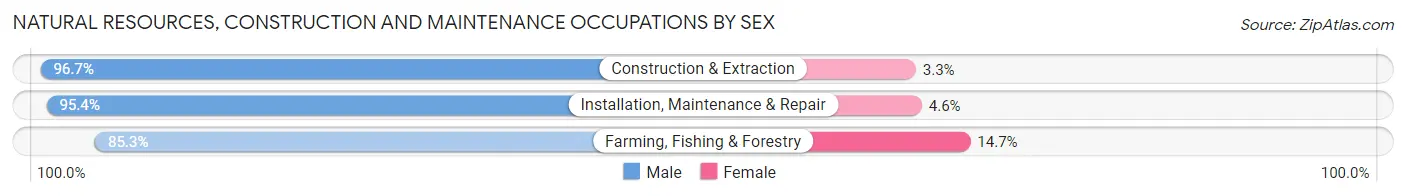
| Occupation | Male | Female |
| Farming, Fishing & Forestry | 2,437 (85.3%) | 419 (14.7%) |
| Construction & Extraction | 19,462 (96.7%) | 667 (3.3%) |
| Installation, Maintenance & Repair | 18,567 (95.4%) | 887 (4.6%) |
| Total (Category) | 40,466 (95.4%) | 1,973 (4.6%) |
| Total (Overall) | 239,792 (50.5%) | 234,888 (49.5%) |
Production, Transportation and Moving Occupations
The most common Production, Transportation and Moving occupations in Area Code 334 are Production (42,601 | 9.0%), Material Moving (22,563 | 4.8%), and Transportation (21,226 | 4.5%).
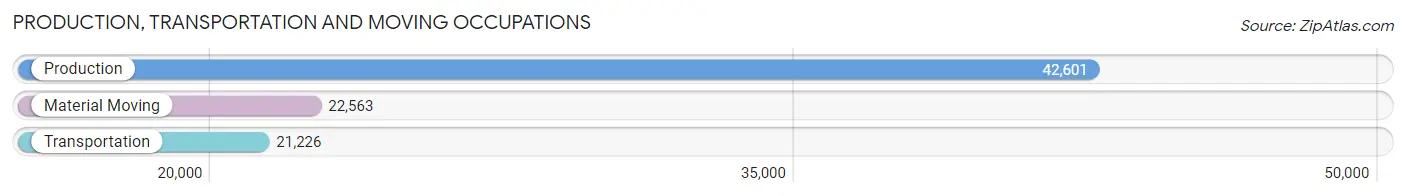
Production, Transportation and Moving Occupations by Sex
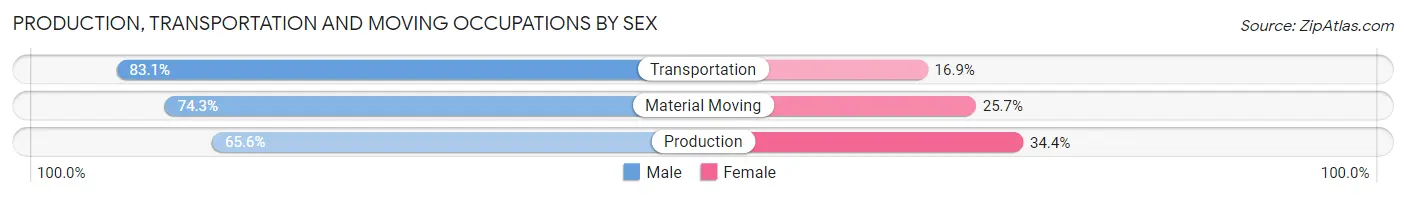
| Occupation | Male | Female |
| Production | 27,944 (65.6%) | 14,657 (34.4%) |
| Transportation | 17,639 (83.1%) | 3,587 (16.9%) |
| Material Moving | 16,757 (74.3%) | 5,806 (25.7%) |
| Total (Category) | 62,340 (72.2%) | 24,050 (27.8%) |
| Total (Overall) | 239,792 (50.5%) | 234,888 (49.5%) |
Employment Industries by Sex in Area Code 334
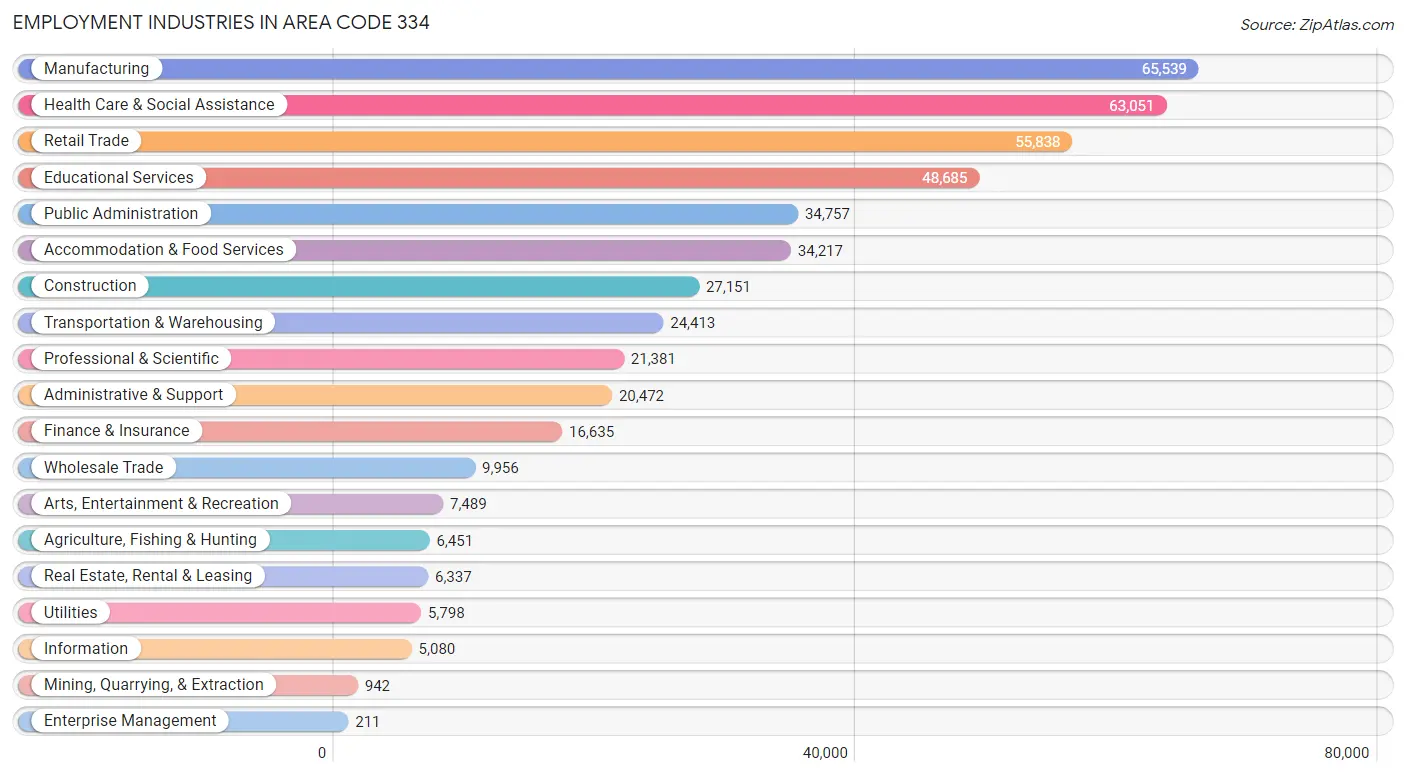
Employment Industries in Area Code 334
The major employment industries in Area Code 334 include Manufacturing (65,539 | 13.8%), Health Care & Social Assistance (63,051 | 13.3%), Retail Trade (55,838 | 11.8%), Educational Services (48,685 | 10.3%), and Public Administration (34,757 | 7.3%).
Employment Industries by Sex in Area Code 334
The Area Code 334 industries that see more men than women are Mining, Quarrying, & Extraction (94.5%), Construction (92.0%), and Agriculture, Fishing & Hunting (85.9%), whereas the industries that tend to have a higher number of women are Enterprise Management (91.9%), Health Care & Social Assistance (81.2%), and Finance & Insurance (71.0%).
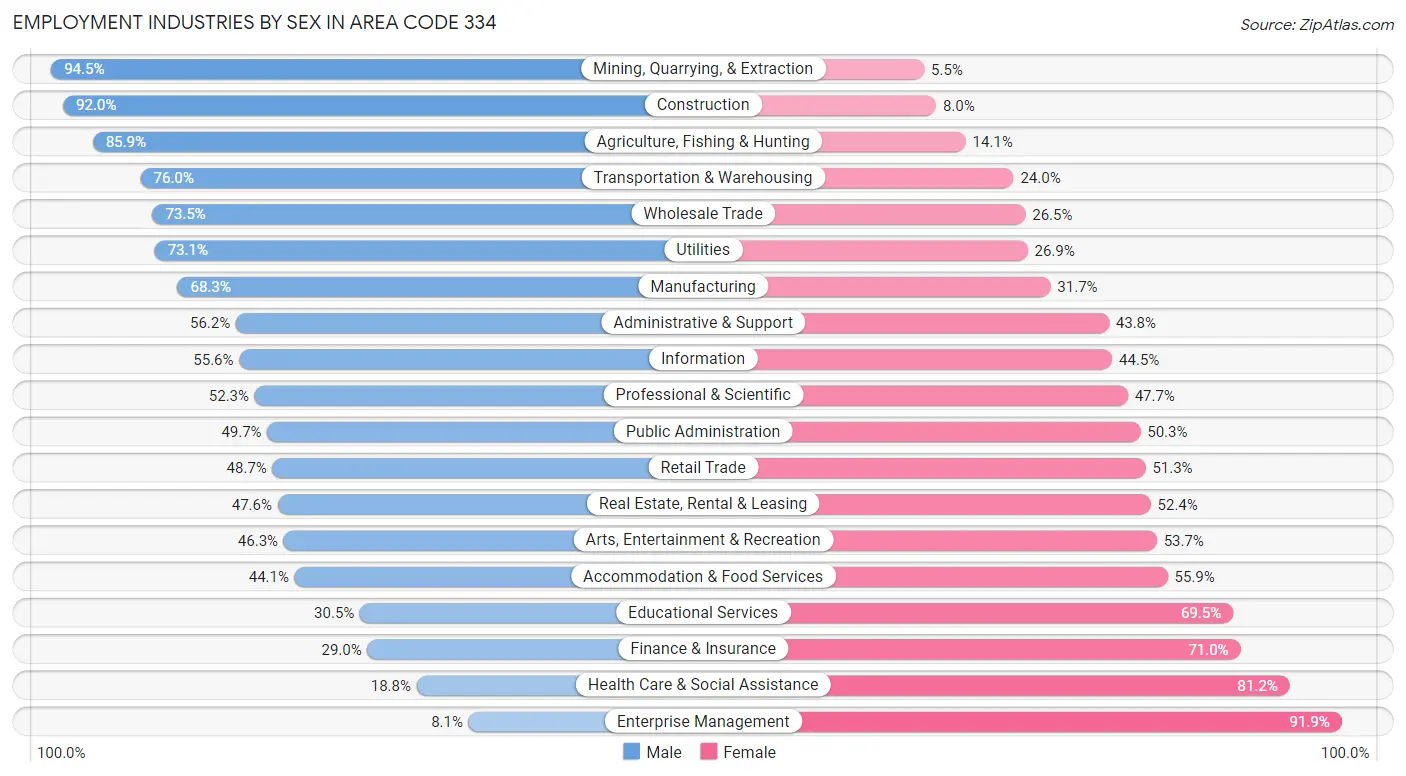
| Industry | Male | Female |
| Agriculture, Fishing & Hunting | 5,541 (85.9%) | 910 (14.1%) |
| Mining, Quarrying, & Extraction | 890 (94.5%) | 52 (5.5%) |
| Construction | 24,983 (92.0%) | 2,168 (8.0%) |
| Manufacturing | 44,783 (68.3%) | 20,756 (31.7%) |
| Wholesale Trade | 7,321 (73.5%) | 2,635 (26.5%) |
| Retail Trade | 27,170 (48.7%) | 28,668 (51.3%) |
| Transportation & Warehousing | 18,549 (76.0%) | 5,864 (24.0%) |
| Utilities | 4,236 (73.1%) | 1,562 (26.9%) |
| Information | 2,822 (55.5%) | 2,258 (44.5%) |
| Finance & Insurance | 4,825 (29.0%) | 11,810 (71.0%) |
| Real Estate, Rental & Leasing | 3,016 (47.6%) | 3,321 (52.4%) |
| Professional & Scientific | 11,191 (52.3%) | 10,190 (47.7%) |
| Enterprise Management | 17 (8.1%) | 194 (91.9%) |
| Administrative & Support | 11,513 (56.2%) | 8,959 (43.8%) |
| Educational Services | 14,869 (30.5%) | 33,816 (69.5%) |
| Health Care & Social Assistance | 11,869 (18.8%) | 51,182 (81.2%) |
| Arts, Entertainment & Recreation | 3,470 (46.3%) | 4,019 (53.7%) |
| Accommodation & Food Services | 15,083 (44.1%) | 19,134 (55.9%) |
| Public Administration | 17,285 (49.7%) | 17,472 (50.3%) |
| Total | 239,792 (50.5%) | 234,888 (49.5%) |
Education in Area Code 334
School Enrollment in Area Code 334
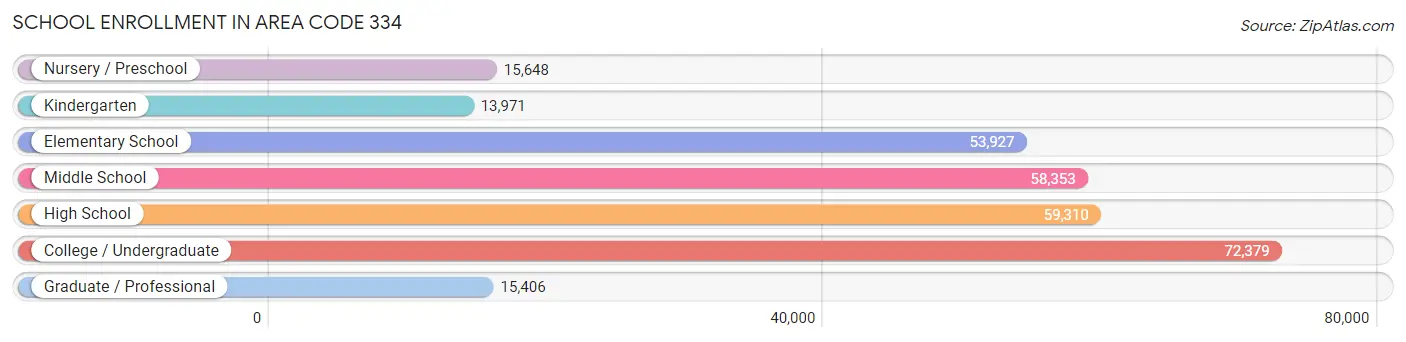
The most common levels of schooling among the 288,994 students in Area Code 334 are college / undergraduate (72,379 | 25.1%), high school (59,310 | 20.5%), and middle school (58,353 | 20.2%).
| School Level | # Students | % Students |
| Nursery / Preschool | 15,648 | 5.4% |
| Kindergarten | 13,971 | 4.8% |
| Elementary School | 53,927 | 18.7% |
| Middle School | 58,353 | 20.2% |
| High School | 59,310 | 20.5% |
| College / Undergraduate | 72,379 | 25.1% |
| Graduate / Professional | 15,406 | 5.3% |
| Total | 288,994 | 100.0% |
School Enrollment by Age by Funding Source in Area Code 334
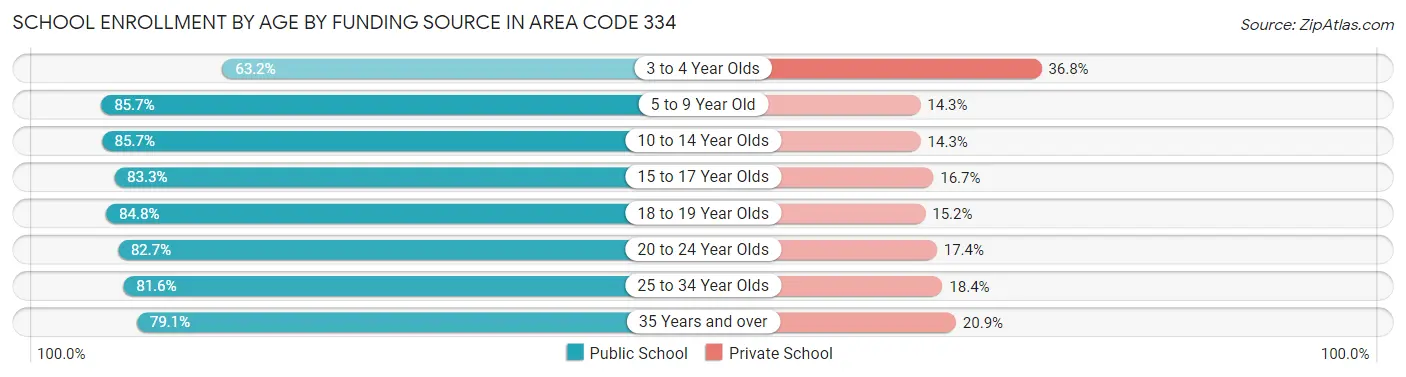
Out of a total of 288,994 students who are enrolled in schools in Area Code 334, 48,347 (16.7%) attend a private institution, while the remaining 240,647 (83.3%) are enrolled in public schools. The age group of 3 to 4 year olds has the highest likelihood of being enrolled in private schools, with 4,719 (36.8% in the age bracket) enrolled. Conversely, the age group of 5 to 9 year old has the lowest likelihood of being enrolled in a private school, with 53,778 (85.7% in the age bracket) attending a public institution.
| Age Bracket | Public School | Private School |
| 3 to 4 Year Olds | 8,091 (63.2%) | 4,719 (36.8%) |
| 5 to 9 Year Old | 53,778 (85.7%) | 8,962 (14.3%) |
| 10 to 14 Year Olds | 62,427 (85.7%) | 10,448 (14.3%) |
| 15 to 17 Year Olds | 34,907 (83.3%) | 6,994 (16.7%) |
| 18 to 19 Year Olds | 23,566 (84.8%) | 4,223 (15.2%) |
| 20 to 24 Year Olds | 31,998 (82.7%) | 6,719 (17.3%) |
| 25 to 34 Year Olds | 14,123 (81.6%) | 3,183 (18.4%) |
| 35 Years and over | 11,749 (79.1%) | 3,107 (20.9%) |
| Total | 240,647 (83.3%) | 48,347 (16.7%) |
Educational Attainment by Field of Study in Area Code 334
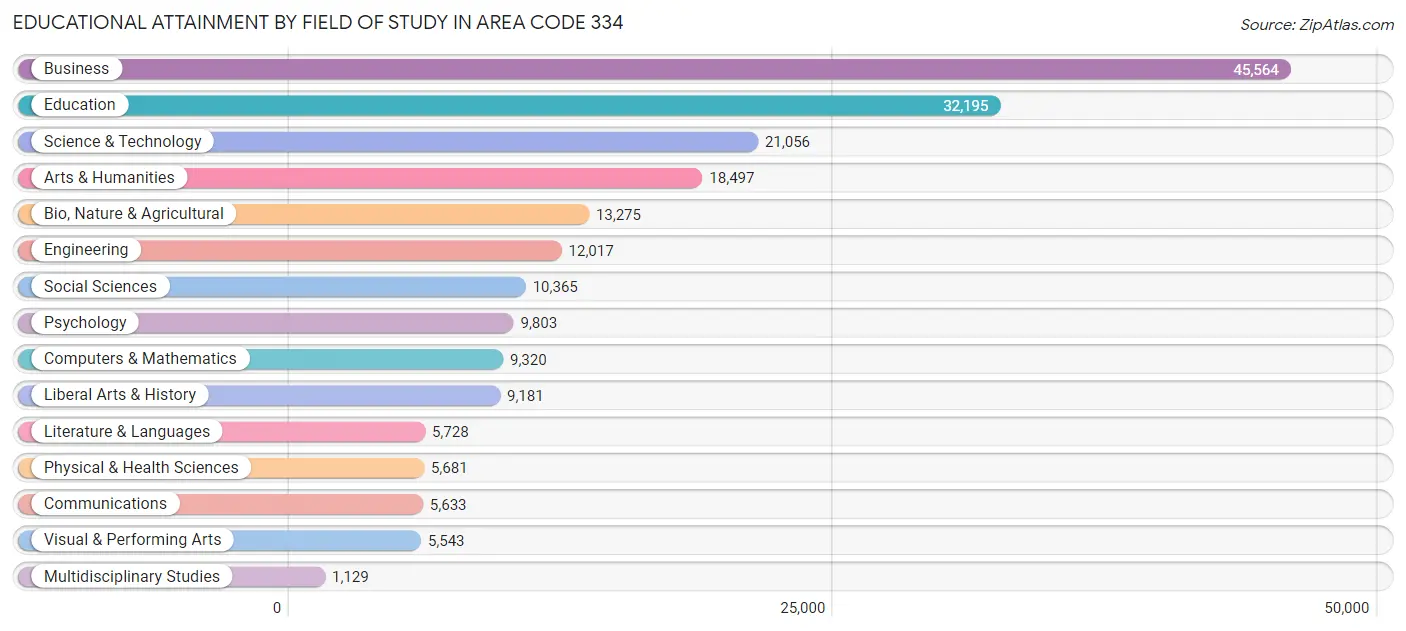
Business (45,564 | 22.2%), education (32,195 | 15.7%), science & technology (21,056 | 10.3%), arts & humanities (18,497 | 9.0%), and bio, nature & agricultural (13,275 | 6.5%) are the most common fields of study among 204,987 individuals in Area Code 334 who have obtained a bachelor's degree or higher.
| Field of Study | # Graduates | % Graduates |
| Computers & Mathematics | 9,320 | 4.5% |
| Bio, Nature & Agricultural | 13,275 | 6.5% |
| Physical & Health Sciences | 5,681 | 2.8% |
| Psychology | 9,803 | 4.8% |
| Social Sciences | 10,365 | 5.1% |
| Engineering | 12,017 | 5.9% |
| Multidisciplinary Studies | 1,129 | 0.5% |
| Science & Technology | 21,056 | 10.3% |
| Business | 45,564 | 22.2% |
| Education | 32,195 | 15.7% |
| Literature & Languages | 5,728 | 2.8% |
| Liberal Arts & History | 9,181 | 4.5% |
| Visual & Performing Arts | 5,543 | 2.7% |
| Communications | 5,633 | 2.8% |
| Arts & Humanities | 18,497 | 9.0% |
| Total | 204,987 | 100.0% |
Transportation & Commute in Area Code 334
Vehicle Availability by Sex in Area Code 334
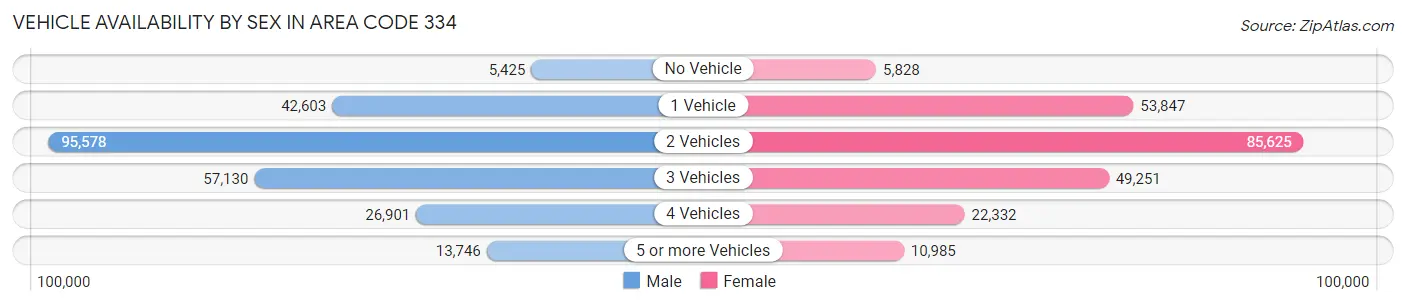
The most prevalent vehicle ownership categories in Area Code 334 are males with 2 vehicles (95,578, accounting for 39.6%) and females with 2 vehicles (85,625, making up 41.9%).
| Vehicles Available | Male | Female |
| No Vehicle | 5,425 (2.2%) | 5,828 (2.6%) |
| 1 Vehicle | 42,603 (17.6%) | 53,847 (23.6%) |
| 2 Vehicles | 95,578 (39.6%) | 85,625 (37.6%) |
| 3 Vehicles | 57,130 (23.7%) | 49,251 (21.6%) |
| 4 Vehicles | 26,901 (11.1%) | 22,332 (9.8%) |
| 5 or more Vehicles | 13,746 (5.7%) | 10,985 (4.8%) |
| Total | 241,383 (100.0%) | 227,868 (100.0%) |
Commute Time in Area Code 334
The most frequently occuring commute durations in Area Code 334 are 15 to 19 minutes (80,539 commuters, 17.9%), 10 to 14 minutes (72,736 commuters, 16.2%), and 20 to 24 minutes (69,398 commuters, 15.4%).
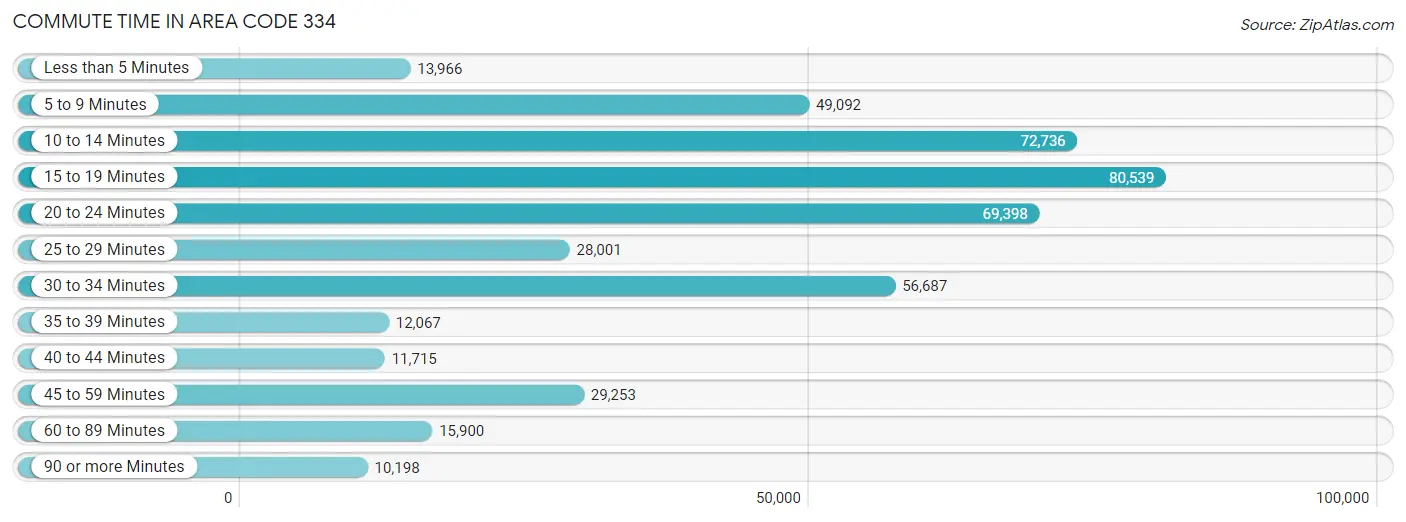
| Commute Time | # Commuters | % Commuters |
| Less than 5 Minutes | 13,966 | 3.1% |
| 5 to 9 Minutes | 49,092 | 10.9% |
| 10 to 14 Minutes | 72,736 | 16.2% |
| 15 to 19 Minutes | 80,539 | 17.9% |
| 20 to 24 Minutes | 69,398 | 15.4% |
| 25 to 29 Minutes | 28,001 | 6.2% |
| 30 to 34 Minutes | 56,687 | 12.6% |
| 35 to 39 Minutes | 12,067 | 2.7% |
| 40 to 44 Minutes | 11,715 | 2.6% |
| 45 to 59 Minutes | 29,253 | 6.5% |
| 60 to 89 Minutes | 15,900 | 3.5% |
| 90 or more Minutes | 10,198 | 2.3% |
Commute Time by Sex in Area Code 334
The most common commute times in Area Code 334 are 15 to 19 minutes (39,817 commuters, 17.1%) for males and 15 to 19 minutes (40,722 commuters, 18.8%) for females.
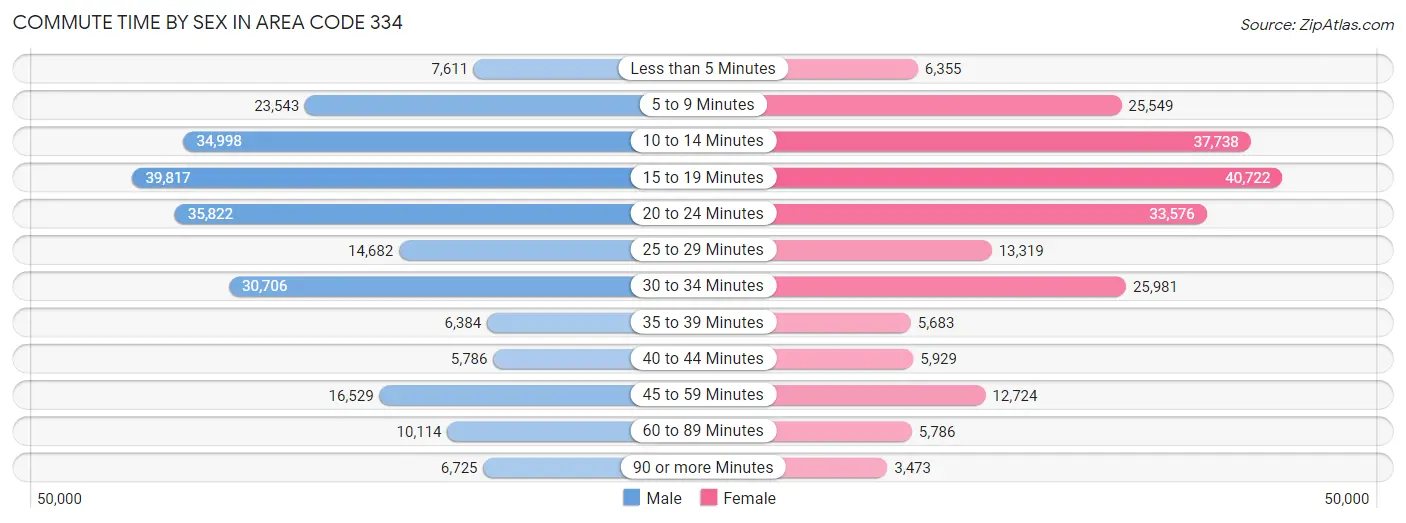
| Commute Time | Male | Female |
| Less than 5 Minutes | 7,611 (3.3%) | 6,355 (2.9%) |
| 5 to 9 Minutes | 23,543 (10.1%) | 25,549 (11.8%) |
| 10 to 14 Minutes | 34,998 (15.0%) | 37,738 (17.4%) |
| 15 to 19 Minutes | 39,817 (17.1%) | 40,722 (18.8%) |
| 20 to 24 Minutes | 35,822 (15.4%) | 33,576 (15.5%) |
| 25 to 29 Minutes | 14,682 (6.3%) | 13,319 (6.1%) |
| 30 to 34 Minutes | 30,706 (13.2%) | 25,981 (12.0%) |
| 35 to 39 Minutes | 6,384 (2.7%) | 5,683 (2.6%) |
| 40 to 44 Minutes | 5,786 (2.5%) | 5,929 (2.7%) |
| 45 to 59 Minutes | 16,529 (7.1%) | 12,724 (5.9%) |
| 60 to 89 Minutes | 10,114 (4.3%) | 5,786 (2.7%) |
| 90 or more Minutes | 6,725 (2.9%) | 3,473 (1.6%) |
Time of Departure to Work by Sex in Area Code 334
The most frequent times of departure to work in Area Code 334 are 7:00 AM to 7:29 AM (35,217, 15.1%) for males and 7:00 AM to 7:29 AM (41,331, 19.1%) for females.
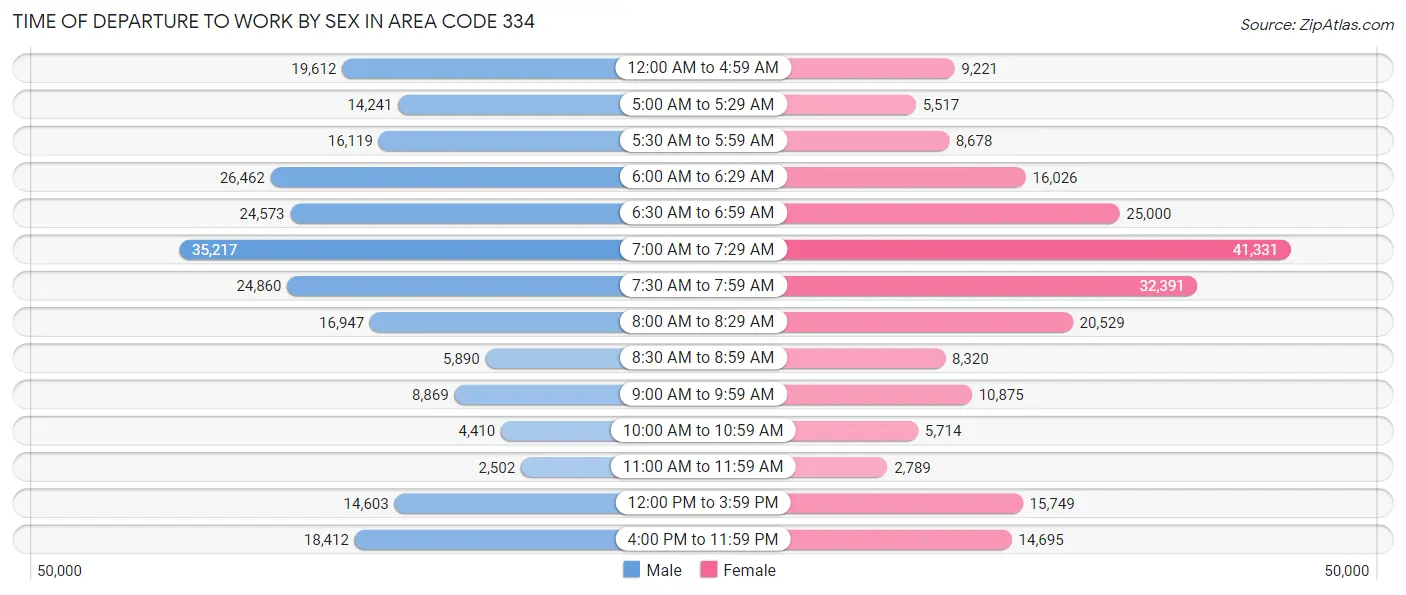
| Time of Departure | Male | Female |
| 12:00 AM to 4:59 AM | 19,612 (8.4%) | 9,221 (4.3%) |
| 5:00 AM to 5:29 AM | 14,241 (6.1%) | 5,517 (2.5%) |
| 5:30 AM to 5:59 AM | 16,119 (6.9%) | 8,678 (4.0%) |
| 6:00 AM to 6:29 AM | 26,462 (11.4%) | 16,026 (7.4%) |
| 6:30 AM to 6:59 AM | 24,573 (10.6%) | 25,000 (11.5%) |
| 7:00 AM to 7:29 AM | 35,217 (15.1%) | 41,331 (19.1%) |
| 7:30 AM to 7:59 AM | 24,860 (10.7%) | 32,391 (14.9%) |
| 8:00 AM to 8:29 AM | 16,947 (7.3%) | 20,529 (9.5%) |
| 8:30 AM to 8:59 AM | 5,890 (2.5%) | 8,320 (3.8%) |
| 9:00 AM to 9:59 AM | 8,869 (3.8%) | 10,875 (5.0%) |
| 10:00 AM to 10:59 AM | 4,410 (1.9%) | 5,714 (2.6%) |
| 11:00 AM to 11:59 AM | 2,502 (1.1%) | 2,789 (1.3%) |
| 12:00 PM to 3:59 PM | 14,603 (6.3%) | 15,749 (7.3%) |
| 4:00 PM to 11:59 PM | 18,412 (7.9%) | 14,695 (6.8%) |
| Total | 232,717 (100.0%) | 216,835 (100.0%) |
Housing Occupancy in Area Code 334
Occupancy by Ownership in Area Code 334
Of the total 434,901 dwellings in Area Code 334, owner-occupied units account for 285,954 (65.7%), while renter-occupied units make up 148,947 (34.3%).
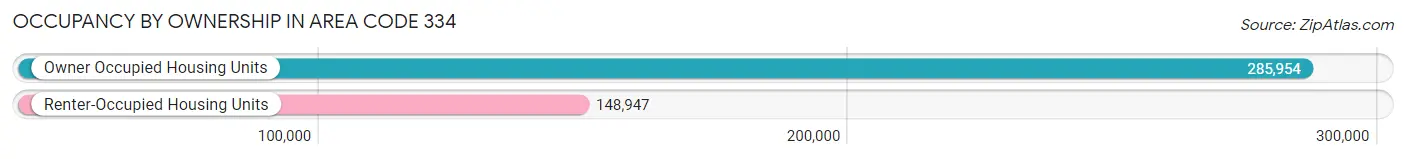
| Occupancy | # Housing Units | % Housing Units |
| Owner Occupied Housing Units | 285,954 | 65.7% |
| Renter-Occupied Housing Units | 148,947 | 34.3% |
| Total Occupied Housing Units | 434,901 | 100.0% |
Occupancy by Household Size in Area Code 334
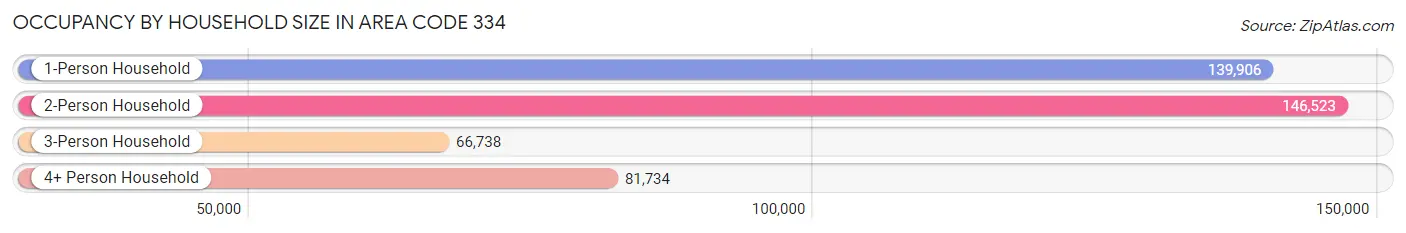
| Household Size | # Housing Units | % Housing Units |
| 1-Person Household | 139,906 | 32.2% |
| 2-Person Household | 146,523 | 33.7% |
| 3-Person Household | 66,738 | 15.3% |
| 4+ Person Household | 81,734 | 18.8% |
| Total Housing Units | 434,901 | 100.0% |
Occupancy by Ownership by Household Size in Area Code 334
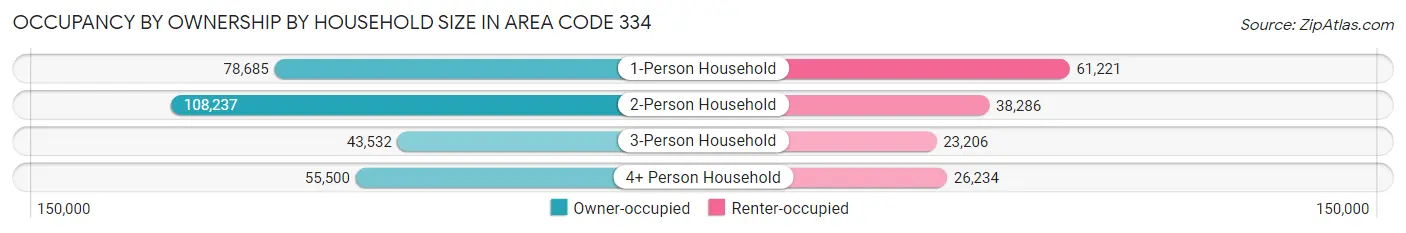
| Household Size | Owner-occupied | Renter-occupied |
| 1-Person Household | 78,685 (56.2%) | 61,221 (43.8%) |
| 2-Person Household | 108,237 (73.9%) | 38,286 (26.1%) |
| 3-Person Household | 43,532 (65.2%) | 23,206 (34.8%) |
| 4+ Person Household | 55,500 (67.9%) | 26,234 (32.1%) |
| Total Housing Units | 285,954 (65.7%) | 148,947 (34.3%) |
Occupancy by Educational Attainment in Area Code 334
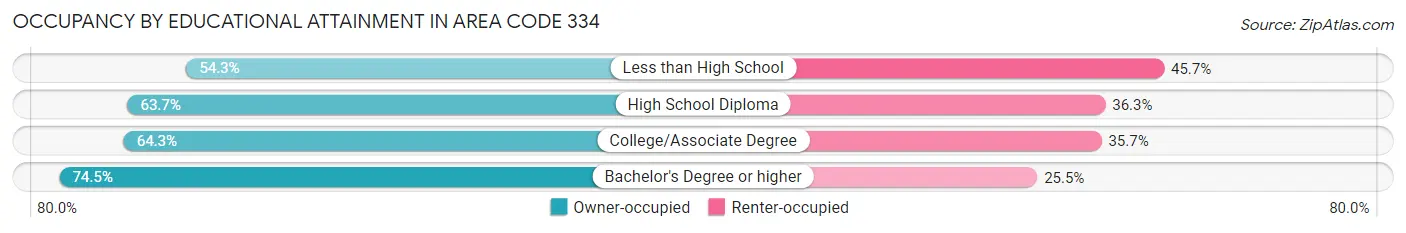
| Household Size | Owner-occupied | Renter-occupied |
| Less than High School | 26,851 (54.3%) | 22,560 (45.7%) |
| High School Diploma | 79,186 (63.7%) | 45,197 (36.3%) |
| College/Associate Degree | 91,435 (64.3%) | 50,845 (35.7%) |
| Bachelor's Degree or higher | 88,482 (74.5%) | 30,345 (25.5%) |
Occupancy by Age of Householder in Area Code 334
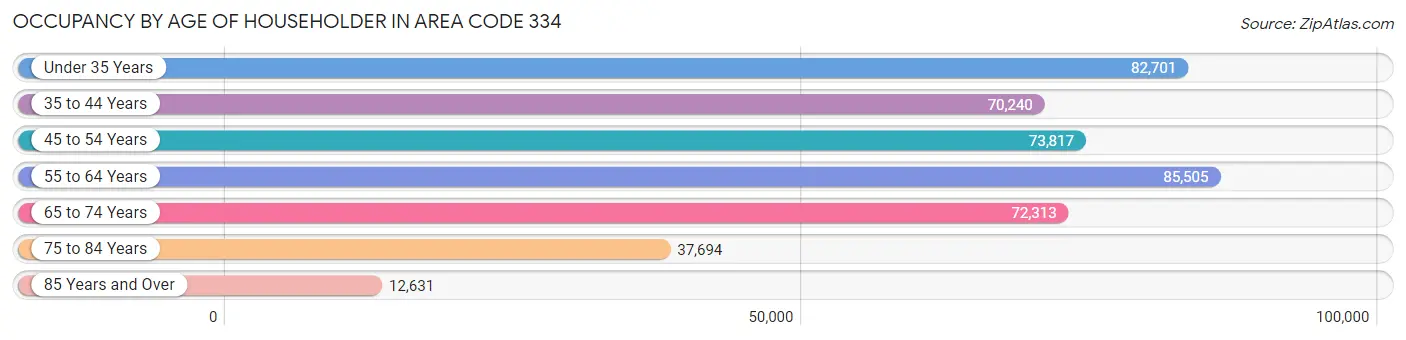
| Age Bracket | # Households | % Households |
| Under 35 Years | 82,701 | 19.0% |
| 35 to 44 Years | 70,240 | 16.2% |
| 45 to 54 Years | 73,817 | 17.0% |
| 55 to 64 Years | 85,505 | 19.7% |
| 65 to 74 Years | 72,313 | 16.6% |
| 75 to 84 Years | 37,694 | 8.7% |
| 85 Years and Over | 12,631 | 2.9% |
| Total | 434,901 | 100.0% |
Housing Finances in Area Code 334
Median Income by Occupancy in Area Code 334
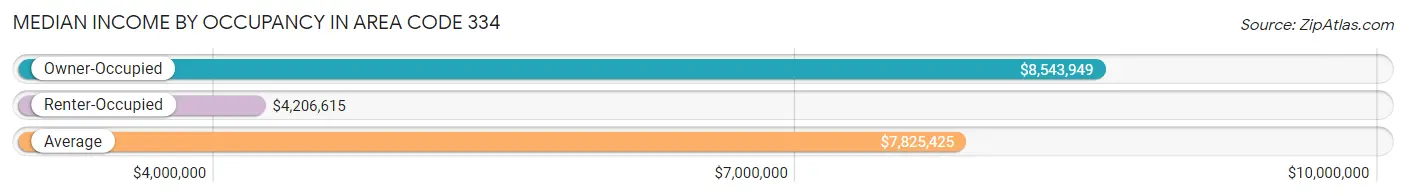
| Occupancy Type | # Households | Median Income |
| Owner-Occupied | 285,954 (65.7%) | $8,543,949 |
| Renter-Occupied | 148,947 (34.3%) | $4,206,615 |
| Average | 434,901 (100.0%) | $7,825,425 |
Occupancy by Householder Income Bracket in Area Code 334
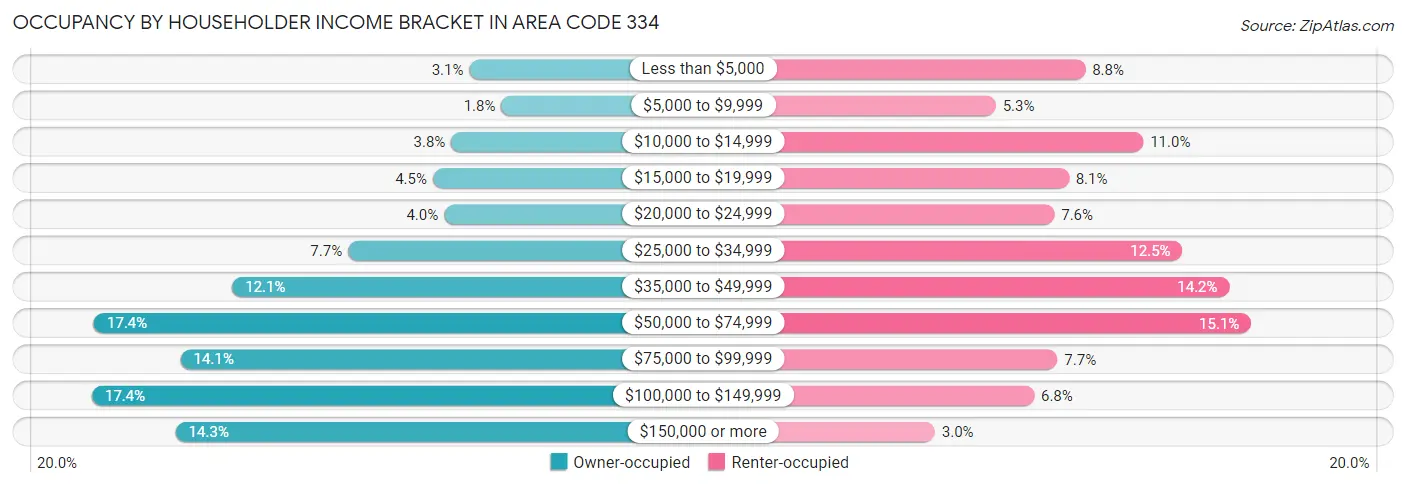
| Income Bracket | Owner-occupied | Renter-occupied |
| Less than $5,000 | 8,764 (3.1%) | 13,031 (8.7%) |
| $5,000 to $9,999 | 5,273 (1.8%) | 7,955 (5.3%) |
| $10,000 to $14,999 | 10,723 (3.7%) | 16,326 (11.0%) |
| $15,000 to $19,999 | 12,726 (4.4%) | 12,091 (8.1%) |
| $20,000 to $24,999 | 11,487 (4.0%) | 11,276 (7.6%) |
| $25,000 to $34,999 | 21,948 (7.7%) | 18,541 (12.4%) |
| $35,000 to $49,999 | 34,565 (12.1%) | 21,206 (14.2%) |
| $50,000 to $74,999 | 49,643 (17.4%) | 22,445 (15.1%) |
| $75,000 to $99,999 | 40,197 (14.1%) | 11,456 (7.7%) |
| $100,000 to $149,999 | 49,883 (17.4%) | 10,126 (6.8%) |
| $150,000 or more | 40,745 (14.2%) | 4,494 (3.0%) |
| Total | 285,954 (100.0%) | 148,947 (100.0%) |
Monthly Housing Cost Tiers in Area Code 334
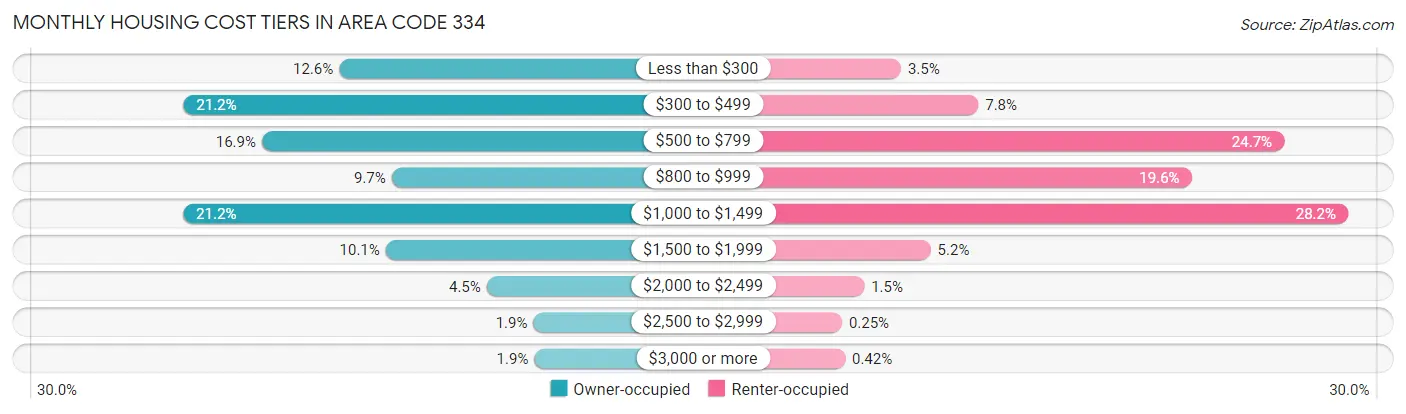
| Monthly Cost | Owner-occupied | Renter-occupied |
| Less than $300 | 36,126 (12.6%) | 5,223 (3.5%) |
| $300 to $499 | 60,702 (21.2%) | 11,581 (7.8%) |
| $500 to $799 | 48,325 (16.9%) | 36,730 (24.7%) |
| $800 to $999 | 27,810 (9.7%) | 29,118 (19.6%) |
| $1,000 to $1,499 | 60,726 (21.2%) | 41,984 (28.2%) |
| $1,500 to $1,999 | 28,762 (10.1%) | 7,673 (5.1%) |
| $2,000 to $2,499 | 12,797 (4.5%) | 2,208 (1.5%) |
| $2,500 to $2,999 | 5,423 (1.9%) | 368 (0.3%) |
| $3,000 or more | 5,283 (1.8%) | 633 (0.4%) |
| Total | 285,954 (100.0%) | 148,947 (100.0%) |
Physical Housing Characteristics in Area Code 334
Housing Structures in Area Code 334
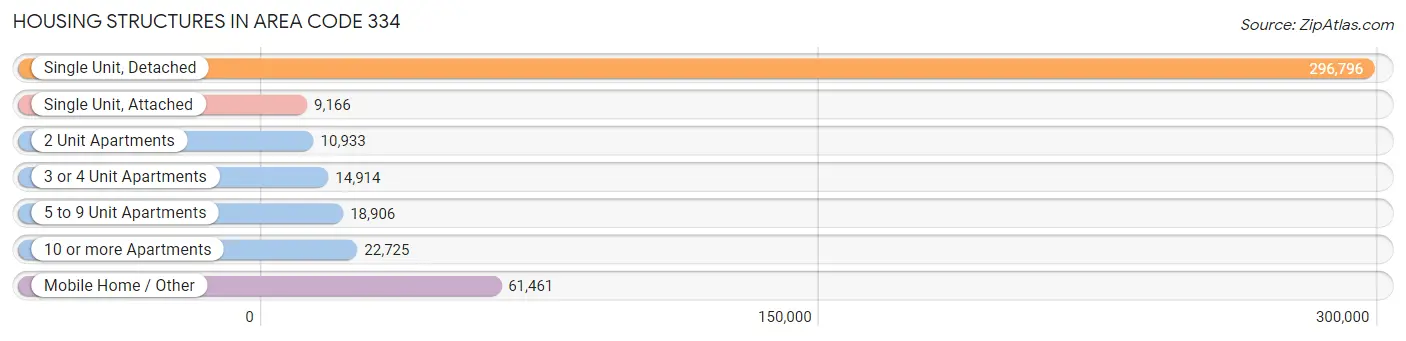
| Structure Type | # Housing Units | % Housing Units |
| Single Unit, Detached | 296,796 | 68.2% |
| Single Unit, Attached | 9,166 | 2.1% |
| 2 Unit Apartments | 10,933 | 2.5% |
| 3 or 4 Unit Apartments | 14,914 | 3.4% |
| 5 to 9 Unit Apartments | 18,906 | 4.3% |
| 10 or more Apartments | 22,725 | 5.2% |
| Mobile Home / Other | 61,461 | 14.1% |
| Total | 434,901 | 100.0% |
Housing Structures by Occupancy in Area Code 334
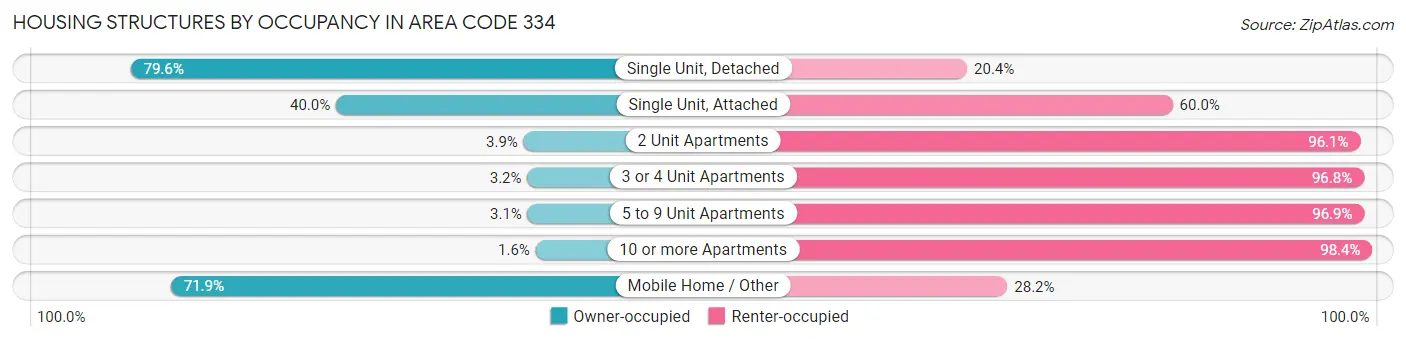
| Structure Type | Owner-occupied | Renter-occupied |
| Single Unit, Detached | 236,263 (79.6%) | 60,533 (20.4%) |
| Single Unit, Attached | 3,669 (40.0%) | 5,497 (60.0%) |
| 2 Unit Apartments | 426 (3.9%) | 10,507 (96.1%) |
| 3 or 4 Unit Apartments | 477 (3.2%) | 14,437 (96.8%) |
| 5 to 9 Unit Apartments | 594 (3.1%) | 18,312 (96.9%) |
| 10 or more Apartments | 364 (1.6%) | 22,361 (98.4%) |
| Mobile Home / Other | 44,161 (71.9%) | 17,300 (28.1%) |
| Total | 285,954 (65.7%) | 148,947 (34.3%) |
Housing Structures by Number of Rooms in Area Code 334
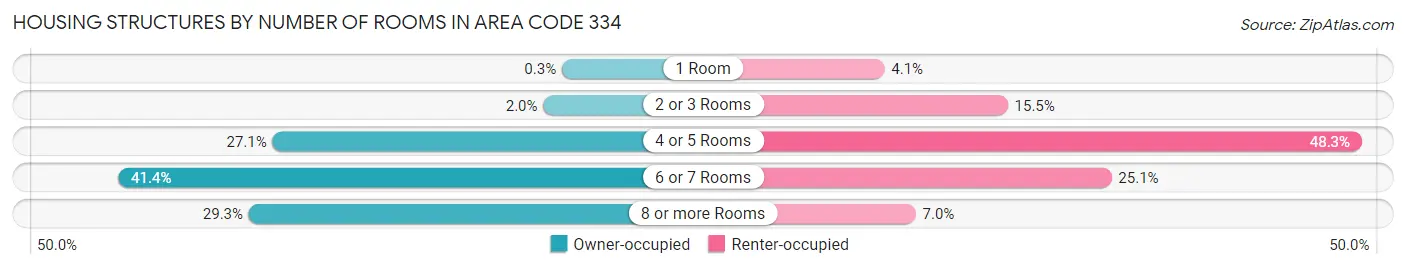
| Number of Rooms | Owner-occupied | Renter-occupied |
| 1 Room | 858 (0.3%) | 6,116 (4.1%) |
| 2 or 3 Rooms | 5,790 (2.0%) | 23,108 (15.5%) |
| 4 or 5 Rooms | 77,406 (27.1%) | 71,899 (48.3%) |
| 6 or 7 Rooms | 118,244 (41.3%) | 37,399 (25.1%) |
| 8 or more Rooms | 83,656 (29.3%) | 10,425 (7.0%) |
| Total | 285,954 (100.0%) | 148,947 (100.0%) |
Housing Structure by Heating Type in Area Code 334
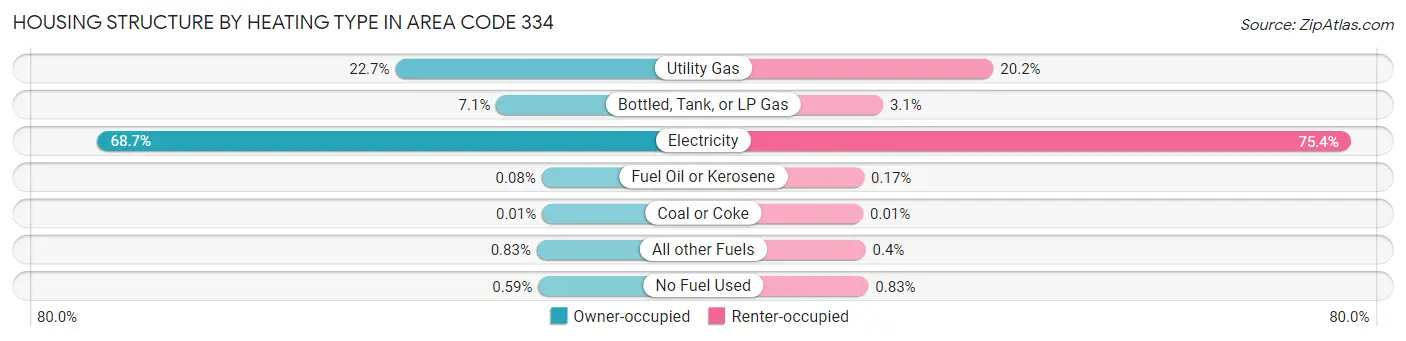
| Heating Type | Owner-occupied | Renter-occupied |
| Utility Gas | 64,878 (22.7%) | 30,007 (20.2%) |
| Bottled, Tank, or LP Gas | 20,268 (7.1%) | 4,591 (3.1%) |
| Electricity | 196,493 (68.7%) | 112,262 (75.4%) |
| Fuel Oil or Kerosene | 231 (0.1%) | 255 (0.2%) |
| Coal or Coke | 18 (0.0%) | 10 (0.0%) |
| All other Fuels | 2,386 (0.8%) | 593 (0.4%) |
| No Fuel Used | 1,680 (0.6%) | 1,229 (0.8%) |
| Total | 285,954 (100.0%) | 148,947 (100.0%) |
Household Vehicle Usage in Area Code 334
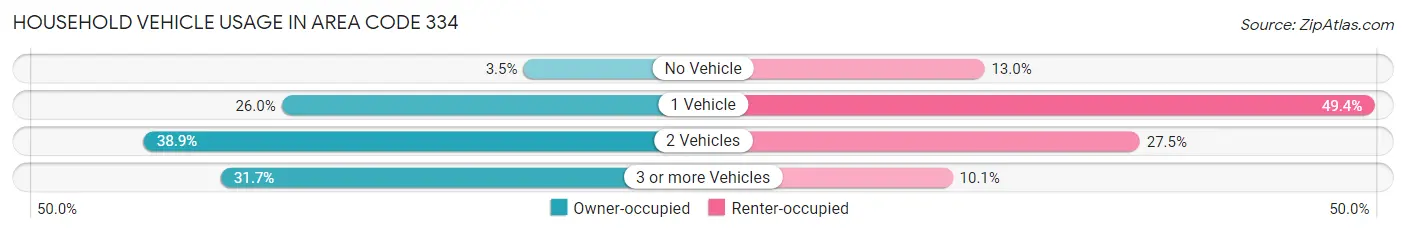
| Vehicles per Household | Owner-occupied | Renter-occupied |
| No Vehicle | 9,868 (3.5%) | 19,403 (13.0%) |
| 1 Vehicle | 74,401 (26.0%) | 73,570 (49.4%) |
| 2 Vehicles | 111,124 (38.9%) | 41,004 (27.5%) |
| 3 or more Vehicles | 90,561 (31.7%) | 14,970 (10.1%) |
| Total | 285,954 (100.0%) | 148,947 (100.0%) |
Real Estate & Mortgages in Area Code 334
Real Estate and Mortgage Overview in Area Code 334
| Characteristic | Without Mortgage | With Mortgage |
| Housing Units | 132,297 | 153,657 |
| Median Property Value | $15,519,899 | $22,581,799 |
| Median Household Income | $6,434,206 | $28,424 |
| Monthly Housing Costs | $59,362 | $5,206 |
| Real Estate Taxes | $53,426 | $18,703 |
Property Value by Mortgage Status in Area Code 334
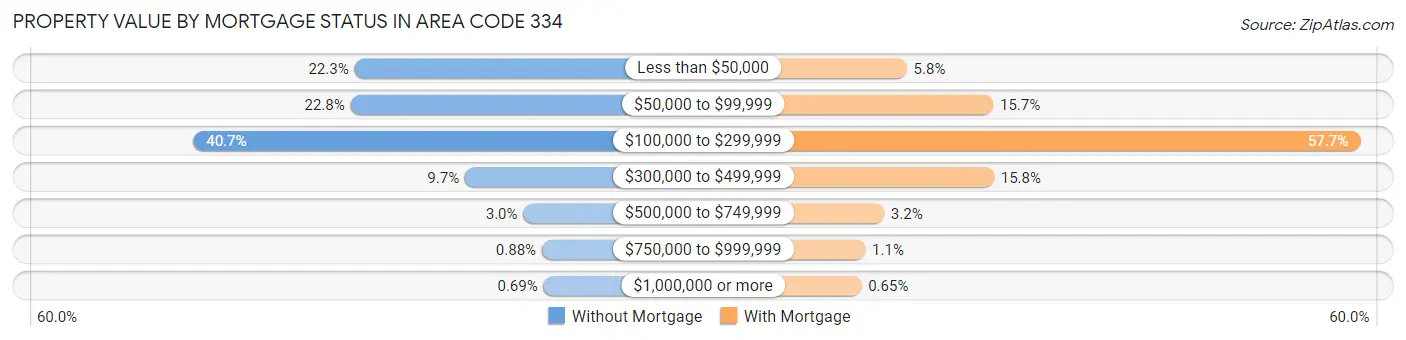
| Property Value | Without Mortgage | With Mortgage |
| Less than $50,000 | 29,499 (22.3%) | 8,969 (5.8%) |
| $50,000 to $99,999 | 30,103 (22.8%) | 24,139 (15.7%) |
| $100,000 to $299,999 | 53,865 (40.7%) | 88,603 (57.7%) |
| $300,000 to $499,999 | 12,795 (9.7%) | 24,272 (15.8%) |
| $500,000 to $749,999 | 3,964 (3.0%) | 4,978 (3.2%) |
| $750,000 to $999,999 | 1,160 (0.9%) | 1,692 (1.1%) |
| $1,000,000 or more | 911 (0.7%) | 1,004 (0.6%) |
| Total | 132,297 (100.0%) | 153,657 (100.0%) |
Household Income by Mortgage Status in Area Code 334
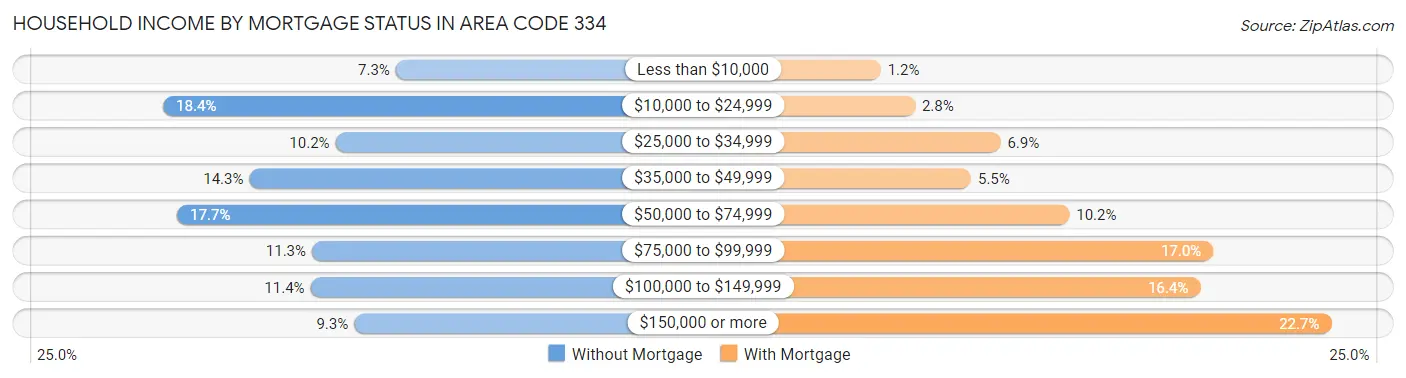
| Household Income | Without Mortgage | With Mortgage |
| Less than $10,000 | 9,696 (7.3%) | 1,850 (1.2%) |
| $10,000 to $24,999 | 24,341 (18.4%) | 4,341 (2.8%) |
| $25,000 to $34,999 | 13,495 (10.2%) | 10,595 (6.9%) |
| $35,000 to $49,999 | 18,921 (14.3%) | 8,453 (5.5%) |
| $50,000 to $74,999 | 23,468 (17.7%) | 15,644 (10.2%) |
| $75,000 to $99,999 | 14,982 (11.3%) | 26,175 (17.0%) |
| $100,000 to $149,999 | 15,073 (11.4%) | 25,215 (16.4%) |
| $150,000 or more | 12,321 (9.3%) | 34,810 (22.7%) |
| Total | 132,297 (100.0%) | 153,657 (100.0%) |
Property Value to Household Income Ratio in Area Code 334
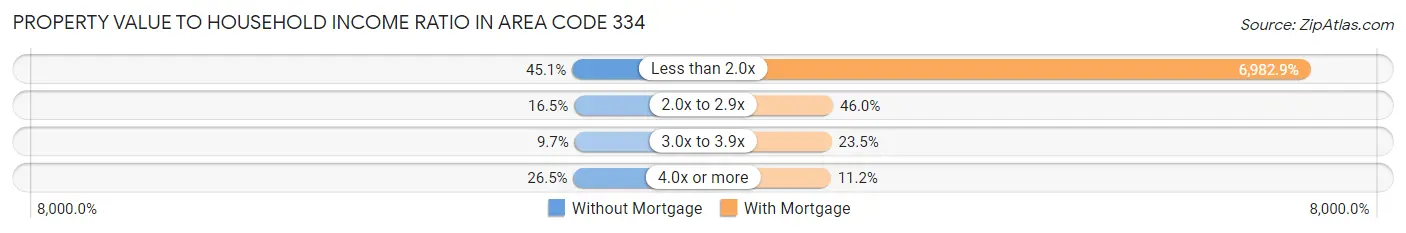
| Value-to-Income Ratio | Without Mortgage | With Mortgage |
| Less than 2.0x | 59,671 (45.1%) | 10,729,756 (6,982.9%) |
| 2.0x to 2.9x | 21,830 (16.5%) | 70,675 (46.0%) |
| 3.0x to 3.9x | 12,881 (9.7%) | 36,084 (23.5%) |
| 4.0x or more | 35,000 (26.5%) | 17,239 (11.2%) |
| Total | 132,297 (100.0%) | 153,657 (100.0%) |
Real Estate Taxes by Mortgage Status in Area Code 334
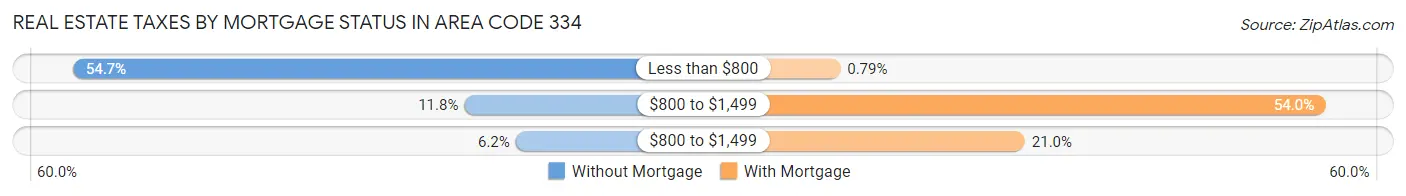
| Property Taxes | Without Mortgage | With Mortgage |
| Less than $800 | 72,381 (54.7%) | 1,214 (0.8%) |
| $800 to $1,499 | 15,642 (11.8%) | 83,007 (54.0%) |
| $800 to $1,499 | 8,194 (6.2%) | 32,298 (21.0%) |
| Total | 132,297 (100.0%) | 153,657 (100.0%) |
Health & Disability in Area Code 334
Health Insurance Coverage by Age in Area Code 334
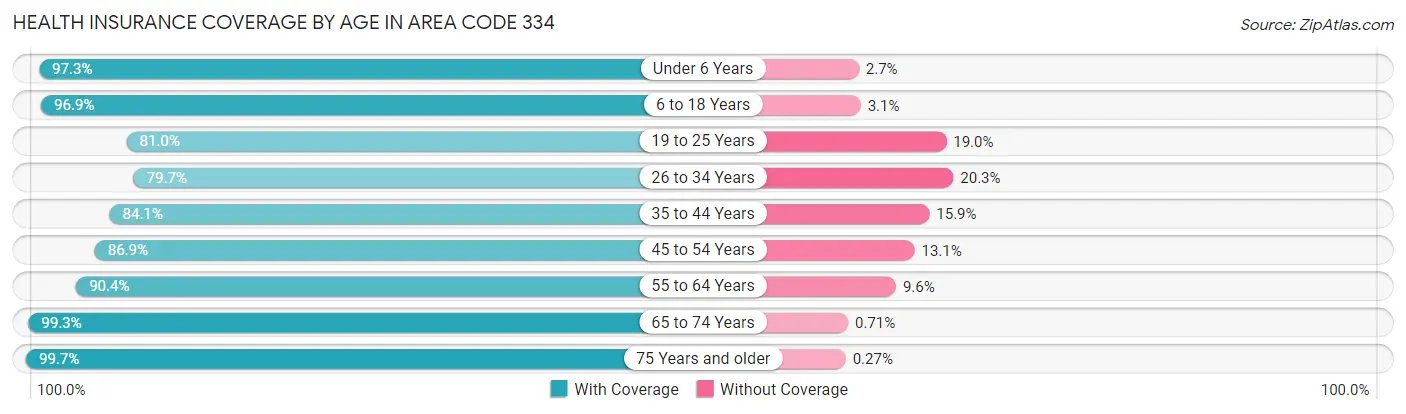
| Age Bracket | With Coverage | Without Coverage |
| Under 6 Years | 78,067 (97.3%) | 2,177 (2.7%) |
| 6 to 18 Years | 184,213 (96.9%) | 5,834 (3.1%) |
| 19 to 25 Years | 94,064 (81.0%) | 22,093 (19.0%) |
| 26 to 34 Years | 100,492 (79.7%) | 25,652 (20.3%) |
| 35 to 44 Years | 110,220 (84.1%) | 20,779 (15.9%) |
| 45 to 54 Years | 117,147 (86.9%) | 17,656 (13.1%) |
| 55 to 64 Years | 129,411 (90.4%) | 13,806 (9.6%) |
| 65 to 74 Years | 111,887 (99.3%) | 802 (0.7%) |
| 75 Years and older | 73,239 (99.7%) | 198 (0.3%) |
| Total | 998,740 (90.2%) | 108,997 (9.8%) |
Health Insurance Coverage by Citizenship Status in Area Code 334
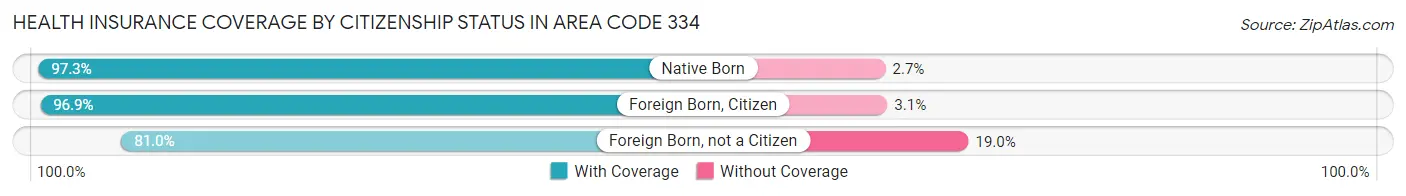
| Citizenship Status | With Coverage | Without Coverage |
| Native Born | 78,067 (97.3%) | 2,177 (2.7%) |
| Foreign Born, Citizen | 184,213 (96.9%) | 5,834 (3.1%) |
| Foreign Born, not a Citizen | 94,064 (81.0%) | 22,093 (19.0%) |
Health Insurance Coverage by Household Income in Area Code 334
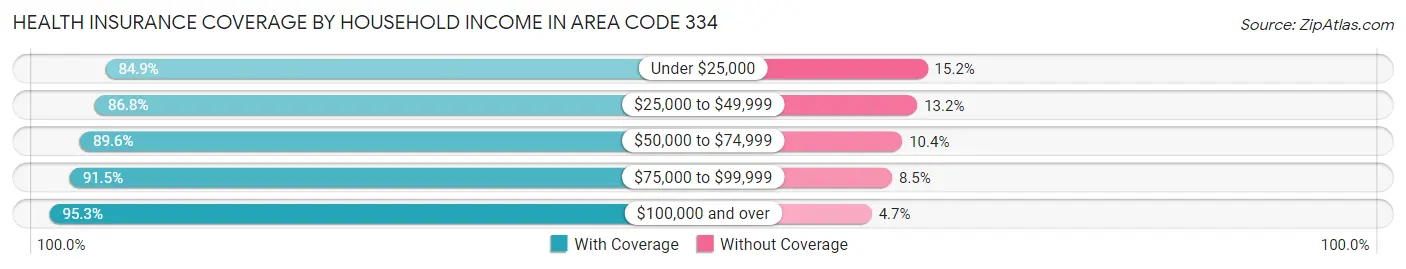
| Household Income | With Coverage | Without Coverage |
| Under $25,000 | 174,284 (84.9%) | 31,111 (15.1%) |
| $25,000 to $49,999 | 193,274 (86.8%) | 29,403 (13.2%) |
| $50,000 to $74,999 | 164,109 (89.6%) | 19,030 (10.4%) |
| $75,000 to $99,999 | 135,046 (91.5%) | 12,518 (8.5%) |
| $100,000 and over | 315,834 (95.3%) | 15,458 (4.7%) |
Public vs Private Health Insurance Coverage by Age in Area Code 334
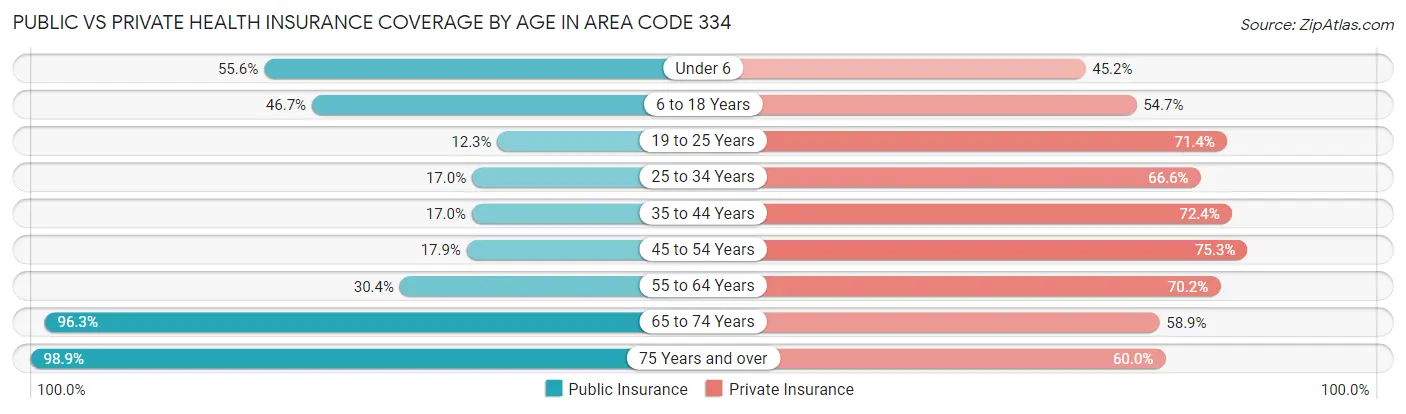
| Age Bracket | Public Insurance | Private Insurance |
| Under 6 | 44,591 (55.6%) | 36,272 (45.2%) |
| 6 to 18 Years | 88,691 (46.7%) | 103,858 (54.6%) |
| 19 to 25 Years | 14,230 (12.2%) | 82,976 (71.4%) |
| 25 to 34 Years | 21,399 (17.0%) | 83,961 (66.6%) |
| 35 to 44 Years | 22,255 (17.0%) | 94,781 (72.4%) |
| 45 to 54 Years | 24,187 (17.9%) | 101,444 (75.2%) |
| 55 to 64 Years | 43,487 (30.4%) | 100,523 (70.2%) |
| 65 to 74 Years | 108,511 (96.3%) | 66,416 (58.9%) |
| 75 Years and over | 72,606 (98.9%) | 44,067 (60.0%) |
| Total | 439,957 (39.7%) | 714,298 (64.5%) |
Disability Status by Sex by Age in Area Code 334
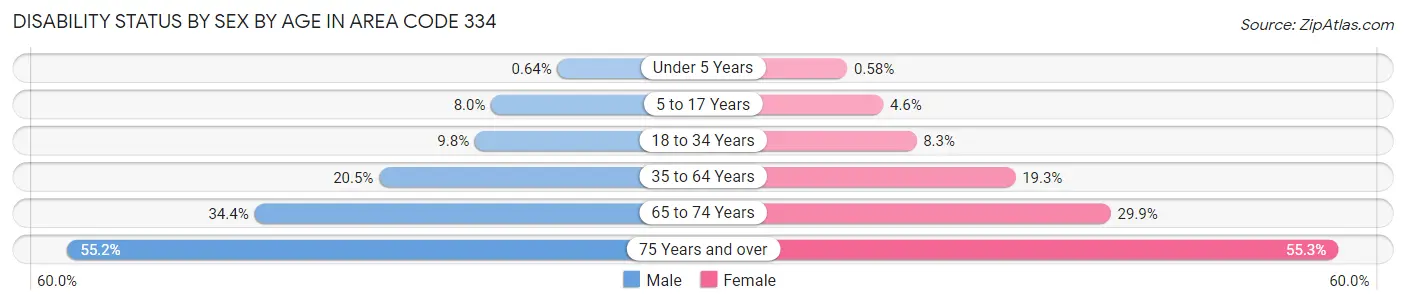
| Age Bracket | Male | Female |
| Under 5 Years | 217 (0.6%) | 191 (0.6%) |
| 5 to 17 Years | 7,564 (8.0%) | 4,171 (4.6%) |
| 18 to 34 Years | 12,435 (9.8%) | 11,106 (8.3%) |
| 35 to 64 Years | 39,096 (20.5%) | 42,180 (19.3%) |
| 65 to 74 Years | 17,736 (34.4%) | 18,301 (29.9%) |
| 75 Years and over | 16,073 (55.2%) | 24,509 (55.3%) |
Disability Class by Sex by Age in Area Code 334
Disability Class: Hearing Difficulty
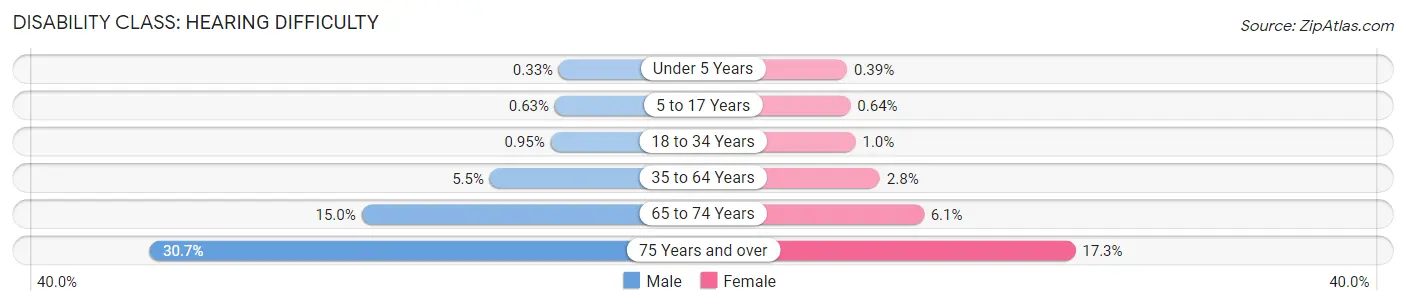
| Age Bracket | Male | Female |
| Under 5 Years | 114 (0.3%) | 130 (0.4%) |
| 5 to 17 Years | 590 (0.6%) | 580 (0.6%) |
| 18 to 34 Years | 1,203 (0.9%) | 1,362 (1.0%) |
| 35 to 64 Years | 10,405 (5.5%) | 6,178 (2.8%) |
| 65 to 74 Years | 7,723 (15.0%) | 3,720 (6.1%) |
| 75 Years and over | 8,927 (30.7%) | 7,690 (17.3%) |
Disability Class: Vision Difficulty
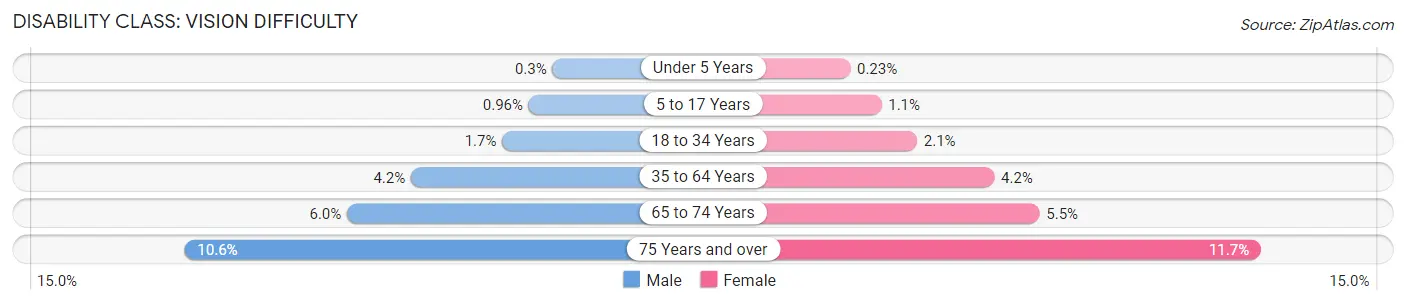
| Age Bracket | Male | Female |
| Under 5 Years | 103 (0.3%) | 77 (0.2%) |
| 5 to 17 Years | 902 (1.0%) | 994 (1.1%) |
| 18 to 34 Years | 2,145 (1.7%) | 2,795 (2.1%) |
| 35 to 64 Years | 8,086 (4.2%) | 9,262 (4.2%) |
| 65 to 74 Years | 3,101 (6.0%) | 3,360 (5.5%) |
| 75 Years and over | 3,069 (10.5%) | 5,175 (11.7%) |
Disability Class: Cognitive Difficulty
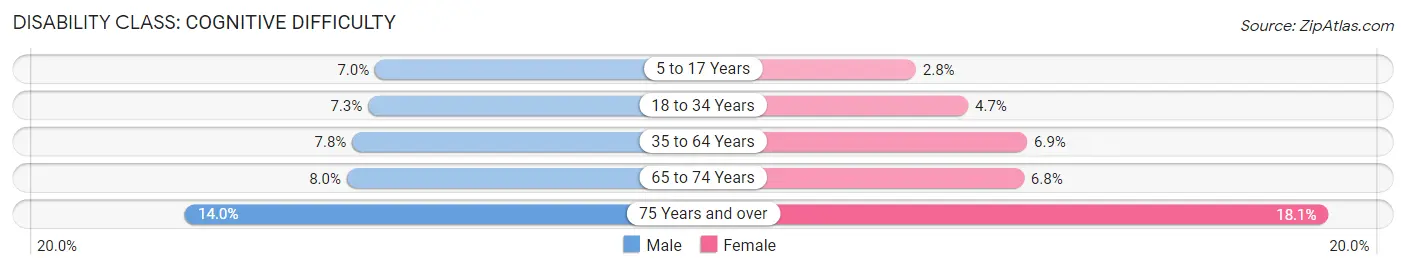
| Age Bracket | Male | Female |
| 5 to 17 Years | 6,587 (7.0%) | 2,495 (2.8%) |
| 18 to 34 Years | 9,167 (7.2%) | 6,279 (4.7%) |
| 35 to 64 Years | 14,944 (7.8%) | 15,032 (6.9%) |
| 65 to 74 Years | 4,143 (8.0%) | 4,132 (6.8%) |
| 75 Years and over | 4,085 (14.0%) | 8,007 (18.1%) |
Disability Class: Ambulatory Difficulty
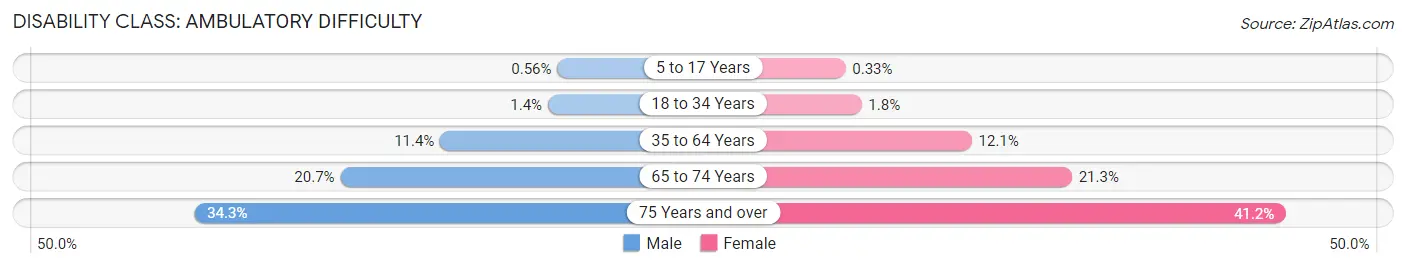
| Age Bracket | Male | Female |
| 5 to 17 Years | 526 (0.6%) | 301 (0.3%) |
| 18 to 34 Years | 1,810 (1.4%) | 2,437 (1.8%) |
| 35 to 64 Years | 21,778 (11.4%) | 26,312 (12.0%) |
| 65 to 74 Years | 10,667 (20.7%) | 13,045 (21.3%) |
| 75 Years and over | 9,972 (34.3%) | 18,285 (41.2%) |
Disability Class: Self-Care Difficulty
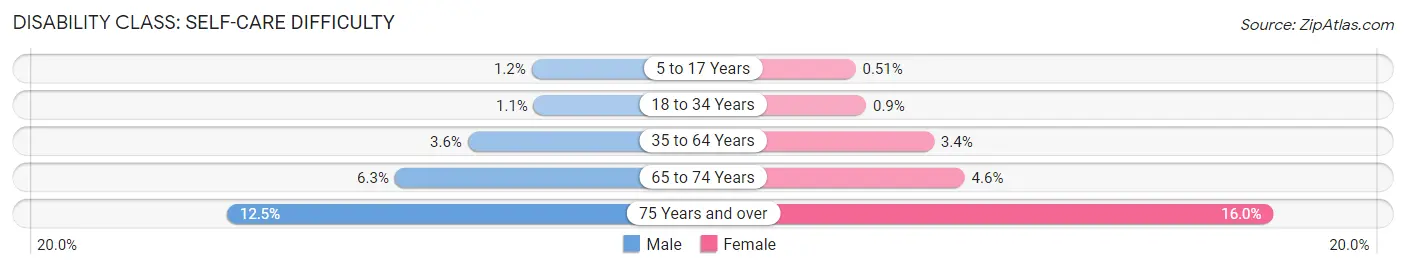
| Age Bracket | Male | Female |
| 5 to 17 Years | 1,114 (1.2%) | 464 (0.5%) |
| 18 to 34 Years | 1,390 (1.1%) | 1,209 (0.9%) |
| 35 to 64 Years | 6,763 (3.5%) | 7,462 (3.4%) |
| 65 to 74 Years | 3,228 (6.3%) | 2,785 (4.6%) |
| 75 Years and over | 3,633 (12.5%) | 7,104 (16.0%) |
Technology Access in Area Code 334
Computing Device Access in Area Code 334
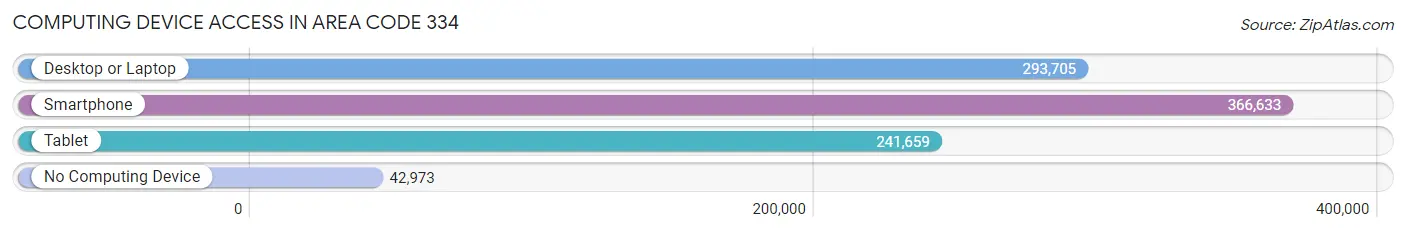
| Device Type | # Households | % Households |
| Desktop or Laptop | 293,705 | 67.5% |
| Smartphone | 366,633 | 84.3% |
| Tablet | 241,659 | 55.6% |
| No Computing Device | 42,973 | 9.9% |
| Total | 434,901 | 100.0% |
Internet Access in Area Code 334
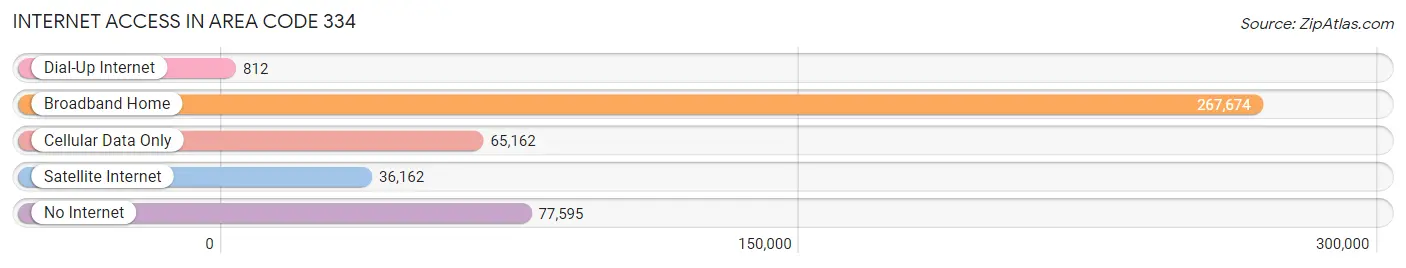
| Internet Type | # Households | % Households |
| Dial-Up Internet | 812 | 0.2% |
| Broadband Home | 267,674 | 61.6% |
| Cellular Data Only | 65,162 | 15.0% |
| Satellite Internet | 36,162 | 8.3% |
| No Internet | 77,595 | 17.8% |
| Total | 434,901 | 100.0% |
Area Code 334 Summary
Geography
Area code 334 is located in the southeastern region of the United States. It covers the entire state of Alabama, as well as parts of Georgia and Florida.
Social
Area code 334 is home to a diverse population of people from all walks of life. The area is known for its friendly and welcoming atmosphere, and its residents are proud of their Southern heritage.
Economics
Area code 334 is home to a thriving economy. The area is home to a number of major corporations, including Hyundai, Honda, and Mercedes-Benz. The area also has a strong agricultural sector, with cotton, peanuts, and soybeans being the main crops.
Demographics
Area code 334 is home to a population of over 4 million people. The area is predominantly white, with African Americans making up the largest minority group. The median household income is around $45,000, and the unemployment rate is around 4%.
Common Questions
What is Per Capita Income in Area Code 334?
Per Capita income in Area Code 334 is $27,513.
What is the Median Family Income in Area Code 334?
Median Family Income in Area Code 334 is $67,119.
What is the Median Household income in Area Code 334?
Median Household Income in Area Code 334 is $51,824.
What is Income or Wage Gap in Area Code 334?
Income or Wage Gap in Area Code 334 is 31.4%.
Women in Area Code 334 earn 68.6 cents for every dollar earned by a man.
What is Family Income Deficit in Area Code 334?
Family Income Deficit in Area Code 334 is $10,732.
Families that are below poverty line in Area Code 334 earn $10,732 less on average than the poverty threshold level.
What is Inequality or Gini Index in Area Code 334?
Inequality or Gini Index in Area Code 334 is 70.46.
What is the Total Population of Area Code 334?
Total Population of Area Code 334 is 1,136,475.
What is the Total Male Population of Area Code 334?
Total Male Population of Area Code 334 is 548,511.
What is the Total Female Population of Area Code 334?
Total Female Population of Area Code 334 is 587,964.
What is the Ratio of Males per 100 Females in Area Code 334?
There are 93.29 Males per 100 Females in Area Code 334.
What is the Ratio of Females per 100 Males in Area Code 334?
There are 107.19 Females per 100 Males in Area Code 334.
What is the Median Population Age in Area Code 334?
Median Population Age in Area Code 334 is 41.7 Years.
What is the Average Family Size in Area Code 334
Average Family Size in Area Code 334 is 3.4 People.
What is the Average Household Size in Area Code 334
Average Household Size in Area Code 334 is 2.6 People.
How Large is the Labor Force in Area Code 334?
There are 468,556 People in the Labor Forcein in Area Code 334.
What is the Percentage of People in the Labor Force in Area Code 334?
51.3% of People are in the Labor Force in Area Code 334.
What is the Unemployment Rate in Area Code 334?
Unemployment Rate in Area Code 334 is 7.6%.