Walker County, AL Map & Demographics
Walker County Overview
$28,204
PER CAPITA INCOME
$68,810
AVG FAMILY INCOME
$52,987
AVG HOUSEHOLD INCOME
35.5%
WAGE / INCOME GAP [ % ]
64.5¢/ $1
WAGE / INCOME GAP [ $ ]
$10,826
FAMILY INCOME DEFICIT
0.45
INEQUALITY / GINI INDEX
64,978
TOTAL POPULATION
32,122
MALE POPULATION
32,856
FEMALE POPULATION
97.77
MALES / 100 FEMALES
102.29
FEMALES / 100 MALES
41.8
MEDIAN AGE
3.1
AVG FAMILY SIZE
2.6
AVG HOUSEHOLD SIZE
27,375
LABOR FORCE [ PEOPLE ]
52.4%
PERCENT IN LABOR FORCE
5.7%
UNEMPLOYMENT RATE
Walker County Area Codes
Income in Walker County
Income Overview in Walker County
Per Capita Income in Walker County is $28,204, while median incomes of families and households are $68,810 and $52,987 respectively.
| Characteristic | Number | Measure |
| Per Capita Income | 64,978 | $28,204 |
| Median Family Income | 16,669 | $68,810 |
| Mean Family Income | 16,669 | $81,733 |
| Median Household Income | 24,718 | $52,987 |
| Mean Household Income | 24,718 | $68,336 |
| Income Deficit | 16,669 | $10,826 |
| Wage / Income Gap (%) | 64,978 | 35.51% |
| Wage / Income Gap ($) | 64,978 | 64.49¢ per $1 |
| Gini / Inequality Index | 64,978 | 0.45 |
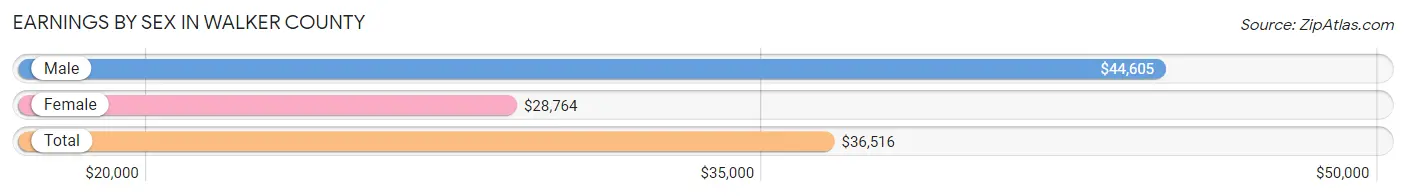
Earnings by Sex in Walker County
Average Earnings in Walker County are $36,516, $44,605 for men and $28,764 for women, a difference of 35.5%.
| Sex | Number | Average Earnings |
| Male | 15,146 (53.9%) | $44,605 |
| Female | 12,975 (46.1%) | $28,764 |
| Total | 28,121 (100.0%) | $36,516 |
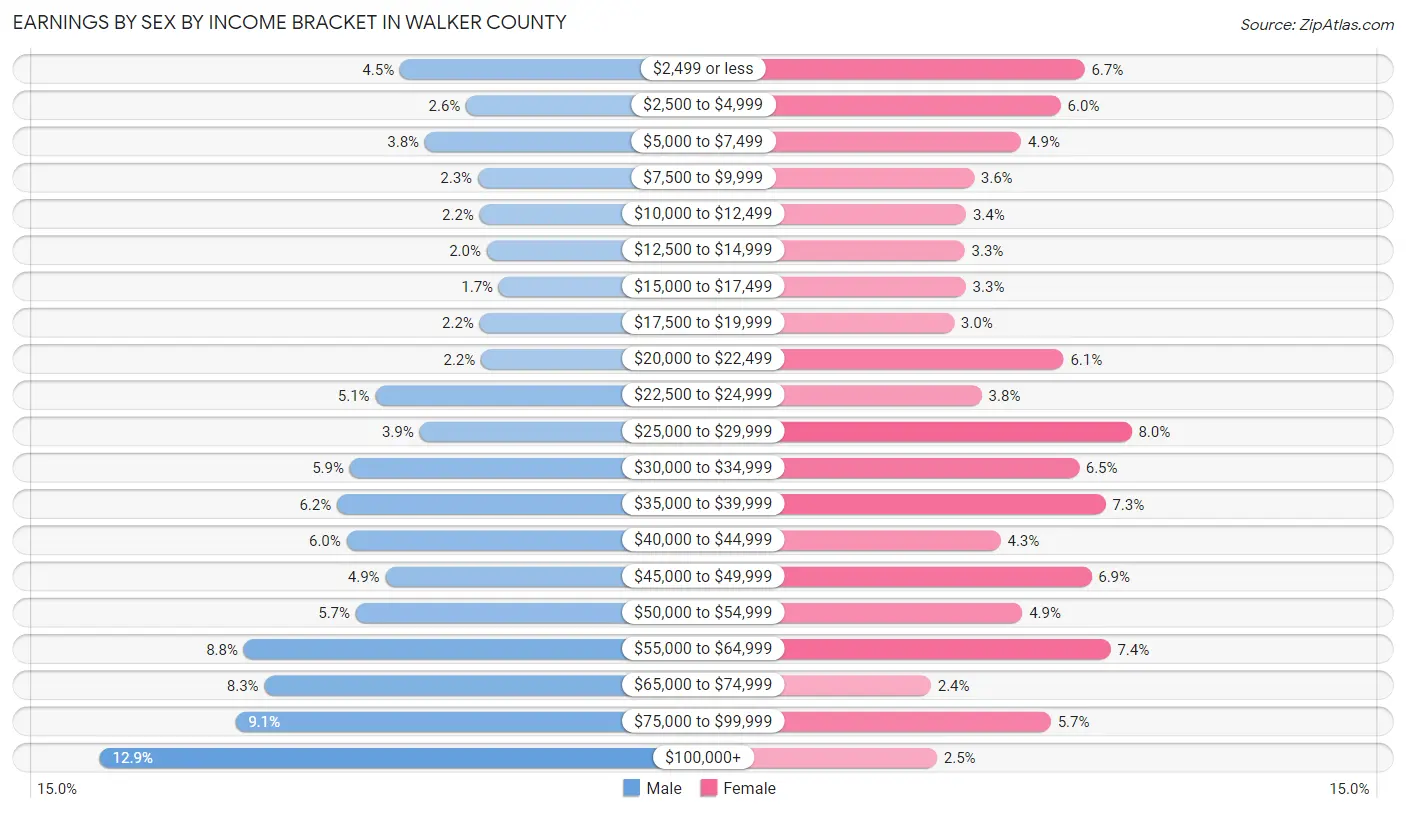
Earnings by Sex by Income Bracket in Walker County
The most common earnings brackets in Walker County are $100,000+ for men (1,953 | 12.9%) and $25,000 to $29,999 for women (1,038 | 8.0%).
| Income | Male | Female |
| $2,499 or less | 674 (4.4%) | 867 (6.7%) |
| $2,500 to $4,999 | 392 (2.6%) | 780 (6.0%) |
| $5,000 to $7,499 | 568 (3.7%) | 636 (4.9%) |
| $7,500 to $9,999 | 342 (2.3%) | 463 (3.6%) |
| $10,000 to $12,499 | 334 (2.2%) | 435 (3.4%) |
| $12,500 to $14,999 | 305 (2.0%) | 430 (3.3%) |
| $15,000 to $17,499 | 253 (1.7%) | 433 (3.3%) |
| $17,500 to $19,999 | 335 (2.2%) | 391 (3.0%) |
| $20,000 to $22,499 | 328 (2.2%) | 790 (6.1%) |
| $22,500 to $24,999 | 778 (5.1%) | 492 (3.8%) |
| $25,000 to $29,999 | 590 (3.9%) | 1,038 (8.0%) |
| $30,000 to $34,999 | 888 (5.9%) | 846 (6.5%) |
| $35,000 to $39,999 | 942 (6.2%) | 943 (7.3%) |
| $40,000 to $44,999 | 901 (5.9%) | 560 (4.3%) |
| $45,000 to $49,999 | 736 (4.9%) | 892 (6.9%) |
| $50,000 to $54,999 | 862 (5.7%) | 640 (4.9%) |
| $55,000 to $64,999 | 1,339 (8.8%) | 961 (7.4%) |
| $65,000 to $74,999 | 1,251 (8.3%) | 306 (2.4%) |
| $75,000 to $99,999 | 1,375 (9.1%) | 744 (5.7%) |
| $100,000+ | 1,953 (12.9%) | 328 (2.5%) |
| Total | 15,146 (100.0%) | 12,975 (100.0%) |
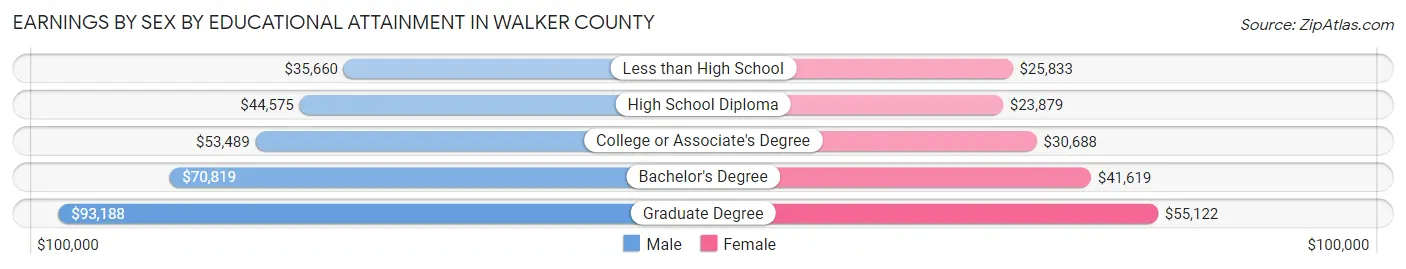
Earnings by Sex by Educational Attainment in Walker County
Average earnings in Walker County are $52,838 for men and $32,440 for women, a difference of 38.6%. Men with an educational attainment of graduate degree enjoy the highest average annual earnings of $93,188, while those with less than high school education earn the least with $35,660. Women with an educational attainment of graduate degree earn the most with the average annual earnings of $55,122, while those with high school diploma education have the smallest earnings of $23,879.
| Educational Attainment | Male Income | Female Income |
| Less than High School | $35,660 | $25,833 |
| High School Diploma | $44,575 | $23,879 |
| College or Associate's Degree | $53,489 | $30,688 |
| Bachelor's Degree | $70,819 | $41,619 |
| Graduate Degree | $93,188 | $55,122 |
| Total | $52,838 | $32,440 |
Family Income in Walker County
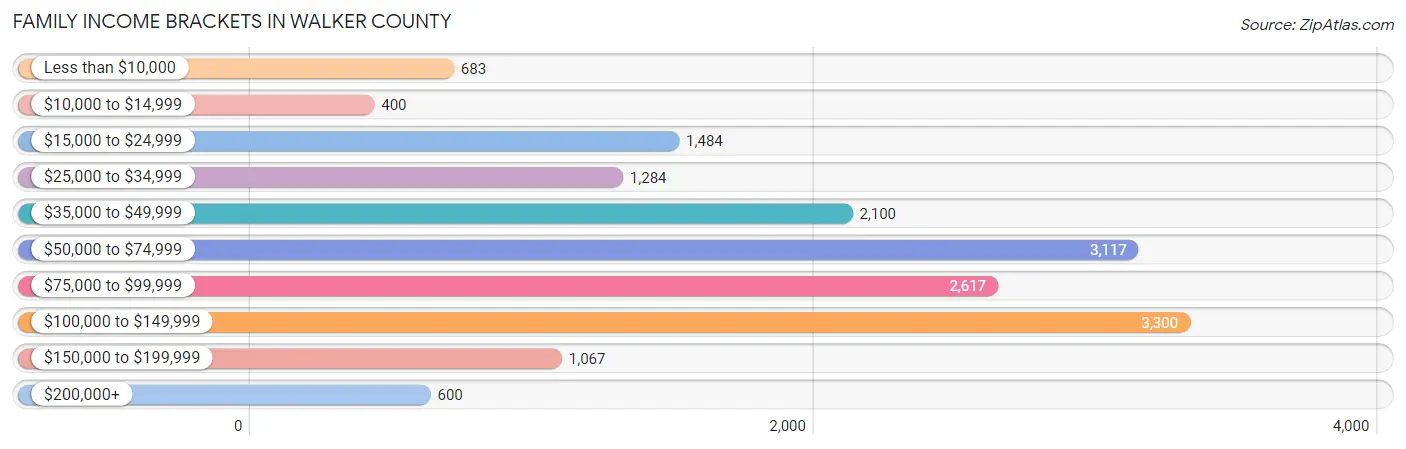
Family Income Brackets in Walker County
According to the Walker County family income data, there are 3,300 families falling into the $100,000 to $149,999 income range, which is the most common income bracket and makes up 19.8% of all families. Conversely, the $10,000 to $14,999 income bracket is the least frequent group with only 400 families (2.4%) belonging to this category.
| Income Bracket | # Families | % Families |
| Less than $10,000 | 683 | 4.1% |
| $10,000 to $14,999 | 400 | 2.4% |
| $15,000 to $24,999 | 1,484 | 8.9% |
| $25,000 to $34,999 | 1,284 | 7.7% |
| $35,000 to $49,999 | 2,100 | 12.6% |
| $50,000 to $74,999 | 3,117 | 18.7% |
| $75,000 to $99,999 | 2,617 | 15.7% |
| $100,000 to $149,999 | 3,300 | 19.8% |
| $150,000 to $199,999 | 1,067 | 6.4% |
| $200,000+ | 600 | 3.6% |
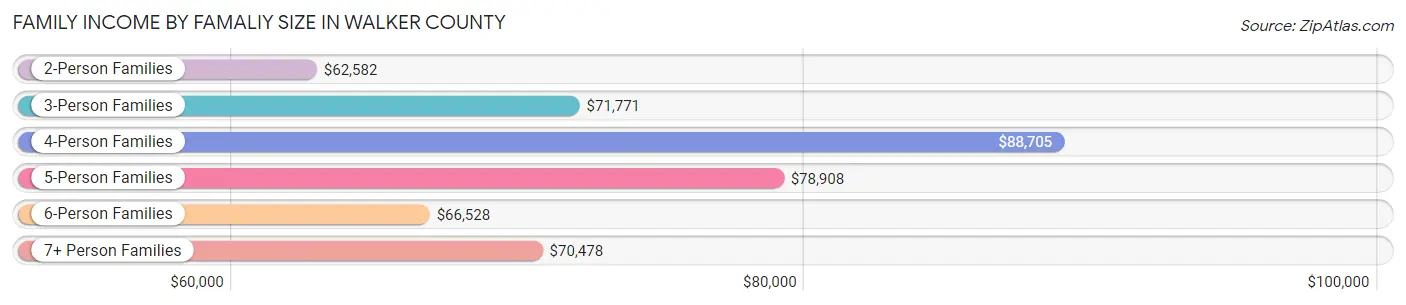
Family Income by Famaliy Size in Walker County
4-person families (2,501 | 15.0%) account for the highest median family income in Walker County with $88,705 per family, while 2-person families (8,881 | 53.3%) have the highest median income of $31,291 per family member.
| Income Bracket | # Families | Median Income |
| 2-Person Families | 8,881 (53.3%) | $62,582 |
| 3-Person Families | 3,747 (22.5%) | $71,771 |
| 4-Person Families | 2,501 (15.0%) | $88,705 |
| 5-Person Families | 1,050 (6.3%) | $78,908 |
| 6-Person Families | 329 (2.0%) | $66,528 |
| 7+ Person Families | 161 (1.0%) | $70,478 |
| Total | 16,669 (100.0%) | $68,810 |
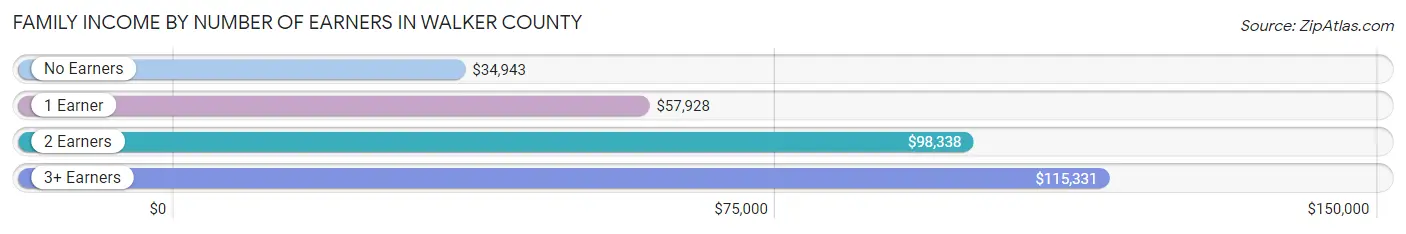
Family Income by Number of Earners in Walker County
The median family income in Walker County is $68,810, with families comprising 3+ earners (1,482) having the highest median family income of $115,331, while families with no earners (3,851) have the lowest median family income of $34,943, accounting for 8.9% and 23.1% of families, respectively.
| Number of Earners | # Families | Median Income |
| No Earners | 3,851 (23.1%) | $34,943 |
| 1 Earner | 5,741 (34.4%) | $57,928 |
| 2 Earners | 5,595 (33.6%) | $98,338 |
| 3+ Earners | 1,482 (8.9%) | $115,331 |
| Total | 16,669 (100.0%) | $68,810 |
Household Income in Walker County
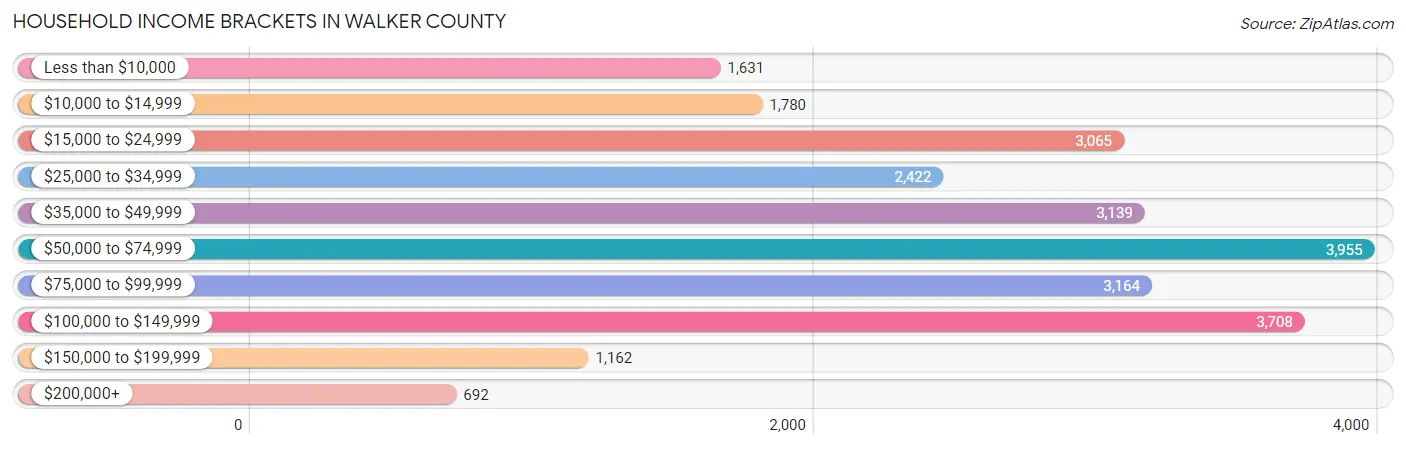
Household Income Brackets in Walker County
With 3,955 households falling in the category, the $50,000 to $74,999 income range is the most frequent in Walker County, accounting for 16.0% of all households. In contrast, only 692 households (2.8%) fall into the $200,000+ income bracket, making it the least populous group.
| Income Bracket | # Households | % Households |
| Less than $10,000 | 1,631 | 6.6% |
| $10,000 to $14,999 | 1,780 | 7.2% |
| $15,000 to $24,999 | 3,065 | 12.4% |
| $25,000 to $34,999 | 2,422 | 9.8% |
| $35,000 to $49,999 | 3,139 | 12.7% |
| $50,000 to $74,999 | 3,955 | 16.0% |
| $75,000 to $99,999 | 3,164 | 12.8% |
| $100,000 to $149,999 | 3,708 | 15.0% |
| $150,000 to $199,999 | 1,162 | 4.7% |
| $200,000+ | 692 | 2.8% |
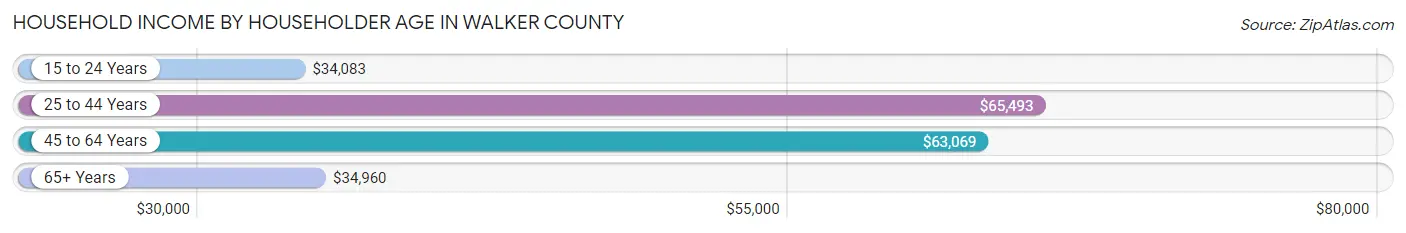
Household Income by Householder Age in Walker County
The median household income in Walker County is $52,987, with the highest median household income of $65,493 found in the 25 to 44 years age bracket for the primary householder. A total of 6,010 households (24.3%) fall into this category. Meanwhile, the 15 to 24 years age bracket for the primary householder has the lowest median household income of $34,083, with 809 households (3.3%) in this group.
| Income Bracket | # Households | Median Income |
| 15 to 24 Years | 809 (3.3%) | $34,083 |
| 25 to 44 Years | 6,010 (24.3%) | $65,493 |
| 45 to 64 Years | 9,687 (39.2%) | $63,069 |
| 65+ Years | 8,212 (33.2%) | $34,960 |
| Total | 24,718 (100.0%) | $52,987 |
Poverty in Walker County
Income Below Poverty by Sex and Age in Walker County
With 15.6% poverty level for males and 17.2% for females among the residents of Walker County, 5 year old males and under 5 year old females are the most vulnerable to poverty, with 183 males (36.5%) and 515 females (32.3%) in their respective age groups living below the poverty level.
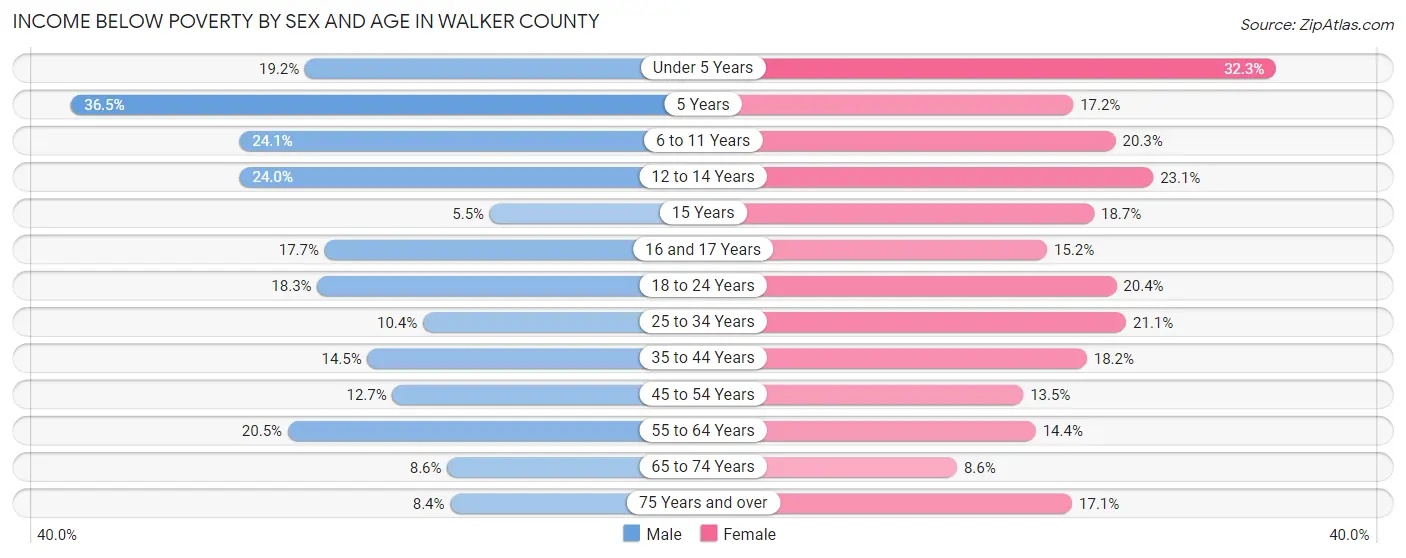
| Age Bracket | Male | Female |
| Under 5 Years | 354 (19.2%) | 515 (32.3%) |
| 5 Years | 183 (36.5%) | 73 (17.2%) |
| 6 to 11 Years | 584 (24.0%) | 424 (20.3%) |
| 12 to 14 Years | 295 (24.0%) | 279 (23.1%) |
| 15 Years | 26 (5.4%) | 71 (18.7%) |
| 16 and 17 Years | 147 (17.7%) | 126 (15.2%) |
| 18 to 24 Years | 509 (18.3%) | 493 (20.4%) |
| 25 to 34 Years | 396 (10.4%) | 829 (21.1%) |
| 35 to 44 Years | 512 (14.5%) | 667 (18.2%) |
| 45 to 54 Years | 506 (12.7%) | 555 (13.5%) |
| 55 to 64 Years | 899 (20.4%) | 672 (14.4%) |
| 65 to 74 Years | 293 (8.6%) | 341 (8.6%) |
| 75 Years and over | 174 (8.4%) | 514 (17.1%) |
| Total | 4,878 (15.6%) | 5,559 (17.2%) |
Income Above Poverty by Sex and Age in Walker County
According to the poverty statistics in Walker County, males aged 15 years and females aged 65 to 74 years are the age groups that are most secure financially, with 94.6% of males and 91.4% of females in these age groups living above the poverty line.
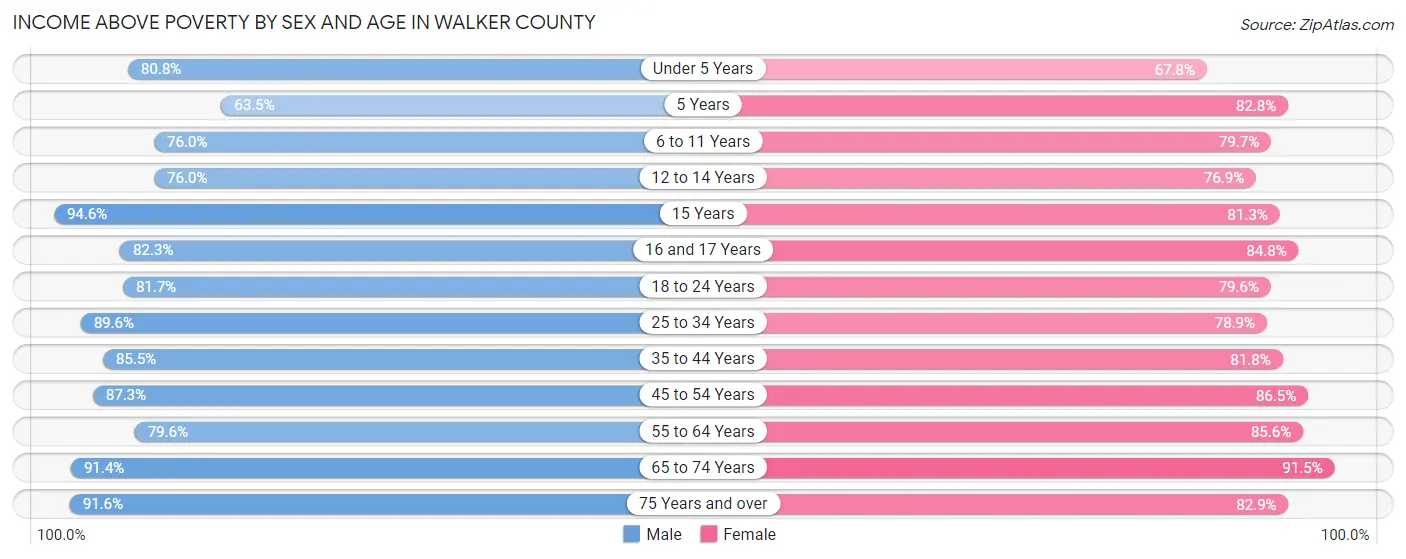
| Age Bracket | Male | Female |
| Under 5 Years | 1,492 (80.8%) | 1,082 (67.7%) |
| 5 Years | 318 (63.5%) | 352 (82.8%) |
| 6 to 11 Years | 1,844 (75.9%) | 1,662 (79.7%) |
| 12 to 14 Years | 932 (76.0%) | 928 (76.9%) |
| 15 Years | 451 (94.6%) | 308 (81.3%) |
| 16 and 17 Years | 683 (82.3%) | 701 (84.8%) |
| 18 to 24 Years | 2,279 (81.7%) | 1,925 (79.6%) |
| 25 to 34 Years | 3,405 (89.6%) | 3,098 (78.9%) |
| 35 to 44 Years | 3,010 (85.5%) | 2,999 (81.8%) |
| 45 to 54 Years | 3,485 (87.3%) | 3,565 (86.5%) |
| 55 to 64 Years | 3,497 (79.5%) | 3,994 (85.6%) |
| 65 to 74 Years | 3,110 (91.4%) | 3,645 (91.4%) |
| 75 Years and over | 1,901 (91.6%) | 2,492 (82.9%) |
| Total | 26,407 (84.4%) | 26,751 (82.8%) |
Income Below Poverty Among Married-Couple Families in Walker County
The poverty statistics for married-couple families in Walker County show that 5.6% or 684 of the total 12,209 families live below the poverty line. Families with 3 or 4 children have the highest poverty rate of 14.6%, comprising of 98 families. On the other hand, families with 1 or 2 children have the lowest poverty rate of 5.0%, which includes 169 families.
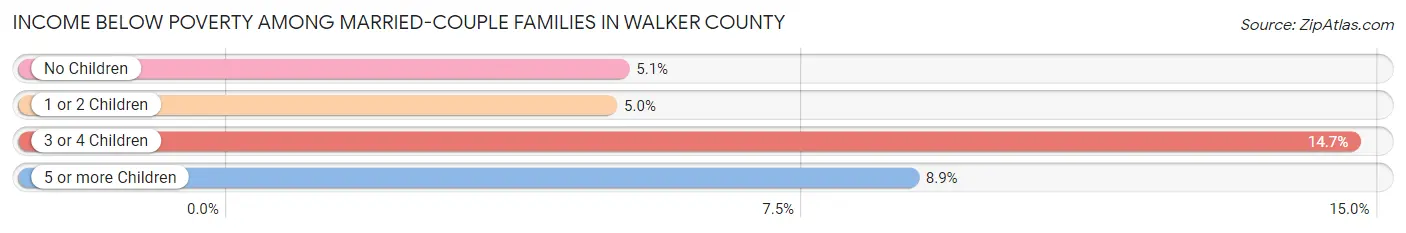
| Children | Above Poverty | Below Poverty |
| No Children | 7,665 (94.9%) | 413 (5.1%) |
| 1 or 2 Children | 3,248 (95.1%) | 169 (5.0%) |
| 3 or 4 Children | 571 (85.4%) | 98 (14.6%) |
| 5 or more Children | 41 (91.1%) | 4 (8.9%) |
| Total | 11,525 (94.4%) | 684 (5.6%) |
Income Below Poverty Among Single-Parent Households in Walker County
According to the poverty data in Walker County, 11.2% or 132 single-father households and 34.1% or 1,118 single-mother households are living below the poverty line. Among single-father households, those with 3 or 4 children have the highest poverty rate, with 19 households (86.4%) experiencing poverty. Likewise, among single-mother households, those with 5 or more children have the highest poverty rate, with 77 households (100.0%) falling below the poverty line.
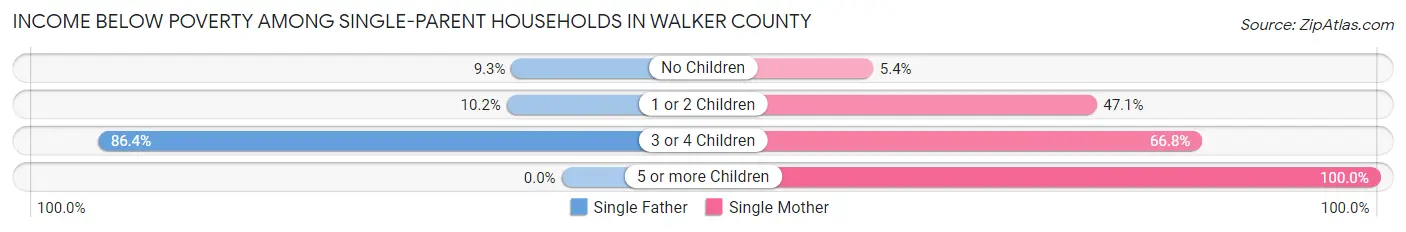
| Children | Single Father | Single Mother |
| No Children | 54 (9.3%) | 69 (5.4%) |
| 1 or 2 Children | 59 (10.2%) | 765 (47.0%) |
| 3 or 4 Children | 19 (86.4%) | 207 (66.8%) |
| 5 or more Children | 0 (0.0%) | 77 (100.0%) |
| Total | 132 (11.2%) | 1,118 (34.1%) |
Income Below Poverty Among Married-Couple vs Single-Parent Households in Walker County
The poverty data for Walker County shows that 684 of the married-couple family households (5.6%) and 1,250 of the single-parent households (28.0%) are living below the poverty level. Within the married-couple family households, those with 3 or 4 children have the highest poverty rate, with 98 households (14.6%) falling below the poverty line. Among the single-parent households, those with 5 or more children have the highest poverty rate, with 77 household (98.7%) living below poverty.
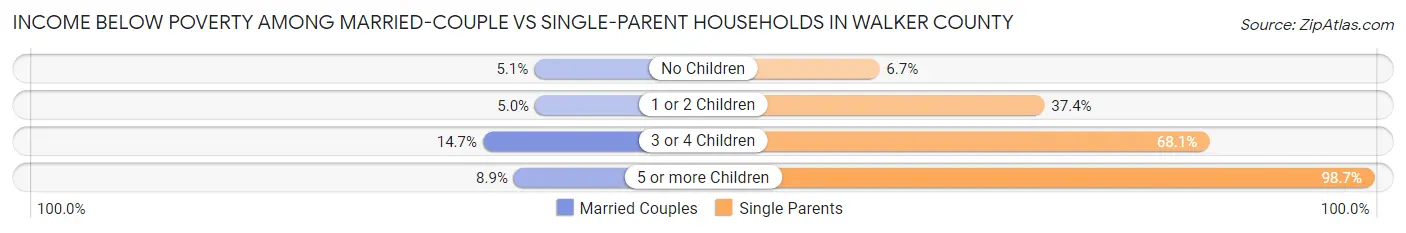
| Children | Married-Couple Families | Single-Parent Households |
| No Children | 413 (5.1%) | 123 (6.7%) |
| 1 or 2 Children | 169 (5.0%) | 824 (37.4%) |
| 3 or 4 Children | 98 (14.6%) | 226 (68.1%) |
| 5 or more Children | 4 (8.9%) | 77 (98.7%) |
| Total | 684 (5.6%) | 1,250 (28.0%) |
Race in Walker County
The most populous races in Walker County are White / Caucasian (57,555 | 88.6%), Black / African American (3,890 | 6.0%), and Two or more Races (2,184 | 3.4%).
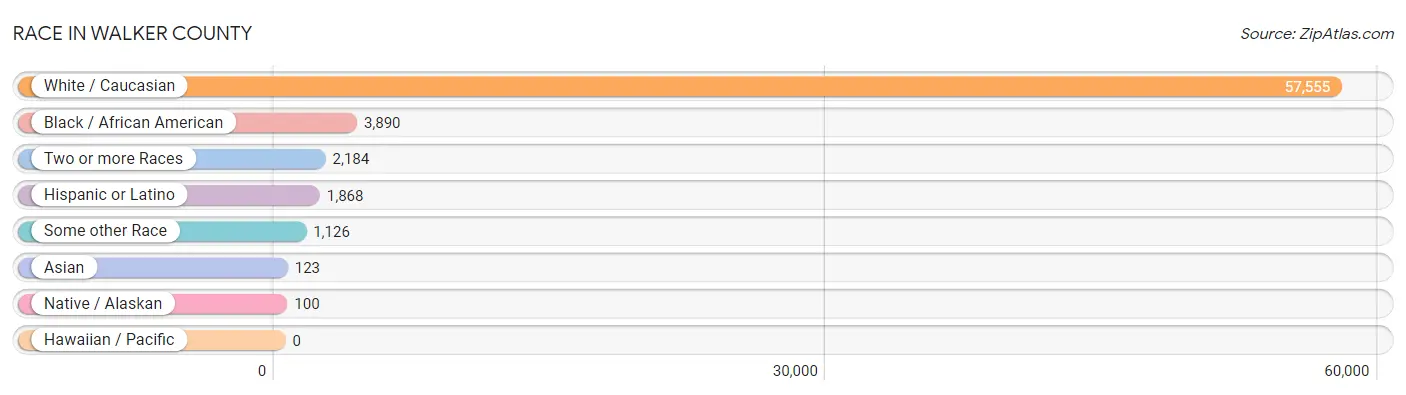
| Race | # Population | % Population |
| Asian | 123 | 0.2% |
| Black / African American | 3,890 | 6.0% |
| Hawaiian / Pacific | 0 | 0.0% |
| Hispanic or Latino | 1,868 | 2.9% |
| Native / Alaskan | 100 | 0.2% |
| White / Caucasian | 57,555 | 88.6% |
| Two or more Races | 2,184 | 3.4% |
| Some other Race | 1,126 | 1.7% |
| Total | 64,978 | 100.0% |
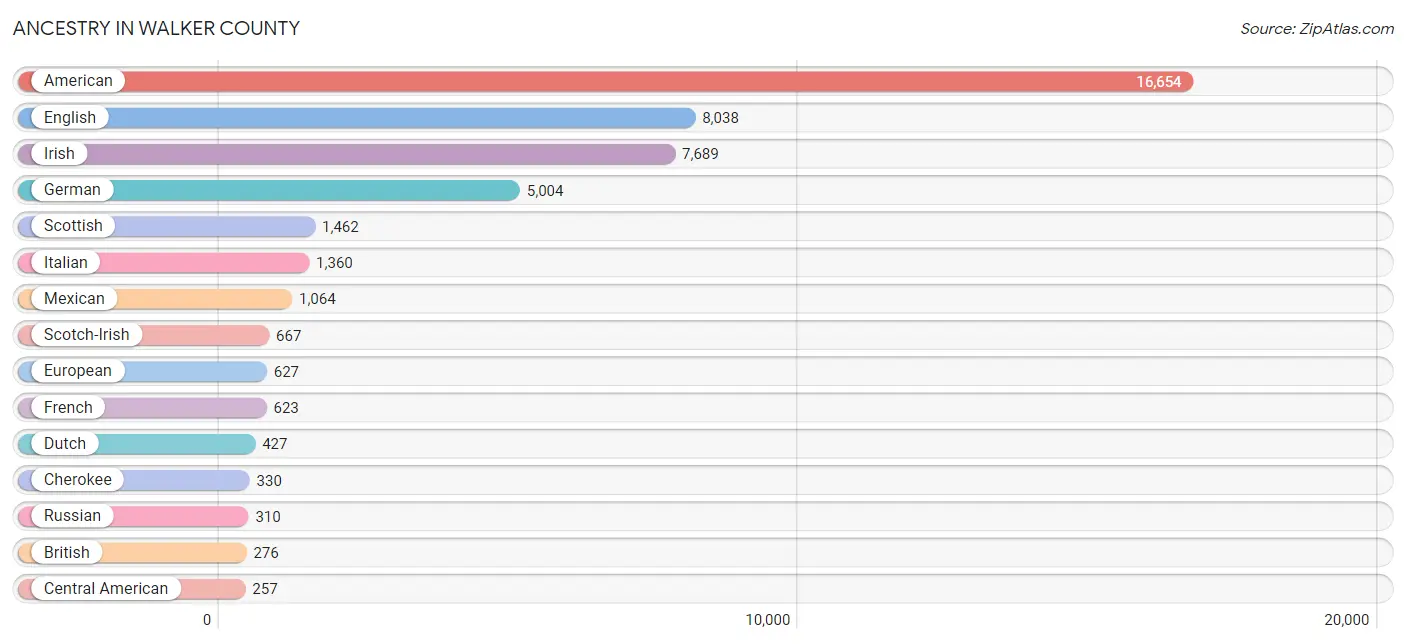
Ancestry in Walker County
The most populous ancestries reported in Walker County are American (16,654 | 25.6%), English (8,038 | 12.4%), Irish (7,689 | 11.8%), German (5,004 | 7.7%), and Scottish (1,462 | 2.2%), together accounting for 59.8% of all Walker County residents.
| Ancestry | # Population | % Population |
| African | 256 | 0.4% |
| American | 16,654 | 25.6% |
| Arab | 38 | 0.1% |
| Austrian | 19 | 0.0% |
| Bhutanese | 69 | 0.1% |
| Blackfeet | 64 | 0.1% |
| Brazilian | 5 | 0.0% |
| British | 276 | 0.4% |
| Burmese | 64 | 0.1% |
| Cajun | 7 | 0.0% |
| Celtic | 15 | 0.0% |
| Central American | 257 | 0.4% |
| Cherokee | 330 | 0.5% |
| Choctaw | 32 | 0.1% |
| Colombian | 26 | 0.0% |
| Creek | 2 | 0.0% |
| Cuban | 74 | 0.1% |
| Czech | 3 | 0.0% |
| Czechoslovakian | 7 | 0.0% |
| Dutch | 427 | 0.7% |
| Eastern European | 16 | 0.0% |
| English | 8,038 | 12.4% |
| European | 627 | 1.0% |
| Finnish | 2 | 0.0% |
| French | 623 | 1.0% |
| French Canadian | 2 | 0.0% |
| German | 5,004 | 7.7% |
| Greek | 136 | 0.2% |
| Guatemalan | 254 | 0.4% |
| Hungarian | 42 | 0.1% |
| Indian (Asian) | 144 | 0.2% |
| Irish | 7,689 | 11.8% |
| Italian | 1,360 | 2.1% |
| Korean | 14 | 0.0% |
| Lebanese | 24 | 0.0% |
| Lithuanian | 25 | 0.0% |
| Mexican | 1,064 | 1.6% |
| Moroccan | 14 | 0.0% |
| Native Hawaiian | 61 | 0.1% |
| Northern European | 90 | 0.1% |
| Norwegian | 65 | 0.1% |
| Polish | 116 | 0.2% |
| Portuguese | 56 | 0.1% |
| Puerto Rican | 99 | 0.2% |
| Romanian | 27 | 0.0% |
| Russian | 310 | 0.5% |
| Salvadoran | 3 | 0.0% |
| Scandinavian | 51 | 0.1% |
| Scotch-Irish | 667 | 1.0% |
| Scottish | 1,462 | 2.2% |
| Slovak | 12 | 0.0% |
| South American | 224 | 0.3% |
| Spaniard | 15 | 0.0% |
| Sri Lankan | 1 | 0.0% |
| Subsaharan African | 256 | 0.4% |
| Swedish | 92 | 0.1% |
| Swiss | 11 | 0.0% |
| Thai | 58 | 0.1% |
| Venezuelan | 198 | 0.3% |
| Welsh | 197 | 0.3% | View All 60 Rows |
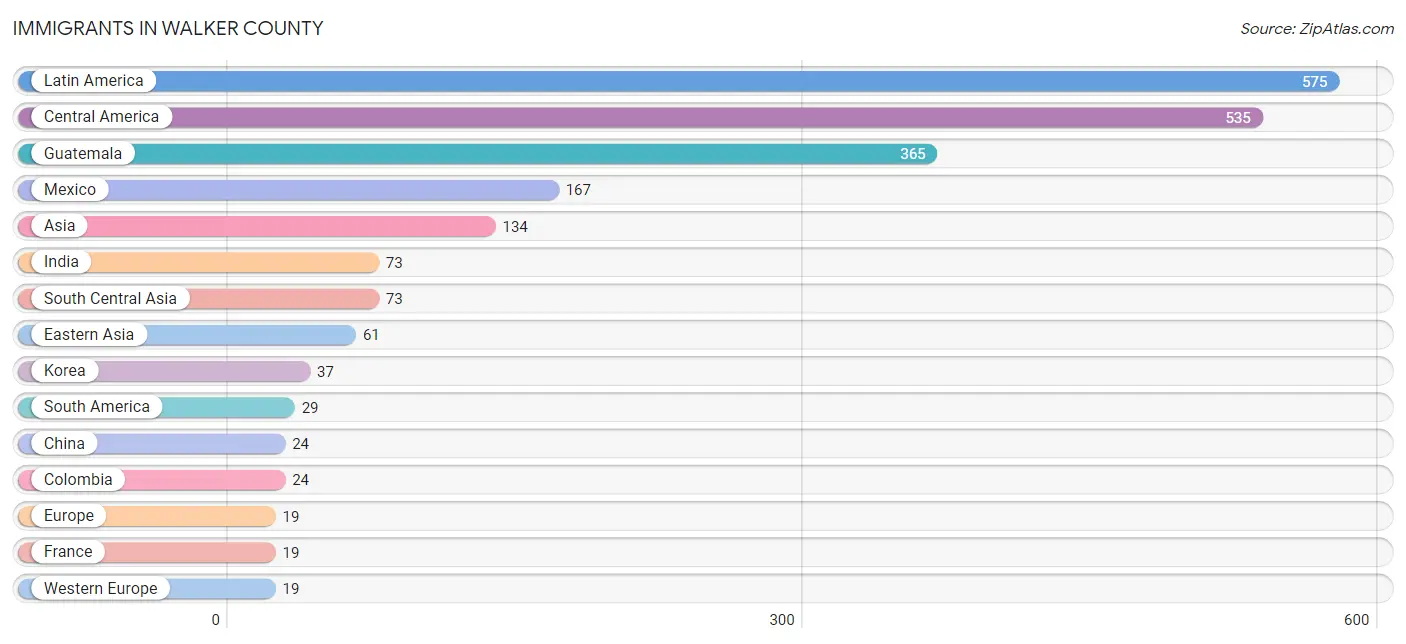
Immigrants in Walker County
The most numerous immigrant groups reported in Walker County came from Latin America (575 | 0.9%), Central America (535 | 0.8%), Guatemala (365 | 0.6%), Mexico (167 | 0.3%), and Asia (134 | 0.2%), together accounting for 2.7% of all Walker County residents.
| Immigration Origin | # Population | % Population |
| Asia | 134 | 0.2% |
| Brazil | 5 | 0.0% |
| Canada | 2 | 0.0% |
| Caribbean | 11 | 0.0% |
| Central America | 535 | 0.8% |
| China | 24 | 0.0% |
| Colombia | 24 | 0.0% |
| Cuba | 11 | 0.0% |
| Eastern Asia | 61 | 0.1% |
| El Salvador | 3 | 0.0% |
| Europe | 19 | 0.0% |
| France | 19 | 0.0% |
| Guatemala | 365 | 0.6% |
| India | 73 | 0.1% |
| Korea | 37 | 0.1% |
| Latin America | 575 | 0.9% |
| Mexico | 167 | 0.3% |
| South America | 29 | 0.0% |
| South Central Asia | 73 | 0.1% |
| Taiwan | 1 | 0.0% |
| Western Europe | 19 | 0.0% | View All 21 Rows |
Sex and Age in Walker County
Sex and Age in Walker County
The most populous age groups in Walker County are 5 to 9 Years (2,339 | 7.3%) for men and 55 to 59 Years (2,431 | 7.4%) for women.
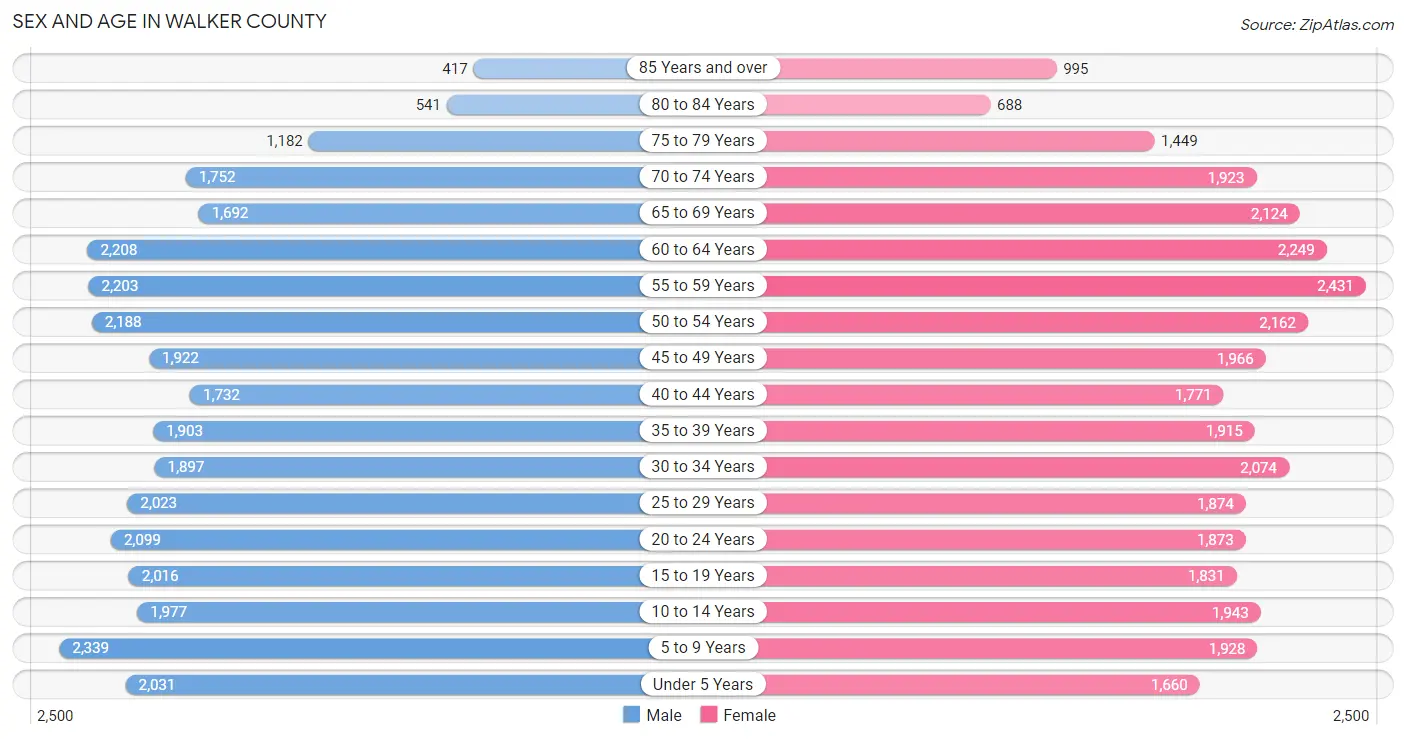
| Age Bracket | Male | Female |
| Under 5 Years | 2,031 (6.3%) | 1,660 (5.1%) |
| 5 to 9 Years | 2,339 (7.3%) | 1,928 (5.9%) |
| 10 to 14 Years | 1,977 (6.1%) | 1,943 (5.9%) |
| 15 to 19 Years | 2,016 (6.3%) | 1,831 (5.6%) |
| 20 to 24 Years | 2,099 (6.5%) | 1,873 (5.7%) |
| 25 to 29 Years | 2,023 (6.3%) | 1,874 (5.7%) |
| 30 to 34 Years | 1,897 (5.9%) | 2,074 (6.3%) |
| 35 to 39 Years | 1,903 (5.9%) | 1,915 (5.8%) |
| 40 to 44 Years | 1,732 (5.4%) | 1,771 (5.4%) |
| 45 to 49 Years | 1,922 (6.0%) | 1,966 (6.0%) |
| 50 to 54 Years | 2,188 (6.8%) | 2,162 (6.6%) |
| 55 to 59 Years | 2,203 (6.9%) | 2,431 (7.4%) |
| 60 to 64 Years | 2,208 (6.9%) | 2,249 (6.9%) |
| 65 to 69 Years | 1,692 (5.3%) | 2,124 (6.5%) |
| 70 to 74 Years | 1,752 (5.4%) | 1,923 (5.9%) |
| 75 to 79 Years | 1,182 (3.7%) | 1,449 (4.4%) |
| 80 to 84 Years | 541 (1.7%) | 688 (2.1%) |
| 85 Years and over | 417 (1.3%) | 995 (3.0%) |
| Total | 32,122 (100.0%) | 32,856 (100.0%) |
Families and Households in Walker County
Median Family Size in Walker County
The median family size in Walker County is 3.14 persons per family, with single female/mother families (3,281 | 19.7%) accounting for the largest median family size of 3.23 persons per family. On the other hand, single male/father families (1,179 | 7.1%) represent the smallest median family size with 3.04 persons per family.
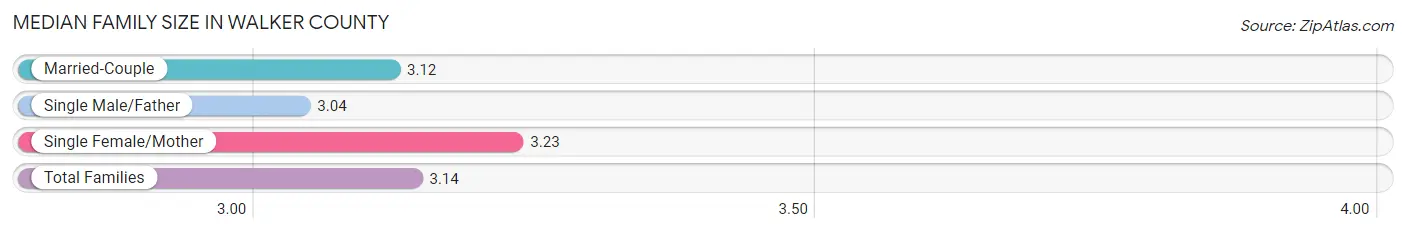
| Family Type | # Families | Family Size |
| Married-Couple | 12,209 (73.2%) | 3.12 |
| Single Male/Father | 1,179 (7.1%) | 3.04 |
| Single Female/Mother | 3,281 (19.7%) | 3.23 |
| Total Families | 16,669 (100.0%) | 3.14 |
Median Household Size in Walker County
The median household size in Walker County is 2.59 persons per household, with single male/father households (1,179 | 4.8%) accounting for the largest median household size of 3.56 persons per household. non-family households (8,049 | 32.6%) represent the smallest median household size with 1.19 persons per household.
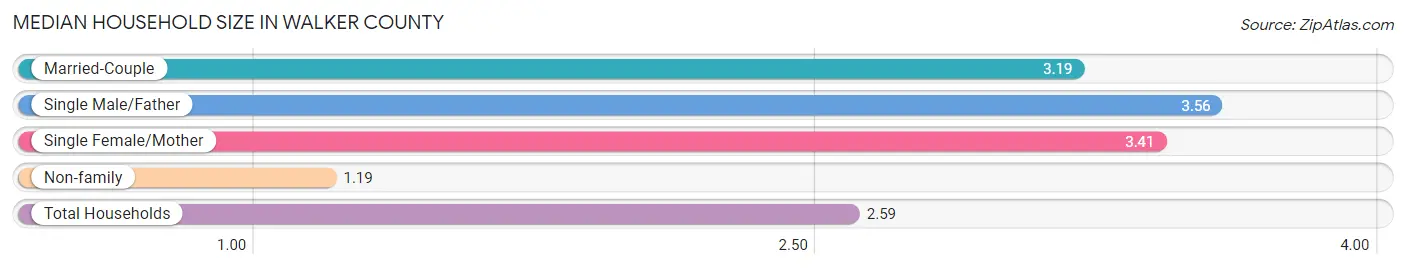
| Household Type | # Households | Household Size |
| Married-Couple | 12,209 (49.4%) | 3.19 |
| Single Male/Father | 1,179 (4.8%) | 3.56 |
| Single Female/Mother | 3,281 (13.3%) | 3.41 |
| Non-family | 8,049 (32.6%) | 1.19 |
| Total Households | 24,718 (100.0%) | 2.59 |
Household Size by Marriage Status in Walker County
Out of a total of 24,718 households in Walker County, 16,669 (67.4%) are family households, while 8,049 (32.6%) are nonfamily households. The most numerous type of family households are 2-person households, comprising 8,107, and the most common type of nonfamily households are 1-person households, comprising 7,199.
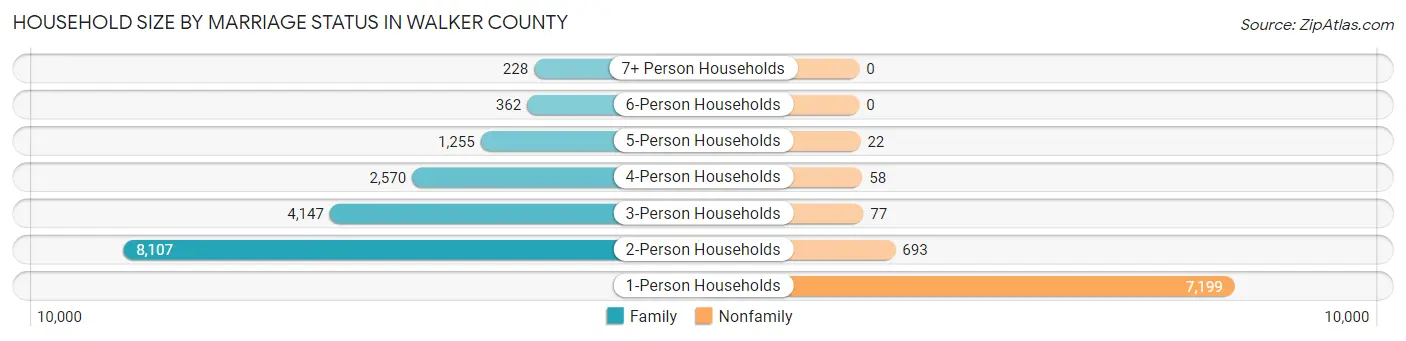
| Household Size | Family Households | Nonfamily Households |
| 1-Person Households | - | 7,199 (29.1%) |
| 2-Person Households | 8,107 (32.8%) | 693 (2.8%) |
| 3-Person Households | 4,147 (16.8%) | 77 (0.3%) |
| 4-Person Households | 2,570 (10.4%) | 58 (0.2%) |
| 5-Person Households | 1,255 (5.1%) | 22 (0.1%) |
| 6-Person Households | 362 (1.5%) | 0 (0.0%) |
| 7+ Person Households | 228 (0.9%) | 0 (0.0%) |
| Total | 16,669 (67.4%) | 8,049 (32.6%) |
Female Fertility in Walker County
Fertility by Age in Walker County
Average fertility rate in Walker County is 48.0 births per 1,000 women. Women in the age bracket of 20 to 34 years have the highest fertility rate with 99.0 births per 1,000 women. Women in the age bracket of 20 to 34 years acount for 88.0% of all women with births.
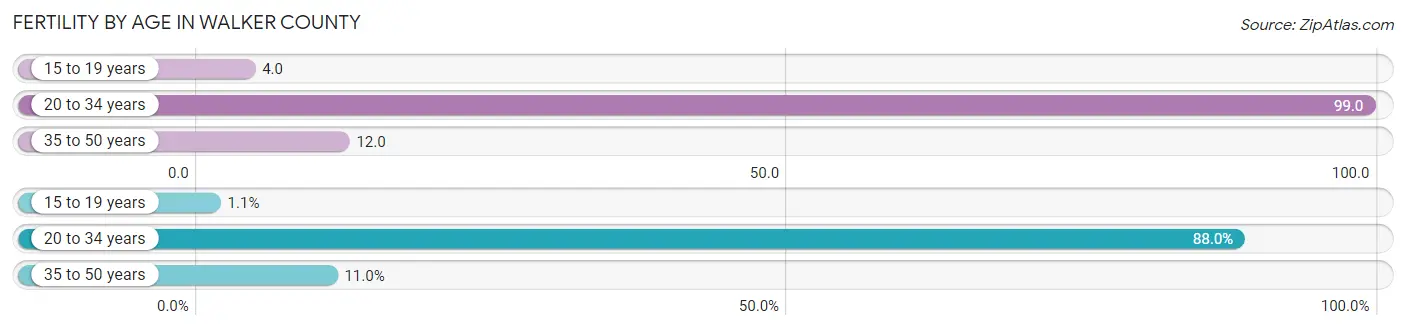
| Age Bracket | Women with Births | Births / 1,000 Women |
| 15 to 19 years | 7 (1.1%) | 4.0 |
| 20 to 34 years | 577 (88.0%) | 99.0 |
| 35 to 50 years | 72 (11.0%) | 12.0 |
| Total | 656 (100.0%) | 48.0 |
Fertility by Age by Marriage Status in Walker County
60.8% of women with births (656) in Walker County are married. The highest percentage of unmarried women with births falls into 15 to 19 years age bracket with 100.0% of them unmarried at the time of birth, while the lowest percentage of unmarried women with births belong to 35 to 50 years age bracket with 8.3% of them unmarried.
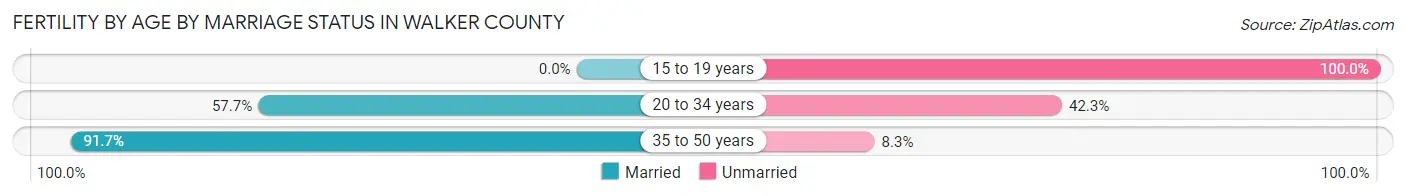
| Age Bracket | Married | Unmarried |
| 15 to 19 years | 0 (0.0%) | 7 (100.0%) |
| 20 to 34 years | 333 (57.7%) | 244 (42.3%) |
| 35 to 50 years | 66 (91.7%) | 6 (8.3%) |
| Total | 399 (60.8%) | 257 (39.2%) |
Fertility by Education in Walker County
Average fertility rate in Walker County is 48.0 births per 1,000 women. Women with the education attainment of graduate degree have the highest fertility rate of 93.0 births per 1,000 women, while women with the education attainment of bachelor's degree have the lowest fertility at 21.0 births per 1,000 women. Women with the education attainment of high school diploma represent 42.2% of all women with births.
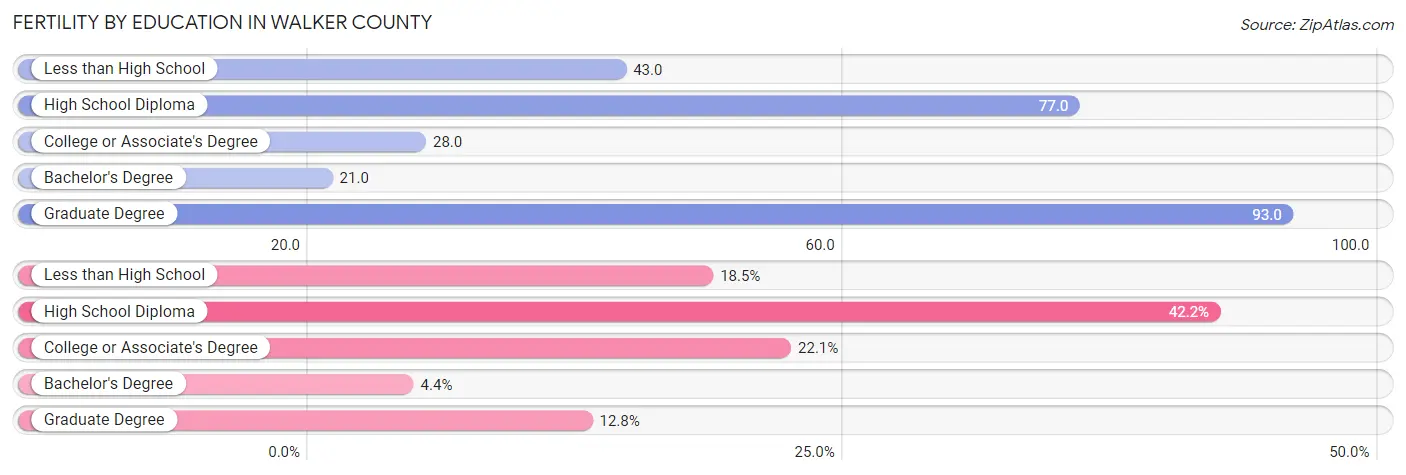
| Educational Attainment | Women with Births | Births / 1,000 Women |
| Less than High School | 121 (18.4%) | 43.0 |
| High School Diploma | 277 (42.2%) | 77.0 |
| College or Associate's Degree | 145 (22.1%) | 28.0 |
| Bachelor's Degree | 29 (4.4%) | 21.0 |
| Graduate Degree | 84 (12.8%) | 93.0 |
| Total | 656 (100.0%) | 48.0 |
Fertility by Education by Marriage Status in Walker County
39.2% of women with births in Walker County are unmarried. Women with the educational attainment of bachelor's degree are most likely to be married with 100.0% of them married at childbirth, while women with the educational attainment of less than high school are least likely to be married with 79.3% of them unmarried at childbirth.
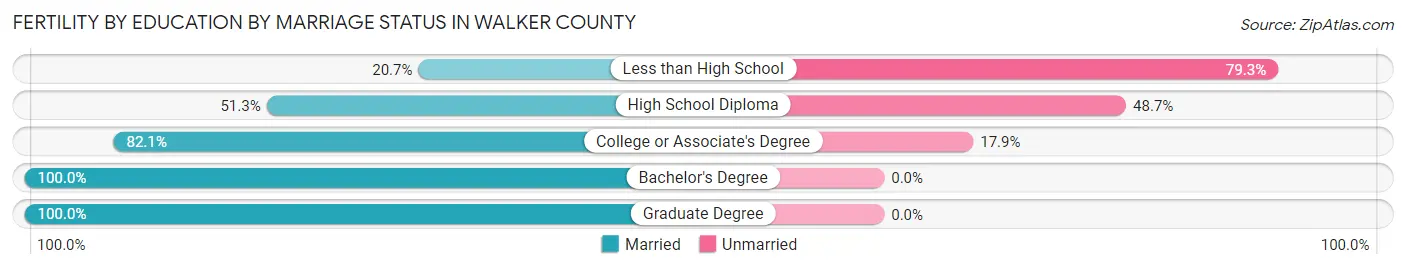
| Educational Attainment | Married | Unmarried |
| Less than High School | 25 (20.7%) | 96 (79.3%) |
| High School Diploma | 142 (51.3%) | 135 (48.7%) |
| College or Associate's Degree | 119 (82.1%) | 26 (17.9%) |
| Bachelor's Degree | 29 (100.0%) | 0 (0.0%) |
| Graduate Degree | 84 (100.0%) | 0 (0.0%) |
| Total | 399 (60.8%) | 257 (39.2%) |
Employment Characteristics in Walker County
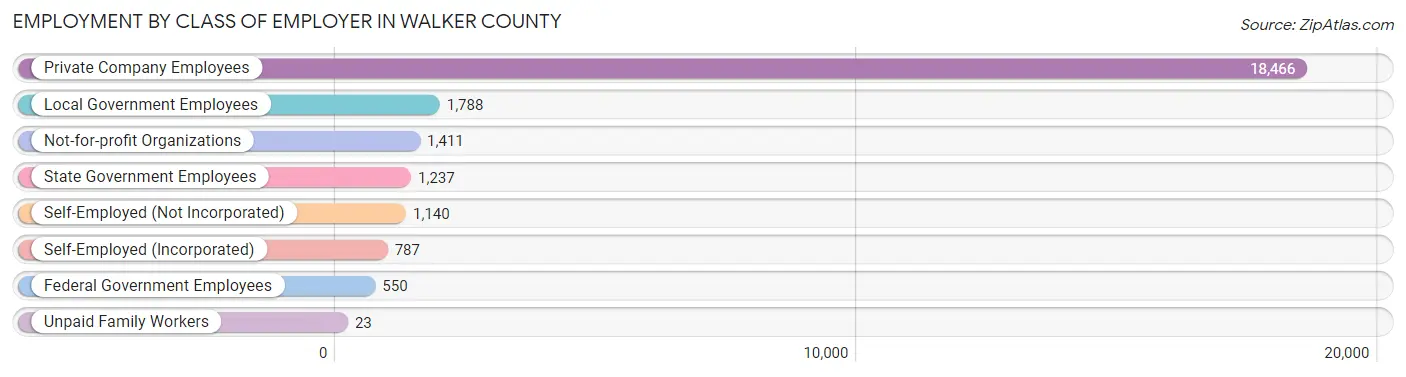
Employment by Class of Employer in Walker County
Among the 25,402 employed individuals in Walker County, private company employees (18,466 | 72.7%), local government employees (1,788 | 7.0%), and not-for-profit organizations (1,411 | 5.6%) make up the most common classes of employment.
| Employer Class | # Employees | % Employees |
| Private Company Employees | 18,466 | 72.7% |
| Self-Employed (Incorporated) | 787 | 3.1% |
| Self-Employed (Not Incorporated) | 1,140 | 4.5% |
| Not-for-profit Organizations | 1,411 | 5.6% |
| Local Government Employees | 1,788 | 7.0% |
| State Government Employees | 1,237 | 4.9% |
| Federal Government Employees | 550 | 2.2% |
| Unpaid Family Workers | 23 | 0.1% |
| Total | 25,402 | 100.0% |
Employment Status by Age in Walker County
According to the labor force statistics for Walker County, out of the total population over 16 years of age (52,243), 52.4% or 27,375 individuals are in the labor force, with 5.7% or 1,560 of them unemployed. The age group with the highest labor force participation rate is 30 to 34 years, with 77.2% or 3,066 individuals in the labor force. Within the labor force, the 16 to 19 years age range has the highest percentage of unemployed individuals, with 14.5% or 164 of them being unemployed.
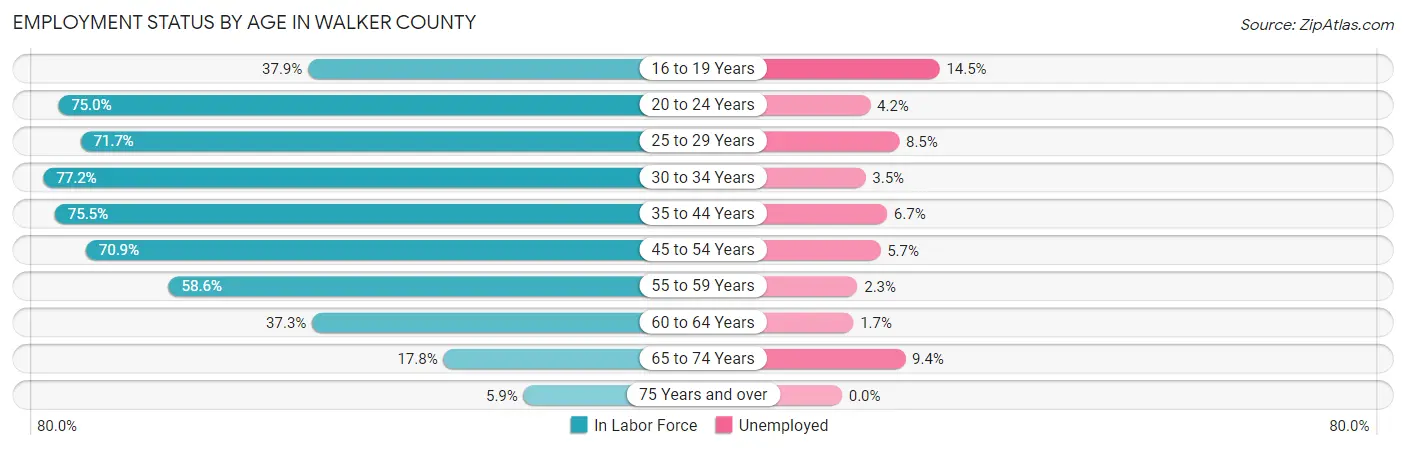
| Age Bracket | In Labor Force | Unemployed |
| 16 to 19 Years | 1,133 (37.9%) | 164 (14.5%) |
| 20 to 24 Years | 2,979 (75.0%) | 125 (4.2%) |
| 25 to 29 Years | 2,794 (71.7%) | 237 (8.5%) |
| 30 to 34 Years | 3,066 (77.2%) | 107 (3.5%) |
| 35 to 44 Years | 5,527 (75.5%) | 370 (6.7%) |
| 45 to 54 Years | 5,841 (70.9%) | 333 (5.7%) |
| 55 to 59 Years | 2,716 (58.6%) | 62 (2.3%) |
| 60 to 64 Years | 1,662 (37.3%) | 28 (1.7%) |
| 65 to 74 Years | 1,333 (17.8%) | 125 (9.4%) |
| 75 Years and over | 311 (5.9%) | 0 (0.0%) |
| Total | 27,375 (52.4%) | 1,560 (5.7%) |
Employment Status by Educational Attainment in Walker County
According to labor force statistics for Walker County, 66.4% of individuals (21,592) out of the total population between 25 and 64 years of age (32,518) are in the labor force, with 5.3% or 1,144 of them being unemployed. The group with the highest labor force participation rate are those with the educational attainment of bachelor's degree or higher, with 84.9% or 4,391 individuals in the labor force. Within the labor force, individuals with less than high school education have the highest percentage of unemployment, with 7.2% or 124 of them being unemployed.
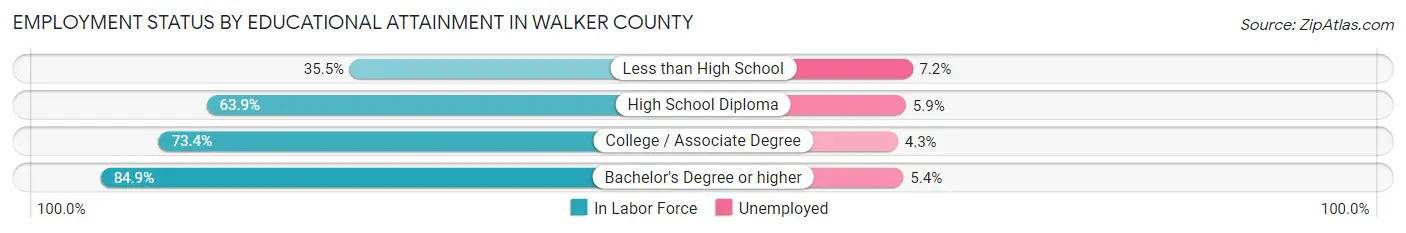
| Educational Attainment | In Labor Force | Unemployed |
| Less than High School | 1,719 (35.5%) | 349 (7.2%) |
| High School Diploma | 6,827 (63.9%) | 630 (5.9%) |
| College / Associate Degree | 8,675 (73.4%) | 508 (4.3%) |
| Bachelor's Degree or higher | 4,391 (84.9%) | 279 (5.4%) |
| Total | 21,592 (66.4%) | 1,723 (5.3%) |
Employment Occupations by Sex in Walker County
Management, Business, Science and Arts Occupations
The most common Management, Business, Science and Arts occupations in Walker County are Community & Social Service (2,132 | 8.3%), Health Diagnosing & Treating (1,975 | 7.7%), Management (1,583 | 6.1%), Education Instruction & Library (1,316 | 5.1%), and Health Technologists (1,165 | 4.5%).
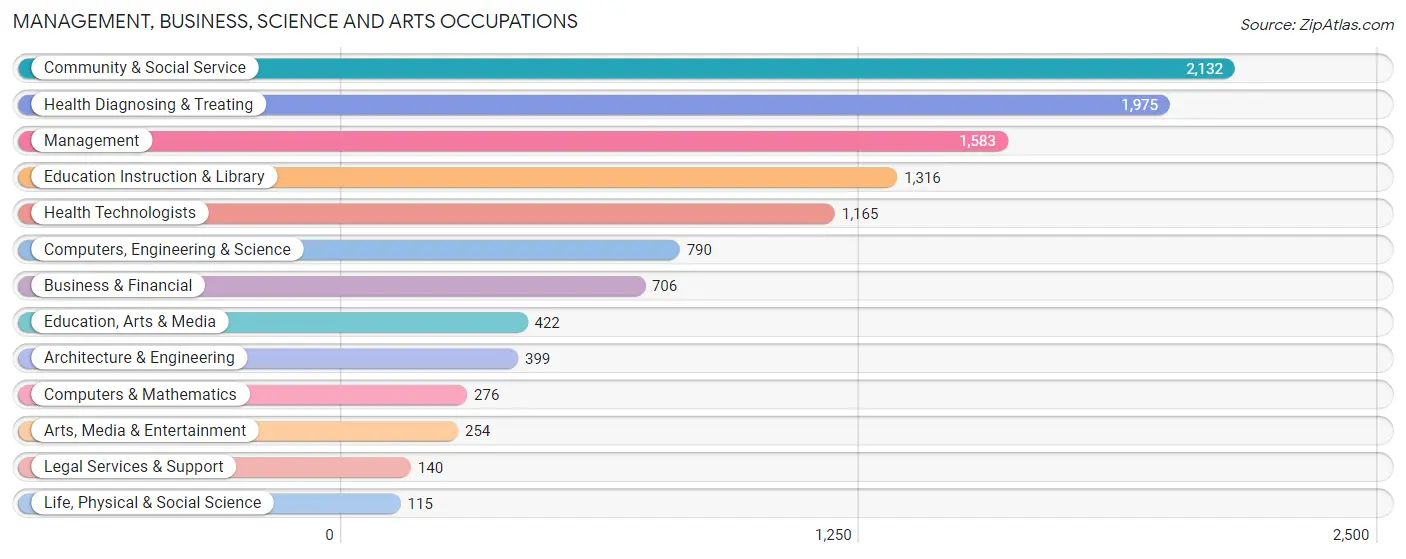
Management, Business, Science and Arts Occupations by Sex
Within the Management, Business, Science and Arts occupations in Walker County, the most male-oriented occupations are Architecture & Engineering (94.5%), Computers & Mathematics (90.6%), and Computers, Engineering & Science (87.5%), while the most female-oriented occupations are Health Technologists (90.5%), Education Instruction & Library (88.4%), and Health Diagnosing & Treating (85.8%).
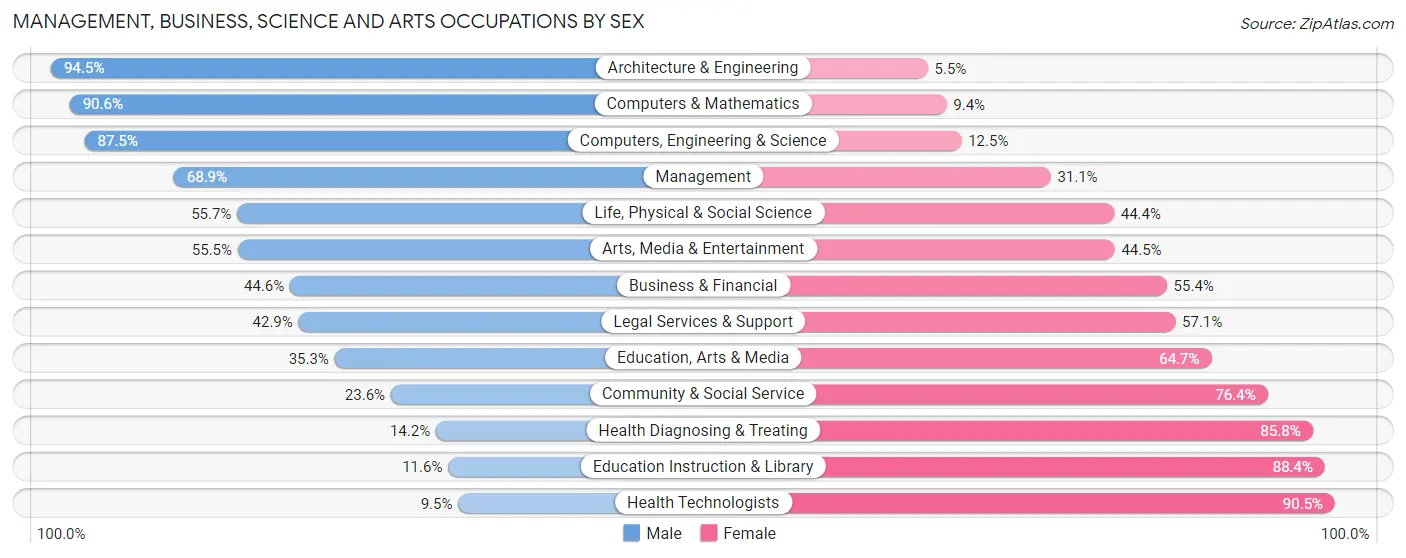
| Occupation | Male | Female |
| Management | 1,090 (68.9%) | 493 (31.1%) |
| Business & Financial | 315 (44.6%) | 391 (55.4%) |
| Computers, Engineering & Science | 691 (87.5%) | 99 (12.5%) |
| Computers & Mathematics | 250 (90.6%) | 26 (9.4%) |
| Architecture & Engineering | 377 (94.5%) | 22 (5.5%) |
| Life, Physical & Social Science | 64 (55.6%) | 51 (44.4%) |
| Community & Social Service | 503 (23.6%) | 1,629 (76.4%) |
| Education, Arts & Media | 149 (35.3%) | 273 (64.7%) |
| Legal Services & Support | 60 (42.9%) | 80 (57.1%) |
| Education Instruction & Library | 153 (11.6%) | 1,163 (88.4%) |
| Arts, Media & Entertainment | 141 (55.5%) | 113 (44.5%) |
| Health Diagnosing & Treating | 280 (14.2%) | 1,695 (85.8%) |
| Health Technologists | 111 (9.5%) | 1,054 (90.5%) |
| Total (Category) | 2,879 (40.1%) | 4,307 (59.9%) |
| Total (Overall) | 13,864 (53.8%) | 11,900 (46.2%) |
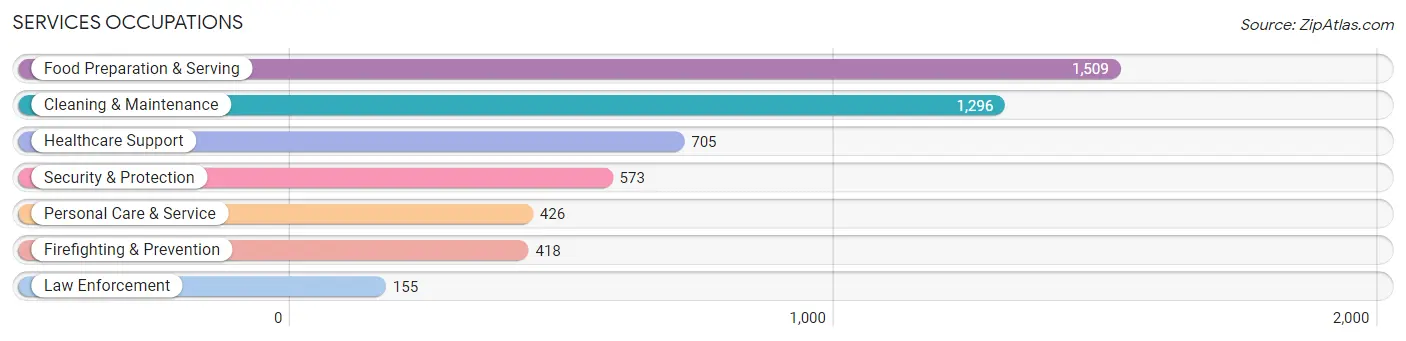
Services Occupations
The most common Services occupations in Walker County are Food Preparation & Serving (1,509 | 5.9%), Cleaning & Maintenance (1,296 | 5.0%), Healthcare Support (705 | 2.7%), Security & Protection (573 | 2.2%), and Personal Care & Service (426 | 1.7%).
Services Occupations by Sex
Within the Services occupations in Walker County, the most male-oriented occupations are Law Enforcement (100.0%), Security & Protection (97.2%), and Firefighting & Prevention (96.2%), while the most female-oriented occupations are Healthcare Support (92.3%), Personal Care & Service (90.4%), and Food Preparation & Serving (72.6%).
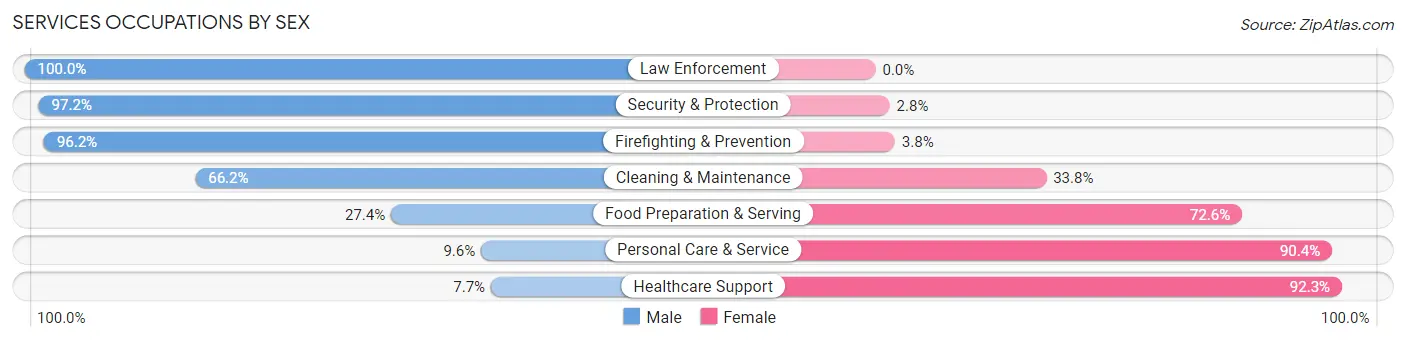
| Occupation | Male | Female |
| Healthcare Support | 54 (7.7%) | 651 (92.3%) |
| Security & Protection | 557 (97.2%) | 16 (2.8%) |
| Firefighting & Prevention | 402 (96.2%) | 16 (3.8%) |
| Law Enforcement | 155 (100.0%) | 0 (0.0%) |
| Food Preparation & Serving | 414 (27.4%) | 1,095 (72.6%) |
| Cleaning & Maintenance | 858 (66.2%) | 438 (33.8%) |
| Personal Care & Service | 41 (9.6%) | 385 (90.4%) |
| Total (Category) | 1,924 (42.7%) | 2,585 (57.3%) |
| Total (Overall) | 13,864 (53.8%) | 11,900 (46.2%) |
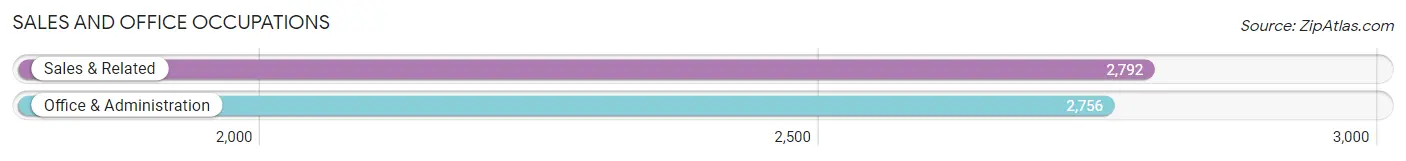
Sales and Office Occupations
The most common Sales and Office occupations in Walker County are Sales & Related (2,792 | 10.8%), and Office & Administration (2,756 | 10.7%).
Sales and Office Occupations by Sex
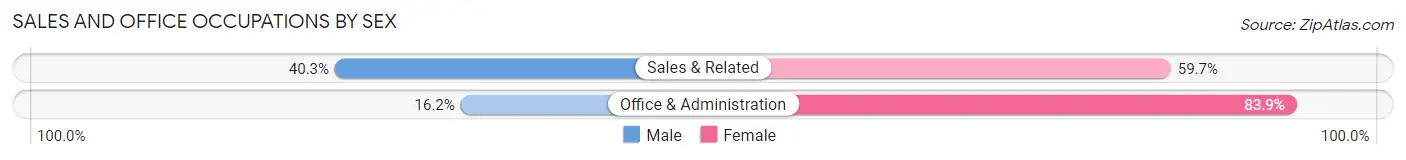
| Occupation | Male | Female |
| Sales & Related | 1,126 (40.3%) | 1,666 (59.7%) |
| Office & Administration | 445 (16.2%) | 2,311 (83.9%) |
| Total (Category) | 1,571 (28.3%) | 3,977 (71.7%) |
| Total (Overall) | 13,864 (53.8%) | 11,900 (46.2%) |
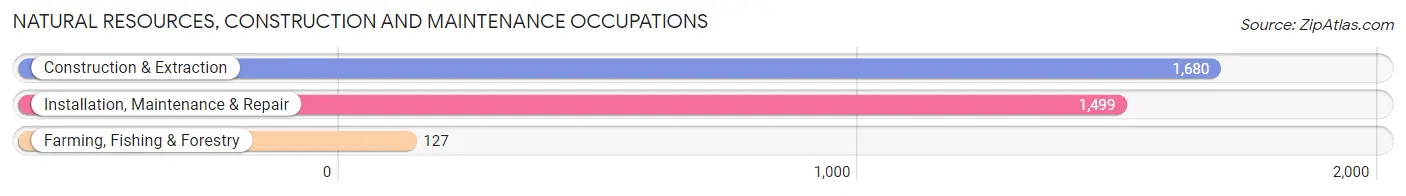
Natural Resources, Construction and Maintenance Occupations
The most common Natural Resources, Construction and Maintenance occupations in Walker County are Construction & Extraction (1,680 | 6.5%), Installation, Maintenance & Repair (1,499 | 5.8%), and Farming, Fishing & Forestry (127 | 0.5%).
Natural Resources, Construction and Maintenance Occupations by Sex
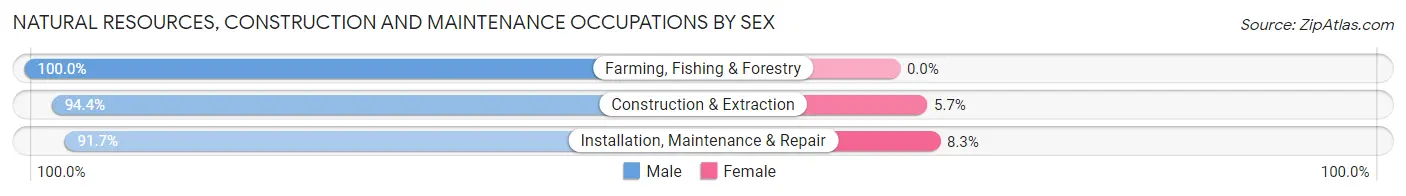
| Occupation | Male | Female |
| Farming, Fishing & Forestry | 127 (100.0%) | 0 (0.0%) |
| Construction & Extraction | 1,585 (94.4%) | 95 (5.7%) |
| Installation, Maintenance & Repair | 1,374 (91.7%) | 125 (8.3%) |
| Total (Category) | 3,086 (93.3%) | 220 (6.7%) |
| Total (Overall) | 13,864 (53.8%) | 11,900 (46.2%) |
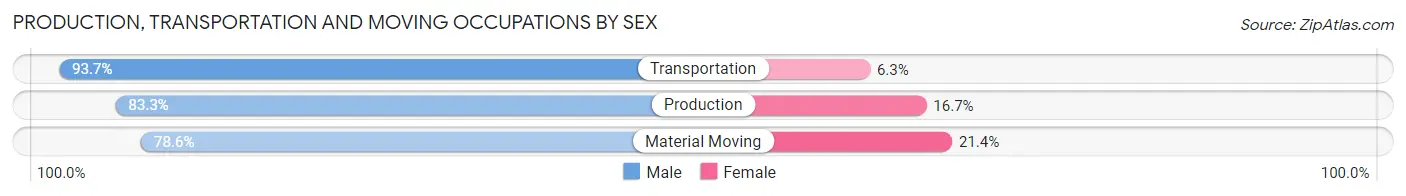
Production, Transportation and Moving Occupations
The most common Production, Transportation and Moving occupations in Walker County are Production (2,657 | 10.3%), Material Moving (1,371 | 5.3%), and Transportation (1,187 | 4.6%).
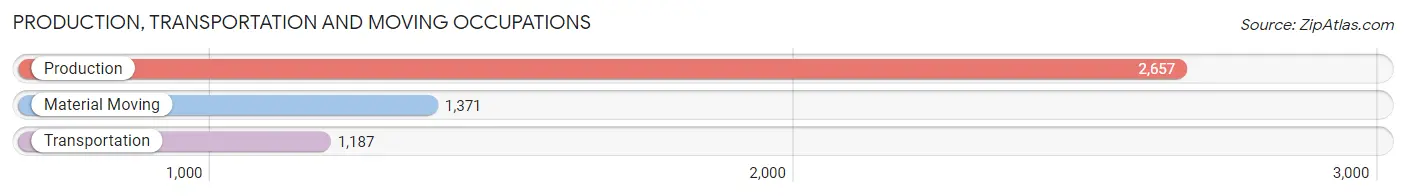
Production, Transportation and Moving Occupations by Sex
| Occupation | Male | Female |
| Production | 2,214 (83.3%) | 443 (16.7%) |
| Transportation | 1,112 (93.7%) | 75 (6.3%) |
| Material Moving | 1,078 (78.6%) | 293 (21.4%) |
| Total (Category) | 4,404 (84.5%) | 811 (15.5%) |
| Total (Overall) | 13,864 (53.8%) | 11,900 (46.2%) |
Employment Industries by Sex in Walker County
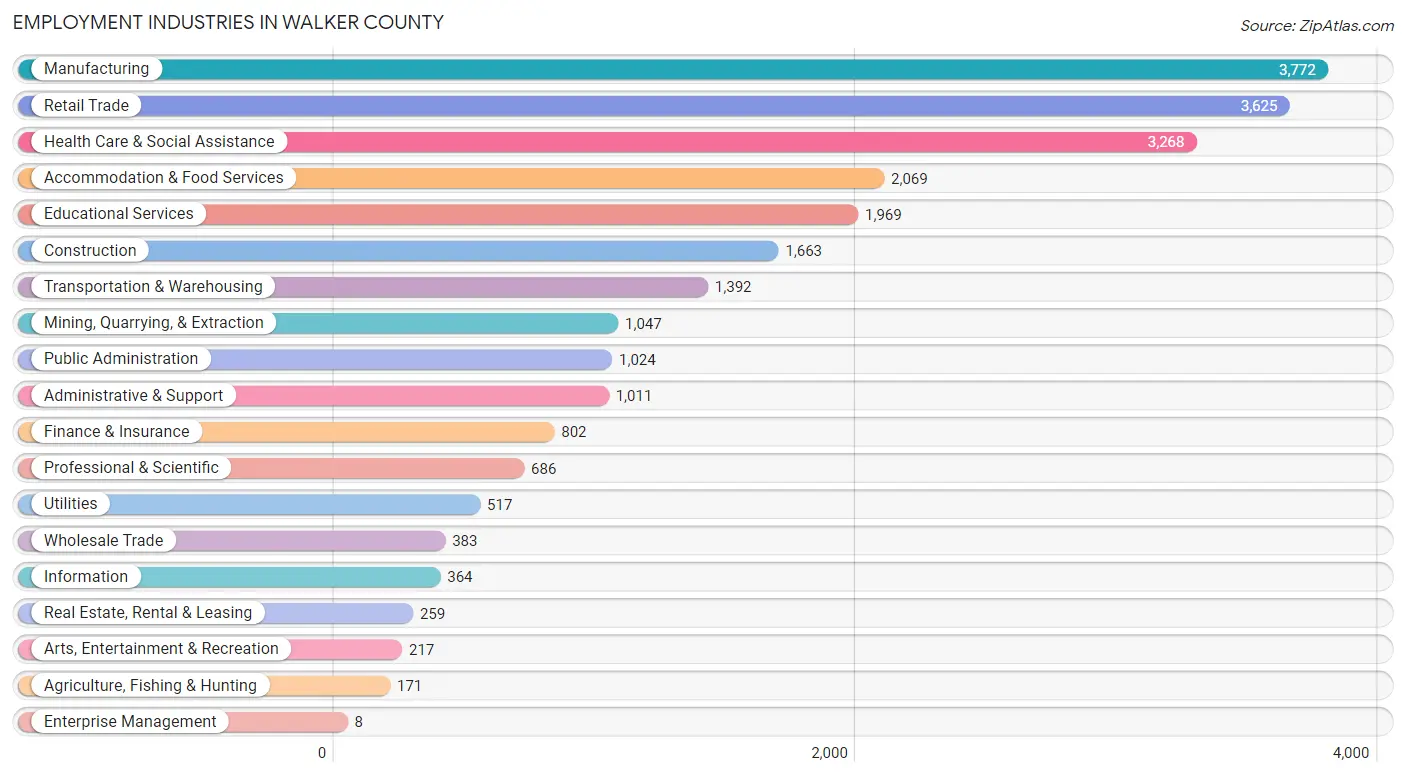
Employment Industries in Walker County
The major employment industries in Walker County include Manufacturing (3,772 | 14.6%), Retail Trade (3,625 | 14.1%), Health Care & Social Assistance (3,268 | 12.7%), Accommodation & Food Services (2,069 | 8.0%), and Educational Services (1,969 | 7.6%).
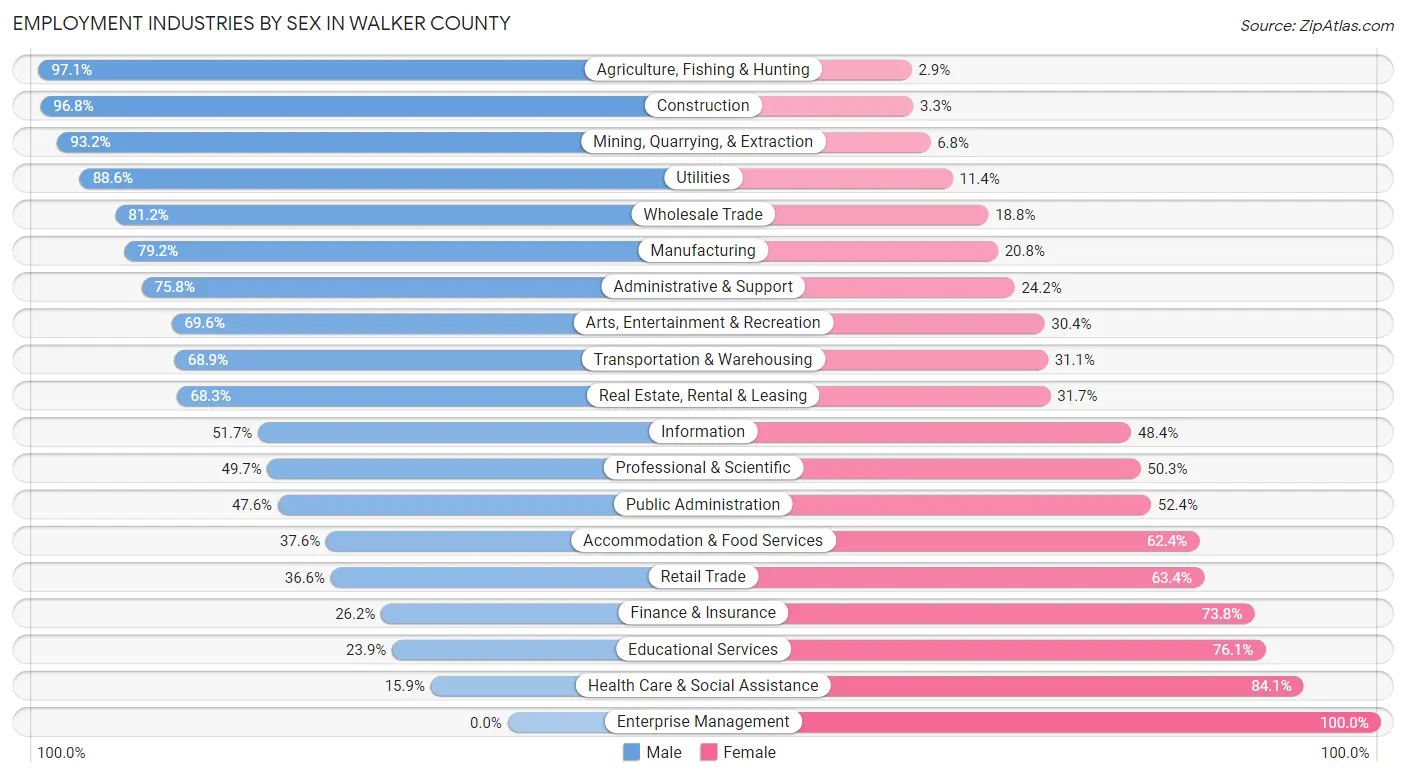
Employment Industries by Sex in Walker County
The Walker County industries that see more men than women are Agriculture, Fishing & Hunting (97.1%), Construction (96.8%), and Mining, Quarrying, & Extraction (93.2%), whereas the industries that tend to have a higher number of women are Enterprise Management (100.0%), Health Care & Social Assistance (84.1%), and Educational Services (76.1%).
| Industry | Male | Female |
| Agriculture, Fishing & Hunting | 166 (97.1%) | 5 (2.9%) |
| Mining, Quarrying, & Extraction | 976 (93.2%) | 71 (6.8%) |
| Construction | 1,609 (96.8%) | 54 (3.3%) |
| Manufacturing | 2,989 (79.2%) | 783 (20.8%) |
| Wholesale Trade | 311 (81.2%) | 72 (18.8%) |
| Retail Trade | 1,327 (36.6%) | 2,298 (63.4%) |
| Transportation & Warehousing | 959 (68.9%) | 433 (31.1%) |
| Utilities | 458 (88.6%) | 59 (11.4%) |
| Information | 188 (51.6%) | 176 (48.3%) |
| Finance & Insurance | 210 (26.2%) | 592 (73.8%) |
| Real Estate, Rental & Leasing | 177 (68.3%) | 82 (31.7%) |
| Professional & Scientific | 341 (49.7%) | 345 (50.3%) |
| Enterprise Management | 0 (0.0%) | 8 (100.0%) |
| Administrative & Support | 766 (75.8%) | 245 (24.2%) |
| Educational Services | 471 (23.9%) | 1,498 (76.1%) |
| Health Care & Social Assistance | 521 (15.9%) | 2,747 (84.1%) |
| Arts, Entertainment & Recreation | 151 (69.6%) | 66 (30.4%) |
| Accommodation & Food Services | 778 (37.6%) | 1,291 (62.4%) |
| Public Administration | 487 (47.6%) | 537 (52.4%) |
| Total | 13,864 (53.8%) | 11,900 (46.2%) |
Education in Walker County
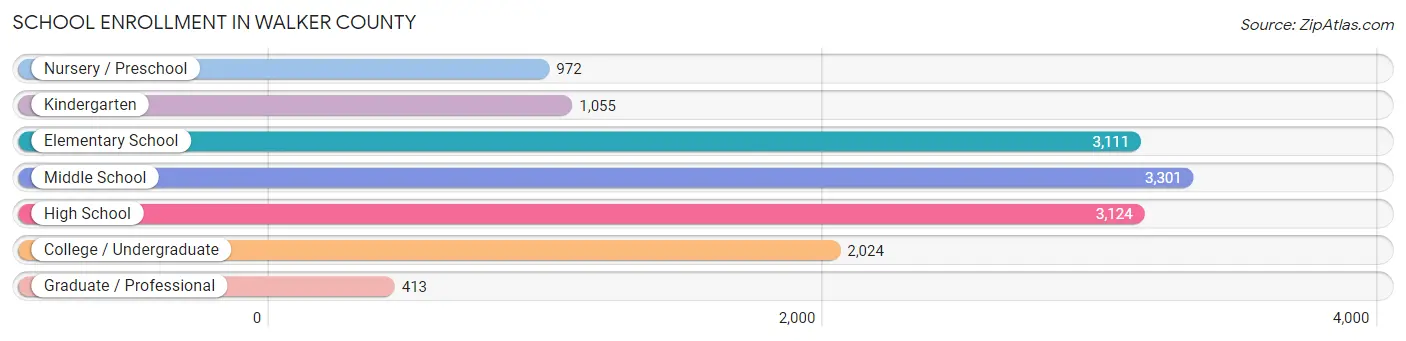
School Enrollment in Walker County
The most common levels of schooling among the 14,000 students in Walker County are middle school (3,301 | 23.6%), high school (3,124 | 22.3%), and elementary school (3,111 | 22.2%).
| School Level | # Students | % Students |
| Nursery / Preschool | 972 | 6.9% |
| Kindergarten | 1,055 | 7.5% |
| Elementary School | 3,111 | 22.2% |
| Middle School | 3,301 | 23.6% |
| High School | 3,124 | 22.3% |
| College / Undergraduate | 2,024 | 14.5% |
| Graduate / Professional | 413 | 2.9% |
| Total | 14,000 | 100.0% |
School Enrollment by Age by Funding Source in Walker County
Out of a total of 14,000 students who are enrolled in schools in Walker County, 1,288 (9.2%) attend a private institution, while the remaining 12,712 (90.8%) are enrolled in public schools. The age group of 3 to 4 year olds has the highest likelihood of being enrolled in private schools, with 208 (27.8% in the age bracket) enrolled. Conversely, the age group of 18 to 19 year olds has the lowest likelihood of being enrolled in a private school, with 865 (96.2% in the age bracket) attending a public institution.
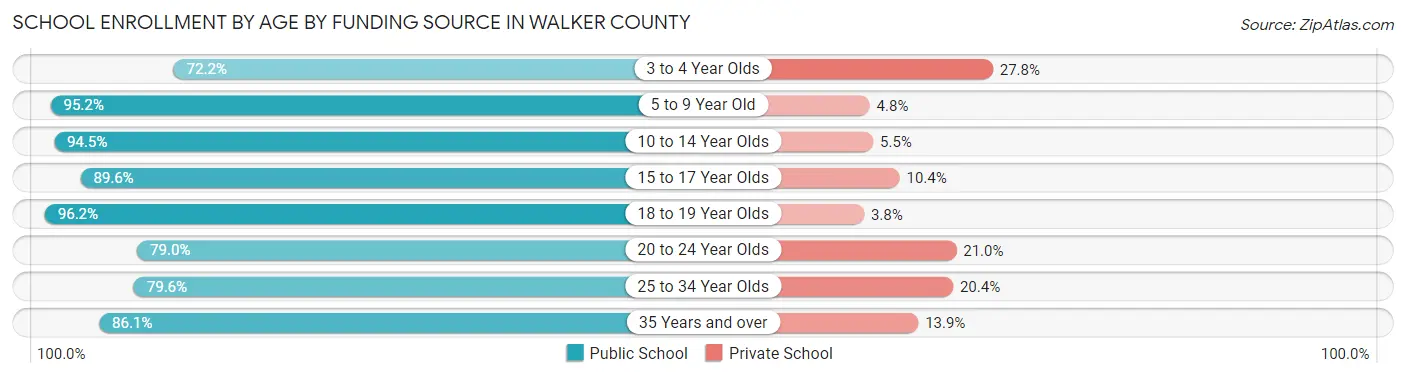
| Age Bracket | Public School | Private School |
| 3 to 4 Year Olds | 541 (72.2%) | 208 (27.8%) |
| 5 to 9 Year Old | 3,854 (95.2%) | 196 (4.8%) |
| 10 to 14 Year Olds | 3,637 (94.5%) | 211 (5.5%) |
| 15 to 17 Year Olds | 2,230 (89.6%) | 259 (10.4%) |
| 18 to 19 Year Olds | 865 (96.2%) | 34 (3.8%) |
| 20 to 24 Year Olds | 878 (79.0%) | 233 (21.0%) |
| 25 to 34 Year Olds | 399 (79.6%) | 102 (20.4%) |
| 35 Years and over | 304 (86.1%) | 49 (13.9%) |
| Total | 12,712 (90.8%) | 1,288 (9.2%) |
Educational Attainment by Field of Study in Walker County
Education (1,788 | 23.6%), business (1,783 | 23.6%), science & technology (785 | 10.4%), liberal arts & history (479 | 6.3%), and psychology (476 | 6.3%) are the most common fields of study among 7,567 individuals in Walker County who have obtained a bachelor's degree or higher.
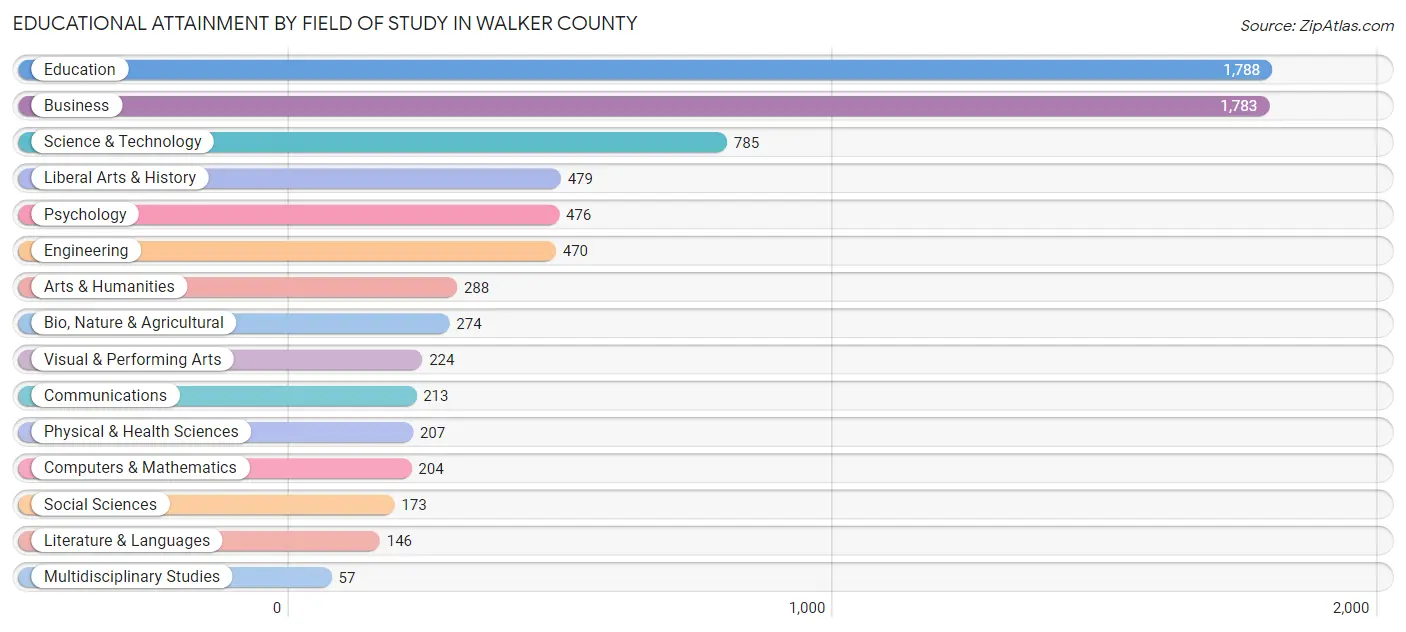
| Field of Study | # Graduates | % Graduates |
| Computers & Mathematics | 204 | 2.7% |
| Bio, Nature & Agricultural | 274 | 3.6% |
| Physical & Health Sciences | 207 | 2.7% |
| Psychology | 476 | 6.3% |
| Social Sciences | 173 | 2.3% |
| Engineering | 470 | 6.2% |
| Multidisciplinary Studies | 57 | 0.7% |
| Science & Technology | 785 | 10.4% |
| Business | 1,783 | 23.6% |
| Education | 1,788 | 23.6% |
| Literature & Languages | 146 | 1.9% |
| Liberal Arts & History | 479 | 6.3% |
| Visual & Performing Arts | 224 | 3.0% |
| Communications | 213 | 2.8% |
| Arts & Humanities | 288 | 3.8% |
| Total | 7,567 | 100.0% |
Transportation & Commute in Walker County
Vehicle Availability by Sex in Walker County
The most prevalent vehicle ownership categories in Walker County are males with 2 vehicles (4,843, accounting for 35.6%) and females with 2 vehicles (3,935, making up 41.1%).
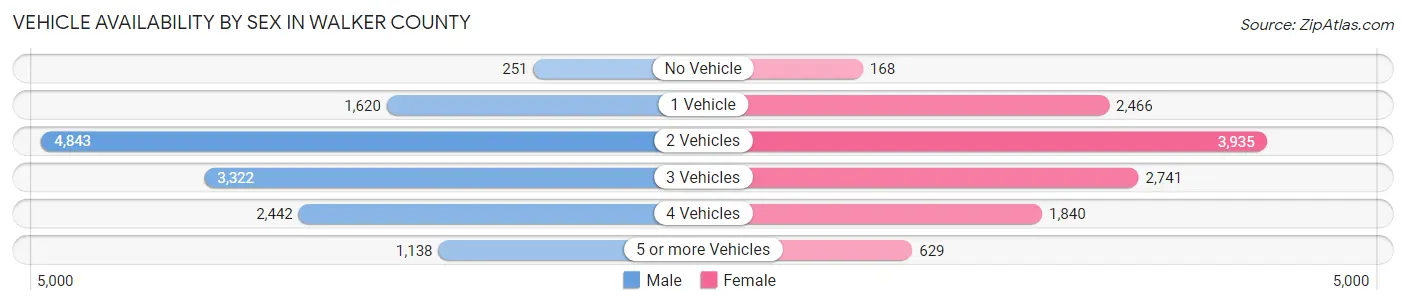
| Vehicles Available | Male | Female |
| No Vehicle | 251 (1.8%) | 168 (1.4%) |
| 1 Vehicle | 1,620 (11.9%) | 2,466 (20.9%) |
| 2 Vehicles | 4,843 (35.6%) | 3,935 (33.4%) |
| 3 Vehicles | 3,322 (24.4%) | 2,741 (23.3%) |
| 4 Vehicles | 2,442 (17.9%) | 1,840 (15.6%) |
| 5 or more Vehicles | 1,138 (8.4%) | 629 (5.3%) |
| Total | 13,616 (100.0%) | 11,779 (100.0%) |
Commute Time in Walker County
The most frequently occuring commute durations in Walker County are 10 to 14 minutes (3,192 commuters, 13.1%), 45 to 59 minutes (3,025 commuters, 12.4%), and 15 to 19 minutes (2,892 commuters, 11.8%).
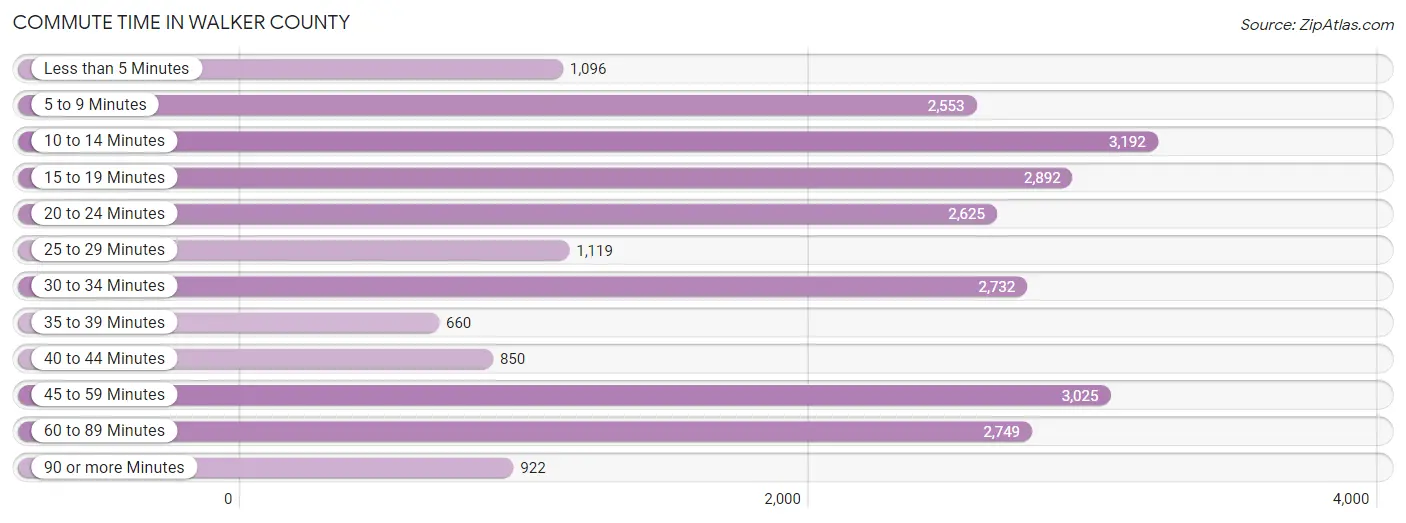
| Commute Time | # Commuters | % Commuters |
| Less than 5 Minutes | 1,096 | 4.5% |
| 5 to 9 Minutes | 2,553 | 10.5% |
| 10 to 14 Minutes | 3,192 | 13.1% |
| 15 to 19 Minutes | 2,892 | 11.8% |
| 20 to 24 Minutes | 2,625 | 10.7% |
| 25 to 29 Minutes | 1,119 | 4.6% |
| 30 to 34 Minutes | 2,732 | 11.2% |
| 35 to 39 Minutes | 660 | 2.7% |
| 40 to 44 Minutes | 850 | 3.5% |
| 45 to 59 Minutes | 3,025 | 12.4% |
| 60 to 89 Minutes | 2,749 | 11.3% |
| 90 or more Minutes | 922 | 3.8% |
Commute Time by Sex in Walker County
The most common commute times in Walker County are 45 to 59 minutes (1,992 commuters, 15.2%) for males and 10 to 14 minutes (1,787 commuters, 15.7%) for females.
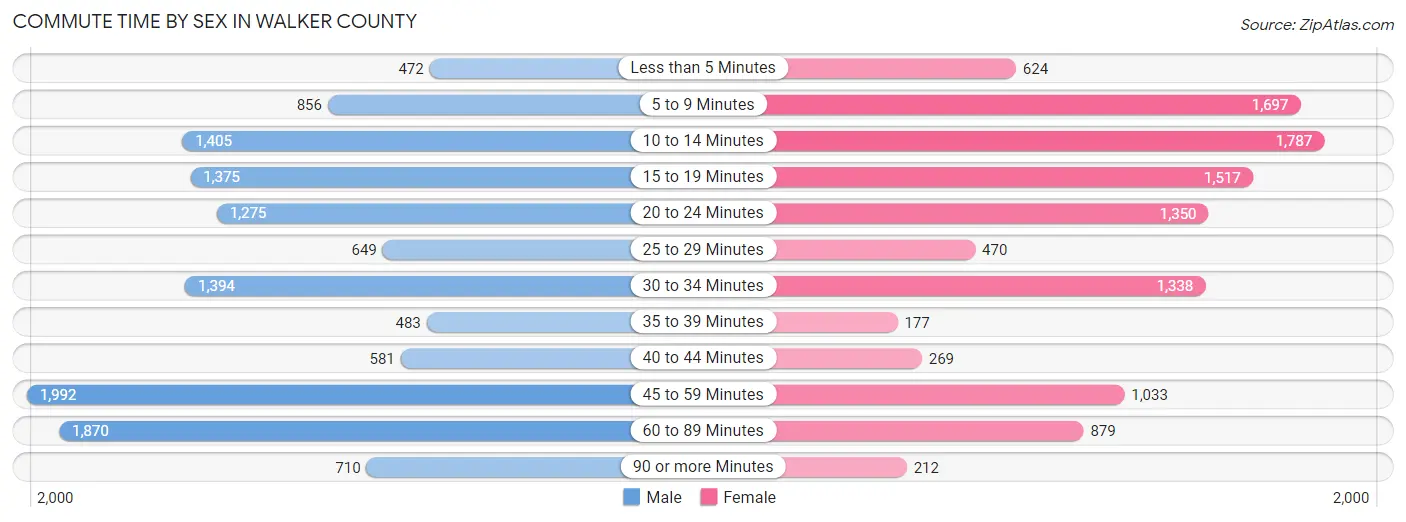
| Commute Time | Male | Female |
| Less than 5 Minutes | 472 (3.6%) | 624 (5.5%) |
| 5 to 9 Minutes | 856 (6.6%) | 1,697 (14.9%) |
| 10 to 14 Minutes | 1,405 (10.8%) | 1,787 (15.7%) |
| 15 to 19 Minutes | 1,375 (10.5%) | 1,517 (13.4%) |
| 20 to 24 Minutes | 1,275 (9.8%) | 1,350 (11.9%) |
| 25 to 29 Minutes | 649 (5.0%) | 470 (4.1%) |
| 30 to 34 Minutes | 1,394 (10.7%) | 1,338 (11.8%) |
| 35 to 39 Minutes | 483 (3.7%) | 177 (1.6%) |
| 40 to 44 Minutes | 581 (4.4%) | 269 (2.4%) |
| 45 to 59 Minutes | 1,992 (15.2%) | 1,033 (9.1%) |
| 60 to 89 Minutes | 1,870 (14.3%) | 879 (7.7%) |
| 90 or more Minutes | 710 (5.4%) | 212 (1.9%) |
Time of Departure to Work by Sex in Walker County
The most frequent times of departure to work in Walker County are 6:00 AM to 6:29 AM (1,636, 12.5%) for males and 7:00 AM to 7:29 AM (1,974, 17.4%) for females.
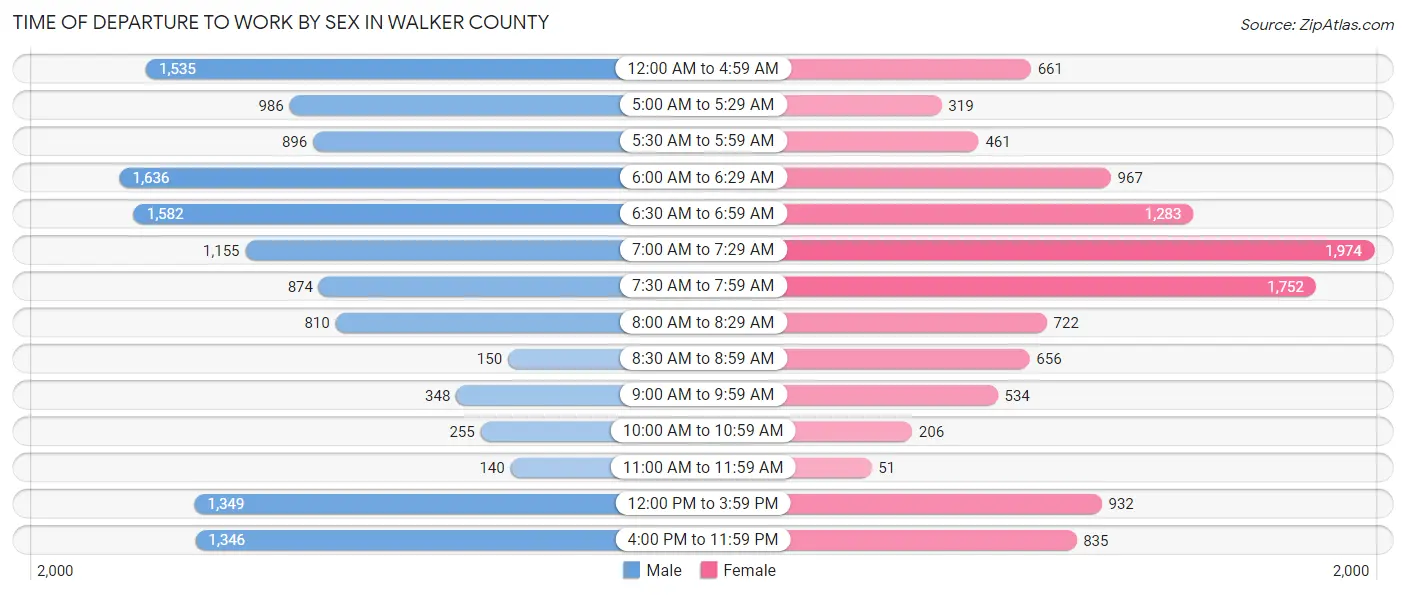
| Time of Departure | Male | Female |
| 12:00 AM to 4:59 AM | 1,535 (11.7%) | 661 (5.8%) |
| 5:00 AM to 5:29 AM | 986 (7.5%) | 319 (2.8%) |
| 5:30 AM to 5:59 AM | 896 (6.9%) | 461 (4.1%) |
| 6:00 AM to 6:29 AM | 1,636 (12.5%) | 967 (8.5%) |
| 6:30 AM to 6:59 AM | 1,582 (12.1%) | 1,283 (11.3%) |
| 7:00 AM to 7:29 AM | 1,155 (8.8%) | 1,974 (17.4%) |
| 7:30 AM to 7:59 AM | 874 (6.7%) | 1,752 (15.4%) |
| 8:00 AM to 8:29 AM | 810 (6.2%) | 722 (6.4%) |
| 8:30 AM to 8:59 AM | 150 (1.1%) | 656 (5.8%) |
| 9:00 AM to 9:59 AM | 348 (2.7%) | 534 (4.7%) |
| 10:00 AM to 10:59 AM | 255 (1.9%) | 206 (1.8%) |
| 11:00 AM to 11:59 AM | 140 (1.1%) | 51 (0.4%) |
| 12:00 PM to 3:59 PM | 1,349 (10.3%) | 932 (8.2%) |
| 4:00 PM to 11:59 PM | 1,346 (10.3%) | 835 (7.3%) |
| Total | 13,062 (100.0%) | 11,353 (100.0%) |
Housing Occupancy in Walker County
Occupancy by Ownership in Walker County
Of the total 24,718 dwellings in Walker County, owner-occupied units account for 19,152 (77.5%), while renter-occupied units make up 5,566 (22.5%).
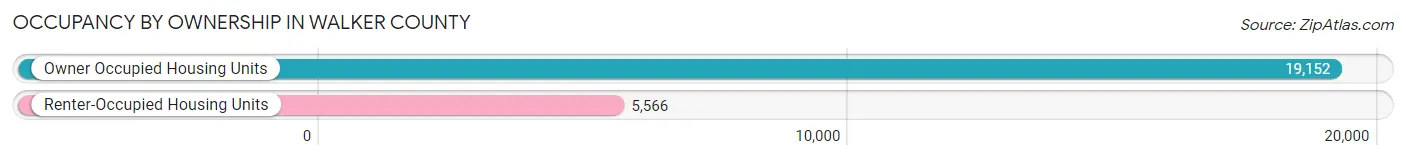
| Occupancy | # Housing Units | % Housing Units |
| Owner Occupied Housing Units | 19,152 | 77.5% |
| Renter-Occupied Housing Units | 5,566 | 22.5% |
| Total Occupied Housing Units | 24,718 | 100.0% |
Occupancy by Household Size in Walker County
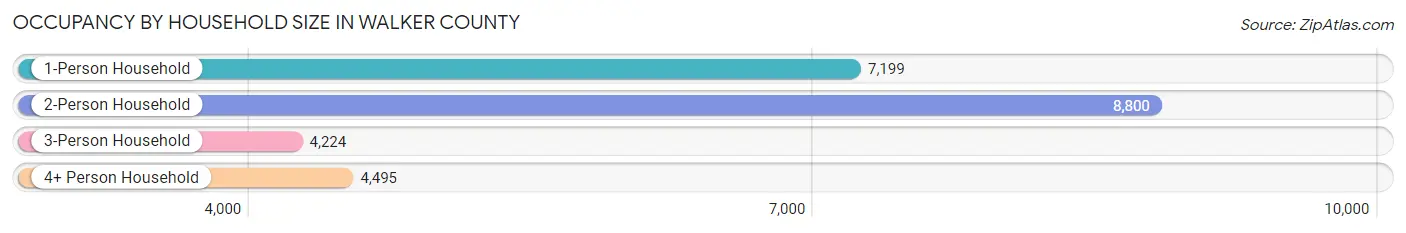
| Household Size | # Housing Units | % Housing Units |
| 1-Person Household | 7,199 | 29.1% |
| 2-Person Household | 8,800 | 35.6% |
| 3-Person Household | 4,224 | 17.1% |
| 4+ Person Household | 4,495 | 18.2% |
| Total Housing Units | 24,718 | 100.0% |
Occupancy by Ownership by Household Size in Walker County
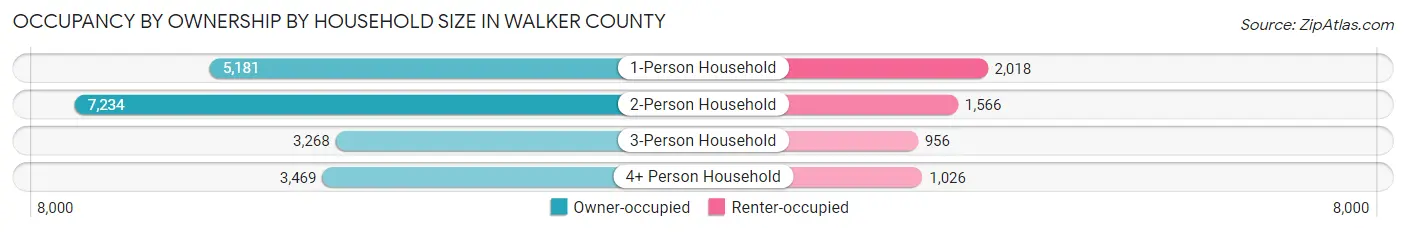
| Household Size | Owner-occupied | Renter-occupied |
| 1-Person Household | 5,181 (72.0%) | 2,018 (28.0%) |
| 2-Person Household | 7,234 (82.2%) | 1,566 (17.8%) |
| 3-Person Household | 3,268 (77.4%) | 956 (22.6%) |
| 4+ Person Household | 3,469 (77.2%) | 1,026 (22.8%) |
| Total Housing Units | 19,152 (77.5%) | 5,566 (22.5%) |
Occupancy by Educational Attainment in Walker County
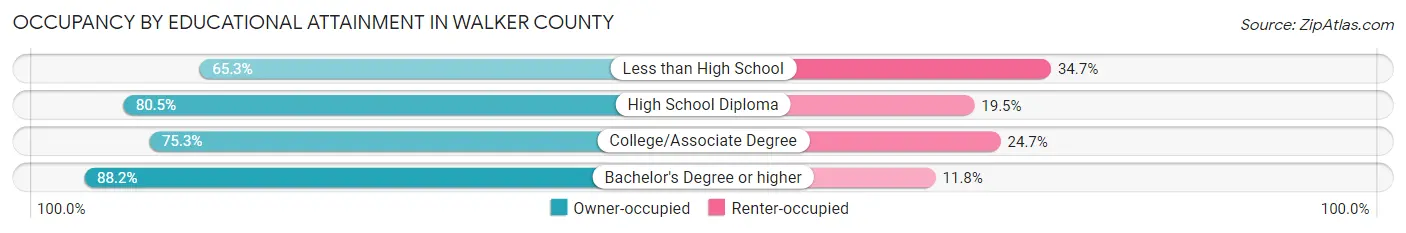
| Household Size | Owner-occupied | Renter-occupied |
| Less than High School | 2,607 (65.3%) | 1,383 (34.7%) |
| High School Diploma | 6,838 (80.5%) | 1,653 (19.5%) |
| College/Associate Degree | 6,362 (75.3%) | 2,083 (24.7%) |
| Bachelor's Degree or higher | 3,345 (88.2%) | 447 (11.8%) |
Occupancy by Age of Householder in Walker County
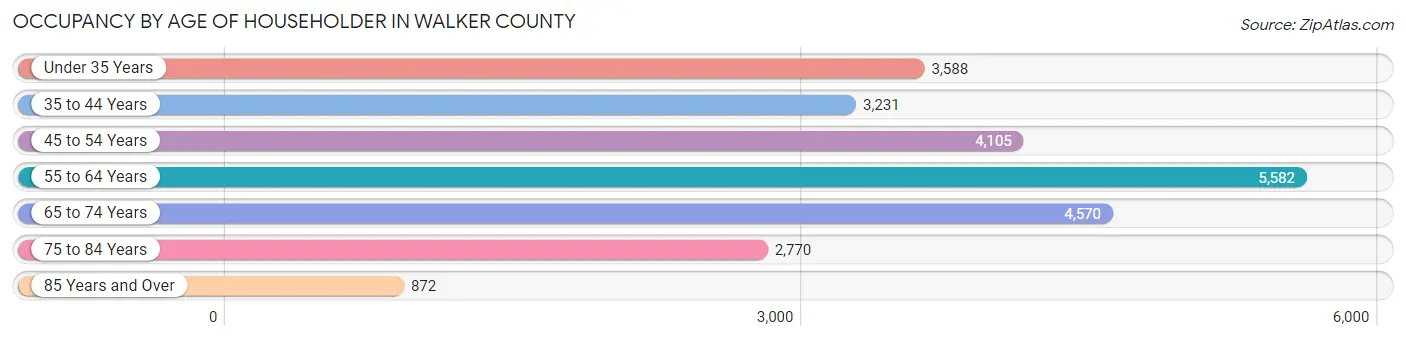
| Age Bracket | # Households | % Households |
| Under 35 Years | 3,588 | 14.5% |
| 35 to 44 Years | 3,231 | 13.1% |
| 45 to 54 Years | 4,105 | 16.6% |
| 55 to 64 Years | 5,582 | 22.6% |
| 65 to 74 Years | 4,570 | 18.5% |
| 75 to 84 Years | 2,770 | 11.2% |
| 85 Years and Over | 872 | 3.5% |
| Total | 24,718 | 100.0% |
Housing Finances in Walker County
Median Income by Occupancy in Walker County
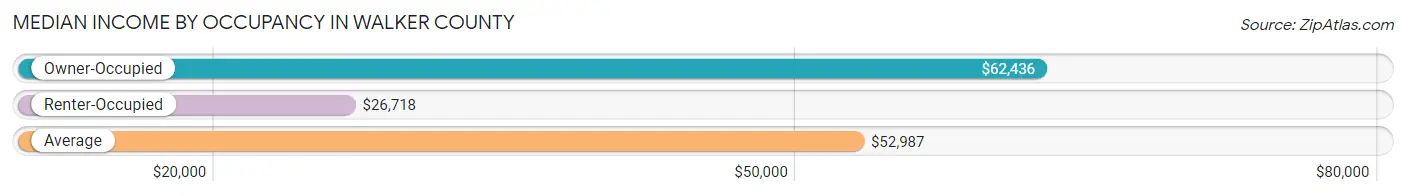
| Occupancy Type | # Households | Median Income |
| Owner-Occupied | 19,152 (77.5%) | $62,436 |
| Renter-Occupied | 5,566 (22.5%) | $26,718 |
| Average | 24,718 (100.0%) | $52,987 |
Occupancy by Householder Income Bracket in Walker County
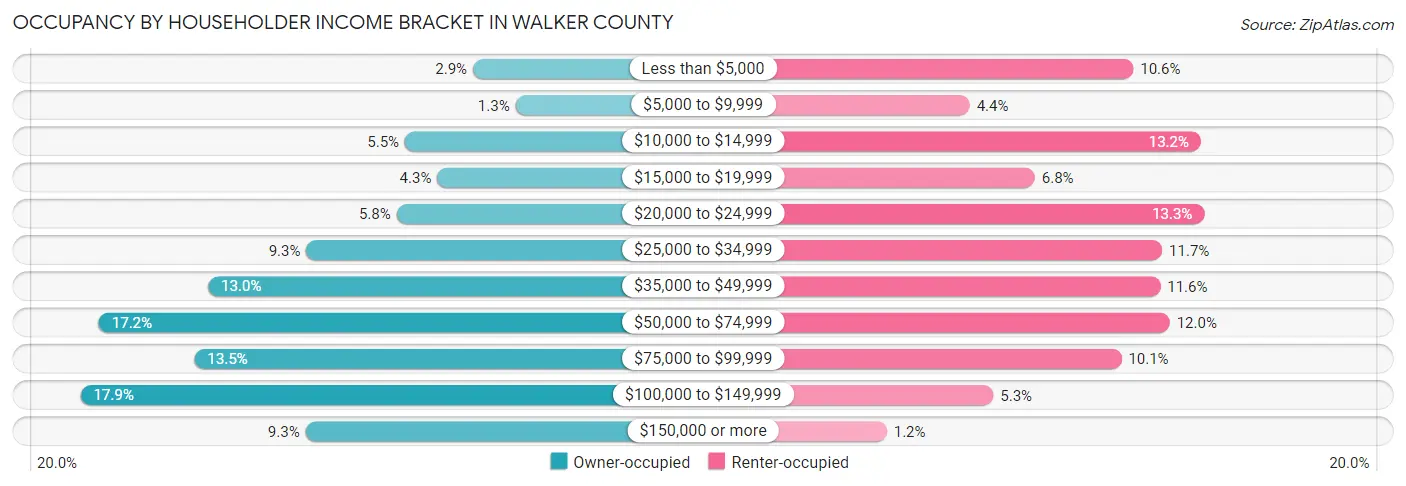
| Income Bracket | Owner-occupied | Renter-occupied |
| Less than $5,000 | 560 (2.9%) | 589 (10.6%) |
| $5,000 to $9,999 | 249 (1.3%) | 242 (4.3%) |
| $10,000 to $14,999 | 1,056 (5.5%) | 732 (13.2%) |
| $15,000 to $19,999 | 820 (4.3%) | 380 (6.8%) |
| $20,000 to $24,999 | 1,117 (5.8%) | 739 (13.3%) |
| $25,000 to $34,999 | 1,775 (9.3%) | 650 (11.7%) |
| $35,000 to $49,999 | 2,491 (13.0%) | 646 (11.6%) |
| $50,000 to $74,999 | 3,288 (17.2%) | 666 (12.0%) |
| $75,000 to $99,999 | 2,592 (13.5%) | 564 (10.1%) |
| $100,000 to $149,999 | 3,422 (17.9%) | 292 (5.2%) |
| $150,000 or more | 1,782 (9.3%) | 66 (1.2%) |
| Total | 19,152 (100.0%) | 5,566 (100.0%) |
Monthly Housing Cost Tiers in Walker County
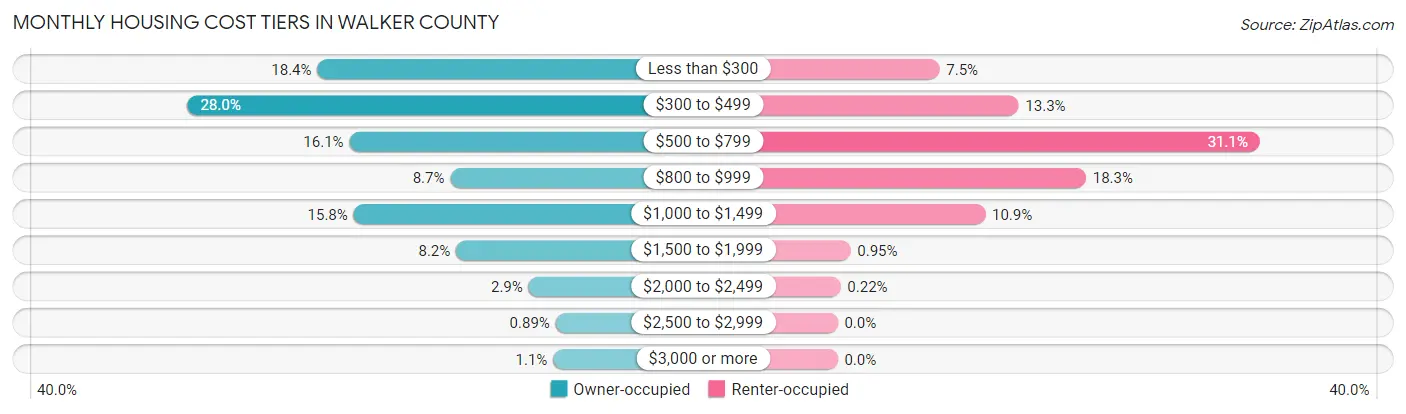
| Monthly Cost | Owner-occupied | Renter-occupied |
| Less than $300 | 3,531 (18.4%) | 418 (7.5%) |
| $300 to $499 | 5,363 (28.0%) | 742 (13.3%) |
| $500 to $799 | 3,080 (16.1%) | 1,731 (31.1%) |
| $800 to $999 | 1,657 (8.6%) | 1,018 (18.3%) |
| $1,000 to $1,499 | 3,021 (15.8%) | 605 (10.9%) |
| $1,500 to $1,999 | 1,575 (8.2%) | 53 (0.9%) |
| $2,000 to $2,499 | 551 (2.9%) | 12 (0.2%) |
| $2,500 to $2,999 | 170 (0.9%) | 0 (0.0%) |
| $3,000 or more | 204 (1.1%) | 0 (0.0%) |
| Total | 19,152 (100.0%) | 5,566 (100.0%) |
Physical Housing Characteristics in Walker County
Housing Structures in Walker County
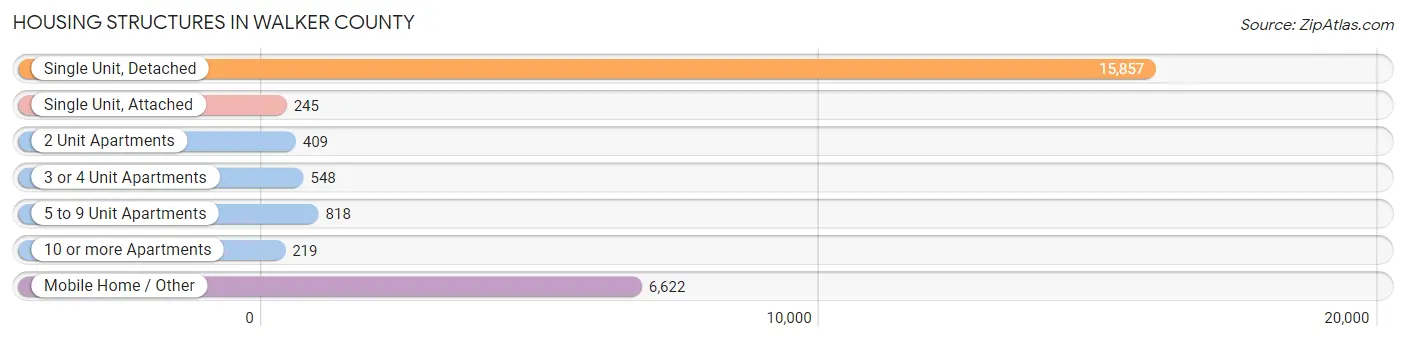
| Structure Type | # Housing Units | % Housing Units |
| Single Unit, Detached | 15,857 | 64.1% |
| Single Unit, Attached | 245 | 1.0% |
| 2 Unit Apartments | 409 | 1.7% |
| 3 or 4 Unit Apartments | 548 | 2.2% |
| 5 to 9 Unit Apartments | 818 | 3.3% |
| 10 or more Apartments | 219 | 0.9% |
| Mobile Home / Other | 6,622 | 26.8% |
| Total | 24,718 | 100.0% |
Housing Structures by Occupancy in Walker County
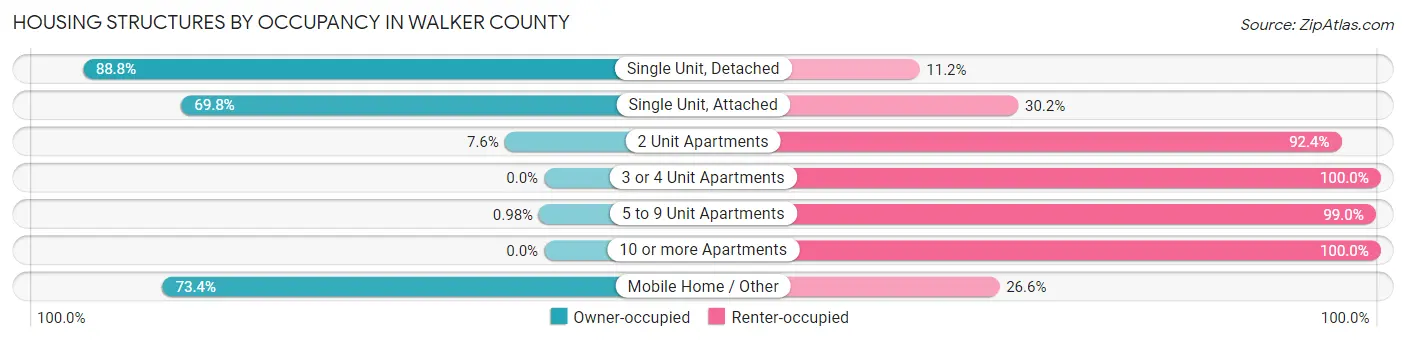
| Structure Type | Owner-occupied | Renter-occupied |
| Single Unit, Detached | 14,080 (88.8%) | 1,777 (11.2%) |
| Single Unit, Attached | 171 (69.8%) | 74 (30.2%) |
| 2 Unit Apartments | 31 (7.6%) | 378 (92.4%) |
| 3 or 4 Unit Apartments | 0 (0.0%) | 548 (100.0%) |
| 5 to 9 Unit Apartments | 8 (1.0%) | 810 (99.0%) |
| 10 or more Apartments | 0 (0.0%) | 219 (100.0%) |
| Mobile Home / Other | 4,862 (73.4%) | 1,760 (26.6%) |
| Total | 19,152 (77.5%) | 5,566 (22.5%) |
Housing Structures by Number of Rooms in Walker County
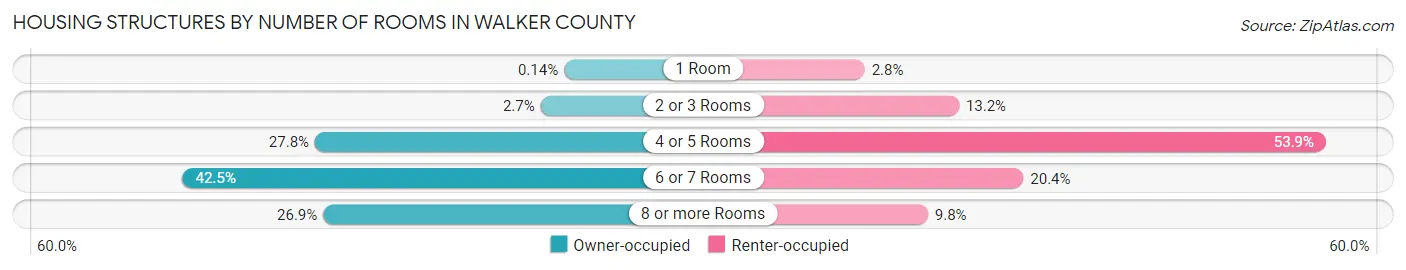
| Number of Rooms | Owner-occupied | Renter-occupied |
| 1 Room | 27 (0.1%) | 153 (2.8%) |
| 2 or 3 Rooms | 524 (2.7%) | 735 (13.2%) |
| 4 or 5 Rooms | 5,321 (27.8%) | 3,002 (53.9%) |
| 6 or 7 Rooms | 8,134 (42.5%) | 1,133 (20.4%) |
| 8 or more Rooms | 5,146 (26.9%) | 543 (9.8%) |
| Total | 19,152 (100.0%) | 5,566 (100.0%) |
Housing Structure by Heating Type in Walker County
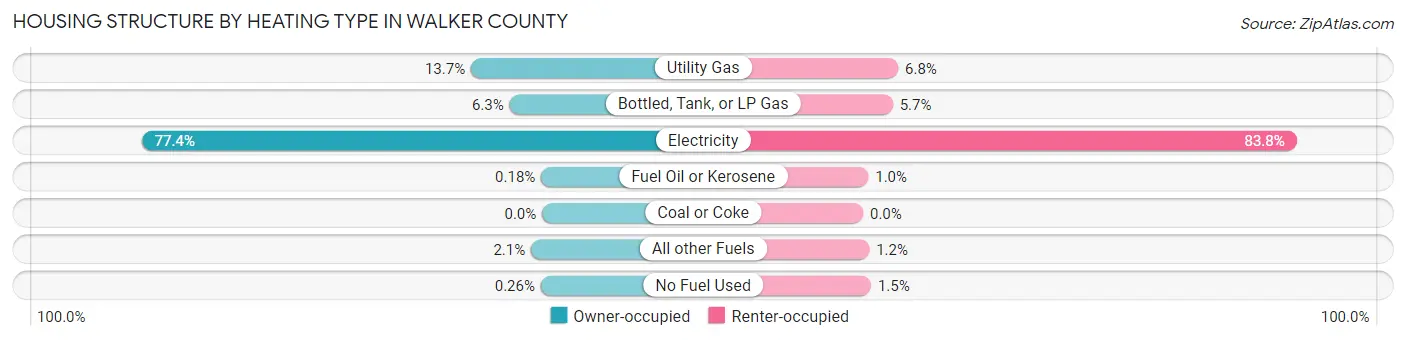
| Heating Type | Owner-occupied | Renter-occupied |
| Utility Gas | 2,632 (13.7%) | 377 (6.8%) |
| Bottled, Tank, or LP Gas | 1,205 (6.3%) | 319 (5.7%) |
| Electricity | 14,822 (77.4%) | 4,662 (83.8%) |
| Fuel Oil or Kerosene | 34 (0.2%) | 56 (1.0%) |
| Coal or Coke | 0 (0.0%) | 0 (0.0%) |
| All other Fuels | 409 (2.1%) | 67 (1.2%) |
| No Fuel Used | 50 (0.3%) | 85 (1.5%) |
| Total | 19,152 (100.0%) | 5,566 (100.0%) |
Household Vehicle Usage in Walker County
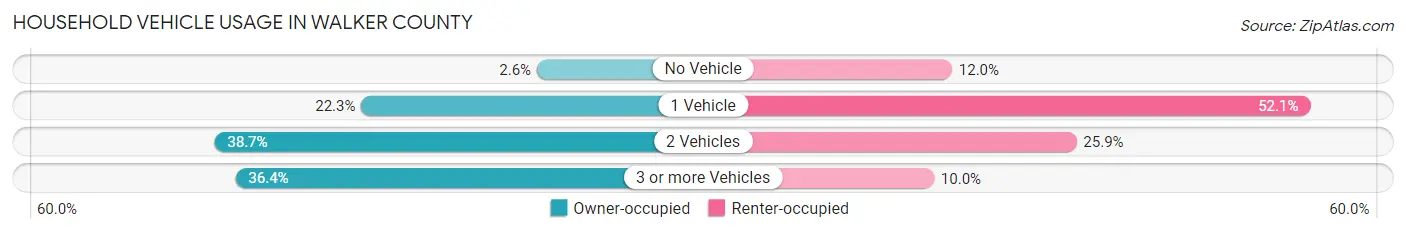
| Vehicles per Household | Owner-occupied | Renter-occupied |
| No Vehicle | 499 (2.6%) | 667 (12.0%) |
| 1 Vehicle | 4,267 (22.3%) | 2,901 (52.1%) |
| 2 Vehicles | 7,419 (38.7%) | 1,443 (25.9%) |
| 3 or more Vehicles | 6,967 (36.4%) | 555 (10.0%) |
| Total | 19,152 (100.0%) | 5,566 (100.0%) |
Real Estate & Mortgages in Walker County
Real Estate and Mortgage Overview in Walker County
| Characteristic | Without Mortgage | With Mortgage |
| Housing Units | 11,108 | 8,044 |
| Median Property Value | $106,300 | $156,100 |
| Median Household Income | $47,316 | $1,094 |
| Monthly Housing Costs | $373 | $204 |
| Real Estate Taxes | $267 | $1,120 |
Property Value by Mortgage Status in Walker County
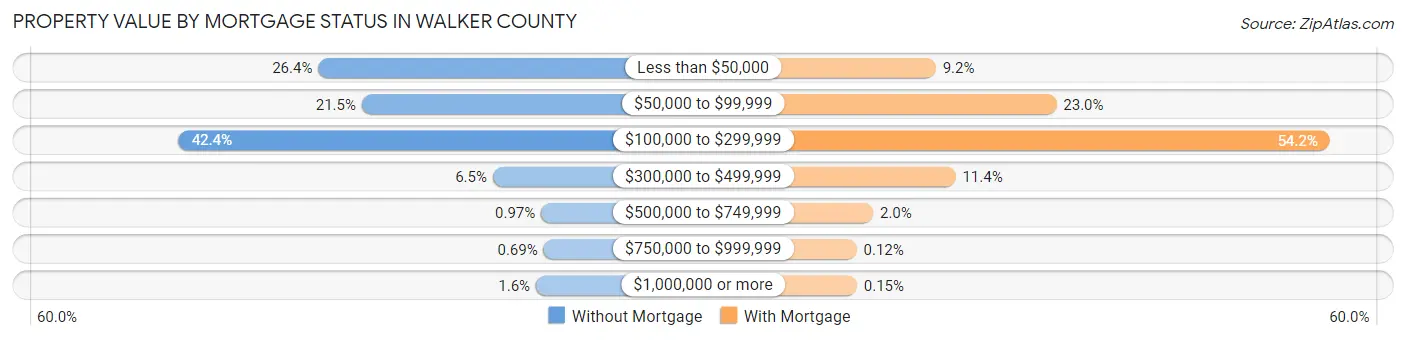
| Property Value | Without Mortgage | With Mortgage |
| Less than $50,000 | 2,937 (26.4%) | 737 (9.2%) |
| $50,000 to $99,999 | 2,384 (21.5%) | 1,846 (23.0%) |
| $100,000 to $299,999 | 4,708 (42.4%) | 4,359 (54.2%) |
| $300,000 to $499,999 | 721 (6.5%) | 919 (11.4%) |
| $500,000 to $749,999 | 108 (1.0%) | 161 (2.0%) |
| $750,000 to $999,999 | 77 (0.7%) | 10 (0.1%) |
| $1,000,000 or more | 173 (1.6%) | 12 (0.2%) |
| Total | 11,108 (100.0%) | 8,044 (100.0%) |
Household Income by Mortgage Status in Walker County
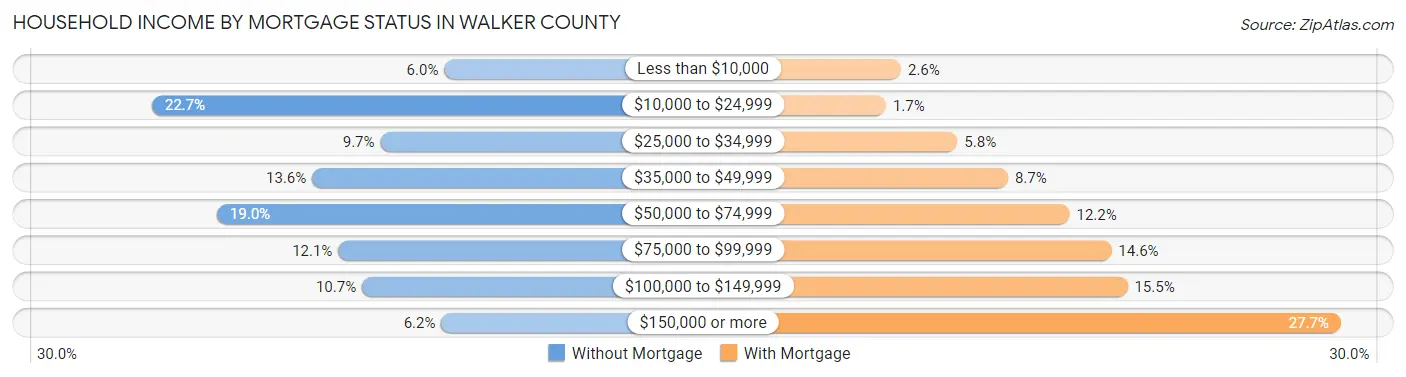
| Household Income | Without Mortgage | With Mortgage |
| Less than $10,000 | 669 (6.0%) | 209 (2.6%) |
| $10,000 to $24,999 | 2,525 (22.7%) | 140 (1.7%) |
| $25,000 to $34,999 | 1,074 (9.7%) | 468 (5.8%) |
| $35,000 to $49,999 | 1,507 (13.6%) | 701 (8.7%) |
| $50,000 to $74,999 | 2,112 (19.0%) | 984 (12.2%) |
| $75,000 to $99,999 | 1,342 (12.1%) | 1,176 (14.6%) |
| $100,000 to $149,999 | 1,191 (10.7%) | 1,250 (15.5%) |
| $150,000 or more | 688 (6.2%) | 2,231 (27.7%) |
| Total | 11,108 (100.0%) | 8,044 (100.0%) |
Property Value to Household Income Ratio in Walker County
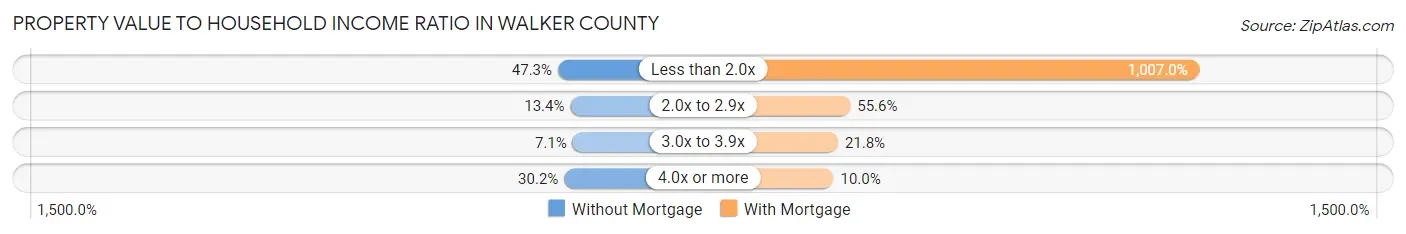
| Value-to-Income Ratio | Without Mortgage | With Mortgage |
| Less than 2.0x | 5,259 (47.3%) | 81,005 (1,007.0%) |
| 2.0x to 2.9x | 1,489 (13.4%) | 4,472 (55.6%) |
| 3.0x to 3.9x | 790 (7.1%) | 1,757 (21.8%) |
| 4.0x or more | 3,353 (30.2%) | 800 (10.0%) |
| Total | 11,108 (100.0%) | 8,044 (100.0%) |
Real Estate Taxes by Mortgage Status in Walker County
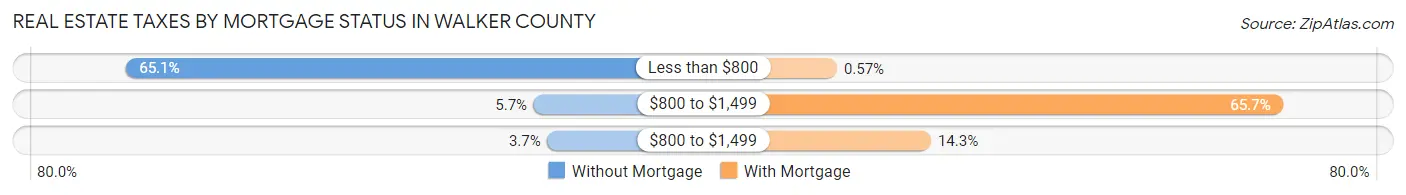
| Property Taxes | Without Mortgage | With Mortgage |
| Less than $800 | 7,235 (65.1%) | 46 (0.6%) |
| $800 to $1,499 | 635 (5.7%) | 5,283 (65.7%) |
| $800 to $1,499 | 414 (3.7%) | 1,151 (14.3%) |
| Total | 11,108 (100.0%) | 8,044 (100.0%) |
Health & Disability in Walker County
Health Insurance Coverage by Age in Walker County
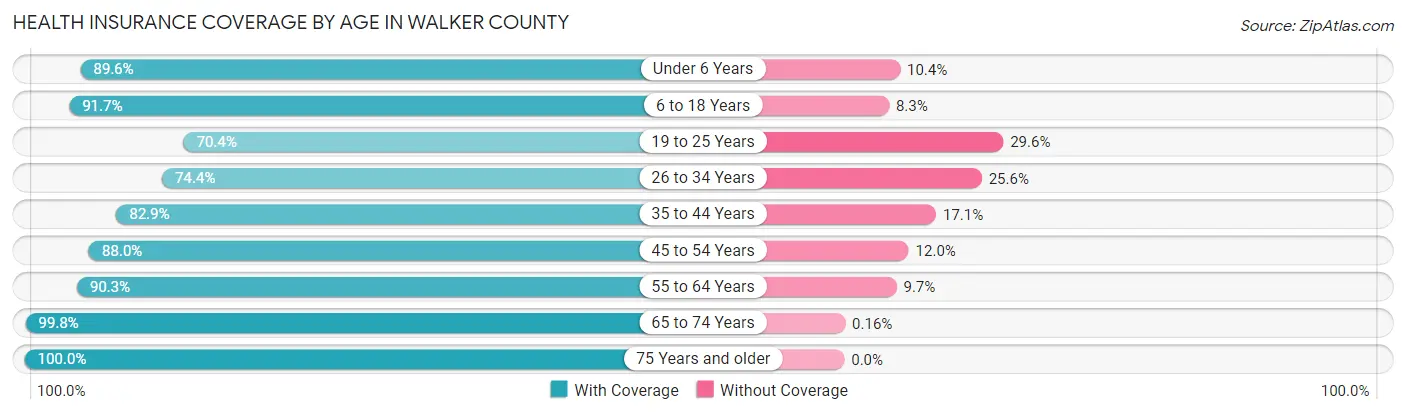
| Age Bracket | With Coverage | Without Coverage |
| Under 6 Years | 4,241 (89.6%) | 492 (10.4%) |
| 6 to 18 Years | 9,537 (91.7%) | 867 (8.3%) |
| 19 to 25 Years | 3,704 (70.4%) | 1,560 (29.6%) |
| 26 to 34 Years | 5,161 (74.4%) | 1,779 (25.6%) |
| 35 to 44 Years | 5,955 (82.9%) | 1,229 (17.1%) |
| 45 to 54 Years | 7,138 (88.0%) | 973 (12.0%) |
| 55 to 64 Years | 8,165 (90.3%) | 881 (9.7%) |
| 65 to 74 Years | 7,377 (99.8%) | 12 (0.2%) |
| 75 Years and older | 5,081 (100.0%) | 0 (0.0%) |
| Total | 56,359 (87.8%) | 7,793 (12.1%) |
Health Insurance Coverage by Citizenship Status in Walker County
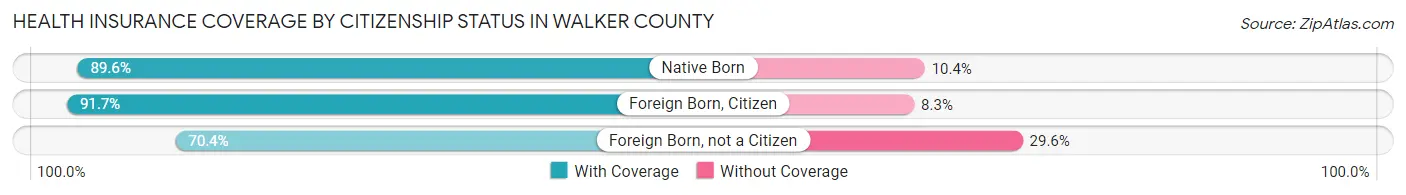
| Citizenship Status | With Coverage | Without Coverage |
| Native Born | 4,241 (89.6%) | 492 (10.4%) |
| Foreign Born, Citizen | 9,537 (91.7%) | 867 (8.3%) |
| Foreign Born, not a Citizen | 3,704 (70.4%) | 1,560 (29.6%) |
Health Insurance Coverage by Household Income in Walker County
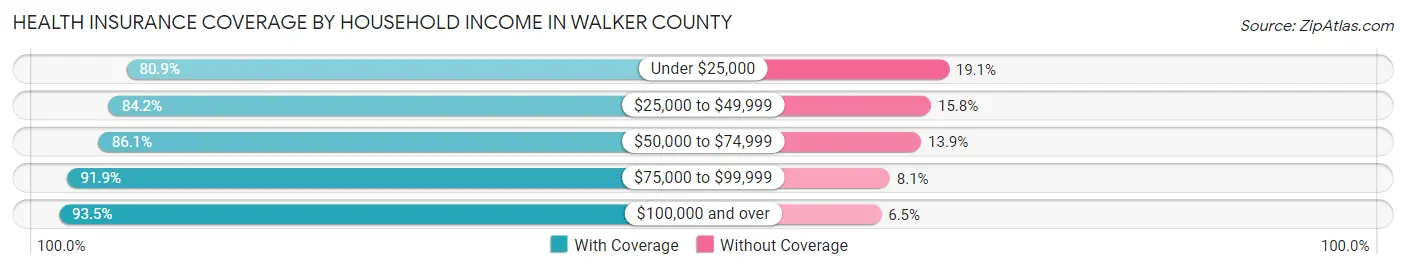
| Household Income | With Coverage | Without Coverage |
| Under $25,000 | 9,486 (80.9%) | 2,241 (19.1%) |
| $25,000 to $49,999 | 10,686 (84.2%) | 2,003 (15.8%) |
| $50,000 to $74,999 | 9,611 (86.1%) | 1,554 (13.9%) |
| $75,000 to $99,999 | 8,608 (91.9%) | 756 (8.1%) |
| $100,000 and over | 17,731 (93.5%) | 1,225 (6.5%) |
Public vs Private Health Insurance Coverage by Age in Walker County
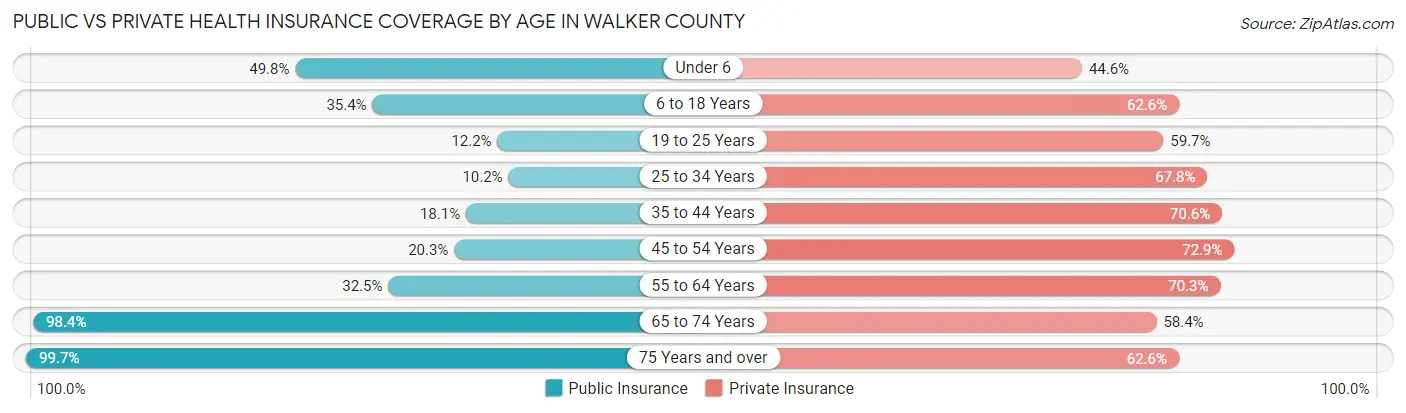
| Age Bracket | Public Insurance | Private Insurance |
| Under 6 | 2,355 (49.8%) | 2,110 (44.6%) |
| 6 to 18 Years | 3,686 (35.4%) | 6,512 (62.6%) |
| 19 to 25 Years | 644 (12.2%) | 3,142 (59.7%) |
| 25 to 34 Years | 707 (10.2%) | 4,708 (67.8%) |
| 35 to 44 Years | 1,298 (18.1%) | 5,071 (70.6%) |
| 45 to 54 Years | 1,643 (20.3%) | 5,910 (72.9%) |
| 55 to 64 Years | 2,940 (32.5%) | 6,356 (70.3%) |
| 65 to 74 Years | 7,274 (98.4%) | 4,315 (58.4%) |
| 75 Years and over | 5,066 (99.7%) | 3,178 (62.5%) |
| Total | 25,613 (39.9%) | 41,302 (64.4%) |
Disability Status by Sex by Age in Walker County
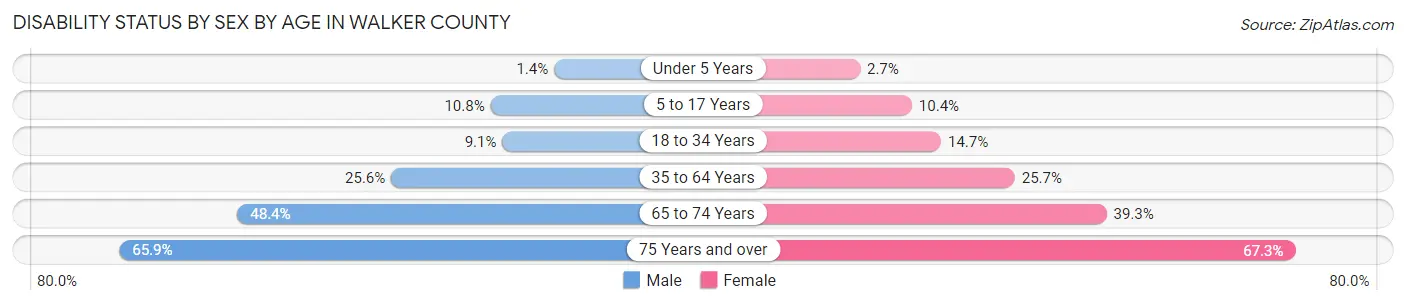
| Age Bracket | Male | Female |
| Under 5 Years | 28 (1.4%) | 45 (2.7%) |
| 5 to 17 Years | 608 (10.8%) | 528 (10.4%) |
| 18 to 34 Years | 597 (9.1%) | 940 (14.7%) |
| 35 to 64 Years | 3,041 (25.6%) | 3,199 (25.7%) |
| 65 to 74 Years | 1,647 (48.4%) | 1,567 (39.3%) |
| 75 Years and over | 1,368 (65.9%) | 2,024 (67.3%) |
Disability Class by Sex by Age in Walker County
Disability Class: Hearing Difficulty
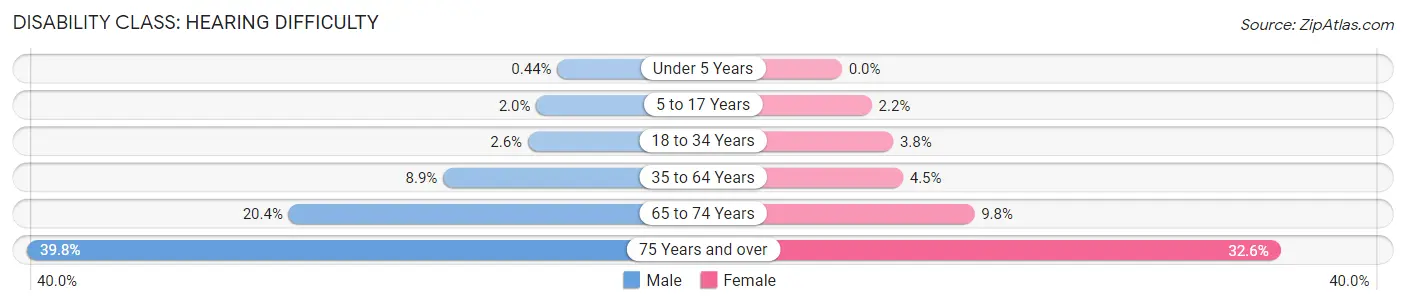
| Age Bracket | Male | Female |
| Under 5 Years | 9 (0.4%) | 0 (0.0%) |
| 5 to 17 Years | 113 (2.0%) | 112 (2.2%) |
| 18 to 34 Years | 173 (2.6%) | 242 (3.8%) |
| 35 to 64 Years | 1,060 (8.9%) | 564 (4.5%) |
| 65 to 74 Years | 694 (20.4%) | 392 (9.8%) |
| 75 Years and over | 826 (39.8%) | 979 (32.6%) |
Disability Class: Vision Difficulty
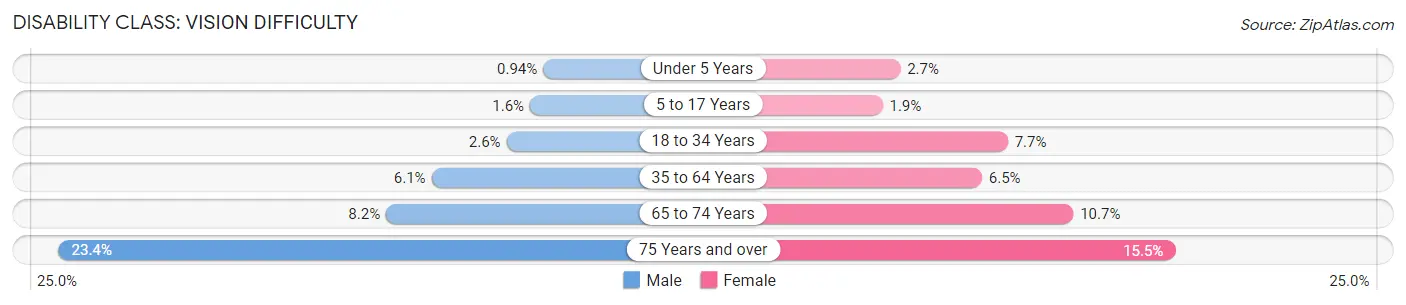
| Age Bracket | Male | Female |
| Under 5 Years | 19 (0.9%) | 45 (2.7%) |
| 5 to 17 Years | 87 (1.5%) | 96 (1.9%) |
| 18 to 34 Years | 174 (2.6%) | 491 (7.7%) |
| 35 to 64 Years | 728 (6.1%) | 810 (6.5%) |
| 65 to 74 Years | 280 (8.2%) | 428 (10.7%) |
| 75 Years and over | 486 (23.4%) | 465 (15.5%) |
Disability Class: Cognitive Difficulty
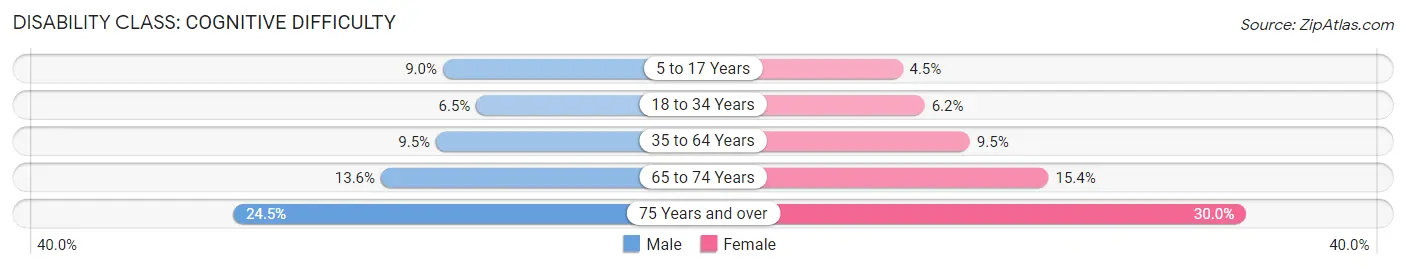
| Age Bracket | Male | Female |
| 5 to 17 Years | 503 (8.9%) | 229 (4.5%) |
| 18 to 34 Years | 426 (6.5%) | 393 (6.2%) |
| 35 to 64 Years | 1,125 (9.5%) | 1,184 (9.5%) |
| 65 to 74 Years | 461 (13.6%) | 612 (15.3%) |
| 75 Years and over | 509 (24.5%) | 902 (30.0%) |
Disability Class: Ambulatory Difficulty
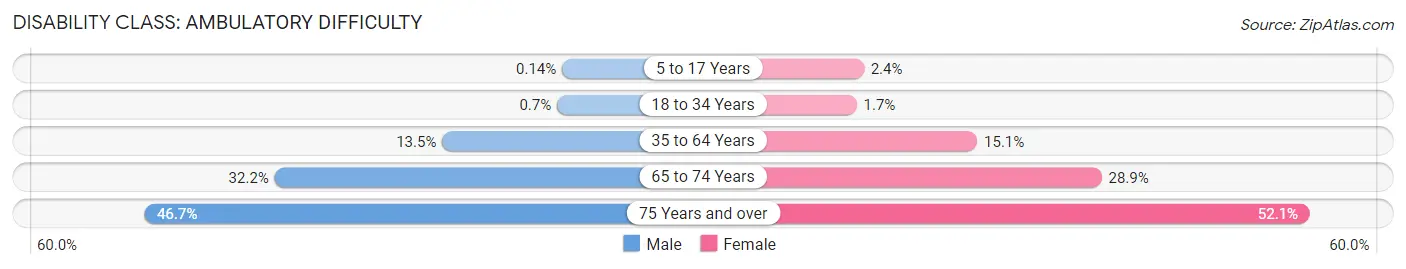
| Age Bracket | Male | Female |
| 5 to 17 Years | 8 (0.1%) | 124 (2.4%) |
| 18 to 34 Years | 46 (0.7%) | 105 (1.7%) |
| 35 to 64 Years | 1,604 (13.5%) | 1,876 (15.1%) |
| 65 to 74 Years | 1,094 (32.2%) | 1,153 (28.9%) |
| 75 Years and over | 969 (46.7%) | 1,567 (52.1%) |
Disability Class: Self-Care Difficulty
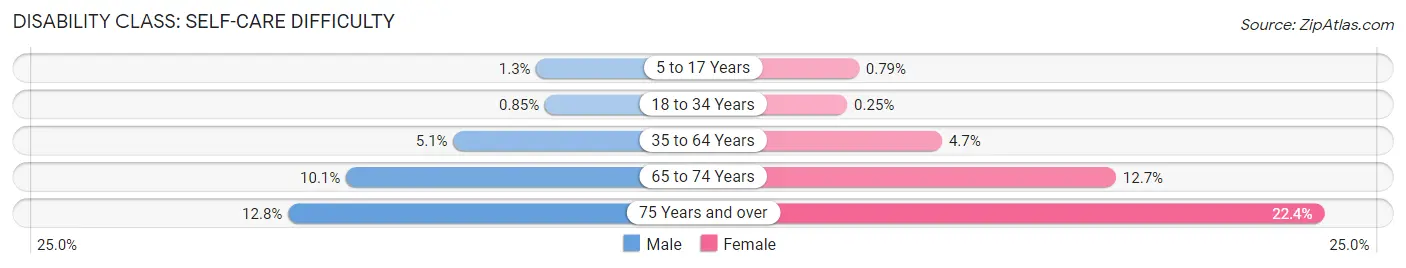
| Age Bracket | Male | Female |
| 5 to 17 Years | 70 (1.3%) | 40 (0.8%) |
| 18 to 34 Years | 56 (0.9%) | 16 (0.3%) |
| 35 to 64 Years | 606 (5.1%) | 579 (4.6%) |
| 65 to 74 Years | 343 (10.1%) | 507 (12.7%) |
| 75 Years and over | 265 (12.8%) | 673 (22.4%) |
Technology Access in Walker County
Computing Device Access in Walker County
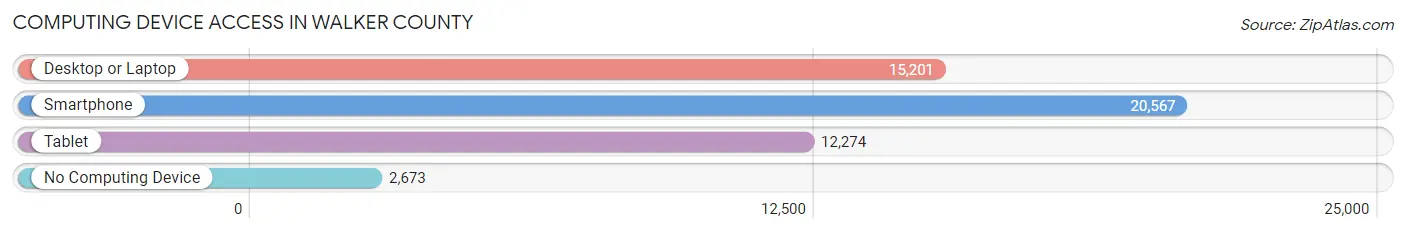
| Device Type | # Households | % Households |
| Desktop or Laptop | 15,201 | 61.5% |
| Smartphone | 20,567 | 83.2% |
| Tablet | 12,274 | 49.7% |
| No Computing Device | 2,673 | 10.8% |
| Total | 24,718 | 100.0% |
Internet Access in Walker County
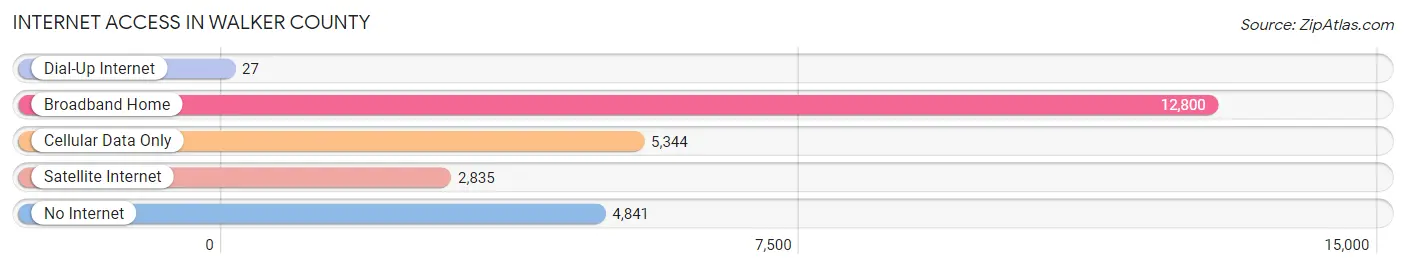
| Internet Type | # Households | % Households |
| Dial-Up Internet | 27 | 0.1% |
| Broadband Home | 12,800 | 51.8% |
| Cellular Data Only | 5,344 | 21.6% |
| Satellite Internet | 2,835 | 11.5% |
| No Internet | 4,841 | 19.6% |
| Total | 24,718 | 100.0% |
Walker County Summary
History
Walker County, Alabama is located in the northwest corner of the state and is part of the Birmingham-Hoover Metropolitan Statistical Area. The county was created in 1823 from parts of Marion and Tuscaloosa counties and was named for John Williams Walker, a United States Senator from Alabama. The county seat is Jasper, which was founded in 1815 and is the largest city in the county.
The area that is now Walker County was originally inhabited by the Cherokee and Creek Native American tribes. The first European settlers arrived in the area in the early 1800s, and the county was officially established in 1823. The county was largely agricultural, with cotton being the main crop. The county also had several coal mines, which provided jobs for many of the residents.
During the Civil War, Walker County was a Confederate stronghold. The county was the site of several battles, including the Battle of Day’s Gap in April 1862. After the war, the county’s economy shifted from agriculture to industry, with coal mining becoming the primary industry. The county also had several iron and steel mills, which provided jobs for many of the residents.
Geography
Walker County is located in the northwest corner of Alabama and is bordered by Marion County to the east, Winston County to the north, Fayette County to the west, and Tuscaloosa County to the south. The county covers an area of 576 square miles and is home to a population of 67,814 people, as of the 2020 census.
The terrain of Walker County is mostly hilly, with the highest point being Mount Cheaha, which has an elevation of 2,407 feet. The county is drained by the Black Warrior River and its tributaries, including the Sipsey Fork, Mulberry Fork, and Town Creek. The county also has several lakes, including Lewis Smith Lake, which is the largest lake in the county.
Economy
Walker County’s economy is largely based on manufacturing and mining. The county is home to several manufacturing plants, including a steel mill, a paper mill, and a chemical plant. The county also has several coal mines, which provide jobs for many of the residents.
The county is also home to several tourist attractions, including the Alabama Mining Museum, the Lewis Smith Lake Dam, and the Bankhead National Forest. The county also has several wineries and vineyards, which attract visitors from all over the state.
Demographics
As of the 2020 census, Walker County had a population of 67,814 people. The racial makeup of the county was 79.2% White, 17.7% Black or African American, 0.4% Native American, 0.7% Asian, 0.1% Pacific Islander, 0.7% from other races, and 1.3% from two or more races. Hispanic or Latino of any race were 2.2% of the population.
The median household income in Walker County was $41,945, and the median family income was $50,945. The per capita income was $20,945. About 17.2% of the population was below the poverty line.
Conclusion
Walker County, Alabama is located in the northwest corner of the state and is part of the Birmingham-Hoover Metropolitan Statistical Area. The county was created in 1823 and is home to a population of 67,814 people, as of the 2020 census. The county’s economy is largely based on manufacturing and mining, with coal mining being the primary industry. The county also has several tourist attractions, including the Alabama Mining Museum, the Lewis Smith Lake Dam, and the Bankhead National Forest. The racial makeup of the county is 79.2% White, 17.7% Black or African American, 0.4% Native American, 0.7% Asian, 0.1% Pacific Islander, 0.7% from other races, and 1.3% from two or more races. The median household income in Walker County was $41,945, and the median family income was $50,945.
Common Questions
What is Per Capita Income in Walker County?
Per Capita income in Walker County is $28,204.
What is the Median Family Income in Walker County?
Median Family Income in Walker County is $68,810.
What is the Median Household income in Walker County?
Median Household Income in Walker County is $52,987.
What is Income or Wage Gap in Walker County?
Income or Wage Gap in Walker County is 35.5%.
Women in Walker County earn 64.5 cents for every dollar earned by a man.
What is Family Income Deficit in Walker County?
Family Income Deficit in Walker County is $10,826.
Families that are below poverty line in Walker County earn $10,826 less on average than the poverty threshold level.
What is Inequality or Gini Index in Walker County?
Inequality or Gini Index in Walker County is 0.45.
What is the Total Population of Walker County?
Total Population of Walker County is 64,978.
What is the Total Male Population of Walker County?
Total Male Population of Walker County is 32,122.
What is the Total Female Population of Walker County?
Total Female Population of Walker County is 32,856.
What is the Ratio of Males per 100 Females in Walker County?
There are 97.77 Males per 100 Females in Walker County.
What is the Ratio of Females per 100 Males in Walker County?
There are 102.29 Females per 100 Males in Walker County.
What is the Median Population Age in Walker County?
Median Population Age in Walker County is 41.8 Years.
What is the Average Family Size in Walker County
Average Family Size in Walker County is 3.1 People.
What is the Average Household Size in Walker County
Average Household Size in Walker County is 2.6 People.
How Large is the Labor Force in Walker County?
There are 27,375 People in the Labor Forcein in Walker County.
What is the Percentage of People in the Labor Force in Walker County?
52.4% of People are in the Labor Force in Walker County.
What is the Unemployment Rate in Walker County?
Unemployment Rate in Walker County is 5.7%.