Phenix City, AL Map & Demographics
Phenix City Map
Phenix City Overview
$28,273
PER CAPITA INCOME
$61,690
AVG FAMILY INCOME
$46,944
AVG HOUSEHOLD INCOME
42.0%
WAGE / INCOME GAP [ % ]
58.0¢/ $1
WAGE / INCOME GAP [ $ ]
0.49
INEQUALITY / GINI INDEX
38,413
TOTAL POPULATION
18,806
MALE POPULATION
19,607
FEMALE POPULATION
95.91
MALES / 100 FEMALES
104.26
FEMALES / 100 MALES
35.9
MEDIAN AGE
3.1
AVG FAMILY SIZE
2.4
AVG HOUSEHOLD SIZE
18,388
LABOR FORCE [ PEOPLE ]
60.8%
PERCENT IN LABOR FORCE
7.1%
UNEMPLOYMENT RATE
Phenix City Area Codes
Income in Phenix City
Income Overview in Phenix City
Per Capita Income in Phenix City is $28,273, while median incomes of families and households are $61,690 and $46,944 respectively.
| Characteristic | Number | Measure |
| Per Capita Income | 38,413 | $28,273 |
| Median Family Income | 9,541 | $61,690 |
| Mean Family Income | 9,541 | $78,411 |
| Median Household Income | 15,852 | $46,944 |
| Mean Household Income | 15,852 | $65,274 |
| Income Deficit | 9,541 | $0 |
| Wage / Income Gap (%) | 38,413 | 42.03% |
| Wage / Income Gap ($) | 38,413 | 57.97¢ per $1 |
| Gini / Inequality Index | 38,413 | 0.49 |
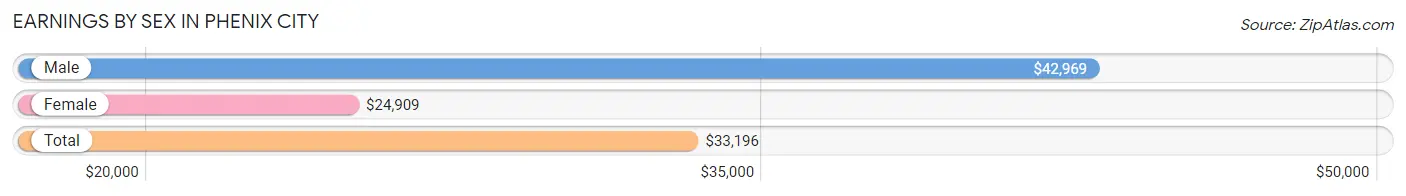
Earnings by Sex in Phenix City
Average Earnings in Phenix City are $33,196, $42,969 for men and $24,909 for women, a difference of 42.0%.
| Sex | Number | Average Earnings |
| Male | 9,472 (50.5%) | $42,969 |
| Female | 9,266 (49.4%) | $24,909 |
| Total | 18,738 (100.0%) | $33,196 |
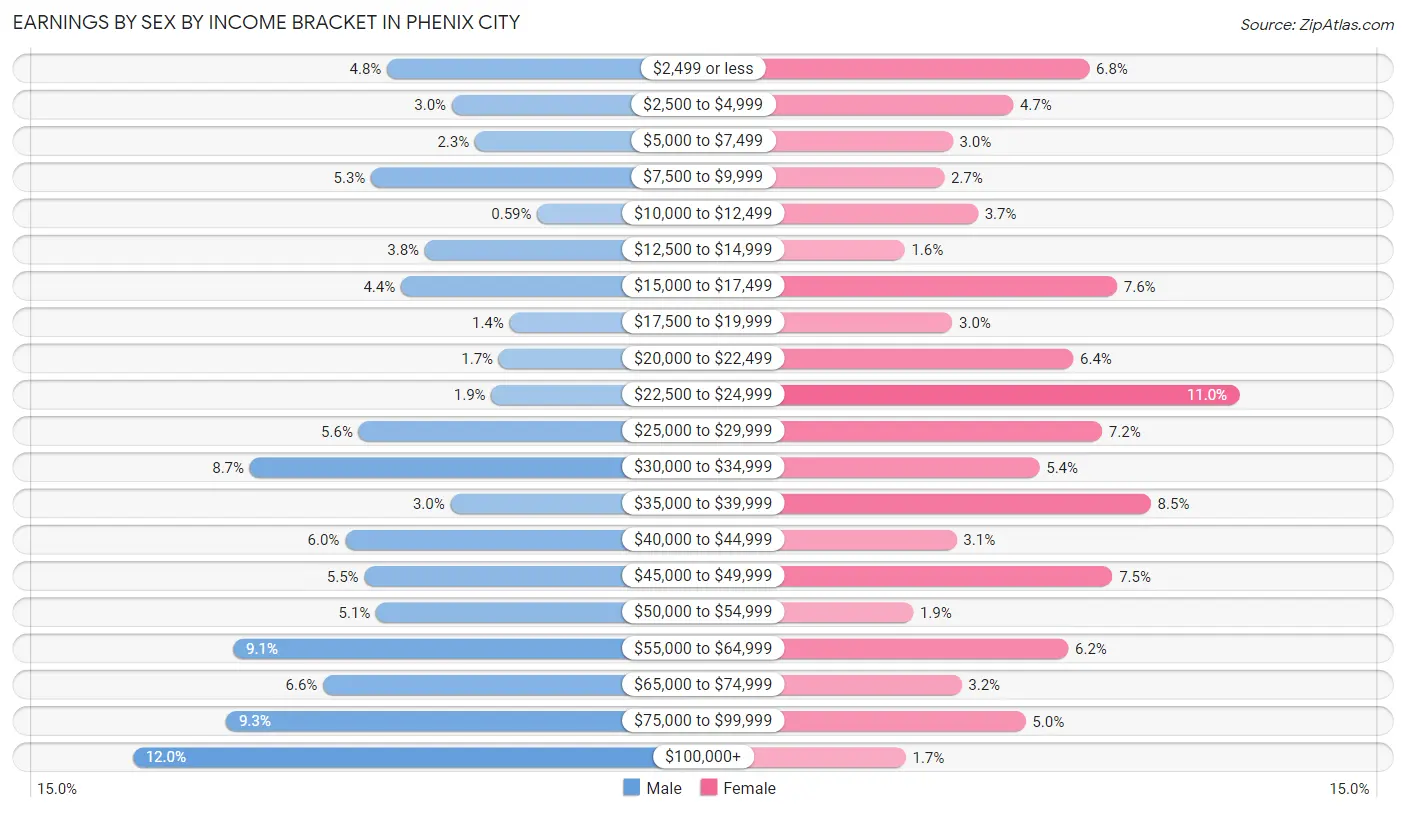
Earnings by Sex by Income Bracket in Phenix City
The most common earnings brackets in Phenix City are $100,000+ for men (1,133 | 12.0%) and $22,500 to $24,999 for women (1,021 | 11.0%).
| Income | Male | Female |
| $2,499 or less | 456 (4.8%) | 631 (6.8%) |
| $2,500 to $4,999 | 283 (3.0%) | 433 (4.7%) |
| $5,000 to $7,499 | 222 (2.3%) | 275 (3.0%) |
| $7,500 to $9,999 | 498 (5.3%) | 253 (2.7%) |
| $10,000 to $12,499 | 56 (0.6%) | 341 (3.7%) |
| $12,500 to $14,999 | 355 (3.7%) | 150 (1.6%) |
| $15,000 to $17,499 | 419 (4.4%) | 703 (7.6%) |
| $17,500 to $19,999 | 130 (1.4%) | 274 (3.0%) |
| $20,000 to $22,499 | 158 (1.7%) | 589 (6.4%) |
| $22,500 to $24,999 | 178 (1.9%) | 1,021 (11.0%) |
| $25,000 to $29,999 | 531 (5.6%) | 664 (7.2%) |
| $30,000 to $34,999 | 821 (8.7%) | 501 (5.4%) |
| $35,000 to $39,999 | 287 (3.0%) | 791 (8.5%) |
| $40,000 to $44,999 | 567 (6.0%) | 285 (3.1%) |
| $45,000 to $49,999 | 516 (5.4%) | 691 (7.5%) |
| $50,000 to $54,999 | 485 (5.1%) | 172 (1.9%) |
| $55,000 to $64,999 | 866 (9.1%) | 576 (6.2%) |
| $65,000 to $74,999 | 626 (6.6%) | 298 (3.2%) |
| $75,000 to $99,999 | 885 (9.3%) | 465 (5.0%) |
| $100,000+ | 1,133 (12.0%) | 153 (1.7%) |
| Total | 9,472 (100.0%) | 9,266 (100.0%) |
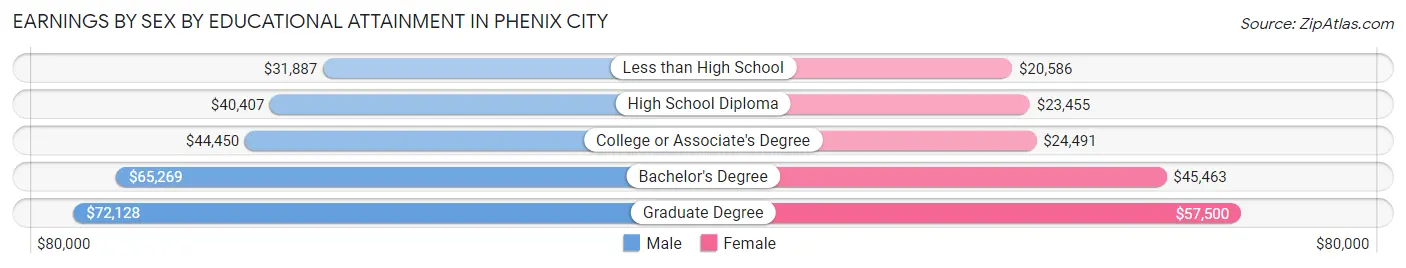
Earnings by Sex by Educational Attainment in Phenix City
Average earnings in Phenix City are $47,590 for men and $28,764 for women, a difference of 39.6%. Men with an educational attainment of graduate degree enjoy the highest average annual earnings of $72,128, while those with less than high school education earn the least with $31,887. Women with an educational attainment of graduate degree earn the most with the average annual earnings of $57,500, while those with less than high school education have the smallest earnings of $20,586.
| Educational Attainment | Male Income | Female Income |
| Less than High School | $31,887 | $20,586 |
| High School Diploma | $40,407 | $23,455 |
| College or Associate's Degree | $44,450 | $24,491 |
| Bachelor's Degree | $65,269 | $45,463 |
| Graduate Degree | $72,128 | $57,500 |
| Total | $47,590 | $28,764 |
Family Income in Phenix City
Family Income Brackets in Phenix City
According to the Phenix City family income data, there are 1,832 families falling into the $50,000 to $74,999 income range, which is the most common income bracket and makes up 19.2% of all families. Conversely, the $10,000 to $14,999 income bracket is the least frequent group with only 401 families (4.2%) belonging to this category.
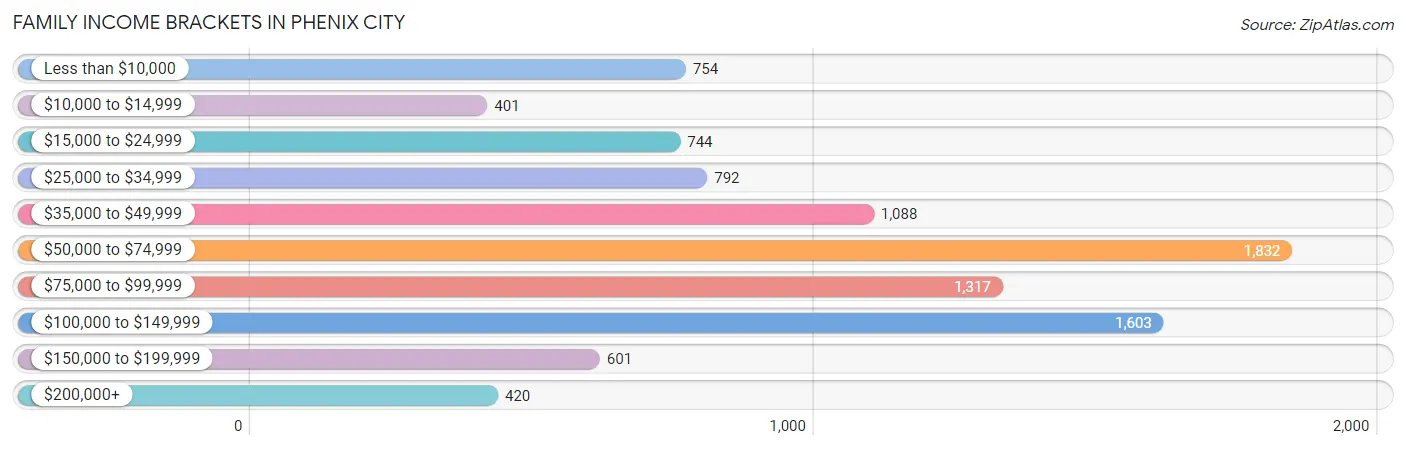
| Income Bracket | # Families | % Families |
| Less than $10,000 | 754 | 7.9% |
| $10,000 to $14,999 | 401 | 4.2% |
| $15,000 to $24,999 | 744 | 7.8% |
| $25,000 to $34,999 | 792 | 8.3% |
| $35,000 to $49,999 | 1,088 | 11.4% |
| $50,000 to $74,999 | 1,832 | 19.2% |
| $75,000 to $99,999 | 1,317 | 13.8% |
| $100,000 to $149,999 | 1,603 | 16.8% |
| $150,000 to $199,999 | 601 | 6.3% |
| $200,000+ | 420 | 4.4% |
Family Income by Famaliy Size in Phenix City
6-person families (110 | 1.1%) account for the highest median family income in Phenix City with $95,978 per family, while 2-person families (4,630 | 48.5%) have the highest median income of $29,640 per family member.
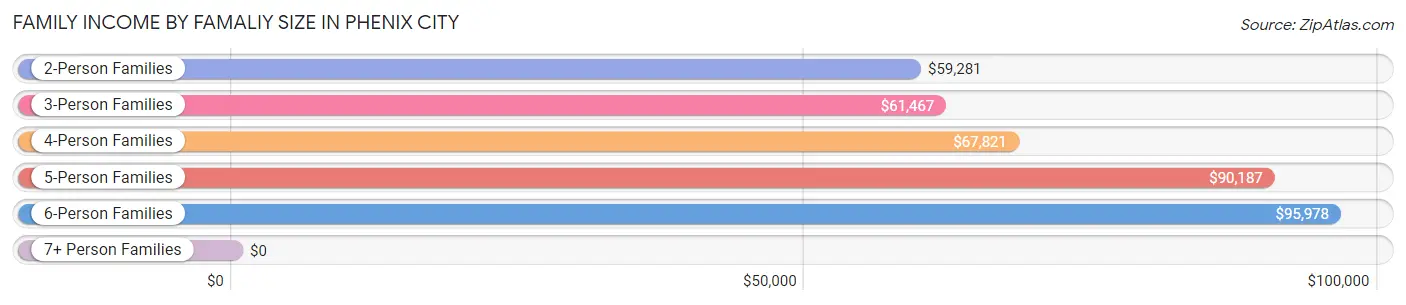
| Income Bracket | # Families | Median Income |
| 2-Person Families | 4,630 (48.5%) | $59,281 |
| 3-Person Families | 2,553 (26.8%) | $61,467 |
| 4-Person Families | 1,614 (16.9%) | $67,821 |
| 5-Person Families | 618 (6.5%) | $90,187 |
| 6-Person Families | 110 (1.1%) | $95,978 |
| 7+ Person Families | 16 (0.2%) | $0 |
| Total | 9,541 (100.0%) | $61,690 |
Family Income by Number of Earners in Phenix City
The median family income in Phenix City is $61,690, with families comprising 3+ earners (628) having the highest median family income of $108,958, while families with no earners (1,702) have the lowest median family income of $30,500, accounting for 6.6% and 17.8% of families, respectively.
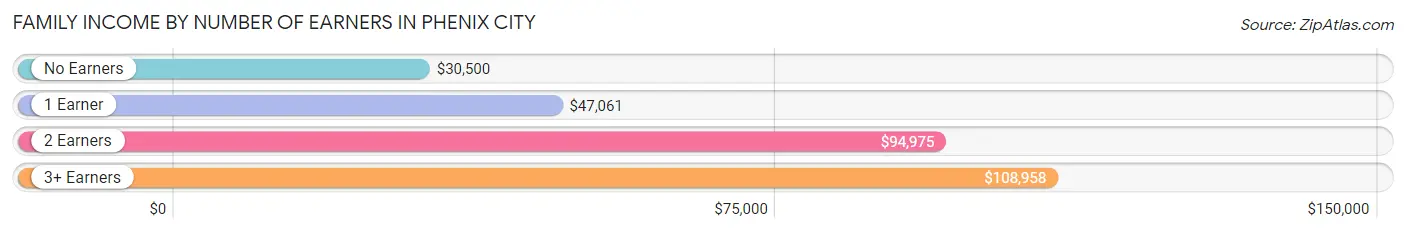
| Number of Earners | # Families | Median Income |
| No Earners | 1,702 (17.8%) | $30,500 |
| 1 Earner | 3,935 (41.2%) | $47,061 |
| 2 Earners | 3,276 (34.3%) | $94,975 |
| 3+ Earners | 628 (6.6%) | $108,958 |
| Total | 9,541 (100.0%) | $61,690 |
Household Income in Phenix City
Household Income Brackets in Phenix City
With 2,631 households falling in the category, the $50,000 to $74,999 income range is the most frequent in Phenix City, accounting for 16.6% of all households. In contrast, only 587 households (3.7%) fall into the $200,000+ income bracket, making it the least populous group.
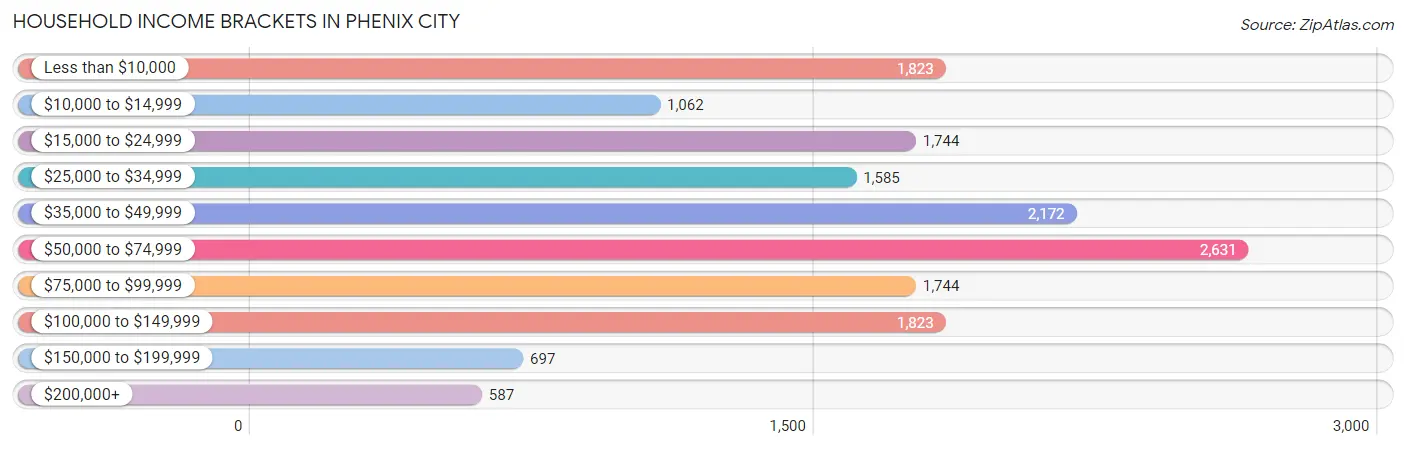
| Income Bracket | # Households | % Households |
| Less than $10,000 | 1,823 | 11.5% |
| $10,000 to $14,999 | 1,062 | 6.7% |
| $15,000 to $24,999 | 1,744 | 11.0% |
| $25,000 to $34,999 | 1,585 | 10.0% |
| $35,000 to $49,999 | 2,172 | 13.7% |
| $50,000 to $74,999 | 2,631 | 16.6% |
| $75,000 to $99,999 | 1,744 | 11.0% |
| $100,000 to $149,999 | 1,823 | 11.5% |
| $150,000 to $199,999 | 697 | 4.4% |
| $200,000+ | 587 | 3.7% |
Household Income by Householder Age in Phenix City
The median household income in Phenix City is $46,944, with the highest median household income of $50,849 found in the 45 to 64 years age bracket for the primary householder. A total of 5,589 households (35.3%) fall into this category. Meanwhile, the 15 to 24 years age bracket for the primary householder has the lowest median household income of $23,904, with 787 households (5.0%) in this group.
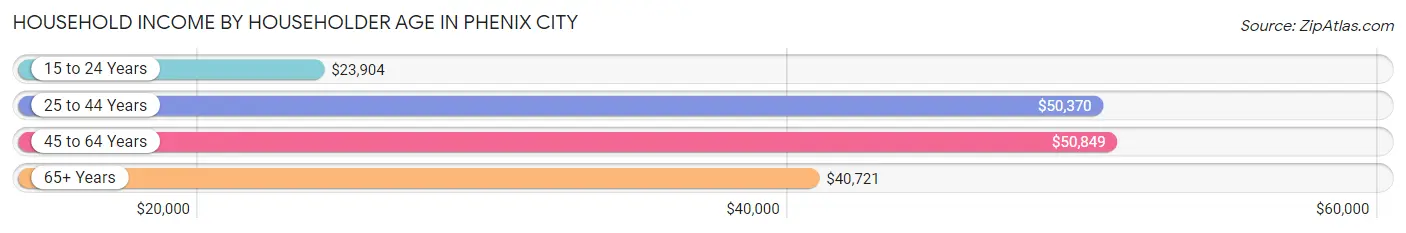
| Income Bracket | # Households | Median Income |
| 15 to 24 Years | 787 (5.0%) | $23,904 |
| 25 to 44 Years | 6,145 (38.8%) | $50,370 |
| 45 to 64 Years | 5,589 (35.3%) | $50,849 |
| 65+ Years | 3,331 (21.0%) | $40,721 |
| Total | 15,852 (100.0%) | $46,944 |
Poverty in Phenix City
Income Below Poverty by Sex and Age in Phenix City
With 23.6% poverty level for males and 27.2% for females among the residents of Phenix City, 5 year old males and 6 to 11 year old females are the most vulnerable to poverty, with 335 males (77.5%) and 683 females (54.0%) in their respective age groups living below the poverty level.
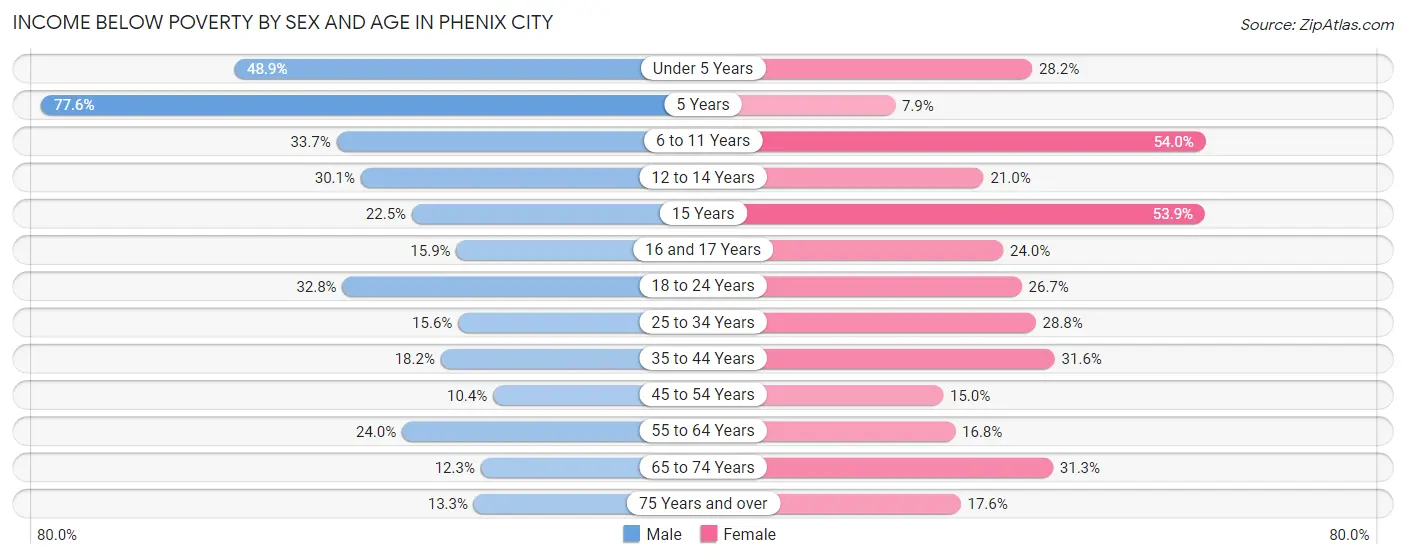
| Age Bracket | Male | Female |
| Under 5 Years | 597 (48.9%) | 288 (28.2%) |
| 5 Years | 335 (77.5%) | 12 (7.9%) |
| 6 to 11 Years | 564 (33.7%) | 683 (54.0%) |
| 12 to 14 Years | 265 (30.1%) | 158 (21.0%) |
| 15 Years | 38 (22.5%) | 248 (53.9%) |
| 16 and 17 Years | 101 (15.9%) | 80 (23.9%) |
| 18 to 24 Years | 574 (32.8%) | 429 (26.7%) |
| 25 to 34 Years | 464 (15.6%) | 798 (28.8%) |
| 35 to 44 Years | 455 (18.2%) | 1,000 (31.6%) |
| 45 to 54 Years | 212 (10.4%) | 385 (15.0%) |
| 55 to 64 Years | 488 (23.9%) | 410 (16.8%) |
| 65 to 74 Years | 183 (12.3%) | 609 (31.3%) |
| 75 Years and over | 87 (13.3%) | 156 (17.6%) |
| Total | 4,363 (23.6%) | 5,256 (27.2%) |
Income Above Poverty by Sex and Age in Phenix City
According to the poverty statistics in Phenix City, males aged 45 to 54 years and females aged 5 years are the age groups that are most secure financially, with 89.6% of males and 92.1% of females in these age groups living above the poverty line.
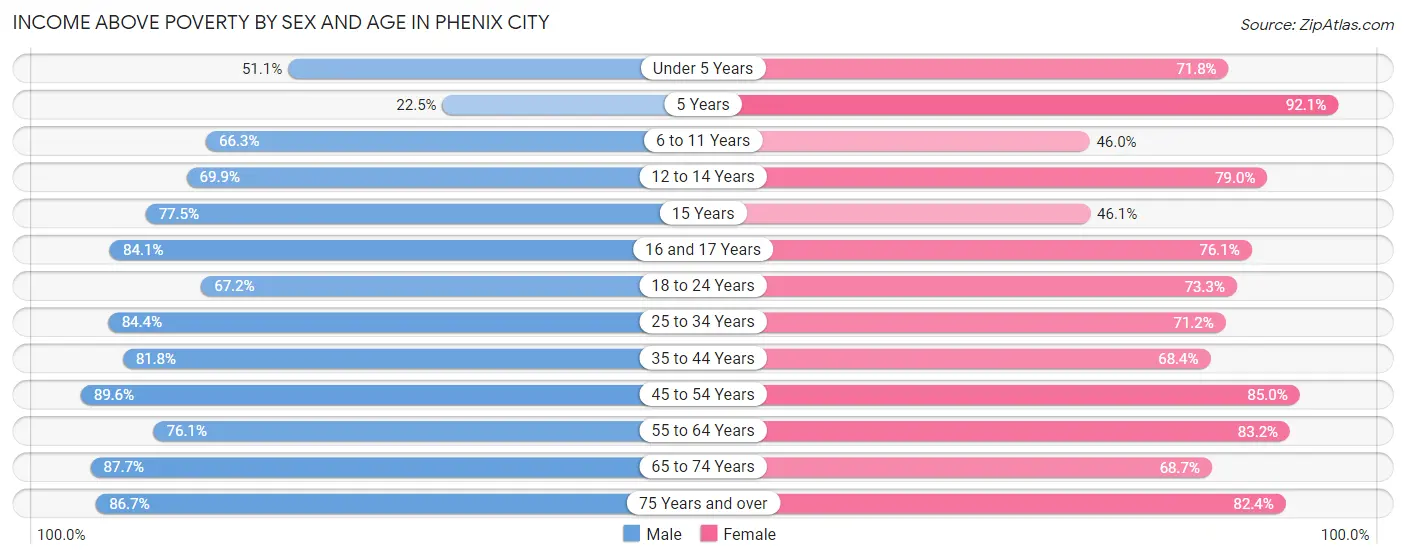
| Age Bracket | Male | Female |
| Under 5 Years | 624 (51.1%) | 732 (71.8%) |
| 5 Years | 97 (22.5%) | 140 (92.1%) |
| 6 to 11 Years | 1,110 (66.3%) | 581 (46.0%) |
| 12 to 14 Years | 616 (69.9%) | 593 (79.0%) |
| 15 Years | 131 (77.5%) | 212 (46.1%) |
| 16 and 17 Years | 535 (84.1%) | 254 (76.0%) |
| 18 to 24 Years | 1,176 (67.2%) | 1,178 (73.3%) |
| 25 to 34 Years | 2,506 (84.4%) | 1,975 (71.2%) |
| 35 to 44 Years | 2,043 (81.8%) | 2,164 (68.4%) |
| 45 to 54 Years | 1,819 (89.6%) | 2,174 (85.0%) |
| 55 to 64 Years | 1,550 (76.0%) | 2,026 (83.2%) |
| 65 to 74 Years | 1,308 (87.7%) | 1,334 (68.7%) |
| 75 Years and over | 567 (86.7%) | 729 (82.4%) |
| Total | 14,082 (76.3%) | 14,092 (72.8%) |
Income Below Poverty Among Married-Couple Families in Phenix City
The poverty statistics for married-couple families in Phenix City show that 8.9% or 527 of the total 5,947 families live below the poverty line. Families with 3 or 4 children have the highest poverty rate of 21.0%, comprising of 103 families. On the other hand, families with no children have the lowest poverty rate of 4.2%, which includes 152 families.
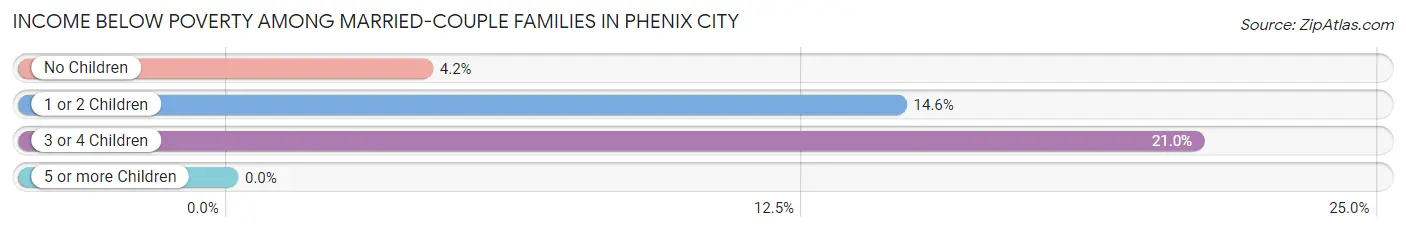
| Children | Above Poverty | Below Poverty |
| No Children | 3,435 (95.8%) | 152 (4.2%) |
| 1 or 2 Children | 1,598 (85.5%) | 272 (14.5%) |
| 3 or 4 Children | 387 (79.0%) | 103 (21.0%) |
| 5 or more Children | 0 (0.0%) | 0 (0.0%) |
| Total | 5,420 (91.1%) | 527 (8.9%) |
Income Below Poverty Among Single-Parent Households in Phenix City
According to the poverty data in Phenix City, 1.7% or 10 single-father households and 44.3% or 1,329 single-mother households are living below the poverty line. Among single-father households, those with 1 or 2 children have the highest poverty rate, with 10 households (2.8%) experiencing poverty. Likewise, among single-mother households, those with 3 or 4 children have the highest poverty rate, with 248 households (86.1%) falling below the poverty line.
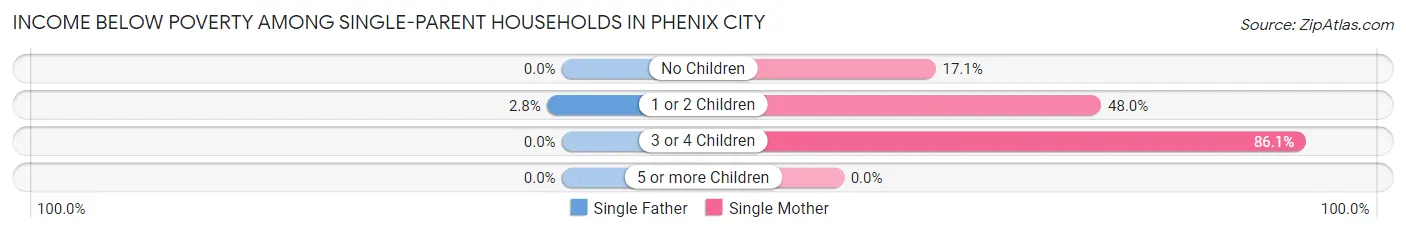
| Children | Single Father | Single Mother |
| No Children | 0 (0.0%) | 121 (17.1%) |
| 1 or 2 Children | 10 (2.8%) | 960 (47.9%) |
| 3 or 4 Children | 0 (0.0%) | 248 (86.1%) |
| 5 or more Children | 0 (0.0%) | 0 (0.0%) |
| Total | 10 (1.7%) | 1,329 (44.3%) |
Income Below Poverty Among Married-Couple vs Single-Parent Households in Phenix City
The poverty data for Phenix City shows that 527 of the married-couple family households (8.9%) and 1,339 of the single-parent households (37.3%) are living below the poverty level. Within the married-couple family households, those with 3 or 4 children have the highest poverty rate, with 103 households (21.0%) falling below the poverty line. Among the single-parent households, those with 3 or 4 children have the highest poverty rate, with 248 household (86.1%) living below poverty.
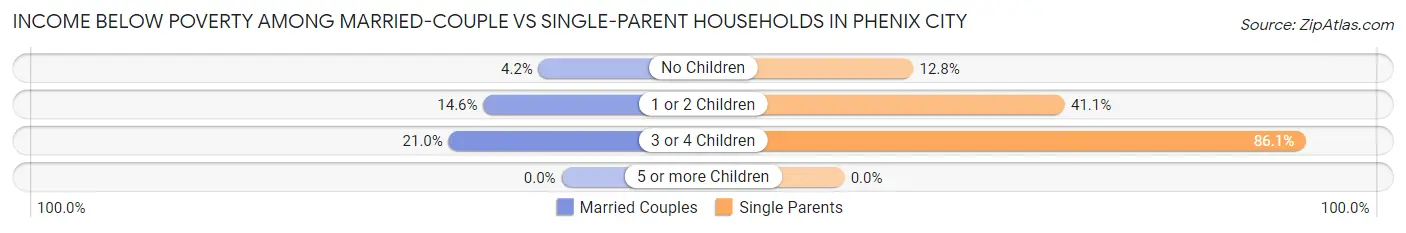
| Children | Married-Couple Families | Single-Parent Households |
| No Children | 152 (4.2%) | 121 (12.8%) |
| 1 or 2 Children | 272 (14.5%) | 970 (41.0%) |
| 3 or 4 Children | 103 (21.0%) | 248 (86.1%) |
| 5 or more Children | 0 (0.0%) | 0 (0.0%) |
| Total | 527 (8.9%) | 1,339 (37.3%) |
Race in Phenix City
The most populous races in Phenix City are Black / African American (18,517 | 48.2%), White / Caucasian (16,252 | 42.3%), and Two or more Races (2,148 | 5.6%).
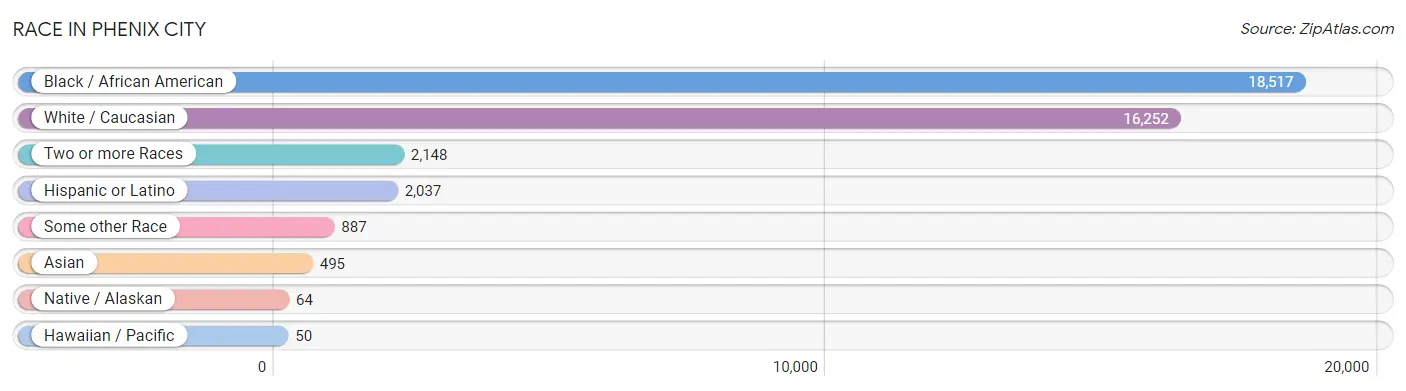
| Race | # Population | % Population |
| Asian | 495 | 1.3% |
| Black / African American | 18,517 | 48.2% |
| Hawaiian / Pacific | 50 | 0.1% |
| Hispanic or Latino | 2,037 | 5.3% |
| Native / Alaskan | 64 | 0.2% |
| White / Caucasian | 16,252 | 42.3% |
| Two or more Races | 2,148 | 5.6% |
| Some other Race | 887 | 2.3% |
| Total | 38,413 | 100.0% |
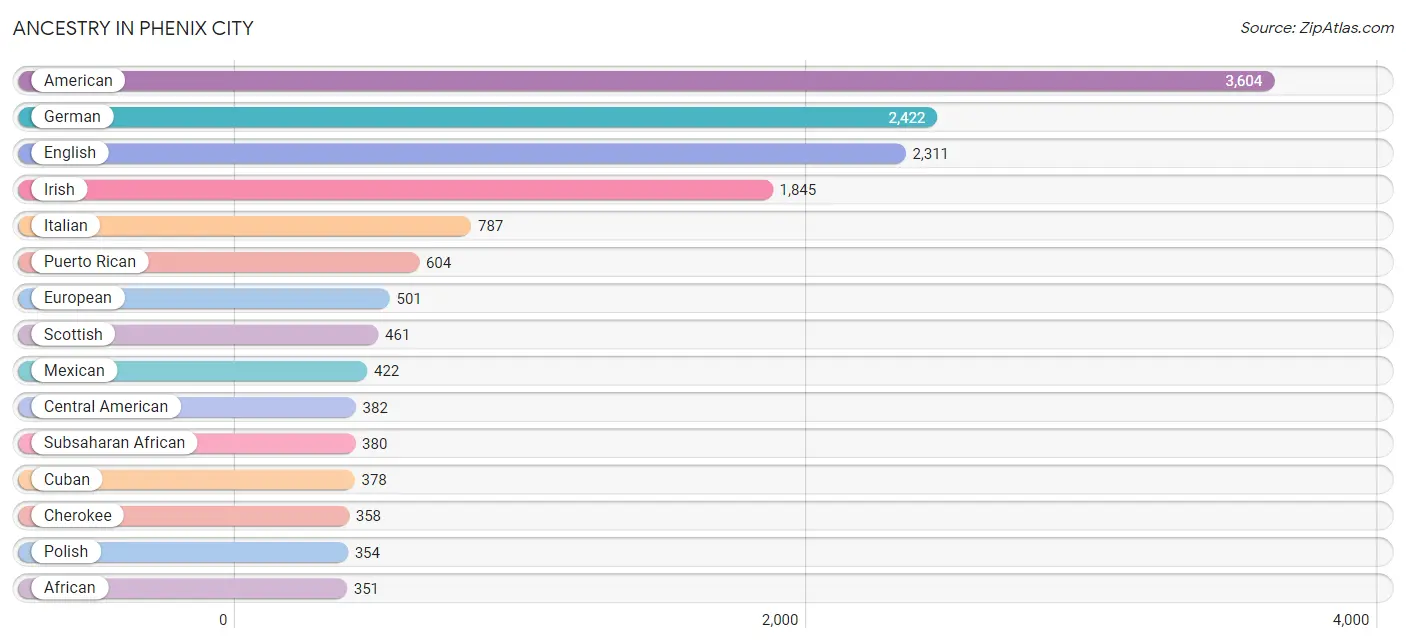
Ancestry in Phenix City
The most populous ancestries reported in Phenix City are American (3,604 | 9.4%), German (2,422 | 6.3%), English (2,311 | 6.0%), Irish (1,845 | 4.8%), and Italian (787 | 2.1%), together accounting for 28.6% of all Phenix City residents.
| Ancestry | # Population | % Population |
| African | 351 | 0.9% |
| American | 3,604 | 9.4% |
| Arab | 9 | 0.0% |
| Argentinean | 9 | 0.0% |
| Bhutanese | 75 | 0.2% |
| Blackfeet | 88 | 0.2% |
| British | 43 | 0.1% |
| Burmese | 110 | 0.3% |
| Canadian | 23 | 0.1% |
| Central American | 382 | 1.0% |
| Central American Indian | 11 | 0.0% |
| Cherokee | 358 | 0.9% |
| Colombian | 151 | 0.4% |
| Creek | 46 | 0.1% |
| Cuban | 378 | 1.0% |
| Danish | 50 | 0.1% |
| Dutch | 9 | 0.0% |
| Ecuadorian | 26 | 0.1% |
| English | 2,311 | 6.0% |
| European | 501 | 1.3% |
| French | 199 | 0.5% |
| French Canadian | 14 | 0.0% |
| German | 2,422 | 6.3% |
| Greek | 45 | 0.1% |
| Guamanian / Chamorro | 42 | 0.1% |
| Guatemalan | 329 | 0.9% |
| Haitian | 8 | 0.0% |
| Indian (Asian) | 205 | 0.5% |
| Iranian | 7 | 0.0% |
| Irish | 1,845 | 4.8% |
| Israeli | 40 | 0.1% |
| Italian | 787 | 2.1% |
| Jamaican | 142 | 0.4% |
| Korean | 315 | 0.8% |
| Mexican | 422 | 1.1% |
| Native Hawaiian | 50 | 0.1% |
| Nigerian | 24 | 0.1% |
| Norwegian | 172 | 0.4% |
| Pakistani | 23 | 0.1% |
| Palestinian | 9 | 0.0% |
| Panamanian | 8 | 0.0% |
| Polish | 354 | 0.9% |
| Portuguese | 5 | 0.0% |
| Puerto Rican | 604 | 1.6% |
| Russian | 18 | 0.1% |
| Salvadoran | 45 | 0.1% |
| Scotch-Irish | 252 | 0.7% |
| Scottish | 461 | 1.2% |
| South American | 186 | 0.5% |
| Sri Lankan | 61 | 0.2% |
| Subsaharan African | 380 | 1.0% |
| Swedish | 80 | 0.2% |
| Swiss | 54 | 0.1% |
| Thai | 23 | 0.1% |
| Ukrainian | 57 | 0.2% |
| Welsh | 78 | 0.2% | View All 56 Rows |
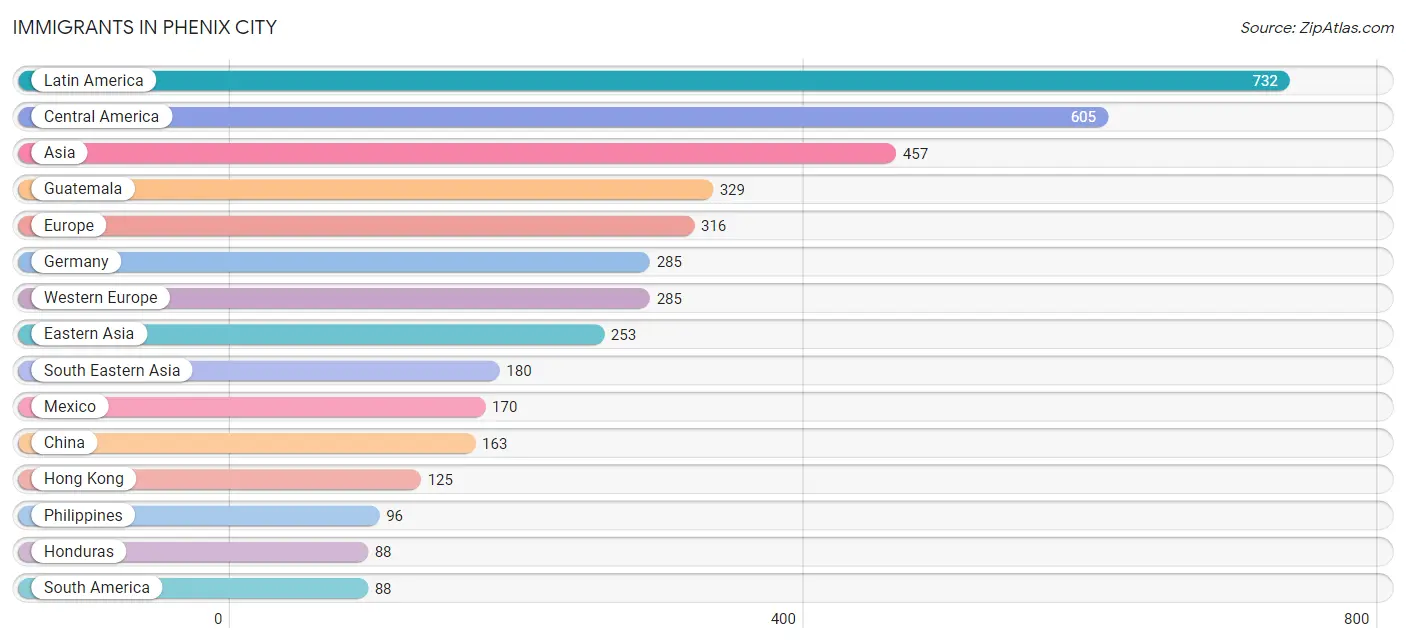
Immigrants in Phenix City
The most numerous immigrant groups reported in Phenix City came from Latin America (732 | 1.9%), Central America (605 | 1.6%), Asia (457 | 1.2%), Guatemala (329 | 0.9%), and Europe (316 | 0.8%), together accounting for 6.4% of all Phenix City residents.
| Immigration Origin | # Population | % Population |
| Africa | 5 | 0.0% |
| Argentina | 9 | 0.0% |
| Asia | 457 | 1.2% |
| Bangladesh | 17 | 0.0% |
| Canada | 23 | 0.1% |
| Caribbean | 39 | 0.1% |
| Central America | 605 | 1.6% |
| China | 163 | 0.4% |
| Colombia | 53 | 0.1% |
| Cuba | 7 | 0.0% |
| Eastern Asia | 253 | 0.7% |
| Ecuador | 26 | 0.1% |
| El Salvador | 18 | 0.1% |
| England | 31 | 0.1% |
| Europe | 316 | 0.8% |
| Germany | 285 | 0.7% |
| Guatemala | 329 | 0.9% |
| Honduras | 88 | 0.2% |
| Hong Kong | 125 | 0.3% |
| Iran | 7 | 0.0% |
| Jamaica | 32 | 0.1% |
| Japan | 24 | 0.1% |
| Korea | 66 | 0.2% |
| Latin America | 732 | 1.9% |
| Mexico | 170 | 0.4% |
| Northern Europe | 31 | 0.1% |
| Philippines | 96 | 0.3% |
| South America | 88 | 0.2% |
| South Central Asia | 24 | 0.1% |
| South Eastern Asia | 180 | 0.5% |
| Thailand | 23 | 0.1% |
| Vietnam | 61 | 0.2% |
| Western Africa | 5 | 0.0% |
| Western Europe | 285 | 0.7% | View All 34 Rows |
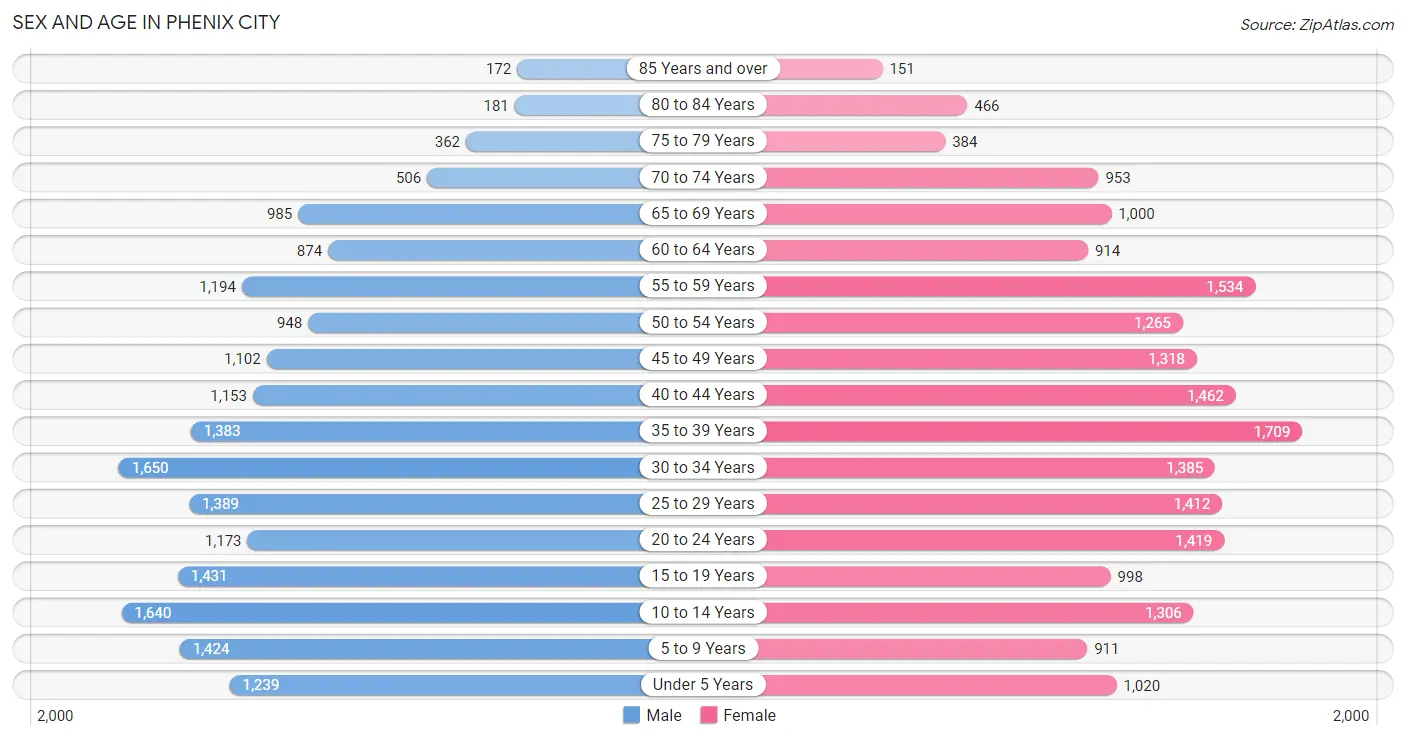
Sex and Age in Phenix City
Sex and Age in Phenix City
The most populous age groups in Phenix City are 30 to 34 Years (1,650 | 8.8%) for men and 35 to 39 Years (1,709 | 8.7%) for women.
| Age Bracket | Male | Female |
| Under 5 Years | 1,239 (6.6%) | 1,020 (5.2%) |
| 5 to 9 Years | 1,424 (7.6%) | 911 (4.6%) |
| 10 to 14 Years | 1,640 (8.7%) | 1,306 (6.7%) |
| 15 to 19 Years | 1,431 (7.6%) | 998 (5.1%) |
| 20 to 24 Years | 1,173 (6.2%) | 1,419 (7.2%) |
| 25 to 29 Years | 1,389 (7.4%) | 1,412 (7.2%) |
| 30 to 34 Years | 1,650 (8.8%) | 1,385 (7.1%) |
| 35 to 39 Years | 1,383 (7.3%) | 1,709 (8.7%) |
| 40 to 44 Years | 1,153 (6.1%) | 1,462 (7.5%) |
| 45 to 49 Years | 1,102 (5.9%) | 1,318 (6.7%) |
| 50 to 54 Years | 948 (5.0%) | 1,265 (6.5%) |
| 55 to 59 Years | 1,194 (6.4%) | 1,534 (7.8%) |
| 60 to 64 Years | 874 (4.6%) | 914 (4.7%) |
| 65 to 69 Years | 985 (5.2%) | 1,000 (5.1%) |
| 70 to 74 Years | 506 (2.7%) | 953 (4.9%) |
| 75 to 79 Years | 362 (1.9%) | 384 (2.0%) |
| 80 to 84 Years | 181 (1.0%) | 466 (2.4%) |
| 85 Years and over | 172 (0.9%) | 151 (0.8%) |
| Total | 18,806 (100.0%) | 19,607 (100.0%) |
Families and Households in Phenix City
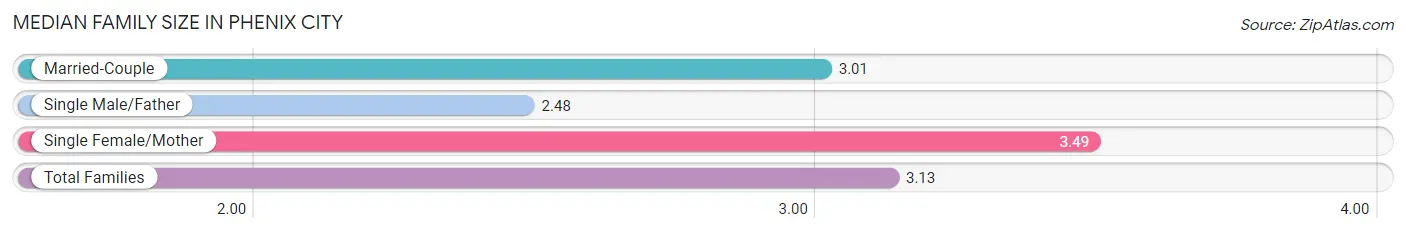
Median Family Size in Phenix City
The median family size in Phenix City is 3.13 persons per family, with single female/mother families (2,997 | 31.4%) accounting for the largest median family size of 3.49 persons per family. On the other hand, single male/father families (597 | 6.3%) represent the smallest median family size with 2.48 persons per family.
| Family Type | # Families | Family Size |
| Married-Couple | 5,947 (62.3%) | 3.01 |
| Single Male/Father | 597 (6.3%) | 2.48 |
| Single Female/Mother | 2,997 (31.4%) | 3.49 |
| Total Families | 9,541 (100.0%) | 3.13 |
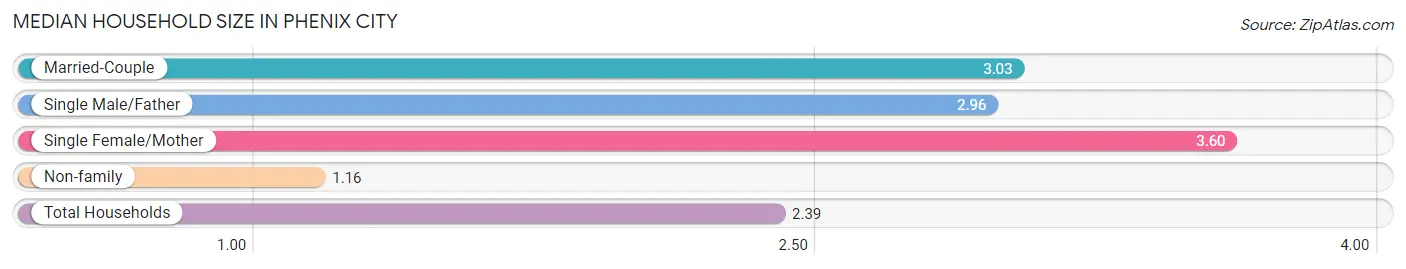
Median Household Size in Phenix City
The median household size in Phenix City is 2.39 persons per household, with single female/mother households (2,997 | 18.9%) accounting for the largest median household size of 3.6 persons per household. non-family households (6,311 | 39.8%) represent the smallest median household size with 1.16 persons per household.
| Household Type | # Households | Household Size |
| Married-Couple | 5,947 (37.5%) | 3.03 |
| Single Male/Father | 597 (3.8%) | 2.96 |
| Single Female/Mother | 2,997 (18.9%) | 3.60 |
| Non-family | 6,311 (39.8%) | 1.16 |
| Total Households | 15,852 (100.0%) | 2.39 |
Household Size by Marriage Status in Phenix City
Out of a total of 15,852 households in Phenix City, 9,541 (60.2%) are family households, while 6,311 (39.8%) are nonfamily households. The most numerous type of family households are 2-person households, comprising 4,284, and the most common type of nonfamily households are 1-person households, comprising 5,545.
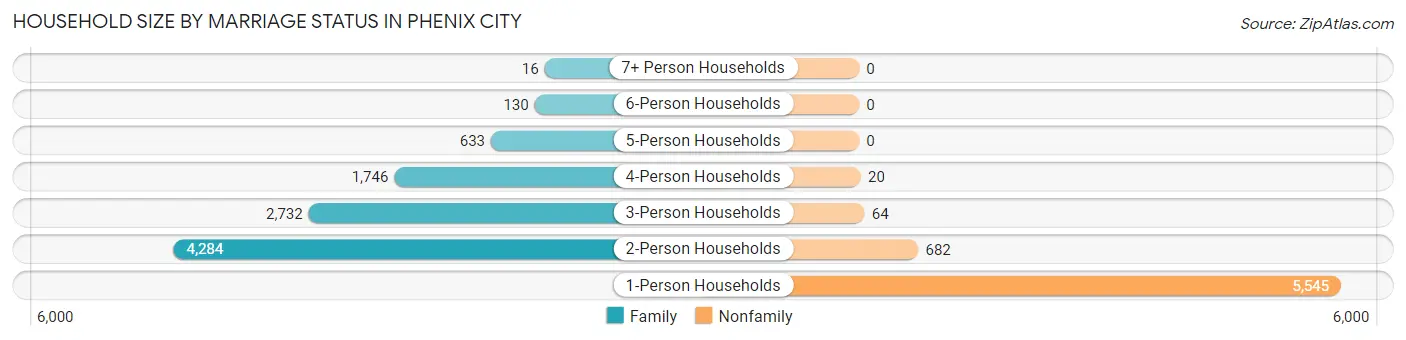
| Household Size | Family Households | Nonfamily Households |
| 1-Person Households | - | 5,545 (35.0%) |
| 2-Person Households | 4,284 (27.0%) | 682 (4.3%) |
| 3-Person Households | 2,732 (17.2%) | 64 (0.4%) |
| 4-Person Households | 1,746 (11.0%) | 20 (0.1%) |
| 5-Person Households | 633 (4.0%) | 0 (0.0%) |
| 6-Person Households | 130 (0.8%) | 0 (0.0%) |
| 7+ Person Households | 16 (0.1%) | 0 (0.0%) |
| Total | 9,541 (60.2%) | 6,311 (39.8%) |
Female Fertility in Phenix City
Fertility by Age in Phenix City
Average fertility rate in Phenix City is 65.0 births per 1,000 women. Women in the age bracket of 20 to 34 years have the highest fertility rate with 124.0 births per 1,000 women. Women in the age bracket of 20 to 34 years acount for 81.9% of all women with births.
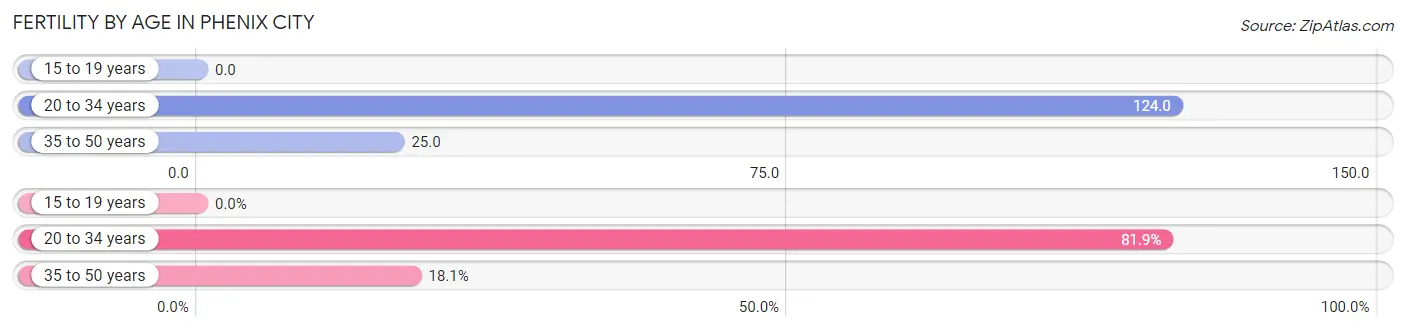
| Age Bracket | Women with Births | Births / 1,000 Women |
| 15 to 19 years | 0 (0.0%) | 0.0 |
| 20 to 34 years | 524 (81.9%) | 124.0 |
| 35 to 50 years | 116 (18.1%) | 25.0 |
| Total | 640 (100.0%) | 65.0 |
Fertility by Age by Marriage Status in Phenix City
30.5% of women with births (640) in Phenix City are married. The highest percentage of unmarried women with births falls into 20 to 34 years age bracket with 79.6% of them unmarried at the time of birth, while the lowest percentage of unmarried women with births belong to 35 to 50 years age bracket with 24.1% of them unmarried.
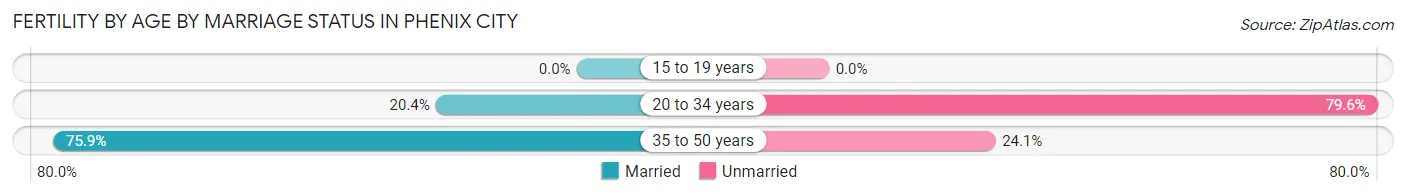
| Age Bracket | Married | Unmarried |
| 15 to 19 years | 0 (0.0%) | 0 (0.0%) |
| 20 to 34 years | 107 (20.4%) | 417 (79.6%) |
| 35 to 50 years | 88 (75.9%) | 28 (24.1%) |
| Total | 195 (30.5%) | 445 (69.5%) |
Fertility by Education in Phenix City
Average fertility rate in Phenix City is 65.0 births per 1,000 women. Women with the education attainment of high school diploma have the highest fertility rate of 124.0 births per 1,000 women, while women with the education attainment of bachelor's degree have the lowest fertility at 12.0 births per 1,000 women. Women with the education attainment of high school diploma represent 45.2% of all women with births.
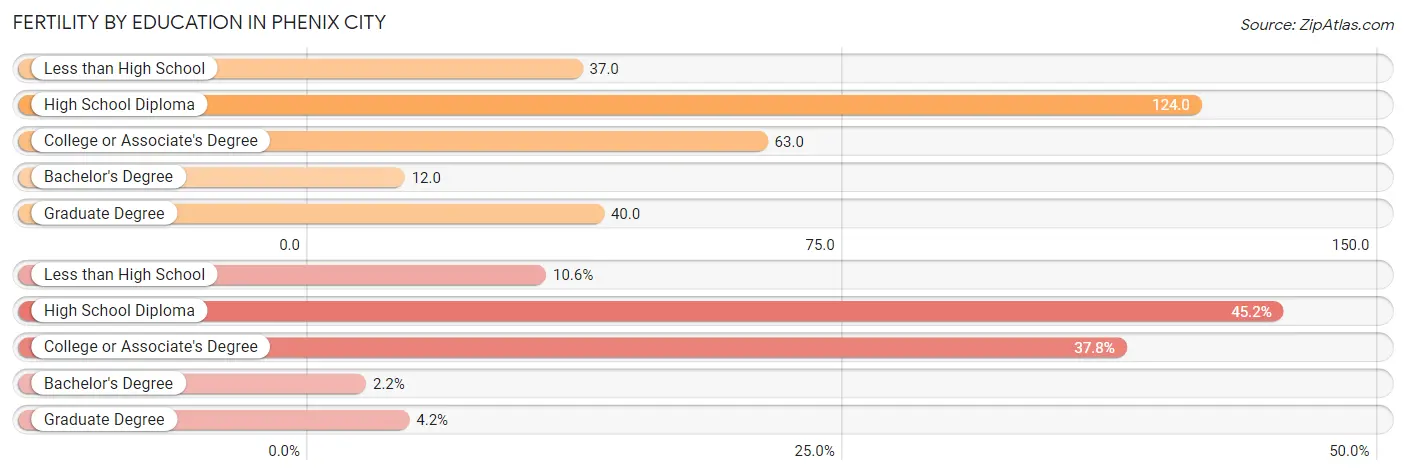
| Educational Attainment | Women with Births | Births / 1,000 Women |
| Less than High School | 68 (10.6%) | 37.0 |
| High School Diploma | 289 (45.2%) | 124.0 |
| College or Associate's Degree | 242 (37.8%) | 63.0 |
| Bachelor's Degree | 14 (2.2%) | 12.0 |
| Graduate Degree | 27 (4.2%) | 40.0 |
| Total | 640 (100.0%) | 65.0 |
Fertility by Education by Marriage Status in Phenix City
69.5% of women with births in Phenix City are unmarried. Women with the educational attainment of bachelor's degree are most likely to be married with 100.0% of them married at childbirth, while women with the educational attainment of less than high school are least likely to be married with 100.0% of them unmarried at childbirth.
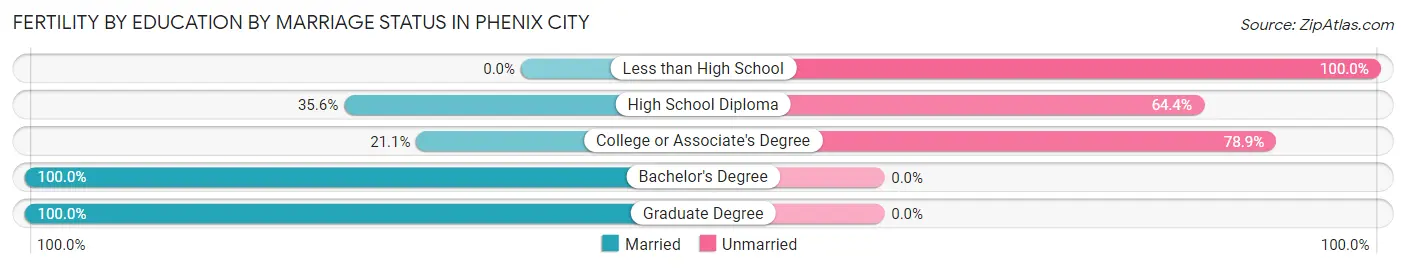
| Educational Attainment | Married | Unmarried |
| Less than High School | 0 (0.0%) | 68 (100.0%) |
| High School Diploma | 103 (35.6%) | 186 (64.4%) |
| College or Associate's Degree | 51 (21.1%) | 191 (78.9%) |
| Bachelor's Degree | 14 (100.0%) | 0 (0.0%) |
| Graduate Degree | 27 (100.0%) | 0 (0.0%) |
| Total | 195 (30.5%) | 445 (69.5%) |
Employment Characteristics in Phenix City
Employment by Class of Employer in Phenix City
Among the 16,902 employed individuals in Phenix City, private company employees (10,458 | 61.9%), federal government employees (1,927 | 11.4%), and local government employees (1,123 | 6.6%) make up the most common classes of employment.
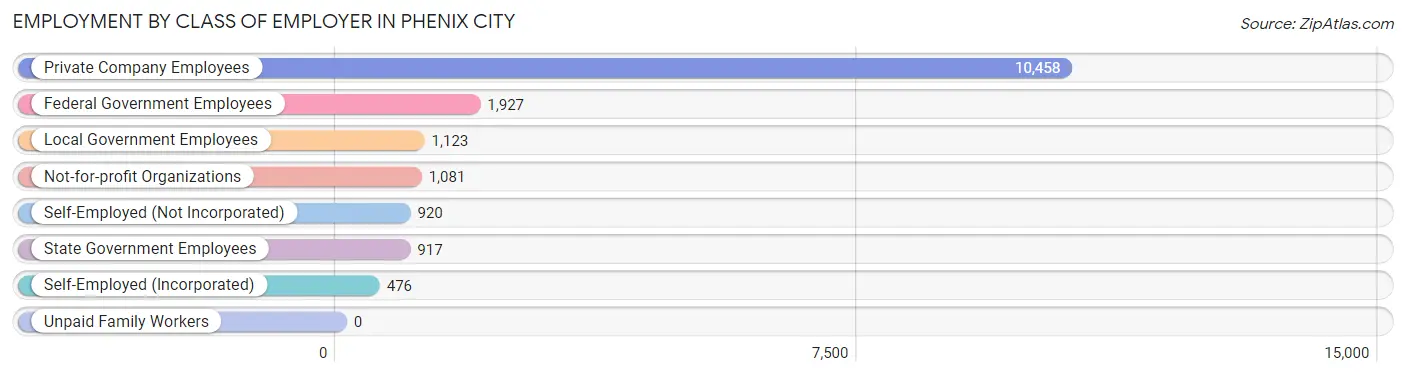
| Employer Class | # Employees | % Employees |
| Private Company Employees | 10,458 | 61.9% |
| Self-Employed (Incorporated) | 476 | 2.8% |
| Self-Employed (Not Incorporated) | 920 | 5.4% |
| Not-for-profit Organizations | 1,081 | 6.4% |
| Local Government Employees | 1,123 | 6.6% |
| State Government Employees | 917 | 5.4% |
| Federal Government Employees | 1,927 | 11.4% |
| Unpaid Family Workers | 0 | 0.0% |
| Total | 16,902 | 100.0% |
Employment Status by Age in Phenix City
According to the labor force statistics for Phenix City, out of the total population over 16 years of age (30,243), 60.8% or 18,388 individuals are in the labor force, with 7.1% or 1,306 of them unemployed. The age group with the highest labor force participation rate is 25 to 29 years, with 79.8% or 2,235 individuals in the labor force. Within the labor force, the 20 to 24 years age range has the highest percentage of unemployed individuals, with 16.9% or 349 of them being unemployed.
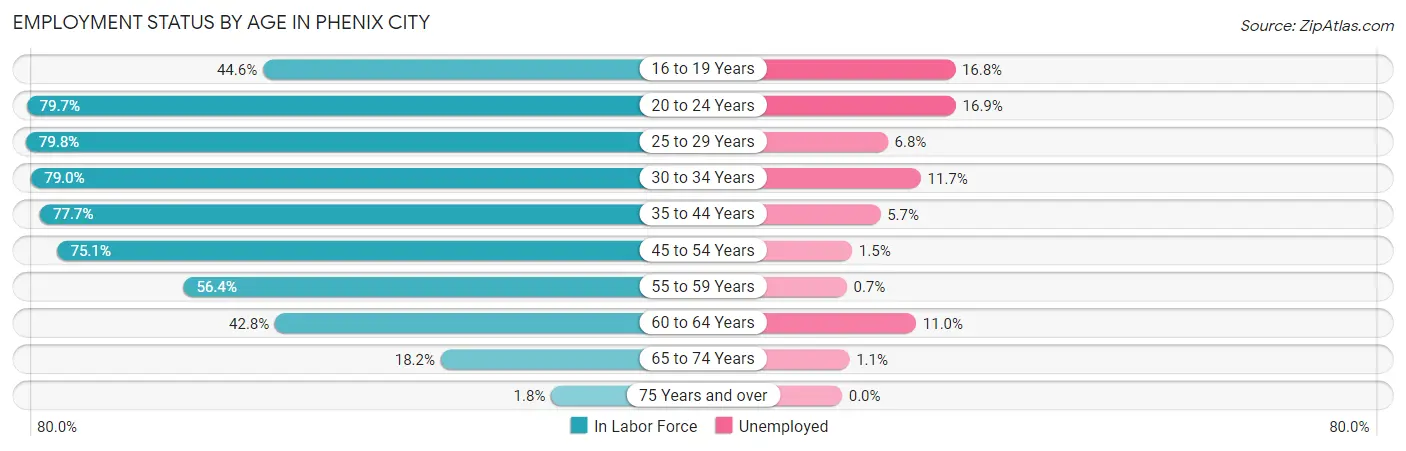
| Age Bracket | In Labor Force | Unemployed |
| 16 to 19 Years | 802 (44.6%) | 135 (16.8%) |
| 20 to 24 Years | 2,066 (79.7%) | 349 (16.9%) |
| 25 to 29 Years | 2,235 (79.8%) | 152 (6.8%) |
| 30 to 34 Years | 2,398 (79.0%) | 281 (11.7%) |
| 35 to 44 Years | 4,434 (77.7%) | 253 (5.7%) |
| 45 to 54 Years | 3,479 (75.1%) | 52 (1.5%) |
| 55 to 59 Years | 1,539 (56.4%) | 11 (0.7%) |
| 60 to 64 Years | 765 (42.8%) | 84 (11.0%) |
| 65 to 74 Years | 627 (18.2%) | 7 (1.1%) |
| 75 Years and over | 31 (1.8%) | 0 (0.0%) |
| Total | 18,388 (60.8%) | 1,306 (7.1%) |
Employment Status by Educational Attainment in Phenix City
According to labor force statistics for Phenix City, 71.8% of individuals (14,857) out of the total population between 25 and 64 years of age (20,692) are in the labor force, with 5.5% or 817 of them being unemployed. The group with the highest labor force participation rate are those with the educational attainment of bachelor's degree or higher, with 84.4% or 4,005 individuals in the labor force. Within the labor force, individuals with less than high school education have the highest percentage of unemployment, with 14.9% or 169 of them being unemployed.
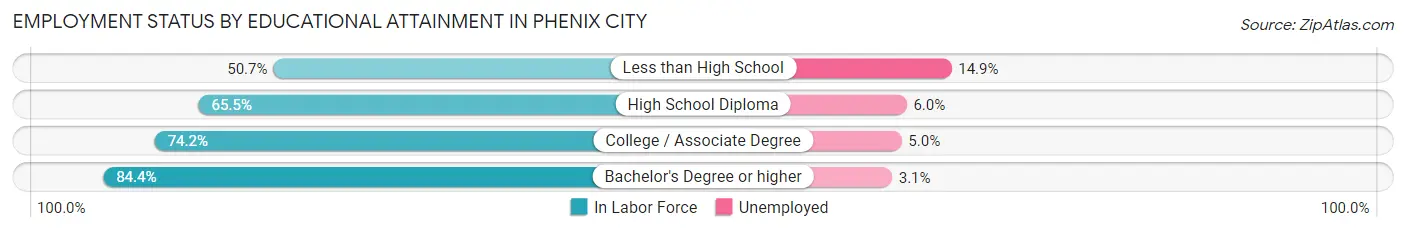
| Educational Attainment | In Labor Force | Unemployed |
| Less than High School | 1,131 (50.7%) | 332 (14.9%) |
| High School Diploma | 3,483 (65.5%) | 319 (6.0%) |
| College / Associate Degree | 6,232 (74.2%) | 420 (5.0%) |
| Bachelor's Degree or higher | 4,005 (84.4%) | 147 (3.1%) |
| Total | 14,857 (71.8%) | 1,138 (5.5%) |
Employment Occupations by Sex in Phenix City
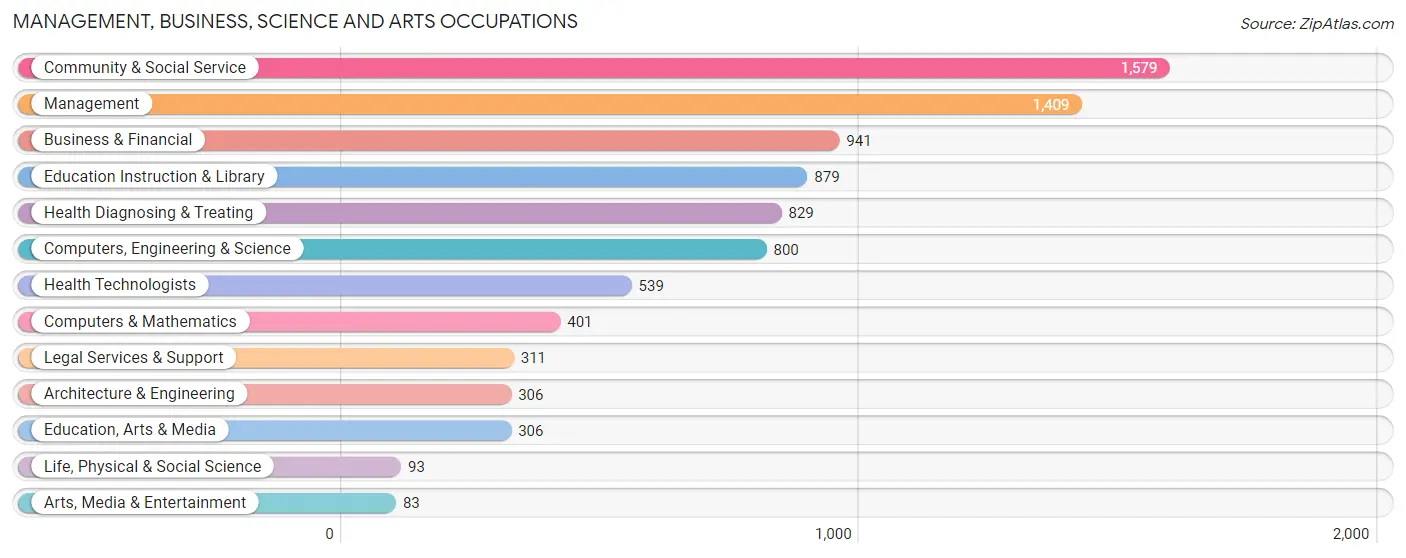
Management, Business, Science and Arts Occupations
The most common Management, Business, Science and Arts occupations in Phenix City are Community & Social Service (1,579 | 9.7%), Management (1,409 | 8.7%), Business & Financial (941 | 5.8%), Education Instruction & Library (879 | 5.4%), and Health Diagnosing & Treating (829 | 5.1%).
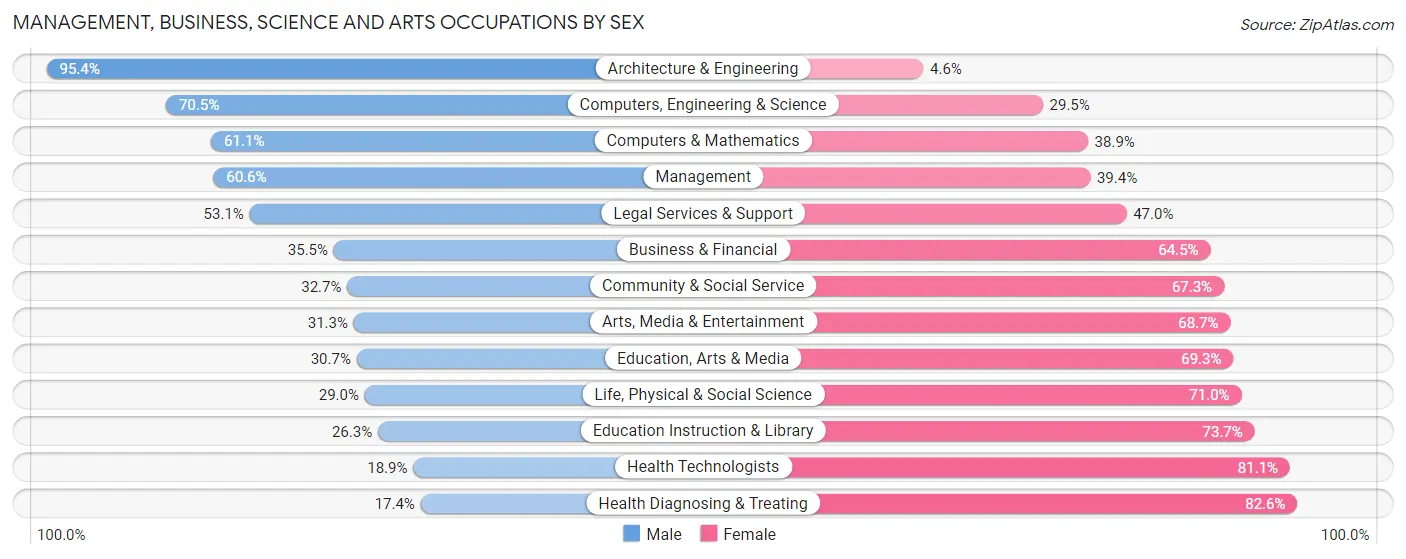
Management, Business, Science and Arts Occupations by Sex
Within the Management, Business, Science and Arts occupations in Phenix City, the most male-oriented occupations are Architecture & Engineering (95.4%), Computers, Engineering & Science (70.5%), and Computers & Mathematics (61.1%), while the most female-oriented occupations are Health Diagnosing & Treating (82.6%), Health Technologists (81.1%), and Education Instruction & Library (73.7%).
| Occupation | Male | Female |
| Management | 854 (60.6%) | 555 (39.4%) |
| Business & Financial | 334 (35.5%) | 607 (64.5%) |
| Computers, Engineering & Science | 564 (70.5%) | 236 (29.5%) |
| Computers & Mathematics | 245 (61.1%) | 156 (38.9%) |
| Architecture & Engineering | 292 (95.4%) | 14 (4.6%) |
| Life, Physical & Social Science | 27 (29.0%) | 66 (71.0%) |
| Community & Social Service | 516 (32.7%) | 1,063 (67.3%) |
| Education, Arts & Media | 94 (30.7%) | 212 (69.3%) |
| Legal Services & Support | 165 (53.0%) | 146 (46.9%) |
| Education Instruction & Library | 231 (26.3%) | 648 (73.7%) |
| Arts, Media & Entertainment | 26 (31.3%) | 57 (68.7%) |
| Health Diagnosing & Treating | 144 (17.4%) | 685 (82.6%) |
| Health Technologists | 102 (18.9%) | 437 (81.1%) |
| Total (Category) | 2,412 (43.4%) | 3,146 (56.6%) |
| Total (Overall) | 8,035 (49.4%) | 8,221 (50.6%) |
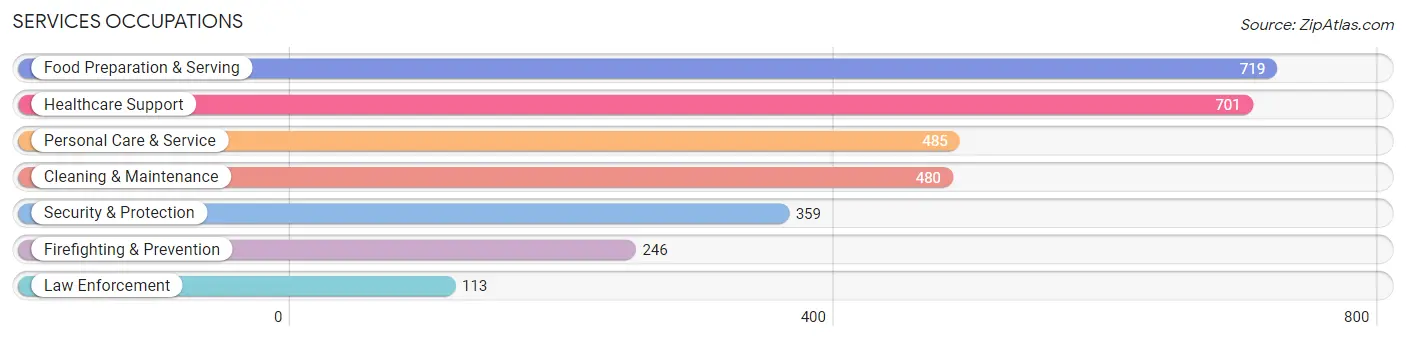
Services Occupations
The most common Services occupations in Phenix City are Food Preparation & Serving (719 | 4.4%), Healthcare Support (701 | 4.3%), Personal Care & Service (485 | 3.0%), Cleaning & Maintenance (480 | 2.9%), and Security & Protection (359 | 2.2%).
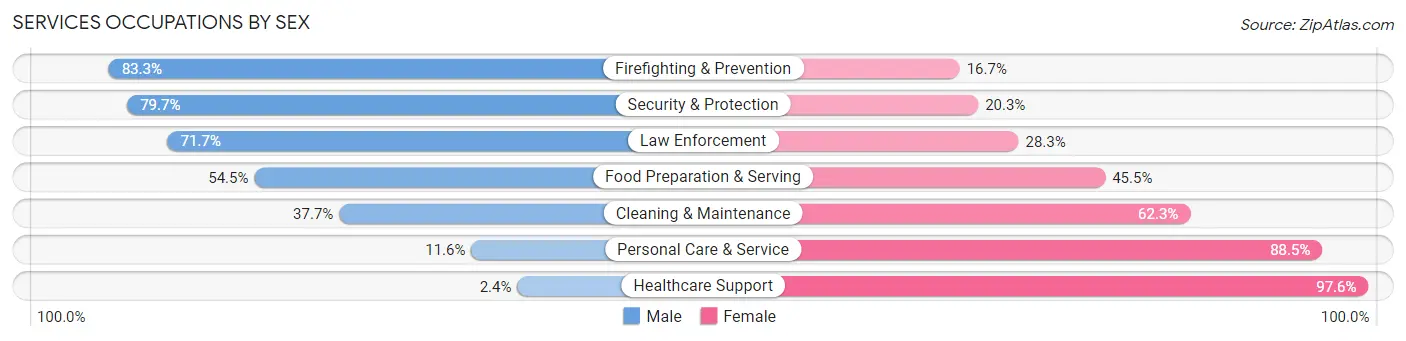
Services Occupations by Sex
Within the Services occupations in Phenix City, the most male-oriented occupations are Firefighting & Prevention (83.3%), Security & Protection (79.7%), and Law Enforcement (71.7%), while the most female-oriented occupations are Healthcare Support (97.6%), Personal Care & Service (88.4%), and Cleaning & Maintenance (62.3%).
| Occupation | Male | Female |
| Healthcare Support | 17 (2.4%) | 684 (97.6%) |
| Security & Protection | 286 (79.7%) | 73 (20.3%) |
| Firefighting & Prevention | 205 (83.3%) | 41 (16.7%) |
| Law Enforcement | 81 (71.7%) | 32 (28.3%) |
| Food Preparation & Serving | 392 (54.5%) | 327 (45.5%) |
| Cleaning & Maintenance | 181 (37.7%) | 299 (62.3%) |
| Personal Care & Service | 56 (11.6%) | 429 (88.4%) |
| Total (Category) | 932 (34.0%) | 1,812 (66.0%) |
| Total (Overall) | 8,035 (49.4%) | 8,221 (50.6%) |
Sales and Office Occupations
The most common Sales and Office occupations in Phenix City are Office & Administration (2,122 | 13.1%), and Sales & Related (1,582 | 9.7%).
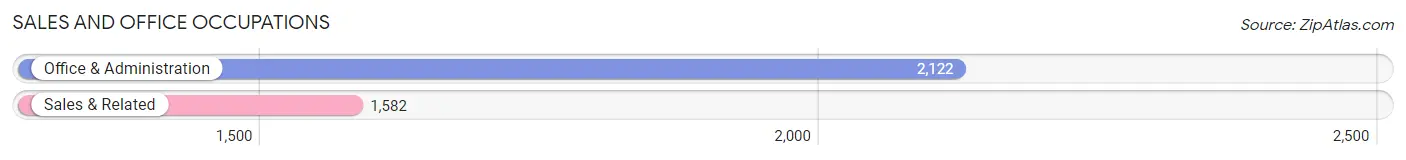
Sales and Office Occupations by Sex
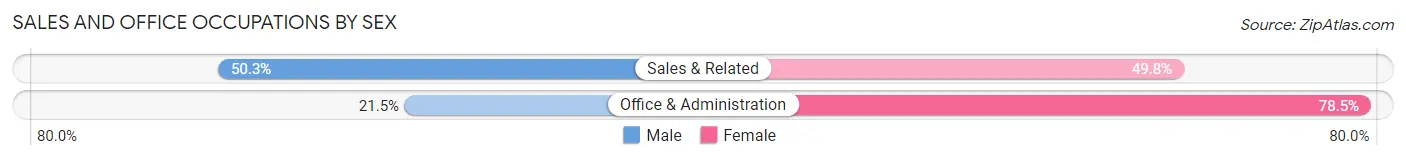
| Occupation | Male | Female |
| Sales & Related | 795 (50.2%) | 787 (49.7%) |
| Office & Administration | 456 (21.5%) | 1,666 (78.5%) |
| Total (Category) | 1,251 (33.8%) | 2,453 (66.2%) |
| Total (Overall) | 8,035 (49.4%) | 8,221 (50.6%) |
Natural Resources, Construction and Maintenance Occupations
The most common Natural Resources, Construction and Maintenance occupations in Phenix City are Construction & Extraction (735 | 4.5%), Installation, Maintenance & Repair (535 | 3.3%), and Farming, Fishing & Forestry (9 | 0.1%).
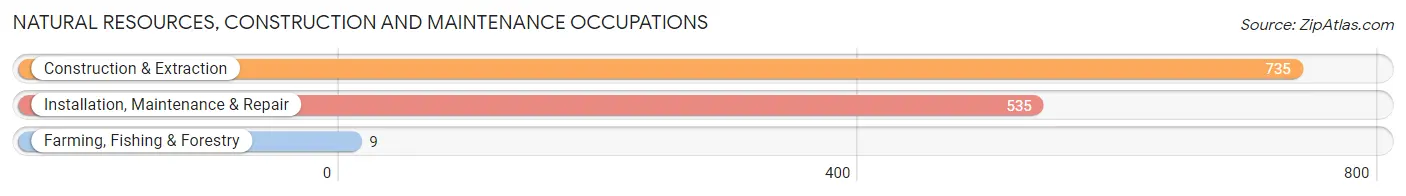
Natural Resources, Construction and Maintenance Occupations by Sex
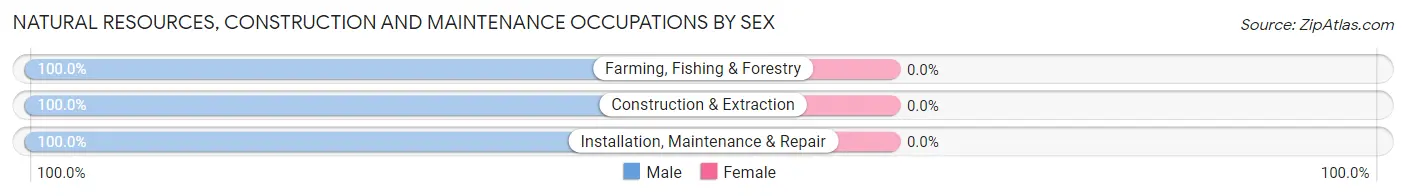
| Occupation | Male | Female |
| Farming, Fishing & Forestry | 9 (100.0%) | 0 (0.0%) |
| Construction & Extraction | 735 (100.0%) | 0 (0.0%) |
| Installation, Maintenance & Repair | 535 (100.0%) | 0 (0.0%) |
| Total (Category) | 1,279 (100.0%) | 0 (0.0%) |
| Total (Overall) | 8,035 (49.4%) | 8,221 (50.6%) |
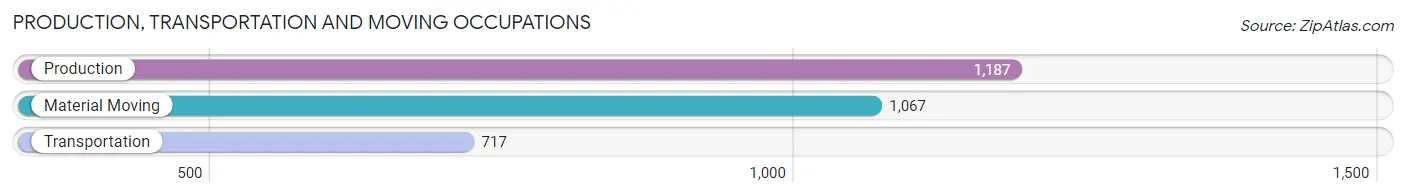
Production, Transportation and Moving Occupations
The most common Production, Transportation and Moving occupations in Phenix City are Production (1,187 | 7.3%), Material Moving (1,067 | 6.6%), and Transportation (717 | 4.4%).
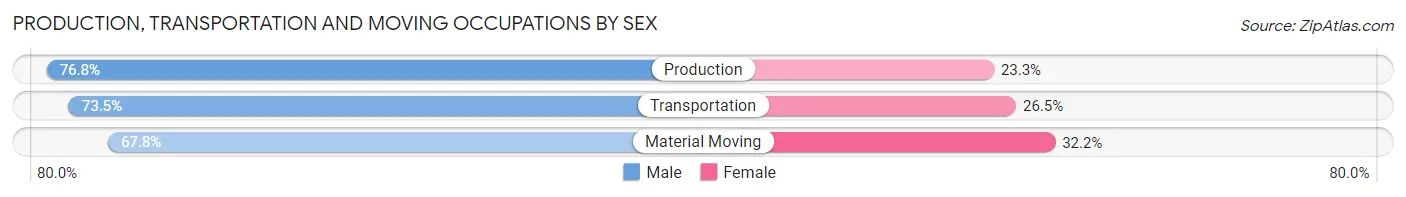
Production, Transportation and Moving Occupations by Sex
| Occupation | Male | Female |
| Production | 911 (76.7%) | 276 (23.3%) |
| Transportation | 527 (73.5%) | 190 (26.5%) |
| Material Moving | 723 (67.8%) | 344 (32.2%) |
| Total (Category) | 2,161 (72.7%) | 810 (27.3%) |
| Total (Overall) | 8,035 (49.4%) | 8,221 (50.6%) |
Employment Industries by Sex in Phenix City
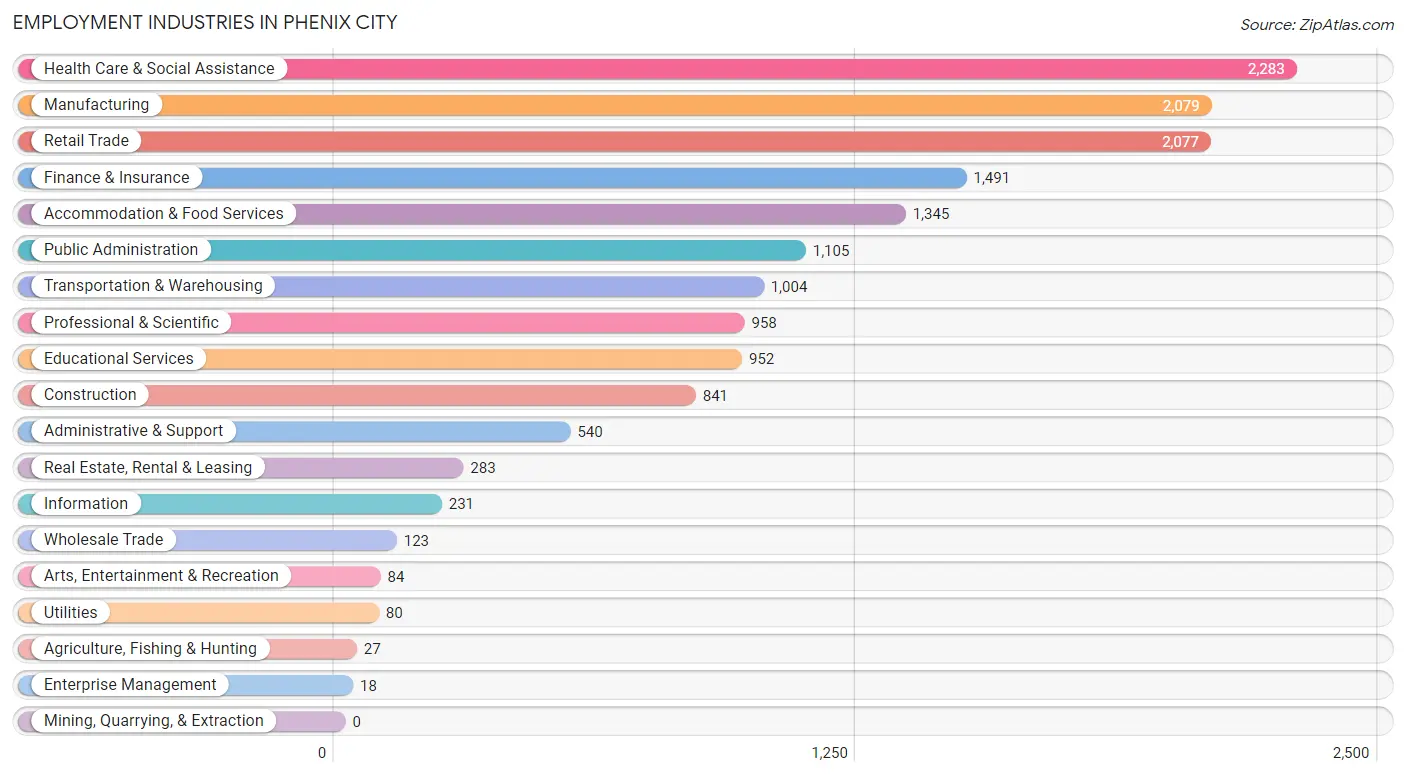
Employment Industries in Phenix City
The major employment industries in Phenix City include Health Care & Social Assistance (2,283 | 14.0%), Manufacturing (2,079 | 12.8%), Retail Trade (2,077 | 12.8%), Finance & Insurance (1,491 | 9.2%), and Accommodation & Food Services (1,345 | 8.3%).
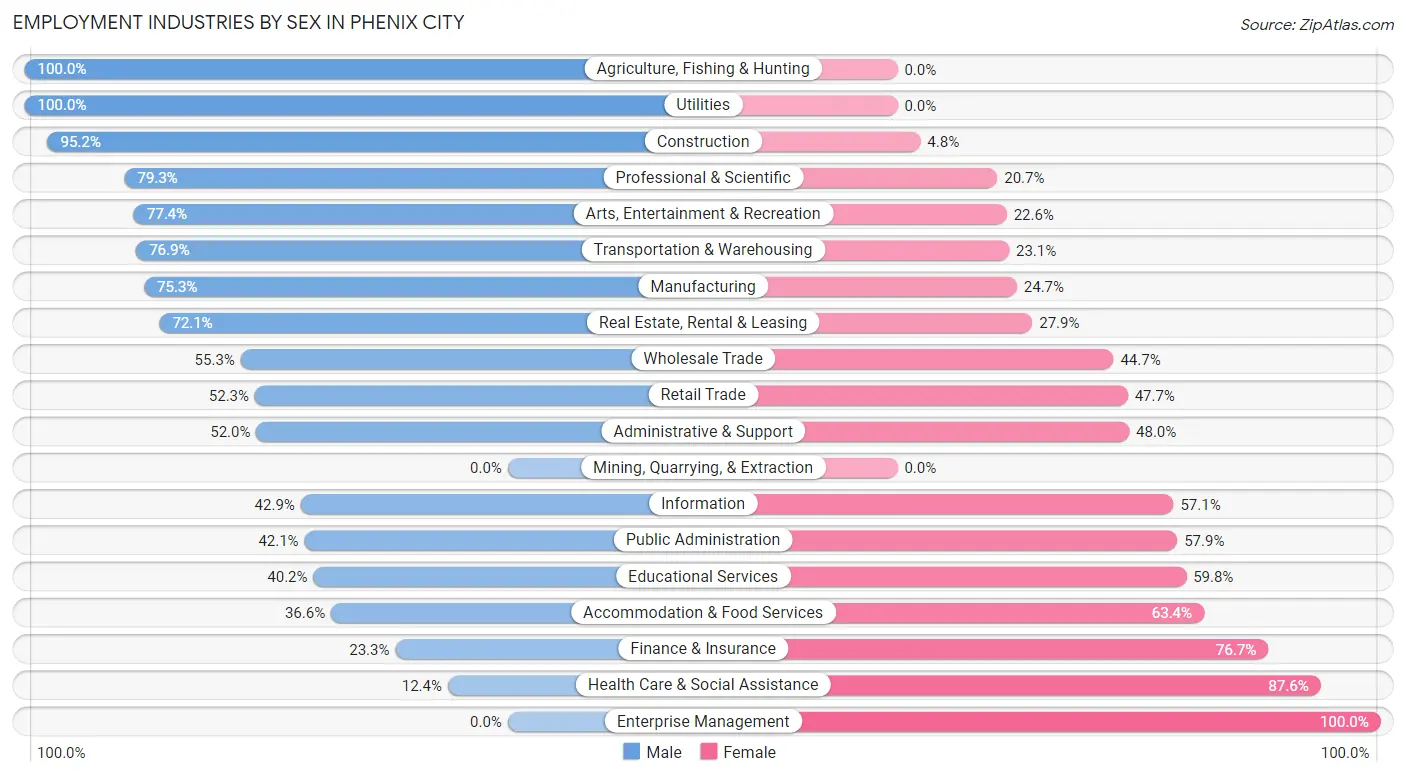
Employment Industries by Sex in Phenix City
The Phenix City industries that see more men than women are Agriculture, Fishing & Hunting (100.0%), Utilities (100.0%), and Construction (95.2%), whereas the industries that tend to have a higher number of women are Enterprise Management (100.0%), Health Care & Social Assistance (87.6%), and Finance & Insurance (76.7%).
| Industry | Male | Female |
| Agriculture, Fishing & Hunting | 27 (100.0%) | 0 (0.0%) |
| Mining, Quarrying, & Extraction | 0 (0.0%) | 0 (0.0%) |
| Construction | 801 (95.2%) | 40 (4.8%) |
| Manufacturing | 1,565 (75.3%) | 514 (24.7%) |
| Wholesale Trade | 68 (55.3%) | 55 (44.7%) |
| Retail Trade | 1,087 (52.3%) | 990 (47.7%) |
| Transportation & Warehousing | 772 (76.9%) | 232 (23.1%) |
| Utilities | 80 (100.0%) | 0 (0.0%) |
| Information | 99 (42.9%) | 132 (57.1%) |
| Finance & Insurance | 347 (23.3%) | 1,144 (76.7%) |
| Real Estate, Rental & Leasing | 204 (72.1%) | 79 (27.9%) |
| Professional & Scientific | 760 (79.3%) | 198 (20.7%) |
| Enterprise Management | 0 (0.0%) | 18 (100.0%) |
| Administrative & Support | 281 (52.0%) | 259 (48.0%) |
| Educational Services | 383 (40.2%) | 569 (59.8%) |
| Health Care & Social Assistance | 283 (12.4%) | 2,000 (87.6%) |
| Arts, Entertainment & Recreation | 65 (77.4%) | 19 (22.6%) |
| Accommodation & Food Services | 492 (36.6%) | 853 (63.4%) |
| Public Administration | 465 (42.1%) | 640 (57.9%) |
| Total | 8,035 (49.4%) | 8,221 (50.6%) |
Education in Phenix City
School Enrollment in Phenix City
The most common levels of schooling among the 10,142 students in Phenix City are middle school (2,446 | 24.1%), high school (2,278 | 22.5%), and college / undergraduate (2,045 | 20.2%).
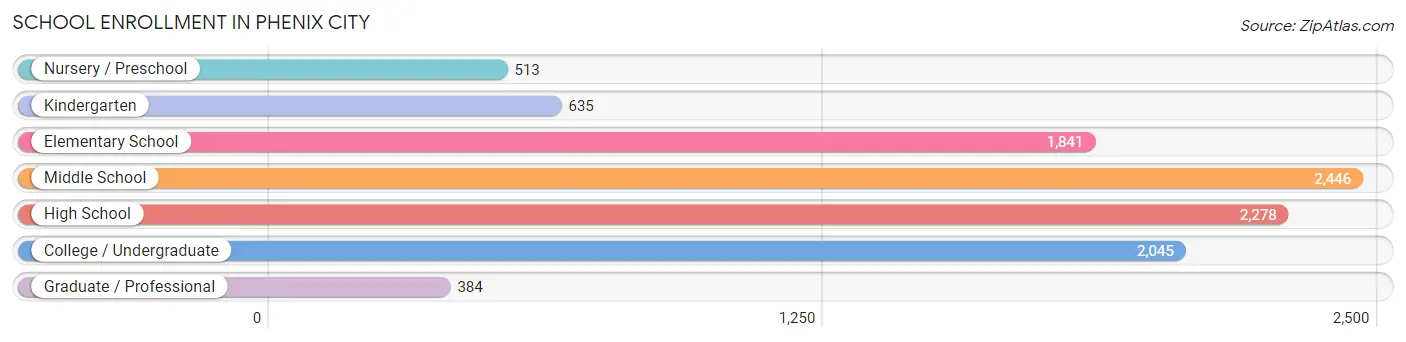
| School Level | # Students | % Students |
| Nursery / Preschool | 513 | 5.1% |
| Kindergarten | 635 | 6.3% |
| Elementary School | 1,841 | 18.1% |
| Middle School | 2,446 | 24.1% |
| High School | 2,278 | 22.5% |
| College / Undergraduate | 2,045 | 20.2% |
| Graduate / Professional | 384 | 3.8% |
| Total | 10,142 | 100.0% |
School Enrollment by Age by Funding Source in Phenix City
Out of a total of 10,142 students who are enrolled in schools in Phenix City, 1,552 (15.3%) attend a private institution, while the remaining 8,590 (84.7%) are enrolled in public schools. The age group of 3 to 4 year olds has the highest likelihood of being enrolled in private schools, with 162 (36.8% in the age bracket) enrolled. Conversely, the age group of 18 to 19 year olds has the lowest likelihood of being enrolled in a private school, with 398 (97.6% in the age bracket) attending a public institution.
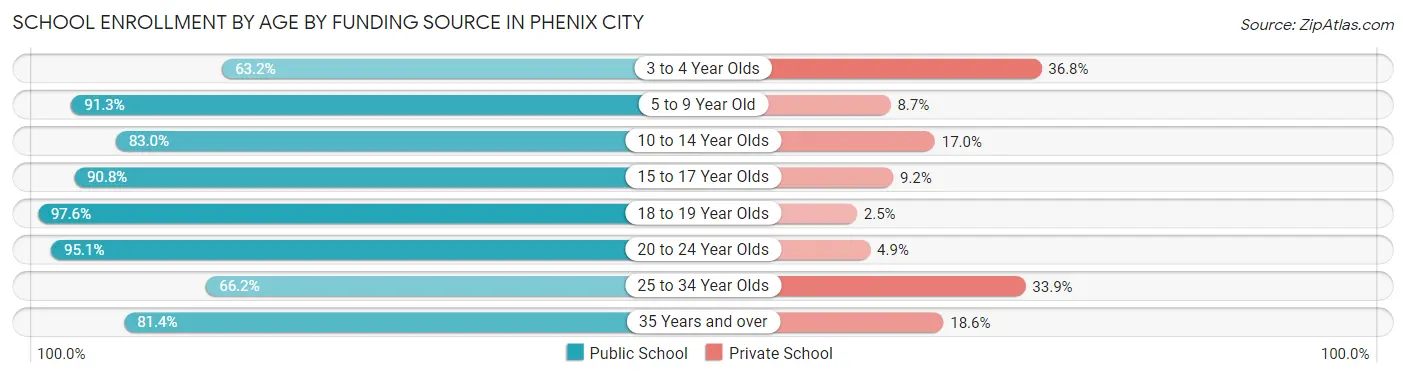
| Age Bracket | Public School | Private School |
| 3 to 4 Year Olds | 278 (63.2%) | 162 (36.8%) |
| 5 to 9 Year Old | 2,009 (91.3%) | 192 (8.7%) |
| 10 to 14 Year Olds | 2,430 (83.0%) | 497 (17.0%) |
| 15 to 17 Year Olds | 1,402 (90.8%) | 142 (9.2%) |
| 18 to 19 Year Olds | 398 (97.6%) | 10 (2.5%) |
| 20 to 24 Year Olds | 617 (95.1%) | 32 (4.9%) |
| 25 to 34 Year Olds | 635 (66.1%) | 325 (33.9%) |
| 35 Years and over | 825 (81.4%) | 188 (18.6%) |
| Total | 8,590 (84.7%) | 1,552 (15.3%) |
Educational Attainment by Field of Study in Phenix City
Business (1,475 | 25.5%), science & technology (803 | 13.9%), education (744 | 12.9%), arts & humanities (659 | 11.4%), and bio, nature & agricultural (413 | 7.1%) are the most common fields of study among 5,778 individuals in Phenix City who have obtained a bachelor's degree or higher.
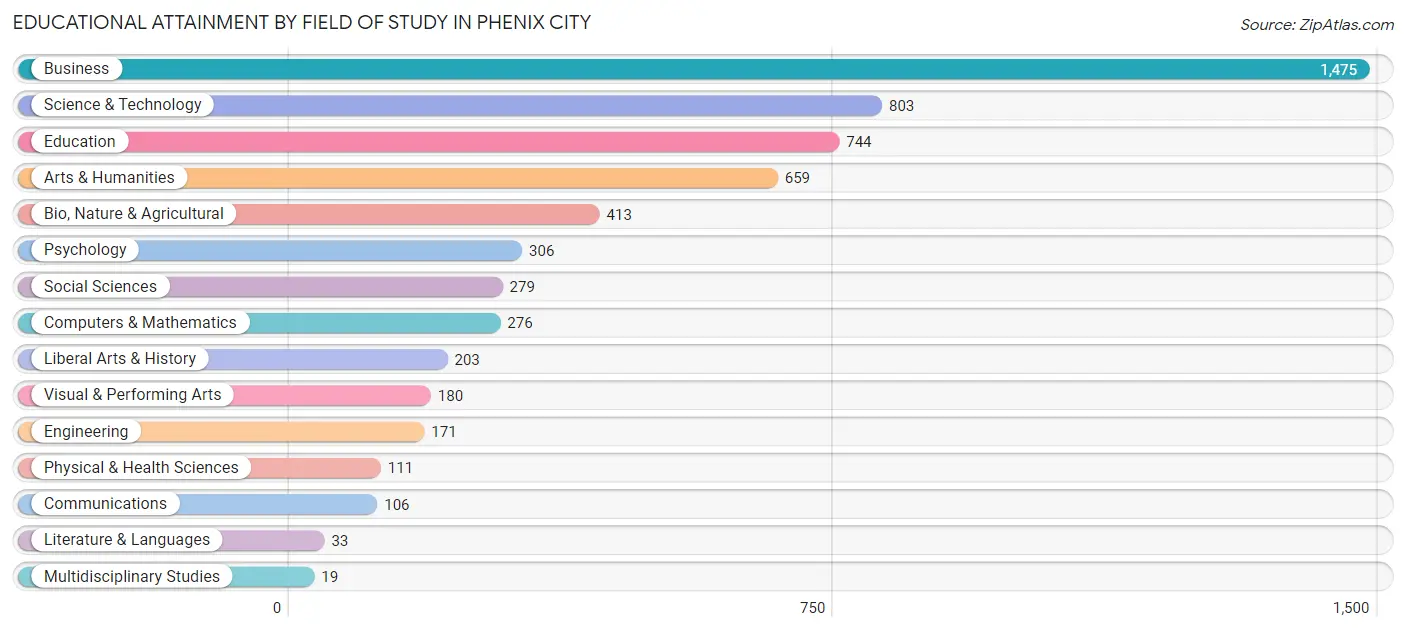
| Field of Study | # Graduates | % Graduates |
| Computers & Mathematics | 276 | 4.8% |
| Bio, Nature & Agricultural | 413 | 7.1% |
| Physical & Health Sciences | 111 | 1.9% |
| Psychology | 306 | 5.3% |
| Social Sciences | 279 | 4.8% |
| Engineering | 171 | 3.0% |
| Multidisciplinary Studies | 19 | 0.3% |
| Science & Technology | 803 | 13.9% |
| Business | 1,475 | 25.5% |
| Education | 744 | 12.9% |
| Literature & Languages | 33 | 0.6% |
| Liberal Arts & History | 203 | 3.5% |
| Visual & Performing Arts | 180 | 3.1% |
| Communications | 106 | 1.8% |
| Arts & Humanities | 659 | 11.4% |
| Total | 5,778 | 100.0% |
Transportation & Commute in Phenix City
Vehicle Availability by Sex in Phenix City
The most prevalent vehicle ownership categories in Phenix City are males with 2 vehicles (3,497, accounting for 39.7%) and females with 2 vehicles (2,886, making up 43.3%).
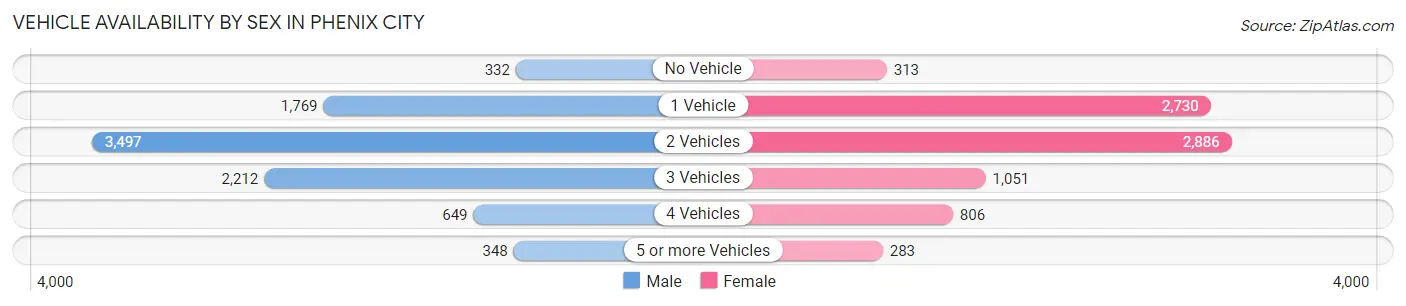
| Vehicles Available | Male | Female |
| No Vehicle | 332 (3.8%) | 313 (3.9%) |
| 1 Vehicle | 1,769 (20.1%) | 2,730 (33.8%) |
| 2 Vehicles | 3,497 (39.7%) | 2,886 (35.8%) |
| 3 Vehicles | 2,212 (25.1%) | 1,051 (13.0%) |
| 4 Vehicles | 649 (7.4%) | 806 (10.0%) |
| 5 or more Vehicles | 348 (4.0%) | 283 (3.5%) |
| Total | 8,807 (100.0%) | 8,069 (100.0%) |
Commute Time in Phenix City
The most frequently occuring commute durations in Phenix City are 15 to 19 minutes (3,252 commuters, 20.9%), 20 to 24 minutes (3,031 commuters, 19.5%), and 10 to 14 minutes (2,931 commuters, 18.9%).
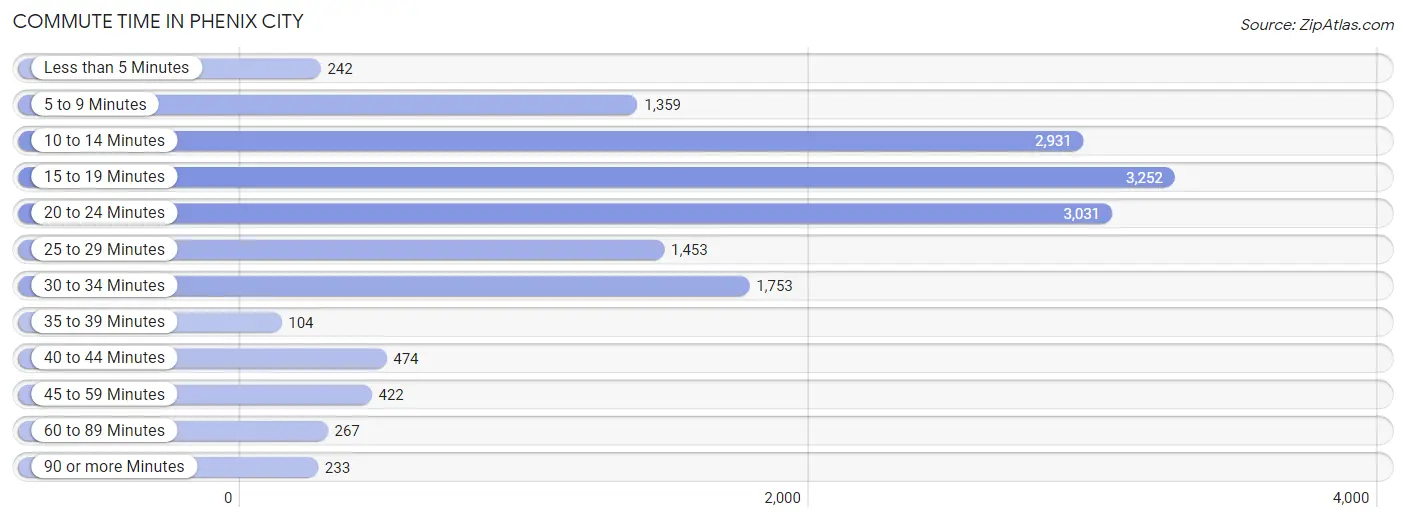
| Commute Time | # Commuters | % Commuters |
| Less than 5 Minutes | 242 | 1.6% |
| 5 to 9 Minutes | 1,359 | 8.8% |
| 10 to 14 Minutes | 2,931 | 18.9% |
| 15 to 19 Minutes | 3,252 | 20.9% |
| 20 to 24 Minutes | 3,031 | 19.5% |
| 25 to 29 Minutes | 1,453 | 9.4% |
| 30 to 34 Minutes | 1,753 | 11.3% |
| 35 to 39 Minutes | 104 | 0.7% |
| 40 to 44 Minutes | 474 | 3.0% |
| 45 to 59 Minutes | 422 | 2.7% |
| 60 to 89 Minutes | 267 | 1.7% |
| 90 or more Minutes | 233 | 1.5% |
Commute Time by Sex in Phenix City
The most common commute times in Phenix City are 15 to 19 minutes (1,660 commuters, 19.7%) for males and 15 to 19 minutes (1,592 commuters, 22.5%) for females.
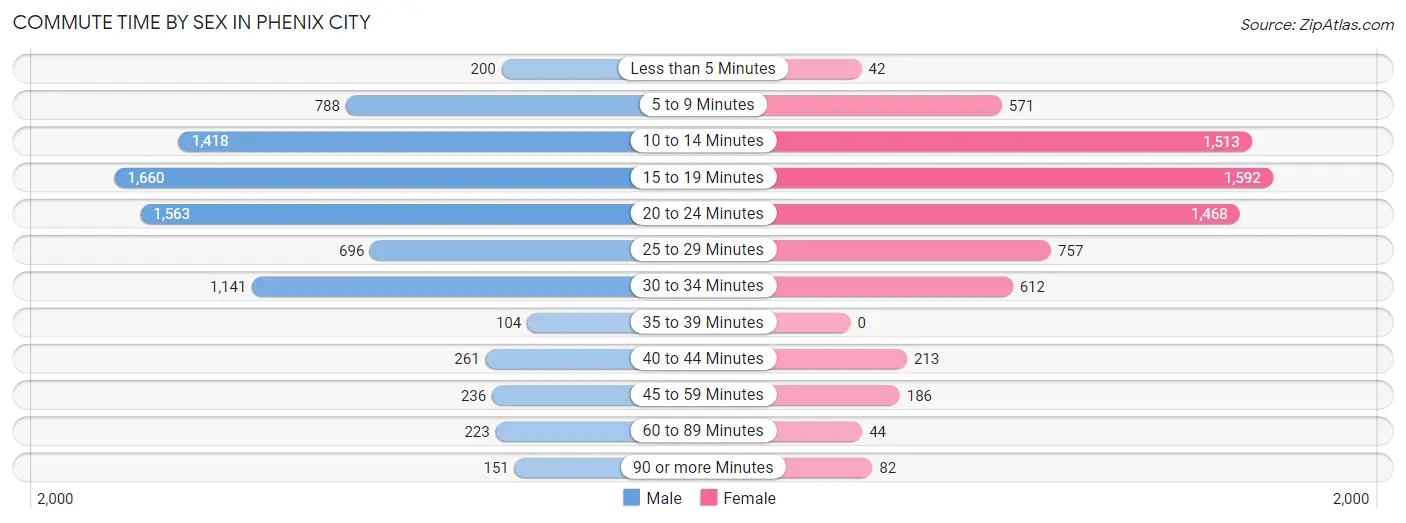
| Commute Time | Male | Female |
| Less than 5 Minutes | 200 (2.4%) | 42 (0.6%) |
| 5 to 9 Minutes | 788 (9.3%) | 571 (8.1%) |
| 10 to 14 Minutes | 1,418 (16.8%) | 1,513 (21.4%) |
| 15 to 19 Minutes | 1,660 (19.7%) | 1,592 (22.5%) |
| 20 to 24 Minutes | 1,563 (18.5%) | 1,468 (20.7%) |
| 25 to 29 Minutes | 696 (8.3%) | 757 (10.7%) |
| 30 to 34 Minutes | 1,141 (13.5%) | 612 (8.6%) |
| 35 to 39 Minutes | 104 (1.2%) | 0 (0.0%) |
| 40 to 44 Minutes | 261 (3.1%) | 213 (3.0%) |
| 45 to 59 Minutes | 236 (2.8%) | 186 (2.6%) |
| 60 to 89 Minutes | 223 (2.6%) | 44 (0.6%) |
| 90 or more Minutes | 151 (1.8%) | 82 (1.2%) |
Time of Departure to Work by Sex in Phenix City
The most frequent times of departure to work in Phenix City are 8:00 AM to 8:29 AM (1,224, 14.5%) for males and 7:30 AM to 7:59 AM (1,586, 22.4%) for females.
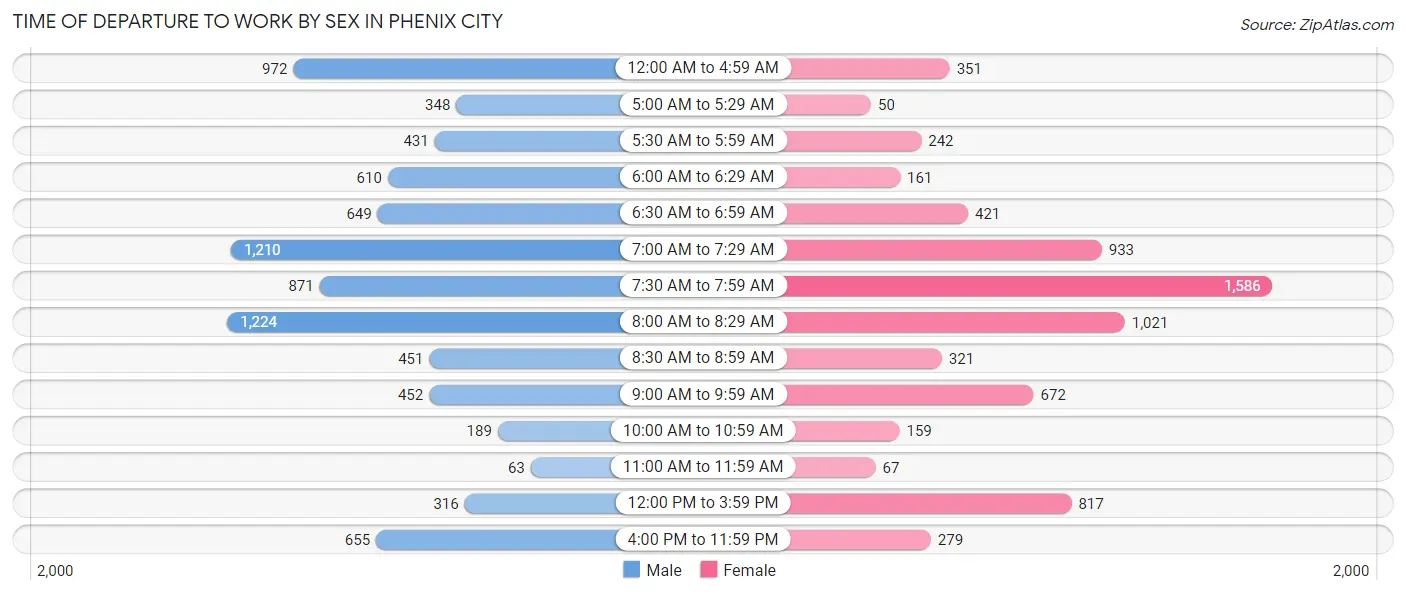
| Time of Departure | Male | Female |
| 12:00 AM to 4:59 AM | 972 (11.5%) | 351 (5.0%) |
| 5:00 AM to 5:29 AM | 348 (4.1%) | 50 (0.7%) |
| 5:30 AM to 5:59 AM | 431 (5.1%) | 242 (3.4%) |
| 6:00 AM to 6:29 AM | 610 (7.2%) | 161 (2.3%) |
| 6:30 AM to 6:59 AM | 649 (7.7%) | 421 (5.9%) |
| 7:00 AM to 7:29 AM | 1,210 (14.3%) | 933 (13.2%) |
| 7:30 AM to 7:59 AM | 871 (10.3%) | 1,586 (22.4%) |
| 8:00 AM to 8:29 AM | 1,224 (14.5%) | 1,021 (14.4%) |
| 8:30 AM to 8:59 AM | 451 (5.3%) | 321 (4.5%) |
| 9:00 AM to 9:59 AM | 452 (5.3%) | 672 (9.5%) |
| 10:00 AM to 10:59 AM | 189 (2.2%) | 159 (2.2%) |
| 11:00 AM to 11:59 AM | 63 (0.7%) | 67 (0.9%) |
| 12:00 PM to 3:59 PM | 316 (3.7%) | 817 (11.5%) |
| 4:00 PM to 11:59 PM | 655 (7.8%) | 279 (3.9%) |
| Total | 8,441 (100.0%) | 7,080 (100.0%) |
Housing Occupancy in Phenix City
Occupancy by Ownership in Phenix City
Of the total 15,852 dwellings in Phenix City, owner-occupied units account for 8,211 (51.8%), while renter-occupied units make up 7,641 (48.2%).
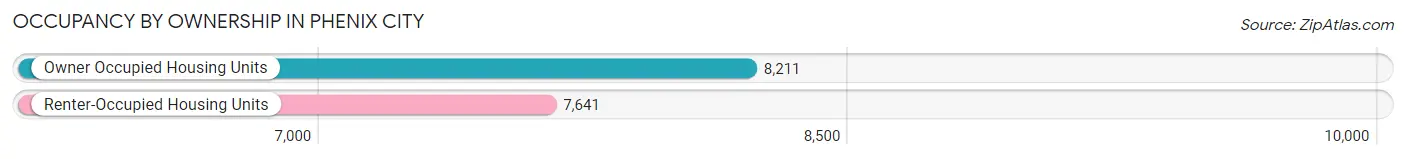
| Occupancy | # Housing Units | % Housing Units |
| Owner Occupied Housing Units | 8,211 | 51.8% |
| Renter-Occupied Housing Units | 7,641 | 48.2% |
| Total Occupied Housing Units | 15,852 | 100.0% |
Occupancy by Household Size in Phenix City
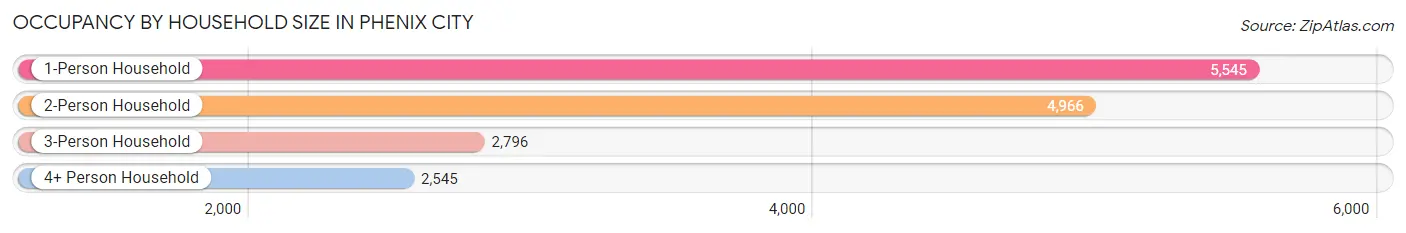
| Household Size | # Housing Units | % Housing Units |
| 1-Person Household | 5,545 | 35.0% |
| 2-Person Household | 4,966 | 31.3% |
| 3-Person Household | 2,796 | 17.6% |
| 4+ Person Household | 2,545 | 16.1% |
| Total Housing Units | 15,852 | 100.0% |
Occupancy by Ownership by Household Size in Phenix City
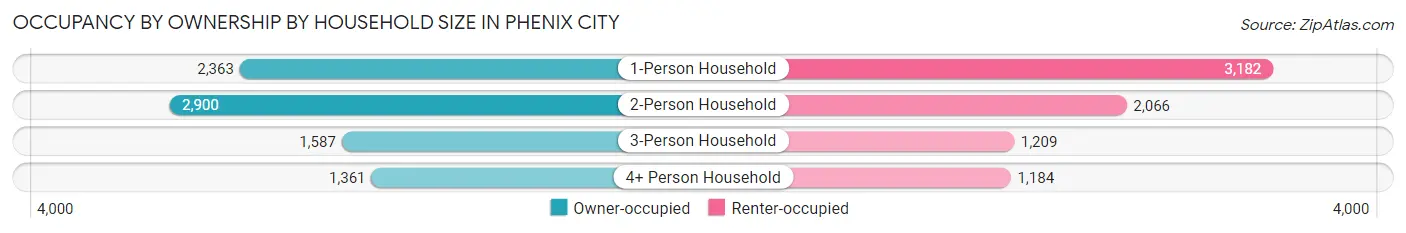
| Household Size | Owner-occupied | Renter-occupied |
| 1-Person Household | 2,363 (42.6%) | 3,182 (57.4%) |
| 2-Person Household | 2,900 (58.4%) | 2,066 (41.6%) |
| 3-Person Household | 1,587 (56.8%) | 1,209 (43.2%) |
| 4+ Person Household | 1,361 (53.5%) | 1,184 (46.5%) |
| Total Housing Units | 8,211 (51.8%) | 7,641 (48.2%) |
Occupancy by Educational Attainment in Phenix City
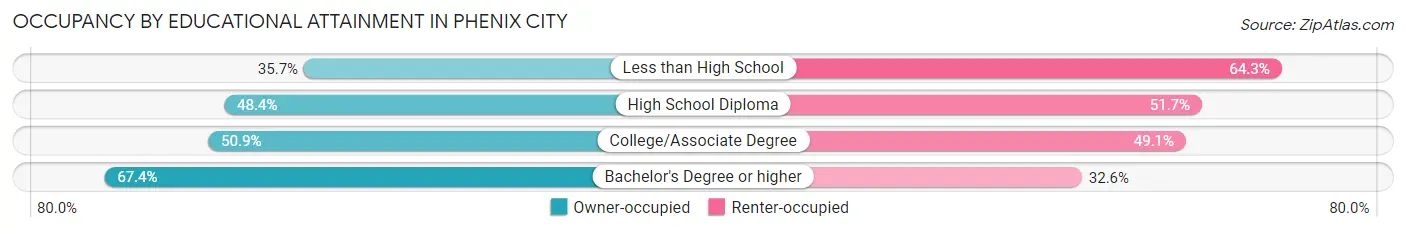
| Household Size | Owner-occupied | Renter-occupied |
| Less than High School | 749 (35.7%) | 1,349 (64.3%) |
| High School Diploma | 1,804 (48.3%) | 1,927 (51.6%) |
| College/Associate Degree | 3,377 (50.9%) | 3,260 (49.1%) |
| Bachelor's Degree or higher | 2,281 (67.4%) | 1,105 (32.6%) |
Occupancy by Age of Householder in Phenix City
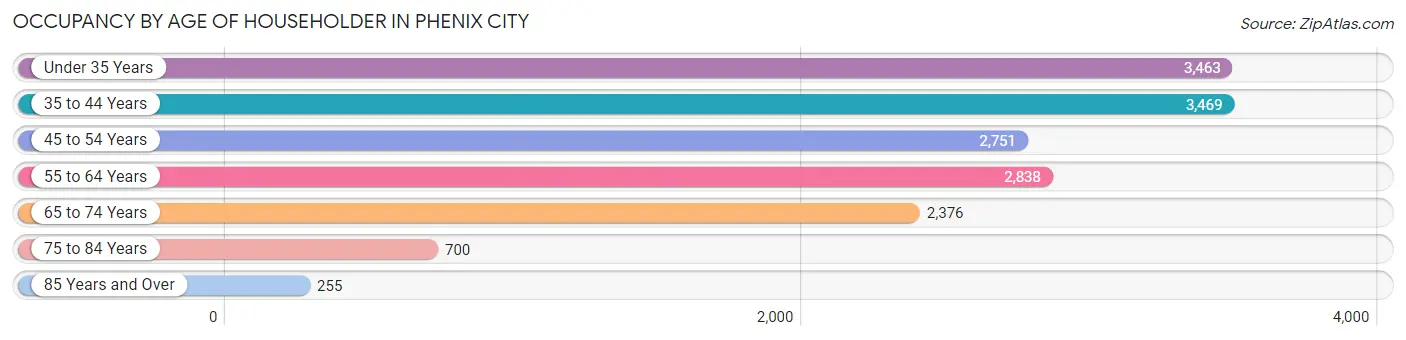
| Age Bracket | # Households | % Households |
| Under 35 Years | 3,463 | 21.8% |
| 35 to 44 Years | 3,469 | 21.9% |
| 45 to 54 Years | 2,751 | 17.3% |
| 55 to 64 Years | 2,838 | 17.9% |
| 65 to 74 Years | 2,376 | 15.0% |
| 75 to 84 Years | 700 | 4.4% |
| 85 Years and Over | 255 | 1.6% |
| Total | 15,852 | 100.0% |
Housing Finances in Phenix City
Median Income by Occupancy in Phenix City
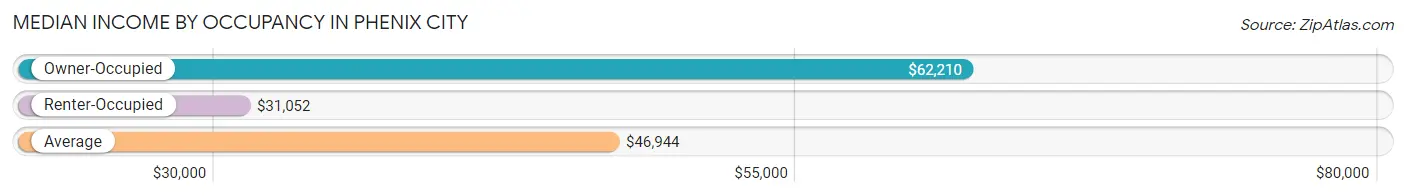
| Occupancy Type | # Households | Median Income |
| Owner-Occupied | 8,211 (51.8%) | $62,210 |
| Renter-Occupied | 7,641 (48.2%) | $31,052 |
| Average | 15,852 (100.0%) | $46,944 |
Occupancy by Householder Income Bracket in Phenix City
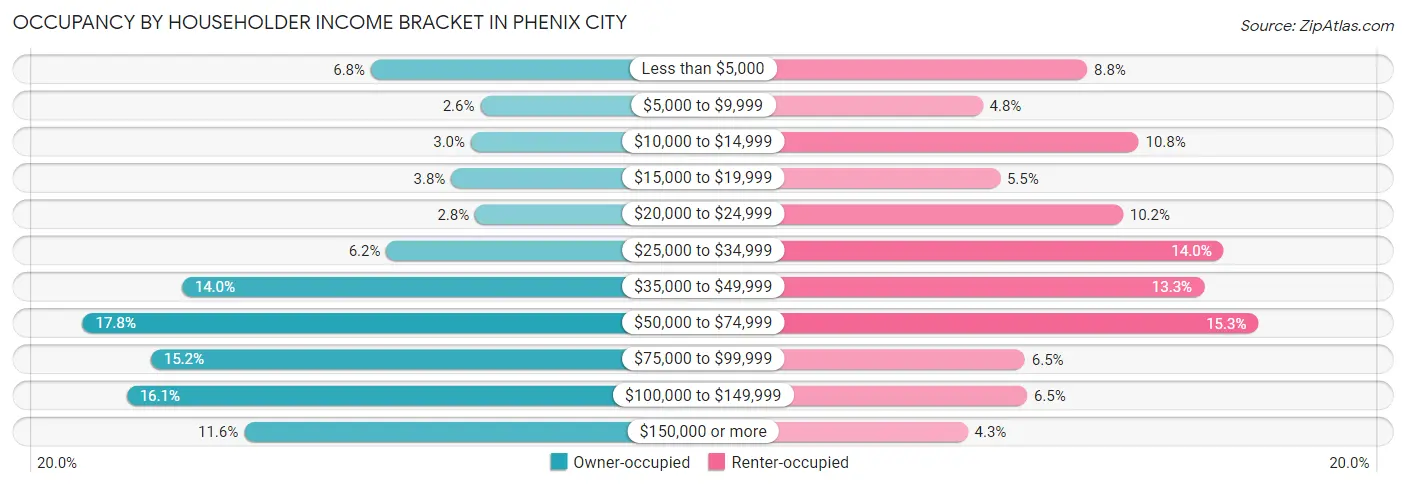
| Income Bracket | Owner-occupied | Renter-occupied |
| Less than $5,000 | 559 (6.8%) | 674 (8.8%) |
| $5,000 to $9,999 | 217 (2.6%) | 370 (4.8%) |
| $10,000 to $14,999 | 246 (3.0%) | 824 (10.8%) |
| $15,000 to $19,999 | 308 (3.7%) | 420 (5.5%) |
| $20,000 to $24,999 | 233 (2.8%) | 778 (10.2%) |
| $25,000 to $34,999 | 511 (6.2%) | 1,071 (14.0%) |
| $35,000 to $49,999 | 1,150 (14.0%) | 1,014 (13.3%) |
| $50,000 to $74,999 | 1,461 (17.8%) | 1,172 (15.3%) |
| $75,000 to $99,999 | 1,247 (15.2%) | 493 (6.5%) |
| $100,000 to $149,999 | 1,323 (16.1%) | 499 (6.5%) |
| $150,000 or more | 956 (11.6%) | 326 (4.3%) |
| Total | 8,211 (100.0%) | 7,641 (100.0%) |
Monthly Housing Cost Tiers in Phenix City
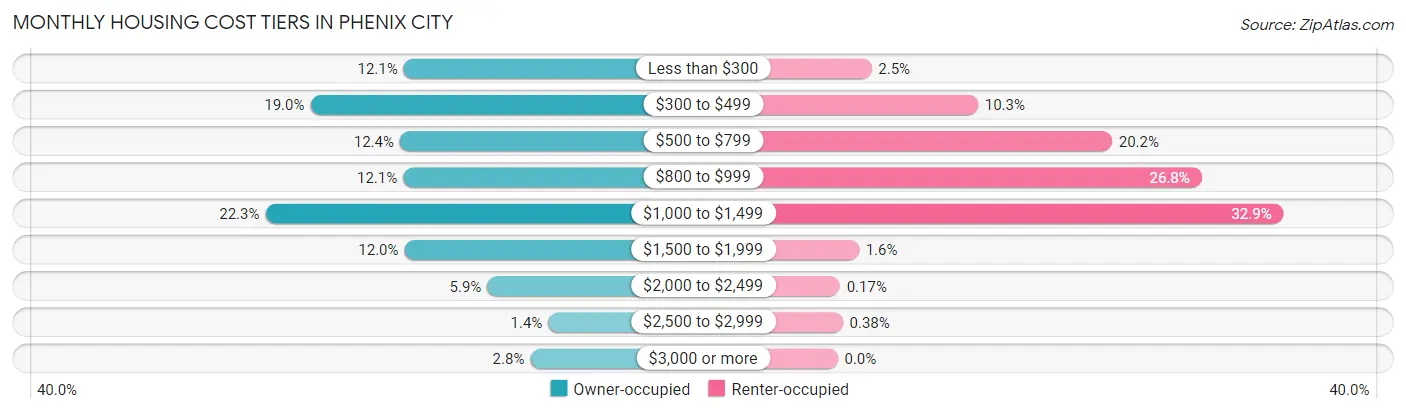
| Monthly Cost | Owner-occupied | Renter-occupied |
| Less than $300 | 993 (12.1%) | 191 (2.5%) |
| $300 to $499 | 1,557 (19.0%) | 790 (10.3%) |
| $500 to $799 | 1,016 (12.4%) | 1,544 (20.2%) |
| $800 to $999 | 996 (12.1%) | 2,049 (26.8%) |
| $1,000 to $1,499 | 1,829 (22.3%) | 2,510 (32.9%) |
| $1,500 to $1,999 | 988 (12.0%) | 120 (1.6%) |
| $2,000 to $2,499 | 487 (5.9%) | 13 (0.2%) |
| $2,500 to $2,999 | 118 (1.4%) | 29 (0.4%) |
| $3,000 or more | 227 (2.8%) | 0 (0.0%) |
| Total | 8,211 (100.0%) | 7,641 (100.0%) |
Physical Housing Characteristics in Phenix City
Housing Structures in Phenix City
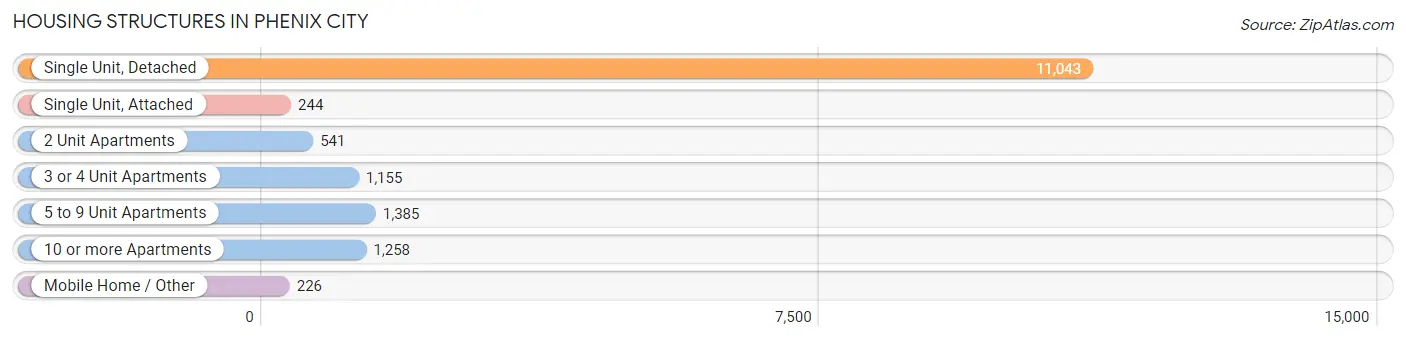
| Structure Type | # Housing Units | % Housing Units |
| Single Unit, Detached | 11,043 | 69.7% |
| Single Unit, Attached | 244 | 1.5% |
| 2 Unit Apartments | 541 | 3.4% |
| 3 or 4 Unit Apartments | 1,155 | 7.3% |
| 5 to 9 Unit Apartments | 1,385 | 8.7% |
| 10 or more Apartments | 1,258 | 7.9% |
| Mobile Home / Other | 226 | 1.4% |
| Total | 15,852 | 100.0% |
Housing Structures by Occupancy in Phenix City
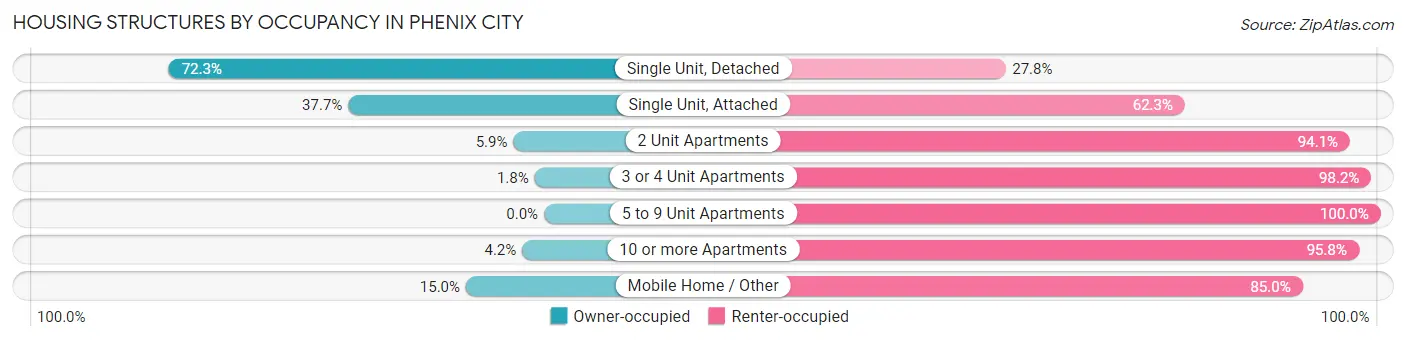
| Structure Type | Owner-occupied | Renter-occupied |
| Single Unit, Detached | 7,979 (72.3%) | 3,064 (27.8%) |
| Single Unit, Attached | 92 (37.7%) | 152 (62.3%) |
| 2 Unit Apartments | 32 (5.9%) | 509 (94.1%) |
| 3 or 4 Unit Apartments | 21 (1.8%) | 1,134 (98.2%) |
| 5 to 9 Unit Apartments | 0 (0.0%) | 1,385 (100.0%) |
| 10 or more Apartments | 53 (4.2%) | 1,205 (95.8%) |
| Mobile Home / Other | 34 (15.0%) | 192 (85.0%) |
| Total | 8,211 (51.8%) | 7,641 (48.2%) |
Housing Structures by Number of Rooms in Phenix City
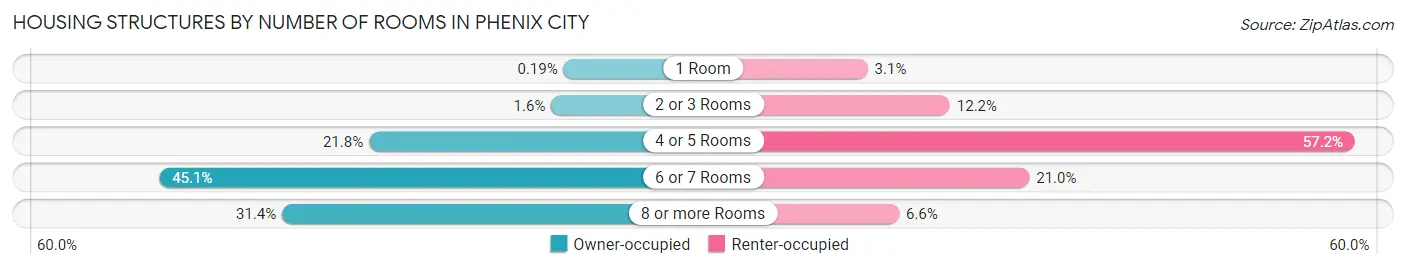
| Number of Rooms | Owner-occupied | Renter-occupied |
| 1 Room | 16 (0.2%) | 235 (3.1%) |
| 2 or 3 Rooms | 127 (1.5%) | 932 (12.2%) |
| 4 or 5 Rooms | 1,788 (21.8%) | 4,367 (57.2%) |
| 6 or 7 Rooms | 3,700 (45.1%) | 1,606 (21.0%) |
| 8 or more Rooms | 2,580 (31.4%) | 501 (6.6%) |
| Total | 8,211 (100.0%) | 7,641 (100.0%) |
Housing Structure by Heating Type in Phenix City
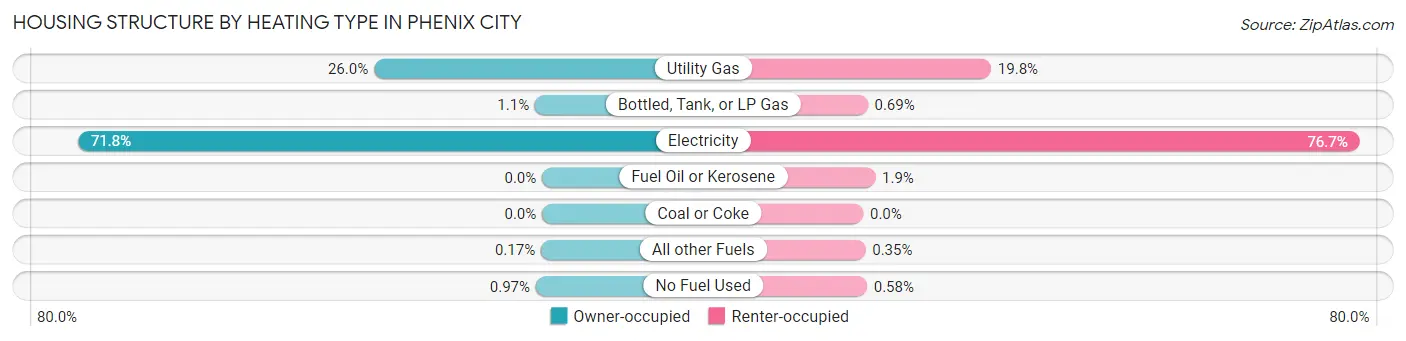
| Heating Type | Owner-occupied | Renter-occupied |
| Utility Gas | 2,134 (26.0%) | 1,511 (19.8%) |
| Bottled, Tank, or LP Gas | 90 (1.1%) | 53 (0.7%) |
| Electricity | 5,893 (71.8%) | 5,864 (76.7%) |
| Fuel Oil or Kerosene | 0 (0.0%) | 142 (1.9%) |
| Coal or Coke | 0 (0.0%) | 0 (0.0%) |
| All other Fuels | 14 (0.2%) | 27 (0.4%) |
| No Fuel Used | 80 (1.0%) | 44 (0.6%) |
| Total | 8,211 (100.0%) | 7,641 (100.0%) |
Household Vehicle Usage in Phenix City
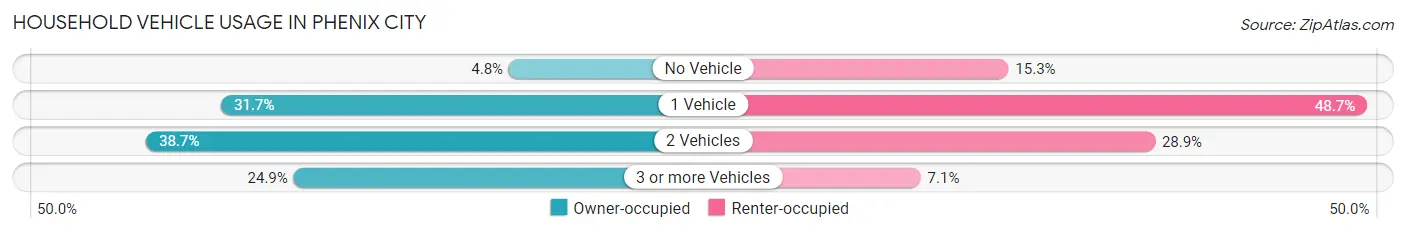
| Vehicles per Household | Owner-occupied | Renter-occupied |
| No Vehicle | 393 (4.8%) | 1,166 (15.3%) |
| 1 Vehicle | 2,600 (31.7%) | 3,724 (48.7%) |
| 2 Vehicles | 3,174 (38.7%) | 2,211 (28.9%) |
| 3 or more Vehicles | 2,044 (24.9%) | 540 (7.1%) |
| Total | 8,211 (100.0%) | 7,641 (100.0%) |
Real Estate & Mortgages in Phenix City
Real Estate and Mortgage Overview in Phenix City
| Characteristic | Without Mortgage | With Mortgage |
| Housing Units | 3,255 | 4,956 |
| Median Property Value | $132,000 | $179,000 |
| Median Household Income | $47,713 | $715 |
| Monthly Housing Costs | $358 | $227 |
| Real Estate Taxes | $591 | $496 |
Property Value by Mortgage Status in Phenix City
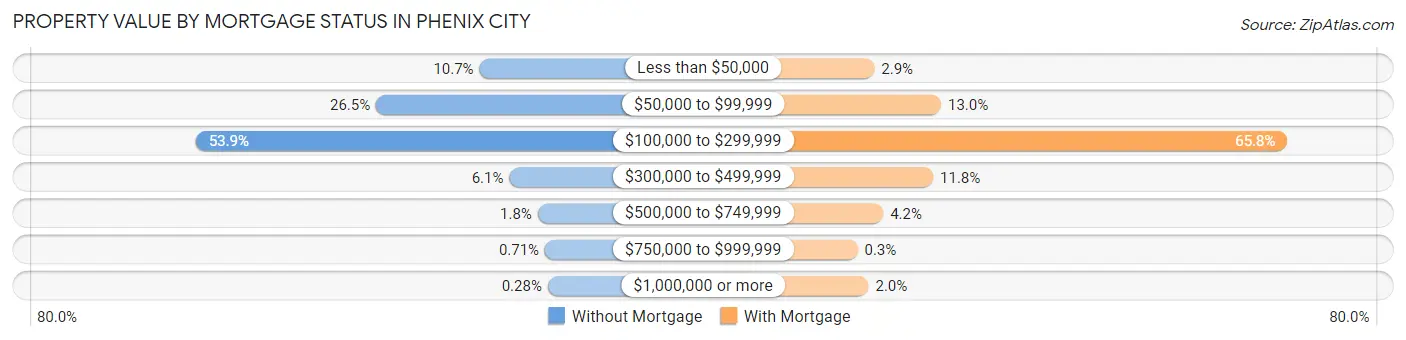
| Property Value | Without Mortgage | With Mortgage |
| Less than $50,000 | 348 (10.7%) | 142 (2.9%) |
| $50,000 to $99,999 | 861 (26.5%) | 646 (13.0%) |
| $100,000 to $299,999 | 1,755 (53.9%) | 3,260 (65.8%) |
| $300,000 to $499,999 | 200 (6.1%) | 586 (11.8%) |
| $500,000 to $749,999 | 59 (1.8%) | 209 (4.2%) |
| $750,000 to $999,999 | 23 (0.7%) | 15 (0.3%) |
| $1,000,000 or more | 9 (0.3%) | 98 (2.0%) |
| Total | 3,255 (100.0%) | 4,956 (100.0%) |
Household Income by Mortgage Status in Phenix City
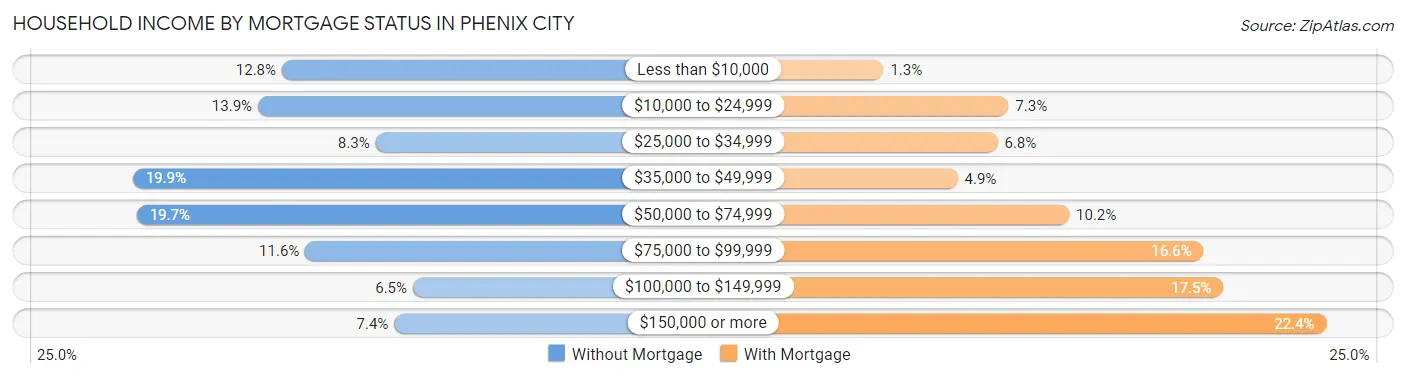
| Household Income | Without Mortgage | With Mortgage |
| Less than $10,000 | 415 (12.8%) | 66 (1.3%) |
| $10,000 to $24,999 | 452 (13.9%) | 361 (7.3%) |
| $25,000 to $34,999 | 270 (8.3%) | 335 (6.8%) |
| $35,000 to $49,999 | 646 (19.9%) | 241 (4.9%) |
| $50,000 to $74,999 | 640 (19.7%) | 504 (10.2%) |
| $75,000 to $99,999 | 379 (11.6%) | 821 (16.6%) |
| $100,000 to $149,999 | 212 (6.5%) | 868 (17.5%) |
| $150,000 or more | 241 (7.4%) | 1,111 (22.4%) |
| Total | 3,255 (100.0%) | 4,956 (100.0%) |
Property Value to Household Income Ratio in Phenix City
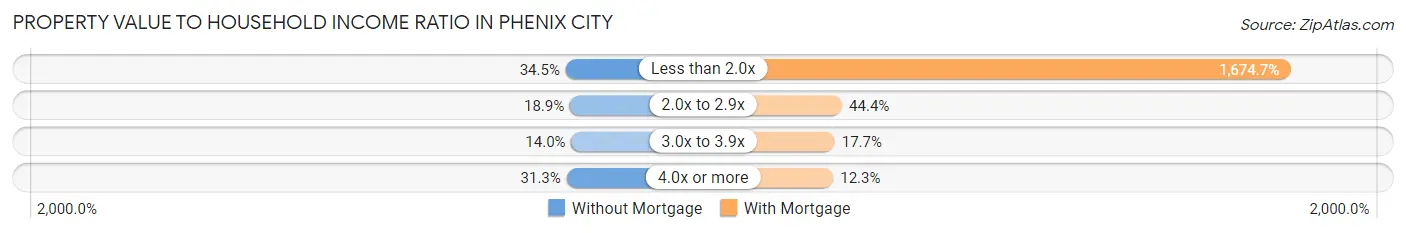
| Value-to-Income Ratio | Without Mortgage | With Mortgage |
| Less than 2.0x | 1,124 (34.5%) | 83,000 (1,674.7%) |
| 2.0x to 2.9x | 615 (18.9%) | 2,201 (44.4%) |
| 3.0x to 3.9x | 454 (14.0%) | 876 (17.7%) |
| 4.0x or more | 1,020 (31.3%) | 607 (12.2%) |
| Total | 3,255 (100.0%) | 4,956 (100.0%) |
Real Estate Taxes by Mortgage Status in Phenix City
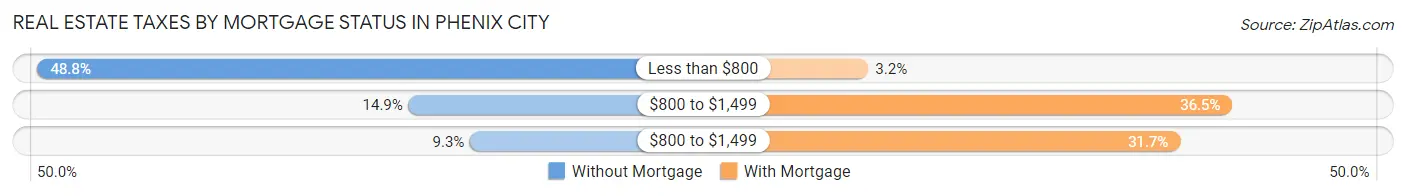
| Property Taxes | Without Mortgage | With Mortgage |
| Less than $800 | 1,589 (48.8%) | 160 (3.2%) |
| $800 to $1,499 | 486 (14.9%) | 1,807 (36.5%) |
| $800 to $1,499 | 303 (9.3%) | 1,571 (31.7%) |
| Total | 3,255 (100.0%) | 4,956 (100.0%) |
Health & Disability in Phenix City
Health Insurance Coverage by Age in Phenix City
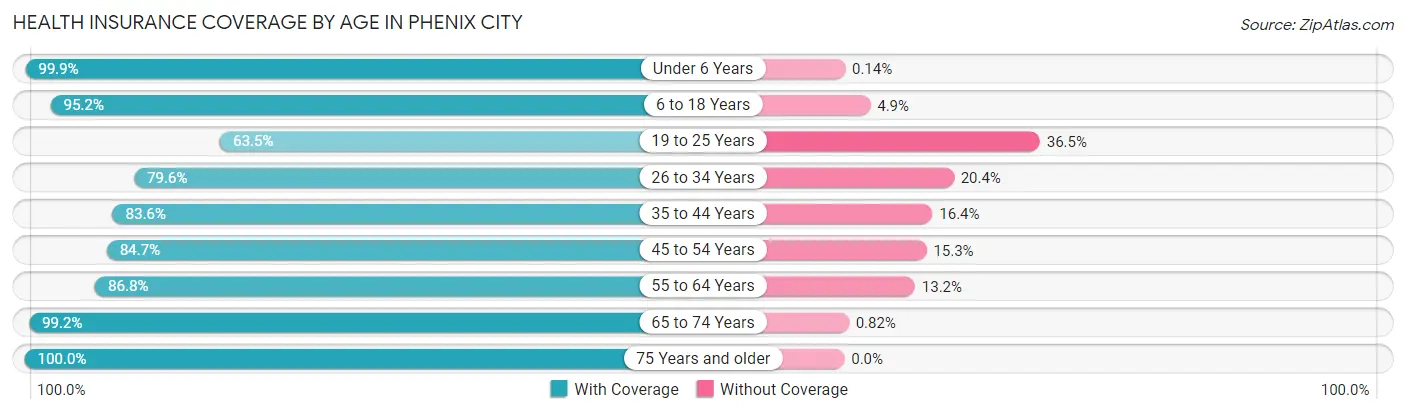
| Age Bracket | With Coverage | Without Coverage |
| Under 6 Years | 2,839 (99.9%) | 4 (0.1%) |
| 6 to 18 Years | 6,477 (95.2%) | 330 (4.9%) |
| 19 to 25 Years | 2,088 (63.5%) | 1,198 (36.5%) |
| 26 to 34 Years | 3,703 (79.6%) | 949 (20.4%) |
| 35 to 44 Years | 4,534 (83.6%) | 891 (16.4%) |
| 45 to 54 Years | 3,887 (84.7%) | 703 (15.3%) |
| 55 to 64 Years | 3,885 (86.8%) | 589 (13.2%) |
| 65 to 74 Years | 3,406 (99.2%) | 28 (0.8%) |
| 75 Years and older | 1,539 (100.0%) | 0 (0.0%) |
| Total | 32,358 (87.3%) | 4,692 (12.7%) |
Health Insurance Coverage by Citizenship Status in Phenix City
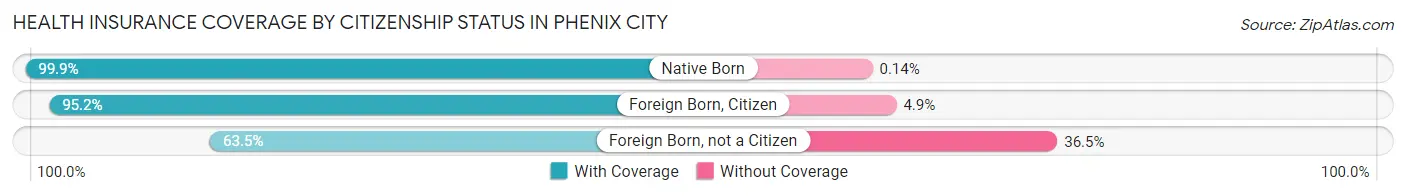
| Citizenship Status | With Coverage | Without Coverage |
| Native Born | 2,839 (99.9%) | 4 (0.1%) |
| Foreign Born, Citizen | 6,477 (95.2%) | 330 (4.9%) |
| Foreign Born, not a Citizen | 2,088 (63.5%) | 1,198 (36.5%) |
Health Insurance Coverage by Household Income in Phenix City
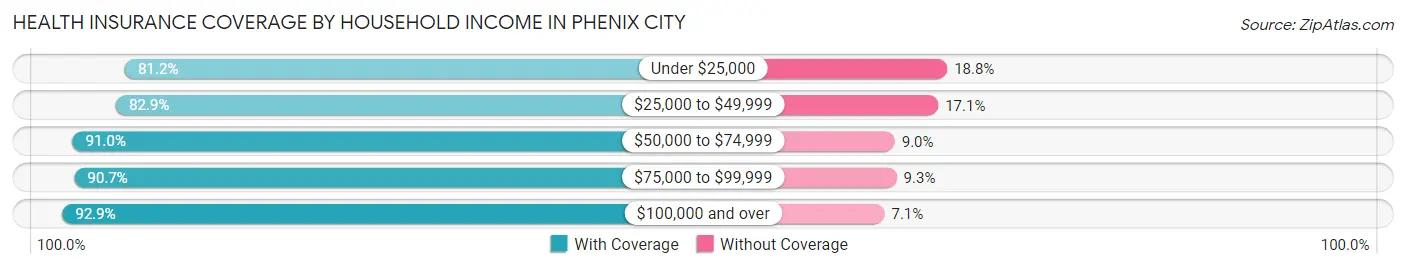
| Household Income | With Coverage | Without Coverage |
| Under $25,000 | 7,656 (81.2%) | 1,774 (18.8%) |
| $25,000 to $49,999 | 5,951 (82.9%) | 1,230 (17.1%) |
| $50,000 to $74,999 | 5,793 (91.0%) | 572 (9.0%) |
| $75,000 to $99,999 | 4,570 (90.7%) | 471 (9.3%) |
| $100,000 and over | 8,328 (92.9%) | 634 (7.1%) |
Public vs Private Health Insurance Coverage by Age in Phenix City
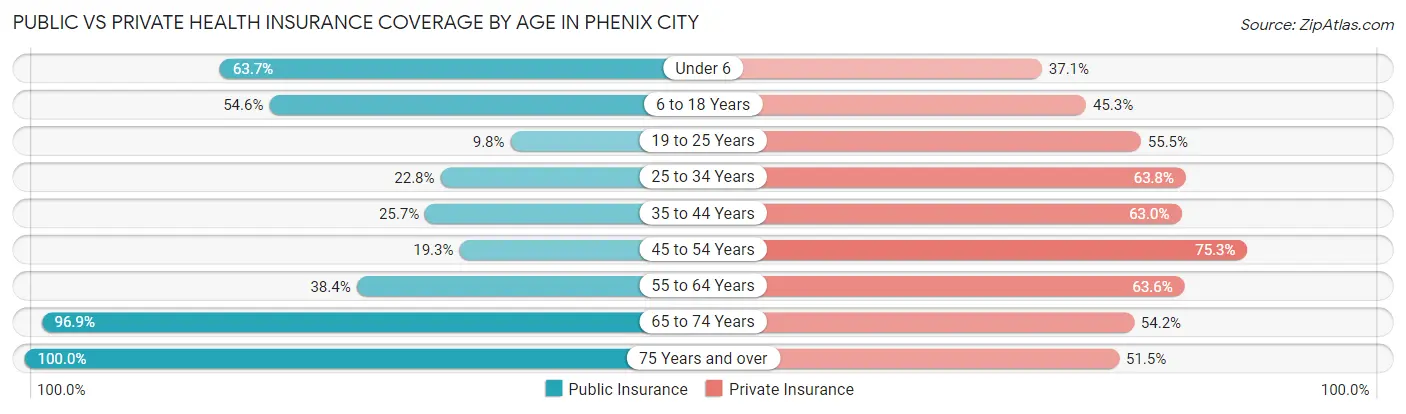
| Age Bracket | Public Insurance | Private Insurance |
| Under 6 | 1,812 (63.7%) | 1,056 (37.1%) |
| 6 to 18 Years | 3,716 (54.6%) | 3,086 (45.3%) |
| 19 to 25 Years | 323 (9.8%) | 1,824 (55.5%) |
| 25 to 34 Years | 1,062 (22.8%) | 2,970 (63.8%) |
| 35 to 44 Years | 1,392 (25.7%) | 3,418 (63.0%) |
| 45 to 54 Years | 887 (19.3%) | 3,455 (75.3%) |
| 55 to 64 Years | 1,718 (38.4%) | 2,846 (63.6%) |
| 65 to 74 Years | 3,326 (96.9%) | 1,862 (54.2%) |
| 75 Years and over | 1,539 (100.0%) | 792 (51.5%) |
| Total | 15,775 (42.6%) | 21,309 (57.5%) |
Disability Status by Sex by Age in Phenix City
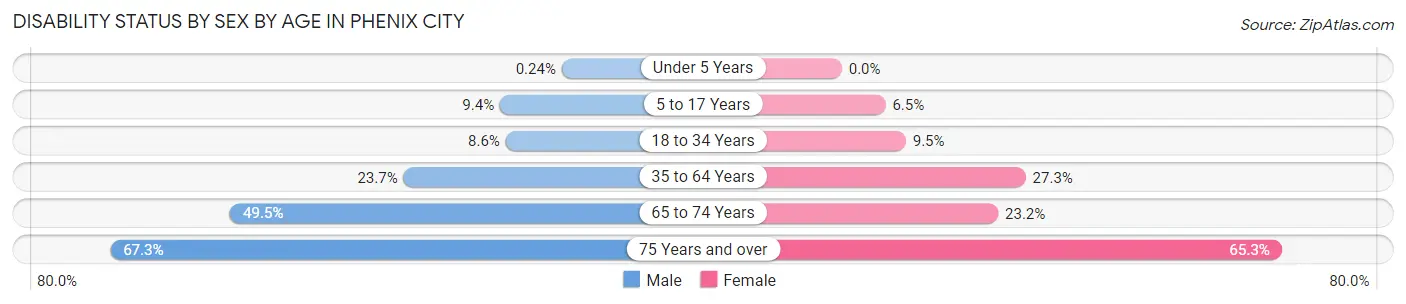
| Age Bracket | Male | Female |
| Under 5 Years | 3 (0.2%) | 0 (0.0%) |
| 5 to 17 Years | 364 (9.4%) | 195 (6.5%) |
| 18 to 34 Years | 353 (8.6%) | 411 (9.5%) |
| 35 to 64 Years | 1,503 (23.7%) | 2,227 (27.3%) |
| 65 to 74 Years | 738 (49.5%) | 451 (23.2%) |
| 75 Years and over | 440 (67.3%) | 578 (65.3%) |
Disability Class by Sex by Age in Phenix City
Disability Class: Hearing Difficulty
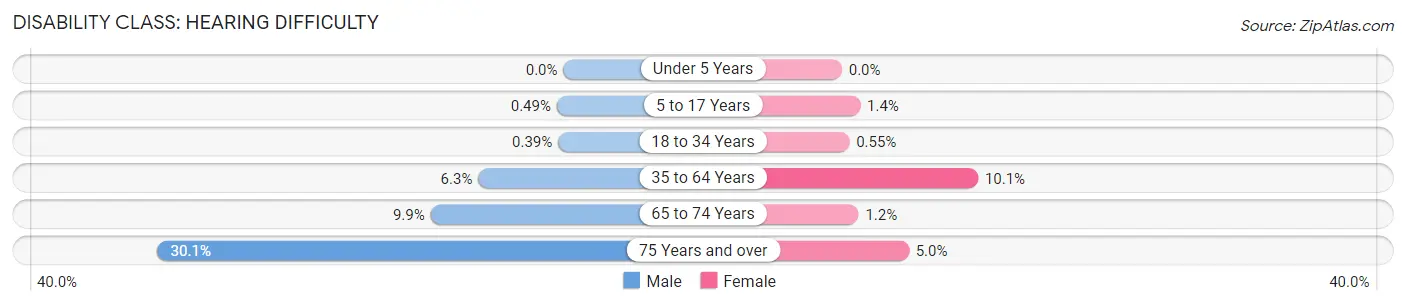
| Age Bracket | Male | Female |
| Under 5 Years | 0 (0.0%) | 0 (0.0%) |
| 5 to 17 Years | 19 (0.5%) | 41 (1.4%) |
| 18 to 34 Years | 16 (0.4%) | 24 (0.5%) |
| 35 to 64 Years | 400 (6.3%) | 825 (10.1%) |
| 65 to 74 Years | 147 (9.9%) | 24 (1.2%) |
| 75 Years and over | 197 (30.1%) | 44 (5.0%) |
Disability Class: Vision Difficulty
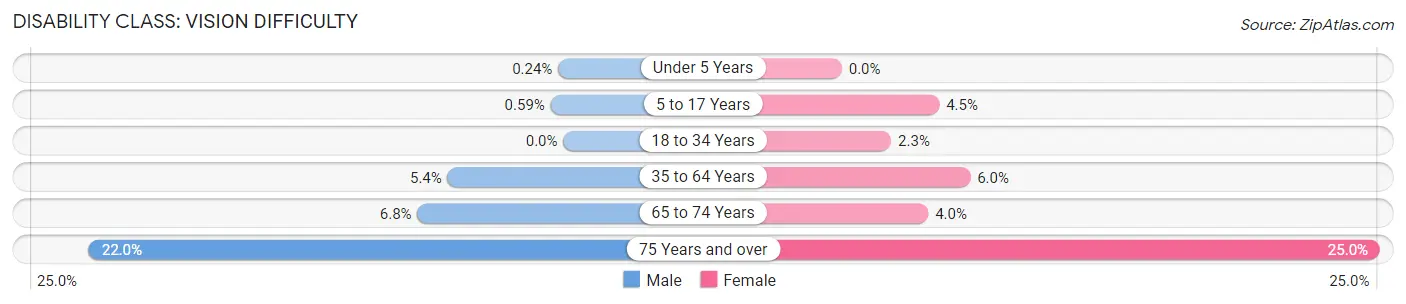
| Age Bracket | Male | Female |
| Under 5 Years | 3 (0.2%) | 0 (0.0%) |
| 5 to 17 Years | 23 (0.6%) | 136 (4.5%) |
| 18 to 34 Years | 0 (0.0%) | 99 (2.3%) |
| 35 to 64 Years | 340 (5.4%) | 486 (6.0%) |
| 65 to 74 Years | 101 (6.8%) | 78 (4.0%) |
| 75 Years and over | 144 (22.0%) | 221 (25.0%) |
Disability Class: Cognitive Difficulty
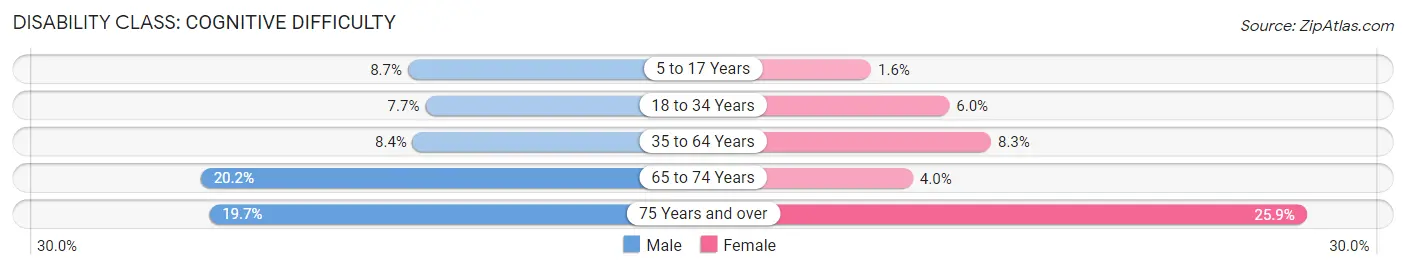
| Age Bracket | Male | Female |
| 5 to 17 Years | 335 (8.7%) | 49 (1.6%) |
| 18 to 34 Years | 317 (7.7%) | 259 (6.0%) |
| 35 to 64 Years | 531 (8.4%) | 678 (8.3%) |
| 65 to 74 Years | 301 (20.2%) | 77 (4.0%) |
| 75 Years and over | 129 (19.7%) | 229 (25.9%) |
Disability Class: Ambulatory Difficulty
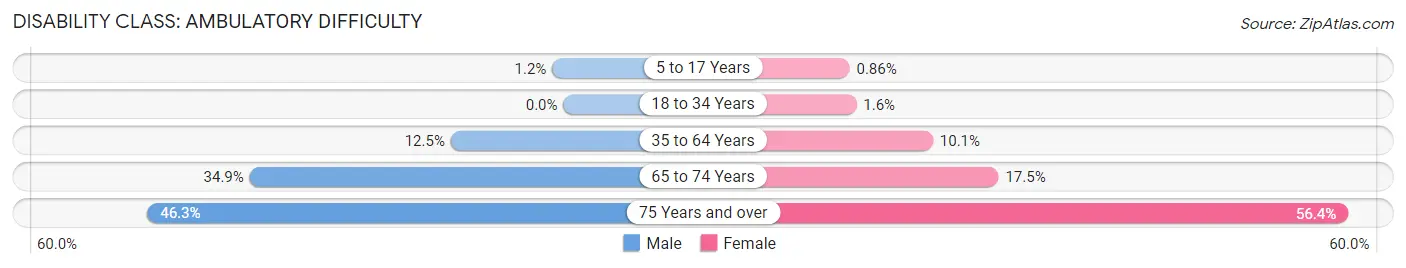
| Age Bracket | Male | Female |
| 5 to 17 Years | 48 (1.2%) | 26 (0.9%) |
| 18 to 34 Years | 0 (0.0%) | 70 (1.6%) |
| 35 to 64 Years | 794 (12.5%) | 827 (10.1%) |
| 65 to 74 Years | 521 (34.9%) | 339 (17.4%) |
| 75 Years and over | 303 (46.3%) | 499 (56.4%) |
Disability Class: Self-Care Difficulty
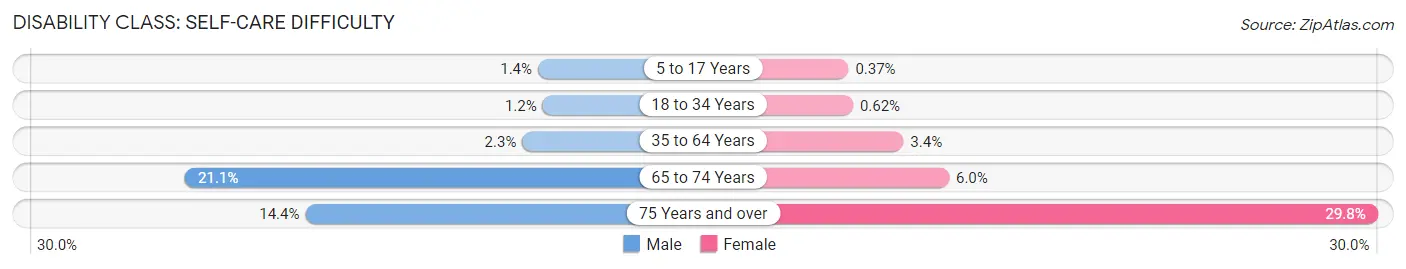
| Age Bracket | Male | Female |
| 5 to 17 Years | 55 (1.4%) | 11 (0.4%) |
| 18 to 34 Years | 48 (1.2%) | 27 (0.6%) |
| 35 to 64 Years | 145 (2.3%) | 280 (3.4%) |
| 65 to 74 Years | 314 (21.1%) | 116 (6.0%) |
| 75 Years and over | 94 (14.4%) | 264 (29.8%) |
Technology Access in Phenix City
Computing Device Access in Phenix City
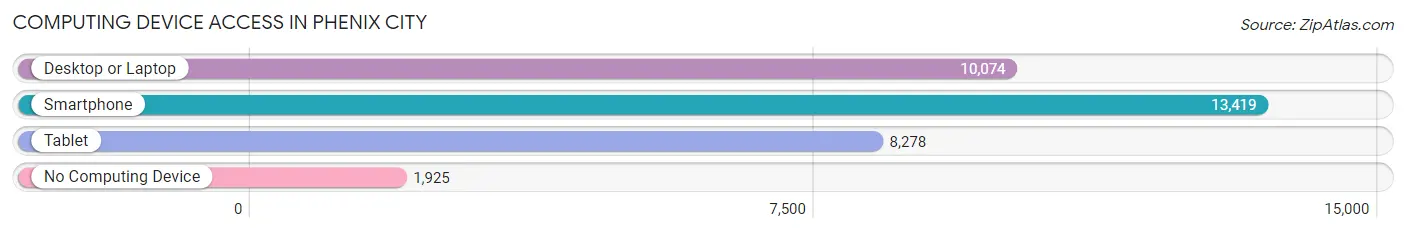
| Device Type | # Households | % Households |
| Desktop or Laptop | 10,074 | 63.5% |
| Smartphone | 13,419 | 84.7% |
| Tablet | 8,278 | 52.2% |
| No Computing Device | 1,925 | 12.1% |
| Total | 15,852 | 100.0% |
Internet Access in Phenix City
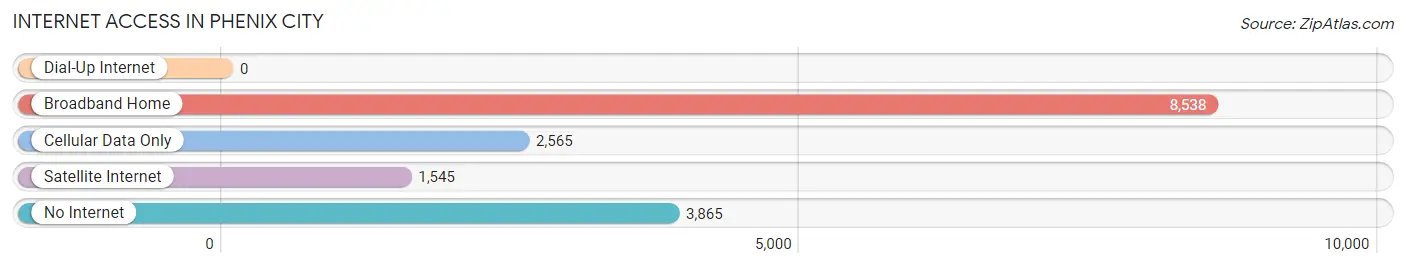
| Internet Type | # Households | % Households |
| Dial-Up Internet | 0 | 0.0% |
| Broadband Home | 8,538 | 53.9% |
| Cellular Data Only | 2,565 | 16.2% |
| Satellite Internet | 1,545 | 9.8% |
| No Internet | 3,865 | 24.4% |
| Total | 15,852 | 100.0% |
Phenix City Summary
Phenix City, Alabama is a city located in Russell County, Alabama, United States. It is situated on the east bank of the Chattahoochee River, directly across from Columbus, Georgia. As of the 2010 census, the population of Phenix City was 32,822.
History
Phenix City was founded in 1883 as a small farming community. It was named after the Phenix Mills, a cotton mill that was built in the area in 1882. The city quickly grew and by the early 1900s, it had become a major industrial center. The city was known for its textile mills, paper mills, and other manufacturing plants.
In the 1920s, Phenix City was known as the “Sin City of the South” due to its rampant corruption and organized crime. The city was controlled by a political machine known as the “Phenix City Combine” which was led by a local attorney named John H. Milner. Milner and his associates controlled the city’s government, police force, and businesses.
In 1954, the citizens of Phenix City voted to incorporate the city. This allowed the city to have its own mayor and city council. The city’s government was able to clean up the corruption and organized crime that had plagued the city for decades.
Geography
Phenix City is located in Russell County, Alabama. It is situated on the east bank of the Chattahoochee River, directly across from Columbus, Georgia. The city has a total area of 24.2 square miles, of which 24.1 square miles is land and 0.1 square miles is water.
Economy
Phenix City’s economy is largely based on manufacturing and retail. The city is home to several large manufacturing plants, including a paper mill, a textile mill, and a plastics plant. The city is also home to several large retail stores, including Walmart, Target, and Lowe’s.
The city is also home to several large employers, including the Russell County Board of Education, the Russell County Health Department, and the Russell County Sheriff’s Office.
Demographics
As of the 2010 census, the population of Phenix City was 32,822. The racial makeup of the city was 63.2% White, 33.3% African American, 0.4% Native American, 0.7% Asian, 0.1% Pacific Islander, 0.7% from other races, and 1.6% from two or more races. Hispanic or Latino of any race were 2.2% of the population.
The median income for a household in the city was $35,945, and the median income for a family was $41,945. The per capita income for the city was $17,945. About 17.2% of families and 20.3% of the population were below the poverty line, including 28.3% of those under age 18 and 14.2% of those age 65 or over.
Common Questions
What is Per Capita Income in Phenix City?
Per Capita income in Phenix City is $28,273.
What is the Median Family Income in Phenix City?
Median Family Income in Phenix City is $61,690.
What is the Median Household income in Phenix City?
Median Household Income in Phenix City is $46,944.
What is Income or Wage Gap in Phenix City?
Income or Wage Gap in Phenix City is 42.0%.
Women in Phenix City earn 58.0 cents for every dollar earned by a man.
What is Inequality or Gini Index in Phenix City?
Inequality or Gini Index in Phenix City is 0.49.
What is the Total Population of Phenix City?
Total Population of Phenix City is 38,413.
What is the Total Male Population of Phenix City?
Total Male Population of Phenix City is 18,806.
What is the Total Female Population of Phenix City?
Total Female Population of Phenix City is 19,607.
What is the Ratio of Males per 100 Females in Phenix City?
There are 95.91 Males per 100 Females in Phenix City.
What is the Ratio of Females per 100 Males in Phenix City?
There are 104.26 Females per 100 Males in Phenix City.
What is the Median Population Age in Phenix City?
Median Population Age in Phenix City is 35.9 Years.
What is the Average Family Size in Phenix City
Average Family Size in Phenix City is 3.1 People.
What is the Average Household Size in Phenix City
Average Household Size in Phenix City is 2.4 People.
How Large is the Labor Force in Phenix City?
There are 18,388 People in the Labor Forcein in Phenix City.
What is the Percentage of People in the Labor Force in Phenix City?
60.8% of People are in the Labor Force in Phenix City.
What is the Unemployment Rate in Phenix City?
Unemployment Rate in Phenix City is 7.1%.