Wyoming County, NY Map & Demographics
Wyoming County Map
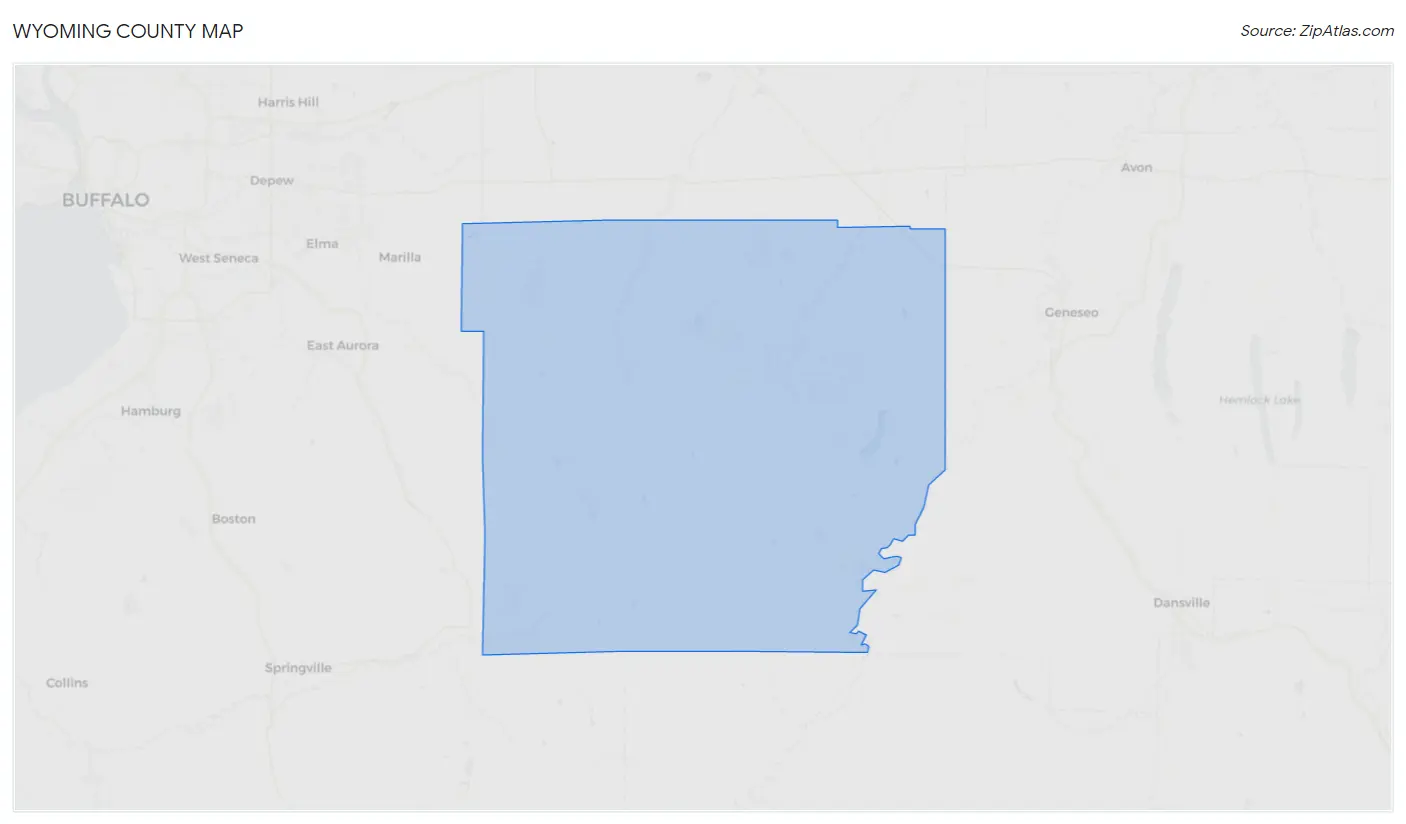
Wyoming County Overview
$35,228
PER CAPITA INCOME
$81,633
AVG FAMILY INCOME
$65,066
AVG HOUSEHOLD INCOME
32.4%
WAGE / INCOME GAP [ % ]
67.6¢/ $1
WAGE / INCOME GAP [ $ ]
$10,555
FAMILY INCOME DEFICIT
0.41
INEQUALITY / GINI INDEX
40,338
TOTAL POPULATION
21,526
MALE POPULATION
18,812
FEMALE POPULATION
114.43
MALES / 100 FEMALES
87.39
FEMALES / 100 MALES
42.9
MEDIAN AGE
2.8
AVG FAMILY SIZE
2.3
AVG HOUSEHOLD SIZE
18,911
LABOR FORCE [ PEOPLE ]
56.8%
PERCENT IN LABOR FORCE
4.1%
UNEMPLOYMENT RATE
Income in Wyoming County
Income Overview in Wyoming County
Per Capita Income in Wyoming County is $35,228, while median incomes of families and households are $81,633 and $65,066 respectively.
| Characteristic | Number | Measure |
| Per Capita Income | 40,338 | $35,228 |
| Median Family Income | 10,538 | $81,633 |
| Mean Family Income | 10,538 | $95,825 |
| Median Household Income | 16,152 | $65,066 |
| Mean Household Income | 16,152 | $81,765 |
| Income Deficit | 10,538 | $10,555 |
| Wage / Income Gap (%) | 40,338 | 32.36% |
| Wage / Income Gap ($) | 40,338 | 67.64¢ per $1 |
| Gini / Inequality Index | 40,338 | 0.41 |
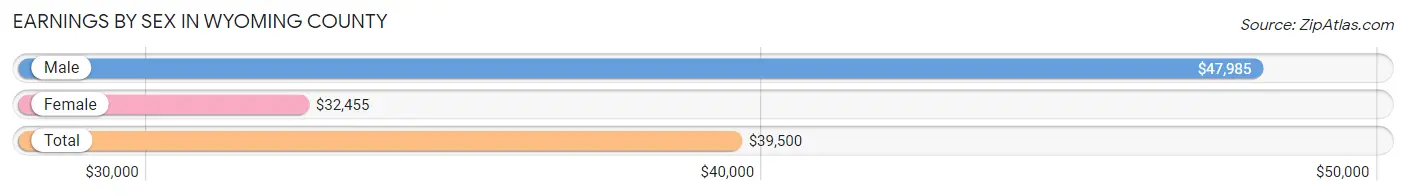
Earnings by Sex in Wyoming County
Average Earnings in Wyoming County are $39,500, $47,985 for men and $32,455 for women, a difference of 32.4%.
| Sex | Number | Average Earnings |
| Male | 10,726 (54.0%) | $47,985 |
| Female | 9,131 (46.0%) | $32,455 |
| Total | 19,857 (100.0%) | $39,500 |
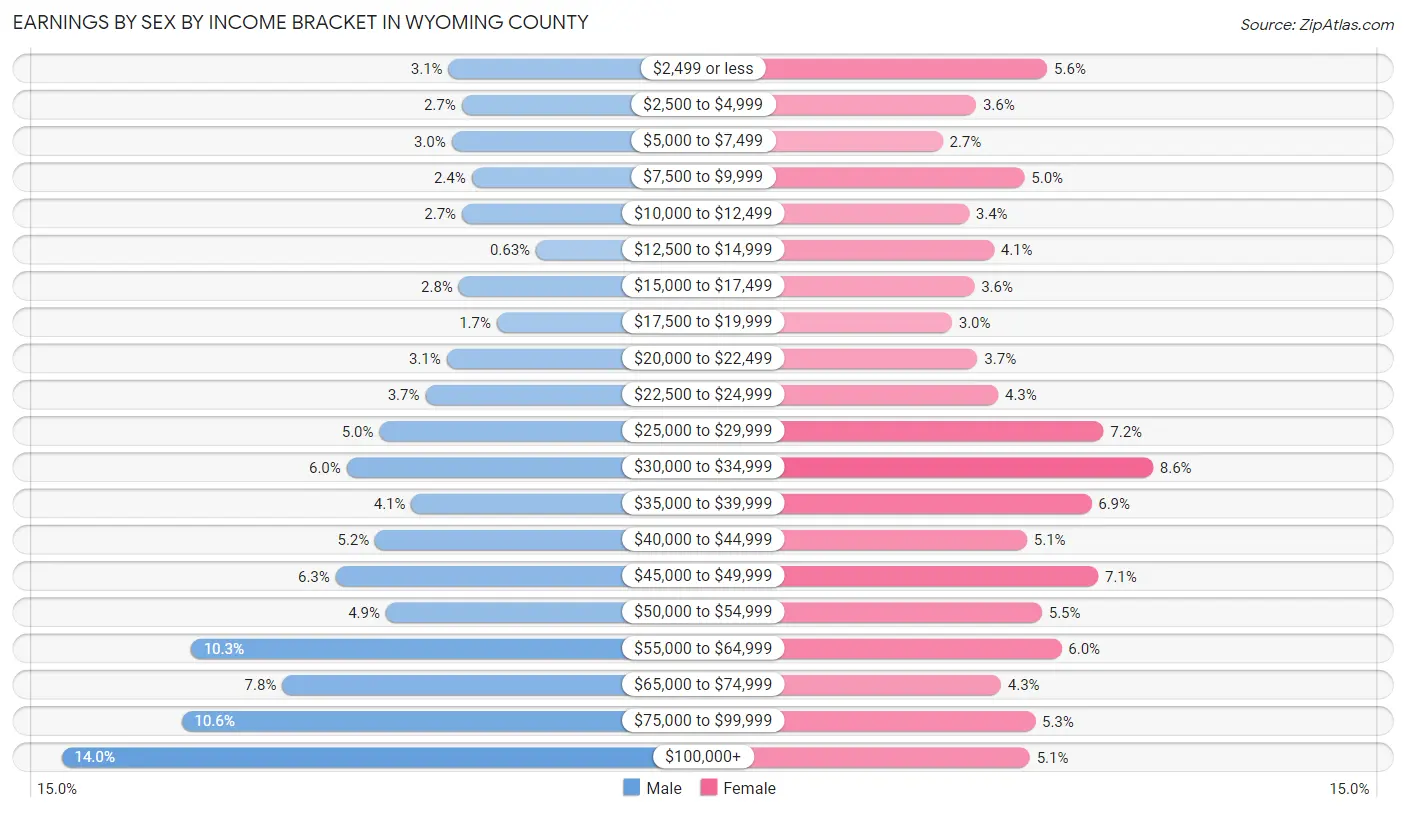
Earnings by Sex by Income Bracket in Wyoming County
The most common earnings brackets in Wyoming County are $100,000+ for men (1,497 | 14.0%) and $30,000 to $34,999 for women (785 | 8.6%).
| Income | Male | Female |
| $2,499 or less | 331 (3.1%) | 514 (5.6%) |
| $2,500 to $4,999 | 292 (2.7%) | 331 (3.6%) |
| $5,000 to $7,499 | 322 (3.0%) | 246 (2.7%) |
| $7,500 to $9,999 | 262 (2.4%) | 456 (5.0%) |
| $10,000 to $12,499 | 291 (2.7%) | 313 (3.4%) |
| $12,500 to $14,999 | 68 (0.6%) | 377 (4.1%) |
| $15,000 to $17,499 | 300 (2.8%) | 327 (3.6%) |
| $17,500 to $19,999 | 186 (1.7%) | 269 (2.9%) |
| $20,000 to $22,499 | 337 (3.1%) | 335 (3.7%) |
| $22,500 to $24,999 | 401 (3.7%) | 388 (4.3%) |
| $25,000 to $29,999 | 539 (5.0%) | 658 (7.2%) |
| $30,000 to $34,999 | 638 (5.9%) | 785 (8.6%) |
| $35,000 to $39,999 | 443 (4.1%) | 627 (6.9%) |
| $40,000 to $44,999 | 552 (5.1%) | 462 (5.1%) |
| $45,000 to $49,999 | 671 (6.3%) | 645 (7.1%) |
| $50,000 to $54,999 | 520 (4.9%) | 500 (5.5%) |
| $55,000 to $64,999 | 1,108 (10.3%) | 551 (6.0%) |
| $65,000 to $74,999 | 832 (7.8%) | 395 (4.3%) |
| $75,000 to $99,999 | 1,136 (10.6%) | 483 (5.3%) |
| $100,000+ | 1,497 (14.0%) | 469 (5.1%) |
| Total | 10,726 (100.0%) | 9,131 (100.0%) |
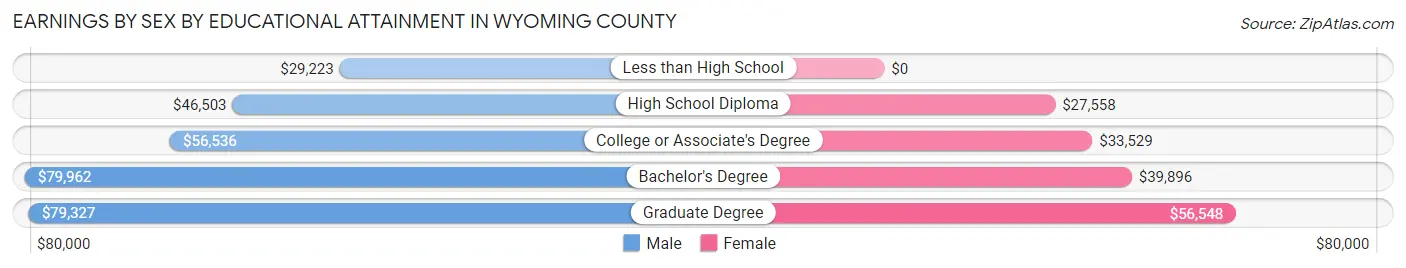
Earnings by Sex by Educational Attainment in Wyoming County
Average earnings in Wyoming County are $53,125 for men and $35,037 for women, a difference of 34.1%. Men with an educational attainment of bachelor's degree enjoy the highest average annual earnings of $79,962, while those with less than high school education earn the least with $29,223. Women with an educational attainment of graduate degree earn the most with the average annual earnings of $56,548, while those with high school diploma education have the smallest earnings of $27,558.
| Educational Attainment | Male Income | Female Income |
| Less than High School | $29,223 | $0 |
| High School Diploma | $46,503 | $27,558 |
| College or Associate's Degree | $56,536 | $33,529 |
| Bachelor's Degree | $79,962 | $39,896 |
| Graduate Degree | $79,327 | $56,548 |
| Total | $53,125 | $35,037 |
Family Income in Wyoming County
Family Income Brackets in Wyoming County
According to the Wyoming County family income data, there are 2,413 families falling into the $100,000 to $149,999 income range, which is the most common income bracket and makes up 22.9% of all families. Conversely, the less than $10,000 income bracket is the least frequent group with only 148 families (1.4%) belonging to this category.
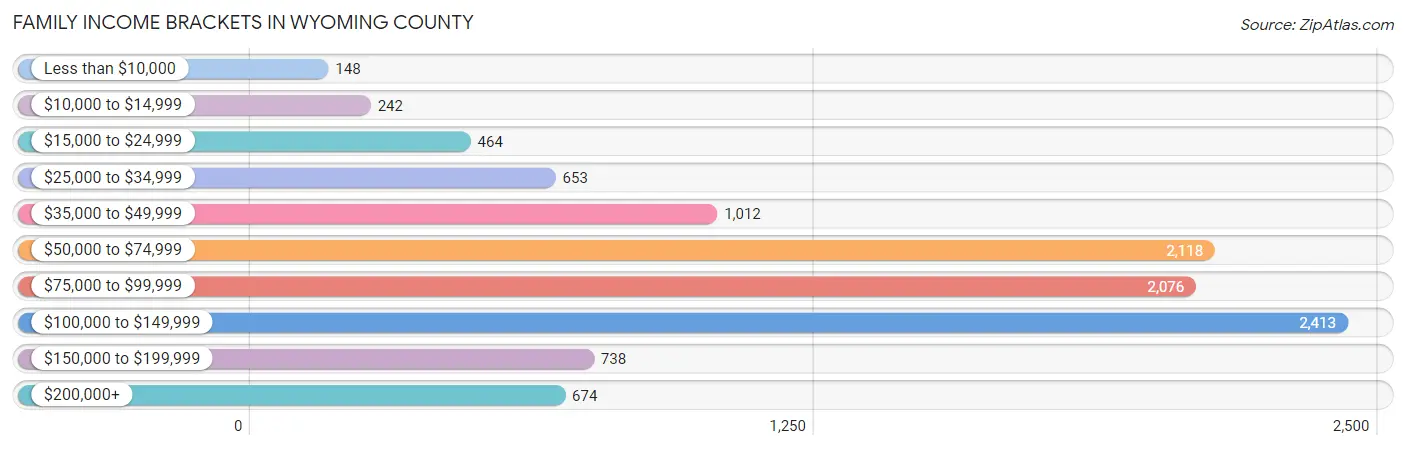
| Income Bracket | # Families | % Families |
| Less than $10,000 | 148 | 1.4% |
| $10,000 to $14,999 | 242 | 2.3% |
| $15,000 to $24,999 | 464 | 4.4% |
| $25,000 to $34,999 | 653 | 6.2% |
| $35,000 to $49,999 | 1,012 | 9.6% |
| $50,000 to $74,999 | 2,118 | 20.1% |
| $75,000 to $99,999 | 2,076 | 19.7% |
| $100,000 to $149,999 | 2,413 | 22.9% |
| $150,000 to $199,999 | 738 | 7.0% |
| $200,000+ | 674 | 6.4% |
Family Income by Famaliy Size in Wyoming County
5-person families (615 | 5.8%) account for the highest median family income in Wyoming County with $116,023 per family, while 2-person families (6,085 | 57.7%) have the highest median income of $37,732 per family member.
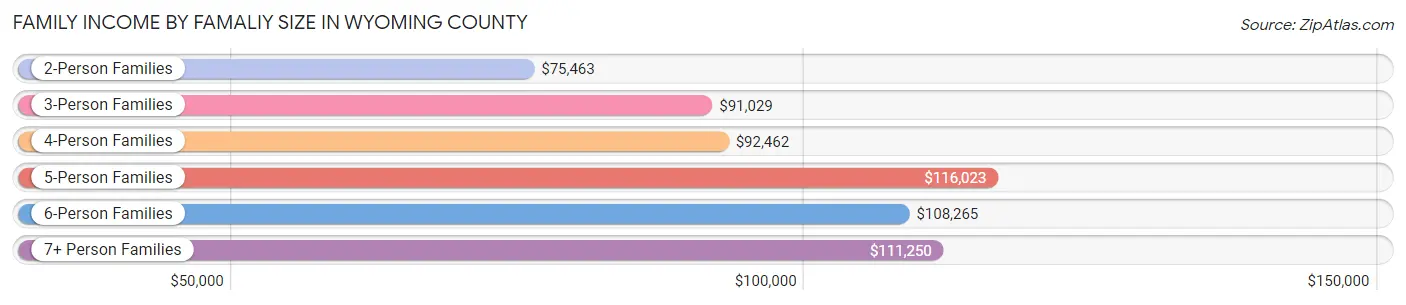
| Income Bracket | # Families | Median Income |
| 2-Person Families | 6,085 (57.7%) | $75,463 |
| 3-Person Families | 1,726 (16.4%) | $91,029 |
| 4-Person Families | 1,796 (17.0%) | $92,462 |
| 5-Person Families | 615 (5.8%) | $116,023 |
| 6-Person Families | 208 (2.0%) | $108,265 |
| 7+ Person Families | 108 (1.0%) | $111,250 |
| Total | 10,538 (100.0%) | $81,633 |
Family Income by Number of Earners in Wyoming County
The median family income in Wyoming County is $81,633, with families comprising 3+ earners (914) having the highest median family income of $140,294, while families with no earners (2,031) have the lowest median family income of $52,435, accounting for 8.7% and 19.3% of families, respectively.
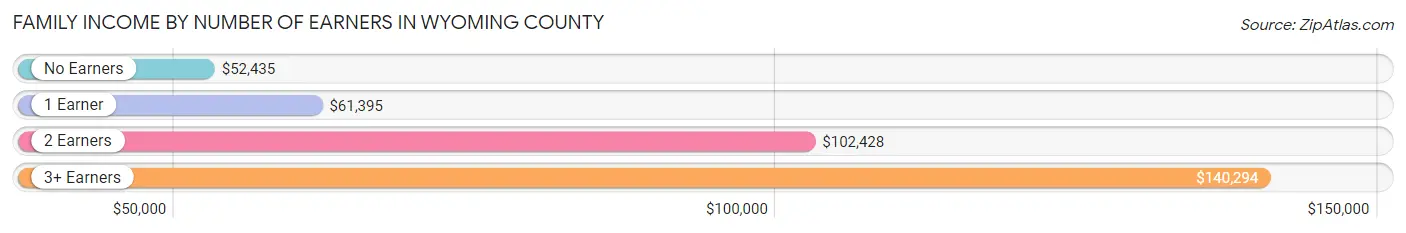
| Number of Earners | # Families | Median Income |
| No Earners | 2,031 (19.3%) | $52,435 |
| 1 Earner | 3,311 (31.4%) | $61,395 |
| 2 Earners | 4,282 (40.6%) | $102,428 |
| 3+ Earners | 914 (8.7%) | $140,294 |
| Total | 10,538 (100.0%) | $81,633 |
Household Income in Wyoming County
Household Income Brackets in Wyoming County
With 3,279 households falling in the category, the $50,000 to $74,999 income range is the most frequent in Wyoming County, accounting for 20.3% of all households. In contrast, only 533 households (3.3%) fall into the $10,000 to $14,999 income bracket, making it the least populous group.
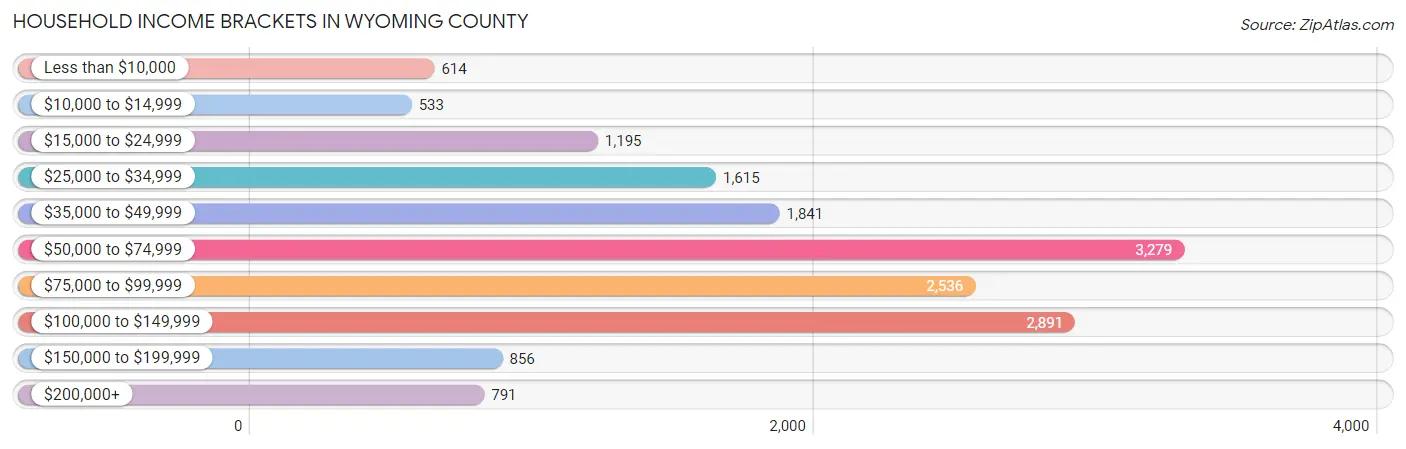
| Income Bracket | # Households | % Households |
| Less than $10,000 | 614 | 3.8% |
| $10,000 to $14,999 | 533 | 3.3% |
| $15,000 to $24,999 | 1,195 | 7.4% |
| $25,000 to $34,999 | 1,615 | 10.0% |
| $35,000 to $49,999 | 1,841 | 11.4% |
| $50,000 to $74,999 | 3,279 | 20.3% |
| $75,000 to $99,999 | 2,536 | 15.7% |
| $100,000 to $149,999 | 2,891 | 17.9% |
| $150,000 to $199,999 | 856 | 5.3% |
| $200,000+ | 791 | 4.9% |
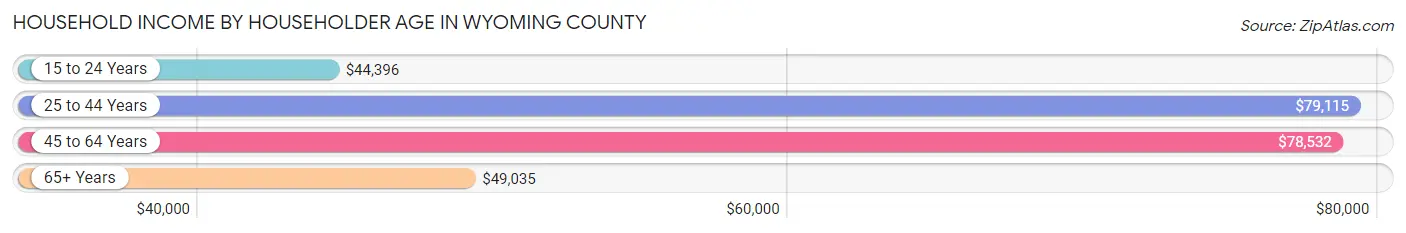
Household Income by Householder Age in Wyoming County
The median household income in Wyoming County is $65,066, with the highest median household income of $79,115 found in the 25 to 44 years age bracket for the primary householder. A total of 4,388 households (27.2%) fall into this category. Meanwhile, the 15 to 24 years age bracket for the primary householder has the lowest median household income of $44,396, with 595 households (3.7%) in this group.
| Income Bracket | # Households | Median Income |
| 15 to 24 Years | 595 (3.7%) | $44,396 |
| 25 to 44 Years | 4,388 (27.2%) | $79,115 |
| 45 to 64 Years | 6,218 (38.5%) | $78,532 |
| 65+ Years | 4,951 (30.6%) | $49,035 |
| Total | 16,152 (100.0%) | $65,066 |
Poverty in Wyoming County
Income Below Poverty by Sex and Age in Wyoming County
With 8.6% poverty level for males and 12.9% for females among the residents of Wyoming County, 5 year old males and 15 year old females are the most vulnerable to poverty, with 43 males (23.1%) and 68 females (22.2%) in their respective age groups living below the poverty level.
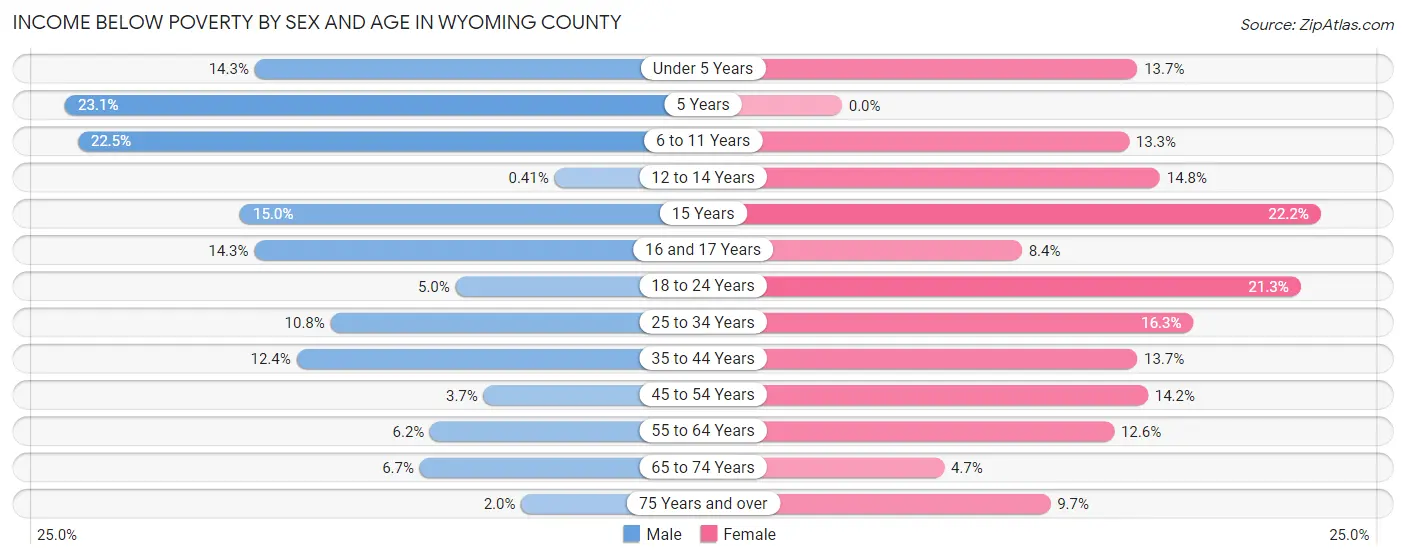
| Age Bracket | Male | Female |
| Under 5 Years | 127 (14.3%) | 126 (13.7%) |
| 5 Years | 43 (23.1%) | 0 (0.0%) |
| 6 to 11 Years | 276 (22.5%) | 173 (13.3%) |
| 12 to 14 Years | 3 (0.4%) | 116 (14.8%) |
| 15 Years | 42 (15.0%) | 68 (22.2%) |
| 16 and 17 Years | 72 (14.3%) | 36 (8.4%) |
| 18 to 24 Years | 70 (5.0%) | 284 (21.3%) |
| 25 to 34 Years | 261 (10.8%) | 350 (16.3%) |
| 35 to 44 Years | 281 (12.4%) | 281 (13.7%) |
| 45 to 54 Years | 93 (3.7%) | 335 (14.2%) |
| 55 to 64 Years | 188 (6.2%) | 361 (12.6%) |
| 65 to 74 Years | 159 (6.7%) | 106 (4.7%) |
| 75 Years and over | 25 (1.9%) | 161 (9.7%) |
| Total | 1,640 (8.6%) | 2,397 (12.9%) |
Income Above Poverty by Sex and Age in Wyoming County
According to the poverty statistics in Wyoming County, males aged 12 to 14 years and females aged 5 years are the age groups that are most secure financially, with 99.6% of males and 100.0% of females in these age groups living above the poverty line.
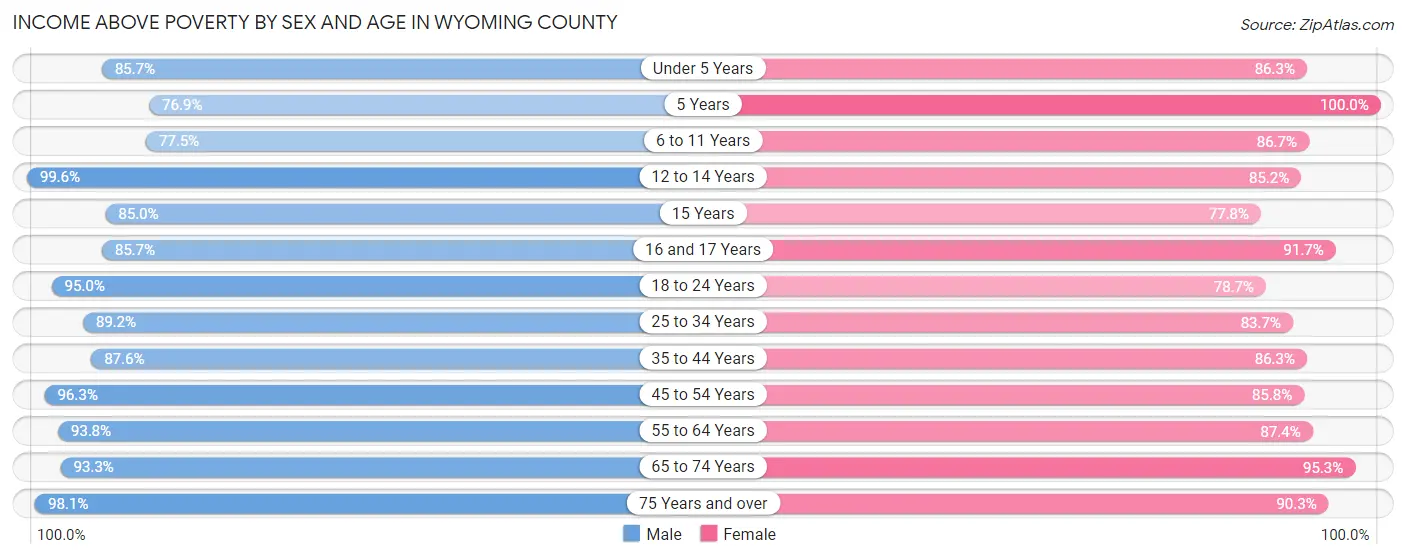
| Age Bracket | Male | Female |
| Under 5 Years | 760 (85.7%) | 793 (86.3%) |
| 5 Years | 143 (76.9%) | 224 (100.0%) |
| 6 to 11 Years | 949 (77.5%) | 1,126 (86.7%) |
| 12 to 14 Years | 722 (99.6%) | 670 (85.2%) |
| 15 Years | 238 (85.0%) | 238 (77.8%) |
| 16 and 17 Years | 430 (85.7%) | 395 (91.6%) |
| 18 to 24 Years | 1,331 (95.0%) | 1,050 (78.7%) |
| 25 to 34 Years | 2,156 (89.2%) | 1,796 (83.7%) |
| 35 to 44 Years | 1,989 (87.6%) | 1,770 (86.3%) |
| 45 to 54 Years | 2,418 (96.3%) | 2,024 (85.8%) |
| 55 to 64 Years | 2,855 (93.8%) | 2,498 (87.4%) |
| 65 to 74 Years | 2,227 (93.3%) | 2,130 (95.3%) |
| 75 Years and over | 1,259 (98.1%) | 1,504 (90.3%) |
| Total | 17,477 (91.4%) | 16,218 (87.1%) |
Income Below Poverty Among Married-Couple Families in Wyoming County
The poverty statistics for married-couple families in Wyoming County show that 3.4% or 278 of the total 8,228 families live below the poverty line. Families with 5 or more children have the highest poverty rate of 9.1%, comprising of 8 families. On the other hand, families with no children have the lowest poverty rate of 2.2%, which includes 124 families.
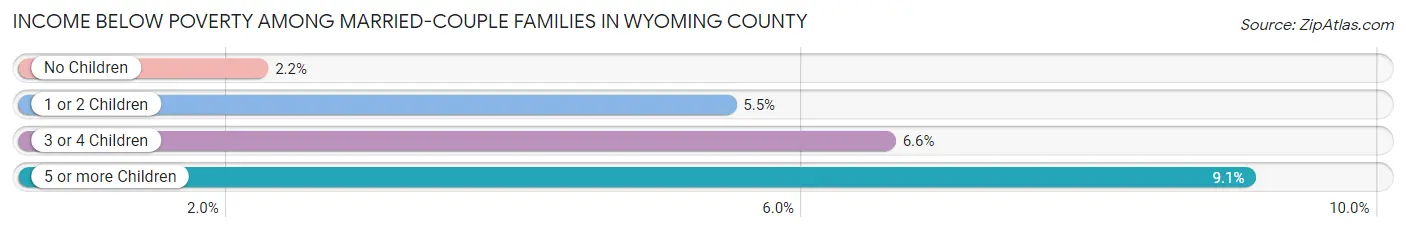
| Children | Above Poverty | Below Poverty |
| No Children | 5,475 (97.8%) | 124 (2.2%) |
| 1 or 2 Children | 1,813 (94.5%) | 105 (5.5%) |
| 3 or 4 Children | 582 (93.4%) | 41 (6.6%) |
| 5 or more Children | 80 (90.9%) | 8 (9.1%) |
| Total | 7,950 (96.6%) | 278 (3.4%) |
Income Below Poverty Among Single-Parent Households in Wyoming County
According to the poverty data in Wyoming County, 15.5% or 160 single-father households and 22.0% or 281 single-mother households are living below the poverty line. Among single-father households, those with 3 or 4 children have the highest poverty rate, with 37 households (52.9%) experiencing poverty. Likewise, among single-mother households, those with 3 or 4 children have the highest poverty rate, with 99 households (64.7%) falling below the poverty line.
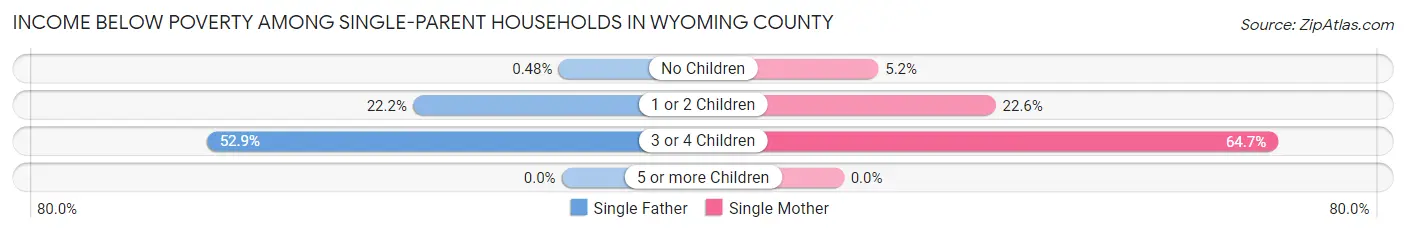
| Children | Single Father | Single Mother |
| No Children | 2 (0.5%) | 21 (5.2%) |
| 1 or 2 Children | 121 (22.2%) | 161 (22.6%) |
| 3 or 4 Children | 37 (52.9%) | 99 (64.7%) |
| 5 or more Children | 0 (0.0%) | 0 (0.0%) |
| Total | 160 (15.5%) | 281 (22.0%) |
Income Below Poverty Among Married-Couple vs Single-Parent Households in Wyoming County
The poverty data for Wyoming County shows that 278 of the married-couple family households (3.4%) and 441 of the single-parent households (19.1%) are living below the poverty level. Within the married-couple family households, those with 5 or more children have the highest poverty rate, with 8 households (9.1%) falling below the poverty line. Among the single-parent households, those with 3 or 4 children have the highest poverty rate, with 136 household (61.0%) living below poverty.
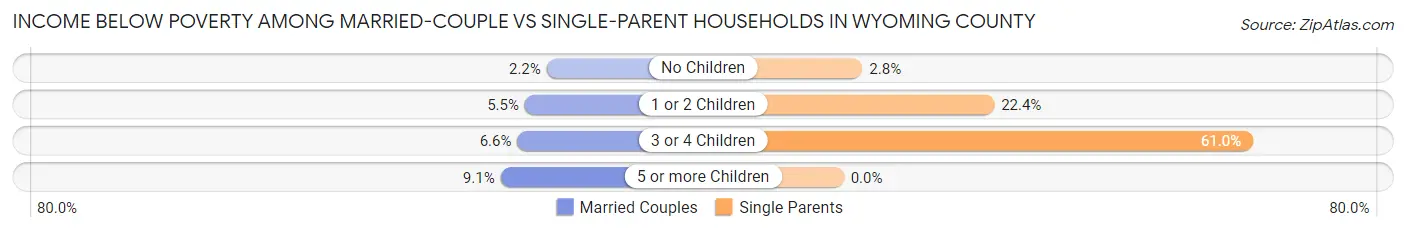
| Children | Married-Couple Families | Single-Parent Households |
| No Children | 124 (2.2%) | 23 (2.8%) |
| 1 or 2 Children | 105 (5.5%) | 282 (22.4%) |
| 3 or 4 Children | 41 (6.6%) | 136 (61.0%) |
| 5 or more Children | 8 (9.1%) | 0 (0.0%) |
| Total | 278 (3.4%) | 441 (19.1%) |
Race in Wyoming County
The most populous races in Wyoming County are White / Caucasian (36,228 | 89.8%), Black / African American (1,473 | 3.6%), and Hispanic or Latino (1,352 | 3.4%).
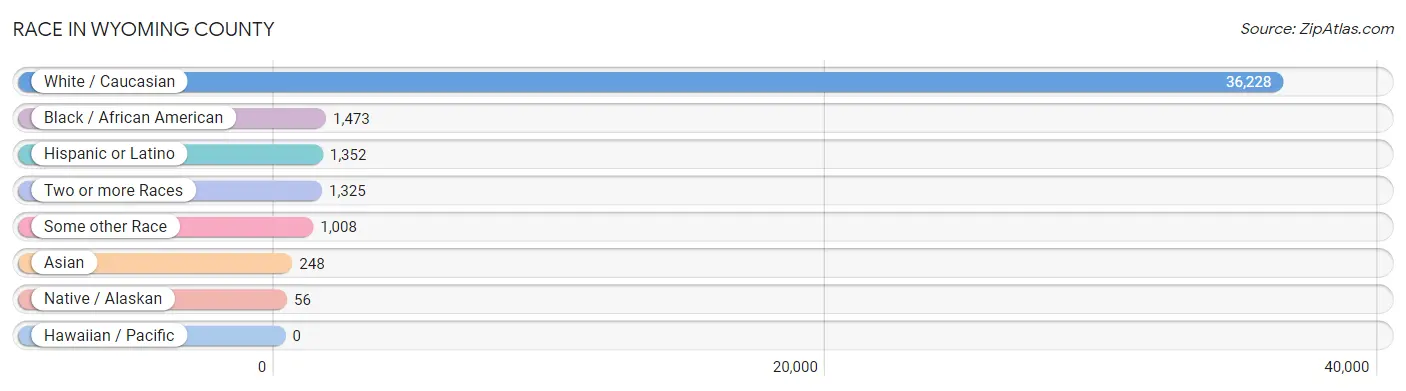
| Race | # Population | % Population |
| Asian | 248 | 0.6% |
| Black / African American | 1,473 | 3.6% |
| Hawaiian / Pacific | 0 | 0.0% |
| Hispanic or Latino | 1,352 | 3.4% |
| Native / Alaskan | 56 | 0.1% |
| White / Caucasian | 36,228 | 89.8% |
| Two or more Races | 1,325 | 3.3% |
| Some other Race | 1,008 | 2.5% |
| Total | 40,338 | 100.0% |
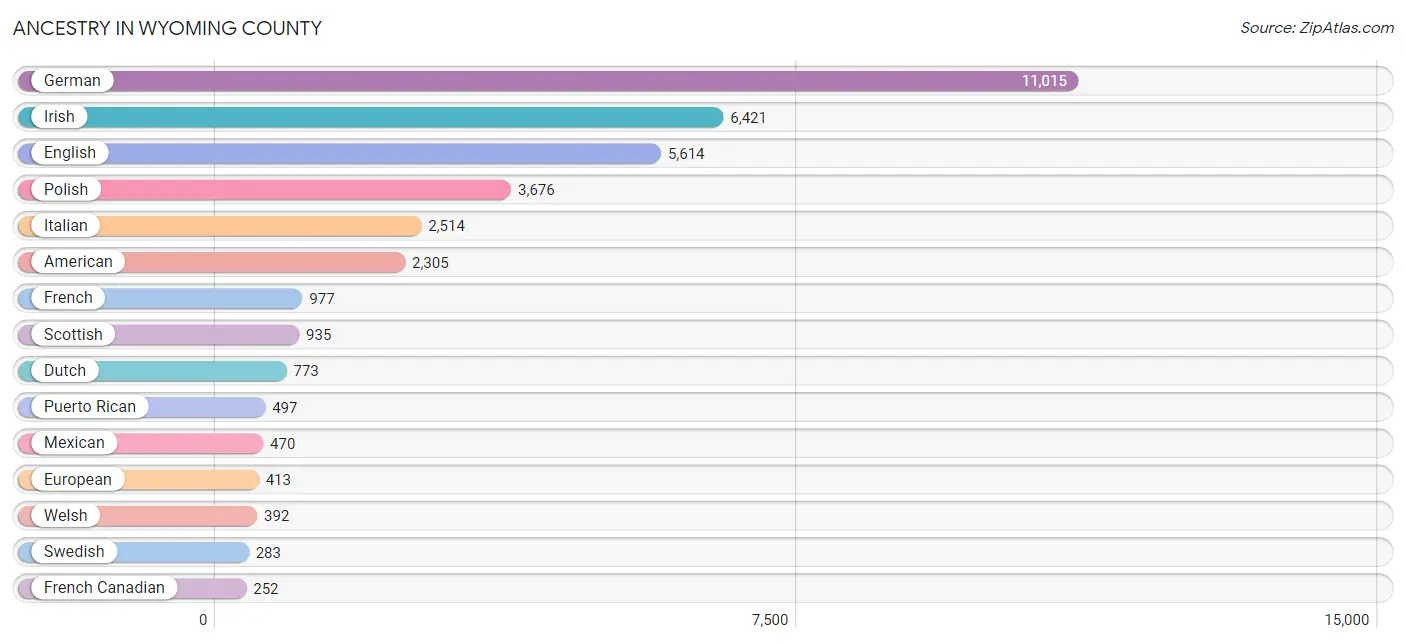
Ancestry in Wyoming County
The most populous ancestries reported in Wyoming County are German (11,015 | 27.3%), Irish (6,421 | 15.9%), English (5,614 | 13.9%), Polish (3,676 | 9.1%), and Italian (2,514 | 6.2%), together accounting for 72.5% of all Wyoming County residents.
| Ancestry | # Population | % Population |
| African | 18 | 0.0% |
| Albanian | 17 | 0.0% |
| Alsatian | 37 | 0.1% |
| American | 2,305 | 5.7% |
| Apache | 1 | 0.0% |
| Arab | 50 | 0.1% |
| Argentinean | 6 | 0.0% |
| Australian | 9 | 0.0% |
| Austrian | 48 | 0.1% |
| Belgian | 128 | 0.3% |
| Bhutanese | 2 | 0.0% |
| Blackfeet | 10 | 0.0% |
| Brazilian | 5 | 0.0% |
| British | 69 | 0.2% |
| Canadian | 66 | 0.2% |
| Central American | 84 | 0.2% |
| Central American Indian | 12 | 0.0% |
| Cherokee | 12 | 0.0% |
| Croatian | 5 | 0.0% |
| Crow | 5 | 0.0% |
| Cuban | 27 | 0.1% |
| Czech | 26 | 0.1% |
| Czechoslovakian | 8 | 0.0% |
| Danish | 26 | 0.1% |
| Dominican | 22 | 0.1% |
| Dutch | 773 | 1.9% |
| Dutch West Indian | 8 | 0.0% |
| Eastern European | 152 | 0.4% |
| English | 5,614 | 13.9% |
| European | 413 | 1.0% |
| Filipino | 30 | 0.1% |
| Finnish | 5 | 0.0% |
| French | 977 | 2.4% |
| French Canadian | 252 | 0.6% |
| German | 11,015 | 27.3% |
| Greek | 93 | 0.2% |
| Guatemalan | 55 | 0.1% |
| Guyanese | 6 | 0.0% |
| Haitian | 5 | 0.0% |
| Honduran | 17 | 0.0% |
| Hungarian | 158 | 0.4% |
| Indian (Asian) | 87 | 0.2% |
| Irish | 6,421 | 15.9% |
| Iroquois | 36 | 0.1% |
| Italian | 2,514 | 6.2% |
| Jamaican | 50 | 0.1% |
| Kenyan | 8 | 0.0% |
| Korean | 77 | 0.2% |
| Latvian | 31 | 0.1% |
| Lebanese | 46 | 0.1% |
| Liberian | 3 | 0.0% |
| Lithuanian | 33 | 0.1% |
| Malaysian | 50 | 0.1% |
| Mexican | 470 | 1.2% |
| Northern European | 72 | 0.2% |
| Norwegian | 201 | 0.5% |
| Pakistani | 5 | 0.0% |
| Panamanian | 12 | 0.0% |
| Pennsylvania German | 59 | 0.2% |
| Peruvian | 5 | 0.0% |
| Polish | 3,676 | 9.1% |
| Portuguese | 13 | 0.0% |
| Puerto Rican | 497 | 1.2% |
| Romanian | 66 | 0.2% |
| Russian | 92 | 0.2% |
| Scandinavian | 55 | 0.1% |
| Scotch-Irish | 175 | 0.4% |
| Scottish | 935 | 2.3% |
| Seminole | 15 | 0.0% |
| Serbian | 4 | 0.0% |
| Slavic | 10 | 0.0% |
| Slovak | 26 | 0.1% |
| Slovene | 13 | 0.0% |
| South American | 11 | 0.0% |
| Spaniard | 14 | 0.0% |
| Subsaharan African | 44 | 0.1% |
| Swedish | 283 | 0.7% |
| Swiss | 213 | 0.5% |
| Thai | 12 | 0.0% |
| Tohono O'Odham | 6 | 0.0% |
| Ukrainian | 233 | 0.6% |
| Welsh | 392 | 1.0% |
| West Indian | 6 | 0.0% |
| Yugoslavian | 6 | 0.0% |
| Yup'ik | 1 | 0.0% | View All 85 Rows |
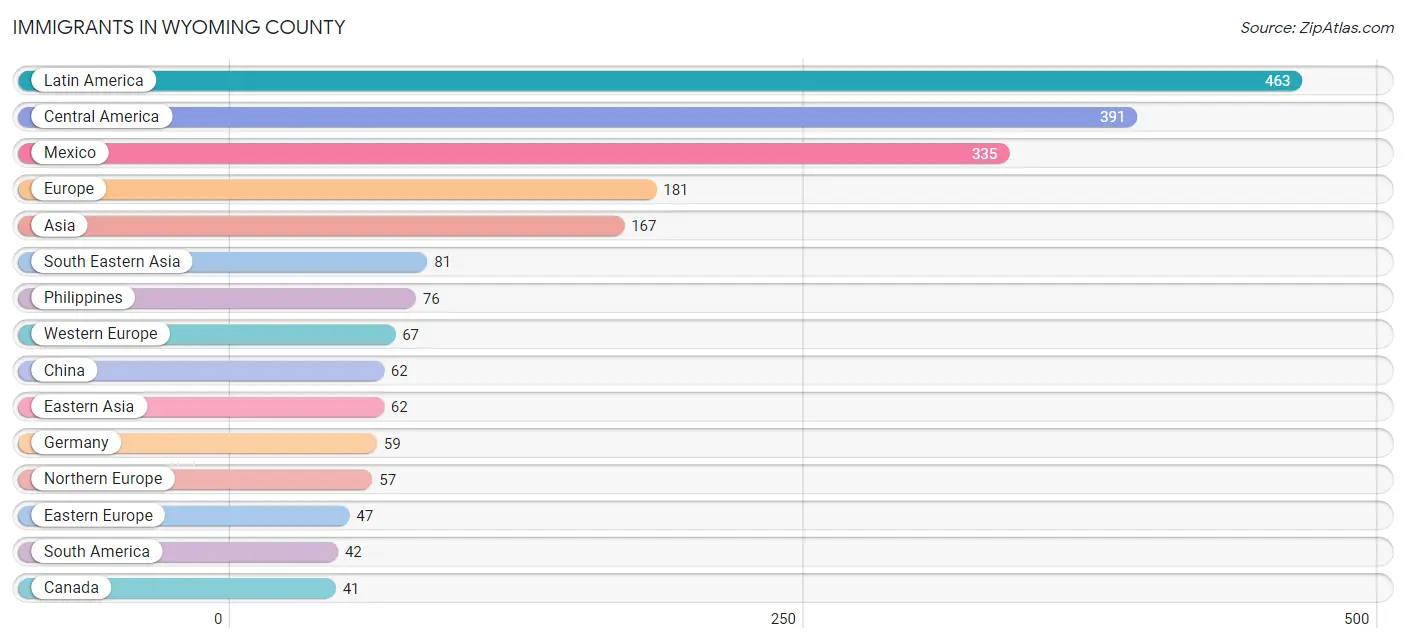
Immigrants in Wyoming County
The most numerous immigrant groups reported in Wyoming County came from Latin America (463 | 1.1%), Central America (391 | 1.0%), Mexico (335 | 0.8%), Europe (181 | 0.4%), and Asia (167 | 0.4%), together accounting for 3.8% of all Wyoming County residents.
| Immigration Origin | # Population | % Population |
| Africa | 31 | 0.1% |
| Argentina | 6 | 0.0% |
| Asia | 167 | 0.4% |
| Austria | 4 | 0.0% |
| Brazil | 8 | 0.0% |
| Canada | 41 | 0.1% |
| Caribbean | 30 | 0.1% |
| Central America | 391 | 1.0% |
| China | 62 | 0.2% |
| Colombia | 15 | 0.0% |
| Costa Rica | 4 | 0.0% |
| Cuba | 9 | 0.0% |
| Dominican Republic | 20 | 0.1% |
| Eastern Africa | 8 | 0.0% |
| Eastern Asia | 62 | 0.2% |
| Eastern Europe | 47 | 0.1% |
| Ecuador | 7 | 0.0% |
| England | 35 | 0.1% |
| Europe | 181 | 0.4% |
| Germany | 59 | 0.2% |
| Guatemala | 35 | 0.1% |
| Guyana | 6 | 0.0% |
| Honduras | 17 | 0.0% |
| Hong Kong | 5 | 0.0% |
| India | 12 | 0.0% |
| Ireland | 7 | 0.0% |
| Italy | 10 | 0.0% |
| Jamaica | 1 | 0.0% |
| Kenya | 8 | 0.0% |
| Latin America | 463 | 1.1% |
| Liberia | 3 | 0.0% |
| Mexico | 335 | 0.8% |
| Morocco | 4 | 0.0% |
| Netherlands | 4 | 0.0% |
| Northern Africa | 4 | 0.0% |
| Northern Europe | 57 | 0.1% |
| Philippines | 76 | 0.2% |
| Poland | 7 | 0.0% |
| South Africa | 1 | 0.0% |
| South America | 42 | 0.1% |
| South Central Asia | 12 | 0.0% |
| South Eastern Asia | 81 | 0.2% |
| Southern Europe | 10 | 0.0% |
| Taiwan | 15 | 0.0% |
| Thailand | 5 | 0.0% |
| Western Africa | 14 | 0.0% |
| Western Europe | 67 | 0.2% | View All 47 Rows |
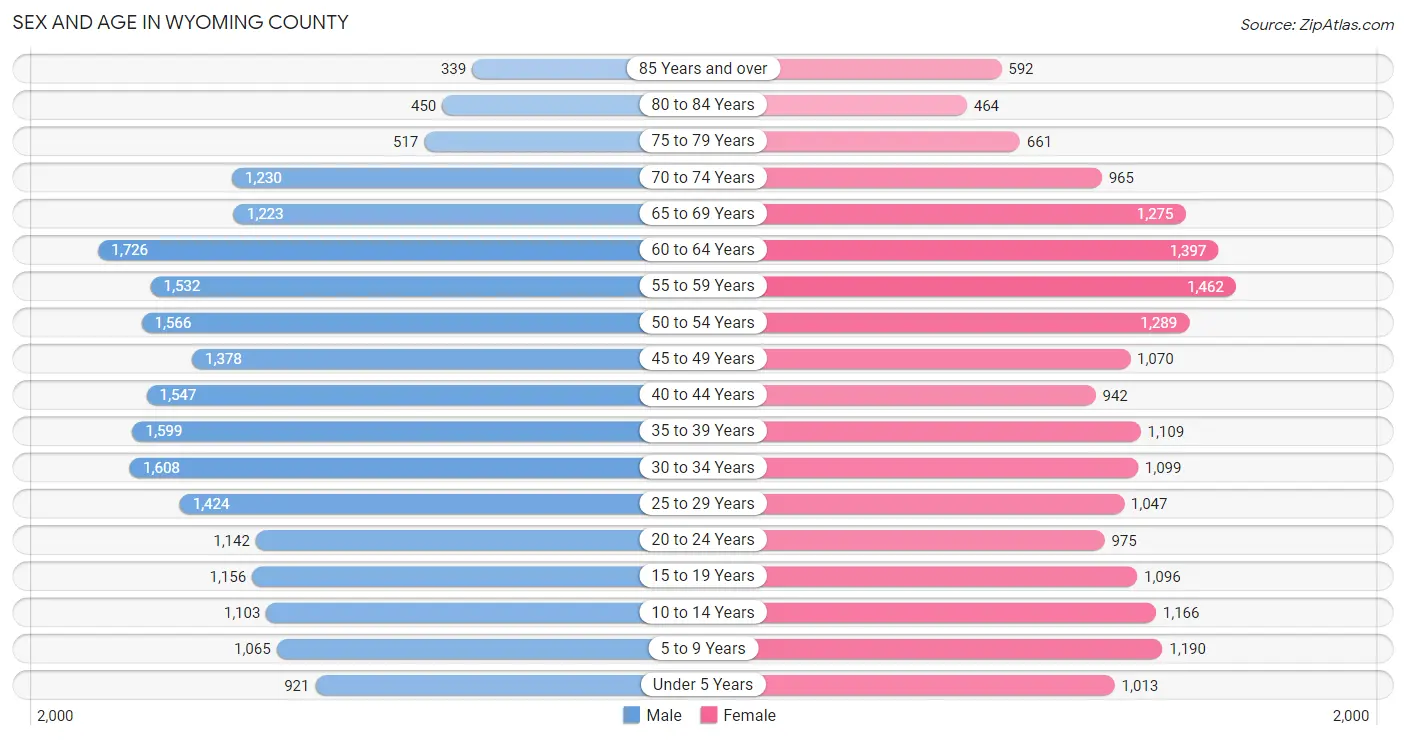
Sex and Age in Wyoming County
Sex and Age in Wyoming County
The most populous age groups in Wyoming County are 60 to 64 Years (1,726 | 8.0%) for men and 55 to 59 Years (1,462 | 7.8%) for women.
| Age Bracket | Male | Female |
| Under 5 Years | 921 (4.3%) | 1,013 (5.4%) |
| 5 to 9 Years | 1,065 (5.0%) | 1,190 (6.3%) |
| 10 to 14 Years | 1,103 (5.1%) | 1,166 (6.2%) |
| 15 to 19 Years | 1,156 (5.4%) | 1,096 (5.8%) |
| 20 to 24 Years | 1,142 (5.3%) | 975 (5.2%) |
| 25 to 29 Years | 1,424 (6.6%) | 1,047 (5.6%) |
| 30 to 34 Years | 1,608 (7.5%) | 1,099 (5.8%) |
| 35 to 39 Years | 1,599 (7.4%) | 1,109 (5.9%) |
| 40 to 44 Years | 1,547 (7.2%) | 942 (5.0%) |
| 45 to 49 Years | 1,378 (6.4%) | 1,070 (5.7%) |
| 50 to 54 Years | 1,566 (7.3%) | 1,289 (6.9%) |
| 55 to 59 Years | 1,532 (7.1%) | 1,462 (7.8%) |
| 60 to 64 Years | 1,726 (8.0%) | 1,397 (7.4%) |
| 65 to 69 Years | 1,223 (5.7%) | 1,275 (6.8%) |
| 70 to 74 Years | 1,230 (5.7%) | 965 (5.1%) |
| 75 to 79 Years | 517 (2.4%) | 661 (3.5%) |
| 80 to 84 Years | 450 (2.1%) | 464 (2.5%) |
| 85 Years and over | 339 (1.6%) | 592 (3.2%) |
| Total | 21,526 (100.0%) | 18,812 (100.0%) |
Families and Households in Wyoming County
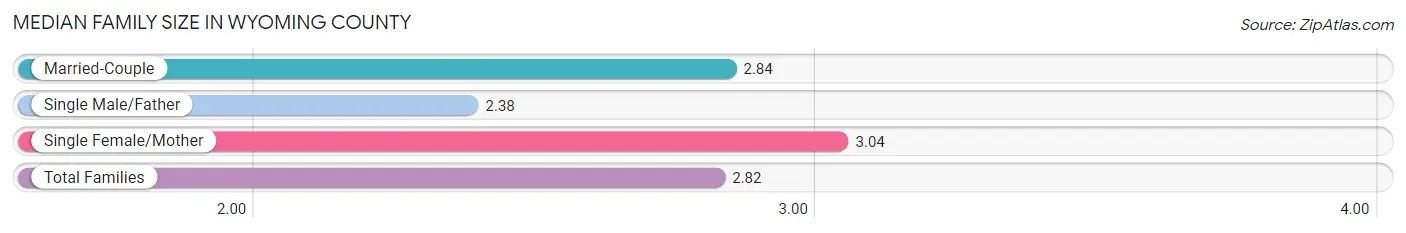
Median Family Size in Wyoming County
The median family size in Wyoming County is 2.82 persons per family, with single female/mother families (1,278 | 12.1%) accounting for the largest median family size of 3.04 persons per family. On the other hand, single male/father families (1,032 | 9.8%) represent the smallest median family size with 2.38 persons per family.
| Family Type | # Families | Family Size |
| Married-Couple | 8,228 (78.1%) | 2.84 |
| Single Male/Father | 1,032 (9.8%) | 2.38 |
| Single Female/Mother | 1,278 (12.1%) | 3.04 |
| Total Families | 10,538 (100.0%) | 2.82 |
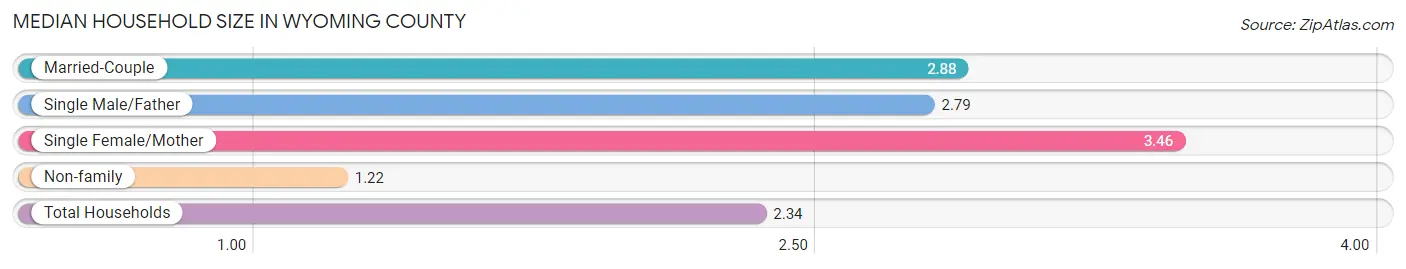
Median Household Size in Wyoming County
The median household size in Wyoming County is 2.34 persons per household, with single female/mother households (1,278 | 7.9%) accounting for the largest median household size of 3.46 persons per household. non-family households (5,614 | 34.8%) represent the smallest median household size with 1.22 persons per household.
| Household Type | # Households | Household Size |
| Married-Couple | 8,228 (50.9%) | 2.88 |
| Single Male/Father | 1,032 (6.4%) | 2.79 |
| Single Female/Mother | 1,278 (7.9%) | 3.46 |
| Non-family | 5,614 (34.8%) | 1.22 |
| Total Households | 16,152 (100.0%) | 2.34 |
Household Size by Marriage Status in Wyoming County
Out of a total of 16,152 households in Wyoming County, 10,538 (65.2%) are family households, while 5,614 (34.8%) are nonfamily households. The most numerous type of family households are 2-person households, comprising 5,642, and the most common type of nonfamily households are 1-person households, comprising 4,425.
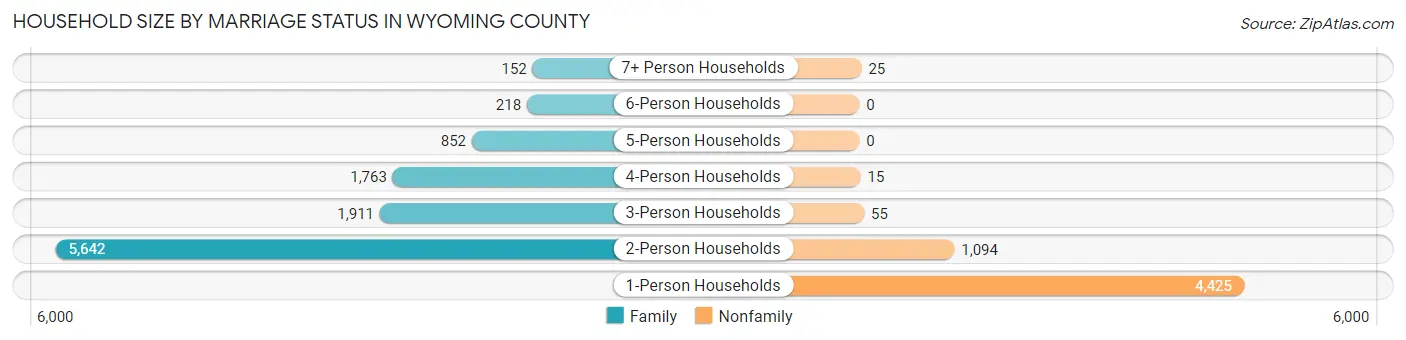
| Household Size | Family Households | Nonfamily Households |
| 1-Person Households | - | 4,425 (27.4%) |
| 2-Person Households | 5,642 (34.9%) | 1,094 (6.8%) |
| 3-Person Households | 1,911 (11.8%) | 55 (0.3%) |
| 4-Person Households | 1,763 (10.9%) | 15 (0.1%) |
| 5-Person Households | 852 (5.3%) | 0 (0.0%) |
| 6-Person Households | 218 (1.3%) | 0 (0.0%) |
| 7+ Person Households | 152 (0.9%) | 25 (0.2%) |
| Total | 10,538 (65.2%) | 5,614 (34.8%) |
Female Fertility in Wyoming County
Fertility by Age in Wyoming County
Average fertility rate in Wyoming County is 38.0 births per 1,000 women. Women in the age bracket of 20 to 34 years have the highest fertility rate with 52.0 births per 1,000 women. Women in the age bracket of 20 to 34 years acount for 56.1% of all women with births.
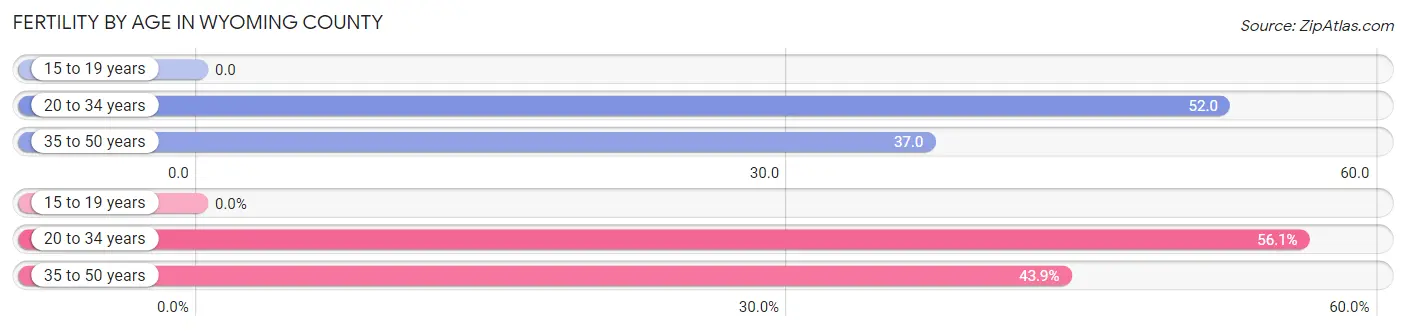
| Age Bracket | Women with Births | Births / 1,000 Women |
| 15 to 19 years | 0 (0.0%) | 0.0 |
| 20 to 34 years | 162 (56.1%) | 52.0 |
| 35 to 50 years | 127 (43.9%) | 37.0 |
| Total | 289 (100.0%) | 38.0 |
Fertility by Age by Marriage Status in Wyoming County
87.9% of women with births (289) in Wyoming County are married. The highest percentage of unmarried women with births falls into 20 to 34 years age bracket with 21.6% of them unmarried at the time of birth, while the lowest percentage of unmarried women with births belong to 35 to 50 years age bracket with 0.0% of them unmarried.
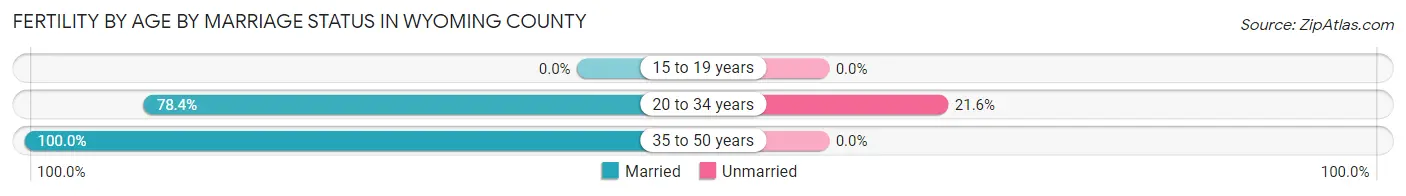
| Age Bracket | Married | Unmarried |
| 15 to 19 years | 0 (0.0%) | 0 (0.0%) |
| 20 to 34 years | 127 (78.4%) | 35 (21.6%) |
| 35 to 50 years | 127 (100.0%) | 0 (0.0%) |
| Total | 254 (87.9%) | 35 (12.1%) |
Fertility by Education in Wyoming County
Average fertility rate in Wyoming County is 38.0 births per 1,000 women. Women with the education attainment of bachelor's degree have the highest fertility rate of 85.0 births per 1,000 women, while women with the education attainment of less than high school have the lowest fertility at 2.0 births per 1,000 women. Women with the education attainment of college or associate's degree represent 51.9% of all women with births.
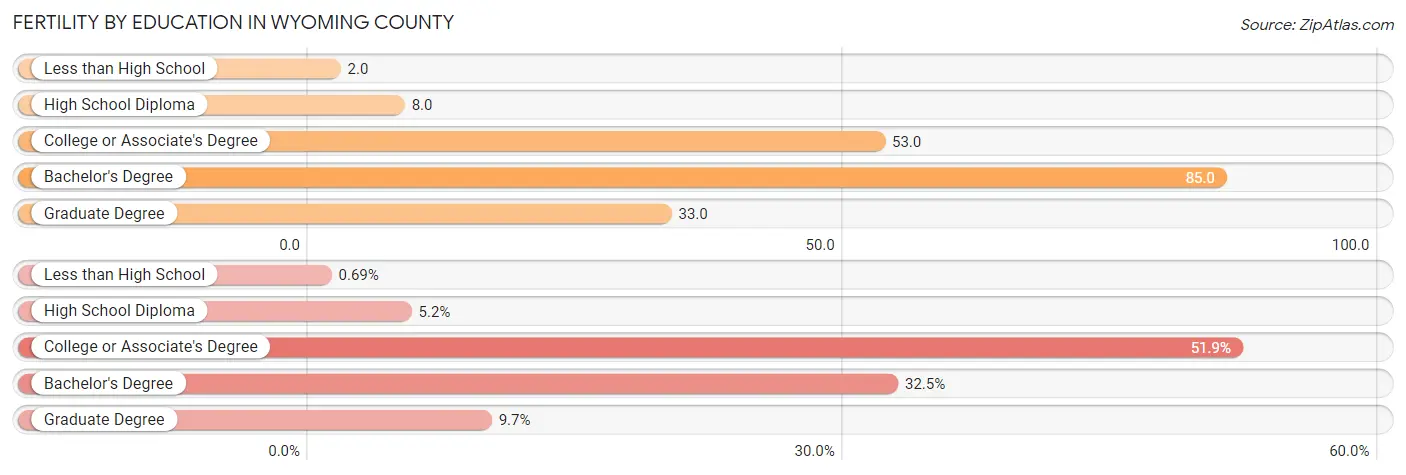
| Educational Attainment | Women with Births | Births / 1,000 Women |
| Less than High School | 2 (0.7%) | 2.0 |
| High School Diploma | 15 (5.2%) | 8.0 |
| College or Associate's Degree | 150 (51.9%) | 53.0 |
| Bachelor's Degree | 94 (32.5%) | 85.0 |
| Graduate Degree | 28 (9.7%) | 33.0 |
| Total | 289 (100.0%) | 38.0 |
Fertility by Education by Marriage Status in Wyoming County
12.1% of women with births in Wyoming County are unmarried. Women with the educational attainment of less than high school are most likely to be married with 100.0% of them married at childbirth, while women with the educational attainment of high school diploma are least likely to be married with 53.3% of them unmarried at childbirth.
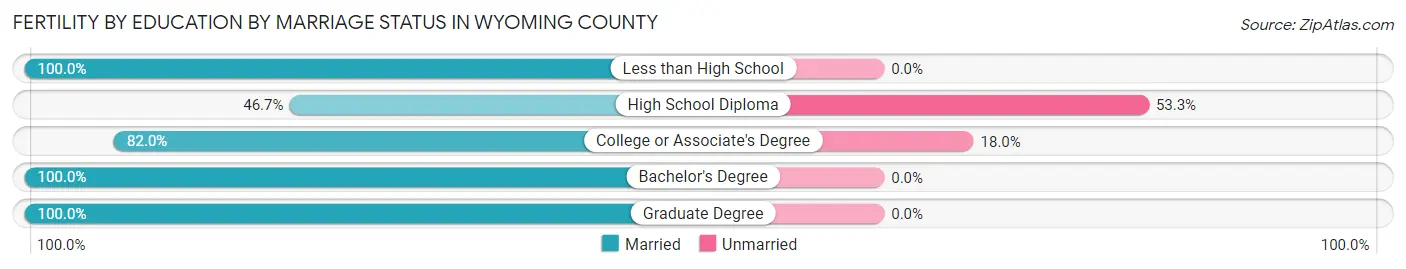
| Educational Attainment | Married | Unmarried |
| Less than High School | 2 (100.0%) | 0 (0.0%) |
| High School Diploma | 7 (46.7%) | 8 (53.3%) |
| College or Associate's Degree | 123 (82.0%) | 27 (18.0%) |
| Bachelor's Degree | 94 (100.0%) | 0 (0.0%) |
| Graduate Degree | 28 (100.0%) | 0 (0.0%) |
| Total | 254 (87.9%) | 35 (12.1%) |
Employment Characteristics in Wyoming County
Employment by Class of Employer in Wyoming County
Among the 17,810 employed individuals in Wyoming County, private company employees (10,461 | 58.7%), local government employees (1,929 | 10.8%), and not-for-profit organizations (1,595 | 9.0%) make up the most common classes of employment.
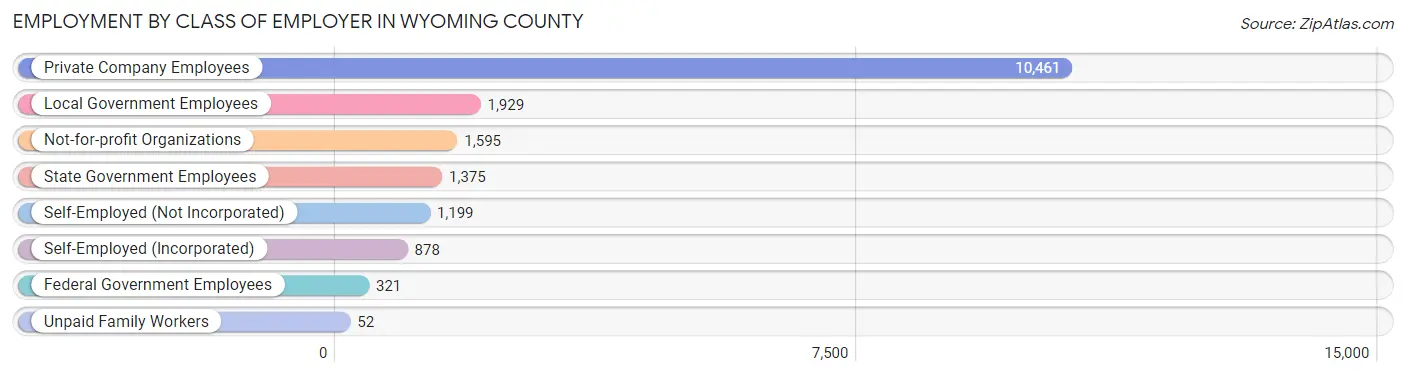
| Employer Class | # Employees | % Employees |
| Private Company Employees | 10,461 | 58.7% |
| Self-Employed (Incorporated) | 878 | 4.9% |
| Self-Employed (Not Incorporated) | 1,199 | 6.7% |
| Not-for-profit Organizations | 1,595 | 9.0% |
| Local Government Employees | 1,929 | 10.8% |
| State Government Employees | 1,375 | 7.7% |
| Federal Government Employees | 321 | 1.8% |
| Unpaid Family Workers | 52 | 0.3% |
| Total | 17,810 | 100.0% |
Employment Status by Age in Wyoming County
According to the labor force statistics for Wyoming County, out of the total population over 16 years of age (33,294), 56.8% or 18,911 individuals are in the labor force, with 4.1% or 775 of them unemployed. The age group with the highest labor force participation rate is 30 to 34 years, with 78.8% or 2,133 individuals in the labor force. Within the labor force, the 20 to 24 years age range has the highest percentage of unemployed individuals, with 7.9% or 130 of them being unemployed.
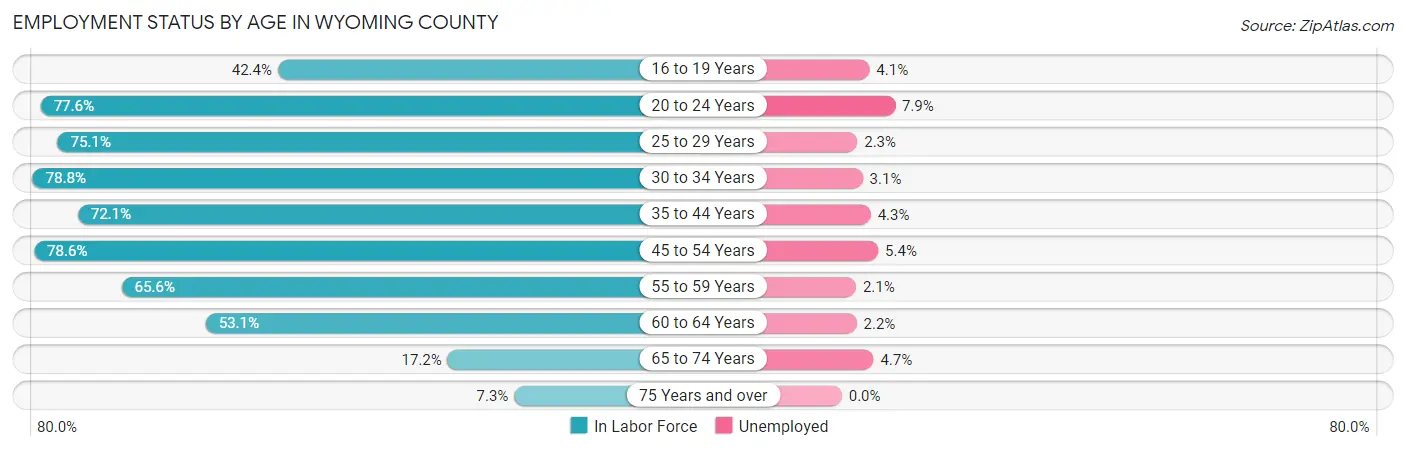
| Age Bracket | In Labor Force | Unemployed |
| 16 to 19 Years | 706 (42.4%) | 29 (4.1%) |
| 20 to 24 Years | 1,643 (77.6%) | 130 (7.9%) |
| 25 to 29 Years | 1,856 (75.1%) | 43 (2.3%) |
| 30 to 34 Years | 2,133 (78.8%) | 66 (3.1%) |
| 35 to 44 Years | 3,747 (72.1%) | 161 (4.3%) |
| 45 to 54 Years | 4,168 (78.6%) | 225 (5.4%) |
| 55 to 59 Years | 1,964 (65.6%) | 41 (2.1%) |
| 60 to 64 Years | 1,658 (53.1%) | 36 (2.2%) |
| 65 to 74 Years | 807 (17.2%) | 38 (4.7%) |
| 75 Years and over | 221 (7.3%) | 0 (0.0%) |
| Total | 18,911 (56.8%) | 775 (4.1%) |
Employment Status by Educational Attainment in Wyoming County
According to labor force statistics for Wyoming County, 71.2% of individuals (15,518) out of the total population between 25 and 64 years of age (21,795) are in the labor force, with 3.7% or 574 of them being unemployed. The group with the highest labor force participation rate are those with the educational attainment of bachelor's degree or higher, with 89.1% or 3,675 individuals in the labor force. Within the labor force, individuals with less than high school education have the highest percentage of unemployment, with 18.2% or 168 of them being unemployed.
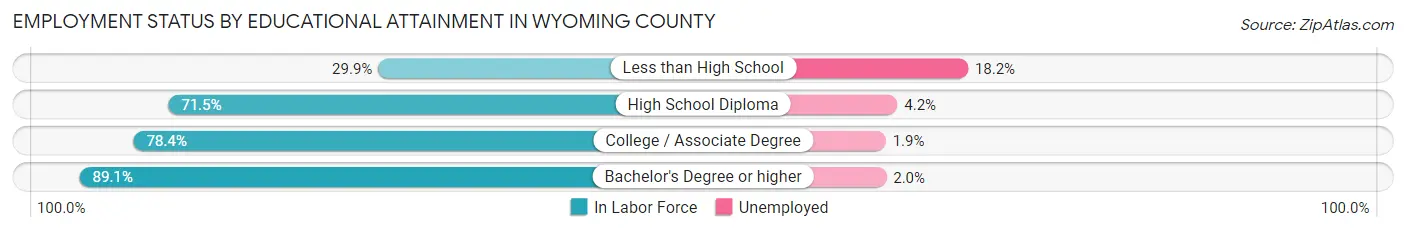
| Educational Attainment | In Labor Force | Unemployed |
| Less than High School | 921 (29.9%) | 561 (18.2%) |
| High School Diploma | 5,350 (71.5%) | 314 (4.2%) |
| College / Associate Degree | 5,572 (78.4%) | 135 (1.9%) |
| Bachelor's Degree or higher | 3,675 (89.1%) | 82 (2.0%) |
| Total | 15,518 (71.2%) | 806 (3.7%) |
Employment Occupations by Sex in Wyoming County
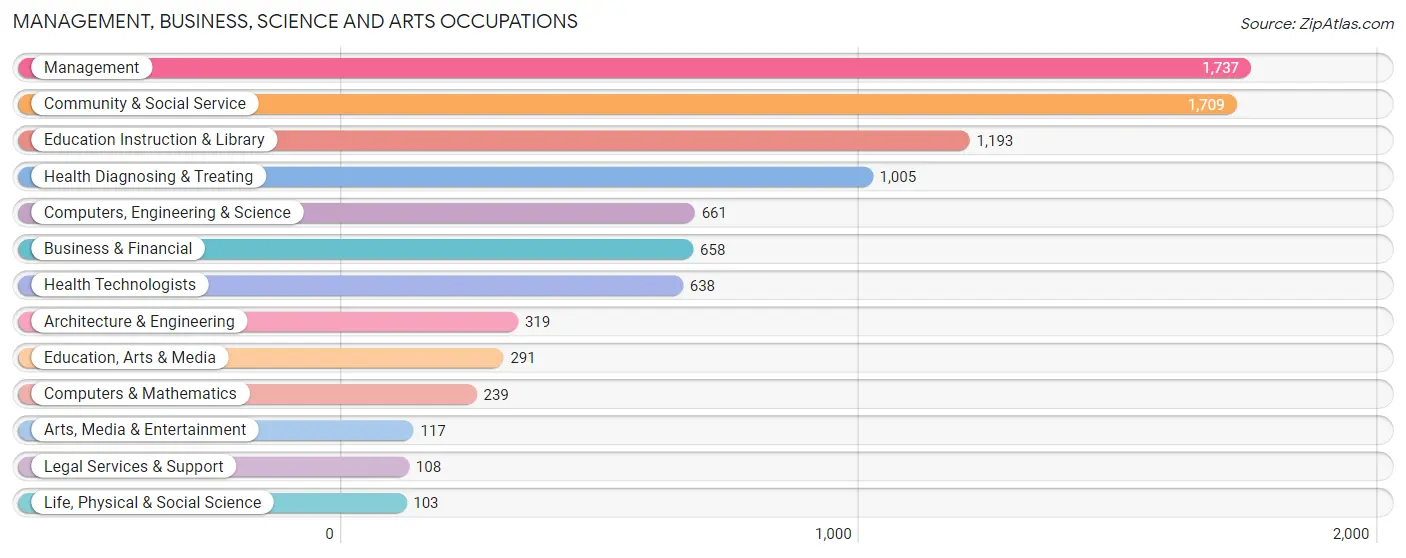
Management, Business, Science and Arts Occupations
The most common Management, Business, Science and Arts occupations in Wyoming County are Management (1,737 | 9.6%), Community & Social Service (1,709 | 9.4%), Education Instruction & Library (1,193 | 6.6%), Health Diagnosing & Treating (1,005 | 5.6%), and Computers, Engineering & Science (661 | 3.6%).
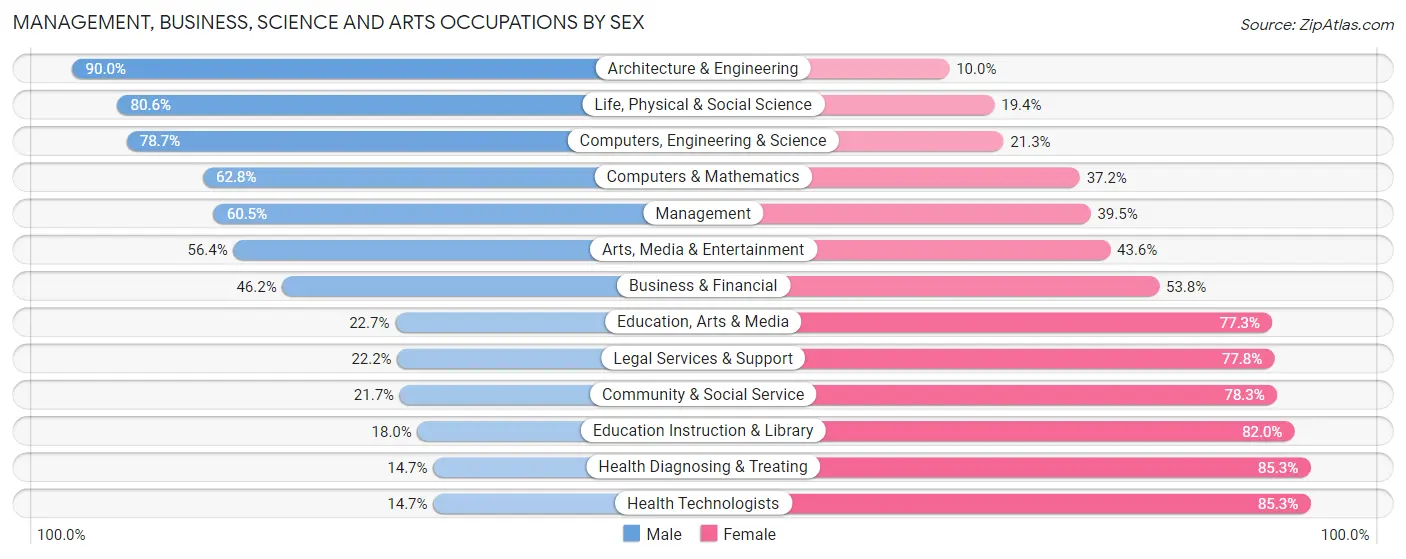
Management, Business, Science and Arts Occupations by Sex
Within the Management, Business, Science and Arts occupations in Wyoming County, the most male-oriented occupations are Architecture & Engineering (90.0%), Life, Physical & Social Science (80.6%), and Computers, Engineering & Science (78.7%), while the most female-oriented occupations are Health Diagnosing & Treating (85.3%), Health Technologists (85.3%), and Education Instruction & Library (82.0%).
| Occupation | Male | Female |
| Management | 1,051 (60.5%) | 686 (39.5%) |
| Business & Financial | 304 (46.2%) | 354 (53.8%) |
| Computers, Engineering & Science | 520 (78.7%) | 141 (21.3%) |
| Computers & Mathematics | 150 (62.8%) | 89 (37.2%) |
| Architecture & Engineering | 287 (90.0%) | 32 (10.0%) |
| Life, Physical & Social Science | 83 (80.6%) | 20 (19.4%) |
| Community & Social Service | 371 (21.7%) | 1,338 (78.3%) |
| Education, Arts & Media | 66 (22.7%) | 225 (77.3%) |
| Legal Services & Support | 24 (22.2%) | 84 (77.8%) |
| Education Instruction & Library | 215 (18.0%) | 978 (82.0%) |
| Arts, Media & Entertainment | 66 (56.4%) | 51 (43.6%) |
| Health Diagnosing & Treating | 148 (14.7%) | 857 (85.3%) |
| Health Technologists | 94 (14.7%) | 544 (85.3%) |
| Total (Category) | 2,394 (41.5%) | 3,376 (58.5%) |
| Total (Overall) | 9,678 (53.5%) | 8,422 (46.5%) |
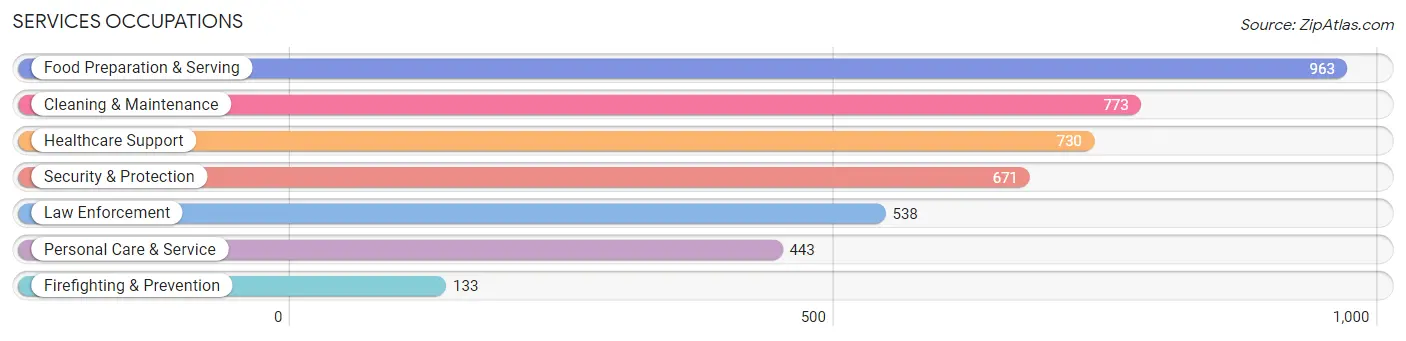
Services Occupations
The most common Services occupations in Wyoming County are Food Preparation & Serving (963 | 5.3%), Cleaning & Maintenance (773 | 4.3%), Healthcare Support (730 | 4.0%), Security & Protection (671 | 3.7%), and Law Enforcement (538 | 3.0%).
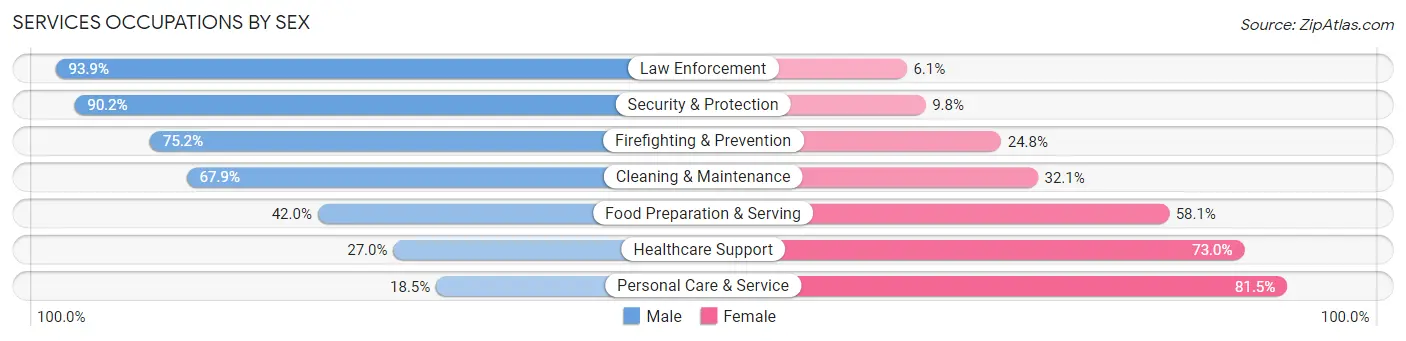
Services Occupations by Sex
Within the Services occupations in Wyoming County, the most male-oriented occupations are Law Enforcement (93.9%), Security & Protection (90.2%), and Firefighting & Prevention (75.2%), while the most female-oriented occupations are Personal Care & Service (81.5%), Healthcare Support (73.0%), and Food Preparation & Serving (58.1%).
| Occupation | Male | Female |
| Healthcare Support | 197 (27.0%) | 533 (73.0%) |
| Security & Protection | 605 (90.2%) | 66 (9.8%) |
| Firefighting & Prevention | 100 (75.2%) | 33 (24.8%) |
| Law Enforcement | 505 (93.9%) | 33 (6.1%) |
| Food Preparation & Serving | 404 (41.9%) | 559 (58.1%) |
| Cleaning & Maintenance | 525 (67.9%) | 248 (32.1%) |
| Personal Care & Service | 82 (18.5%) | 361 (81.5%) |
| Total (Category) | 1,813 (50.6%) | 1,767 (49.4%) |
| Total (Overall) | 9,678 (53.5%) | 8,422 (46.5%) |
Sales and Office Occupations
The most common Sales and Office occupations in Wyoming County are Office & Administration (1,824 | 10.1%), and Sales & Related (1,607 | 8.9%).

Sales and Office Occupations by Sex

| Occupation | Male | Female |
| Sales & Related | 774 (48.2%) | 833 (51.8%) |
| Office & Administration | 185 (10.1%) | 1,639 (89.9%) |
| Total (Category) | 959 (28.0%) | 2,472 (72.1%) |
| Total (Overall) | 9,678 (53.5%) | 8,422 (46.5%) |
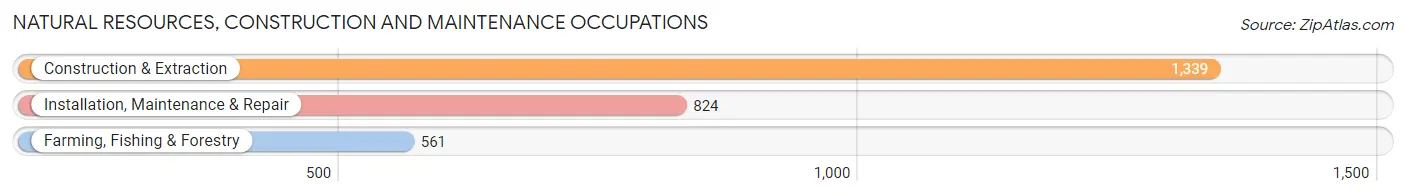
Natural Resources, Construction and Maintenance Occupations
The most common Natural Resources, Construction and Maintenance occupations in Wyoming County are Construction & Extraction (1,339 | 7.4%), Installation, Maintenance & Repair (824 | 4.5%), and Farming, Fishing & Forestry (561 | 3.1%).
Natural Resources, Construction and Maintenance Occupations by Sex
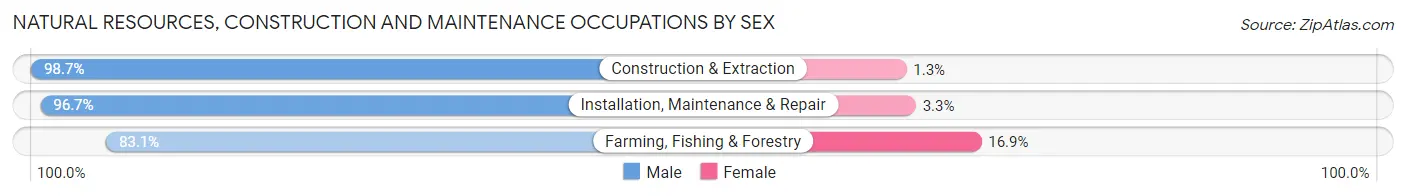
| Occupation | Male | Female |
| Farming, Fishing & Forestry | 466 (83.1%) | 95 (16.9%) |
| Construction & Extraction | 1,321 (98.7%) | 18 (1.3%) |
| Installation, Maintenance & Repair | 797 (96.7%) | 27 (3.3%) |
| Total (Category) | 2,584 (94.9%) | 140 (5.1%) |
| Total (Overall) | 9,678 (53.5%) | 8,422 (46.5%) |
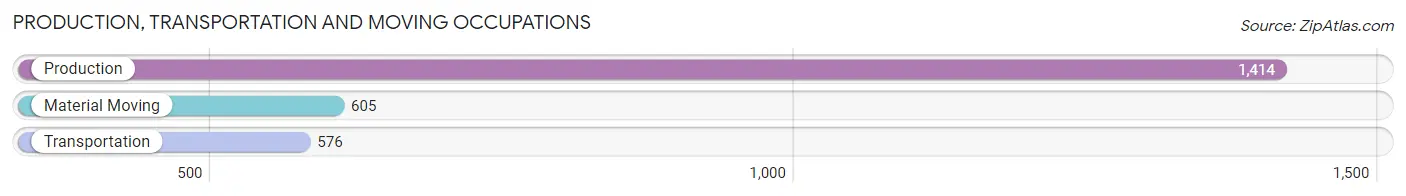
Production, Transportation and Moving Occupations
The most common Production, Transportation and Moving occupations in Wyoming County are Production (1,414 | 7.8%), Material Moving (605 | 3.3%), and Transportation (576 | 3.2%).
Production, Transportation and Moving Occupations by Sex
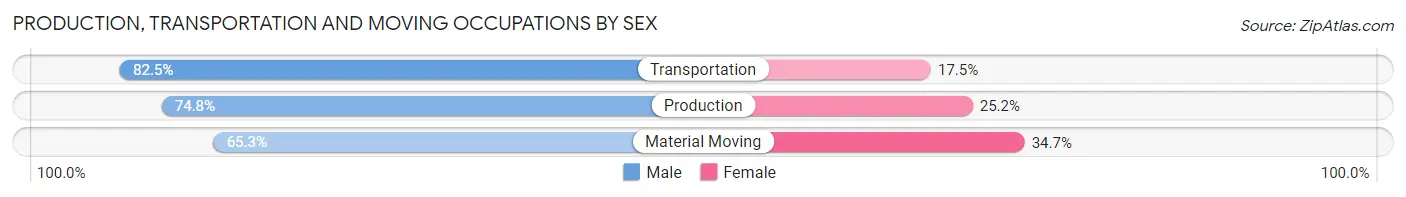
| Occupation | Male | Female |
| Production | 1,058 (74.8%) | 356 (25.2%) |
| Transportation | 475 (82.5%) | 101 (17.5%) |
| Material Moving | 395 (65.3%) | 210 (34.7%) |
| Total (Category) | 1,928 (74.3%) | 667 (25.7%) |
| Total (Overall) | 9,678 (53.5%) | 8,422 (46.5%) |
Employment Industries by Sex in Wyoming County
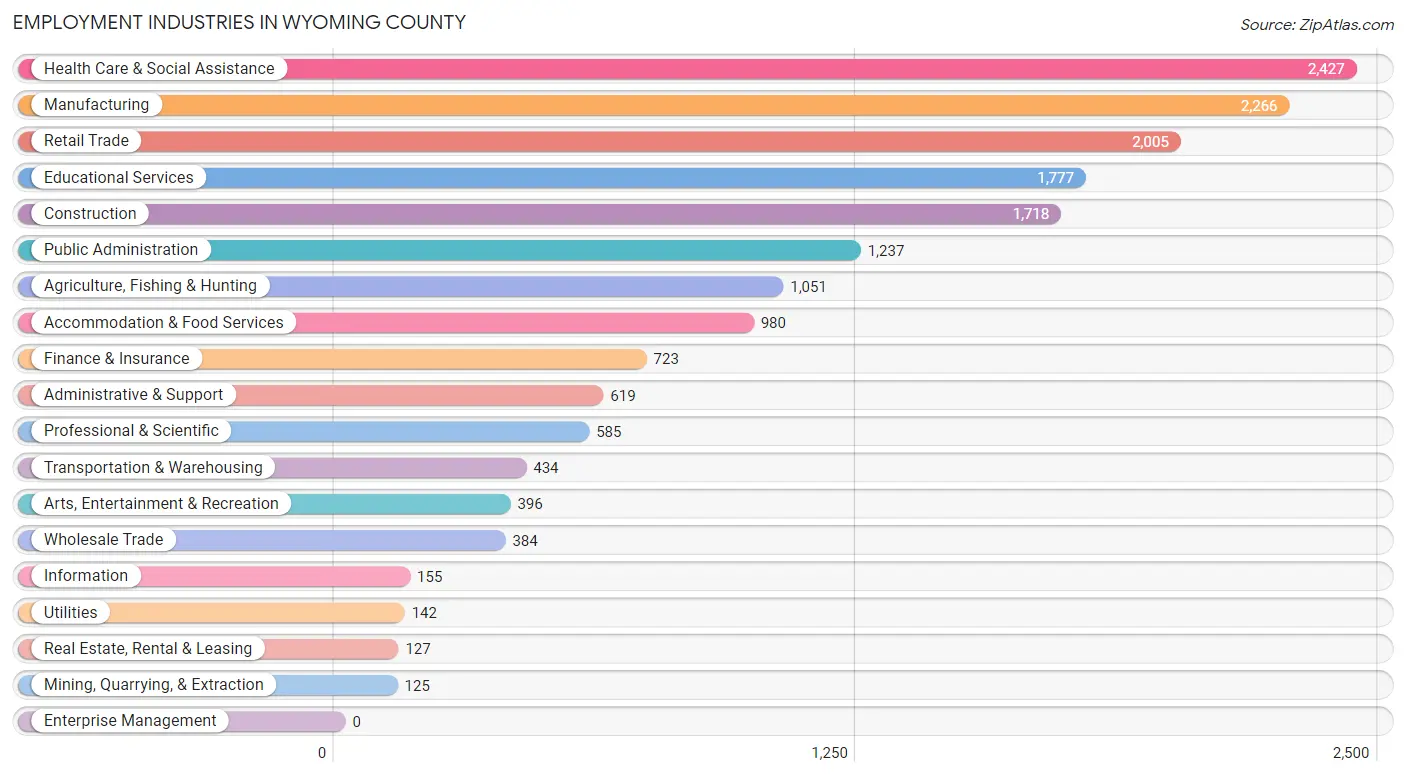
Employment Industries in Wyoming County
The major employment industries in Wyoming County include Health Care & Social Assistance (2,427 | 13.4%), Manufacturing (2,266 | 12.5%), Retail Trade (2,005 | 11.1%), Educational Services (1,777 | 9.8%), and Construction (1,718 | 9.5%).
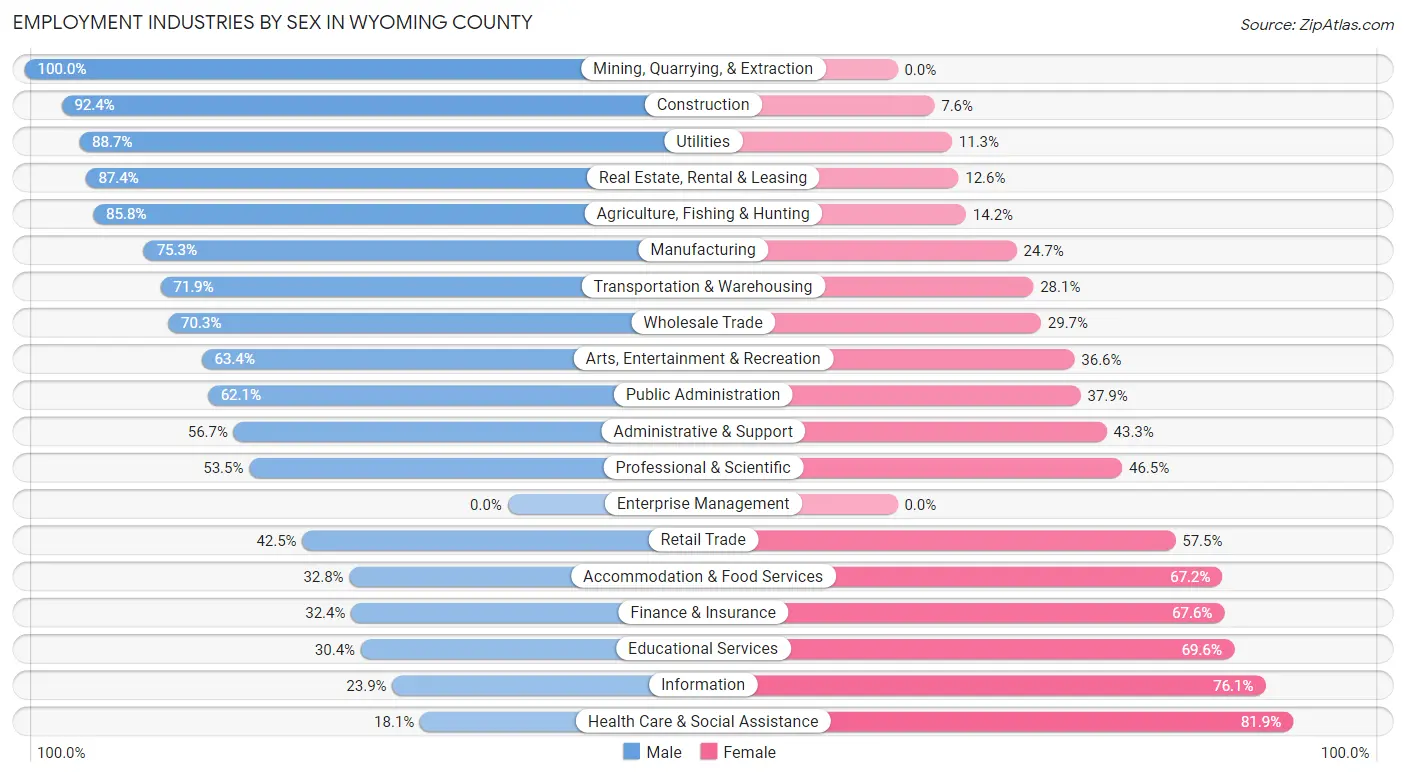
Employment Industries by Sex in Wyoming County
The Wyoming County industries that see more men than women are Mining, Quarrying, & Extraction (100.0%), Construction (92.4%), and Utilities (88.7%), whereas the industries that tend to have a higher number of women are Health Care & Social Assistance (81.9%), Information (76.1%), and Educational Services (69.6%).
| Industry | Male | Female |
| Agriculture, Fishing & Hunting | 902 (85.8%) | 149 (14.2%) |
| Mining, Quarrying, & Extraction | 125 (100.0%) | 0 (0.0%) |
| Construction | 1,587 (92.4%) | 131 (7.6%) |
| Manufacturing | 1,707 (75.3%) | 559 (24.7%) |
| Wholesale Trade | 270 (70.3%) | 114 (29.7%) |
| Retail Trade | 852 (42.5%) | 1,153 (57.5%) |
| Transportation & Warehousing | 312 (71.9%) | 122 (28.1%) |
| Utilities | 126 (88.7%) | 16 (11.3%) |
| Information | 37 (23.9%) | 118 (76.1%) |
| Finance & Insurance | 234 (32.4%) | 489 (67.6%) |
| Real Estate, Rental & Leasing | 111 (87.4%) | 16 (12.6%) |
| Professional & Scientific | 313 (53.5%) | 272 (46.5%) |
| Enterprise Management | 0 (0.0%) | 0 (0.0%) |
| Administrative & Support | 351 (56.7%) | 268 (43.3%) |
| Educational Services | 540 (30.4%) | 1,237 (69.6%) |
| Health Care & Social Assistance | 440 (18.1%) | 1,987 (81.9%) |
| Arts, Entertainment & Recreation | 251 (63.4%) | 145 (36.6%) |
| Accommodation & Food Services | 321 (32.8%) | 659 (67.2%) |
| Public Administration | 768 (62.1%) | 469 (37.9%) |
| Total | 9,678 (53.5%) | 8,422 (46.5%) |
Education in Wyoming County
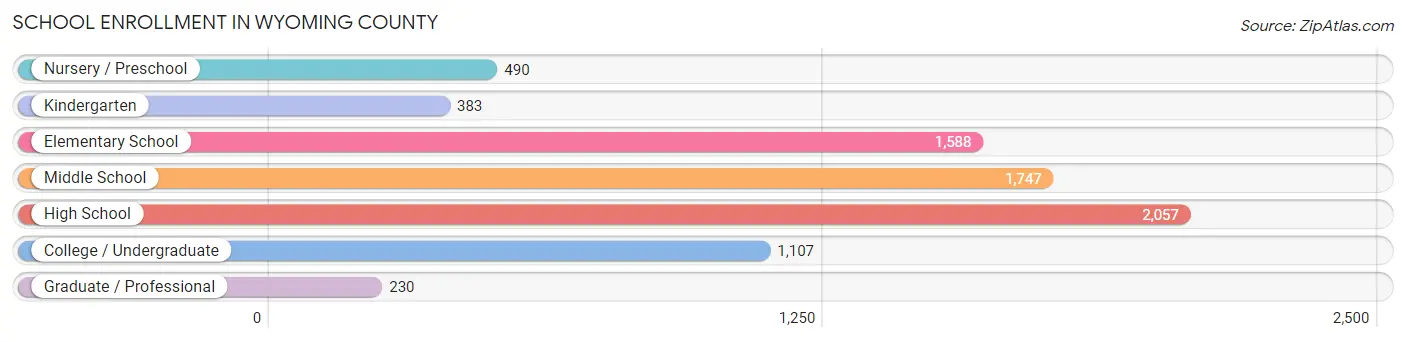
School Enrollment in Wyoming County
The most common levels of schooling among the 7,602 students in Wyoming County are high school (2,057 | 27.1%), middle school (1,747 | 23.0%), and elementary school (1,588 | 20.9%).
| School Level | # Students | % Students |
| Nursery / Preschool | 490 | 6.5% |
| Kindergarten | 383 | 5.0% |
| Elementary School | 1,588 | 20.9% |
| Middle School | 1,747 | 23.0% |
| High School | 2,057 | 27.1% |
| College / Undergraduate | 1,107 | 14.6% |
| Graduate / Professional | 230 | 3.0% |
| Total | 7,602 | 100.0% |
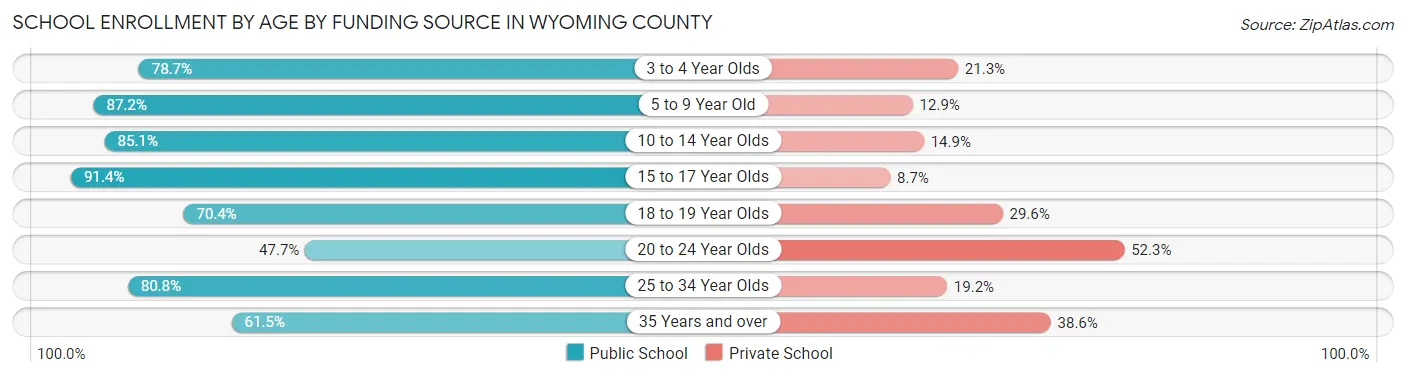
School Enrollment by Age by Funding Source in Wyoming County
Out of a total of 7,602 students who are enrolled in schools in Wyoming County, 1,330 (17.5%) attend a private institution, while the remaining 6,272 (82.5%) are enrolled in public schools. The age group of 20 to 24 year olds has the highest likelihood of being enrolled in private schools, with 231 (52.3% in the age bracket) enrolled. Conversely, the age group of 15 to 17 year olds has the lowest likelihood of being enrolled in a private school, with 1,309 (91.3% in the age bracket) attending a public institution.
| Age Bracket | Public School | Private School |
| 3 to 4 Year Olds | 270 (78.7%) | 73 (21.3%) |
| 5 to 9 Year Old | 1,797 (87.2%) | 265 (12.9%) |
| 10 to 14 Year Olds | 1,912 (85.1%) | 335 (14.9%) |
| 15 to 17 Year Olds | 1,309 (91.3%) | 124 (8.6%) |
| 18 to 19 Year Olds | 307 (70.4%) | 129 (29.6%) |
| 20 to 24 Year Olds | 211 (47.7%) | 231 (52.3%) |
| 25 to 34 Year Olds | 294 (80.8%) | 70 (19.2%) |
| 35 Years and over | 169 (61.5%) | 106 (38.6%) |
| Total | 6,272 (82.5%) | 1,330 (17.5%) |
Educational Attainment by Field of Study in Wyoming County
Education (1,121 | 19.2%), business (995 | 17.0%), science & technology (618 | 10.6%), bio, nature & agricultural (464 | 7.9%), and arts & humanities (414 | 7.1%) are the most common fields of study among 5,841 individuals in Wyoming County who have obtained a bachelor's degree or higher.
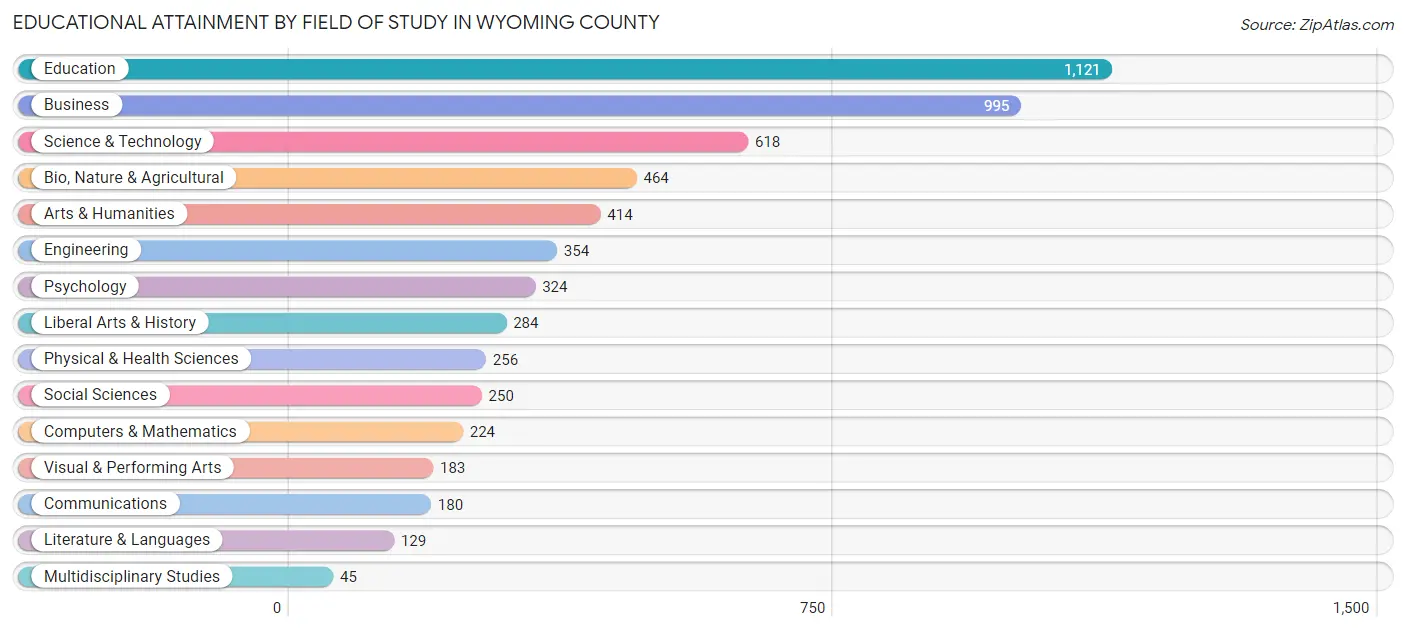
| Field of Study | # Graduates | % Graduates |
| Computers & Mathematics | 224 | 3.8% |
| Bio, Nature & Agricultural | 464 | 7.9% |
| Physical & Health Sciences | 256 | 4.4% |
| Psychology | 324 | 5.6% |
| Social Sciences | 250 | 4.3% |
| Engineering | 354 | 6.1% |
| Multidisciplinary Studies | 45 | 0.8% |
| Science & Technology | 618 | 10.6% |
| Business | 995 | 17.0% |
| Education | 1,121 | 19.2% |
| Literature & Languages | 129 | 2.2% |
| Liberal Arts & History | 284 | 4.9% |
| Visual & Performing Arts | 183 | 3.1% |
| Communications | 180 | 3.1% |
| Arts & Humanities | 414 | 7.1% |
| Total | 5,841 | 100.0% |
Transportation & Commute in Wyoming County
Vehicle Availability by Sex in Wyoming County
The most prevalent vehicle ownership categories in Wyoming County are males with 2 vehicles (4,387, accounting for 45.9%) and females with 2 vehicles (3,780, making up 53.3%).
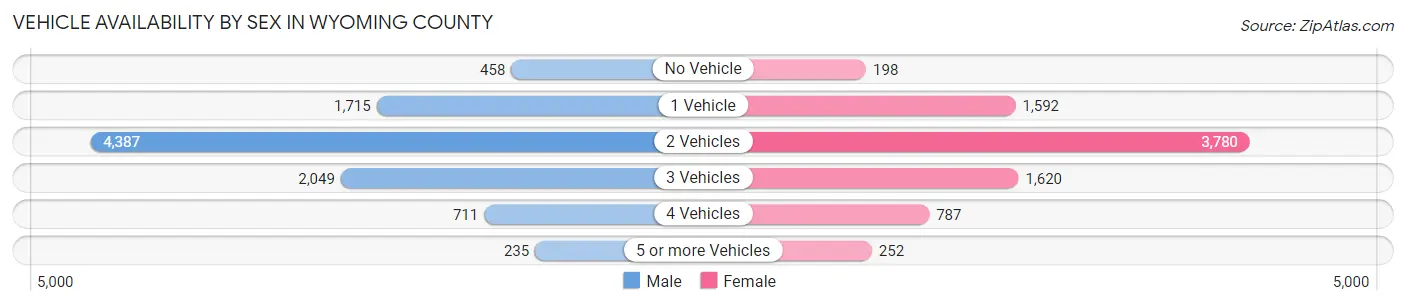
| Vehicles Available | Male | Female |
| No Vehicle | 458 (4.8%) | 198 (2.4%) |
| 1 Vehicle | 1,715 (17.9%) | 1,592 (19.4%) |
| 2 Vehicles | 4,387 (45.9%) | 3,780 (45.9%) |
| 3 Vehicles | 2,049 (21.4%) | 1,620 (19.7%) |
| 4 Vehicles | 711 (7.4%) | 787 (9.6%) |
| 5 or more Vehicles | 235 (2.5%) | 252 (3.1%) |
| Total | 9,555 (100.0%) | 8,229 (100.0%) |
Commute Time in Wyoming County
The most frequently occuring commute durations in Wyoming County are 10 to 14 minutes (2,201 commuters, 13.1%), 5 to 9 minutes (2,125 commuters, 12.6%), and 20 to 24 minutes (2,027 commuters, 12.1%).
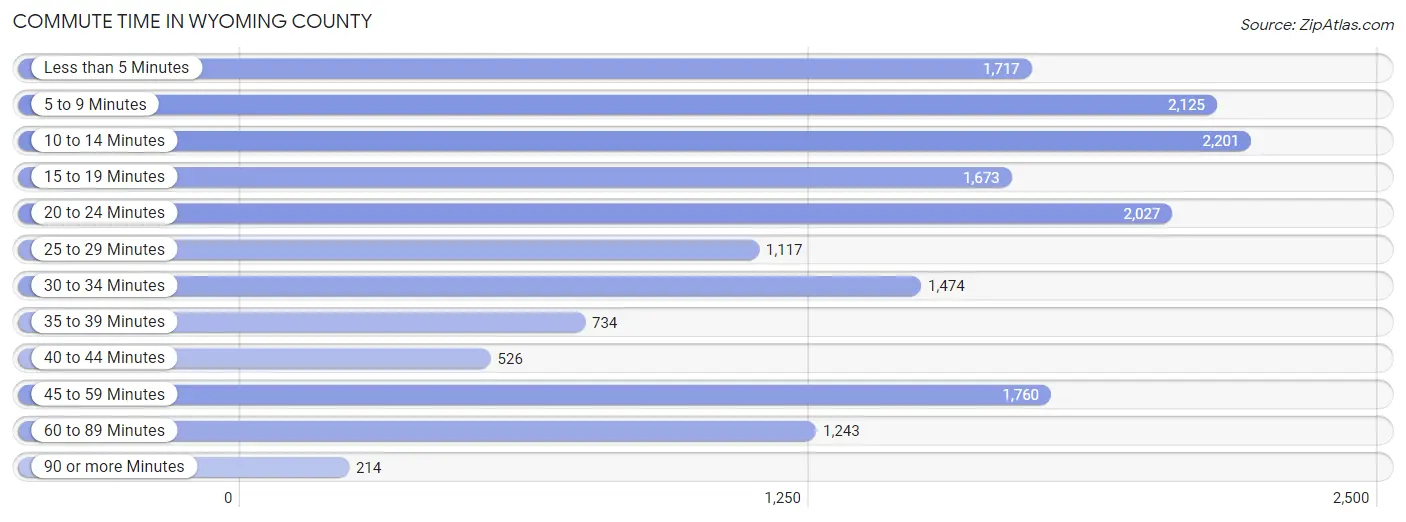
| Commute Time | # Commuters | % Commuters |
| Less than 5 Minutes | 1,717 | 10.2% |
| 5 to 9 Minutes | 2,125 | 12.6% |
| 10 to 14 Minutes | 2,201 | 13.1% |
| 15 to 19 Minutes | 1,673 | 10.0% |
| 20 to 24 Minutes | 2,027 | 12.1% |
| 25 to 29 Minutes | 1,117 | 6.6% |
| 30 to 34 Minutes | 1,474 | 8.8% |
| 35 to 39 Minutes | 734 | 4.4% |
| 40 to 44 Minutes | 526 | 3.1% |
| 45 to 59 Minutes | 1,760 | 10.5% |
| 60 to 89 Minutes | 1,243 | 7.4% |
| 90 or more Minutes | 214 | 1.3% |
Commute Time by Sex in Wyoming County
The most common commute times in Wyoming County are 10 to 14 minutes (1,162 commuters, 12.7%) for males and 5 to 9 minutes (1,069 commuters, 13.9%) for females.
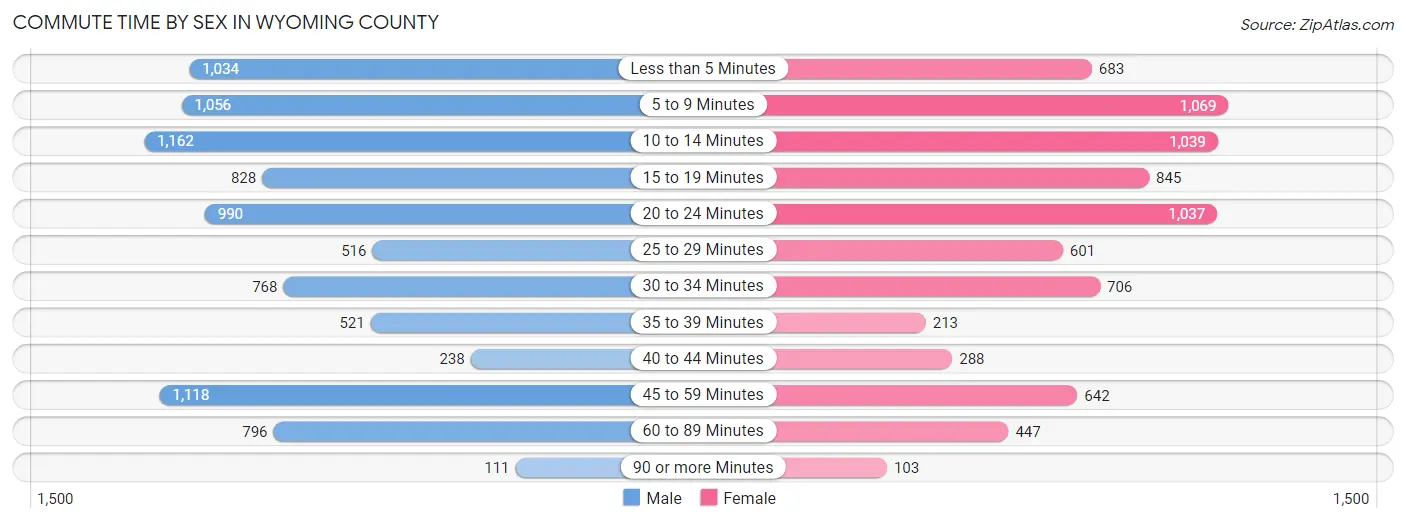
| Commute Time | Male | Female |
| Less than 5 Minutes | 1,034 (11.3%) | 683 (8.9%) |
| 5 to 9 Minutes | 1,056 (11.6%) | 1,069 (13.9%) |
| 10 to 14 Minutes | 1,162 (12.7%) | 1,039 (13.5%) |
| 15 to 19 Minutes | 828 (9.1%) | 845 (11.0%) |
| 20 to 24 Minutes | 990 (10.8%) | 1,037 (13.5%) |
| 25 to 29 Minutes | 516 (5.7%) | 601 (7.8%) |
| 30 to 34 Minutes | 768 (8.4%) | 706 (9.2%) |
| 35 to 39 Minutes | 521 (5.7%) | 213 (2.8%) |
| 40 to 44 Minutes | 238 (2.6%) | 288 (3.7%) |
| 45 to 59 Minutes | 1,118 (12.2%) | 642 (8.4%) |
| 60 to 89 Minutes | 796 (8.7%) | 447 (5.8%) |
| 90 or more Minutes | 111 (1.2%) | 103 (1.3%) |
Time of Departure to Work by Sex in Wyoming County
The most frequent times of departure to work in Wyoming County are 7:00 AM to 7:29 AM (1,392, 15.2%) for males and 7:30 AM to 7:59 AM (1,683, 21.9%) for females.
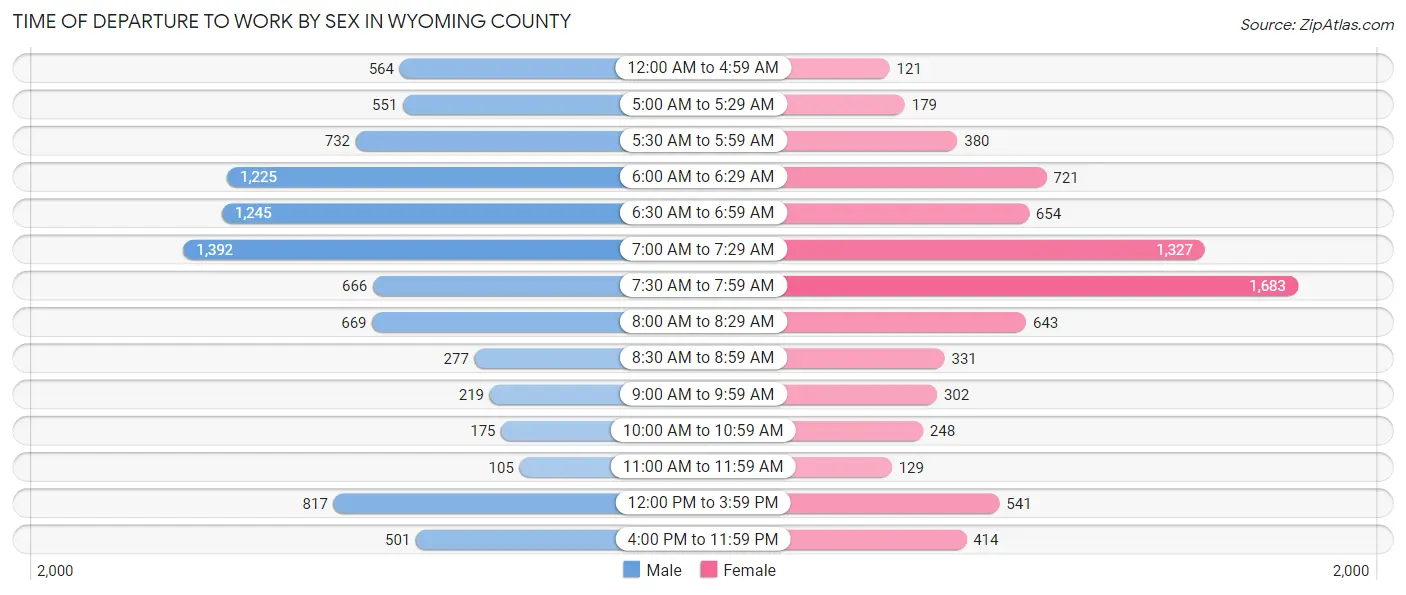
| Time of Departure | Male | Female |
| 12:00 AM to 4:59 AM | 564 (6.2%) | 121 (1.6%) |
| 5:00 AM to 5:29 AM | 551 (6.0%) | 179 (2.3%) |
| 5:30 AM to 5:59 AM | 732 (8.0%) | 380 (5.0%) |
| 6:00 AM to 6:29 AM | 1,225 (13.4%) | 721 (9.4%) |
| 6:30 AM to 6:59 AM | 1,245 (13.6%) | 654 (8.5%) |
| 7:00 AM to 7:29 AM | 1,392 (15.2%) | 1,327 (17.3%) |
| 7:30 AM to 7:59 AM | 666 (7.3%) | 1,683 (21.9%) |
| 8:00 AM to 8:29 AM | 669 (7.3%) | 643 (8.4%) |
| 8:30 AM to 8:59 AM | 277 (3.0%) | 331 (4.3%) |
| 9:00 AM to 9:59 AM | 219 (2.4%) | 302 (3.9%) |
| 10:00 AM to 10:59 AM | 175 (1.9%) | 248 (3.2%) |
| 11:00 AM to 11:59 AM | 105 (1.1%) | 129 (1.7%) |
| 12:00 PM to 3:59 PM | 817 (8.9%) | 541 (7.0%) |
| 4:00 PM to 11:59 PM | 501 (5.5%) | 414 (5.4%) |
| Total | 9,138 (100.0%) | 7,673 (100.0%) |
Housing Occupancy in Wyoming County
Occupancy by Ownership in Wyoming County
Of the total 16,152 dwellings in Wyoming County, owner-occupied units account for 12,457 (77.1%), while renter-occupied units make up 3,695 (22.9%).
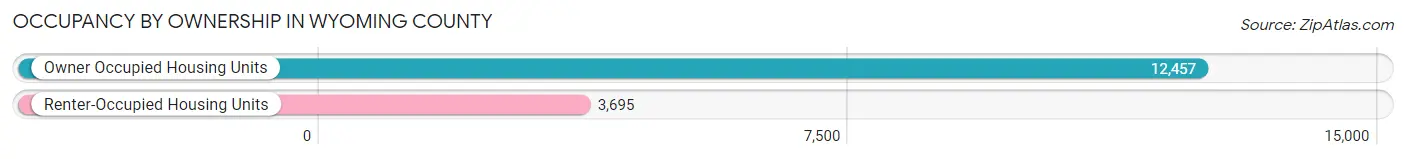
| Occupancy | # Housing Units | % Housing Units |
| Owner Occupied Housing Units | 12,457 | 77.1% |
| Renter-Occupied Housing Units | 3,695 | 22.9% |
| Total Occupied Housing Units | 16,152 | 100.0% |
Occupancy by Household Size in Wyoming County
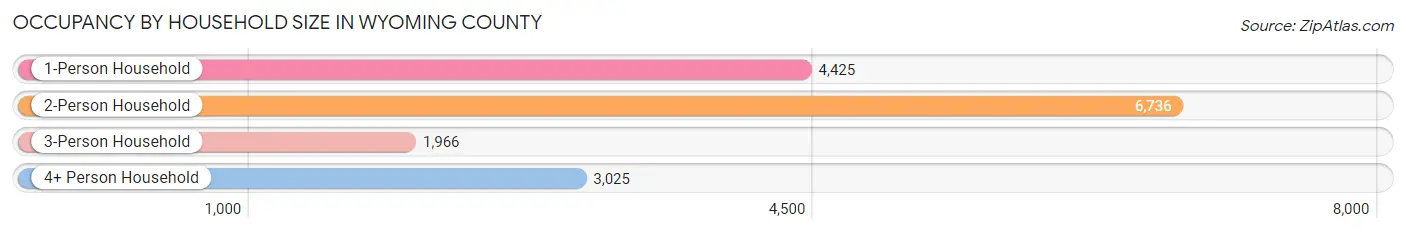
| Household Size | # Housing Units | % Housing Units |
| 1-Person Household | 4,425 | 27.4% |
| 2-Person Household | 6,736 | 41.7% |
| 3-Person Household | 1,966 | 12.2% |
| 4+ Person Household | 3,025 | 18.7% |
| Total Housing Units | 16,152 | 100.0% |
Occupancy by Ownership by Household Size in Wyoming County
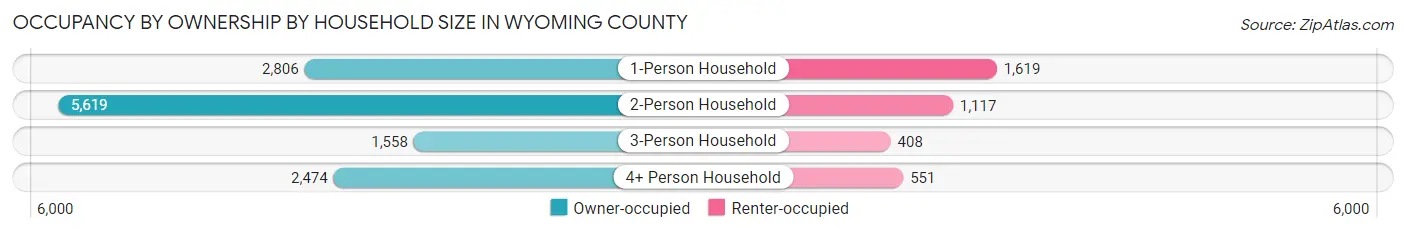
| Household Size | Owner-occupied | Renter-occupied |
| 1-Person Household | 2,806 (63.4%) | 1,619 (36.6%) |
| 2-Person Household | 5,619 (83.4%) | 1,117 (16.6%) |
| 3-Person Household | 1,558 (79.2%) | 408 (20.7%) |
| 4+ Person Household | 2,474 (81.8%) | 551 (18.2%) |
| Total Housing Units | 12,457 (77.1%) | 3,695 (22.9%) |
Occupancy by Educational Attainment in Wyoming County
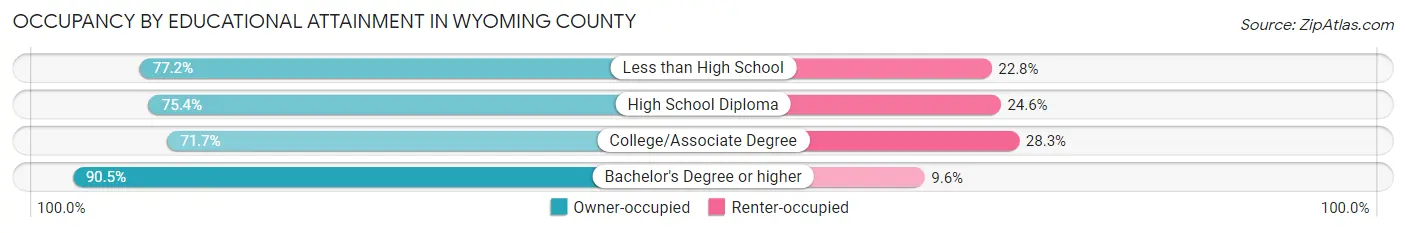
| Household Size | Owner-occupied | Renter-occupied |
| Less than High School | 760 (77.2%) | 225 (22.8%) |
| High School Diploma | 4,673 (75.4%) | 1,528 (24.6%) |
| College/Associate Degree | 4,153 (71.7%) | 1,639 (28.3%) |
| Bachelor's Degree or higher | 2,871 (90.4%) | 303 (9.6%) |
Occupancy by Age of Householder in Wyoming County
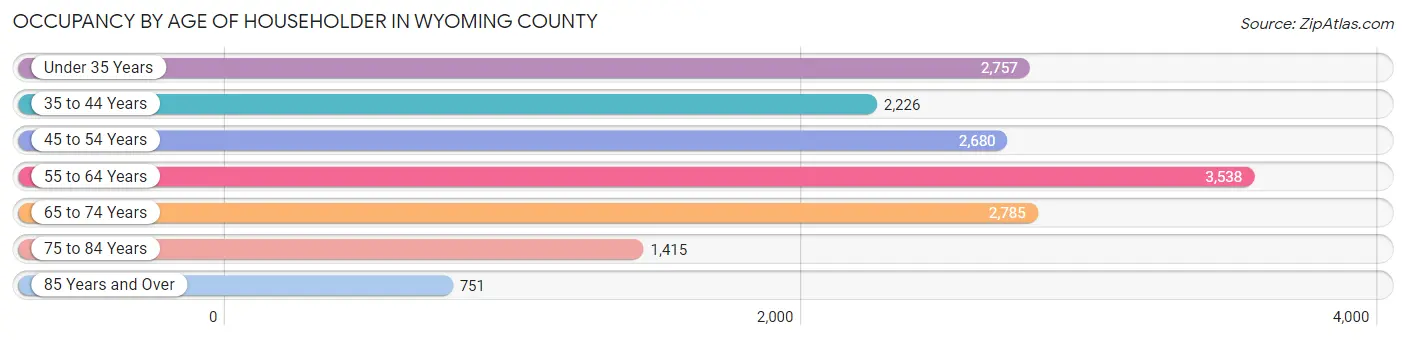
| Age Bracket | # Households | % Households |
| Under 35 Years | 2,757 | 17.1% |
| 35 to 44 Years | 2,226 | 13.8% |
| 45 to 54 Years | 2,680 | 16.6% |
| 55 to 64 Years | 3,538 | 21.9% |
| 65 to 74 Years | 2,785 | 17.2% |
| 75 to 84 Years | 1,415 | 8.8% |
| 85 Years and Over | 751 | 4.6% |
| Total | 16,152 | 100.0% |
Housing Finances in Wyoming County
Median Income by Occupancy in Wyoming County
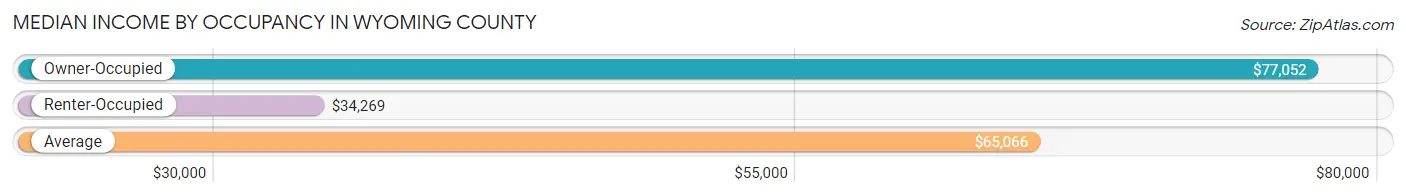
| Occupancy Type | # Households | Median Income |
| Owner-Occupied | 12,457 (77.1%) | $77,052 |
| Renter-Occupied | 3,695 (22.9%) | $34,269 |
| Average | 16,152 (100.0%) | $65,066 |
Occupancy by Householder Income Bracket in Wyoming County
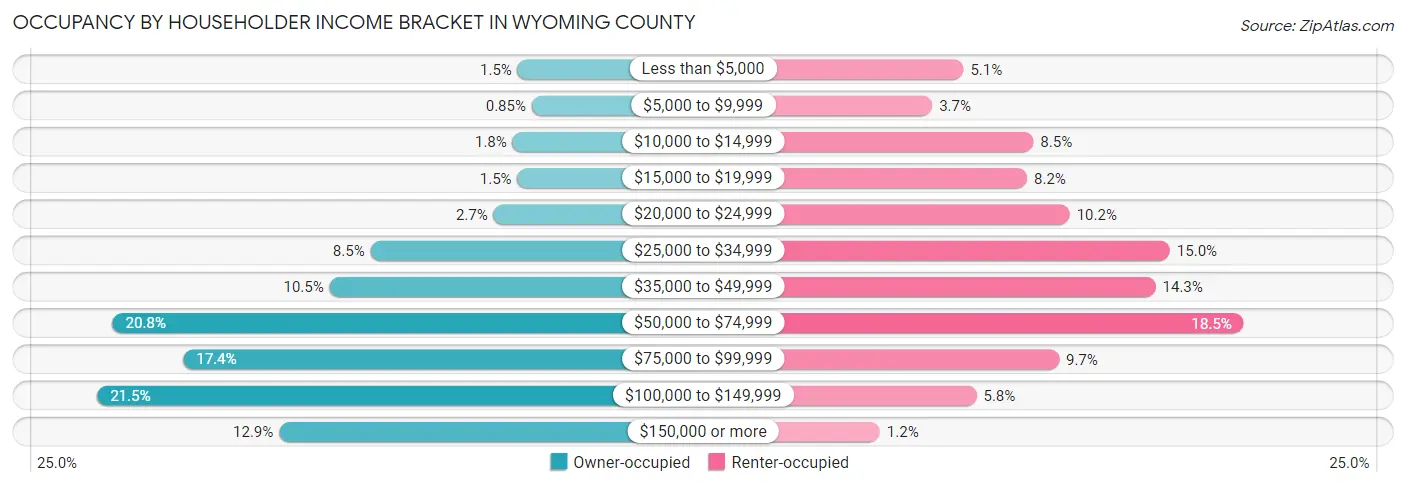
| Income Bracket | Owner-occupied | Renter-occupied |
| Less than $5,000 | 189 (1.5%) | 190 (5.1%) |
| $5,000 to $9,999 | 106 (0.9%) | 135 (3.6%) |
| $10,000 to $14,999 | 219 (1.8%) | 313 (8.5%) |
| $15,000 to $19,999 | 191 (1.5%) | 302 (8.2%) |
| $20,000 to $24,999 | 332 (2.7%) | 377 (10.2%) |
| $25,000 to $34,999 | 1,062 (8.5%) | 553 (15.0%) |
| $35,000 to $49,999 | 1,306 (10.5%) | 528 (14.3%) |
| $50,000 to $74,999 | 2,592 (20.8%) | 683 (18.5%) |
| $75,000 to $99,999 | 2,172 (17.4%) | 358 (9.7%) |
| $100,000 to $149,999 | 2,683 (21.5%) | 213 (5.8%) |
| $150,000 or more | 1,605 (12.9%) | 43 (1.2%) |
| Total | 12,457 (100.0%) | 3,695 (100.0%) |
Monthly Housing Cost Tiers in Wyoming County
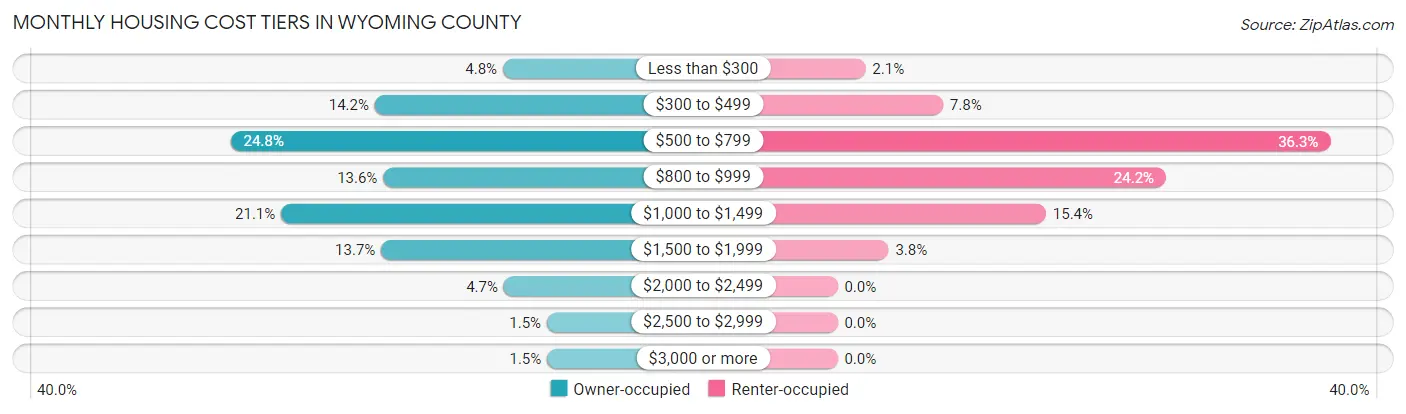
| Monthly Cost | Owner-occupied | Renter-occupied |
| Less than $300 | 594 (4.8%) | 76 (2.1%) |
| $300 to $499 | 1,770 (14.2%) | 287 (7.8%) |
| $500 to $799 | 3,093 (24.8%) | 1,341 (36.3%) |
| $800 to $999 | 1,693 (13.6%) | 894 (24.2%) |
| $1,000 to $1,499 | 2,630 (21.1%) | 567 (15.3%) |
| $1,500 to $1,999 | 1,711 (13.7%) | 139 (3.8%) |
| $2,000 to $2,499 | 587 (4.7%) | 0 (0.0%) |
| $2,500 to $2,999 | 190 (1.5%) | 0 (0.0%) |
| $3,000 or more | 189 (1.5%) | 0 (0.0%) |
| Total | 12,457 (100.0%) | 3,695 (100.0%) |
Physical Housing Characteristics in Wyoming County
Housing Structures in Wyoming County
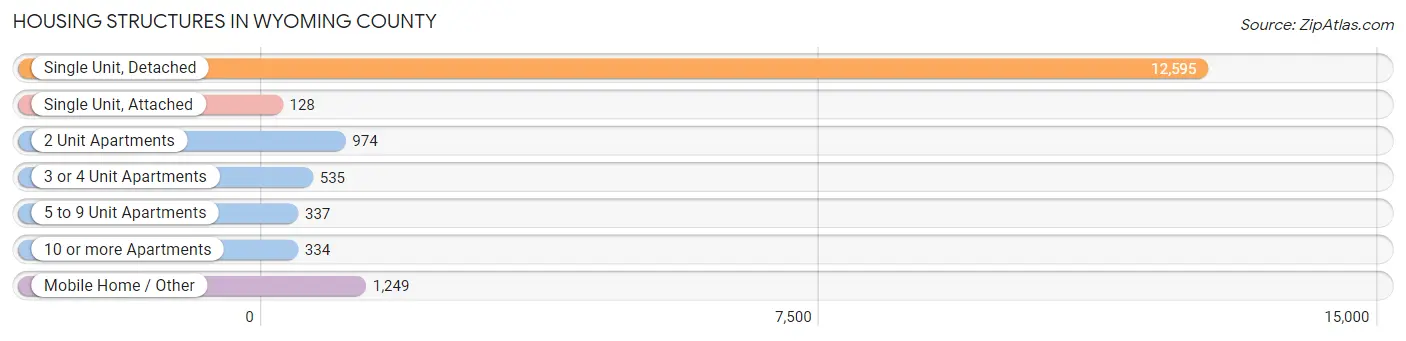
| Structure Type | # Housing Units | % Housing Units |
| Single Unit, Detached | 12,595 | 78.0% |
| Single Unit, Attached | 128 | 0.8% |
| 2 Unit Apartments | 974 | 6.0% |
| 3 or 4 Unit Apartments | 535 | 3.3% |
| 5 to 9 Unit Apartments | 337 | 2.1% |
| 10 or more Apartments | 334 | 2.1% |
| Mobile Home / Other | 1,249 | 7.7% |
| Total | 16,152 | 100.0% |
Housing Structures by Occupancy in Wyoming County
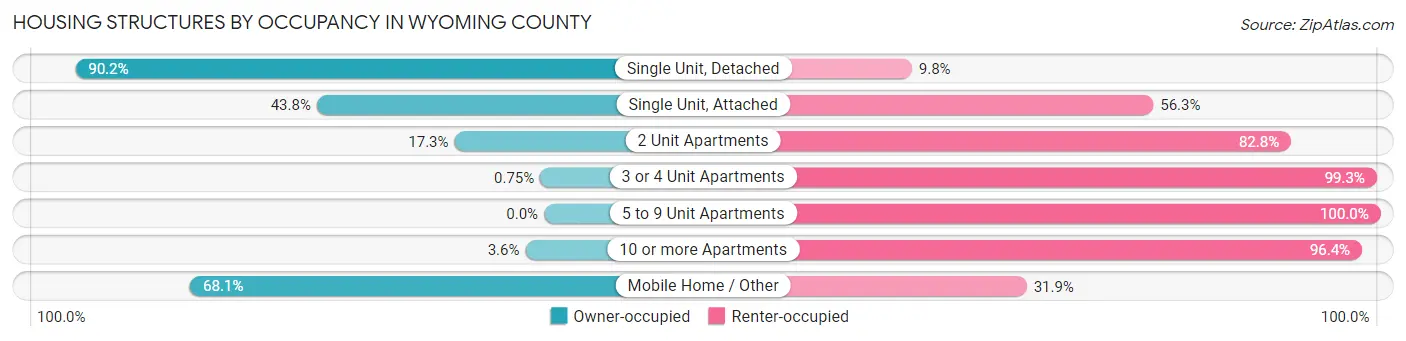
| Structure Type | Owner-occupied | Renter-occupied |
| Single Unit, Detached | 11,366 (90.2%) | 1,229 (9.8%) |
| Single Unit, Attached | 56 (43.8%) | 72 (56.2%) |
| 2 Unit Apartments | 168 (17.2%) | 806 (82.8%) |
| 3 or 4 Unit Apartments | 4 (0.7%) | 531 (99.3%) |
| 5 to 9 Unit Apartments | 0 (0.0%) | 337 (100.0%) |
| 10 or more Apartments | 12 (3.6%) | 322 (96.4%) |
| Mobile Home / Other | 851 (68.1%) | 398 (31.9%) |
| Total | 12,457 (77.1%) | 3,695 (22.9%) |
Housing Structures by Number of Rooms in Wyoming County
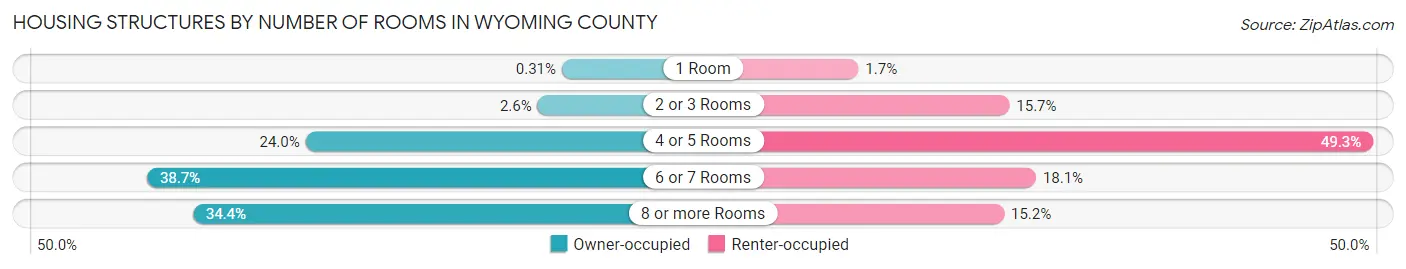
| Number of Rooms | Owner-occupied | Renter-occupied |
| 1 Room | 38 (0.3%) | 63 (1.7%) |
| 2 or 3 Rooms | 319 (2.6%) | 579 (15.7%) |
| 4 or 5 Rooms | 2,992 (24.0%) | 1,822 (49.3%) |
| 6 or 7 Rooms | 4,818 (38.7%) | 670 (18.1%) |
| 8 or more Rooms | 4,290 (34.4%) | 561 (15.2%) |
| Total | 12,457 (100.0%) | 3,695 (100.0%) |
Housing Structure by Heating Type in Wyoming County
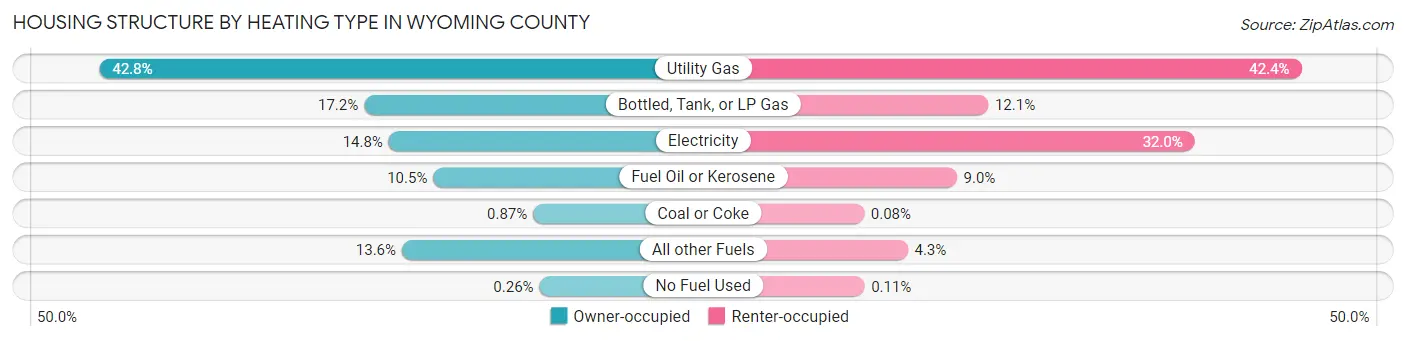
| Heating Type | Owner-occupied | Renter-occupied |
| Utility Gas | 5,329 (42.8%) | 1,565 (42.3%) |
| Bottled, Tank, or LP Gas | 2,143 (17.2%) | 446 (12.1%) |
| Electricity | 1,846 (14.8%) | 1,184 (32.0%) |
| Fuel Oil or Kerosene | 1,311 (10.5%) | 334 (9.0%) |
| Coal or Coke | 108 (0.9%) | 3 (0.1%) |
| All other Fuels | 1,688 (13.6%) | 159 (4.3%) |
| No Fuel Used | 32 (0.3%) | 4 (0.1%) |
| Total | 12,457 (100.0%) | 3,695 (100.0%) |
Household Vehicle Usage in Wyoming County
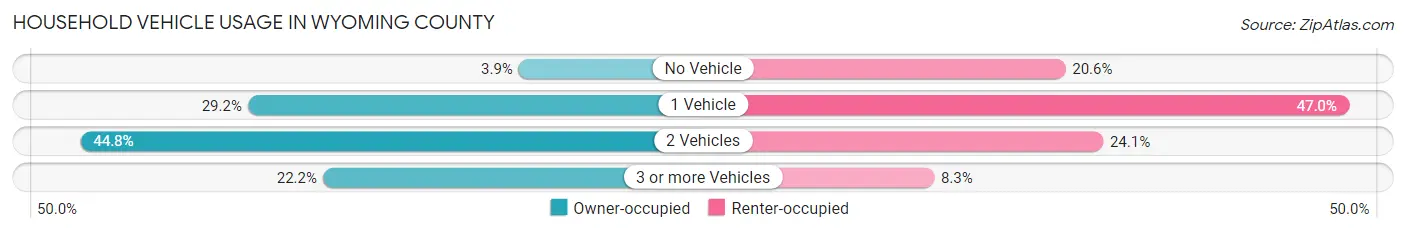
| Vehicles per Household | Owner-occupied | Renter-occupied |
| No Vehicle | 483 (3.9%) | 760 (20.6%) |
| 1 Vehicle | 3,634 (29.2%) | 1,738 (47.0%) |
| 2 Vehicles | 5,579 (44.8%) | 890 (24.1%) |
| 3 or more Vehicles | 2,761 (22.2%) | 307 (8.3%) |
| Total | 12,457 (100.0%) | 3,695 (100.0%) |
Real Estate & Mortgages in Wyoming County
Real Estate and Mortgage Overview in Wyoming County
| Characteristic | Without Mortgage | With Mortgage |
| Housing Units | 6,001 | 6,456 |
| Median Property Value | $129,600 | $154,700 |
| Median Household Income | $63,793 | $1,091 |
| Monthly Housing Costs | $570 | $182 |
| Real Estate Taxes | $3,310 | $220 |
Property Value by Mortgage Status in Wyoming County
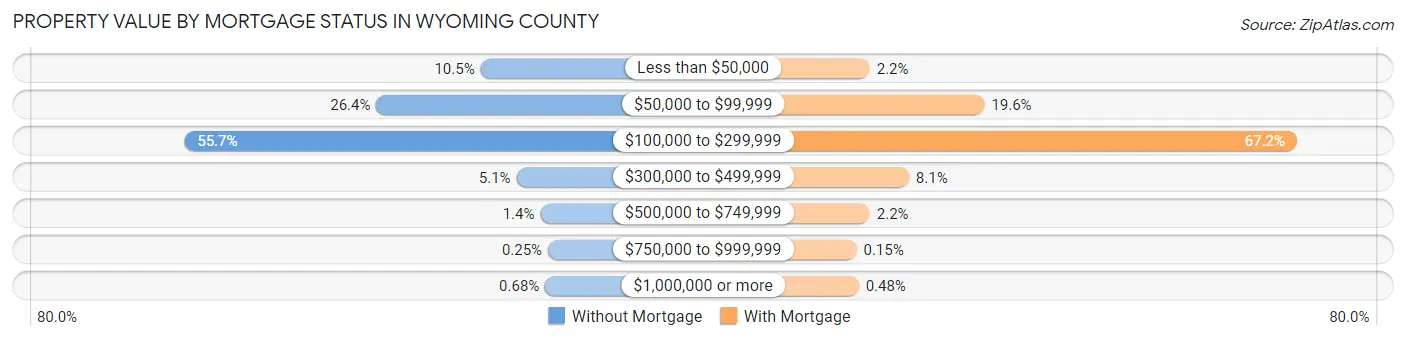
| Property Value | Without Mortgage | With Mortgage |
| Less than $50,000 | 632 (10.5%) | 140 (2.2%) |
| $50,000 to $99,999 | 1,585 (26.4%) | 1,268 (19.6%) |
| $100,000 to $299,999 | 3,340 (55.7%) | 4,341 (67.2%) |
| $300,000 to $499,999 | 303 (5.1%) | 525 (8.1%) |
| $500,000 to $749,999 | 85 (1.4%) | 141 (2.2%) |
| $750,000 to $999,999 | 15 (0.3%) | 10 (0.2%) |
| $1,000,000 or more | 41 (0.7%) | 31 (0.5%) |
| Total | 6,001 (100.0%) | 6,456 (100.0%) |
Household Income by Mortgage Status in Wyoming County
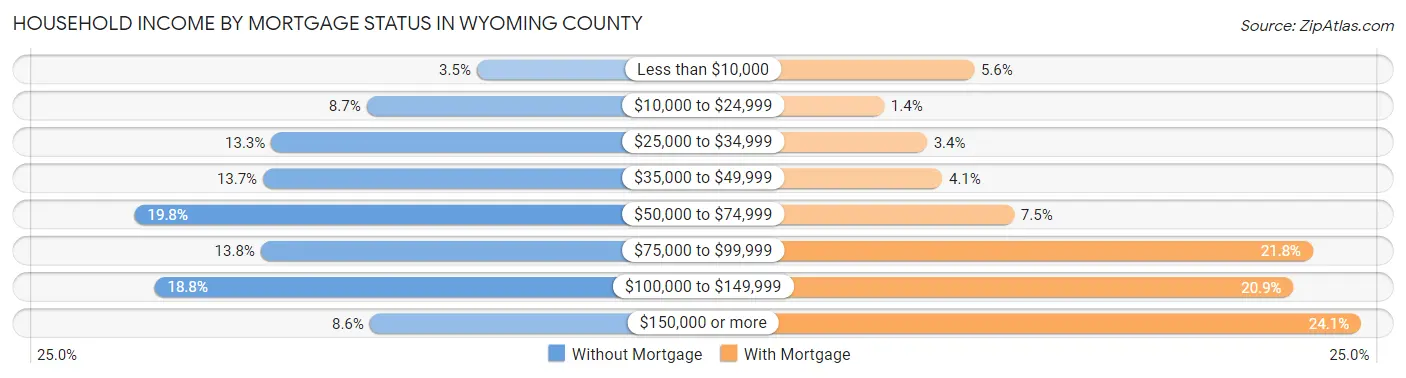
| Household Income | Without Mortgage | With Mortgage |
| Less than $10,000 | 208 (3.5%) | 364 (5.6%) |
| $10,000 to $24,999 | 523 (8.7%) | 87 (1.3%) |
| $25,000 to $34,999 | 796 (13.3%) | 219 (3.4%) |
| $35,000 to $49,999 | 819 (13.7%) | 266 (4.1%) |
| $50,000 to $74,999 | 1,186 (19.8%) | 487 (7.5%) |
| $75,000 to $99,999 | 826 (13.8%) | 1,406 (21.8%) |
| $100,000 to $149,999 | 1,129 (18.8%) | 1,346 (20.8%) |
| $150,000 or more | 514 (8.6%) | 1,554 (24.1%) |
| Total | 6,001 (100.0%) | 6,456 (100.0%) |
Property Value to Household Income Ratio in Wyoming County
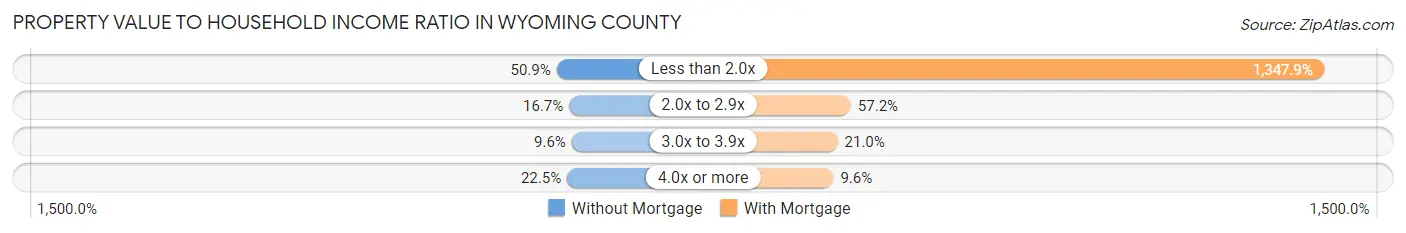
| Value-to-Income Ratio | Without Mortgage | With Mortgage |
| Less than 2.0x | 3,056 (50.9%) | 87,017 (1,347.9%) |
| 2.0x to 2.9x | 1,001 (16.7%) | 3,690 (57.2%) |
| 3.0x to 3.9x | 575 (9.6%) | 1,353 (21.0%) |
| 4.0x or more | 1,347 (22.5%) | 619 (9.6%) |
| Total | 6,001 (100.0%) | 6,456 (100.0%) |
Real Estate Taxes by Mortgage Status in Wyoming County
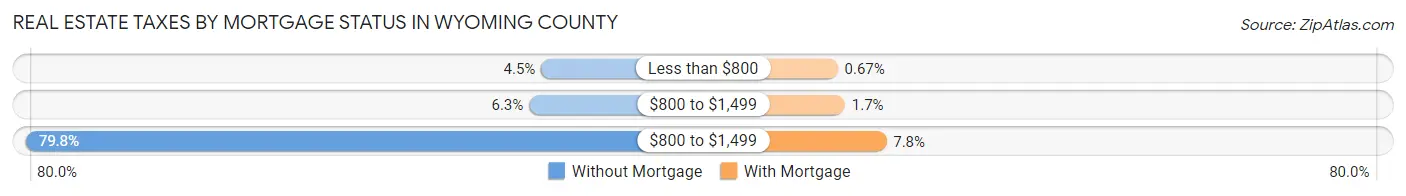
| Property Taxes | Without Mortgage | With Mortgage |
| Less than $800 | 271 (4.5%) | 43 (0.7%) |
| $800 to $1,499 | 377 (6.3%) | 111 (1.7%) |
| $800 to $1,499 | 4,790 (79.8%) | 502 (7.8%) |
| Total | 6,001 (100.0%) | 6,456 (100.0%) |
Health & Disability in Wyoming County
Health Insurance Coverage by Age in Wyoming County
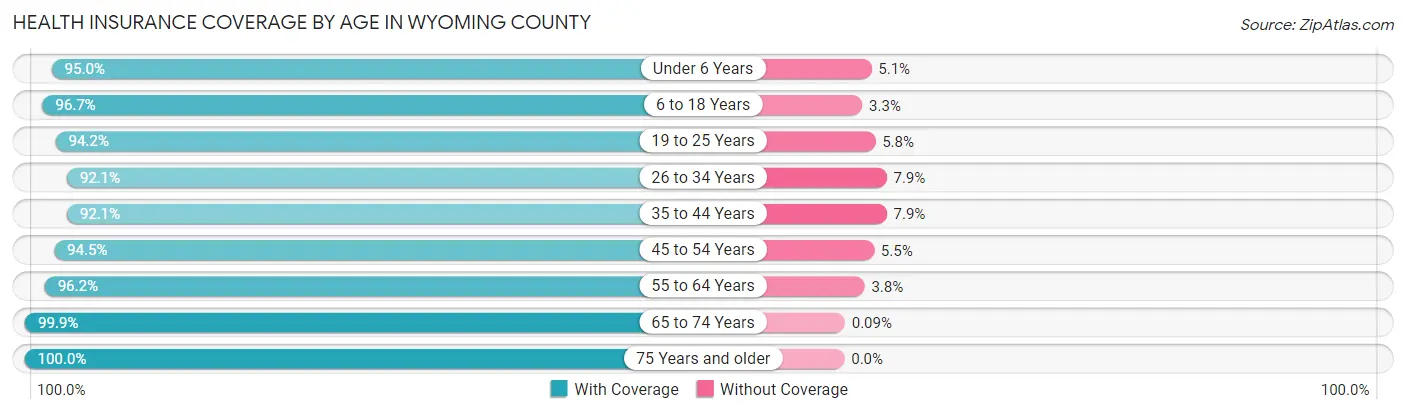
| Age Bracket | With Coverage | Without Coverage |
| Under 6 Years | 2,254 (95.0%) | 120 (5.1%) |
| 6 to 18 Years | 5,658 (96.7%) | 195 (3.3%) |
| 19 to 25 Years | 2,661 (94.2%) | 163 (5.8%) |
| 26 to 34 Years | 3,860 (92.1%) | 330 (7.9%) |
| 35 to 44 Years | 3,980 (92.1%) | 341 (7.9%) |
| 45 to 54 Years | 4,601 (94.5%) | 269 (5.5%) |
| 55 to 64 Years | 5,680 (96.2%) | 222 (3.8%) |
| 65 to 74 Years | 4,618 (99.9%) | 4 (0.1%) |
| 75 Years and older | 2,949 (100.0%) | 0 (0.0%) |
| Total | 36,261 (95.7%) | 1,644 (4.3%) |
Health Insurance Coverage by Citizenship Status in Wyoming County
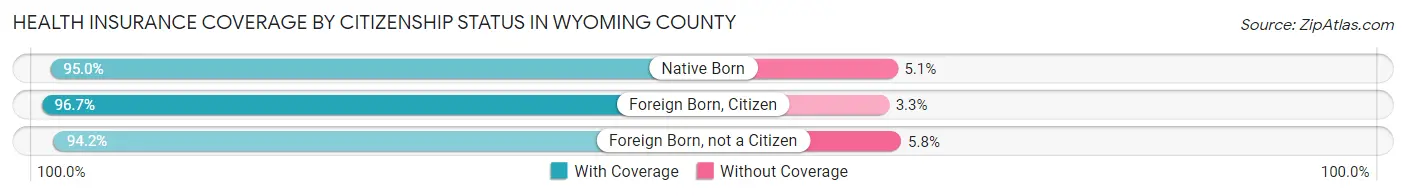
| Citizenship Status | With Coverage | Without Coverage |
| Native Born | 2,254 (95.0%) | 120 (5.1%) |
| Foreign Born, Citizen | 5,658 (96.7%) | 195 (3.3%) |
| Foreign Born, not a Citizen | 2,661 (94.2%) | 163 (5.8%) |
Health Insurance Coverage by Household Income in Wyoming County
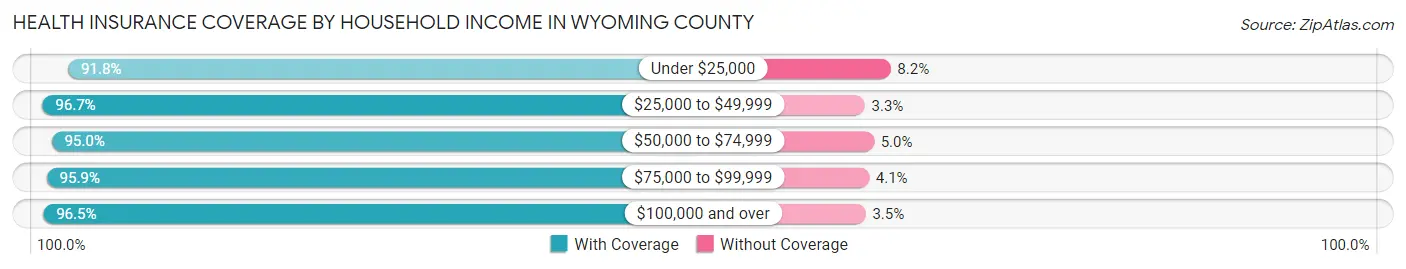
| Household Income | With Coverage | Without Coverage |
| Under $25,000 | 3,460 (91.8%) | 308 (8.2%) |
| $25,000 to $49,999 | 6,217 (96.7%) | 215 (3.3%) |
| $50,000 to $74,999 | 6,871 (95.0%) | 365 (5.0%) |
| $75,000 to $99,999 | 6,600 (95.9%) | 284 (4.1%) |
| $100,000 and over | 12,969 (96.5%) | 471 (3.5%) |
Public vs Private Health Insurance Coverage by Age in Wyoming County
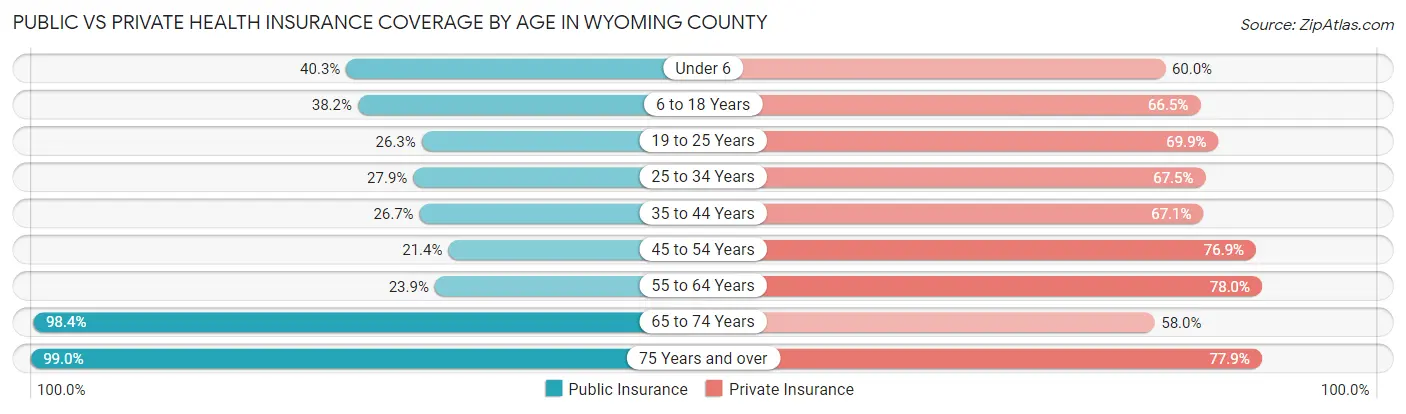
| Age Bracket | Public Insurance | Private Insurance |
| Under 6 | 957 (40.3%) | 1,424 (60.0%) |
| 6 to 18 Years | 2,233 (38.2%) | 3,893 (66.5%) |
| 19 to 25 Years | 743 (26.3%) | 1,974 (69.9%) |
| 25 to 34 Years | 1,168 (27.9%) | 2,827 (67.5%) |
| 35 to 44 Years | 1,154 (26.7%) | 2,899 (67.1%) |
| 45 to 54 Years | 1,040 (21.4%) | 3,743 (76.9%) |
| 55 to 64 Years | 1,409 (23.9%) | 4,601 (78.0%) |
| 65 to 74 Years | 4,550 (98.4%) | 2,681 (58.0%) |
| 75 Years and over | 2,918 (99.0%) | 2,297 (77.9%) |
| Total | 16,172 (42.7%) | 26,339 (69.5%) |
Disability Status by Sex by Age in Wyoming County
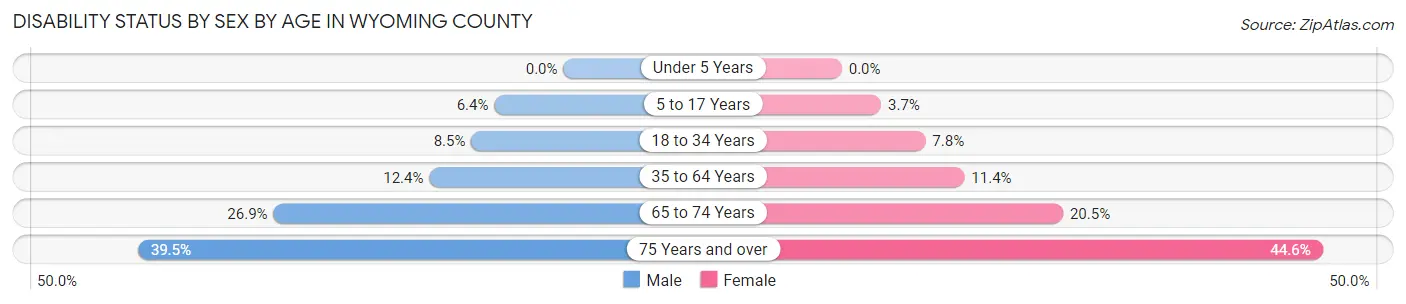
| Age Bracket | Male | Female |
| Under 5 Years | 0 (0.0%) | 0 (0.0%) |
| 5 to 17 Years | 189 (6.4%) | 113 (3.6%) |
| 18 to 34 Years | 323 (8.5%) | 270 (7.8%) |
| 35 to 64 Years | 973 (12.4%) | 827 (11.4%) |
| 65 to 74 Years | 642 (26.9%) | 459 (20.5%) |
| 75 Years and over | 507 (39.5%) | 743 (44.6%) |
Disability Class by Sex by Age in Wyoming County
Disability Class: Hearing Difficulty
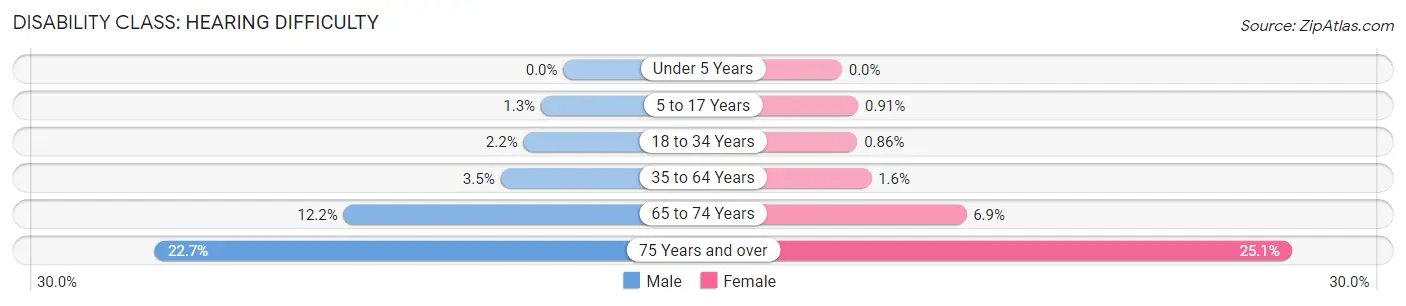
| Age Bracket | Male | Female |
| Under 5 Years | 0 (0.0%) | 0 (0.0%) |
| 5 to 17 Years | 37 (1.3%) | 28 (0.9%) |
| 18 to 34 Years | 84 (2.2%) | 30 (0.9%) |
| 35 to 64 Years | 274 (3.5%) | 119 (1.6%) |
| 65 to 74 Years | 292 (12.2%) | 155 (6.9%) |
| 75 Years and over | 292 (22.7%) | 417 (25.1%) |
Disability Class: Vision Difficulty
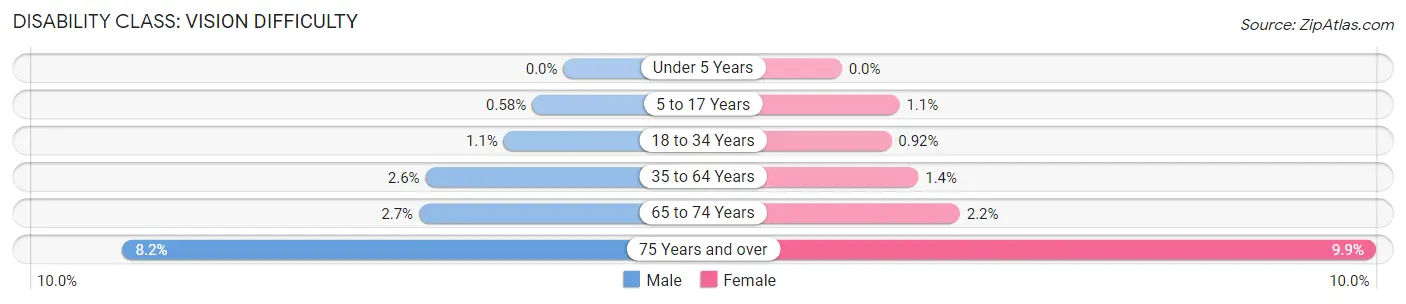
| Age Bracket | Male | Female |
| Under 5 Years | 0 (0.0%) | 0 (0.0%) |
| 5 to 17 Years | 17 (0.6%) | 33 (1.1%) |
| 18 to 34 Years | 42 (1.1%) | 32 (0.9%) |
| 35 to 64 Years | 200 (2.6%) | 103 (1.4%) |
| 65 to 74 Years | 64 (2.7%) | 49 (2.2%) |
| 75 Years and over | 105 (8.2%) | 165 (9.9%) |
Disability Class: Cognitive Difficulty
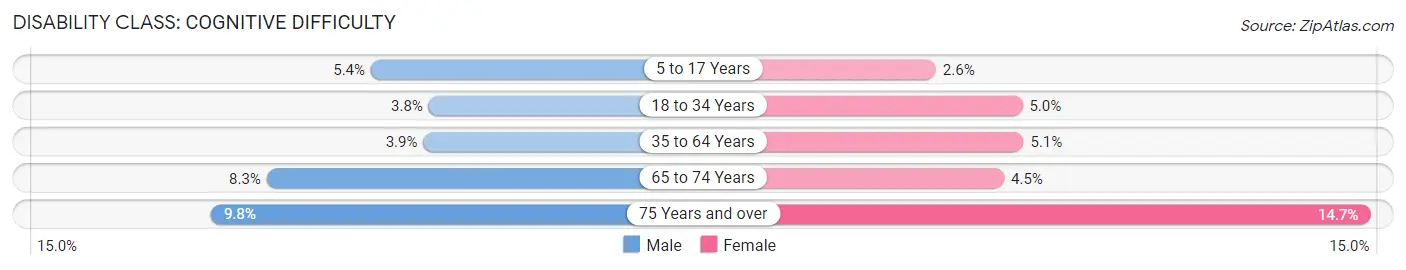
| Age Bracket | Male | Female |
| 5 to 17 Years | 158 (5.4%) | 81 (2.6%) |
| 18 to 34 Years | 142 (3.7%) | 175 (5.0%) |
| 35 to 64 Years | 305 (3.9%) | 368 (5.1%) |
| 65 to 74 Years | 197 (8.3%) | 101 (4.5%) |
| 75 Years and over | 126 (9.8%) | 245 (14.7%) |
Disability Class: Ambulatory Difficulty
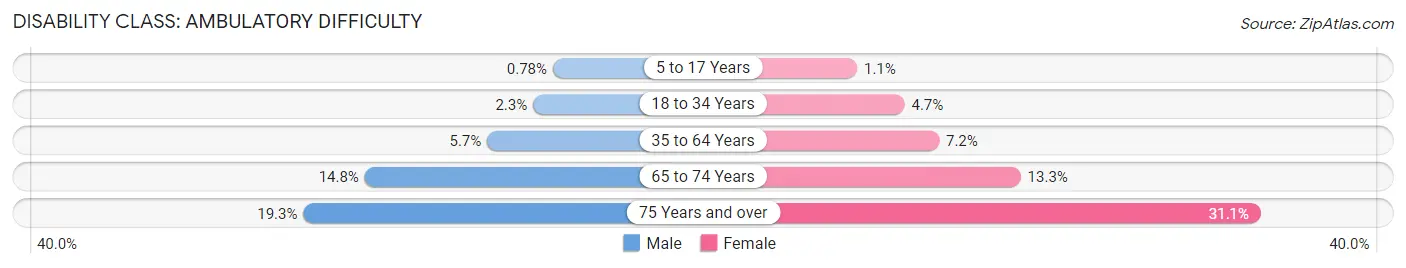
| Age Bracket | Male | Female |
| 5 to 17 Years | 23 (0.8%) | 35 (1.1%) |
| 18 to 34 Years | 85 (2.2%) | 162 (4.7%) |
| 35 to 64 Years | 443 (5.7%) | 525 (7.2%) |
| 65 to 74 Years | 352 (14.7%) | 297 (13.3%) |
| 75 Years and over | 248 (19.3%) | 518 (31.1%) |
Disability Class: Self-Care Difficulty
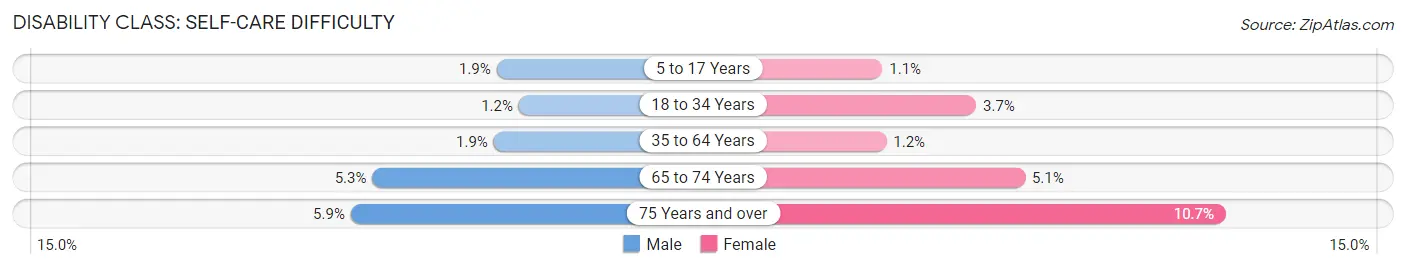
| Age Bracket | Male | Female |
| 5 to 17 Years | 55 (1.9%) | 35 (1.1%) |
| 18 to 34 Years | 47 (1.2%) | 130 (3.7%) |
| 35 to 64 Years | 152 (1.9%) | 90 (1.2%) |
| 65 to 74 Years | 127 (5.3%) | 114 (5.1%) |
| 75 Years and over | 76 (5.9%) | 178 (10.7%) |
Technology Access in Wyoming County
Computing Device Access in Wyoming County
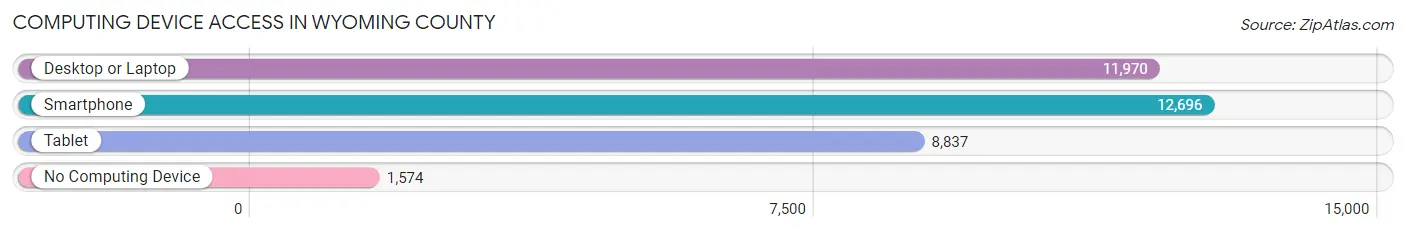
| Device Type | # Households | % Households |
| Desktop or Laptop | 11,970 | 74.1% |
| Smartphone | 12,696 | 78.6% |
| Tablet | 8,837 | 54.7% |
| No Computing Device | 1,574 | 9.7% |
| Total | 16,152 | 100.0% |
Internet Access in Wyoming County
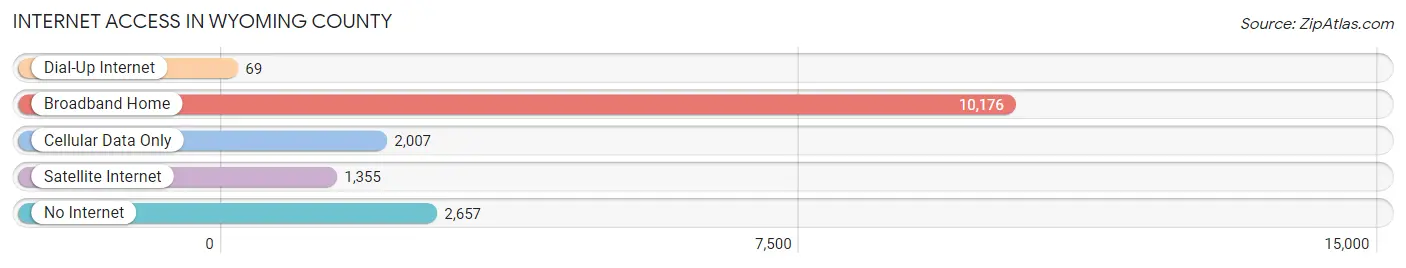
| Internet Type | # Households | % Households |
| Dial-Up Internet | 69 | 0.4% |
| Broadband Home | 10,176 | 63.0% |
| Cellular Data Only | 2,007 | 12.4% |
| Satellite Internet | 1,355 | 8.4% |
| No Internet | 2,657 | 16.5% |
| Total | 16,152 | 100.0% |
Wyoming County Summary
Wyoming County is located in western New York State, and is part of the Genesee Valley region. It is bordered by Livingston County to the north, Genesee County to the east, Cattaraugus County to the south, and Erie County to the west. The county seat is Warsaw, and the largest city is Perry.
History
Wyoming County was formed in 1841 from Genesee County. It was named after the Wyoming Valley in Pennsylvania, which was named after the Munsee word for "large plains". The area was originally inhabited by the Seneca Nation of the Iroquois Confederacy. The first European settlers arrived in the late 1700s, and the county was officially established in 1841.
The county was an important part of the Underground Railroad, with many Quaker families providing shelter and assistance to escaped slaves. During the Civil War, the county was home to several regiments of the Union Army.
Geography
Wyoming County is located in the western part of New York State, and is part of the Genesee Valley region. It is bordered by Livingston County to the north, Genesee County to the east, Cattaraugus County to the south, and Erie County to the west. The county has a total area of 517 square miles, of which 514 square miles is land and 3 square miles is water.
The terrain of Wyoming County is mostly rolling hills, with some flat areas in the valleys. The highest point in the county is 2,092 feet above sea level, located in the town of Arcade. The county is drained by several creeks, including the Genesee River, which flows through the county from north to south.
Economy
Wyoming County has a diverse economy, with a mix of agriculture, manufacturing, and tourism. Agriculture is the largest sector of the economy, with dairy farming being the most important. Other agricultural products include corn, hay, wheat, and apples.
Manufacturing is also an important part of the economy, with several companies located in the county. These include a paper mill, a plastics manufacturer, and a metal fabrication plant.
Tourism is also an important part of the economy, with several attractions in the county. These include Letchworth State Park, which is known as the "Grand Canyon of the East", and the Wyoming County Fair, which is held annually in August.
Demographics
As of the 2010 census, Wyoming County had a population of 42,155. The population density was 82.2 people per square mile. The racial makeup of the county was 97.2% White, 0.7% African American, 0.3% Native American, 0.3% Asian, 0.1% Pacific Islander, 0.4% from other races, and 0.9% from two or more races. Hispanic or Latino of any race were 1.7% of the population.
The median income for a household in the county was $45,945, and the median income for a family was $54,945. The per capita income for the county was $22,845. About 8.7% of families and 11.7% of the population were below the poverty line, including 15.2% of those under age 18 and 8.2% of those age 65 or over.
Common Questions
What is Per Capita Income in Wyoming County?
Per Capita income in Wyoming County is $35,228.
What is the Median Family Income in Wyoming County?
Median Family Income in Wyoming County is $81,633.
What is the Median Household income in Wyoming County?
Median Household Income in Wyoming County is $65,066.
What is Income or Wage Gap in Wyoming County?
Income or Wage Gap in Wyoming County is 32.4%.
Women in Wyoming County earn 67.6 cents for every dollar earned by a man.
What is Family Income Deficit in Wyoming County?
Family Income Deficit in Wyoming County is $10,555.
Families that are below poverty line in Wyoming County earn $10,555 less on average than the poverty threshold level.
What is Inequality or Gini Index in Wyoming County?
Inequality or Gini Index in Wyoming County is 0.41.
What is the Total Population of Wyoming County?
Total Population of Wyoming County is 40,338.
What is the Total Male Population of Wyoming County?
Total Male Population of Wyoming County is 21,526.
What is the Total Female Population of Wyoming County?
Total Female Population of Wyoming County is 18,812.
What is the Ratio of Males per 100 Females in Wyoming County?
There are 114.43 Males per 100 Females in Wyoming County.
What is the Ratio of Females per 100 Males in Wyoming County?
There are 87.39 Females per 100 Males in Wyoming County.
What is the Median Population Age in Wyoming County?
Median Population Age in Wyoming County is 42.9 Years.
What is the Average Family Size in Wyoming County
Average Family Size in Wyoming County is 2.8 People.
What is the Average Household Size in Wyoming County
Average Household Size in Wyoming County is 2.3 People.
How Large is the Labor Force in Wyoming County?
There are 18,911 People in the Labor Forcein in Wyoming County.
What is the Percentage of People in the Labor Force in Wyoming County?
56.8% of People are in the Labor Force in Wyoming County.
What is the Unemployment Rate in Wyoming County?
Unemployment Rate in Wyoming County is 4.1%.