Rockland County, NY Map & Demographics
Rockland County Map
Rockland County Overview
$44,212
PER CAPITA INCOME
$125,645
AVG FAMILY INCOME
$106,173
AVG HOUSEHOLD INCOME
30.3%
WAGE / INCOME GAP [ % ]
69.7¢/ $1
WAGE / INCOME GAP [ $ ]
$14,315
FAMILY INCOME DEFICIT
0.47
INEQUALITY / GINI INDEX
337,326
TOTAL POPULATION
166,981
MALE POPULATION
170,345
FEMALE POPULATION
98.03
MALES / 100 FEMALES
102.01
FEMALES / 100 MALES
35.3
MEDIAN AGE
3.8
AVG FAMILY SIZE
3.2
AVG HOUSEHOLD SIZE
158,417
LABOR FORCE [ PEOPLE ]
63.2%
PERCENT IN LABOR FORCE
6.2%
UNEMPLOYMENT RATE
Income in Rockland County
Income Overview in Rockland County
Per Capita Income in Rockland County is $44,212, while median incomes of families and households are $125,645 and $106,173 respectively.
| Characteristic | Number | Measure |
| Per Capita Income | 337,326 | $44,212 |
| Median Family Income | 77,708 | $125,645 |
| Mean Family Income | 77,708 | $160,506 |
| Median Household Income | 102,579 | $106,173 |
| Mean Household Income | 102,579 | $142,392 |
| Income Deficit | 77,708 | $14,315 |
| Wage / Income Gap (%) | 337,326 | 30.30% |
| Wage / Income Gap ($) | 337,326 | 69.70¢ per $1 |
| Gini / Inequality Index | 337,326 | 0.47 |
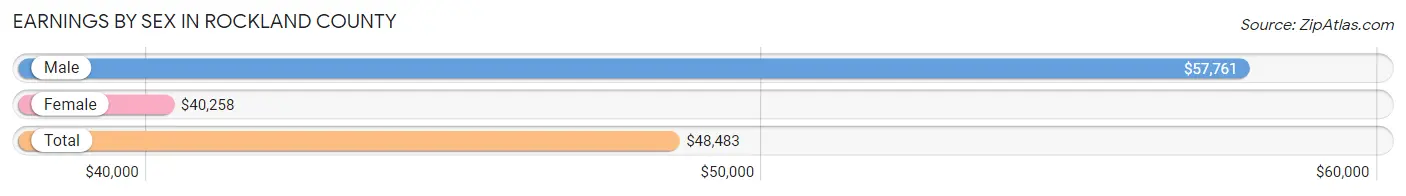
Earnings by Sex in Rockland County
Average Earnings in Rockland County are $48,483, $57,761 for men and $40,258 for women, a difference of 30.3%.
| Sex | Number | Average Earnings |
| Male | 85,179 (52.1%) | $57,761 |
| Female | 78,233 (47.9%) | $40,258 |
| Total | 163,412 (100.0%) | $48,483 |
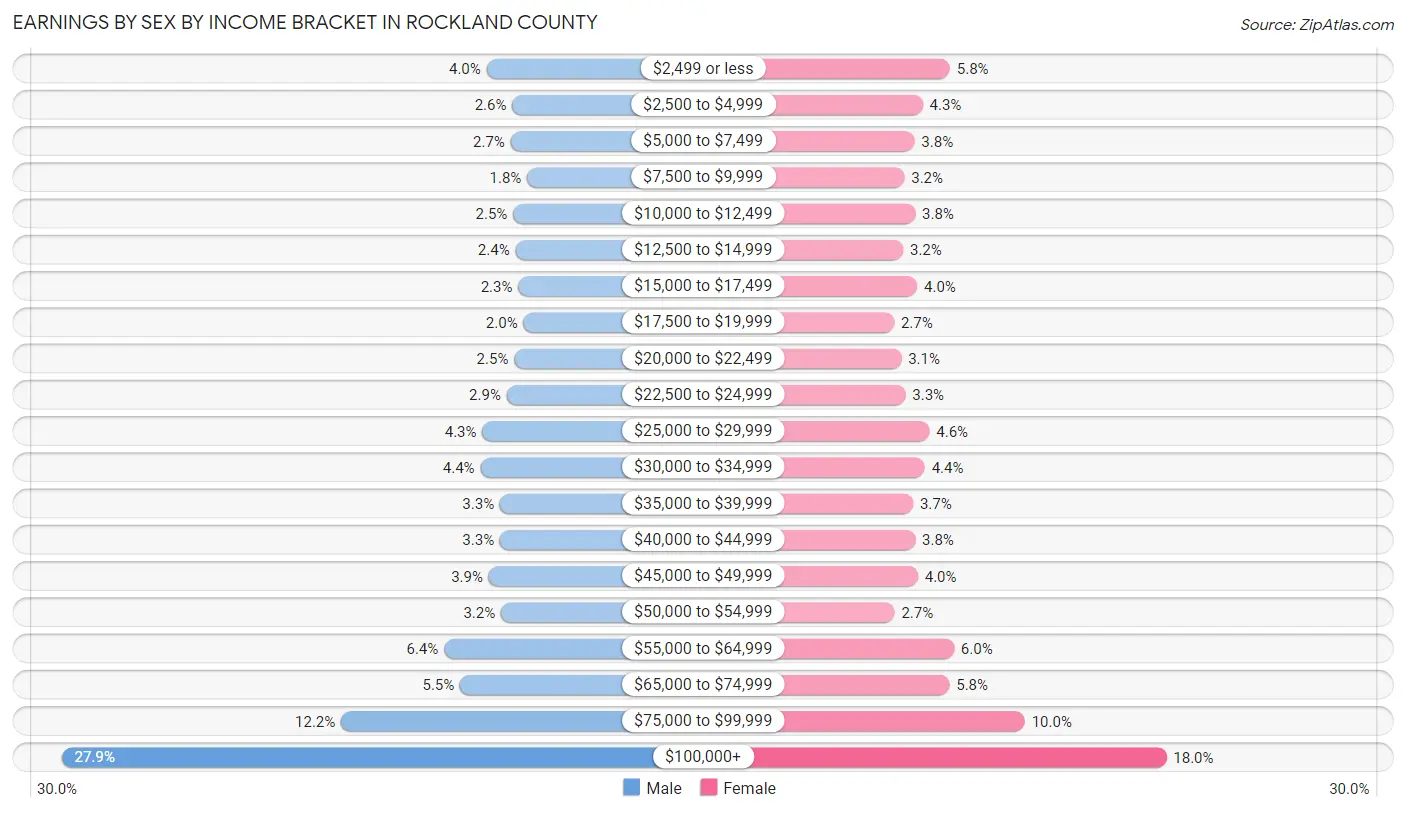
Earnings by Sex by Income Bracket in Rockland County
The most common earnings brackets in Rockland County are $100,000+ for men (23,783 | 27.9%) and $100,000+ for women (14,049 | 18.0%).
| Income | Male | Female |
| $2,499 or less | 3,436 (4.0%) | 4,526 (5.8%) |
| $2,500 to $4,999 | 2,209 (2.6%) | 3,330 (4.3%) |
| $5,000 to $7,499 | 2,286 (2.7%) | 2,972 (3.8%) |
| $7,500 to $9,999 | 1,487 (1.8%) | 2,527 (3.2%) |
| $10,000 to $12,499 | 2,160 (2.5%) | 3,004 (3.8%) |
| $12,500 to $14,999 | 2,054 (2.4%) | 2,471 (3.2%) |
| $15,000 to $17,499 | 1,920 (2.2%) | 3,091 (4.0%) |
| $17,500 to $19,999 | 1,669 (2.0%) | 2,073 (2.6%) |
| $20,000 to $22,499 | 2,115 (2.5%) | 2,391 (3.1%) |
| $22,500 to $24,999 | 2,467 (2.9%) | 2,573 (3.3%) |
| $25,000 to $29,999 | 3,633 (4.3%) | 3,630 (4.6%) |
| $30,000 to $34,999 | 3,729 (4.4%) | 3,425 (4.4%) |
| $35,000 to $39,999 | 2,793 (3.3%) | 2,911 (3.7%) |
| $40,000 to $44,999 | 2,794 (3.3%) | 3,008 (3.8%) |
| $45,000 to $49,999 | 3,329 (3.9%) | 3,121 (4.0%) |
| $50,000 to $54,999 | 2,741 (3.2%) | 2,093 (2.7%) |
| $55,000 to $64,999 | 5,470 (6.4%) | 4,708 (6.0%) |
| $65,000 to $74,999 | 4,703 (5.5%) | 4,506 (5.8%) |
| $75,000 to $99,999 | 10,401 (12.2%) | 7,824 (10.0%) |
| $100,000+ | 23,783 (27.9%) | 14,049 (18.0%) |
| Total | 85,179 (100.0%) | 78,233 (100.0%) |
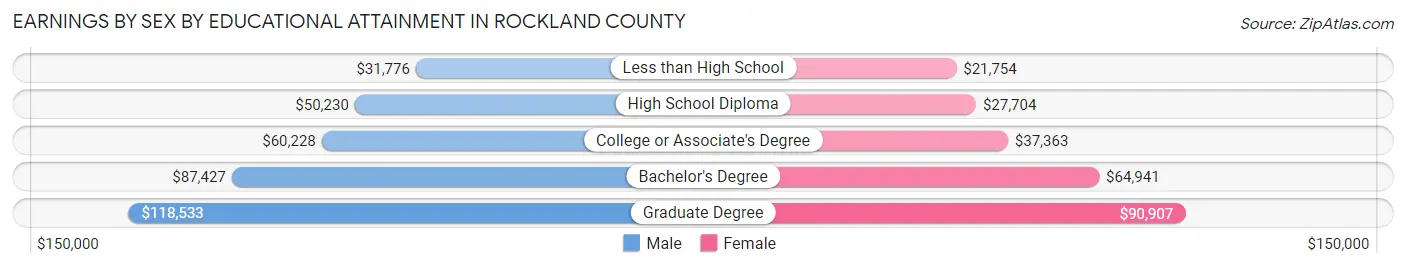
Earnings by Sex by Educational Attainment in Rockland County
Average earnings in Rockland County are $67,853 for men and $49,167 for women, a difference of 27.5%. Men with an educational attainment of graduate degree enjoy the highest average annual earnings of $118,533, while those with less than high school education earn the least with $31,776. Women with an educational attainment of graduate degree earn the most with the average annual earnings of $90,907, while those with less than high school education have the smallest earnings of $21,754.
| Educational Attainment | Male Income | Female Income |
| Less than High School | $31,776 | $21,754 |
| High School Diploma | $50,230 | $27,704 |
| College or Associate's Degree | $60,228 | $37,363 |
| Bachelor's Degree | $87,427 | $64,941 |
| Graduate Degree | $118,533 | $90,907 |
| Total | $67,853 | $49,167 |
Family Income in Rockland County
Family Income Brackets in Rockland County
According to the Rockland County family income data, there are 21,214 families falling into the $200,000+ income range, which is the most common income bracket and makes up 27.3% of all families. Conversely, the $10,000 to $14,999 income bracket is the least frequent group with only 1,166 families (1.5%) belonging to this category.
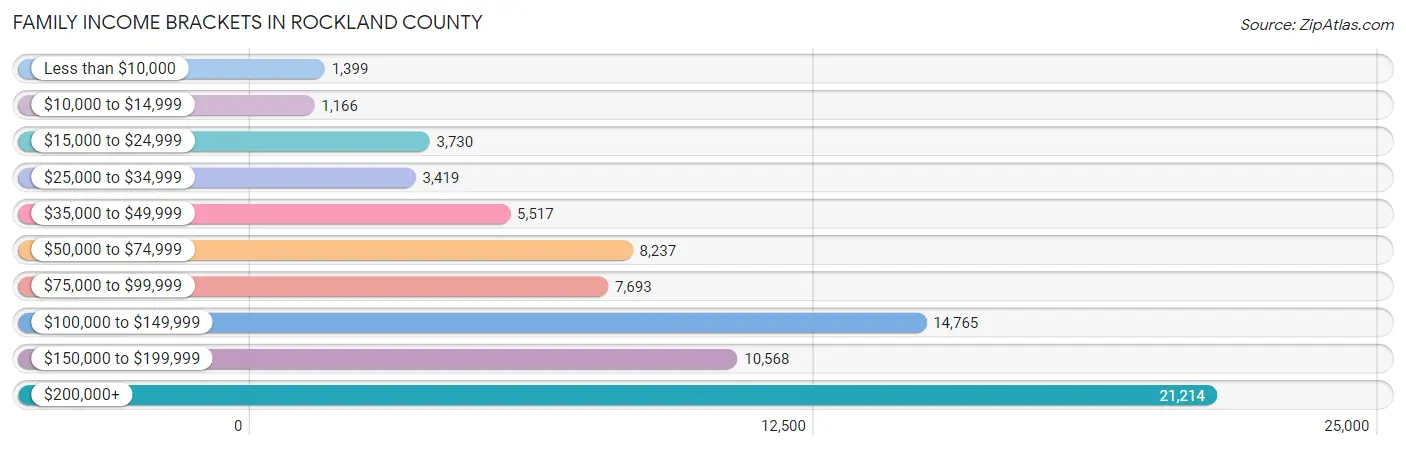
| Income Bracket | # Families | % Families |
| Less than $10,000 | 1,399 | 1.8% |
| $10,000 to $14,999 | 1,166 | 1.5% |
| $15,000 to $24,999 | 3,730 | 4.8% |
| $25,000 to $34,999 | 3,419 | 4.4% |
| $35,000 to $49,999 | 5,517 | 7.1% |
| $50,000 to $74,999 | 8,237 | 10.6% |
| $75,000 to $99,999 | 7,693 | 9.9% |
| $100,000 to $149,999 | 14,765 | 19.0% |
| $150,000 to $199,999 | 10,568 | 13.6% |
| $200,000+ | 21,214 | 27.3% |
Family Income by Famaliy Size in Rockland County
4-person families (16,960 | 21.8%) account for the highest median family income in Rockland County with $154,399 per family, while 2-person families (25,875 | 33.3%) have the highest median income of $58,930 per family member.
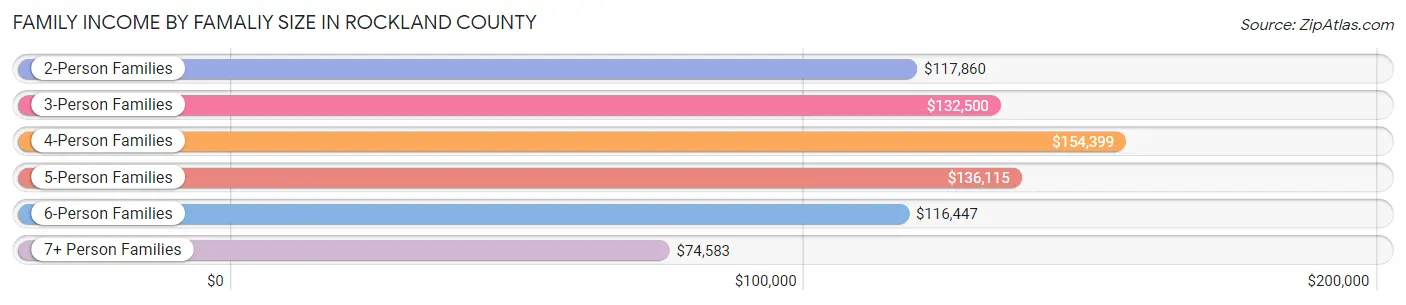
| Income Bracket | # Families | Median Income |
| 2-Person Families | 25,875 (33.3%) | $117,860 |
| 3-Person Families | 15,566 (20.0%) | $132,500 |
| 4-Person Families | 16,960 (21.8%) | $154,399 |
| 5-Person Families | 8,596 (11.1%) | $136,115 |
| 6-Person Families | 4,410 (5.7%) | $116,447 |
| 7+ Person Families | 6,301 (8.1%) | $74,583 |
| Total | 77,708 (100.0%) | $125,645 |
Family Income by Number of Earners in Rockland County
The median family income in Rockland County is $125,645, with families comprising 3+ earners (13,807) having the highest median family income of $183,821, while families with no earners (8,492) have the lowest median family income of $68,604, accounting for 17.8% and 10.9% of families, respectively.
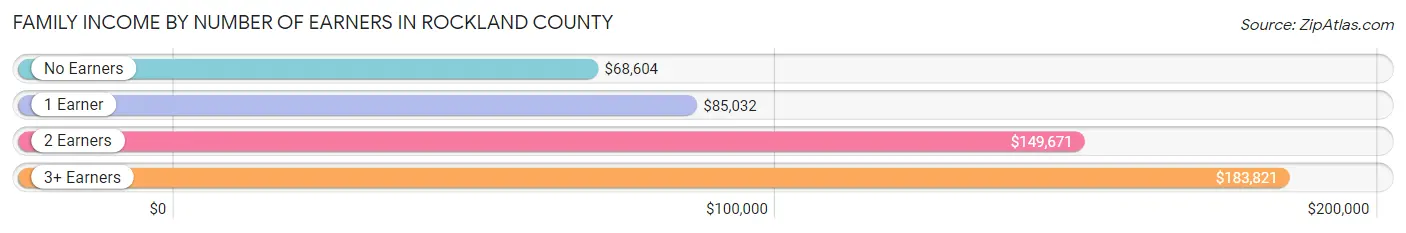
| Number of Earners | # Families | Median Income |
| No Earners | 8,492 (10.9%) | $68,604 |
| 1 Earner | 22,443 (28.9%) | $85,032 |
| 2 Earners | 32,966 (42.4%) | $149,671 |
| 3+ Earners | 13,807 (17.8%) | $183,821 |
| Total | 77,708 (100.0%) | $125,645 |
Household Income in Rockland County
Household Income Brackets in Rockland County
With 23,491 households falling in the category, the $200,000+ income range is the most frequent in Rockland County, accounting for 22.9% of all households. In contrast, only 2,462 households (2.4%) fall into the $10,000 to $14,999 income bracket, making it the least populous group.
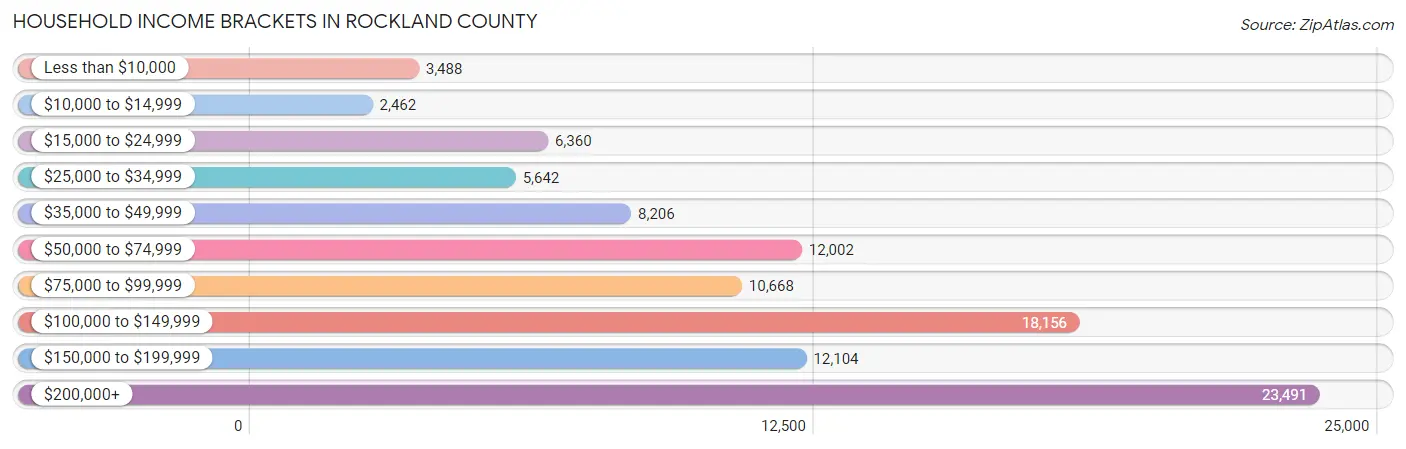
| Income Bracket | # Households | % Households |
| Less than $10,000 | 3,488 | 3.4% |
| $10,000 to $14,999 | 2,462 | 2.4% |
| $15,000 to $24,999 | 6,360 | 6.2% |
| $25,000 to $34,999 | 5,642 | 5.5% |
| $35,000 to $49,999 | 8,206 | 8.0% |
| $50,000 to $74,999 | 12,002 | 11.7% |
| $75,000 to $99,999 | 10,668 | 10.4% |
| $100,000 to $149,999 | 18,156 | 17.7% |
| $150,000 to $199,999 | 12,104 | 11.8% |
| $200,000+ | 23,491 | 22.9% |
Household Income by Householder Age in Rockland County
The median household income in Rockland County is $106,173, with the highest median household income of $136,760 found in the 45 to 64 years age bracket for the primary householder. A total of 41,377 households (40.3%) fall into this category. Meanwhile, the 15 to 24 years age bracket for the primary householder has the lowest median household income of $23,619, with 2,013 households (2.0%) in this group.
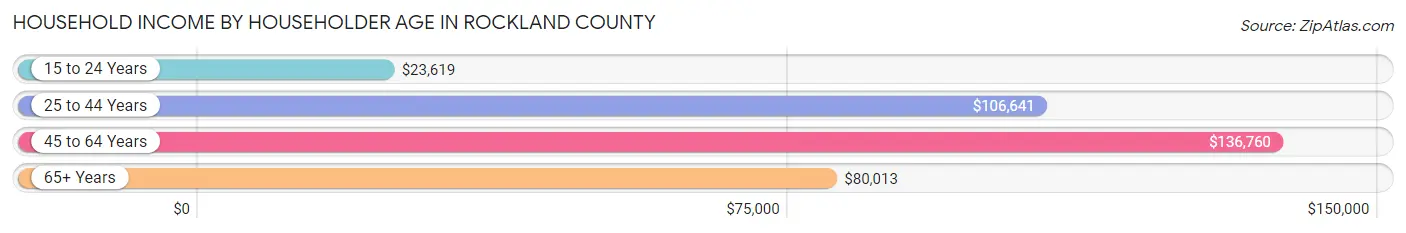
| Income Bracket | # Households | Median Income |
| 15 to 24 Years | 2,013 (2.0%) | $23,619 |
| 25 to 44 Years | 27,936 (27.2%) | $106,641 |
| 45 to 64 Years | 41,377 (40.3%) | $136,760 |
| 65+ Years | 31,253 (30.5%) | $80,013 |
| Total | 102,579 (100.0%) | $106,173 |
Poverty in Rockland County
Income Below Poverty by Sex and Age in Rockland County
With 15.4% poverty level for males and 14.8% for females among the residents of Rockland County, under 5 year old males and 5 year old females are the most vulnerable to poverty, with 4,628 males (33.1%) and 751 females (31.7%) in their respective age groups living below the poverty level.
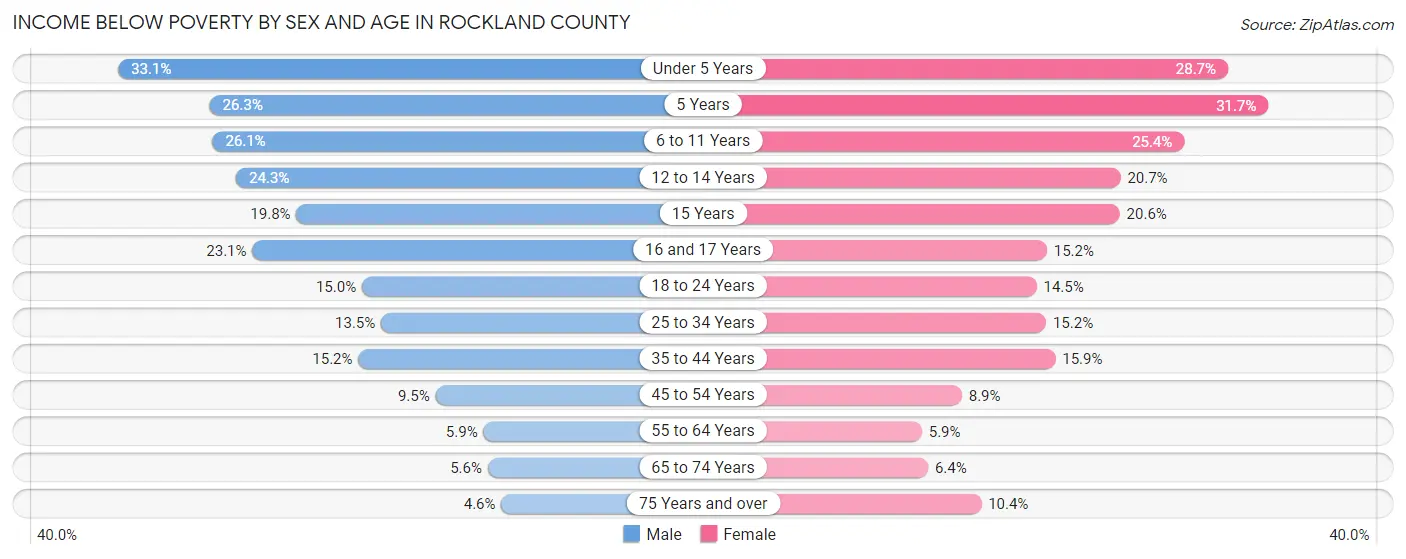
| Age Bracket | Male | Female |
| Under 5 Years | 4,628 (33.1%) | 3,889 (28.7%) |
| 5 Years | 669 (26.3%) | 751 (31.7%) |
| 6 to 11 Years | 4,125 (26.1%) | 4,022 (25.4%) |
| 12 to 14 Years | 2,070 (24.3%) | 1,513 (20.7%) |
| 15 Years | 539 (19.8%) | 613 (20.6%) |
| 16 and 17 Years | 1,289 (23.1%) | 745 (15.2%) |
| 18 to 24 Years | 2,300 (14.9%) | 2,079 (14.5%) |
| 25 to 34 Years | 2,664 (13.5%) | 2,855 (15.2%) |
| 35 to 44 Years | 2,909 (15.2%) | 2,965 (15.9%) |
| 45 to 54 Years | 1,836 (9.5%) | 1,741 (8.9%) |
| 55 to 64 Years | 1,162 (5.9%) | 1,214 (5.9%) |
| 65 to 74 Years | 740 (5.6%) | 972 (6.4%) |
| 75 Years and over | 424 (4.6%) | 1,467 (10.3%) |
| Total | 25,355 (15.4%) | 24,826 (14.8%) |
Income Above Poverty by Sex and Age in Rockland County
According to the poverty statistics in Rockland County, males aged 75 years and over and females aged 55 to 64 years are the age groups that are most secure financially, with 95.4% of males and 94.1% of females in these age groups living above the poverty line.
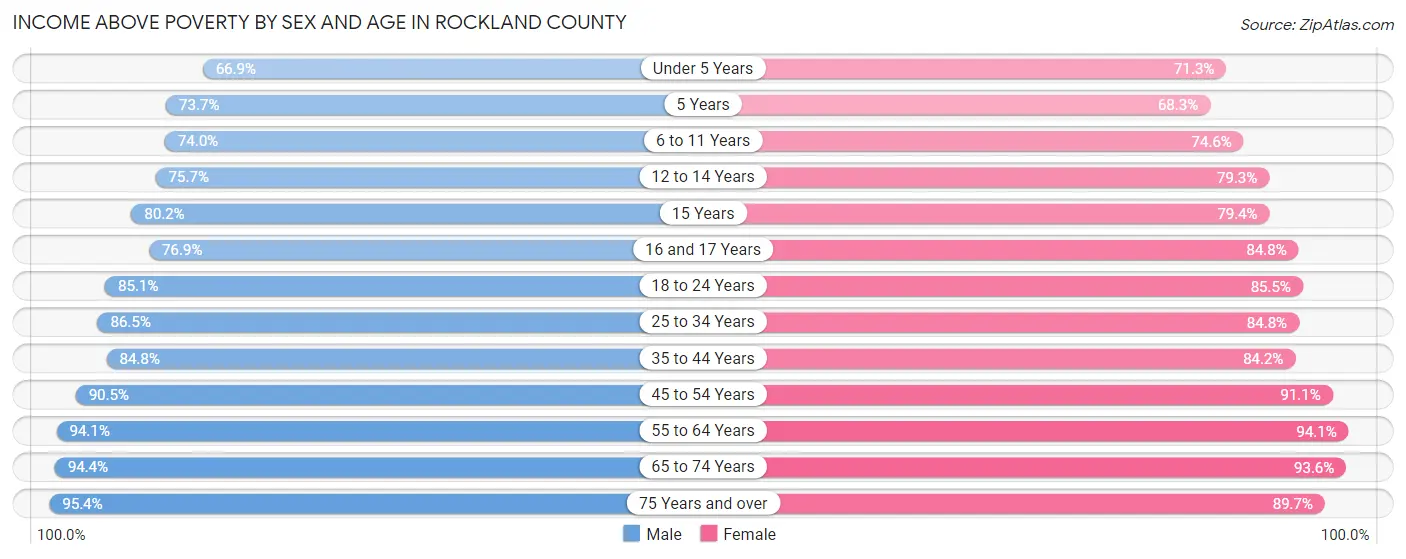
| Age Bracket | Male | Female |
| Under 5 Years | 9,369 (66.9%) | 9,681 (71.3%) |
| 5 Years | 1,878 (73.7%) | 1,621 (68.3%) |
| 6 to 11 Years | 11,707 (74.0%) | 11,802 (74.6%) |
| 12 to 14 Years | 6,450 (75.7%) | 5,801 (79.3%) |
| 15 Years | 2,181 (80.2%) | 2,359 (79.4%) |
| 16 and 17 Years | 4,293 (76.9%) | 4,150 (84.8%) |
| 18 to 24 Years | 13,088 (85.1%) | 12,301 (85.5%) |
| 25 to 34 Years | 17,027 (86.5%) | 15,974 (84.8%) |
| 35 to 44 Years | 16,208 (84.8%) | 15,747 (84.2%) |
| 45 to 54 Years | 17,512 (90.5%) | 17,806 (91.1%) |
| 55 to 64 Years | 18,438 (94.1%) | 19,235 (94.1%) |
| 65 to 74 Years | 12,446 (94.4%) | 14,214 (93.6%) |
| 75 Years and over | 8,784 (95.4%) | 12,711 (89.6%) |
| Total | 139,381 (84.6%) | 143,402 (85.2%) |
Income Below Poverty Among Married-Couple Families in Rockland County
The poverty statistics for married-couple families in Rockland County show that 9.8% or 6,127 of the total 62,258 families live below the poverty line. Families with 5 or more children have the highest poverty rate of 46.1%, comprising of 2,177 families. On the other hand, families with no children have the lowest poverty rate of 2.9%, which includes 882 families.
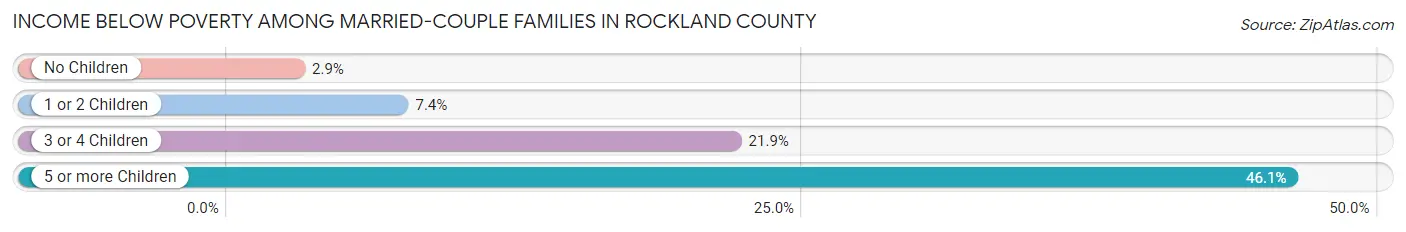
| Children | Above Poverty | Below Poverty |
| No Children | 29,374 (97.1%) | 882 (2.9%) |
| 1 or 2 Children | 18,594 (92.6%) | 1,490 (7.4%) |
| 3 or 4 Children | 5,622 (78.1%) | 1,578 (21.9%) |
| 5 or more Children | 2,541 (53.9%) | 2,177 (46.1%) |
| Total | 56,131 (90.2%) | 6,127 (9.8%) |
Income Below Poverty Among Single-Parent Households in Rockland County
According to the poverty data in Rockland County, 11.1% or 442 single-father households and 12.4% or 1,421 single-mother households are living below the poverty line. Among single-father households, those with 5 or more children have the highest poverty rate, with 10 households (100.0%) experiencing poverty. Likewise, among single-mother households, those with 5 or more children have the highest poverty rate, with 36 households (52.9%) falling below the poverty line.
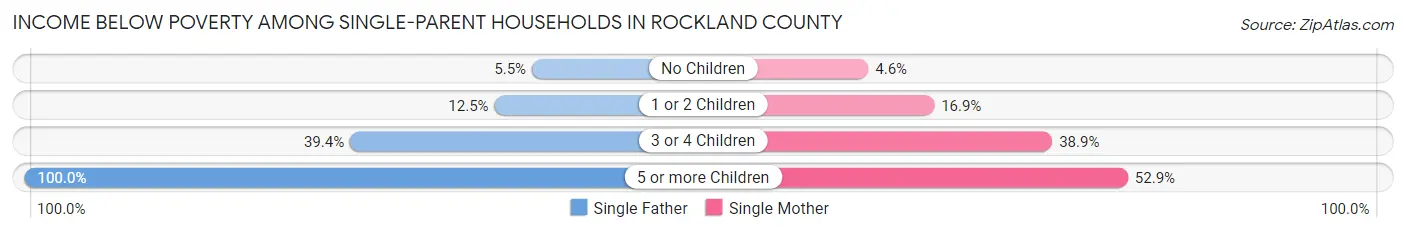
| Children | Single Father | Single Mother |
| No Children | 120 (5.5%) | 265 (4.6%) |
| 1 or 2 Children | 182 (12.5%) | 824 (16.9%) |
| 3 or 4 Children | 130 (39.4%) | 296 (38.9%) |
| 5 or more Children | 10 (100.0%) | 36 (52.9%) |
| Total | 442 (11.1%) | 1,421 (12.4%) |
Income Below Poverty Among Married-Couple vs Single-Parent Households in Rockland County
The poverty data for Rockland County shows that 6,127 of the married-couple family households (9.8%) and 1,863 of the single-parent households (12.1%) are living below the poverty level. Within the married-couple family households, those with 5 or more children have the highest poverty rate, with 2,177 households (46.1%) falling below the poverty line. Among the single-parent households, those with 5 or more children have the highest poverty rate, with 46 household (59.0%) living below poverty.
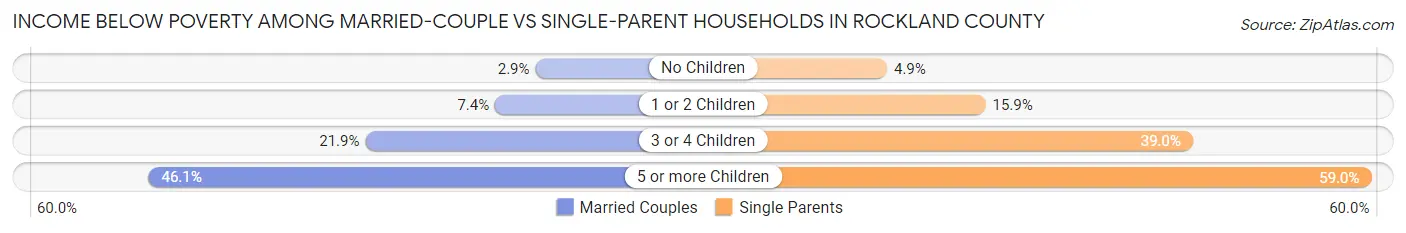
| Children | Married-Couple Families | Single-Parent Households |
| No Children | 882 (2.9%) | 385 (4.9%) |
| 1 or 2 Children | 1,490 (7.4%) | 1,006 (15.9%) |
| 3 or 4 Children | 1,578 (21.9%) | 426 (39.0%) |
| 5 or more Children | 2,177 (46.1%) | 46 (59.0%) |
| Total | 6,127 (9.8%) | 1,863 (12.1%) |
Race in Rockland County
The most populous races in Rockland County are White / Caucasian (225,889 | 67.0%), Hispanic or Latino (62,908 | 18.6%), and Black / African American (38,683 | 11.5%).
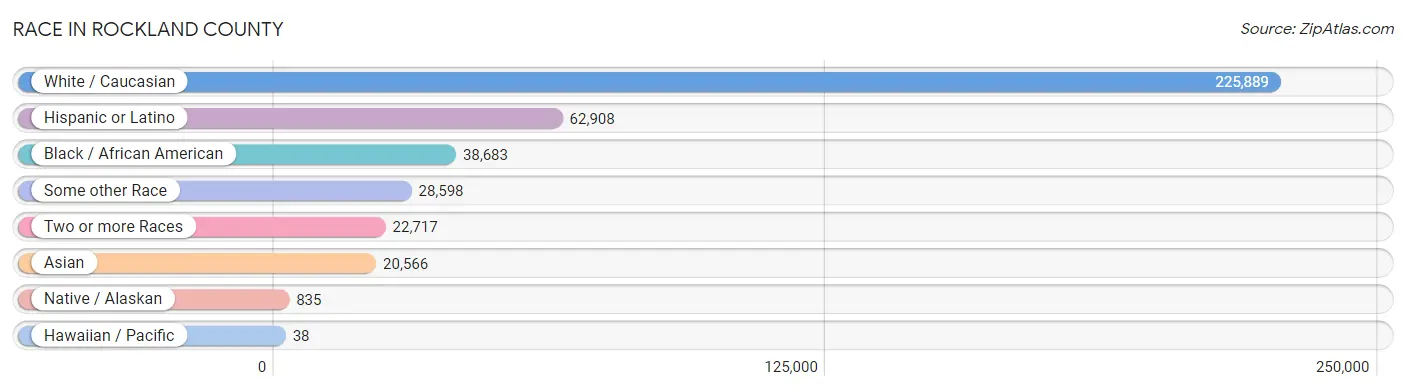
| Race | # Population | % Population |
| Asian | 20,566 | 6.1% |
| Black / African American | 38,683 | 11.5% |
| Hawaiian / Pacific | 38 | 0.0% |
| Hispanic or Latino | 62,908 | 18.6% |
| Native / Alaskan | 835 | 0.3% |
| White / Caucasian | 225,889 | 67.0% |
| Two or more Races | 22,717 | 6.7% |
| Some other Race | 28,598 | 8.5% |
| Total | 337,326 | 100.0% |
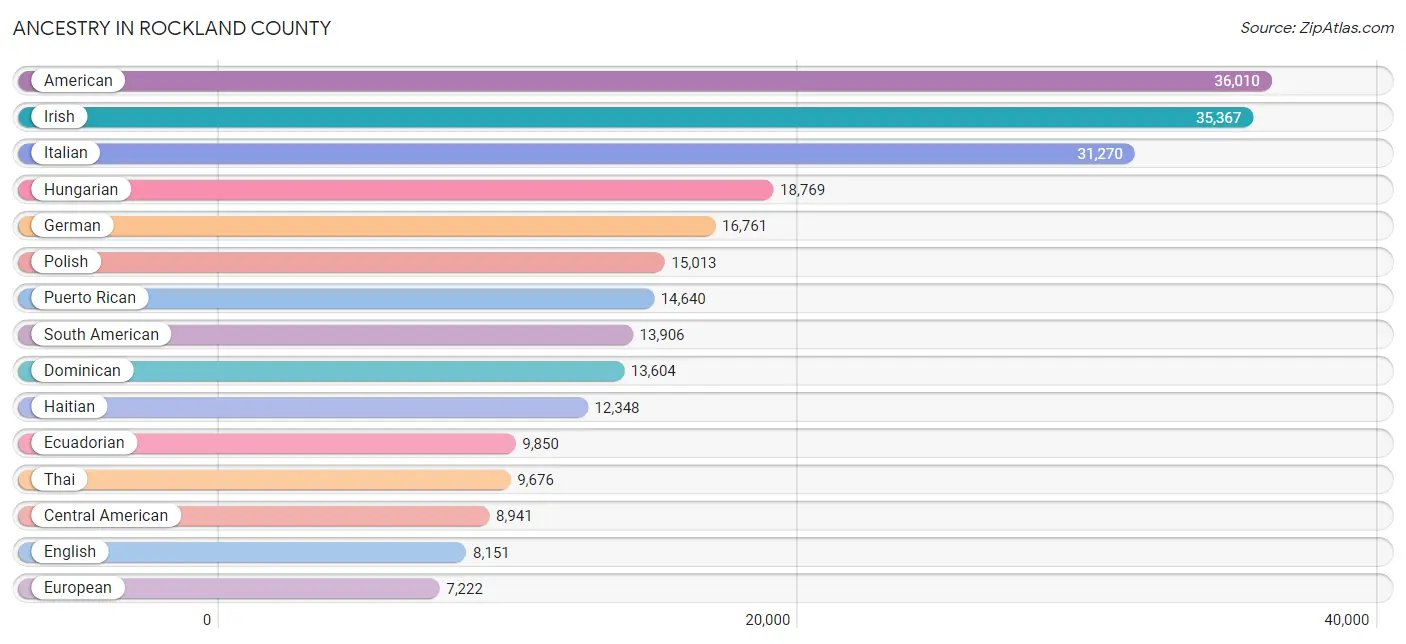
Ancestry in Rockland County
The most populous ancestries reported in Rockland County are American (36,010 | 10.7%), Irish (35,367 | 10.5%), Italian (31,270 | 9.3%), Hungarian (18,769 | 5.6%), and German (16,761 | 5.0%), together accounting for 41.0% of all Rockland County residents.
| Ancestry | # Population | % Population |
| Afghan | 168 | 0.1% |
| African | 1,282 | 0.4% |
| Albanian | 823 | 0.2% |
| Alsatian | 40 | 0.0% |
| American | 36,010 | 10.7% |
| Apache | 97 | 0.0% |
| Arab | 2,221 | 0.7% |
| Argentinean | 455 | 0.1% |
| Armenian | 521 | 0.2% |
| Australian | 84 | 0.0% |
| Austrian | 1,789 | 0.5% |
| Bahamian | 82 | 0.0% |
| Barbadian | 42 | 0.0% |
| Basque | 120 | 0.0% |
| Belgian | 269 | 0.1% |
| Belizean | 36 | 0.0% |
| Bhutanese | 366 | 0.1% |
| Blackfeet | 63 | 0.0% |
| Bolivian | 51 | 0.0% |
| Brazilian | 354 | 0.1% |
| British | 592 | 0.2% |
| British West Indian | 147 | 0.0% |
| Bulgarian | 107 | 0.0% |
| Burmese | 2,191 | 0.6% |
| Canadian | 897 | 0.3% |
| Cape Verdean | 11 | 0.0% |
| Carpatho Rusyn | 4 | 0.0% |
| Celtic | 16 | 0.0% |
| Central American | 8,941 | 2.6% |
| Central American Indian | 632 | 0.2% |
| Cherokee | 418 | 0.1% |
| Chilean | 81 | 0.0% |
| Colombian | 1,822 | 0.5% |
| Comanche | 8 | 0.0% |
| Costa Rican | 194 | 0.1% |
| Croatian | 264 | 0.1% |
| Cuban | 894 | 0.3% |
| Cypriot | 41 | 0.0% |
| Czech | 1,233 | 0.4% |
| Czechoslovakian | 580 | 0.2% |
| Danish | 365 | 0.1% |
| Delaware | 108 | 0.0% |
| Dominican | 13,604 | 4.0% |
| Dutch | 1,939 | 0.6% |
| Dutch West Indian | 47 | 0.0% |
| Eastern European | 3,860 | 1.1% |
| Ecuadorian | 9,850 | 2.9% |
| Egyptian | 171 | 0.1% |
| English | 8,151 | 2.4% |
| Estonian | 161 | 0.1% |
| Ethiopian | 9 | 0.0% |
| European | 7,222 | 2.1% |
| Filipino | 47 | 0.0% |
| Finnish | 160 | 0.1% |
| French | 2,407 | 0.7% |
| French Canadian | 657 | 0.2% |
| German | 16,761 | 5.0% |
| Ghanaian | 1,113 | 0.3% |
| Greek | 1,871 | 0.5% |
| Guatemalan | 5,318 | 1.6% |
| Guyanese | 196 | 0.1% |
| Haitian | 12,348 | 3.7% |
| Honduran | 386 | 0.1% |
| Hungarian | 18,769 | 5.6% |
| Icelander | 23 | 0.0% |
| Indian (Asian) | 3,327 | 1.0% |
| Indonesian | 32 | 0.0% |
| Iranian | 144 | 0.0% |
| Iraqi | 111 | 0.0% |
| Irish | 35,367 | 10.5% |
| Iroquois | 98 | 0.0% |
| Israeli | 2,905 | 0.9% |
| Italian | 31,270 | 9.3% |
| Jamaican | 2,552 | 0.8% |
| Japanese | 189 | 0.1% |
| Jordanian | 44 | 0.0% |
| Kenyan | 36 | 0.0% |
| Korean | 5,184 | 1.5% |
| Latvian | 201 | 0.1% |
| Lebanese | 393 | 0.1% |
| Lithuanian | 1,018 | 0.3% |
| Macedonian | 1 | 0.0% |
| Malaysian | 76 | 0.0% |
| Maltese | 18 | 0.0% |
| Mexican | 4,532 | 1.3% |
| Mexican American Indian | 214 | 0.1% |
| Moroccan | 571 | 0.2% |
| Native Hawaiian | 98 | 0.0% |
| Nicaraguan | 135 | 0.0% |
| Nigerian | 704 | 0.2% |
| Northern European | 255 | 0.1% |
| Norwegian | 825 | 0.2% |
| Pakistani | 68 | 0.0% |
| Palestinian | 297 | 0.1% |
| Panamanian | 299 | 0.1% |
| Paraguayan | 15 | 0.0% |
| Pennsylvania German | 18 | 0.0% |
| Peruvian | 994 | 0.3% |
| Polish | 15,013 | 4.4% |
| Portuguese | 760 | 0.2% |
| Puerto Rican | 14,640 | 4.3% |
| Romanian | 3,782 | 1.1% |
| Russian | 6,929 | 2.1% |
| Salvadoran | 2,609 | 0.8% |
| Samoan | 8 | 0.0% |
| Scandinavian | 310 | 0.1% |
| Scotch-Irish | 687 | 0.2% |
| Scottish | 1,503 | 0.4% |
| Seminole | 37 | 0.0% |
| Senegalese | 32 | 0.0% |
| Serbian | 29 | 0.0% |
| Sierra Leonean | 31 | 0.0% |
| Sioux | 97 | 0.0% |
| Slavic | 42 | 0.0% |
| Slovak | 676 | 0.2% |
| Slovene | 110 | 0.0% |
| South African | 59 | 0.0% |
| South American | 13,906 | 4.1% |
| South American Indian | 244 | 0.1% |
| Spaniard | 1,361 | 0.4% |
| Spanish | 565 | 0.2% |
| Spanish American | 6 | 0.0% |
| Sri Lankan | 389 | 0.1% |
| Subsaharan African | 3,561 | 1.1% |
| Swedish | 798 | 0.2% |
| Swiss | 929 | 0.3% |
| Syrian | 184 | 0.1% |
| Thai | 9,676 | 2.9% |
| Tongan | 9 | 0.0% |
| Trinidadian and Tobagonian | 366 | 0.1% |
| Turkish | 251 | 0.1% |
| U.S. Virgin Islander | 30 | 0.0% |
| Ugandan | 30 | 0.0% |
| Ukrainian | 2,257 | 0.7% |
| Uruguayan | 32 | 0.0% |
| Venezuelan | 558 | 0.2% |
| Vietnamese | 276 | 0.1% |
| Welsh | 391 | 0.1% |
| West Indian | 709 | 0.2% |
| Yugoslavian | 55 | 0.0% | View All 140 Rows |
Immigrants in Rockland County
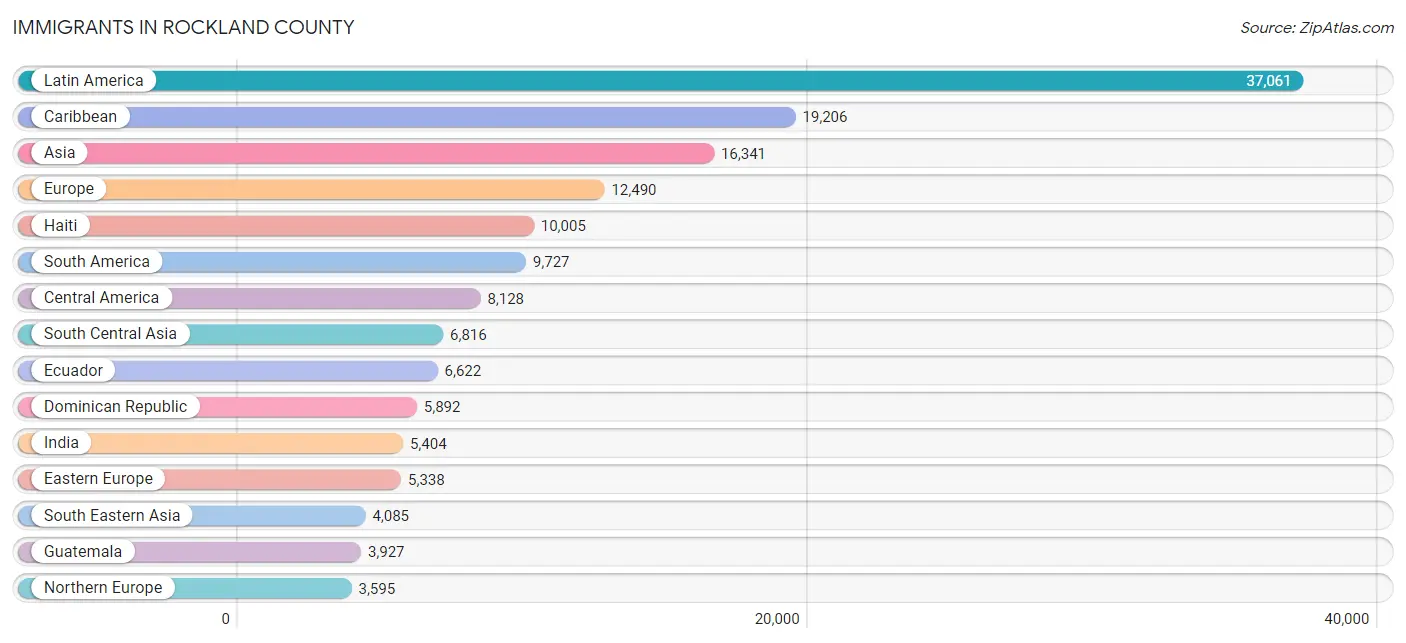
The most numerous immigrant groups reported in Rockland County came from Latin America (37,061 | 11.0%), Caribbean (19,206 | 5.7%), Asia (16,341 | 4.8%), Europe (12,490 | 3.7%), and Haiti (10,005 | 3.0%), together accounting for 28.2% of all Rockland County residents.
| Immigration Origin | # Population | % Population |
| Afghanistan | 121 | 0.0% |
| Africa | 2,529 | 0.7% |
| Albania | 379 | 0.1% |
| Argentina | 243 | 0.1% |
| Armenia | 9 | 0.0% |
| Asia | 16,341 | 4.8% |
| Australia | 141 | 0.0% |
| Austria | 132 | 0.0% |
| Bahamas | 34 | 0.0% |
| Bangladesh | 221 | 0.1% |
| Barbados | 47 | 0.0% |
| Belarus | 70 | 0.0% |
| Belgium | 237 | 0.1% |
| Belize | 83 | 0.0% |
| Bolivia | 43 | 0.0% |
| Bosnia and Herzegovina | 11 | 0.0% |
| Brazil | 562 | 0.2% |
| Bulgaria | 80 | 0.0% |
| Cambodia | 82 | 0.0% |
| Cameroon | 14 | 0.0% |
| Canada | 1,163 | 0.3% |
| Caribbean | 19,206 | 5.7% |
| Central America | 8,128 | 2.4% |
| Chile | 145 | 0.0% |
| China | 1,290 | 0.4% |
| Colombia | 977 | 0.3% |
| Costa Rica | 197 | 0.1% |
| Croatia | 68 | 0.0% |
| Cuba | 217 | 0.1% |
| Czechoslovakia | 167 | 0.1% |
| Denmark | 29 | 0.0% |
| Dominica | 164 | 0.1% |
| Dominican Republic | 5,892 | 1.8% |
| Eastern Africa | 174 | 0.1% |
| Eastern Asia | 2,670 | 0.8% |
| Eastern Europe | 5,338 | 1.6% |
| Ecuador | 6,622 | 2.0% |
| Egypt | 135 | 0.0% |
| El Salvador | 1,437 | 0.4% |
| England | 1,033 | 0.3% |
| Ethiopia | 9 | 0.0% |
| Europe | 12,490 | 3.7% |
| France | 290 | 0.1% |
| Germany | 1,055 | 0.3% |
| Ghana | 951 | 0.3% |
| Greece | 201 | 0.1% |
| Grenada | 131 | 0.0% |
| Guatemala | 3,927 | 1.2% |
| Guyana | 237 | 0.1% |
| Haiti | 10,005 | 3.0% |
| Honduras | 260 | 0.1% |
| Hong Kong | 230 | 0.1% |
| Hungary | 319 | 0.1% |
| India | 5,404 | 1.6% |
| Indonesia | 146 | 0.0% |
| Iran | 104 | 0.0% |
| Iraq | 75 | 0.0% |
| Ireland | 1,533 | 0.4% |
| Israel | 1,735 | 0.5% |
| Italy | 962 | 0.3% |
| Jamaica | 2,148 | 0.6% |
| Japan | 171 | 0.1% |
| Jordan | 156 | 0.1% |
| Kazakhstan | 4 | 0.0% |
| Kenya | 44 | 0.0% |
| Korea | 1,209 | 0.4% |
| Kuwait | 27 | 0.0% |
| Latin America | 37,061 | 11.0% |
| Latvia | 5 | 0.0% |
| Lebanon | 37 | 0.0% |
| Liberia | 64 | 0.0% |
| Lithuania | 38 | 0.0% |
| Malaysia | 27 | 0.0% |
| Mexico | 1,549 | 0.5% |
| Middle Africa | 23 | 0.0% |
| Moldova | 171 | 0.1% |
| Morocco | 155 | 0.1% |
| Nepal | 69 | 0.0% |
| Netherlands | 66 | 0.0% |
| Nicaragua | 400 | 0.1% |
| Nigeria | 681 | 0.2% |
| Northern Africa | 335 | 0.1% |
| Northern Europe | 3,595 | 1.1% |
| Norway | 19 | 0.0% |
| Oceania | 201 | 0.1% |
| Pakistan | 696 | 0.2% |
| Panama | 264 | 0.1% |
| Peru | 461 | 0.1% |
| Philippines | 3,416 | 1.0% |
| Poland | 1,440 | 0.4% |
| Portugal | 147 | 0.0% |
| Romania | 498 | 0.2% |
| Russia | 758 | 0.2% |
| Saudi Arabia | 174 | 0.1% |
| Scotland | 48 | 0.0% |
| Senegal | 3 | 0.0% |
| Sierra Leone | 89 | 0.0% |
| Singapore | 13 | 0.0% |
| Somalia | 10 | 0.0% |
| South Africa | 95 | 0.0% |
| South America | 9,727 | 2.9% |
| South Central Asia | 6,816 | 2.0% |
| South Eastern Asia | 4,085 | 1.2% |
| Southern Europe | 1,429 | 0.4% |
| Spain | 102 | 0.0% |
| Sri Lanka | 15 | 0.0% |
| St. Vincent and the Grenadines | 41 | 0.0% |
| Sudan | 29 | 0.0% |
| Sweden | 9 | 0.0% |
| Switzerland | 150 | 0.0% |
| Syria | 112 | 0.0% |
| Taiwan | 117 | 0.0% |
| Thailand | 49 | 0.0% |
| Trinidad and Tobago | 445 | 0.1% |
| Turkey | 160 | 0.1% |
| Uganda | 16 | 0.0% |
| Ukraine | 684 | 0.2% |
| Uruguay | 75 | 0.0% |
| Uzbekistan | 19 | 0.0% |
| Venezuela | 306 | 0.1% |
| Vietnam | 345 | 0.1% |
| West Indies | 28 | 0.0% |
| Western Africa | 1,884 | 0.6% |
| Western Asia | 2,770 | 0.8% |
| Western Europe | 1,930 | 0.6% |
| Yemen | 86 | 0.0% |
| Zaire | 9 | 0.0% | View All 127 Rows |
Sex and Age in Rockland County
Sex and Age in Rockland County
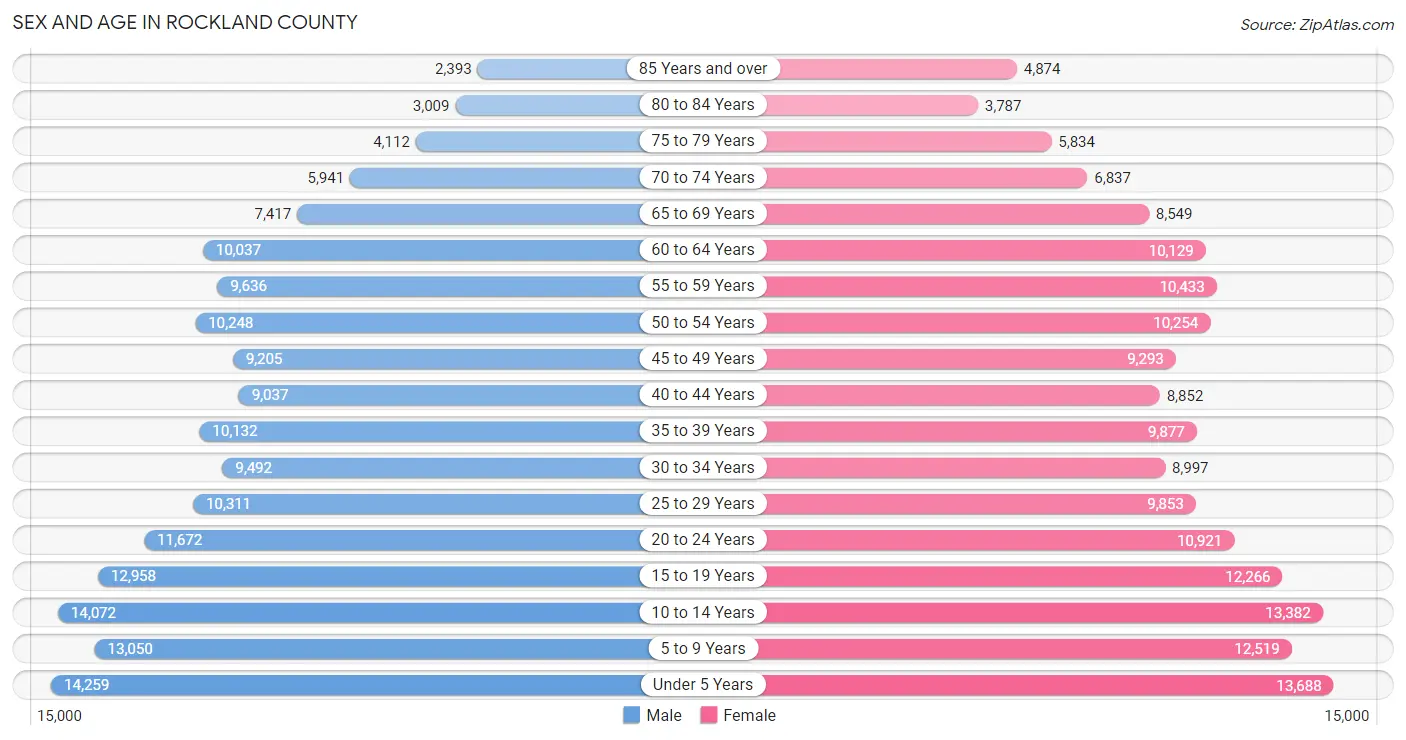
The most populous age groups in Rockland County are Under 5 Years (14,259 | 8.5%) for men and Under 5 Years (13,688 | 8.0%) for women.
| Age Bracket | Male | Female |
| Under 5 Years | 14,259 (8.5%) | 13,688 (8.0%) |
| 5 to 9 Years | 13,050 (7.8%) | 12,519 (7.3%) |
| 10 to 14 Years | 14,072 (8.4%) | 13,382 (7.9%) |
| 15 to 19 Years | 12,958 (7.8%) | 12,266 (7.2%) |
| 20 to 24 Years | 11,672 (7.0%) | 10,921 (6.4%) |
| 25 to 29 Years | 10,311 (6.2%) | 9,853 (5.8%) |
| 30 to 34 Years | 9,492 (5.7%) | 8,997 (5.3%) |
| 35 to 39 Years | 10,132 (6.1%) | 9,877 (5.8%) |
| 40 to 44 Years | 9,037 (5.4%) | 8,852 (5.2%) |
| 45 to 49 Years | 9,205 (5.5%) | 9,293 (5.5%) |
| 50 to 54 Years | 10,248 (6.1%) | 10,254 (6.0%) |
| 55 to 59 Years | 9,636 (5.8%) | 10,433 (6.1%) |
| 60 to 64 Years | 10,037 (6.0%) | 10,129 (5.9%) |
| 65 to 69 Years | 7,417 (4.4%) | 8,549 (5.0%) |
| 70 to 74 Years | 5,941 (3.6%) | 6,837 (4.0%) |
| 75 to 79 Years | 4,112 (2.5%) | 5,834 (3.4%) |
| 80 to 84 Years | 3,009 (1.8%) | 3,787 (2.2%) |
| 85 Years and over | 2,393 (1.4%) | 4,874 (2.9%) |
| Total | 166,981 (100.0%) | 170,345 (100.0%) |
Families and Households in Rockland County
Median Family Size in Rockland County
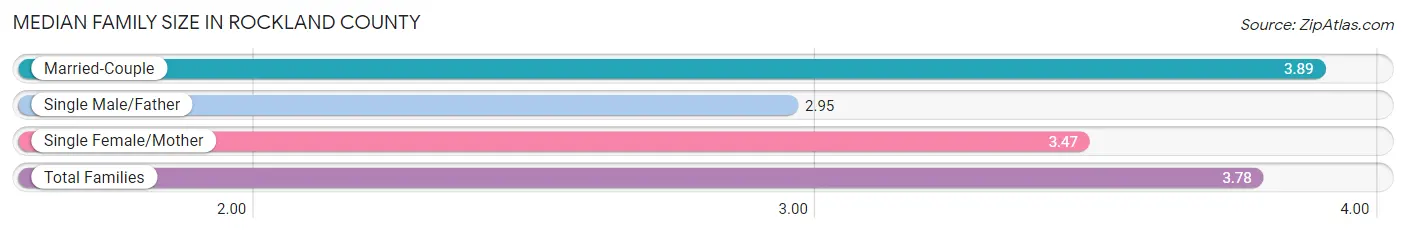
The median family size in Rockland County is 3.78 persons per family, with married-couple families (62,258 | 80.1%) accounting for the largest median family size of 3.89 persons per family. On the other hand, single male/father families (3,977 | 5.1%) represent the smallest median family size with 2.95 persons per family.
| Family Type | # Families | Family Size |
| Married-Couple | 62,258 (80.1%) | 3.89 |
| Single Male/Father | 3,977 (5.1%) | 2.95 |
| Single Female/Mother | 11,473 (14.8%) | 3.47 |
| Total Families | 77,708 (100.0%) | 3.78 |
Median Household Size in Rockland County
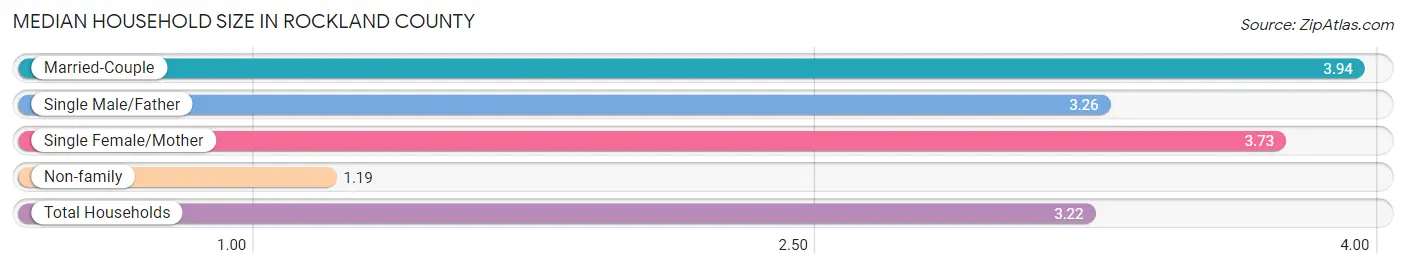
The median household size in Rockland County is 3.22 persons per household, with married-couple households (62,258 | 60.7%) accounting for the largest median household size of 3.94 persons per household. non-family households (24,871 | 24.2%) represent the smallest median household size with 1.19 persons per household.
| Household Type | # Households | Household Size |
| Married-Couple | 62,258 (60.7%) | 3.94 |
| Single Male/Father | 3,977 (3.9%) | 3.26 |
| Single Female/Mother | 11,473 (11.2%) | 3.73 |
| Non-family | 24,871 (24.2%) | 1.19 |
| Total Households | 102,579 (100.0%) | 3.22 |
Household Size by Marriage Status in Rockland County
Out of a total of 102,579 households in Rockland County, 77,708 (75.7%) are family households, while 24,871 (24.2%) are nonfamily households. The most numerous type of family households are 2-person households, comprising 24,339, and the most common type of nonfamily households are 1-person households, comprising 21,444.
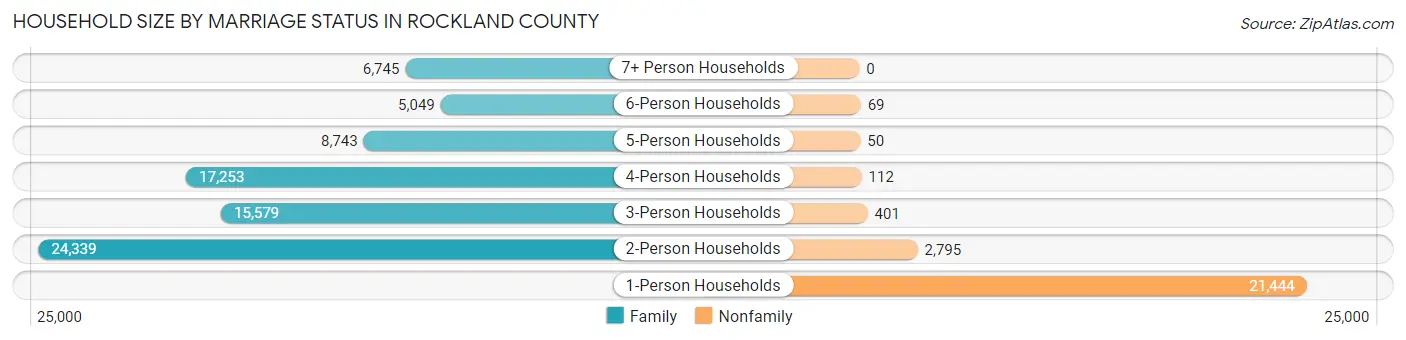
| Household Size | Family Households | Nonfamily Households |
| 1-Person Households | - | 21,444 (20.9%) |
| 2-Person Households | 24,339 (23.7%) | 2,795 (2.7%) |
| 3-Person Households | 15,579 (15.2%) | 401 (0.4%) |
| 4-Person Households | 17,253 (16.8%) | 112 (0.1%) |
| 5-Person Households | 8,743 (8.5%) | 50 (0.1%) |
| 6-Person Households | 5,049 (4.9%) | 69 (0.1%) |
| 7+ Person Households | 6,745 (6.6%) | 0 (0.0%) |
| Total | 77,708 (75.7%) | 24,871 (24.2%) |
Female Fertility in Rockland County
Fertility by Age in Rockland County
Average fertility rate in Rockland County is 78.0 births per 1,000 women. Women in the age bracket of 20 to 34 years have the highest fertility rate with 124.0 births per 1,000 women. Women in the age bracket of 20 to 34 years acount for 65.6% of all women with births.
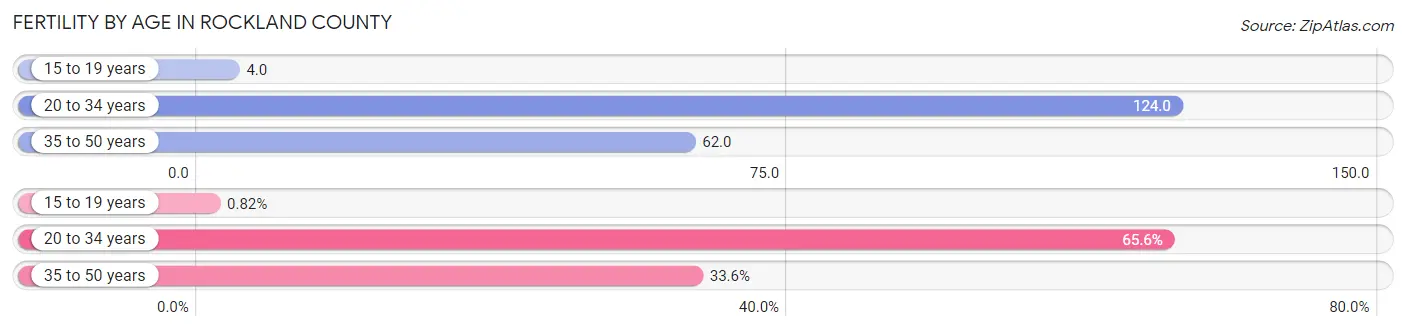
| Age Bracket | Women with Births | Births / 1,000 Women |
| 15 to 19 years | 46 (0.8%) | 4.0 |
| 20 to 34 years | 3,688 (65.6%) | 124.0 |
| 35 to 50 years | 1,888 (33.6%) | 62.0 |
| Total | 5,622 (100.0%) | 78.0 |
Fertility by Age by Marriage Status in Rockland County
86.4% of women with births (5,622) in Rockland County are married. The highest percentage of unmarried women with births falls into 15 to 19 years age bracket with 100.0% of them unmarried at the time of birth, while the lowest percentage of unmarried women with births belong to 35 to 50 years age bracket with 9.9% of them unmarried.
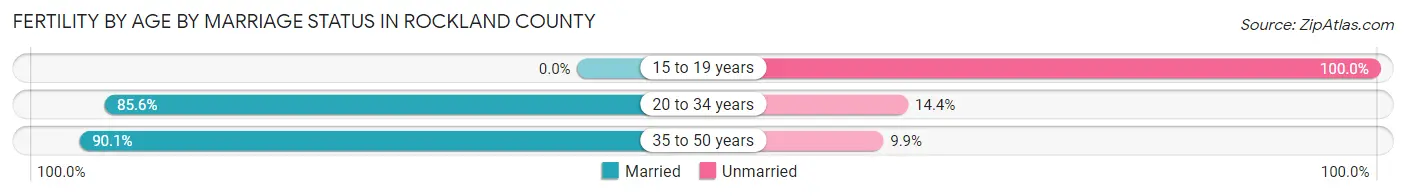
| Age Bracket | Married | Unmarried |
| 15 to 19 years | 0 (0.0%) | 46 (100.0%) |
| 20 to 34 years | 3,157 (85.6%) | 531 (14.4%) |
| 35 to 50 years | 1,701 (90.1%) | 187 (9.9%) |
| Total | 4,857 (86.4%) | 765 (13.6%) |
Fertility by Education in Rockland County
Average fertility rate in Rockland County is 78.0 births per 1,000 women. Women with the education attainment of high school diploma have the highest fertility rate of 145.0 births per 1,000 women, while women with the education attainment of bachelor's degree have the lowest fertility at 50.0 births per 1,000 women. Women with the education attainment of high school diploma represent 44.2% of all women with births.
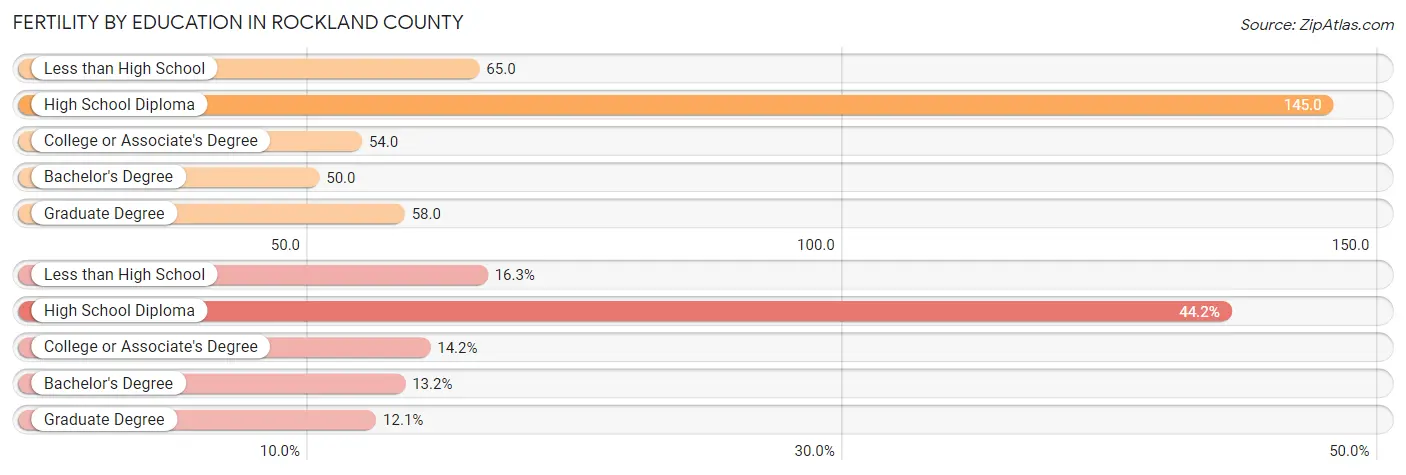
| Educational Attainment | Women with Births | Births / 1,000 Women |
| Less than High School | 917 (16.3%) | 65.0 |
| High School Diploma | 2,484 (44.2%) | 145.0 |
| College or Associate's Degree | 796 (14.2%) | 54.0 |
| Bachelor's Degree | 743 (13.2%) | 50.0 |
| Graduate Degree | 682 (12.1%) | 58.0 |
| Total | 5,622 (100.0%) | 78.0 |
Fertility by Education by Marriage Status in Rockland County
13.6% of women with births in Rockland County are unmarried. Women with the educational attainment of high school diploma are most likely to be married with 97.2% of them married at childbirth, while women with the educational attainment of bachelor's degree are least likely to be married with 39.3% of them unmarried at childbirth.
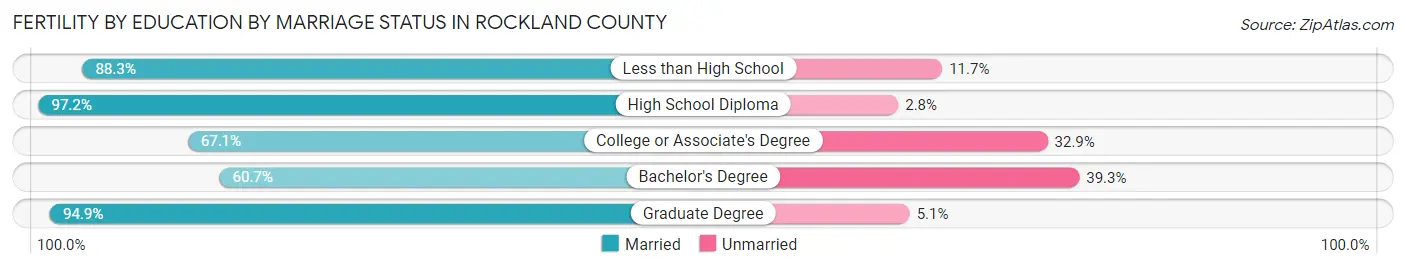
| Educational Attainment | Married | Unmarried |
| Less than High School | 810 (88.3%) | 107 (11.7%) |
| High School Diploma | 2,414 (97.2%) | 70 (2.8%) |
| College or Associate's Degree | 534 (67.1%) | 262 (32.9%) |
| Bachelor's Degree | 451 (60.7%) | 292 (39.3%) |
| Graduate Degree | 647 (94.9%) | 35 (5.1%) |
| Total | 4,857 (86.4%) | 765 (13.6%) |
Employment Characteristics in Rockland County
Employment by Class of Employer in Rockland County
Among the 144,661 employed individuals in Rockland County, private company employees (84,529 | 58.4%), not-for-profit organizations (21,568 | 14.9%), and local government employees (15,616 | 10.8%) make up the most common classes of employment.
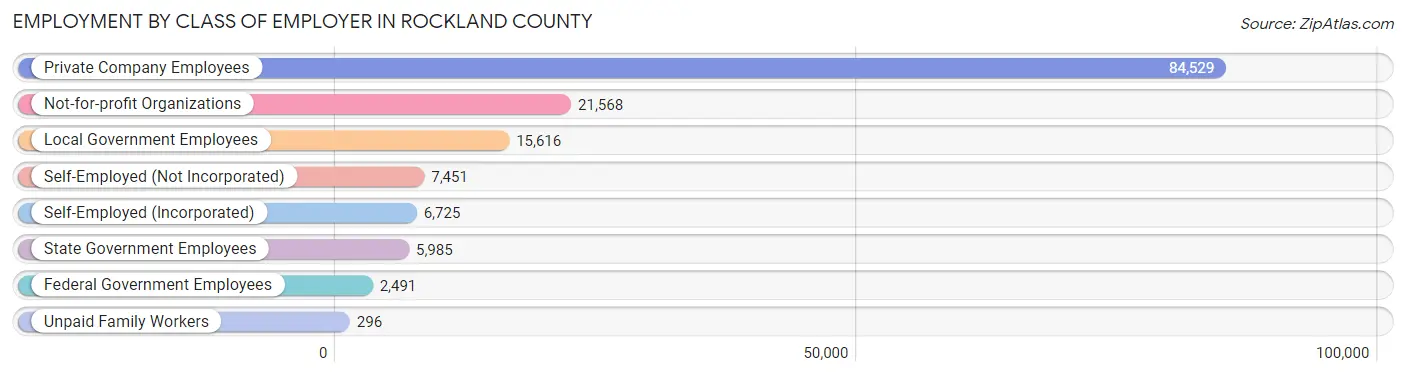
| Employer Class | # Employees | % Employees |
| Private Company Employees | 84,529 | 58.4% |
| Self-Employed (Incorporated) | 6,725 | 4.6% |
| Self-Employed (Not Incorporated) | 7,451 | 5.1% |
| Not-for-profit Organizations | 21,568 | 14.9% |
| Local Government Employees | 15,616 | 10.8% |
| State Government Employees | 5,985 | 4.1% |
| Federal Government Employees | 2,491 | 1.7% |
| Unpaid Family Workers | 296 | 0.2% |
| Total | 144,661 | 100.0% |
Employment Status by Age in Rockland County
According to the labor force statistics for Rockland County, out of the total population over 16 years of age (250,660), 63.2% or 158,417 individuals are in the labor force, with 6.2% or 9,822 of them unemployed. The age group with the highest labor force participation rate is 45 to 54 years, with 84.8% or 33,072 individuals in the labor force. Within the labor force, the 16 to 19 years age range has the highest percentage of unemployed individuals, with 13.0% or 698 of them being unemployed.
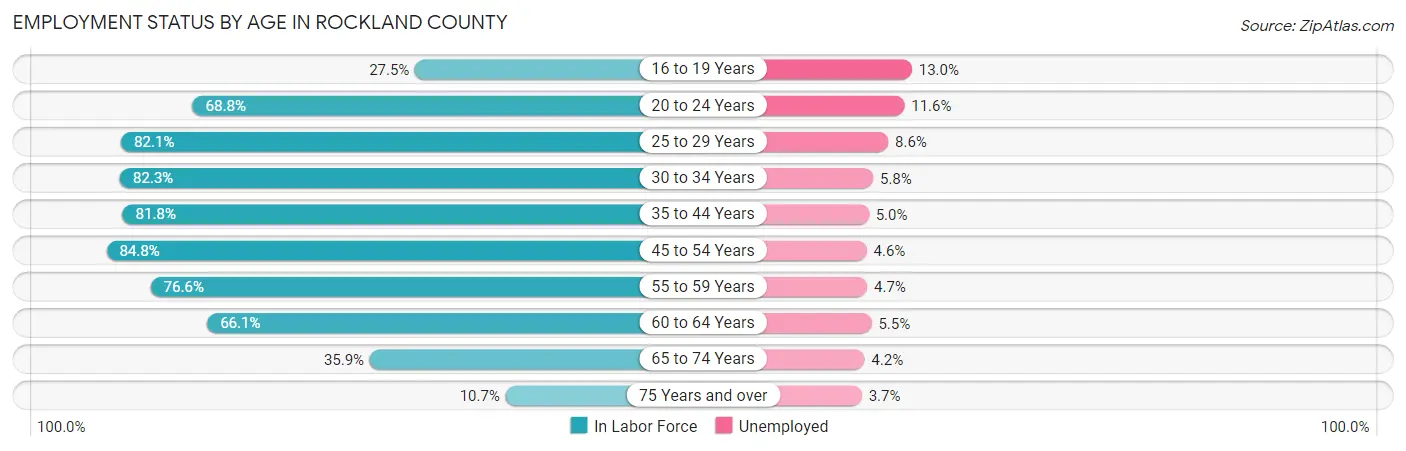
| Age Bracket | In Labor Force | Unemployed |
| 16 to 19 Years | 5,370 (27.5%) | 698 (13.0%) |
| 20 to 24 Years | 15,544 (68.8%) | 1,803 (11.6%) |
| 25 to 29 Years | 16,555 (82.1%) | 1,424 (8.6%) |
| 30 to 34 Years | 15,216 (82.3%) | 883 (5.8%) |
| 35 to 44 Years | 31,001 (81.8%) | 1,550 (5.0%) |
| 45 to 54 Years | 33,072 (84.8%) | 1,521 (4.6%) |
| 55 to 59 Years | 15,373 (76.6%) | 723 (4.7%) |
| 60 to 64 Years | 13,330 (66.1%) | 733 (5.5%) |
| 65 to 74 Years | 10,319 (35.9%) | 433 (4.2%) |
| 75 Years and over | 2,569 (10.7%) | 95 (3.7%) |
| Total | 158,417 (63.2%) | 9,822 (6.2%) |
Employment Status by Educational Attainment in Rockland County
According to labor force statistics for Rockland County, 79.9% of individuals (124,473) out of the total population between 25 and 64 years of age (155,786) are in the labor force, with 5.5% or 6,846 of them being unemployed. The group with the highest labor force participation rate are those with the educational attainment of bachelor's degree or higher, with 88.0% or 58,301 individuals in the labor force. Within the labor force, individuals with high school diploma education have the highest percentage of unemployment, with 8.5% or 1,985 of them being unemployed.
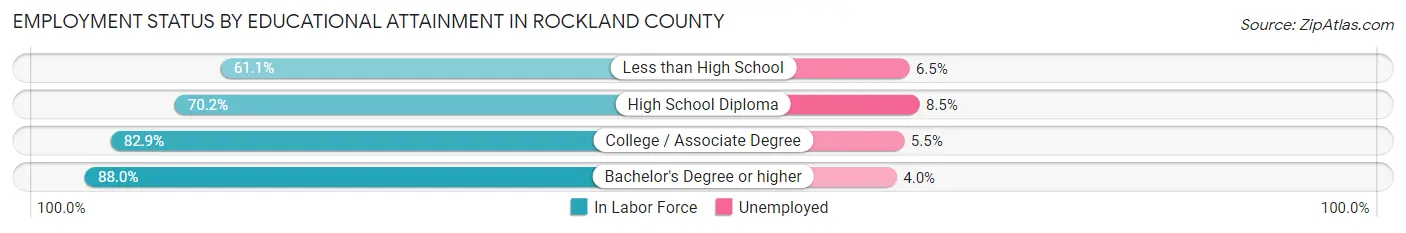
| Educational Attainment | In Labor Force | Unemployed |
| Less than High School | 10,647 (61.1%) | 1,133 (6.5%) |
| High School Diploma | 23,356 (70.2%) | 2,828 (8.5%) |
| College / Associate Degree | 32,198 (82.9%) | 2,136 (5.5%) |
| Bachelor's Degree or higher | 58,301 (88.0%) | 2,650 (4.0%) |
| Total | 124,473 (79.9%) | 8,568 (5.5%) |
Employment Occupations by Sex in Rockland County
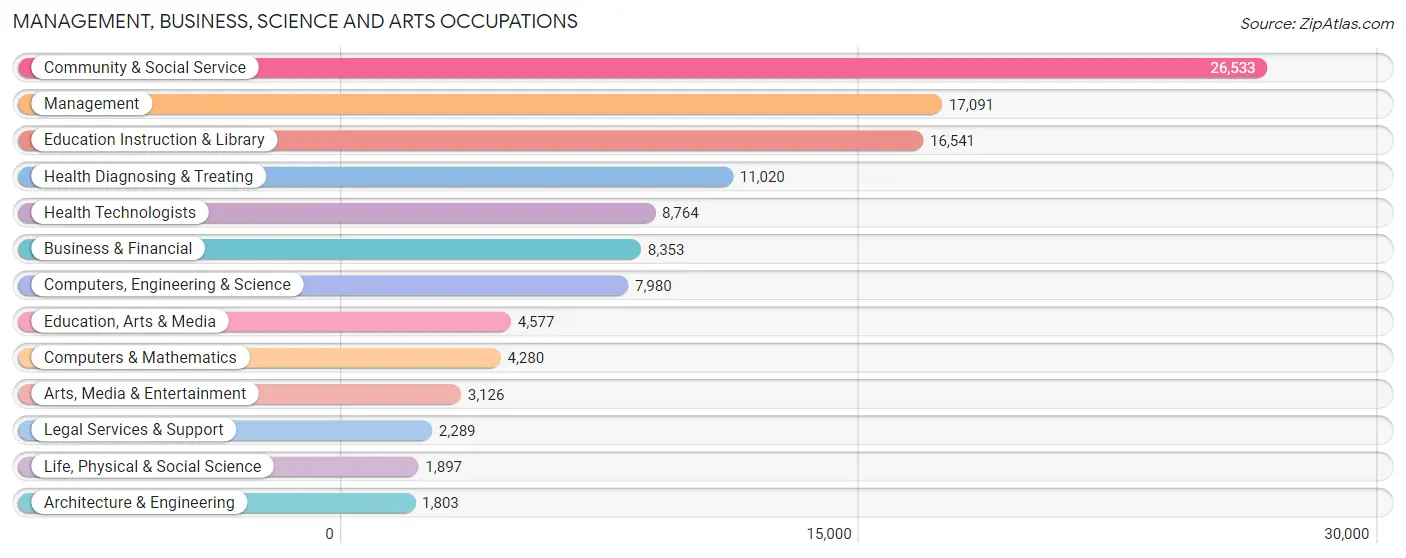
Management, Business, Science and Arts Occupations
The most common Management, Business, Science and Arts occupations in Rockland County are Community & Social Service (26,533 | 17.9%), Management (17,091 | 11.5%), Education Instruction & Library (16,541 | 11.2%), Health Diagnosing & Treating (11,020 | 7.4%), and Health Technologists (8,764 | 5.9%).
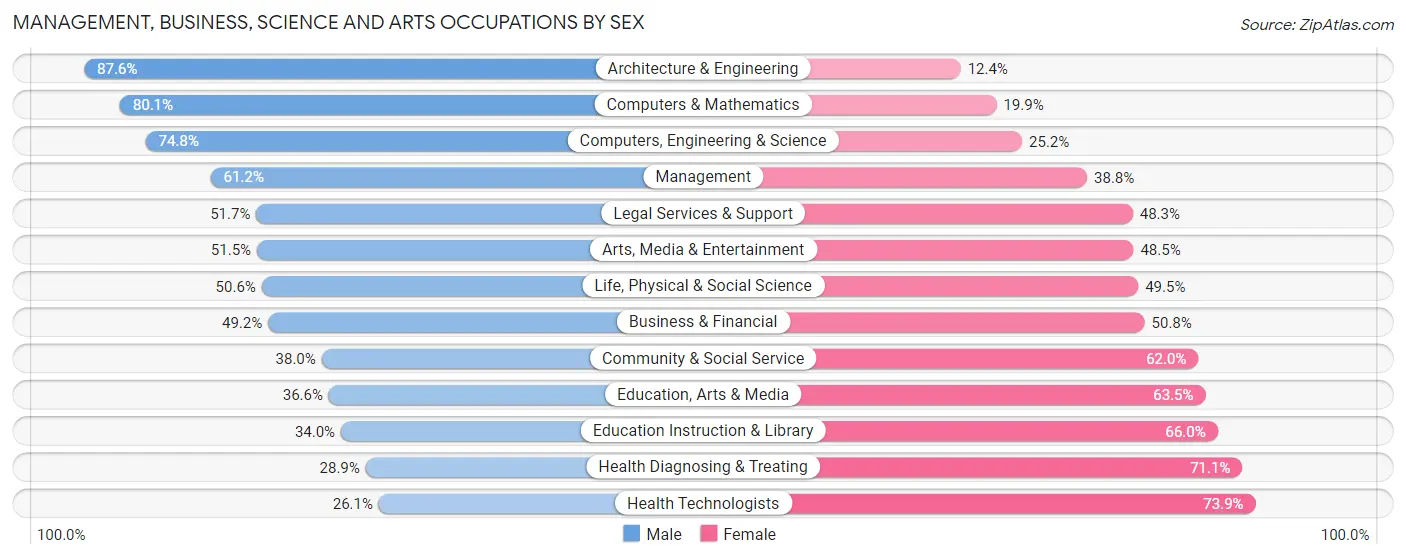
Management, Business, Science and Arts Occupations by Sex
Within the Management, Business, Science and Arts occupations in Rockland County, the most male-oriented occupations are Architecture & Engineering (87.6%), Computers & Mathematics (80.1%), and Computers, Engineering & Science (74.8%), while the most female-oriented occupations are Health Technologists (73.9%), Health Diagnosing & Treating (71.1%), and Education Instruction & Library (66.0%).
| Occupation | Male | Female |
| Management | 10,461 (61.2%) | 6,630 (38.8%) |
| Business & Financial | 4,111 (49.2%) | 4,242 (50.8%) |
| Computers, Engineering & Science | 5,967 (74.8%) | 2,013 (25.2%) |
| Computers & Mathematics | 3,429 (80.1%) | 851 (19.9%) |
| Architecture & Engineering | 1,579 (87.6%) | 224 (12.4%) |
| Life, Physical & Social Science | 959 (50.5%) | 938 (49.4%) |
| Community & Social Service | 10,092 (38.0%) | 16,441 (62.0%) |
| Education, Arts & Media | 1,673 (36.5%) | 2,904 (63.4%) |
| Legal Services & Support | 1,183 (51.7%) | 1,106 (48.3%) |
| Education Instruction & Library | 5,625 (34.0%) | 10,916 (66.0%) |
| Arts, Media & Entertainment | 1,611 (51.5%) | 1,515 (48.5%) |
| Health Diagnosing & Treating | 3,180 (28.9%) | 7,840 (71.1%) |
| Health Technologists | 2,288 (26.1%) | 6,476 (73.9%) |
| Total (Category) | 33,811 (47.6%) | 37,166 (52.4%) |
| Total (Overall) | 77,317 (52.1%) | 71,032 (47.9%) |
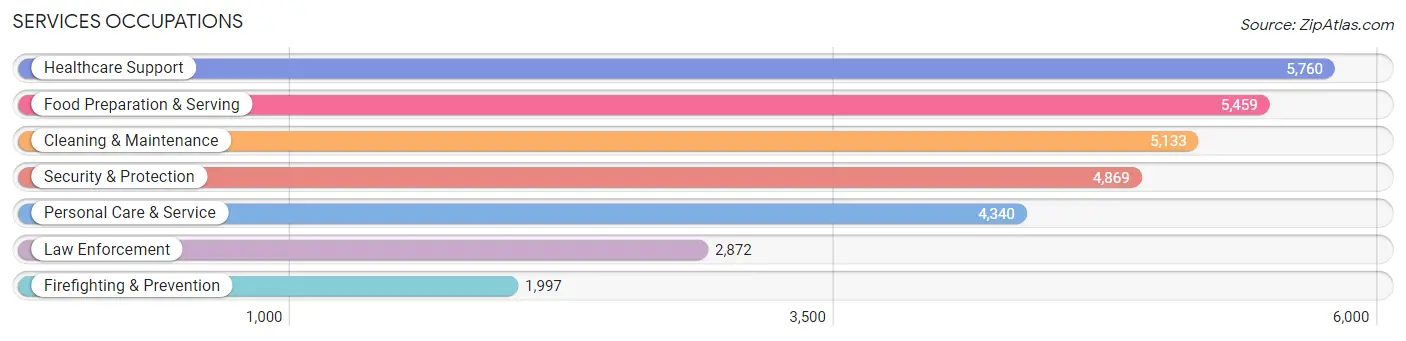
Services Occupations
The most common Services occupations in Rockland County are Healthcare Support (5,760 | 3.9%), Food Preparation & Serving (5,459 | 3.7%), Cleaning & Maintenance (5,133 | 3.5%), Security & Protection (4,869 | 3.3%), and Personal Care & Service (4,340 | 2.9%).
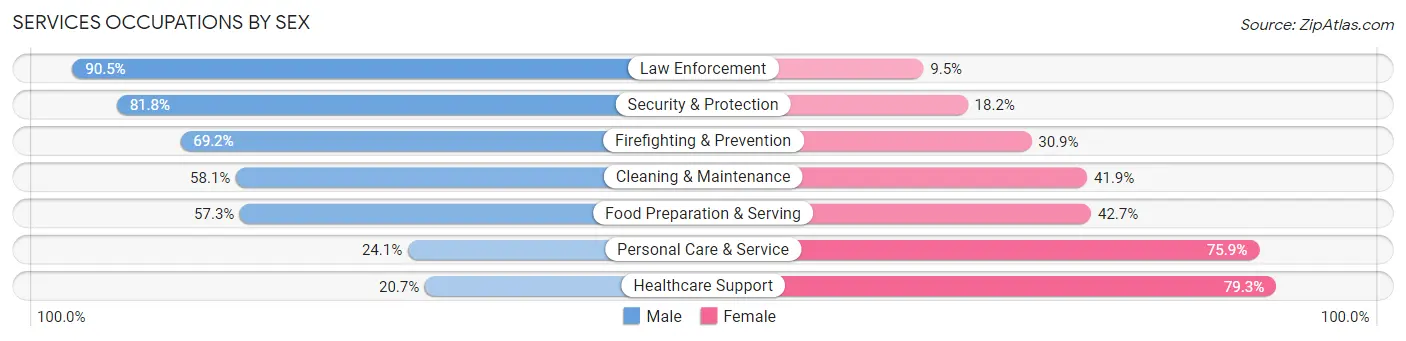
Services Occupations by Sex
Within the Services occupations in Rockland County, the most male-oriented occupations are Law Enforcement (90.5%), Security & Protection (81.8%), and Firefighting & Prevention (69.2%), while the most female-oriented occupations are Healthcare Support (79.3%), Personal Care & Service (75.9%), and Food Preparation & Serving (42.7%).
| Occupation | Male | Female |
| Healthcare Support | 1,193 (20.7%) | 4,567 (79.3%) |
| Security & Protection | 3,981 (81.8%) | 888 (18.2%) |
| Firefighting & Prevention | 1,381 (69.2%) | 616 (30.8%) |
| Law Enforcement | 2,600 (90.5%) | 272 (9.5%) |
| Food Preparation & Serving | 3,129 (57.3%) | 2,330 (42.7%) |
| Cleaning & Maintenance | 2,983 (58.1%) | 2,150 (41.9%) |
| Personal Care & Service | 1,045 (24.1%) | 3,295 (75.9%) |
| Total (Category) | 12,331 (48.2%) | 13,230 (51.8%) |
| Total (Overall) | 77,317 (52.1%) | 71,032 (47.9%) |
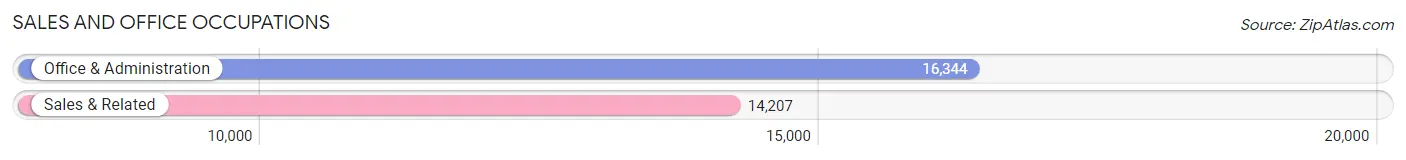
Sales and Office Occupations
The most common Sales and Office occupations in Rockland County are Office & Administration (16,344 | 11.0%), and Sales & Related (14,207 | 9.6%).
Sales and Office Occupations by Sex
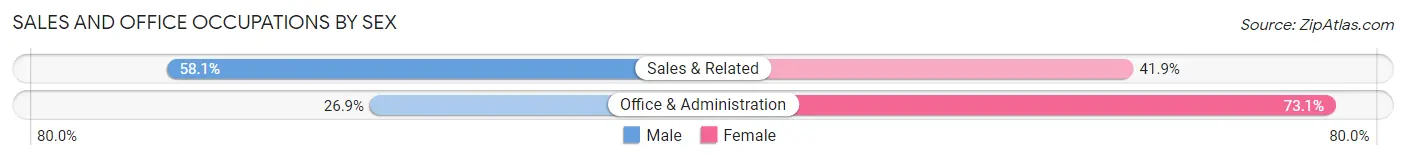
| Occupation | Male | Female |
| Sales & Related | 8,260 (58.1%) | 5,947 (41.9%) |
| Office & Administration | 4,393 (26.9%) | 11,951 (73.1%) |
| Total (Category) | 12,653 (41.4%) | 17,898 (58.6%) |
| Total (Overall) | 77,317 (52.1%) | 71,032 (47.9%) |
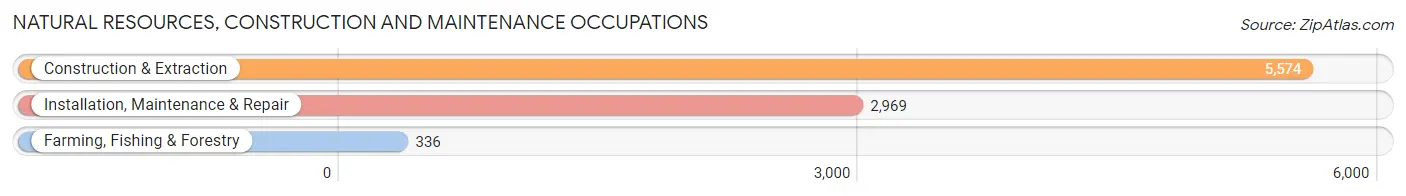
Natural Resources, Construction and Maintenance Occupations
The most common Natural Resources, Construction and Maintenance occupations in Rockland County are Construction & Extraction (5,574 | 3.8%), Installation, Maintenance & Repair (2,969 | 2.0%), and Farming, Fishing & Forestry (336 | 0.2%).
Natural Resources, Construction and Maintenance Occupations by Sex
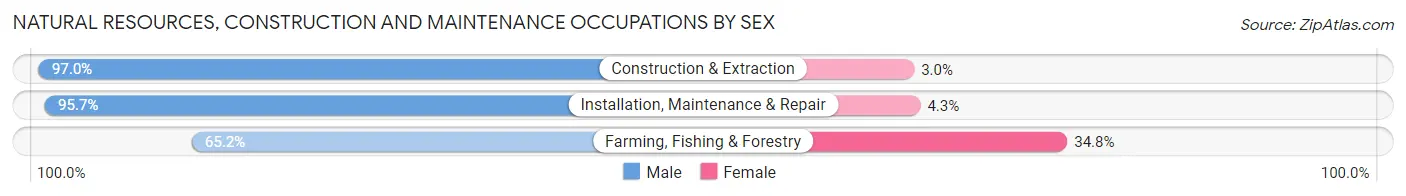
| Occupation | Male | Female |
| Farming, Fishing & Forestry | 219 (65.2%) | 117 (34.8%) |
| Construction & Extraction | 5,408 (97.0%) | 166 (3.0%) |
| Installation, Maintenance & Repair | 2,842 (95.7%) | 127 (4.3%) |
| Total (Category) | 8,469 (95.4%) | 410 (4.6%) |
| Total (Overall) | 77,317 (52.1%) | 71,032 (47.9%) |
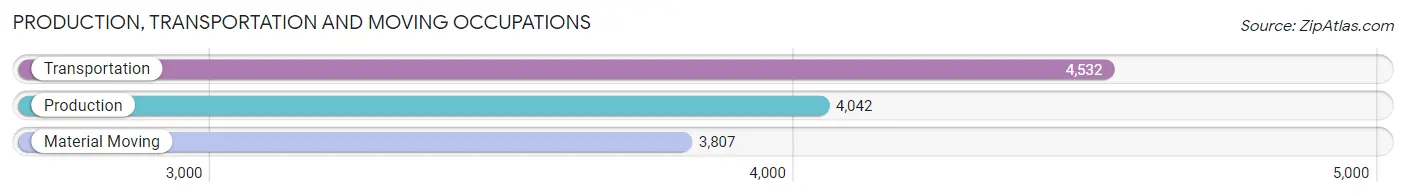
Production, Transportation and Moving Occupations
The most common Production, Transportation and Moving occupations in Rockland County are Transportation (4,532 | 3.0%), Production (4,042 | 2.7%), and Material Moving (3,807 | 2.6%).
Production, Transportation and Moving Occupations by Sex
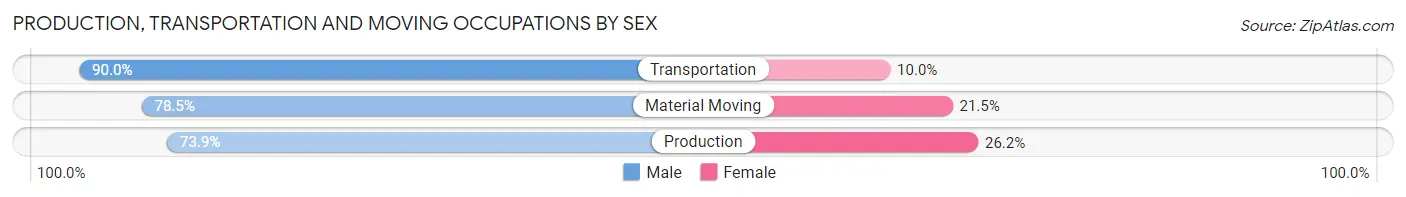
| Occupation | Male | Female |
| Production | 2,985 (73.9%) | 1,057 (26.2%) |
| Transportation | 4,078 (90.0%) | 454 (10.0%) |
| Material Moving | 2,990 (78.5%) | 817 (21.5%) |
| Total (Category) | 10,053 (81.2%) | 2,328 (18.8%) |
| Total (Overall) | 77,317 (52.1%) | 71,032 (47.9%) |
Employment Industries by Sex in Rockland County
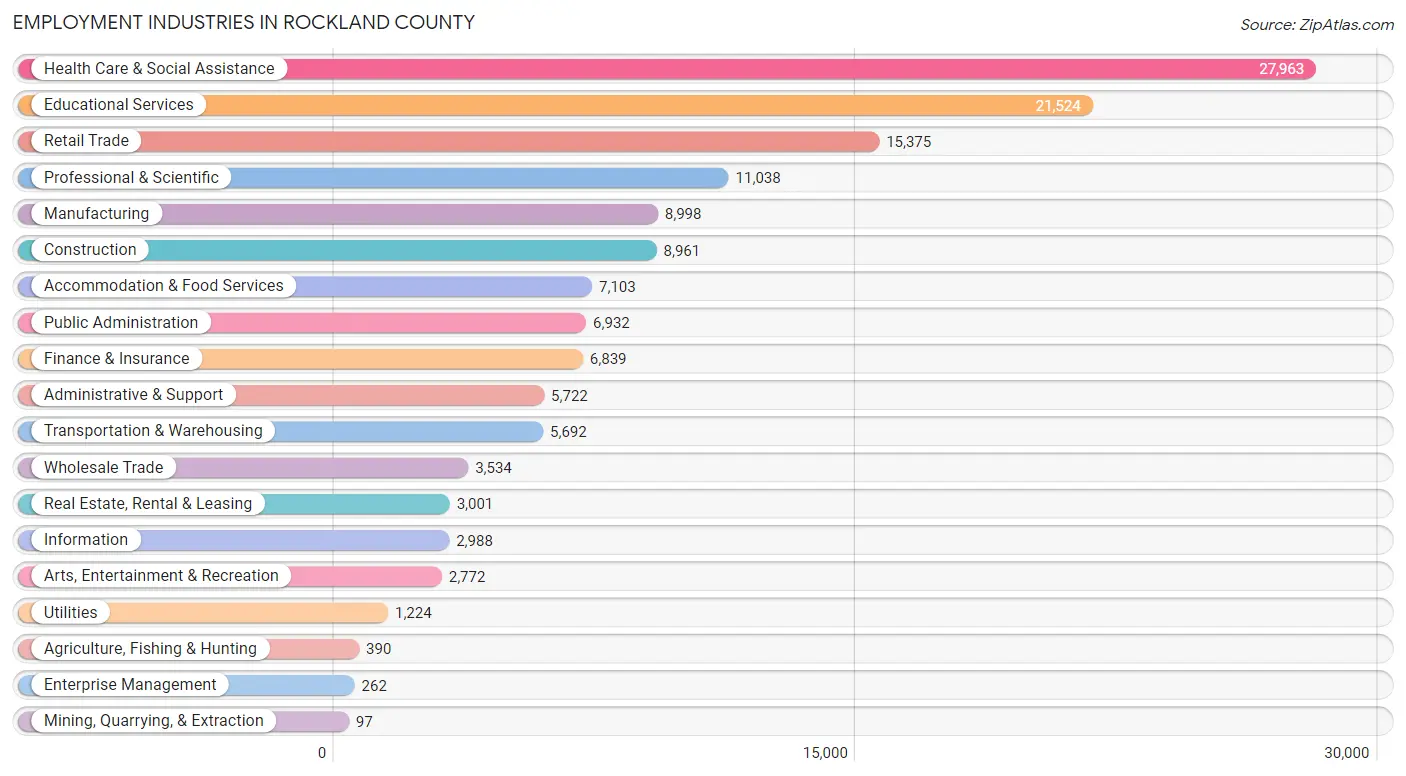
Employment Industries in Rockland County
The major employment industries in Rockland County include Health Care & Social Assistance (27,963 | 18.9%), Educational Services (21,524 | 14.5%), Retail Trade (15,375 | 10.4%), Professional & Scientific (11,038 | 7.4%), and Manufacturing (8,998 | 6.1%).
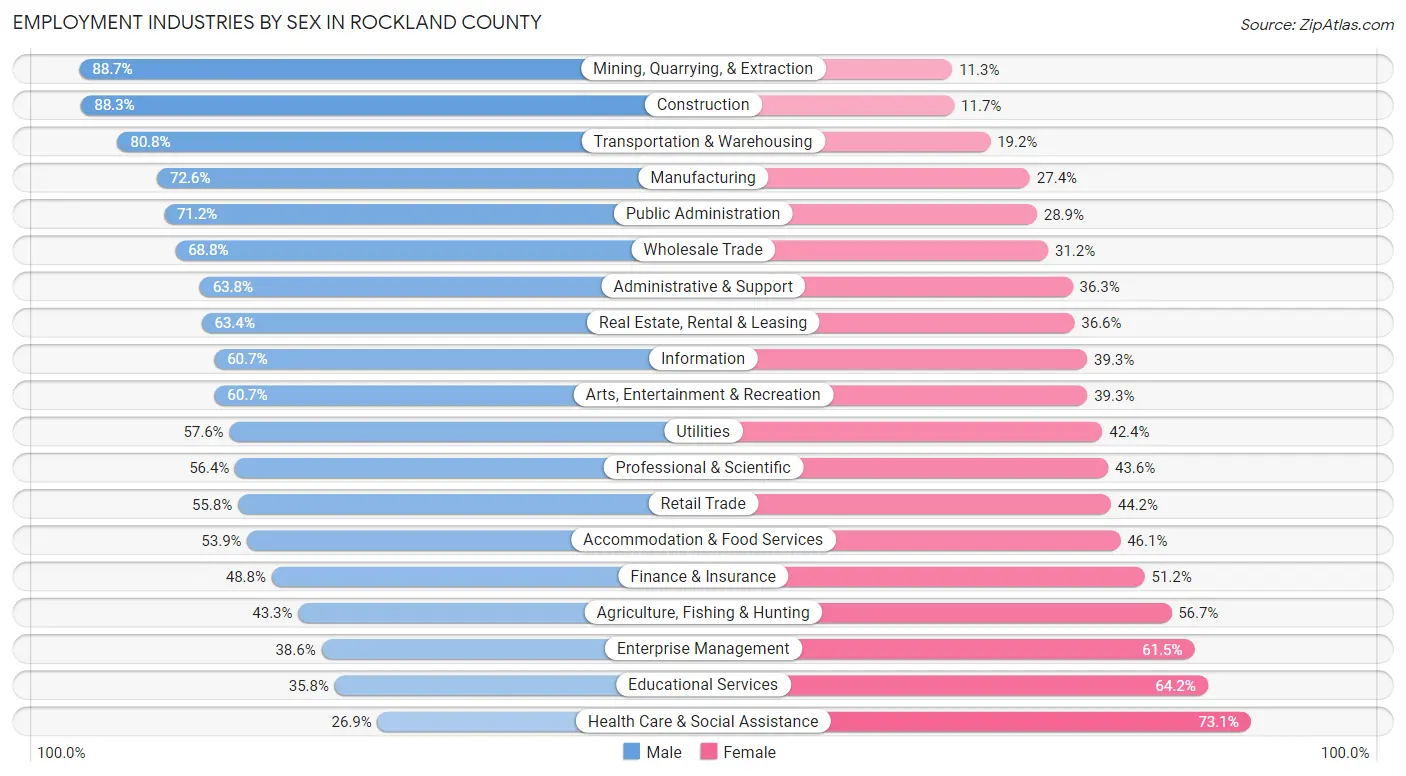
Employment Industries by Sex in Rockland County
The Rockland County industries that see more men than women are Mining, Quarrying, & Extraction (88.7%), Construction (88.3%), and Transportation & Warehousing (80.8%), whereas the industries that tend to have a higher number of women are Health Care & Social Assistance (73.1%), Educational Services (64.2%), and Enterprise Management (61.5%).
| Industry | Male | Female |
| Agriculture, Fishing & Hunting | 169 (43.3%) | 221 (56.7%) |
| Mining, Quarrying, & Extraction | 86 (88.7%) | 11 (11.3%) |
| Construction | 7,909 (88.3%) | 1,052 (11.7%) |
| Manufacturing | 6,531 (72.6%) | 2,467 (27.4%) |
| Wholesale Trade | 2,432 (68.8%) | 1,102 (31.2%) |
| Retail Trade | 8,582 (55.8%) | 6,793 (44.2%) |
| Transportation & Warehousing | 4,599 (80.8%) | 1,093 (19.2%) |
| Utilities | 705 (57.6%) | 519 (42.4%) |
| Information | 1,815 (60.7%) | 1,173 (39.3%) |
| Finance & Insurance | 3,340 (48.8%) | 3,499 (51.2%) |
| Real Estate, Rental & Leasing | 1,902 (63.4%) | 1,099 (36.6%) |
| Professional & Scientific | 6,227 (56.4%) | 4,811 (43.6%) |
| Enterprise Management | 101 (38.6%) | 161 (61.5%) |
| Administrative & Support | 3,648 (63.7%) | 2,074 (36.2%) |
| Educational Services | 7,706 (35.8%) | 13,818 (64.2%) |
| Health Care & Social Assistance | 7,530 (26.9%) | 20,433 (73.1%) |
| Arts, Entertainment & Recreation | 1,683 (60.7%) | 1,089 (39.3%) |
| Accommodation & Food Services | 3,827 (53.9%) | 3,276 (46.1%) |
| Public Administration | 4,932 (71.2%) | 2,000 (28.8%) |
| Total | 77,317 (52.1%) | 71,032 (47.9%) |
Education in Rockland County
School Enrollment in Rockland County
The most common levels of schooling among the 98,948 students in Rockland County are middle school (22,305 | 22.5%), high school (21,865 | 22.1%), and elementary school (21,200 | 21.4%).
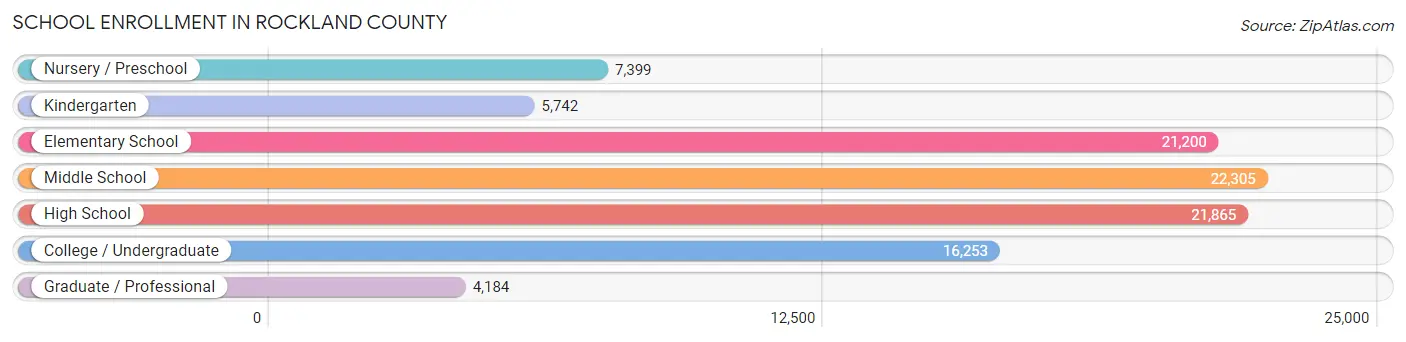
| School Level | # Students | % Students |
| Nursery / Preschool | 7,399 | 7.5% |
| Kindergarten | 5,742 | 5.8% |
| Elementary School | 21,200 | 21.4% |
| Middle School | 22,305 | 22.5% |
| High School | 21,865 | 22.1% |
| College / Undergraduate | 16,253 | 16.4% |
| Graduate / Professional | 4,184 | 4.2% |
| Total | 98,948 | 100.0% |
School Enrollment by Age by Funding Source in Rockland County
Out of a total of 98,948 students who are enrolled in schools in Rockland County, 50,365 (50.9%) attend a private institution, while the remaining 48,583 (49.1%) are enrolled in public schools. The age group of 3 to 4 year olds has the highest likelihood of being enrolled in private schools, with 6,382 (75.5% in the age bracket) enrolled. Conversely, the age group of 15 to 17 year olds has the lowest likelihood of being enrolled in a private school, with 9,400 (59.9% in the age bracket) attending a public institution.
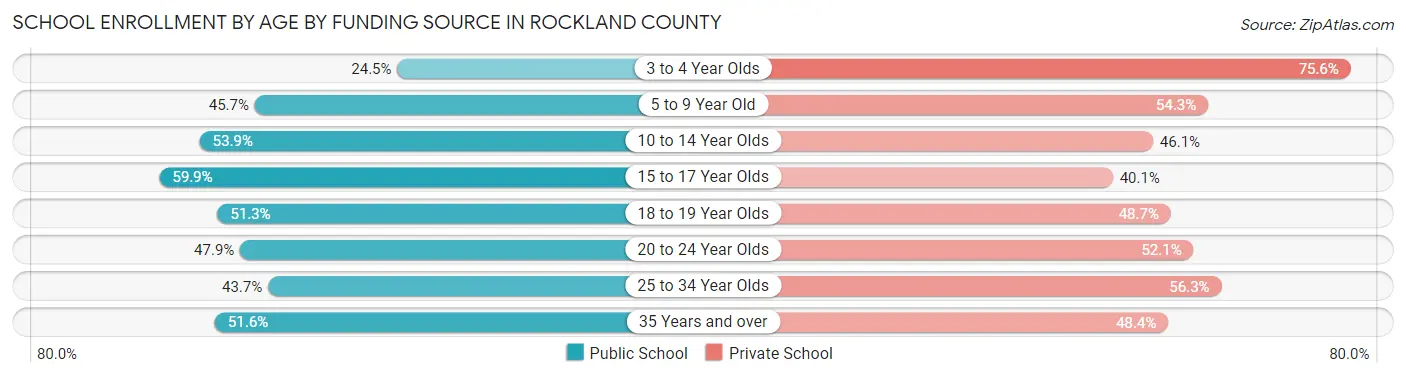
| Age Bracket | Public School | Private School |
| 3 to 4 Year Olds | 2,065 (24.4%) | 6,382 (75.5%) |
| 5 to 9 Year Old | 11,456 (45.7%) | 13,614 (54.3%) |
| 10 to 14 Year Olds | 14,612 (53.9%) | 12,485 (46.1%) |
| 15 to 17 Year Olds | 9,400 (59.9%) | 6,290 (40.1%) |
| 18 to 19 Year Olds | 3,629 (51.3%) | 3,449 (48.7%) |
| 20 to 24 Year Olds | 4,623 (47.9%) | 5,033 (52.1%) |
| 25 to 34 Year Olds | 1,395 (43.7%) | 1,796 (56.3%) |
| 35 Years and over | 1,404 (51.6%) | 1,315 (48.4%) |
| Total | 48,583 (49.1%) | 50,365 (50.9%) |
Educational Attainment by Field of Study in Rockland County
Business (18,816 | 19.9%), science & technology (11,266 | 11.9%), education (11,099 | 11.7%), social sciences (7,396 | 7.8%), and psychology (6,042 | 6.4%) are the most common fields of study among 94,553 individuals in Rockland County who have obtained a bachelor's degree or higher.
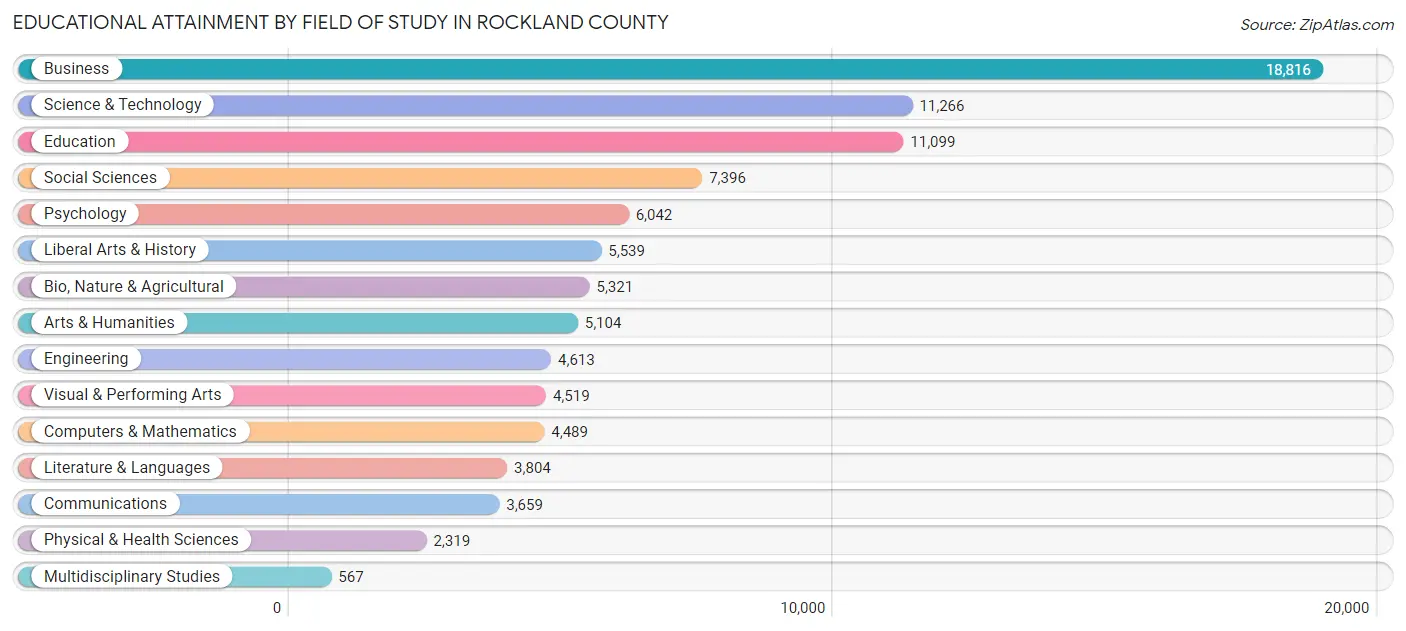
| Field of Study | # Graduates | % Graduates |
| Computers & Mathematics | 4,489 | 4.8% |
| Bio, Nature & Agricultural | 5,321 | 5.6% |
| Physical & Health Sciences | 2,319 | 2.5% |
| Psychology | 6,042 | 6.4% |
| Social Sciences | 7,396 | 7.8% |
| Engineering | 4,613 | 4.9% |
| Multidisciplinary Studies | 567 | 0.6% |
| Science & Technology | 11,266 | 11.9% |
| Business | 18,816 | 19.9% |
| Education | 11,099 | 11.7% |
| Literature & Languages | 3,804 | 4.0% |
| Liberal Arts & History | 5,539 | 5.9% |
| Visual & Performing Arts | 4,519 | 4.8% |
| Communications | 3,659 | 3.9% |
| Arts & Humanities | 5,104 | 5.4% |
| Total | 94,553 | 100.0% |
Transportation & Commute in Rockland County
Vehicle Availability by Sex in Rockland County
The most prevalent vehicle ownership categories in Rockland County are males with 2 vehicles (30,444, accounting for 40.3%) and females with 2 vehicles (27,230, making up 44.8%).
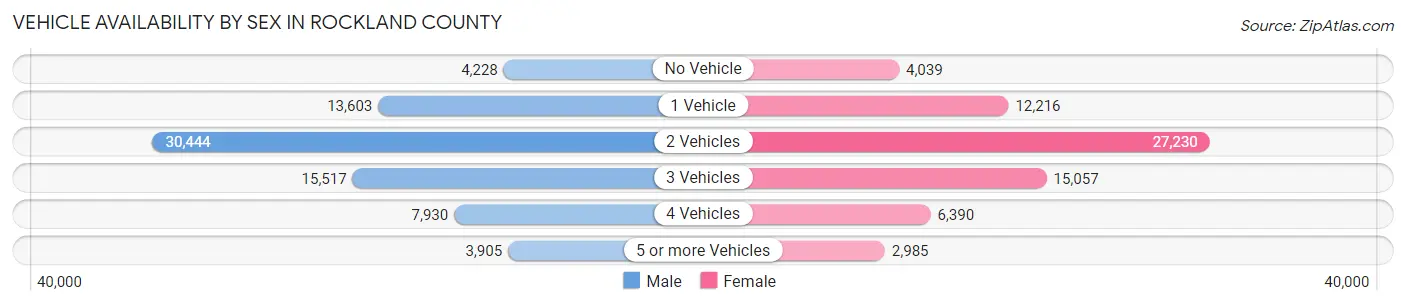
| Vehicles Available | Male | Female |
| No Vehicle | 4,228 (5.6%) | 4,039 (5.9%) |
| 1 Vehicle | 13,603 (18.0%) | 12,216 (18.0%) |
| 2 Vehicles | 30,444 (40.3%) | 27,230 (40.1%) |
| 3 Vehicles | 15,517 (20.5%) | 15,057 (22.2%) |
| 4 Vehicles | 7,930 (10.5%) | 6,390 (9.4%) |
| 5 or more Vehicles | 3,905 (5.2%) | 2,985 (4.4%) |
| Total | 75,627 (100.0%) | 67,917 (100.0%) |
Commute Time in Rockland County
The most frequently occuring commute durations in Rockland County are 15 to 19 minutes (18,668 commuters, 14.5%), 10 to 14 minutes (16,170 commuters, 12.6%), and 20 to 24 minutes (16,030 commuters, 12.4%).
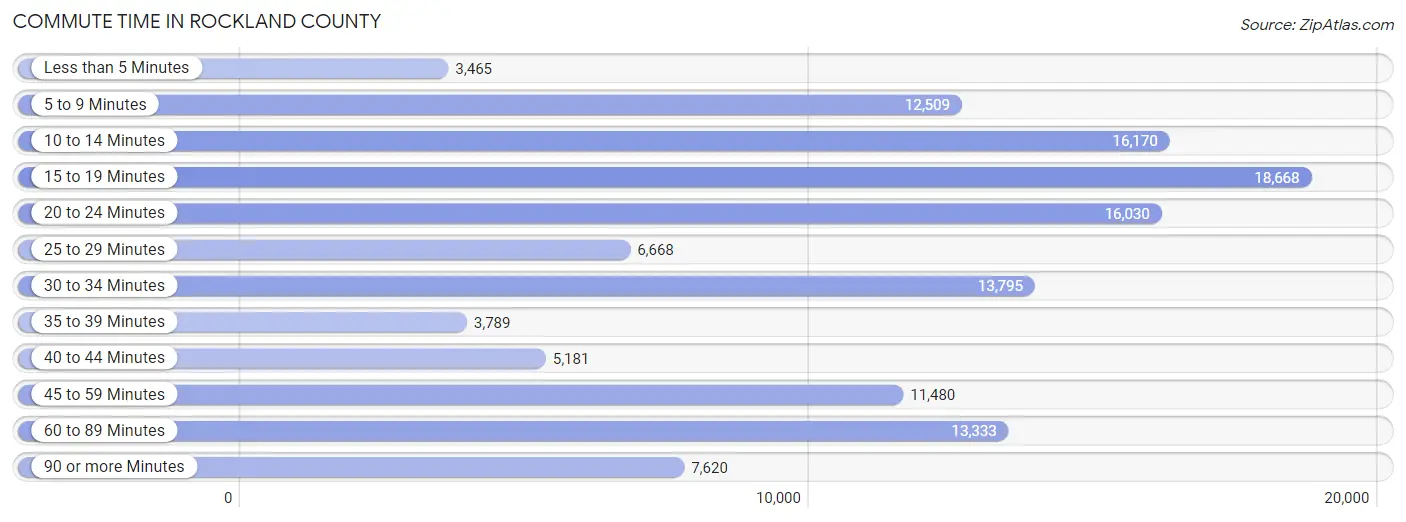
| Commute Time | # Commuters | % Commuters |
| Less than 5 Minutes | 3,465 | 2.7% |
| 5 to 9 Minutes | 12,509 | 9.7% |
| 10 to 14 Minutes | 16,170 | 12.6% |
| 15 to 19 Minutes | 18,668 | 14.5% |
| 20 to 24 Minutes | 16,030 | 12.4% |
| 25 to 29 Minutes | 6,668 | 5.2% |
| 30 to 34 Minutes | 13,795 | 10.7% |
| 35 to 39 Minutes | 3,789 | 2.9% |
| 40 to 44 Minutes | 5,181 | 4.0% |
| 45 to 59 Minutes | 11,480 | 8.9% |
| 60 to 89 Minutes | 13,333 | 10.4% |
| 90 or more Minutes | 7,620 | 5.9% |
Commute Time by Sex in Rockland County
The most common commute times in Rockland County are 15 to 19 minutes (8,635 commuters, 12.7%) for males and 15 to 19 minutes (10,033 commuters, 16.6%) for females.
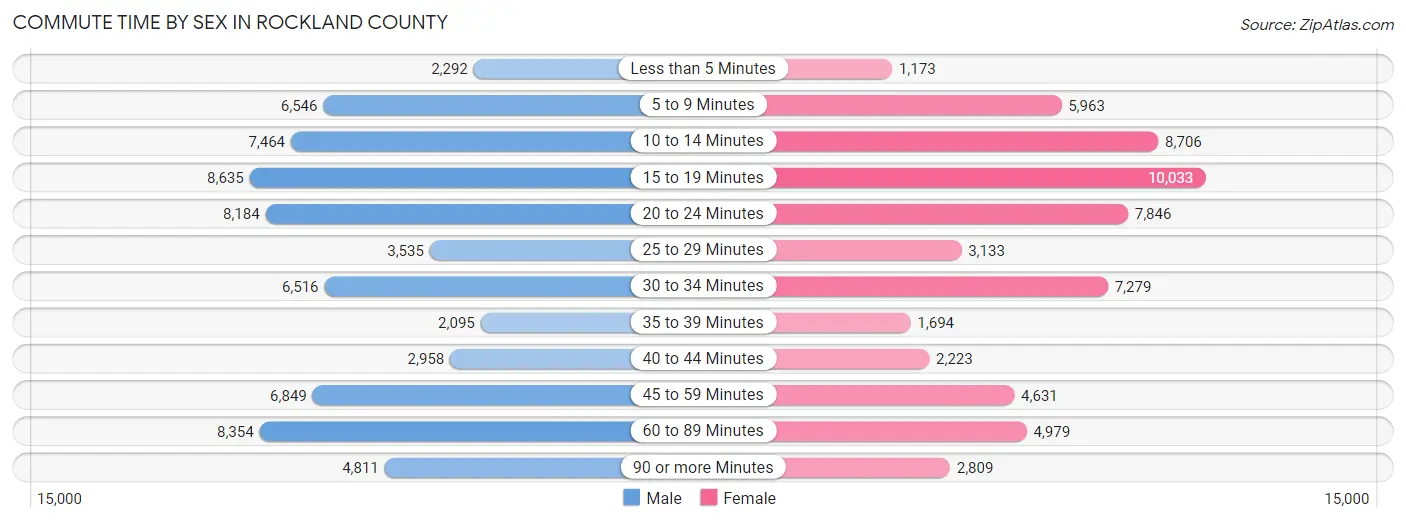
| Commute Time | Male | Female |
| Less than 5 Minutes | 2,292 (3.4%) | 1,173 (1.9%) |
| 5 to 9 Minutes | 6,546 (9.6%) | 5,963 (9.9%) |
| 10 to 14 Minutes | 7,464 (10.9%) | 8,706 (14.4%) |
| 15 to 19 Minutes | 8,635 (12.7%) | 10,033 (16.6%) |
| 20 to 24 Minutes | 8,184 (12.0%) | 7,846 (13.0%) |
| 25 to 29 Minutes | 3,535 (5.2%) | 3,133 (5.2%) |
| 30 to 34 Minutes | 6,516 (9.6%) | 7,279 (12.0%) |
| 35 to 39 Minutes | 2,095 (3.1%) | 1,694 (2.8%) |
| 40 to 44 Minutes | 2,958 (4.3%) | 2,223 (3.7%) |
| 45 to 59 Minutes | 6,849 (10.0%) | 4,631 (7.7%) |
| 60 to 89 Minutes | 8,354 (12.2%) | 4,979 (8.2%) |
| 90 or more Minutes | 4,811 (7.0%) | 2,809 (4.6%) |
Time of Departure to Work by Sex in Rockland County
The most frequent times of departure to work in Rockland County are 7:00 AM to 7:29 AM (8,309, 12.2%) for males and 8:00 AM to 8:29 AM (8,365, 13.8%) for females.
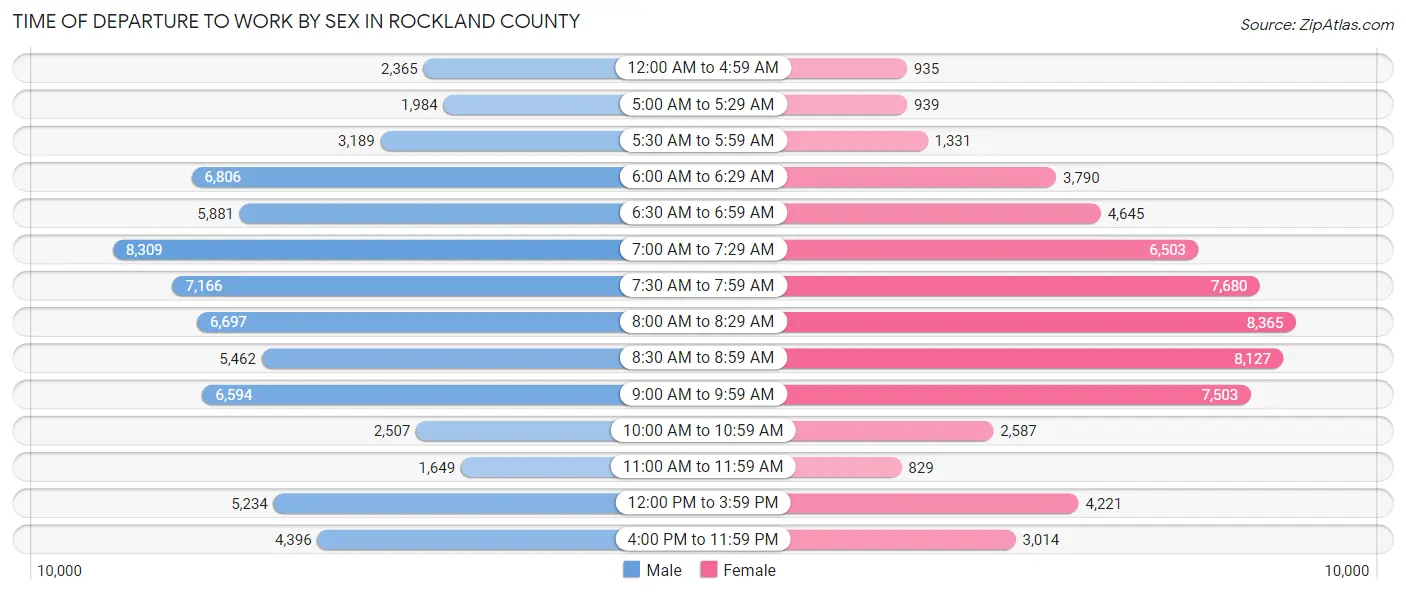
| Time of Departure | Male | Female |
| 12:00 AM to 4:59 AM | 2,365 (3.5%) | 935 (1.5%) |
| 5:00 AM to 5:29 AM | 1,984 (2.9%) | 939 (1.5%) |
| 5:30 AM to 5:59 AM | 3,189 (4.7%) | 1,331 (2.2%) |
| 6:00 AM to 6:29 AM | 6,806 (10.0%) | 3,790 (6.3%) |
| 6:30 AM to 6:59 AM | 5,881 (8.6%) | 4,645 (7.7%) |
| 7:00 AM to 7:29 AM | 8,309 (12.2%) | 6,503 (10.7%) |
| 7:30 AM to 7:59 AM | 7,166 (10.5%) | 7,680 (12.7%) |
| 8:00 AM to 8:29 AM | 6,697 (9.8%) | 8,365 (13.8%) |
| 8:30 AM to 8:59 AM | 5,462 (8.0%) | 8,127 (13.4%) |
| 9:00 AM to 9:59 AM | 6,594 (9.7%) | 7,503 (12.4%) |
| 10:00 AM to 10:59 AM | 2,507 (3.7%) | 2,587 (4.3%) |
| 11:00 AM to 11:59 AM | 1,649 (2.4%) | 829 (1.4%) |
| 12:00 PM to 3:59 PM | 5,234 (7.7%) | 4,221 (7.0%) |
| 4:00 PM to 11:59 PM | 4,396 (6.4%) | 3,014 (5.0%) |
| Total | 68,239 (100.0%) | 60,469 (100.0%) |
Housing Occupancy in Rockland County
Occupancy by Ownership in Rockland County
Of the total 102,579 dwellings in Rockland County, owner-occupied units account for 70,035 (68.3%), while renter-occupied units make up 32,544 (31.7%).
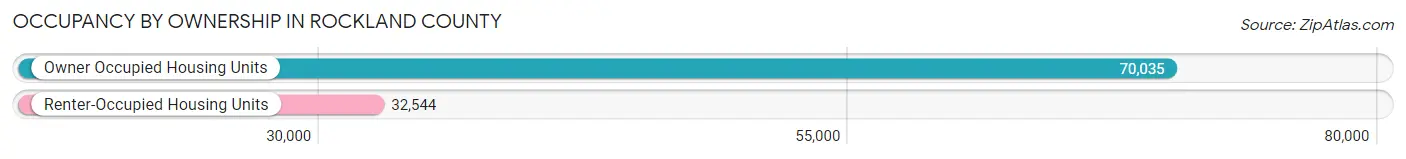
| Occupancy | # Housing Units | % Housing Units |
| Owner Occupied Housing Units | 70,035 | 68.3% |
| Renter-Occupied Housing Units | 32,544 | 31.7% |
| Total Occupied Housing Units | 102,579 | 100.0% |
Occupancy by Household Size in Rockland County
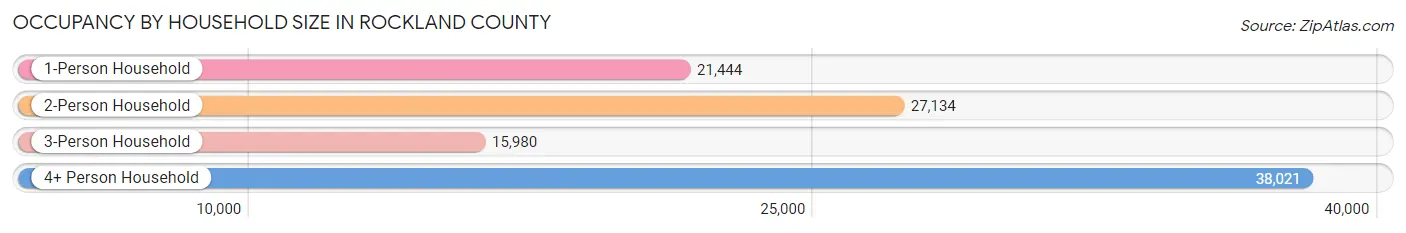
| Household Size | # Housing Units | % Housing Units |
| 1-Person Household | 21,444 | 20.9% |
| 2-Person Household | 27,134 | 26.5% |
| 3-Person Household | 15,980 | 15.6% |
| 4+ Person Household | 38,021 | 37.1% |
| Total Housing Units | 102,579 | 100.0% |
Occupancy by Ownership by Household Size in Rockland County
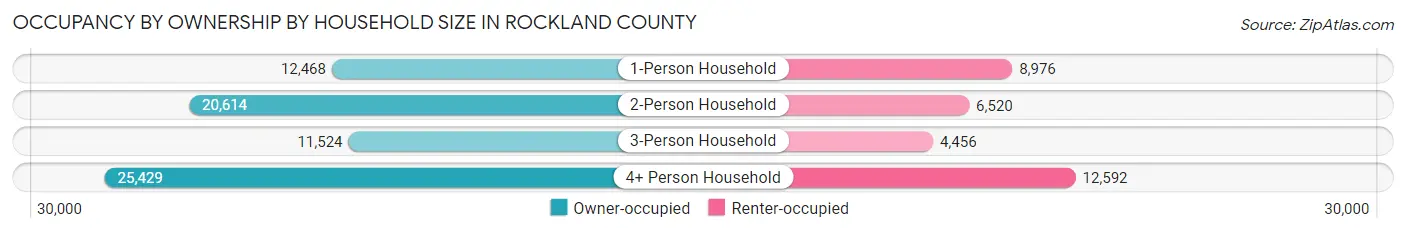
| Household Size | Owner-occupied | Renter-occupied |
| 1-Person Household | 12,468 (58.1%) | 8,976 (41.9%) |
| 2-Person Household | 20,614 (76.0%) | 6,520 (24.0%) |
| 3-Person Household | 11,524 (72.1%) | 4,456 (27.9%) |
| 4+ Person Household | 25,429 (66.9%) | 12,592 (33.1%) |
| Total Housing Units | 70,035 (68.3%) | 32,544 (31.7%) |
Occupancy by Educational Attainment in Rockland County
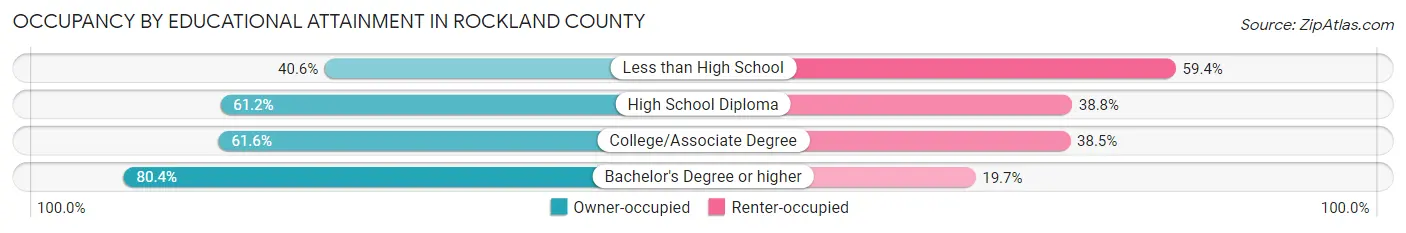
| Household Size | Owner-occupied | Renter-occupied |
| Less than High School | 3,695 (40.6%) | 5,401 (59.4%) |
| High School Diploma | 11,817 (61.2%) | 7,493 (38.8%) |
| College/Associate Degree | 16,616 (61.6%) | 10,380 (38.5%) |
| Bachelor's Degree or higher | 37,907 (80.3%) | 9,270 (19.7%) |
Occupancy by Age of Householder in Rockland County
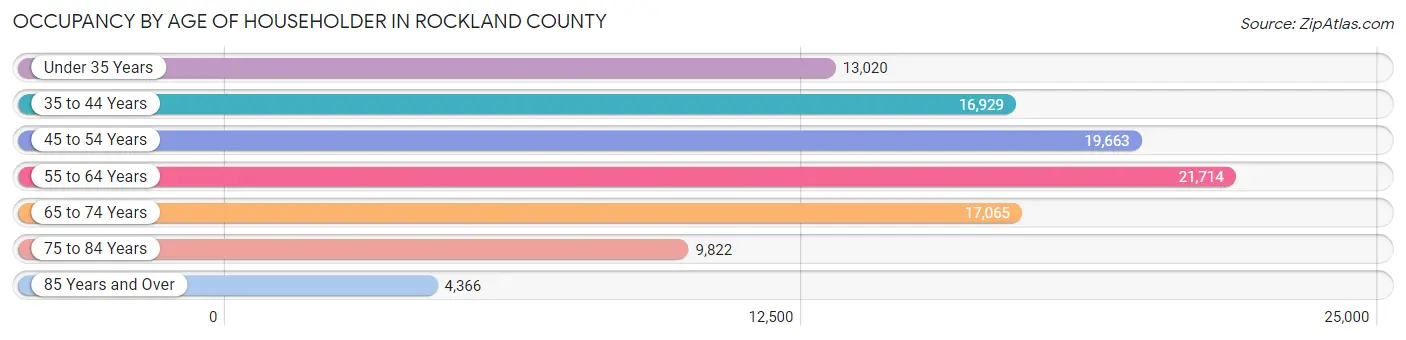
| Age Bracket | # Households | % Households |
| Under 35 Years | 13,020 | 12.7% |
| 35 to 44 Years | 16,929 | 16.5% |
| 45 to 54 Years | 19,663 | 19.2% |
| 55 to 64 Years | 21,714 | 21.2% |
| 65 to 74 Years | 17,065 | 16.6% |
| 75 to 84 Years | 9,822 | 9.6% |
| 85 Years and Over | 4,366 | 4.3% |
| Total | 102,579 | 100.0% |
Housing Finances in Rockland County
Median Income by Occupancy in Rockland County
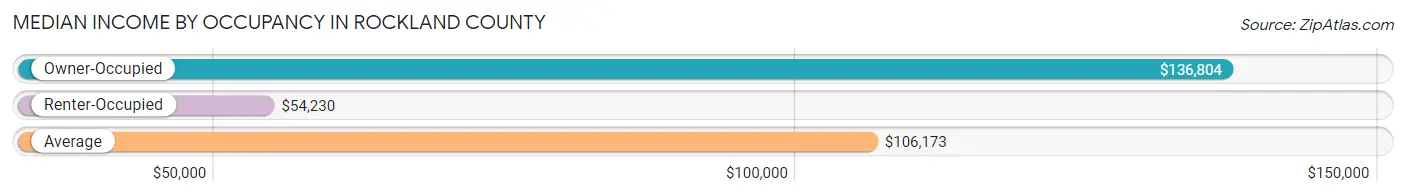
| Occupancy Type | # Households | Median Income |
| Owner-Occupied | 70,035 (68.3%) | $136,804 |
| Renter-Occupied | 32,544 (31.7%) | $54,230 |
| Average | 102,579 (100.0%) | $106,173 |
Occupancy by Householder Income Bracket in Rockland County
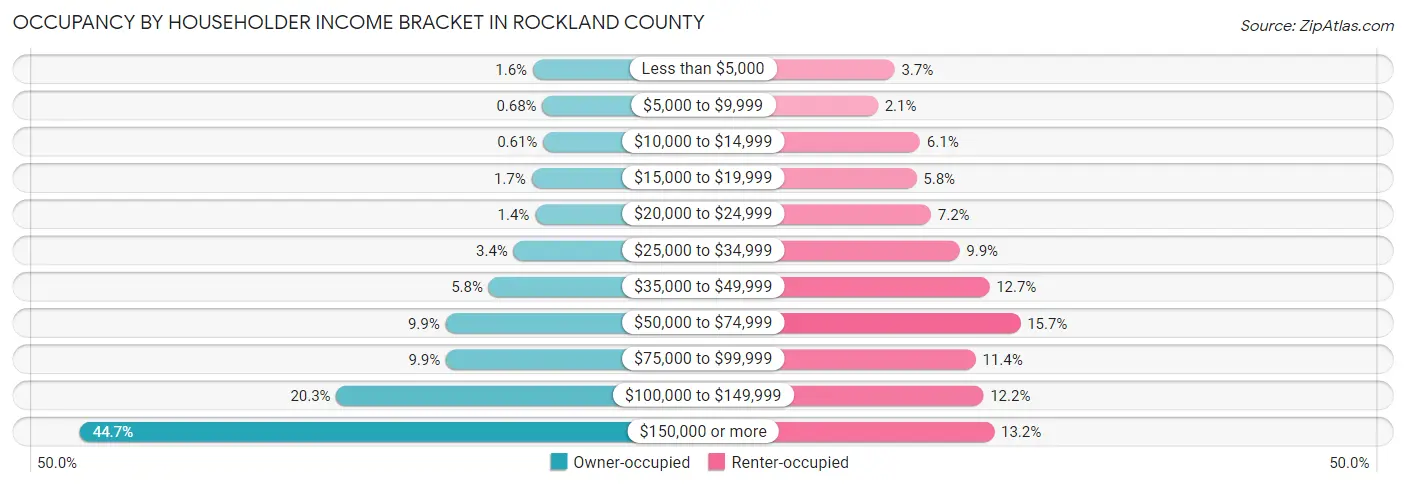
| Income Bracket | Owner-occupied | Renter-occupied |
| Less than $5,000 | 1,117 (1.6%) | 1,206 (3.7%) |
| $5,000 to $9,999 | 475 (0.7%) | 687 (2.1%) |
| $10,000 to $14,999 | 430 (0.6%) | 1,994 (6.1%) |
| $15,000 to $19,999 | 1,205 (1.7%) | 1,883 (5.8%) |
| $20,000 to $24,999 | 958 (1.4%) | 2,335 (7.2%) |
| $25,000 to $34,999 | 2,397 (3.4%) | 3,220 (9.9%) |
| $35,000 to $49,999 | 4,054 (5.8%) | 4,143 (12.7%) |
| $50,000 to $74,999 | 6,940 (9.9%) | 5,104 (15.7%) |
| $75,000 to $99,999 | 6,908 (9.9%) | 3,721 (11.4%) |
| $100,000 to $149,999 | 14,219 (20.3%) | 3,957 (12.2%) |
| $150,000 or more | 31,332 (44.7%) | 4,294 (13.2%) |
| Total | 70,035 (100.0%) | 32,544 (100.0%) |
Monthly Housing Cost Tiers in Rockland County
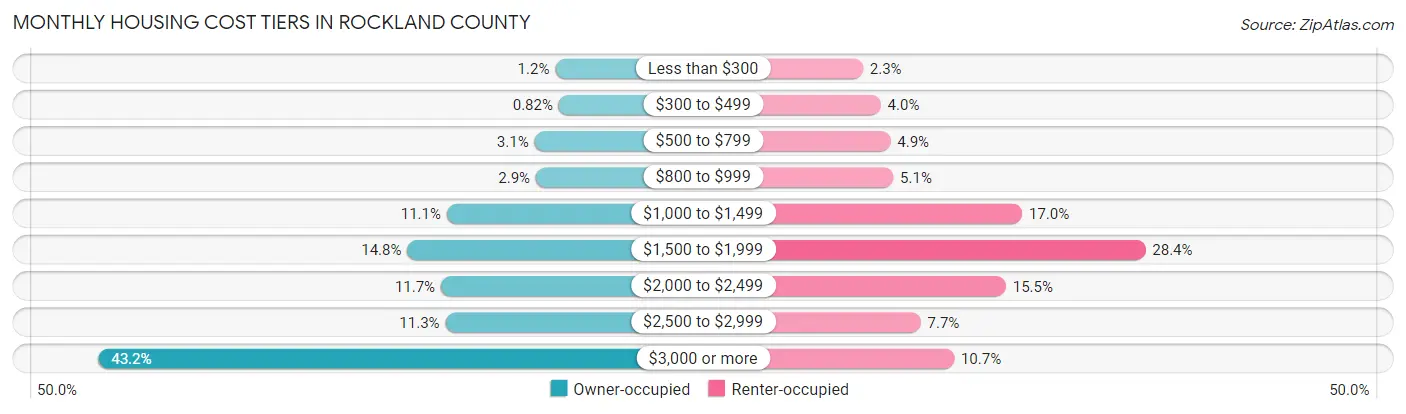
| Monthly Cost | Owner-occupied | Renter-occupied |
| Less than $300 | 803 (1.1%) | 760 (2.3%) |
| $300 to $499 | 575 (0.8%) | 1,294 (4.0%) |
| $500 to $799 | 2,145 (3.1%) | 1,584 (4.9%) |
| $800 to $999 | 2,051 (2.9%) | 1,668 (5.1%) |
| $1,000 to $1,499 | 7,796 (11.1%) | 5,532 (17.0%) |
| $1,500 to $1,999 | 10,344 (14.8%) | 9,225 (28.3%) |
| $2,000 to $2,499 | 8,174 (11.7%) | 5,044 (15.5%) |
| $2,500 to $2,999 | 7,884 (11.3%) | 2,492 (7.7%) |
| $3,000 or more | 30,263 (43.2%) | 3,491 (10.7%) |
| Total | 70,035 (100.0%) | 32,544 (100.0%) |
Physical Housing Characteristics in Rockland County
Housing Structures in Rockland County
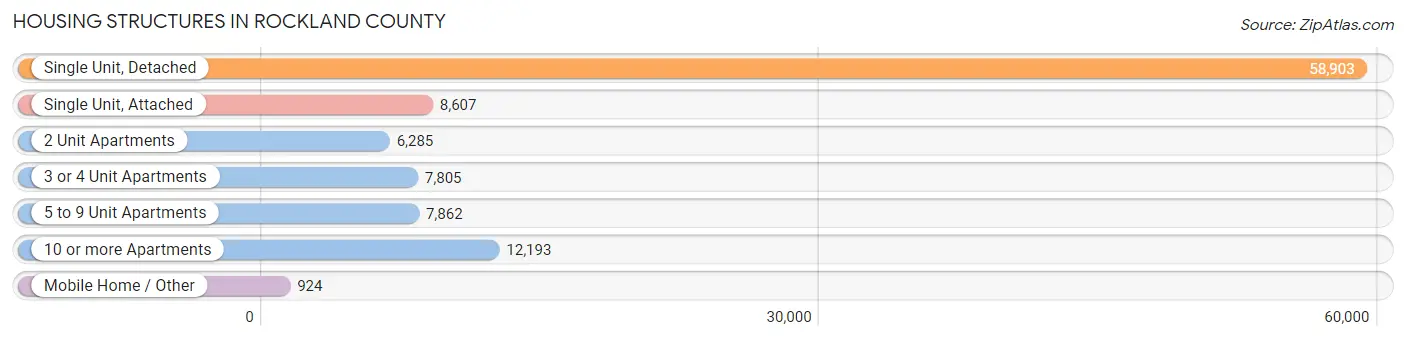
| Structure Type | # Housing Units | % Housing Units |
| Single Unit, Detached | 58,903 | 57.4% |
| Single Unit, Attached | 8,607 | 8.4% |
| 2 Unit Apartments | 6,285 | 6.1% |
| 3 or 4 Unit Apartments | 7,805 | 7.6% |
| 5 to 9 Unit Apartments | 7,862 | 7.7% |
| 10 or more Apartments | 12,193 | 11.9% |
| Mobile Home / Other | 924 | 0.9% |
| Total | 102,579 | 100.0% |
Housing Structures by Occupancy in Rockland County
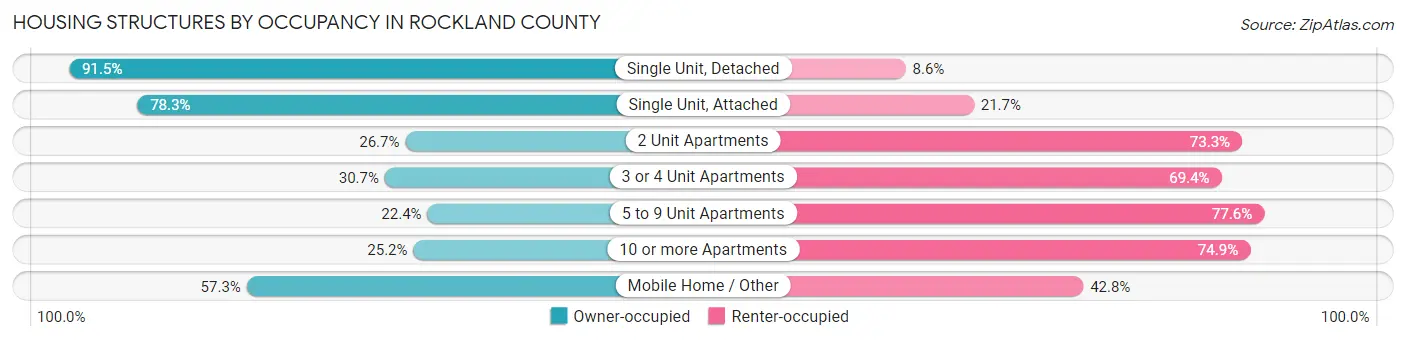
| Structure Type | Owner-occupied | Renter-occupied |
| Single Unit, Detached | 53,865 (91.4%) | 5,038 (8.6%) |
| Single Unit, Attached | 6,740 (78.3%) | 1,867 (21.7%) |
| 2 Unit Apartments | 1,678 (26.7%) | 4,607 (73.3%) |
| 3 or 4 Unit Apartments | 2,392 (30.6%) | 5,413 (69.4%) |
| 5 to 9 Unit Apartments | 1,764 (22.4%) | 6,098 (77.6%) |
| 10 or more Apartments | 3,067 (25.2%) | 9,126 (74.9%) |
| Mobile Home / Other | 529 (57.3%) | 395 (42.7%) |
| Total | 70,035 (68.3%) | 32,544 (31.7%) |
Housing Structures by Number of Rooms in Rockland County
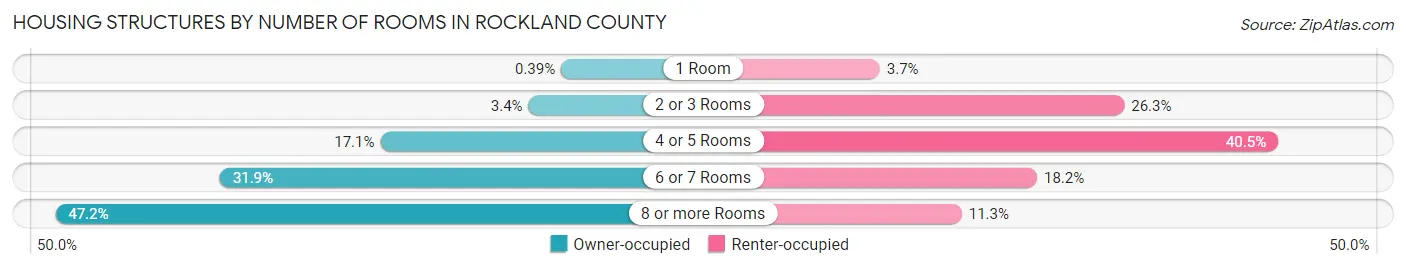
| Number of Rooms | Owner-occupied | Renter-occupied |
| 1 Room | 274 (0.4%) | 1,201 (3.7%) |
| 2 or 3 Rooms | 2,380 (3.4%) | 8,558 (26.3%) |
| 4 or 5 Rooms | 11,978 (17.1%) | 13,185 (40.5%) |
| 6 or 7 Rooms | 22,371 (31.9%) | 5,932 (18.2%) |
| 8 or more Rooms | 33,032 (47.2%) | 3,668 (11.3%) |
| Total | 70,035 (100.0%) | 32,544 (100.0%) |
Housing Structure by Heating Type in Rockland County
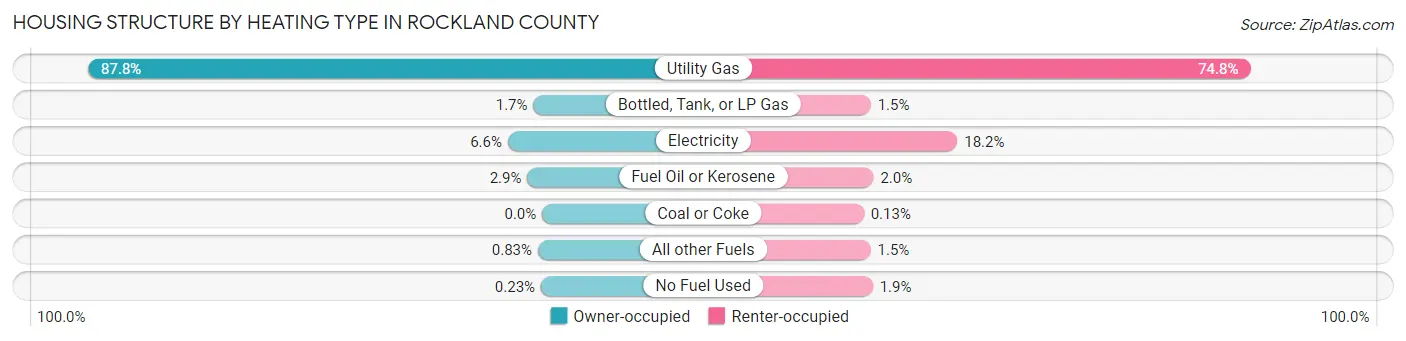
| Heating Type | Owner-occupied | Renter-occupied |
| Utility Gas | 61,465 (87.8%) | 24,346 (74.8%) |
| Bottled, Tank, or LP Gas | 1,185 (1.7%) | 483 (1.5%) |
| Electricity | 4,641 (6.6%) | 5,931 (18.2%) |
| Fuel Oil or Kerosene | 2,003 (2.9%) | 657 (2.0%) |
| Coal or Coke | 0 (0.0%) | 43 (0.1%) |
| All other Fuels | 583 (0.8%) | 476 (1.5%) |
| No Fuel Used | 158 (0.2%) | 608 (1.9%) |
| Total | 70,035 (100.0%) | 32,544 (100.0%) |
Household Vehicle Usage in Rockland County
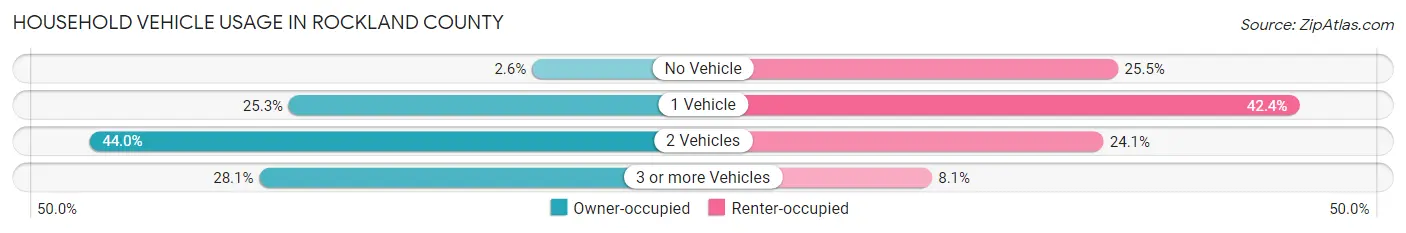
| Vehicles per Household | Owner-occupied | Renter-occupied |
| No Vehicle | 1,843 (2.6%) | 8,285 (25.5%) |
| 1 Vehicle | 17,737 (25.3%) | 13,799 (42.4%) |
| 2 Vehicles | 30,785 (44.0%) | 7,836 (24.1%) |
| 3 or more Vehicles | 19,670 (28.1%) | 2,624 (8.1%) |
| Total | 70,035 (100.0%) | 32,544 (100.0%) |
Real Estate & Mortgages in Rockland County
Real Estate and Mortgage Overview in Rockland County
| Characteristic | Without Mortgage | With Mortgage |
| Housing Units | 26,041 | 43,994 |
| Median Property Value | $503,500 | $541,900 |
| Median Household Income | $104,561 | $22,936 |
| Monthly Housing Costs | $1,501 | $28,927 |
| Real Estate Taxes | $10,001 | $918 |
Property Value by Mortgage Status in Rockland County
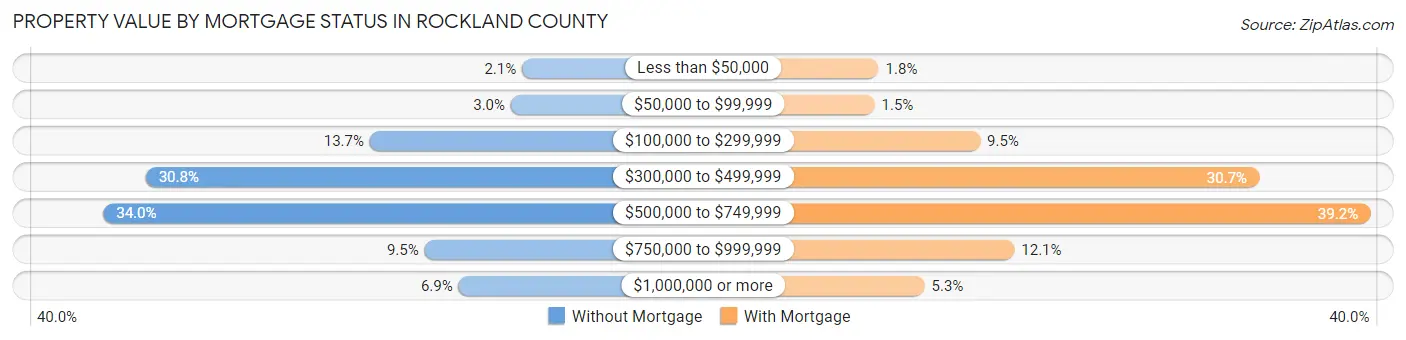
| Property Value | Without Mortgage | With Mortgage |
| Less than $50,000 | 546 (2.1%) | 775 (1.8%) |
| $50,000 to $99,999 | 769 (2.9%) | 639 (1.5%) |
| $100,000 to $299,999 | 3,567 (13.7%) | 4,177 (9.5%) |
| $300,000 to $499,999 | 8,013 (30.8%) | 13,518 (30.7%) |
| $500,000 to $749,999 | 8,855 (34.0%) | 17,246 (39.2%) |
| $750,000 to $999,999 | 2,483 (9.5%) | 5,325 (12.1%) |
| $1,000,000 or more | 1,808 (6.9%) | 2,314 (5.3%) |
| Total | 26,041 (100.0%) | 43,994 (100.0%) |
Household Income by Mortgage Status in Rockland County
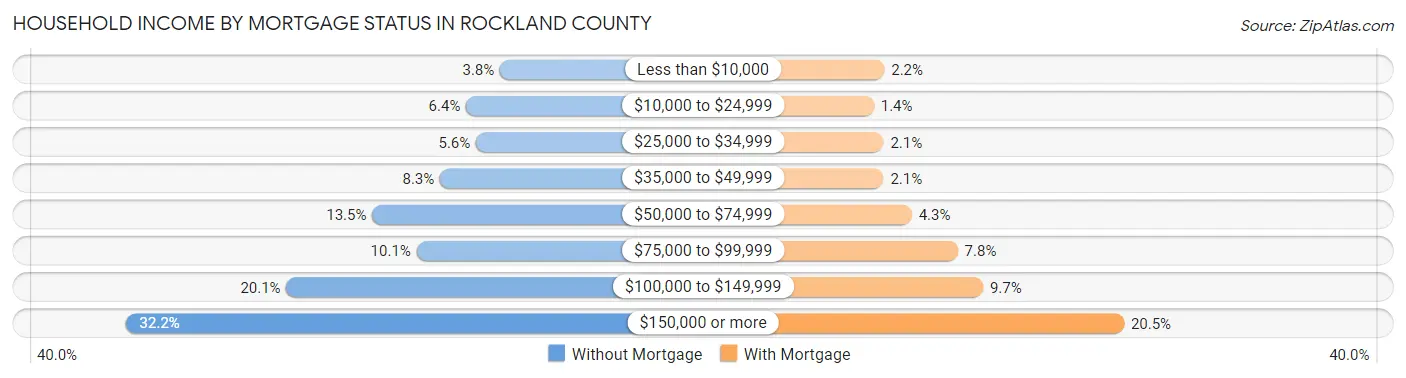
| Household Income | Without Mortgage | With Mortgage |
| Less than $10,000 | 981 (3.8%) | 964 (2.2%) |
| $10,000 to $24,999 | 1,654 (6.4%) | 611 (1.4%) |
| $25,000 to $34,999 | 1,459 (5.6%) | 939 (2.1%) |
| $35,000 to $49,999 | 2,173 (8.3%) | 938 (2.1%) |
| $50,000 to $74,999 | 3,519 (13.5%) | 1,881 (4.3%) |
| $75,000 to $99,999 | 2,637 (10.1%) | 3,421 (7.8%) |
| $100,000 to $149,999 | 5,222 (20.1%) | 4,271 (9.7%) |
| $150,000 or more | 8,396 (32.2%) | 8,997 (20.4%) |
| Total | 26,041 (100.0%) | 43,994 (100.0%) |
Property Value to Household Income Ratio in Rockland County
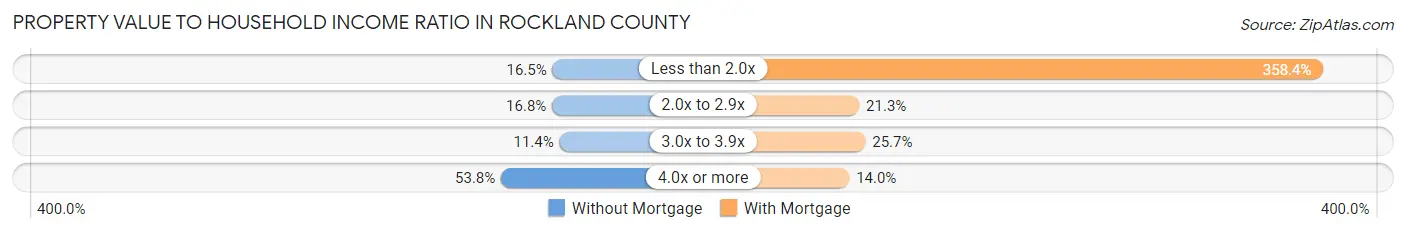
| Value-to-Income Ratio | Without Mortgage | With Mortgage |
| Less than 2.0x | 4,285 (16.5%) | 157,657 (358.4%) |
| 2.0x to 2.9x | 4,365 (16.8%) | 9,348 (21.2%) |
| 3.0x to 3.9x | 2,970 (11.4%) | 11,300 (25.7%) |
| 4.0x or more | 14,016 (53.8%) | 6,161 (14.0%) |
| Total | 26,041 (100.0%) | 43,994 (100.0%) |
Real Estate Taxes by Mortgage Status in Rockland County
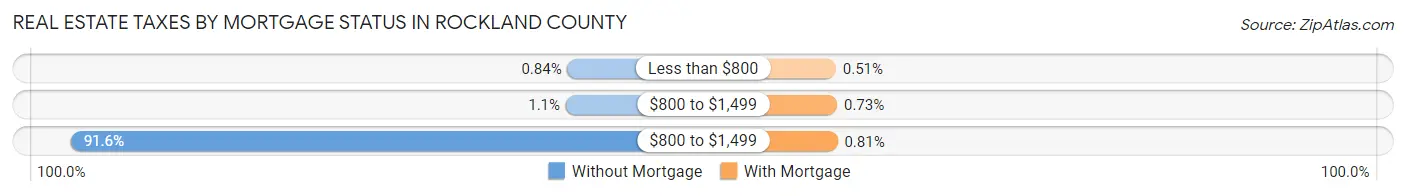
| Property Taxes | Without Mortgage | With Mortgage |
| Less than $800 | 218 (0.8%) | 226 (0.5%) |
| $800 to $1,499 | 298 (1.1%) | 321 (0.7%) |
| $800 to $1,499 | 23,847 (91.6%) | 356 (0.8%) |
| Total | 26,041 (100.0%) | 43,994 (100.0%) |
Health & Disability in Rockland County
Health Insurance Coverage by Age in Rockland County
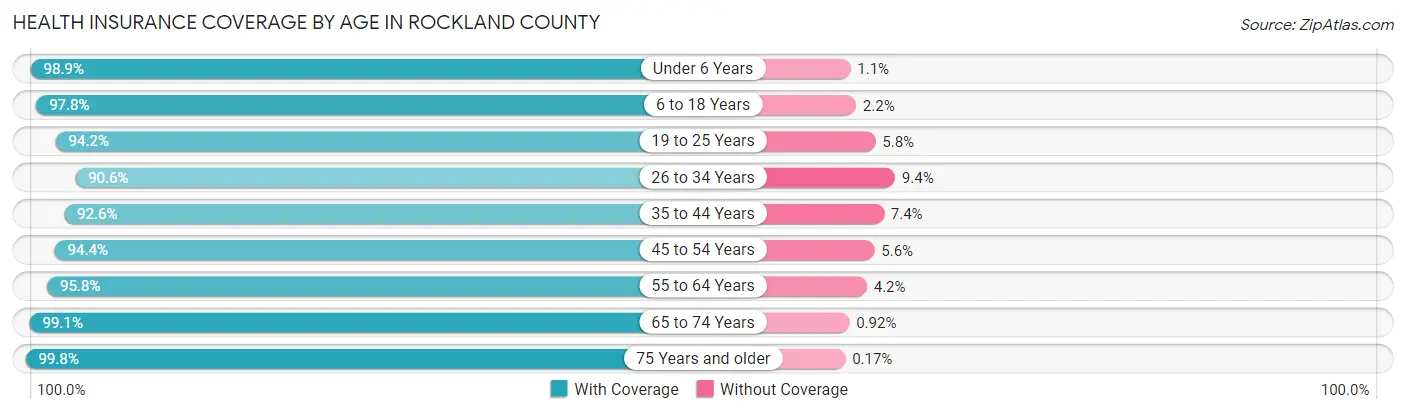
| Age Bracket | With Coverage | Without Coverage |
| Under 6 Years | 32,514 (98.9%) | 373 (1.1%) |
| 6 to 18 Years | 67,826 (97.8%) | 1,505 (2.2%) |
| 19 to 25 Years | 28,956 (94.2%) | 1,780 (5.8%) |
| 26 to 34 Years | 30,938 (90.6%) | 3,224 (9.4%) |
| 35 to 44 Years | 35,027 (92.6%) | 2,790 (7.4%) |
| 45 to 54 Years | 36,705 (94.4%) | 2,181 (5.6%) |
| 55 to 64 Years | 38,378 (95.8%) | 1,678 (4.2%) |
| 65 to 74 Years | 28,110 (99.1%) | 262 (0.9%) |
| 75 Years and older | 23,346 (99.8%) | 40 (0.2%) |
| Total | 321,800 (95.9%) | 13,833 (4.1%) |
Health Insurance Coverage by Citizenship Status in Rockland County
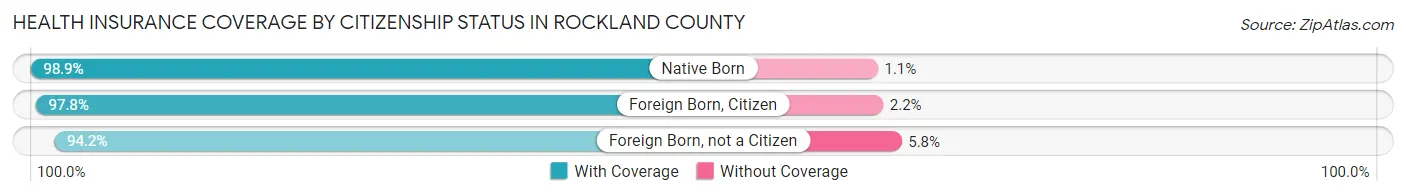
| Citizenship Status | With Coverage | Without Coverage |
| Native Born | 32,514 (98.9%) | 373 (1.1%) |
| Foreign Born, Citizen | 67,826 (97.8%) | 1,505 (2.2%) |
| Foreign Born, not a Citizen | 28,956 (94.2%) | 1,780 (5.8%) |
Health Insurance Coverage by Household Income in Rockland County
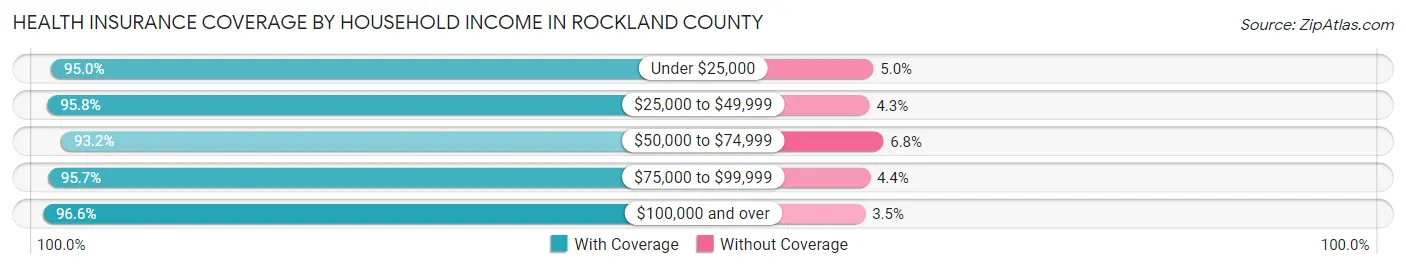
| Household Income | With Coverage | Without Coverage |
| Under $25,000 | 30,569 (95.0%) | 1,599 (5.0%) |
| $25,000 to $49,999 | 40,412 (95.8%) | 1,792 (4.3%) |
| $50,000 to $74,999 | 32,603 (93.2%) | 2,394 (6.8%) |
| $75,000 to $99,999 | 30,712 (95.7%) | 1,398 (4.3%) |
| $100,000 and over | 182,358 (96.6%) | 6,516 (3.5%) |
Public vs Private Health Insurance Coverage by Age in Rockland County
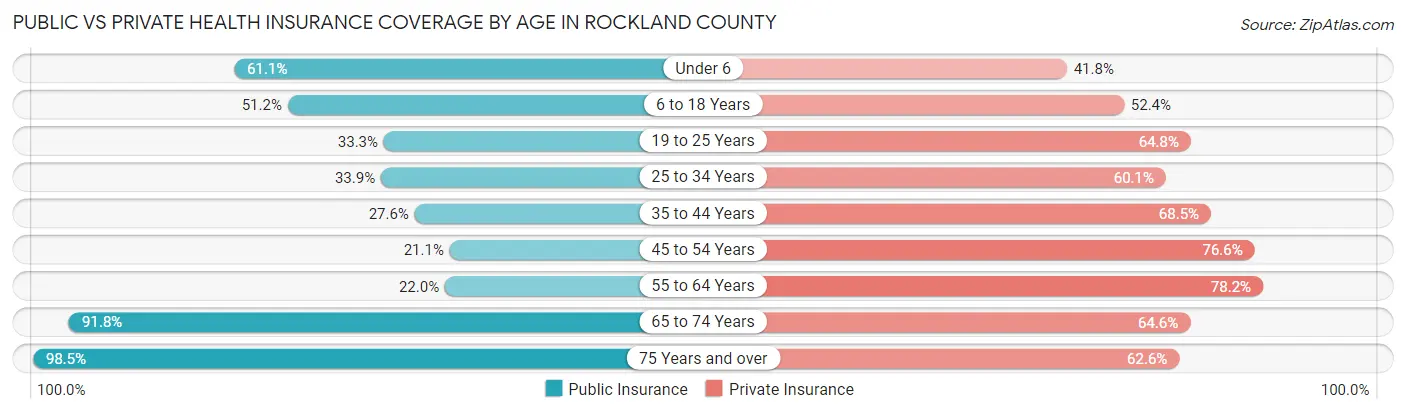
| Age Bracket | Public Insurance | Private Insurance |
| Under 6 | 20,103 (61.1%) | 13,731 (41.7%) |
| 6 to 18 Years | 35,473 (51.2%) | 36,301 (52.4%) |
| 19 to 25 Years | 10,240 (33.3%) | 19,912 (64.8%) |
| 25 to 34 Years | 11,564 (33.9%) | 20,541 (60.1%) |
| 35 to 44 Years | 10,433 (27.6%) | 25,908 (68.5%) |
| 45 to 54 Years | 8,201 (21.1%) | 29,790 (76.6%) |
| 55 to 64 Years | 8,800 (22.0%) | 31,306 (78.2%) |
| 65 to 74 Years | 26,037 (91.8%) | 18,339 (64.6%) |
| 75 Years and over | 23,030 (98.5%) | 14,643 (62.6%) |
| Total | 153,881 (45.9%) | 210,471 (62.7%) |
Disability Status by Sex by Age in Rockland County
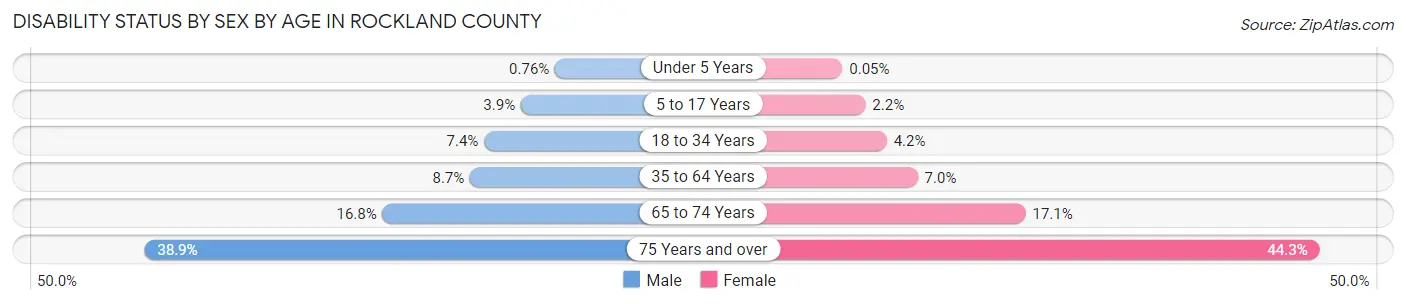
| Age Bracket | Male | Female |
| Under 5 Years | 108 (0.8%) | 7 (0.1%) |
| 5 to 17 Years | 1,393 (3.9%) | 739 (2.2%) |
| 18 to 34 Years | 2,637 (7.3%) | 1,423 (4.2%) |
| 35 to 64 Years | 5,022 (8.6%) | 4,135 (7.0%) |
| 65 to 74 Years | 2,213 (16.8%) | 2,589 (17.1%) |
| 75 Years and over | 3,580 (38.9%) | 6,285 (44.3%) |
Disability Class by Sex by Age in Rockland County
Disability Class: Hearing Difficulty
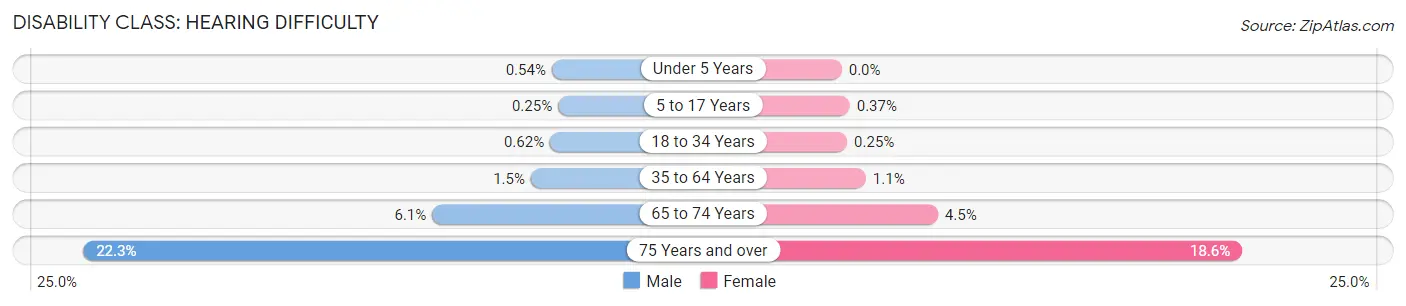
| Age Bracket | Male | Female |
| Under 5 Years | 77 (0.5%) | 0 (0.0%) |
| 5 to 17 Years | 90 (0.3%) | 126 (0.4%) |
| 18 to 34 Years | 221 (0.6%) | 85 (0.3%) |
| 35 to 64 Years | 876 (1.5%) | 658 (1.1%) |
| 65 to 74 Years | 803 (6.1%) | 677 (4.5%) |
| 75 Years and over | 2,052 (22.3%) | 2,633 (18.6%) |
Disability Class: Vision Difficulty
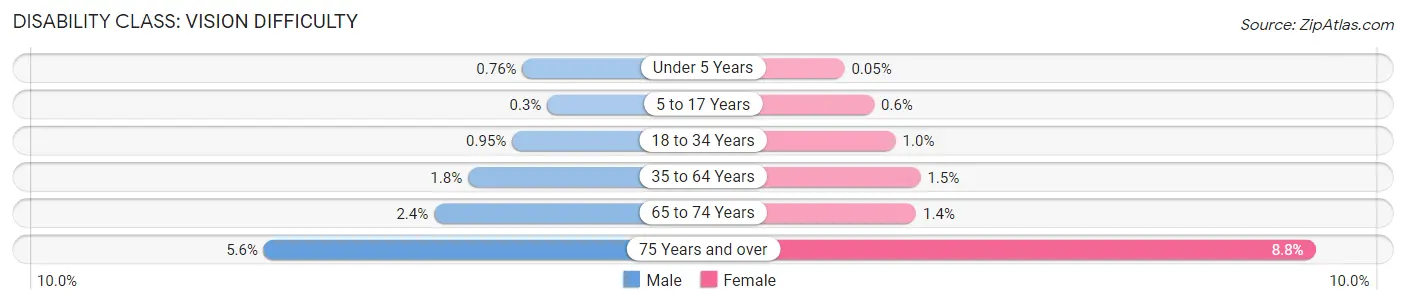
| Age Bracket | Male | Female |
| Under 5 Years | 108 (0.8%) | 7 (0.1%) |
| 5 to 17 Years | 106 (0.3%) | 203 (0.6%) |
| 18 to 34 Years | 340 (0.9%) | 341 (1.0%) |
| 35 to 64 Years | 1,030 (1.8%) | 858 (1.5%) |
| 65 to 74 Years | 317 (2.4%) | 210 (1.4%) |
| 75 Years and over | 512 (5.6%) | 1,246 (8.8%) |
Disability Class: Cognitive Difficulty
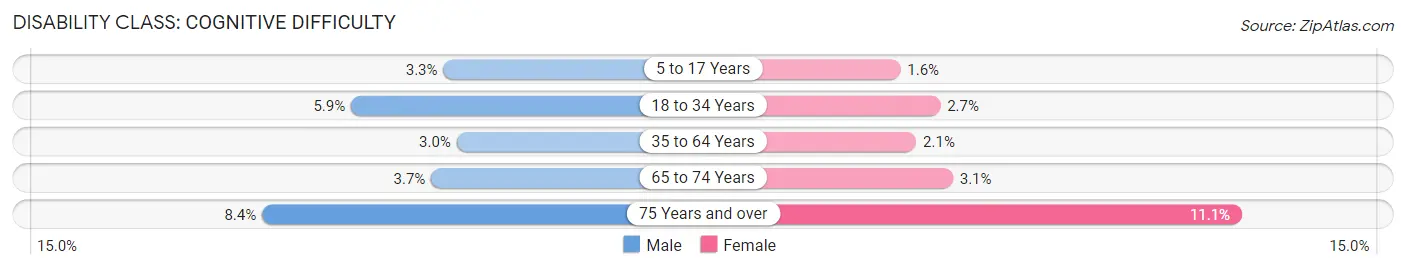
| Age Bracket | Male | Female |
| 5 to 17 Years | 1,183 (3.3%) | 552 (1.6%) |
| 18 to 34 Years | 2,120 (5.9%) | 935 (2.7%) |
| 35 to 64 Years | 1,726 (3.0%) | 1,216 (2.1%) |
| 65 to 74 Years | 485 (3.7%) | 470 (3.1%) |
| 75 Years and over | 773 (8.4%) | 1,580 (11.1%) |
Disability Class: Ambulatory Difficulty
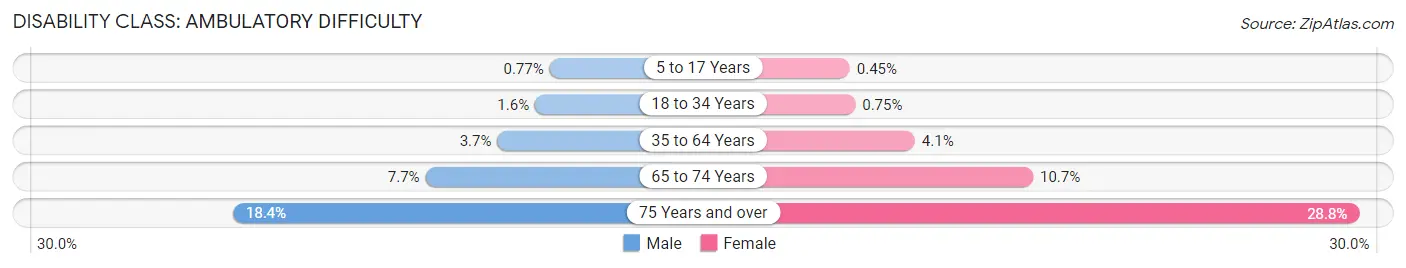
| Age Bracket | Male | Female |
| 5 to 17 Years | 274 (0.8%) | 151 (0.4%) |
| 18 to 34 Years | 567 (1.6%) | 257 (0.7%) |
| 35 to 64 Years | 2,137 (3.7%) | 2,386 (4.1%) |
| 65 to 74 Years | 1,013 (7.7%) | 1,618 (10.6%) |
| 75 Years and over | 1,694 (18.4%) | 4,084 (28.8%) |
Disability Class: Self-Care Difficulty
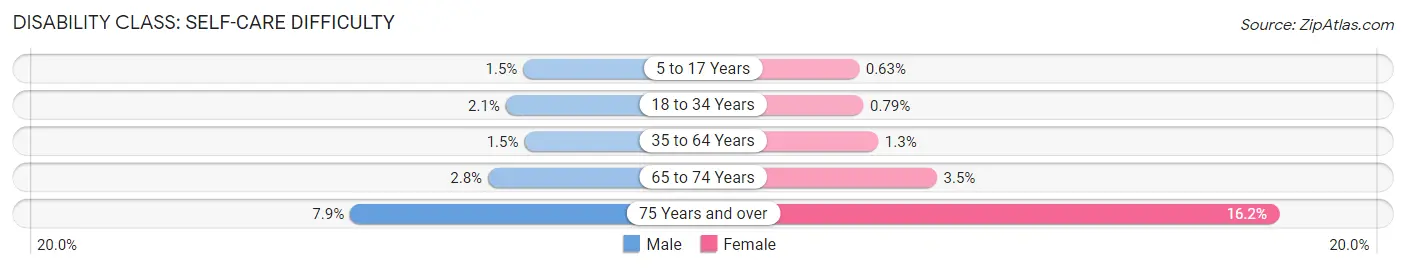
| Age Bracket | Male | Female |
| 5 to 17 Years | 526 (1.5%) | 214 (0.6%) |
| 18 to 34 Years | 767 (2.1%) | 268 (0.8%) |
| 35 to 64 Years | 840 (1.5%) | 787 (1.3%) |
| 65 to 74 Years | 369 (2.8%) | 534 (3.5%) |
| 75 Years and over | 729 (7.9%) | 2,299 (16.2%) |
Technology Access in Rockland County
Computing Device Access in Rockland County
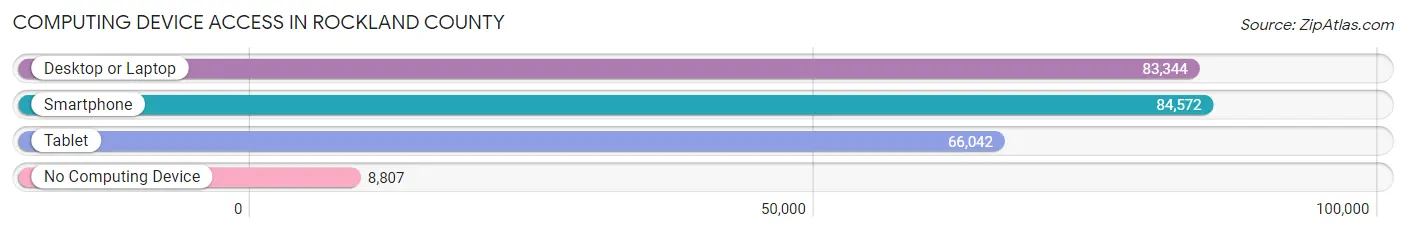
| Device Type | # Households | % Households |
| Desktop or Laptop | 83,344 | 81.2% |
| Smartphone | 84,572 | 82.5% |
| Tablet | 66,042 | 64.4% |
| No Computing Device | 8,807 | 8.6% |
| Total | 102,579 | 100.0% |
Internet Access in Rockland County
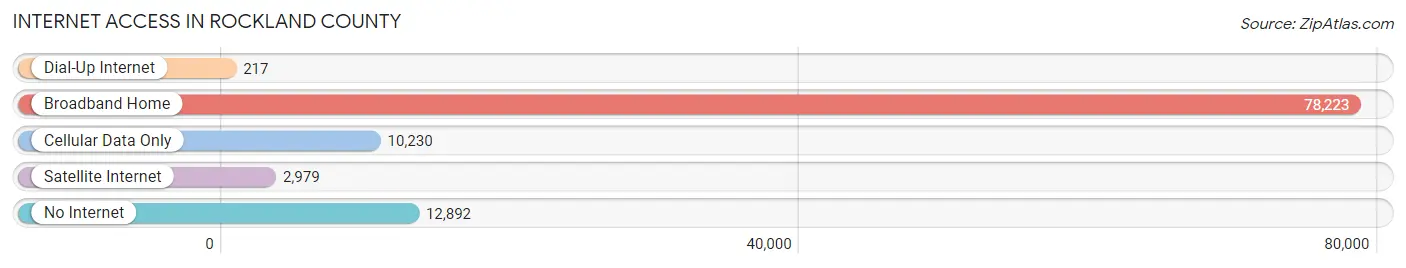
| Internet Type | # Households | % Households |
| Dial-Up Internet | 217 | 0.2% |
| Broadband Home | 78,223 | 76.3% |
| Cellular Data Only | 10,230 | 10.0% |
| Satellite Internet | 2,979 | 2.9% |
| No Internet | 12,892 | 12.6% |
| Total | 102,579 | 100.0% |
Rockland County Summary
Rockland County is a county located in the U.S. state of New York. It is part of the New York City metropolitan area and is located just north of the city of New York. The county has an estimated population of 311,687 as of 2019, making it the third-most populous county in the state of New York.
History
Rockland County was originally part of Orange County, which was established in 1683. In 1798, Rockland County was created from the southern part of Orange County. The county was named after the rocky terrain of the area.
The county was originally inhabited by the Munsee people, a branch of the Lenape Native Americans. The first European settlers arrived in the area in the late 17th century. The county was part of the Province of New York until the American Revolution. After the war, the county was part of the newly formed state of New York.
In the 19th century, the county experienced rapid growth due to the construction of the Erie Canal and the New York and Erie Railroad. The county also became a popular destination for vacationers from New York City.
Geography
Rockland County is located in the southeastern part of New York State, just north of New York City. It is bordered by Orange County to the south, Westchester County to the east, and Bergen County, New Jersey to the west. The county covers an area of 199 square miles and has a population density of 1,567 people per square mile.
The county is mostly hilly and is located in the Hudson Valley region. The highest point in the county is High Tor, which has an elevation of 1,255 feet. The county is home to several rivers, including the Hudson River, the Ramapo River, and the Hackensack River.
Economy
Rockland County has a diverse economy that is largely driven by the service sector. The county is home to several large companies, including IBM, PepsiCo, and Pfizer. The county is also home to several major shopping malls, including the Palisades Center and the Shops at Nanuet.
The county is also home to several colleges and universities, including Rockland Community College, St. Thomas Aquinas College, and Dominican College.
Demographics
As of the 2010 census, Rockland County had a population of 311,687. The racial makeup of the county was 68.3% White, 16.3% African American, 8.3% Hispanic or Latino, and 6.1% Asian.
The median household income in the county was $87,811, and the median family income was $103,817. The per capita income was $41,945. The poverty rate was 8.2%.
Conclusion
Rockland County is a diverse and vibrant county located in the southeastern part of New York State. The county has a rich history and a diverse economy that is largely driven by the service sector. The county is home to several large companies, shopping malls, and colleges and universities. The population of the county is 311,687, and the median household income is $87,811.
Common Questions
What is Per Capita Income in Rockland County?
Per Capita income in Rockland County is $44,212.
What is the Median Family Income in Rockland County?
Median Family Income in Rockland County is $125,645.
What is the Median Household income in Rockland County?
Median Household Income in Rockland County is $106,173.
What is Income or Wage Gap in Rockland County?
Income or Wage Gap in Rockland County is 30.3%.
Women in Rockland County earn 69.7 cents for every dollar earned by a man.
What is Family Income Deficit in Rockland County?
Family Income Deficit in Rockland County is $14,315.
Families that are below poverty line in Rockland County earn $14,315 less on average than the poverty threshold level.
What is Inequality or Gini Index in Rockland County?
Inequality or Gini Index in Rockland County is 0.47.
What is the Total Population of Rockland County?
Total Population of Rockland County is 337,326.
What is the Total Male Population of Rockland County?
Total Male Population of Rockland County is 166,981.
What is the Total Female Population of Rockland County?
Total Female Population of Rockland County is 170,345.
What is the Ratio of Males per 100 Females in Rockland County?
There are 98.03 Males per 100 Females in Rockland County.
What is the Ratio of Females per 100 Males in Rockland County?
There are 102.01 Females per 100 Males in Rockland County.
What is the Median Population Age in Rockland County?
Median Population Age in Rockland County is 35.3 Years.
What is the Average Family Size in Rockland County
Average Family Size in Rockland County is 3.8 People.
What is the Average Household Size in Rockland County
Average Household Size in Rockland County is 3.2 People.
How Large is the Labor Force in Rockland County?
There are 158,417 People in the Labor Forcein in Rockland County.
What is the Percentage of People in the Labor Force in Rockland County?
63.2% of People are in the Labor Force in Rockland County.
What is the Unemployment Rate in Rockland County?
Unemployment Rate in Rockland County is 6.2%.