Putnam County, NY Map & Demographics
Putnam County Map
Putnam County Overview
$53,105
PER CAPITA INCOME
$137,946
AVG FAMILY INCOME
$120,970
AVG HOUSEHOLD INCOME
31.3%
WAGE / INCOME GAP [ % ]
68.7¢/ $1
WAGE / INCOME GAP [ $ ]
$9,339
FAMILY INCOME DEFICIT
0.42
INEQUALITY / GINI INDEX
97,942
TOTAL POPULATION
49,280
MALE POPULATION
48,662
FEMALE POPULATION
101.27
MALES / 100 FEMALES
98.75
FEMALES / 100 MALES
44.1
MEDIAN AGE
3.1
AVG FAMILY SIZE
2.7
AVG HOUSEHOLD SIZE
52,534
LABOR FORCE [ PEOPLE ]
64.7%
PERCENT IN LABOR FORCE
4.4%
UNEMPLOYMENT RATE
Income in Putnam County
Income Overview in Putnam County
Per Capita Income in Putnam County is $53,105, while median incomes of families and households are $137,946 and $120,970 respectively.
| Characteristic | Number | Measure |
| Per Capita Income | 97,942 | $53,105 |
| Median Family Income | 26,324 | $137,946 |
| Mean Family Income | 26,324 | $163,221 |
| Median Household Income | 34,903 | $120,970 |
| Mean Household Income | 34,903 | $145,465 |
| Income Deficit | 26,324 | $9,339 |
| Wage / Income Gap (%) | 97,942 | 31.28% |
| Wage / Income Gap ($) | 97,942 | 68.72¢ per $1 |
| Gini / Inequality Index | 97,942 | 0.42 |
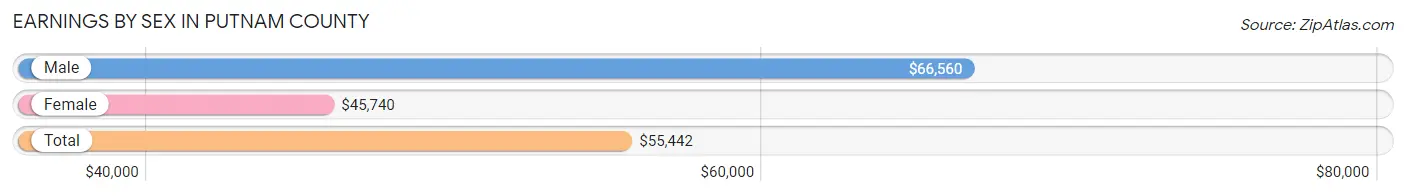
Earnings by Sex in Putnam County
Average Earnings in Putnam County are $55,442, $66,560 for men and $45,740 for women, a difference of 31.3%.
| Sex | Number | Average Earnings |
| Male | 29,506 (53.4%) | $66,560 |
| Female | 25,760 (46.6%) | $45,740 |
| Total | 55,266 (100.0%) | $55,442 |
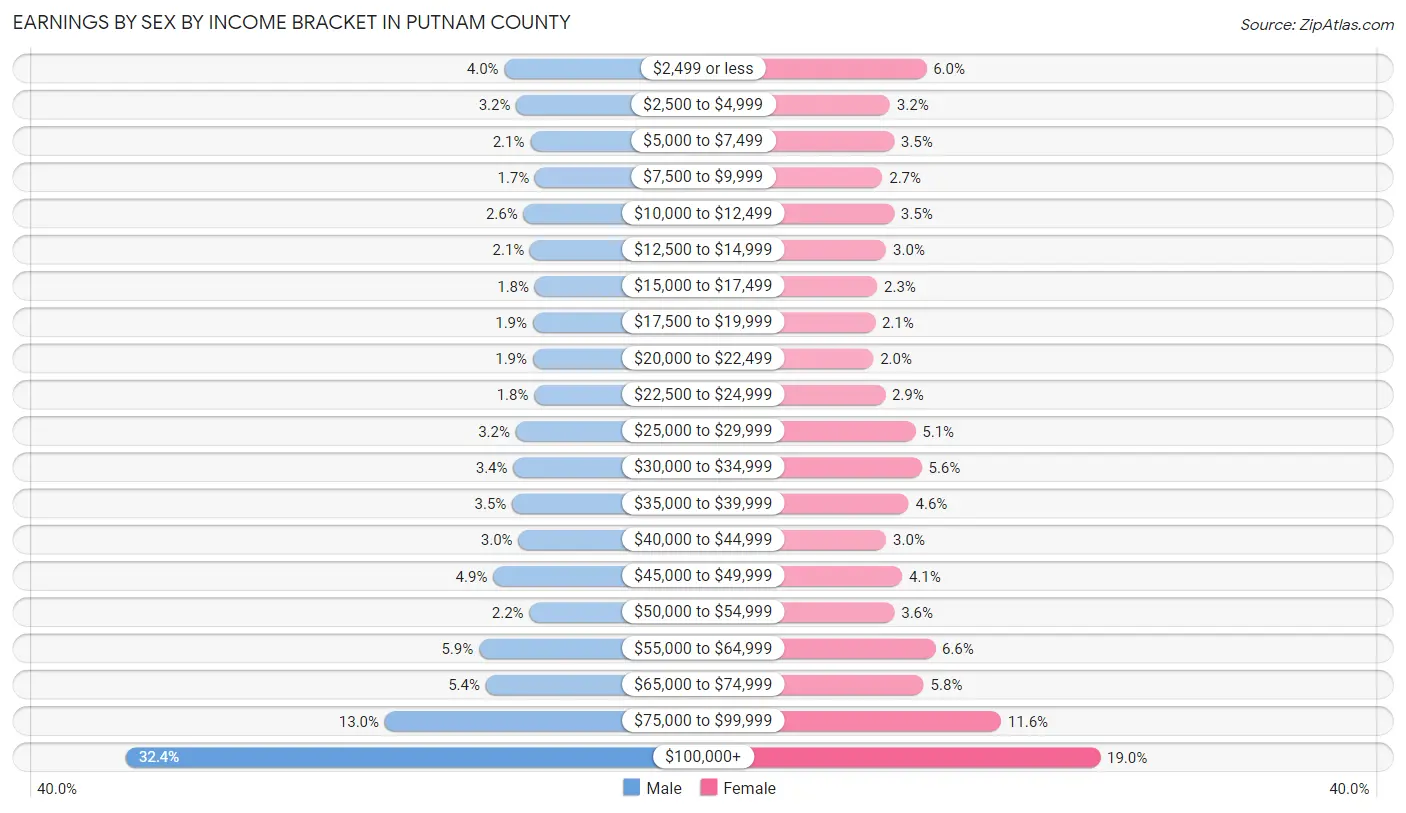
Earnings by Sex by Income Bracket in Putnam County
The most common earnings brackets in Putnam County are $100,000+ for men (9,564 | 32.4%) and $100,000+ for women (4,890 | 19.0%).
| Income | Male | Female |
| $2,499 or less | 1,193 (4.0%) | 1,534 (5.9%) |
| $2,500 to $4,999 | 929 (3.2%) | 832 (3.2%) |
| $5,000 to $7,499 | 619 (2.1%) | 909 (3.5%) |
| $7,500 to $9,999 | 513 (1.7%) | 684 (2.7%) |
| $10,000 to $12,499 | 770 (2.6%) | 910 (3.5%) |
| $12,500 to $14,999 | 622 (2.1%) | 760 (2.9%) |
| $15,000 to $17,499 | 520 (1.8%) | 586 (2.3%) |
| $17,500 to $19,999 | 564 (1.9%) | 543 (2.1%) |
| $20,000 to $22,499 | 564 (1.9%) | 511 (2.0%) |
| $22,500 to $24,999 | 532 (1.8%) | 736 (2.9%) |
| $25,000 to $29,999 | 942 (3.2%) | 1,323 (5.1%) |
| $30,000 to $34,999 | 993 (3.4%) | 1,443 (5.6%) |
| $35,000 to $39,999 | 1,020 (3.5%) | 1,193 (4.6%) |
| $40,000 to $44,999 | 883 (3.0%) | 761 (2.9%) |
| $45,000 to $49,999 | 1,441 (4.9%) | 1,067 (4.1%) |
| $50,000 to $54,999 | 640 (2.2%) | 916 (3.6%) |
| $55,000 to $64,999 | 1,754 (5.9%) | 1,703 (6.6%) |
| $65,000 to $74,999 | 1,606 (5.4%) | 1,485 (5.8%) |
| $75,000 to $99,999 | 3,837 (13.0%) | 2,974 (11.6%) |
| $100,000+ | 9,564 (32.4%) | 4,890 (19.0%) |
| Total | 29,506 (100.0%) | 25,760 (100.0%) |
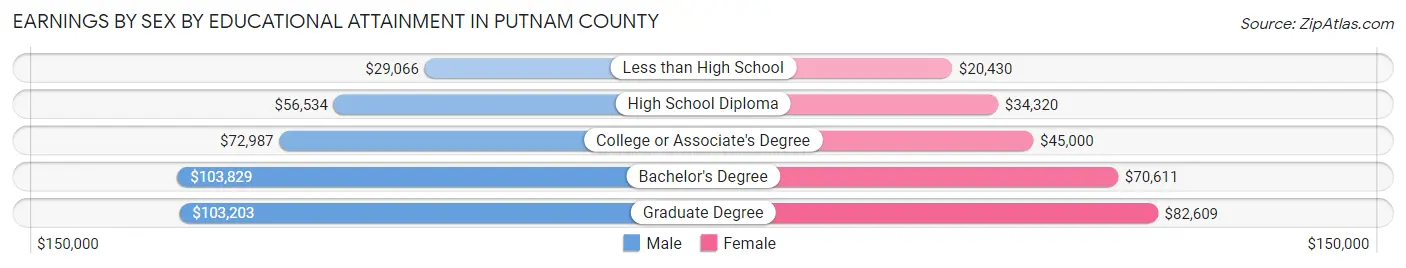
Earnings by Sex by Educational Attainment in Putnam County
Average earnings in Putnam County are $78,579 for men and $53,525 for women, a difference of 31.9%. Men with an educational attainment of bachelor's degree enjoy the highest average annual earnings of $103,829, while those with less than high school education earn the least with $29,066. Women with an educational attainment of graduate degree earn the most with the average annual earnings of $82,609, while those with less than high school education have the smallest earnings of $20,430.
| Educational Attainment | Male Income | Female Income |
| Less than High School | $29,066 | $20,430 |
| High School Diploma | $56,534 | $34,320 |
| College or Associate's Degree | $72,987 | $45,000 |
| Bachelor's Degree | $103,829 | $70,611 |
| Graduate Degree | $103,203 | $82,609 |
| Total | $78,579 | $53,525 |
Family Income in Putnam County
Family Income Brackets in Putnam County
According to the Putnam County family income data, there are 7,213 families falling into the $200,000+ income range, which is the most common income bracket and makes up 27.4% of all families. Conversely, the $10,000 to $14,999 income bracket is the least frequent group with only 184 families (0.7%) belonging to this category.
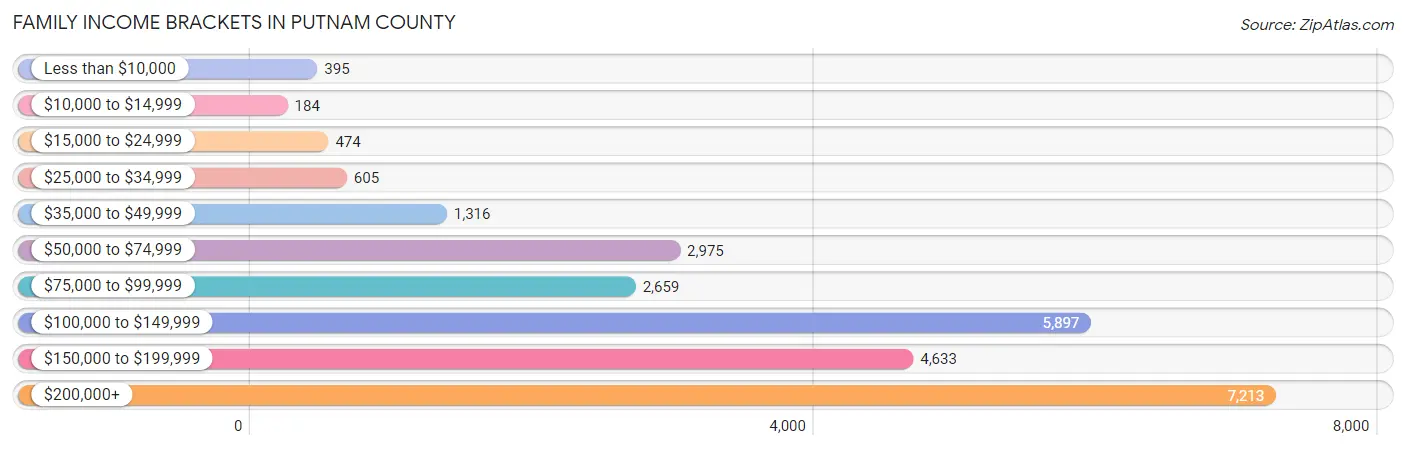
| Income Bracket | # Families | % Families |
| Less than $10,000 | 395 | 1.5% |
| $10,000 to $14,999 | 184 | 0.7% |
| $15,000 to $24,999 | 474 | 1.8% |
| $25,000 to $34,999 | 605 | 2.3% |
| $35,000 to $49,999 | 1,316 | 5.0% |
| $50,000 to $74,999 | 2,975 | 11.3% |
| $75,000 to $99,999 | 2,659 | 10.1% |
| $100,000 to $149,999 | 5,897 | 22.4% |
| $150,000 to $199,999 | 4,633 | 17.6% |
| $200,000+ | 7,213 | 27.4% |
Family Income by Famaliy Size in Putnam County
7+ person families (197 | 0.7%) account for the highest median family income in Putnam County with $250,001 per family, while 2-person families (11,295 | 42.9%) have the highest median income of $56,134 per family member.
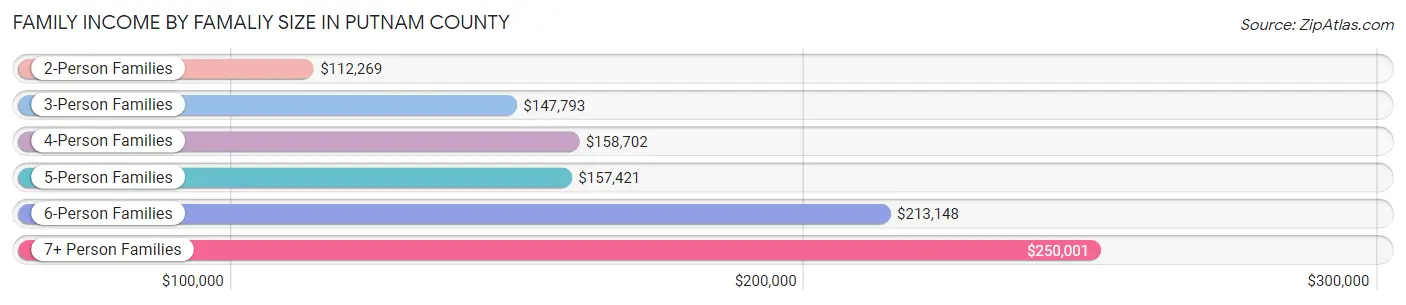
| Income Bracket | # Families | Median Income |
| 2-Person Families | 11,295 (42.9%) | $112,269 |
| 3-Person Families | 6,175 (23.5%) | $147,793 |
| 4-Person Families | 5,349 (20.3%) | $158,702 |
| 5-Person Families | 2,470 (9.4%) | $157,421 |
| 6-Person Families | 838 (3.2%) | $213,148 |
| 7+ Person Families | 197 (0.7%) | $250,001 |
| Total | 26,324 (100.0%) | $137,946 |
Family Income by Number of Earners in Putnam County
The median family income in Putnam County is $137,946, with families comprising 3+ earners (4,276) having the highest median family income of $212,250, while families with no earners (3,016) have the lowest median family income of $69,231, accounting for 16.2% and 11.5% of families, respectively.
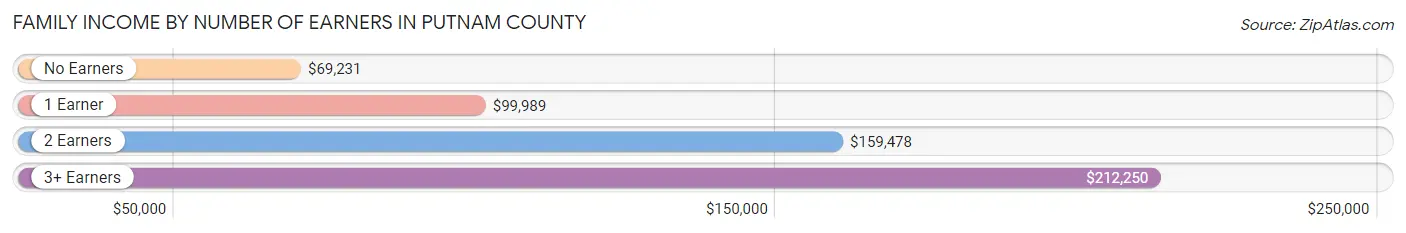
| Number of Earners | # Families | Median Income |
| No Earners | 3,016 (11.5%) | $69,231 |
| 1 Earner | 6,697 (25.4%) | $99,989 |
| 2 Earners | 12,335 (46.9%) | $159,478 |
| 3+ Earners | 4,276 (16.2%) | $212,250 |
| Total | 26,324 (100.0%) | $137,946 |
Household Income in Putnam County
Household Income Brackets in Putnam County
With 7,923 households falling in the category, the $200,000+ income range is the most frequent in Putnam County, accounting for 22.7% of all households. In contrast, only 558 households (1.6%) fall into the $10,000 to $14,999 income bracket, making it the least populous group.
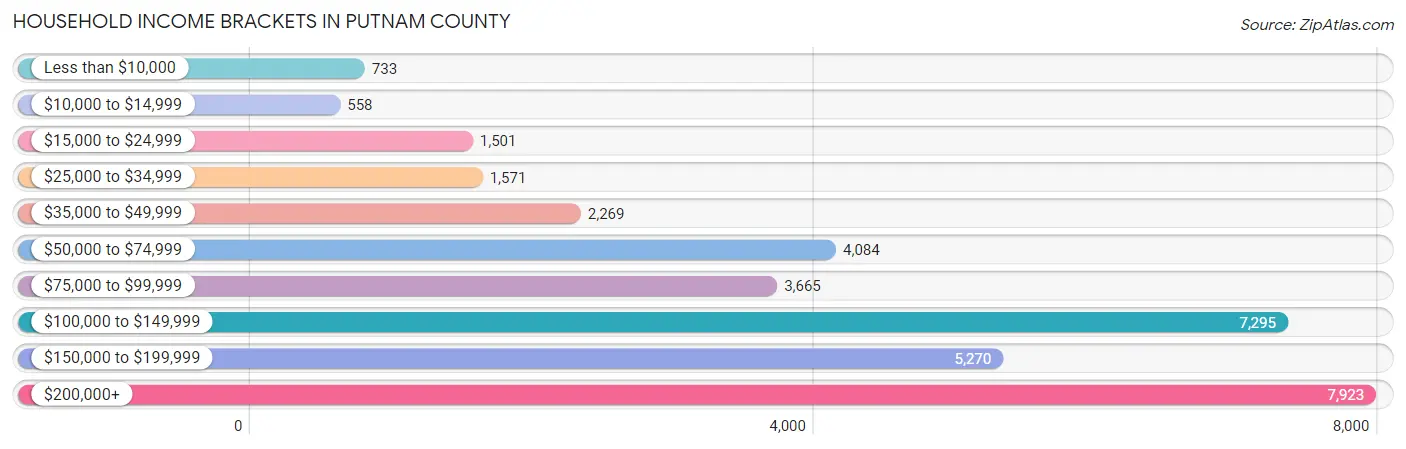
| Income Bracket | # Households | % Households |
| Less than $10,000 | 733 | 2.1% |
| $10,000 to $14,999 | 558 | 1.6% |
| $15,000 to $24,999 | 1,501 | 4.3% |
| $25,000 to $34,999 | 1,571 | 4.5% |
| $35,000 to $49,999 | 2,269 | 6.5% |
| $50,000 to $74,999 | 4,084 | 11.7% |
| $75,000 to $99,999 | 3,665 | 10.5% |
| $100,000 to $149,999 | 7,295 | 20.9% |
| $150,000 to $199,999 | 5,270 | 15.1% |
| $200,000+ | 7,923 | 22.7% |
Household Income by Householder Age in Putnam County
The median household income in Putnam County is $120,970, with the highest median household income of $140,740 found in the 45 to 64 years age bracket for the primary householder. A total of 16,224 households (46.5%) fall into this category. Meanwhile, the 15 to 24 years age bracket for the primary householder has the lowest median household income of $0, with 146 households (0.4%) in this group.
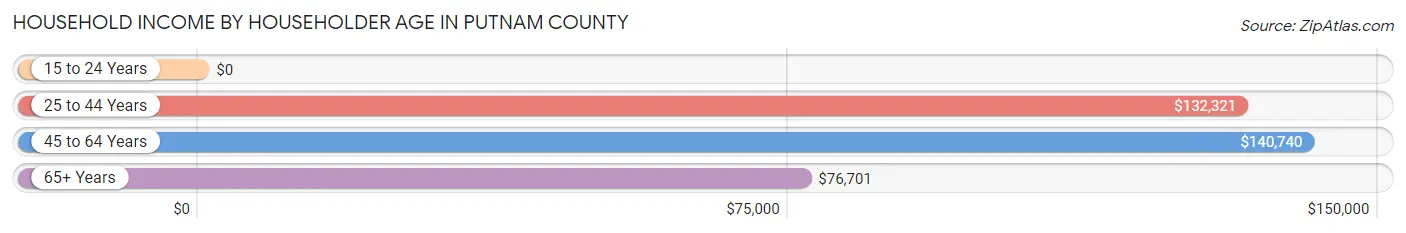
| Income Bracket | # Households | Median Income |
| 15 to 24 Years | 146 (0.4%) | $0 |
| 25 to 44 Years | 8,055 (23.1%) | $132,321 |
| 45 to 64 Years | 16,224 (46.5%) | $140,740 |
| 65+ Years | 10,478 (30.0%) | $76,701 |
| Total | 34,903 (100.0%) | $120,970 |
Poverty in Putnam County
Income Below Poverty by Sex and Age in Putnam County
With 5.4% poverty level for males and 7.2% for females among the residents of Putnam County, 5 year old males and 75 year old and over females are the most vulnerable to poverty, with 65 males (21.3%) and 492 females (11.8%) in their respective age groups living below the poverty level.
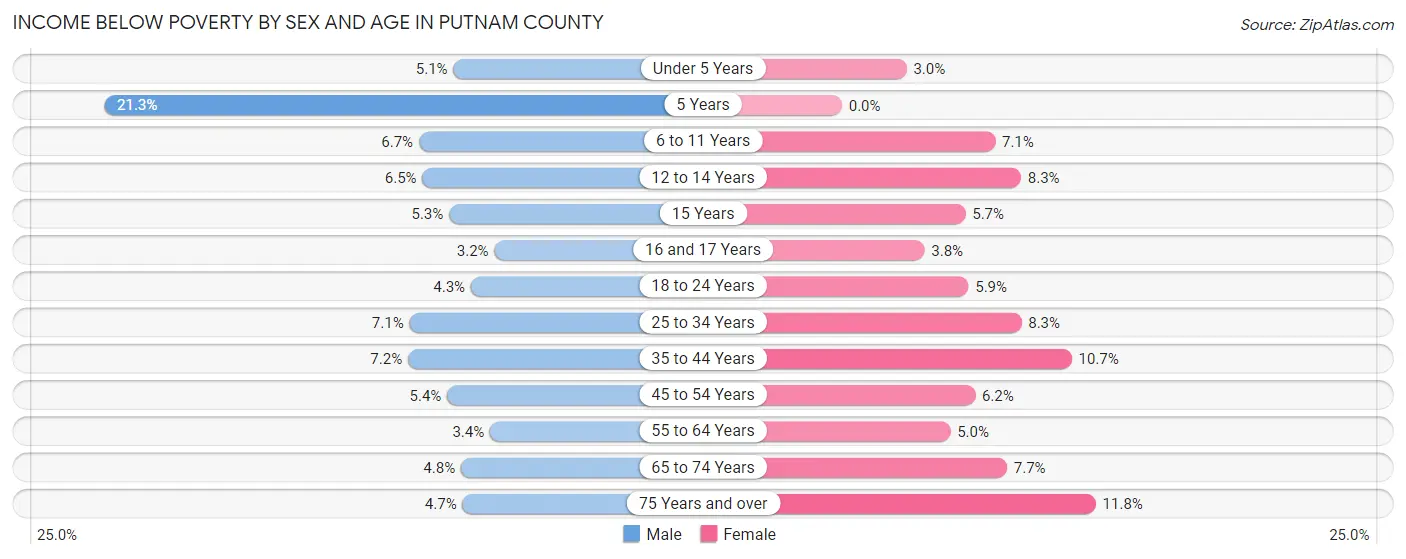
| Age Bracket | Male | Female |
| Under 5 Years | 113 (5.1%) | 66 (3.0%) |
| 5 Years | 65 (21.3%) | 0 (0.0%) |
| 6 to 11 Years | 195 (6.7%) | 213 (7.1%) |
| 12 to 14 Years | 143 (6.5%) | 132 (8.3%) |
| 15 Years | 43 (5.3%) | 46 (5.7%) |
| 16 and 17 Years | 37 (3.2%) | 44 (3.8%) |
| 18 to 24 Years | 183 (4.3%) | 220 (5.9%) |
| 25 to 34 Years | 399 (7.1%) | 435 (8.3%) |
| 35 to 44 Years | 428 (7.2%) | 599 (10.7%) |
| 45 to 54 Years | 392 (5.4%) | 432 (6.2%) |
| 55 to 64 Years | 266 (3.4%) | 390 (5.0%) |
| 65 to 74 Years | 248 (4.8%) | 412 (7.7%) |
| 75 Years and over | 136 (4.7%) | 492 (11.8%) |
| Total | 2,648 (5.4%) | 3,481 (7.2%) |
Income Above Poverty by Sex and Age in Putnam County
According to the poverty statistics in Putnam County, males aged 16 and 17 years and females aged 5 years are the age groups that are most secure financially, with 96.8% of males and 100.0% of females in these age groups living above the poverty line.
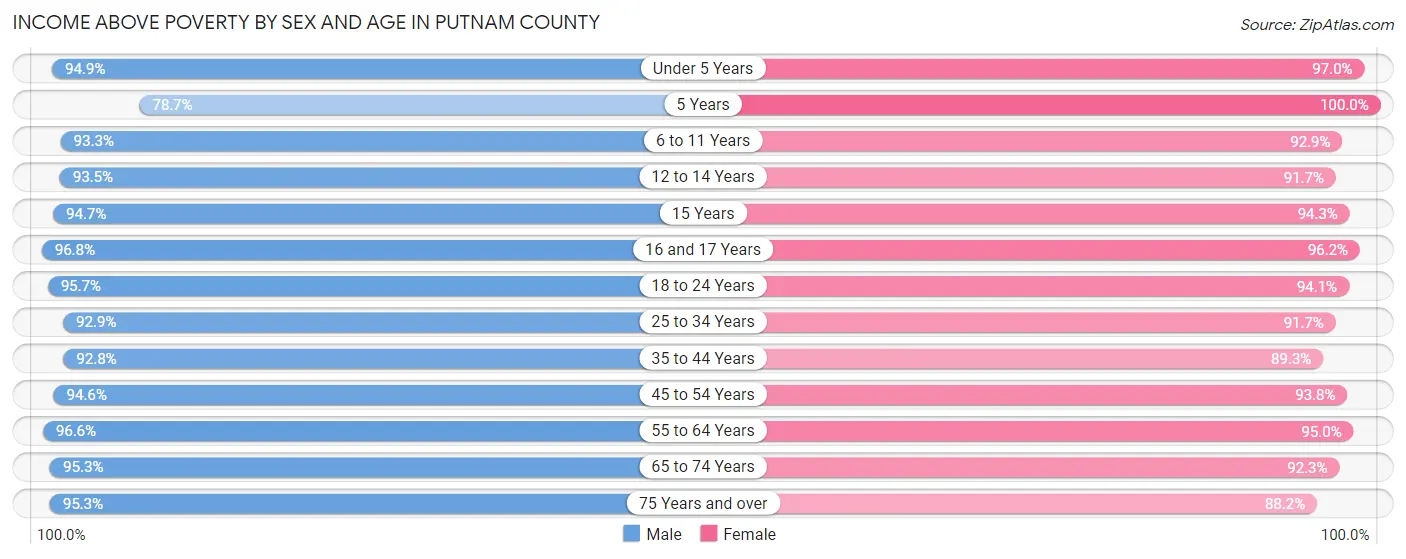
| Age Bracket | Male | Female |
| Under 5 Years | 2,103 (94.9%) | 2,133 (97.0%) |
| 5 Years | 240 (78.7%) | 457 (100.0%) |
| 6 to 11 Years | 2,715 (93.3%) | 2,784 (92.9%) |
| 12 to 14 Years | 2,044 (93.5%) | 1,456 (91.7%) |
| 15 Years | 768 (94.7%) | 757 (94.3%) |
| 16 and 17 Years | 1,120 (96.8%) | 1,106 (96.2%) |
| 18 to 24 Years | 4,080 (95.7%) | 3,530 (94.1%) |
| 25 to 34 Years | 5,189 (92.9%) | 4,790 (91.7%) |
| 35 to 44 Years | 5,505 (92.8%) | 5,022 (89.3%) |
| 45 to 54 Years | 6,887 (94.6%) | 6,554 (93.8%) |
| 55 to 64 Years | 7,569 (96.6%) | 7,362 (95.0%) |
| 65 to 74 Years | 4,972 (95.3%) | 4,968 (92.3%) |
| 75 Years and over | 2,773 (95.3%) | 3,686 (88.2%) |
| Total | 45,965 (94.6%) | 44,605 (92.8%) |
Income Below Poverty Among Married-Couple Families in Putnam County
The poverty statistics for married-couple families in Putnam County show that 2.3% or 491 of the total 21,256 families live below the poverty line. Families with 3 or 4 children have the highest poverty rate of 5.6%, comprising of 62 families. On the other hand, families with 5 or more children have the lowest poverty rate of 0.0%, which includes 0 families.
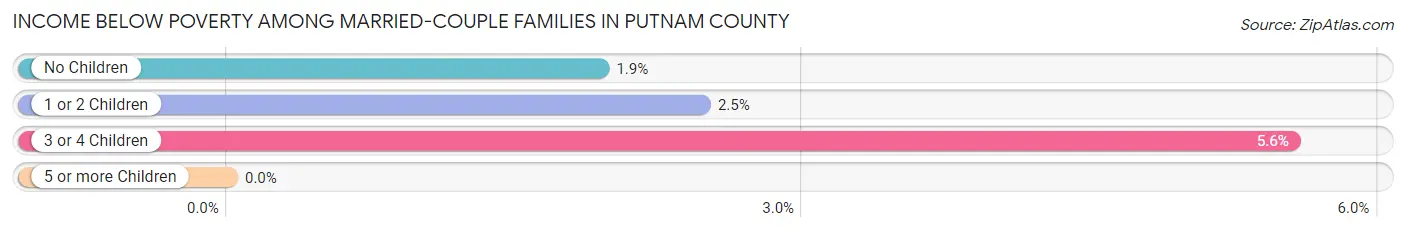
| Children | Above Poverty | Below Poverty |
| No Children | 12,342 (98.1%) | 244 (1.9%) |
| 1 or 2 Children | 7,313 (97.5%) | 185 (2.5%) |
| 3 or 4 Children | 1,055 (94.5%) | 62 (5.6%) |
| 5 or more Children | 55 (100.0%) | 0 (0.0%) |
| Total | 20,765 (97.7%) | 491 (2.3%) |
Income Below Poverty Among Single-Parent Households in Putnam County
According to the poverty data in Putnam County, 4.2% or 59 single-father households and 12.6% or 462 single-mother households are living below the poverty line. Among single-father households, those with 1 or 2 children have the highest poverty rate, with 32 households (7.2%) experiencing poverty. Likewise, among single-mother households, those with 1 or 2 children have the highest poverty rate, with 396 households (23.1%) falling below the poverty line.
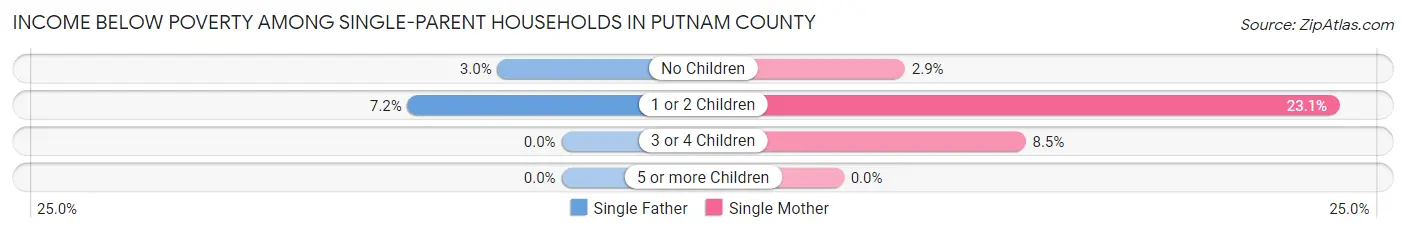
| Children | Single Father | Single Mother |
| No Children | 27 (3.0%) | 50 (2.9%) |
| 1 or 2 Children | 32 (7.2%) | 396 (23.1%) |
| 3 or 4 Children | 0 (0.0%) | 16 (8.5%) |
| 5 or more Children | 0 (0.0%) | 0 (0.0%) |
| Total | 59 (4.2%) | 462 (12.6%) |
Income Below Poverty Among Married-Couple vs Single-Parent Households in Putnam County
The poverty data for Putnam County shows that 491 of the married-couple family households (2.3%) and 521 of the single-parent households (10.3%) are living below the poverty level. Within the married-couple family households, those with 3 or 4 children have the highest poverty rate, with 62 households (5.6%) falling below the poverty line. Among the single-parent households, those with 1 or 2 children have the highest poverty rate, with 428 household (19.8%) living below poverty.
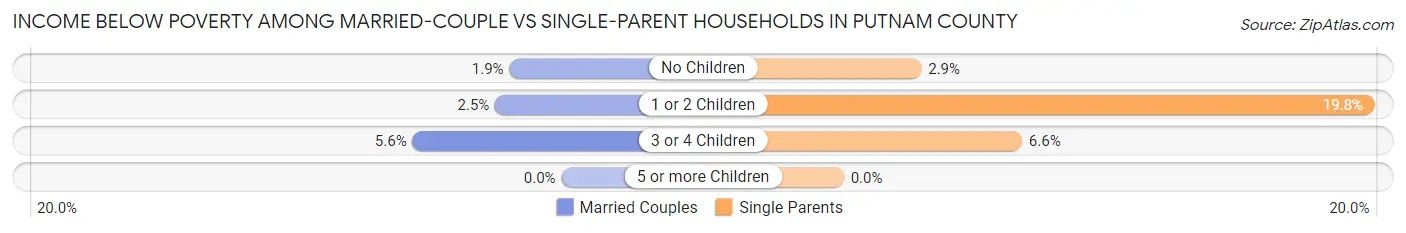
| Children | Married-Couple Families | Single-Parent Households |
| No Children | 244 (1.9%) | 77 (2.9%) |
| 1 or 2 Children | 185 (2.5%) | 428 (19.8%) |
| 3 or 4 Children | 62 (5.6%) | 16 (6.6%) |
| 5 or more Children | 0 (0.0%) | 0 (0.0%) |
| Total | 491 (2.3%) | 521 (10.3%) |
Race in Putnam County
The most populous races in Putnam County are White / Caucasian (78,451 | 80.1%), Hispanic or Latino (16,898 | 17.2%), and Some other Race (8,194 | 8.4%).
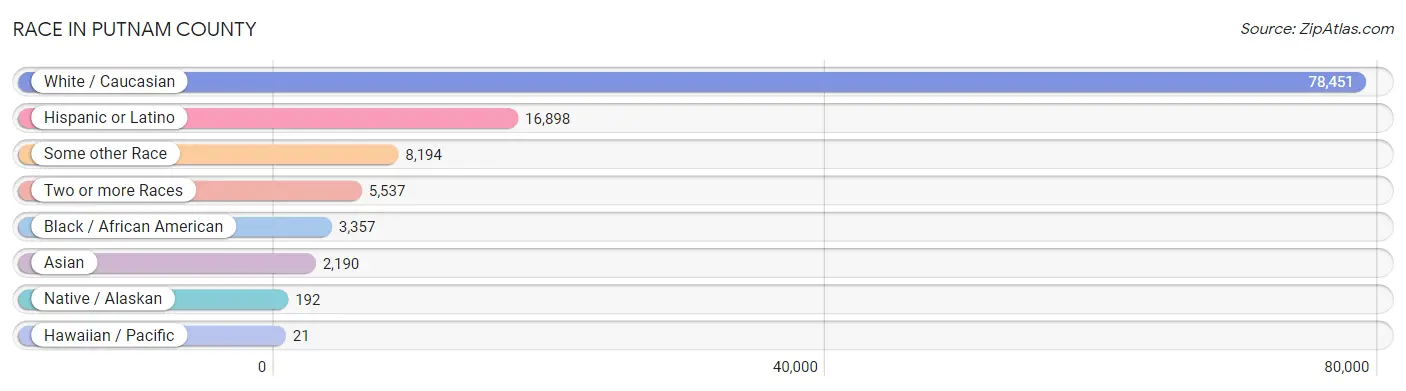
| Race | # Population | % Population |
| Asian | 2,190 | 2.2% |
| Black / African American | 3,357 | 3.4% |
| Hawaiian / Pacific | 21 | 0.0% |
| Hispanic or Latino | 16,898 | 17.2% |
| Native / Alaskan | 192 | 0.2% |
| White / Caucasian | 78,451 | 80.1% |
| Two or more Races | 5,537 | 5.7% |
| Some other Race | 8,194 | 8.4% |
| Total | 97,942 | 100.0% |
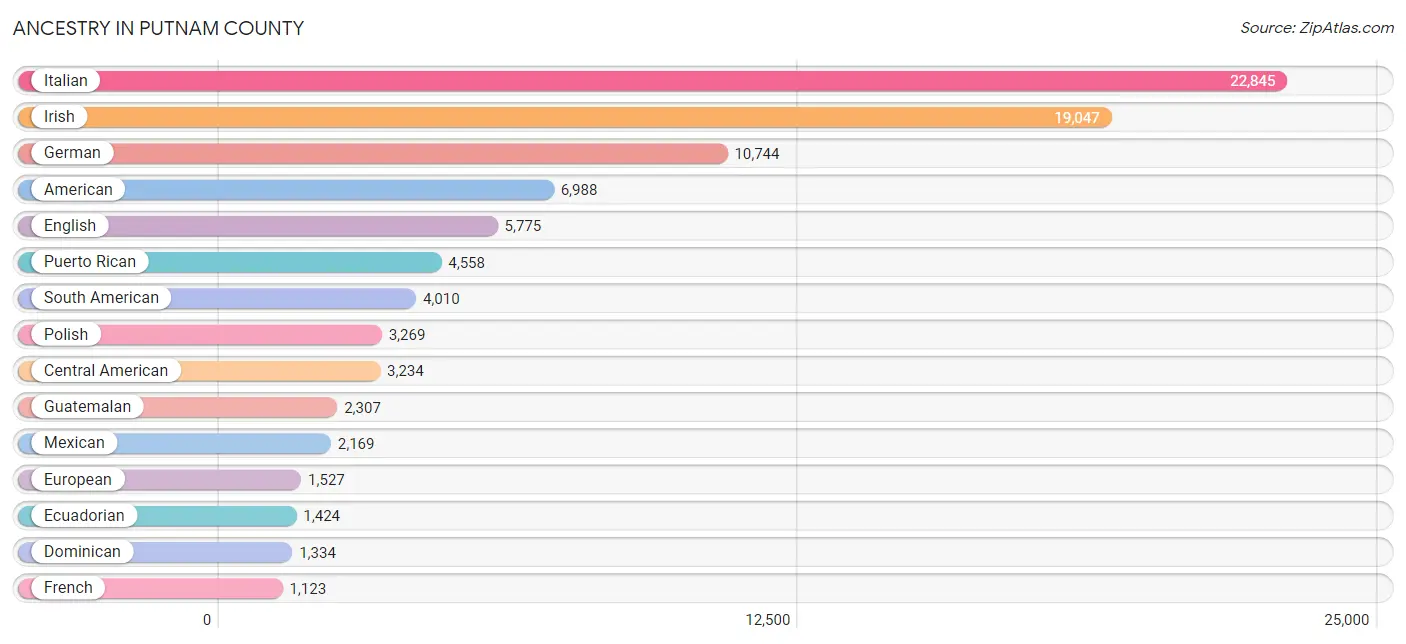
Ancestry in Putnam County
The most populous ancestries reported in Putnam County are Italian (22,845 | 23.3%), Irish (19,047 | 19.5%), German (10,744 | 11.0%), American (6,988 | 7.1%), and English (5,775 | 5.9%), together accounting for 66.8% of all Putnam County residents.
| Ancestry | # Population | % Population |
| African | 237 | 0.2% |
| Albanian | 648 | 0.7% |
| Alsatian | 4 | 0.0% |
| American | 6,988 | 7.1% |
| Apache | 140 | 0.1% |
| Arab | 365 | 0.4% |
| Argentinean | 585 | 0.6% |
| Armenian | 43 | 0.0% |
| Austrian | 307 | 0.3% |
| Basque | 64 | 0.1% |
| Belgian | 22 | 0.0% |
| Bhutanese | 196 | 0.2% |
| Blackfeet | 23 | 0.0% |
| Brazilian | 360 | 0.4% |
| British | 351 | 0.4% |
| British West Indian | 11 | 0.0% |
| Bulgarian | 6 | 0.0% |
| Burmese | 324 | 0.3% |
| Cambodian | 8 | 0.0% |
| Canadian | 244 | 0.3% |
| Carpatho Rusyn | 10 | 0.0% |
| Celtic | 25 | 0.0% |
| Central American | 3,234 | 3.3% |
| Central American Indian | 380 | 0.4% |
| Cherokee | 57 | 0.1% |
| Cheyenne | 47 | 0.1% |
| Chilean | 286 | 0.3% |
| Chippewa | 29 | 0.0% |
| Colombian | 556 | 0.6% |
| Costa Rican | 8 | 0.0% |
| Croatian | 95 | 0.1% |
| Cuban | 351 | 0.4% |
| Cypriot | 79 | 0.1% |
| Czech | 246 | 0.3% |
| Czechoslovakian | 85 | 0.1% |
| Danish | 328 | 0.3% |
| Dominican | 1,334 | 1.4% |
| Dutch | 962 | 1.0% |
| Eastern European | 707 | 0.7% |
| Ecuadorian | 1,424 | 1.5% |
| Egyptian | 95 | 0.1% |
| English | 5,775 | 5.9% |
| Estonian | 13 | 0.0% |
| Ethiopian | 4 | 0.0% |
| European | 1,527 | 1.6% |
| Finnish | 179 | 0.2% |
| French | 1,123 | 1.1% |
| French American Indian | 40 | 0.0% |
| French Canadian | 384 | 0.4% |
| German | 10,744 | 11.0% |
| Ghanaian | 39 | 0.0% |
| Greek | 849 | 0.9% |
| Guatemalan | 2,307 | 2.4% |
| Guyanese | 72 | 0.1% |
| Haitian | 120 | 0.1% |
| Honduran | 484 | 0.5% |
| Hungarian | 799 | 0.8% |
| Icelander | 10 | 0.0% |
| Indian (Asian) | 980 | 1.0% |
| Iranian | 47 | 0.1% |
| Irish | 19,047 | 19.5% |
| Iroquois | 75 | 0.1% |
| Israeli | 12 | 0.0% |
| Italian | 22,845 | 23.3% |
| Jamaican | 488 | 0.5% |
| Jordanian | 148 | 0.2% |
| Kiowa | 2 | 0.0% |
| Korean | 612 | 0.6% |
| Latvian | 147 | 0.2% |
| Lebanese | 26 | 0.0% |
| Lithuanian | 89 | 0.1% |
| Luxembourger | 75 | 0.1% |
| Maltese | 9 | 0.0% |
| Mexican | 2,169 | 2.2% |
| Mexican American Indian | 18 | 0.0% |
| Mongolian | 8 | 0.0% |
| Native Hawaiian | 7 | 0.0% |
| New Zealander | 1 | 0.0% |
| Nigerian | 54 | 0.1% |
| Northern European | 475 | 0.5% |
| Norwegian | 548 | 0.6% |
| Pakistani | 71 | 0.1% |
| Panamanian | 84 | 0.1% |
| Peruvian | 927 | 0.9% |
| Polish | 3,269 | 3.3% |
| Portuguese | 939 | 1.0% |
| Puerto Rican | 4,558 | 4.6% |
| Romanian | 268 | 0.3% |
| Russian | 1,005 | 1.0% |
| Salvadoran | 351 | 0.4% |
| Scandinavian | 68 | 0.1% |
| Scotch-Irish | 421 | 0.4% |
| Scottish | 967 | 1.0% |
| Serbian | 11 | 0.0% |
| Sierra Leonean | 42 | 0.0% |
| Slavic | 26 | 0.0% |
| Slovak | 388 | 0.4% |
| Slovene | 69 | 0.1% |
| South American | 4,010 | 4.1% |
| Spaniard | 259 | 0.3% |
| Spanish | 269 | 0.3% |
| Sri Lankan | 68 | 0.1% |
| Subsaharan African | 471 | 0.5% |
| Swedish | 662 | 0.7% |
| Swiss | 209 | 0.2% |
| Syrian | 35 | 0.0% |
| Thai | 382 | 0.4% |
| Tongan | 13 | 0.0% |
| Trinidadian and Tobagonian | 26 | 0.0% |
| Turkish | 104 | 0.1% |
| U.S. Virgin Islander | 9 | 0.0% |
| Ukrainian | 309 | 0.3% |
| Uruguayan | 94 | 0.1% |
| Venezuelan | 109 | 0.1% |
| Vietnamese | 34 | 0.0% |
| Welsh | 329 | 0.3% |
| West Indian | 81 | 0.1% |
| Yugoslavian | 23 | 0.0% |
| Zimbabwean | 124 | 0.1% | View All 119 Rows |
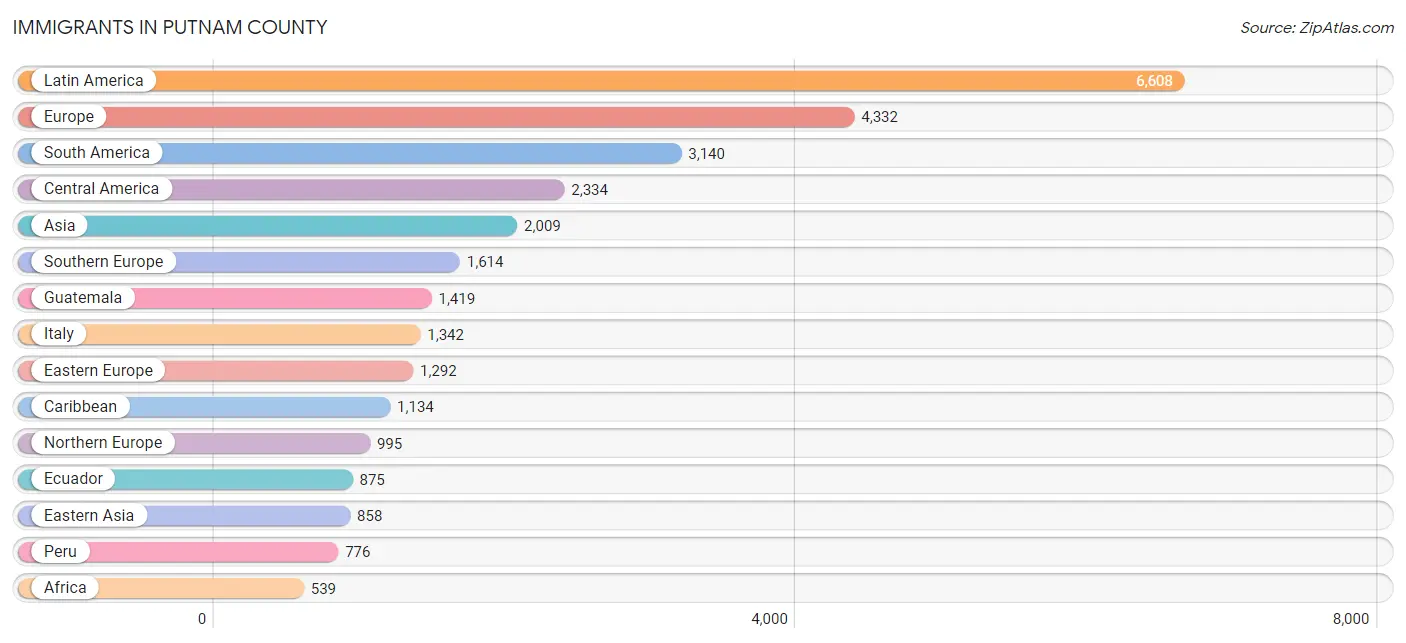
Immigrants in Putnam County
The most numerous immigrant groups reported in Putnam County came from Latin America (6,608 | 6.8%), Europe (4,332 | 4.4%), South America (3,140 | 3.2%), Central America (2,334 | 2.4%), and Asia (2,009 | 2.1%), together accounting for 18.8% of all Putnam County residents.
| Immigration Origin | # Population | % Population |
| Africa | 539 | 0.5% |
| Albania | 18 | 0.0% |
| Argentina | 364 | 0.4% |
| Asia | 2,009 | 2.1% |
| Australia | 3 | 0.0% |
| Austria | 54 | 0.1% |
| Bangladesh | 34 | 0.0% |
| Belarus | 7 | 0.0% |
| Belgium | 20 | 0.0% |
| Belize | 30 | 0.0% |
| Bosnia and Herzegovina | 3 | 0.0% |
| Brazil | 363 | 0.4% |
| Bulgaria | 6 | 0.0% |
| Canada | 302 | 0.3% |
| Caribbean | 1,134 | 1.2% |
| Central America | 2,334 | 2.4% |
| Chile | 111 | 0.1% |
| China | 531 | 0.5% |
| Colombia | 313 | 0.3% |
| Costa Rica | 3 | 0.0% |
| Croatia | 38 | 0.0% |
| Cuba | 38 | 0.0% |
| Czechoslovakia | 211 | 0.2% |
| Denmark | 15 | 0.0% |
| Dominican Republic | 505 | 0.5% |
| Eastern Africa | 353 | 0.4% |
| Eastern Asia | 858 | 0.9% |
| Eastern Europe | 1,292 | 1.3% |
| Ecuador | 875 | 0.9% |
| Egypt | 47 | 0.1% |
| El Salvador | 262 | 0.3% |
| England | 190 | 0.2% |
| Ethiopia | 174 | 0.2% |
| Europe | 4,332 | 4.4% |
| France | 100 | 0.1% |
| Germany | 151 | 0.2% |
| Ghana | 50 | 0.1% |
| Greece | 65 | 0.1% |
| Guatemala | 1,419 | 1.5% |
| Guyana | 131 | 0.1% |
| Haiti | 154 | 0.2% |
| Honduras | 187 | 0.2% |
| Hong Kong | 41 | 0.0% |
| Hungary | 38 | 0.0% |
| India | 303 | 0.3% |
| Iran | 41 | 0.0% |
| Ireland | 505 | 0.5% |
| Israel | 12 | 0.0% |
| Italy | 1,342 | 1.4% |
| Jamaica | 370 | 0.4% |
| Japan | 62 | 0.1% |
| Jordan | 227 | 0.2% |
| Korea | 265 | 0.3% |
| Latin America | 6,608 | 6.8% |
| Latvia | 49 | 0.1% |
| Lebanon | 4 | 0.0% |
| Malaysia | 8 | 0.0% |
| Mexico | 351 | 0.4% |
| Middle Africa | 17 | 0.0% |
| Morocco | 8 | 0.0% |
| Nepal | 10 | 0.0% |
| Netherlands | 40 | 0.0% |
| Nigeria | 12 | 0.0% |
| Northern Africa | 55 | 0.1% |
| Northern Europe | 995 | 1.0% |
| Norway | 12 | 0.0% |
| Oceania | 17 | 0.0% |
| Pakistan | 2 | 0.0% |
| Panama | 36 | 0.0% |
| Peru | 776 | 0.8% |
| Philippines | 359 | 0.4% |
| Poland | 314 | 0.3% |
| Portugal | 105 | 0.1% |
| Romania | 94 | 0.1% |
| Russia | 176 | 0.2% |
| Scotland | 37 | 0.0% |
| Sierra Leone | 36 | 0.0% |
| Singapore | 13 | 0.0% |
| South America | 3,140 | 3.2% |
| South Central Asia | 413 | 0.4% |
| South Eastern Asia | 467 | 0.5% |
| Southern Europe | 1,614 | 1.7% |
| Spain | 102 | 0.1% |
| St. Vincent and the Grenadines | 8 | 0.0% |
| Sweden | 18 | 0.0% |
| Switzerland | 29 | 0.0% |
| Taiwan | 21 | 0.0% |
| Thailand | 60 | 0.1% |
| Trinidad and Tobago | 12 | 0.0% |
| Turkey | 12 | 0.0% |
| Ukraine | 26 | 0.0% |
| Uruguay | 123 | 0.1% |
| Uzbekistan | 23 | 0.0% |
| Venezuela | 60 | 0.1% |
| Vietnam | 22 | 0.0% |
| West Indies | 39 | 0.0% |
| Western Africa | 111 | 0.1% |
| Western Asia | 271 | 0.3% |
| Western Europe | 394 | 0.4% |
| Zimbabwe | 135 | 0.1% | View All 100 Rows |
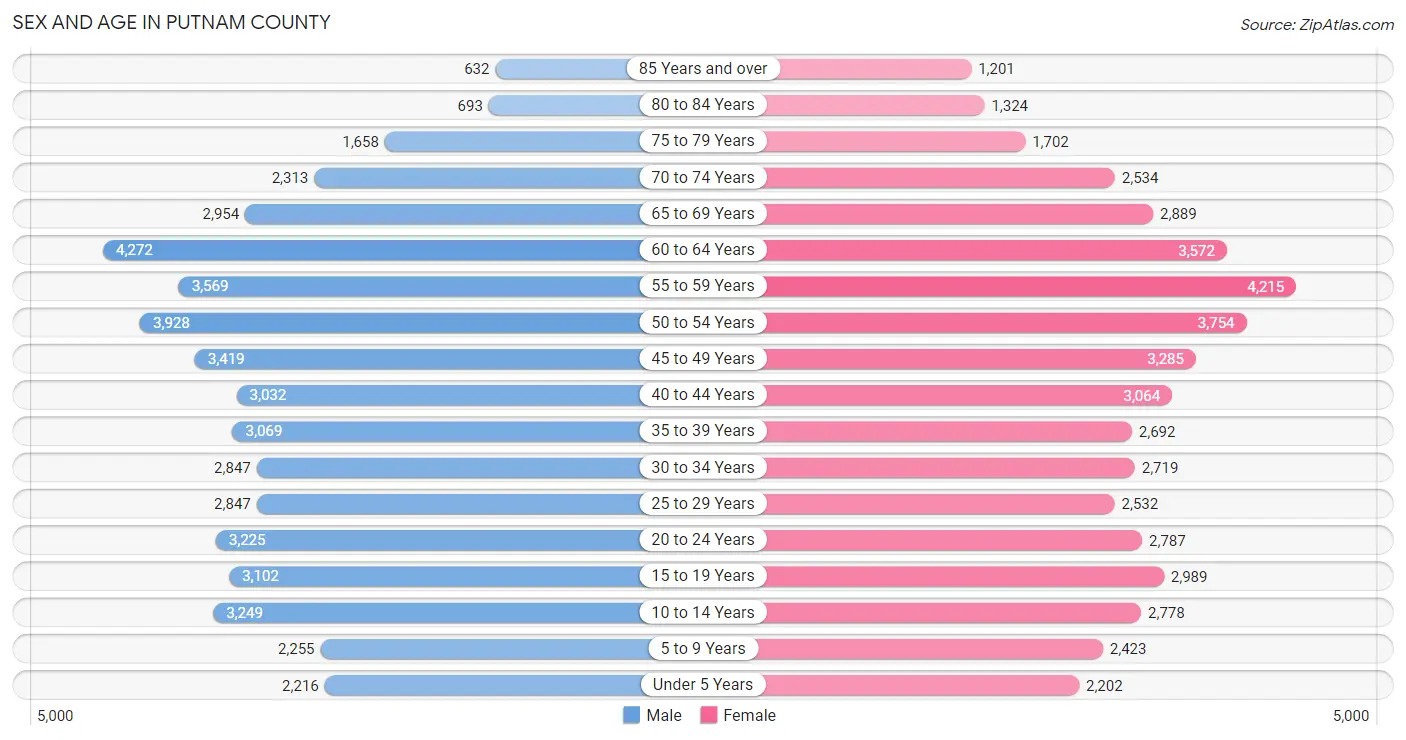
Sex and Age in Putnam County
Sex and Age in Putnam County
The most populous age groups in Putnam County are 60 to 64 Years (4,272 | 8.7%) for men and 55 to 59 Years (4,215 | 8.7%) for women.
| Age Bracket | Male | Female |
| Under 5 Years | 2,216 (4.5%) | 2,202 (4.5%) |
| 5 to 9 Years | 2,255 (4.6%) | 2,423 (5.0%) |
| 10 to 14 Years | 3,249 (6.6%) | 2,778 (5.7%) |
| 15 to 19 Years | 3,102 (6.3%) | 2,989 (6.1%) |
| 20 to 24 Years | 3,225 (6.5%) | 2,787 (5.7%) |
| 25 to 29 Years | 2,847 (5.8%) | 2,532 (5.2%) |
| 30 to 34 Years | 2,847 (5.8%) | 2,719 (5.6%) |
| 35 to 39 Years | 3,069 (6.2%) | 2,692 (5.5%) |
| 40 to 44 Years | 3,032 (6.1%) | 3,064 (6.3%) |
| 45 to 49 Years | 3,419 (6.9%) | 3,285 (6.8%) |
| 50 to 54 Years | 3,928 (8.0%) | 3,754 (7.7%) |
| 55 to 59 Years | 3,569 (7.2%) | 4,215 (8.7%) |
| 60 to 64 Years | 4,272 (8.7%) | 3,572 (7.3%) |
| 65 to 69 Years | 2,954 (6.0%) | 2,889 (5.9%) |
| 70 to 74 Years | 2,313 (4.7%) | 2,534 (5.2%) |
| 75 to 79 Years | 1,658 (3.4%) | 1,702 (3.5%) |
| 80 to 84 Years | 693 (1.4%) | 1,324 (2.7%) |
| 85 Years and over | 632 (1.3%) | 1,201 (2.5%) |
| Total | 49,280 (100.0%) | 48,662 (100.0%) |
Families and Households in Putnam County
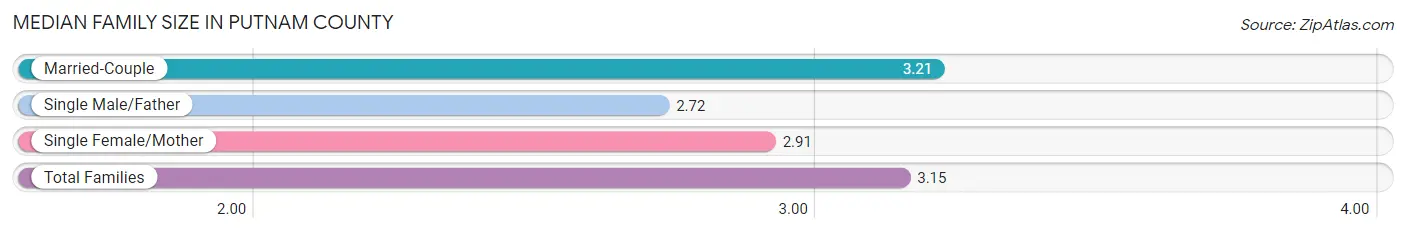
Median Family Size in Putnam County
The median family size in Putnam County is 3.15 persons per family, with married-couple families (21,256 | 80.7%) accounting for the largest median family size of 3.21 persons per family. On the other hand, single male/father families (1,403 | 5.3%) represent the smallest median family size with 2.72 persons per family.
| Family Type | # Families | Family Size |
| Married-Couple | 21,256 (80.7%) | 3.21 |
| Single Male/Father | 1,403 (5.3%) | 2.72 |
| Single Female/Mother | 3,665 (13.9%) | 2.91 |
| Total Families | 26,324 (100.0%) | 3.15 |
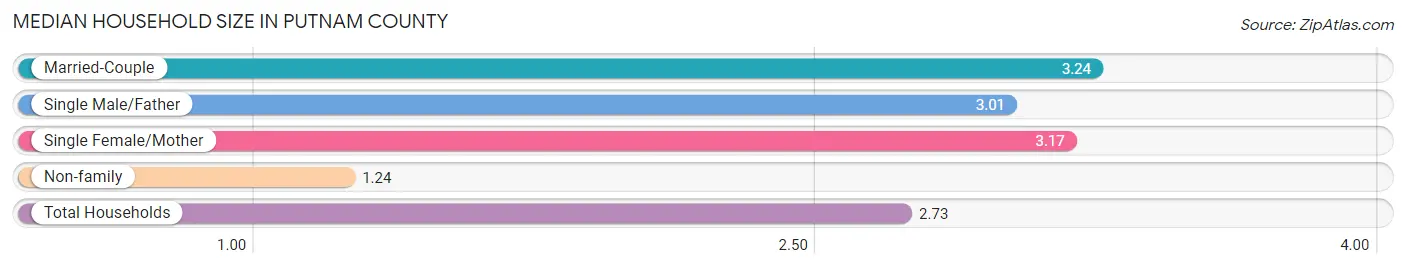
Median Household Size in Putnam County
The median household size in Putnam County is 2.73 persons per household, with married-couple households (21,256 | 60.9%) accounting for the largest median household size of 3.24 persons per household. non-family households (8,579 | 24.6%) represent the smallest median household size with 1.24 persons per household.
| Household Type | # Households | Household Size |
| Married-Couple | 21,256 (60.9%) | 3.24 |
| Single Male/Father | 1,403 (4.0%) | 3.01 |
| Single Female/Mother | 3,665 (10.5%) | 3.17 |
| Non-family | 8,579 (24.6%) | 1.24 |
| Total Households | 34,903 (100.0%) | 2.73 |
Household Size by Marriage Status in Putnam County
Out of a total of 34,903 households in Putnam County, 26,324 (75.4%) are family households, while 8,579 (24.6%) are nonfamily households. The most numerous type of family households are 2-person households, comprising 10,463, and the most common type of nonfamily households are 1-person households, comprising 7,109.
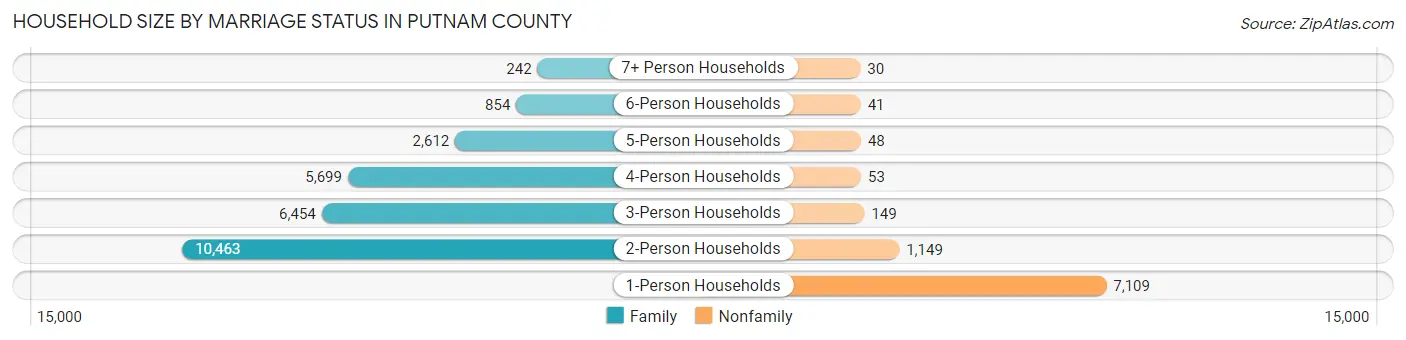
| Household Size | Family Households | Nonfamily Households |
| 1-Person Households | - | 7,109 (20.4%) |
| 2-Person Households | 10,463 (30.0%) | 1,149 (3.3%) |
| 3-Person Households | 6,454 (18.5%) | 149 (0.4%) |
| 4-Person Households | 5,699 (16.3%) | 53 (0.2%) |
| 5-Person Households | 2,612 (7.5%) | 48 (0.1%) |
| 6-Person Households | 854 (2.5%) | 41 (0.1%) |
| 7+ Person Households | 242 (0.7%) | 30 (0.1%) |
| Total | 26,324 (75.4%) | 8,579 (24.6%) |
Female Fertility in Putnam County
Fertility by Age in Putnam County
Average fertility rate in Putnam County is 49.0 births per 1,000 women. Women in the age bracket of 20 to 34 years have the highest fertility rate with 78.0 births per 1,000 women. Women in the age bracket of 20 to 34 years acount for 61.1% of all women with births.
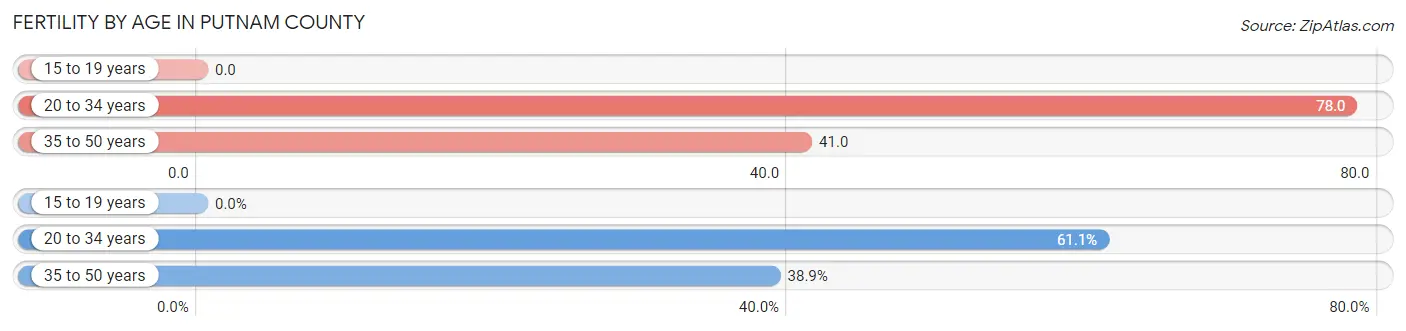
| Age Bracket | Women with Births | Births / 1,000 Women |
| 15 to 19 years | 0 (0.0%) | 0.0 |
| 20 to 34 years | 623 (61.1%) | 78.0 |
| 35 to 50 years | 396 (38.9%) | 41.0 |
| Total | 1,019 (100.0%) | 49.0 |
Fertility by Age by Marriage Status in Putnam County
78.4% of women with births (1,019) in Putnam County are married. The highest percentage of unmarried women with births falls into 20 to 34 years age bracket with 28.1% of them unmarried at the time of birth, while the lowest percentage of unmarried women with births belong to 35 to 50 years age bracket with 11.4% of them unmarried.
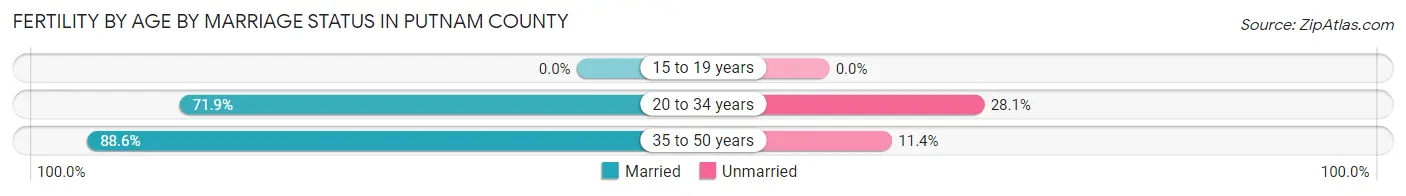
| Age Bracket | Married | Unmarried |
| 15 to 19 years | 0 (0.0%) | 0 (0.0%) |
| 20 to 34 years | 448 (71.9%) | 175 (28.1%) |
| 35 to 50 years | 351 (88.6%) | 45 (11.4%) |
| Total | 799 (78.4%) | 220 (21.6%) |
Fertility by Education in Putnam County
Average fertility rate in Putnam County is 49.0 births per 1,000 women. Women with the education attainment of graduate degree have the highest fertility rate of 102.0 births per 1,000 women, while women with the education attainment of less than high school have the lowest fertility at 14.0 births per 1,000 women. Women with the education attainment of graduate degree represent 37.3% of all women with births.
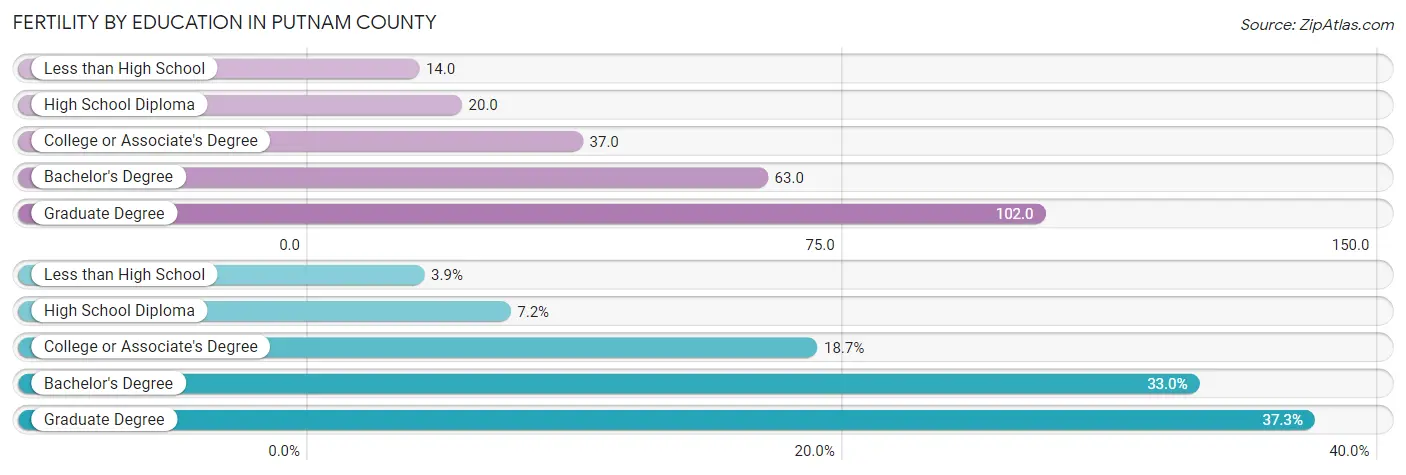
| Educational Attainment | Women with Births | Births / 1,000 Women |
| Less than High School | 40 (3.9%) | 14.0 |
| High School Diploma | 73 (7.2%) | 20.0 |
| College or Associate's Degree | 190 (18.6%) | 37.0 |
| Bachelor's Degree | 336 (33.0%) | 63.0 |
| Graduate Degree | 380 (37.3%) | 102.0 |
| Total | 1,019 (100.0%) | 49.0 |
Fertility by Education by Marriage Status in Putnam County
21.6% of women with births in Putnam County are unmarried. Women with the educational attainment of less than high school are most likely to be married with 100.0% of them married at childbirth, while women with the educational attainment of high school diploma are least likely to be married with 79.4% of them unmarried at childbirth.
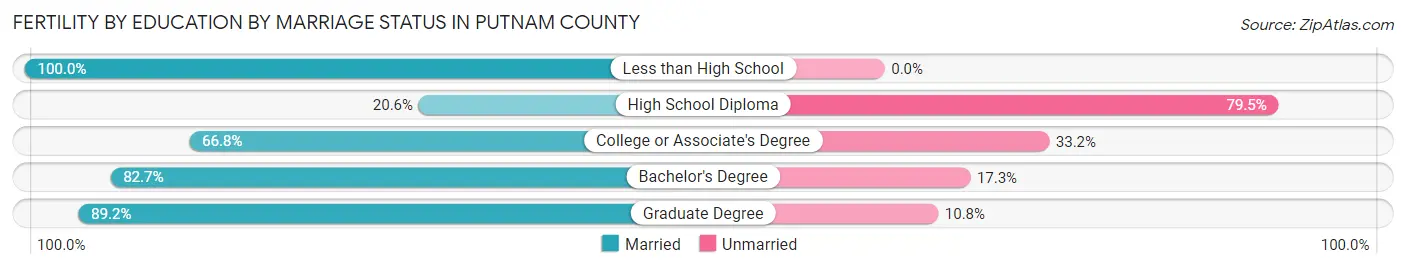
| Educational Attainment | Married | Unmarried |
| Less than High School | 40 (100.0%) | 0 (0.0%) |
| High School Diploma | 15 (20.5%) | 58 (79.4%) |
| College or Associate's Degree | 127 (66.8%) | 63 (33.2%) |
| Bachelor's Degree | 278 (82.7%) | 58 (17.3%) |
| Graduate Degree | 339 (89.2%) | 41 (10.8%) |
| Total | 799 (78.4%) | 220 (21.6%) |
Employment Characteristics in Putnam County
Employment by Class of Employer in Putnam County
Among the 49,087 employed individuals in Putnam County, private company employees (28,980 | 59.0%), local government employees (6,421 | 13.1%), and not-for-profit organizations (5,072 | 10.3%) make up the most common classes of employment.
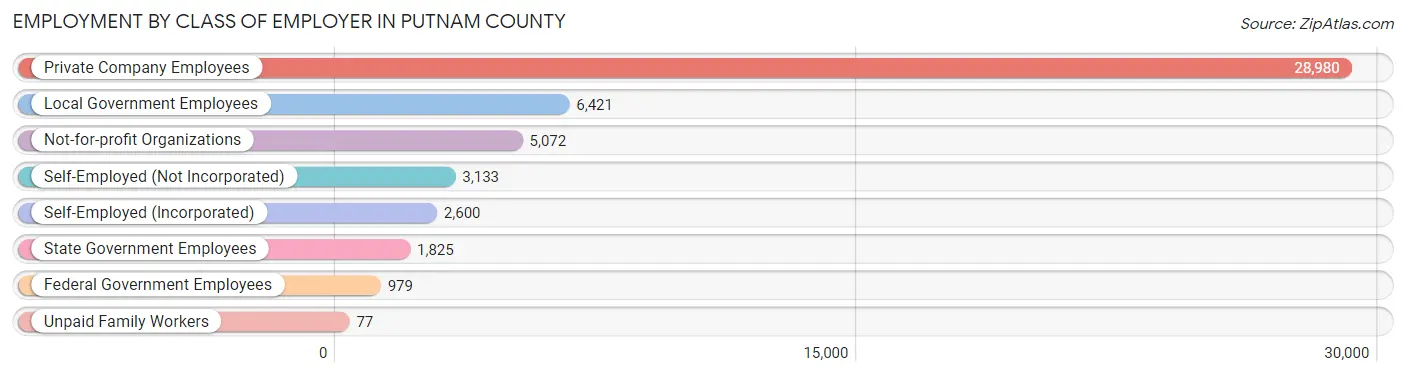
| Employer Class | # Employees | % Employees |
| Private Company Employees | 28,980 | 59.0% |
| Self-Employed (Incorporated) | 2,600 | 5.3% |
| Self-Employed (Not Incorporated) | 3,133 | 6.4% |
| Not-for-profit Organizations | 5,072 | 10.3% |
| Local Government Employees | 6,421 | 13.1% |
| State Government Employees | 1,825 | 3.7% |
| Federal Government Employees | 979 | 2.0% |
| Unpaid Family Workers | 77 | 0.2% |
| Total | 49,087 | 100.0% |
Employment Status by Age in Putnam County
According to the labor force statistics for Putnam County, out of the total population over 16 years of age (81,197), 64.7% or 52,534 individuals are in the labor force, with 4.4% or 2,311 of them unemployed. The age group with the highest labor force participation rate is 25 to 29 years, with 85.4% or 4,594 individuals in the labor force. Within the labor force, the 16 to 19 years age range has the highest percentage of unemployed individuals, with 9.6% or 145 of them being unemployed.
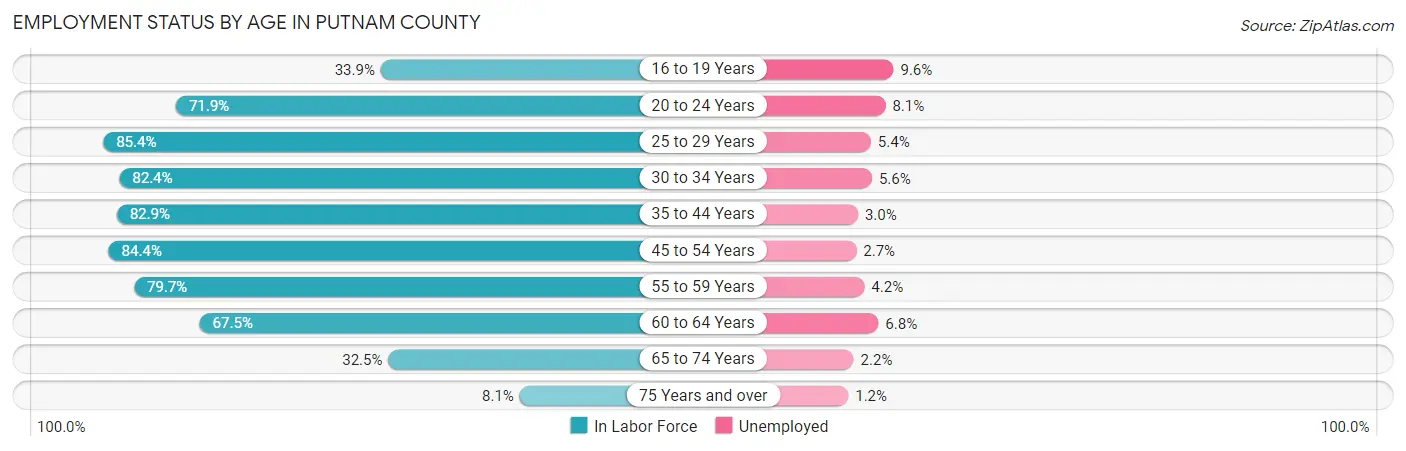
| Age Bracket | In Labor Force | Unemployed |
| 16 to 19 Years | 1,515 (33.9%) | 145 (9.6%) |
| 20 to 24 Years | 4,323 (71.9%) | 350 (8.1%) |
| 25 to 29 Years | 4,594 (85.4%) | 248 (5.4%) |
| 30 to 34 Years | 4,586 (82.4%) | 257 (5.6%) |
| 35 to 44 Years | 9,829 (82.9%) | 295 (3.0%) |
| 45 to 54 Years | 12,142 (84.4%) | 328 (2.7%) |
| 55 to 59 Years | 6,204 (79.7%) | 261 (4.2%) |
| 60 to 64 Years | 5,295 (67.5%) | 360 (6.8%) |
| 65 to 74 Years | 3,474 (32.5%) | 76 (2.2%) |
| 75 Years and over | 584 (8.1%) | 7 (1.2%) |
| Total | 52,534 (64.7%) | 2,311 (4.4%) |
Employment Status by Educational Attainment in Putnam County
According to labor force statistics for Putnam County, 80.7% of individuals (42,623) out of the total population between 25 and 64 years of age (52,816) are in the labor force, with 4.1% or 1,748 of them being unemployed. The group with the highest labor force participation rate are those with the educational attainment of bachelor's degree or higher, with 85.4% or 20,839 individuals in the labor force. Within the labor force, individuals with high school diploma education have the highest percentage of unemployment, with 5.7% or 511 of them being unemployed.
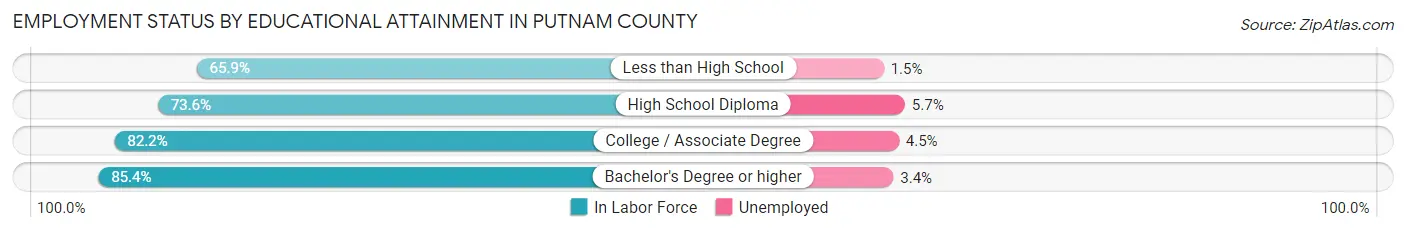
| Educational Attainment | In Labor Force | Unemployed |
| Less than High School | 2,003 (65.9%) | 46 (1.5%) |
| High School Diploma | 8,962 (73.6%) | 694 (5.7%) |
| College / Associate Degree | 10,848 (82.2%) | 594 (4.5%) |
| Bachelor's Degree or higher | 20,839 (85.4%) | 830 (3.4%) |
| Total | 42,623 (80.7%) | 2,165 (4.1%) |
Employment Occupations by Sex in Putnam County
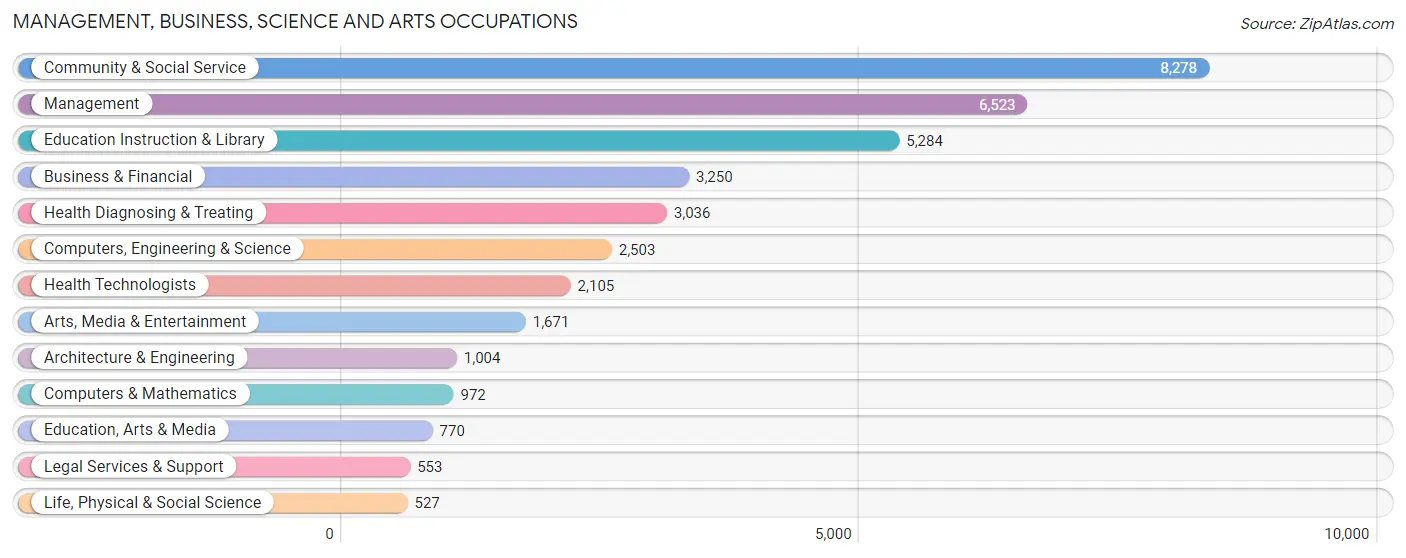
Management, Business, Science and Arts Occupations
The most common Management, Business, Science and Arts occupations in Putnam County are Community & Social Service (8,278 | 16.5%), Management (6,523 | 13.0%), Education Instruction & Library (5,284 | 10.5%), Business & Financial (3,250 | 6.5%), and Health Diagnosing & Treating (3,036 | 6.0%).
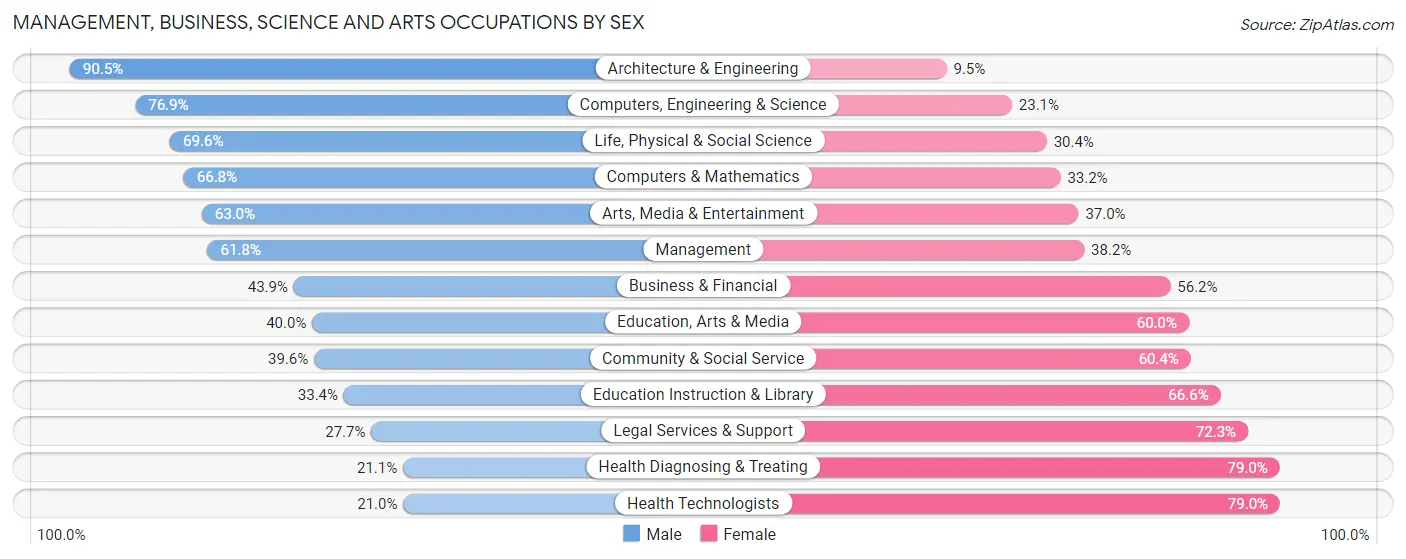
Management, Business, Science and Arts Occupations by Sex
Within the Management, Business, Science and Arts occupations in Putnam County, the most male-oriented occupations are Architecture & Engineering (90.5%), Computers, Engineering & Science (76.9%), and Life, Physical & Social Science (69.6%), while the most female-oriented occupations are Health Technologists (79.0%), Health Diagnosing & Treating (78.9%), and Legal Services & Support (72.3%).
| Occupation | Male | Female |
| Management | 4,033 (61.8%) | 2,490 (38.2%) |
| Business & Financial | 1,425 (43.9%) | 1,825 (56.1%) |
| Computers, Engineering & Science | 1,925 (76.9%) | 578 (23.1%) |
| Computers & Mathematics | 649 (66.8%) | 323 (33.2%) |
| Architecture & Engineering | 909 (90.5%) | 95 (9.5%) |
| Life, Physical & Social Science | 367 (69.6%) | 160 (30.4%) |
| Community & Social Service | 3,279 (39.6%) | 4,999 (60.4%) |
| Education, Arts & Media | 308 (40.0%) | 462 (60.0%) |
| Legal Services & Support | 153 (27.7%) | 400 (72.3%) |
| Education Instruction & Library | 1,765 (33.4%) | 3,519 (66.6%) |
| Arts, Media & Entertainment | 1,053 (63.0%) | 618 (37.0%) |
| Health Diagnosing & Treating | 639 (21.0%) | 2,397 (78.9%) |
| Health Technologists | 442 (21.0%) | 1,663 (79.0%) |
| Total (Category) | 11,301 (47.9%) | 12,289 (52.1%) |
| Total (Overall) | 27,262 (54.3%) | 22,948 (45.7%) |
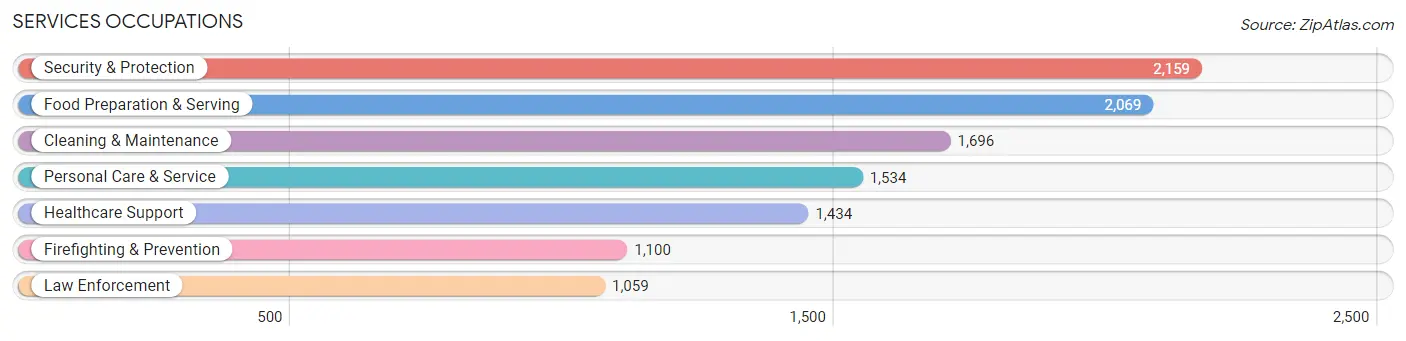
Services Occupations
The most common Services occupations in Putnam County are Security & Protection (2,159 | 4.3%), Food Preparation & Serving (2,069 | 4.1%), Cleaning & Maintenance (1,696 | 3.4%), Personal Care & Service (1,534 | 3.1%), and Healthcare Support (1,434 | 2.9%).
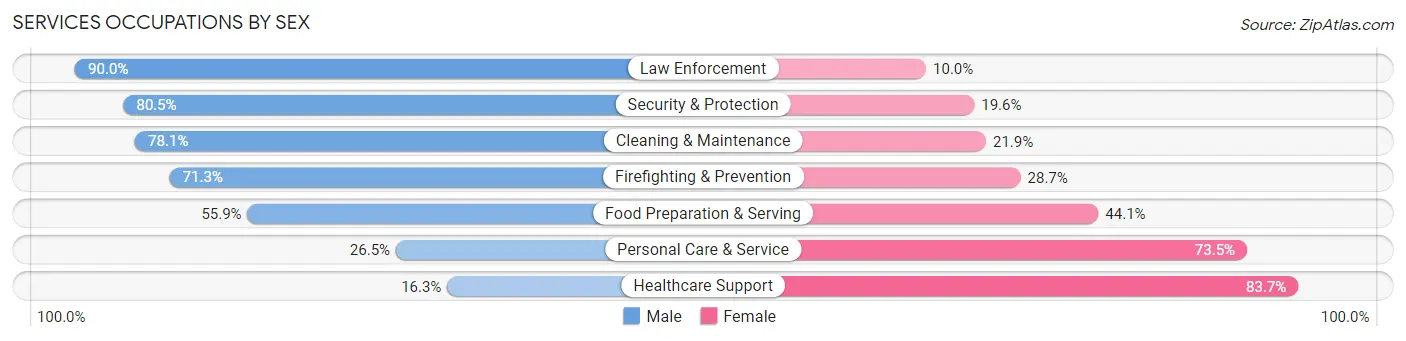
Services Occupations by Sex
Within the Services occupations in Putnam County, the most male-oriented occupations are Law Enforcement (90.0%), Security & Protection (80.4%), and Cleaning & Maintenance (78.1%), while the most female-oriented occupations are Healthcare Support (83.7%), Personal Care & Service (73.5%), and Food Preparation & Serving (44.1%).
| Occupation | Male | Female |
| Healthcare Support | 234 (16.3%) | 1,200 (83.7%) |
| Security & Protection | 1,737 (80.4%) | 422 (19.6%) |
| Firefighting & Prevention | 784 (71.3%) | 316 (28.7%) |
| Law Enforcement | 953 (90.0%) | 106 (10.0%) |
| Food Preparation & Serving | 1,156 (55.9%) | 913 (44.1%) |
| Cleaning & Maintenance | 1,325 (78.1%) | 371 (21.9%) |
| Personal Care & Service | 406 (26.5%) | 1,128 (73.5%) |
| Total (Category) | 4,858 (54.6%) | 4,034 (45.4%) |
| Total (Overall) | 27,262 (54.3%) | 22,948 (45.7%) |
Sales and Office Occupations
The most common Sales and Office occupations in Putnam County are Office & Administration (5,553 | 11.1%), and Sales & Related (4,068 | 8.1%).
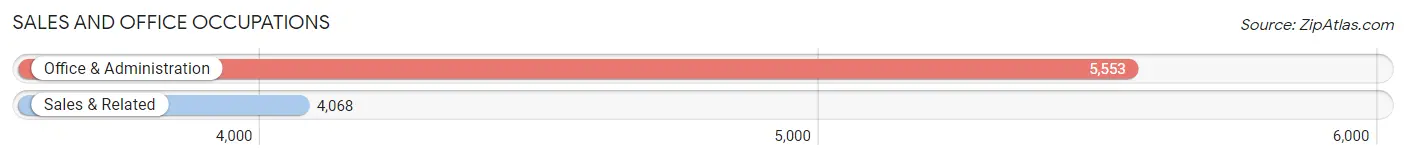
Sales and Office Occupations by Sex
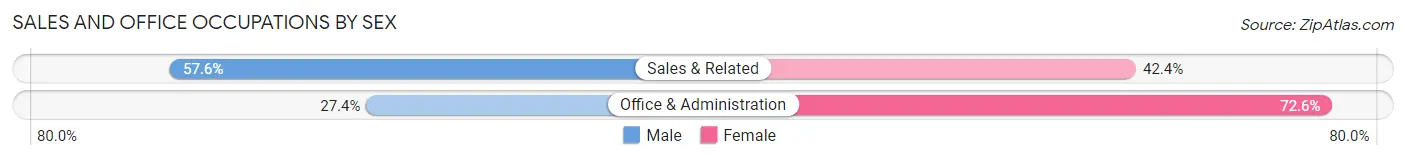
| Occupation | Male | Female |
| Sales & Related | 2,344 (57.6%) | 1,724 (42.4%) |
| Office & Administration | 1,523 (27.4%) | 4,030 (72.6%) |
| Total (Category) | 3,867 (40.2%) | 5,754 (59.8%) |
| Total (Overall) | 27,262 (54.3%) | 22,948 (45.7%) |
Natural Resources, Construction and Maintenance Occupations
The most common Natural Resources, Construction and Maintenance occupations in Putnam County are Construction & Extraction (3,094 | 6.2%), Installation, Maintenance & Repair (1,324 | 2.6%), and Farming, Fishing & Forestry (25 | 0.1%).
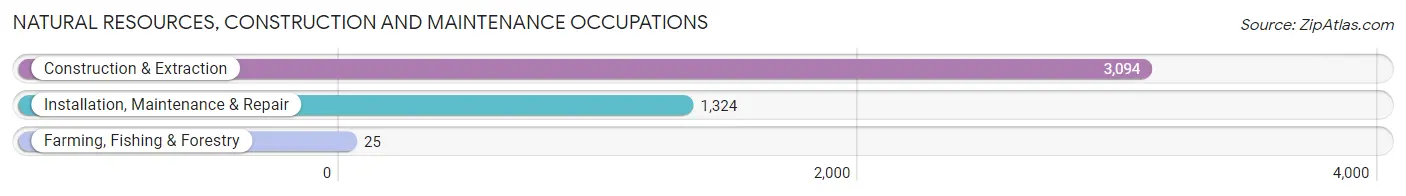
Natural Resources, Construction and Maintenance Occupations by Sex
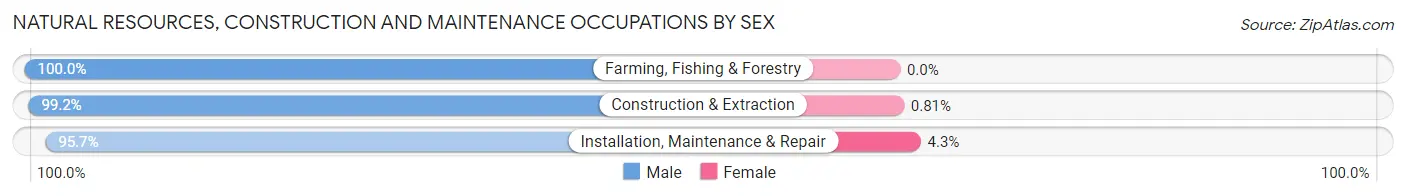
| Occupation | Male | Female |
| Farming, Fishing & Forestry | 25 (100.0%) | 0 (0.0%) |
| Construction & Extraction | 3,069 (99.2%) | 25 (0.8%) |
| Installation, Maintenance & Repair | 1,267 (95.7%) | 57 (4.3%) |
| Total (Category) | 4,361 (98.2%) | 82 (1.8%) |
| Total (Overall) | 27,262 (54.3%) | 22,948 (45.7%) |
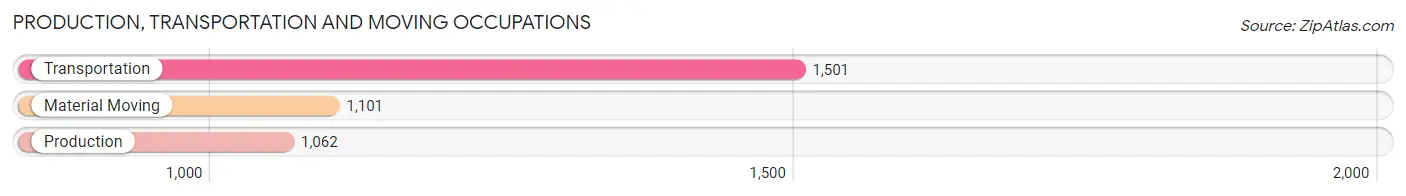
Production, Transportation and Moving Occupations
The most common Production, Transportation and Moving occupations in Putnam County are Transportation (1,501 | 3.0%), Material Moving (1,101 | 2.2%), and Production (1,062 | 2.1%).
Production, Transportation and Moving Occupations by Sex
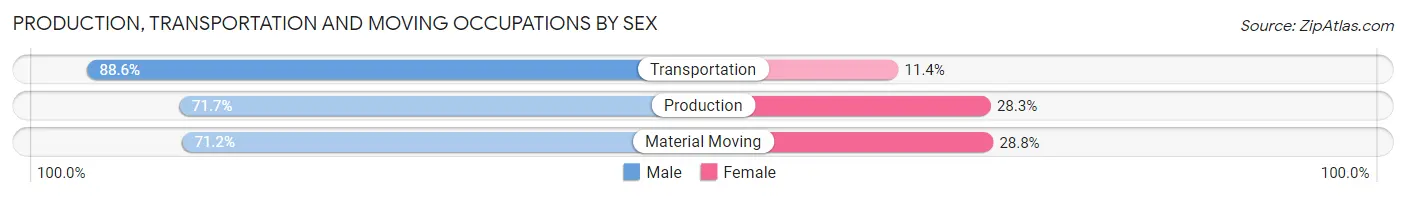
| Occupation | Male | Female |
| Production | 761 (71.7%) | 301 (28.3%) |
| Transportation | 1,330 (88.6%) | 171 (11.4%) |
| Material Moving | 784 (71.2%) | 317 (28.8%) |
| Total (Category) | 2,875 (78.5%) | 789 (21.5%) |
| Total (Overall) | 27,262 (54.3%) | 22,948 (45.7%) |
Employment Industries by Sex in Putnam County
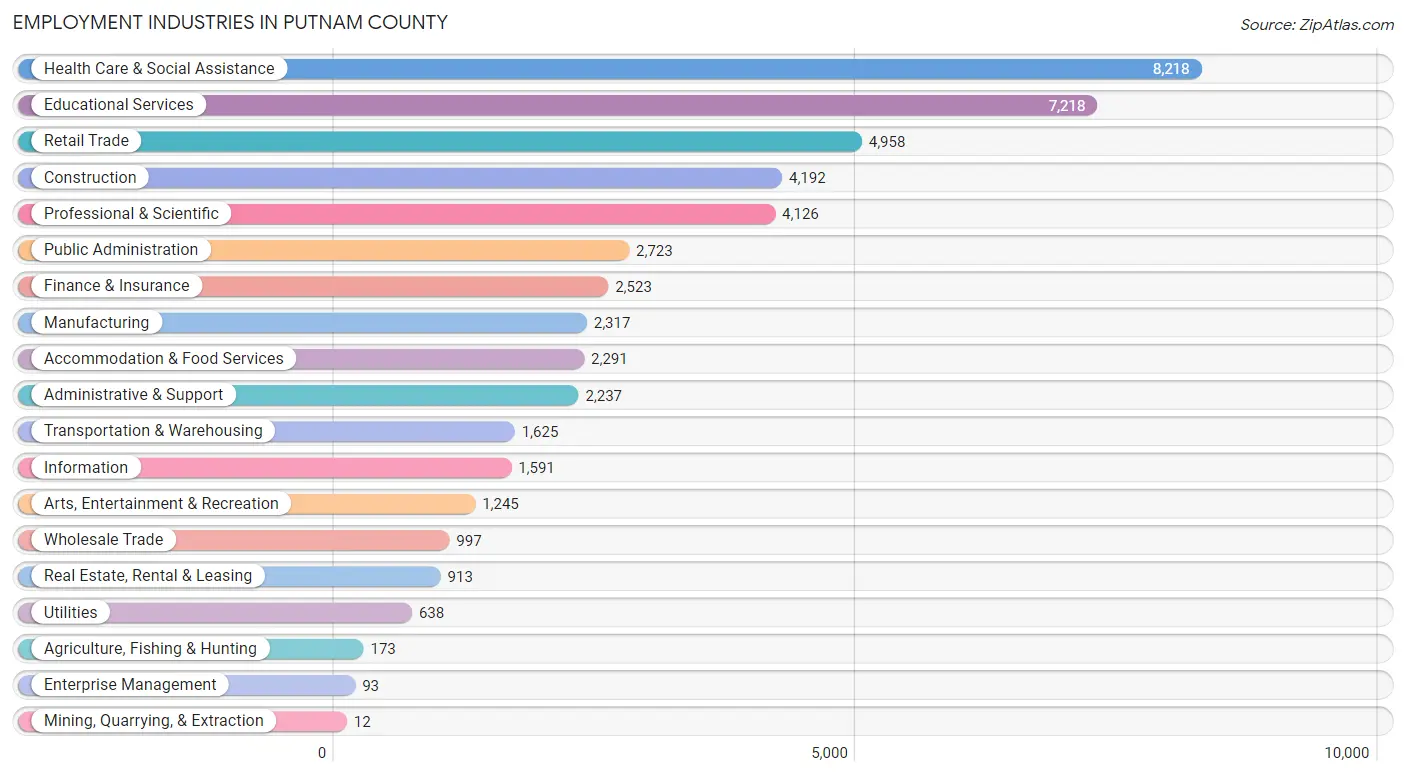
Employment Industries in Putnam County
The major employment industries in Putnam County include Health Care & Social Assistance (8,218 | 16.4%), Educational Services (7,218 | 14.4%), Retail Trade (4,958 | 9.9%), Construction (4,192 | 8.4%), and Professional & Scientific (4,126 | 8.2%).
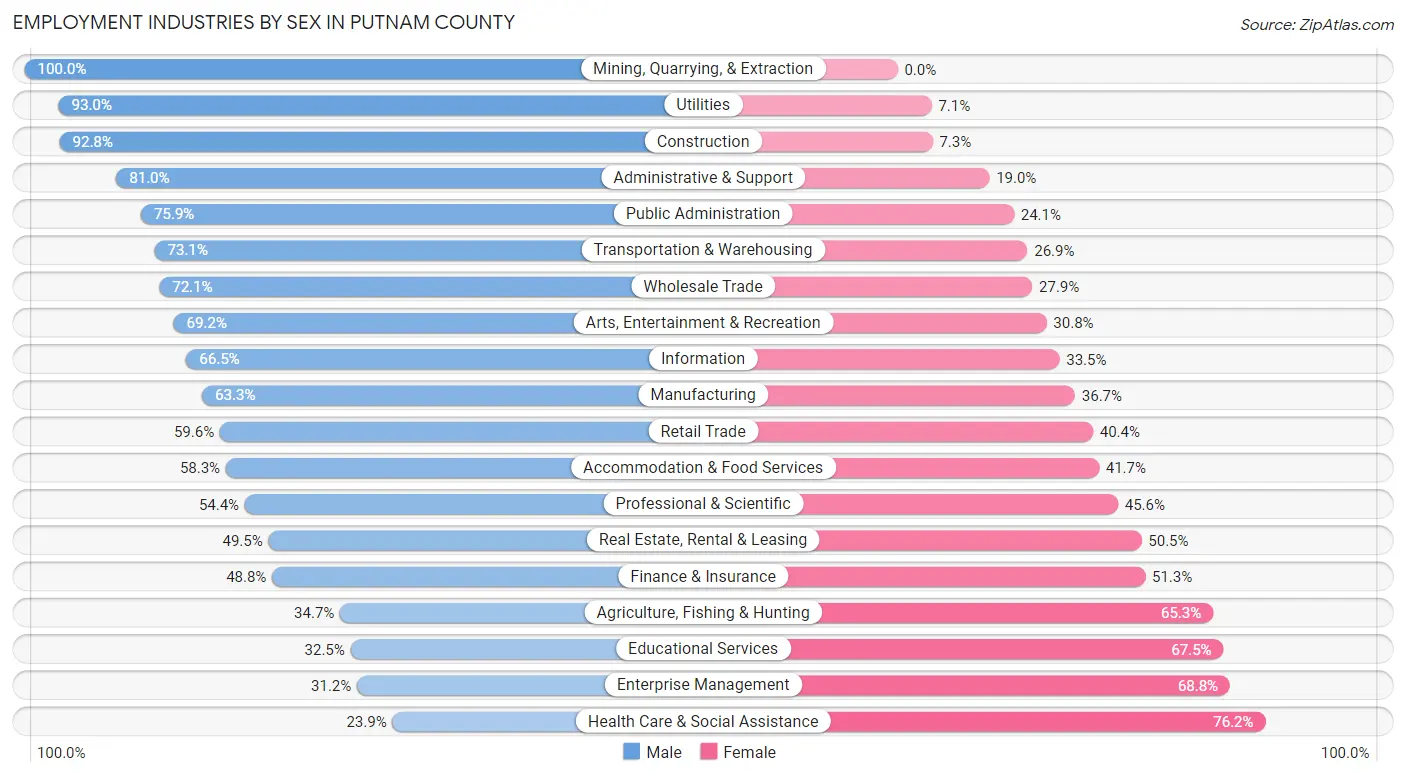
Employment Industries by Sex in Putnam County
The Putnam County industries that see more men than women are Mining, Quarrying, & Extraction (100.0%), Utilities (92.9%), and Construction (92.7%), whereas the industries that tend to have a higher number of women are Health Care & Social Assistance (76.1%), Enterprise Management (68.8%), and Educational Services (67.5%).
| Industry | Male | Female |
| Agriculture, Fishing & Hunting | 60 (34.7%) | 113 (65.3%) |
| Mining, Quarrying, & Extraction | 12 (100.0%) | 0 (0.0%) |
| Construction | 3,888 (92.7%) | 304 (7.2%) |
| Manufacturing | 1,466 (63.3%) | 851 (36.7%) |
| Wholesale Trade | 719 (72.1%) | 278 (27.9%) |
| Retail Trade | 2,953 (59.6%) | 2,005 (40.4%) |
| Transportation & Warehousing | 1,188 (73.1%) | 437 (26.9%) |
| Utilities | 593 (92.9%) | 45 (7.0%) |
| Information | 1,058 (66.5%) | 533 (33.5%) |
| Finance & Insurance | 1,230 (48.7%) | 1,293 (51.2%) |
| Real Estate, Rental & Leasing | 452 (49.5%) | 461 (50.5%) |
| Professional & Scientific | 2,244 (54.4%) | 1,882 (45.6%) |
| Enterprise Management | 29 (31.2%) | 64 (68.8%) |
| Administrative & Support | 1,812 (81.0%) | 425 (19.0%) |
| Educational Services | 2,347 (32.5%) | 4,871 (67.5%) |
| Health Care & Social Assistance | 1,960 (23.8%) | 6,258 (76.1%) |
| Arts, Entertainment & Recreation | 861 (69.2%) | 384 (30.8%) |
| Accommodation & Food Services | 1,336 (58.3%) | 955 (41.7%) |
| Public Administration | 2,067 (75.9%) | 656 (24.1%) |
| Total | 27,262 (54.3%) | 22,948 (45.7%) |
Education in Putnam County
School Enrollment in Putnam County
The most common levels of schooling among the 22,220 students in Putnam County are high school (5,550 | 25.0%), middle school (4,758 | 21.4%), and college / undergraduate (4,677 | 21.0%).
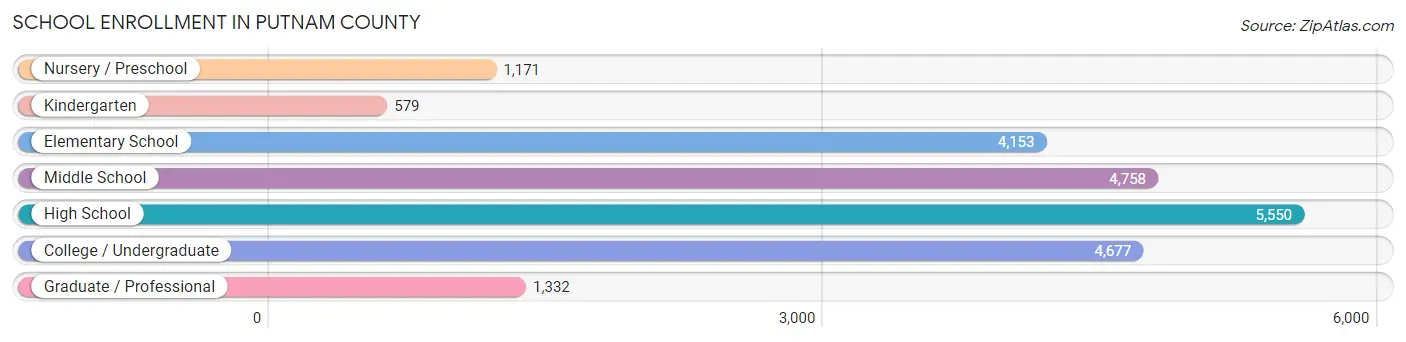
| School Level | # Students | % Students |
| Nursery / Preschool | 1,171 | 5.3% |
| Kindergarten | 579 | 2.6% |
| Elementary School | 4,153 | 18.7% |
| Middle School | 4,758 | 21.4% |
| High School | 5,550 | 25.0% |
| College / Undergraduate | 4,677 | 21.0% |
| Graduate / Professional | 1,332 | 6.0% |
| Total | 22,220 | 100.0% |
School Enrollment by Age by Funding Source in Putnam County
Out of a total of 22,220 students who are enrolled in schools in Putnam County, 4,888 (22.0%) attend a private institution, while the remaining 17,332 (78.0%) are enrolled in public schools. The age group of 3 to 4 year olds has the highest likelihood of being enrolled in private schools, with 652 (63.5% in the age bracket) enrolled. Conversely, the age group of 15 to 17 year olds has the lowest likelihood of being enrolled in a private school, with 3,621 (94.1% in the age bracket) attending a public institution.
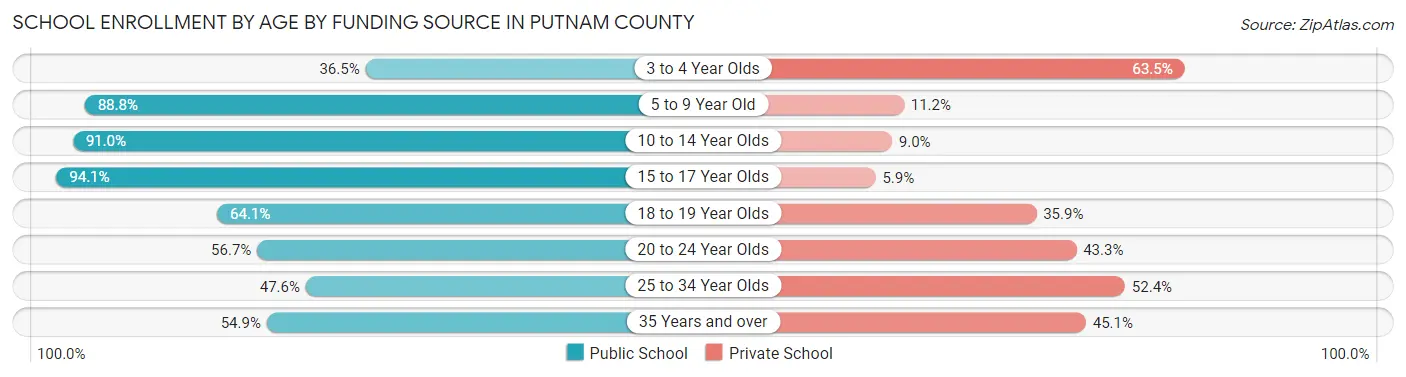
| Age Bracket | Public School | Private School |
| 3 to 4 Year Olds | 375 (36.5%) | 652 (63.5%) |
| 5 to 9 Year Old | 3,974 (88.8%) | 501 (11.2%) |
| 10 to 14 Year Olds | 5,408 (91.0%) | 533 (9.0%) |
| 15 to 17 Year Olds | 3,621 (94.1%) | 228 (5.9%) |
| 18 to 19 Year Olds | 1,148 (64.1%) | 642 (35.9%) |
| 20 to 24 Year Olds | 1,600 (56.7%) | 1,223 (43.3%) |
| 25 to 34 Year Olds | 490 (47.6%) | 539 (52.4%) |
| 35 Years and over | 706 (54.9%) | 580 (45.1%) |
| Total | 17,332 (78.0%) | 4,888 (22.0%) |
Educational Attainment by Field of Study in Putnam County
Business (5,752 | 17.8%), education (4,298 | 13.3%), science & technology (2,695 | 8.3%), social sciences (2,479 | 7.7%), and visual & performing arts (2,240 | 6.9%) are the most common fields of study among 32,296 individuals in Putnam County who have obtained a bachelor's degree or higher.
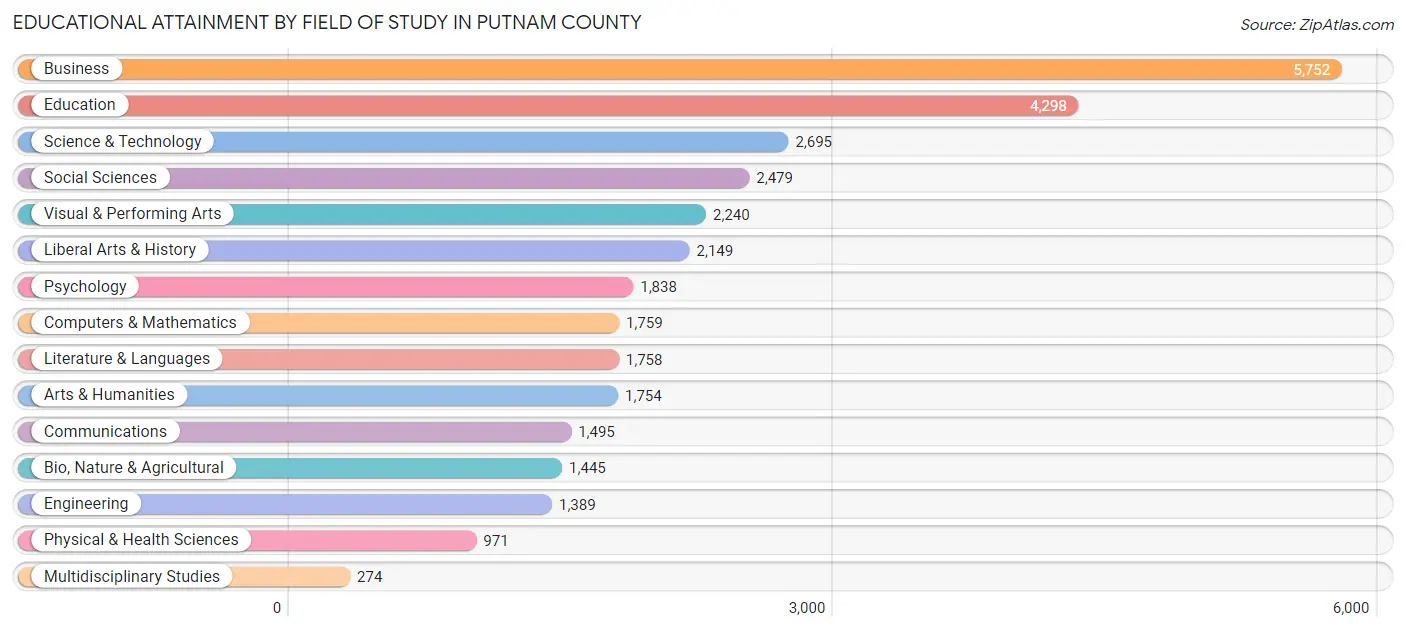
| Field of Study | # Graduates | % Graduates |
| Computers & Mathematics | 1,759 | 5.4% |
| Bio, Nature & Agricultural | 1,445 | 4.5% |
| Physical & Health Sciences | 971 | 3.0% |
| Psychology | 1,838 | 5.7% |
| Social Sciences | 2,479 | 7.7% |
| Engineering | 1,389 | 4.3% |
| Multidisciplinary Studies | 274 | 0.9% |
| Science & Technology | 2,695 | 8.3% |
| Business | 5,752 | 17.8% |
| Education | 4,298 | 13.3% |
| Literature & Languages | 1,758 | 5.4% |
| Liberal Arts & History | 2,149 | 6.7% |
| Visual & Performing Arts | 2,240 | 6.9% |
| Communications | 1,495 | 4.6% |
| Arts & Humanities | 1,754 | 5.4% |
| Total | 32,296 | 100.0% |
Transportation & Commute in Putnam County
Vehicle Availability by Sex in Putnam County
The most prevalent vehicle ownership categories in Putnam County are males with 2 vehicles (11,906, accounting for 44.3%) and females with 2 vehicles (9,163, making up 53.7%).
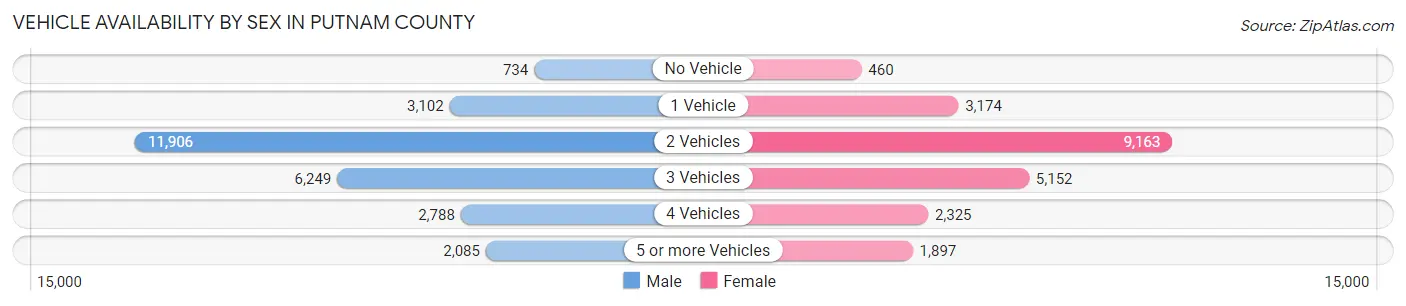
| Vehicles Available | Male | Female |
| No Vehicle | 734 (2.7%) | 460 (2.1%) |
| 1 Vehicle | 3,102 (11.6%) | 3,174 (14.3%) |
| 2 Vehicles | 11,906 (44.3%) | 9,163 (41.3%) |
| 3 Vehicles | 6,249 (23.3%) | 5,152 (23.2%) |
| 4 Vehicles | 2,788 (10.4%) | 2,325 (10.5%) |
| 5 or more Vehicles | 2,085 (7.8%) | 1,897 (8.6%) |
| Total | 26,864 (100.0%) | 22,171 (100.0%) |
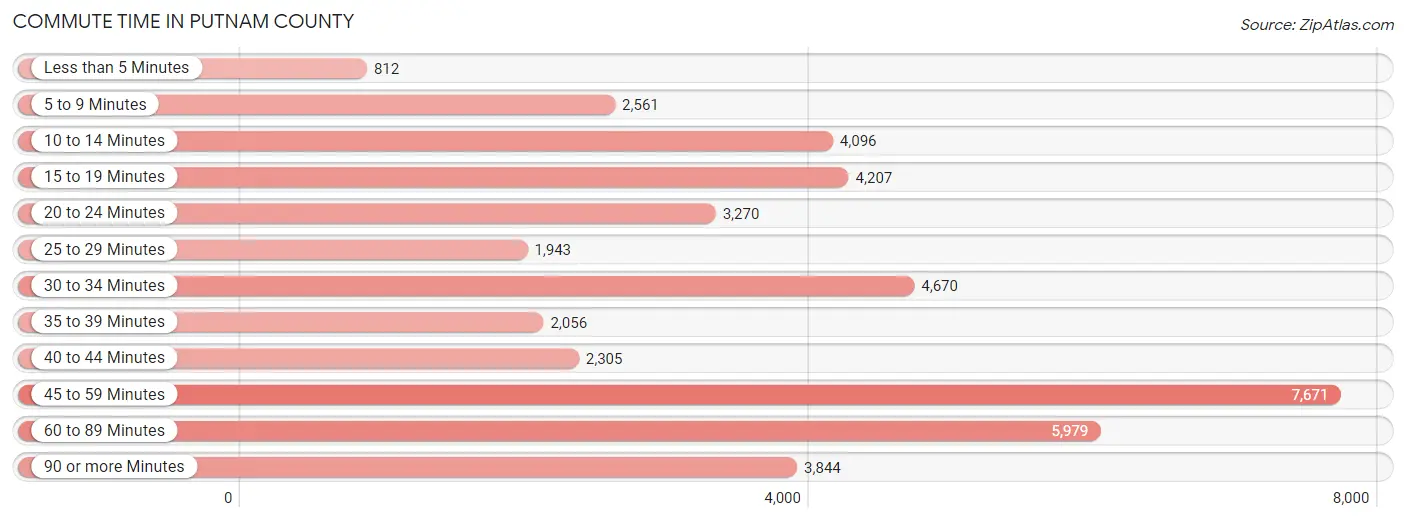
Commute Time in Putnam County
The most frequently occuring commute durations in Putnam County are 45 to 59 minutes (7,671 commuters, 17.7%), 60 to 89 minutes (5,979 commuters, 13.8%), and 30 to 34 minutes (4,670 commuters, 10.8%).
| Commute Time | # Commuters | % Commuters |
| Less than 5 Minutes | 812 | 1.9% |
| 5 to 9 Minutes | 2,561 | 5.9% |
| 10 to 14 Minutes | 4,096 | 9.4% |
| 15 to 19 Minutes | 4,207 | 9.7% |
| 20 to 24 Minutes | 3,270 | 7.5% |
| 25 to 29 Minutes | 1,943 | 4.5% |
| 30 to 34 Minutes | 4,670 | 10.8% |
| 35 to 39 Minutes | 2,056 | 4.7% |
| 40 to 44 Minutes | 2,305 | 5.3% |
| 45 to 59 Minutes | 7,671 | 17.7% |
| 60 to 89 Minutes | 5,979 | 13.8% |
| 90 or more Minutes | 3,844 | 8.8% |
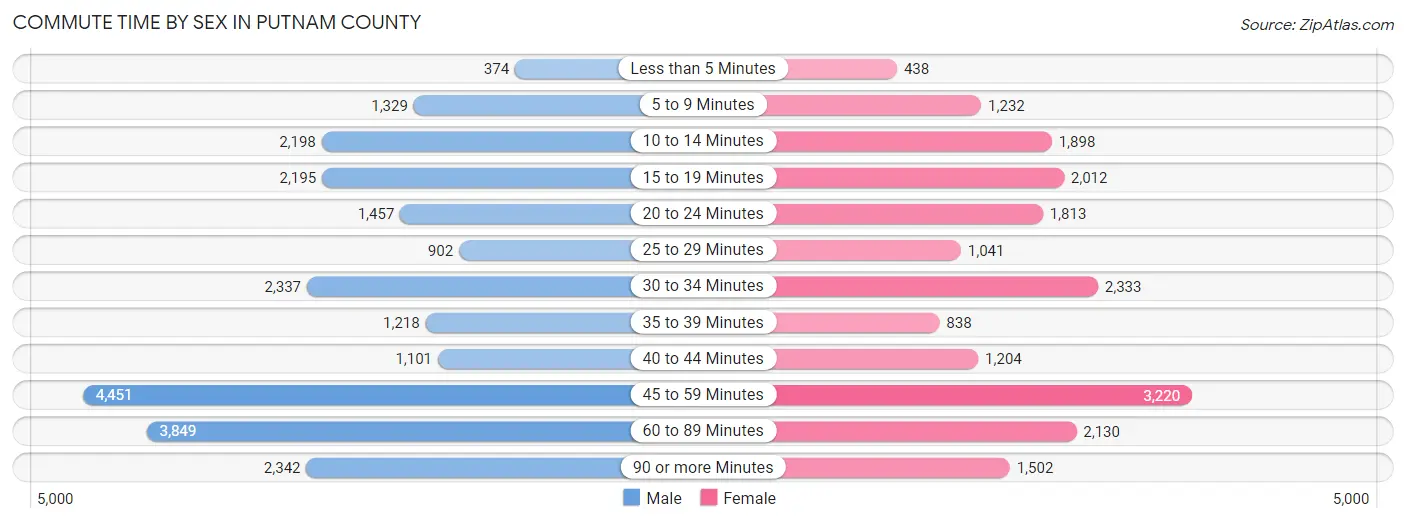
Commute Time by Sex in Putnam County
The most common commute times in Putnam County are 45 to 59 minutes (4,451 commuters, 18.7%) for males and 45 to 59 minutes (3,220 commuters, 16.4%) for females.
| Commute Time | Male | Female |
| Less than 5 Minutes | 374 (1.6%) | 438 (2.2%) |
| 5 to 9 Minutes | 1,329 (5.6%) | 1,232 (6.3%) |
| 10 to 14 Minutes | 2,198 (9.2%) | 1,898 (9.7%) |
| 15 to 19 Minutes | 2,195 (9.2%) | 2,012 (10.2%) |
| 20 to 24 Minutes | 1,457 (6.1%) | 1,813 (9.2%) |
| 25 to 29 Minutes | 902 (3.8%) | 1,041 (5.3%) |
| 30 to 34 Minutes | 2,337 (9.8%) | 2,333 (11.9%) |
| 35 to 39 Minutes | 1,218 (5.1%) | 838 (4.3%) |
| 40 to 44 Minutes | 1,101 (4.6%) | 1,204 (6.1%) |
| 45 to 59 Minutes | 4,451 (18.7%) | 3,220 (16.4%) |
| 60 to 89 Minutes | 3,849 (16.2%) | 2,130 (10.8%) |
| 90 or more Minutes | 2,342 (9.9%) | 1,502 (7.6%) |
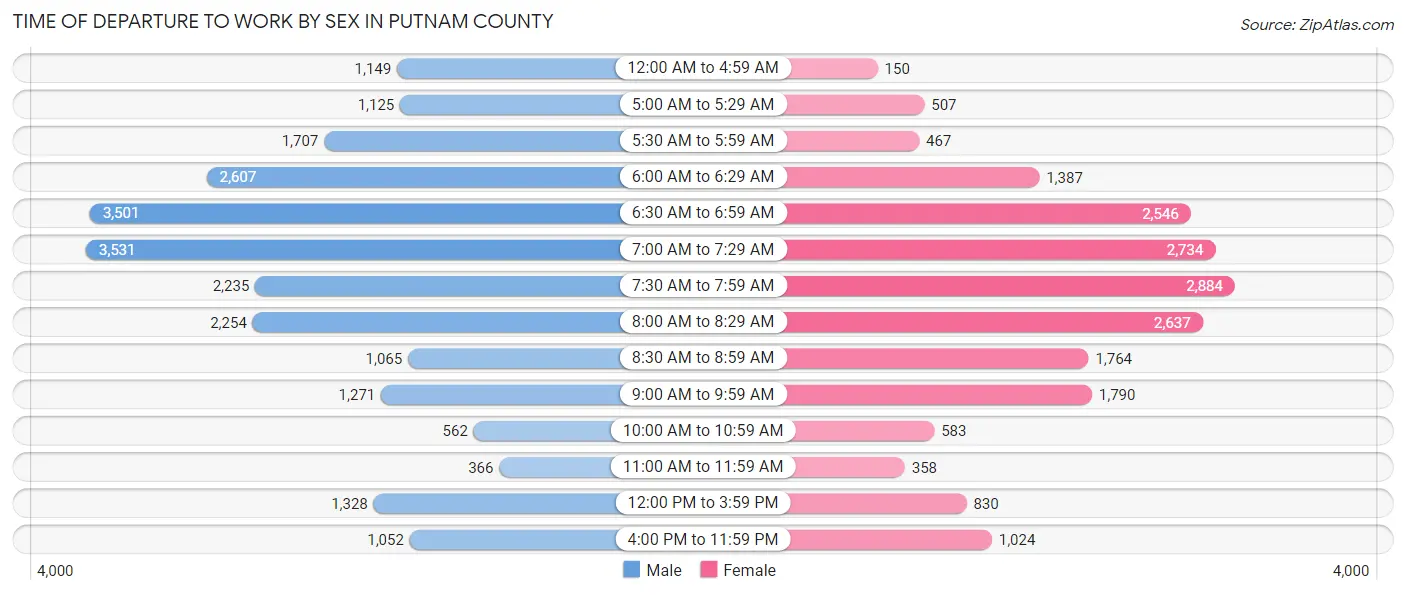
Time of Departure to Work by Sex in Putnam County
The most frequent times of departure to work in Putnam County are 7:00 AM to 7:29 AM (3,531, 14.9%) for males and 7:30 AM to 7:59 AM (2,884, 14.7%) for females.
| Time of Departure | Male | Female |
| 12:00 AM to 4:59 AM | 1,149 (4.8%) | 150 (0.8%) |
| 5:00 AM to 5:29 AM | 1,125 (4.7%) | 507 (2.6%) |
| 5:30 AM to 5:59 AM | 1,707 (7.2%) | 467 (2.4%) |
| 6:00 AM to 6:29 AM | 2,607 (11.0%) | 1,387 (7.0%) |
| 6:30 AM to 6:59 AM | 3,501 (14.7%) | 2,546 (13.0%) |
| 7:00 AM to 7:29 AM | 3,531 (14.9%) | 2,734 (13.9%) |
| 7:30 AM to 7:59 AM | 2,235 (9.4%) | 2,884 (14.7%) |
| 8:00 AM to 8:29 AM | 2,254 (9.5%) | 2,637 (13.4%) |
| 8:30 AM to 8:59 AM | 1,065 (4.5%) | 1,764 (9.0%) |
| 9:00 AM to 9:59 AM | 1,271 (5.3%) | 1,790 (9.1%) |
| 10:00 AM to 10:59 AM | 562 (2.4%) | 583 (3.0%) |
| 11:00 AM to 11:59 AM | 366 (1.5%) | 358 (1.8%) |
| 12:00 PM to 3:59 PM | 1,328 (5.6%) | 830 (4.2%) |
| 4:00 PM to 11:59 PM | 1,052 (4.4%) | 1,024 (5.2%) |
| Total | 23,753 (100.0%) | 19,661 (100.0%) |
Housing Occupancy in Putnam County
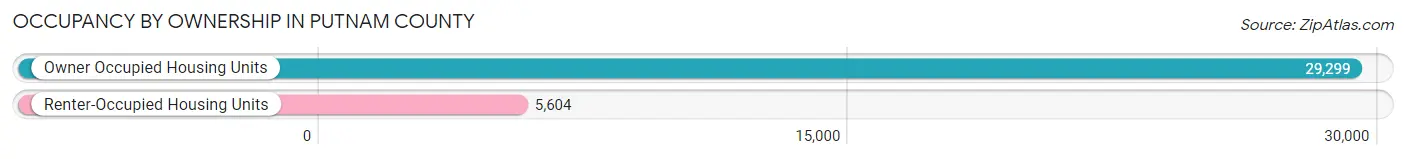
Occupancy by Ownership in Putnam County
Of the total 34,903 dwellings in Putnam County, owner-occupied units account for 29,299 (83.9%), while renter-occupied units make up 5,604 (16.1%).
| Occupancy | # Housing Units | % Housing Units |
| Owner Occupied Housing Units | 29,299 | 83.9% |
| Renter-Occupied Housing Units | 5,604 | 16.1% |
| Total Occupied Housing Units | 34,903 | 100.0% |
Occupancy by Household Size in Putnam County
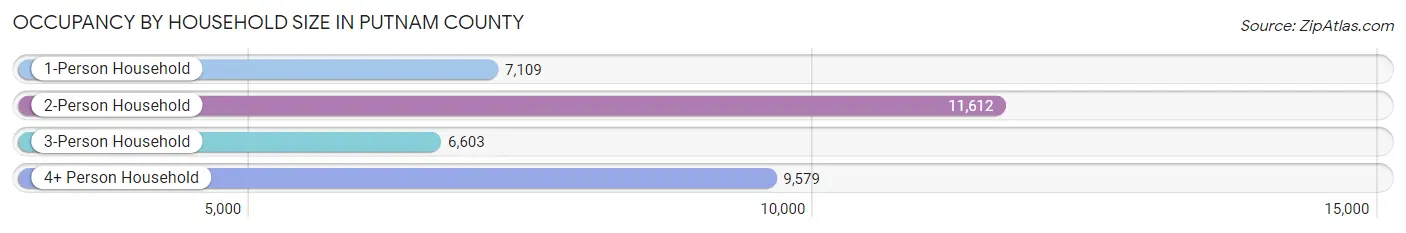
| Household Size | # Housing Units | % Housing Units |
| 1-Person Household | 7,109 | 20.4% |
| 2-Person Household | 11,612 | 33.3% |
| 3-Person Household | 6,603 | 18.9% |
| 4+ Person Household | 9,579 | 27.4% |
| Total Housing Units | 34,903 | 100.0% |
Occupancy by Ownership by Household Size in Putnam County
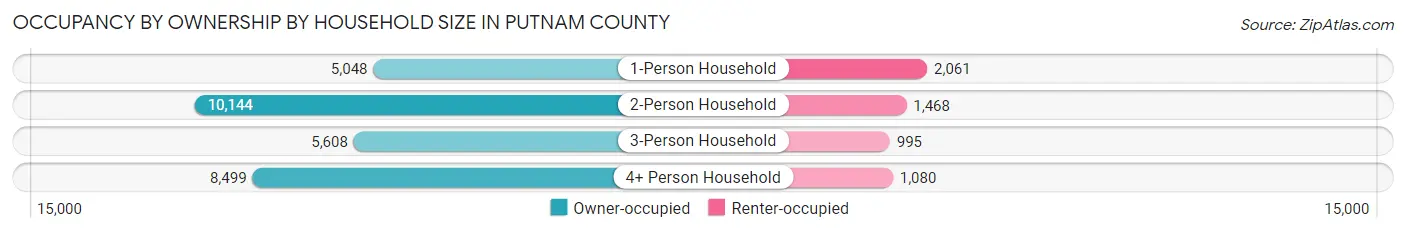
| Household Size | Owner-occupied | Renter-occupied |
| 1-Person Household | 5,048 (71.0%) | 2,061 (29.0%) |
| 2-Person Household | 10,144 (87.4%) | 1,468 (12.6%) |
| 3-Person Household | 5,608 (84.9%) | 995 (15.1%) |
| 4+ Person Household | 8,499 (88.7%) | 1,080 (11.3%) |
| Total Housing Units | 29,299 (83.9%) | 5,604 (16.1%) |
Occupancy by Educational Attainment in Putnam County
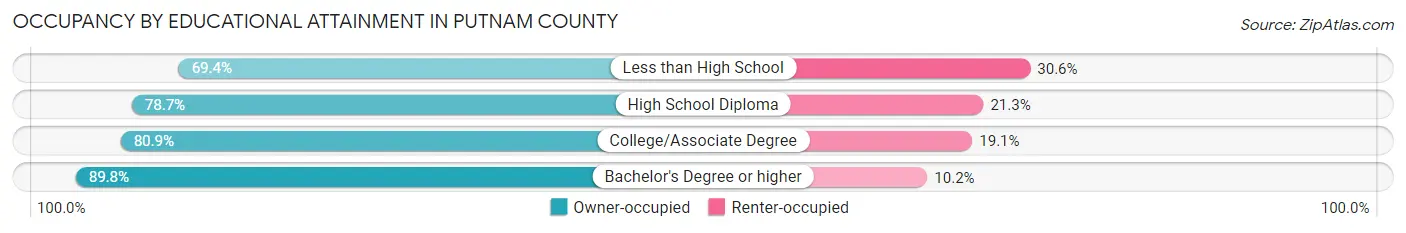
| Household Size | Owner-occupied | Renter-occupied |
| Less than High School | 1,422 (69.4%) | 626 (30.6%) |
| High School Diploma | 5,862 (78.7%) | 1,585 (21.3%) |
| College/Associate Degree | 7,374 (80.9%) | 1,738 (19.1%) |
| Bachelor's Degree or higher | 14,641 (89.8%) | 1,655 (10.2%) |
Occupancy by Age of Householder in Putnam County
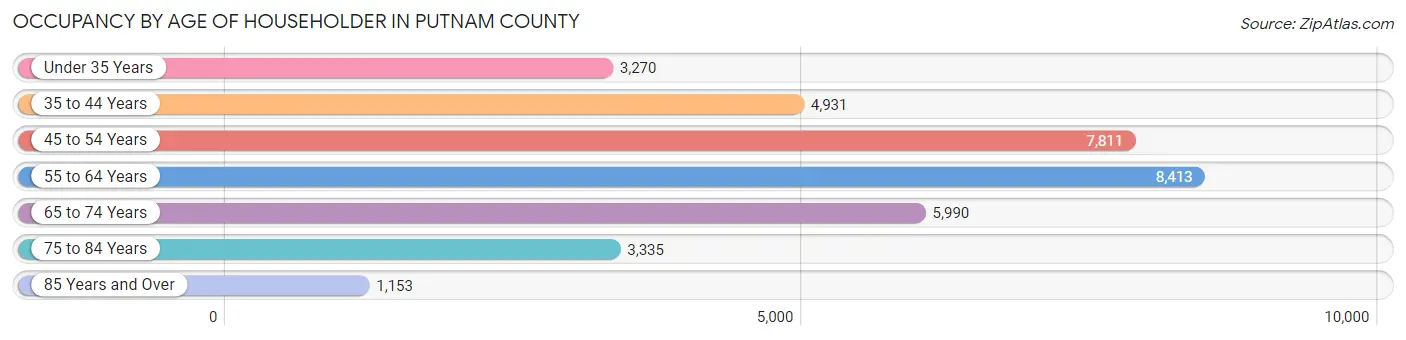
| Age Bracket | # Households | % Households |
| Under 35 Years | 3,270 | 9.4% |
| 35 to 44 Years | 4,931 | 14.1% |
| 45 to 54 Years | 7,811 | 22.4% |
| 55 to 64 Years | 8,413 | 24.1% |
| 65 to 74 Years | 5,990 | 17.2% |
| 75 to 84 Years | 3,335 | 9.6% |
| 85 Years and Over | 1,153 | 3.3% |
| Total | 34,903 | 100.0% |
Housing Finances in Putnam County
Median Income by Occupancy in Putnam County
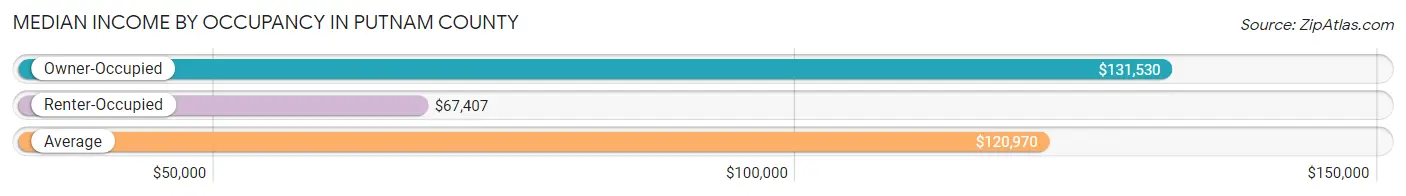
| Occupancy Type | # Households | Median Income |
| Owner-Occupied | 29,299 (83.9%) | $131,530 |
| Renter-Occupied | 5,604 (16.1%) | $67,407 |
| Average | 34,903 (100.0%) | $120,970 |
Occupancy by Householder Income Bracket in Putnam County
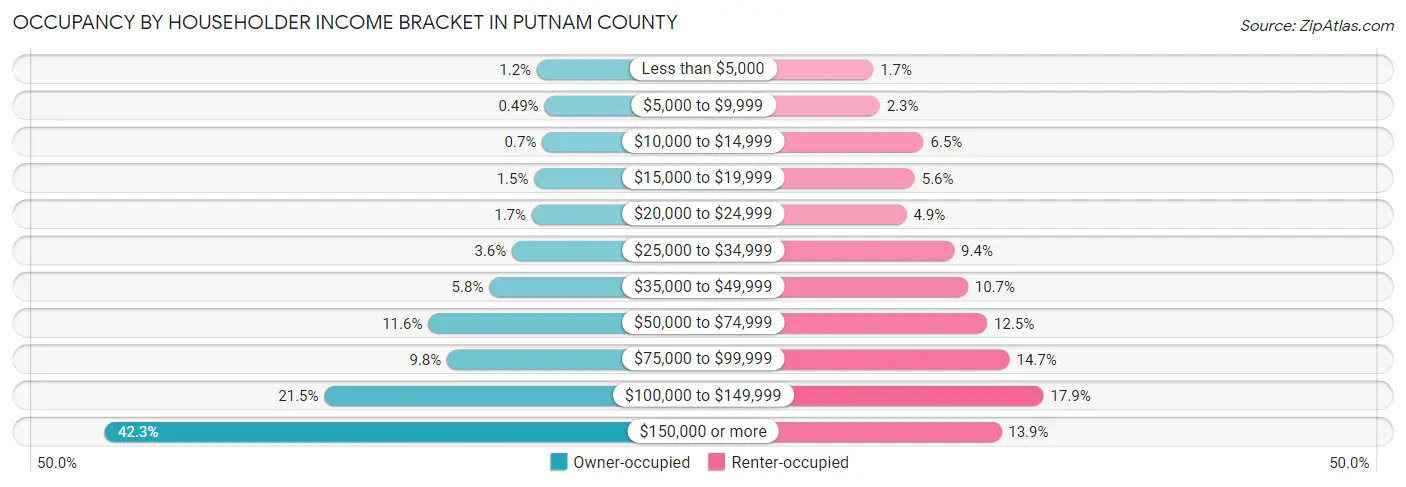
| Income Bracket | Owner-occupied | Renter-occupied |
| Less than $5,000 | 355 (1.2%) | 94 (1.7%) |
| $5,000 to $9,999 | 144 (0.5%) | 129 (2.3%) |
| $10,000 to $14,999 | 206 (0.7%) | 363 (6.5%) |
| $15,000 to $19,999 | 429 (1.5%) | 316 (5.6%) |
| $20,000 to $24,999 | 496 (1.7%) | 272 (4.9%) |
| $25,000 to $34,999 | 1,047 (3.6%) | 526 (9.4%) |
| $35,000 to $49,999 | 1,684 (5.8%) | 599 (10.7%) |
| $50,000 to $74,999 | 3,388 (11.6%) | 702 (12.5%) |
| $75,000 to $99,999 | 2,859 (9.8%) | 822 (14.7%) |
| $100,000 to $149,999 | 6,286 (21.4%) | 1,003 (17.9%) |
| $150,000 or more | 12,405 (42.3%) | 778 (13.9%) |
| Total | 29,299 (100.0%) | 5,604 (100.0%) |
Monthly Housing Cost Tiers in Putnam County
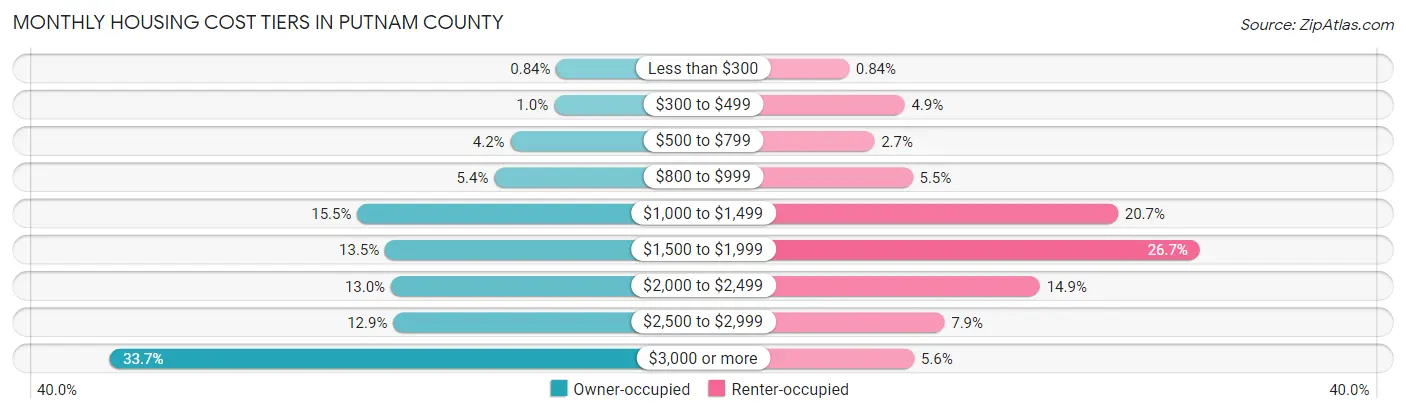
| Monthly Cost | Owner-occupied | Renter-occupied |
| Less than $300 | 247 (0.8%) | 47 (0.8%) |
| $300 to $499 | 295 (1.0%) | 277 (4.9%) |
| $500 to $799 | 1,237 (4.2%) | 152 (2.7%) |
| $800 to $999 | 1,585 (5.4%) | 310 (5.5%) |
| $1,000 to $1,499 | 4,540 (15.5%) | 1,157 (20.6%) |
| $1,500 to $1,999 | 3,942 (13.5%) | 1,495 (26.7%) |
| $2,000 to $2,499 | 3,814 (13.0%) | 835 (14.9%) |
| $2,500 to $2,999 | 3,765 (12.9%) | 441 (7.9%) |
| $3,000 or more | 9,874 (33.7%) | 316 (5.6%) |
| Total | 29,299 (100.0%) | 5,604 (100.0%) |
Physical Housing Characteristics in Putnam County
Housing Structures in Putnam County
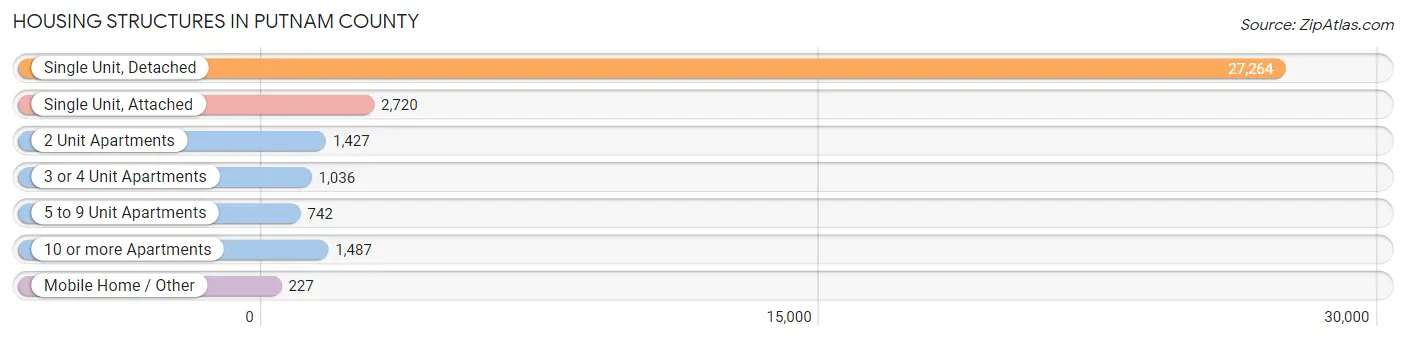
| Structure Type | # Housing Units | % Housing Units |
| Single Unit, Detached | 27,264 | 78.1% |
| Single Unit, Attached | 2,720 | 7.8% |
| 2 Unit Apartments | 1,427 | 4.1% |
| 3 or 4 Unit Apartments | 1,036 | 3.0% |
| 5 to 9 Unit Apartments | 742 | 2.1% |
| 10 or more Apartments | 1,487 | 4.3% |
| Mobile Home / Other | 227 | 0.6% |
| Total | 34,903 | 100.0% |
Housing Structures by Occupancy in Putnam County
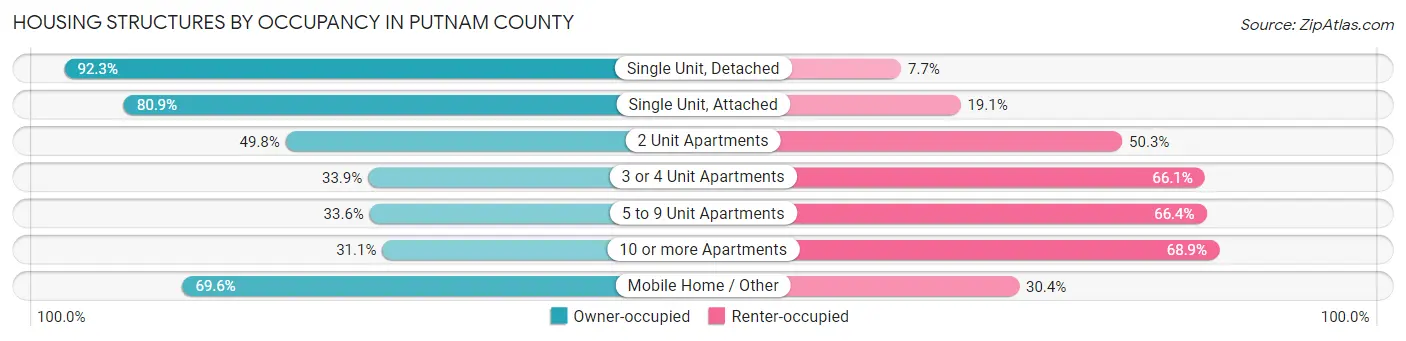
| Structure Type | Owner-occupied | Renter-occupied |
| Single Unit, Detached | 25,168 (92.3%) | 2,096 (7.7%) |
| Single Unit, Attached | 2,200 (80.9%) | 520 (19.1%) |
| 2 Unit Apartments | 710 (49.7%) | 717 (50.2%) |
| 3 or 4 Unit Apartments | 351 (33.9%) | 685 (66.1%) |
| 5 to 9 Unit Apartments | 249 (33.6%) | 493 (66.4%) |
| 10 or more Apartments | 463 (31.1%) | 1,024 (68.9%) |
| Mobile Home / Other | 158 (69.6%) | 69 (30.4%) |
| Total | 29,299 (83.9%) | 5,604 (16.1%) |
Housing Structures by Number of Rooms in Putnam County
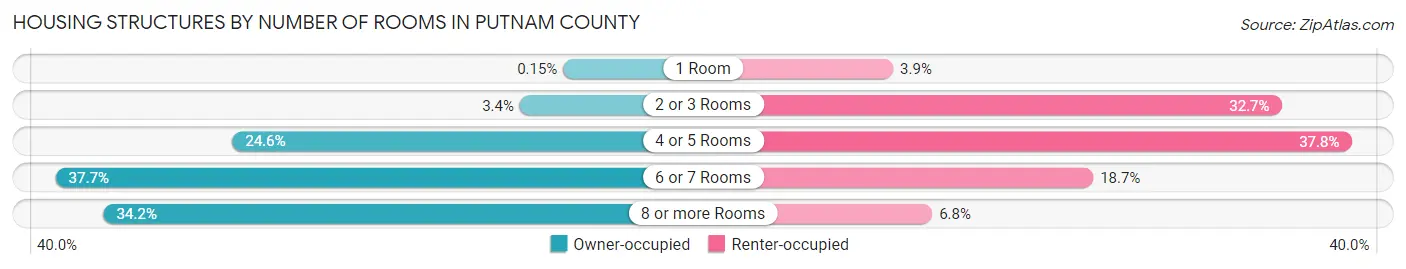
| Number of Rooms | Owner-occupied | Renter-occupied |
| 1 Room | 44 (0.2%) | 221 (3.9%) |
| 2 or 3 Rooms | 983 (3.4%) | 1,830 (32.7%) |
| 4 or 5 Rooms | 7,217 (24.6%) | 2,120 (37.8%) |
| 6 or 7 Rooms | 11,045 (37.7%) | 1,050 (18.7%) |
| 8 or more Rooms | 10,010 (34.2%) | 383 (6.8%) |
| Total | 29,299 (100.0%) | 5,604 (100.0%) |
Housing Structure by Heating Type in Putnam County
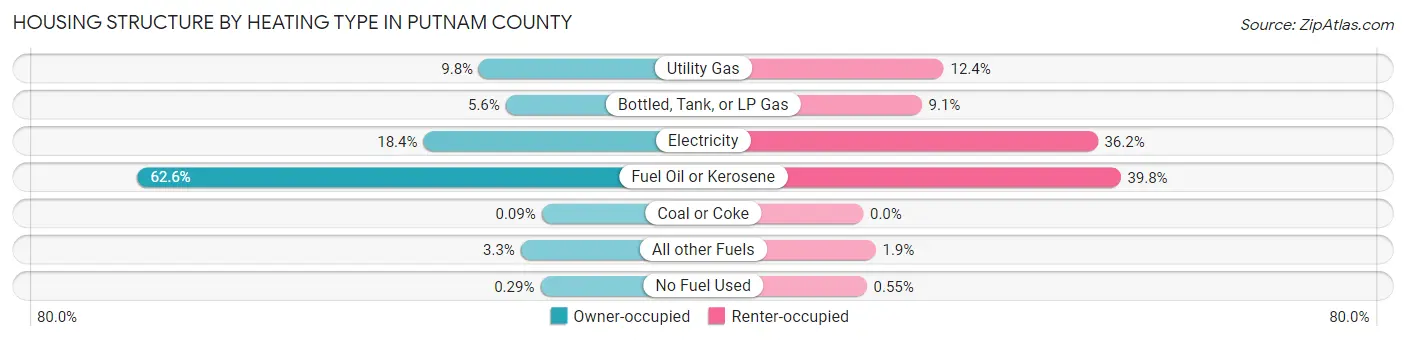
| Heating Type | Owner-occupied | Renter-occupied |
| Utility Gas | 2,862 (9.8%) | 697 (12.4%) |
| Bottled, Tank, or LP Gas | 1,651 (5.6%) | 507 (9.0%) |
| Electricity | 5,381 (18.4%) | 2,031 (36.2%) |
| Fuel Oil or Kerosene | 18,326 (62.5%) | 2,230 (39.8%) |
| Coal or Coke | 25 (0.1%) | 0 (0.0%) |
| All other Fuels | 970 (3.3%) | 108 (1.9%) |
| No Fuel Used | 84 (0.3%) | 31 (0.5%) |
| Total | 29,299 (100.0%) | 5,604 (100.0%) |
Household Vehicle Usage in Putnam County
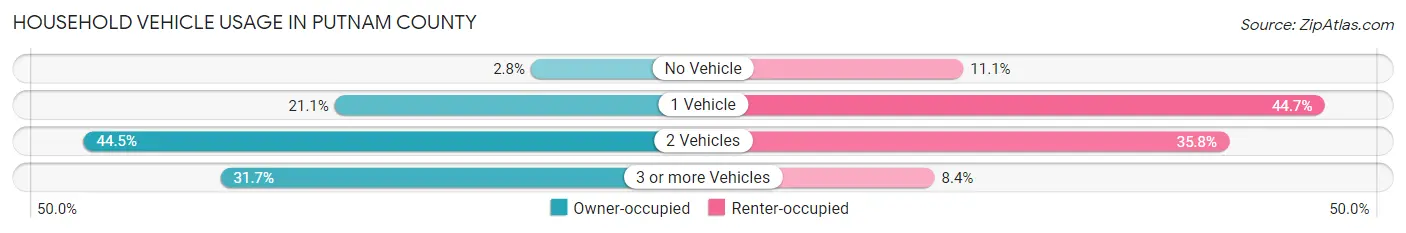
| Vehicles per Household | Owner-occupied | Renter-occupied |
| No Vehicle | 807 (2.8%) | 620 (11.1%) |
| 1 Vehicle | 6,169 (21.1%) | 2,507 (44.7%) |
| 2 Vehicles | 13,035 (44.5%) | 2,008 (35.8%) |
| 3 or more Vehicles | 9,288 (31.7%) | 469 (8.4%) |
| Total | 29,299 (100.0%) | 5,604 (100.0%) |
Real Estate & Mortgages in Putnam County
Real Estate and Mortgage Overview in Putnam County
| Characteristic | Without Mortgage | With Mortgage |
| Housing Units | 9,877 | 19,422 |
| Median Property Value | $406,700 | $429,200 |
| Median Household Income | $97,326 | $9,272 |
| Monthly Housing Costs | $1,241 | $9,627 |
| Real Estate Taxes | $9,790 | $191 |
Property Value by Mortgage Status in Putnam County
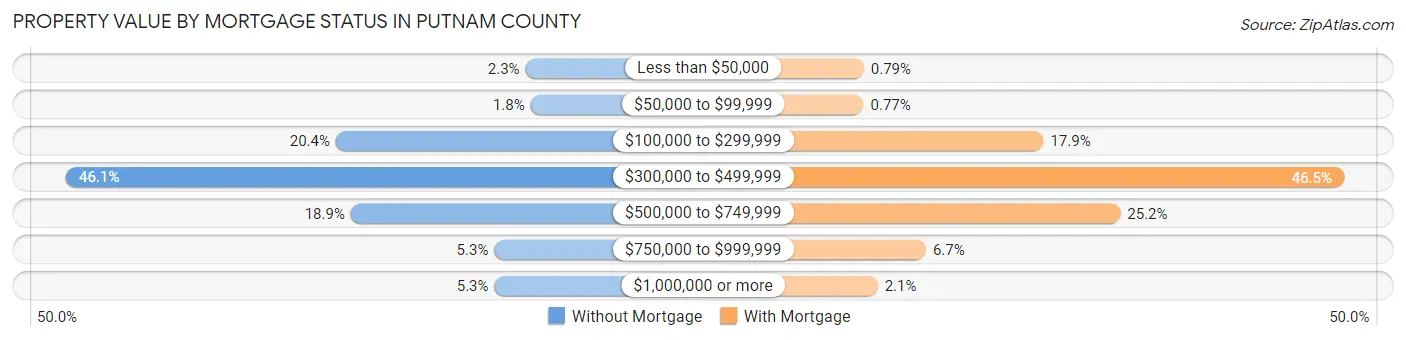
| Property Value | Without Mortgage | With Mortgage |
| Less than $50,000 | 227 (2.3%) | 153 (0.8%) |
| $50,000 to $99,999 | 179 (1.8%) | 149 (0.8%) |
| $100,000 to $299,999 | 2,011 (20.4%) | 3,477 (17.9%) |
| $300,000 to $499,999 | 4,548 (46.1%) | 9,031 (46.5%) |
| $500,000 to $749,999 | 1,871 (18.9%) | 4,898 (25.2%) |
| $750,000 to $999,999 | 521 (5.3%) | 1,304 (6.7%) |
| $1,000,000 or more | 520 (5.3%) | 410 (2.1%) |
| Total | 9,877 (100.0%) | 19,422 (100.0%) |
Household Income by Mortgage Status in Putnam County
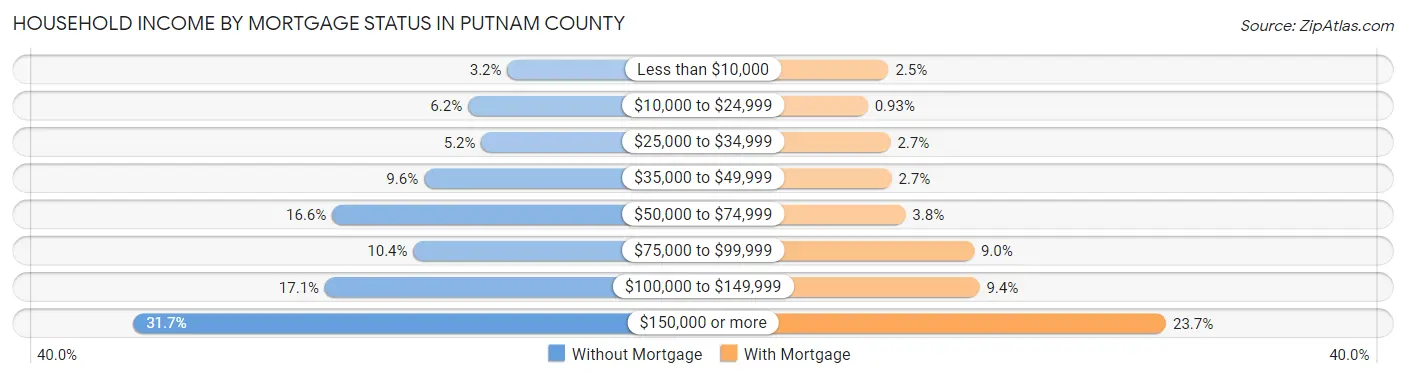
| Household Income | Without Mortgage | With Mortgage |
| Less than $10,000 | 318 (3.2%) | 487 (2.5%) |
| $10,000 to $24,999 | 614 (6.2%) | 181 (0.9%) |
| $25,000 to $34,999 | 514 (5.2%) | 517 (2.7%) |
| $35,000 to $49,999 | 945 (9.6%) | 533 (2.7%) |
| $50,000 to $74,999 | 1,637 (16.6%) | 739 (3.8%) |
| $75,000 to $99,999 | 1,025 (10.4%) | 1,751 (9.0%) |
| $100,000 to $149,999 | 1,691 (17.1%) | 1,834 (9.4%) |
| $150,000 or more | 3,133 (31.7%) | 4,595 (23.7%) |
| Total | 9,877 (100.0%) | 19,422 (100.0%) |
Property Value to Household Income Ratio in Putnam County
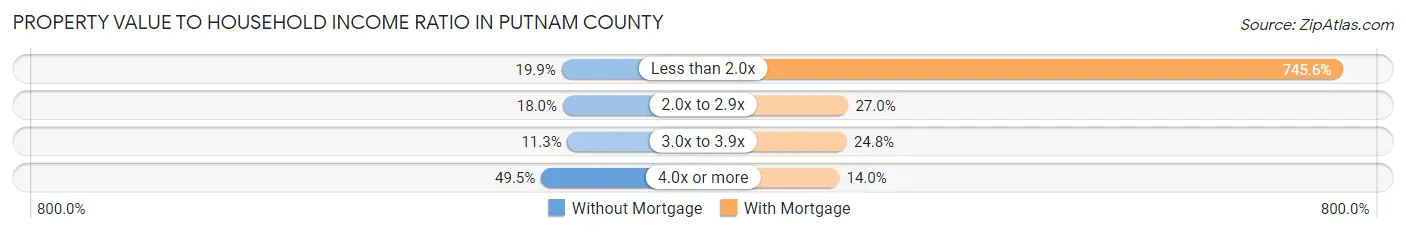
| Value-to-Income Ratio | Without Mortgage | With Mortgage |
| Less than 2.0x | 1,962 (19.9%) | 144,813 (745.6%) |
| 2.0x to 2.9x | 1,776 (18.0%) | 5,241 (27.0%) |
| 3.0x to 3.9x | 1,111 (11.3%) | 4,808 (24.8%) |
| 4.0x or more | 4,891 (49.5%) | 2,725 (14.0%) |
| Total | 9,877 (100.0%) | 19,422 (100.0%) |
Real Estate Taxes by Mortgage Status in Putnam County
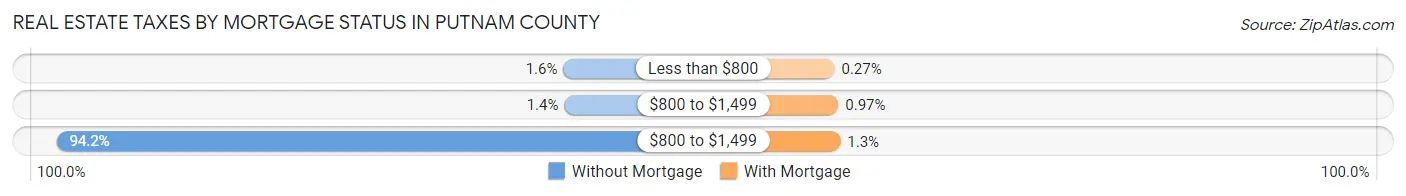
| Property Taxes | Without Mortgage | With Mortgage |
| Less than $800 | 159 (1.6%) | 52 (0.3%) |
| $800 to $1,499 | 141 (1.4%) | 189 (1.0%) |
| $800 to $1,499 | 9,302 (94.2%) | 260 (1.3%) |
| Total | 9,877 (100.0%) | 19,422 (100.0%) |
Health & Disability in Putnam County
Health Insurance Coverage by Age in Putnam County
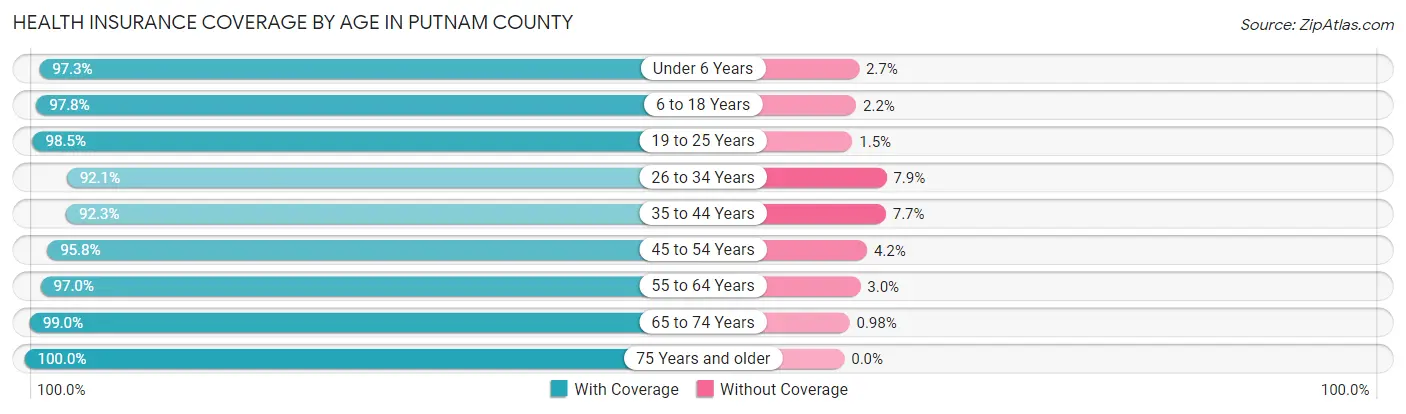
| Age Bracket | With Coverage | Without Coverage |
| Under 6 Years | 5,061 (97.3%) | 142 (2.7%) |
| 6 to 18 Years | 14,648 (97.8%) | 329 (2.2%) |
| 19 to 25 Years | 7,966 (98.5%) | 121 (1.5%) |
| 26 to 34 Years | 9,039 (92.1%) | 771 (7.9%) |
| 35 to 44 Years | 10,914 (92.3%) | 916 (7.7%) |
| 45 to 54 Years | 13,757 (95.8%) | 608 (4.2%) |
| 55 to 64 Years | 15,126 (97.0%) | 467 (3.0%) |
| 65 to 74 Years | 10,496 (99.0%) | 104 (1.0%) |
| 75 Years and older | 7,087 (100.0%) | 0 (0.0%) |
| Total | 94,094 (96.5%) | 3,458 (3.5%) |
Health Insurance Coverage by Citizenship Status in Putnam County
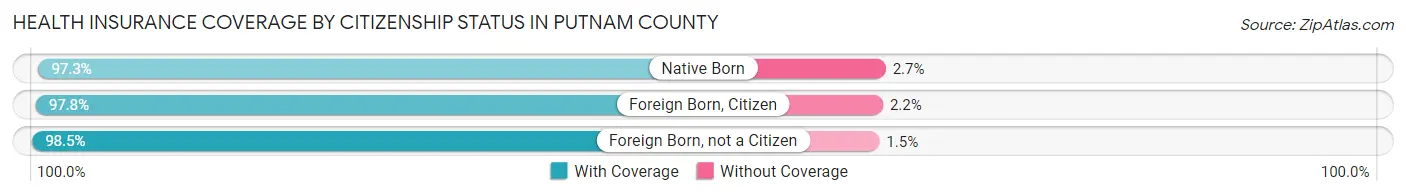
| Citizenship Status | With Coverage | Without Coverage |
| Native Born | 5,061 (97.3%) | 142 (2.7%) |
| Foreign Born, Citizen | 14,648 (97.8%) | 329 (2.2%) |
| Foreign Born, not a Citizen | 7,966 (98.5%) | 121 (1.5%) |
Health Insurance Coverage by Household Income in Putnam County
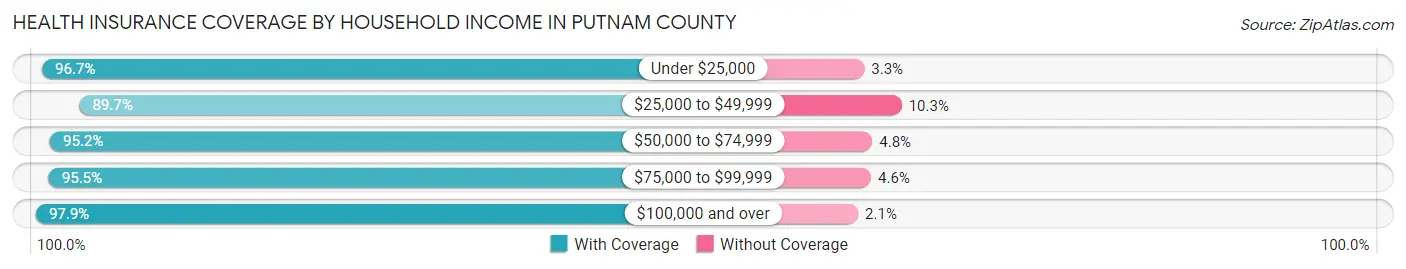
| Household Income | With Coverage | Without Coverage |
| Under $25,000 | 4,062 (96.7%) | 138 (3.3%) |
| $25,000 to $49,999 | 6,248 (89.7%) | 717 (10.3%) |
| $50,000 to $74,999 | 8,304 (95.2%) | 417 (4.8%) |
| $75,000 to $99,999 | 9,214 (95.5%) | 439 (4.5%) |
| $100,000 and over | 64,311 (97.9%) | 1,400 (2.1%) |
Public vs Private Health Insurance Coverage by Age in Putnam County
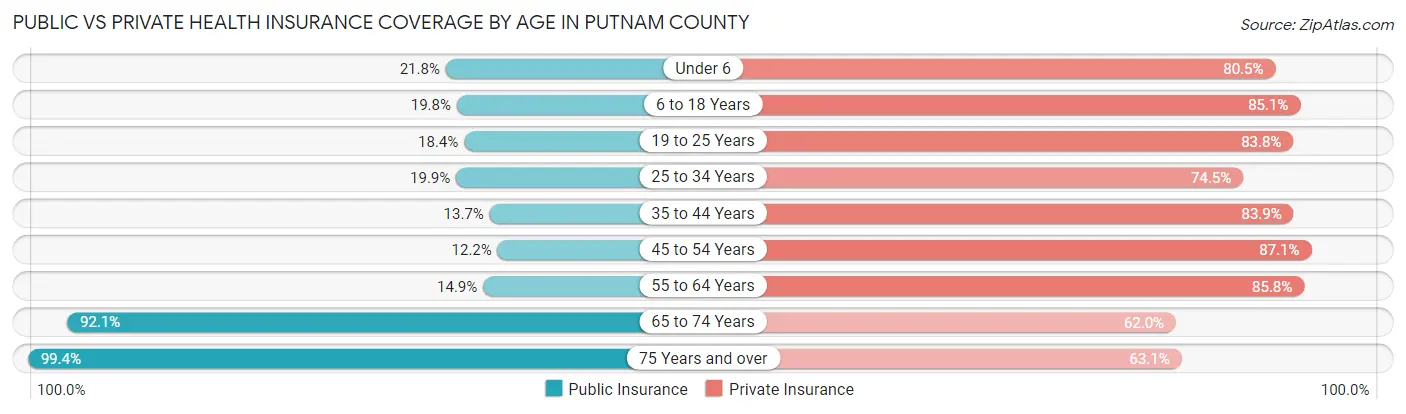
| Age Bracket | Public Insurance | Private Insurance |
| Under 6 | 1,136 (21.8%) | 4,186 (80.4%) |
| 6 to 18 Years | 2,962 (19.8%) | 12,742 (85.1%) |
| 19 to 25 Years | 1,490 (18.4%) | 6,776 (83.8%) |
| 25 to 34 Years | 1,953 (19.9%) | 7,306 (74.5%) |
| 35 to 44 Years | 1,618 (13.7%) | 9,920 (83.9%) |
| 45 to 54 Years | 1,753 (12.2%) | 12,517 (87.1%) |
| 55 to 64 Years | 2,322 (14.9%) | 13,380 (85.8%) |
| 65 to 74 Years | 9,766 (92.1%) | 6,574 (62.0%) |
| 75 Years and over | 7,045 (99.4%) | 4,470 (63.1%) |
| Total | 30,045 (30.8%) | 77,871 (79.8%) |
Disability Status by Sex by Age in Putnam County
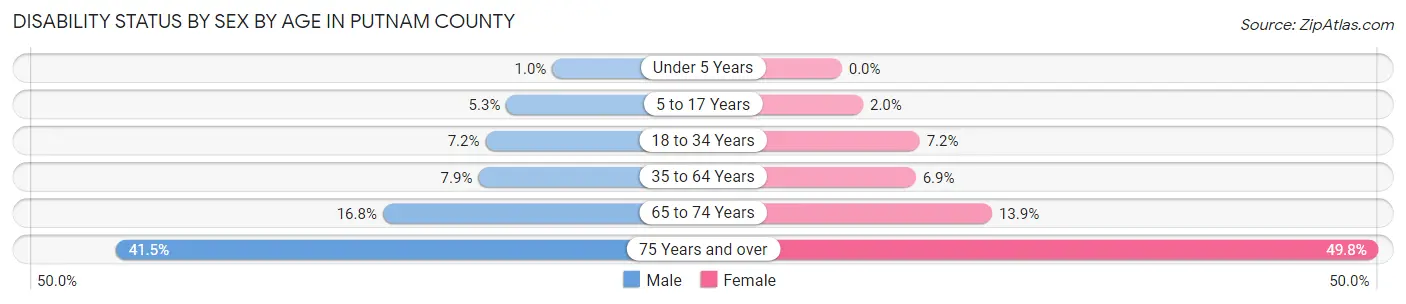
| Age Bracket | Male | Female |
| Under 5 Years | 23 (1.0%) | 0 (0.0%) |
| 5 to 17 Years | 396 (5.3%) | 141 (2.0%) |
| 18 to 34 Years | 722 (7.2%) | 655 (7.2%) |
| 35 to 64 Years | 1,680 (7.9%) | 1,409 (6.9%) |
| 65 to 74 Years | 875 (16.8%) | 750 (13.9%) |
| 75 Years and over | 1,208 (41.5%) | 2,081 (49.8%) |
Disability Class by Sex by Age in Putnam County
Disability Class: Hearing Difficulty
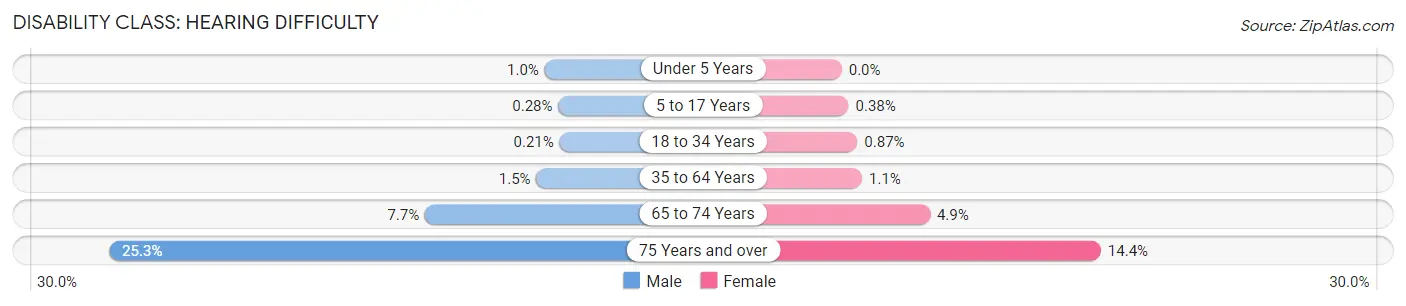
| Age Bracket | Male | Female |
| Under 5 Years | 23 (1.0%) | 0 (0.0%) |
| 5 to 17 Years | 21 (0.3%) | 27 (0.4%) |
| 18 to 34 Years | 21 (0.2%) | 79 (0.9%) |
| 35 to 64 Years | 319 (1.5%) | 231 (1.1%) |
| 65 to 74 Years | 402 (7.7%) | 264 (4.9%) |
| 75 Years and over | 736 (25.3%) | 603 (14.4%) |
Disability Class: Vision Difficulty
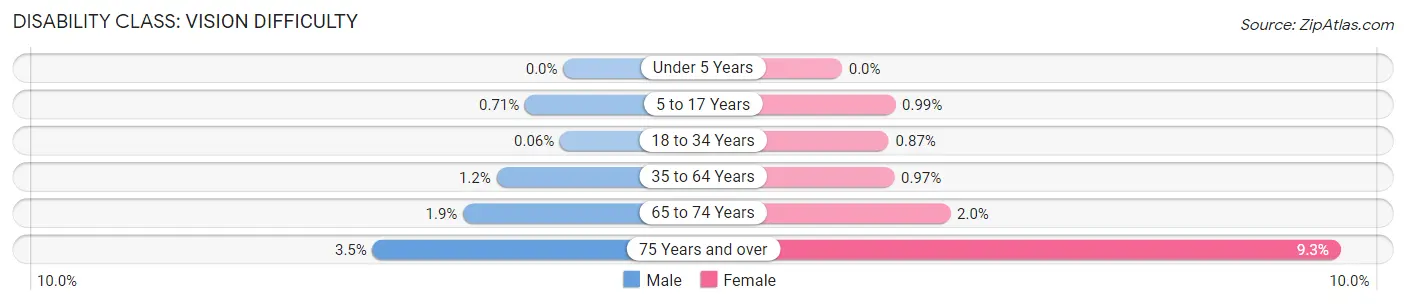
| Age Bracket | Male | Female |
| Under 5 Years | 0 (0.0%) | 0 (0.0%) |
| 5 to 17 Years | 53 (0.7%) | 71 (1.0%) |
| 18 to 34 Years | 6 (0.1%) | 79 (0.9%) |
| 35 to 64 Years | 264 (1.2%) | 199 (1.0%) |
| 65 to 74 Years | 97 (1.9%) | 108 (2.0%) |
| 75 Years and over | 103 (3.5%) | 387 (9.3%) |
Disability Class: Cognitive Difficulty
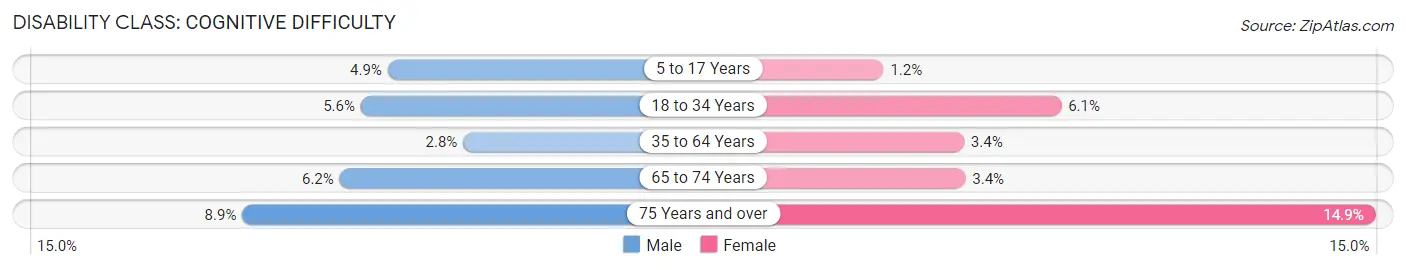
| Age Bracket | Male | Female |
| 5 to 17 Years | 365 (4.9%) | 83 (1.2%) |
| 18 to 34 Years | 563 (5.6%) | 554 (6.1%) |
| 35 to 64 Years | 594 (2.8%) | 697 (3.4%) |
| 65 to 74 Years | 325 (6.2%) | 185 (3.4%) |
| 75 Years and over | 260 (8.9%) | 621 (14.9%) |
Disability Class: Ambulatory Difficulty
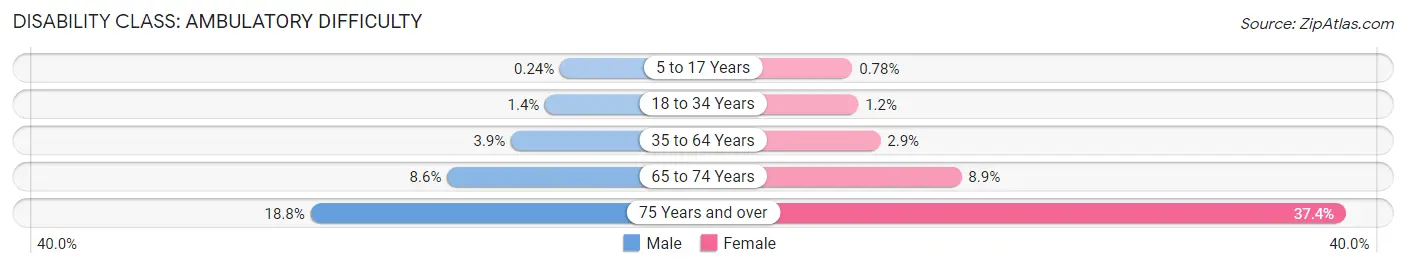
| Age Bracket | Male | Female |
| 5 to 17 Years | 18 (0.2%) | 56 (0.8%) |
| 18 to 34 Years | 135 (1.3%) | 111 (1.2%) |
| 35 to 64 Years | 824 (3.9%) | 588 (2.9%) |
| 65 to 74 Years | 450 (8.6%) | 478 (8.9%) |
| 75 Years and over | 546 (18.8%) | 1,564 (37.4%) |
Disability Class: Self-Care Difficulty
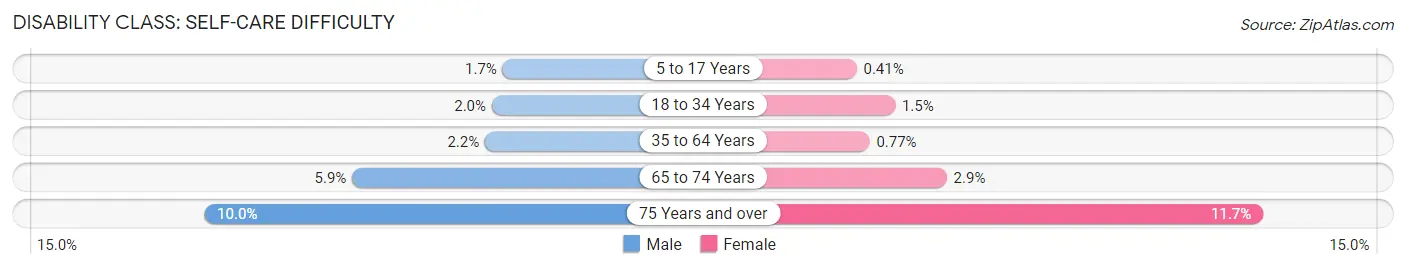
| Age Bracket | Male | Female |
| 5 to 17 Years | 126 (1.7%) | 29 (0.4%) |
| 18 to 34 Years | 199 (2.0%) | 134 (1.5%) |
| 35 to 64 Years | 464 (2.2%) | 159 (0.8%) |
| 65 to 74 Years | 307 (5.9%) | 157 (2.9%) |
| 75 Years and over | 291 (10.0%) | 490 (11.7%) |
Technology Access in Putnam County
Computing Device Access in Putnam County
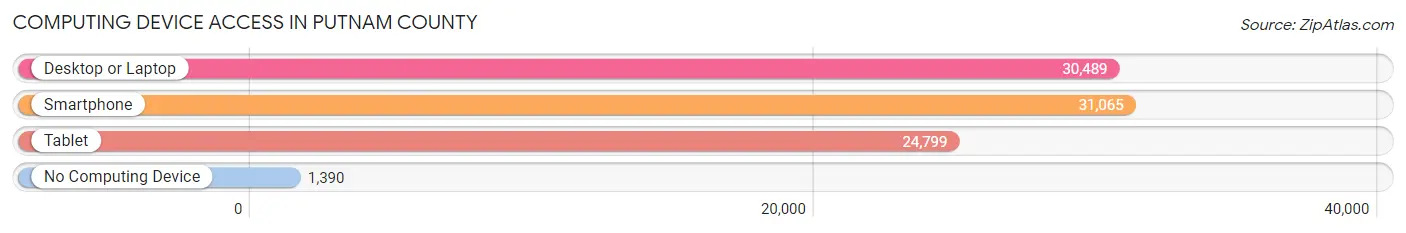
| Device Type | # Households | % Households |
| Desktop or Laptop | 30,489 | 87.4% |
| Smartphone | 31,065 | 89.0% |
| Tablet | 24,799 | 71.1% |
| No Computing Device | 1,390 | 4.0% |
| Total | 34,903 | 100.0% |
Internet Access in Putnam County
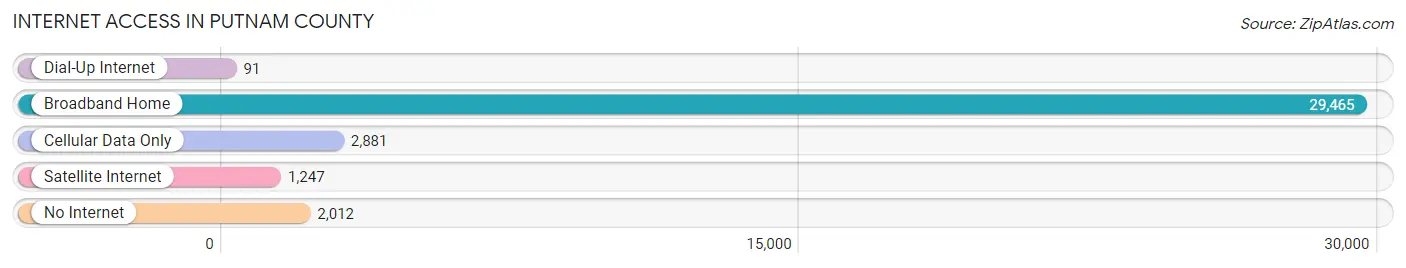
| Internet Type | # Households | % Households |
| Dial-Up Internet | 91 | 0.3% |
| Broadband Home | 29,465 | 84.4% |
| Cellular Data Only | 2,881 | 8.3% |
| Satellite Internet | 1,247 | 3.6% |
| No Internet | 2,012 | 5.8% |
| Total | 34,903 | 100.0% |
Putnam County Summary
Putnam County is located in the southeastern corner of New York State, just north of New York City. It is bordered by Westchester County to the north, Dutchess County to the east, and Fairfield County, Connecticut to the south. Putnam County is part of the New York metropolitan area and is considered part of the Hudson Valley region. The county seat is Carmel.
History
Putnam County was established in 1812 from parts of Dutchess and Westchester counties. It was named after Israel Putnam, a Revolutionary War hero. The county was originally inhabited by the Wappinger Indians, who were part of the larger Algonquin nation. The first European settlers arrived in the area in the late 17th century.
The county was an agricultural area for much of its history, with dairy farming and apple orchards being the main industries. The county also had a thriving tourism industry, with many people coming to the area to enjoy the natural beauty of the Hudson Valley.
In the late 19th century, the county began to industrialize, with the development of the New York Central Railroad and the construction of the Croton Aqueduct. This brought an influx of people to the area, and the population of the county grew rapidly.
Geography
Putnam County covers an area of 437 square miles and is located in the southeastern corner of New York State. It is bordered by Westchester County to the north, Dutchess County to the east, and Fairfield County, Connecticut to the south. The county is part of the Hudson Valley region and is located in the Appalachian Mountains.
The terrain of the county is mostly hilly, with the highest point being Schunemunk Mountain at 1,664 feet. The county is home to several rivers, including the Croton River, the Saw Mill River, and the Hudson River.
Economy
The economy of Putnam County is largely based on tourism, with many people coming to the area to enjoy the natural beauty of the Hudson Valley. The county is also home to several large corporations, including IBM, PepsiCo, and Nestle.
The county is also home to several small businesses, including wineries, breweries, and farms. The county is also home to several educational institutions, including the State University of New York at Purchase and Marist College.
Demographics
As of the 2010 census, Putnam County had a population of 99,710. The population is mostly white (90.2%), with small percentages of African Americans (3.2%), Asians (2.2%), and Hispanics (2.7%). The median household income is $87,845, and the median age is 43.
The county is home to several small towns, including Carmel, Brewster, and Cold Spring. The county seat is Carmel, which is the largest town in the county with a population of 5,914.
Common Questions
What is Per Capita Income in Putnam County?
Per Capita income in Putnam County is $53,105.
What is the Median Family Income in Putnam County?
Median Family Income in Putnam County is $137,946.
What is the Median Household income in Putnam County?
Median Household Income in Putnam County is $120,970.
What is Income or Wage Gap in Putnam County?
Income or Wage Gap in Putnam County is 31.3%.
Women in Putnam County earn 68.7 cents for every dollar earned by a man.
What is Family Income Deficit in Putnam County?
Family Income Deficit in Putnam County is $9,339.
Families that are below poverty line in Putnam County earn $9,339 less on average than the poverty threshold level.
What is Inequality or Gini Index in Putnam County?
Inequality or Gini Index in Putnam County is 0.42.
What is the Total Population of Putnam County?
Total Population of Putnam County is 97,942.
What is the Total Male Population of Putnam County?
Total Male Population of Putnam County is 49,280.
What is the Total Female Population of Putnam County?
Total Female Population of Putnam County is 48,662.
What is the Ratio of Males per 100 Females in Putnam County?
There are 101.27 Males per 100 Females in Putnam County.
What is the Ratio of Females per 100 Males in Putnam County?
There are 98.75 Females per 100 Males in Putnam County.
What is the Median Population Age in Putnam County?
Median Population Age in Putnam County is 44.1 Years.
What is the Average Family Size in Putnam County
Average Family Size in Putnam County is 3.1 People.
What is the Average Household Size in Putnam County
Average Household Size in Putnam County is 2.7 People.
How Large is the Labor Force in Putnam County?
There are 52,534 People in the Labor Forcein in Putnam County.
What is the Percentage of People in the Labor Force in Putnam County?
64.7% of People are in the Labor Force in Putnam County.
What is the Unemployment Rate in Putnam County?
Unemployment Rate in Putnam County is 4.4%.