Orleans County, NY Map & Demographics
Orleans County Map
Orleans County Overview
$33,054
PER CAPITA INCOME
$78,370
AVG FAMILY INCOME
$61,069
AVG HOUSEHOLD INCOME
24.2%
WAGE / INCOME GAP [ % ]
75.8¢/ $1
WAGE / INCOME GAP [ $ ]
$12,858
FAMILY INCOME DEFICIT
0.44
INEQUALITY / GINI INDEX
40,148
TOTAL POPULATION
20,464
MALE POPULATION
19,684
FEMALE POPULATION
103.96
MALES / 100 FEMALES
96.19
FEMALES / 100 MALES
43.2
MEDIAN AGE
2.9
AVG FAMILY SIZE
2.3
AVG HOUSEHOLD SIZE
18,988
LABOR FORCE [ PEOPLE ]
56.8%
PERCENT IN LABOR FORCE
6.1%
UNEMPLOYMENT RATE
Income in Orleans County
Income Overview in Orleans County
Per Capita Income in Orleans County is $33,054, while median incomes of families and households are $78,370 and $61,069 respectively.
| Characteristic | Number | Measure |
| Per Capita Income | 40,148 | $33,054 |
| Median Family Income | 10,468 | $78,370 |
| Mean Family Income | 10,468 | $97,047 |
| Median Household Income | 16,201 | $61,069 |
| Mean Household Income | 16,201 | $80,669 |
| Income Deficit | 10,468 | $12,858 |
| Wage / Income Gap (%) | 40,148 | 24.20% |
| Wage / Income Gap ($) | 40,148 | 75.80¢ per $1 |
| Gini / Inequality Index | 40,148 | 0.44 |
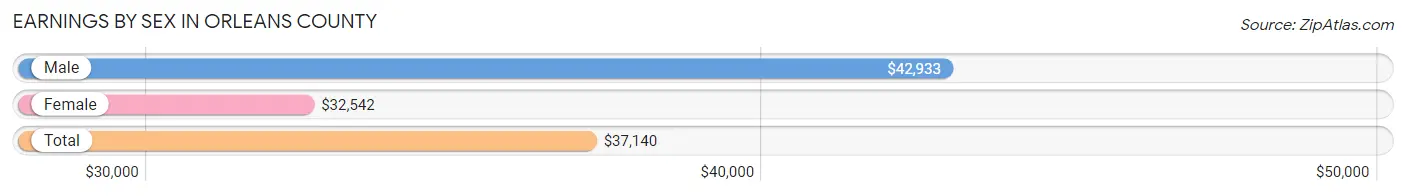
Earnings by Sex in Orleans County
Average Earnings in Orleans County are $37,140, $42,933 for men and $32,542 for women, a difference of 24.2%.
| Sex | Number | Average Earnings |
| Male | 11,027 (54.2%) | $42,933 |
| Female | 9,331 (45.8%) | $32,542 |
| Total | 20,358 (100.0%) | $37,140 |
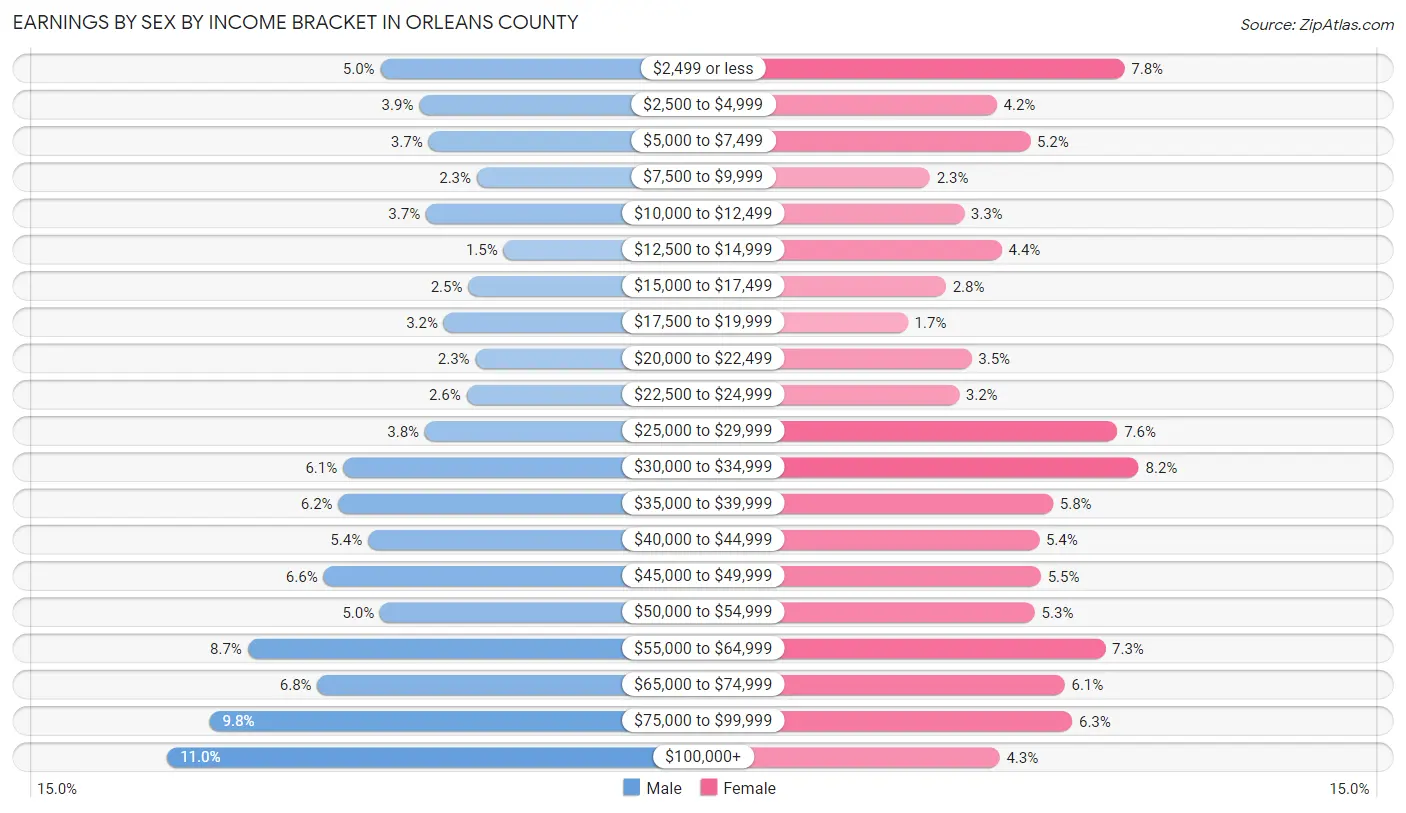
Earnings by Sex by Income Bracket in Orleans County
The most common earnings brackets in Orleans County are $100,000+ for men (1,212 | 11.0%) and $30,000 to $34,999 for women (765 | 8.2%).
| Income | Male | Female |
| $2,499 or less | 551 (5.0%) | 728 (7.8%) |
| $2,500 to $4,999 | 431 (3.9%) | 393 (4.2%) |
| $5,000 to $7,499 | 403 (3.6%) | 481 (5.1%) |
| $7,500 to $9,999 | 253 (2.3%) | 217 (2.3%) |
| $10,000 to $12,499 | 410 (3.7%) | 307 (3.3%) |
| $12,500 to $14,999 | 170 (1.5%) | 406 (4.3%) |
| $15,000 to $17,499 | 279 (2.5%) | 259 (2.8%) |
| $17,500 to $19,999 | 355 (3.2%) | 160 (1.7%) |
| $20,000 to $22,499 | 257 (2.3%) | 327 (3.5%) |
| $22,500 to $24,999 | 285 (2.6%) | 294 (3.2%) |
| $25,000 to $29,999 | 413 (3.7%) | 709 (7.6%) |
| $30,000 to $34,999 | 667 (6.0%) | 765 (8.2%) |
| $35,000 to $39,999 | 681 (6.2%) | 540 (5.8%) |
| $40,000 to $44,999 | 590 (5.3%) | 504 (5.4%) |
| $45,000 to $49,999 | 728 (6.6%) | 509 (5.4%) |
| $50,000 to $54,999 | 552 (5.0%) | 493 (5.3%) |
| $55,000 to $64,999 | 963 (8.7%) | 677 (7.3%) |
| $65,000 to $74,999 | 746 (6.8%) | 571 (6.1%) |
| $75,000 to $99,999 | 1,081 (9.8%) | 591 (6.3%) |
| $100,000+ | 1,212 (11.0%) | 400 (4.3%) |
| Total | 11,027 (100.0%) | 9,331 (100.0%) |
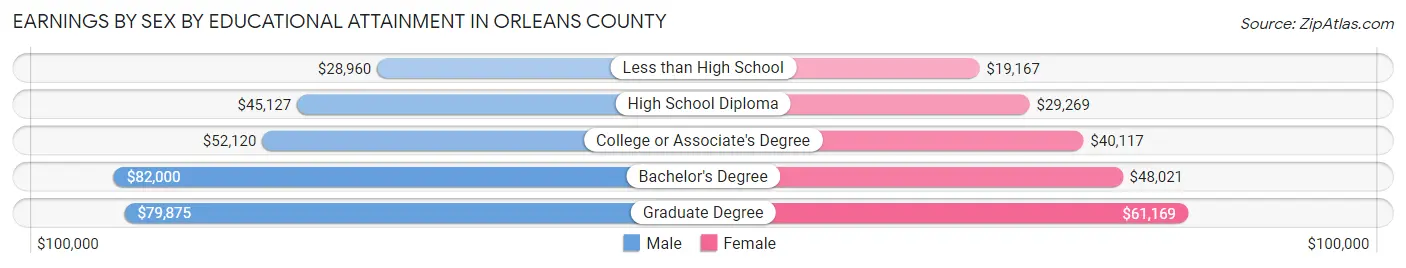
Earnings by Sex by Educational Attainment in Orleans County
Average earnings in Orleans County are $46,934 for men and $36,281 for women, a difference of 22.7%. Men with an educational attainment of bachelor's degree enjoy the highest average annual earnings of $82,000, while those with less than high school education earn the least with $28,960. Women with an educational attainment of graduate degree earn the most with the average annual earnings of $61,169, while those with less than high school education have the smallest earnings of $19,167.
| Educational Attainment | Male Income | Female Income |
| Less than High School | $28,960 | $19,167 |
| High School Diploma | $45,127 | $29,269 |
| College or Associate's Degree | $52,120 | $40,117 |
| Bachelor's Degree | $82,000 | $48,021 |
| Graduate Degree | $79,875 | $61,169 |
| Total | $46,934 | $36,281 |
Family Income in Orleans County
Family Income Brackets in Orleans County
According to the Orleans County family income data, there are 1,811 families falling into the $100,000 to $149,999 income range, which is the most common income bracket and makes up 17.3% of all families. Conversely, the $10,000 to $14,999 income bracket is the least frequent group with only 157 families (1.5%) belonging to this category.
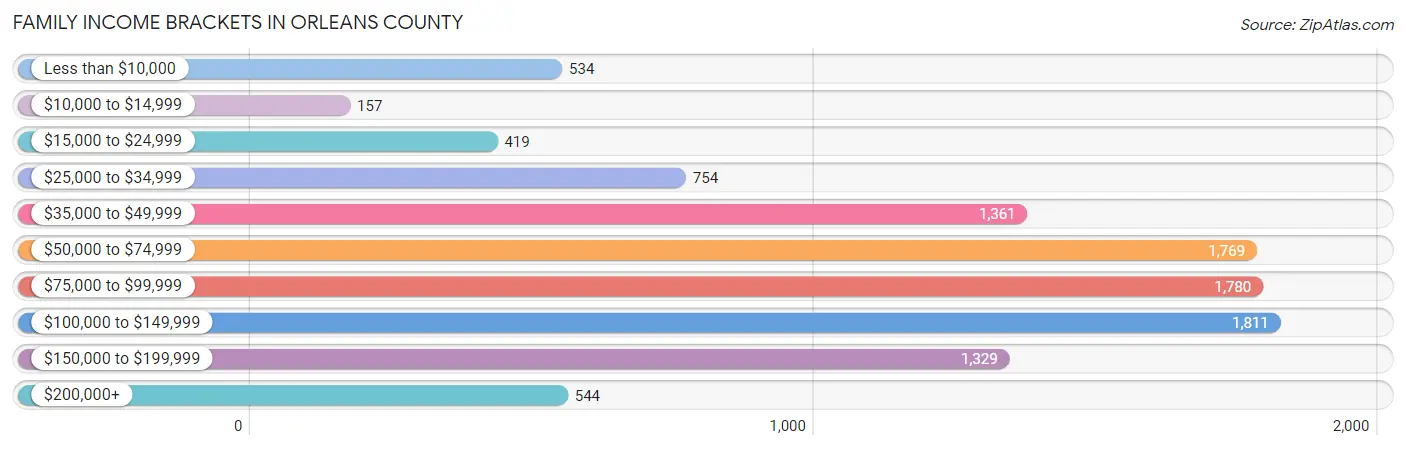
| Income Bracket | # Families | % Families |
| Less than $10,000 | 534 | 5.1% |
| $10,000 to $14,999 | 157 | 1.5% |
| $15,000 to $24,999 | 419 | 4.0% |
| $25,000 to $34,999 | 754 | 7.2% |
| $35,000 to $49,999 | 1,361 | 13.0% |
| $50,000 to $74,999 | 1,769 | 16.9% |
| $75,000 to $99,999 | 1,780 | 17.0% |
| $100,000 to $149,999 | 1,811 | 17.3% |
| $150,000 to $199,999 | 1,329 | 12.7% |
| $200,000+ | 544 | 5.2% |
Family Income by Famaliy Size in Orleans County
6-person families (401 | 3.8%) account for the highest median family income in Orleans County with $124,632 per family, while 2-person families (5,532 | 52.8%) have the highest median income of $36,179 per family member.
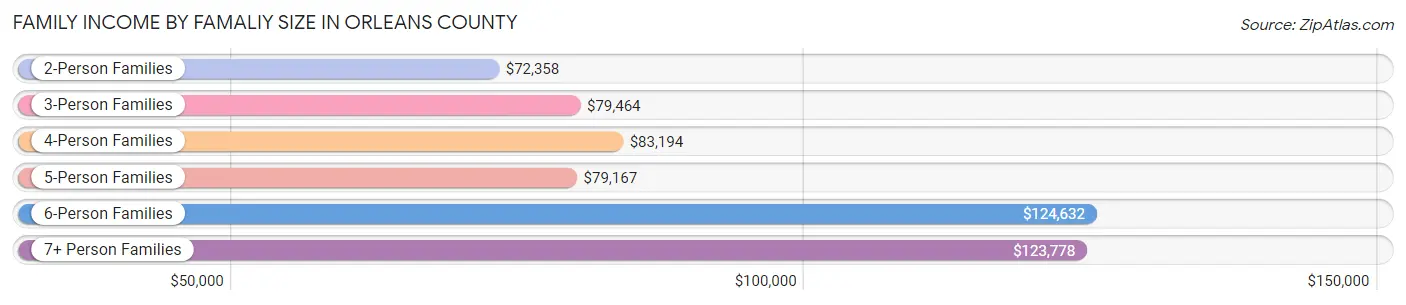
| Income Bracket | # Families | Median Income |
| 2-Person Families | 5,532 (52.8%) | $72,358 |
| 3-Person Families | 2,269 (21.7%) | $79,464 |
| 4-Person Families | 1,513 (14.4%) | $83,194 |
| 5-Person Families | 638 (6.1%) | $79,167 |
| 6-Person Families | 401 (3.8%) | $124,632 |
| 7+ Person Families | 115 (1.1%) | $123,778 |
| Total | 10,468 (100.0%) | $78,370 |
Family Income by Number of Earners in Orleans County
The median family income in Orleans County is $78,370, with families comprising 3+ earners (1,235) having the highest median family income of $134,236, while families with no earners (1,826) have the lowest median family income of $44,830, accounting for 11.8% and 17.4% of families, respectively.
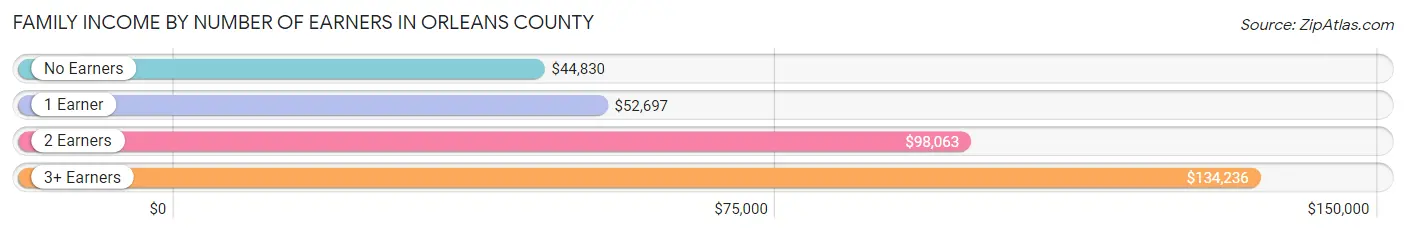
| Number of Earners | # Families | Median Income |
| No Earners | 1,826 (17.4%) | $44,830 |
| 1 Earner | 3,686 (35.2%) | $52,697 |
| 2 Earners | 3,721 (35.5%) | $98,063 |
| 3+ Earners | 1,235 (11.8%) | $134,236 |
| Total | 10,468 (100.0%) | $78,370 |
Household Income in Orleans County
Household Income Brackets in Orleans County
With 2,965 households falling in the category, the $50,000 to $74,999 income range is the most frequent in Orleans County, accounting for 18.3% of all households. In contrast, only 567 households (3.5%) fall into the $200,000+ income bracket, making it the least populous group.
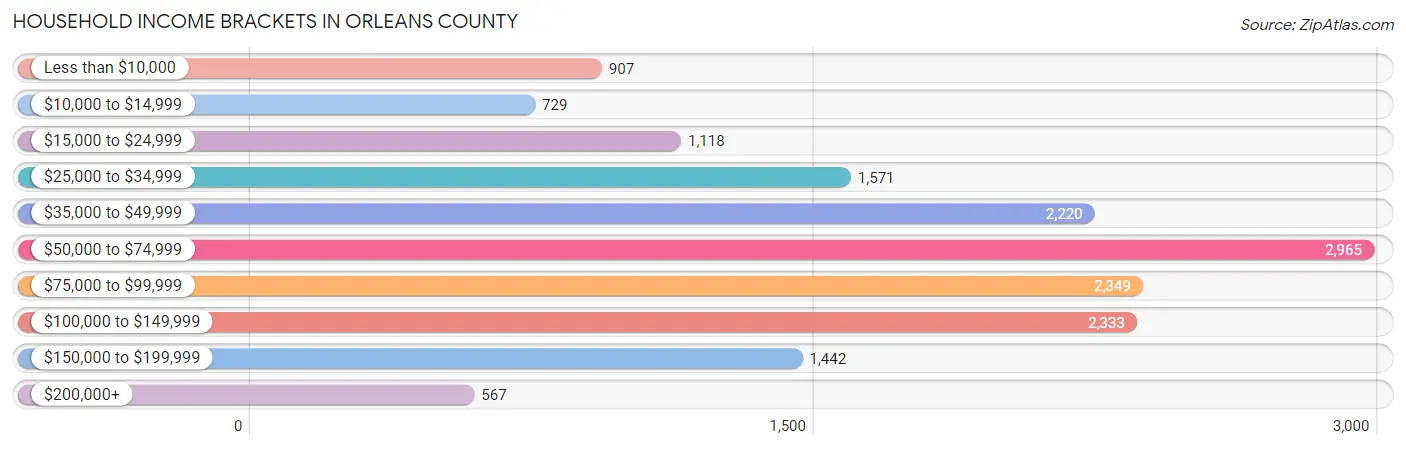
| Income Bracket | # Households | % Households |
| Less than $10,000 | 907 | 5.6% |
| $10,000 to $14,999 | 729 | 4.5% |
| $15,000 to $24,999 | 1,118 | 6.9% |
| $25,000 to $34,999 | 1,571 | 9.7% |
| $35,000 to $49,999 | 2,220 | 13.7% |
| $50,000 to $74,999 | 2,965 | 18.3% |
| $75,000 to $99,999 | 2,349 | 14.5% |
| $100,000 to $149,999 | 2,333 | 14.4% |
| $150,000 to $199,999 | 1,442 | 8.9% |
| $200,000+ | 567 | 3.5% |
Household Income by Householder Age in Orleans County
The median household income in Orleans County is $61,069, with the highest median household income of $79,022 found in the 45 to 64 years age bracket for the primary householder. A total of 6,535 households (40.3%) fall into this category. Meanwhile, the 65+ years age bracket for the primary householder has the lowest median household income of $47,335, with 4,795 households (29.6%) in this group.
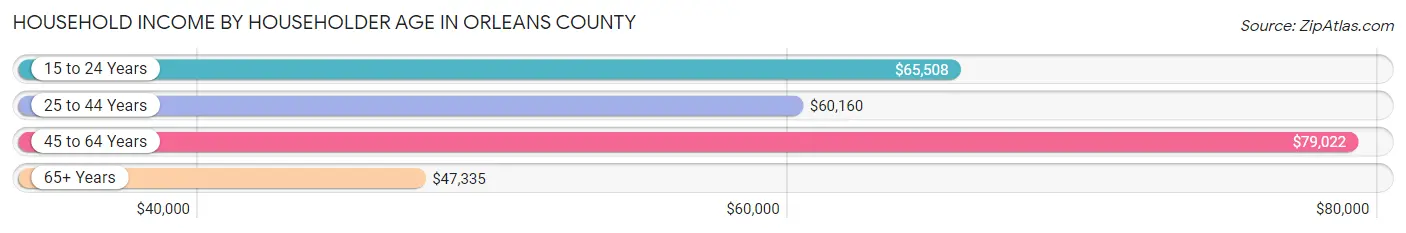
| Income Bracket | # Households | Median Income |
| 15 to 24 Years | 480 (3.0%) | $65,508 |
| 25 to 44 Years | 4,391 (27.1%) | $60,160 |
| 45 to 64 Years | 6,535 (40.3%) | $79,022 |
| 65+ Years | 4,795 (29.6%) | $47,335 |
| Total | 16,201 (100.0%) | $61,069 |
Poverty in Orleans County
Income Below Poverty by Sex and Age in Orleans County
With 11.5% poverty level for males and 13.8% for females among the residents of Orleans County, under 5 year old males and 15 year old females are the most vulnerable to poverty, with 256 males (23.9%) and 57 females (27.3%) in their respective age groups living below the poverty level.
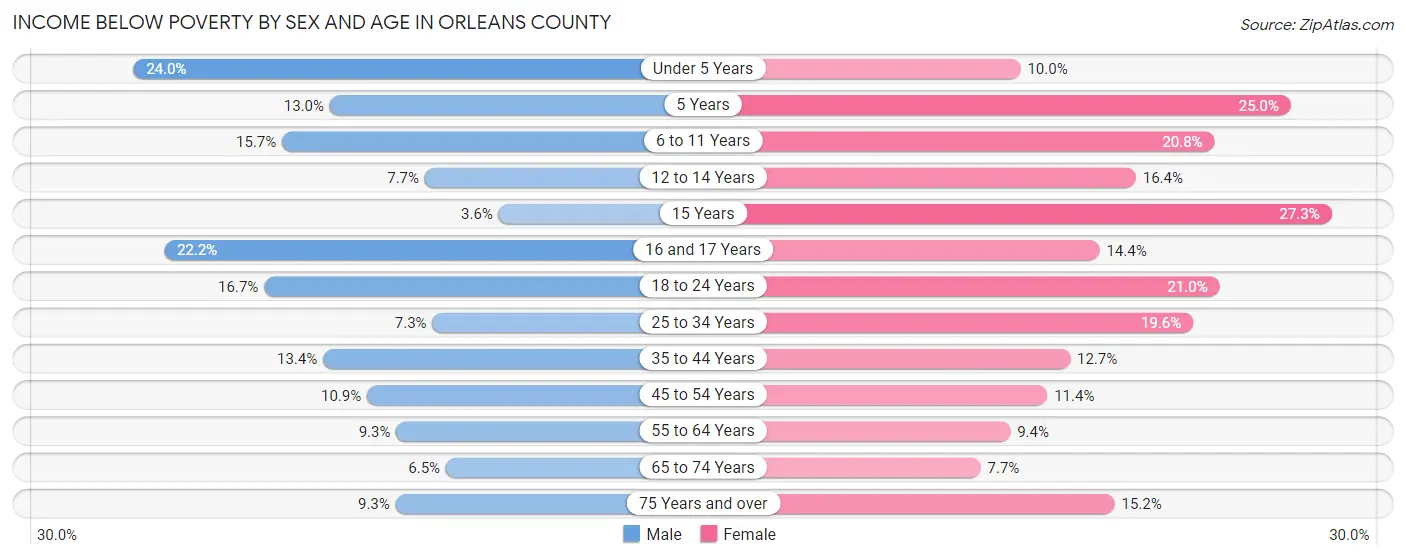
| Age Bracket | Male | Female |
| Under 5 Years | 256 (23.9%) | 85 (10.0%) |
| 5 Years | 39 (13.0%) | 44 (25.0%) |
| 6 to 11 Years | 185 (15.7%) | 248 (20.7%) |
| 12 to 14 Years | 46 (7.7%) | 111 (16.4%) |
| 15 Years | 13 (3.6%) | 57 (27.3%) |
| 16 and 17 Years | 109 (22.2%) | 69 (14.3%) |
| 18 to 24 Years | 276 (16.7%) | 283 (21.0%) |
| 25 to 34 Years | 178 (7.3%) | 395 (19.6%) |
| 35 to 44 Years | 303 (13.4%) | 272 (12.7%) |
| 45 to 54 Years | 266 (10.9%) | 305 (11.4%) |
| 55 to 64 Years | 309 (9.3%) | 298 (9.4%) |
| 65 to 74 Years | 144 (6.5%) | 171 (7.7%) |
| 75 Years and over | 111 (9.3%) | 228 (15.2%) |
| Total | 2,235 (11.5%) | 2,566 (13.8%) |
Income Above Poverty by Sex and Age in Orleans County
According to the poverty statistics in Orleans County, males aged 15 years and females aged 65 to 74 years are the age groups that are most secure financially, with 96.4% of males and 92.3% of females in these age groups living above the poverty line.
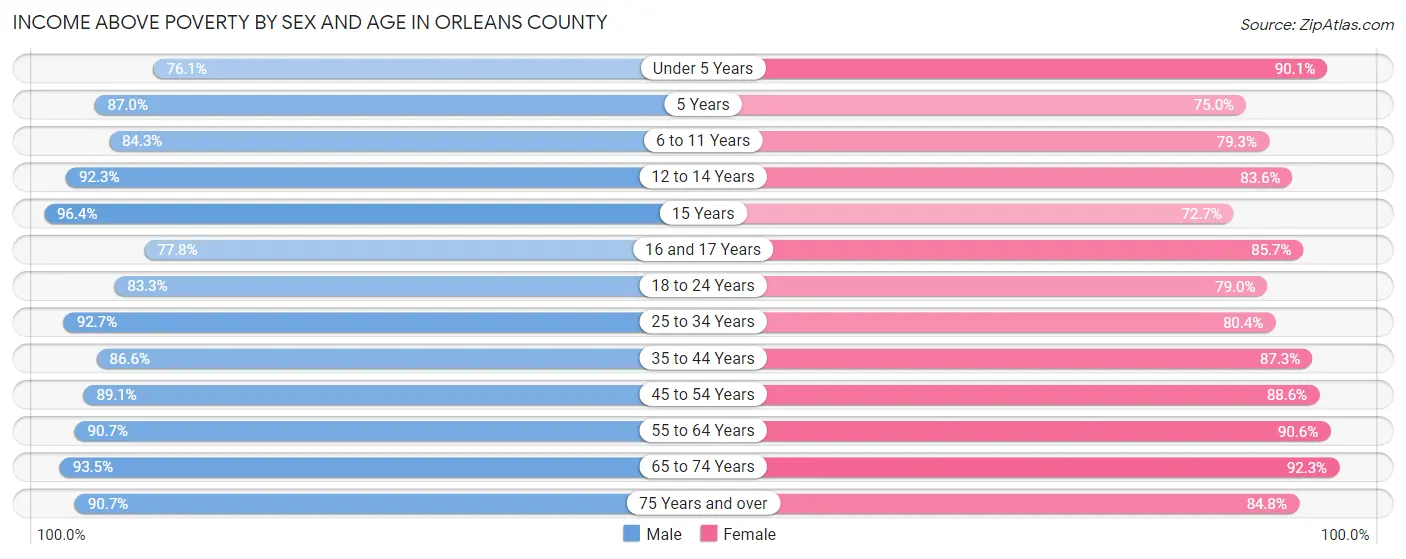
| Age Bracket | Male | Female |
| Under 5 Years | 813 (76.0%) | 769 (90.0%) |
| 5 Years | 261 (87.0%) | 132 (75.0%) |
| 6 to 11 Years | 996 (84.3%) | 947 (79.2%) |
| 12 to 14 Years | 551 (92.3%) | 567 (83.6%) |
| 15 Years | 348 (96.4%) | 152 (72.7%) |
| 16 and 17 Years | 381 (77.8%) | 412 (85.7%) |
| 18 to 24 Years | 1,381 (83.3%) | 1,063 (79.0%) |
| 25 to 34 Years | 2,263 (92.7%) | 1,624 (80.4%) |
| 35 to 44 Years | 1,961 (86.6%) | 1,868 (87.3%) |
| 45 to 54 Years | 2,168 (89.1%) | 2,360 (88.6%) |
| 55 to 64 Years | 3,015 (90.7%) | 2,880 (90.6%) |
| 65 to 74 Years | 2,059 (93.5%) | 2,041 (92.3%) |
| 75 Years and over | 1,077 (90.7%) | 1,273 (84.8%) |
| Total | 17,274 (88.5%) | 16,088 (86.2%) |
Income Below Poverty Among Married-Couple Families in Orleans County
The poverty statistics for married-couple families in Orleans County show that 3.4% or 264 of the total 7,708 families live below the poverty line. Families with 5 or more children have the highest poverty rate of 53.3%, comprising of 16 families. On the other hand, families with no children have the lowest poverty rate of 2.7%, which includes 148 families.
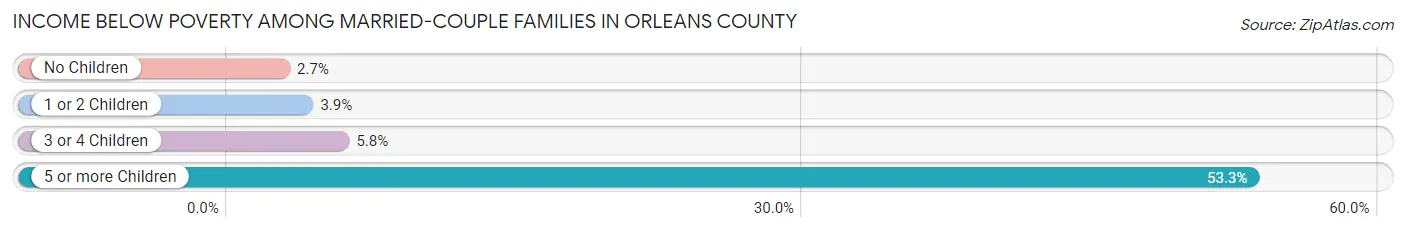
| Children | Above Poverty | Below Poverty |
| No Children | 5,285 (97.3%) | 148 (2.7%) |
| 1 or 2 Children | 1,562 (96.1%) | 64 (3.9%) |
| 3 or 4 Children | 583 (94.2%) | 36 (5.8%) |
| 5 or more Children | 14 (46.7%) | 16 (53.3%) |
| Total | 7,444 (96.6%) | 264 (3.4%) |
Income Below Poverty Among Single-Parent Households in Orleans County
According to the poverty data in Orleans County, 24.7% or 230 single-father households and 24.5% or 448 single-mother households are living below the poverty line. Among single-father households, those with 5 or more children have the highest poverty rate, with 3 households (100.0%) experiencing poverty. Likewise, among single-mother households, those with 5 or more children have the highest poverty rate, with 7 households (100.0%) falling below the poverty line.
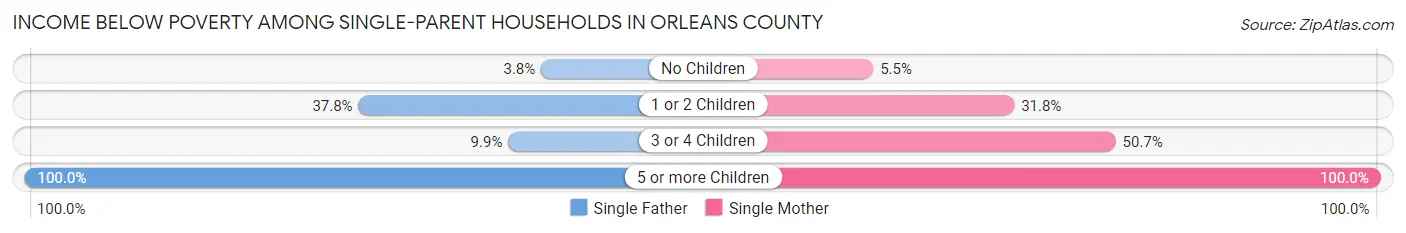
| Children | Single Father | Single Mother |
| No Children | 10 (3.8%) | 35 (5.5%) |
| 1 or 2 Children | 205 (37.8%) | 329 (31.8%) |
| 3 or 4 Children | 12 (9.9%) | 77 (50.7%) |
| 5 or more Children | 3 (100.0%) | 7 (100.0%) |
| Total | 230 (24.7%) | 448 (24.5%) |
Income Below Poverty Among Married-Couple vs Single-Parent Households in Orleans County
The poverty data for Orleans County shows that 264 of the married-couple family households (3.4%) and 678 of the single-parent households (24.6%) are living below the poverty level. Within the married-couple family households, those with 5 or more children have the highest poverty rate, with 16 households (53.3%) falling below the poverty line. Among the single-parent households, those with 5 or more children have the highest poverty rate, with 10 household (100.0%) living below poverty.
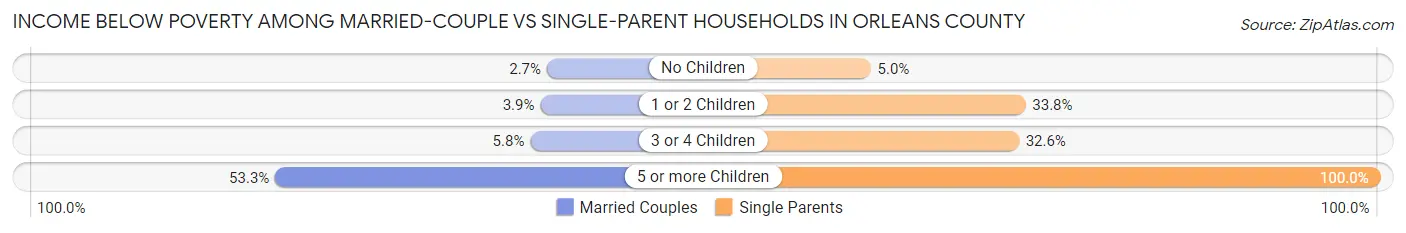
| Children | Married-Couple Families | Single-Parent Households |
| No Children | 148 (2.7%) | 45 (5.0%) |
| 1 or 2 Children | 64 (3.9%) | 534 (33.8%) |
| 3 or 4 Children | 36 (5.8%) | 89 (32.6%) |
| 5 or more Children | 16 (53.3%) | 10 (100.0%) |
| Total | 264 (3.4%) | 678 (24.6%) |
Race in Orleans County
The most populous races in Orleans County are White / Caucasian (35,018 | 87.2%), Black / African American (2,167 | 5.4%), and Hispanic or Latino (2,122 | 5.3%).
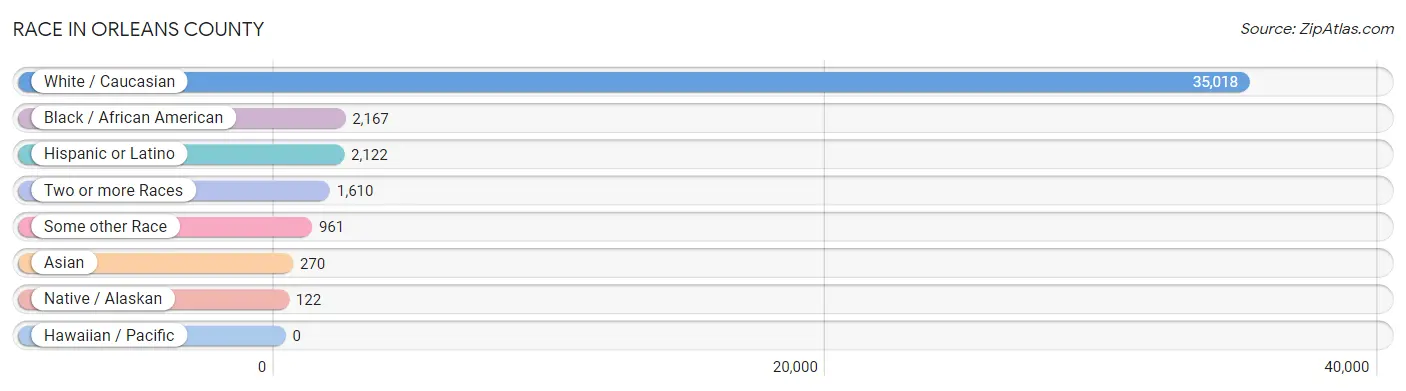
| Race | # Population | % Population |
| Asian | 270 | 0.7% |
| Black / African American | 2,167 | 5.4% |
| Hawaiian / Pacific | 0 | 0.0% |
| Hispanic or Latino | 2,122 | 5.3% |
| Native / Alaskan | 122 | 0.3% |
| White / Caucasian | 35,018 | 87.2% |
| Two or more Races | 1,610 | 4.0% |
| Some other Race | 961 | 2.4% |
| Total | 40,148 | 100.0% |
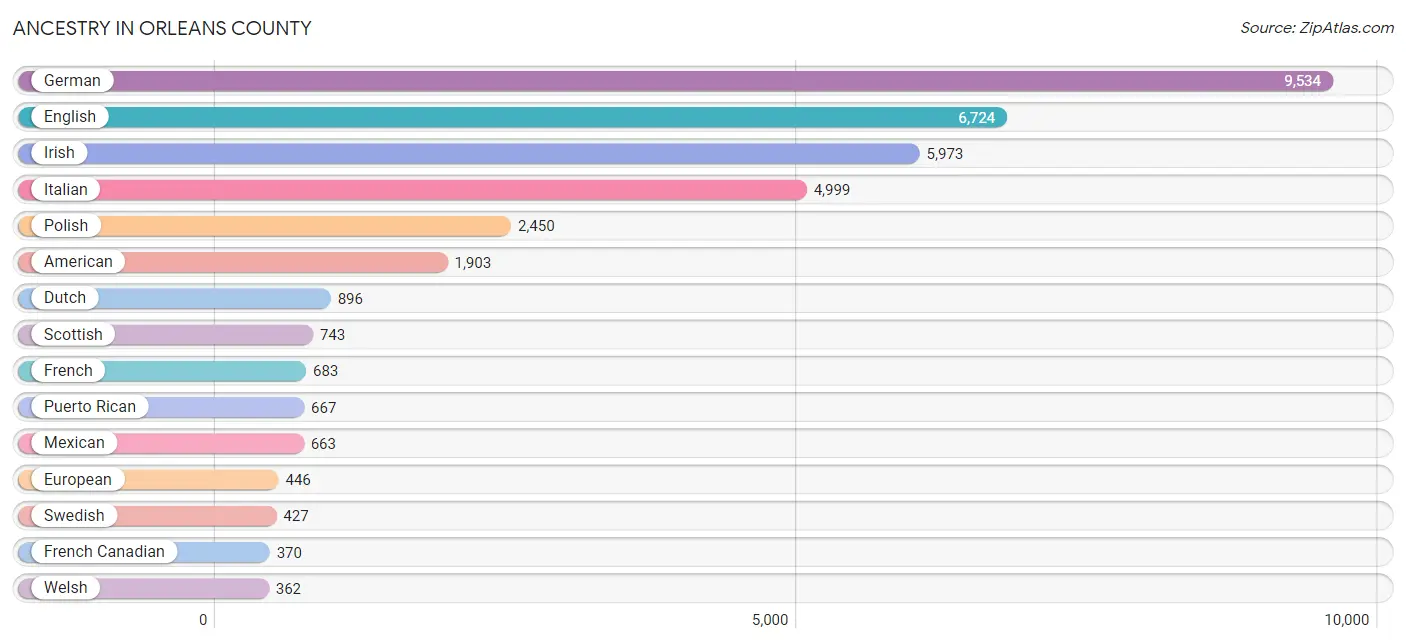
Ancestry in Orleans County
The most populous ancestries reported in Orleans County are German (9,534 | 23.7%), English (6,724 | 16.8%), Irish (5,973 | 14.9%), Italian (4,999 | 12.4%), and Polish (2,450 | 6.1%), together accounting for 73.9% of all Orleans County residents.
| Ancestry | # Population | % Population |
| African | 207 | 0.5% |
| Aleut | 7 | 0.0% |
| American | 1,903 | 4.7% |
| Arab | 27 | 0.1% |
| Argentinean | 239 | 0.6% |
| Armenian | 44 | 0.1% |
| Australian | 12 | 0.0% |
| Austrian | 27 | 0.1% |
| Bahamian | 82 | 0.2% |
| Bhutanese | 19 | 0.1% |
| British | 169 | 0.4% |
| Burmese | 65 | 0.2% |
| Canadian | 123 | 0.3% |
| Celtic | 10 | 0.0% |
| Central American | 23 | 0.1% |
| Cherokee | 50 | 0.1% |
| Colombian | 56 | 0.1% |
| Costa Rican | 15 | 0.0% |
| Cuban | 86 | 0.2% |
| Czech | 6 | 0.0% |
| Czechoslovakian | 17 | 0.0% |
| Danish | 106 | 0.3% |
| Dominican | 54 | 0.1% |
| Dutch | 896 | 2.2% |
| Eastern European | 24 | 0.1% |
| English | 6,724 | 16.8% |
| European | 446 | 1.1% |
| Filipino | 21 | 0.1% |
| Finnish | 23 | 0.1% |
| French | 683 | 1.7% |
| French American Indian | 8 | 0.0% |
| French Canadian | 370 | 0.9% |
| German | 9,534 | 23.7% |
| Greek | 64 | 0.2% |
| Guamanian / Chamorro | 23 | 0.1% |
| Hungarian | 105 | 0.3% |
| Indian (Asian) | 66 | 0.2% |
| Indonesian | 1 | 0.0% |
| Irish | 5,973 | 14.9% |
| Iroquois | 106 | 0.3% |
| Italian | 4,999 | 12.4% |
| Jamaican | 215 | 0.5% |
| Japanese | 29 | 0.1% |
| Korean | 104 | 0.3% |
| Lebanese | 13 | 0.0% |
| Liberian | 6 | 0.0% |
| Lithuanian | 18 | 0.0% |
| Mexican | 663 | 1.7% |
| Native Hawaiian | 51 | 0.1% |
| Nigerian | 4 | 0.0% |
| Northern European | 84 | 0.2% |
| Norwegian | 169 | 0.4% |
| Pakistani | 18 | 0.0% |
| Panamanian | 8 | 0.0% |
| Pennsylvania German | 51 | 0.1% |
| Peruvian | 4 | 0.0% |
| Polish | 2,450 | 6.1% |
| Portuguese | 55 | 0.1% |
| Puerto Rican | 667 | 1.7% |
| Russian | 55 | 0.1% |
| Scandinavian | 51 | 0.1% |
| Scotch-Irish | 238 | 0.6% |
| Scottish | 743 | 1.8% |
| Serbian | 8 | 0.0% |
| Slovak | 5 | 0.0% |
| Slovene | 6 | 0.0% |
| South African | 2 | 0.0% |
| South American | 361 | 0.9% |
| Spaniard | 100 | 0.3% |
| Sri Lankan | 19 | 0.1% |
| Subsaharan African | 219 | 0.5% |
| Swedish | 427 | 1.1% |
| Swiss | 230 | 0.6% |
| Syrian | 8 | 0.0% |
| Thai | 50 | 0.1% |
| Trinidadian and Tobagonian | 3 | 0.0% |
| Ukrainian | 161 | 0.4% |
| Venezuelan | 62 | 0.2% |
| Vietnamese | 6 | 0.0% |
| Welsh | 362 | 0.9% |
| West Indian | 18 | 0.0% |
| Yugoslavian | 19 | 0.1% | View All 82 Rows |
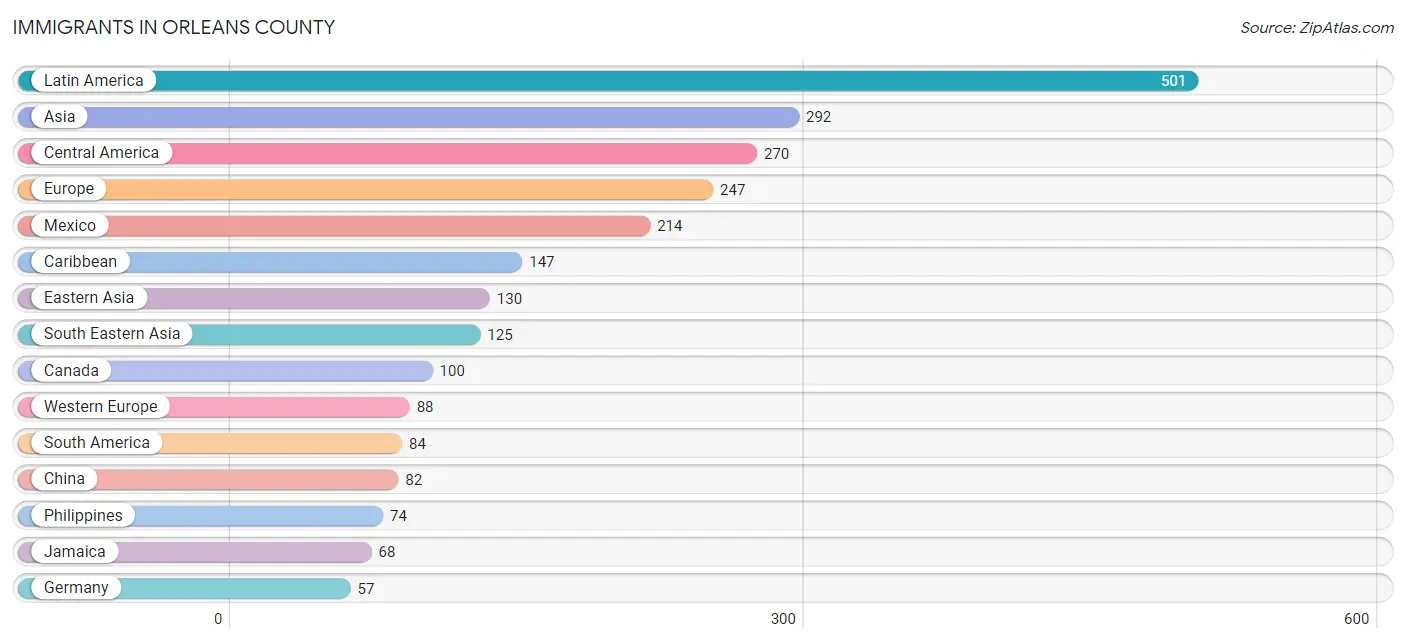
Immigrants in Orleans County
The most numerous immigrant groups reported in Orleans County came from Latin America (501 | 1.3%), Asia (292 | 0.7%), Central America (270 | 0.7%), Europe (247 | 0.6%), and Mexico (214 | 0.5%), together accounting for 3.8% of all Orleans County residents.
| Immigration Origin | # Population | % Population |
| Africa | 29 | 0.1% |
| Argentina | 23 | 0.1% |
| Asia | 292 | 0.7% |
| Australia | 1 | 0.0% |
| Cambodia | 9 | 0.0% |
| Canada | 100 | 0.3% |
| Caribbean | 147 | 0.4% |
| Central America | 270 | 0.7% |
| China | 82 | 0.2% |
| Cuba | 16 | 0.0% |
| Czechoslovakia | 6 | 0.0% |
| Dominica | 22 | 0.1% |
| Dominican Republic | 38 | 0.1% |
| Eastern Africa | 2 | 0.0% |
| Eastern Asia | 130 | 0.3% |
| Eastern Europe | 50 | 0.1% |
| Ecuador | 12 | 0.0% |
| Egypt | 3 | 0.0% |
| El Salvador | 55 | 0.1% |
| England | 23 | 0.1% |
| Europe | 247 | 0.6% |
| Germany | 57 | 0.1% |
| Guyana | 8 | 0.0% |
| Hong Kong | 37 | 0.1% |
| India | 31 | 0.1% |
| Italy | 53 | 0.1% |
| Jamaica | 68 | 0.2% |
| Japan | 18 | 0.0% |
| Korea | 30 | 0.1% |
| Latin America | 501 | 1.3% |
| Liberia | 6 | 0.0% |
| Mexico | 214 | 0.5% |
| Netherlands | 31 | 0.1% |
| Northern Africa | 3 | 0.0% |
| Northern Europe | 56 | 0.1% |
| Norway | 3 | 0.0% |
| Oceania | 1 | 0.0% |
| Panama | 1 | 0.0% |
| Peru | 4 | 0.0% |
| Philippines | 74 | 0.2% |
| Poland | 44 | 0.1% |
| Scotland | 16 | 0.0% |
| South Africa | 18 | 0.0% |
| South America | 84 | 0.2% |
| South Central Asia | 31 | 0.1% |
| South Eastern Asia | 125 | 0.3% |
| Southern Europe | 53 | 0.1% |
| Taiwan | 21 | 0.1% |
| Thailand | 33 | 0.1% |
| Trinidad and Tobago | 3 | 0.0% |
| Turkey | 6 | 0.0% |
| Venezuela | 37 | 0.1% |
| Vietnam | 9 | 0.0% |
| Western Africa | 6 | 0.0% |
| Western Asia | 6 | 0.0% |
| Western Europe | 88 | 0.2% | View All 56 Rows |
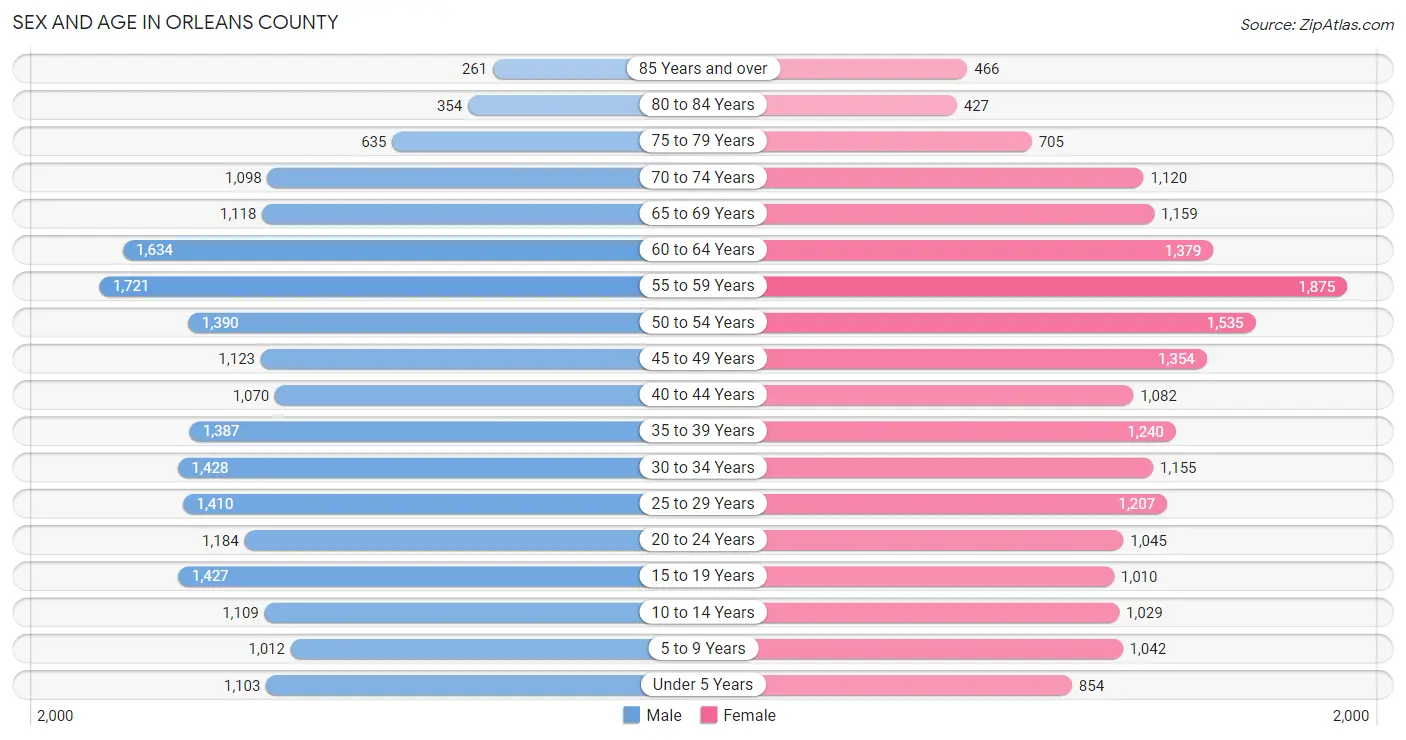
Sex and Age in Orleans County
Sex and Age in Orleans County
The most populous age groups in Orleans County are 55 to 59 Years (1,721 | 8.4%) for men and 55 to 59 Years (1,875 | 9.5%) for women.
| Age Bracket | Male | Female |
| Under 5 Years | 1,103 (5.4%) | 854 (4.3%) |
| 5 to 9 Years | 1,012 (5.0%) | 1,042 (5.3%) |
| 10 to 14 Years | 1,109 (5.4%) | 1,029 (5.2%) |
| 15 to 19 Years | 1,427 (7.0%) | 1,010 (5.1%) |
| 20 to 24 Years | 1,184 (5.8%) | 1,045 (5.3%) |
| 25 to 29 Years | 1,410 (6.9%) | 1,207 (6.1%) |
| 30 to 34 Years | 1,428 (7.0%) | 1,155 (5.9%) |
| 35 to 39 Years | 1,387 (6.8%) | 1,240 (6.3%) |
| 40 to 44 Years | 1,070 (5.2%) | 1,082 (5.5%) |
| 45 to 49 Years | 1,123 (5.5%) | 1,354 (6.9%) |
| 50 to 54 Years | 1,390 (6.8%) | 1,535 (7.8%) |
| 55 to 59 Years | 1,721 (8.4%) | 1,875 (9.5%) |
| 60 to 64 Years | 1,634 (8.0%) | 1,379 (7.0%) |
| 65 to 69 Years | 1,118 (5.5%) | 1,159 (5.9%) |
| 70 to 74 Years | 1,098 (5.4%) | 1,120 (5.7%) |
| 75 to 79 Years | 635 (3.1%) | 705 (3.6%) |
| 80 to 84 Years | 354 (1.7%) | 427 (2.2%) |
| 85 Years and over | 261 (1.3%) | 466 (2.4%) |
| Total | 20,464 (100.0%) | 19,684 (100.0%) |
Families and Households in Orleans County
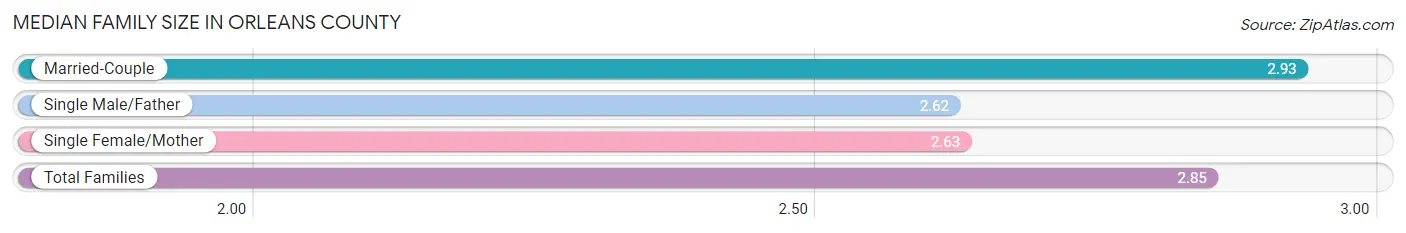
Median Family Size in Orleans County
The median family size in Orleans County is 2.85 persons per family, with married-couple families (7,708 | 73.6%) accounting for the largest median family size of 2.93 persons per family. On the other hand, single male/father families (930 | 8.9%) represent the smallest median family size with 2.62 persons per family.
| Family Type | # Families | Family Size |
| Married-Couple | 7,708 (73.6%) | 2.93 |
| Single Male/Father | 930 (8.9%) | 2.62 |
| Single Female/Mother | 1,830 (17.5%) | 2.63 |
| Total Families | 10,468 (100.0%) | 2.85 |
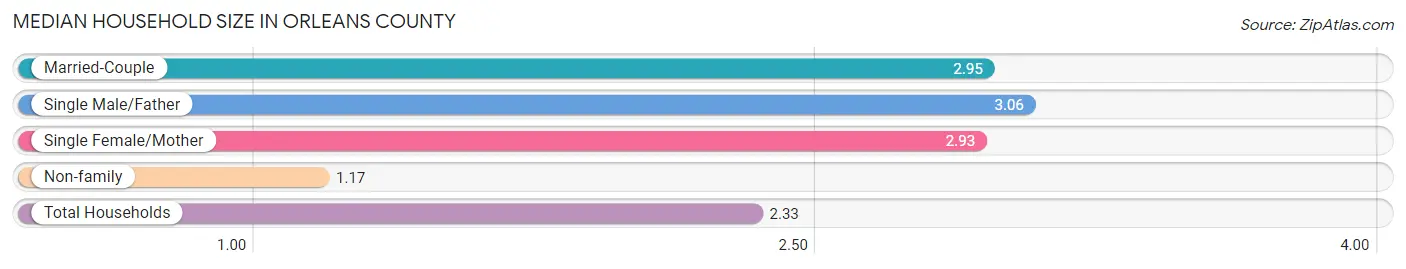
Median Household Size in Orleans County
The median household size in Orleans County is 2.33 persons per household, with single male/father households (930 | 5.7%) accounting for the largest median household size of 3.06 persons per household. non-family households (5,733 | 35.4%) represent the smallest median household size with 1.17 persons per household.
| Household Type | # Households | Household Size |
| Married-Couple | 7,708 (47.6%) | 2.95 |
| Single Male/Father | 930 (5.7%) | 3.06 |
| Single Female/Mother | 1,830 (11.3%) | 2.93 |
| Non-family | 5,733 (35.4%) | 1.17 |
| Total Households | 16,201 (100.0%) | 2.33 |
Household Size by Marriage Status in Orleans County
Out of a total of 16,201 households in Orleans County, 10,468 (64.6%) are family households, while 5,733 (35.4%) are nonfamily households. The most numerous type of family households are 2-person households, comprising 5,059, and the most common type of nonfamily households are 1-person households, comprising 4,743.
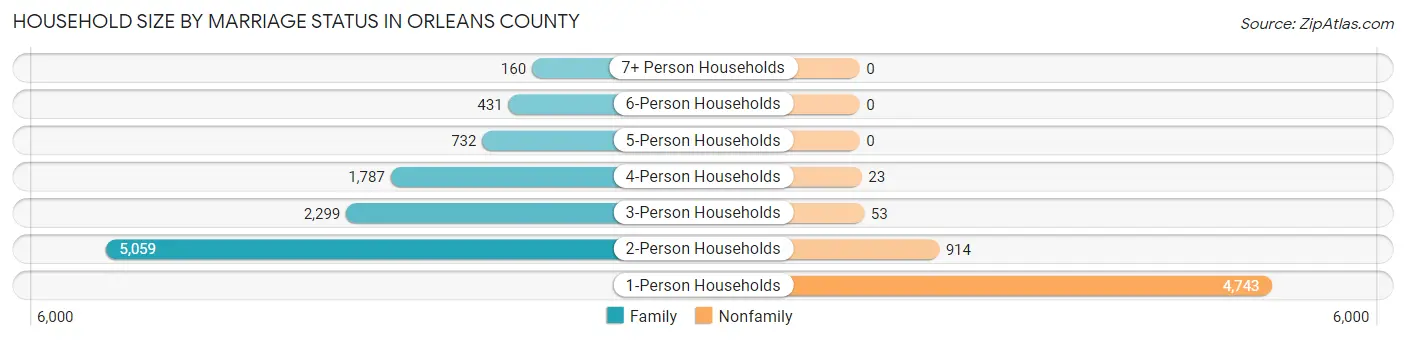
| Household Size | Family Households | Nonfamily Households |
| 1-Person Households | - | 4,743 (29.3%) |
| 2-Person Households | 5,059 (31.2%) | 914 (5.6%) |
| 3-Person Households | 2,299 (14.2%) | 53 (0.3%) |
| 4-Person Households | 1,787 (11.0%) | 23 (0.1%) |
| 5-Person Households | 732 (4.5%) | 0 (0.0%) |
| 6-Person Households | 431 (2.7%) | 0 (0.0%) |
| 7+ Person Households | 160 (1.0%) | 0 (0.0%) |
| Total | 10,468 (64.6%) | 5,733 (35.4%) |
Female Fertility in Orleans County
Fertility by Age in Orleans County
Average fertility rate in Orleans County is 41.0 births per 1,000 women. Women in the age bracket of 20 to 34 years have the highest fertility rate with 89.0 births per 1,000 women. Women in the age bracket of 20 to 34 years acount for 89.6% of all women with births.
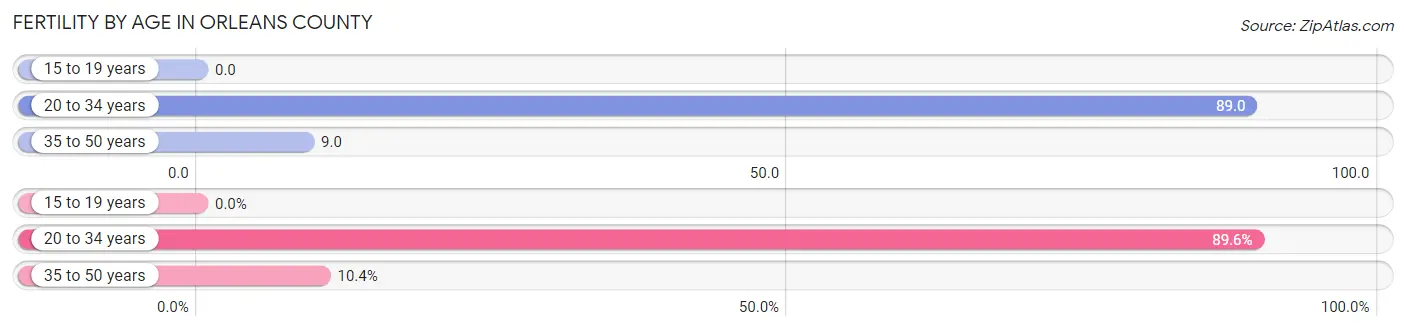
| Age Bracket | Women with Births | Births / 1,000 Women |
| 15 to 19 years | 0 (0.0%) | 0.0 |
| 20 to 34 years | 302 (89.6%) | 89.0 |
| 35 to 50 years | 35 (10.4%) | 9.0 |
| Total | 337 (100.0%) | 41.0 |
Fertility by Age by Marriage Status in Orleans County
73.0% of women with births (337) in Orleans County are married. The highest percentage of unmarried women with births falls into 35 to 50 years age bracket with 40.0% of them unmarried at the time of birth, while the lowest percentage of unmarried women with births belong to 20 to 34 years age bracket with 25.5% of them unmarried.
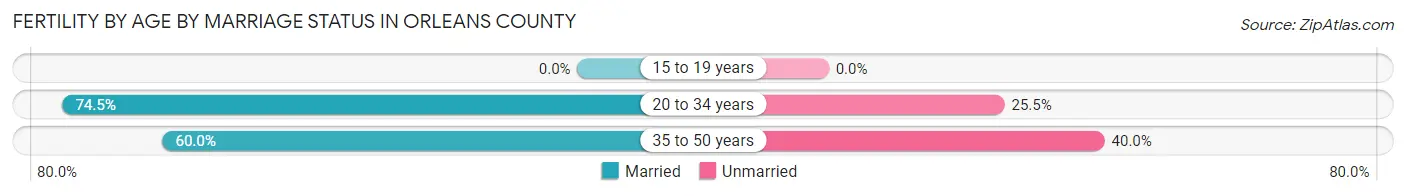
| Age Bracket | Married | Unmarried |
| 15 to 19 years | 0 (0.0%) | 0 (0.0%) |
| 20 to 34 years | 225 (74.5%) | 77 (25.5%) |
| 35 to 50 years | 21 (60.0%) | 14 (40.0%) |
| Total | 246 (73.0%) | 91 (27.0%) |
Fertility by Education in Orleans County
Average fertility rate in Orleans County is 41.0 births per 1,000 women. Women with the education attainment of high school diploma have the highest fertility rate of 71.0 births per 1,000 women, while women with the education attainment of graduate degree have the lowest fertility at 14.0 births per 1,000 women. Women with the education attainment of high school diploma represent 43.0% of all women with births.
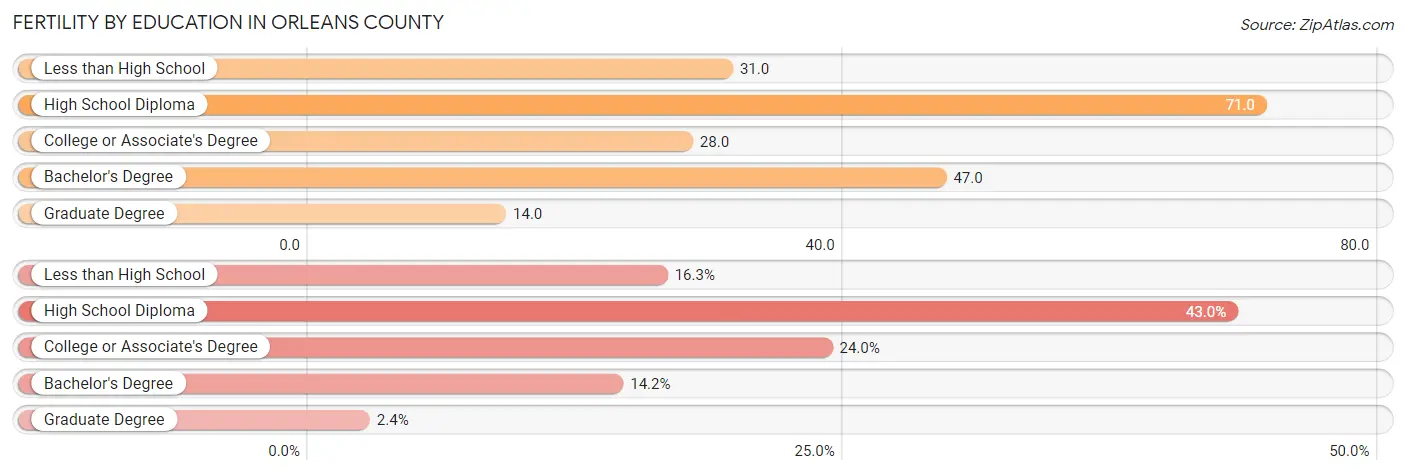
| Educational Attainment | Women with Births | Births / 1,000 Women |
| Less than High School | 55 (16.3%) | 31.0 |
| High School Diploma | 145 (43.0%) | 71.0 |
| College or Associate's Degree | 81 (24.0%) | 28.0 |
| Bachelor's Degree | 48 (14.2%) | 47.0 |
| Graduate Degree | 8 (2.4%) | 14.0 |
| Total | 337 (100.0%) | 41.0 |
Fertility by Education by Marriage Status in Orleans County
27.0% of women with births in Orleans County are unmarried. Women with the educational attainment of less than high school are most likely to be married with 100.0% of them married at childbirth, while women with the educational attainment of graduate degree are least likely to be married with 62.5% of them unmarried at childbirth.
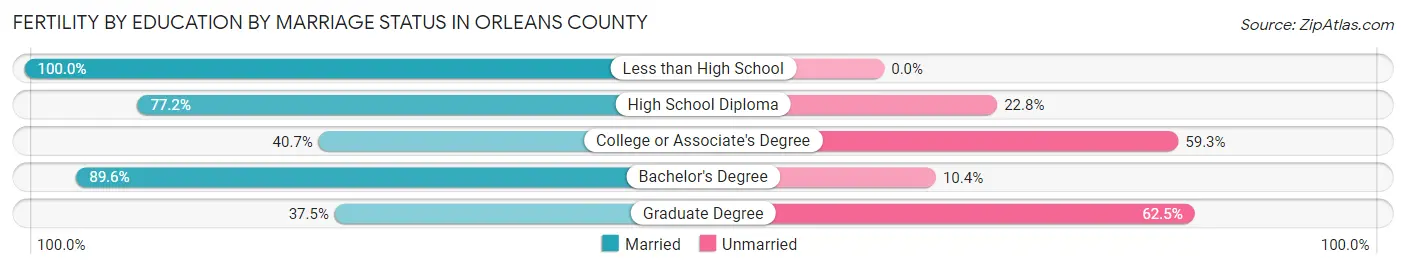
| Educational Attainment | Married | Unmarried |
| Less than High School | 55 (100.0%) | 0 (0.0%) |
| High School Diploma | 112 (77.2%) | 33 (22.8%) |
| College or Associate's Degree | 33 (40.7%) | 48 (59.3%) |
| Bachelor's Degree | 43 (89.6%) | 5 (10.4%) |
| Graduate Degree | 3 (37.5%) | 5 (62.5%) |
| Total | 246 (73.0%) | 91 (27.0%) |
Employment Characteristics in Orleans County
Employment by Class of Employer in Orleans County
Among the 17,535 employed individuals in Orleans County, private company employees (10,980 | 62.6%), not-for-profit organizations (1,724 | 9.8%), and local government employees (1,603 | 9.1%) make up the most common classes of employment.
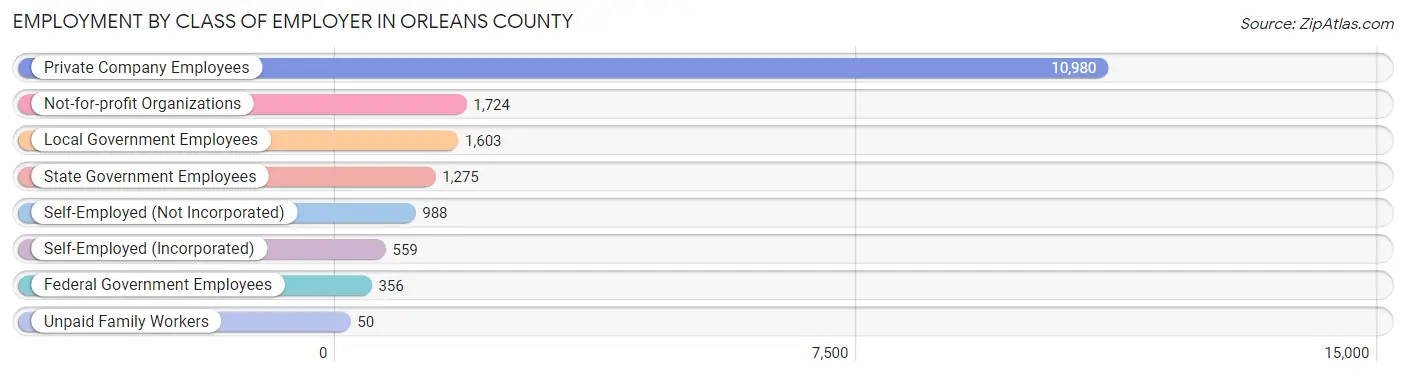
| Employer Class | # Employees | % Employees |
| Private Company Employees | 10,980 | 62.6% |
| Self-Employed (Incorporated) | 559 | 3.2% |
| Self-Employed (Not Incorporated) | 988 | 5.6% |
| Not-for-profit Organizations | 1,724 | 9.8% |
| Local Government Employees | 1,603 | 9.1% |
| State Government Employees | 1,275 | 7.3% |
| Federal Government Employees | 356 | 2.0% |
| Unpaid Family Workers | 50 | 0.3% |
| Total | 17,535 | 100.0% |
Employment Status by Age in Orleans County
According to the labor force statistics for Orleans County, out of the total population over 16 years of age (33,429), 56.8% or 18,988 individuals are in the labor force, with 6.1% or 1,158 of them unemployed. The age group with the highest labor force participation rate is 35 to 44 years, with 77.4% or 3,699 individuals in the labor force. Within the labor force, the 16 to 19 years age range has the highest percentage of unemployed individuals, with 29.3% or 236 of them being unemployed.
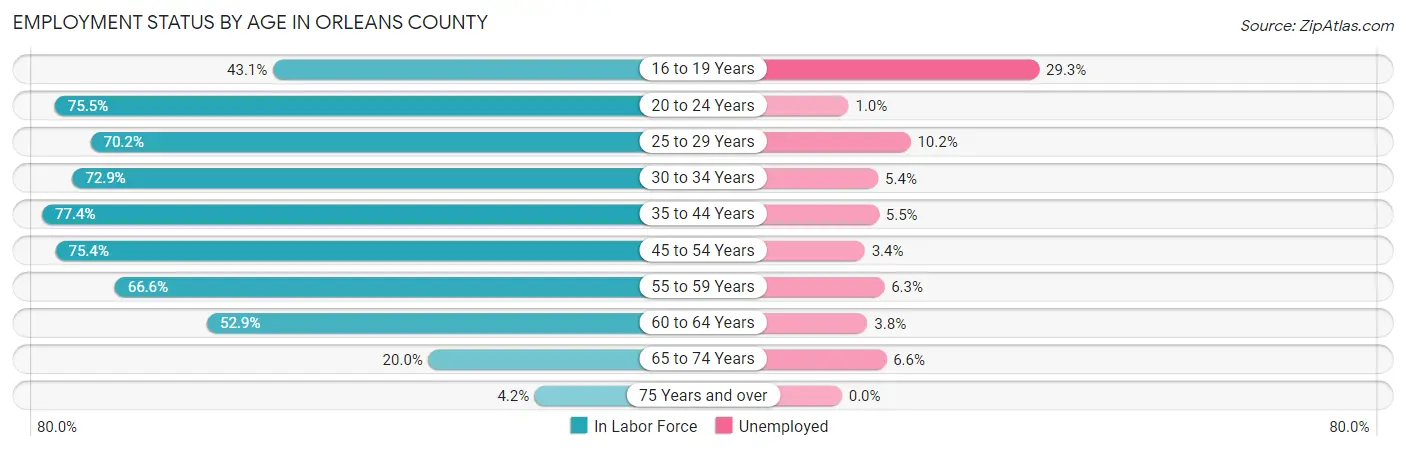
| Age Bracket | In Labor Force | Unemployed |
| 16 to 19 Years | 805 (43.1%) | 236 (29.3%) |
| 20 to 24 Years | 1,683 (75.5%) | 17 (1.0%) |
| 25 to 29 Years | 1,837 (70.2%) | 187 (10.2%) |
| 30 to 34 Years | 1,883 (72.9%) | 102 (5.4%) |
| 35 to 44 Years | 3,699 (77.4%) | 203 (5.5%) |
| 45 to 54 Years | 4,073 (75.4%) | 138 (3.4%) |
| 55 to 59 Years | 2,395 (66.6%) | 151 (6.3%) |
| 60 to 64 Years | 1,594 (52.9%) | 61 (3.8%) |
| 65 to 74 Years | 899 (20.0%) | 59 (6.6%) |
| 75 Years and over | 120 (4.2%) | 0 (0.0%) |
| Total | 18,988 (56.8%) | 1,158 (6.1%) |
Employment Status by Educational Attainment in Orleans County
According to labor force statistics for Orleans County, 70.4% of individuals (15,481) out of the total population between 25 and 64 years of age (21,990) are in the labor force, with 5.4% or 836 of them being unemployed. The group with the highest labor force participation rate are those with the educational attainment of bachelor's degree or higher, with 82.4% or 3,154 individuals in the labor force. Within the labor force, individuals with less than high school education have the highest percentage of unemployment, with 19.1% or 297 of them being unemployed.
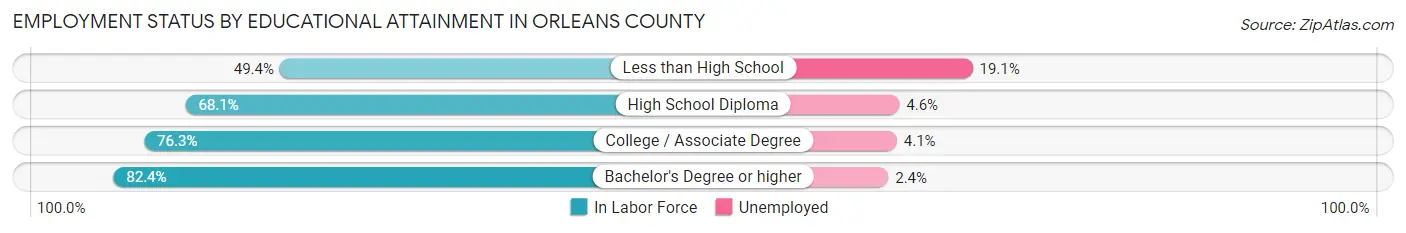
| Educational Attainment | In Labor Force | Unemployed |
| Less than High School | 1,553 (49.4%) | 601 (19.1%) |
| High School Diploma | 5,677 (68.1%) | 383 (4.6%) |
| College / Associate Degree | 5,098 (76.3%) | 274 (4.1%) |
| Bachelor's Degree or higher | 3,154 (82.4%) | 92 (2.4%) |
| Total | 15,481 (70.4%) | 1,187 (5.4%) |
Employment Occupations by Sex in Orleans County
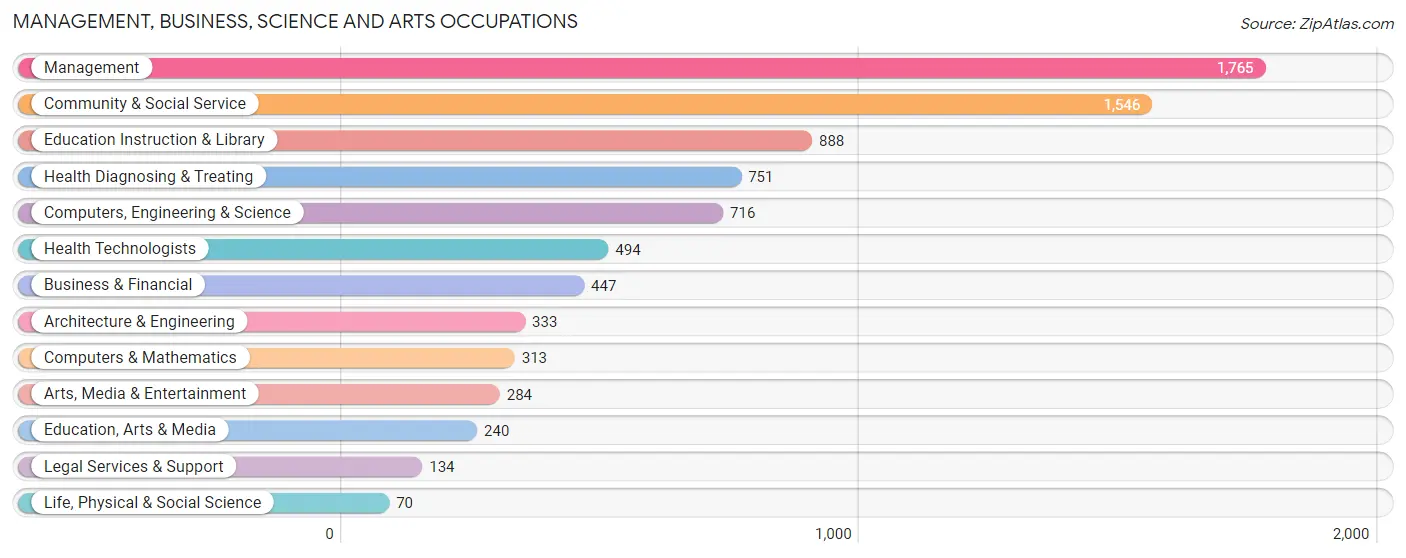
Management, Business, Science and Arts Occupations
The most common Management, Business, Science and Arts occupations in Orleans County are Management (1,765 | 9.9%), Community & Social Service (1,546 | 8.7%), Education Instruction & Library (888 | 5.0%), Health Diagnosing & Treating (751 | 4.2%), and Computers, Engineering & Science (716 | 4.0%).
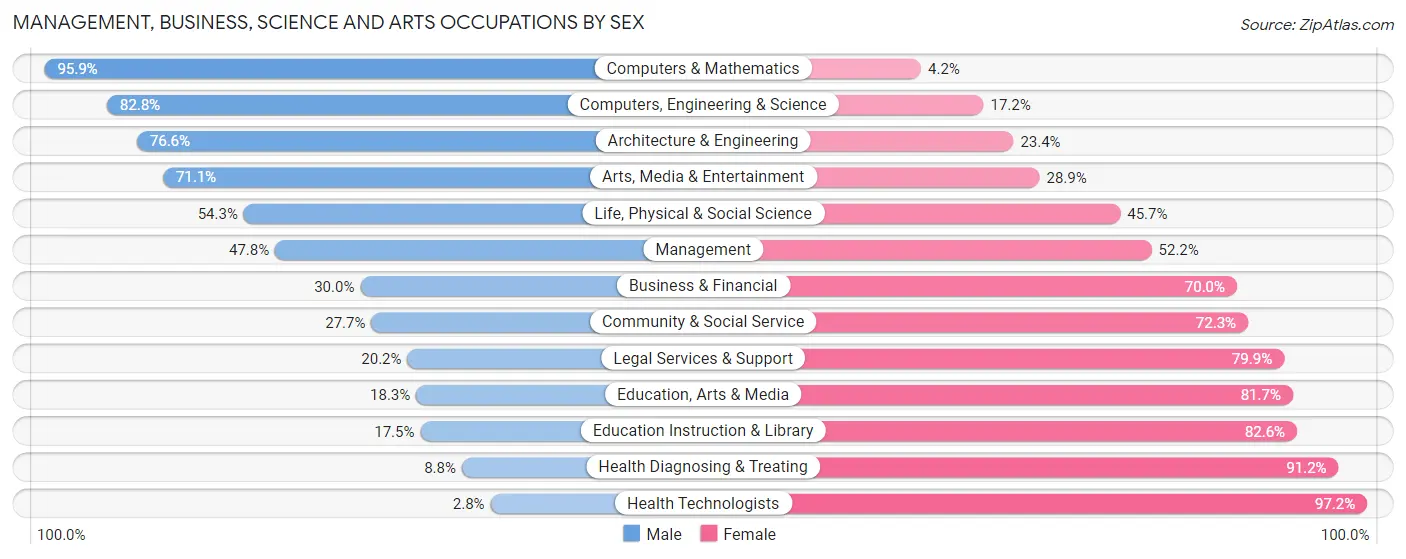
Management, Business, Science and Arts Occupations by Sex
Within the Management, Business, Science and Arts occupations in Orleans County, the most male-oriented occupations are Computers & Mathematics (95.9%), Computers, Engineering & Science (82.8%), and Architecture & Engineering (76.6%), while the most female-oriented occupations are Health Technologists (97.2%), Health Diagnosing & Treating (91.2%), and Education Instruction & Library (82.6%).
| Occupation | Male | Female |
| Management | 843 (47.8%) | 922 (52.2%) |
| Business & Financial | 134 (30.0%) | 313 (70.0%) |
| Computers, Engineering & Science | 593 (82.8%) | 123 (17.2%) |
| Computers & Mathematics | 300 (95.9%) | 13 (4.2%) |
| Architecture & Engineering | 255 (76.6%) | 78 (23.4%) |
| Life, Physical & Social Science | 38 (54.3%) | 32 (45.7%) |
| Community & Social Service | 428 (27.7%) | 1,118 (72.3%) |
| Education, Arts & Media | 44 (18.3%) | 196 (81.7%) |
| Legal Services & Support | 27 (20.2%) | 107 (79.8%) |
| Education Instruction & Library | 155 (17.4%) | 733 (82.6%) |
| Arts, Media & Entertainment | 202 (71.1%) | 82 (28.9%) |
| Health Diagnosing & Treating | 66 (8.8%) | 685 (91.2%) |
| Health Technologists | 14 (2.8%) | 480 (97.2%) |
| Total (Category) | 2,064 (39.5%) | 3,161 (60.5%) |
| Total (Overall) | 9,536 (53.5%) | 8,280 (46.5%) |
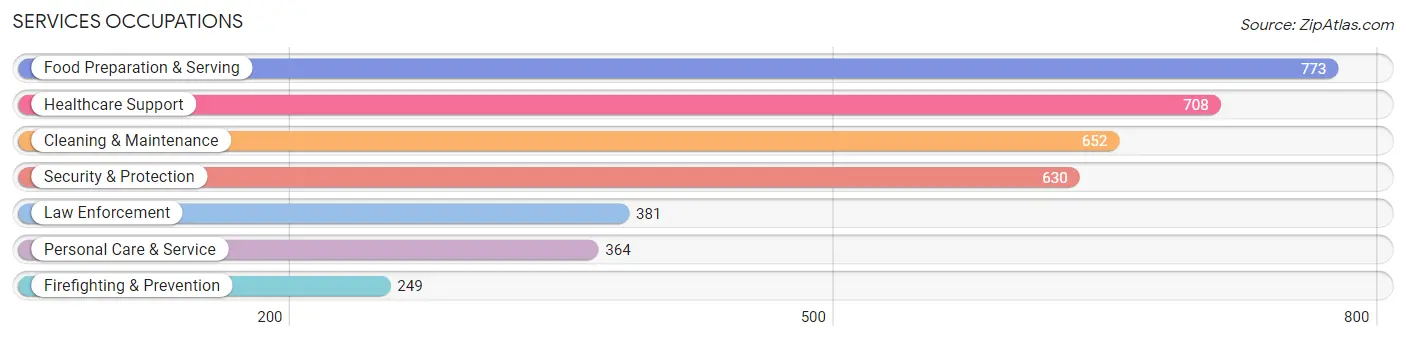
Services Occupations
The most common Services occupations in Orleans County are Food Preparation & Serving (773 | 4.3%), Healthcare Support (708 | 4.0%), Cleaning & Maintenance (652 | 3.7%), Security & Protection (630 | 3.5%), and Law Enforcement (381 | 2.1%).
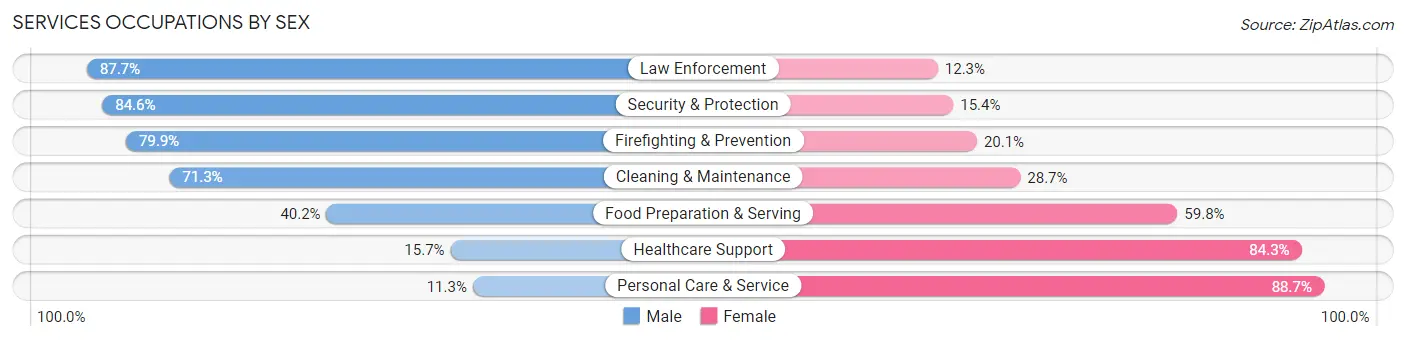
Services Occupations by Sex
Within the Services occupations in Orleans County, the most male-oriented occupations are Law Enforcement (87.7%), Security & Protection (84.6%), and Firefighting & Prevention (79.9%), while the most female-oriented occupations are Personal Care & Service (88.7%), Healthcare Support (84.3%), and Food Preparation & Serving (59.8%).
| Occupation | Male | Female |
| Healthcare Support | 111 (15.7%) | 597 (84.3%) |
| Security & Protection | 533 (84.6%) | 97 (15.4%) |
| Firefighting & Prevention | 199 (79.9%) | 50 (20.1%) |
| Law Enforcement | 334 (87.7%) | 47 (12.3%) |
| Food Preparation & Serving | 311 (40.2%) | 462 (59.8%) |
| Cleaning & Maintenance | 465 (71.3%) | 187 (28.7%) |
| Personal Care & Service | 41 (11.3%) | 323 (88.7%) |
| Total (Category) | 1,461 (46.7%) | 1,666 (53.3%) |
| Total (Overall) | 9,536 (53.5%) | 8,280 (46.5%) |
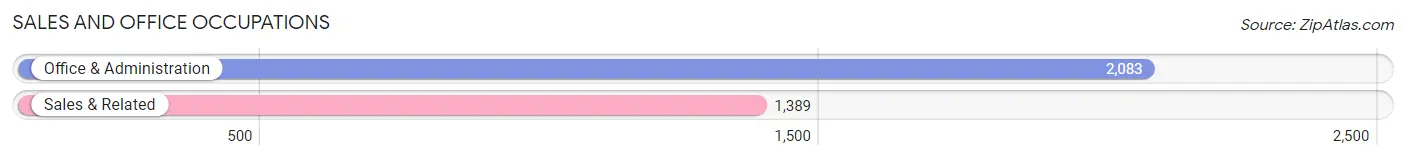
Sales and Office Occupations
The most common Sales and Office occupations in Orleans County are Office & Administration (2,083 | 11.7%), and Sales & Related (1,389 | 7.8%).
Sales and Office Occupations by Sex
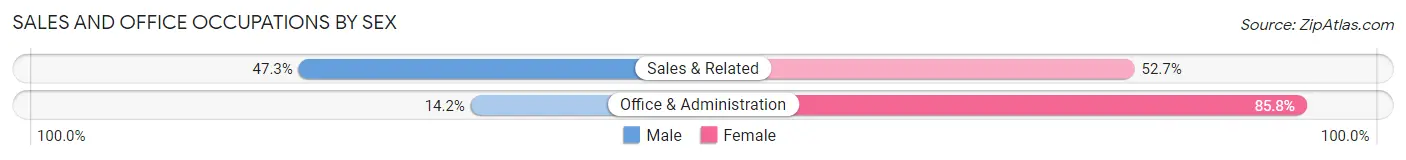
| Occupation | Male | Female |
| Sales & Related | 657 (47.3%) | 732 (52.7%) |
| Office & Administration | 296 (14.2%) | 1,787 (85.8%) |
| Total (Category) | 953 (27.5%) | 2,519 (72.6%) |
| Total (Overall) | 9,536 (53.5%) | 8,280 (46.5%) |
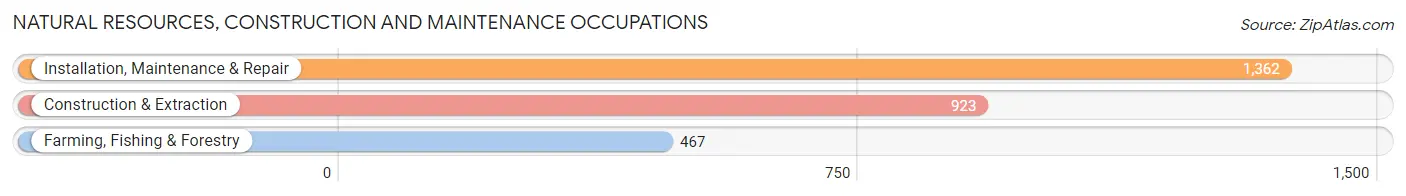
Natural Resources, Construction and Maintenance Occupations
The most common Natural Resources, Construction and Maintenance occupations in Orleans County are Installation, Maintenance & Repair (1,362 | 7.6%), Construction & Extraction (923 | 5.2%), and Farming, Fishing & Forestry (467 | 2.6%).
Natural Resources, Construction and Maintenance Occupations by Sex
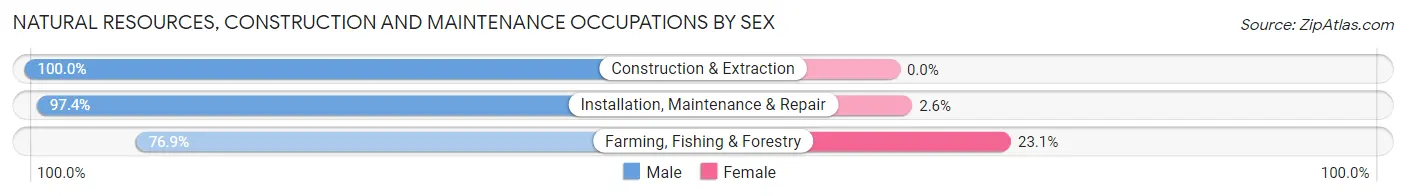
| Occupation | Male | Female |
| Farming, Fishing & Forestry | 359 (76.9%) | 108 (23.1%) |
| Construction & Extraction | 923 (100.0%) | 0 (0.0%) |
| Installation, Maintenance & Repair | 1,327 (97.4%) | 35 (2.6%) |
| Total (Category) | 2,609 (94.8%) | 143 (5.2%) |
| Total (Overall) | 9,536 (53.5%) | 8,280 (46.5%) |
Production, Transportation and Moving Occupations
The most common Production, Transportation and Moving occupations in Orleans County are Production (1,780 | 10.0%), Material Moving (780 | 4.4%), and Transportation (680 | 3.8%).
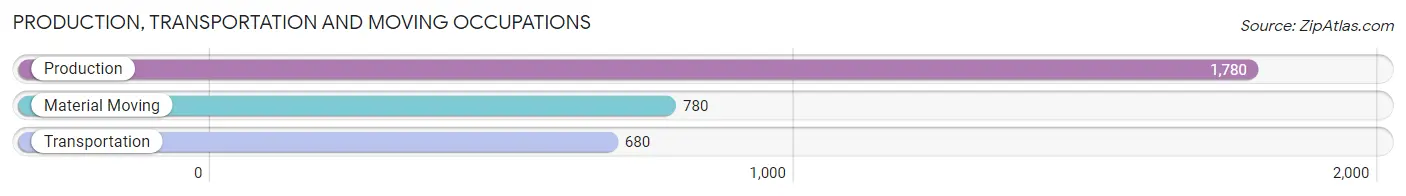
Production, Transportation and Moving Occupations by Sex
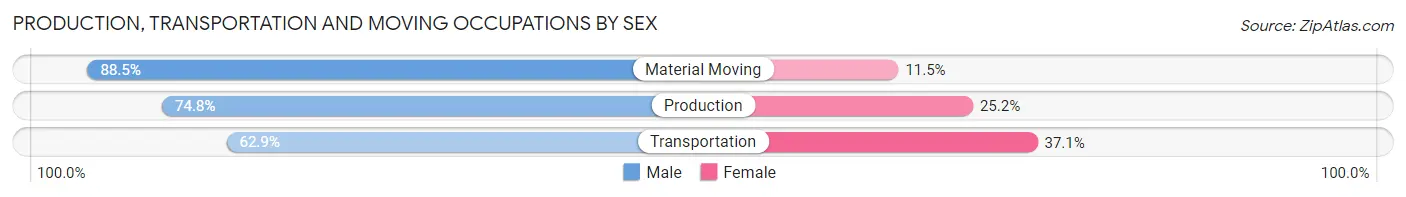
| Occupation | Male | Female |
| Production | 1,331 (74.8%) | 449 (25.2%) |
| Transportation | 428 (62.9%) | 252 (37.1%) |
| Material Moving | 690 (88.5%) | 90 (11.5%) |
| Total (Category) | 2,449 (75.6%) | 791 (24.4%) |
| Total (Overall) | 9,536 (53.5%) | 8,280 (46.5%) |
Employment Industries by Sex in Orleans County
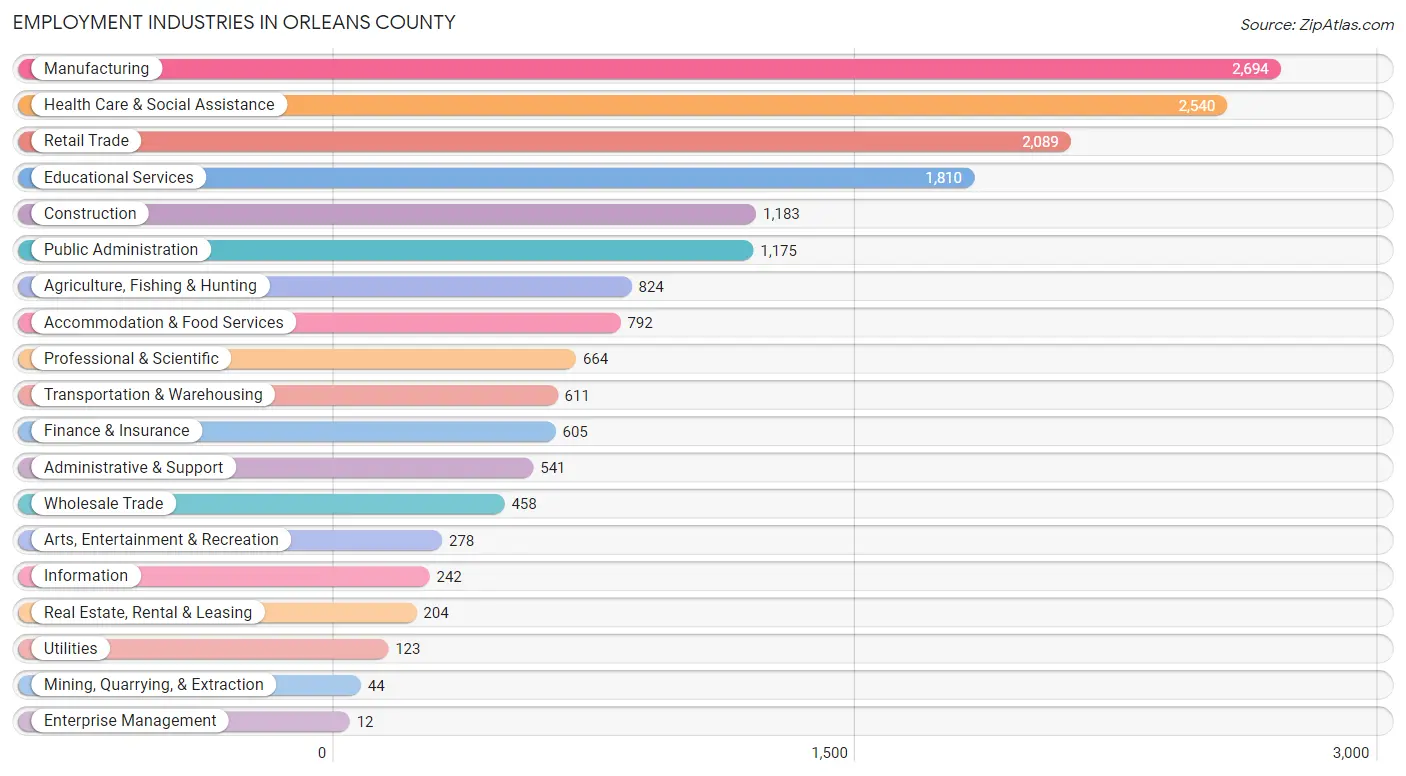
Employment Industries in Orleans County
The major employment industries in Orleans County include Manufacturing (2,694 | 15.1%), Health Care & Social Assistance (2,540 | 14.3%), Retail Trade (2,089 | 11.7%), Educational Services (1,810 | 10.2%), and Construction (1,183 | 6.6%).
Employment Industries by Sex in Orleans County
The Orleans County industries that see more men than women are Mining, Quarrying, & Extraction (100.0%), Construction (97.1%), and Wholesale Trade (88.4%), whereas the industries that tend to have a higher number of women are Finance & Insurance (85.3%), Health Care & Social Assistance (85.1%), and Educational Services (67.2%).
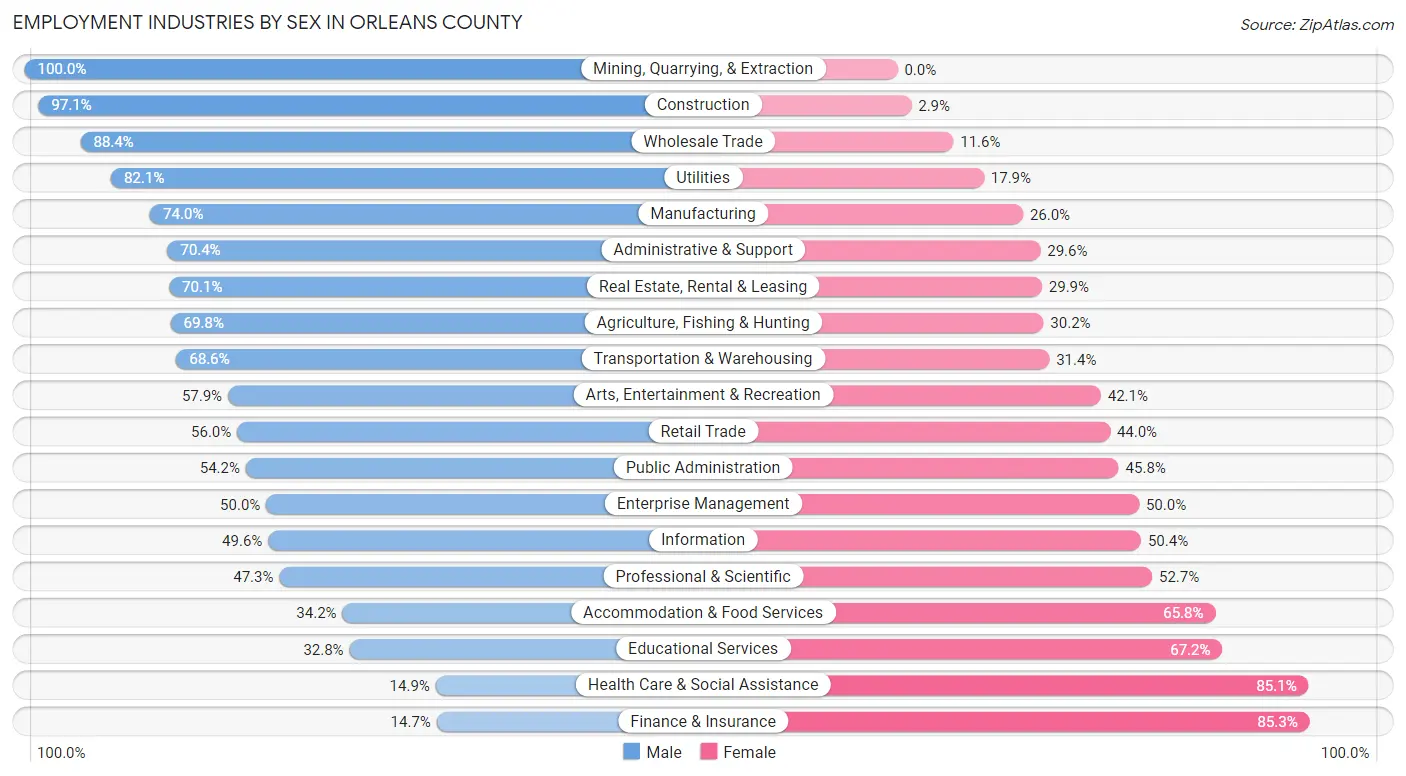
| Industry | Male | Female |
| Agriculture, Fishing & Hunting | 575 (69.8%) | 249 (30.2%) |
| Mining, Quarrying, & Extraction | 44 (100.0%) | 0 (0.0%) |
| Construction | 1,149 (97.1%) | 34 (2.9%) |
| Manufacturing | 1,994 (74.0%) | 700 (26.0%) |
| Wholesale Trade | 405 (88.4%) | 53 (11.6%) |
| Retail Trade | 1,170 (56.0%) | 919 (44.0%) |
| Transportation & Warehousing | 419 (68.6%) | 192 (31.4%) |
| Utilities | 101 (82.1%) | 22 (17.9%) |
| Information | 120 (49.6%) | 122 (50.4%) |
| Finance & Insurance | 89 (14.7%) | 516 (85.3%) |
| Real Estate, Rental & Leasing | 143 (70.1%) | 61 (29.9%) |
| Professional & Scientific | 314 (47.3%) | 350 (52.7%) |
| Enterprise Management | 6 (50.0%) | 6 (50.0%) |
| Administrative & Support | 381 (70.4%) | 160 (29.6%) |
| Educational Services | 593 (32.8%) | 1,217 (67.2%) |
| Health Care & Social Assistance | 379 (14.9%) | 2,161 (85.1%) |
| Arts, Entertainment & Recreation | 161 (57.9%) | 117 (42.1%) |
| Accommodation & Food Services | 271 (34.2%) | 521 (65.8%) |
| Public Administration | 637 (54.2%) | 538 (45.8%) |
| Total | 9,536 (53.5%) | 8,280 (46.5%) |
Education in Orleans County
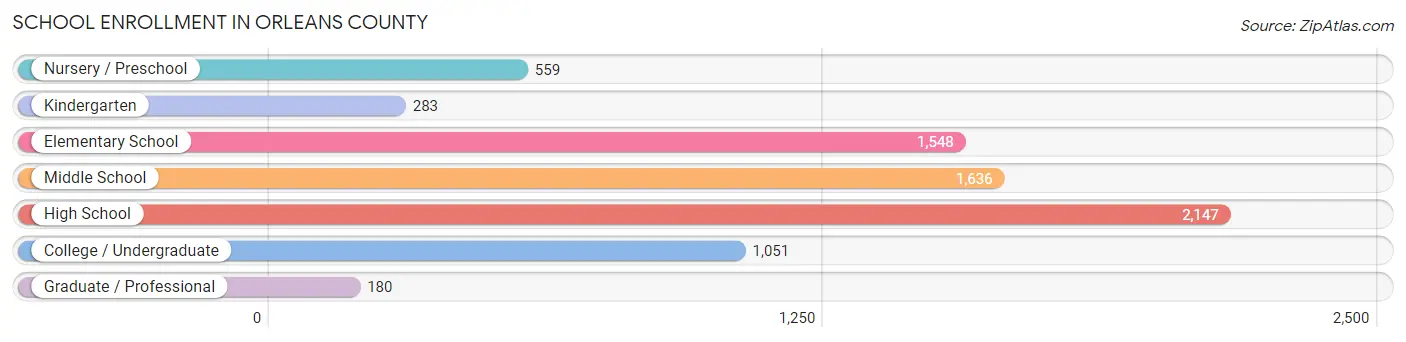
School Enrollment in Orleans County
The most common levels of schooling among the 7,404 students in Orleans County are high school (2,147 | 29.0%), middle school (1,636 | 22.1%), and elementary school (1,548 | 20.9%).
| School Level | # Students | % Students |
| Nursery / Preschool | 559 | 7.5% |
| Kindergarten | 283 | 3.8% |
| Elementary School | 1,548 | 20.9% |
| Middle School | 1,636 | 22.1% |
| High School | 2,147 | 29.0% |
| College / Undergraduate | 1,051 | 14.2% |
| Graduate / Professional | 180 | 2.4% |
| Total | 7,404 | 100.0% |
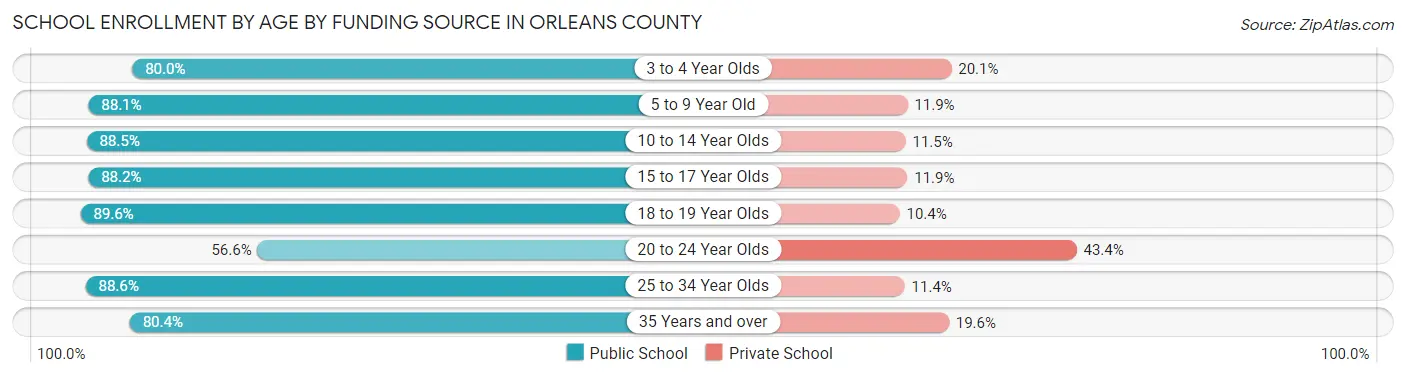
School Enrollment by Age by Funding Source in Orleans County
Out of a total of 7,404 students who are enrolled in schools in Orleans County, 1,044 (14.1%) attend a private institution, while the remaining 6,360 (85.9%) are enrolled in public schools. The age group of 20 to 24 year olds has the highest likelihood of being enrolled in private schools, with 177 (43.4% in the age bracket) enrolled. Conversely, the age group of 18 to 19 year olds has the lowest likelihood of being enrolled in a private school, with 542 (89.6% in the age bracket) attending a public institution.
| Age Bracket | Public School | Private School |
| 3 to 4 Year Olds | 303 (79.9%) | 76 (20.1%) |
| 5 to 9 Year Old | 1,721 (88.1%) | 232 (11.9%) |
| 10 to 14 Year Olds | 1,795 (88.5%) | 234 (11.5%) |
| 15 to 17 Year Olds | 1,264 (88.1%) | 170 (11.8%) |
| 18 to 19 Year Olds | 542 (89.6%) | 63 (10.4%) |
| 20 to 24 Year Olds | 231 (56.6%) | 177 (43.4%) |
| 25 to 34 Year Olds | 234 (88.6%) | 30 (11.4%) |
| 35 Years and over | 267 (80.4%) | 65 (19.6%) |
| Total | 6,360 (85.9%) | 1,044 (14.1%) |
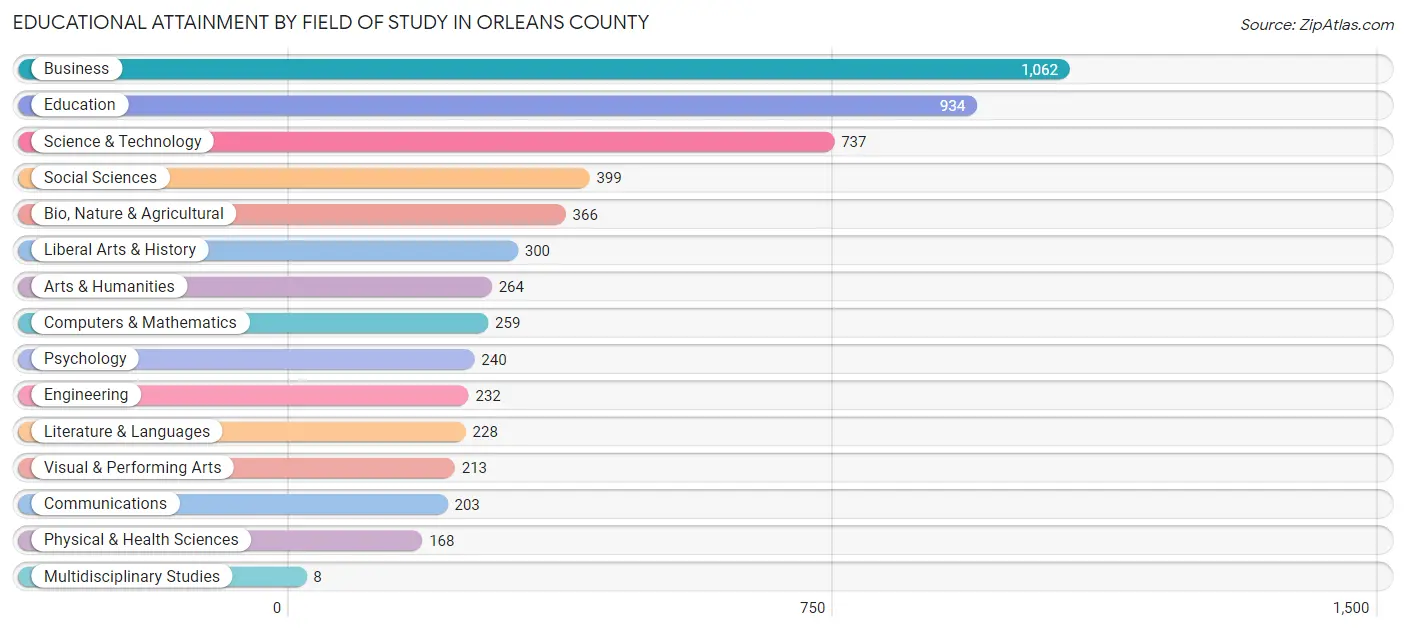
Educational Attainment by Field of Study in Orleans County
Business (1,062 | 18.9%), education (934 | 16.6%), science & technology (737 | 13.1%), social sciences (399 | 7.1%), and bio, nature & agricultural (366 | 6.5%) are the most common fields of study among 5,613 individuals in Orleans County who have obtained a bachelor's degree or higher.
| Field of Study | # Graduates | % Graduates |
| Computers & Mathematics | 259 | 4.6% |
| Bio, Nature & Agricultural | 366 | 6.5% |
| Physical & Health Sciences | 168 | 3.0% |
| Psychology | 240 | 4.3% |
| Social Sciences | 399 | 7.1% |
| Engineering | 232 | 4.1% |
| Multidisciplinary Studies | 8 | 0.1% |
| Science & Technology | 737 | 13.1% |
| Business | 1,062 | 18.9% |
| Education | 934 | 16.6% |
| Literature & Languages | 228 | 4.1% |
| Liberal Arts & History | 300 | 5.3% |
| Visual & Performing Arts | 213 | 3.8% |
| Communications | 203 | 3.6% |
| Arts & Humanities | 264 | 4.7% |
| Total | 5,613 | 100.0% |
Transportation & Commute in Orleans County
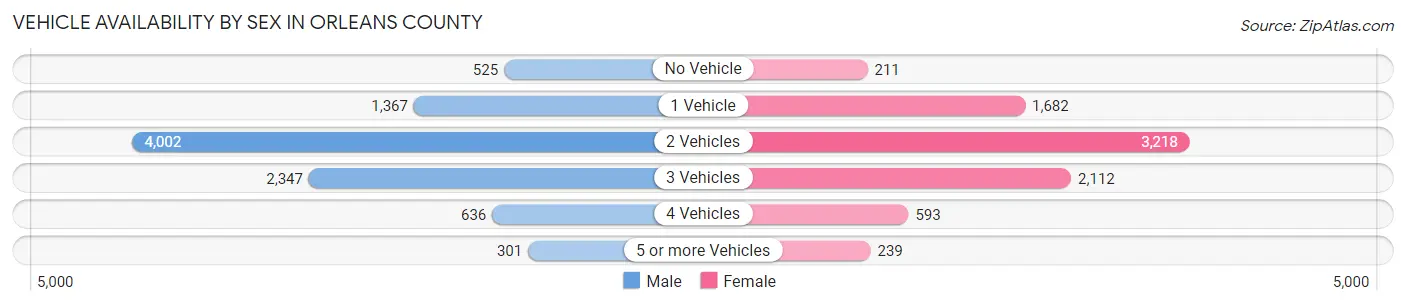
Vehicle Availability by Sex in Orleans County
The most prevalent vehicle ownership categories in Orleans County are males with 2 vehicles (4,002, accounting for 43.6%) and females with 2 vehicles (3,218, making up 49.7%).
| Vehicles Available | Male | Female |
| No Vehicle | 525 (5.7%) | 211 (2.6%) |
| 1 Vehicle | 1,367 (14.9%) | 1,682 (20.9%) |
| 2 Vehicles | 4,002 (43.6%) | 3,218 (40.0%) |
| 3 Vehicles | 2,347 (25.6%) | 2,112 (26.2%) |
| 4 Vehicles | 636 (6.9%) | 593 (7.4%) |
| 5 or more Vehicles | 301 (3.3%) | 239 (3.0%) |
| Total | 9,178 (100.0%) | 8,055 (100.0%) |
Commute Time in Orleans County
The most frequently occuring commute durations in Orleans County are 5 to 9 minutes (2,239 commuters, 13.9%), 45 to 59 minutes (2,027 commuters, 12.6%), and 15 to 19 minutes (1,959 commuters, 12.2%).
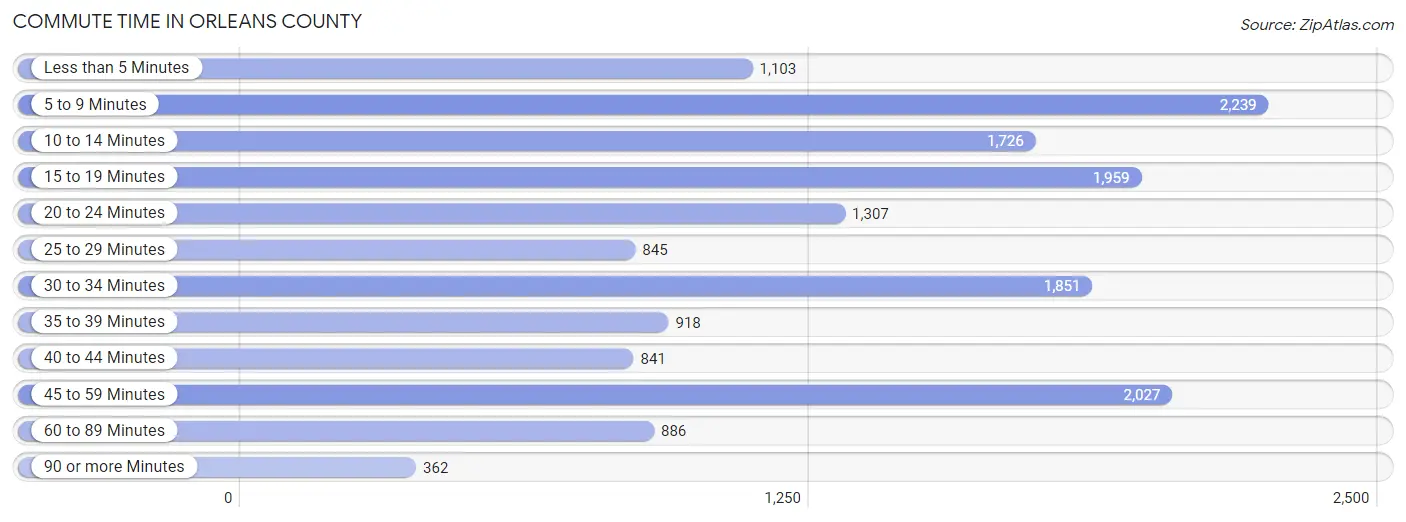
| Commute Time | # Commuters | % Commuters |
| Less than 5 Minutes | 1,103 | 6.9% |
| 5 to 9 Minutes | 2,239 | 13.9% |
| 10 to 14 Minutes | 1,726 | 10.7% |
| 15 to 19 Minutes | 1,959 | 12.2% |
| 20 to 24 Minutes | 1,307 | 8.1% |
| 25 to 29 Minutes | 845 | 5.3% |
| 30 to 34 Minutes | 1,851 | 11.5% |
| 35 to 39 Minutes | 918 | 5.7% |
| 40 to 44 Minutes | 841 | 5.2% |
| 45 to 59 Minutes | 2,027 | 12.6% |
| 60 to 89 Minutes | 886 | 5.5% |
| 90 or more Minutes | 362 | 2.2% |
Commute Time by Sex in Orleans County
The most common commute times in Orleans County are 45 to 59 minutes (1,409 commuters, 16.0%) for males and 5 to 9 minutes (1,210 commuters, 16.6%) for females.
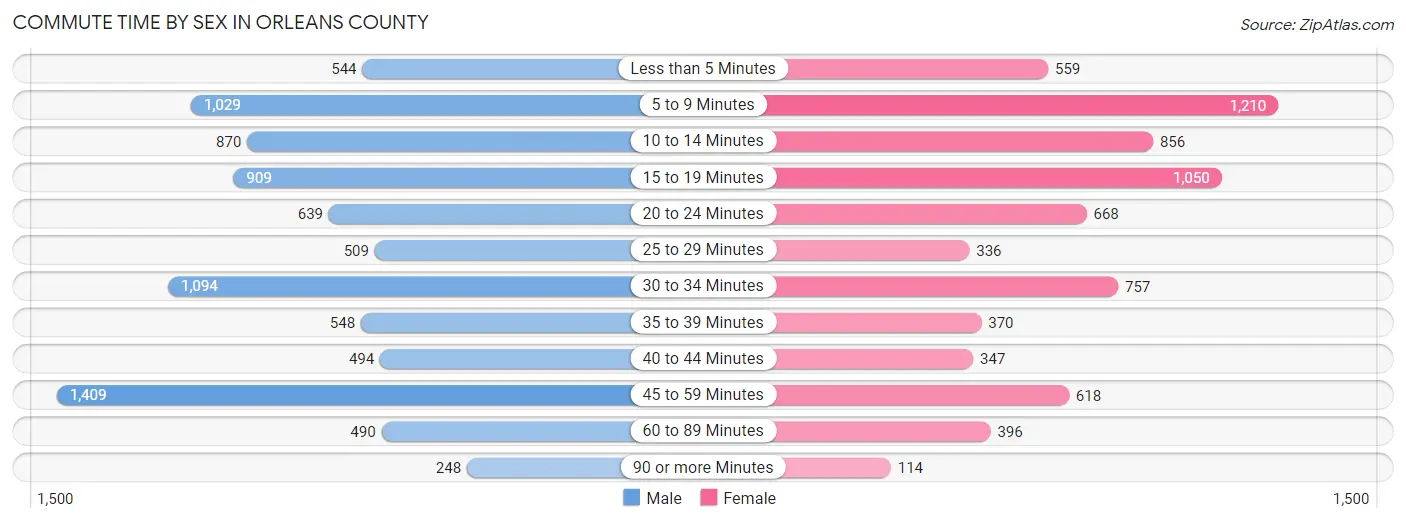
| Commute Time | Male | Female |
| Less than 5 Minutes | 544 (6.2%) | 559 (7.7%) |
| 5 to 9 Minutes | 1,029 (11.7%) | 1,210 (16.6%) |
| 10 to 14 Minutes | 870 (9.9%) | 856 (11.8%) |
| 15 to 19 Minutes | 909 (10.3%) | 1,050 (14.4%) |
| 20 to 24 Minutes | 639 (7.3%) | 668 (9.2%) |
| 25 to 29 Minutes | 509 (5.8%) | 336 (4.6%) |
| 30 to 34 Minutes | 1,094 (12.5%) | 757 (10.4%) |
| 35 to 39 Minutes | 548 (6.2%) | 370 (5.1%) |
| 40 to 44 Minutes | 494 (5.6%) | 347 (4.8%) |
| 45 to 59 Minutes | 1,409 (16.0%) | 618 (8.5%) |
| 60 to 89 Minutes | 490 (5.6%) | 396 (5.4%) |
| 90 or more Minutes | 248 (2.8%) | 114 (1.6%) |
Time of Departure to Work by Sex in Orleans County
The most frequent times of departure to work in Orleans County are 6:00 AM to 6:29 AM (1,489, 17.0%) for males and 7:00 AM to 7:29 AM (1,268, 17.4%) for females.
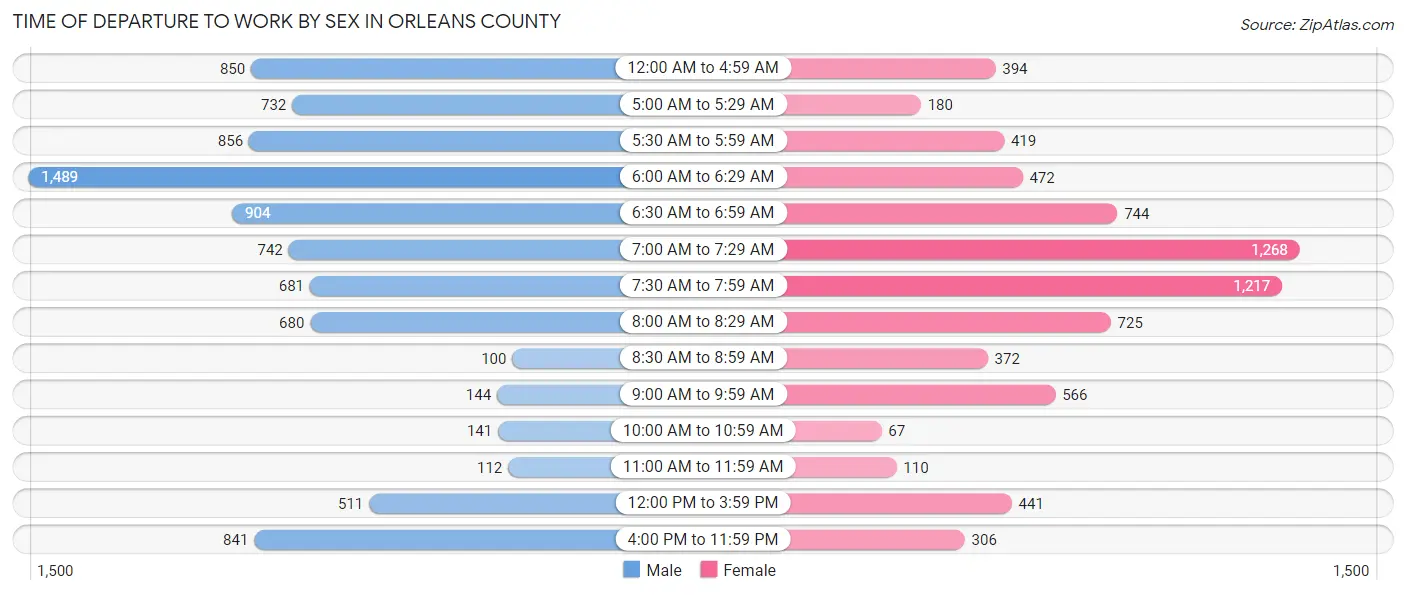
| Time of Departure | Male | Female |
| 12:00 AM to 4:59 AM | 850 (9.7%) | 394 (5.4%) |
| 5:00 AM to 5:29 AM | 732 (8.3%) | 180 (2.5%) |
| 5:30 AM to 5:59 AM | 856 (9.8%) | 419 (5.8%) |
| 6:00 AM to 6:29 AM | 1,489 (17.0%) | 472 (6.5%) |
| 6:30 AM to 6:59 AM | 904 (10.3%) | 744 (10.2%) |
| 7:00 AM to 7:29 AM | 742 (8.5%) | 1,268 (17.4%) |
| 7:30 AM to 7:59 AM | 681 (7.7%) | 1,217 (16.7%) |
| 8:00 AM to 8:29 AM | 680 (7.7%) | 725 (10.0%) |
| 8:30 AM to 8:59 AM | 100 (1.1%) | 372 (5.1%) |
| 9:00 AM to 9:59 AM | 144 (1.6%) | 566 (7.8%) |
| 10:00 AM to 10:59 AM | 141 (1.6%) | 67 (0.9%) |
| 11:00 AM to 11:59 AM | 112 (1.3%) | 110 (1.5%) |
| 12:00 PM to 3:59 PM | 511 (5.8%) | 441 (6.1%) |
| 4:00 PM to 11:59 PM | 841 (9.6%) | 306 (4.2%) |
| Total | 8,783 (100.0%) | 7,281 (100.0%) |
Housing Occupancy in Orleans County
Occupancy by Ownership in Orleans County
Of the total 16,201 dwellings in Orleans County, owner-occupied units account for 12,348 (76.2%), while renter-occupied units make up 3,853 (23.8%).
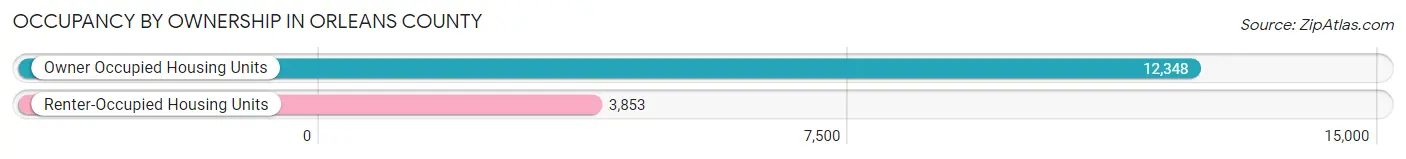
| Occupancy | # Housing Units | % Housing Units |
| Owner Occupied Housing Units | 12,348 | 76.2% |
| Renter-Occupied Housing Units | 3,853 | 23.8% |
| Total Occupied Housing Units | 16,201 | 100.0% |
Occupancy by Household Size in Orleans County
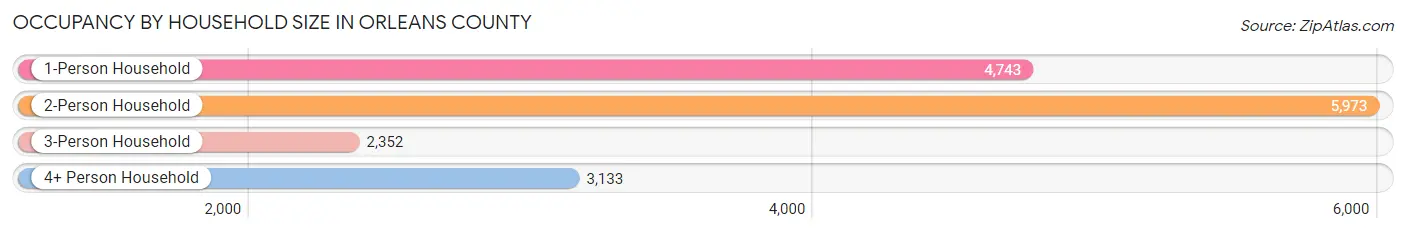
| Household Size | # Housing Units | % Housing Units |
| 1-Person Household | 4,743 | 29.3% |
| 2-Person Household | 5,973 | 36.9% |
| 3-Person Household | 2,352 | 14.5% |
| 4+ Person Household | 3,133 | 19.3% |
| Total Housing Units | 16,201 | 100.0% |
Occupancy by Ownership by Household Size in Orleans County
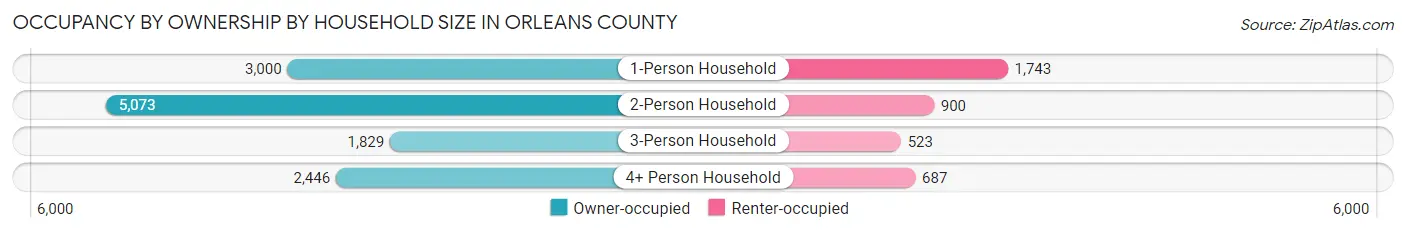
| Household Size | Owner-occupied | Renter-occupied |
| 1-Person Household | 3,000 (63.2%) | 1,743 (36.7%) |
| 2-Person Household | 5,073 (84.9%) | 900 (15.1%) |
| 3-Person Household | 1,829 (77.8%) | 523 (22.2%) |
| 4+ Person Household | 2,446 (78.1%) | 687 (21.9%) |
| Total Housing Units | 12,348 (76.2%) | 3,853 (23.8%) |
Occupancy by Educational Attainment in Orleans County
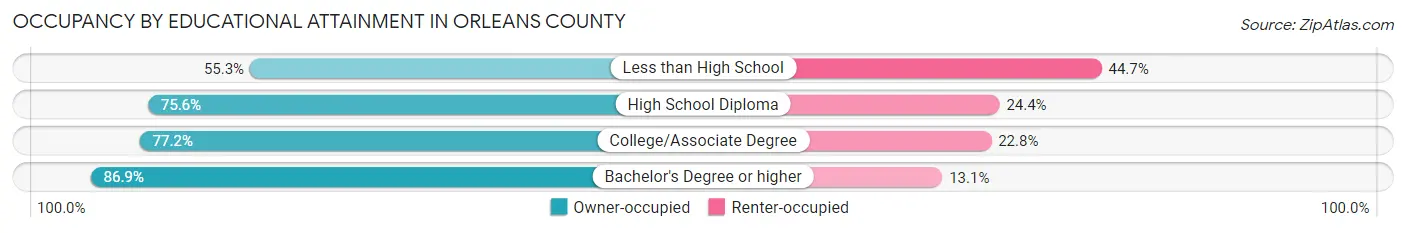
| Household Size | Owner-occupied | Renter-occupied |
| Less than High School | 947 (55.3%) | 765 (44.7%) |
| High School Diploma | 4,374 (75.6%) | 1,415 (24.4%) |
| College/Associate Degree | 4,241 (77.2%) | 1,253 (22.8%) |
| Bachelor's Degree or higher | 2,786 (86.9%) | 420 (13.1%) |
Occupancy by Age of Householder in Orleans County
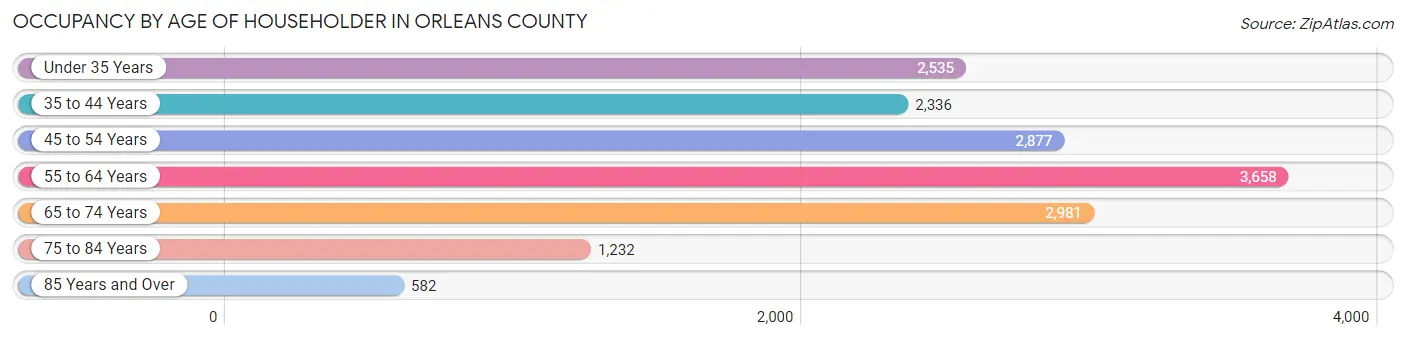
| Age Bracket | # Households | % Households |
| Under 35 Years | 2,535 | 15.7% |
| 35 to 44 Years | 2,336 | 14.4% |
| 45 to 54 Years | 2,877 | 17.8% |
| 55 to 64 Years | 3,658 | 22.6% |
| 65 to 74 Years | 2,981 | 18.4% |
| 75 to 84 Years | 1,232 | 7.6% |
| 85 Years and Over | 582 | 3.6% |
| Total | 16,201 | 100.0% |
Housing Finances in Orleans County
Median Income by Occupancy in Orleans County
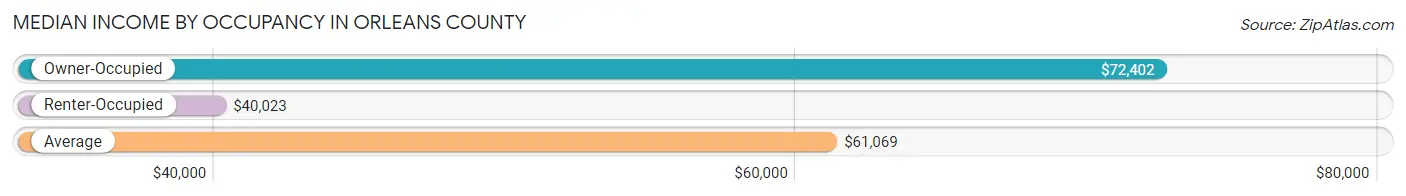
| Occupancy Type | # Households | Median Income |
| Owner-Occupied | 12,348 (76.2%) | $72,402 |
| Renter-Occupied | 3,853 (23.8%) | $40,023 |
| Average | 16,201 (100.0%) | $61,069 |
Occupancy by Householder Income Bracket in Orleans County
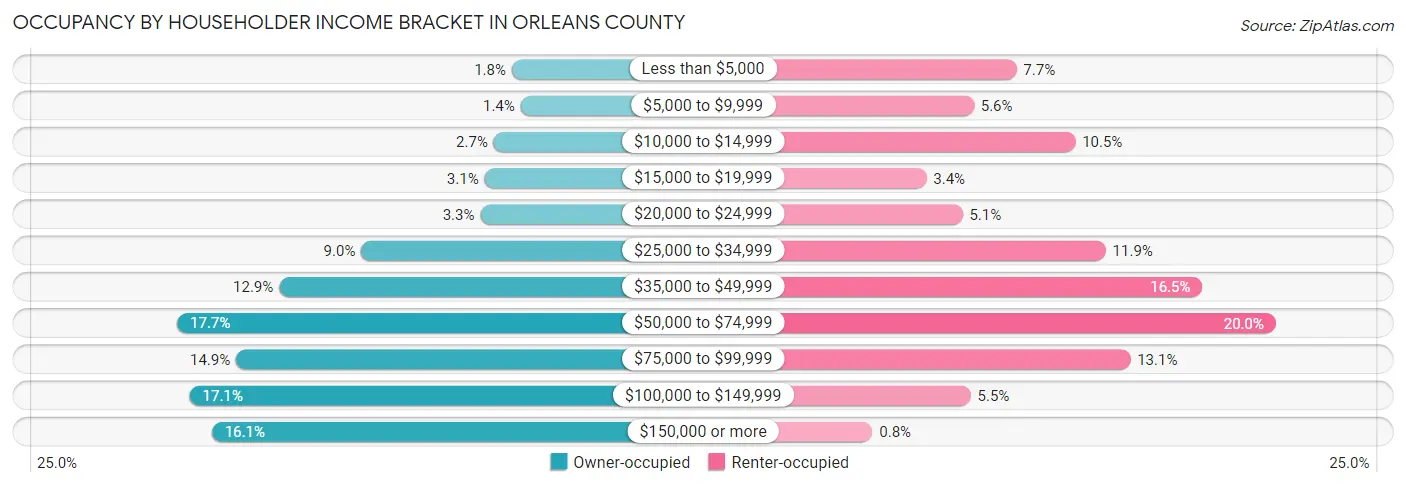
| Income Bracket | Owner-occupied | Renter-occupied |
| Less than $5,000 | 222 (1.8%) | 295 (7.7%) |
| $5,000 to $9,999 | 170 (1.4%) | 217 (5.6%) |
| $10,000 to $14,999 | 329 (2.7%) | 403 (10.5%) |
| $15,000 to $19,999 | 383 (3.1%) | 130 (3.4%) |
| $20,000 to $24,999 | 408 (3.3%) | 196 (5.1%) |
| $25,000 to $34,999 | 1,108 (9.0%) | 459 (11.9%) |
| $35,000 to $49,999 | 1,590 (12.9%) | 636 (16.5%) |
| $50,000 to $74,999 | 2,191 (17.7%) | 771 (20.0%) |
| $75,000 to $99,999 | 1,844 (14.9%) | 504 (13.1%) |
| $100,000 to $149,999 | 2,116 (17.1%) | 211 (5.5%) |
| $150,000 or more | 1,987 (16.1%) | 31 (0.8%) |
| Total | 12,348 (100.0%) | 3,853 (100.0%) |
Monthly Housing Cost Tiers in Orleans County
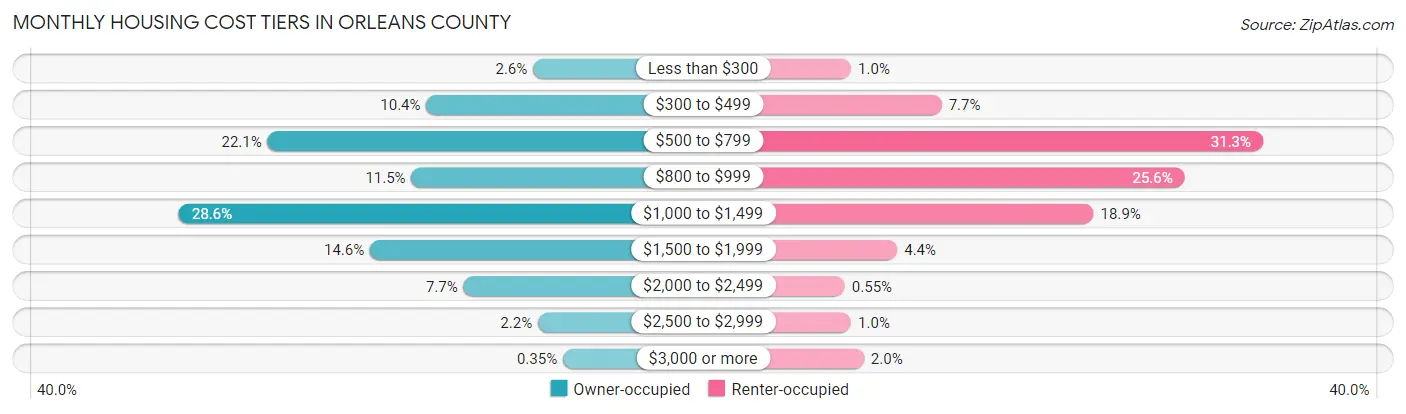
| Monthly Cost | Owner-occupied | Renter-occupied |
| Less than $300 | 315 (2.5%) | 39 (1.0%) |
| $300 to $499 | 1,286 (10.4%) | 296 (7.7%) |
| $500 to $799 | 2,730 (22.1%) | 1,207 (31.3%) |
| $800 to $999 | 1,421 (11.5%) | 985 (25.6%) |
| $1,000 to $1,499 | 3,537 (28.6%) | 727 (18.9%) |
| $1,500 to $1,999 | 1,798 (14.6%) | 170 (4.4%) |
| $2,000 to $2,499 | 947 (7.7%) | 21 (0.5%) |
| $2,500 to $2,999 | 271 (2.2%) | 39 (1.0%) |
| $3,000 or more | 43 (0.4%) | 75 (1.9%) |
| Total | 12,348 (100.0%) | 3,853 (100.0%) |
Physical Housing Characteristics in Orleans County
Housing Structures in Orleans County
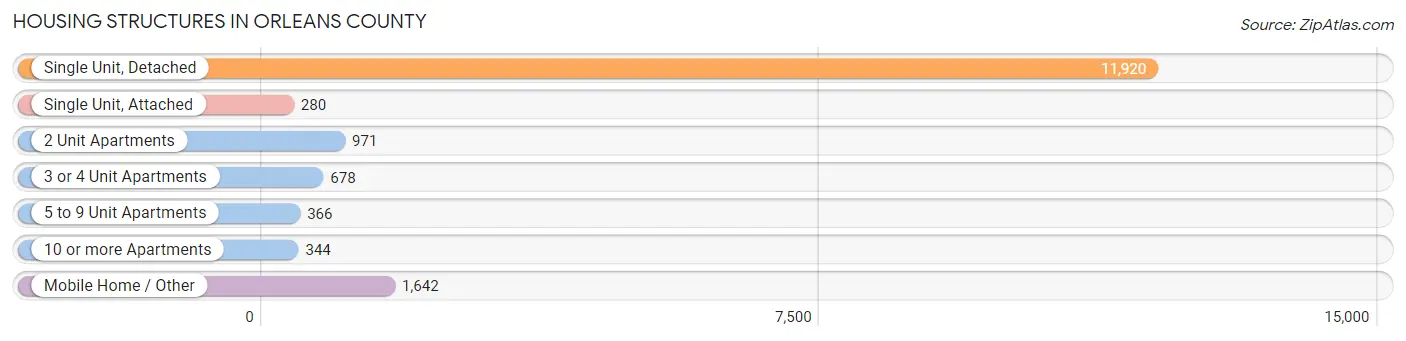
| Structure Type | # Housing Units | % Housing Units |
| Single Unit, Detached | 11,920 | 73.6% |
| Single Unit, Attached | 280 | 1.7% |
| 2 Unit Apartments | 971 | 6.0% |
| 3 or 4 Unit Apartments | 678 | 4.2% |
| 5 to 9 Unit Apartments | 366 | 2.3% |
| 10 or more Apartments | 344 | 2.1% |
| Mobile Home / Other | 1,642 | 10.1% |
| Total | 16,201 | 100.0% |
Housing Structures by Occupancy in Orleans County
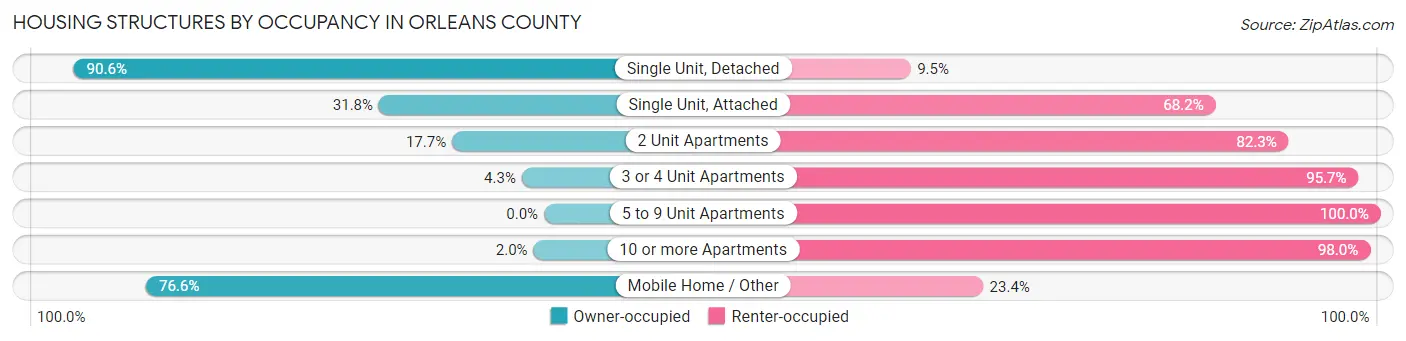
| Structure Type | Owner-occupied | Renter-occupied |
| Single Unit, Detached | 10,793 (90.5%) | 1,127 (9.5%) |
| Single Unit, Attached | 89 (31.8%) | 191 (68.2%) |
| 2 Unit Apartments | 172 (17.7%) | 799 (82.3%) |
| 3 or 4 Unit Apartments | 29 (4.3%) | 649 (95.7%) |
| 5 to 9 Unit Apartments | 0 (0.0%) | 366 (100.0%) |
| 10 or more Apartments | 7 (2.0%) | 337 (98.0%) |
| Mobile Home / Other | 1,258 (76.6%) | 384 (23.4%) |
| Total | 12,348 (76.2%) | 3,853 (23.8%) |
Housing Structures by Number of Rooms in Orleans County
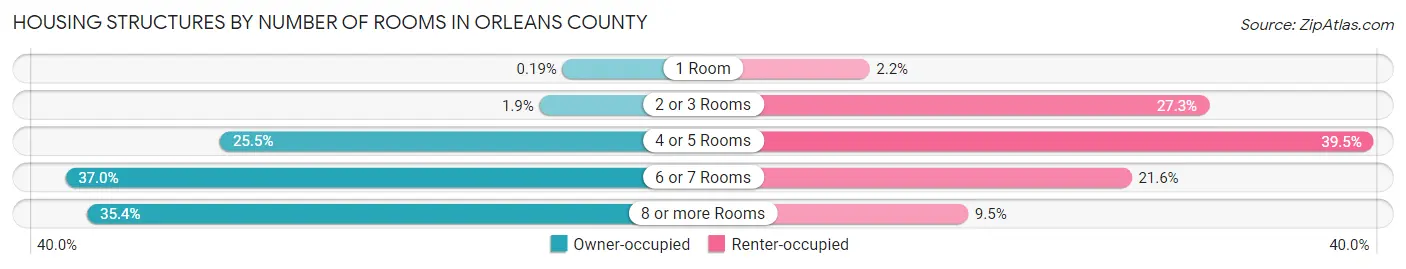
| Number of Rooms | Owner-occupied | Renter-occupied |
| 1 Room | 23 (0.2%) | 84 (2.2%) |
| 2 or 3 Rooms | 235 (1.9%) | 1,052 (27.3%) |
| 4 or 5 Rooms | 3,154 (25.5%) | 1,521 (39.5%) |
| 6 or 7 Rooms | 4,568 (37.0%) | 831 (21.6%) |
| 8 or more Rooms | 4,368 (35.4%) | 365 (9.5%) |
| Total | 12,348 (100.0%) | 3,853 (100.0%) |
Housing Structure by Heating Type in Orleans County
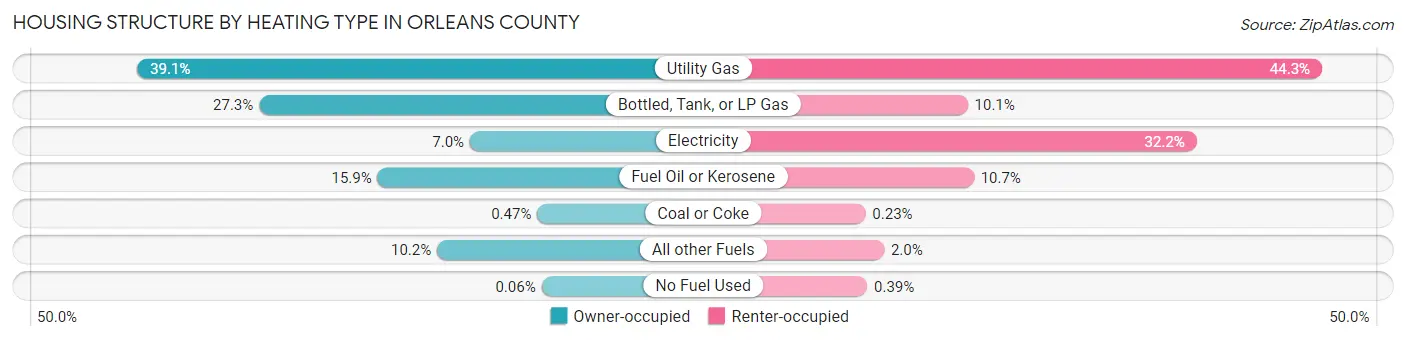
| Heating Type | Owner-occupied | Renter-occupied |
| Utility Gas | 4,830 (39.1%) | 1,708 (44.3%) |
| Bottled, Tank, or LP Gas | 3,376 (27.3%) | 389 (10.1%) |
| Electricity | 861 (7.0%) | 1,242 (32.2%) |
| Fuel Oil or Kerosene | 1,963 (15.9%) | 412 (10.7%) |
| Coal or Coke | 58 (0.5%) | 9 (0.2%) |
| All other Fuels | 1,253 (10.2%) | 78 (2.0%) |
| No Fuel Used | 7 (0.1%) | 15 (0.4%) |
| Total | 12,348 (100.0%) | 3,853 (100.0%) |
Household Vehicle Usage in Orleans County
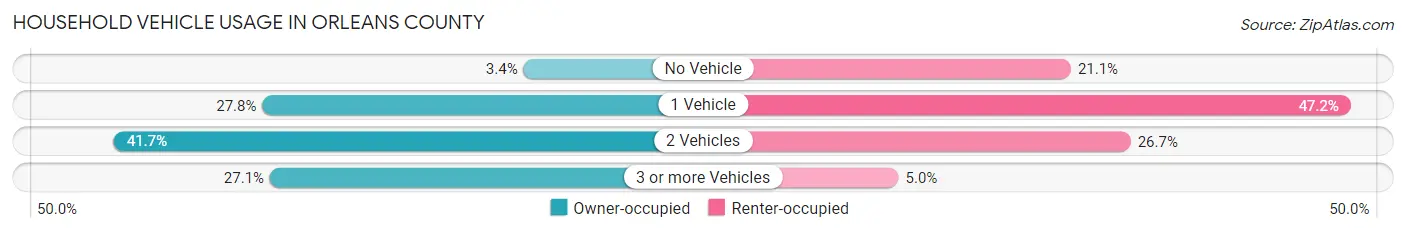
| Vehicles per Household | Owner-occupied | Renter-occupied |
| No Vehicle | 423 (3.4%) | 813 (21.1%) |
| 1 Vehicle | 3,434 (27.8%) | 1,819 (47.2%) |
| 2 Vehicles | 5,145 (41.7%) | 1,028 (26.7%) |
| 3 or more Vehicles | 3,346 (27.1%) | 193 (5.0%) |
| Total | 12,348 (100.0%) | 3,853 (100.0%) |
Real Estate & Mortgages in Orleans County
Real Estate and Mortgage Overview in Orleans County
| Characteristic | Without Mortgage | With Mortgage |
| Housing Units | 5,287 | 7,061 |
| Median Property Value | $106,000 | $139,600 |
| Median Household Income | $51,313 | $1,497 |
| Monthly Housing Costs | $643 | $40 |
| Real Estate Taxes | $3,167 | $267 |
Property Value by Mortgage Status in Orleans County
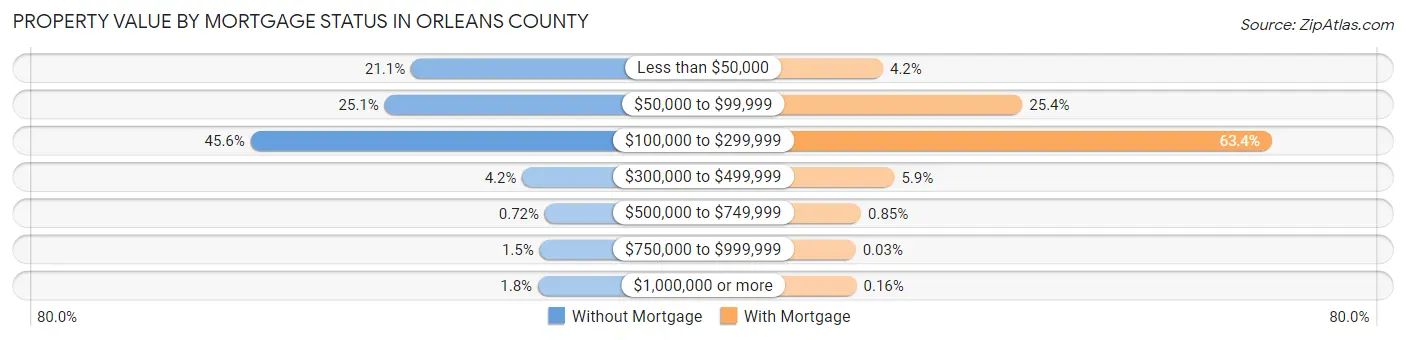
| Property Value | Without Mortgage | With Mortgage |
| Less than $50,000 | 1,116 (21.1%) | 296 (4.2%) |
| $50,000 to $99,999 | 1,329 (25.1%) | 1,795 (25.4%) |
| $100,000 to $299,999 | 2,409 (45.6%) | 4,478 (63.4%) |
| $300,000 to $499,999 | 220 (4.2%) | 419 (5.9%) |
| $500,000 to $749,999 | 38 (0.7%) | 60 (0.9%) |
| $750,000 to $999,999 | 81 (1.5%) | 2 (0.0%) |
| $1,000,000 or more | 94 (1.8%) | 11 (0.2%) |
| Total | 5,287 (100.0%) | 7,061 (100.0%) |
Household Income by Mortgage Status in Orleans County
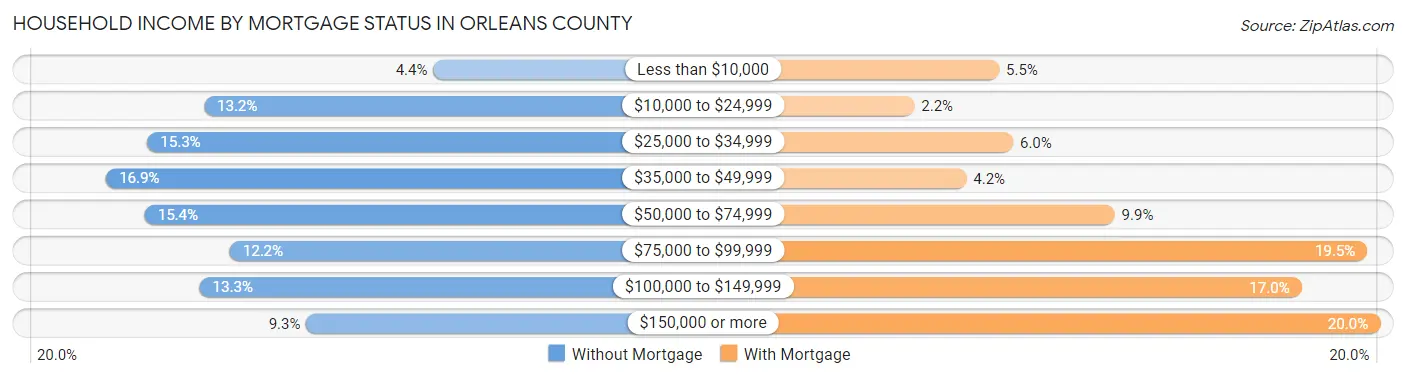
| Household Income | Without Mortgage | With Mortgage |
| Less than $10,000 | 234 (4.4%) | 386 (5.5%) |
| $10,000 to $24,999 | 696 (13.2%) | 158 (2.2%) |
| $25,000 to $34,999 | 810 (15.3%) | 424 (6.0%) |
| $35,000 to $49,999 | 893 (16.9%) | 298 (4.2%) |
| $50,000 to $74,999 | 815 (15.4%) | 697 (9.9%) |
| $75,000 to $99,999 | 644 (12.2%) | 1,376 (19.5%) |
| $100,000 to $149,999 | 705 (13.3%) | 1,200 (17.0%) |
| $150,000 or more | 490 (9.3%) | 1,411 (20.0%) |
| Total | 5,287 (100.0%) | 7,061 (100.0%) |
Property Value to Household Income Ratio in Orleans County
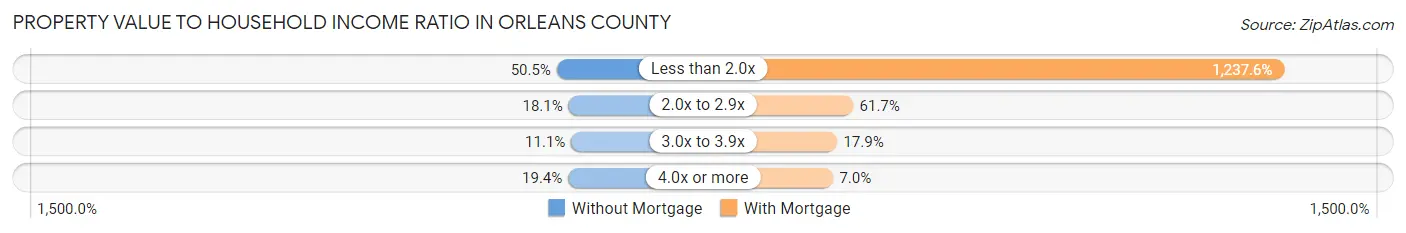
| Value-to-Income Ratio | Without Mortgage | With Mortgage |
| Less than 2.0x | 2,668 (50.5%) | 87,390 (1,237.6%) |
| 2.0x to 2.9x | 959 (18.1%) | 4,359 (61.7%) |
| 3.0x to 3.9x | 588 (11.1%) | 1,265 (17.9%) |
| 4.0x or more | 1,024 (19.4%) | 492 (7.0%) |
| Total | 5,287 (100.0%) | 7,061 (100.0%) |
Real Estate Taxes by Mortgage Status in Orleans County
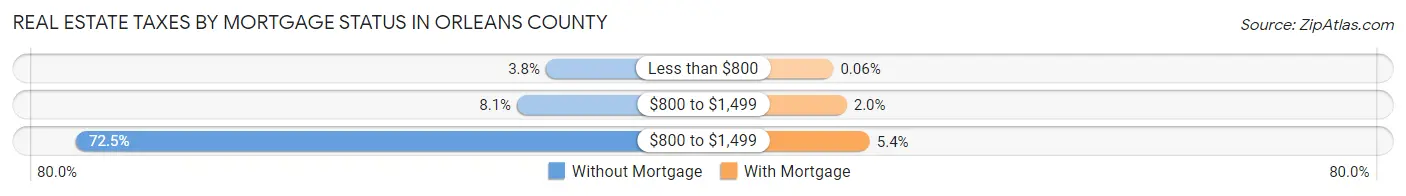
| Property Taxes | Without Mortgage | With Mortgage |
| Less than $800 | 203 (3.8%) | 4 (0.1%) |
| $800 to $1,499 | 426 (8.1%) | 142 (2.0%) |
| $800 to $1,499 | 3,832 (72.5%) | 380 (5.4%) |
| Total | 5,287 (100.0%) | 7,061 (100.0%) |
Health & Disability in Orleans County
Health Insurance Coverage by Age in Orleans County
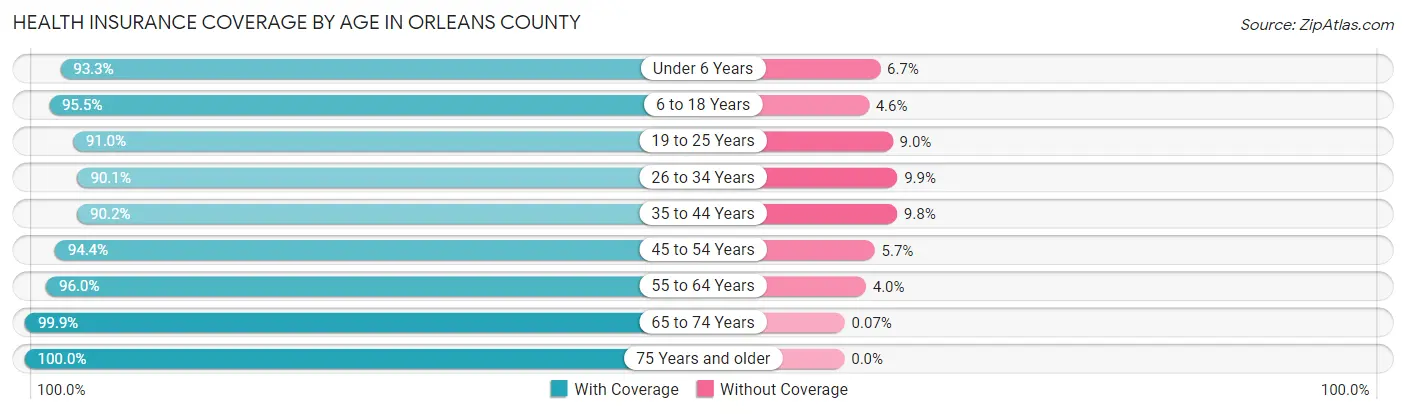
| Age Bracket | With Coverage | Without Coverage |
| Under 6 Years | 2,271 (93.3%) | 162 (6.7%) |
| 6 to 18 Years | 5,534 (95.5%) | 264 (4.5%) |
| 19 to 25 Years | 2,545 (91.0%) | 252 (9.0%) |
| 26 to 34 Years | 3,718 (90.1%) | 407 (9.9%) |
| 35 to 44 Years | 3,953 (90.2%) | 430 (9.8%) |
| 45 to 54 Years | 4,811 (94.4%) | 288 (5.7%) |
| 55 to 64 Years | 6,241 (96.0%) | 261 (4.0%) |
| 65 to 74 Years | 4,412 (99.9%) | 3 (0.1%) |
| 75 Years and older | 2,689 (100.0%) | 0 (0.0%) |
| Total | 36,174 (94.6%) | 2,067 (5.4%) |
Health Insurance Coverage by Citizenship Status in Orleans County
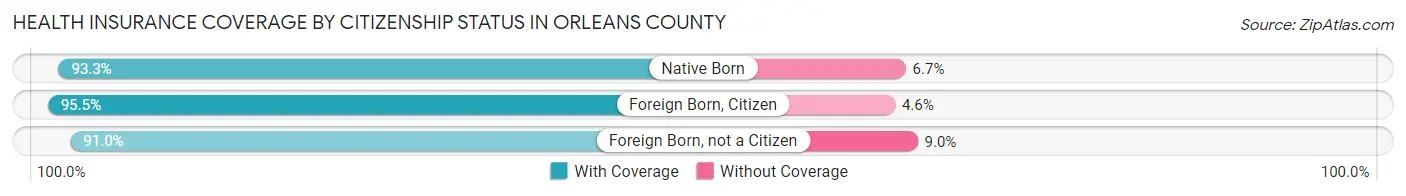
| Citizenship Status | With Coverage | Without Coverage |
| Native Born | 2,271 (93.3%) | 162 (6.7%) |
| Foreign Born, Citizen | 5,534 (95.5%) | 264 (4.5%) |
| Foreign Born, not a Citizen | 2,545 (91.0%) | 252 (9.0%) |
Health Insurance Coverage by Household Income in Orleans County
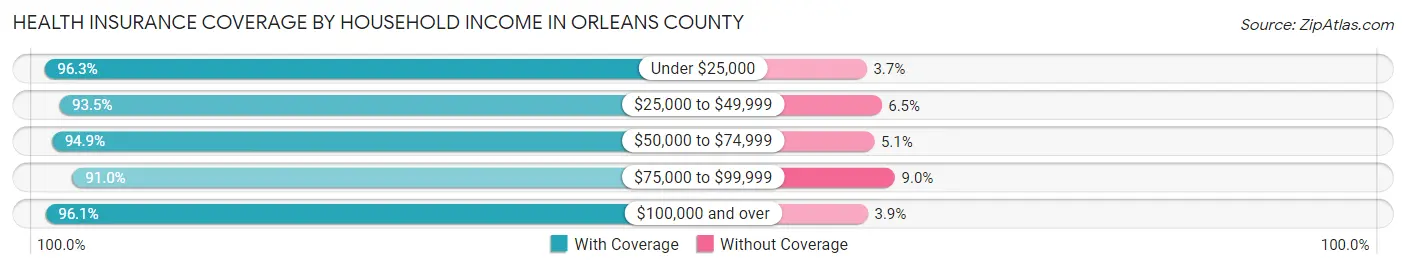
| Household Income | With Coverage | Without Coverage |
| Under $25,000 | 4,201 (96.3%) | 161 (3.7%) |
| $25,000 to $49,999 | 6,894 (93.5%) | 476 (6.5%) |
| $50,000 to $74,999 | 6,449 (94.9%) | 346 (5.1%) |
| $75,000 to $99,999 | 5,387 (91.0%) | 530 (9.0%) |
| $100,000 and over | 12,724 (96.1%) | 513 (3.9%) |
Public vs Private Health Insurance Coverage by Age in Orleans County
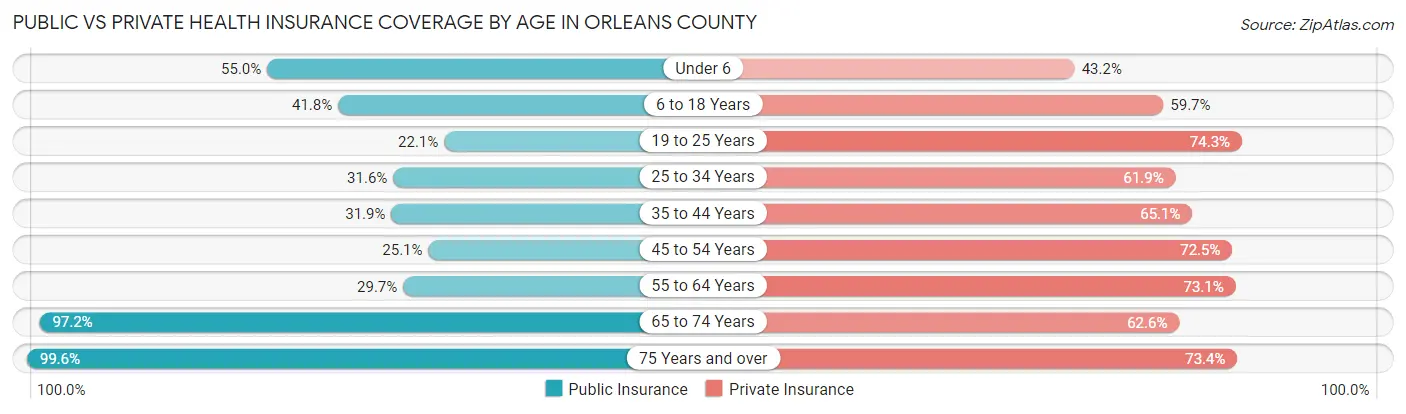
| Age Bracket | Public Insurance | Private Insurance |
| Under 6 | 1,338 (55.0%) | 1,052 (43.2%) |
| 6 to 18 Years | 2,425 (41.8%) | 3,461 (59.7%) |
| 19 to 25 Years | 619 (22.1%) | 2,077 (74.3%) |
| 25 to 34 Years | 1,303 (31.6%) | 2,555 (61.9%) |
| 35 to 44 Years | 1,400 (31.9%) | 2,851 (65.0%) |
| 45 to 54 Years | 1,278 (25.1%) | 3,696 (72.5%) |
| 55 to 64 Years | 1,934 (29.7%) | 4,752 (73.1%) |
| 65 to 74 Years | 4,293 (97.2%) | 2,765 (62.6%) |
| 75 Years and over | 2,678 (99.6%) | 1,974 (73.4%) |
| Total | 17,268 (45.2%) | 25,183 (65.8%) |
Disability Status by Sex by Age in Orleans County
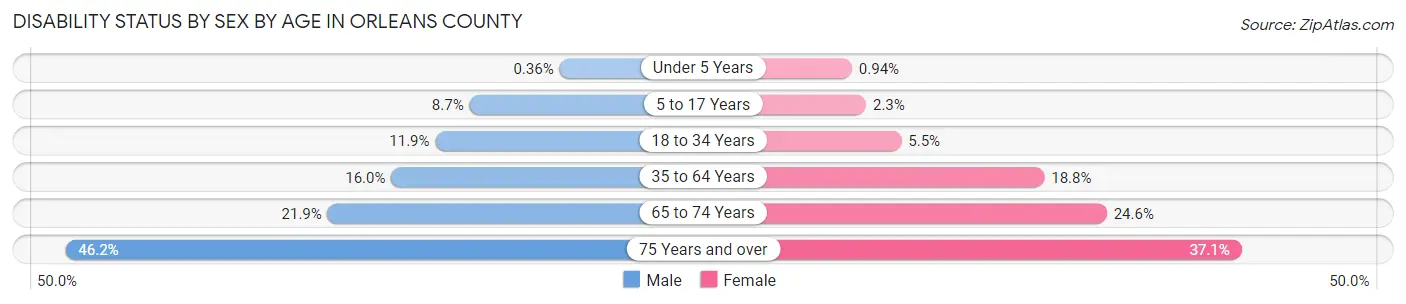
| Age Bracket | Male | Female |
| Under 5 Years | 4 (0.4%) | 8 (0.9%) |
| 5 to 17 Years | 259 (8.7%) | 62 (2.2%) |
| 18 to 34 Years | 487 (11.9%) | 186 (5.5%) |
| 35 to 64 Years | 1,278 (16.0%) | 1,500 (18.8%) |
| 65 to 74 Years | 482 (21.9%) | 544 (24.6%) |
| 75 Years and over | 549 (46.2%) | 557 (37.1%) |
Disability Class by Sex by Age in Orleans County
Disability Class: Hearing Difficulty
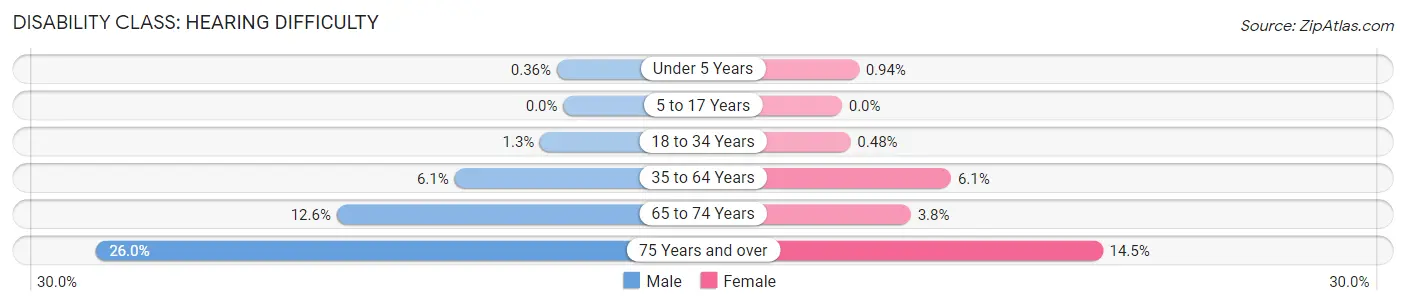
| Age Bracket | Male | Female |
| Under 5 Years | 4 (0.4%) | 8 (0.9%) |
| 5 to 17 Years | 0 (0.0%) | 0 (0.0%) |
| 18 to 34 Years | 53 (1.3%) | 16 (0.5%) |
| 35 to 64 Years | 485 (6.1%) | 485 (6.1%) |
| 65 to 74 Years | 278 (12.6%) | 85 (3.8%) |
| 75 Years and over | 309 (26.0%) | 218 (14.5%) |
Disability Class: Vision Difficulty
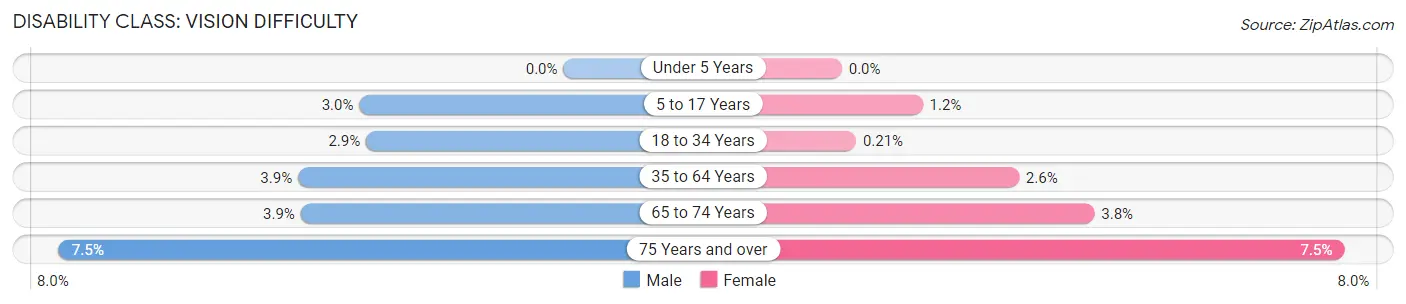
| Age Bracket | Male | Female |
| Under 5 Years | 0 (0.0%) | 0 (0.0%) |
| 5 to 17 Years | 90 (3.0%) | 33 (1.2%) |
| 18 to 34 Years | 120 (2.9%) | 7 (0.2%) |
| 35 to 64 Years | 315 (3.9%) | 210 (2.6%) |
| 65 to 74 Years | 86 (3.9%) | 83 (3.7%) |
| 75 Years and over | 89 (7.5%) | 112 (7.5%) |
Disability Class: Cognitive Difficulty
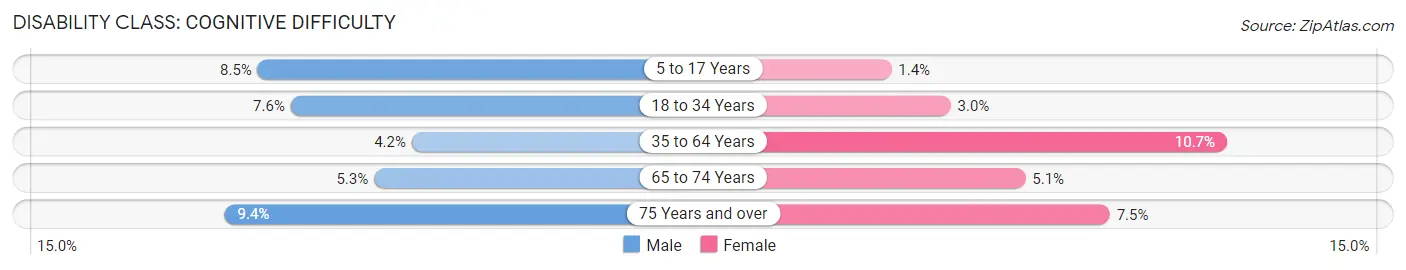
| Age Bracket | Male | Female |
| 5 to 17 Years | 253 (8.5%) | 38 (1.4%) |
| 18 to 34 Years | 311 (7.6%) | 102 (3.0%) |
| 35 to 64 Years | 338 (4.2%) | 856 (10.7%) |
| 65 to 74 Years | 116 (5.3%) | 113 (5.1%) |
| 75 Years and over | 112 (9.4%) | 112 (7.5%) |
Disability Class: Ambulatory Difficulty
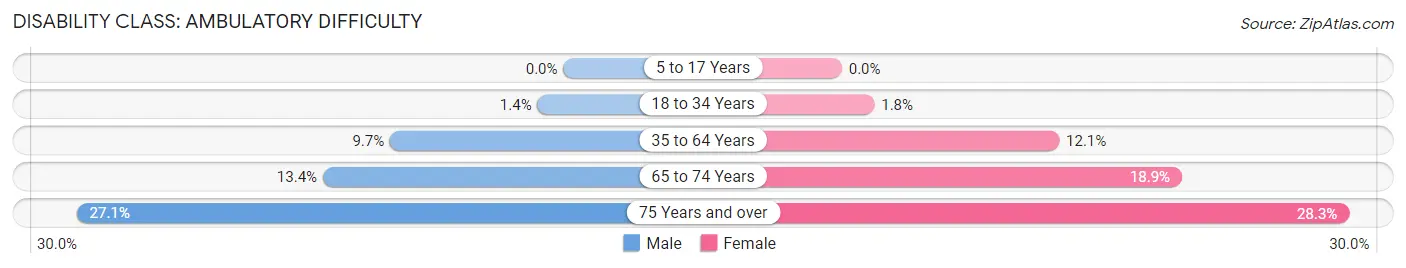
| Age Bracket | Male | Female |
| 5 to 17 Years | 0 (0.0%) | 0 (0.0%) |
| 18 to 34 Years | 59 (1.4%) | 61 (1.8%) |
| 35 to 64 Years | 772 (9.7%) | 966 (12.1%) |
| 65 to 74 Years | 295 (13.4%) | 419 (18.9%) |
| 75 Years and over | 322 (27.1%) | 424 (28.2%) |
Disability Class: Self-Care Difficulty
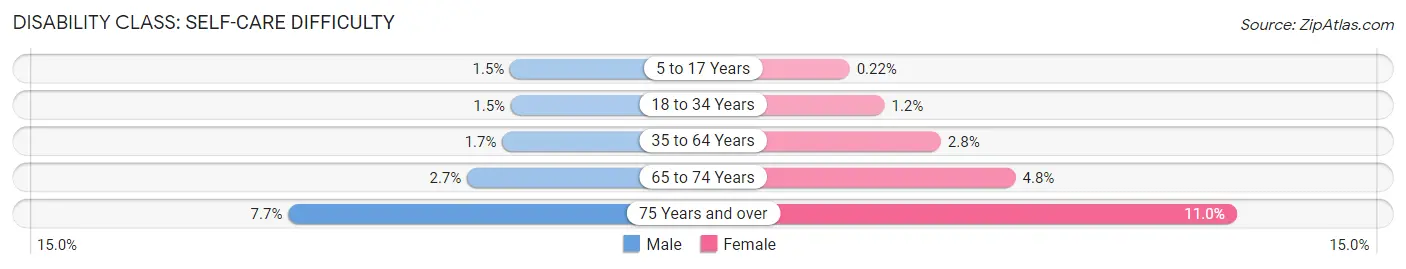
| Age Bracket | Male | Female |
| 5 to 17 Years | 44 (1.5%) | 6 (0.2%) |
| 18 to 34 Years | 60 (1.5%) | 40 (1.2%) |
| 35 to 64 Years | 136 (1.7%) | 220 (2.8%) |
| 65 to 74 Years | 59 (2.7%) | 107 (4.8%) |
| 75 Years and over | 91 (7.7%) | 165 (11.0%) |
Technology Access in Orleans County
Computing Device Access in Orleans County
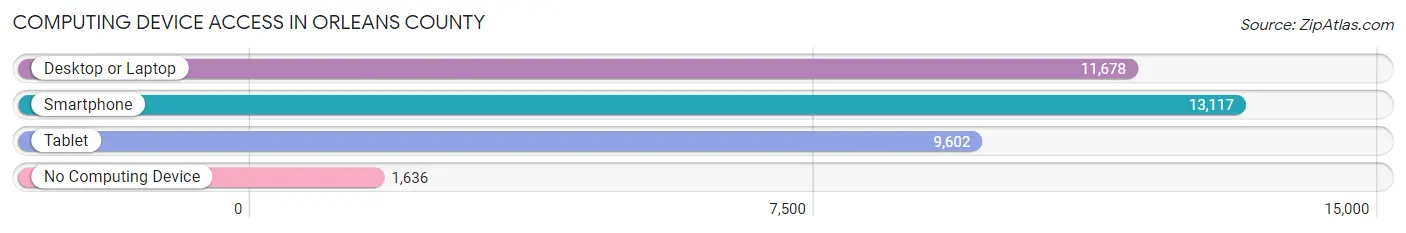
| Device Type | # Households | % Households |
| Desktop or Laptop | 11,678 | 72.1% |
| Smartphone | 13,117 | 81.0% |
| Tablet | 9,602 | 59.3% |
| No Computing Device | 1,636 | 10.1% |
| Total | 16,201 | 100.0% |
Internet Access in Orleans County
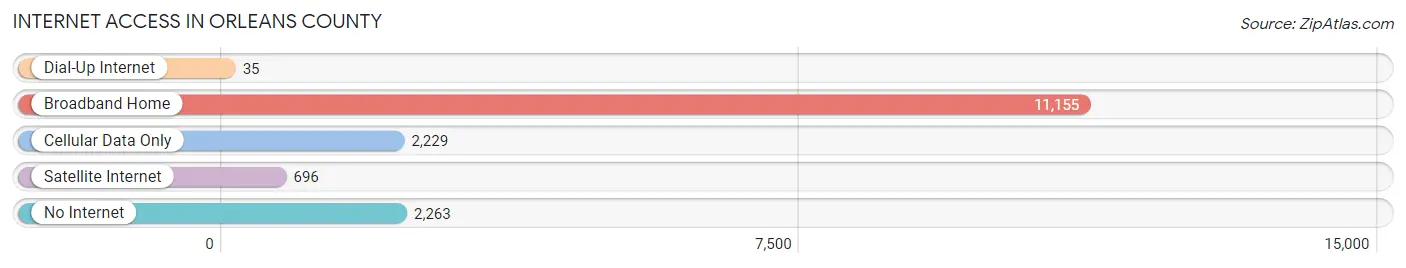
| Internet Type | # Households | % Households |
| Dial-Up Internet | 35 | 0.2% |
| Broadband Home | 11,155 | 68.9% |
| Cellular Data Only | 2,229 | 13.8% |
| Satellite Internet | 696 | 4.3% |
| No Internet | 2,263 | 14.0% |
| Total | 16,201 | 100.0% |
Orleans County Summary
Orleans County is a county located in the western part of the state of New York, in the United States. As of the 2010 census, the population was 42,883. The county seat is Albion. The county is named after the French Royal House of Orleans.
Geography
Orleans County is located in the western part of New York State, east of Buffalo and south of Rochester. It is bordered by Lake Ontario to the north, Niagara County to the east, Genesee County to the south, and Monroe County to the west. The county has a total area of 519 square miles, of which 498 square miles is land and 21 square miles (4.1%) is water.
The northern part of the county is relatively flat, while the southern part is hilly. The highest point in the county is a hill in the Town of Gaines, with an elevation of 875 feet above sea level. The lowest point is near the shore of Lake Ontario, with an elevation of 249 feet.
Climate
Orleans County has a humid continental climate, with cold, snowy winters and warm, humid summers. The average annual temperature is 46°F, and the average annual precipitation is 37 inches.
Demographics
As of the 2010 census, there were 42,883 people, 16,845 households, and 11,717 families residing in the county. The population density was 86 people per square mile. There were 19,890 housing units at an average density of 40 per square mile. The racial makeup of the county was 95.2% White, 1.7% Black or African American, 0.4% Native American, 0.4% Asian, 0.0% Pacific Islander, 0.7% from other races, and 1.6% from two or more races. Hispanic or Latino of any race were 2.2% of the population.
There were 16,845 households, out of which 30.2% had children under the age of 18 living with them, 54.2% were married couples living together, 10.2% had a female householder with no husband present, and 30.7% were non-families. 25.2% of all households were made up of individuals, and 11.2% had someone living alone who was 65 years of age or older. The average household size was 2.50 and the average family size was 2.98.
The median age in the county was 41.3 years. 23.2% of residents were under the age of 18; 7.3% were between the ages of 18 and 24; 24.2% were from 25 to 44; 29.2% were from 45 to 64; and 16.1% were 65 years of age or older. The gender makeup of the county was 48.3% male and 51.7% female.
Economy
Orleans County is largely rural, with a few small towns and villages. The county's economy is largely based on agriculture, with dairy farming being the primary industry. Other industries include manufacturing, tourism, and retail.
The county is home to several large employers, including the Orleans County Cooperative Extension, the Orleans County Department of Social Services, and the Orleans County Sheriff's Office. The county is also home to several small businesses, including wineries, breweries, and farms.
The median household income in the county was $45,945 in 2018, and the median family income was $54,945. The per capita income was $24,945. About 11.2% of families and 14.7% of the population were below the poverty line, including 19.2% of those under age 18 and 8.2% of those age 65 or over.
Conclusion
Orleans County is a rural county located in the western part of New York State. It is bordered by Lake Ontario to the north, Niagara County to the east, Genesee County to the south, and Monroe County to the west. The county has a total area of 519 square miles, and a population of 42,883 as of the 2010 census. The county has a humid continental climate, with cold, snowy winters and warm, humid summers. The economy of the county is largely based on agriculture, with dairy farming being the primary industry. Other industries include manufacturing, tourism, and retail. The median household income in the county was $45,945 in 2018, and the median family income was $54,945.
Common Questions
What is Per Capita Income in Orleans County?
Per Capita income in Orleans County is $33,054.
What is the Median Family Income in Orleans County?
Median Family Income in Orleans County is $78,370.
What is the Median Household income in Orleans County?
Median Household Income in Orleans County is $61,069.
What is Income or Wage Gap in Orleans County?
Income or Wage Gap in Orleans County is 24.2%.
Women in Orleans County earn 75.8 cents for every dollar earned by a man.
What is Family Income Deficit in Orleans County?
Family Income Deficit in Orleans County is $12,858.
Families that are below poverty line in Orleans County earn $12,858 less on average than the poverty threshold level.
What is Inequality or Gini Index in Orleans County?
Inequality or Gini Index in Orleans County is 0.44.
What is the Total Population of Orleans County?
Total Population of Orleans County is 40,148.
What is the Total Male Population of Orleans County?
Total Male Population of Orleans County is 20,464.
What is the Total Female Population of Orleans County?
Total Female Population of Orleans County is 19,684.
What is the Ratio of Males per 100 Females in Orleans County?
There are 103.96 Males per 100 Females in Orleans County.
What is the Ratio of Females per 100 Males in Orleans County?
There are 96.19 Females per 100 Males in Orleans County.
What is the Median Population Age in Orleans County?
Median Population Age in Orleans County is 43.2 Years.
What is the Average Family Size in Orleans County
Average Family Size in Orleans County is 2.9 People.
What is the Average Household Size in Orleans County
Average Household Size in Orleans County is 2.3 People.
How Large is the Labor Force in Orleans County?
There are 18,988 People in the Labor Forcein in Orleans County.
What is the Percentage of People in the Labor Force in Orleans County?
56.8% of People are in the Labor Force in Orleans County.
What is the Unemployment Rate in Orleans County?
Unemployment Rate in Orleans County is 6.1%.