Niagara County, NY Map & Demographics
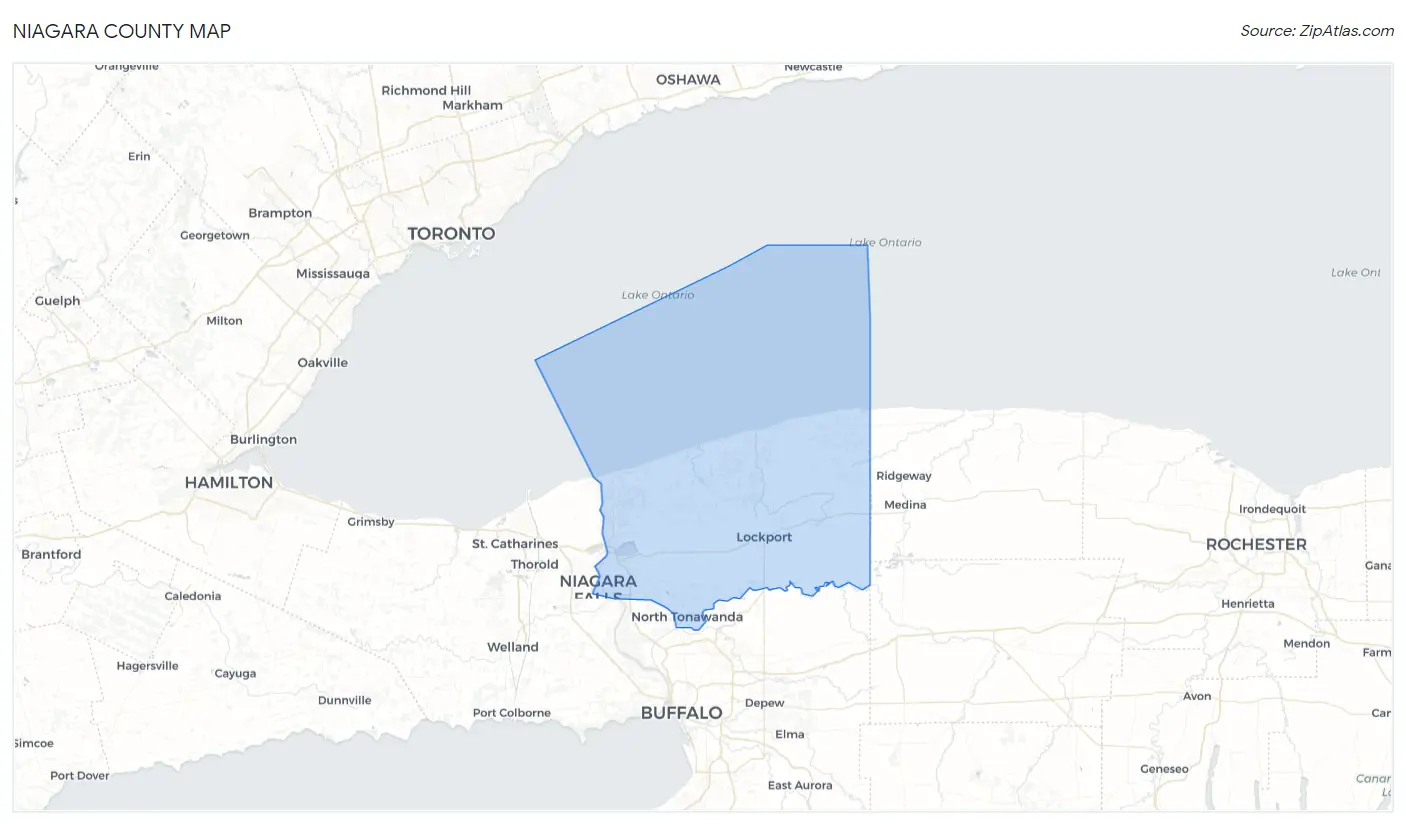
Niagara County Map
Niagara County Overview
$36,556
PER CAPITA INCOME
$85,934
AVG FAMILY INCOME
$65,882
AVG HOUSEHOLD INCOME
27.5%
WAGE / INCOME GAP [ % ]
72.5¢/ $1
WAGE / INCOME GAP [ $ ]
$11,254
FAMILY INCOME DEFICIT
0.44
INEQUALITY / GINI INDEX
212,230
TOTAL POPULATION
104,348
MALE POPULATION
107,882
FEMALE POPULATION
96.72
MALES / 100 FEMALES
103.39
FEMALES / 100 MALES
43.1
MEDIAN AGE
2.9
AVG FAMILY SIZE
2.3
AVG HOUSEHOLD SIZE
106,863
LABOR FORCE [ PEOPLE ]
60.9%
PERCENT IN LABOR FORCE
5.8%
UNEMPLOYMENT RATE
Income in Niagara County
Income Overview in Niagara County
Per Capita Income in Niagara County is $36,556, while median incomes of families and households are $85,934 and $65,882 respectively.
| Characteristic | Number | Measure |
| Per Capita Income | 212,230 | $36,556 |
| Median Family Income | 55,919 | $85,934 |
| Mean Family Income | 55,919 | $102,730 |
| Median Household Income | 90,982 | $65,882 |
| Mean Household Income | 90,982 | $84,468 |
| Income Deficit | 55,919 | $11,254 |
| Wage / Income Gap (%) | 212,230 | 27.45% |
| Wage / Income Gap ($) | 212,230 | 72.55¢ per $1 |
| Gini / Inequality Index | 212,230 | 0.44 |
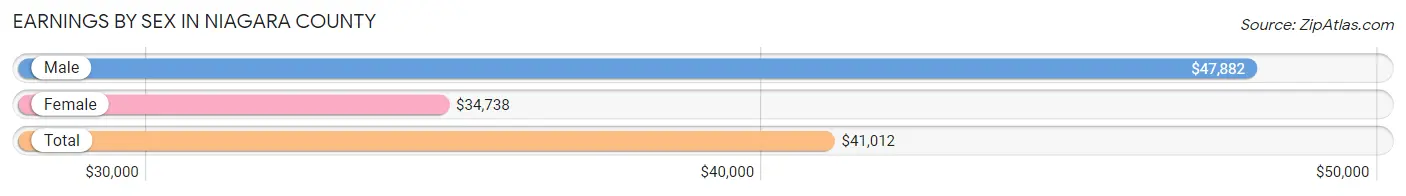
Earnings by Sex in Niagara County
Average Earnings in Niagara County are $41,012, $47,882 for men and $34,738 for women, a difference of 27.5%.
| Sex | Number | Average Earnings |
| Male | 57,605 (51.5%) | $47,882 |
| Female | 54,278 (48.5%) | $34,738 |
| Total | 111,883 (100.0%) | $41,012 |
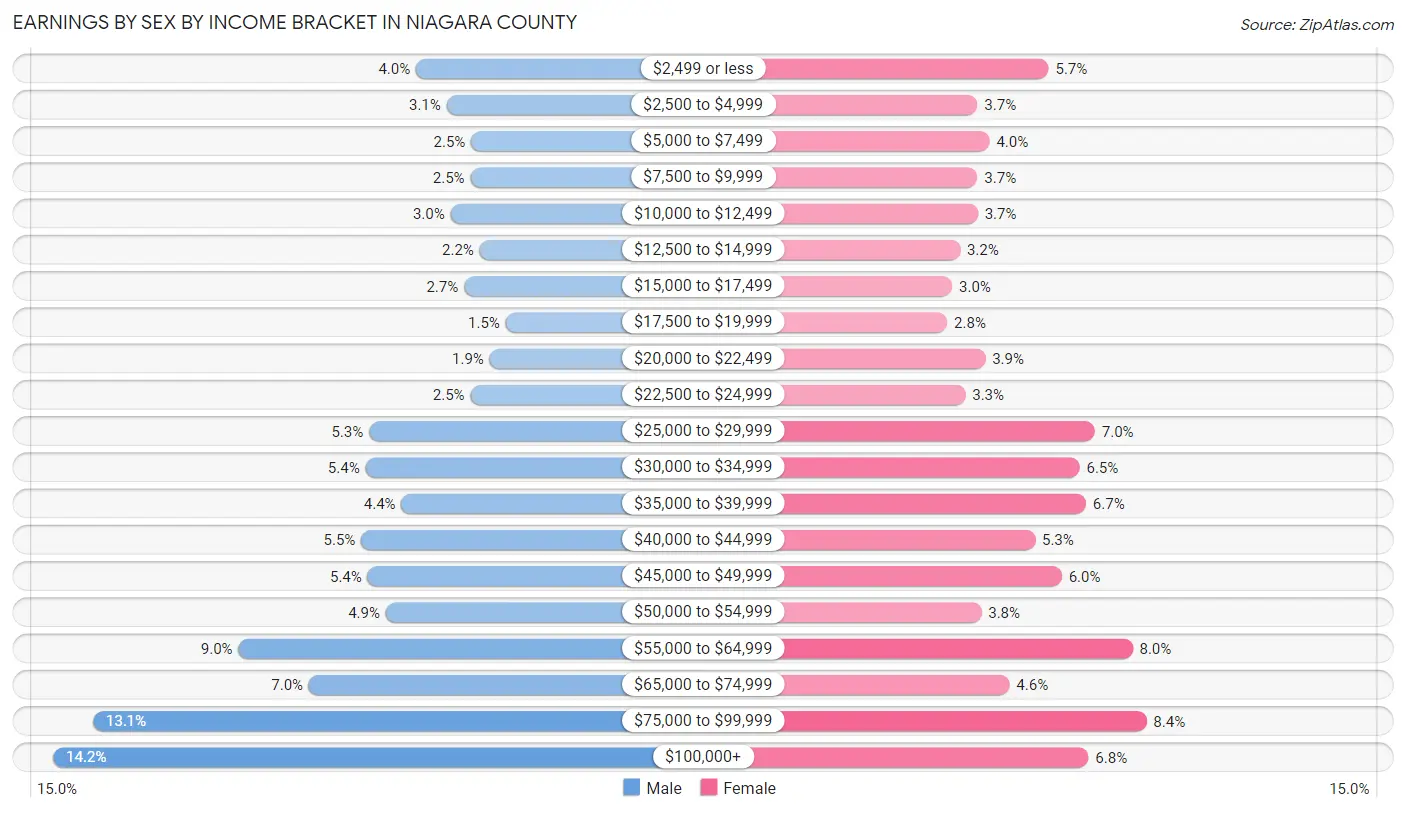
Earnings by Sex by Income Bracket in Niagara County
The most common earnings brackets in Niagara County are $100,000+ for men (8,181 | 14.2%) and $75,000 to $99,999 for women (4,568 | 8.4%).
| Income | Male | Female |
| $2,499 or less | 2,307 (4.0%) | 3,077 (5.7%) |
| $2,500 to $4,999 | 1,808 (3.1%) | 1,994 (3.7%) |
| $5,000 to $7,499 | 1,411 (2.5%) | 2,176 (4.0%) |
| $7,500 to $9,999 | 1,424 (2.5%) | 1,990 (3.7%) |
| $10,000 to $12,499 | 1,746 (3.0%) | 1,997 (3.7%) |
| $12,500 to $14,999 | 1,271 (2.2%) | 1,728 (3.2%) |
| $15,000 to $17,499 | 1,524 (2.6%) | 1,604 (3.0%) |
| $17,500 to $19,999 | 852 (1.5%) | 1,529 (2.8%) |
| $20,000 to $22,499 | 1,112 (1.9%) | 2,112 (3.9%) |
| $22,500 to $24,999 | 1,424 (2.5%) | 1,805 (3.3%) |
| $25,000 to $29,999 | 3,064 (5.3%) | 3,781 (7.0%) |
| $30,000 to $34,999 | 3,124 (5.4%) | 3,551 (6.5%) |
| $35,000 to $39,999 | 2,538 (4.4%) | 3,648 (6.7%) |
| $40,000 to $44,999 | 3,191 (5.5%) | 2,869 (5.3%) |
| $45,000 to $49,999 | 3,086 (5.4%) | 3,280 (6.0%) |
| $50,000 to $54,999 | 2,793 (4.9%) | 2,050 (3.8%) |
| $55,000 to $64,999 | 5,178 (9.0%) | 4,356 (8.0%) |
| $65,000 to $74,999 | 4,037 (7.0%) | 2,480 (4.6%) |
| $75,000 to $99,999 | 7,534 (13.1%) | 4,568 (8.4%) |
| $100,000+ | 8,181 (14.2%) | 3,683 (6.8%) |
| Total | 57,605 (100.0%) | 54,278 (100.0%) |
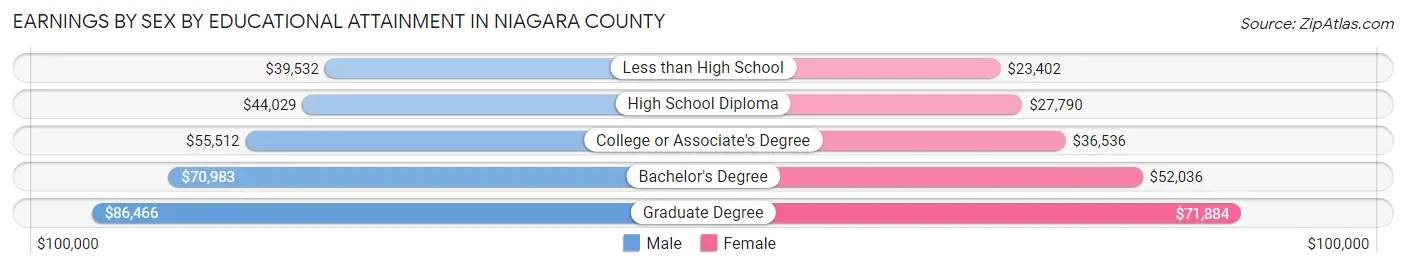
Earnings by Sex by Educational Attainment in Niagara County
Average earnings in Niagara County are $54,873 for men and $39,571 for women, a difference of 27.9%. Men with an educational attainment of graduate degree enjoy the highest average annual earnings of $86,466, while those with less than high school education earn the least with $39,532. Women with an educational attainment of graduate degree earn the most with the average annual earnings of $71,884, while those with less than high school education have the smallest earnings of $23,402.
| Educational Attainment | Male Income | Female Income |
| Less than High School | $39,532 | $23,402 |
| High School Diploma | $44,029 | $27,790 |
| College or Associate's Degree | $55,512 | $36,536 |
| Bachelor's Degree | $70,983 | $52,036 |
| Graduate Degree | $86,466 | $71,884 |
| Total | $54,873 | $39,571 |
Family Income in Niagara County
Family Income Brackets in Niagara County
According to the Niagara County family income data, there are 12,358 families falling into the $100,000 to $149,999 income range, which is the most common income bracket and makes up 22.1% of all families. Conversely, the $10,000 to $14,999 income bracket is the least frequent group with only 951 families (1.7%) belonging to this category.
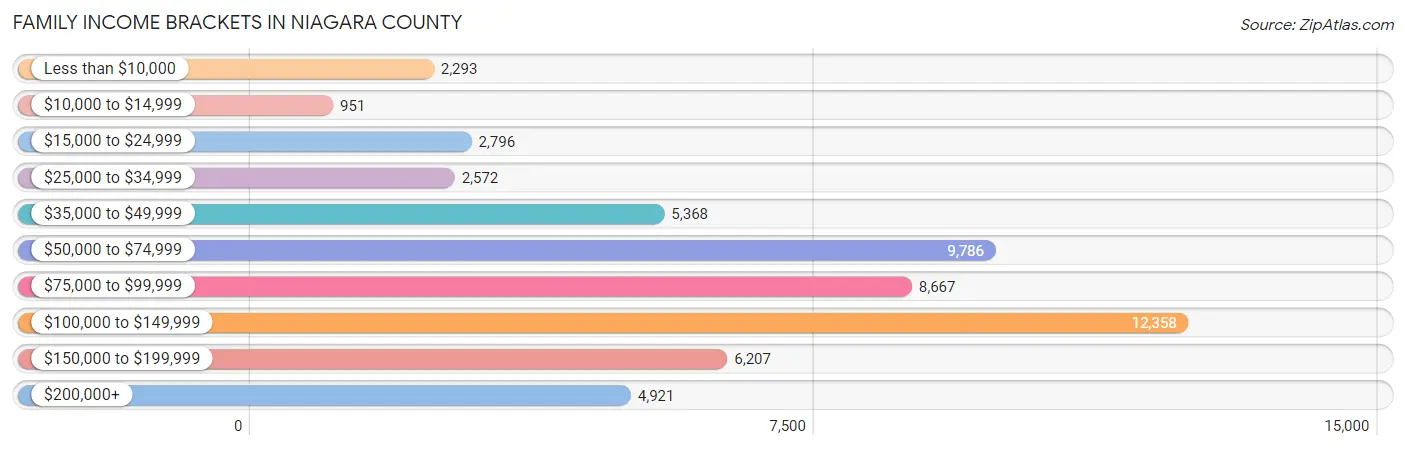
| Income Bracket | # Families | % Families |
| Less than $10,000 | 2,293 | 4.1% |
| $10,000 to $14,999 | 951 | 1.7% |
| $15,000 to $24,999 | 2,796 | 5.0% |
| $25,000 to $34,999 | 2,572 | 4.6% |
| $35,000 to $49,999 | 5,368 | 9.6% |
| $50,000 to $74,999 | 9,786 | 17.5% |
| $75,000 to $99,999 | 8,667 | 15.5% |
| $100,000 to $149,999 | 12,358 | 22.1% |
| $150,000 to $199,999 | 6,207 | 11.1% |
| $200,000+ | 4,921 | 8.8% |
Family Income by Famaliy Size in Niagara County
4-person families (9,733 | 17.4%) account for the highest median family income in Niagara County with $110,789 per family, while 2-person families (28,882 | 51.6%) have the highest median income of $37,423 per family member.
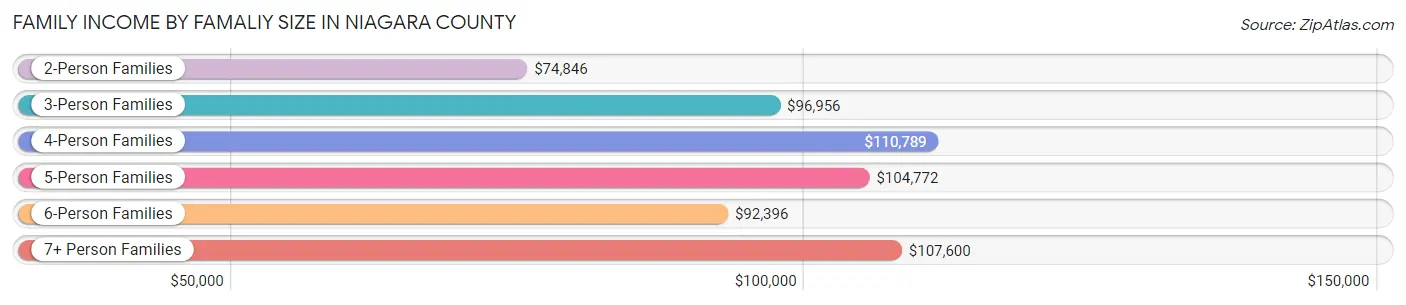
| Income Bracket | # Families | Median Income |
| 2-Person Families | 28,882 (51.6%) | $74,846 |
| 3-Person Families | 12,221 (21.8%) | $96,956 |
| 4-Person Families | 9,733 (17.4%) | $110,789 |
| 5-Person Families | 3,743 (6.7%) | $104,772 |
| 6-Person Families | 816 (1.5%) | $92,396 |
| 7+ Person Families | 524 (0.9%) | $107,600 |
| Total | 55,919 (100.0%) | $85,934 |
Family Income by Number of Earners in Niagara County
The median family income in Niagara County is $85,934, with families comprising 3+ earners (6,392) having the highest median family income of $152,523, while families with no earners (9,675) have the lowest median family income of $49,555, accounting for 11.4% and 17.3% of families, respectively.
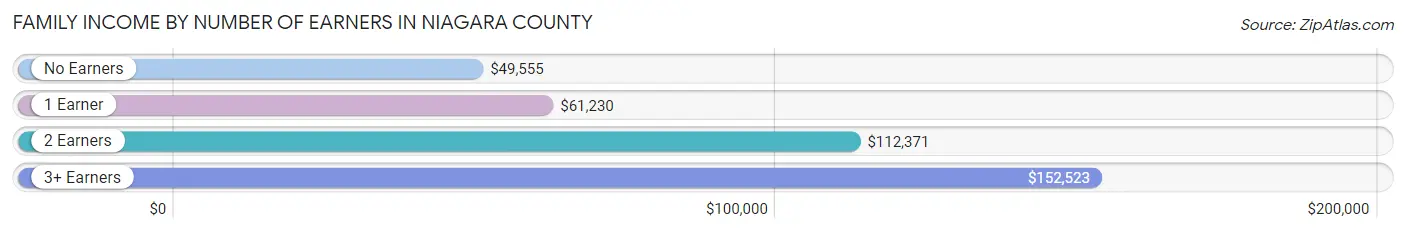
| Number of Earners | # Families | Median Income |
| No Earners | 9,675 (17.3%) | $49,555 |
| 1 Earner | 18,027 (32.2%) | $61,230 |
| 2 Earners | 21,825 (39.0%) | $112,371 |
| 3+ Earners | 6,392 (11.4%) | $152,523 |
| Total | 55,919 (100.0%) | $85,934 |
Household Income in Niagara County
Household Income Brackets in Niagara County
With 15,376 households falling in the category, the $100,000 to $149,999 income range is the most frequent in Niagara County, accounting for 16.9% of all households. In contrast, only 3,730 households (4.1%) fall into the $10,000 to $14,999 income bracket, making it the least populous group.
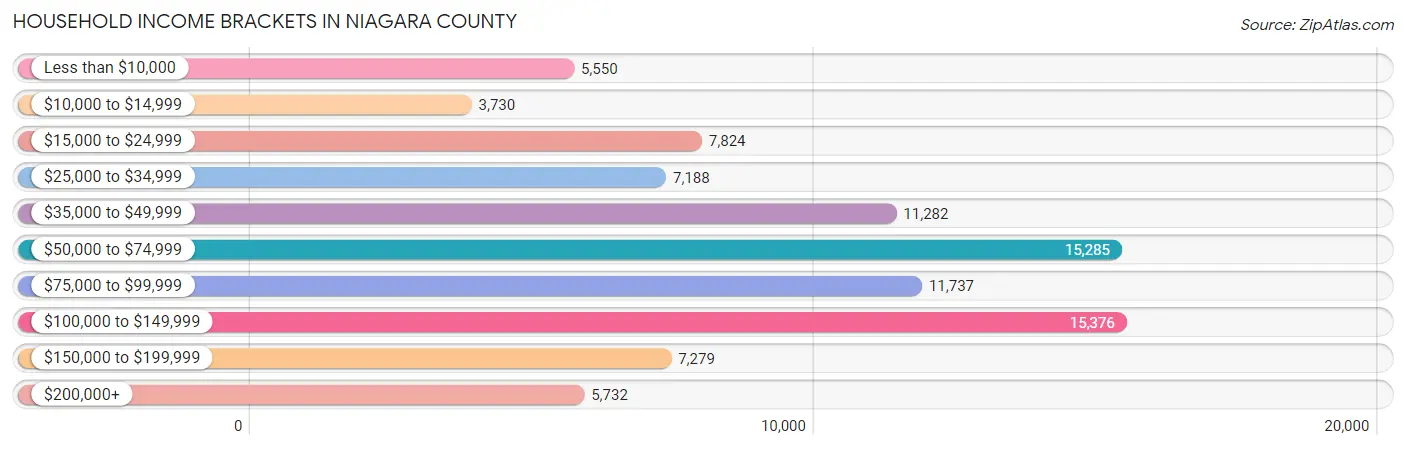
| Income Bracket | # Households | % Households |
| Less than $10,000 | 5,550 | 6.1% |
| $10,000 to $14,999 | 3,730 | 4.1% |
| $15,000 to $24,999 | 7,824 | 8.6% |
| $25,000 to $34,999 | 7,188 | 7.9% |
| $35,000 to $49,999 | 11,282 | 12.4% |
| $50,000 to $74,999 | 15,285 | 16.8% |
| $75,000 to $99,999 | 11,737 | 12.9% |
| $100,000 to $149,999 | 15,376 | 16.9% |
| $150,000 to $199,999 | 7,279 | 8.0% |
| $200,000+ | 5,732 | 6.3% |
Household Income by Householder Age in Niagara County
The median household income in Niagara County is $65,882, with the highest median household income of $81,241 found in the 45 to 64 years age bracket for the primary householder. A total of 35,862 households (39.4%) fall into this category. Meanwhile, the 15 to 24 years age bracket for the primary householder has the lowest median household income of $33,750, with 2,514 households (2.8%) in this group.
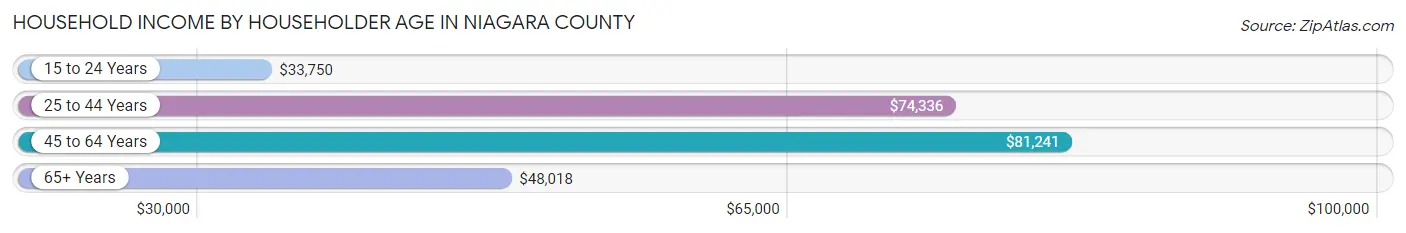
| Income Bracket | # Households | Median Income |
| 15 to 24 Years | 2,514 (2.8%) | $33,750 |
| 25 to 44 Years | 25,229 (27.7%) | $74,336 |
| 45 to 64 Years | 35,862 (39.4%) | $81,241 |
| 65+ Years | 27,377 (30.1%) | $48,018 |
| Total | 90,982 (100.0%) | $65,882 |
Poverty in Niagara County
Income Below Poverty by Sex and Age in Niagara County
With 11.4% poverty level for males and 14.5% for females among the residents of Niagara County, under 5 year old males and 5 year old females are the most vulnerable to poverty, with 1,185 males (22.3%) and 251 females (22.6%) in their respective age groups living below the poverty level.
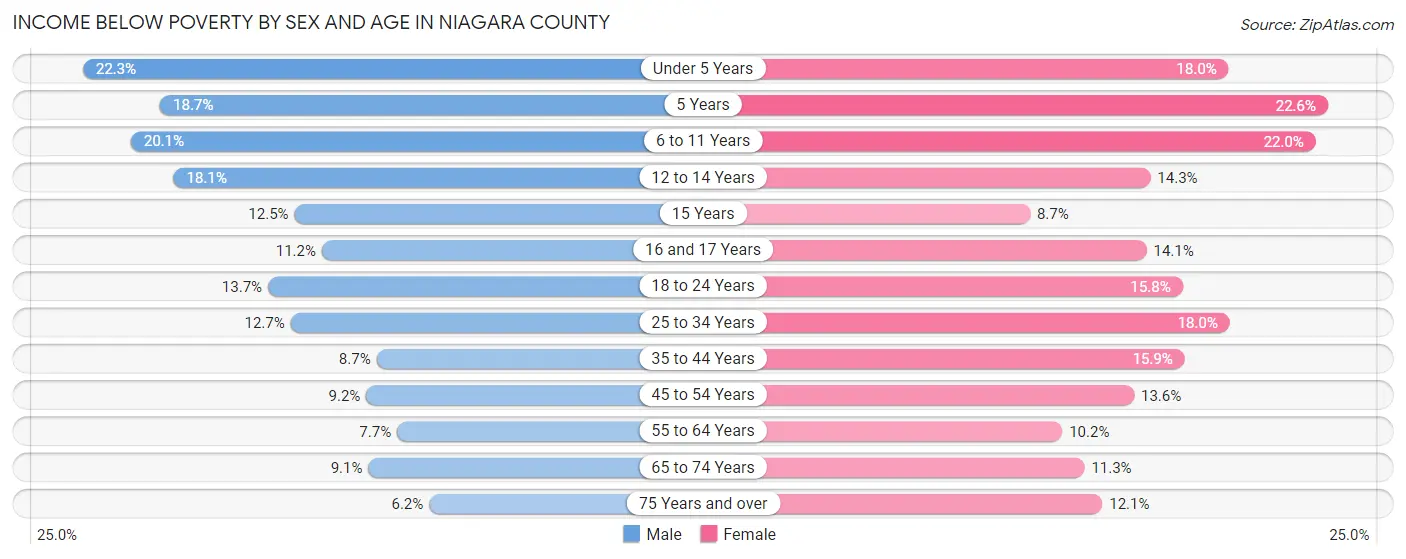
| Age Bracket | Male | Female |
| Under 5 Years | 1,185 (22.3%) | 946 (17.9%) |
| 5 Years | 208 (18.7%) | 251 (22.6%) |
| 6 to 11 Years | 1,352 (20.1%) | 1,591 (22.0%) |
| 12 to 14 Years | 705 (18.1%) | 450 (14.3%) |
| 15 Years | 130 (12.5%) | 104 (8.7%) |
| 16 and 17 Years | 314 (11.2%) | 347 (14.1%) |
| 18 to 24 Years | 1,133 (13.7%) | 1,231 (15.8%) |
| 25 to 34 Years | 1,675 (12.7%) | 2,317 (18.0%) |
| 35 to 44 Years | 1,063 (8.7%) | 1,990 (15.9%) |
| 45 to 54 Years | 1,204 (9.1%) | 1,778 (13.6%) |
| 55 to 64 Years | 1,259 (7.7%) | 1,727 (10.2%) |
| 65 to 74 Years | 1,091 (9.0%) | 1,418 (11.3%) |
| 75 Years and over | 409 (6.2%) | 1,168 (12.1%) |
| Total | 11,728 (11.4%) | 15,318 (14.5%) |
Income Above Poverty by Sex and Age in Niagara County
According to the poverty statistics in Niagara County, males aged 75 years and over and females aged 15 years are the age groups that are most secure financially, with 93.8% of males and 91.3% of females in these age groups living above the poverty line.
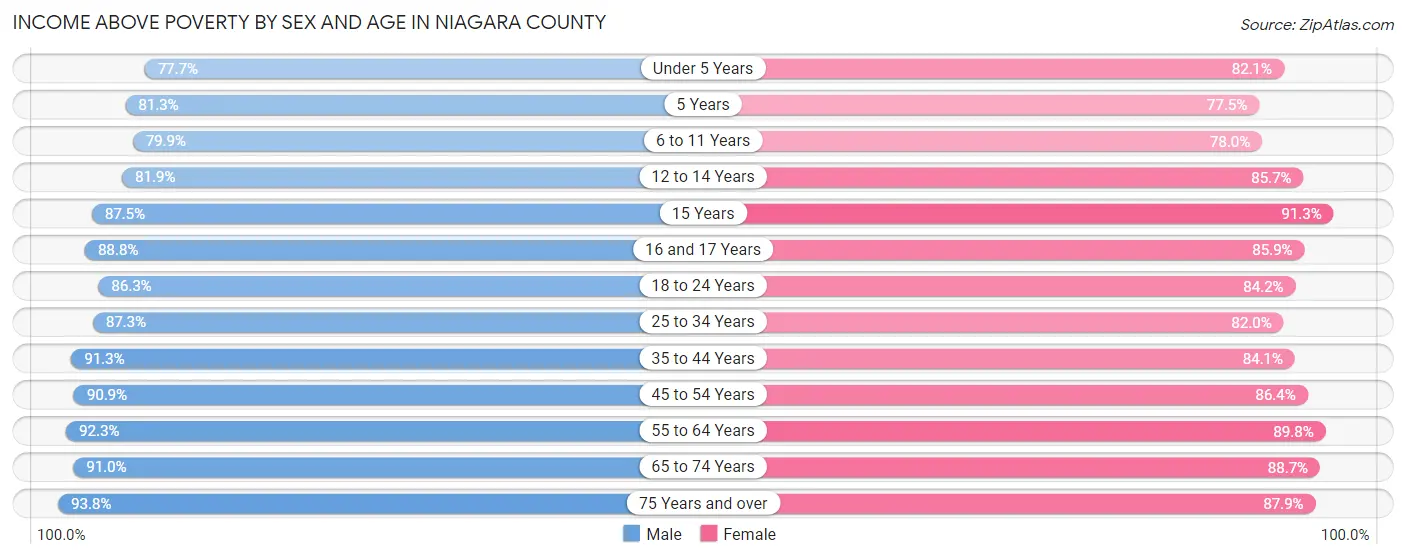
| Age Bracket | Male | Female |
| Under 5 Years | 4,128 (77.7%) | 4,325 (82.1%) |
| 5 Years | 904 (81.3%) | 862 (77.4%) |
| 6 to 11 Years | 5,386 (79.9%) | 5,643 (78.0%) |
| 12 to 14 Years | 3,193 (81.9%) | 2,693 (85.7%) |
| 15 Years | 912 (87.5%) | 1,087 (91.3%) |
| 16 and 17 Years | 2,488 (88.8%) | 2,107 (85.9%) |
| 18 to 24 Years | 7,133 (86.3%) | 6,553 (84.2%) |
| 25 to 34 Years | 11,555 (87.3%) | 10,553 (82.0%) |
| 35 to 44 Years | 11,193 (91.3%) | 10,514 (84.1%) |
| 45 to 54 Years | 11,953 (90.8%) | 11,334 (86.4%) |
| 55 to 64 Years | 15,054 (92.3%) | 15,147 (89.8%) |
| 65 to 74 Years | 10,959 (90.9%) | 11,176 (88.7%) |
| 75 Years and over | 6,154 (93.8%) | 8,493 (87.9%) |
| Total | 91,012 (88.6%) | 90,487 (85.5%) |
Income Below Poverty Among Married-Couple Families in Niagara County
The poverty statistics for married-couple families in Niagara County show that 4.3% or 1,736 of the total 40,214 families live below the poverty line. Families with 5 or more children have the highest poverty rate of 36.4%, comprising of 76 families. On the other hand, families with no children have the lowest poverty rate of 3.4%, which includes 889 families.
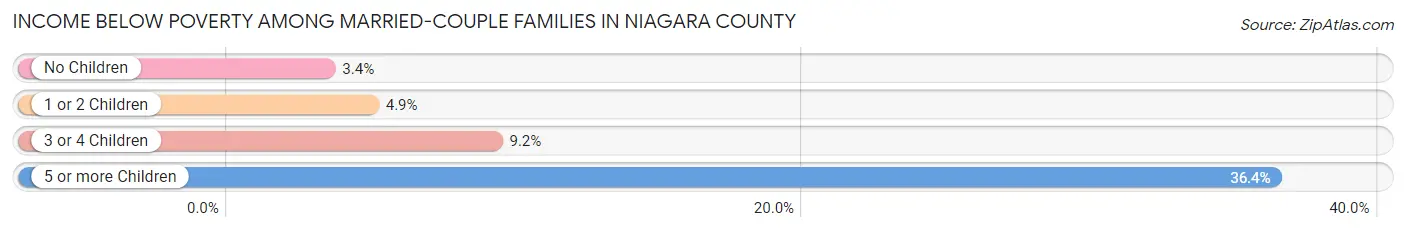
| Children | Above Poverty | Below Poverty |
| No Children | 25,339 (96.6%) | 889 (3.4%) |
| 1 or 2 Children | 10,976 (95.1%) | 565 (4.9%) |
| 3 or 4 Children | 2,030 (90.8%) | 206 (9.2%) |
| 5 or more Children | 133 (63.6%) | 76 (36.4%) |
| Total | 38,478 (95.7%) | 1,736 (4.3%) |
Income Below Poverty Among Single-Parent Households in Niagara County
According to the poverty data in Niagara County, 13.8% or 654 single-father households and 26.4% or 2,898 single-mother households are living below the poverty line. Among single-father households, those with 5 or more children have the highest poverty rate, with 33 households (100.0%) experiencing poverty. Likewise, among single-mother households, those with 3 or 4 children have the highest poverty rate, with 656 households (59.4%) falling below the poverty line.
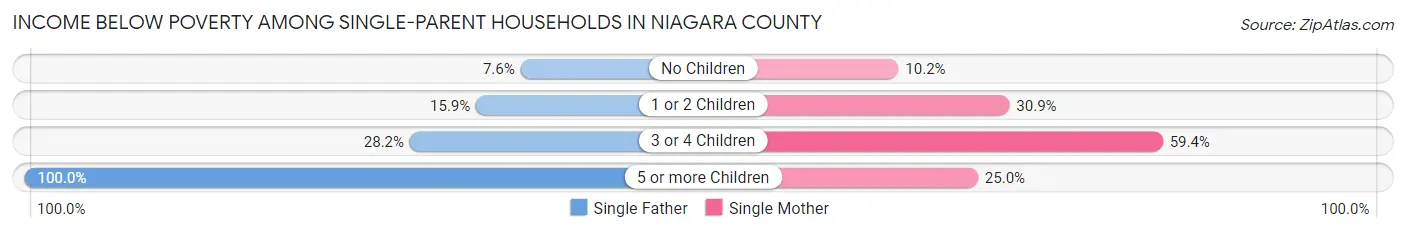
| Children | Single Father | Single Mother |
| No Children | 164 (7.6%) | 396 (10.2%) |
| 1 or 2 Children | 337 (15.9%) | 1,836 (30.9%) |
| 3 or 4 Children | 120 (28.2%) | 656 (59.4%) |
| 5 or more Children | 33 (100.0%) | 10 (25.0%) |
| Total | 654 (13.8%) | 2,898 (26.4%) |
Income Below Poverty Among Married-Couple vs Single-Parent Households in Niagara County
The poverty data for Niagara County shows that 1,736 of the married-couple family households (4.3%) and 3,552 of the single-parent households (22.6%) are living below the poverty level. Within the married-couple family households, those with 5 or more children have the highest poverty rate, with 76 households (36.4%) falling below the poverty line. Among the single-parent households, those with 5 or more children have the highest poverty rate, with 43 household (58.9%) living below poverty.
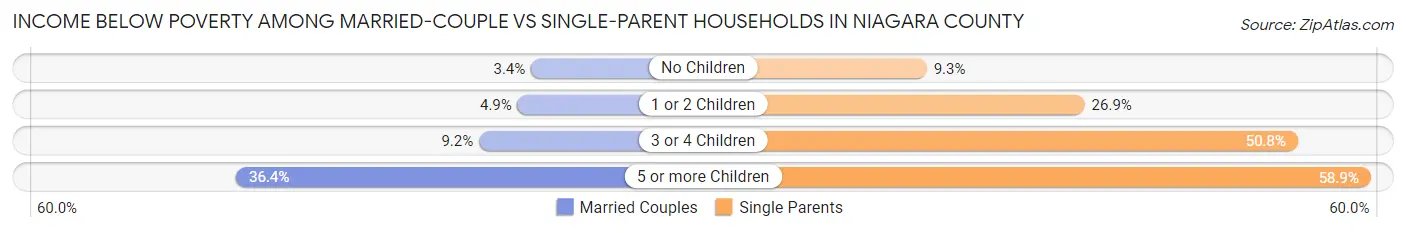
| Children | Married-Couple Families | Single-Parent Households |
| No Children | 889 (3.4%) | 560 (9.3%) |
| 1 or 2 Children | 565 (4.9%) | 2,173 (26.9%) |
| 3 or 4 Children | 206 (9.2%) | 776 (50.7%) |
| 5 or more Children | 76 (36.4%) | 43 (58.9%) |
| Total | 1,736 (4.3%) | 3,552 (22.6%) |
Race in Niagara County
The most populous races in Niagara County are White / Caucasian (180,212 | 84.9%), Black / African American (14,059 | 6.6%), and Two or more Races (11,891 | 5.6%).
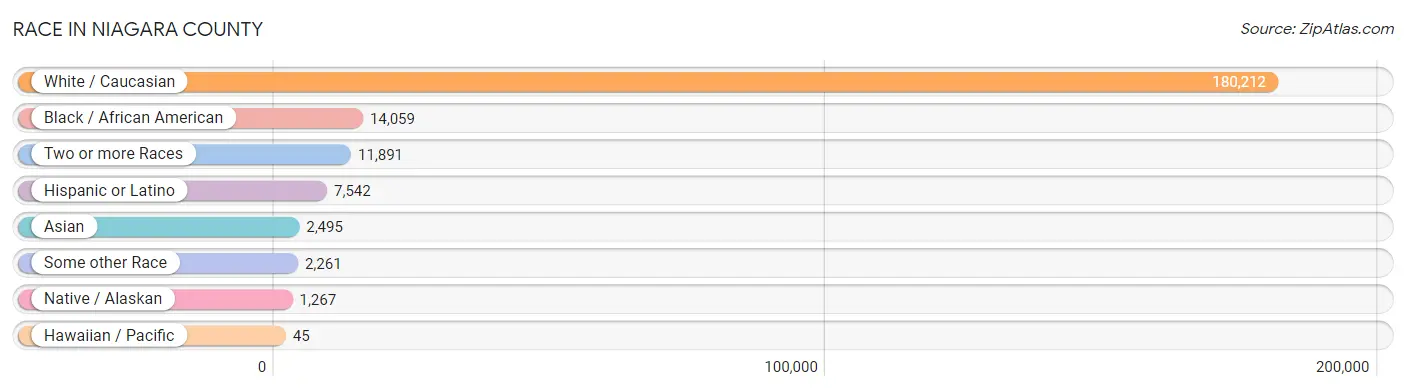
| Race | # Population | % Population |
| Asian | 2,495 | 1.2% |
| Black / African American | 14,059 | 6.6% |
| Hawaiian / Pacific | 45 | 0.0% |
| Hispanic or Latino | 7,542 | 3.5% |
| Native / Alaskan | 1,267 | 0.6% |
| White / Caucasian | 180,212 | 84.9% |
| Two or more Races | 11,891 | 5.6% |
| Some other Race | 2,261 | 1.1% |
| Total | 212,230 | 100.0% |
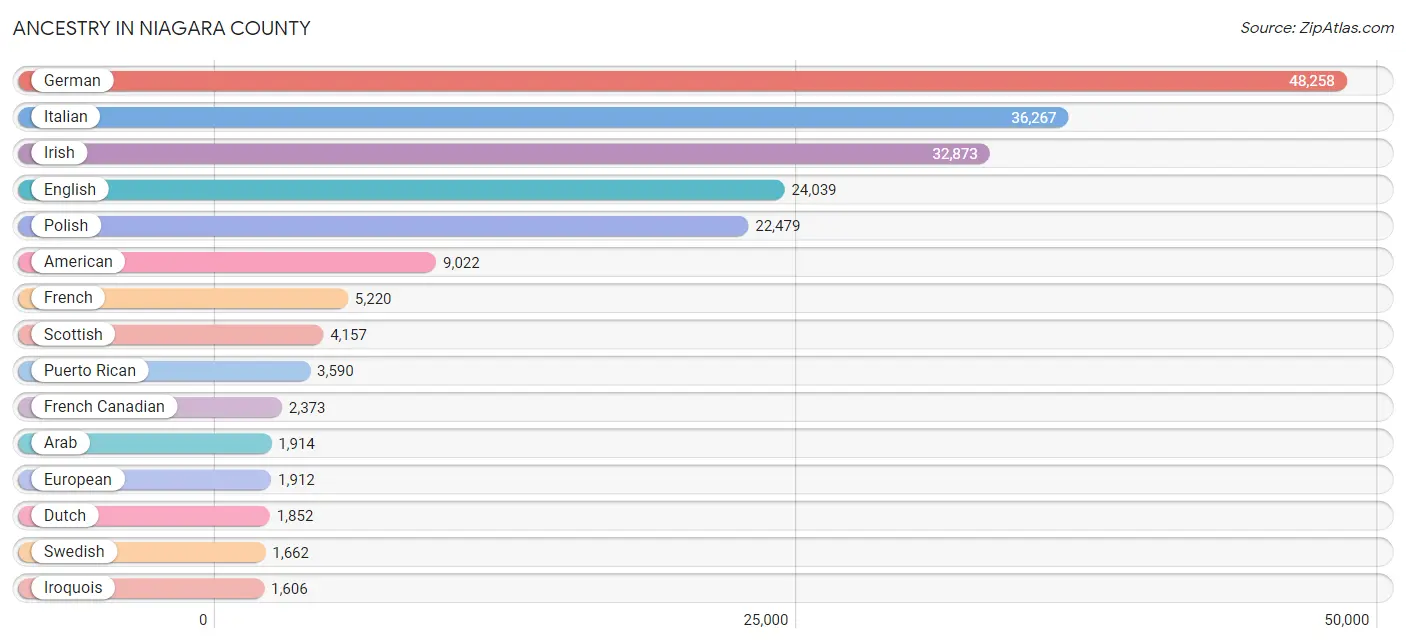
Ancestry in Niagara County
The most populous ancestries reported in Niagara County are German (48,258 | 22.7%), Italian (36,267 | 17.1%), Irish (32,873 | 15.5%), English (24,039 | 11.3%), and Polish (22,479 | 10.6%), together accounting for 77.2% of all Niagara County residents.
| Ancestry | # Population | % Population |
| African | 522 | 0.3% |
| Alaska Native | 62 | 0.0% |
| Albanian | 21 | 0.0% |
| Alsatian | 82 | 0.0% |
| American | 9,022 | 4.3% |
| Arab | 1,914 | 0.9% |
| Arapaho | 19 | 0.0% |
| Armenian | 137 | 0.1% |
| Austrian | 407 | 0.2% |
| Bahamian | 37 | 0.0% |
| Belgian | 118 | 0.1% |
| Bhutanese | 140 | 0.1% |
| Blackfeet | 84 | 0.0% |
| Brazilian | 65 | 0.0% |
| British | 914 | 0.4% |
| Bulgarian | 29 | 0.0% |
| Burmese | 494 | 0.2% |
| Canadian | 1,063 | 0.5% |
| Celtic | 58 | 0.0% |
| Central American | 292 | 0.1% |
| Central American Indian | 34 | 0.0% |
| Cherokee | 204 | 0.1% |
| Chilean | 33 | 0.0% |
| Chippewa | 211 | 0.1% |
| Colombian | 130 | 0.1% |
| Comanche | 9 | 0.0% |
| Creek | 238 | 0.1% |
| Croatian | 180 | 0.1% |
| Cuban | 298 | 0.1% |
| Czech | 294 | 0.1% |
| Czechoslovakian | 134 | 0.1% |
| Danish | 421 | 0.2% |
| Dominican | 348 | 0.2% |
| Dutch | 1,852 | 0.9% |
| Eastern European | 408 | 0.2% |
| Ecuadorian | 123 | 0.1% |
| Egyptian | 112 | 0.1% |
| English | 24,039 | 11.3% |
| Estonian | 26 | 0.0% |
| Ethiopian | 7 | 0.0% |
| European | 1,912 | 0.9% |
| Filipino | 48 | 0.0% |
| Finnish | 115 | 0.1% |
| French | 5,220 | 2.5% |
| French American Indian | 239 | 0.1% |
| French Canadian | 2,373 | 1.1% |
| German | 48,258 | 22.7% |
| Ghanaian | 42 | 0.0% |
| Greek | 665 | 0.3% |
| Guamanian / Chamorro | 13 | 0.0% |
| Guatemalan | 81 | 0.0% |
| Guyanese | 59 | 0.0% |
| Haitian | 39 | 0.0% |
| Honduran | 24 | 0.0% |
| Hungarian | 1,344 | 0.6% |
| Icelander | 95 | 0.0% |
| Indian (Asian) | 700 | 0.3% |
| Indonesian | 14 | 0.0% |
| Iranian | 124 | 0.1% |
| Iraqi | 48 | 0.0% |
| Irish | 32,873 | 15.5% |
| Iroquois | 1,606 | 0.8% |
| Israeli | 54 | 0.0% |
| Italian | 36,267 | 17.1% |
| Jamaican | 1,097 | 0.5% |
| Japanese | 20 | 0.0% |
| Jordanian | 29 | 0.0% |
| Korean | 421 | 0.2% |
| Latvian | 36 | 0.0% |
| Lebanese | 1,038 | 0.5% |
| Lithuanian | 624 | 0.3% |
| Lumbee | 11 | 0.0% |
| Malaysian | 17 | 0.0% |
| Maltese | 7 | 0.0% |
| Mexican | 1,277 | 0.6% |
| Moroccan | 20 | 0.0% |
| Native Hawaiian | 142 | 0.1% |
| Navajo | 46 | 0.0% |
| New Zealander | 6 | 0.0% |
| Nigerian | 22 | 0.0% |
| Northern European | 139 | 0.1% |
| Norwegian | 563 | 0.3% |
| Paiute | 13 | 0.0% |
| Pakistani | 83 | 0.0% |
| Palestinian | 383 | 0.2% |
| Panamanian | 162 | 0.1% |
| Pennsylvania German | 271 | 0.1% |
| Peruvian | 17 | 0.0% |
| Polish | 22,479 | 10.6% |
| Portuguese | 143 | 0.1% |
| Puerto Rican | 3,590 | 1.7% |
| Romanian | 173 | 0.1% |
| Russian | 1,346 | 0.6% |
| Salvadoran | 25 | 0.0% |
| Samoan | 96 | 0.1% |
| Scandinavian | 357 | 0.2% |
| Scotch-Irish | 1,176 | 0.5% |
| Scottish | 4,157 | 2.0% |
| Serbian | 14 | 0.0% |
| Slavic | 65 | 0.0% |
| Slovak | 678 | 0.3% |
| Slovene | 25 | 0.0% |
| Somali | 97 | 0.1% |
| South African | 17 | 0.0% |
| South American | 385 | 0.2% |
| South American Indian | 13 | 0.0% |
| Spaniard | 519 | 0.2% |
| Spanish | 394 | 0.2% |
| Sri Lankan | 173 | 0.1% |
| Subsaharan African | 965 | 0.4% |
| Swedish | 1,662 | 0.8% |
| Swiss | 237 | 0.1% |
| Syrian | 202 | 0.1% |
| Thai | 795 | 0.4% |
| Trinidadian and Tobagonian | 24 | 0.0% |
| Turkish | 54 | 0.0% |
| Ukrainian | 1,317 | 0.6% |
| Venezuelan | 36 | 0.0% |
| Vietnamese | 102 | 0.1% |
| Welsh | 1,407 | 0.7% |
| West Indian | 81 | 0.0% |
| Yugoslavian | 45 | 0.0% | View All 122 Rows |
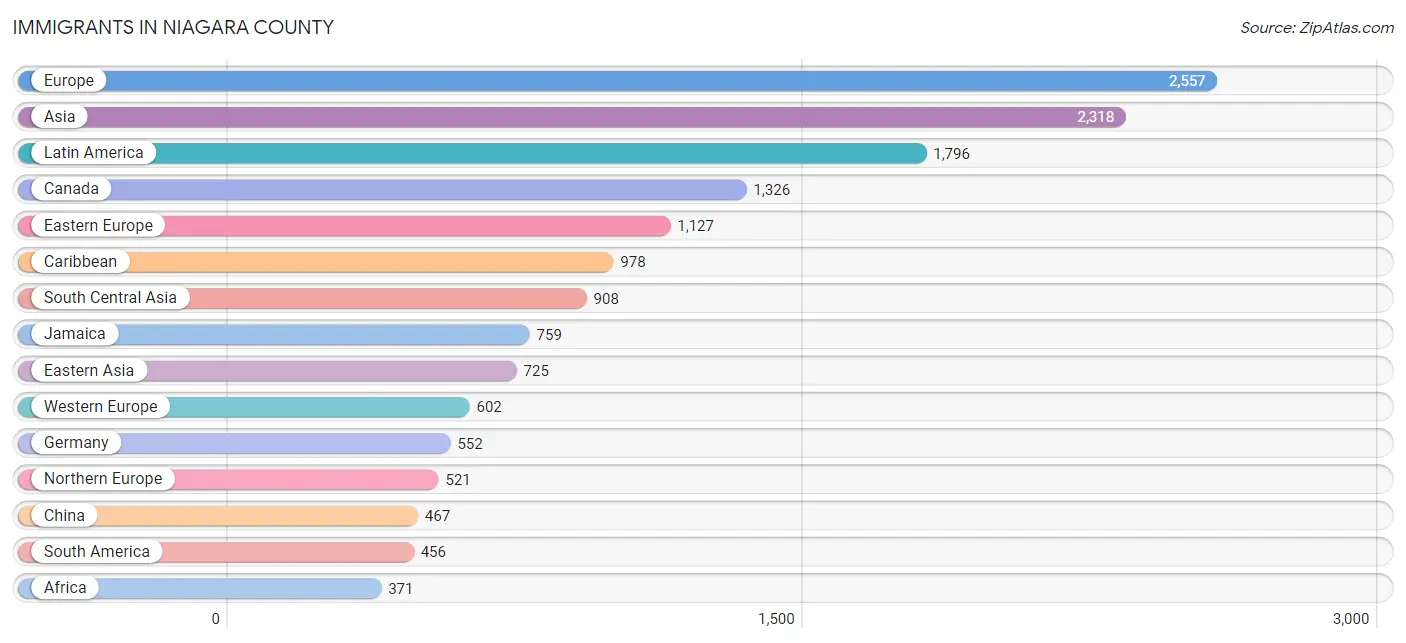
Immigrants in Niagara County
The most numerous immigrant groups reported in Niagara County came from Europe (2,557 | 1.2%), Asia (2,318 | 1.1%), Latin America (1,796 | 0.9%), Canada (1,326 | 0.6%), and Eastern Europe (1,127 | 0.5%), together accounting for 4.3% of all Niagara County residents.
| Immigration Origin | # Population | % Population |
| Afghanistan | 17 | 0.0% |
| Africa | 371 | 0.2% |
| Albania | 21 | 0.0% |
| Asia | 2,318 | 1.1% |
| Bangladesh | 93 | 0.0% |
| Barbados | 39 | 0.0% |
| Belarus | 201 | 0.1% |
| Belgium | 11 | 0.0% |
| Brazil | 79 | 0.0% |
| Bulgaria | 6 | 0.0% |
| Canada | 1,326 | 0.6% |
| Caribbean | 978 | 0.5% |
| Central America | 362 | 0.2% |
| Chile | 33 | 0.0% |
| China | 467 | 0.2% |
| Colombia | 46 | 0.0% |
| Costa Rica | 13 | 0.0% |
| Cuba | 15 | 0.0% |
| Czechoslovakia | 22 | 0.0% |
| Denmark | 20 | 0.0% |
| Dominican Republic | 127 | 0.1% |
| Eastern Africa | 83 | 0.0% |
| Eastern Asia | 725 | 0.3% |
| Eastern Europe | 1,127 | 0.5% |
| Ecuador | 56 | 0.0% |
| Egypt | 61 | 0.0% |
| El Salvador | 78 | 0.0% |
| England | 222 | 0.1% |
| Ethiopia | 7 | 0.0% |
| Europe | 2,557 | 1.2% |
| France | 17 | 0.0% |
| Germany | 552 | 0.3% |
| Guatemala | 97 | 0.1% |
| Guyana | 173 | 0.1% |
| Haiti | 21 | 0.0% |
| Honduras | 24 | 0.0% |
| Hong Kong | 10 | 0.0% |
| Hungary | 31 | 0.0% |
| India | 270 | 0.1% |
| Iran | 164 | 0.1% |
| Iraq | 35 | 0.0% |
| Ireland | 16 | 0.0% |
| Israel | 12 | 0.0% |
| Italy | 297 | 0.1% |
| Jamaica | 759 | 0.4% |
| Japan | 66 | 0.0% |
| Jordan | 20 | 0.0% |
| Kazakhstan | 63 | 0.0% |
| Kenya | 39 | 0.0% |
| Korea | 192 | 0.1% |
| Kuwait | 2 | 0.0% |
| Laos | 17 | 0.0% |
| Latin America | 1,796 | 0.9% |
| Latvia | 55 | 0.0% |
| Lebanon | 59 | 0.0% |
| Lithuania | 7 | 0.0% |
| Mexico | 105 | 0.1% |
| Moldova | 39 | 0.0% |
| Morocco | 20 | 0.0% |
| Netherlands | 22 | 0.0% |
| Nigeria | 2 | 0.0% |
| Northern Africa | 100 | 0.1% |
| Northern Europe | 521 | 0.3% |
| Oceania | 6 | 0.0% |
| Pakistan | 215 | 0.1% |
| Panama | 45 | 0.0% |
| Peru | 17 | 0.0% |
| Philippines | 112 | 0.1% |
| Poland | 140 | 0.1% |
| Romania | 11 | 0.0% |
| Russia | 211 | 0.1% |
| Saudi Arabia | 83 | 0.0% |
| Scotland | 45 | 0.0% |
| Serbia | 18 | 0.0% |
| Somalia | 37 | 0.0% |
| South Africa | 24 | 0.0% |
| South America | 456 | 0.2% |
| South Central Asia | 908 | 0.4% |
| South Eastern Asia | 244 | 0.1% |
| Southern Europe | 307 | 0.1% |
| Sri Lanka | 38 | 0.0% |
| St. Vincent and the Grenadines | 4 | 0.0% |
| Sweden | 29 | 0.0% |
| Taiwan | 54 | 0.0% |
| Thailand | 18 | 0.0% |
| Trinidad and Tobago | 13 | 0.0% |
| Turkey | 1 | 0.0% |
| Ukraine | 349 | 0.2% |
| Uzbekistan | 9 | 0.0% |
| Venezuela | 52 | 0.0% |
| Vietnam | 83 | 0.0% |
| Western Africa | 164 | 0.1% |
| Western Asia | 277 | 0.1% |
| Western Europe | 602 | 0.3% |
| Yemen | 10 | 0.0% | View All 95 Rows |
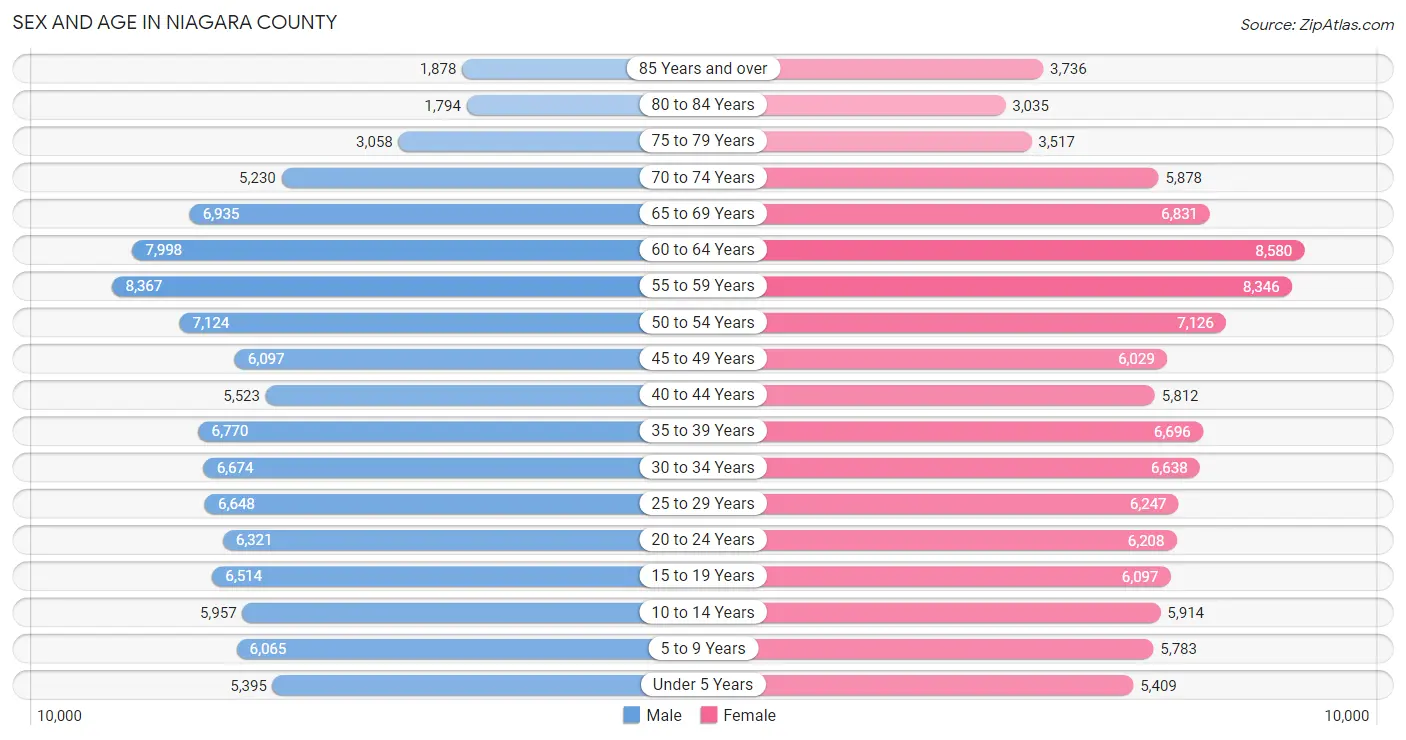
Sex and Age in Niagara County
Sex and Age in Niagara County
The most populous age groups in Niagara County are 55 to 59 Years (8,367 | 8.0%) for men and 60 to 64 Years (8,580 | 8.0%) for women.
| Age Bracket | Male | Female |
| Under 5 Years | 5,395 (5.2%) | 5,409 (5.0%) |
| 5 to 9 Years | 6,065 (5.8%) | 5,783 (5.4%) |
| 10 to 14 Years | 5,957 (5.7%) | 5,914 (5.5%) |
| 15 to 19 Years | 6,514 (6.2%) | 6,097 (5.7%) |
| 20 to 24 Years | 6,321 (6.1%) | 6,208 (5.8%) |
| 25 to 29 Years | 6,648 (6.4%) | 6,247 (5.8%) |
| 30 to 34 Years | 6,674 (6.4%) | 6,638 (6.1%) |
| 35 to 39 Years | 6,770 (6.5%) | 6,696 (6.2%) |
| 40 to 44 Years | 5,523 (5.3%) | 5,812 (5.4%) |
| 45 to 49 Years | 6,097 (5.8%) | 6,029 (5.6%) |
| 50 to 54 Years | 7,124 (6.8%) | 7,126 (6.6%) |
| 55 to 59 Years | 8,367 (8.0%) | 8,346 (7.7%) |
| 60 to 64 Years | 7,998 (7.7%) | 8,580 (8.0%) |
| 65 to 69 Years | 6,935 (6.7%) | 6,831 (6.3%) |
| 70 to 74 Years | 5,230 (5.0%) | 5,878 (5.4%) |
| 75 to 79 Years | 3,058 (2.9%) | 3,517 (3.3%) |
| 80 to 84 Years | 1,794 (1.7%) | 3,035 (2.8%) |
| 85 Years and over | 1,878 (1.8%) | 3,736 (3.5%) |
| Total | 104,348 (100.0%) | 107,882 (100.0%) |
Families and Households in Niagara County
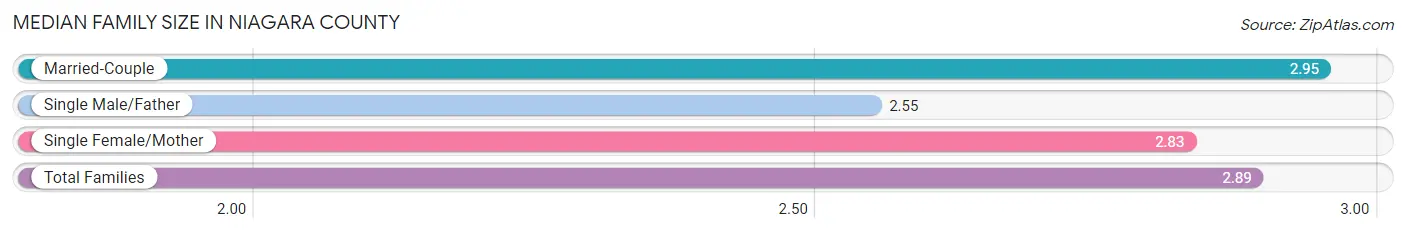
Median Family Size in Niagara County
The median family size in Niagara County is 2.89 persons per family, with married-couple families (40,214 | 71.9%) accounting for the largest median family size of 2.95 persons per family. On the other hand, single male/father families (4,729 | 8.5%) represent the smallest median family size with 2.55 persons per family.
| Family Type | # Families | Family Size |
| Married-Couple | 40,214 (71.9%) | 2.95 |
| Single Male/Father | 4,729 (8.5%) | 2.55 |
| Single Female/Mother | 10,976 (19.6%) | 2.83 |
| Total Families | 55,919 (100.0%) | 2.89 |
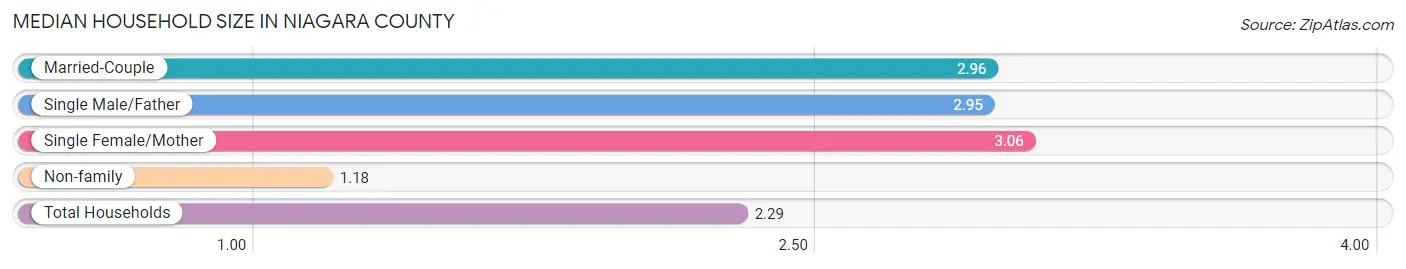
Median Household Size in Niagara County
The median household size in Niagara County is 2.29 persons per household, with single female/mother households (10,976 | 12.1%) accounting for the largest median household size of 3.06 persons per household. non-family households (35,063 | 38.5%) represent the smallest median household size with 1.18 persons per household.
| Household Type | # Households | Household Size |
| Married-Couple | 40,214 (44.2%) | 2.96 |
| Single Male/Father | 4,729 (5.2%) | 2.95 |
| Single Female/Mother | 10,976 (12.1%) | 3.06 |
| Non-family | 35,063 (38.5%) | 1.18 |
| Total Households | 90,982 (100.0%) | 2.29 |
Household Size by Marriage Status in Niagara County
Out of a total of 90,982 households in Niagara County, 55,919 (61.5%) are family households, while 35,063 (38.5%) are nonfamily households. The most numerous type of family households are 2-person households, comprising 27,092, and the most common type of nonfamily households are 1-person households, comprising 29,410.
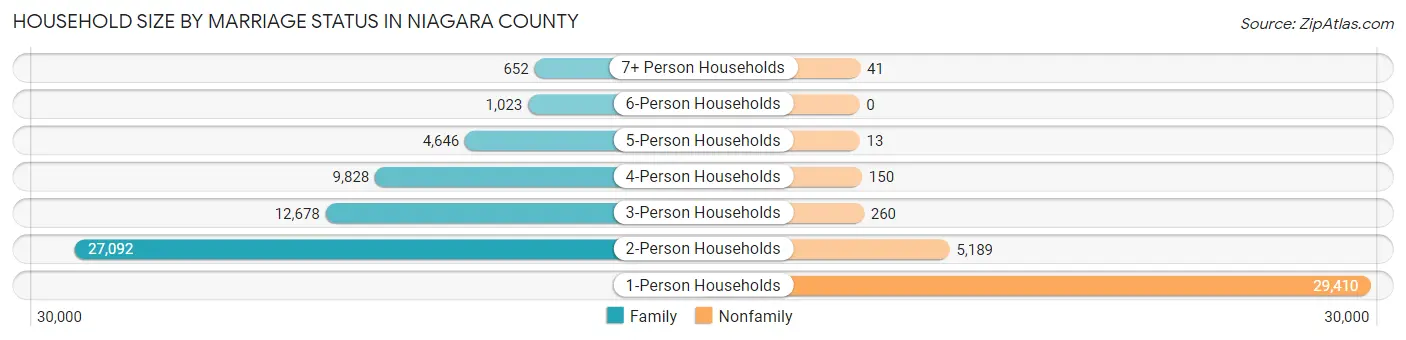
| Household Size | Family Households | Nonfamily Households |
| 1-Person Households | - | 29,410 (32.3%) |
| 2-Person Households | 27,092 (29.8%) | 5,189 (5.7%) |
| 3-Person Households | 12,678 (13.9%) | 260 (0.3%) |
| 4-Person Households | 9,828 (10.8%) | 150 (0.2%) |
| 5-Person Households | 4,646 (5.1%) | 13 (0.0%) |
| 6-Person Households | 1,023 (1.1%) | 0 (0.0%) |
| 7+ Person Households | 652 (0.7%) | 41 (0.1%) |
| Total | 55,919 (61.5%) | 35,063 (38.5%) |
Female Fertility in Niagara County
Fertility by Age in Niagara County
Average fertility rate in Niagara County is 49.0 births per 1,000 women. Women in the age bracket of 20 to 34 years have the highest fertility rate with 86.0 births per 1,000 women. Women in the age bracket of 20 to 34 years acount for 73.4% of all women with births.
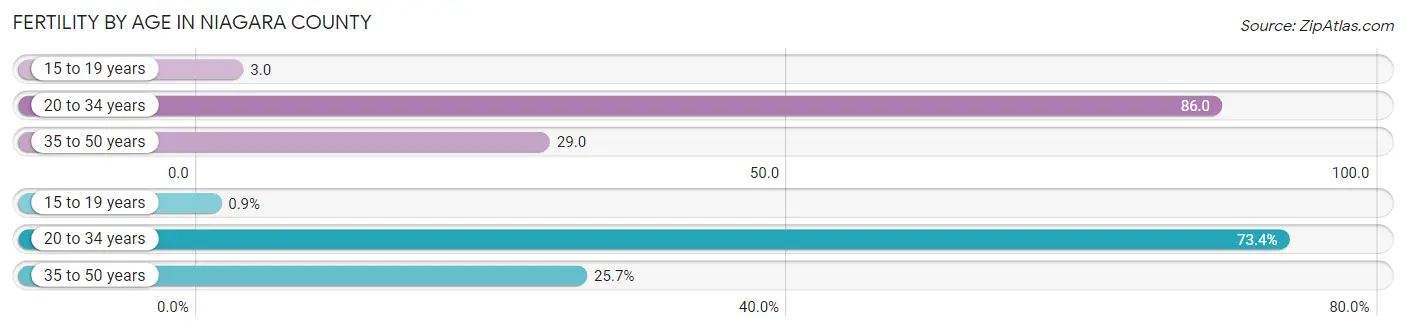
| Age Bracket | Women with Births | Births / 1,000 Women |
| 15 to 19 years | 20 (0.9%) | 3.0 |
| 20 to 34 years | 1,634 (73.4%) | 86.0 |
| 35 to 50 years | 573 (25.7%) | 29.0 |
| Total | 2,227 (100.0%) | 49.0 |
Fertility by Age by Marriage Status in Niagara County
58.8% of women with births (2,227) in Niagara County are married. The highest percentage of unmarried women with births falls into 15 to 19 years age bracket with 100.0% of them unmarried at the time of birth, while the lowest percentage of unmarried women with births belong to 35 to 50 years age bracket with 33.9% of them unmarried.
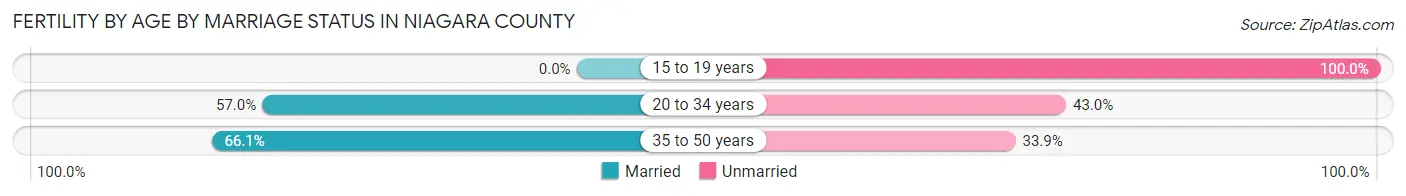
| Age Bracket | Married | Unmarried |
| 15 to 19 years | 0 (0.0%) | 20 (100.0%) |
| 20 to 34 years | 931 (57.0%) | 703 (43.0%) |
| 35 to 50 years | 379 (66.1%) | 194 (33.9%) |
| Total | 1,309 (58.8%) | 918 (41.2%) |
Fertility by Education in Niagara County
Average fertility rate in Niagara County is 49.0 births per 1,000 women. Women with the education attainment of college or associate's degree have the highest fertility rate of 64.0 births per 1,000 women, while women with the education attainment of less than high school have the lowest fertility at 27.0 births per 1,000 women. Women with the education attainment of college or associate's degree represent 45.7% of all women with births.
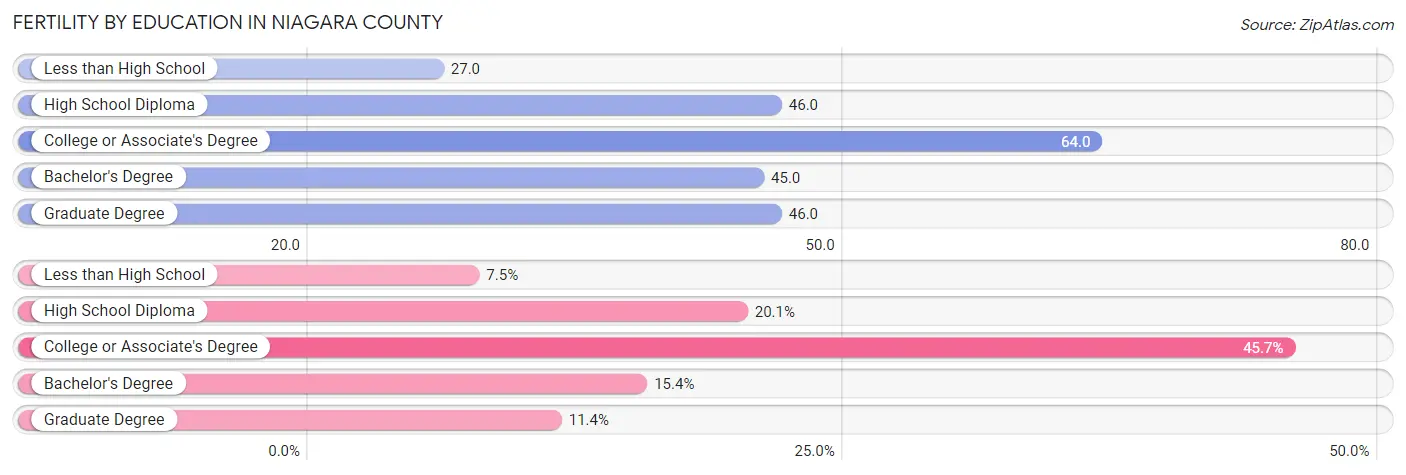
| Educational Attainment | Women with Births | Births / 1,000 Women |
| Less than High School | 167 (7.5%) | 27.0 |
| High School Diploma | 447 (20.1%) | 46.0 |
| College or Associate's Degree | 1,018 (45.7%) | 64.0 |
| Bachelor's Degree | 342 (15.4%) | 45.0 |
| Graduate Degree | 253 (11.4%) | 46.0 |
| Total | 2,227 (100.0%) | 49.0 |
Fertility by Education by Marriage Status in Niagara County
41.2% of women with births in Niagara County are unmarried. Women with the educational attainment of graduate degree are most likely to be married with 95.3% of them married at childbirth, while women with the educational attainment of high school diploma are least likely to be married with 92.2% of them unmarried at childbirth.
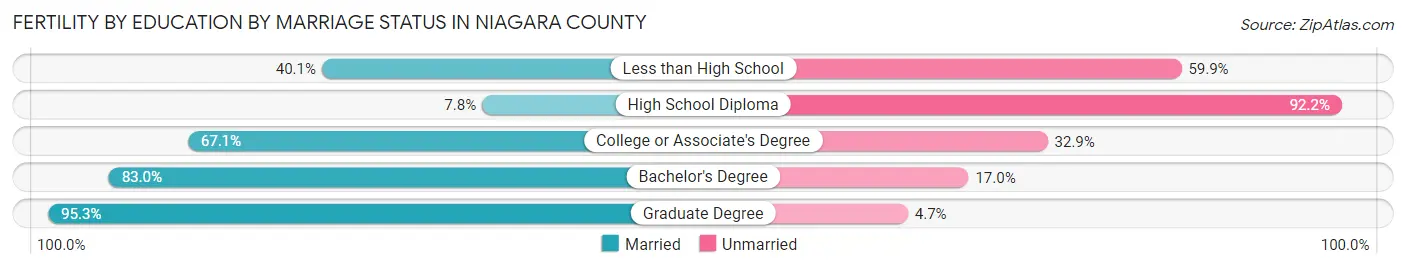
| Educational Attainment | Married | Unmarried |
| Less than High School | 67 (40.1%) | 100 (59.9%) |
| High School Diploma | 35 (7.8%) | 412 (92.2%) |
| College or Associate's Degree | 683 (67.1%) | 335 (32.9%) |
| Bachelor's Degree | 284 (83.0%) | 58 (17.0%) |
| Graduate Degree | 241 (95.3%) | 12 (4.7%) |
| Total | 1,309 (58.8%) | 918 (41.2%) |
Employment Characteristics in Niagara County
Employment by Class of Employer in Niagara County
Among the 98,566 employed individuals in Niagara County, private company employees (66,143 | 67.1%), not-for-profit organizations (9,654 | 9.8%), and local government employees (9,257 | 9.4%) make up the most common classes of employment.
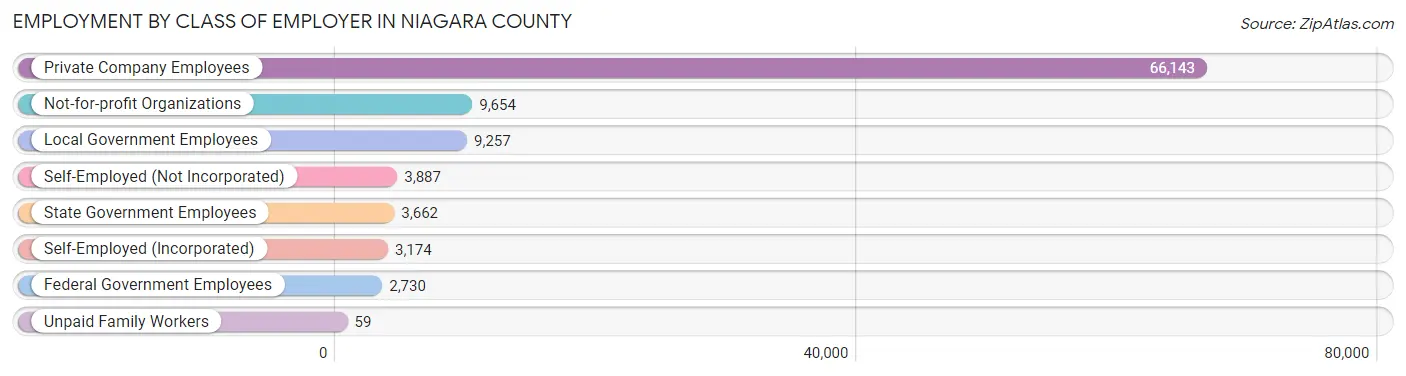
| Employer Class | # Employees | % Employees |
| Private Company Employees | 66,143 | 67.1% |
| Self-Employed (Incorporated) | 3,174 | 3.2% |
| Self-Employed (Not Incorporated) | 3,887 | 3.9% |
| Not-for-profit Organizations | 9,654 | 9.8% |
| Local Government Employees | 9,257 | 9.4% |
| State Government Employees | 3,662 | 3.7% |
| Federal Government Employees | 2,730 | 2.8% |
| Unpaid Family Workers | 59 | 0.1% |
| Total | 98,566 | 100.0% |
Employment Status by Age in Niagara County
According to the labor force statistics for Niagara County, out of the total population over 16 years of age (175,473), 60.9% or 106,863 individuals are in the labor force, with 5.8% or 6,198 of them unemployed. The age group with the highest labor force participation rate is 25 to 29 years, with 84.4% or 10,883 individuals in the labor force. Within the labor force, the 16 to 19 years age range has the highest percentage of unemployed individuals, with 16.7% or 802 of them being unemployed.
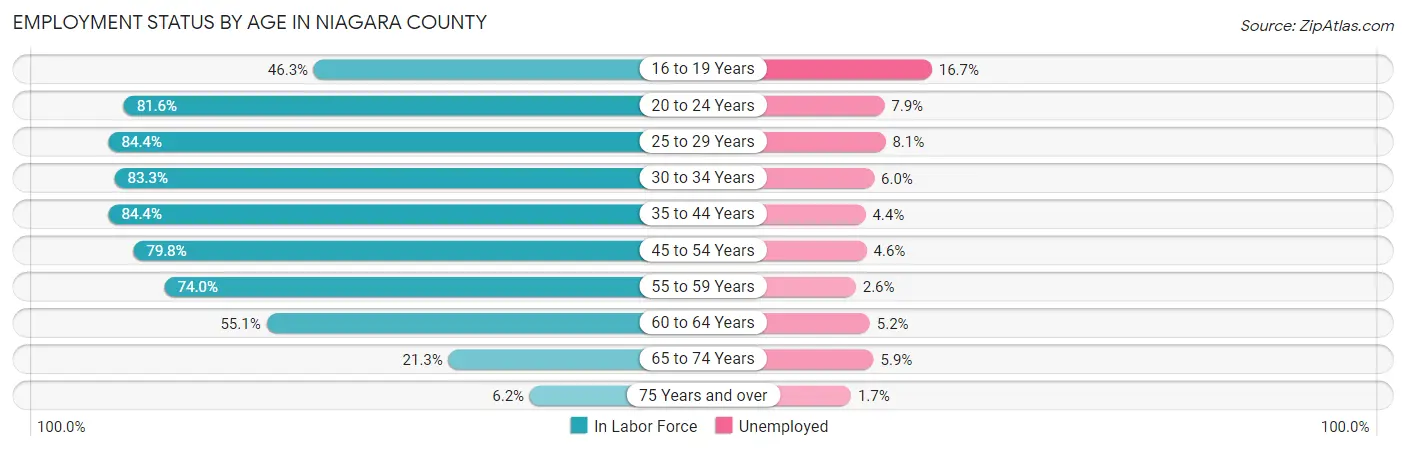
| Age Bracket | In Labor Force | Unemployed |
| 16 to 19 Years | 4,805 (46.3%) | 802 (16.7%) |
| 20 to 24 Years | 10,224 (81.6%) | 808 (7.9%) |
| 25 to 29 Years | 10,883 (84.4%) | 882 (8.1%) |
| 30 to 34 Years | 11,089 (83.3%) | 665 (6.0%) |
| 35 to 44 Years | 20,932 (84.4%) | 921 (4.4%) |
| 45 to 54 Years | 21,048 (79.8%) | 968 (4.6%) |
| 55 to 59 Years | 12,368 (74.0%) | 322 (2.6%) |
| 60 to 64 Years | 9,134 (55.1%) | 475 (5.2%) |
| 65 to 74 Years | 5,298 (21.3%) | 313 (5.9%) |
| 75 Years and over | 1,055 (6.2%) | 18 (1.7%) |
| Total | 106,863 (60.9%) | 6,198 (5.8%) |
Employment Status by Educational Attainment in Niagara County
According to labor force statistics for Niagara County, 77.2% of individuals (85,441) out of the total population between 25 and 64 years of age (110,675) are in the labor force, with 4.9% or 4,187 of them being unemployed. The group with the highest labor force participation rate are those with the educational attainment of bachelor's degree or higher, with 87.4% or 27,988 individuals in the labor force. Within the labor force, individuals with less than high school education have the highest percentage of unemployment, with 11.2% or 567 of them being unemployed.
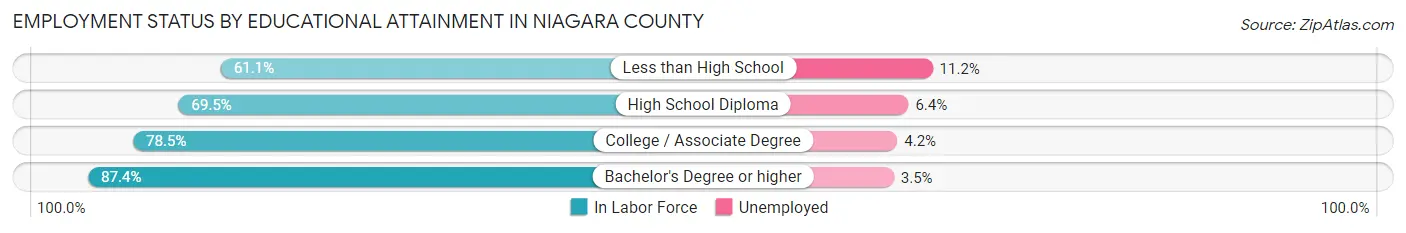
| Educational Attainment | In Labor Force | Unemployed |
| Less than High School | 5,065 (61.1%) | 928 (11.2%) |
| High School Diploma | 22,108 (69.5%) | 2,036 (6.4%) |
| College / Associate Degree | 30,264 (78.5%) | 1,619 (4.2%) |
| Bachelor's Degree or higher | 27,988 (87.4%) | 1,121 (3.5%) |
| Total | 85,441 (77.2%) | 5,423 (4.9%) |
Employment Occupations by Sex in Niagara County
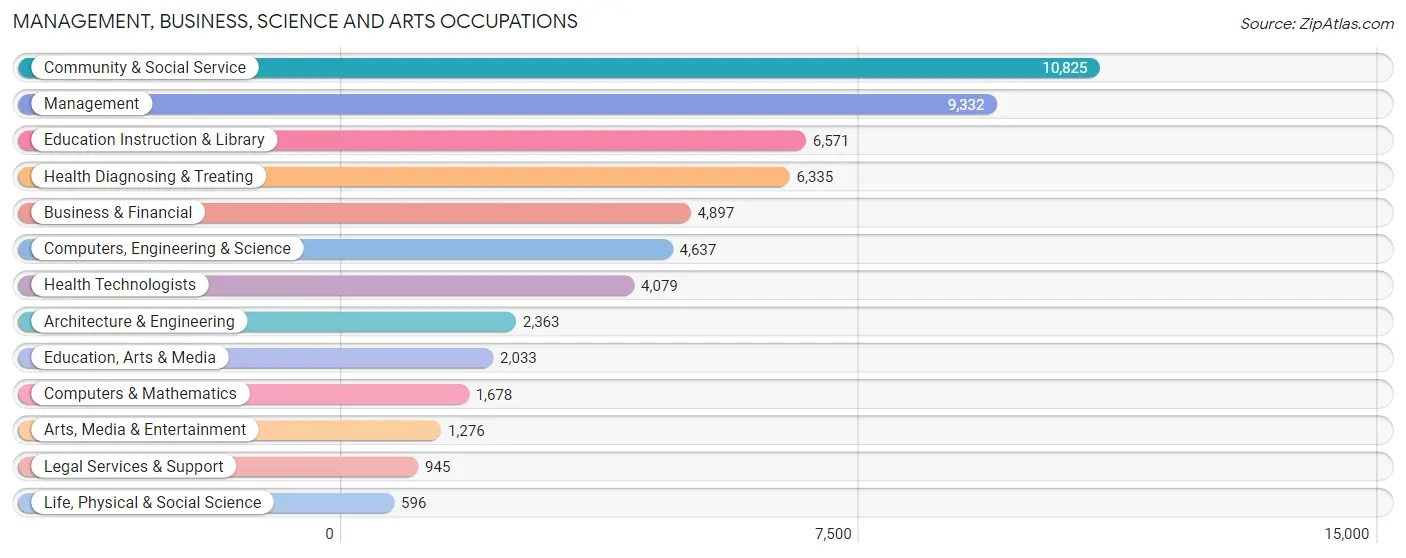
Management, Business, Science and Arts Occupations
The most common Management, Business, Science and Arts occupations in Niagara County are Community & Social Service (10,825 | 10.8%), Management (9,332 | 9.3%), Education Instruction & Library (6,571 | 6.6%), Health Diagnosing & Treating (6,335 | 6.3%), and Business & Financial (4,897 | 4.9%).
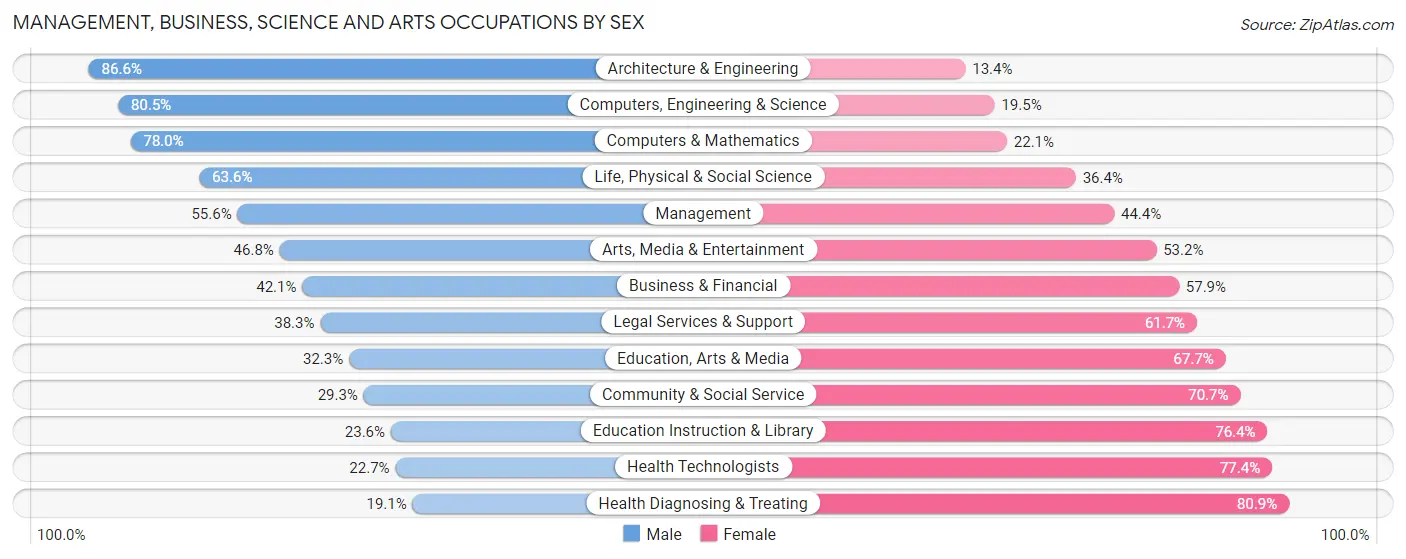
Management, Business, Science and Arts Occupations by Sex
Within the Management, Business, Science and Arts occupations in Niagara County, the most male-oriented occupations are Architecture & Engineering (86.6%), Computers, Engineering & Science (80.5%), and Computers & Mathematics (77.9%), while the most female-oriented occupations are Health Diagnosing & Treating (80.9%), Health Technologists (77.3%), and Education Instruction & Library (76.4%).
| Occupation | Male | Female |
| Management | 5,188 (55.6%) | 4,144 (44.4%) |
| Business & Financial | 2,060 (42.1%) | 2,837 (57.9%) |
| Computers, Engineering & Science | 3,734 (80.5%) | 903 (19.5%) |
| Computers & Mathematics | 1,308 (77.9%) | 370 (22.1%) |
| Architecture & Engineering | 2,047 (86.6%) | 316 (13.4%) |
| Life, Physical & Social Science | 379 (63.6%) | 217 (36.4%) |
| Community & Social Service | 3,167 (29.3%) | 7,658 (70.7%) |
| Education, Arts & Media | 657 (32.3%) | 1,376 (67.7%) |
| Legal Services & Support | 362 (38.3%) | 583 (61.7%) |
| Education Instruction & Library | 1,551 (23.6%) | 5,020 (76.4%) |
| Arts, Media & Entertainment | 597 (46.8%) | 679 (53.2%) |
| Health Diagnosing & Treating | 1,209 (19.1%) | 5,126 (80.9%) |
| Health Technologists | 924 (22.7%) | 3,155 (77.3%) |
| Total (Category) | 15,358 (42.6%) | 20,668 (57.4%) |
| Total (Overall) | 51,675 (51.5%) | 48,722 (48.5%) |
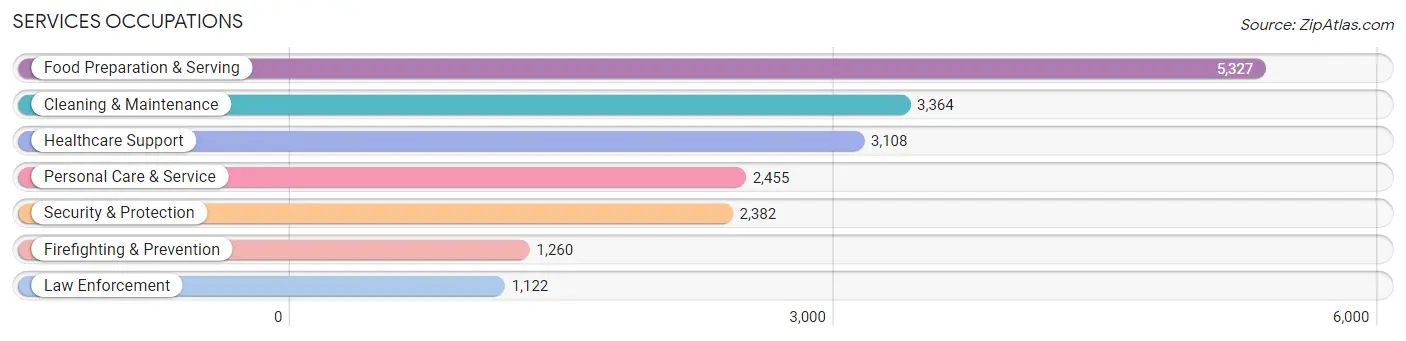
Services Occupations
The most common Services occupations in Niagara County are Food Preparation & Serving (5,327 | 5.3%), Cleaning & Maintenance (3,364 | 3.4%), Healthcare Support (3,108 | 3.1%), Personal Care & Service (2,455 | 2.5%), and Security & Protection (2,382 | 2.4%).
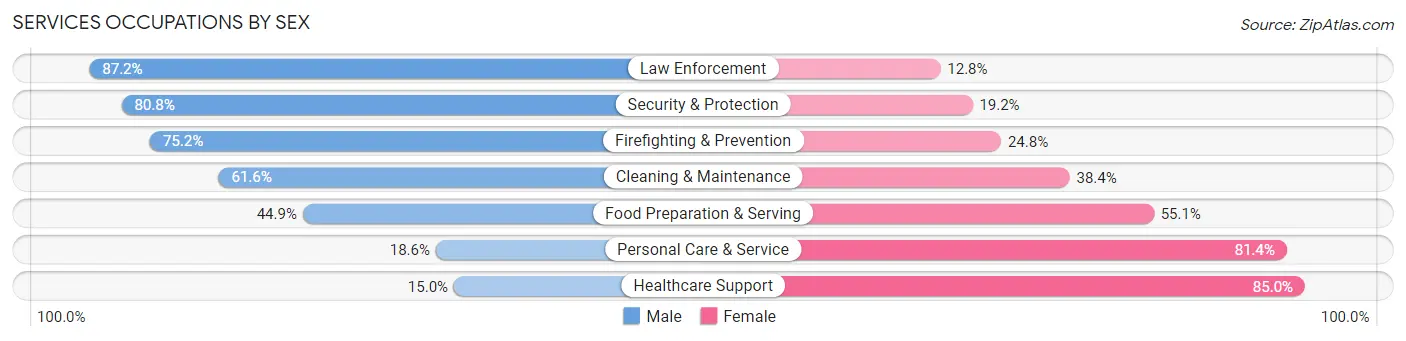
Services Occupations by Sex
Within the Services occupations in Niagara County, the most male-oriented occupations are Law Enforcement (87.2%), Security & Protection (80.8%), and Firefighting & Prevention (75.2%), while the most female-oriented occupations are Healthcare Support (85.0%), Personal Care & Service (81.4%), and Food Preparation & Serving (55.1%).
| Occupation | Male | Female |
| Healthcare Support | 466 (15.0%) | 2,642 (85.0%) |
| Security & Protection | 1,925 (80.8%) | 457 (19.2%) |
| Firefighting & Prevention | 947 (75.2%) | 313 (24.8%) |
| Law Enforcement | 978 (87.2%) | 144 (12.8%) |
| Food Preparation & Serving | 2,393 (44.9%) | 2,934 (55.1%) |
| Cleaning & Maintenance | 2,072 (61.6%) | 1,292 (38.4%) |
| Personal Care & Service | 456 (18.6%) | 1,999 (81.4%) |
| Total (Category) | 7,312 (44.0%) | 9,324 (56.0%) |
| Total (Overall) | 51,675 (51.5%) | 48,722 (48.5%) |
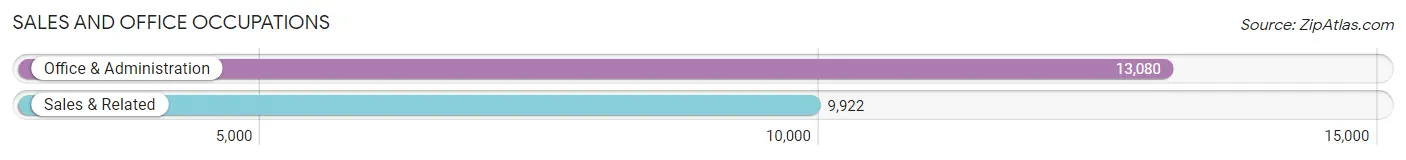
Sales and Office Occupations
The most common Sales and Office occupations in Niagara County are Office & Administration (13,080 | 13.0%), and Sales & Related (9,922 | 9.9%).
Sales and Office Occupations by Sex
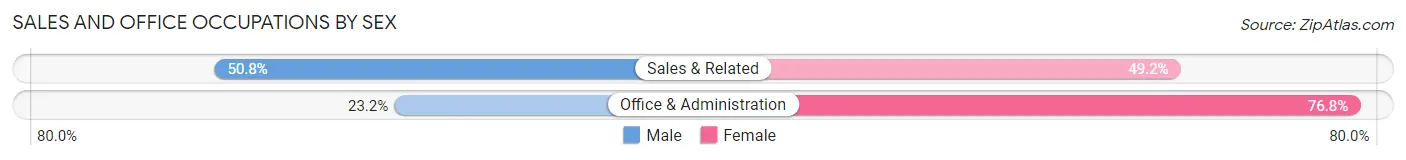
| Occupation | Male | Female |
| Sales & Related | 5,039 (50.8%) | 4,883 (49.2%) |
| Office & Administration | 3,029 (23.2%) | 10,051 (76.8%) |
| Total (Category) | 8,068 (35.1%) | 14,934 (64.9%) |
| Total (Overall) | 51,675 (51.5%) | 48,722 (48.5%) |
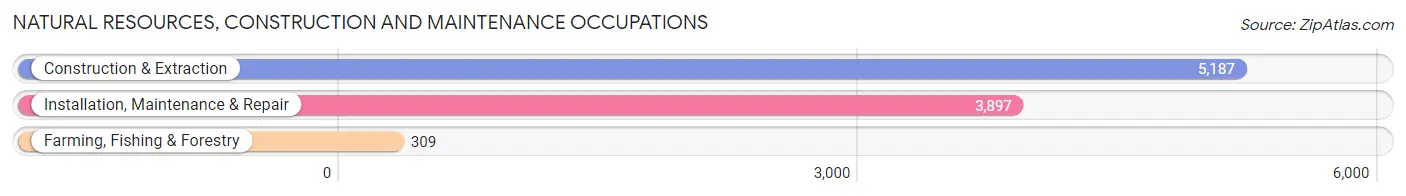
Natural Resources, Construction and Maintenance Occupations
The most common Natural Resources, Construction and Maintenance occupations in Niagara County are Construction & Extraction (5,187 | 5.2%), Installation, Maintenance & Repair (3,897 | 3.9%), and Farming, Fishing & Forestry (309 | 0.3%).
Natural Resources, Construction and Maintenance Occupations by Sex
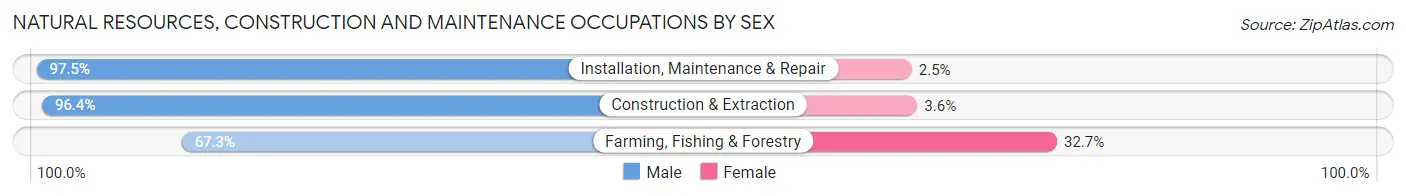
| Occupation | Male | Female |
| Farming, Fishing & Forestry | 208 (67.3%) | 101 (32.7%) |
| Construction & Extraction | 4,998 (96.4%) | 189 (3.6%) |
| Installation, Maintenance & Repair | 3,800 (97.5%) | 97 (2.5%) |
| Total (Category) | 9,006 (95.9%) | 387 (4.1%) |
| Total (Overall) | 51,675 (51.5%) | 48,722 (48.5%) |
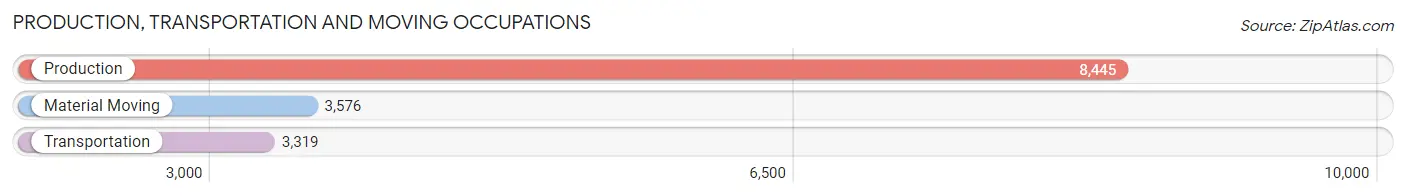
Production, Transportation and Moving Occupations
The most common Production, Transportation and Moving occupations in Niagara County are Production (8,445 | 8.4%), Material Moving (3,576 | 3.6%), and Transportation (3,319 | 3.3%).
Production, Transportation and Moving Occupations by Sex
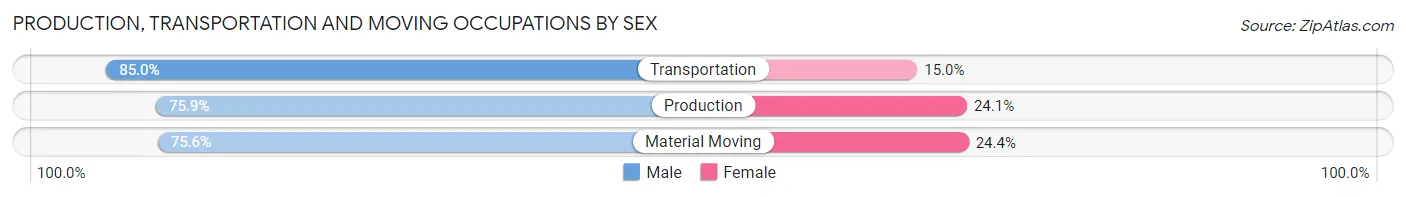
| Occupation | Male | Female |
| Production | 6,408 (75.9%) | 2,037 (24.1%) |
| Transportation | 2,821 (85.0%) | 498 (15.0%) |
| Material Moving | 2,702 (75.6%) | 874 (24.4%) |
| Total (Category) | 11,931 (77.8%) | 3,409 (22.2%) |
| Total (Overall) | 51,675 (51.5%) | 48,722 (48.5%) |
Employment Industries by Sex in Niagara County
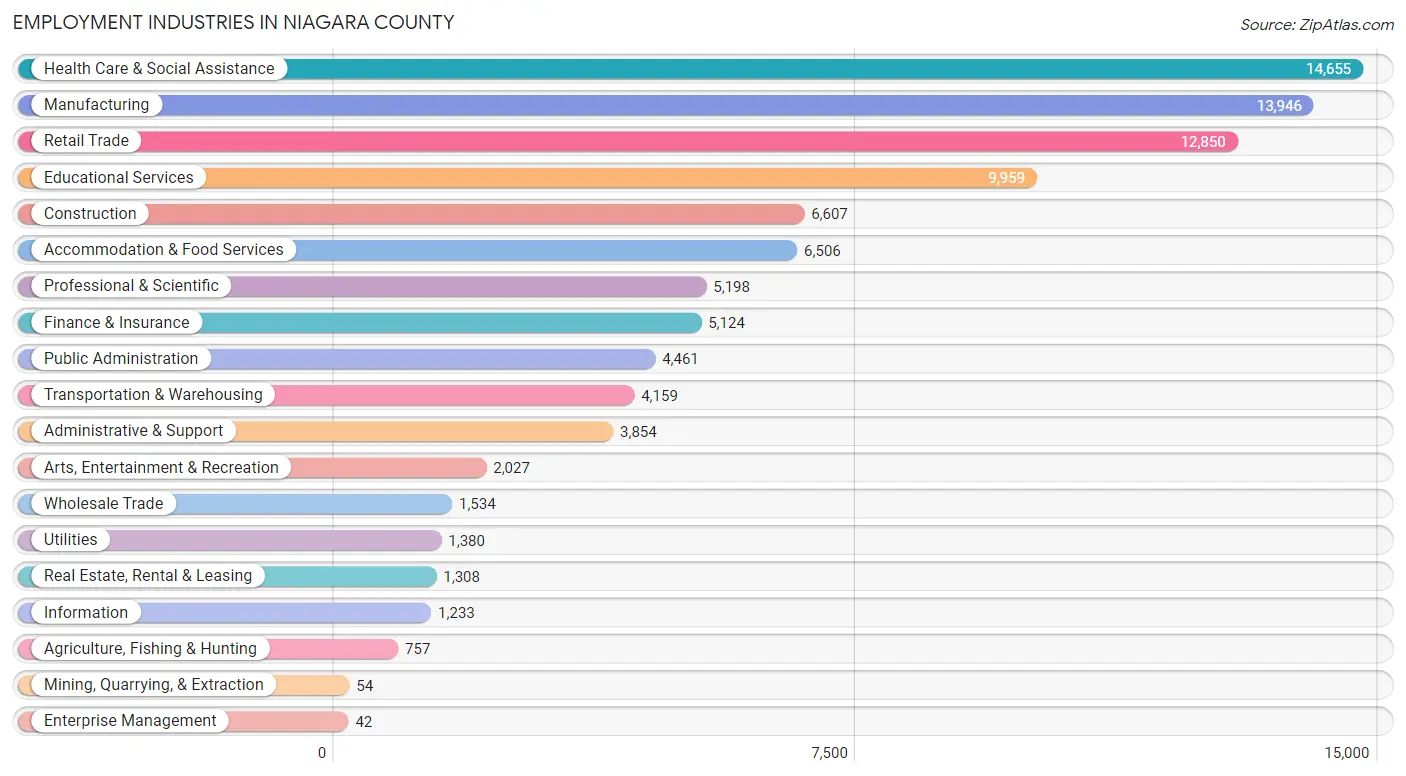
Employment Industries in Niagara County
The major employment industries in Niagara County include Health Care & Social Assistance (14,655 | 14.6%), Manufacturing (13,946 | 13.9%), Retail Trade (12,850 | 12.8%), Educational Services (9,959 | 9.9%), and Construction (6,607 | 6.6%).
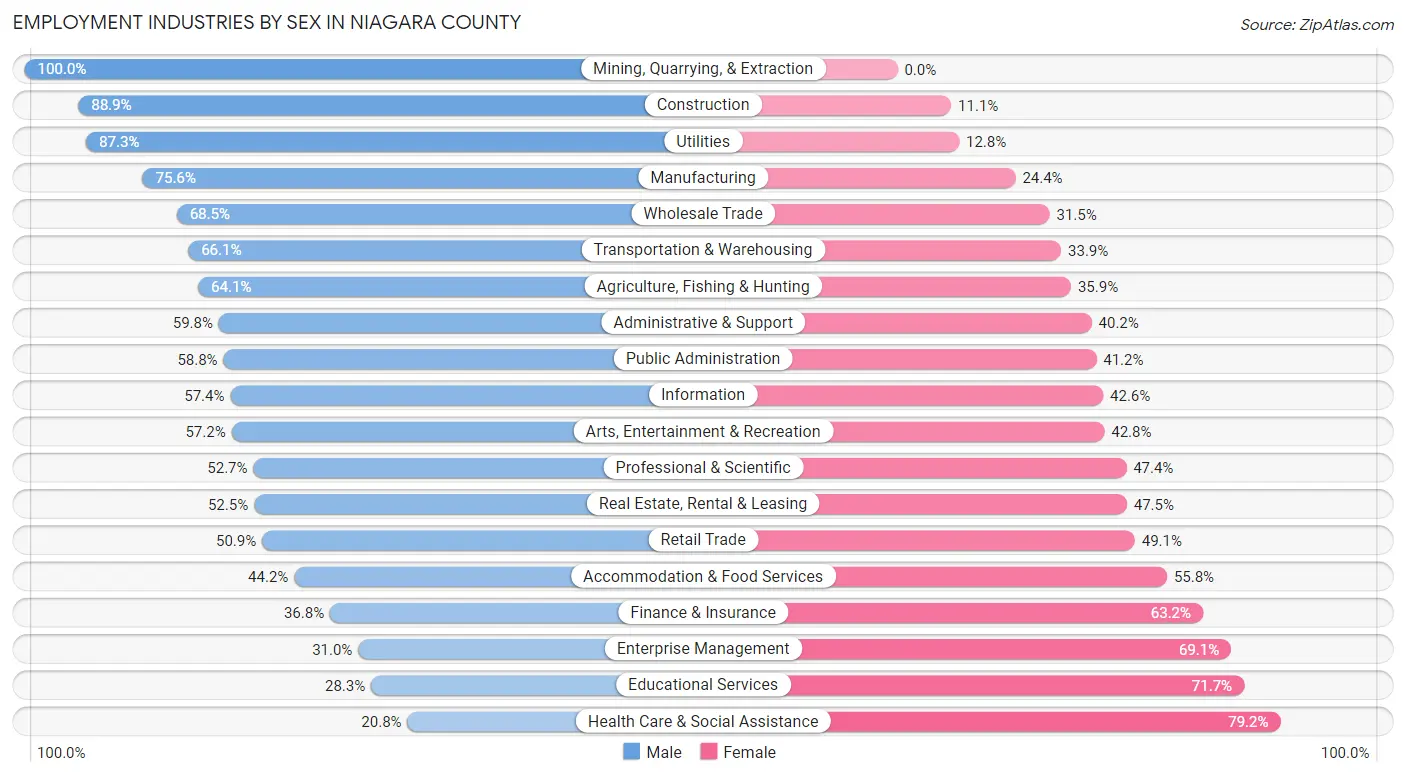
Employment Industries by Sex in Niagara County
The Niagara County industries that see more men than women are Mining, Quarrying, & Extraction (100.0%), Construction (88.9%), and Utilities (87.3%), whereas the industries that tend to have a higher number of women are Health Care & Social Assistance (79.2%), Educational Services (71.7%), and Enterprise Management (69.1%).
| Industry | Male | Female |
| Agriculture, Fishing & Hunting | 485 (64.1%) | 272 (35.9%) |
| Mining, Quarrying, & Extraction | 54 (100.0%) | 0 (0.0%) |
| Construction | 5,872 (88.9%) | 735 (11.1%) |
| Manufacturing | 10,539 (75.6%) | 3,407 (24.4%) |
| Wholesale Trade | 1,051 (68.5%) | 483 (31.5%) |
| Retail Trade | 6,536 (50.9%) | 6,314 (49.1%) |
| Transportation & Warehousing | 2,750 (66.1%) | 1,409 (33.9%) |
| Utilities | 1,204 (87.3%) | 176 (12.8%) |
| Information | 708 (57.4%) | 525 (42.6%) |
| Finance & Insurance | 1,885 (36.8%) | 3,239 (63.2%) |
| Real Estate, Rental & Leasing | 687 (52.5%) | 621 (47.5%) |
| Professional & Scientific | 2,737 (52.6%) | 2,461 (47.3%) |
| Enterprise Management | 13 (30.9%) | 29 (69.1%) |
| Administrative & Support | 2,305 (59.8%) | 1,549 (40.2%) |
| Educational Services | 2,817 (28.3%) | 7,142 (71.7%) |
| Health Care & Social Assistance | 3,043 (20.8%) | 11,612 (79.2%) |
| Arts, Entertainment & Recreation | 1,159 (57.2%) | 868 (42.8%) |
| Accommodation & Food Services | 2,876 (44.2%) | 3,630 (55.8%) |
| Public Administration | 2,625 (58.8%) | 1,836 (41.2%) |
| Total | 51,675 (51.5%) | 48,722 (48.5%) |
Education in Niagara County
School Enrollment in Niagara County
The most common levels of schooling among the 43,913 students in Niagara County are high school (10,244 | 23.3%), college / undergraduate (8,992 | 20.5%), and elementary school (8,965 | 20.4%).
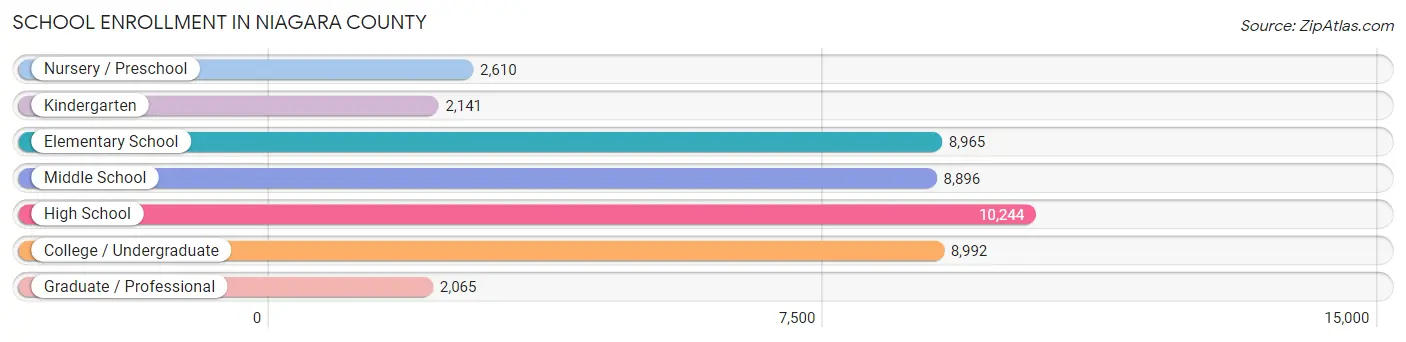
| School Level | # Students | % Students |
| Nursery / Preschool | 2,610 | 5.9% |
| Kindergarten | 2,141 | 4.9% |
| Elementary School | 8,965 | 20.4% |
| Middle School | 8,896 | 20.3% |
| High School | 10,244 | 23.3% |
| College / Undergraduate | 8,992 | 20.5% |
| Graduate / Professional | 2,065 | 4.7% |
| Total | 43,913 | 100.0% |
School Enrollment by Age by Funding Source in Niagara County
Out of a total of 43,913 students who are enrolled in schools in Niagara County, 8,695 (19.8%) attend a private institution, while the remaining 35,218 (80.2%) are enrolled in public schools. The age group of 3 to 4 year olds has the highest likelihood of being enrolled in private schools, with 940 (46.7% in the age bracket) enrolled. Conversely, the age group of 10 to 14 year olds has the lowest likelihood of being enrolled in a private school, with 9,866 (88.6% in the age bracket) attending a public institution.
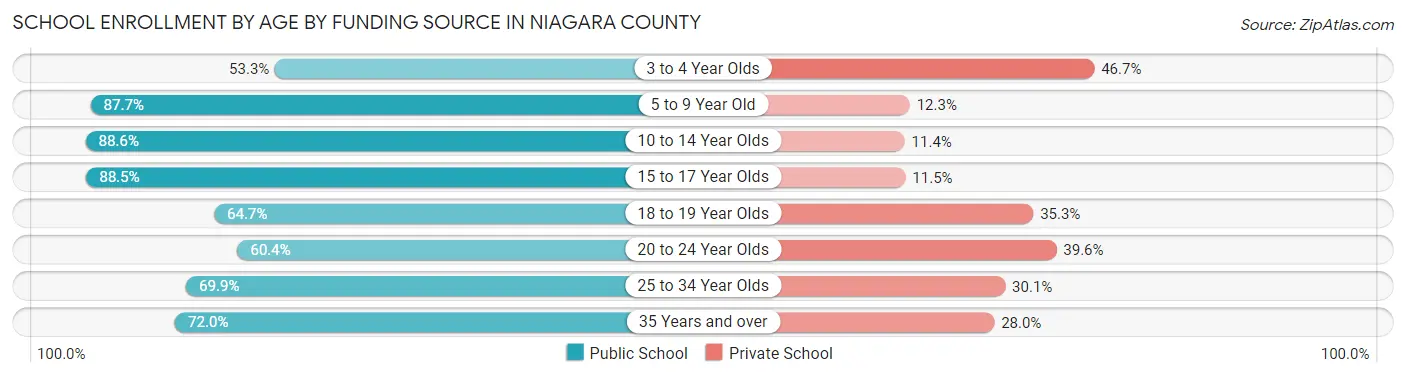
| Age Bracket | Public School | Private School |
| 3 to 4 Year Olds | 1,074 (53.3%) | 940 (46.7%) |
| 5 to 9 Year Old | 9,641 (87.7%) | 1,354 (12.3%) |
| 10 to 14 Year Olds | 9,866 (88.6%) | 1,264 (11.4%) |
| 15 to 17 Year Olds | 6,532 (88.5%) | 849 (11.5%) |
| 18 to 19 Year Olds | 2,388 (64.7%) | 1,303 (35.3%) |
| 20 to 24 Year Olds | 2,681 (60.4%) | 1,759 (39.6%) |
| 25 to 34 Year Olds | 1,581 (69.9%) | 680 (30.1%) |
| 35 Years and over | 1,440 (72.0%) | 561 (28.0%) |
| Total | 35,218 (80.2%) | 8,695 (19.8%) |
Educational Attainment by Field of Study in Niagara County
Business (7,541 | 17.0%), education (7,252 | 16.3%), science & technology (4,779 | 10.7%), social sciences (3,384 | 7.6%), and arts & humanities (2,980 | 6.7%) are the most common fields of study among 44,487 individuals in Niagara County who have obtained a bachelor's degree or higher.
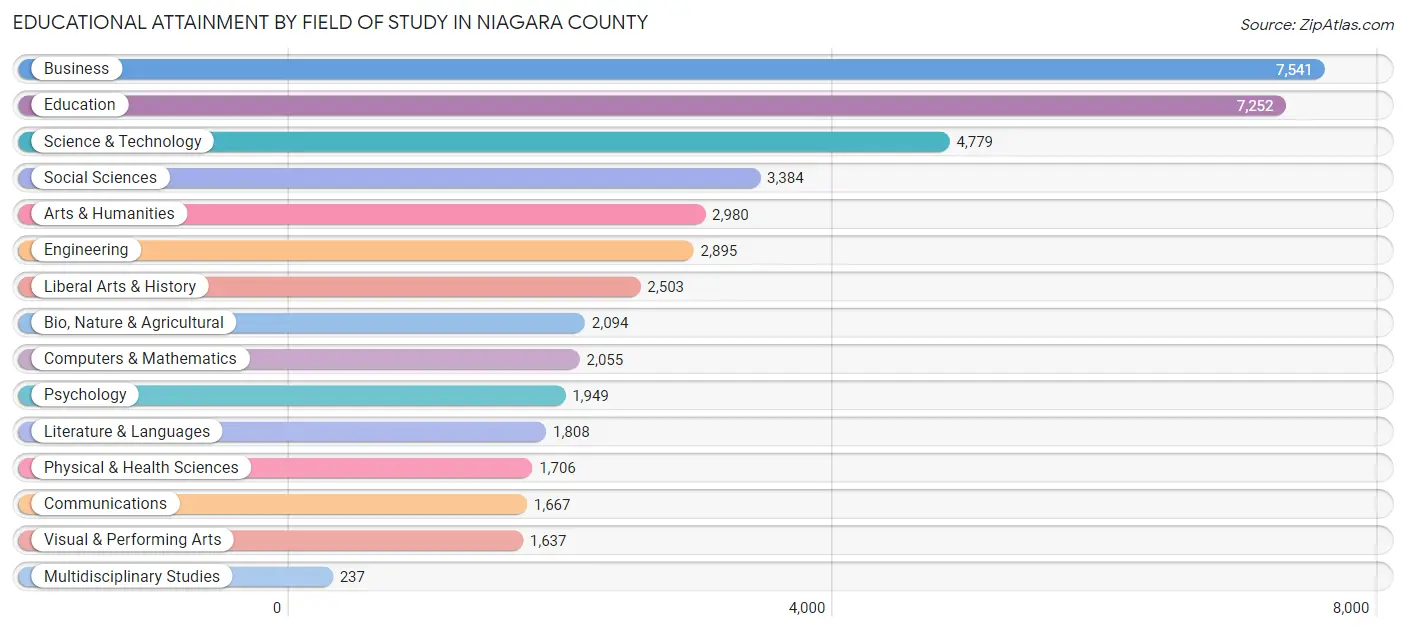
| Field of Study | # Graduates | % Graduates |
| Computers & Mathematics | 2,055 | 4.6% |
| Bio, Nature & Agricultural | 2,094 | 4.7% |
| Physical & Health Sciences | 1,706 | 3.8% |
| Psychology | 1,949 | 4.4% |
| Social Sciences | 3,384 | 7.6% |
| Engineering | 2,895 | 6.5% |
| Multidisciplinary Studies | 237 | 0.5% |
| Science & Technology | 4,779 | 10.7% |
| Business | 7,541 | 17.0% |
| Education | 7,252 | 16.3% |
| Literature & Languages | 1,808 | 4.1% |
| Liberal Arts & History | 2,503 | 5.6% |
| Visual & Performing Arts | 1,637 | 3.7% |
| Communications | 1,667 | 3.7% |
| Arts & Humanities | 2,980 | 6.7% |
| Total | 44,487 | 100.0% |
Transportation & Commute in Niagara County
Vehicle Availability by Sex in Niagara County
The most prevalent vehicle ownership categories in Niagara County are males with 2 vehicles (23,403, accounting for 46.3%) and females with 2 vehicles (20,424, making up 49.5%).
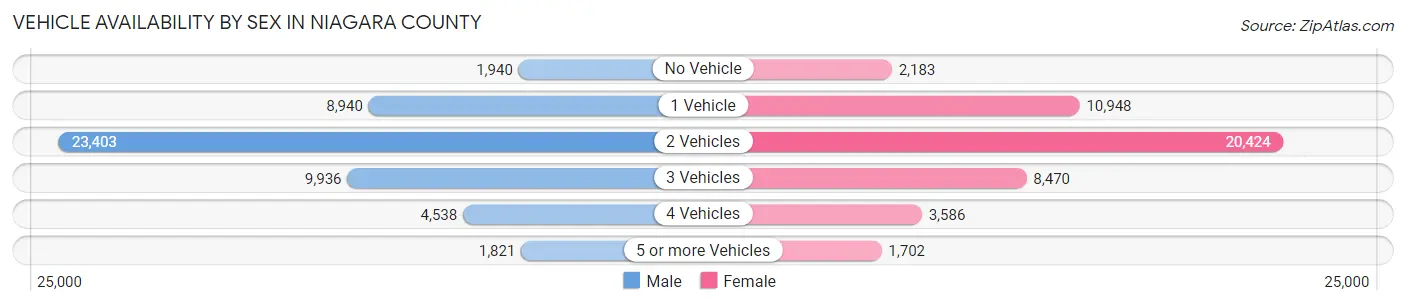
| Vehicles Available | Male | Female |
| No Vehicle | 1,940 (3.8%) | 2,183 (4.6%) |
| 1 Vehicle | 8,940 (17.7%) | 10,948 (23.1%) |
| 2 Vehicles | 23,403 (46.3%) | 20,424 (43.2%) |
| 3 Vehicles | 9,936 (19.6%) | 8,470 (17.9%) |
| 4 Vehicles | 4,538 (9.0%) | 3,586 (7.6%) |
| 5 or more Vehicles | 1,821 (3.6%) | 1,702 (3.6%) |
| Total | 50,578 (100.0%) | 47,313 (100.0%) |
Commute Time in Niagara County
The most frequently occuring commute durations in Niagara County are 15 to 19 minutes (13,770 commuters, 15.1%), 10 to 14 minutes (13,028 commuters, 14.3%), and 20 to 24 minutes (12,530 commuters, 13.8%).
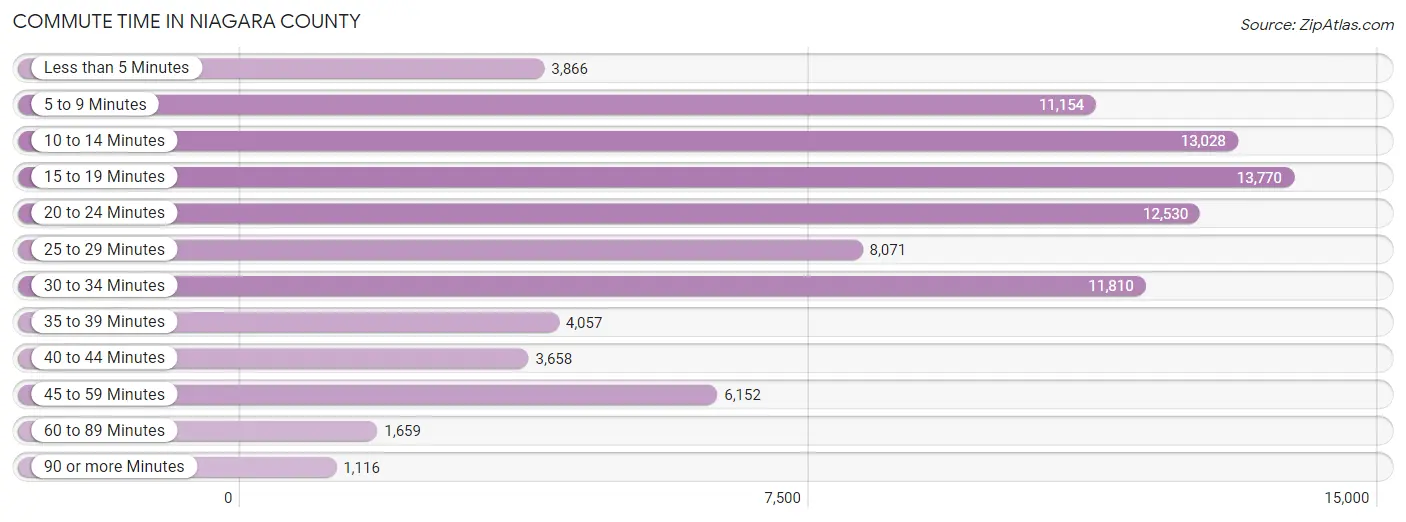
| Commute Time | # Commuters | % Commuters |
| Less than 5 Minutes | 3,866 | 4.3% |
| 5 to 9 Minutes | 11,154 | 12.3% |
| 10 to 14 Minutes | 13,028 | 14.3% |
| 15 to 19 Minutes | 13,770 | 15.1% |
| 20 to 24 Minutes | 12,530 | 13.8% |
| 25 to 29 Minutes | 8,071 | 8.9% |
| 30 to 34 Minutes | 11,810 | 13.0% |
| 35 to 39 Minutes | 4,057 | 4.5% |
| 40 to 44 Minutes | 3,658 | 4.0% |
| 45 to 59 Minutes | 6,152 | 6.8% |
| 60 to 89 Minutes | 1,659 | 1.8% |
| 90 or more Minutes | 1,116 | 1.2% |
Commute Time by Sex in Niagara County
The most common commute times in Niagara County are 15 to 19 minutes (6,870 commuters, 14.4%) for males and 15 to 19 minutes (6,900 commuters, 15.9%) for females.
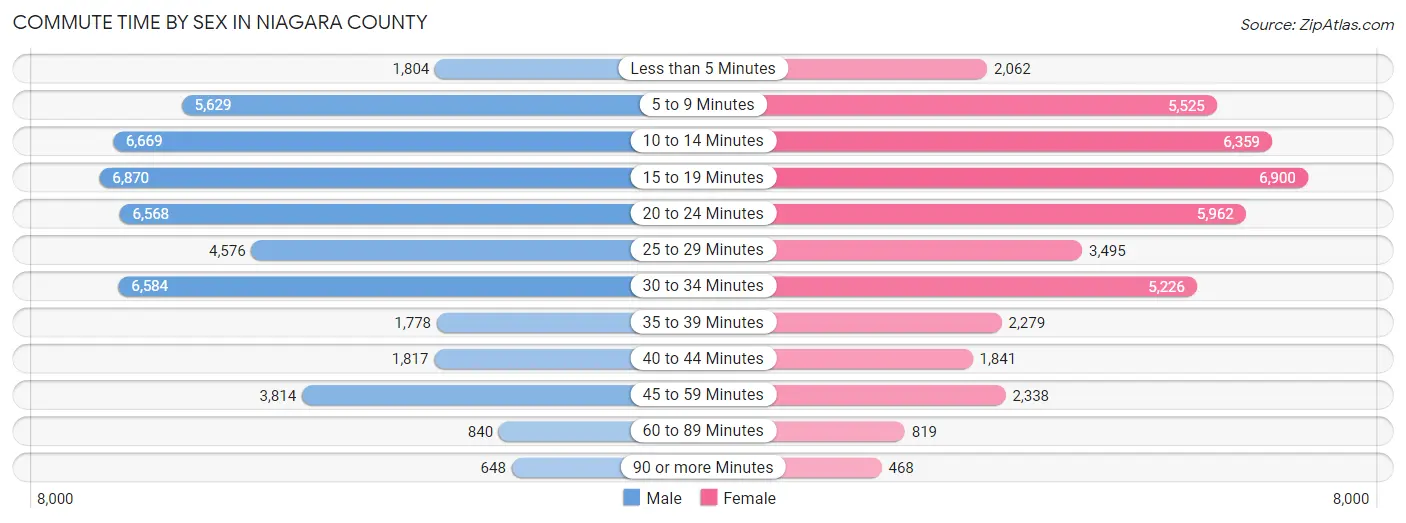
| Commute Time | Male | Female |
| Less than 5 Minutes | 1,804 (3.8%) | 2,062 (4.8%) |
| 5 to 9 Minutes | 5,629 (11.8%) | 5,525 (12.8%) |
| 10 to 14 Minutes | 6,669 (14.0%) | 6,359 (14.7%) |
| 15 to 19 Minutes | 6,870 (14.4%) | 6,900 (15.9%) |
| 20 to 24 Minutes | 6,568 (13.8%) | 5,962 (13.8%) |
| 25 to 29 Minutes | 4,576 (9.6%) | 3,495 (8.1%) |
| 30 to 34 Minutes | 6,584 (13.8%) | 5,226 (12.1%) |
| 35 to 39 Minutes | 1,778 (3.7%) | 2,279 (5.3%) |
| 40 to 44 Minutes | 1,817 (3.8%) | 1,841 (4.3%) |
| 45 to 59 Minutes | 3,814 (8.0%) | 2,338 (5.4%) |
| 60 to 89 Minutes | 840 (1.8%) | 819 (1.9%) |
| 90 or more Minutes | 648 (1.4%) | 468 (1.1%) |
Time of Departure to Work by Sex in Niagara County
The most frequent times of departure to work in Niagara County are 7:00 AM to 7:29 AM (6,017, 12.6%) for males and 7:00 AM to 7:29 AM (6,936, 16.0%) for females.
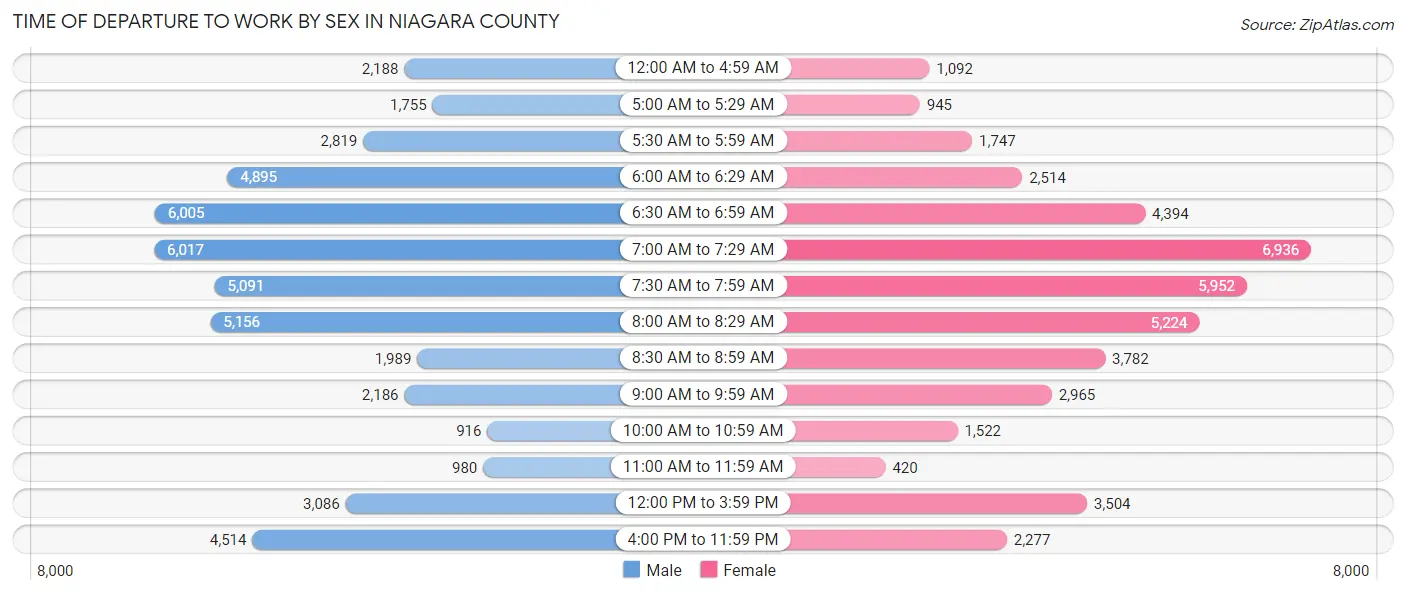
| Time of Departure | Male | Female |
| 12:00 AM to 4:59 AM | 2,188 (4.6%) | 1,092 (2.5%) |
| 5:00 AM to 5:29 AM | 1,755 (3.7%) | 945 (2.2%) |
| 5:30 AM to 5:59 AM | 2,819 (5.9%) | 1,747 (4.0%) |
| 6:00 AM to 6:29 AM | 4,895 (10.3%) | 2,514 (5.8%) |
| 6:30 AM to 6:59 AM | 6,005 (12.6%) | 4,394 (10.2%) |
| 7:00 AM to 7:29 AM | 6,017 (12.6%) | 6,936 (16.0%) |
| 7:30 AM to 7:59 AM | 5,091 (10.7%) | 5,952 (13.8%) |
| 8:00 AM to 8:29 AM | 5,156 (10.8%) | 5,224 (12.1%) |
| 8:30 AM to 8:59 AM | 1,989 (4.2%) | 3,782 (8.7%) |
| 9:00 AM to 9:59 AM | 2,186 (4.6%) | 2,965 (6.9%) |
| 10:00 AM to 10:59 AM | 916 (1.9%) | 1,522 (3.5%) |
| 11:00 AM to 11:59 AM | 980 (2.1%) | 420 (1.0%) |
| 12:00 PM to 3:59 PM | 3,086 (6.5%) | 3,504 (8.1%) |
| 4:00 PM to 11:59 PM | 4,514 (9.5%) | 2,277 (5.3%) |
| Total | 47,597 (100.0%) | 43,274 (100.0%) |
Housing Occupancy in Niagara County
Occupancy by Ownership in Niagara County
Of the total 90,982 dwellings in Niagara County, owner-occupied units account for 64,550 (71.0%), while renter-occupied units make up 26,432 (29.0%).
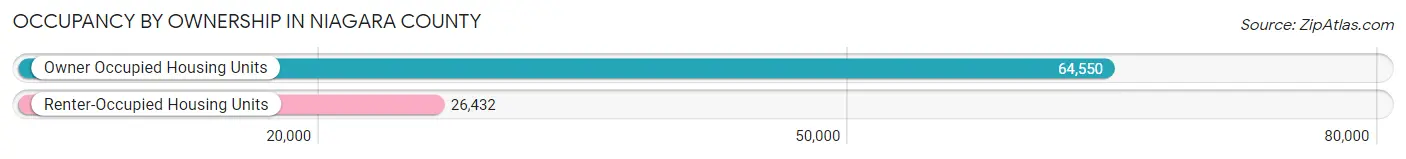
| Occupancy | # Housing Units | % Housing Units |
| Owner Occupied Housing Units | 64,550 | 71.0% |
| Renter-Occupied Housing Units | 26,432 | 29.0% |
| Total Occupied Housing Units | 90,982 | 100.0% |
Occupancy by Household Size in Niagara County
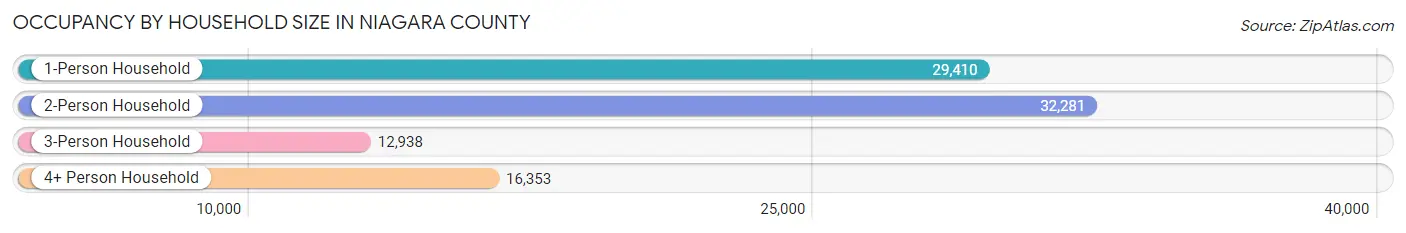
| Household Size | # Housing Units | % Housing Units |
| 1-Person Household | 29,410 | 32.3% |
| 2-Person Household | 32,281 | 35.5% |
| 3-Person Household | 12,938 | 14.2% |
| 4+ Person Household | 16,353 | 18.0% |
| Total Housing Units | 90,982 | 100.0% |
Occupancy by Ownership by Household Size in Niagara County
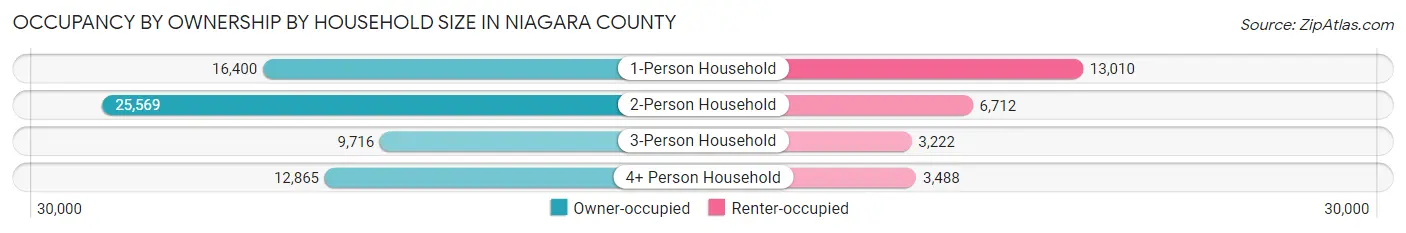
| Household Size | Owner-occupied | Renter-occupied |
| 1-Person Household | 16,400 (55.8%) | 13,010 (44.2%) |
| 2-Person Household | 25,569 (79.2%) | 6,712 (20.8%) |
| 3-Person Household | 9,716 (75.1%) | 3,222 (24.9%) |
| 4+ Person Household | 12,865 (78.7%) | 3,488 (21.3%) |
| Total Housing Units | 64,550 (71.0%) | 26,432 (29.0%) |
Occupancy by Educational Attainment in Niagara County
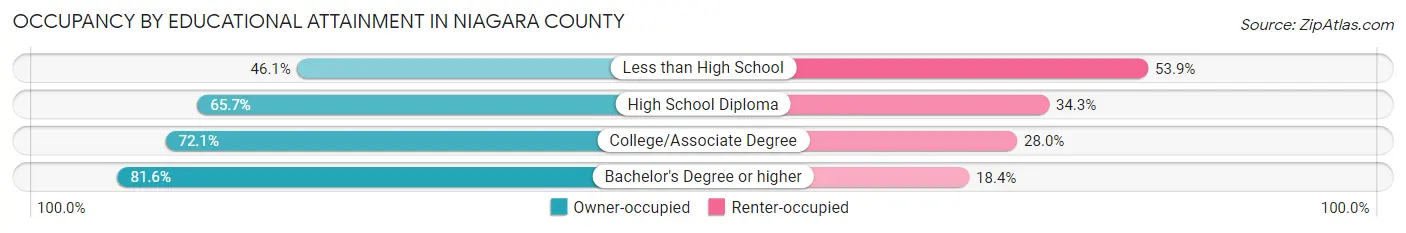
| Household Size | Owner-occupied | Renter-occupied |
| Less than High School | 3,127 (46.1%) | 3,660 (53.9%) |
| High School Diploma | 17,727 (65.7%) | 9,244 (34.3%) |
| College/Associate Degree | 22,556 (72.1%) | 8,749 (28.0%) |
| Bachelor's Degree or higher | 21,140 (81.6%) | 4,779 (18.4%) |
Occupancy by Age of Householder in Niagara County
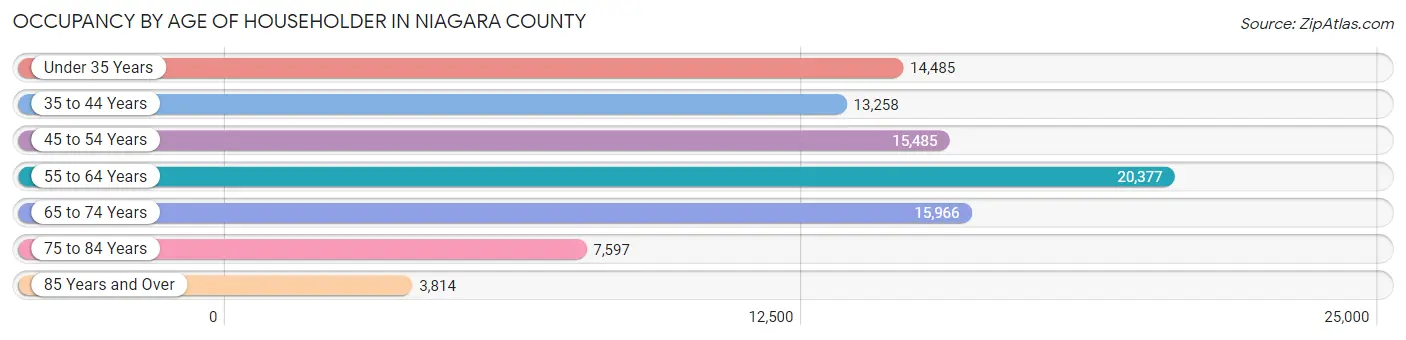
| Age Bracket | # Households | % Households |
| Under 35 Years | 14,485 | 15.9% |
| 35 to 44 Years | 13,258 | 14.6% |
| 45 to 54 Years | 15,485 | 17.0% |
| 55 to 64 Years | 20,377 | 22.4% |
| 65 to 74 Years | 15,966 | 17.5% |
| 75 to 84 Years | 7,597 | 8.4% |
| 85 Years and Over | 3,814 | 4.2% |
| Total | 90,982 | 100.0% |
Housing Finances in Niagara County
Median Income by Occupancy in Niagara County
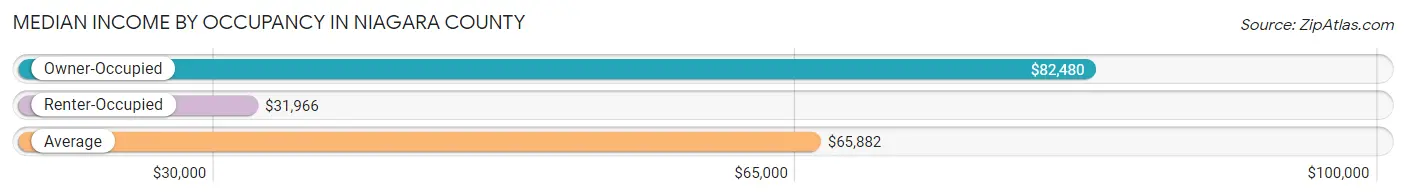
| Occupancy Type | # Households | Median Income |
| Owner-Occupied | 64,550 (71.0%) | $82,480 |
| Renter-Occupied | 26,432 (29.0%) | $31,966 |
| Average | 90,982 (100.0%) | $65,882 |
Occupancy by Householder Income Bracket in Niagara County
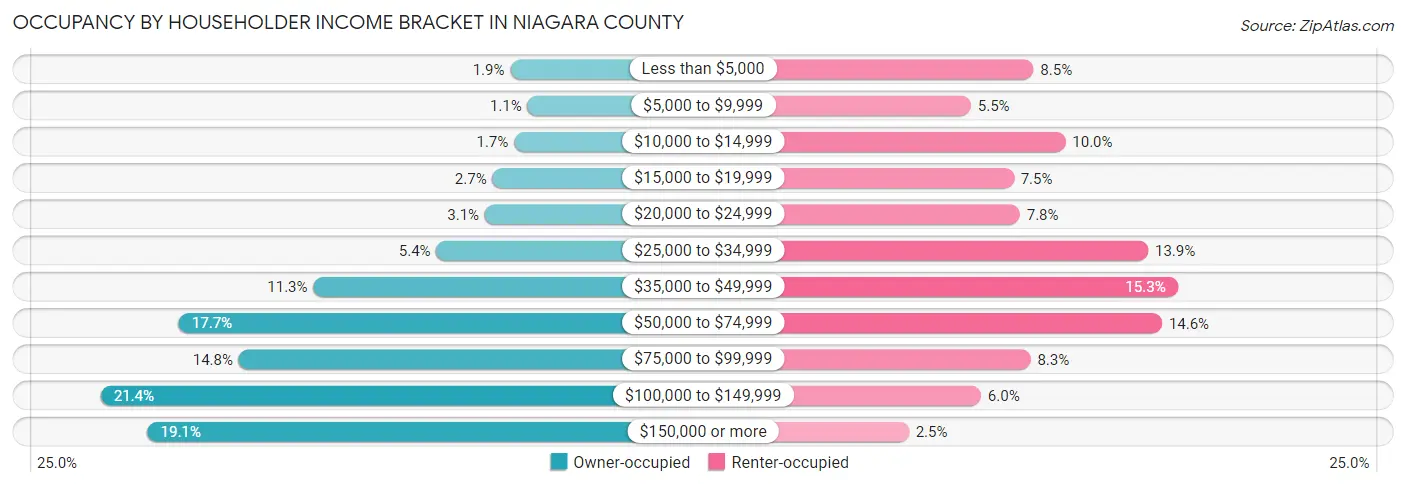
| Income Bracket | Owner-occupied | Renter-occupied |
| Less than $5,000 | 1,204 (1.9%) | 2,240 (8.5%) |
| $5,000 to $9,999 | 676 (1.1%) | 1,451 (5.5%) |
| $10,000 to $14,999 | 1,089 (1.7%) | 2,641 (10.0%) |
| $15,000 to $19,999 | 1,754 (2.7%) | 1,990 (7.5%) |
| $20,000 to $24,999 | 1,988 (3.1%) | 2,068 (7.8%) |
| $25,000 to $34,999 | 3,478 (5.4%) | 3,682 (13.9%) |
| $35,000 to $49,999 | 7,262 (11.3%) | 4,051 (15.3%) |
| $50,000 to $74,999 | 11,395 (17.6%) | 3,857 (14.6%) |
| $75,000 to $99,999 | 9,553 (14.8%) | 2,203 (8.3%) |
| $100,000 to $149,999 | 13,797 (21.4%) | 1,579 (6.0%) |
| $150,000 or more | 12,354 (19.1%) | 670 (2.5%) |
| Total | 64,550 (100.0%) | 26,432 (100.0%) |
Monthly Housing Cost Tiers in Niagara County
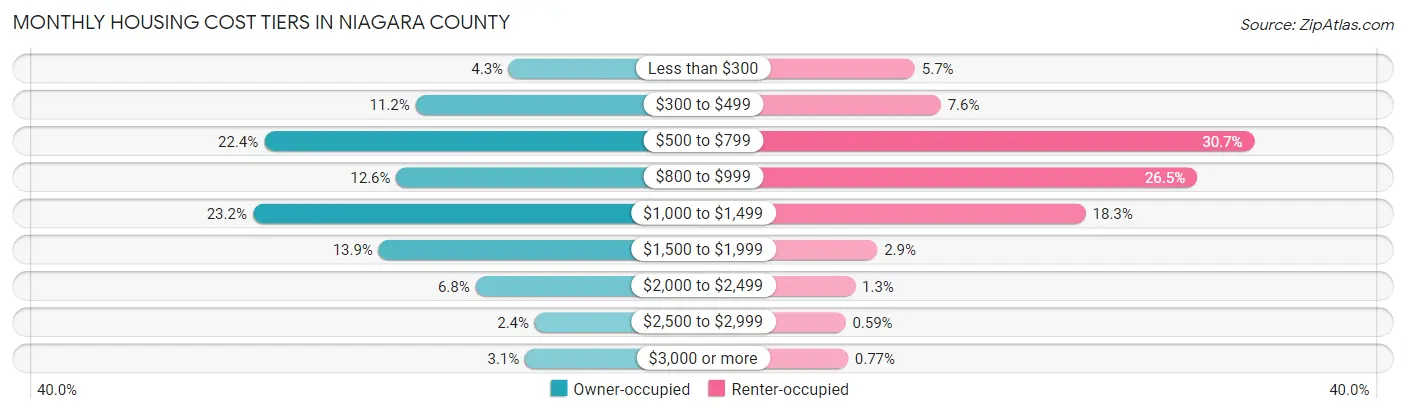
| Monthly Cost | Owner-occupied | Renter-occupied |
| Less than $300 | 2,796 (4.3%) | 1,507 (5.7%) |
| $300 to $499 | 7,239 (11.2%) | 2,012 (7.6%) |
| $500 to $799 | 14,436 (22.4%) | 8,116 (30.7%) |
| $800 to $999 | 8,146 (12.6%) | 6,998 (26.5%) |
| $1,000 to $1,499 | 14,978 (23.2%) | 4,831 (18.3%) |
| $1,500 to $1,999 | 8,986 (13.9%) | 775 (2.9%) |
| $2,000 to $2,499 | 4,380 (6.8%) | 344 (1.3%) |
| $2,500 to $2,999 | 1,559 (2.4%) | 157 (0.6%) |
| $3,000 or more | 2,030 (3.1%) | 203 (0.8%) |
| Total | 64,550 (100.0%) | 26,432 (100.0%) |
Physical Housing Characteristics in Niagara County
Housing Structures in Niagara County
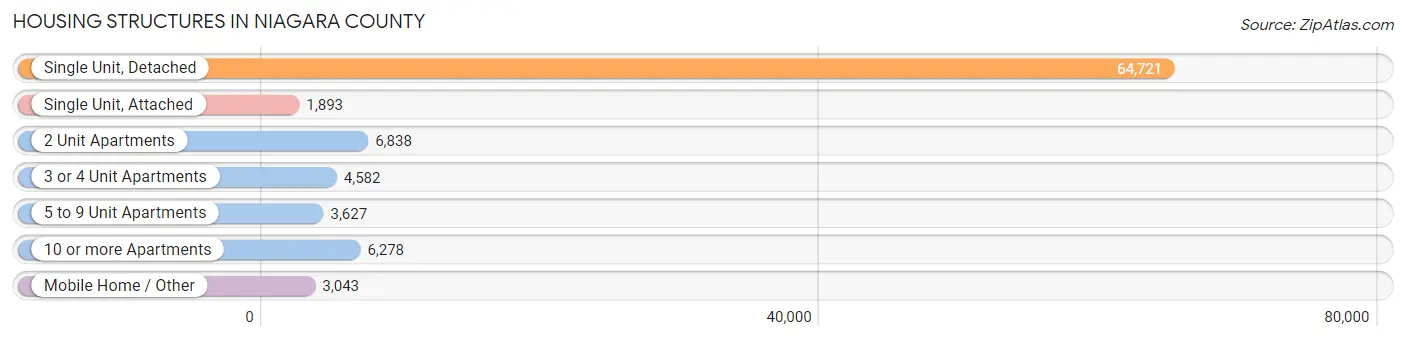
| Structure Type | # Housing Units | % Housing Units |
| Single Unit, Detached | 64,721 | 71.1% |
| Single Unit, Attached | 1,893 | 2.1% |
| 2 Unit Apartments | 6,838 | 7.5% |
| 3 or 4 Unit Apartments | 4,582 | 5.0% |
| 5 to 9 Unit Apartments | 3,627 | 4.0% |
| 10 or more Apartments | 6,278 | 6.9% |
| Mobile Home / Other | 3,043 | 3.3% |
| Total | 90,982 | 100.0% |
Housing Structures by Occupancy in Niagara County
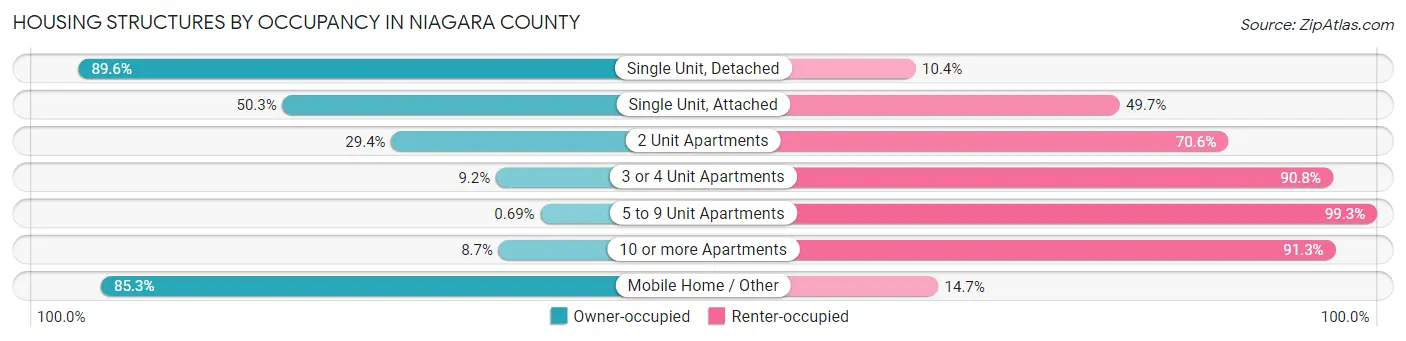
| Structure Type | Owner-occupied | Renter-occupied |
| Single Unit, Detached | 58,000 (89.6%) | 6,721 (10.4%) |
| Single Unit, Attached | 953 (50.3%) | 940 (49.7%) |
| 2 Unit Apartments | 2,008 (29.4%) | 4,830 (70.6%) |
| 3 or 4 Unit Apartments | 423 (9.2%) | 4,159 (90.8%) |
| 5 to 9 Unit Apartments | 25 (0.7%) | 3,602 (99.3%) |
| 10 or more Apartments | 546 (8.7%) | 5,732 (91.3%) |
| Mobile Home / Other | 2,595 (85.3%) | 448 (14.7%) |
| Total | 64,550 (71.0%) | 26,432 (29.0%) |
Housing Structures by Number of Rooms in Niagara County
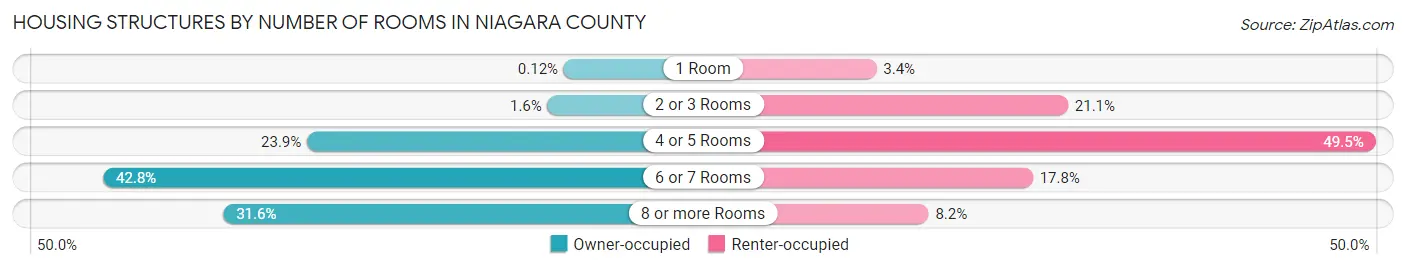
| Number of Rooms | Owner-occupied | Renter-occupied |
| 1 Room | 80 (0.1%) | 891 (3.4%) |
| 2 or 3 Rooms | 1,050 (1.6%) | 5,571 (21.1%) |
| 4 or 5 Rooms | 15,407 (23.9%) | 13,091 (49.5%) |
| 6 or 7 Rooms | 27,597 (42.7%) | 4,714 (17.8%) |
| 8 or more Rooms | 20,416 (31.6%) | 2,165 (8.2%) |
| Total | 64,550 (100.0%) | 26,432 (100.0%) |
Housing Structure by Heating Type in Niagara County
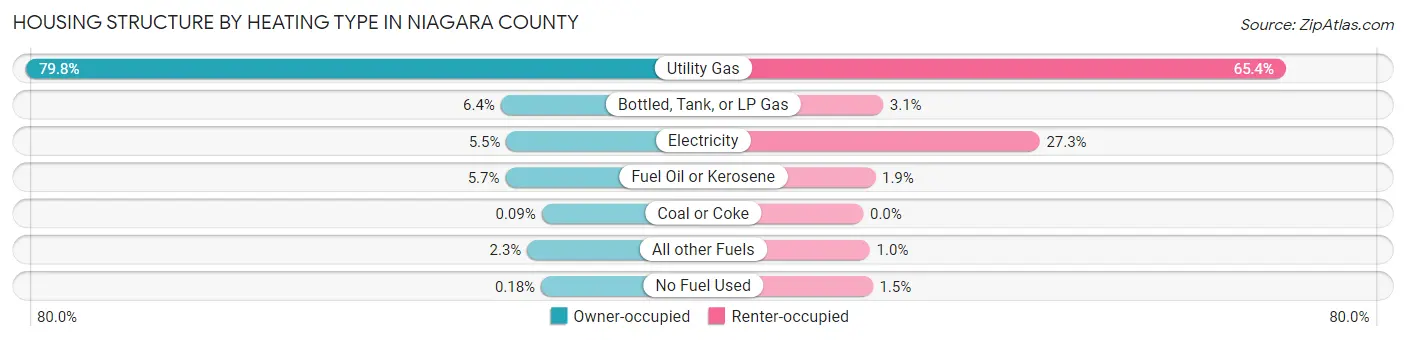
| Heating Type | Owner-occupied | Renter-occupied |
| Utility Gas | 51,500 (79.8%) | 17,273 (65.3%) |
| Bottled, Tank, or LP Gas | 4,139 (6.4%) | 808 (3.1%) |
| Electricity | 3,576 (5.5%) | 7,209 (27.3%) |
| Fuel Oil or Kerosene | 3,674 (5.7%) | 488 (1.8%) |
| Coal or Coke | 60 (0.1%) | 0 (0.0%) |
| All other Fuels | 1,488 (2.3%) | 269 (1.0%) |
| No Fuel Used | 113 (0.2%) | 385 (1.5%) |
| Total | 64,550 (100.0%) | 26,432 (100.0%) |
Household Vehicle Usage in Niagara County
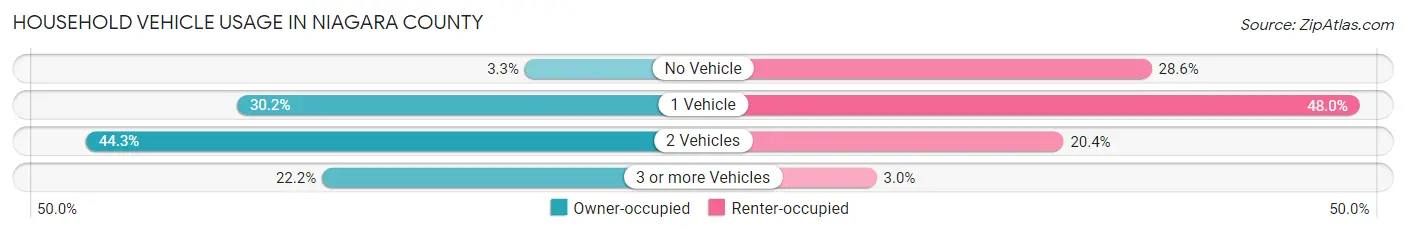
| Vehicles per Household | Owner-occupied | Renter-occupied |
| No Vehicle | 2,139 (3.3%) | 7,565 (28.6%) |
| 1 Vehicle | 19,477 (30.2%) | 12,694 (48.0%) |
| 2 Vehicles | 28,578 (44.3%) | 5,391 (20.4%) |
| 3 or more Vehicles | 14,356 (22.2%) | 782 (3.0%) |
| Total | 64,550 (100.0%) | 26,432 (100.0%) |
Real Estate & Mortgages in Niagara County
Real Estate and Mortgage Overview in Niagara County
| Characteristic | Without Mortgage | With Mortgage |
| Housing Units | 29,090 | 35,460 |
| Median Property Value | $144,500 | $177,200 |
| Median Household Income | $63,619 | $8,654 |
| Monthly Housing Costs | $612 | $1,940 |
| Real Estate Taxes | $3,493 | $1,085 |
Property Value by Mortgage Status in Niagara County
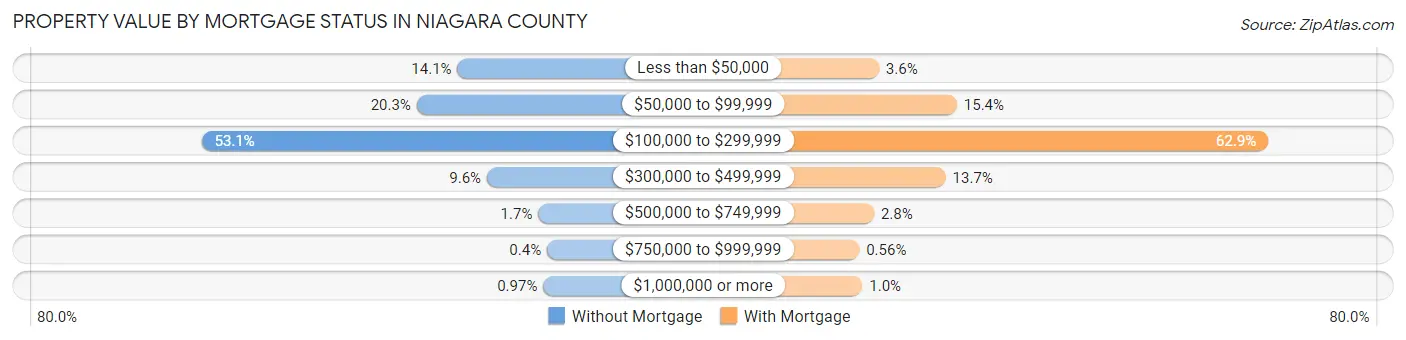
| Property Value | Without Mortgage | With Mortgage |
| Less than $50,000 | 4,088 (14.1%) | 1,261 (3.6%) |
| $50,000 to $99,999 | 5,892 (20.3%) | 5,475 (15.4%) |
| $100,000 to $299,999 | 15,431 (53.0%) | 22,292 (62.9%) |
| $300,000 to $499,999 | 2,778 (9.6%) | 4,868 (13.7%) |
| $500,000 to $749,999 | 503 (1.7%) | 997 (2.8%) |
| $750,000 to $999,999 | 116 (0.4%) | 199 (0.6%) |
| $1,000,000 or more | 282 (1.0%) | 368 (1.0%) |
| Total | 29,090 (100.0%) | 35,460 (100.0%) |
Household Income by Mortgage Status in Niagara County
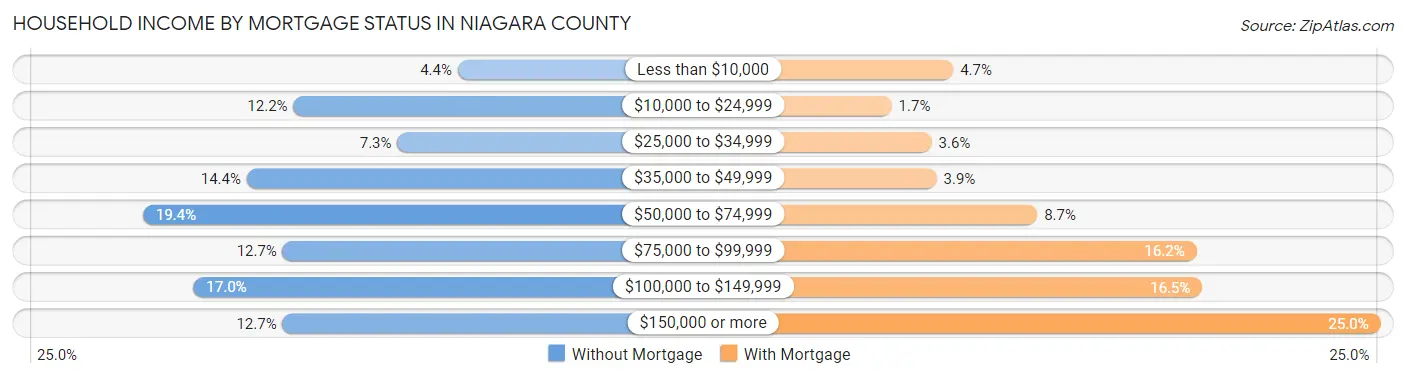
| Household Income | Without Mortgage | With Mortgage |
| Less than $10,000 | 1,271 (4.4%) | 1,648 (4.6%) |
| $10,000 to $24,999 | 3,549 (12.2%) | 609 (1.7%) |
| $25,000 to $34,999 | 2,109 (7.2%) | 1,282 (3.6%) |
| $35,000 to $49,999 | 4,196 (14.4%) | 1,369 (3.9%) |
| $50,000 to $74,999 | 5,635 (19.4%) | 3,066 (8.6%) |
| $75,000 to $99,999 | 3,697 (12.7%) | 5,760 (16.2%) |
| $100,000 to $149,999 | 4,933 (17.0%) | 5,856 (16.5%) |
| $150,000 or more | 3,700 (12.7%) | 8,864 (25.0%) |
| Total | 29,090 (100.0%) | 35,460 (100.0%) |
Property Value to Household Income Ratio in Niagara County
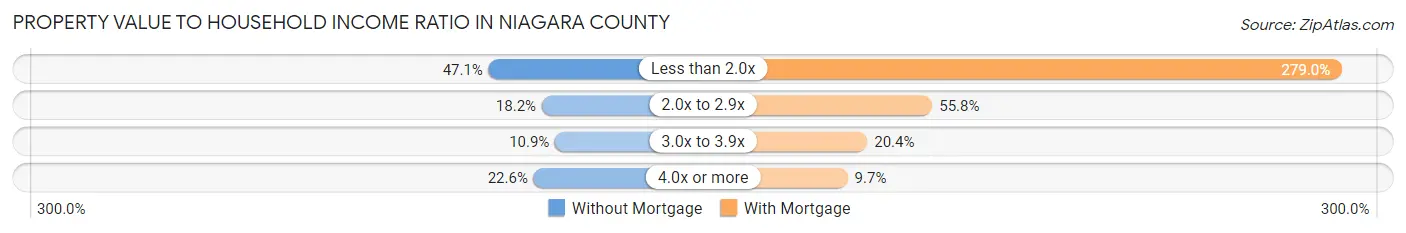
| Value-to-Income Ratio | Without Mortgage | With Mortgage |
| Less than 2.0x | 13,714 (47.1%) | 98,944 (279.0%) |
| 2.0x to 2.9x | 5,283 (18.2%) | 19,787 (55.8%) |
| 3.0x to 3.9x | 3,174 (10.9%) | 7,215 (20.3%) |
| 4.0x or more | 6,578 (22.6%) | 3,427 (9.7%) |
| Total | 29,090 (100.0%) | 35,460 (100.0%) |
Real Estate Taxes by Mortgage Status in Niagara County
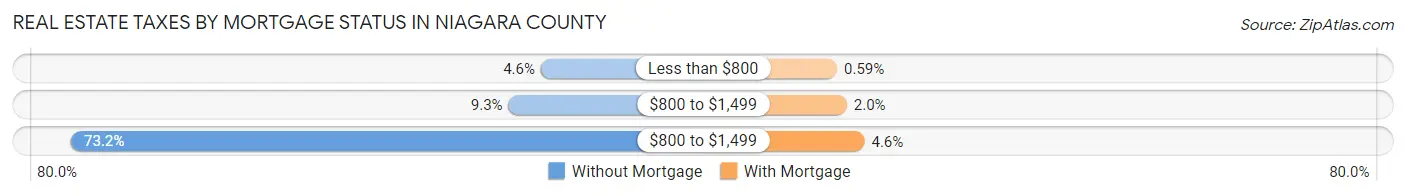
| Property Taxes | Without Mortgage | With Mortgage |
| Less than $800 | 1,330 (4.6%) | 210 (0.6%) |
| $800 to $1,499 | 2,706 (9.3%) | 716 (2.0%) |
| $800 to $1,499 | 21,297 (73.2%) | 1,632 (4.6%) |
| Total | 29,090 (100.0%) | 35,460 (100.0%) |
Health & Disability in Niagara County
Health Insurance Coverage by Age in Niagara County
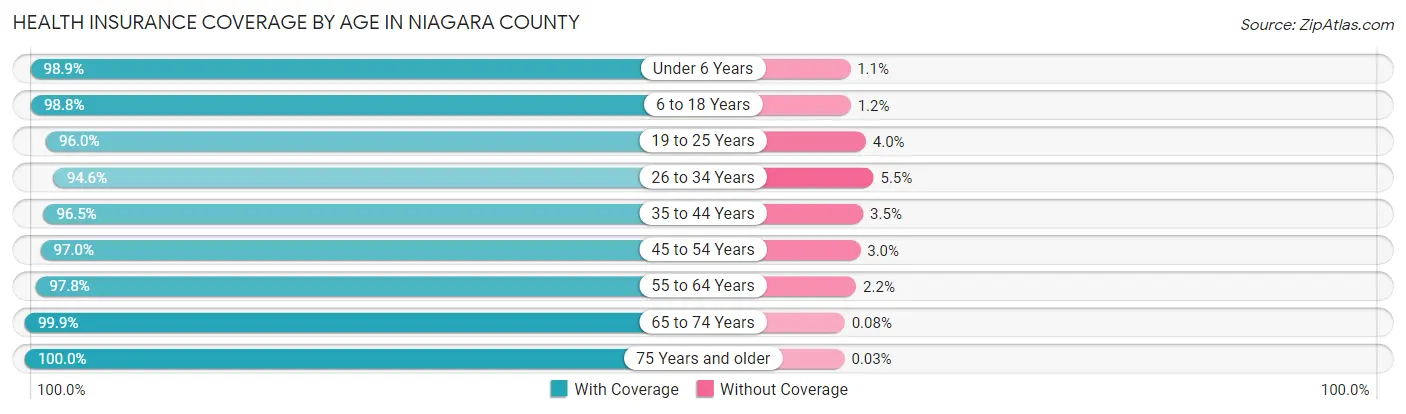
| Age Bracket | With Coverage | Without Coverage |
| Under 6 Years | 12,917 (98.9%) | 145 (1.1%) |
| 6 to 18 Years | 31,211 (98.8%) | 378 (1.2%) |
| 19 to 25 Years | 16,371 (96.0%) | 686 (4.0%) |
| 26 to 34 Years | 22,484 (94.6%) | 1,297 (5.4%) |
| 35 to 44 Years | 23,808 (96.5%) | 869 (3.5%) |
| 45 to 54 Years | 25,428 (97.0%) | 780 (3.0%) |
| 55 to 64 Years | 32,445 (97.8%) | 733 (2.2%) |
| 65 to 74 Years | 24,625 (99.9%) | 19 (0.1%) |
| 75 Years and older | 16,219 (100.0%) | 5 (0.0%) |
| Total | 205,508 (97.7%) | 4,912 (2.3%) |
Health Insurance Coverage by Citizenship Status in Niagara County
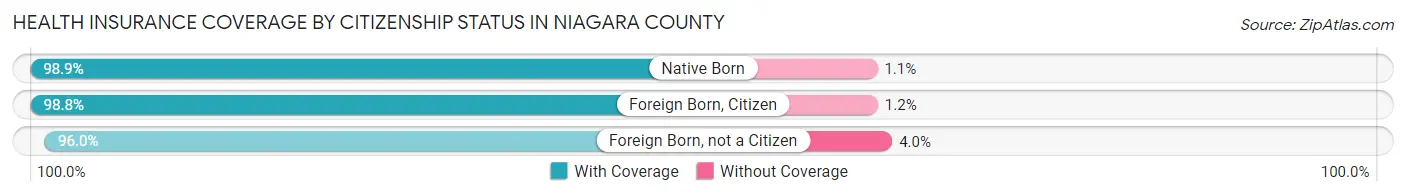
| Citizenship Status | With Coverage | Without Coverage |
| Native Born | 12,917 (98.9%) | 145 (1.1%) |
| Foreign Born, Citizen | 31,211 (98.8%) | 378 (1.2%) |
| Foreign Born, not a Citizen | 16,371 (96.0%) | 686 (4.0%) |
Health Insurance Coverage by Household Income in Niagara County
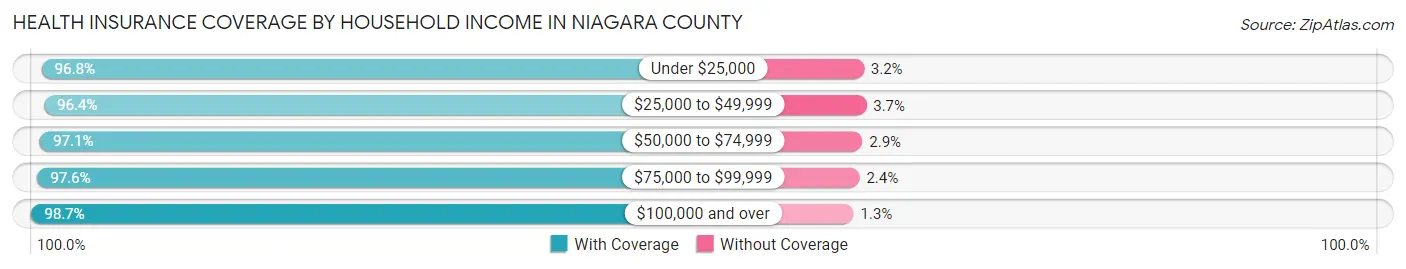
| Household Income | With Coverage | Without Coverage |
| Under $25,000 | 27,368 (96.8%) | 905 (3.2%) |
| $25,000 to $49,999 | 30,803 (96.4%) | 1,168 (3.6%) |
| $50,000 to $74,999 | 32,803 (97.1%) | 988 (2.9%) |
| $75,000 to $99,999 | 28,787 (97.6%) | 703 (2.4%) |
| $100,000 and over | 83,364 (98.7%) | 1,070 (1.3%) |
Public vs Private Health Insurance Coverage by Age in Niagara County
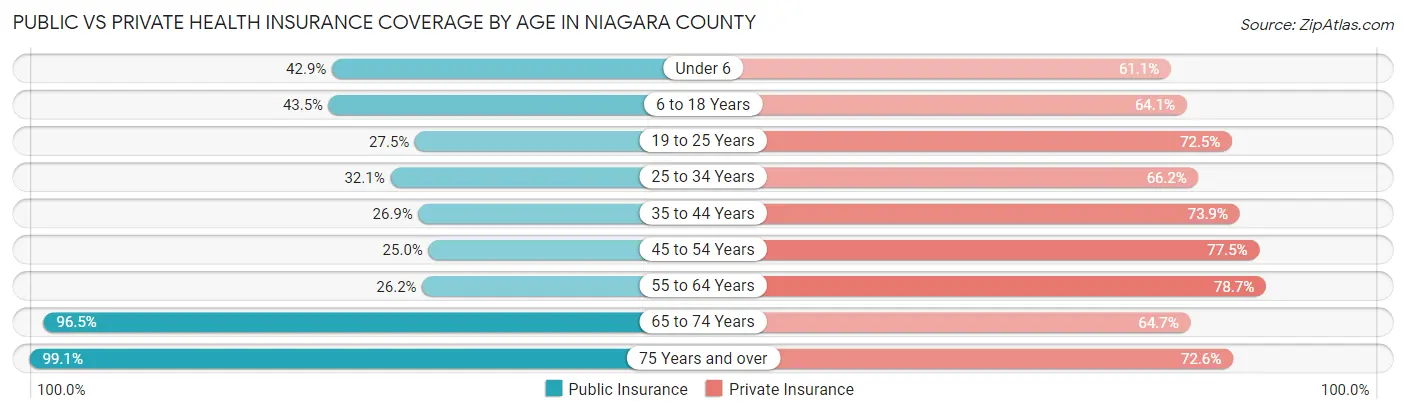
| Age Bracket | Public Insurance | Private Insurance |
| Under 6 | 5,605 (42.9%) | 7,981 (61.1%) |
| 6 to 18 Years | 13,744 (43.5%) | 20,237 (64.1%) |
| 19 to 25 Years | 4,693 (27.5%) | 12,360 (72.5%) |
| 25 to 34 Years | 7,632 (32.1%) | 15,752 (66.2%) |
| 35 to 44 Years | 6,630 (26.9%) | 18,232 (73.9%) |
| 45 to 54 Years | 6,552 (25.0%) | 20,315 (77.5%) |
| 55 to 64 Years | 8,679 (26.2%) | 26,123 (78.7%) |
| 65 to 74 Years | 23,782 (96.5%) | 15,950 (64.7%) |
| 75 Years and over | 16,077 (99.1%) | 11,781 (72.6%) |
| Total | 93,394 (44.4%) | 148,731 (70.7%) |
Disability Status by Sex by Age in Niagara County
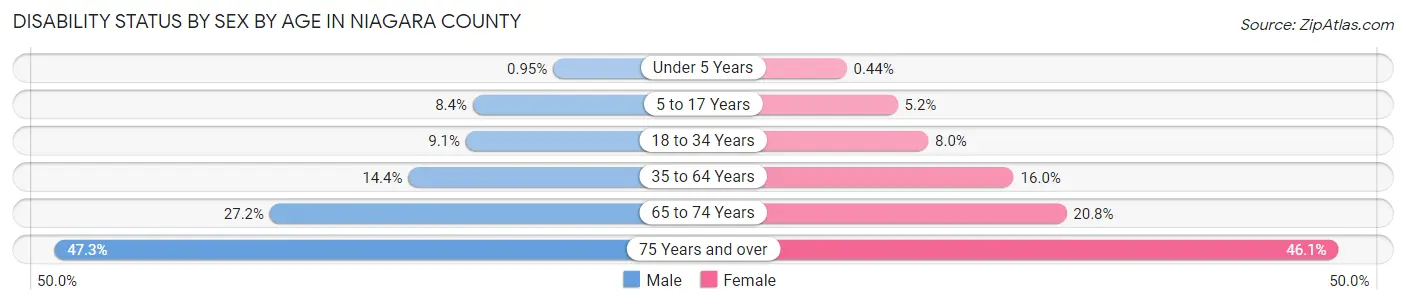
| Age Bracket | Male | Female |
| Under 5 Years | 51 (0.9%) | 24 (0.4%) |
| 5 to 17 Years | 1,333 (8.4%) | 797 (5.2%) |
| 18 to 34 Years | 1,988 (9.0%) | 1,719 (8.0%) |
| 35 to 64 Years | 5,983 (14.4%) | 6,778 (16.0%) |
| 65 to 74 Years | 3,282 (27.2%) | 2,625 (20.8%) |
| 75 Years and over | 3,101 (47.2%) | 4,453 (46.1%) |
Disability Class by Sex by Age in Niagara County
Disability Class: Hearing Difficulty
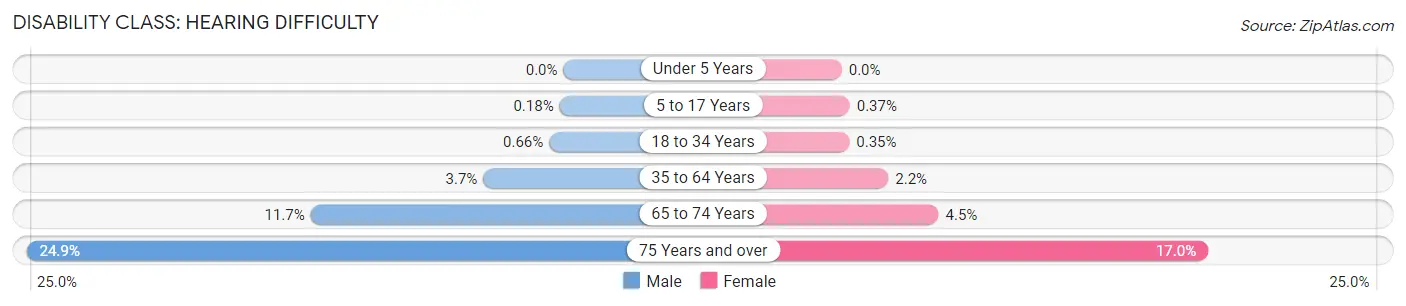
| Age Bracket | Male | Female |
| Under 5 Years | 0 (0.0%) | 0 (0.0%) |
| 5 to 17 Years | 29 (0.2%) | 57 (0.4%) |
| 18 to 34 Years | 145 (0.7%) | 76 (0.4%) |
| 35 to 64 Years | 1,545 (3.7%) | 919 (2.2%) |
| 65 to 74 Years | 1,414 (11.7%) | 566 (4.5%) |
| 75 Years and over | 1,635 (24.9%) | 1,641 (17.0%) |
Disability Class: Vision Difficulty
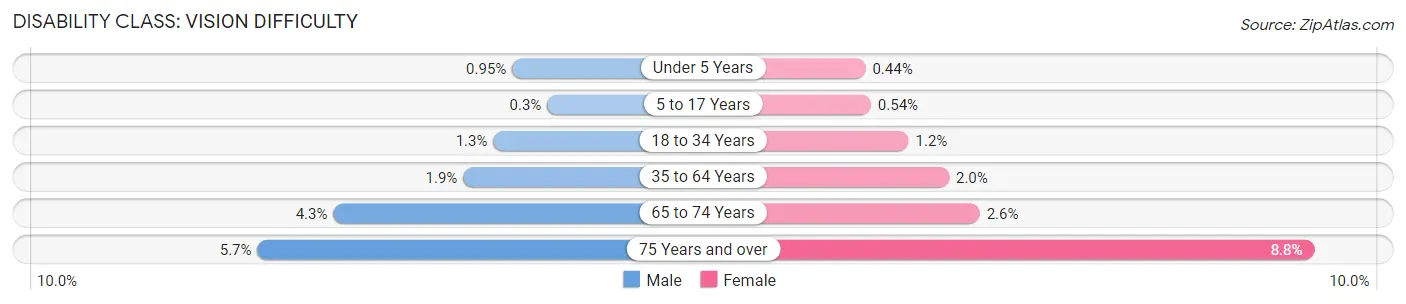
| Age Bracket | Male | Female |
| Under 5 Years | 51 (0.9%) | 24 (0.4%) |
| 5 to 17 Years | 48 (0.3%) | 83 (0.5%) |
| 18 to 34 Years | 285 (1.3%) | 267 (1.2%) |
| 35 to 64 Years | 775 (1.9%) | 846 (2.0%) |
| 65 to 74 Years | 515 (4.3%) | 322 (2.6%) |
| 75 Years and over | 373 (5.7%) | 847 (8.8%) |
Disability Class: Cognitive Difficulty
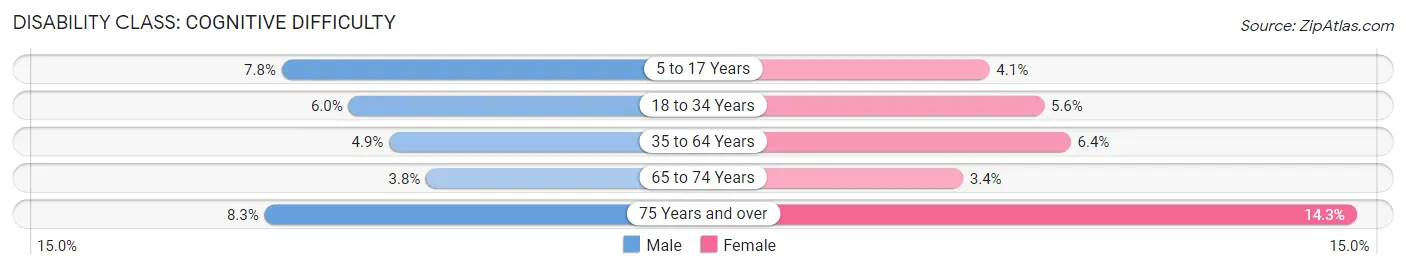
| Age Bracket | Male | Female |
| 5 to 17 Years | 1,244 (7.8%) | 633 (4.1%) |
| 18 to 34 Years | 1,313 (6.0%) | 1,209 (5.6%) |
| 35 to 64 Years | 2,016 (4.9%) | 2,707 (6.4%) |
| 65 to 74 Years | 460 (3.8%) | 425 (3.4%) |
| 75 Years and over | 546 (8.3%) | 1,384 (14.3%) |
Disability Class: Ambulatory Difficulty
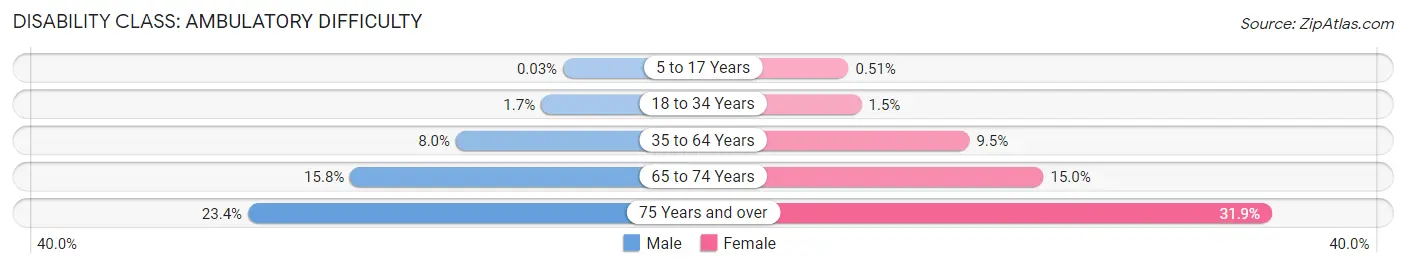
| Age Bracket | Male | Female |
| 5 to 17 Years | 4 (0.0%) | 79 (0.5%) |
| 18 to 34 Years | 365 (1.7%) | 316 (1.5%) |
| 35 to 64 Years | 3,316 (8.0%) | 4,026 (9.5%) |
| 65 to 74 Years | 1,908 (15.8%) | 1,887 (15.0%) |
| 75 Years and over | 1,537 (23.4%) | 3,085 (31.9%) |
Disability Class: Self-Care Difficulty
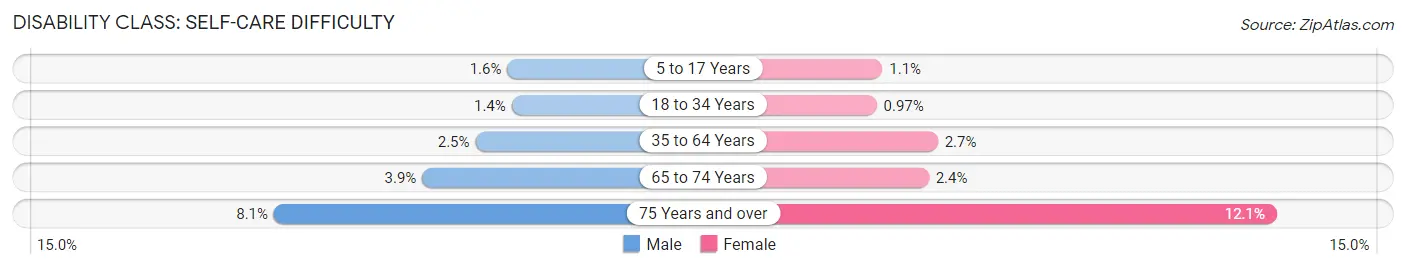
| Age Bracket | Male | Female |
| 5 to 17 Years | 248 (1.6%) | 174 (1.1%) |
| 18 to 34 Years | 316 (1.4%) | 208 (1.0%) |
| 35 to 64 Years | 1,019 (2.5%) | 1,135 (2.7%) |
| 65 to 74 Years | 474 (3.9%) | 305 (2.4%) |
| 75 Years and over | 529 (8.1%) | 1,170 (12.1%) |
Technology Access in Niagara County
Computing Device Access in Niagara County
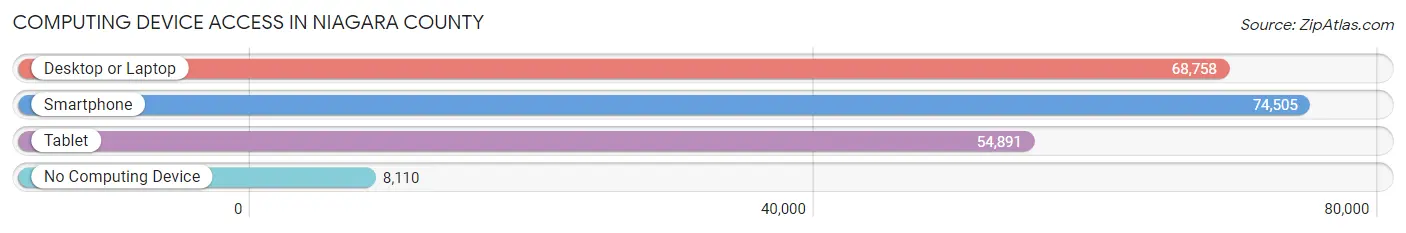
| Device Type | # Households | % Households |
| Desktop or Laptop | 68,758 | 75.6% |
| Smartphone | 74,505 | 81.9% |
| Tablet | 54,891 | 60.3% |
| No Computing Device | 8,110 | 8.9% |
| Total | 90,982 | 100.0% |
Internet Access in Niagara County
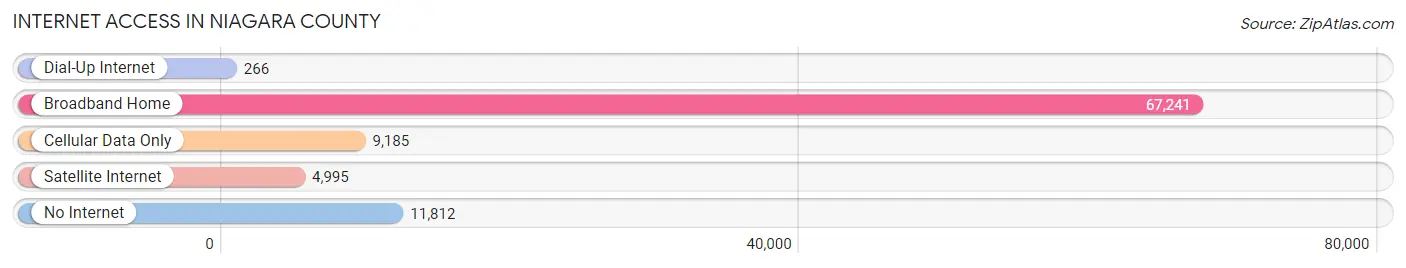
| Internet Type | # Households | % Households |
| Dial-Up Internet | 266 | 0.3% |
| Broadband Home | 67,241 | 73.9% |
| Cellular Data Only | 9,185 | 10.1% |
| Satellite Internet | 4,995 | 5.5% |
| No Internet | 11,812 | 13.0% |
| Total | 90,982 | 100.0% |
Niagara County Summary
Niagara County is located in the western part of New York State, along the Niagara River and Lake Ontario. It is bordered by Erie County to the east, Genesee County to the south, and Orleans County to the west. The county seat is Lockport, and the largest city is Niagara Falls. The county has a total area of 519 square miles, of which 498 square miles is land and 21 square miles is water.
History
The area that is now Niagara County was originally part of the Iroquois Confederacy, and was inhabited by the Neutral Nation and the Seneca Nation of the Iroquois. The first Europeans to settle in the area were the French, who established trading posts in the area in the late 17th century. The area was ceded to the British in 1763, and was part of the Phelps and Gorham Purchase in 1788.
In 1808, Niagara County was formed from part of Genesee County. The county was named after the Niagara River, which flows through the county. The county seat was originally located in Buffalo, but was moved to Lockport in 1823.
The county was an important center of the Underground Railroad, and was home to many abolitionists. During the Civil War, the county was a major supplier of troops for the Union Army.
Geography
Niagara County is located in the western part of New York State, along the Niagara River and Lake Ontario. It is bordered by Erie County to the east, Genesee County to the south, and Orleans County to the west. The county has a total area of 519 square miles, of which 498 square miles is land and 21 square miles is water.
The county is divided into two distinct regions: the Niagara Escarpment and the Niagara Frontier. The Niagara Escarpment is a ridge of land that runs along the eastern edge of the county, and is home to many of the county's most scenic areas. The Niagara Frontier is the western part of the county, and is home to the cities of Niagara Falls and Lockport.
The county is home to several state parks, including Niagara Falls State Park, Whirlpool State Park, and Four Mile Creek State Park.
Economy
Niagara County has a diverse economy, with a mix of manufacturing, agriculture, and tourism. The county is home to several major employers, including General Motors, Delphi Automotive, and Niagara Falls Memorial Medical Center.
Agriculture is an important part of the county's economy, with dairy farming and fruit production being the main industries. Tourism is also an important part of the economy, with Niagara Falls being the county's main tourist attraction.
Demographics
As of the 2010 census, the population of Niagara County was 216,469. The population is made up of a mix of races and ethnicities, with the largest group being White (87.3%), followed by African American (7.2%), Hispanic or Latino (3.2%), and Asian (1.3%).
The median household income in the county is $48,945, and the median family income is $58,945. The per capita income is $25,845. The poverty rate is 13.2%, and the unemployment rate is 8.2%.
Conclusion
Niagara County is located in the western part of New York State, along the Niagara River and Lake Ontario. It has a diverse economy, with a mix of manufacturing, agriculture, and tourism. The population is made up of a mix of races and ethnicities, with the largest group being White. The median household income in the county is $48,945, and the poverty rate is 13.2%. Niagara County is home to several state parks, and is an important center of the Underground Railroad.
Common Questions
What is Per Capita Income in Niagara County?
Per Capita income in Niagara County is $36,556.
What is the Median Family Income in Niagara County?
Median Family Income in Niagara County is $85,934.
What is the Median Household income in Niagara County?
Median Household Income in Niagara County is $65,882.
What is Income or Wage Gap in Niagara County?
Income or Wage Gap in Niagara County is 27.5%.
Women in Niagara County earn 72.5 cents for every dollar earned by a man.
What is Family Income Deficit in Niagara County?
Family Income Deficit in Niagara County is $11,254.
Families that are below poverty line in Niagara County earn $11,254 less on average than the poverty threshold level.
What is Inequality or Gini Index in Niagara County?
Inequality or Gini Index in Niagara County is 0.44.
What is the Total Population of Niagara County?
Total Population of Niagara County is 212,230.
What is the Total Male Population of Niagara County?
Total Male Population of Niagara County is 104,348.
What is the Total Female Population of Niagara County?
Total Female Population of Niagara County is 107,882.
What is the Ratio of Males per 100 Females in Niagara County?
There are 96.72 Males per 100 Females in Niagara County.
What is the Ratio of Females per 100 Males in Niagara County?
There are 103.39 Females per 100 Males in Niagara County.
What is the Median Population Age in Niagara County?
Median Population Age in Niagara County is 43.1 Years.
What is the Average Family Size in Niagara County
Average Family Size in Niagara County is 2.9 People.
What is the Average Household Size in Niagara County
Average Household Size in Niagara County is 2.3 People.
How Large is the Labor Force in Niagara County?
There are 106,863 People in the Labor Forcein in Niagara County.
What is the Percentage of People in the Labor Force in Niagara County?
60.9% of People are in the Labor Force in Niagara County.
What is the Unemployment Rate in Niagara County?
Unemployment Rate in Niagara County is 5.8%.