Livingston County, NY Map & Demographics
Livingston County Map
Livingston County Overview
$35,673
PER CAPITA INCOME
$89,466
AVG FAMILY INCOME
$70,443
AVG HOUSEHOLD INCOME
33.4%
WAGE / INCOME GAP [ % ]
66.6¢/ $1
WAGE / INCOME GAP [ $ ]
$12,918
FAMILY INCOME DEFICIT
0.43
INEQUALITY / GINI INDEX
61,980
TOTAL POPULATION
31,139
MALE POPULATION
30,841
FEMALE POPULATION
100.97
MALES / 100 FEMALES
99.04
FEMALES / 100 MALES
41.7
MEDIAN AGE
2.9
AVG FAMILY SIZE
2.4
AVG HOUSEHOLD SIZE
30,356
LABOR FORCE [ PEOPLE ]
58.1%
PERCENT IN LABOR FORCE
4.7%
UNEMPLOYMENT RATE
Livingston County Area Codes
Income in Livingston County
Income Overview in Livingston County
Per Capita Income in Livingston County is $35,673, while median incomes of families and households are $89,466 and $70,443 respectively.
| Characteristic | Number | Measure |
| Per Capita Income | 61,980 | $35,673 |
| Median Family Income | 15,076 | $89,466 |
| Mean Family Income | 15,076 | $105,726 |
| Median Household Income | 24,071 | $70,443 |
| Mean Household Income | 24,071 | $89,669 |
| Income Deficit | 15,076 | $12,918 |
| Wage / Income Gap (%) | 61,980 | 33.44% |
| Wage / Income Gap ($) | 61,980 | 66.56¢ per $1 |
| Gini / Inequality Index | 61,980 | 0.43 |
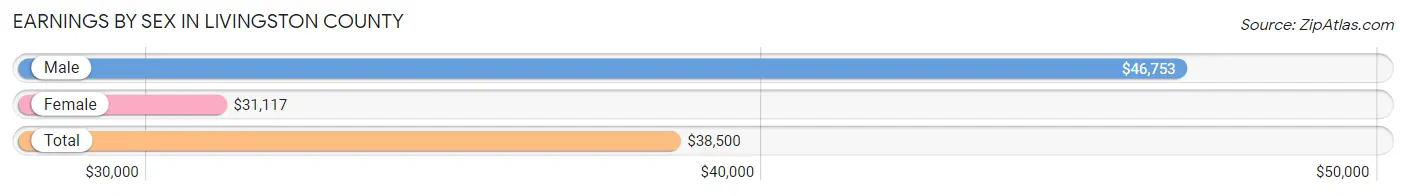
Earnings by Sex in Livingston County
Average Earnings in Livingston County are $38,500, $46,753 for men and $31,117 for women, a difference of 33.4%.
| Sex | Number | Average Earnings |
| Male | 16,720 (50.9%) | $46,753 |
| Female | 16,137 (49.1%) | $31,117 |
| Total | 32,857 (100.0%) | $38,500 |
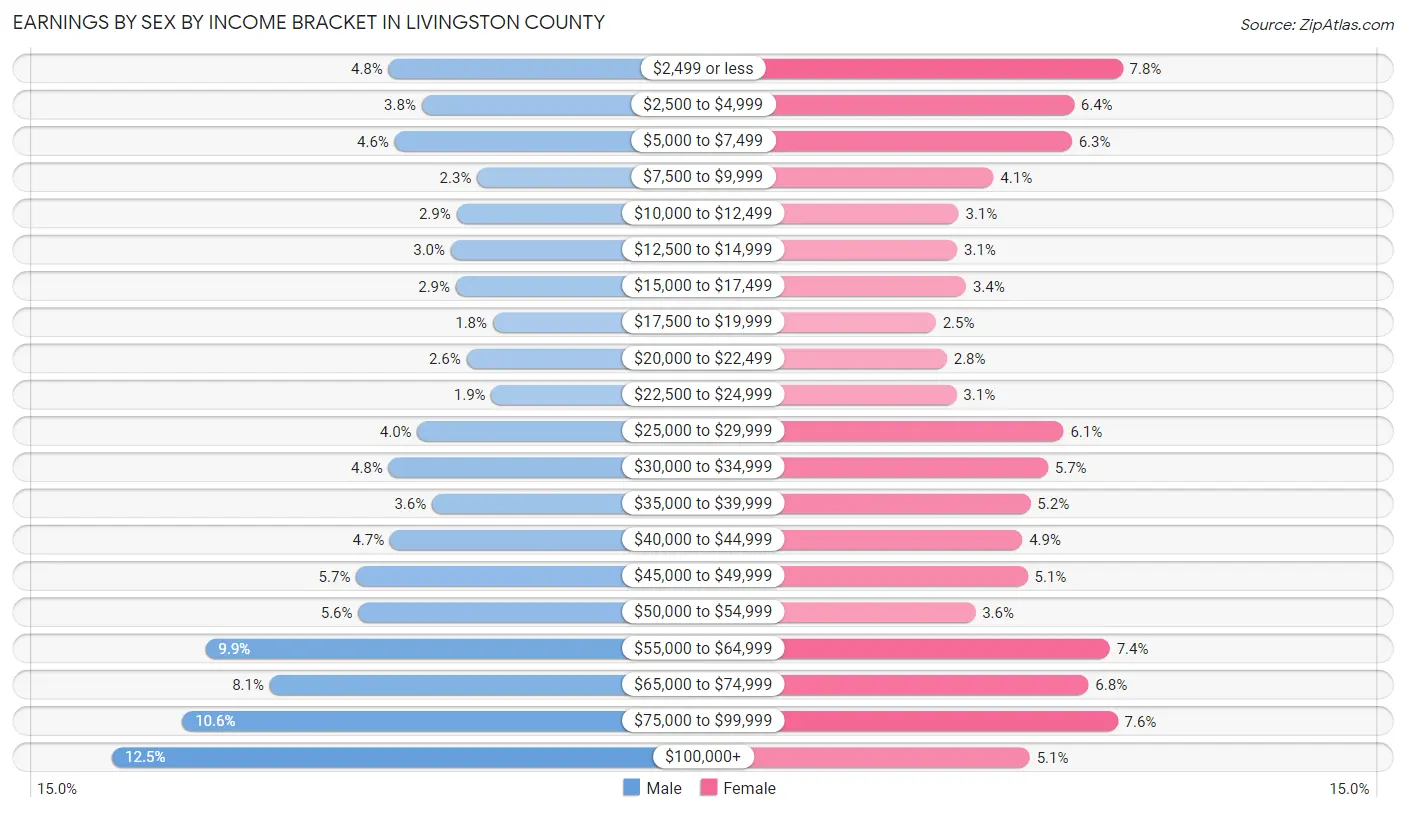
Earnings by Sex by Income Bracket in Livingston County
The most common earnings brackets in Livingston County are $100,000+ for men (2,096 | 12.5%) and $2,499 or less for women (1,250 | 7.7%).
| Income | Male | Female |
| $2,499 or less | 797 (4.8%) | 1,250 (7.7%) |
| $2,500 to $4,999 | 642 (3.8%) | 1,030 (6.4%) |
| $5,000 to $7,499 | 769 (4.6%) | 1,020 (6.3%) |
| $7,500 to $9,999 | 381 (2.3%) | 665 (4.1%) |
| $10,000 to $12,499 | 479 (2.9%) | 507 (3.1%) |
| $12,500 to $14,999 | 505 (3.0%) | 501 (3.1%) |
| $15,000 to $17,499 | 481 (2.9%) | 541 (3.4%) |
| $17,500 to $19,999 | 308 (1.8%) | 404 (2.5%) |
| $20,000 to $22,499 | 432 (2.6%) | 453 (2.8%) |
| $22,500 to $24,999 | 315 (1.9%) | 497 (3.1%) |
| $25,000 to $29,999 | 662 (4.0%) | 983 (6.1%) |
| $30,000 to $34,999 | 797 (4.8%) | 911 (5.7%) |
| $35,000 to $39,999 | 593 (3.5%) | 832 (5.2%) |
| $40,000 to $44,999 | 791 (4.7%) | 796 (4.9%) |
| $45,000 to $49,999 | 949 (5.7%) | 820 (5.1%) |
| $50,000 to $54,999 | 940 (5.6%) | 582 (3.6%) |
| $55,000 to $64,999 | 1,659 (9.9%) | 1,192 (7.4%) |
| $65,000 to $74,999 | 1,356 (8.1%) | 1,096 (6.8%) |
| $75,000 to $99,999 | 1,768 (10.6%) | 1,228 (7.6%) |
| $100,000+ | 2,096 (12.5%) | 829 (5.1%) |
| Total | 16,720 (100.0%) | 16,137 (100.0%) |
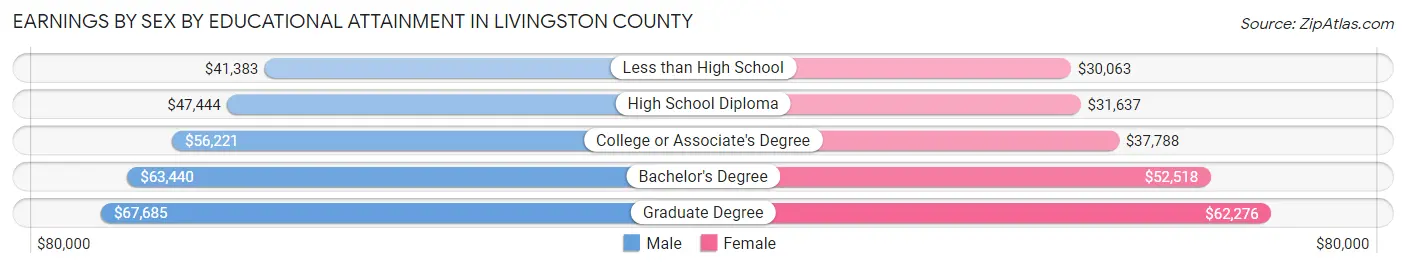
Earnings by Sex by Educational Attainment in Livingston County
Average earnings in Livingston County are $54,377 for men and $41,631 for women, a difference of 23.4%. Men with an educational attainment of graduate degree enjoy the highest average annual earnings of $67,685, while those with less than high school education earn the least with $41,383. Women with an educational attainment of graduate degree earn the most with the average annual earnings of $62,276, while those with less than high school education have the smallest earnings of $30,063.
| Educational Attainment | Male Income | Female Income |
| Less than High School | $41,383 | $30,063 |
| High School Diploma | $47,444 | $31,637 |
| College or Associate's Degree | $56,221 | $37,788 |
| Bachelor's Degree | $63,440 | $52,518 |
| Graduate Degree | $67,685 | $62,276 |
| Total | $54,377 | $41,631 |
Family Income in Livingston County
Family Income Brackets in Livingston County
According to the Livingston County family income data, there are 3,875 families falling into the $100,000 to $149,999 income range, which is the most common income bracket and makes up 25.7% of all families. Conversely, the $10,000 to $14,999 income bracket is the least frequent group with only 181 families (1.2%) belonging to this category.
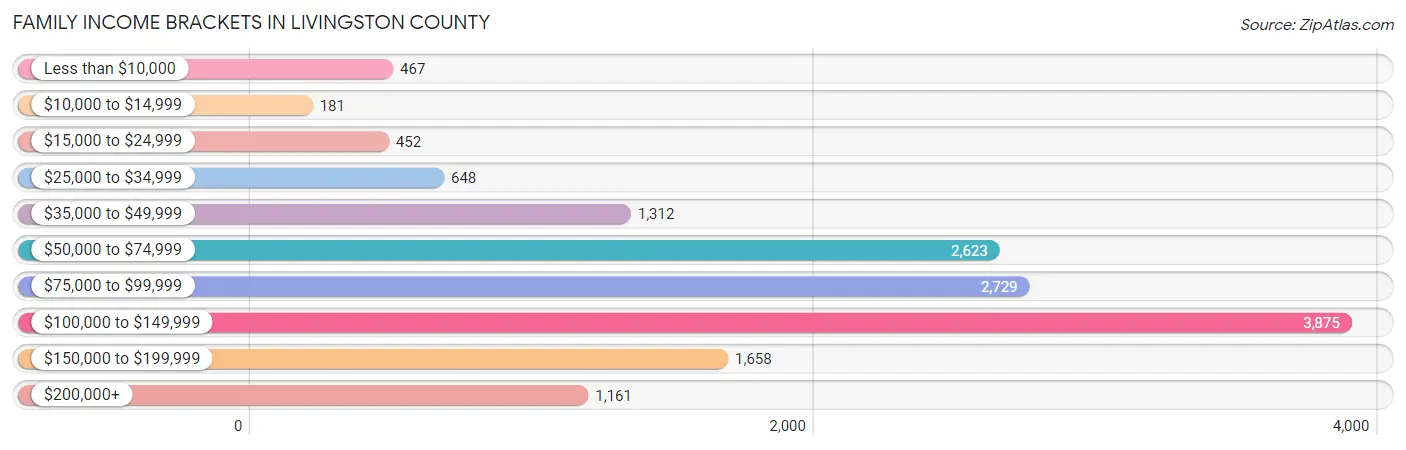
| Income Bracket | # Families | % Families |
| Less than $10,000 | 467 | 3.1% |
| $10,000 to $14,999 | 181 | 1.2% |
| $15,000 to $24,999 | 452 | 3.0% |
| $25,000 to $34,999 | 648 | 4.3% |
| $35,000 to $49,999 | 1,312 | 8.7% |
| $50,000 to $74,999 | 2,623 | 17.4% |
| $75,000 to $99,999 | 2,729 | 18.1% |
| $100,000 to $149,999 | 3,875 | 25.7% |
| $150,000 to $199,999 | 1,658 | 11.0% |
| $200,000+ | 1,161 | 7.7% |
Family Income by Famaliy Size in Livingston County
5-person families (830 | 5.5%) account for the highest median family income in Livingston County with $129,028 per family, while 2-person families (8,118 | 53.8%) have the highest median income of $39,948 per family member.
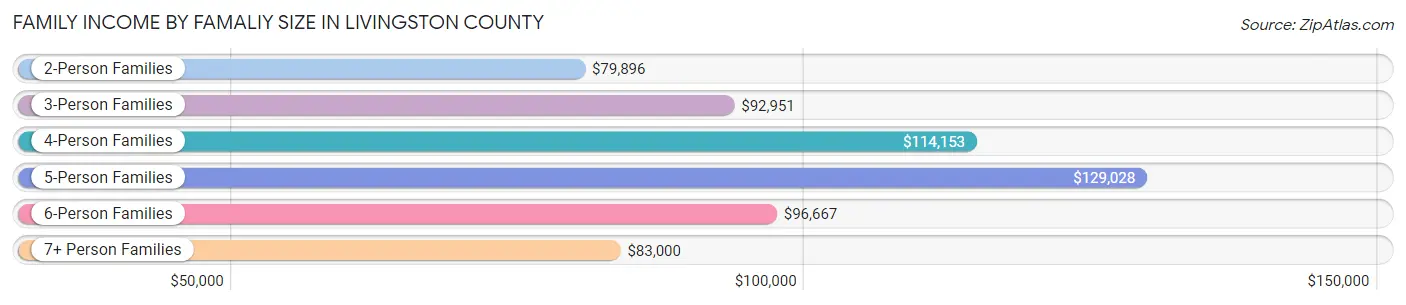
| Income Bracket | # Families | Median Income |
| 2-Person Families | 8,118 (53.8%) | $79,896 |
| 3-Person Families | 3,333 (22.1%) | $92,951 |
| 4-Person Families | 2,377 (15.8%) | $114,153 |
| 5-Person Families | 830 (5.5%) | $129,028 |
| 6-Person Families | 230 (1.5%) | $96,667 |
| 7+ Person Families | 188 (1.3%) | $83,000 |
| Total | 15,076 (100.0%) | $89,466 |
Family Income by Number of Earners in Livingston County
The median family income in Livingston County is $89,466, with families comprising 3+ earners (1,783) having the highest median family income of $135,456, while families with no earners (2,831) have the lowest median family income of $55,202, accounting for 11.8% and 18.8% of families, respectively.
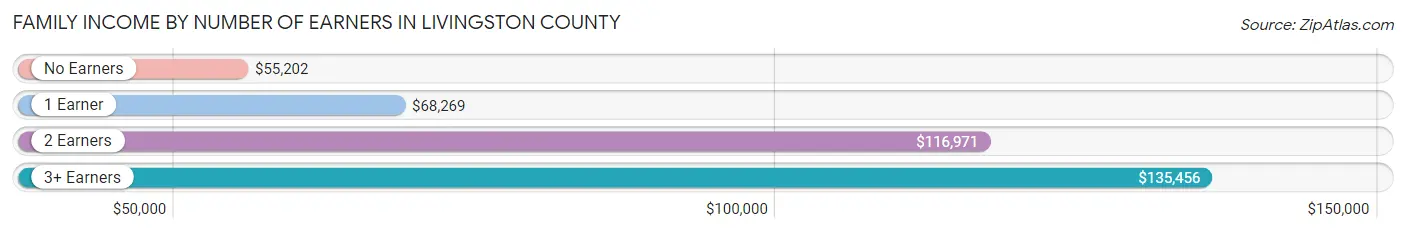
| Number of Earners | # Families | Median Income |
| No Earners | 2,831 (18.8%) | $55,202 |
| 1 Earner | 4,518 (30.0%) | $68,269 |
| 2 Earners | 5,944 (39.4%) | $116,971 |
| 3+ Earners | 1,783 (11.8%) | $135,456 |
| Total | 15,076 (100.0%) | $89,466 |
Household Income in Livingston County
Household Income Brackets in Livingston County
With 4,670 households falling in the category, the $100,000 to $149,999 income range is the most frequent in Livingston County, accounting for 19.4% of all households. In contrast, only 698 households (2.9%) fall into the $10,000 to $14,999 income bracket, making it the least populous group.
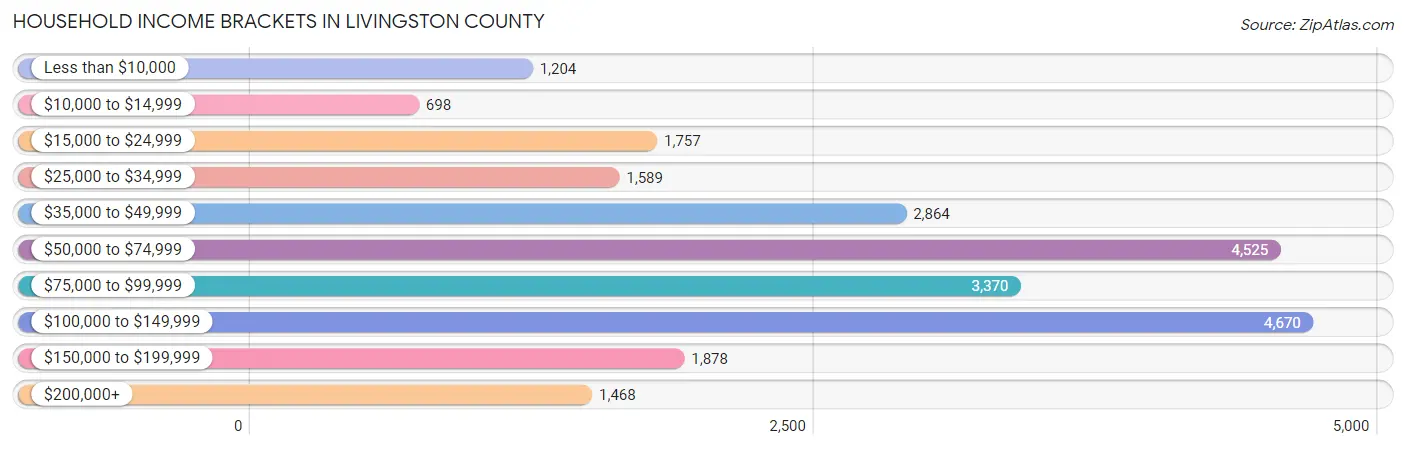
| Income Bracket | # Households | % Households |
| Less than $10,000 | 1,204 | 5.0% |
| $10,000 to $14,999 | 698 | 2.9% |
| $15,000 to $24,999 | 1,757 | 7.3% |
| $25,000 to $34,999 | 1,589 | 6.6% |
| $35,000 to $49,999 | 2,864 | 11.9% |
| $50,000 to $74,999 | 4,525 | 18.8% |
| $75,000 to $99,999 | 3,370 | 14.0% |
| $100,000 to $149,999 | 4,670 | 19.4% |
| $150,000 to $199,999 | 1,878 | 7.8% |
| $200,000+ | 1,468 | 6.1% |
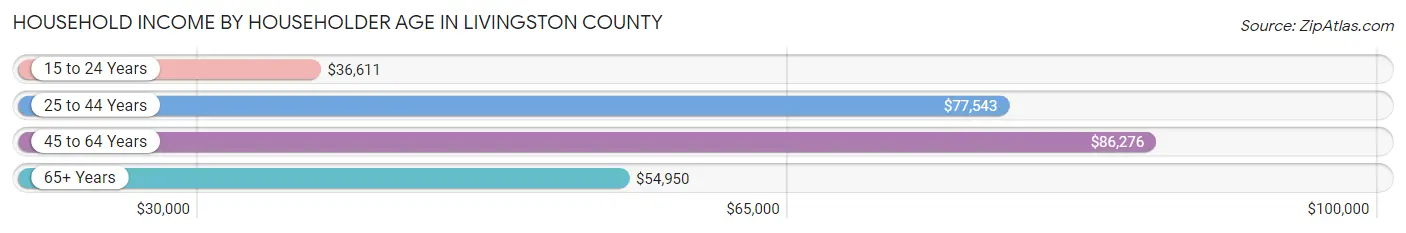
Household Income by Householder Age in Livingston County
The median household income in Livingston County is $70,443, with the highest median household income of $86,276 found in the 45 to 64 years age bracket for the primary householder. A total of 9,499 households (39.5%) fall into this category. Meanwhile, the 15 to 24 years age bracket for the primary householder has the lowest median household income of $36,611, with 955 households (4.0%) in this group.
| Income Bracket | # Households | Median Income |
| 15 to 24 Years | 955 (4.0%) | $36,611 |
| 25 to 44 Years | 6,329 (26.3%) | $77,543 |
| 45 to 64 Years | 9,499 (39.5%) | $86,276 |
| 65+ Years | 7,288 (30.3%) | $54,950 |
| Total | 24,071 (100.0%) | $70,443 |
Poverty in Livingston County
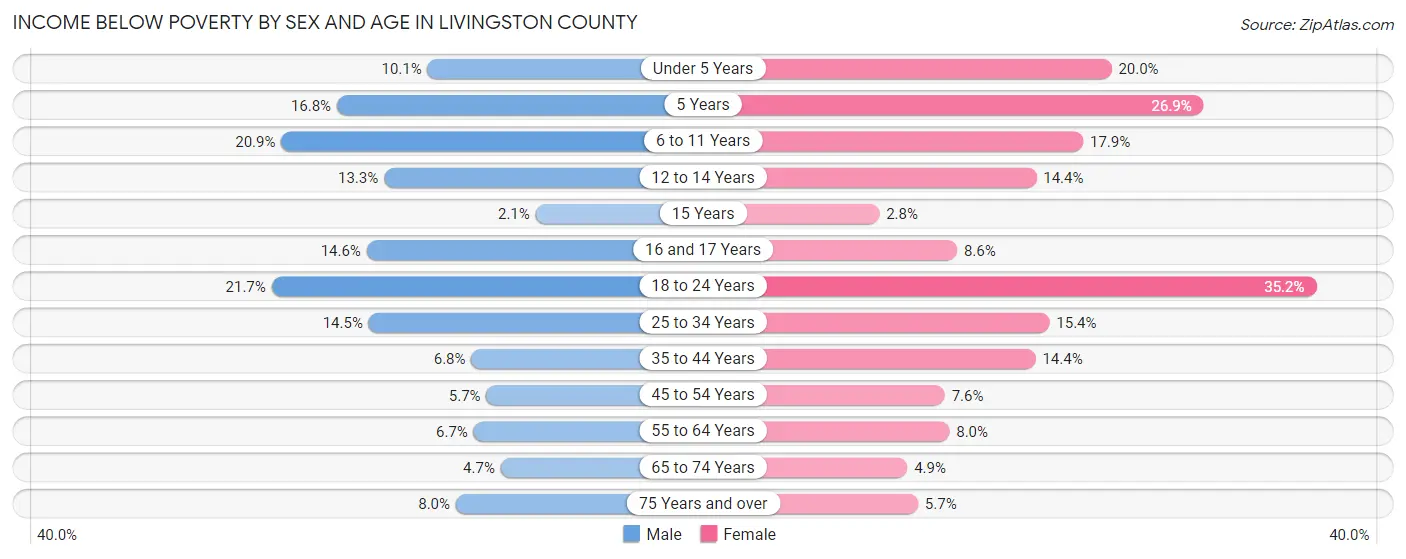
Income Below Poverty by Sex and Age in Livingston County
With 10.4% poverty level for males and 13.0% for females among the residents of Livingston County, 18 to 24 year old males and 18 to 24 year old females are the most vulnerable to poverty, with 633 males (21.7%) and 1,003 females (35.2%) in their respective age groups living below the poverty level.
| Age Bracket | Male | Female |
| Under 5 Years | 140 (10.1%) | 246 (20.0%) |
| 5 Years | 57 (16.8%) | 94 (26.9%) |
| 6 to 11 Years | 404 (20.9%) | 277 (17.9%) |
| 12 to 14 Years | 128 (13.3%) | 146 (14.4%) |
| 15 Years | 7 (2.1%) | 12 (2.8%) |
| 16 and 17 Years | 100 (14.6%) | 52 (8.6%) |
| 18 to 24 Years | 633 (21.7%) | 1,003 (35.2%) |
| 25 to 34 Years | 458 (14.4%) | 451 (15.4%) |
| 35 to 44 Years | 221 (6.8%) | 445 (14.4%) |
| 45 to 54 Years | 206 (5.7%) | 275 (7.6%) |
| 55 to 64 Years | 303 (6.7%) | 381 (8.0%) |
| 65 to 74 Years | 157 (4.6%) | 172 (4.9%) |
| 75 Years and over | 156 (8.0%) | 143 (5.7%) |
| Total | 2,970 (10.4%) | 3,697 (13.0%) |
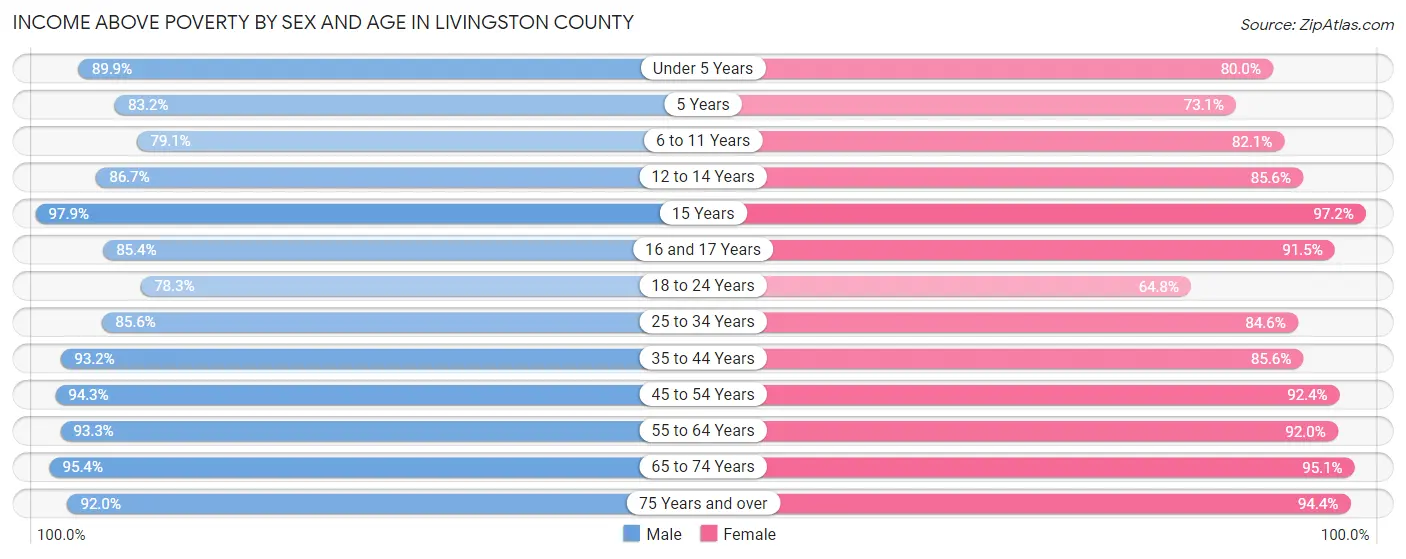
Income Above Poverty by Sex and Age in Livingston County
According to the poverty statistics in Livingston County, males aged 15 years and females aged 15 years are the age groups that are most secure financially, with 97.9% of males and 97.2% of females in these age groups living above the poverty line.
| Age Bracket | Male | Female |
| Under 5 Years | 1,249 (89.9%) | 983 (80.0%) |
| 5 Years | 282 (83.2%) | 256 (73.1%) |
| 6 to 11 Years | 1,525 (79.1%) | 1,270 (82.1%) |
| 12 to 14 Years | 834 (86.7%) | 865 (85.6%) |
| 15 Years | 332 (97.9%) | 420 (97.2%) |
| 16 and 17 Years | 585 (85.4%) | 556 (91.4%) |
| 18 to 24 Years | 2,290 (78.3%) | 1,844 (64.8%) |
| 25 to 34 Years | 2,712 (85.6%) | 2,475 (84.6%) |
| 35 to 44 Years | 3,014 (93.2%) | 2,650 (85.6%) |
| 45 to 54 Years | 3,402 (94.3%) | 3,324 (92.4%) |
| 55 to 64 Years | 4,245 (93.3%) | 4,393 (92.0%) |
| 65 to 74 Years | 3,221 (95.4%) | 3,368 (95.1%) |
| 75 Years and over | 1,798 (92.0%) | 2,387 (94.4%) |
| Total | 25,489 (89.6%) | 24,791 (87.0%) |
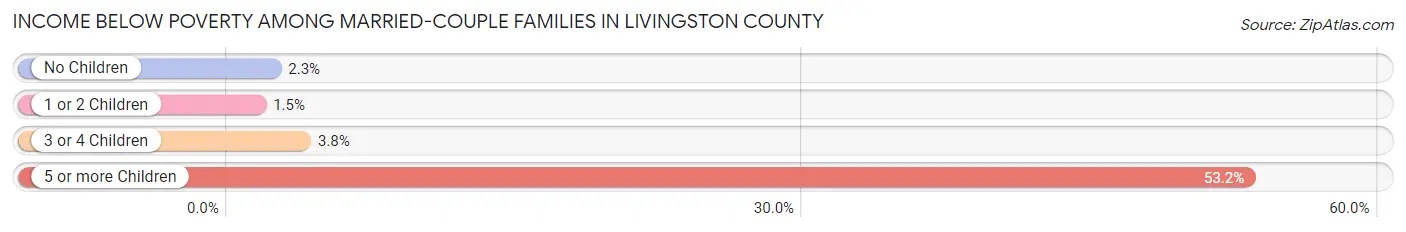
Income Below Poverty Among Married-Couple Families in Livingston County
The poverty statistics for married-couple families in Livingston County show that 2.7% or 317 of the total 11,728 families live below the poverty line. Families with 5 or more children have the highest poverty rate of 53.2%, comprising of 67 families. On the other hand, families with 1 or 2 children have the lowest poverty rate of 1.5%, which includes 43 families.
| Children | Above Poverty | Below Poverty |
| No Children | 7,787 (97.7%) | 180 (2.3%) |
| 1 or 2 Children | 2,883 (98.5%) | 43 (1.5%) |
| 3 or 4 Children | 682 (96.2%) | 27 (3.8%) |
| 5 or more Children | 59 (46.8%) | 67 (53.2%) |
| Total | 11,411 (97.3%) | 317 (2.7%) |
Income Below Poverty Among Single-Parent Households in Livingston County
According to the poverty data in Livingston County, 7.0% or 71 single-father households and 23.0% or 535 single-mother households are living below the poverty line. Among single-father households, those with no children have the highest poverty rate, with 43 households (10.1%) experiencing poverty. Likewise, among single-mother households, those with 3 or 4 children have the highest poverty rate, with 57 households (35.8%) falling below the poverty line.
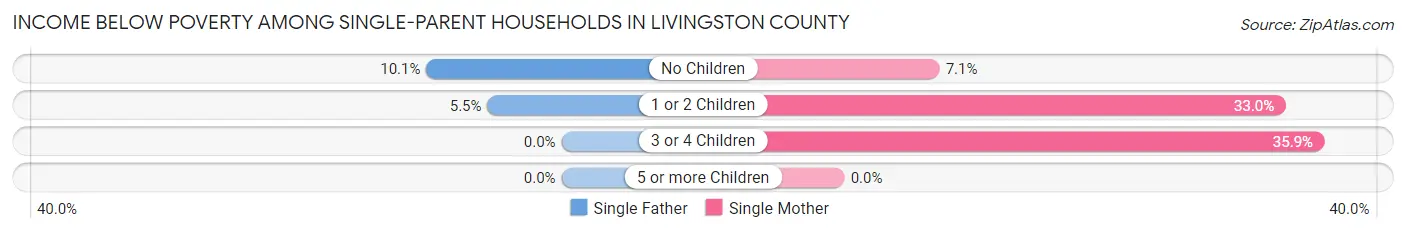
| Children | Single Father | Single Mother |
| No Children | 43 (10.1%) | 65 (7.1%) |
| 1 or 2 Children | 28 (5.5%) | 413 (33.0%) |
| 3 or 4 Children | 0 (0.0%) | 57 (35.8%) |
| 5 or more Children | 0 (0.0%) | 0 (0.0%) |
| Total | 71 (7.0%) | 535 (23.0%) |
Income Below Poverty Among Married-Couple vs Single-Parent Households in Livingston County
The poverty data for Livingston County shows that 317 of the married-couple family households (2.7%) and 606 of the single-parent households (18.1%) are living below the poverty level. Within the married-couple family households, those with 5 or more children have the highest poverty rate, with 67 households (53.2%) falling below the poverty line. Among the single-parent households, those with 1 or 2 children have the highest poverty rate, with 441 household (25.1%) living below poverty.
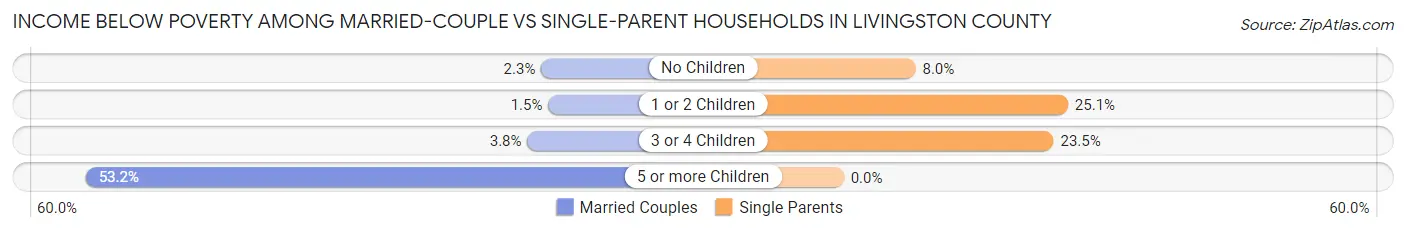
| Children | Married-Couple Families | Single-Parent Households |
| No Children | 180 (2.3%) | 108 (8.0%) |
| 1 or 2 Children | 43 (1.5%) | 441 (25.1%) |
| 3 or 4 Children | 27 (3.8%) | 57 (23.5%) |
| 5 or more Children | 67 (53.2%) | 0 (0.0%) |
| Total | 317 (2.7%) | 606 (18.1%) |
Race in Livingston County
The most populous races in Livingston County are White / Caucasian (56,557 | 91.2%), Two or more Races (2,473 | 4.0%), and Hispanic or Latino (2,417 | 3.9%).
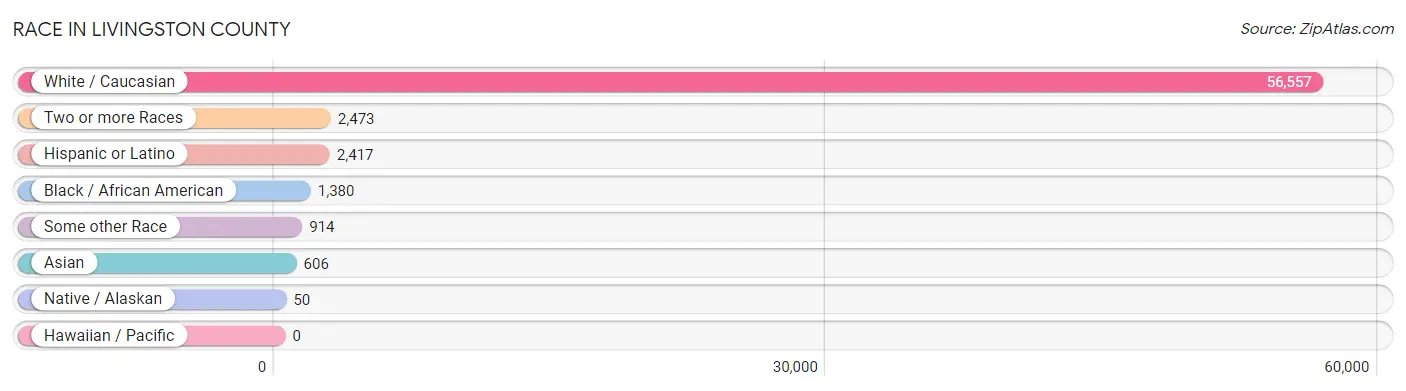
| Race | # Population | % Population |
| Asian | 606 | 1.0% |
| Black / African American | 1,380 | 2.2% |
| Hawaiian / Pacific | 0 | 0.0% |
| Hispanic or Latino | 2,417 | 3.9% |
| Native / Alaskan | 50 | 0.1% |
| White / Caucasian | 56,557 | 91.2% |
| Two or more Races | 2,473 | 4.0% |
| Some other Race | 914 | 1.5% |
| Total | 61,980 | 100.0% |
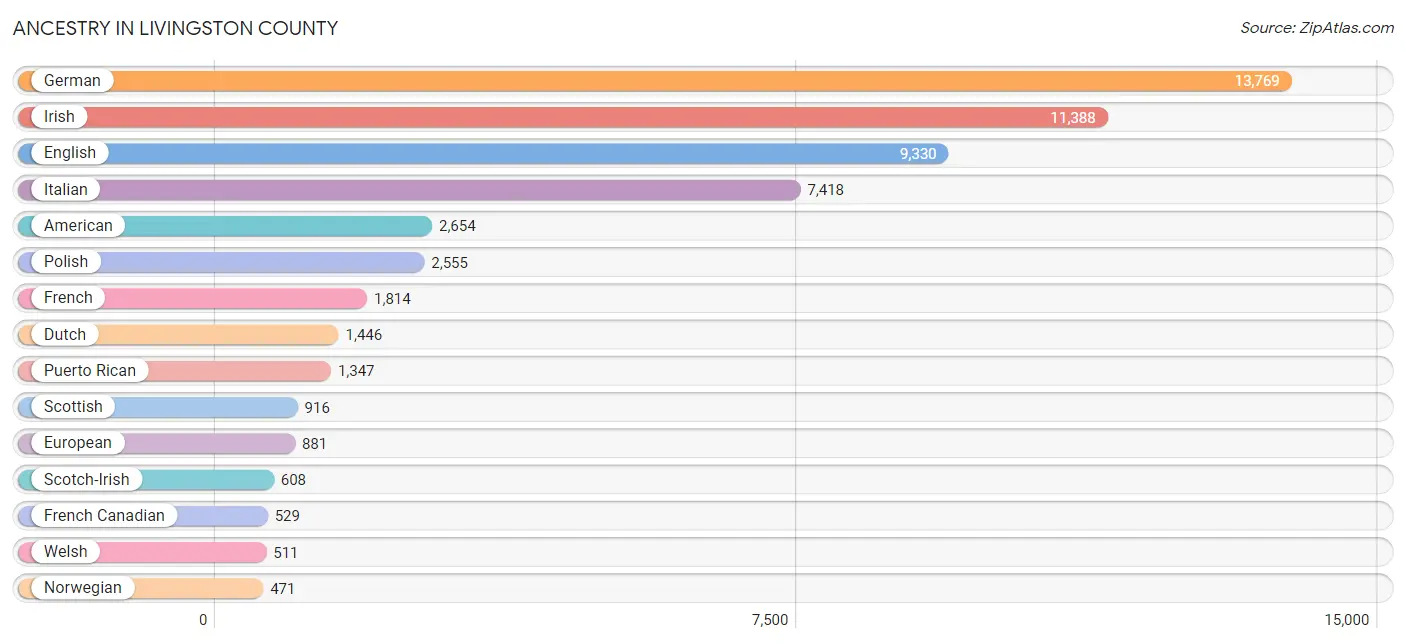
Ancestry in Livingston County
The most populous ancestries reported in Livingston County are German (13,769 | 22.2%), Irish (11,388 | 18.4%), English (9,330 | 15.0%), Italian (7,418 | 12.0%), and American (2,654 | 4.3%), together accounting for 71.9% of all Livingston County residents.
| Ancestry | # Population | % Population |
| Afghan | 102 | 0.2% |
| African | 117 | 0.2% |
| Alsatian | 6 | 0.0% |
| American | 2,654 | 4.3% |
| Arab | 77 | 0.1% |
| Argentinean | 4 | 0.0% |
| Armenian | 91 | 0.2% |
| Austrian | 218 | 0.4% |
| Belgian | 54 | 0.1% |
| Belizean | 20 | 0.0% |
| Bhutanese | 149 | 0.2% |
| Blackfeet | 14 | 0.0% |
| Brazilian | 1 | 0.0% |
| British | 283 | 0.5% |
| Bulgarian | 15 | 0.0% |
| Burmese | 209 | 0.3% |
| Cajun | 24 | 0.0% |
| Canadian | 120 | 0.2% |
| Celtic | 24 | 0.0% |
| Central American | 95 | 0.2% |
| Central American Indian | 26 | 0.0% |
| Cherokee | 8 | 0.0% |
| Chilean | 11 | 0.0% |
| Chippewa | 3 | 0.0% |
| Colombian | 13 | 0.0% |
| Comanche | 7 | 0.0% |
| Costa Rican | 4 | 0.0% |
| Cree | 5 | 0.0% |
| Croatian | 18 | 0.0% |
| Crow | 3 | 0.0% |
| Cuban | 50 | 0.1% |
| Czech | 65 | 0.1% |
| Czechoslovakian | 123 | 0.2% |
| Danish | 61 | 0.1% |
| Dominican | 112 | 0.2% |
| Dutch | 1,446 | 2.3% |
| Eastern European | 228 | 0.4% |
| Ecuadorian | 4 | 0.0% |
| Egyptian | 20 | 0.0% |
| English | 9,330 | 15.0% |
| Estonian | 18 | 0.0% |
| Ethiopian | 3 | 0.0% |
| European | 881 | 1.4% |
| Finnish | 36 | 0.1% |
| French | 1,814 | 2.9% |
| French American Indian | 4 | 0.0% |
| French Canadian | 529 | 0.9% |
| German | 13,769 | 22.2% |
| Greek | 162 | 0.3% |
| Guatemalan | 34 | 0.1% |
| Haitian | 10 | 0.0% |
| Hopi | 17 | 0.0% |
| Hungarian | 140 | 0.2% |
| Icelander | 37 | 0.1% |
| Indian (Asian) | 97 | 0.2% |
| Irish | 11,388 | 18.4% |
| Iroquois | 103 | 0.2% |
| Israeli | 99 | 0.2% |
| Italian | 7,418 | 12.0% |
| Jamaican | 41 | 0.1% |
| Jordanian | 4 | 0.0% |
| Korean | 215 | 0.4% |
| Laotian | 8 | 0.0% |
| Lebanese | 14 | 0.0% |
| Lithuanian | 69 | 0.1% |
| Macedonian | 15 | 0.0% |
| Malaysian | 14 | 0.0% |
| Mexican | 296 | 0.5% |
| Mongolian | 10 | 0.0% |
| Native Hawaiian | 37 | 0.1% |
| Nigerian | 9 | 0.0% |
| Northern European | 85 | 0.1% |
| Norwegian | 471 | 0.8% |
| Panamanian | 20 | 0.0% |
| Paraguayan | 8 | 0.0% |
| Pennsylvania German | 162 | 0.3% |
| Peruvian | 3 | 0.0% |
| Polish | 2,555 | 4.1% |
| Portuguese | 125 | 0.2% |
| Puerto Rican | 1,347 | 2.2% |
| Romanian | 20 | 0.0% |
| Russian | 121 | 0.2% |
| Salvadoran | 37 | 0.1% |
| Scandinavian | 60 | 0.1% |
| Scotch-Irish | 608 | 1.0% |
| Scottish | 916 | 1.5% |
| Sioux | 28 | 0.1% |
| Slavic | 7 | 0.0% |
| Slovak | 30 | 0.1% |
| Slovene | 51 | 0.1% |
| South African | 1 | 0.0% |
| South American | 70 | 0.1% |
| Spaniard | 107 | 0.2% |
| Spanish | 14 | 0.0% |
| Sri Lankan | 169 | 0.3% |
| Subsaharan African | 138 | 0.2% |
| Swedish | 440 | 0.7% |
| Swiss | 186 | 0.3% |
| Syrian | 32 | 0.1% |
| Thai | 117 | 0.2% |
| Trinidadian and Tobagonian | 2 | 0.0% |
| Turkish | 39 | 0.1% |
| Ukrainian | 207 | 0.3% |
| Vietnamese | 18 | 0.0% |
| Welsh | 511 | 0.8% |
| West Indian | 8 | 0.0% | View All 106 Rows |
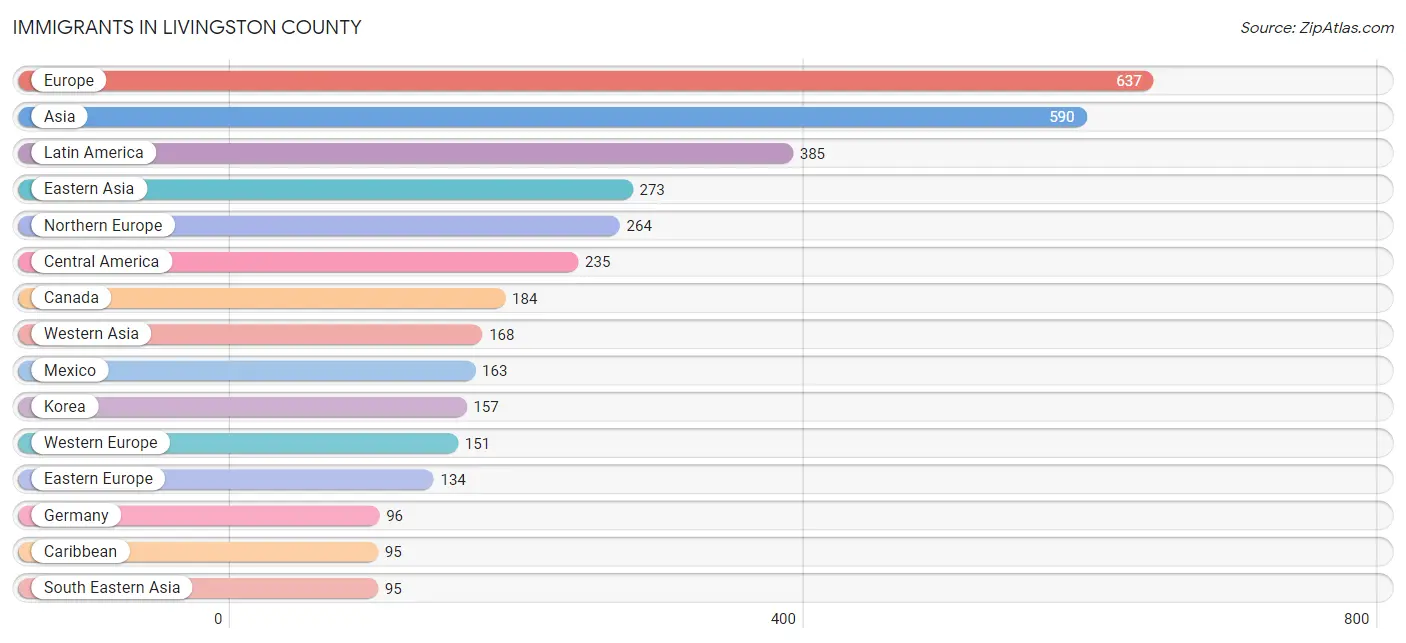
Immigrants in Livingston County
The most numerous immigrant groups reported in Livingston County came from Europe (637 | 1.0%), Asia (590 | 0.9%), Latin America (385 | 0.6%), Eastern Asia (273 | 0.4%), and Northern Europe (264 | 0.4%), together accounting for 3.5% of all Livingston County residents.
| Immigration Origin | # Population | % Population |
| Africa | 78 | 0.1% |
| Asia | 590 | 0.9% |
| Austria | 14 | 0.0% |
| Bangladesh | 5 | 0.0% |
| Belarus | 76 | 0.1% |
| Bulgaria | 11 | 0.0% |
| Canada | 184 | 0.3% |
| Caribbean | 95 | 0.2% |
| Central America | 235 | 0.4% |
| China | 81 | 0.1% |
| Costa Rica | 4 | 0.0% |
| Dominican Republic | 13 | 0.0% |
| Eastern Africa | 11 | 0.0% |
| Eastern Asia | 273 | 0.4% |
| Eastern Europe | 134 | 0.2% |
| Ecuador | 19 | 0.0% |
| El Salvador | 47 | 0.1% |
| England | 41 | 0.1% |
| Ethiopia | 11 | 0.0% |
| Europe | 637 | 1.0% |
| France | 20 | 0.0% |
| Germany | 96 | 0.2% |
| Greece | 15 | 0.0% |
| Guatemala | 21 | 0.0% |
| Haiti | 48 | 0.1% |
| India | 21 | 0.0% |
| Iran | 7 | 0.0% |
| Israel | 71 | 0.1% |
| Italy | 73 | 0.1% |
| Jamaica | 32 | 0.1% |
| Japan | 35 | 0.1% |
| Jordan | 4 | 0.0% |
| Korea | 157 | 0.3% |
| Laos | 8 | 0.0% |
| Latin America | 385 | 0.6% |
| Malaysia | 10 | 0.0% |
| Mexico | 163 | 0.3% |
| Middle Africa | 14 | 0.0% |
| Netherlands | 21 | 0.0% |
| Nigeria | 9 | 0.0% |
| Northern Europe | 264 | 0.4% |
| Norway | 31 | 0.1% |
| Peru | 36 | 0.1% |
| Philippines | 9 | 0.0% |
| Poland | 15 | 0.0% |
| Romania | 7 | 0.0% |
| Russia | 14 | 0.0% |
| South Africa | 44 | 0.1% |
| South America | 55 | 0.1% |
| South Central Asia | 37 | 0.1% |
| South Eastern Asia | 95 | 0.2% |
| Southern Europe | 88 | 0.1% |
| Sweden | 12 | 0.0% |
| Trinidad and Tobago | 2 | 0.0% |
| Turkey | 87 | 0.1% |
| Ukraine | 8 | 0.0% |
| Uzbekistan | 4 | 0.0% |
| Vietnam | 68 | 0.1% |
| Western Africa | 9 | 0.0% |
| Western Asia | 168 | 0.3% |
| Western Europe | 151 | 0.2% | View All 61 Rows |
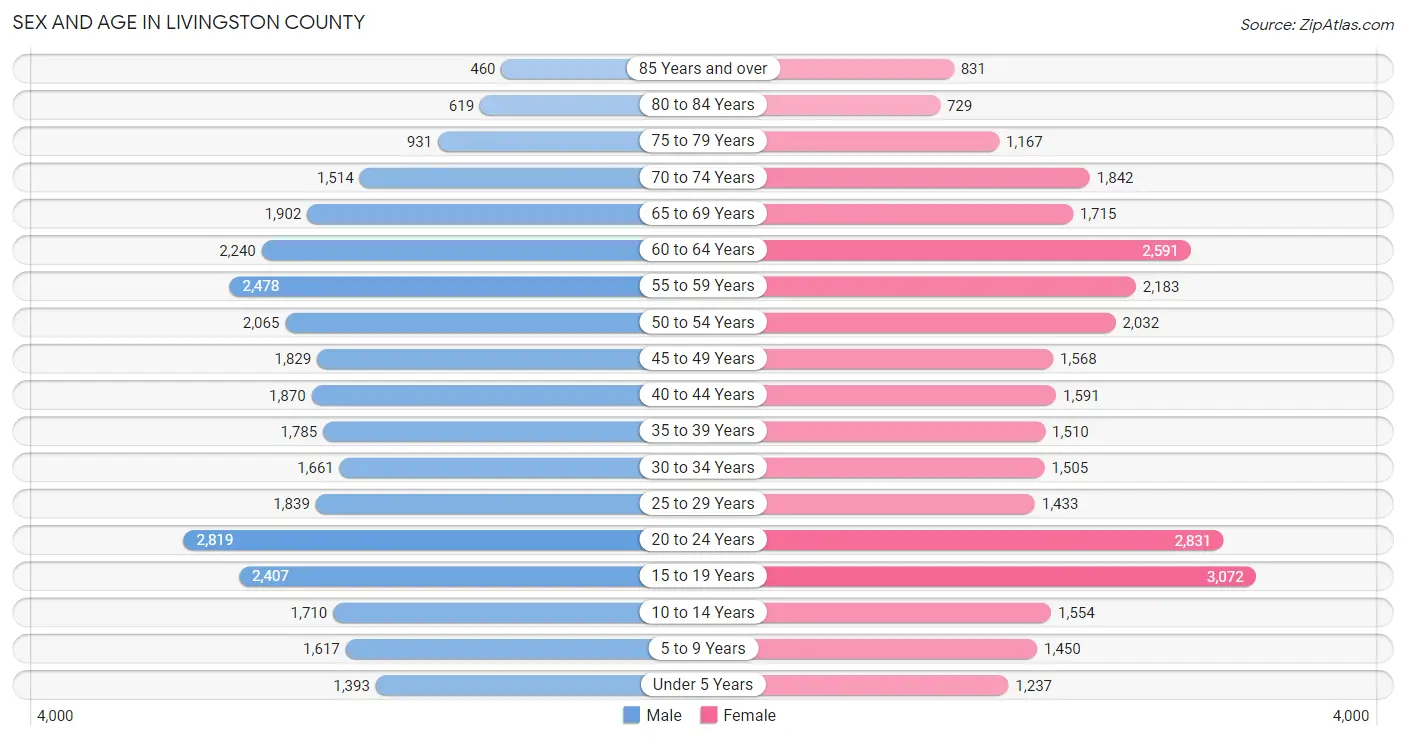
Sex and Age in Livingston County
Sex and Age in Livingston County
The most populous age groups in Livingston County are 20 to 24 Years (2,819 | 9.0%) for men and 15 to 19 Years (3,072 | 10.0%) for women.
| Age Bracket | Male | Female |
| Under 5 Years | 1,393 (4.5%) | 1,237 (4.0%) |
| 5 to 9 Years | 1,617 (5.2%) | 1,450 (4.7%) |
| 10 to 14 Years | 1,710 (5.5%) | 1,554 (5.0%) |
| 15 to 19 Years | 2,407 (7.7%) | 3,072 (10.0%) |
| 20 to 24 Years | 2,819 (9.0%) | 2,831 (9.2%) |
| 25 to 29 Years | 1,839 (5.9%) | 1,433 (4.6%) |
| 30 to 34 Years | 1,661 (5.3%) | 1,505 (4.9%) |
| 35 to 39 Years | 1,785 (5.7%) | 1,510 (4.9%) |
| 40 to 44 Years | 1,870 (6.0%) | 1,591 (5.2%) |
| 45 to 49 Years | 1,829 (5.9%) | 1,568 (5.1%) |
| 50 to 54 Years | 2,065 (6.6%) | 2,032 (6.6%) |
| 55 to 59 Years | 2,478 (8.0%) | 2,183 (7.1%) |
| 60 to 64 Years | 2,240 (7.2%) | 2,591 (8.4%) |
| 65 to 69 Years | 1,902 (6.1%) | 1,715 (5.6%) |
| 70 to 74 Years | 1,514 (4.9%) | 1,842 (6.0%) |
| 75 to 79 Years | 931 (3.0%) | 1,167 (3.8%) |
| 80 to 84 Years | 619 (2.0%) | 729 (2.4%) |
| 85 Years and over | 460 (1.5%) | 831 (2.7%) |
| Total | 31,139 (100.0%) | 30,841 (100.0%) |
Families and Households in Livingston County
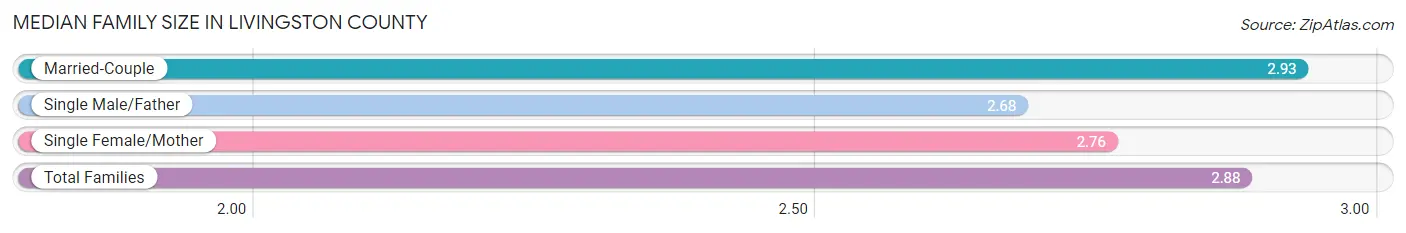
Median Family Size in Livingston County
The median family size in Livingston County is 2.88 persons per family, with married-couple families (11,728 | 77.8%) accounting for the largest median family size of 2.93 persons per family. On the other hand, single male/father families (1,018 | 6.8%) represent the smallest median family size with 2.68 persons per family.
| Family Type | # Families | Family Size |
| Married-Couple | 11,728 (77.8%) | 2.93 |
| Single Male/Father | 1,018 (6.8%) | 2.68 |
| Single Female/Mother | 2,330 (15.5%) | 2.76 |
| Total Families | 15,076 (100.0%) | 2.88 |
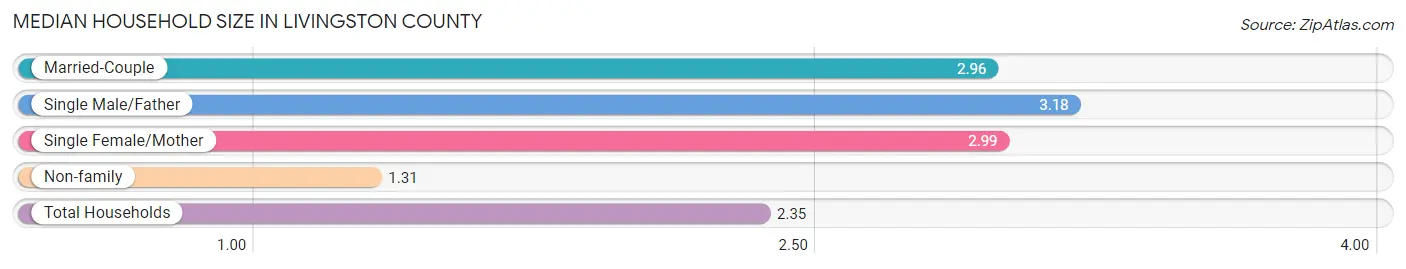
Median Household Size in Livingston County
The median household size in Livingston County is 2.35 persons per household, with single male/father households (1,018 | 4.2%) accounting for the largest median household size of 3.18 persons per household. non-family households (8,995 | 37.4%) represent the smallest median household size with 1.31 persons per household.
| Household Type | # Households | Household Size |
| Married-Couple | 11,728 (48.7%) | 2.96 |
| Single Male/Father | 1,018 (4.2%) | 3.18 |
| Single Female/Mother | 2,330 (9.7%) | 2.99 |
| Non-family | 8,995 (37.4%) | 1.31 |
| Total Households | 24,071 (100.0%) | 2.35 |
Household Size by Marriage Status in Livingston County
Out of a total of 24,071 households in Livingston County, 15,076 (62.6%) are family households, while 8,995 (37.4%) are nonfamily households. The most numerous type of family households are 2-person households, comprising 7,679, and the most common type of nonfamily households are 1-person households, comprising 7,167.
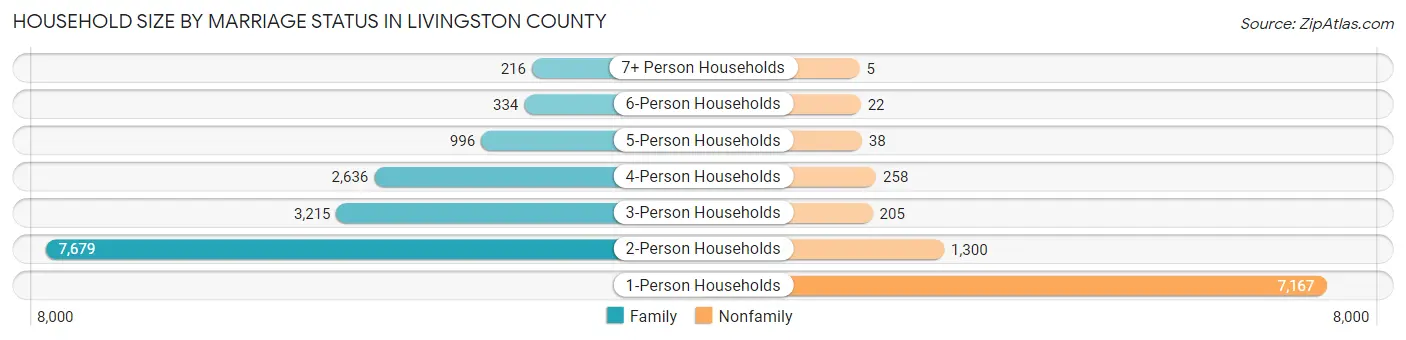
| Household Size | Family Households | Nonfamily Households |
| 1-Person Households | - | 7,167 (29.8%) |
| 2-Person Households | 7,679 (31.9%) | 1,300 (5.4%) |
| 3-Person Households | 3,215 (13.4%) | 205 (0.9%) |
| 4-Person Households | 2,636 (11.0%) | 258 (1.1%) |
| 5-Person Households | 996 (4.1%) | 38 (0.2%) |
| 6-Person Households | 334 (1.4%) | 22 (0.1%) |
| 7+ Person Households | 216 (0.9%) | 5 (0.0%) |
| Total | 15,076 (62.6%) | 8,995 (37.4%) |
Female Fertility in Livingston County
Fertility by Age in Livingston County
Average fertility rate in Livingston County is 56.0 births per 1,000 women. Women in the age bracket of 20 to 34 years have the highest fertility rate with 84.0 births per 1,000 women. Women in the age bracket of 20 to 34 years acount for 62.3% of all women with births.
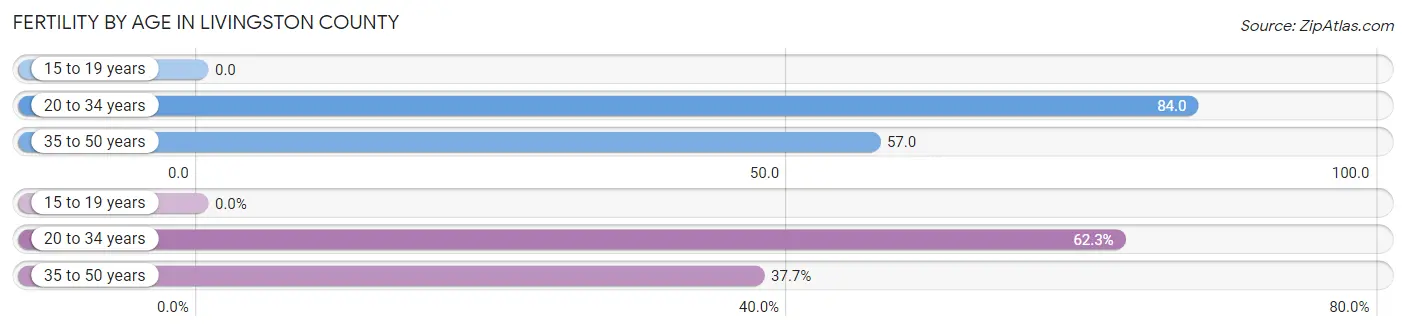
| Age Bracket | Women with Births | Births / 1,000 Women |
| 15 to 19 years | 0 (0.0%) | 0.0 |
| 20 to 34 years | 485 (62.3%) | 84.0 |
| 35 to 50 years | 294 (37.7%) | 57.0 |
| Total | 779 (100.0%) | 56.0 |
Fertility by Age by Marriage Status in Livingston County
57.9% of women with births (779) in Livingston County are married. The highest percentage of unmarried women with births falls into 20 to 34 years age bracket with 43.7% of them unmarried at the time of birth, while the lowest percentage of unmarried women with births belong to 35 to 50 years age bracket with 39.5% of them unmarried.
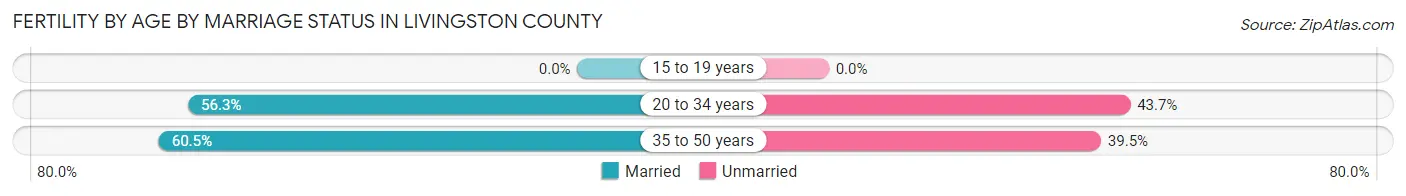
| Age Bracket | Married | Unmarried |
| 15 to 19 years | 0 (0.0%) | 0 (0.0%) |
| 20 to 34 years | 273 (56.3%) | 212 (43.7%) |
| 35 to 50 years | 178 (60.5%) | 116 (39.5%) |
| Total | 451 (57.9%) | 328 (42.1%) |
Fertility by Education in Livingston County
Average fertility rate in Livingston County is 56.0 births per 1,000 women. Women with the education attainment of bachelor's degree have the highest fertility rate of 137.0 births per 1,000 women, while women with the education attainment of less than high school have the lowest fertility at 27.0 births per 1,000 women. Women with the education attainment of college or associate's degree represent 43.5% of all women with births.
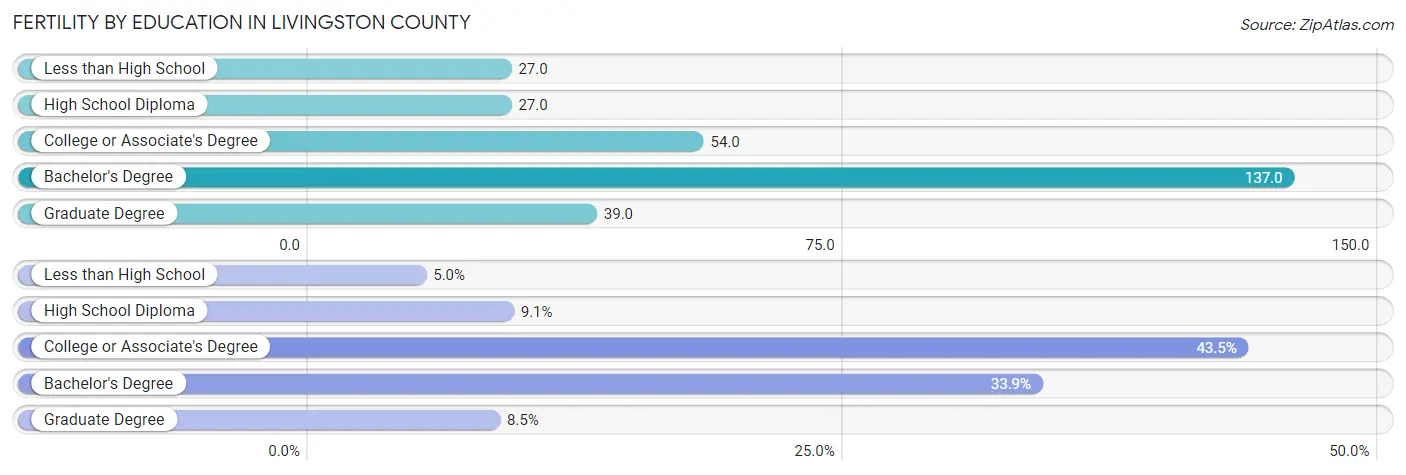
| Educational Attainment | Women with Births | Births / 1,000 Women |
| Less than High School | 39 (5.0%) | 27.0 |
| High School Diploma | 71 (9.1%) | 27.0 |
| College or Associate's Degree | 339 (43.5%) | 54.0 |
| Bachelor's Degree | 264 (33.9%) | 137.0 |
| Graduate Degree | 66 (8.5%) | 39.0 |
| Total | 779 (100.0%) | 56.0 |
Fertility by Education by Marriage Status in Livingston County
42.1% of women with births in Livingston County are unmarried. Women with the educational attainment of graduate degree are most likely to be married with 100.0% of them married at childbirth, while women with the educational attainment of high school diploma are least likely to be married with 73.2% of them unmarried at childbirth.
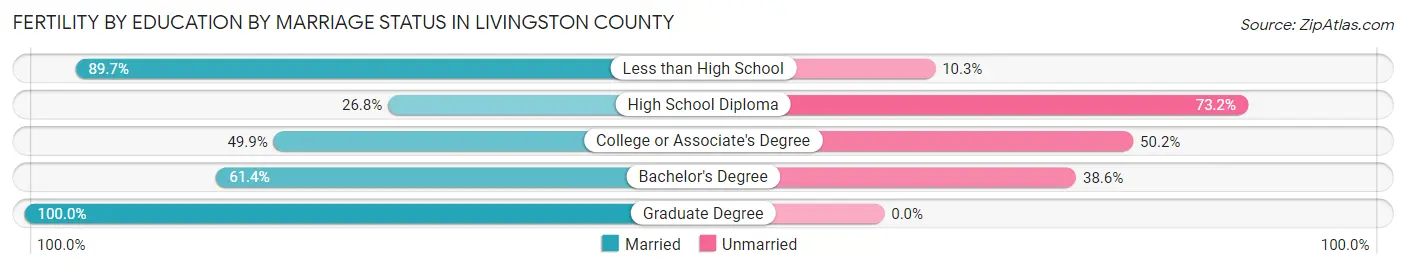
| Educational Attainment | Married | Unmarried |
| Less than High School | 35 (89.7%) | 4 (10.3%) |
| High School Diploma | 19 (26.8%) | 52 (73.2%) |
| College or Associate's Degree | 169 (49.8%) | 170 (50.1%) |
| Bachelor's Degree | 162 (61.4%) | 102 (38.6%) |
| Graduate Degree | 66 (100.0%) | 0 (0.0%) |
| Total | 451 (57.9%) | 328 (42.1%) |
Employment Characteristics in Livingston County
Employment by Class of Employer in Livingston County
Among the 28,236 employed individuals in Livingston County, private company employees (16,982 | 60.1%), not-for-profit organizations (3,060 | 10.8%), and local government employees (3,045 | 10.8%) make up the most common classes of employment.
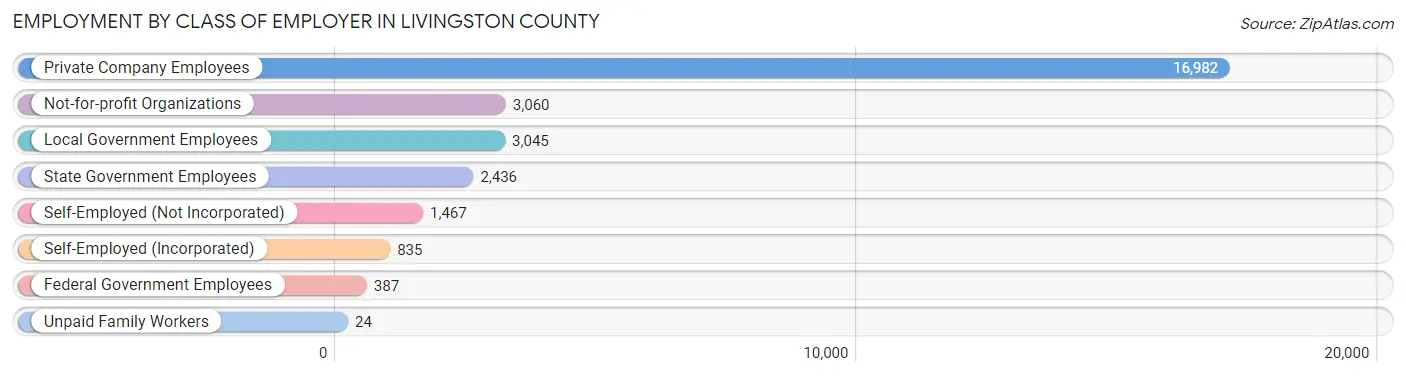
| Employer Class | # Employees | % Employees |
| Private Company Employees | 16,982 | 60.1% |
| Self-Employed (Incorporated) | 835 | 3.0% |
| Self-Employed (Not Incorporated) | 1,467 | 5.2% |
| Not-for-profit Organizations | 3,060 | 10.8% |
| Local Government Employees | 3,045 | 10.8% |
| State Government Employees | 2,436 | 8.6% |
| Federal Government Employees | 387 | 1.4% |
| Unpaid Family Workers | 24 | 0.1% |
| Total | 28,236 | 100.0% |
Employment Status by Age in Livingston County
According to the labor force statistics for Livingston County, out of the total population over 16 years of age (52,248), 58.1% or 30,356 individuals are in the labor force, with 4.7% or 1,427 of them unemployed. The age group with the highest labor force participation rate is 30 to 34 years, with 83.6% or 2,647 individuals in the labor force. Within the labor force, the 16 to 19 years age range has the highest percentage of unemployed individuals, with 17.1% or 340 of them being unemployed.
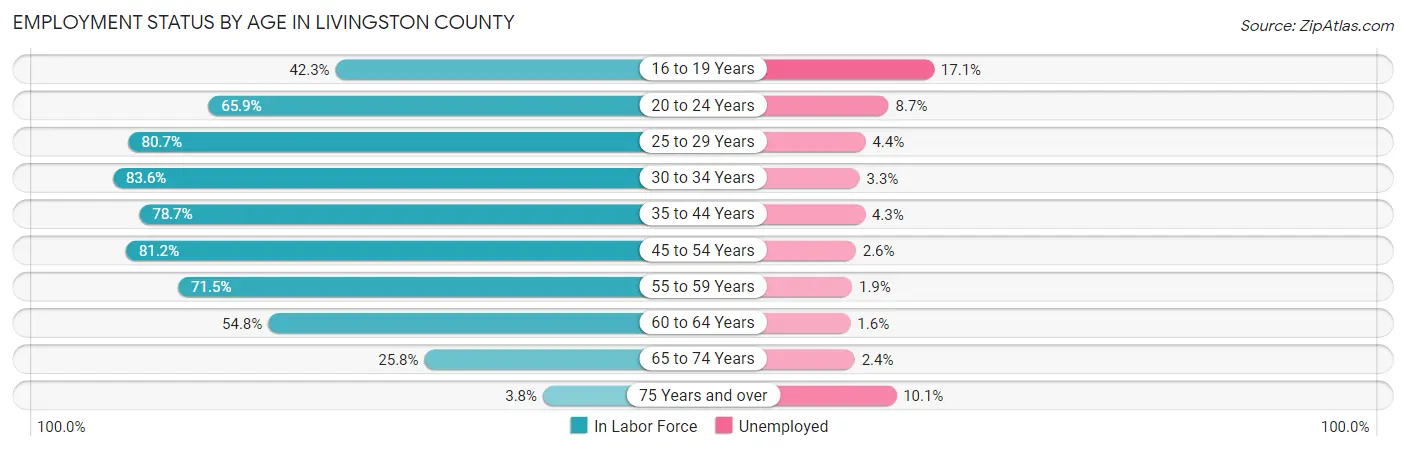
| Age Bracket | In Labor Force | Unemployed |
| 16 to 19 Years | 1,991 (42.3%) | 340 (17.1%) |
| 20 to 24 Years | 3,723 (65.9%) | 324 (8.7%) |
| 25 to 29 Years | 2,641 (80.7%) | 116 (4.4%) |
| 30 to 34 Years | 2,647 (83.6%) | 87 (3.3%) |
| 35 to 44 Years | 5,317 (78.7%) | 229 (4.3%) |
| 45 to 54 Years | 6,085 (81.2%) | 158 (2.6%) |
| 55 to 59 Years | 3,333 (71.5%) | 63 (1.9%) |
| 60 to 64 Years | 2,647 (54.8%) | 42 (1.6%) |
| 65 to 74 Years | 1,799 (25.8%) | 43 (2.4%) |
| 75 Years and over | 180 (3.8%) | 18 (10.1%) |
| Total | 30,356 (58.1%) | 1,427 (4.7%) |
Employment Status by Educational Attainment in Livingston County
According to labor force statistics for Livingston County, 75.1% of individuals (22,665) out of the total population between 25 and 64 years of age (30,180) are in the labor force, with 3.1% or 703 of them being unemployed. The group with the highest labor force participation rate are those with the educational attainment of bachelor's degree or higher, with 86.7% or 8,034 individuals in the labor force. Within the labor force, individuals with college / associate degree education have the highest percentage of unemployment, with 4.6% or 346 of them being unemployed.
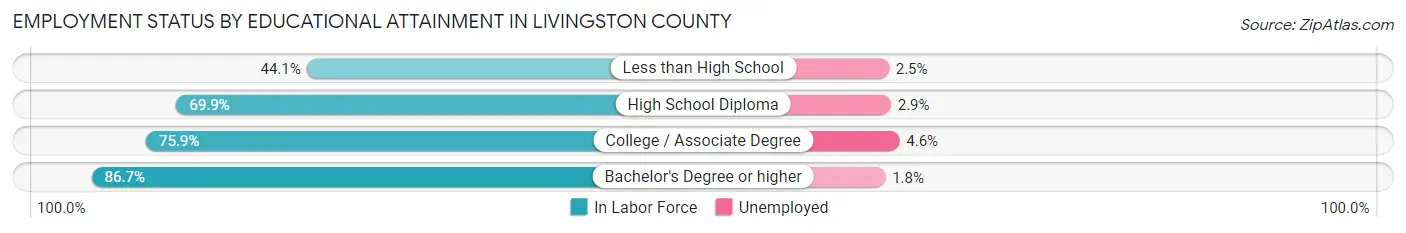
| Educational Attainment | In Labor Force | Unemployed |
| Less than High School | 985 (44.1%) | 56 (2.5%) |
| High School Diploma | 6,121 (69.9%) | 254 (2.9%) |
| College / Associate Degree | 7,531 (75.9%) | 456 (4.6%) |
| Bachelor's Degree or higher | 8,034 (86.7%) | 167 (1.8%) |
| Total | 22,665 (75.1%) | 936 (3.1%) |
Employment Occupations by Sex in Livingston County
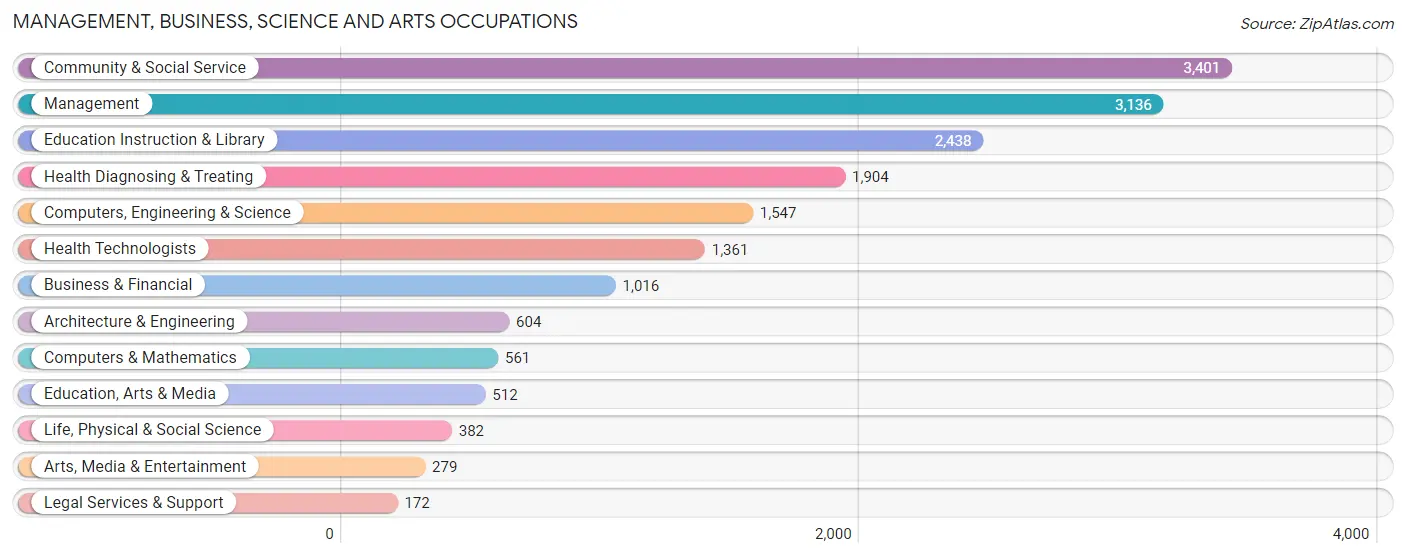
Management, Business, Science and Arts Occupations
The most common Management, Business, Science and Arts occupations in Livingston County are Community & Social Service (3,401 | 11.8%), Management (3,136 | 10.8%), Education Instruction & Library (2,438 | 8.4%), Health Diagnosing & Treating (1,904 | 6.6%), and Computers, Engineering & Science (1,547 | 5.3%).
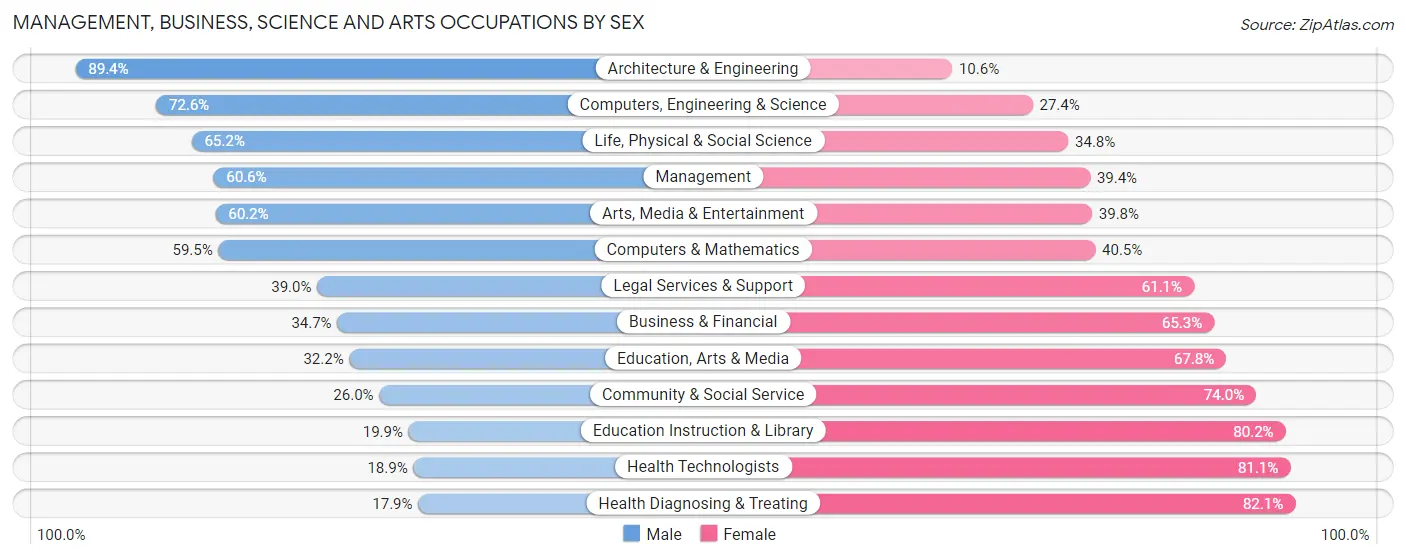
Management, Business, Science and Arts Occupations by Sex
Within the Management, Business, Science and Arts occupations in Livingston County, the most male-oriented occupations are Architecture & Engineering (89.4%), Computers, Engineering & Science (72.6%), and Life, Physical & Social Science (65.2%), while the most female-oriented occupations are Health Diagnosing & Treating (82.1%), Health Technologists (81.1%), and Education Instruction & Library (80.1%).
| Occupation | Male | Female |
| Management | 1,901 (60.6%) | 1,235 (39.4%) |
| Business & Financial | 353 (34.7%) | 663 (65.3%) |
| Computers, Engineering & Science | 1,123 (72.6%) | 424 (27.4%) |
| Computers & Mathematics | 334 (59.5%) | 227 (40.5%) |
| Architecture & Engineering | 540 (89.4%) | 64 (10.6%) |
| Life, Physical & Social Science | 249 (65.2%) | 133 (34.8%) |
| Community & Social Service | 884 (26.0%) | 2,517 (74.0%) |
| Education, Arts & Media | 165 (32.2%) | 347 (67.8%) |
| Legal Services & Support | 67 (39.0%) | 105 (61.1%) |
| Education Instruction & Library | 484 (19.9%) | 1,954 (80.1%) |
| Arts, Media & Entertainment | 168 (60.2%) | 111 (39.8%) |
| Health Diagnosing & Treating | 340 (17.9%) | 1,564 (82.1%) |
| Health Technologists | 257 (18.9%) | 1,104 (81.1%) |
| Total (Category) | 4,601 (41.8%) | 6,403 (58.2%) |
| Total (Overall) | 14,921 (51.6%) | 14,002 (48.4%) |
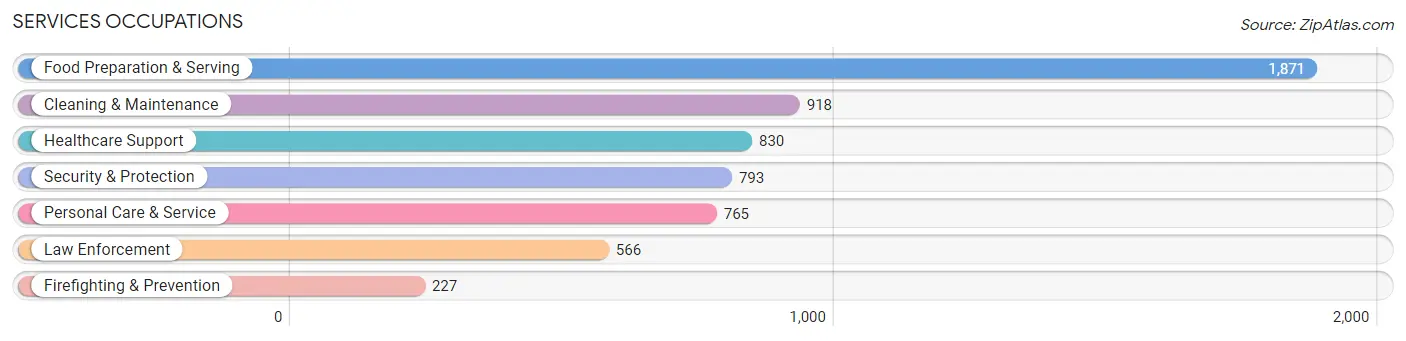
Services Occupations
The most common Services occupations in Livingston County are Food Preparation & Serving (1,871 | 6.5%), Cleaning & Maintenance (918 | 3.2%), Healthcare Support (830 | 2.9%), Security & Protection (793 | 2.7%), and Personal Care & Service (765 | 2.6%).
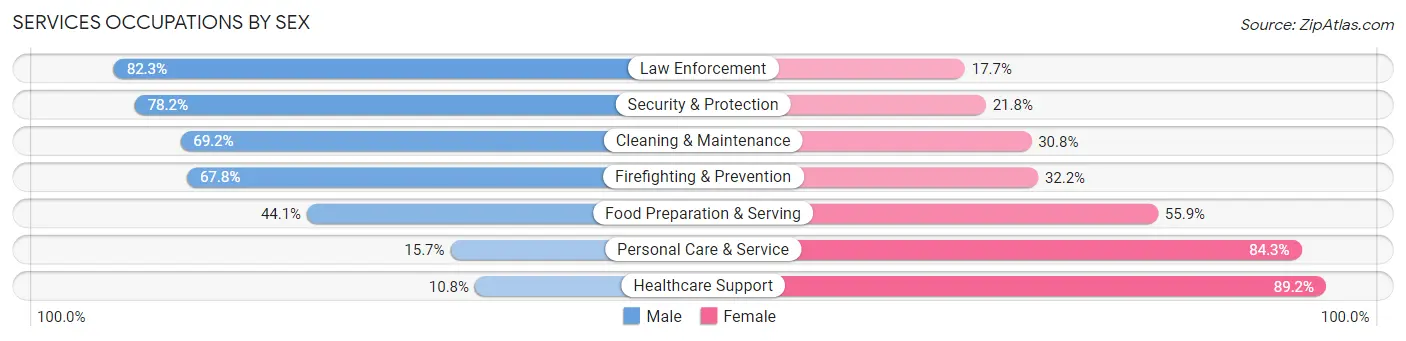
Services Occupations by Sex
Within the Services occupations in Livingston County, the most male-oriented occupations are Law Enforcement (82.3%), Security & Protection (78.2%), and Cleaning & Maintenance (69.2%), while the most female-oriented occupations are Healthcare Support (89.2%), Personal Care & Service (84.3%), and Food Preparation & Serving (55.9%).
| Occupation | Male | Female |
| Healthcare Support | 90 (10.8%) | 740 (89.2%) |
| Security & Protection | 620 (78.2%) | 173 (21.8%) |
| Firefighting & Prevention | 154 (67.8%) | 73 (32.2%) |
| Law Enforcement | 466 (82.3%) | 100 (17.7%) |
| Food Preparation & Serving | 825 (44.1%) | 1,046 (55.9%) |
| Cleaning & Maintenance | 635 (69.2%) | 283 (30.8%) |
| Personal Care & Service | 120 (15.7%) | 645 (84.3%) |
| Total (Category) | 2,290 (44.2%) | 2,887 (55.8%) |
| Total (Overall) | 14,921 (51.6%) | 14,002 (48.4%) |
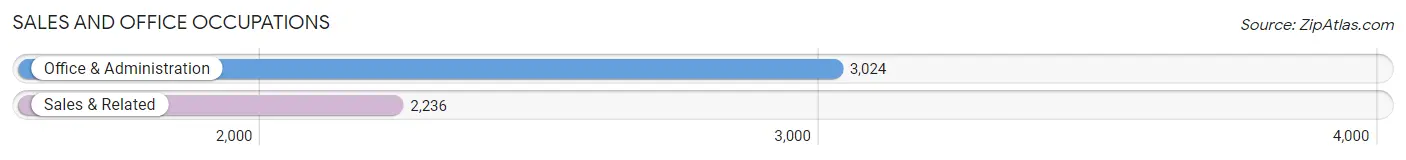
Sales and Office Occupations
The most common Sales and Office occupations in Livingston County are Office & Administration (3,024 | 10.5%), and Sales & Related (2,236 | 7.7%).
Sales and Office Occupations by Sex
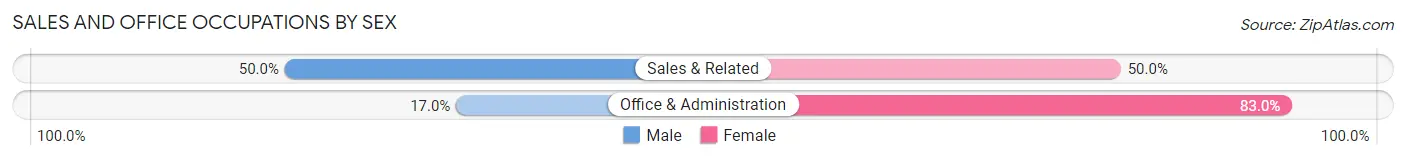
| Occupation | Male | Female |
| Sales & Related | 1,117 (50.0%) | 1,119 (50.0%) |
| Office & Administration | 514 (17.0%) | 2,510 (83.0%) |
| Total (Category) | 1,631 (31.0%) | 3,629 (69.0%) |
| Total (Overall) | 14,921 (51.6%) | 14,002 (48.4%) |
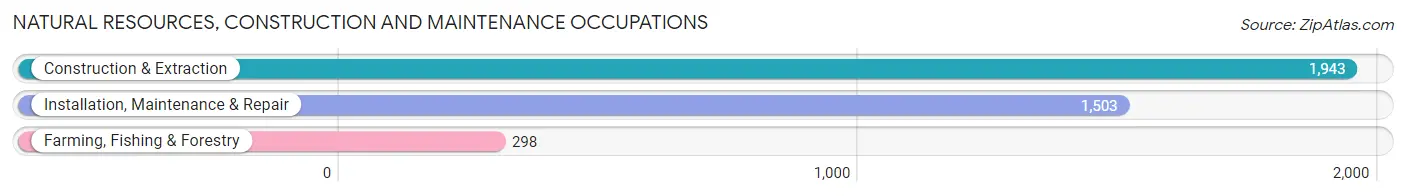
Natural Resources, Construction and Maintenance Occupations
The most common Natural Resources, Construction and Maintenance occupations in Livingston County are Construction & Extraction (1,943 | 6.7%), Installation, Maintenance & Repair (1,503 | 5.2%), and Farming, Fishing & Forestry (298 | 1.0%).
Natural Resources, Construction and Maintenance Occupations by Sex
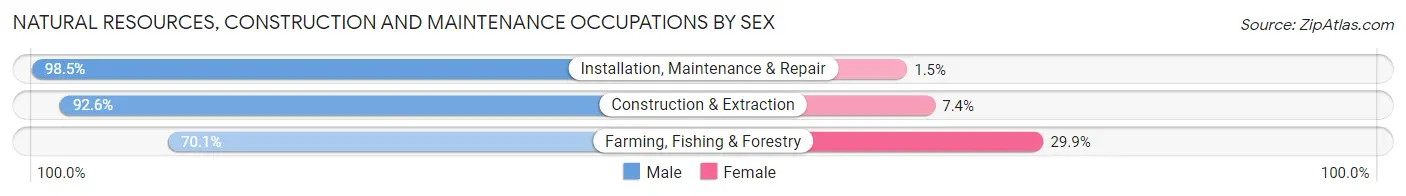
| Occupation | Male | Female |
| Farming, Fishing & Forestry | 209 (70.1%) | 89 (29.9%) |
| Construction & Extraction | 1,800 (92.6%) | 143 (7.4%) |
| Installation, Maintenance & Repair | 1,480 (98.5%) | 23 (1.5%) |
| Total (Category) | 3,489 (93.2%) | 255 (6.8%) |
| Total (Overall) | 14,921 (51.6%) | 14,002 (48.4%) |
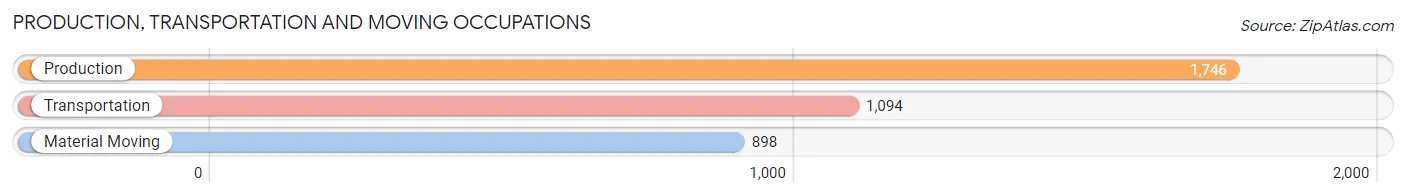
Production, Transportation and Moving Occupations
The most common Production, Transportation and Moving occupations in Livingston County are Production (1,746 | 6.0%), Transportation (1,094 | 3.8%), and Material Moving (898 | 3.1%).
Production, Transportation and Moving Occupations by Sex
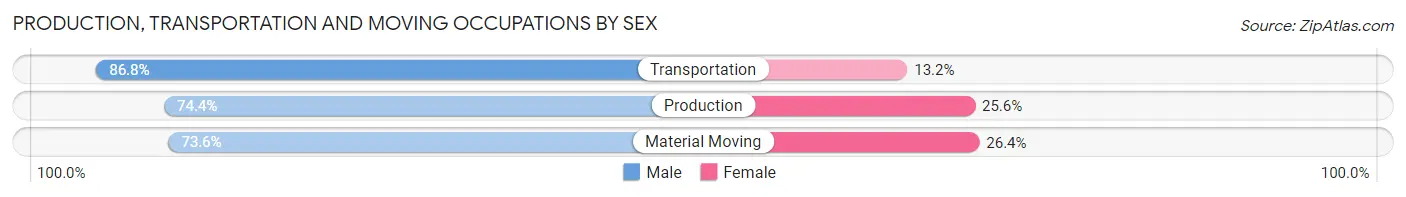
| Occupation | Male | Female |
| Production | 1,299 (74.4%) | 447 (25.6%) |
| Transportation | 950 (86.8%) | 144 (13.2%) |
| Material Moving | 661 (73.6%) | 237 (26.4%) |
| Total (Category) | 2,910 (77.8%) | 828 (22.2%) |
| Total (Overall) | 14,921 (51.6%) | 14,002 (48.4%) |
Employment Industries by Sex in Livingston County
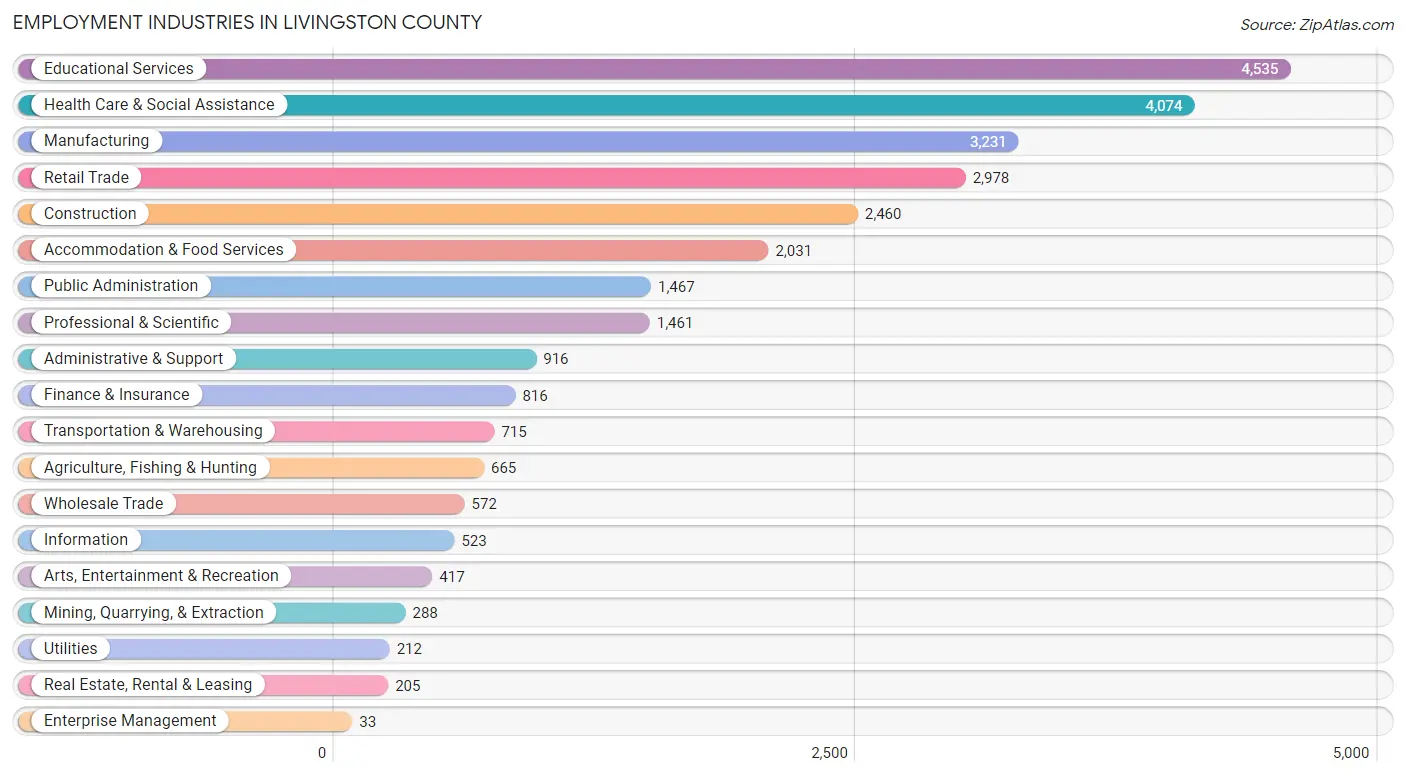
Employment Industries in Livingston County
The major employment industries in Livingston County include Educational Services (4,535 | 15.7%), Health Care & Social Assistance (4,074 | 14.1%), Manufacturing (3,231 | 11.2%), Retail Trade (2,978 | 10.3%), and Construction (2,460 | 8.5%).
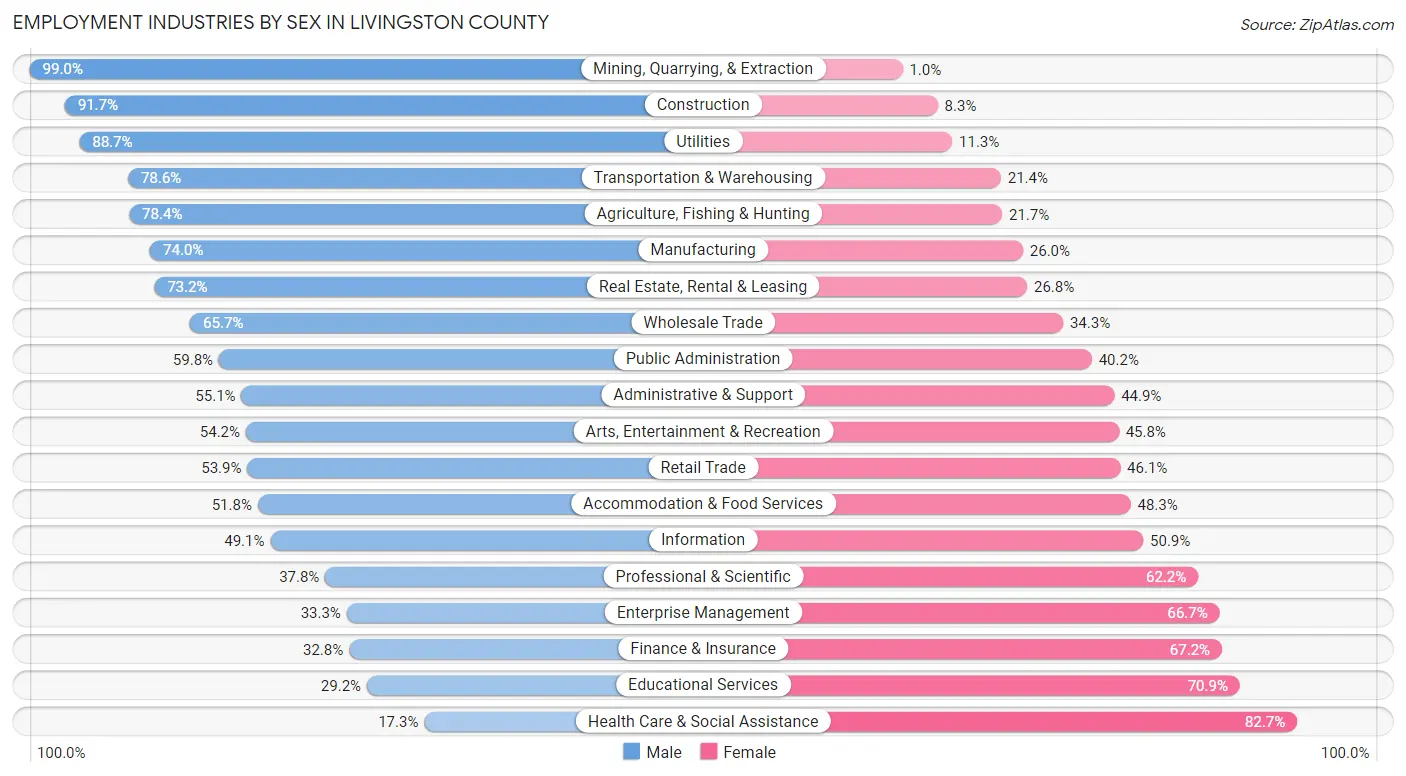
Employment Industries by Sex in Livingston County
The Livingston County industries that see more men than women are Mining, Quarrying, & Extraction (99.0%), Construction (91.7%), and Utilities (88.7%), whereas the industries that tend to have a higher number of women are Health Care & Social Assistance (82.7%), Educational Services (70.9%), and Finance & Insurance (67.2%).
| Industry | Male | Female |
| Agriculture, Fishing & Hunting | 521 (78.3%) | 144 (21.6%) |
| Mining, Quarrying, & Extraction | 285 (99.0%) | 3 (1.0%) |
| Construction | 2,255 (91.7%) | 205 (8.3%) |
| Manufacturing | 2,392 (74.0%) | 839 (26.0%) |
| Wholesale Trade | 376 (65.7%) | 196 (34.3%) |
| Retail Trade | 1,605 (53.9%) | 1,373 (46.1%) |
| Transportation & Warehousing | 562 (78.6%) | 153 (21.4%) |
| Utilities | 188 (88.7%) | 24 (11.3%) |
| Information | 257 (49.1%) | 266 (50.9%) |
| Finance & Insurance | 268 (32.8%) | 548 (67.2%) |
| Real Estate, Rental & Leasing | 150 (73.2%) | 55 (26.8%) |
| Professional & Scientific | 552 (37.8%) | 909 (62.2%) |
| Enterprise Management | 11 (33.3%) | 22 (66.7%) |
| Administrative & Support | 505 (55.1%) | 411 (44.9%) |
| Educational Services | 1,322 (29.1%) | 3,213 (70.9%) |
| Health Care & Social Assistance | 704 (17.3%) | 3,370 (82.7%) |
| Arts, Entertainment & Recreation | 226 (54.2%) | 191 (45.8%) |
| Accommodation & Food Services | 1,051 (51.7%) | 980 (48.2%) |
| Public Administration | 877 (59.8%) | 590 (40.2%) |
| Total | 14,921 (51.6%) | 14,002 (48.4%) |
Education in Livingston County
School Enrollment in Livingston County
The most common levels of schooling among the 15,540 students in Livingston County are college / undergraduate (6,122 | 39.4%), high school (2,779 | 17.9%), and middle school (2,521 | 16.2%).
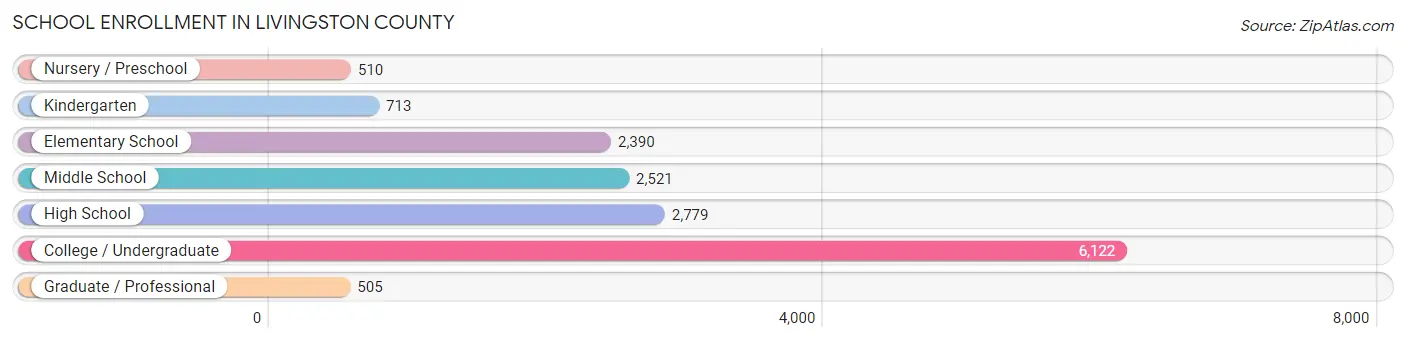
| School Level | # Students | % Students |
| Nursery / Preschool | 510 | 3.3% |
| Kindergarten | 713 | 4.6% |
| Elementary School | 2,390 | 15.4% |
| Middle School | 2,521 | 16.2% |
| High School | 2,779 | 17.9% |
| College / Undergraduate | 6,122 | 39.4% |
| Graduate / Professional | 505 | 3.3% |
| Total | 15,540 | 100.0% |
School Enrollment by Age by Funding Source in Livingston County
Out of a total of 15,540 students who are enrolled in schools in Livingston County, 2,378 (15.3%) attend a private institution, while the remaining 13,162 (84.7%) are enrolled in public schools. The age group of 3 to 4 year olds has the highest likelihood of being enrolled in private schools, with 159 (36.3% in the age bracket) enrolled. Conversely, the age group of 15 to 17 year olds has the lowest likelihood of being enrolled in a private school, with 1,913 (93.7% in the age bracket) attending a public institution.
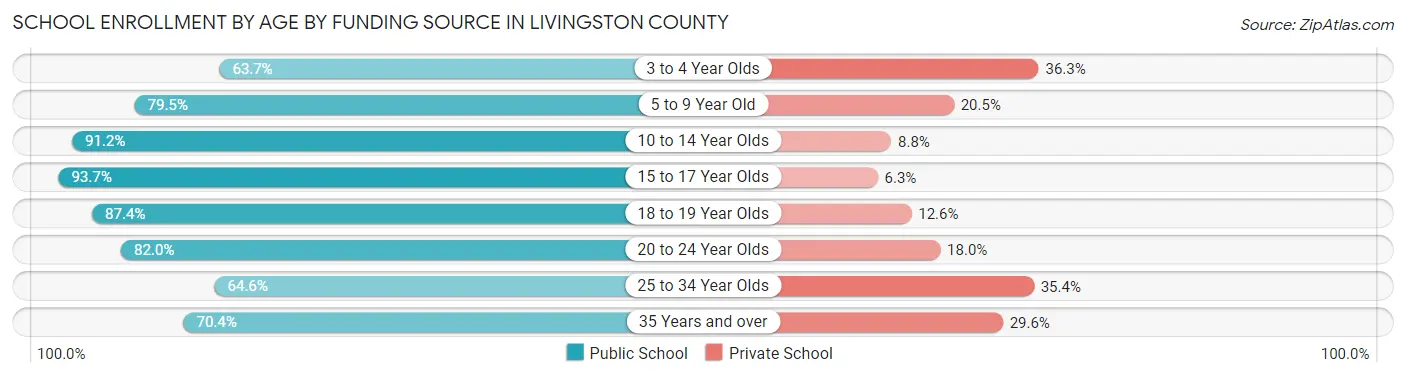
| Age Bracket | Public School | Private School |
| 3 to 4 Year Olds | 279 (63.7%) | 159 (36.3%) |
| 5 to 9 Year Old | 2,339 (79.5%) | 603 (20.5%) |
| 10 to 14 Year Olds | 2,876 (91.2%) | 279 (8.8%) |
| 15 to 17 Year Olds | 1,913 (93.7%) | 129 (6.3%) |
| 18 to 19 Year Olds | 2,542 (87.4%) | 366 (12.6%) |
| 20 to 24 Year Olds | 2,675 (82.0%) | 586 (18.0%) |
| 25 to 34 Year Olds | 188 (64.6%) | 103 (35.4%) |
| 35 Years and over | 354 (70.4%) | 149 (29.6%) |
| Total | 13,162 (84.7%) | 2,378 (15.3%) |
Educational Attainment by Field of Study in Livingston County
Education (2,514 | 18.7%), business (2,033 | 15.2%), science & technology (1,702 | 12.7%), bio, nature & agricultural (1,152 | 8.6%), and engineering (821 | 6.1%) are the most common fields of study among 13,412 individuals in Livingston County who have obtained a bachelor's degree or higher.
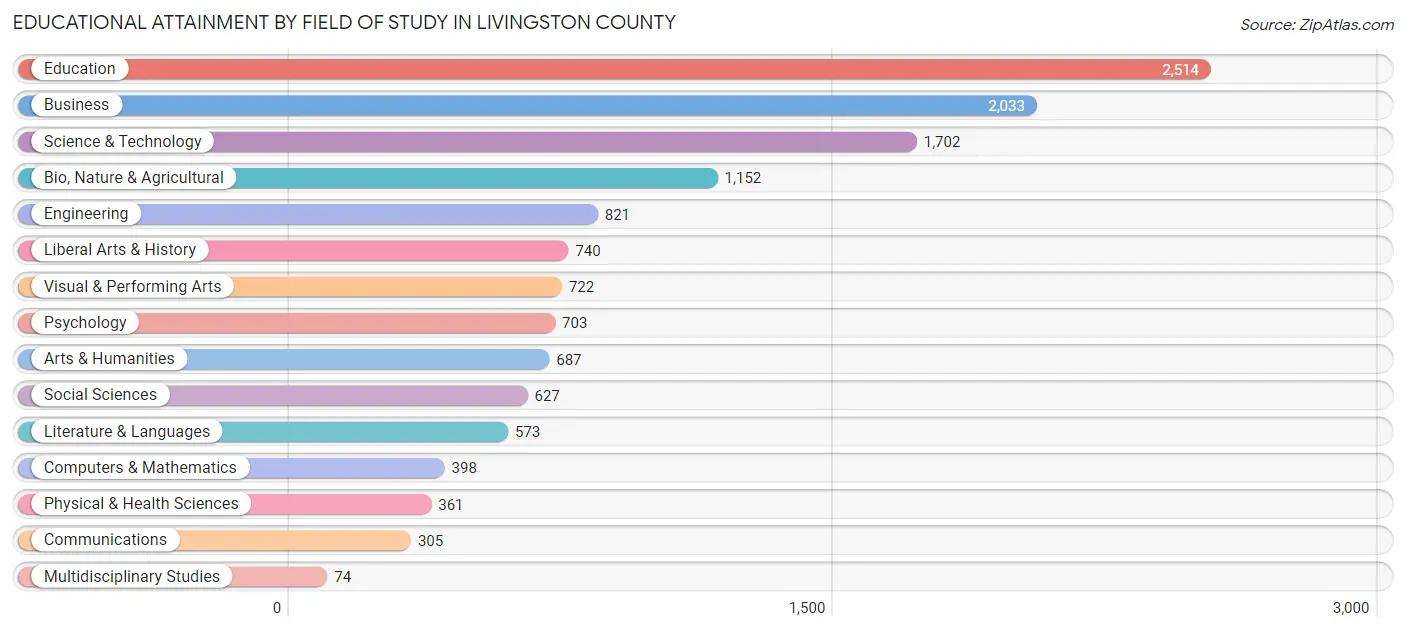
| Field of Study | # Graduates | % Graduates |
| Computers & Mathematics | 398 | 3.0% |
| Bio, Nature & Agricultural | 1,152 | 8.6% |
| Physical & Health Sciences | 361 | 2.7% |
| Psychology | 703 | 5.2% |
| Social Sciences | 627 | 4.7% |
| Engineering | 821 | 6.1% |
| Multidisciplinary Studies | 74 | 0.5% |
| Science & Technology | 1,702 | 12.7% |
| Business | 2,033 | 15.2% |
| Education | 2,514 | 18.7% |
| Literature & Languages | 573 | 4.3% |
| Liberal Arts & History | 740 | 5.5% |
| Visual & Performing Arts | 722 | 5.4% |
| Communications | 305 | 2.3% |
| Arts & Humanities | 687 | 5.1% |
| Total | 13,412 | 100.0% |
Transportation & Commute in Livingston County
Vehicle Availability by Sex in Livingston County
The most prevalent vehicle ownership categories in Livingston County are males with 2 vehicles (6,253, accounting for 43.7%) and females with 2 vehicles (5,441, making up 48.7%).
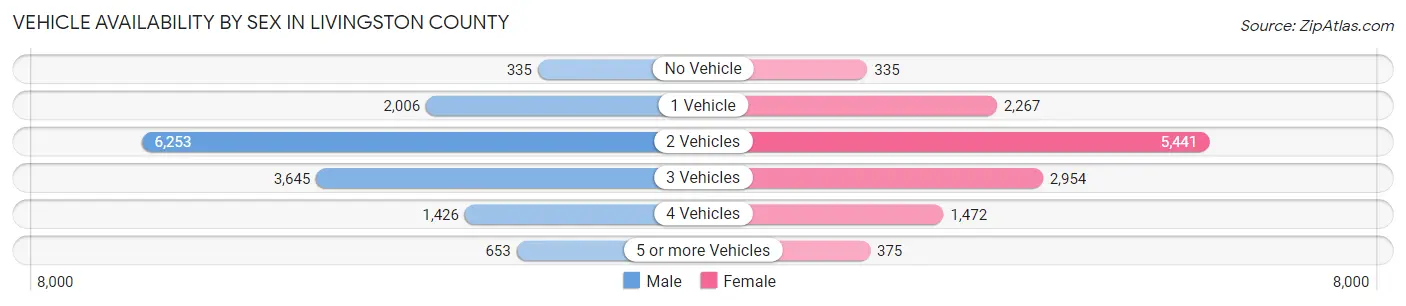
| Vehicles Available | Male | Female |
| No Vehicle | 335 (2.3%) | 335 (2.6%) |
| 1 Vehicle | 2,006 (14.0%) | 2,267 (17.6%) |
| 2 Vehicles | 6,253 (43.7%) | 5,441 (42.4%) |
| 3 Vehicles | 3,645 (25.5%) | 2,954 (23.0%) |
| 4 Vehicles | 1,426 (10.0%) | 1,472 (11.5%) |
| 5 or more Vehicles | 653 (4.6%) | 375 (2.9%) |
| Total | 14,318 (100.0%) | 12,844 (100.0%) |
Commute Time in Livingston County
The most frequently occuring commute durations in Livingston County are 5 to 9 minutes (3,813 commuters, 14.6%), 30 to 34 minutes (3,418 commuters, 13.1%), and 10 to 14 minutes (3,278 commuters, 12.5%).
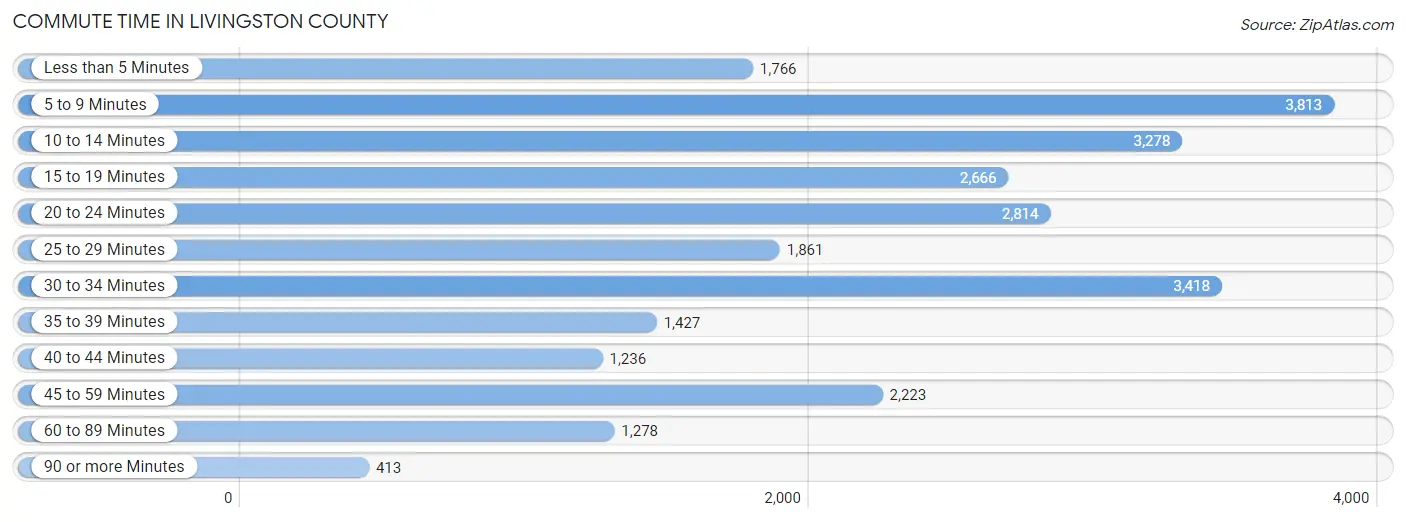
| Commute Time | # Commuters | % Commuters |
| Less than 5 Minutes | 1,766 | 6.7% |
| 5 to 9 Minutes | 3,813 | 14.6% |
| 10 to 14 Minutes | 3,278 | 12.5% |
| 15 to 19 Minutes | 2,666 | 10.2% |
| 20 to 24 Minutes | 2,814 | 10.7% |
| 25 to 29 Minutes | 1,861 | 7.1% |
| 30 to 34 Minutes | 3,418 | 13.1% |
| 35 to 39 Minutes | 1,427 | 5.4% |
| 40 to 44 Minutes | 1,236 | 4.7% |
| 45 to 59 Minutes | 2,223 | 8.5% |
| 60 to 89 Minutes | 1,278 | 4.9% |
| 90 or more Minutes | 413 | 1.6% |
Commute Time by Sex in Livingston County
The most common commute times in Livingston County are 5 to 9 minutes (1,836 commuters, 13.4%) for males and 5 to 9 minutes (1,977 commuters, 15.9%) for females.
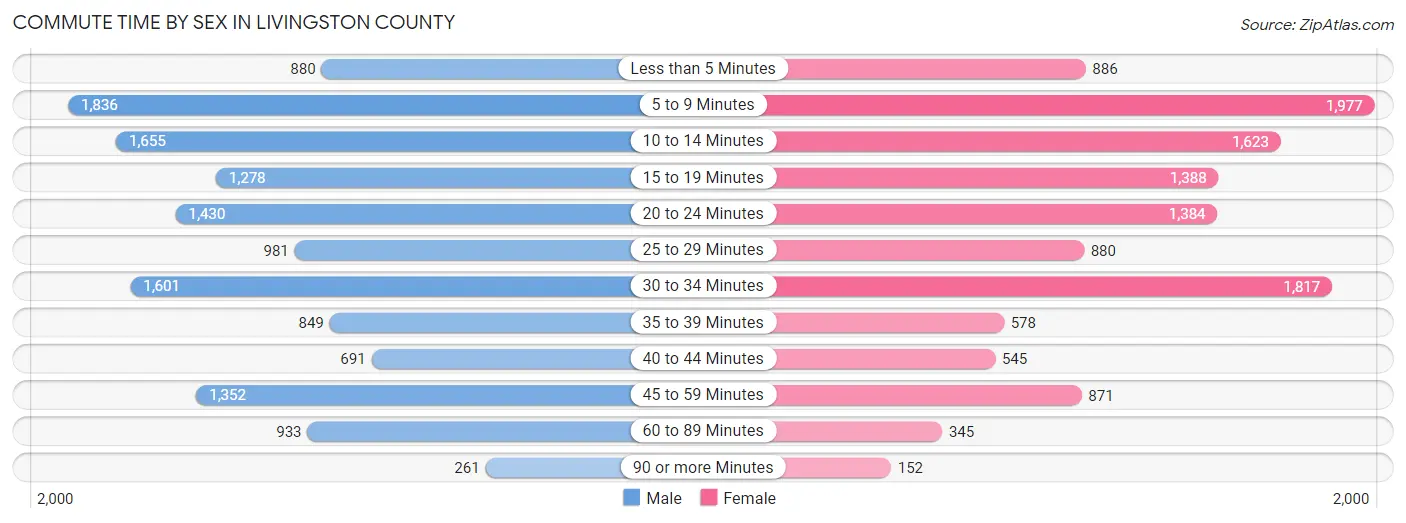
| Commute Time | Male | Female |
| Less than 5 Minutes | 880 (6.4%) | 886 (7.1%) |
| 5 to 9 Minutes | 1,836 (13.4%) | 1,977 (15.9%) |
| 10 to 14 Minutes | 1,655 (12.0%) | 1,623 (13.0%) |
| 15 to 19 Minutes | 1,278 (9.3%) | 1,388 (11.2%) |
| 20 to 24 Minutes | 1,430 (10.4%) | 1,384 (11.1%) |
| 25 to 29 Minutes | 981 (7.1%) | 880 (7.1%) |
| 30 to 34 Minutes | 1,601 (11.7%) | 1,817 (14.6%) |
| 35 to 39 Minutes | 849 (6.2%) | 578 (4.6%) |
| 40 to 44 Minutes | 691 (5.0%) | 545 (4.4%) |
| 45 to 59 Minutes | 1,352 (9.8%) | 871 (7.0%) |
| 60 to 89 Minutes | 933 (6.8%) | 345 (2.8%) |
| 90 or more Minutes | 261 (1.9%) | 152 (1.2%) |
Time of Departure to Work by Sex in Livingston County
The most frequent times of departure to work in Livingston County are 7:00 AM to 7:29 AM (1,786, 13.0%) for males and 7:00 AM to 7:29 AM (2,306, 18.5%) for females.
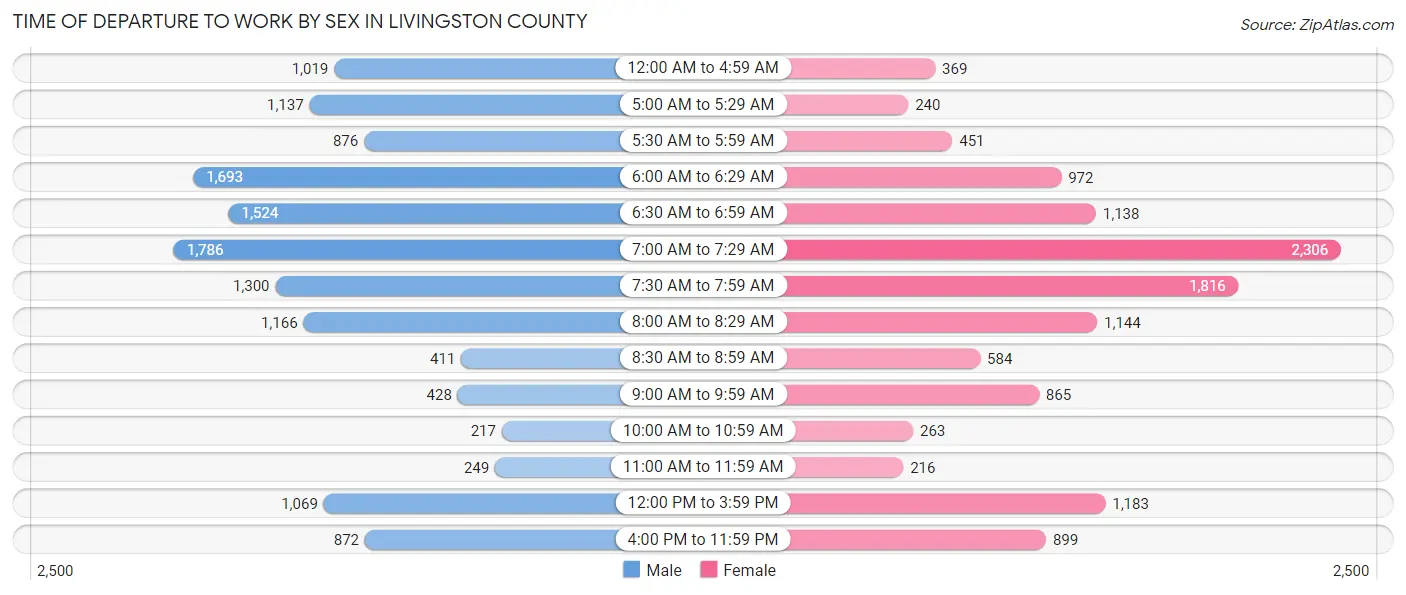
| Time of Departure | Male | Female |
| 12:00 AM to 4:59 AM | 1,019 (7.4%) | 369 (3.0%) |
| 5:00 AM to 5:29 AM | 1,137 (8.3%) | 240 (1.9%) |
| 5:30 AM to 5:59 AM | 876 (6.4%) | 451 (3.6%) |
| 6:00 AM to 6:29 AM | 1,693 (12.3%) | 972 (7.8%) |
| 6:30 AM to 6:59 AM | 1,524 (11.1%) | 1,138 (9.1%) |
| 7:00 AM to 7:29 AM | 1,786 (13.0%) | 2,306 (18.5%) |
| 7:30 AM to 7:59 AM | 1,300 (9.5%) | 1,816 (14.6%) |
| 8:00 AM to 8:29 AM | 1,166 (8.5%) | 1,144 (9.2%) |
| 8:30 AM to 8:59 AM | 411 (3.0%) | 584 (4.7%) |
| 9:00 AM to 9:59 AM | 428 (3.1%) | 865 (7.0%) |
| 10:00 AM to 10:59 AM | 217 (1.6%) | 263 (2.1%) |
| 11:00 AM to 11:59 AM | 249 (1.8%) | 216 (1.7%) |
| 12:00 PM to 3:59 PM | 1,069 (7.8%) | 1,183 (9.5%) |
| 4:00 PM to 11:59 PM | 872 (6.3%) | 899 (7.2%) |
| Total | 13,747 (100.0%) | 12,446 (100.0%) |
Housing Occupancy in Livingston County
Occupancy by Ownership in Livingston County
Of the total 24,071 dwellings in Livingston County, owner-occupied units account for 18,546 (77.0%), while renter-occupied units make up 5,525 (23.0%).
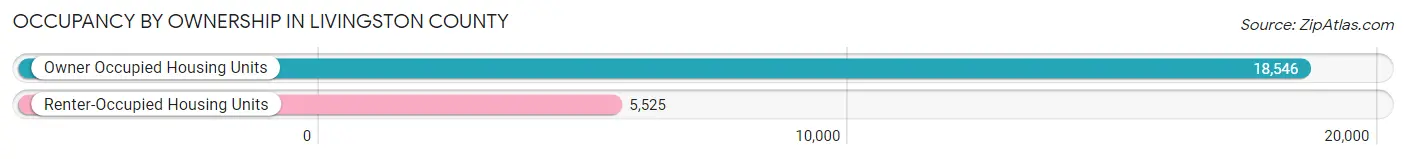
| Occupancy | # Housing Units | % Housing Units |
| Owner Occupied Housing Units | 18,546 | 77.0% |
| Renter-Occupied Housing Units | 5,525 | 23.0% |
| Total Occupied Housing Units | 24,071 | 100.0% |
Occupancy by Household Size in Livingston County
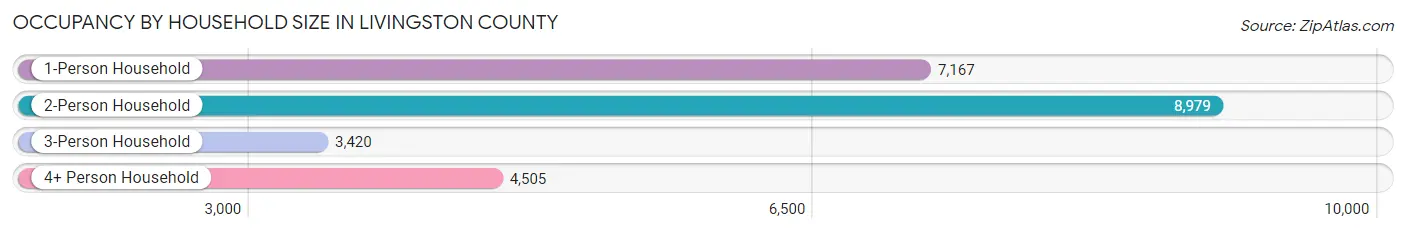
| Household Size | # Housing Units | % Housing Units |
| 1-Person Household | 7,167 | 29.8% |
| 2-Person Household | 8,979 | 37.3% |
| 3-Person Household | 3,420 | 14.2% |
| 4+ Person Household | 4,505 | 18.7% |
| Total Housing Units | 24,071 | 100.0% |
Occupancy by Ownership by Household Size in Livingston County
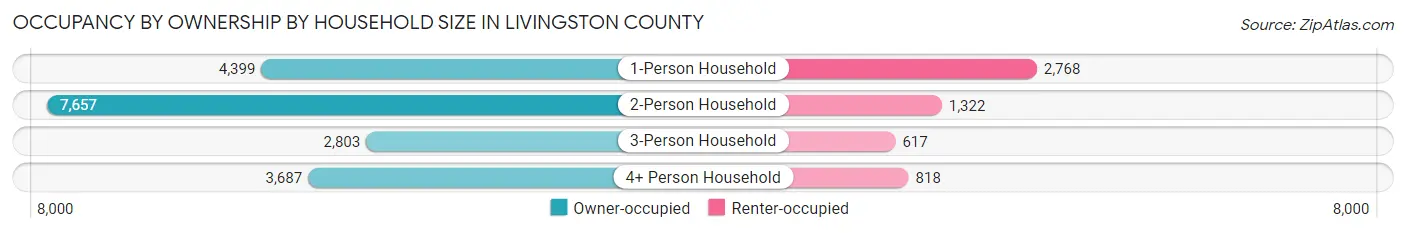
| Household Size | Owner-occupied | Renter-occupied |
| 1-Person Household | 4,399 (61.4%) | 2,768 (38.6%) |
| 2-Person Household | 7,657 (85.3%) | 1,322 (14.7%) |
| 3-Person Household | 2,803 (82.0%) | 617 (18.0%) |
| 4+ Person Household | 3,687 (81.8%) | 818 (18.2%) |
| Total Housing Units | 18,546 (77.0%) | 5,525 (23.0%) |
Occupancy by Educational Attainment in Livingston County
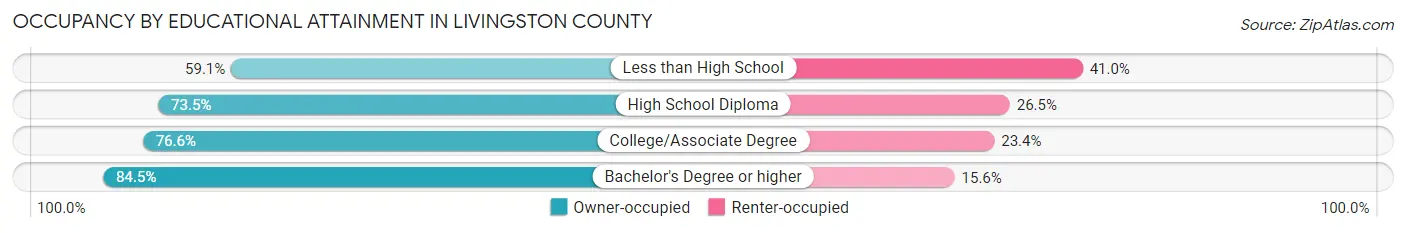
| Household Size | Owner-occupied | Renter-occupied |
| Less than High School | 910 (59.1%) | 631 (40.9%) |
| High School Diploma | 4,956 (73.5%) | 1,786 (26.5%) |
| College/Associate Degree | 6,352 (76.6%) | 1,943 (23.4%) |
| Bachelor's Degree or higher | 6,328 (84.5%) | 1,165 (15.5%) |
Occupancy by Age of Householder in Livingston County
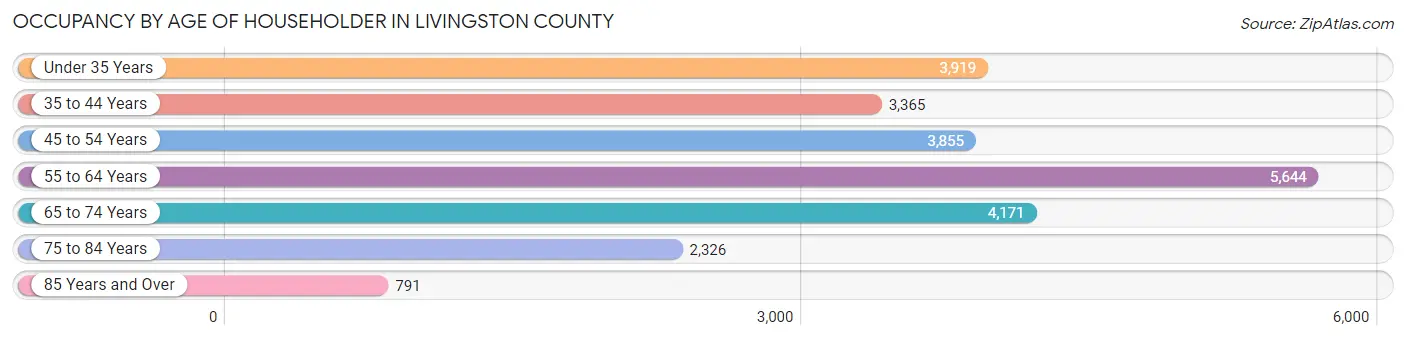
| Age Bracket | # Households | % Households |
| Under 35 Years | 3,919 | 16.3% |
| 35 to 44 Years | 3,365 | 14.0% |
| 45 to 54 Years | 3,855 | 16.0% |
| 55 to 64 Years | 5,644 | 23.4% |
| 65 to 74 Years | 4,171 | 17.3% |
| 75 to 84 Years | 2,326 | 9.7% |
| 85 Years and Over | 791 | 3.3% |
| Total | 24,071 | 100.0% |
Housing Finances in Livingston County
Median Income by Occupancy in Livingston County
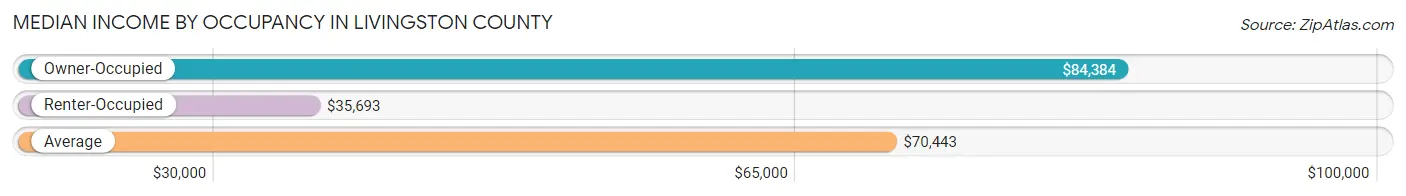
| Occupancy Type | # Households | Median Income |
| Owner-Occupied | 18,546 (77.0%) | $84,384 |
| Renter-Occupied | 5,525 (23.0%) | $35,693 |
| Average | 24,071 (100.0%) | $70,443 |
Occupancy by Householder Income Bracket in Livingston County
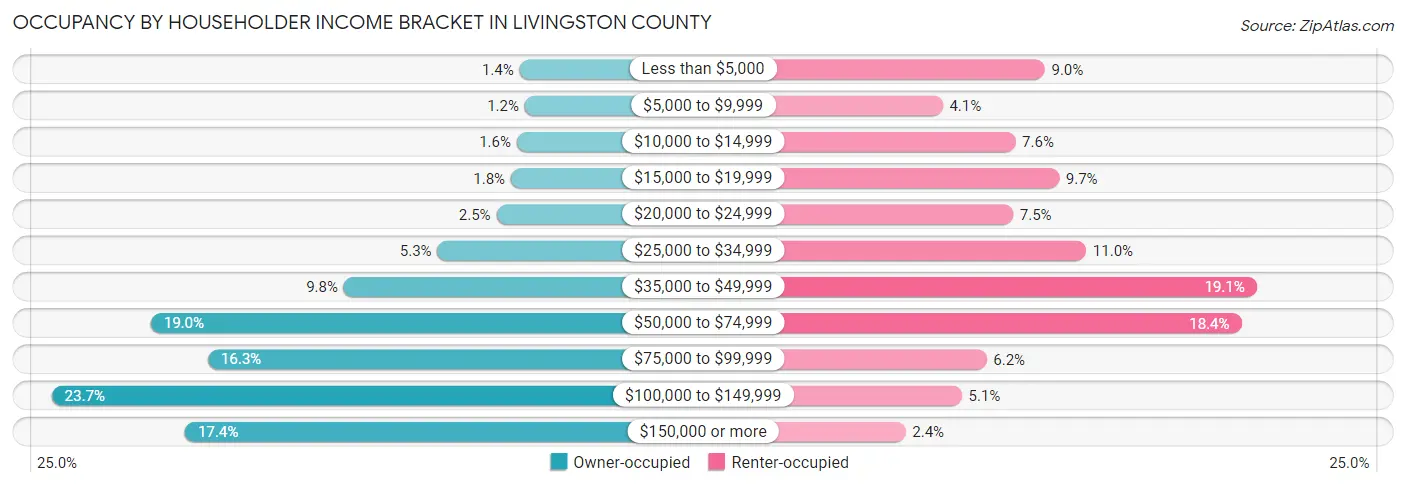
| Income Bracket | Owner-occupied | Renter-occupied |
| Less than $5,000 | 266 (1.4%) | 497 (9.0%) |
| $5,000 to $9,999 | 218 (1.2%) | 229 (4.1%) |
| $10,000 to $14,999 | 290 (1.6%) | 420 (7.6%) |
| $15,000 to $19,999 | 341 (1.8%) | 535 (9.7%) |
| $20,000 to $24,999 | 469 (2.5%) | 414 (7.5%) |
| $25,000 to $34,999 | 990 (5.3%) | 606 (11.0%) |
| $35,000 to $49,999 | 1,818 (9.8%) | 1,055 (19.1%) |
| $50,000 to $74,999 | 3,521 (19.0%) | 1,015 (18.4%) |
| $75,000 to $99,999 | 3,017 (16.3%) | 344 (6.2%) |
| $100,000 to $149,999 | 4,397 (23.7%) | 279 (5.1%) |
| $150,000 or more | 3,219 (17.4%) | 131 (2.4%) |
| Total | 18,546 (100.0%) | 5,525 (100.0%) |
Monthly Housing Cost Tiers in Livingston County
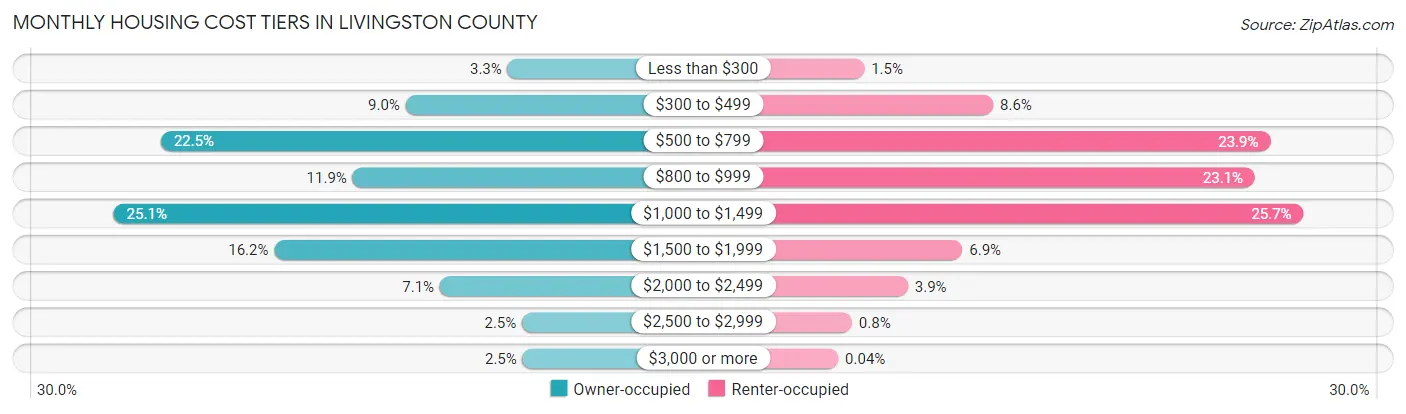
| Monthly Cost | Owner-occupied | Renter-occupied |
| Less than $300 | 616 (3.3%) | 82 (1.5%) |
| $300 to $499 | 1,660 (8.9%) | 475 (8.6%) |
| $500 to $799 | 4,169 (22.5%) | 1,321 (23.9%) |
| $800 to $999 | 2,204 (11.9%) | 1,274 (23.1%) |
| $1,000 to $1,499 | 4,652 (25.1%) | 1,422 (25.7%) |
| $1,500 to $1,999 | 3,006 (16.2%) | 381 (6.9%) |
| $2,000 to $2,499 | 1,309 (7.1%) | 215 (3.9%) |
| $2,500 to $2,999 | 468 (2.5%) | 44 (0.8%) |
| $3,000 or more | 462 (2.5%) | 2 (0.0%) |
| Total | 18,546 (100.0%) | 5,525 (100.0%) |
Physical Housing Characteristics in Livingston County
Housing Structures in Livingston County
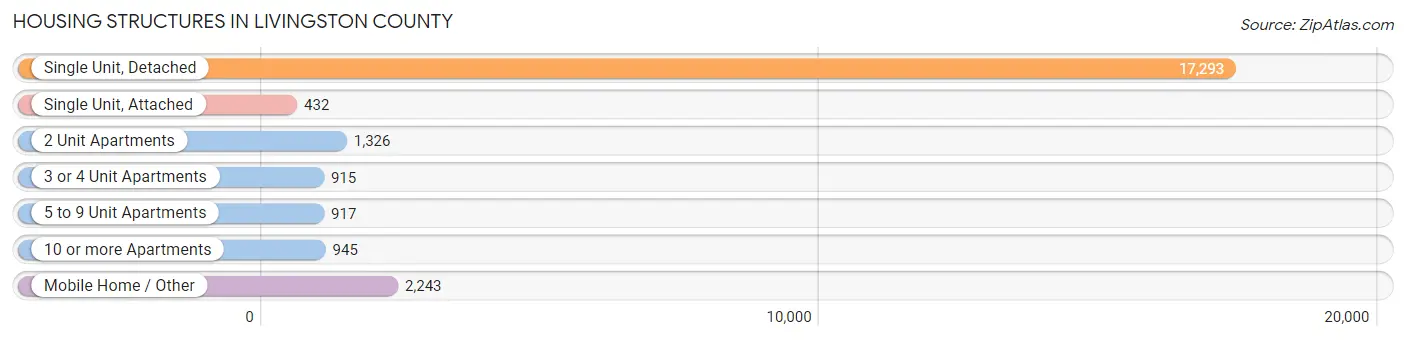
| Structure Type | # Housing Units | % Housing Units |
| Single Unit, Detached | 17,293 | 71.8% |
| Single Unit, Attached | 432 | 1.8% |
| 2 Unit Apartments | 1,326 | 5.5% |
| 3 or 4 Unit Apartments | 915 | 3.8% |
| 5 to 9 Unit Apartments | 917 | 3.8% |
| 10 or more Apartments | 945 | 3.9% |
| Mobile Home / Other | 2,243 | 9.3% |
| Total | 24,071 | 100.0% |
Housing Structures by Occupancy in Livingston County
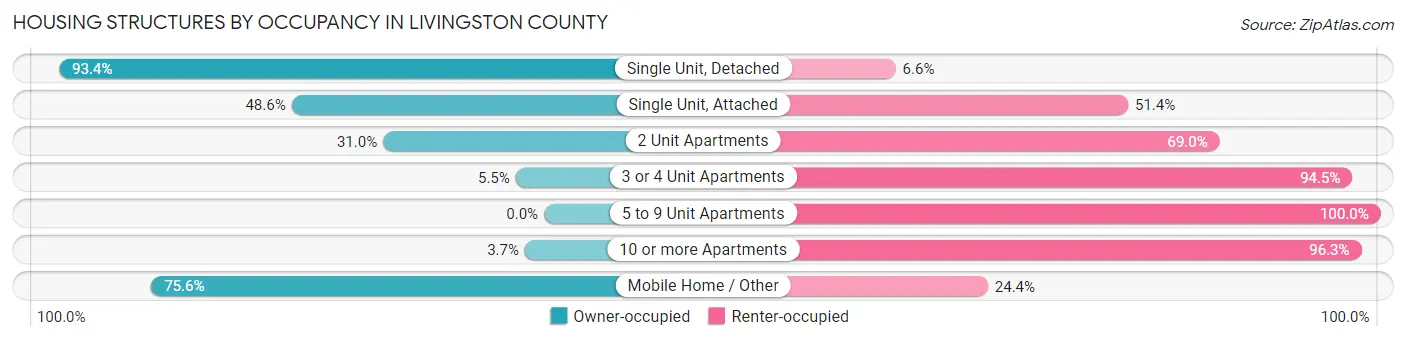
| Structure Type | Owner-occupied | Renter-occupied |
| Single Unit, Detached | 16,144 (93.4%) | 1,149 (6.6%) |
| Single Unit, Attached | 210 (48.6%) | 222 (51.4%) |
| 2 Unit Apartments | 411 (31.0%) | 915 (69.0%) |
| 3 or 4 Unit Apartments | 50 (5.5%) | 865 (94.5%) |
| 5 to 9 Unit Apartments | 0 (0.0%) | 917 (100.0%) |
| 10 or more Apartments | 35 (3.7%) | 910 (96.3%) |
| Mobile Home / Other | 1,696 (75.6%) | 547 (24.4%) |
| Total | 18,546 (77.0%) | 5,525 (23.0%) |
Housing Structures by Number of Rooms in Livingston County
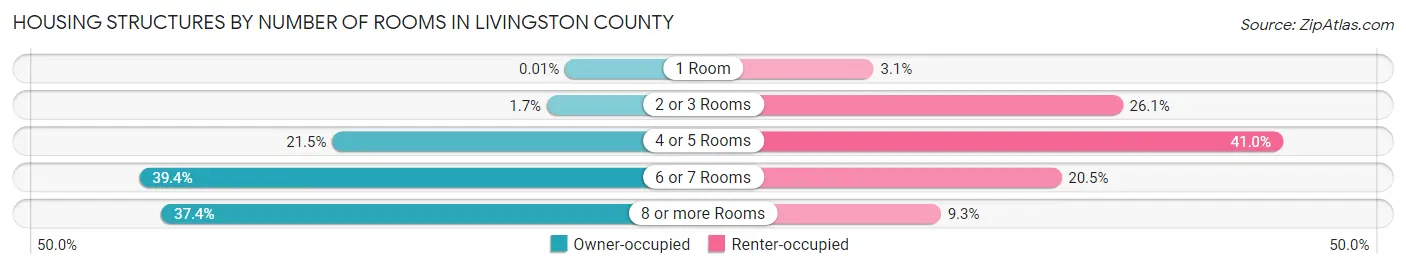
| Number of Rooms | Owner-occupied | Renter-occupied |
| 1 Room | 2 (0.0%) | 172 (3.1%) |
| 2 or 3 Rooms | 313 (1.7%) | 1,444 (26.1%) |
| 4 or 5 Rooms | 3,995 (21.5%) | 2,263 (41.0%) |
| 6 or 7 Rooms | 7,305 (39.4%) | 1,131 (20.5%) |
| 8 or more Rooms | 6,931 (37.4%) | 515 (9.3%) |
| Total | 18,546 (100.0%) | 5,525 (100.0%) |
Housing Structure by Heating Type in Livingston County
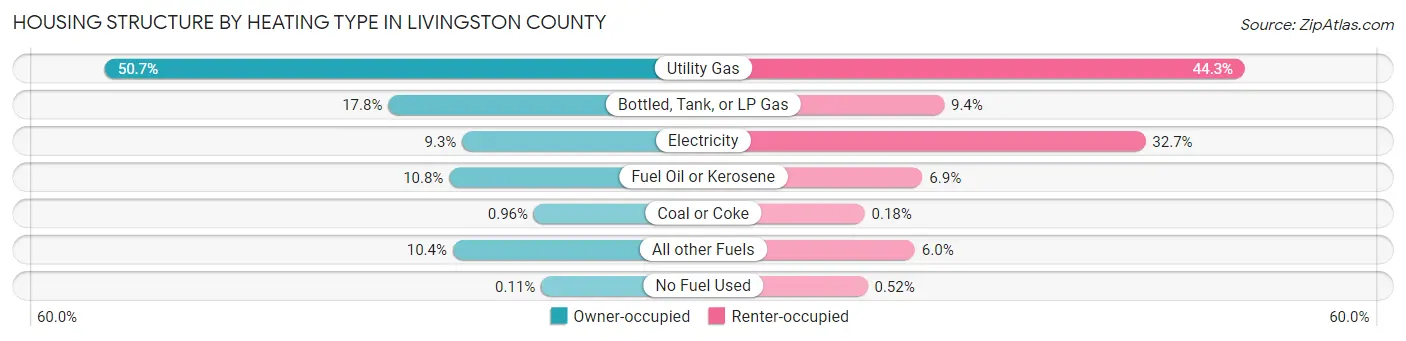
| Heating Type | Owner-occupied | Renter-occupied |
| Utility Gas | 9,403 (50.7%) | 2,446 (44.3%) |
| Bottled, Tank, or LP Gas | 3,308 (17.8%) | 519 (9.4%) |
| Electricity | 1,720 (9.3%) | 1,809 (32.7%) |
| Fuel Oil or Kerosene | 1,997 (10.8%) | 380 (6.9%) |
| Coal or Coke | 178 (1.0%) | 10 (0.2%) |
| All other Fuels | 1,919 (10.3%) | 332 (6.0%) |
| No Fuel Used | 21 (0.1%) | 29 (0.5%) |
| Total | 18,546 (100.0%) | 5,525 (100.0%) |
Household Vehicle Usage in Livingston County
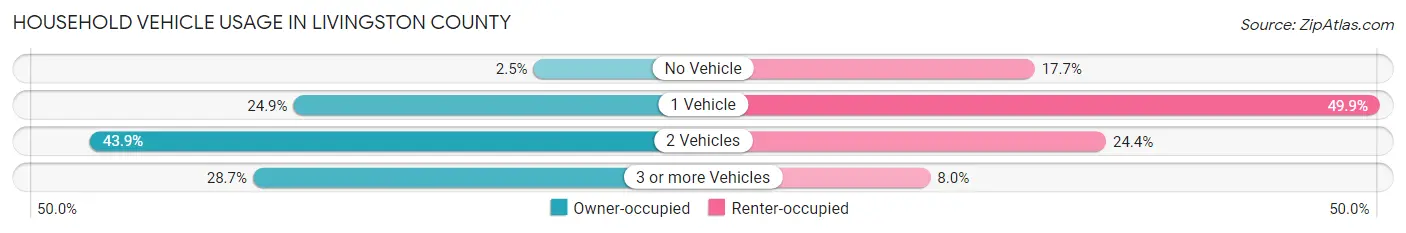
| Vehicles per Household | Owner-occupied | Renter-occupied |
| No Vehicle | 463 (2.5%) | 979 (17.7%) |
| 1 Vehicle | 4,619 (24.9%) | 2,758 (49.9%) |
| 2 Vehicles | 8,142 (43.9%) | 1,347 (24.4%) |
| 3 or more Vehicles | 5,322 (28.7%) | 441 (8.0%) |
| Total | 18,546 (100.0%) | 5,525 (100.0%) |
Real Estate & Mortgages in Livingston County
Real Estate and Mortgage Overview in Livingston County
| Characteristic | Without Mortgage | With Mortgage |
| Housing Units | 7,807 | 10,739 |
| Median Property Value | $148,200 | $166,700 |
| Median Household Income | $63,282 | $2,372 |
| Monthly Housing Costs | $634 | $458 |
| Real Estate Taxes | $3,573 | $401 |
Property Value by Mortgage Status in Livingston County
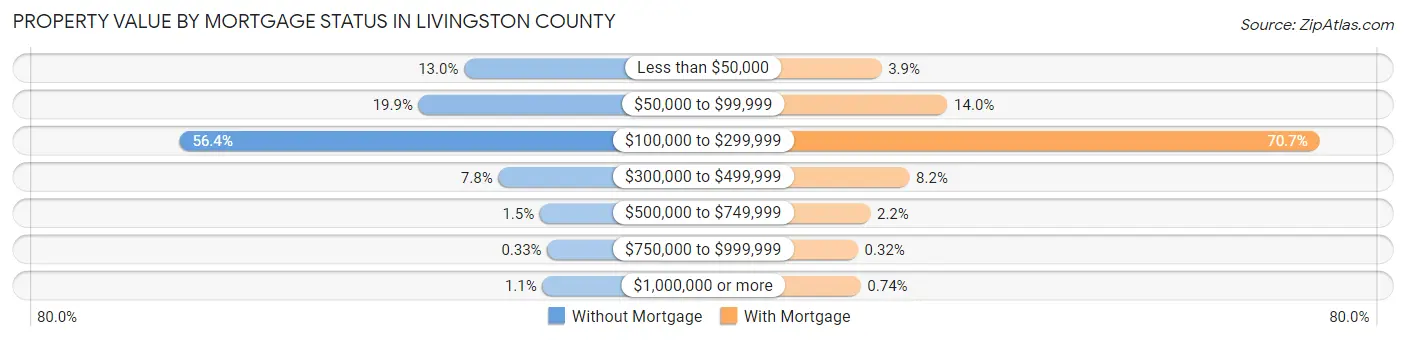
| Property Value | Without Mortgage | With Mortgage |
| Less than $50,000 | 1,016 (13.0%) | 420 (3.9%) |
| $50,000 to $99,999 | 1,557 (19.9%) | 1,499 (14.0%) |
| $100,000 to $299,999 | 4,402 (56.4%) | 7,593 (70.7%) |
| $300,000 to $499,999 | 608 (7.8%) | 877 (8.2%) |
| $500,000 to $749,999 | 114 (1.5%) | 237 (2.2%) |
| $750,000 to $999,999 | 26 (0.3%) | 34 (0.3%) |
| $1,000,000 or more | 84 (1.1%) | 79 (0.7%) |
| Total | 7,807 (100.0%) | 10,739 (100.0%) |
Household Income by Mortgage Status in Livingston County
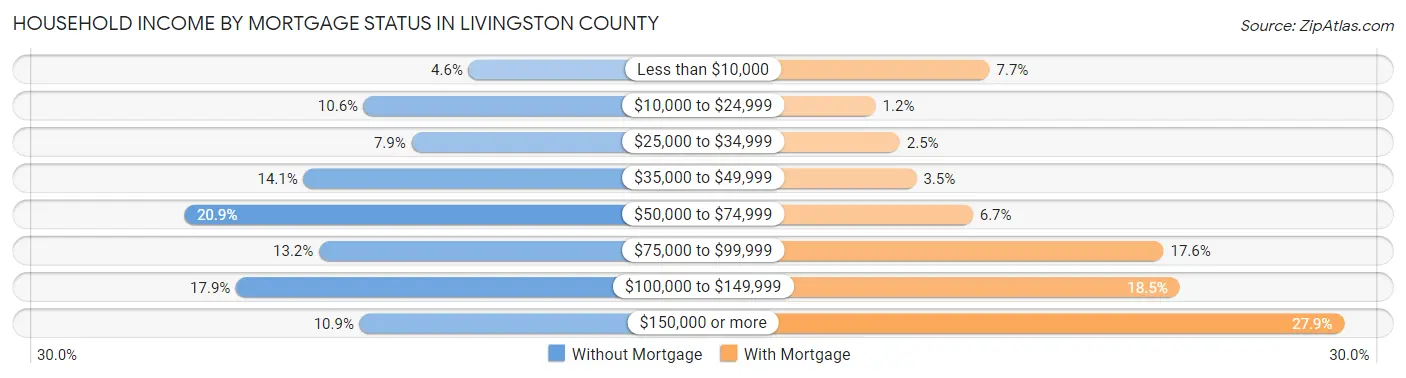
| Household Income | Without Mortgage | With Mortgage |
| Less than $10,000 | 361 (4.6%) | 823 (7.7%) |
| $10,000 to $24,999 | 828 (10.6%) | 123 (1.1%) |
| $25,000 to $34,999 | 616 (7.9%) | 272 (2.5%) |
| $35,000 to $49,999 | 1,098 (14.1%) | 374 (3.5%) |
| $50,000 to $74,999 | 1,631 (20.9%) | 720 (6.7%) |
| $75,000 to $99,999 | 1,028 (13.2%) | 1,890 (17.6%) |
| $100,000 to $149,999 | 1,398 (17.9%) | 1,989 (18.5%) |
| $150,000 or more | 847 (10.8%) | 2,999 (27.9%) |
| Total | 7,807 (100.0%) | 10,739 (100.0%) |
Property Value to Household Income Ratio in Livingston County
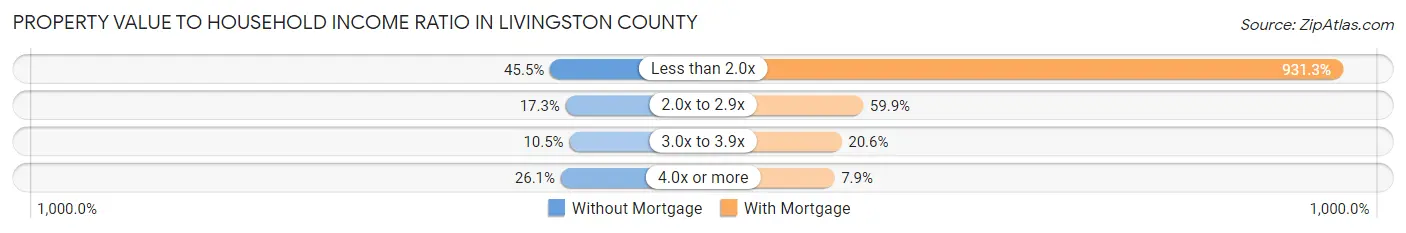
| Value-to-Income Ratio | Without Mortgage | With Mortgage |
| Less than 2.0x | 3,553 (45.5%) | 100,014 (931.3%) |
| 2.0x to 2.9x | 1,353 (17.3%) | 6,437 (59.9%) |
| 3.0x to 3.9x | 821 (10.5%) | 2,212 (20.6%) |
| 4.0x or more | 2,038 (26.1%) | 845 (7.9%) |
| Total | 7,807 (100.0%) | 10,739 (100.0%) |
Real Estate Taxes by Mortgage Status in Livingston County
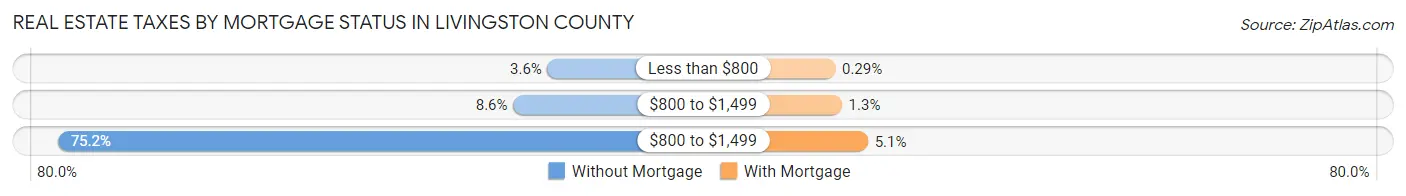
| Property Taxes | Without Mortgage | With Mortgage |
| Less than $800 | 279 (3.6%) | 31 (0.3%) |
| $800 to $1,499 | 670 (8.6%) | 135 (1.3%) |
| $800 to $1,499 | 5,868 (75.2%) | 544 (5.1%) |
| Total | 7,807 (100.0%) | 10,739 (100.0%) |
Health & Disability in Livingston County
Health Insurance Coverage by Age in Livingston County
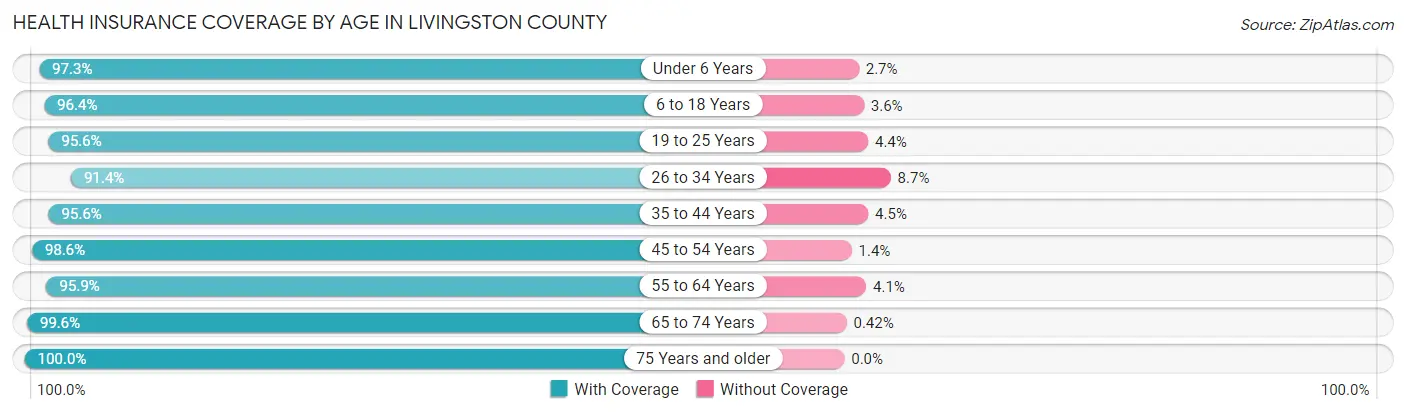
| Age Bracket | With Coverage | Without Coverage |
| Under 6 Years | 3,238 (97.3%) | 90 (2.7%) |
| 6 to 18 Years | 9,032 (96.4%) | 341 (3.6%) |
| 19 to 25 Years | 7,377 (95.6%) | 342 (4.4%) |
| 26 to 34 Years | 5,227 (91.3%) | 495 (8.6%) |
| 35 to 44 Years | 6,048 (95.6%) | 282 (4.4%) |
| 45 to 54 Years | 7,109 (98.6%) | 98 (1.4%) |
| 55 to 64 Years | 8,924 (95.9%) | 379 (4.1%) |
| 65 to 74 Years | 6,889 (99.6%) | 29 (0.4%) |
| 75 Years and older | 4,484 (100.0%) | 0 (0.0%) |
| Total | 58,328 (96.6%) | 2,056 (3.4%) |
Health Insurance Coverage by Citizenship Status in Livingston County
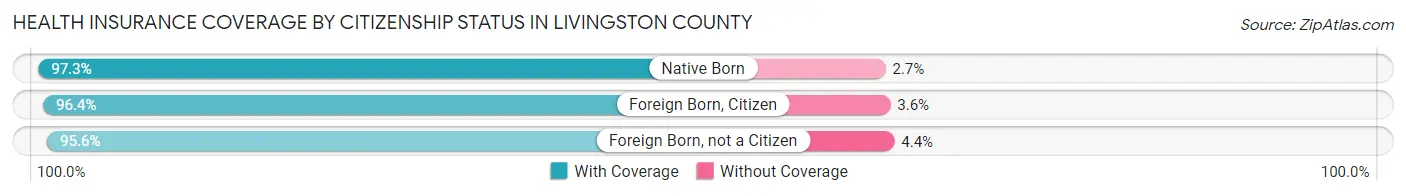
| Citizenship Status | With Coverage | Without Coverage |
| Native Born | 3,238 (97.3%) | 90 (2.7%) |
| Foreign Born, Citizen | 9,032 (96.4%) | 341 (3.6%) |
| Foreign Born, not a Citizen | 7,377 (95.6%) | 342 (4.4%) |
Health Insurance Coverage by Household Income in Livingston County
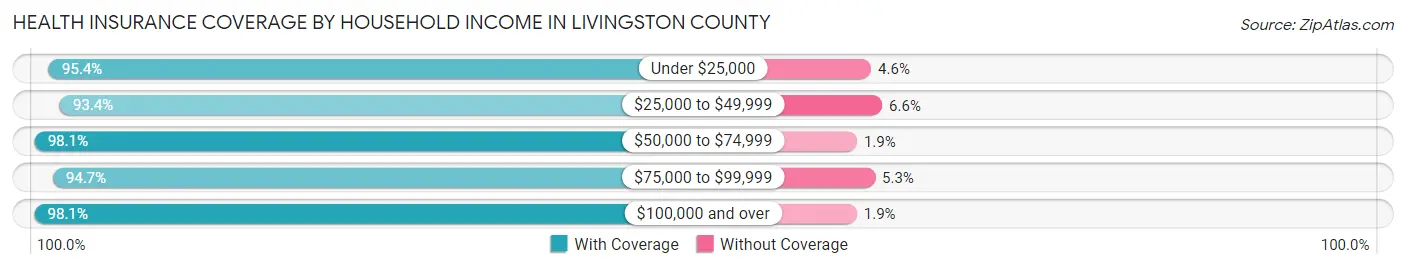
| Household Income | With Coverage | Without Coverage |
| Under $25,000 | 5,718 (95.4%) | 273 (4.6%) |
| $25,000 to $49,999 | 7,918 (93.4%) | 561 (6.6%) |
| $50,000 to $74,999 | 9,123 (98.1%) | 178 (1.9%) |
| $75,000 to $99,999 | 8,316 (94.7%) | 465 (5.3%) |
| $100,000 and over | 23,622 (98.1%) | 452 (1.9%) |
Public vs Private Health Insurance Coverage by Age in Livingston County
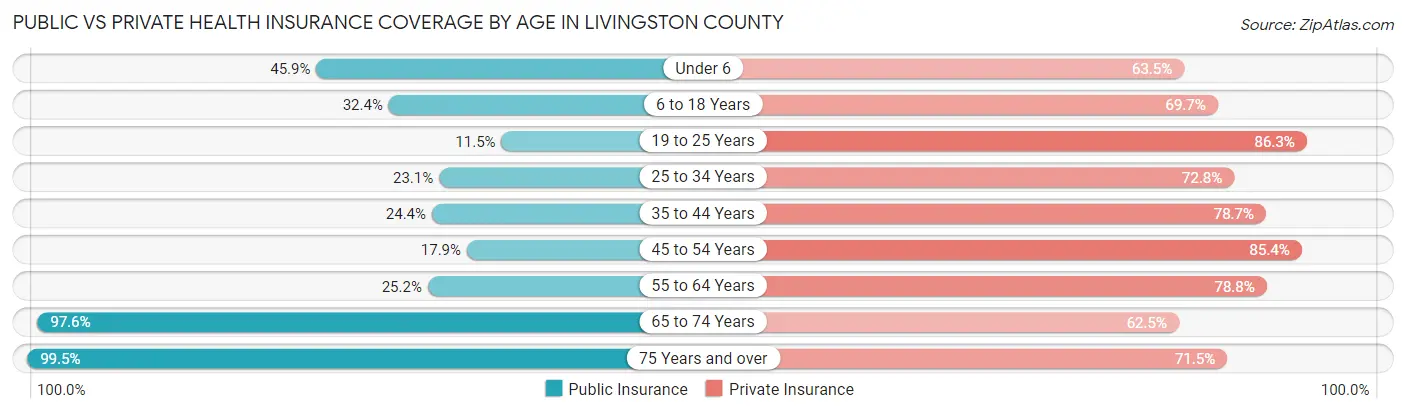
| Age Bracket | Public Insurance | Private Insurance |
| Under 6 | 1,526 (45.9%) | 2,114 (63.5%) |
| 6 to 18 Years | 3,038 (32.4%) | 6,537 (69.7%) |
| 19 to 25 Years | 888 (11.5%) | 6,660 (86.3%) |
| 25 to 34 Years | 1,320 (23.1%) | 4,166 (72.8%) |
| 35 to 44 Years | 1,545 (24.4%) | 4,982 (78.7%) |
| 45 to 54 Years | 1,291 (17.9%) | 6,151 (85.4%) |
| 55 to 64 Years | 2,342 (25.2%) | 7,334 (78.8%) |
| 65 to 74 Years | 6,754 (97.6%) | 4,326 (62.5%) |
| 75 Years and over | 4,462 (99.5%) | 3,206 (71.5%) |
| Total | 23,166 (38.4%) | 45,476 (75.3%) |
Disability Status by Sex by Age in Livingston County
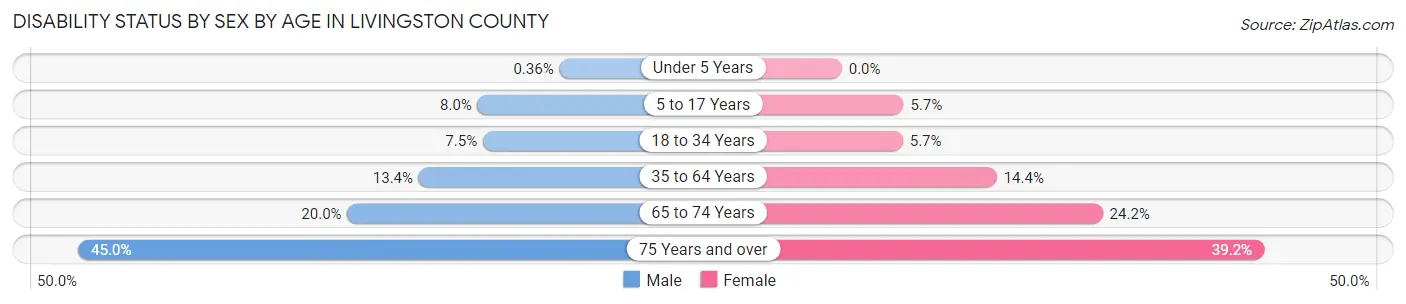
| Age Bracket | Male | Female |
| Under 5 Years | 5 (0.4%) | 0 (0.0%) |
| 5 to 17 Years | 347 (8.0%) | 232 (5.7%) |
| 18 to 34 Years | 545 (7.5%) | 441 (5.7%) |
| 35 to 64 Years | 1,525 (13.4%) | 1,649 (14.4%) |
| 65 to 74 Years | 677 (20.0%) | 857 (24.2%) |
| 75 Years and over | 880 (45.0%) | 991 (39.2%) |
Disability Class by Sex by Age in Livingston County
Disability Class: Hearing Difficulty
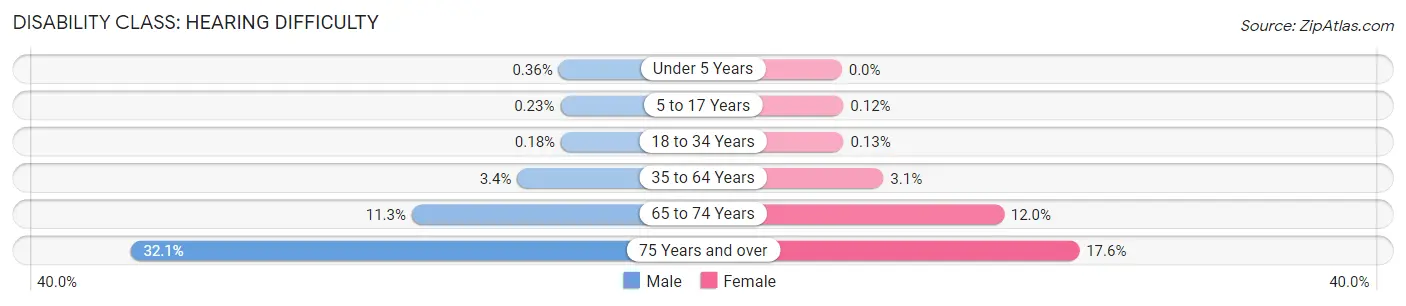
| Age Bracket | Male | Female |
| Under 5 Years | 5 (0.4%) | 0 (0.0%) |
| 5 to 17 Years | 10 (0.2%) | 5 (0.1%) |
| 18 to 34 Years | 13 (0.2%) | 10 (0.1%) |
| 35 to 64 Years | 389 (3.4%) | 354 (3.1%) |
| 65 to 74 Years | 380 (11.3%) | 426 (12.0%) |
| 75 Years and over | 628 (32.1%) | 446 (17.6%) |
Disability Class: Vision Difficulty
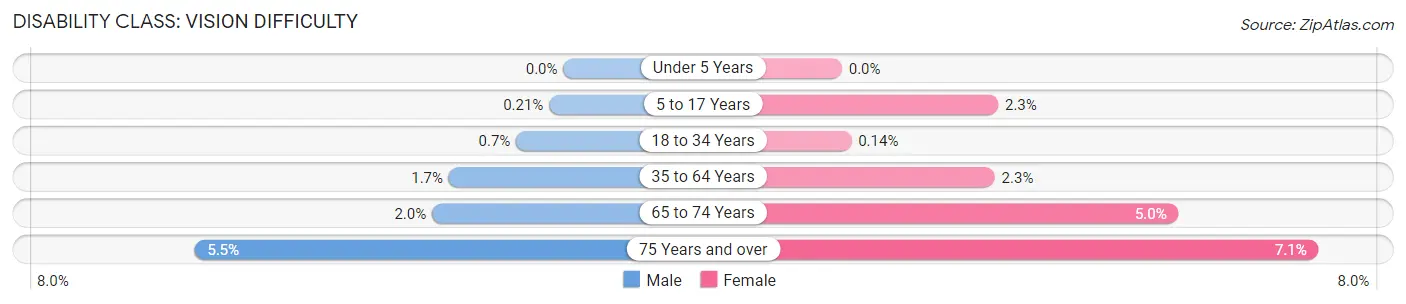
| Age Bracket | Male | Female |
| Under 5 Years | 0 (0.0%) | 0 (0.0%) |
| 5 to 17 Years | 9 (0.2%) | 94 (2.3%) |
| 18 to 34 Years | 51 (0.7%) | 11 (0.1%) |
| 35 to 64 Years | 193 (1.7%) | 260 (2.3%) |
| 65 to 74 Years | 66 (1.9%) | 177 (5.0%) |
| 75 Years and over | 107 (5.5%) | 179 (7.1%) |
Disability Class: Cognitive Difficulty
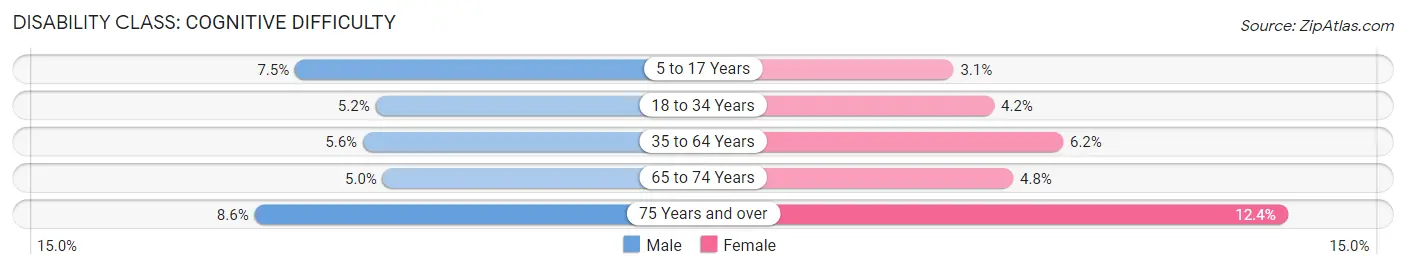
| Age Bracket | Male | Female |
| 5 to 17 Years | 326 (7.5%) | 126 (3.1%) |
| 18 to 34 Years | 382 (5.2%) | 330 (4.2%) |
| 35 to 64 Years | 635 (5.6%) | 707 (6.2%) |
| 65 to 74 Years | 170 (5.0%) | 169 (4.8%) |
| 75 Years and over | 168 (8.6%) | 314 (12.4%) |
Disability Class: Ambulatory Difficulty
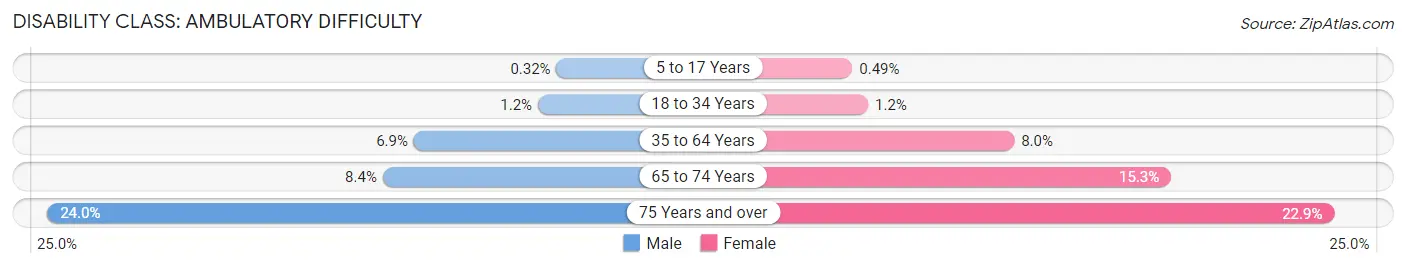
| Age Bracket | Male | Female |
| 5 to 17 Years | 14 (0.3%) | 20 (0.5%) |
| 18 to 34 Years | 86 (1.2%) | 95 (1.2%) |
| 35 to 64 Years | 789 (6.9%) | 918 (8.0%) |
| 65 to 74 Years | 283 (8.4%) | 541 (15.3%) |
| 75 Years and over | 468 (23.9%) | 578 (22.9%) |
Disability Class: Self-Care Difficulty
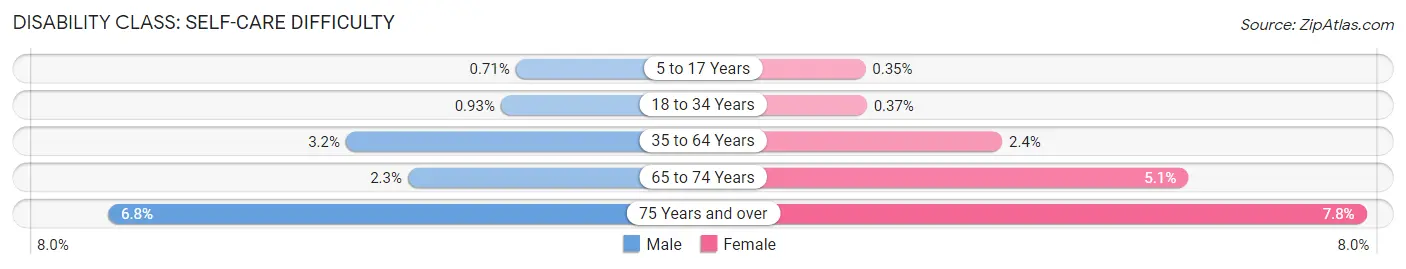
| Age Bracket | Male | Female |
| 5 to 17 Years | 31 (0.7%) | 14 (0.4%) |
| 18 to 34 Years | 68 (0.9%) | 29 (0.4%) |
| 35 to 64 Years | 367 (3.2%) | 273 (2.4%) |
| 65 to 74 Years | 78 (2.3%) | 182 (5.1%) |
| 75 Years and over | 132 (6.8%) | 197 (7.8%) |
Technology Access in Livingston County
Computing Device Access in Livingston County
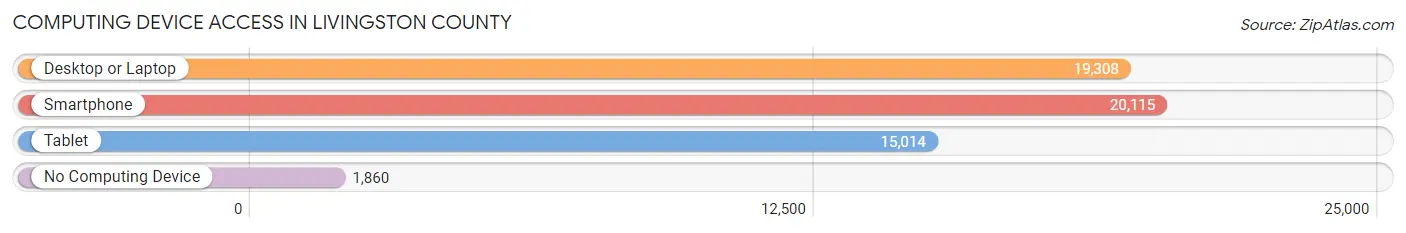
| Device Type | # Households | % Households |
| Desktop or Laptop | 19,308 | 80.2% |
| Smartphone | 20,115 | 83.6% |
| Tablet | 15,014 | 62.4% |
| No Computing Device | 1,860 | 7.7% |
| Total | 24,071 | 100.0% |
Internet Access in Livingston County
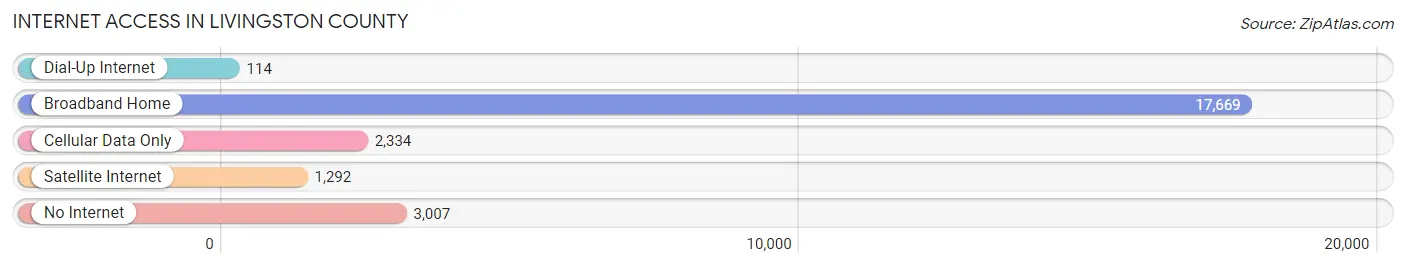
| Internet Type | # Households | % Households |
| Dial-Up Internet | 114 | 0.5% |
| Broadband Home | 17,669 | 73.4% |
| Cellular Data Only | 2,334 | 9.7% |
| Satellite Internet | 1,292 | 5.4% |
| No Internet | 3,007 | 12.5% |
| Total | 24,071 | 100.0% |
Livingston County Summary
Livingston County is located in the western part of New York State, and is part of the Finger Lakes region. It is bordered by Monroe, Ontario, Yates, Steuben, Allegany, and Wyoming counties. The county seat is Geneseo, and the largest city is Mount Morris. The county was established in 1821 and named after Robert R. Livingston, a member of the Committee of Five that drafted the Declaration of Independence.
Geography
Livingston County covers an area of 577 square miles, making it the fourth largest county in New York State. The terrain is mostly rolling hills, with some flat areas in the northern and western parts of the county. The highest point in the county is the summit of Conesus Hill, which is 1,945 feet above sea level. The Genesee River flows through the county, and there are several smaller streams and creeks. The county is home to several state parks, including Letchworth State Park, which is known for its spectacular waterfalls and gorges.
Demographics
As of the 2010 census, Livingston County had a population of 65,393. The population density was 113 people per square mile. The racial makeup of the county was 94.3% White, 2.3% African American, 0.5% Native American, 1.2% Asian, 0.1% Pacific Islander, 0.7% from other races, and 1.0% from two or more races. Hispanic or Latino of any race were 2.7% of the population.
The median income for a household in the county was $50,945, and the median income for a family was $60,945. The per capita income for the county was $24,845. About 6.2% of families and 10.2% of the population were below the poverty line, including 11.3% of those under age 18 and 6.2% of those age 65 or over.
Economy
Livingston County has a diverse economy, with a mix of manufacturing, agriculture, and tourism. The county is home to several large manufacturing companies, including Eastman Kodak, Xerox, and Bausch & Lomb. Agriculture is also an important part of the economy, with dairy farming being the most common type of farming. Tourism is also a major industry in the county, with Letchworth State Park being a popular destination for visitors.
History
Livingston County was first settled in the late 1700s by pioneers from New England. The county was officially established in 1821, and the first county seat was established in Geneseo. The county grew rapidly in the 19th century, and by the mid-1800s it was one of the most prosperous counties in the state. The county continued to grow and develop throughout the 20th century, and today it is a vibrant and diverse community.
Common Questions
What is Per Capita Income in Livingston County?
Per Capita income in Livingston County is $35,673.
What is the Median Family Income in Livingston County?
Median Family Income in Livingston County is $89,466.
What is the Median Household income in Livingston County?
Median Household Income in Livingston County is $70,443.
What is Income or Wage Gap in Livingston County?
Income or Wage Gap in Livingston County is 33.4%.
Women in Livingston County earn 66.6 cents for every dollar earned by a man.
What is Family Income Deficit in Livingston County?
Family Income Deficit in Livingston County is $12,918.
Families that are below poverty line in Livingston County earn $12,918 less on average than the poverty threshold level.
What is Inequality or Gini Index in Livingston County?
Inequality or Gini Index in Livingston County is 0.43.
What is the Total Population of Livingston County?
Total Population of Livingston County is 61,980.
What is the Total Male Population of Livingston County?
Total Male Population of Livingston County is 31,139.
What is the Total Female Population of Livingston County?
Total Female Population of Livingston County is 30,841.
What is the Ratio of Males per 100 Females in Livingston County?
There are 100.97 Males per 100 Females in Livingston County.
What is the Ratio of Females per 100 Males in Livingston County?
There are 99.04 Females per 100 Males in Livingston County.
What is the Median Population Age in Livingston County?
Median Population Age in Livingston County is 41.7 Years.
What is the Average Family Size in Livingston County
Average Family Size in Livingston County is 2.9 People.
What is the Average Household Size in Livingston County
Average Household Size in Livingston County is 2.4 People.
How Large is the Labor Force in Livingston County?
There are 30,356 People in the Labor Forcein in Livingston County.
What is the Percentage of People in the Labor Force in Livingston County?
58.1% of People are in the Labor Force in Livingston County.
What is the Unemployment Rate in Livingston County?
Unemployment Rate in Livingston County is 4.7%.