Genesee County, NY Map & Demographics
Genesee County Map
Genesee County Overview
$35,053
PER CAPITA INCOME
$86,700
AVG FAMILY INCOME
$68,178
AVG HOUSEHOLD INCOME
38.6%
WAGE / INCOME GAP [ % ]
61.4¢/ $1
WAGE / INCOME GAP [ $ ]
$10,556
FAMILY INCOME DEFICIT
0.41
INEQUALITY / GINI INDEX
58,204
TOTAL POPULATION
29,171
MALE POPULATION
29,033
FEMALE POPULATION
100.48
MALES / 100 FEMALES
99.53
FEMALES / 100 MALES
42.7
MEDIAN AGE
2.9
AVG FAMILY SIZE
2.3
AVG HOUSEHOLD SIZE
30,319
LABOR FORCE [ PEOPLE ]
63.7%
PERCENT IN LABOR FORCE
4.7%
UNEMPLOYMENT RATE
Genesee County Area Codes
Income in Genesee County
Income Overview in Genesee County
Per Capita Income in Genesee County is $35,053, while median incomes of families and households are $86,700 and $68,178 respectively.
| Characteristic | Number | Measure |
| Per Capita Income | 58,204 | $35,053 |
| Median Family Income | 15,044 | $86,700 |
| Mean Family Income | 15,044 | $100,644 |
| Median Household Income | 24,416 | $68,178 |
| Mean Household Income | 24,416 | $83,313 |
| Income Deficit | 15,044 | $10,556 |
| Wage / Income Gap (%) | 58,204 | 38.64% |
| Wage / Income Gap ($) | 58,204 | 61.36¢ per $1 |
| Gini / Inequality Index | 58,204 | 0.41 |
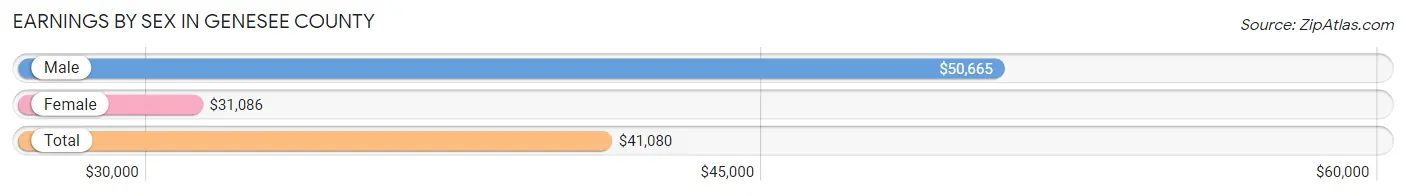
Earnings by Sex in Genesee County
Average Earnings in Genesee County are $41,080, $50,665 for men and $31,086 for women, a difference of 38.6%.
| Sex | Number | Average Earnings |
| Male | 16,682 (52.9%) | $50,665 |
| Female | 14,844 (47.1%) | $31,086 |
| Total | 31,526 (100.0%) | $41,080 |
Earnings by Sex by Income Bracket in Genesee County
The most common earnings brackets in Genesee County are $75,000 to $99,999 for men (2,404 | 14.4%) and $55,000 to $64,999 for women (1,213 | 8.2%).
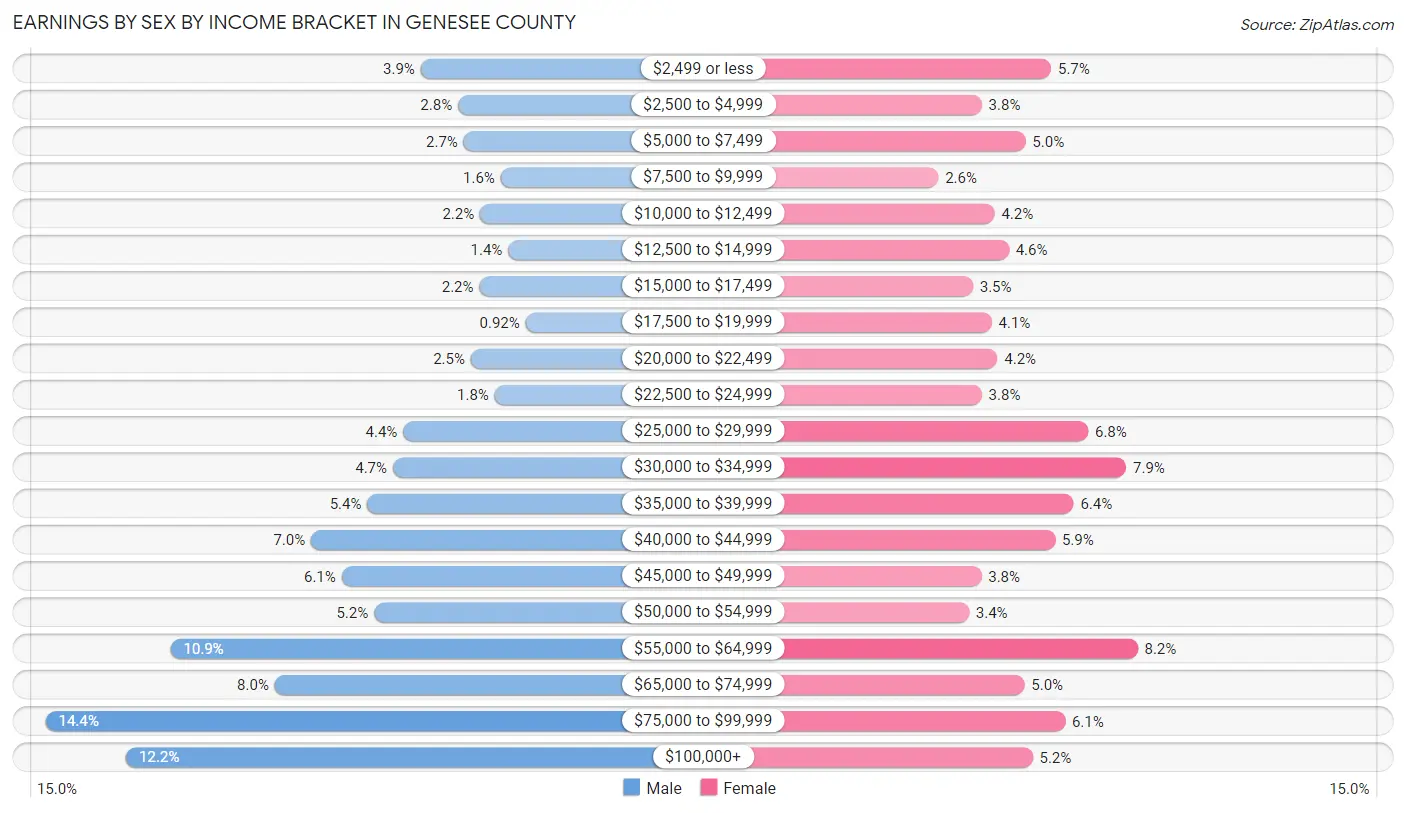
| Income | Male | Female |
| $2,499 or less | 646 (3.9%) | 852 (5.7%) |
| $2,500 to $4,999 | 470 (2.8%) | 562 (3.8%) |
| $5,000 to $7,499 | 443 (2.7%) | 745 (5.0%) |
| $7,500 to $9,999 | 271 (1.6%) | 381 (2.6%) |
| $10,000 to $12,499 | 367 (2.2%) | 616 (4.2%) |
| $12,500 to $14,999 | 235 (1.4%) | 675 (4.5%) |
| $15,000 to $17,499 | 370 (2.2%) | 525 (3.5%) |
| $17,500 to $19,999 | 154 (0.9%) | 604 (4.1%) |
| $20,000 to $22,499 | 410 (2.5%) | 628 (4.2%) |
| $22,500 to $24,999 | 299 (1.8%) | 562 (3.8%) |
| $25,000 to $29,999 | 727 (4.4%) | 1,007 (6.8%) |
| $30,000 to $34,999 | 775 (4.6%) | 1,165 (7.9%) |
| $35,000 to $39,999 | 895 (5.4%) | 946 (6.4%) |
| $40,000 to $44,999 | 1,160 (7.0%) | 868 (5.9%) |
| $45,000 to $49,999 | 1,016 (6.1%) | 561 (3.8%) |
| $50,000 to $54,999 | 864 (5.2%) | 509 (3.4%) |
| $55,000 to $64,999 | 1,819 (10.9%) | 1,213 (8.2%) |
| $65,000 to $74,999 | 1,330 (8.0%) | 740 (5.0%) |
| $75,000 to $99,999 | 2,404 (14.4%) | 910 (6.1%) |
| $100,000+ | 2,027 (12.1%) | 775 (5.2%) |
| Total | 16,682 (100.0%) | 14,844 (100.0%) |
Earnings by Sex by Educational Attainment in Genesee County
Average earnings in Genesee County are $54,871 for men and $35,320 for women, a difference of 35.6%. Men with an educational attainment of bachelor's degree enjoy the highest average annual earnings of $75,798, while those with less than high school education earn the least with $30,750. Women with an educational attainment of graduate degree earn the most with the average annual earnings of $62,031, while those with less than high school education have the smallest earnings of $16,378.
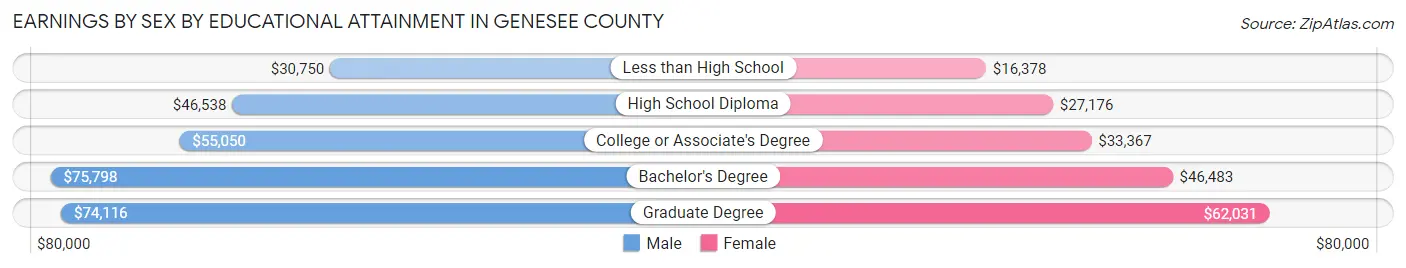
| Educational Attainment | Male Income | Female Income |
| Less than High School | $30,750 | $16,378 |
| High School Diploma | $46,538 | $27,176 |
| College or Associate's Degree | $55,050 | $33,367 |
| Bachelor's Degree | $75,798 | $46,483 |
| Graduate Degree | $74,116 | $62,031 |
| Total | $54,871 | $35,320 |
Family Income in Genesee County
Family Income Brackets in Genesee County
According to the Genesee County family income data, there are 3,656 families falling into the $100,000 to $149,999 income range, which is the most common income bracket and makes up 24.3% of all families. Conversely, the $10,000 to $14,999 income bracket is the least frequent group with only 226 families (1.5%) belonging to this category.
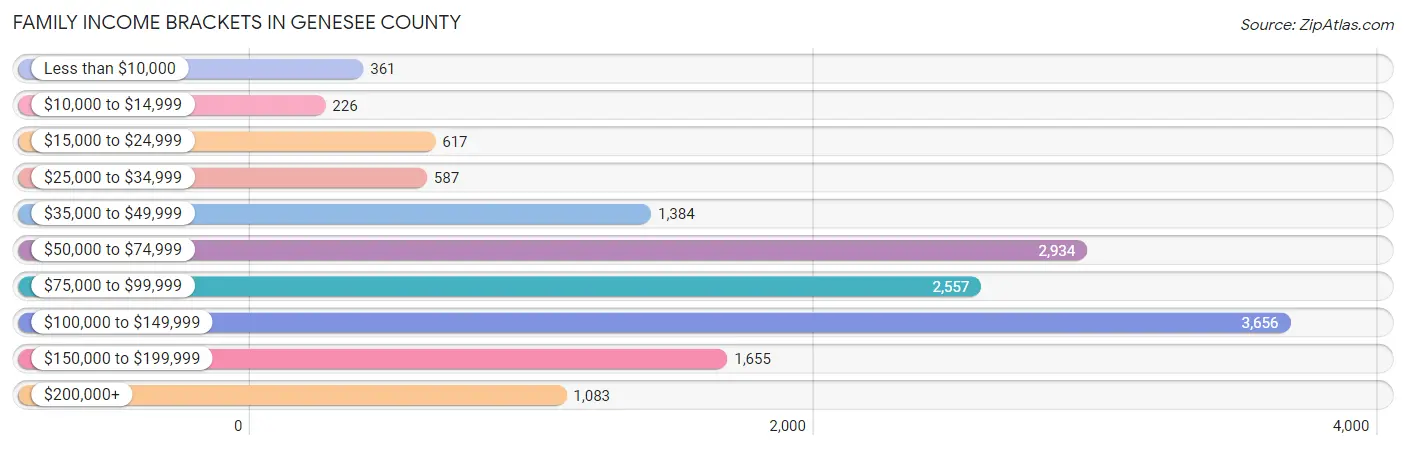
| Income Bracket | # Families | % Families |
| Less than $10,000 | 361 | 2.4% |
| $10,000 to $14,999 | 226 | 1.5% |
| $15,000 to $24,999 | 617 | 4.1% |
| $25,000 to $34,999 | 587 | 3.9% |
| $35,000 to $49,999 | 1,384 | 9.2% |
| $50,000 to $74,999 | 2,934 | 19.5% |
| $75,000 to $99,999 | 2,557 | 17.0% |
| $100,000 to $149,999 | 3,656 | 24.3% |
| $150,000 to $199,999 | 1,655 | 11.0% |
| $200,000+ | 1,083 | 7.2% |
Family Income by Famaliy Size in Genesee County
5-person families (880 | 5.9%) account for the highest median family income in Genesee County with $133,295 per family, while 2-person families (7,972 | 53.0%) have the highest median income of $37,374 per family member.
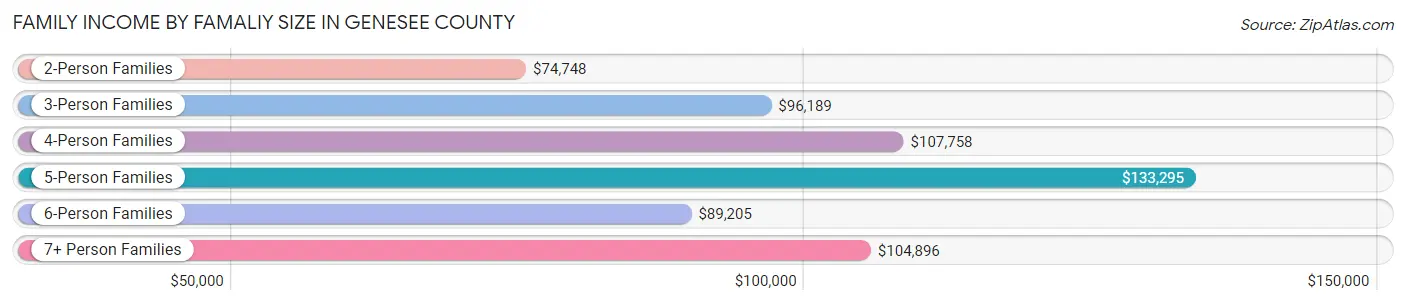
| Income Bracket | # Families | Median Income |
| 2-Person Families | 7,972 (53.0%) | $74,748 |
| 3-Person Families | 3,275 (21.8%) | $96,189 |
| 4-Person Families | 2,341 (15.6%) | $107,758 |
| 5-Person Families | 880 (5.9%) | $133,295 |
| 6-Person Families | 413 (2.8%) | $89,205 |
| 7+ Person Families | 163 (1.1%) | $104,896 |
| Total | 15,044 (100.0%) | $86,700 |
Family Income by Number of Earners in Genesee County
The median family income in Genesee County is $86,700, with families comprising 3+ earners (1,993) having the highest median family income of $147,371, while families with no earners (2,481) have the lowest median family income of $46,392, accounting for 13.3% and 16.5% of families, respectively.
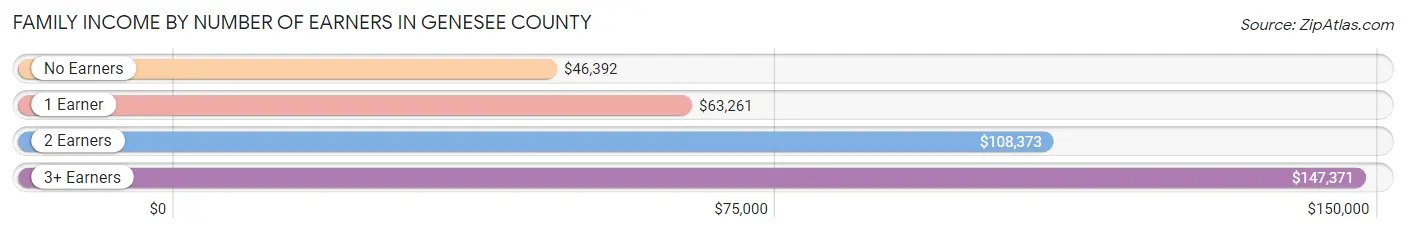
| Number of Earners | # Families | Median Income |
| No Earners | 2,481 (16.5%) | $46,392 |
| 1 Earner | 4,054 (27.0%) | $63,261 |
| 2 Earners | 6,516 (43.3%) | $108,373 |
| 3+ Earners | 1,993 (13.3%) | $147,371 |
| Total | 15,044 (100.0%) | $86,700 |
Household Income in Genesee County
Household Income Brackets in Genesee County
With 4,322 households falling in the category, the $50,000 to $74,999 income range is the most frequent in Genesee County, accounting for 17.7% of all households. In contrast, only 903 households (3.7%) fall into the $10,000 to $14,999 income bracket, making it the least populous group.
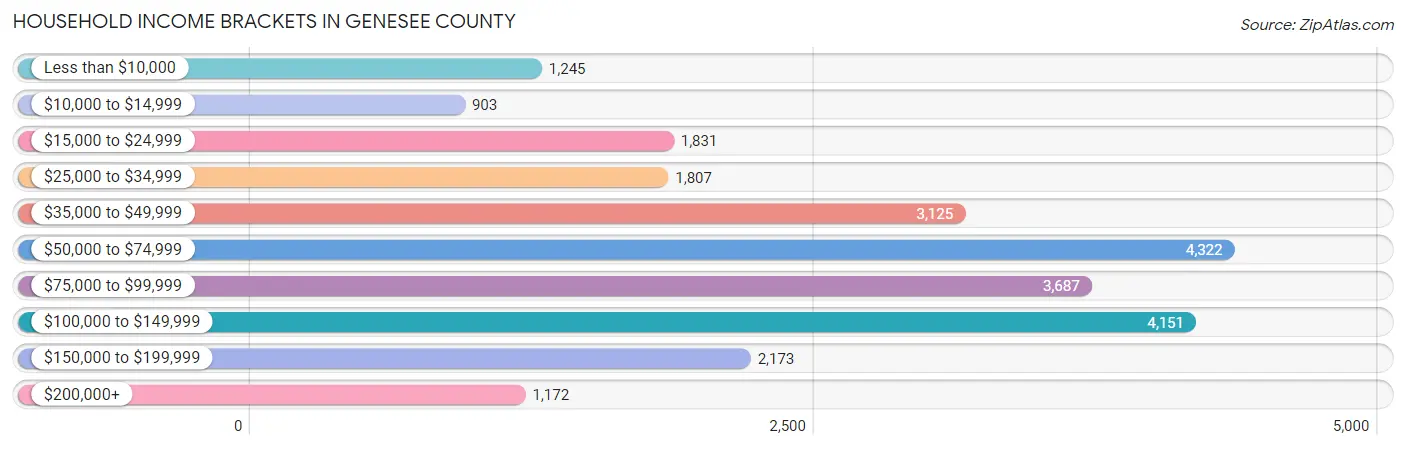
| Income Bracket | # Households | % Households |
| Less than $10,000 | 1,245 | 5.1% |
| $10,000 to $14,999 | 903 | 3.7% |
| $15,000 to $24,999 | 1,831 | 7.5% |
| $25,000 to $34,999 | 1,807 | 7.4% |
| $35,000 to $49,999 | 3,125 | 12.8% |
| $50,000 to $74,999 | 4,322 | 17.7% |
| $75,000 to $99,999 | 3,687 | 15.1% |
| $100,000 to $149,999 | 4,151 | 17.0% |
| $150,000 to $199,999 | 2,173 | 8.9% |
| $200,000+ | 1,172 | 4.8% |
Household Income by Householder Age in Genesee County
The median household income in Genesee County is $68,178, with the highest median household income of $82,001 found in the 45 to 64 years age bracket for the primary householder. A total of 9,373 households (38.4%) fall into this category. Meanwhile, the 65+ years age bracket for the primary householder has the lowest median household income of $45,779, with 7,361 households (30.1%) in this group.
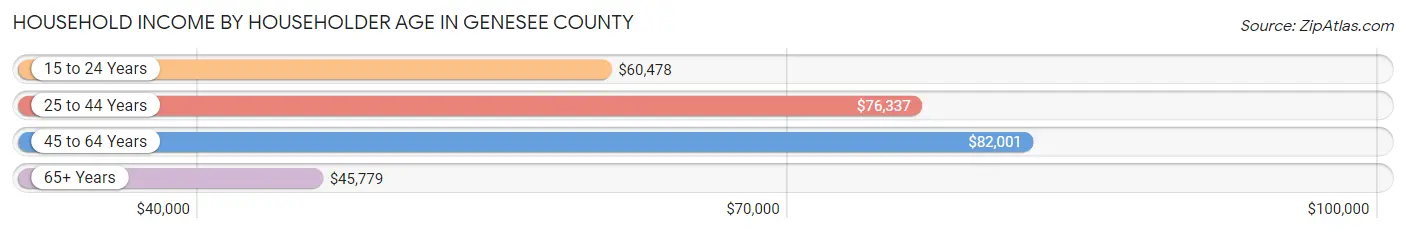
| Income Bracket | # Households | Median Income |
| 15 to 24 Years | 779 (3.2%) | $60,478 |
| 25 to 44 Years | 6,903 (28.3%) | $76,337 |
| 45 to 64 Years | 9,373 (38.4%) | $82,001 |
| 65+ Years | 7,361 (30.1%) | $45,779 |
| Total | 24,416 (100.0%) | $68,178 |
Poverty in Genesee County
Income Below Poverty by Sex and Age in Genesee County
With 8.8% poverty level for males and 12.1% for females among the residents of Genesee County, 15 year old males and 55 to 64 year old females are the most vulnerable to poverty, with 145 males (32.6%) and 750 females (16.6%) in their respective age groups living below the poverty level.
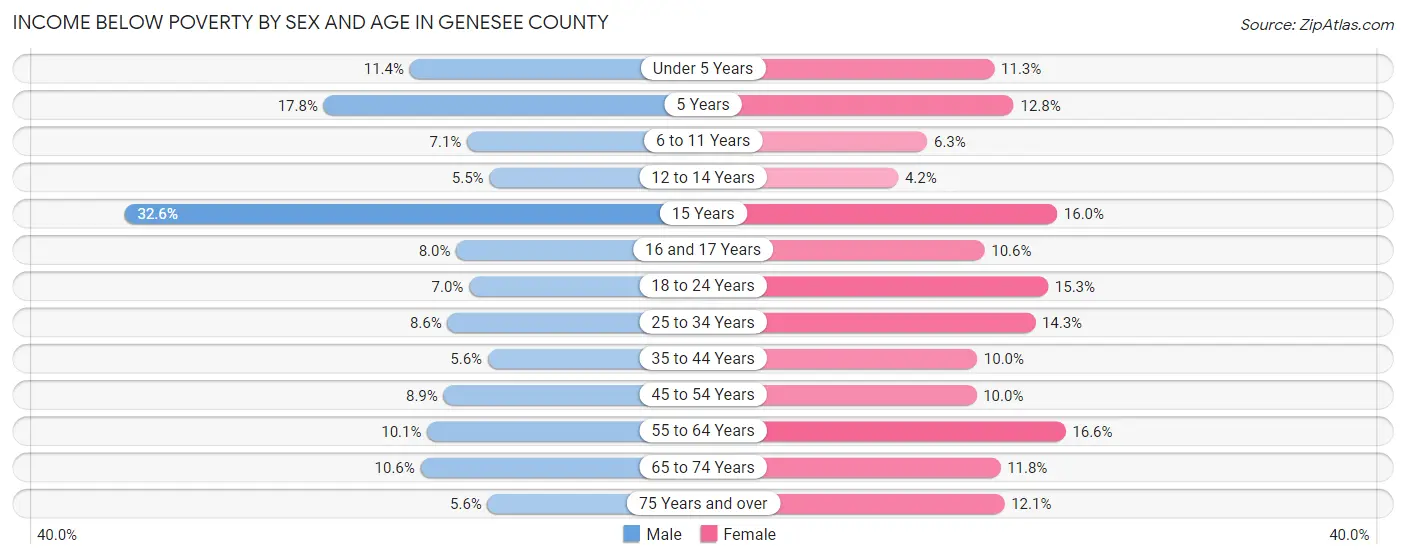
| Age Bracket | Male | Female |
| Under 5 Years | 172 (11.4%) | 164 (11.3%) |
| 5 Years | 37 (17.8%) | 45 (12.8%) |
| 6 to 11 Years | 133 (7.1%) | 123 (6.3%) |
| 12 to 14 Years | 59 (5.5%) | 38 (4.2%) |
| 15 Years | 145 (32.6%) | 69 (16.0%) |
| 16 and 17 Years | 50 (8.0%) | 62 (10.6%) |
| 18 to 24 Years | 159 (7.0%) | 340 (15.3%) |
| 25 to 34 Years | 327 (8.6%) | 481 (14.3%) |
| 35 to 44 Years | 193 (5.6%) | 330 (10.0%) |
| 45 to 54 Years | 337 (8.9%) | 365 (10.0%) |
| 55 to 64 Years | 455 (10.1%) | 750 (16.6%) |
| 65 to 74 Years | 328 (10.6%) | 378 (11.8%) |
| 75 Years and over | 106 (5.6%) | 328 (12.1%) |
| Total | 2,501 (8.8%) | 3,473 (12.1%) |
Income Above Poverty by Sex and Age in Genesee County
According to the poverty statistics in Genesee County, males aged 12 to 14 years and females aged 12 to 14 years are the age groups that are most secure financially, with 94.5% of males and 95.8% of females in these age groups living above the poverty line.
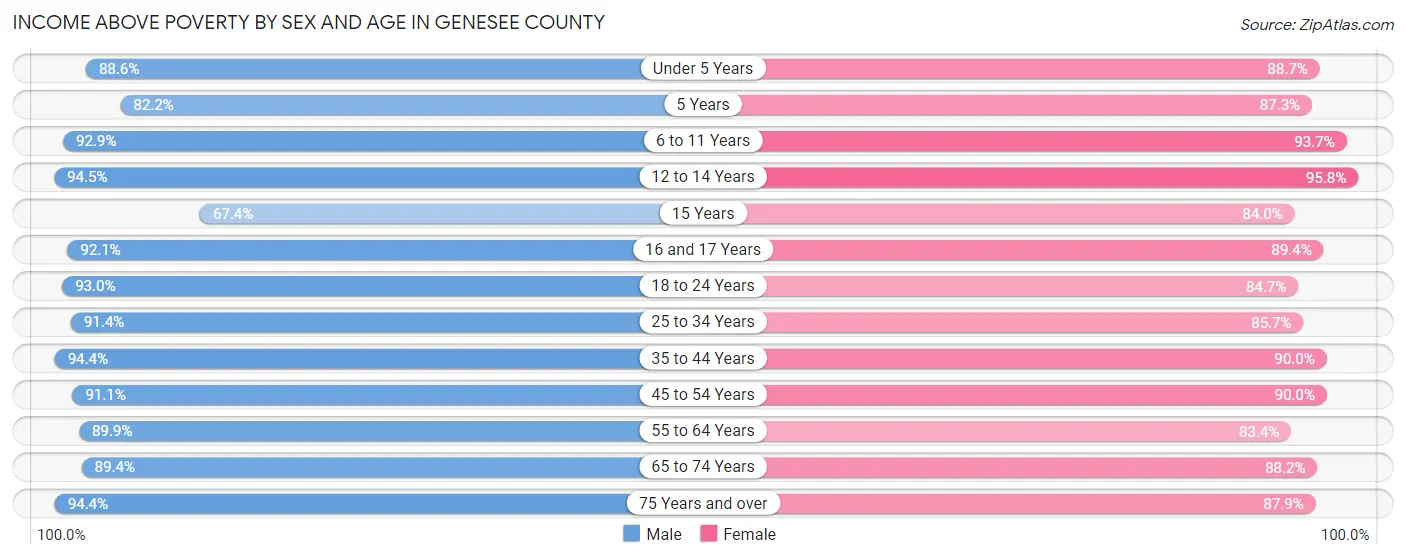
| Age Bracket | Male | Female |
| Under 5 Years | 1,337 (88.6%) | 1,286 (88.7%) |
| 5 Years | 171 (82.2%) | 308 (87.3%) |
| 6 to 11 Years | 1,731 (92.9%) | 1,820 (93.7%) |
| 12 to 14 Years | 1,016 (94.5%) | 874 (95.8%) |
| 15 Years | 300 (67.4%) | 363 (84.0%) |
| 16 and 17 Years | 579 (92.0%) | 524 (89.4%) |
| 18 to 24 Years | 2,116 (93.0%) | 1,882 (84.7%) |
| 25 to 34 Years | 3,476 (91.4%) | 2,874 (85.7%) |
| 35 to 44 Years | 3,255 (94.4%) | 2,959 (90.0%) |
| 45 to 54 Years | 3,455 (91.1%) | 3,291 (90.0%) |
| 55 to 64 Years | 4,050 (89.9%) | 3,769 (83.4%) |
| 65 to 74 Years | 2,765 (89.4%) | 2,836 (88.2%) |
| 75 Years and over | 1,781 (94.4%) | 2,392 (87.9%) |
| Total | 26,032 (91.2%) | 25,178 (87.9%) |
Income Below Poverty Among Married-Couple Families in Genesee County
The poverty statistics for married-couple families in Genesee County show that 2.7% or 314 of the total 11,475 families live below the poverty line. Families with no children have the highest poverty rate of 3.2%, comprising of 235 families. On the other hand, families with 5 or more children have the lowest poverty rate of 0.0%, which includes 0 families.
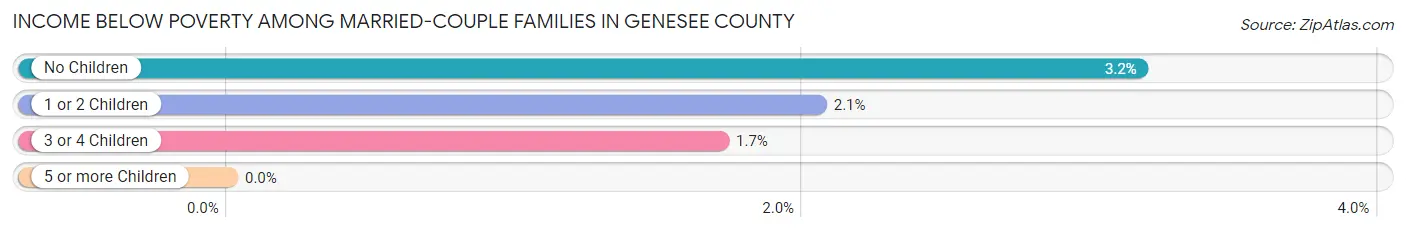
| Children | Above Poverty | Below Poverty |
| No Children | 7,185 (96.8%) | 235 (3.2%) |
| 1 or 2 Children | 3,064 (98.0%) | 64 (2.1%) |
| 3 or 4 Children | 862 (98.3%) | 15 (1.7%) |
| 5 or more Children | 50 (100.0%) | 0 (0.0%) |
| Total | 11,161 (97.3%) | 314 (2.7%) |
Income Below Poverty Among Single-Parent Households in Genesee County
According to the poverty data in Genesee County, 14.4% or 184 single-father households and 17.5% or 400 single-mother households are living below the poverty line. Among single-father households, those with 1 or 2 children have the highest poverty rate, with 140 households (19.5%) experiencing poverty. Likewise, among single-mother households, those with 3 or 4 children have the highest poverty rate, with 68 households (41.7%) falling below the poverty line.
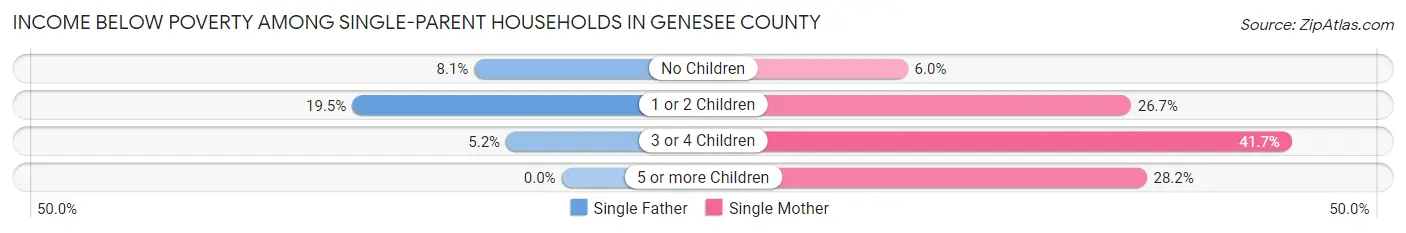
| Children | Single Father | Single Mother |
| No Children | 41 (8.1%) | 68 (6.0%) |
| 1 or 2 Children | 140 (19.5%) | 253 (26.7%) |
| 3 or 4 Children | 3 (5.2%) | 68 (41.7%) |
| 5 or more Children | 0 (0.0%) | 11 (28.2%) |
| Total | 184 (14.4%) | 400 (17.5%) |
Income Below Poverty Among Married-Couple vs Single-Parent Households in Genesee County
The poverty data for Genesee County shows that 314 of the married-couple family households (2.7%) and 584 of the single-parent households (16.4%) are living below the poverty level. Within the married-couple family households, those with no children have the highest poverty rate, with 235 households (3.2%) falling below the poverty line. Among the single-parent households, those with 3 or 4 children have the highest poverty rate, with 71 household (32.1%) living below poverty.
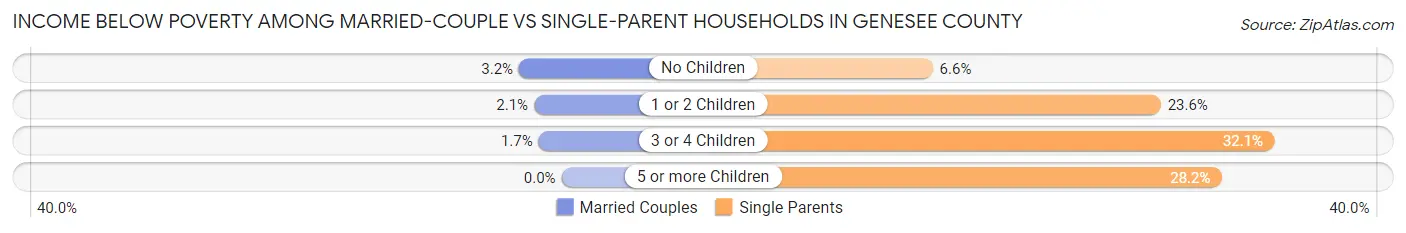
| Children | Married-Couple Families | Single-Parent Households |
| No Children | 235 (3.2%) | 109 (6.6%) |
| 1 or 2 Children | 64 (2.1%) | 393 (23.6%) |
| 3 or 4 Children | 15 (1.7%) | 71 (32.1%) |
| 5 or more Children | 0 (0.0%) | 11 (28.2%) |
| Total | 314 (2.7%) | 584 (16.4%) |
Race in Genesee County
The most populous races in Genesee County are White / Caucasian (52,954 | 91.0%), Two or more Races (2,685 | 4.6%), and Hispanic or Latino (2,050 | 3.5%).
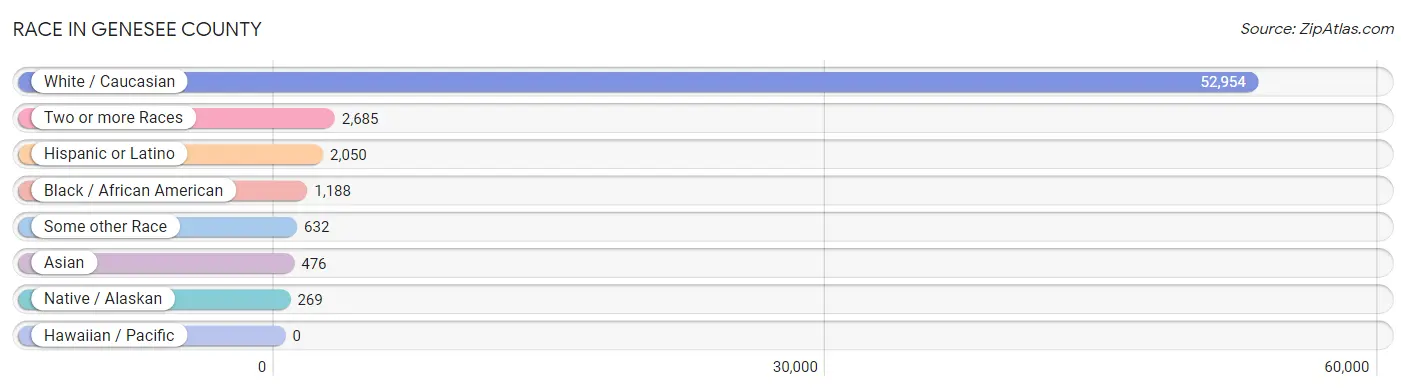
| Race | # Population | % Population |
| Asian | 476 | 0.8% |
| Black / African American | 1,188 | 2.0% |
| Hawaiian / Pacific | 0 | 0.0% |
| Hispanic or Latino | 2,050 | 3.5% |
| Native / Alaskan | 269 | 0.5% |
| White / Caucasian | 52,954 | 91.0% |
| Two or more Races | 2,685 | 4.6% |
| Some other Race | 632 | 1.1% |
| Total | 58,204 | 100.0% |
Ancestry in Genesee County
The most populous ancestries reported in Genesee County are German (14,982 | 25.7%), Irish (9,171 | 15.8%), Italian (9,118 | 15.7%), English (8,779 | 15.1%), and Polish (5,231 | 9.0%), together accounting for 81.2% of all Genesee County residents.
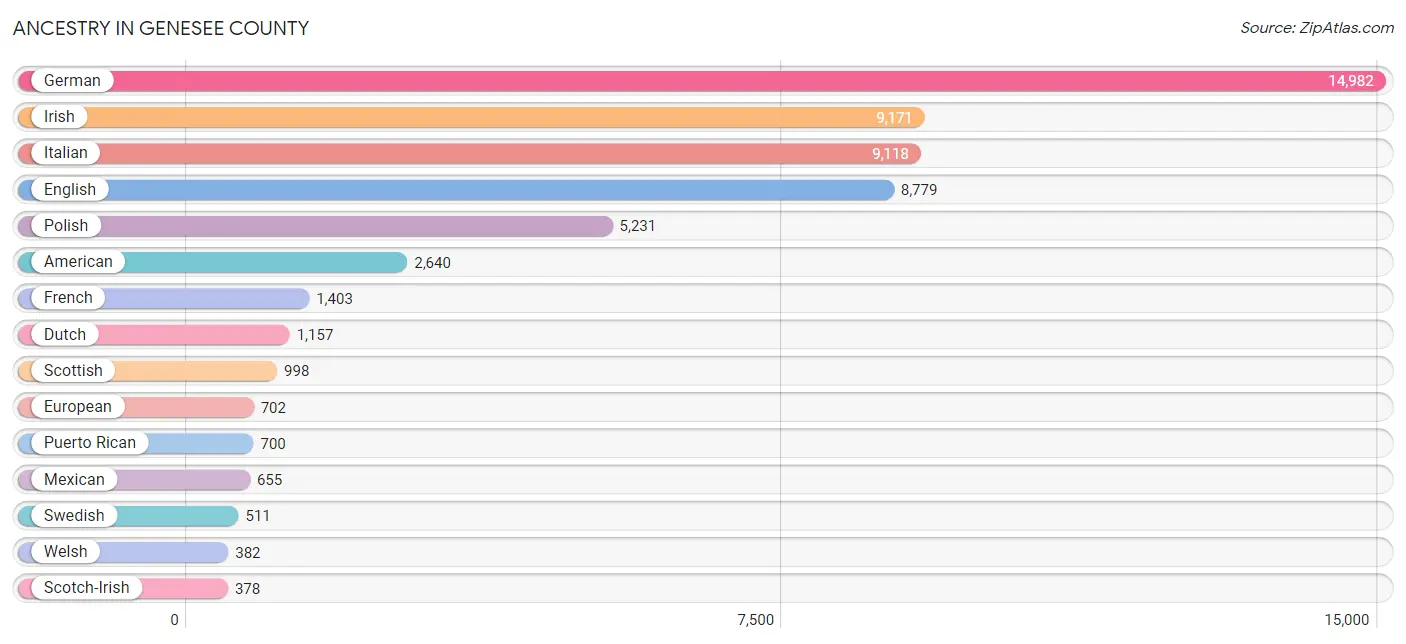
| Ancestry | # Population | % Population |
| African | 143 | 0.3% |
| Albanian | 21 | 0.0% |
| American | 2,640 | 4.5% |
| Arab | 32 | 0.1% |
| Argentinean | 17 | 0.0% |
| Armenian | 31 | 0.1% |
| Austrian | 82 | 0.1% |
| Basque | 5 | 0.0% |
| Belgian | 57 | 0.1% |
| Belizean | 45 | 0.1% |
| Blackfeet | 106 | 0.2% |
| Bolivian | 6 | 0.0% |
| Brazilian | 8 | 0.0% |
| British | 370 | 0.6% |
| Bulgarian | 17 | 0.0% |
| Burmese | 66 | 0.1% |
| Canadian | 263 | 0.4% |
| Celtic | 5 | 0.0% |
| Central American | 54 | 0.1% |
| Central American Indian | 31 | 0.1% |
| Cherokee | 14 | 0.0% |
| Cheyenne | 19 | 0.0% |
| Chinese | 48 | 0.1% |
| Choctaw | 4 | 0.0% |
| Colombian | 46 | 0.1% |
| Costa Rican | 11 | 0.0% |
| Croatian | 175 | 0.3% |
| Cuban | 67 | 0.1% |
| Czech | 39 | 0.1% |
| Czechoslovakian | 34 | 0.1% |
| Danish | 127 | 0.2% |
| Dominican | 78 | 0.1% |
| Dutch | 1,157 | 2.0% |
| Eastern European | 159 | 0.3% |
| Ecuadorian | 222 | 0.4% |
| Egyptian | 16 | 0.0% |
| English | 8,779 | 15.1% |
| European | 702 | 1.2% |
| Finnish | 44 | 0.1% |
| French | 1,403 | 2.4% |
| French Canadian | 316 | 0.5% |
| German | 14,982 | 25.7% |
| Greek | 102 | 0.2% |
| Guatemalan | 17 | 0.0% |
| Haitian | 69 | 0.1% |
| Hungarian | 203 | 0.4% |
| Indian (Asian) | 272 | 0.5% |
| Iranian | 3 | 0.0% |
| Irish | 9,171 | 15.8% |
| Iroquois | 359 | 0.6% |
| Israeli | 53 | 0.1% |
| Italian | 9,118 | 15.7% |
| Jamaican | 236 | 0.4% |
| Korean | 145 | 0.3% |
| Lebanese | 4 | 0.0% |
| Lithuanian | 20 | 0.0% |
| Luxembourger | 9 | 0.0% |
| Macedonian | 5 | 0.0% |
| Malaysian | 3 | 0.0% |
| Mexican | 655 | 1.1% |
| Native Hawaiian | 10 | 0.0% |
| Nicaraguan | 11 | 0.0% |
| Northern European | 110 | 0.2% |
| Norwegian | 263 | 0.4% |
| Pennsylvania German | 37 | 0.1% |
| Polish | 5,231 | 9.0% |
| Puerto Rican | 700 | 1.2% |
| Romanian | 40 | 0.1% |
| Russian | 167 | 0.3% |
| Samoan | 32 | 0.1% |
| Scandinavian | 44 | 0.1% |
| Scotch-Irish | 378 | 0.6% |
| Scottish | 998 | 1.7% |
| Serbian | 3 | 0.0% |
| Sioux | 40 | 0.1% |
| Slavic | 21 | 0.0% |
| Slovak | 16 | 0.0% |
| South African | 15 | 0.0% |
| South American | 305 | 0.5% |
| Spanish | 88 | 0.2% |
| Subsaharan African | 160 | 0.3% |
| Swedish | 511 | 0.9% |
| Swiss | 77 | 0.1% |
| Syrian | 12 | 0.0% |
| Thai | 61 | 0.1% |
| Trinidadian and Tobagonian | 33 | 0.1% |
| Turkish | 7 | 0.0% |
| Ukrainian | 185 | 0.3% |
| Venezuelan | 14 | 0.0% |
| Welsh | 382 | 0.7% |
| West Indian | 31 | 0.1% |
| Yugoslavian | 15 | 0.0% | View All 92 Rows |
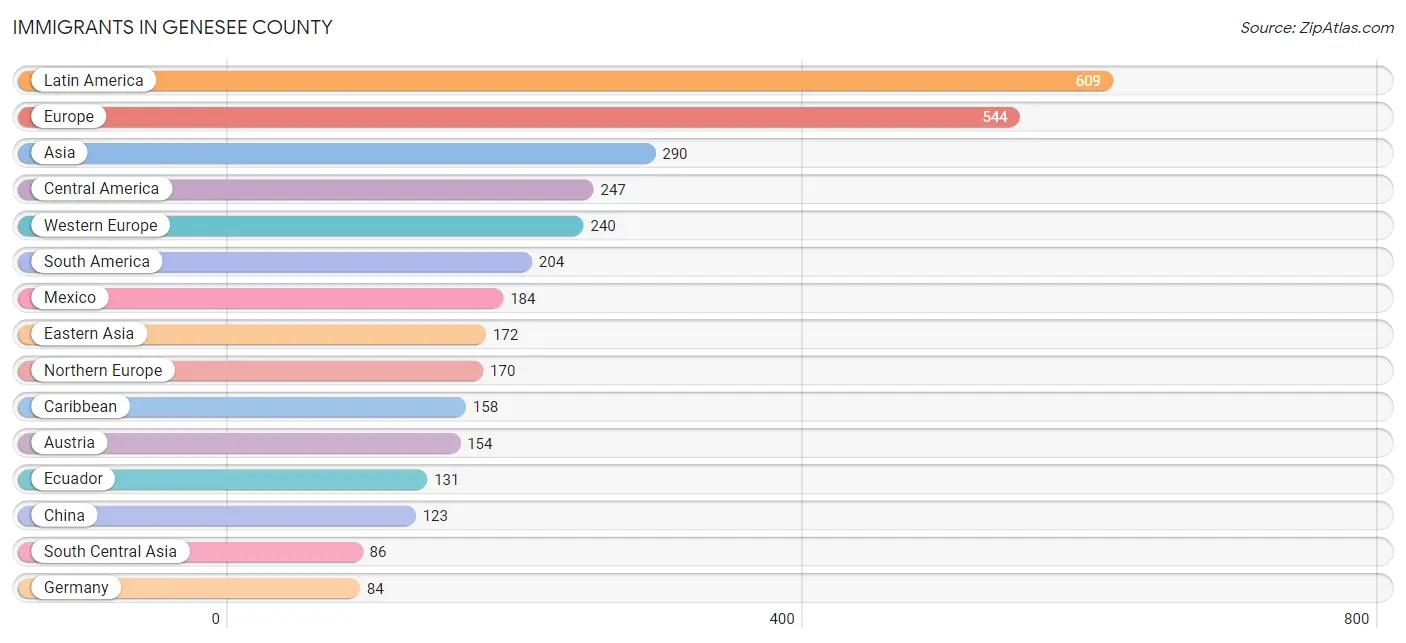
Immigrants in Genesee County
The most numerous immigrant groups reported in Genesee County came from Latin America (609 | 1.1%), Europe (544 | 0.9%), Asia (290 | 0.5%), Central America (247 | 0.4%), and Western Europe (240 | 0.4%), together accounting for 3.3% of all Genesee County residents.
| Immigration Origin | # Population | % Population |
| Africa | 25 | 0.0% |
| Argentina | 17 | 0.0% |
| Asia | 290 | 0.5% |
| Austria | 154 | 0.3% |
| Bangladesh | 25 | 0.0% |
| Belarus | 32 | 0.1% |
| Belize | 24 | 0.0% |
| Brazil | 4 | 0.0% |
| Bulgaria | 3 | 0.0% |
| Canada | 49 | 0.1% |
| Caribbean | 158 | 0.3% |
| Central America | 247 | 0.4% |
| China | 123 | 0.2% |
| Colombia | 38 | 0.1% |
| Costa Rica | 11 | 0.0% |
| Croatia | 5 | 0.0% |
| Cuba | 3 | 0.0% |
| Denmark | 5 | 0.0% |
| Dominican Republic | 73 | 0.1% |
| Eastern Asia | 172 | 0.3% |
| Eastern Europe | 69 | 0.1% |
| Ecuador | 131 | 0.2% |
| El Salvador | 2 | 0.0% |
| England | 73 | 0.1% |
| Europe | 544 | 0.9% |
| France | 2 | 0.0% |
| Germany | 84 | 0.1% |
| Guatemala | 15 | 0.0% |
| Haiti | 5 | 0.0% |
| Hong Kong | 14 | 0.0% |
| India | 30 | 0.1% |
| Italy | 46 | 0.1% |
| Jamaica | 46 | 0.1% |
| Japan | 15 | 0.0% |
| Kazakhstan | 7 | 0.0% |
| Korea | 34 | 0.1% |
| Laos | 3 | 0.0% |
| Latin America | 609 | 1.1% |
| Mexico | 184 | 0.3% |
| Nicaragua | 11 | 0.0% |
| North Macedonia | 5 | 0.0% |
| Northern Europe | 170 | 0.3% |
| Norway | 11 | 0.0% |
| Pakistan | 24 | 0.0% |
| Philippines | 29 | 0.1% |
| Scotland | 11 | 0.0% |
| Sierra Leone | 10 | 0.0% |
| South Africa | 15 | 0.0% |
| South America | 204 | 0.4% |
| South Central Asia | 86 | 0.2% |
| South Eastern Asia | 32 | 0.1% |
| Southern Europe | 46 | 0.1% |
| Taiwan | 14 | 0.0% |
| Trinidad and Tobago | 31 | 0.1% |
| Venezuela | 14 | 0.0% |
| Western Africa | 10 | 0.0% |
| Western Europe | 240 | 0.4% | View All 57 Rows |
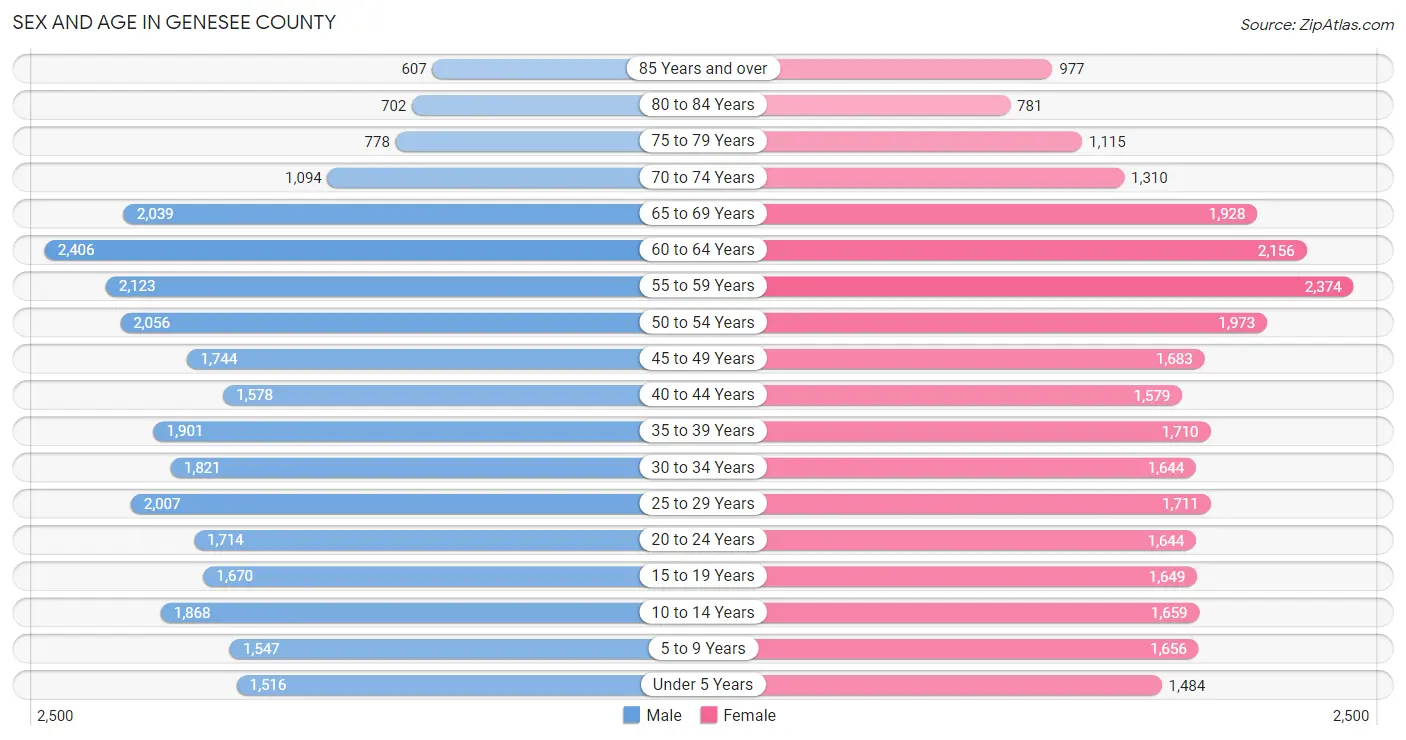
Sex and Age in Genesee County
Sex and Age in Genesee County
The most populous age groups in Genesee County are 60 to 64 Years (2,406 | 8.3%) for men and 55 to 59 Years (2,374 | 8.2%) for women.
| Age Bracket | Male | Female |
| Under 5 Years | 1,516 (5.2%) | 1,484 (5.1%) |
| 5 to 9 Years | 1,547 (5.3%) | 1,656 (5.7%) |
| 10 to 14 Years | 1,868 (6.4%) | 1,659 (5.7%) |
| 15 to 19 Years | 1,670 (5.7%) | 1,649 (5.7%) |
| 20 to 24 Years | 1,714 (5.9%) | 1,644 (5.7%) |
| 25 to 29 Years | 2,007 (6.9%) | 1,711 (5.9%) |
| 30 to 34 Years | 1,821 (6.2%) | 1,644 (5.7%) |
| 35 to 39 Years | 1,901 (6.5%) | 1,710 (5.9%) |
| 40 to 44 Years | 1,578 (5.4%) | 1,579 (5.4%) |
| 45 to 49 Years | 1,744 (6.0%) | 1,683 (5.8%) |
| 50 to 54 Years | 2,056 (7.0%) | 1,973 (6.8%) |
| 55 to 59 Years | 2,123 (7.3%) | 2,374 (8.2%) |
| 60 to 64 Years | 2,406 (8.3%) | 2,156 (7.4%) |
| 65 to 69 Years | 2,039 (7.0%) | 1,928 (6.6%) |
| 70 to 74 Years | 1,094 (3.7%) | 1,310 (4.5%) |
| 75 to 79 Years | 778 (2.7%) | 1,115 (3.8%) |
| 80 to 84 Years | 702 (2.4%) | 781 (2.7%) |
| 85 Years and over | 607 (2.1%) | 977 (3.4%) |
| Total | 29,171 (100.0%) | 29,033 (100.0%) |
Families and Households in Genesee County
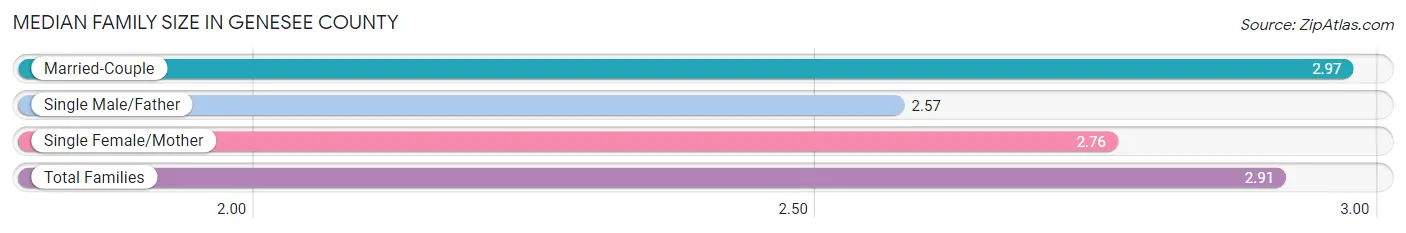
Median Family Size in Genesee County
The median family size in Genesee County is 2.91 persons per family, with married-couple families (11,475 | 76.3%) accounting for the largest median family size of 2.97 persons per family. On the other hand, single male/father families (1,280 | 8.5%) represent the smallest median family size with 2.57 persons per family.
| Family Type | # Families | Family Size |
| Married-Couple | 11,475 (76.3%) | 2.97 |
| Single Male/Father | 1,280 (8.5%) | 2.57 |
| Single Female/Mother | 2,289 (15.2%) | 2.76 |
| Total Families | 15,044 (100.0%) | 2.91 |
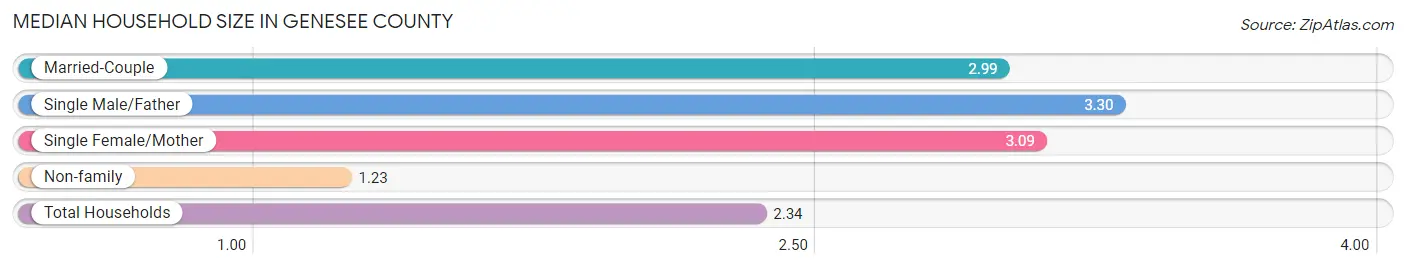
Median Household Size in Genesee County
The median household size in Genesee County is 2.34 persons per household, with single male/father households (1,280 | 5.2%) accounting for the largest median household size of 3.3 persons per household. non-family households (9,372 | 38.4%) represent the smallest median household size with 1.23 persons per household.
| Household Type | # Households | Household Size |
| Married-Couple | 11,475 (47.0%) | 2.99 |
| Single Male/Father | 1,280 (5.2%) | 3.30 |
| Single Female/Mother | 2,289 (9.4%) | 3.09 |
| Non-family | 9,372 (38.4%) | 1.23 |
| Total Households | 24,416 (100.0%) | 2.34 |
Household Size by Marriage Status in Genesee County
Out of a total of 24,416 households in Genesee County, 15,044 (61.6%) are family households, while 9,372 (38.4%) are nonfamily households. The most numerous type of family households are 2-person households, comprising 7,197, and the most common type of nonfamily households are 1-person households, comprising 7,309.
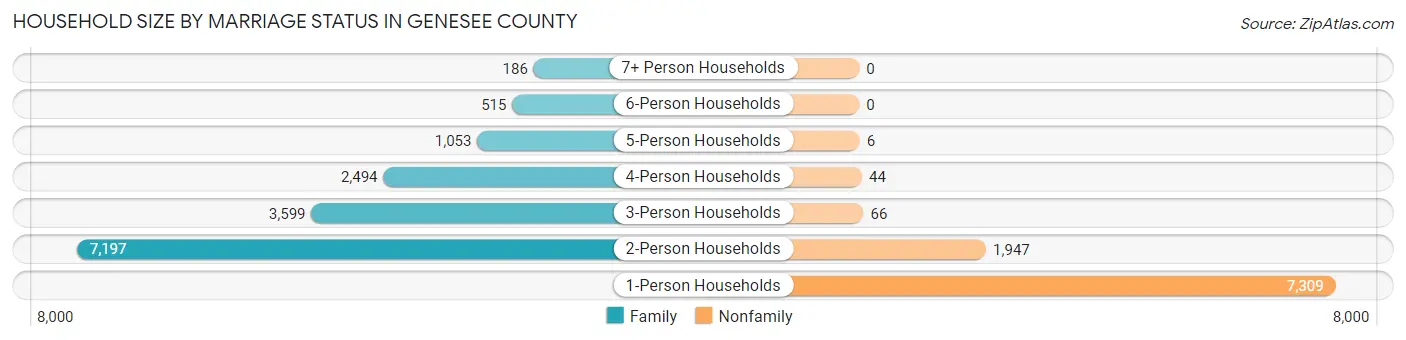
| Household Size | Family Households | Nonfamily Households |
| 1-Person Households | - | 7,309 (29.9%) |
| 2-Person Households | 7,197 (29.5%) | 1,947 (8.0%) |
| 3-Person Households | 3,599 (14.7%) | 66 (0.3%) |
| 4-Person Households | 2,494 (10.2%) | 44 (0.2%) |
| 5-Person Households | 1,053 (4.3%) | 6 (0.0%) |
| 6-Person Households | 515 (2.1%) | 0 (0.0%) |
| 7+ Person Households | 186 (0.8%) | 0 (0.0%) |
| Total | 15,044 (61.6%) | 9,372 (38.4%) |
Female Fertility in Genesee County
Fertility by Age in Genesee County
Average fertility rate in Genesee County is 60.0 births per 1,000 women. Women in the age bracket of 20 to 34 years have the highest fertility rate with 100.0 births per 1,000 women. Women in the age bracket of 20 to 34 years acount for 69.4% of all women with births.
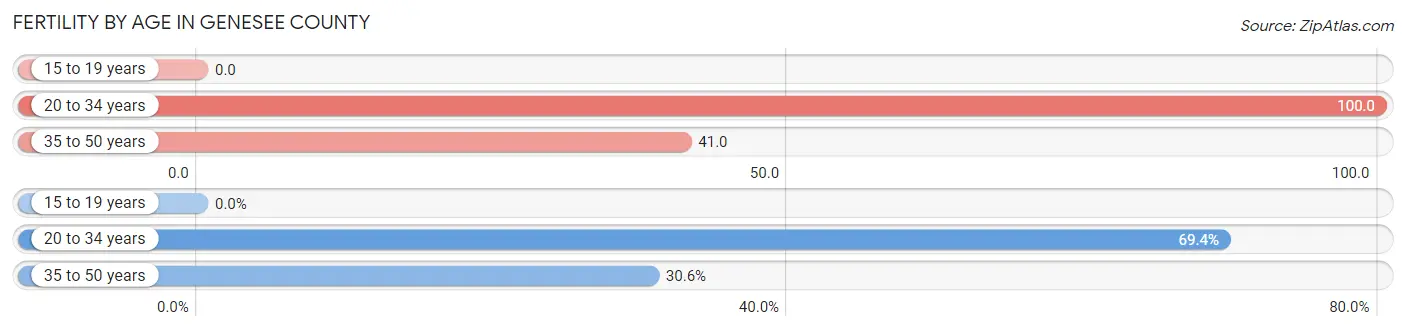
| Age Bracket | Women with Births | Births / 1,000 Women |
| 15 to 19 years | 0 (0.0%) | 0.0 |
| 20 to 34 years | 499 (69.4%) | 100.0 |
| 35 to 50 years | 220 (30.6%) | 41.0 |
| Total | 719 (100.0%) | 60.0 |
Fertility by Age by Marriage Status in Genesee County
75.7% of women with births (719) in Genesee County are married. The highest percentage of unmarried women with births falls into 35 to 50 years age bracket with 30.4% of them unmarried at the time of birth, while the lowest percentage of unmarried women with births belong to 20 to 34 years age bracket with 21.6% of them unmarried.
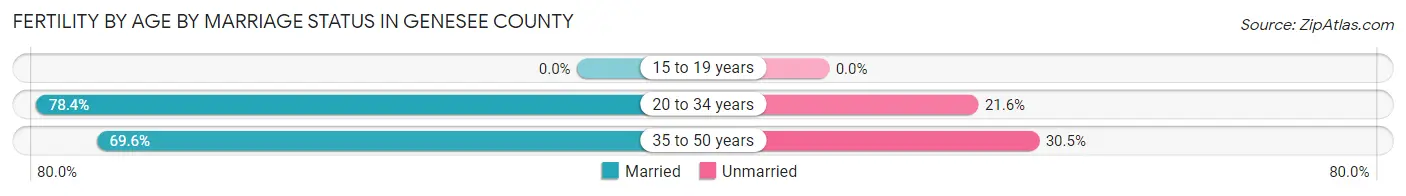
| Age Bracket | Married | Unmarried |
| 15 to 19 years | 0 (0.0%) | 0 (0.0%) |
| 20 to 34 years | 391 (78.4%) | 108 (21.6%) |
| 35 to 50 years | 153 (69.6%) | 67 (30.4%) |
| Total | 544 (75.7%) | 175 (24.3%) |
Fertility by Education in Genesee County
Average fertility rate in Genesee County is 60.0 births per 1,000 women. Women with the education attainment of high school diploma have the highest fertility rate of 92.0 births per 1,000 women, while women with the education attainment of less than high school have the lowest fertility at 30.0 births per 1,000 women. Women with the education attainment of high school diploma represent 34.5% of all women with births.
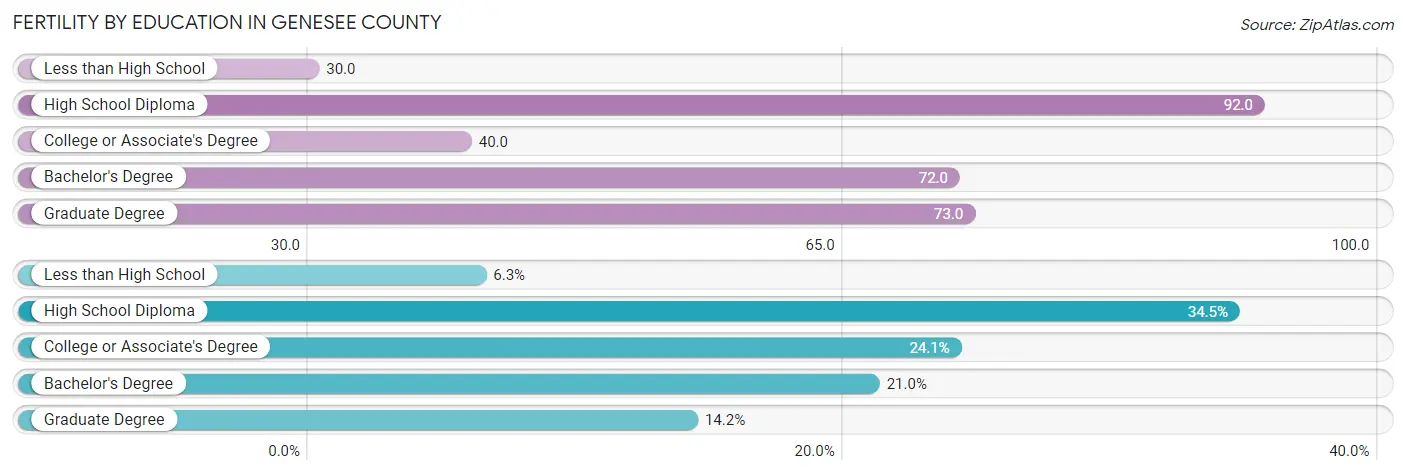
| Educational Attainment | Women with Births | Births / 1,000 Women |
| Less than High School | 45 (6.3%) | 30.0 |
| High School Diploma | 248 (34.5%) | 92.0 |
| College or Associate's Degree | 173 (24.1%) | 40.0 |
| Bachelor's Degree | 151 (21.0%) | 72.0 |
| Graduate Degree | 102 (14.2%) | 73.0 |
| Total | 719 (100.0%) | 60.0 |
Fertility by Education by Marriage Status in Genesee County
24.3% of women with births in Genesee County are unmarried. Women with the educational attainment of bachelor's degree are most likely to be married with 92.7% of them married at childbirth, while women with the educational attainment of high school diploma are least likely to be married with 37.9% of them unmarried at childbirth.
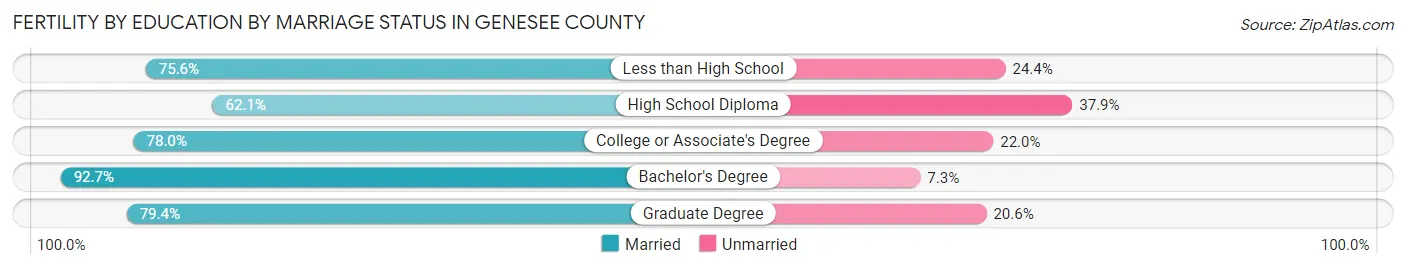
| Educational Attainment | Married | Unmarried |
| Less than High School | 34 (75.6%) | 11 (24.4%) |
| High School Diploma | 154 (62.1%) | 94 (37.9%) |
| College or Associate's Degree | 135 (78.0%) | 38 (22.0%) |
| Bachelor's Degree | 140 (92.7%) | 11 (7.3%) |
| Graduate Degree | 81 (79.4%) | 21 (20.6%) |
| Total | 544 (75.7%) | 175 (24.3%) |
Employment Characteristics in Genesee County
Employment by Class of Employer in Genesee County
Among the 28,247 employed individuals in Genesee County, private company employees (18,400 | 65.1%), local government employees (2,749 | 9.7%), and not-for-profit organizations (2,502 | 8.9%) make up the most common classes of employment.
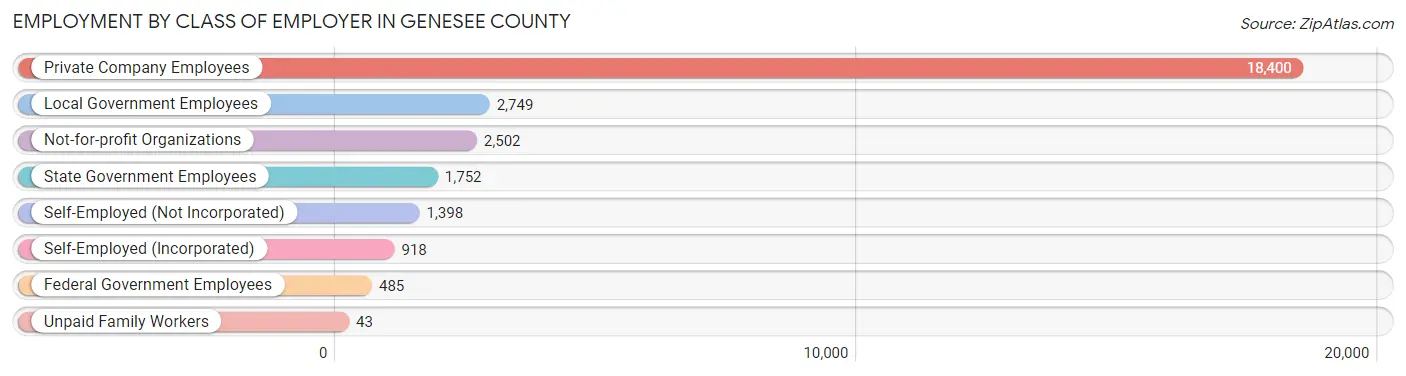
| Employer Class | # Employees | % Employees |
| Private Company Employees | 18,400 | 65.1% |
| Self-Employed (Incorporated) | 918 | 3.3% |
| Self-Employed (Not Incorporated) | 1,398 | 5.0% |
| Not-for-profit Organizations | 2,502 | 8.9% |
| Local Government Employees | 2,749 | 9.7% |
| State Government Employees | 1,752 | 6.2% |
| Federal Government Employees | 485 | 1.7% |
| Unpaid Family Workers | 43 | 0.2% |
| Total | 28,247 | 100.0% |
Employment Status by Age in Genesee County
According to the labor force statistics for Genesee County, out of the total population over 16 years of age (47,597), 63.7% or 30,319 individuals are in the labor force, with 4.7% or 1,425 of them unemployed. The age group with the highest labor force participation rate is 30 to 34 years, with 88.1% or 3,053 individuals in the labor force. Within the labor force, the 20 to 24 years age range has the highest percentage of unemployed individuals, with 11.9% or 339 of them being unemployed.
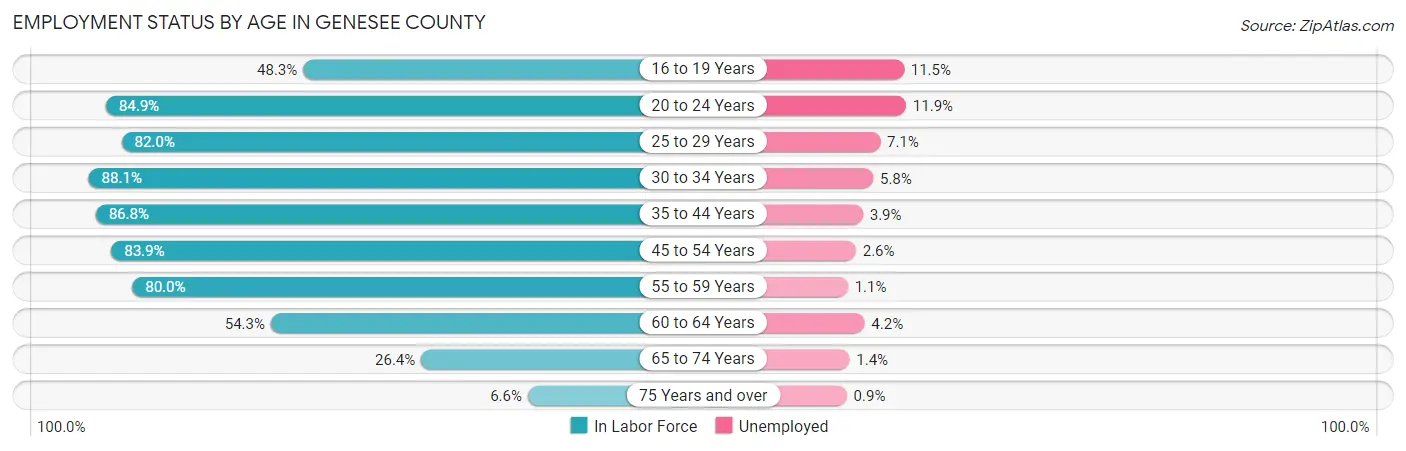
| Age Bracket | In Labor Force | Unemployed |
| 16 to 19 Years | 1,179 (48.3%) | 136 (11.5%) |
| 20 to 24 Years | 2,851 (84.9%) | 339 (11.9%) |
| 25 to 29 Years | 3,049 (82.0%) | 216 (7.1%) |
| 30 to 34 Years | 3,053 (88.1%) | 177 (5.8%) |
| 35 to 44 Years | 5,875 (86.8%) | 229 (3.9%) |
| 45 to 54 Years | 6,256 (83.9%) | 163 (2.6%) |
| 55 to 59 Years | 3,598 (80.0%) | 40 (1.1%) |
| 60 to 64 Years | 2,477 (54.3%) | 104 (4.2%) |
| 65 to 74 Years | 1,682 (26.4%) | 24 (1.4%) |
| 75 Years and over | 327 (6.6%) | 3 (0.9%) |
| Total | 30,319 (63.7%) | 1,425 (4.7%) |
Employment Status by Educational Attainment in Genesee County
According to labor force statistics for Genesee County, 79.8% of individuals (24,312) out of the total population between 25 and 64 years of age (30,466) are in the labor force, with 3.8% or 924 of them being unemployed. The group with the highest labor force participation rate are those with the educational attainment of bachelor's degree or higher, with 87.5% or 6,761 individuals in the labor force. Within the labor force, individuals with high school diploma education have the highest percentage of unemployment, with 5.5% or 422 of them being unemployed.
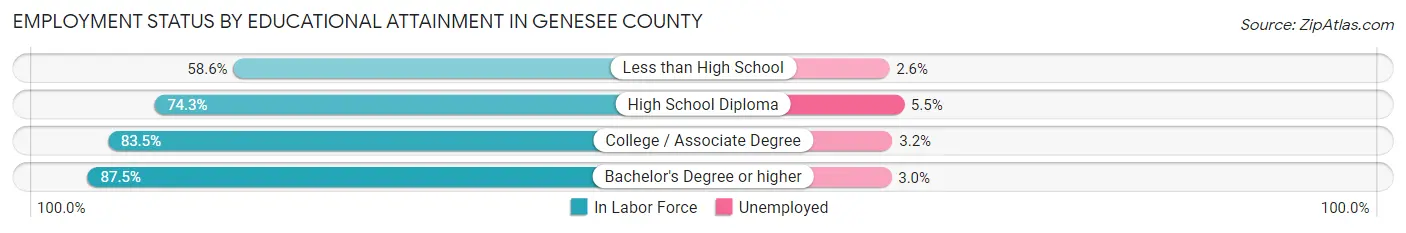
| Educational Attainment | In Labor Force | Unemployed |
| Less than High School | 1,158 (58.6%) | 51 (2.6%) |
| High School Diploma | 7,665 (74.3%) | 567 (5.5%) |
| College / Associate Degree | 8,723 (83.5%) | 334 (3.2%) |
| Bachelor's Degree or higher | 6,761 (87.5%) | 232 (3.0%) |
| Total | 24,312 (79.8%) | 1,158 (3.8%) |
Employment Occupations by Sex in Genesee County
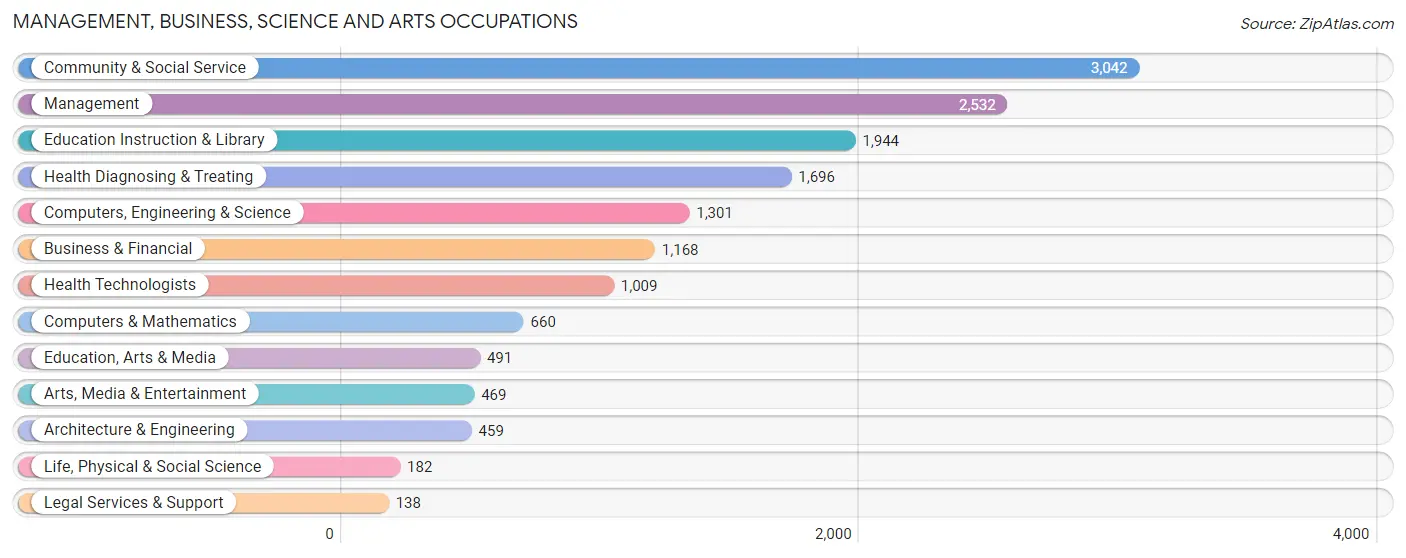
Management, Business, Science and Arts Occupations
The most common Management, Business, Science and Arts occupations in Genesee County are Community & Social Service (3,042 | 10.5%), Management (2,532 | 8.8%), Education Instruction & Library (1,944 | 6.7%), Health Diagnosing & Treating (1,696 | 5.9%), and Computers, Engineering & Science (1,301 | 4.5%).
Management, Business, Science and Arts Occupations by Sex
Within the Management, Business, Science and Arts occupations in Genesee County, the most male-oriented occupations are Architecture & Engineering (85.0%), Legal Services & Support (71.7%), and Computers, Engineering & Science (68.8%), while the most female-oriented occupations are Health Technologists (88.1%), Health Diagnosing & Treating (87.1%), and Education Instruction & Library (76.8%).
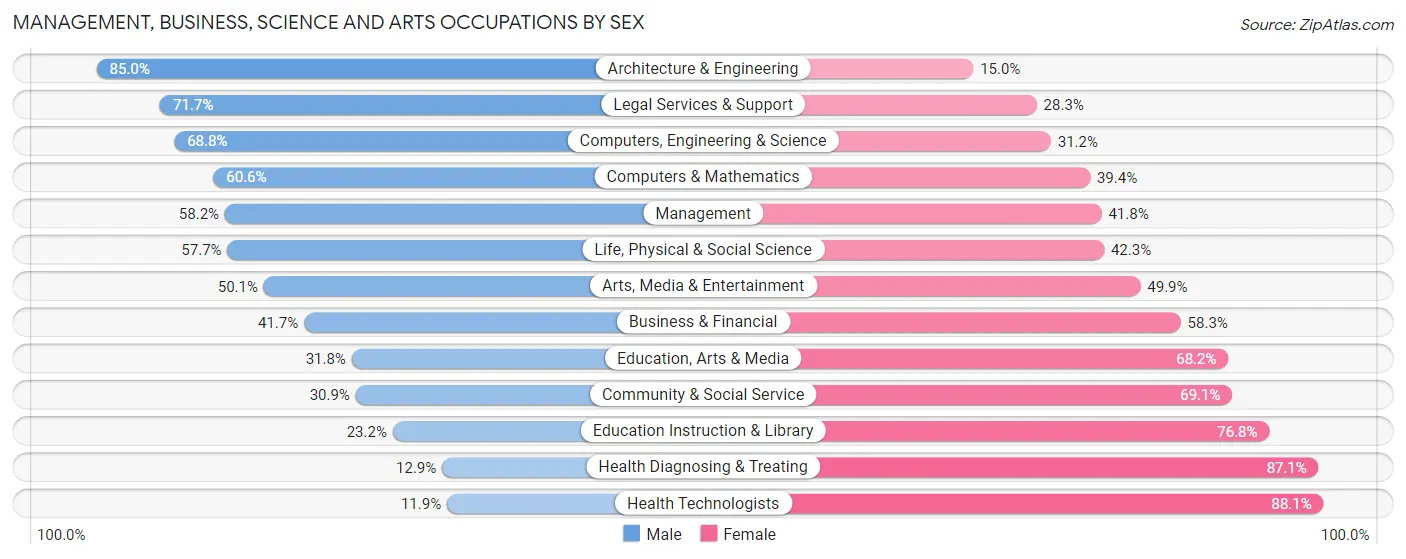
| Occupation | Male | Female |
| Management | 1,474 (58.2%) | 1,058 (41.8%) |
| Business & Financial | 487 (41.7%) | 681 (58.3%) |
| Computers, Engineering & Science | 895 (68.8%) | 406 (31.2%) |
| Computers & Mathematics | 400 (60.6%) | 260 (39.4%) |
| Architecture & Engineering | 390 (85.0%) | 69 (15.0%) |
| Life, Physical & Social Science | 105 (57.7%) | 77 (42.3%) |
| Community & Social Service | 941 (30.9%) | 2,101 (69.1%) |
| Education, Arts & Media | 156 (31.8%) | 335 (68.2%) |
| Legal Services & Support | 99 (71.7%) | 39 (28.3%) |
| Education Instruction & Library | 451 (23.2%) | 1,493 (76.8%) |
| Arts, Media & Entertainment | 235 (50.1%) | 234 (49.9%) |
| Health Diagnosing & Treating | 219 (12.9%) | 1,477 (87.1%) |
| Health Technologists | 120 (11.9%) | 889 (88.1%) |
| Total (Category) | 4,016 (41.2%) | 5,723 (58.8%) |
| Total (Overall) | 15,172 (52.5%) | 13,721 (47.5%) |
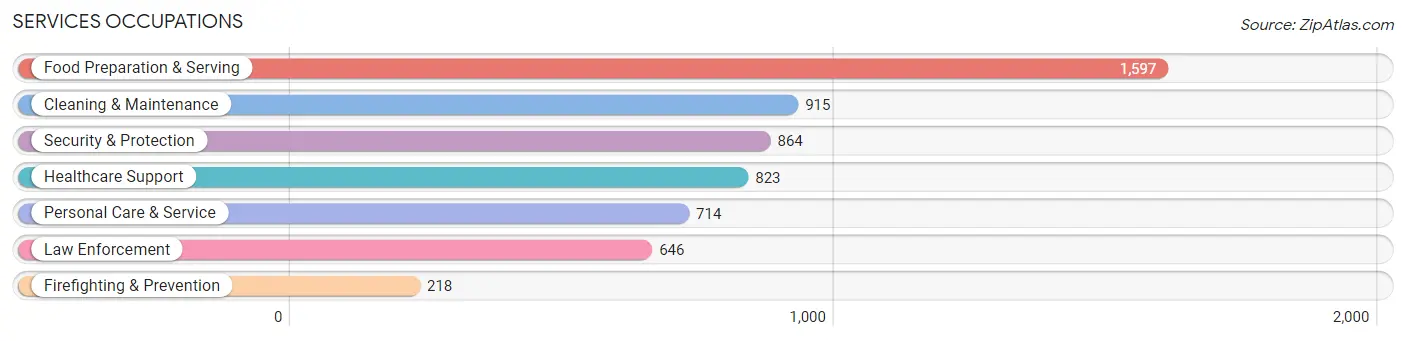
Services Occupations
The most common Services occupations in Genesee County are Food Preparation & Serving (1,597 | 5.5%), Cleaning & Maintenance (915 | 3.2%), Security & Protection (864 | 3.0%), Healthcare Support (823 | 2.9%), and Personal Care & Service (714 | 2.5%).
Services Occupations by Sex
Within the Services occupations in Genesee County, the most male-oriented occupations are Law Enforcement (96.6%), Security & Protection (88.2%), and Firefighting & Prevention (63.3%), while the most female-oriented occupations are Healthcare Support (91.9%), Personal Care & Service (79.1%), and Food Preparation & Serving (64.4%).
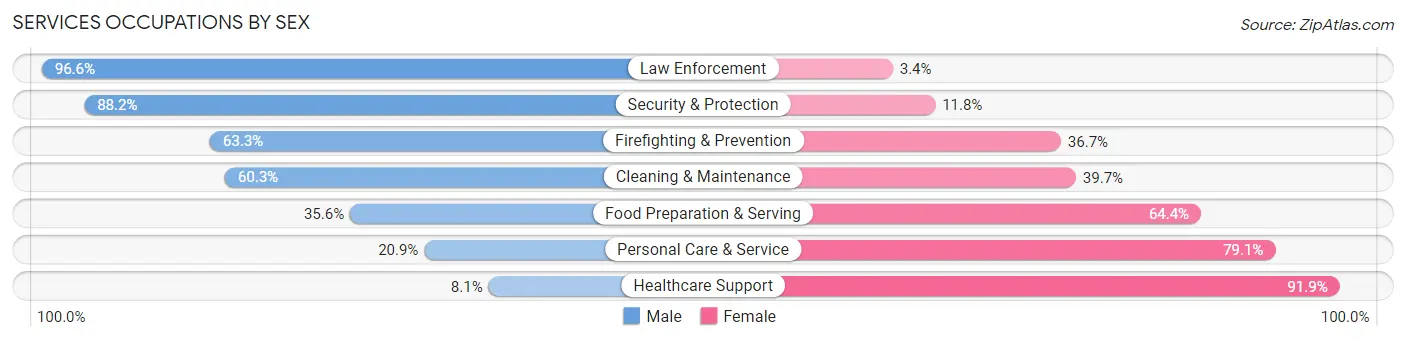
| Occupation | Male | Female |
| Healthcare Support | 67 (8.1%) | 756 (91.9%) |
| Security & Protection | 762 (88.2%) | 102 (11.8%) |
| Firefighting & Prevention | 138 (63.3%) | 80 (36.7%) |
| Law Enforcement | 624 (96.6%) | 22 (3.4%) |
| Food Preparation & Serving | 568 (35.6%) | 1,029 (64.4%) |
| Cleaning & Maintenance | 552 (60.3%) | 363 (39.7%) |
| Personal Care & Service | 149 (20.9%) | 565 (79.1%) |
| Total (Category) | 2,098 (42.7%) | 2,815 (57.3%) |
| Total (Overall) | 15,172 (52.5%) | 13,721 (47.5%) |
Sales and Office Occupations
The most common Sales and Office occupations in Genesee County are Office & Administration (3,397 | 11.8%), and Sales & Related (2,606 | 9.0%).
Sales and Office Occupations by Sex

| Occupation | Male | Female |
| Sales & Related | 1,346 (51.6%) | 1,260 (48.3%) |
| Office & Administration | 545 (16.0%) | 2,852 (84.0%) |
| Total (Category) | 1,891 (31.5%) | 4,112 (68.5%) |
| Total (Overall) | 15,172 (52.5%) | 13,721 (47.5%) |
Natural Resources, Construction and Maintenance Occupations
The most common Natural Resources, Construction and Maintenance occupations in Genesee County are Construction & Extraction (1,764 | 6.1%), Installation, Maintenance & Repair (1,615 | 5.6%), and Farming, Fishing & Forestry (396 | 1.4%).
Natural Resources, Construction and Maintenance Occupations by Sex
| Occupation | Male | Female |
| Farming, Fishing & Forestry | 279 (70.5%) | 117 (29.5%) |
| Construction & Extraction | 1,764 (100.0%) | 0 (0.0%) |
| Installation, Maintenance & Repair | 1,582 (98.0%) | 33 (2.0%) |
| Total (Category) | 3,625 (96.0%) | 150 (4.0%) |
| Total (Overall) | 15,172 (52.5%) | 13,721 (47.5%) |
Production, Transportation and Moving Occupations
The most common Production, Transportation and Moving occupations in Genesee County are Production (2,333 | 8.1%), Material Moving (1,107 | 3.8%), and Transportation (1,023 | 3.5%).
Production, Transportation and Moving Occupations by Sex
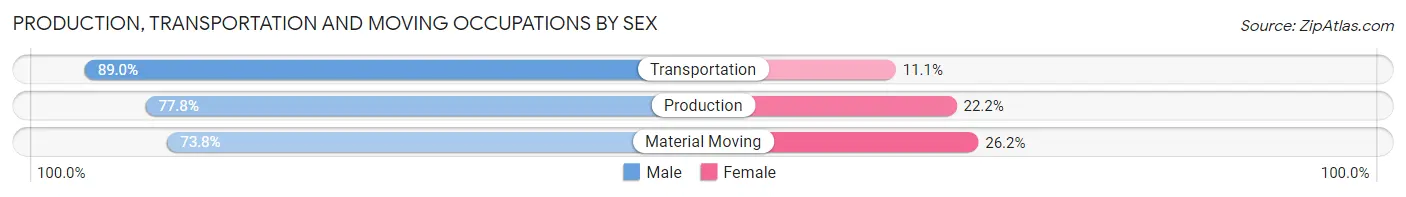
| Occupation | Male | Female |
| Production | 1,815 (77.8%) | 518 (22.2%) |
| Transportation | 910 (88.9%) | 113 (11.1%) |
| Material Moving | 817 (73.8%) | 290 (26.2%) |
| Total (Category) | 3,542 (79.4%) | 921 (20.6%) |
| Total (Overall) | 15,172 (52.5%) | 13,721 (47.5%) |
Employment Industries by Sex in Genesee County
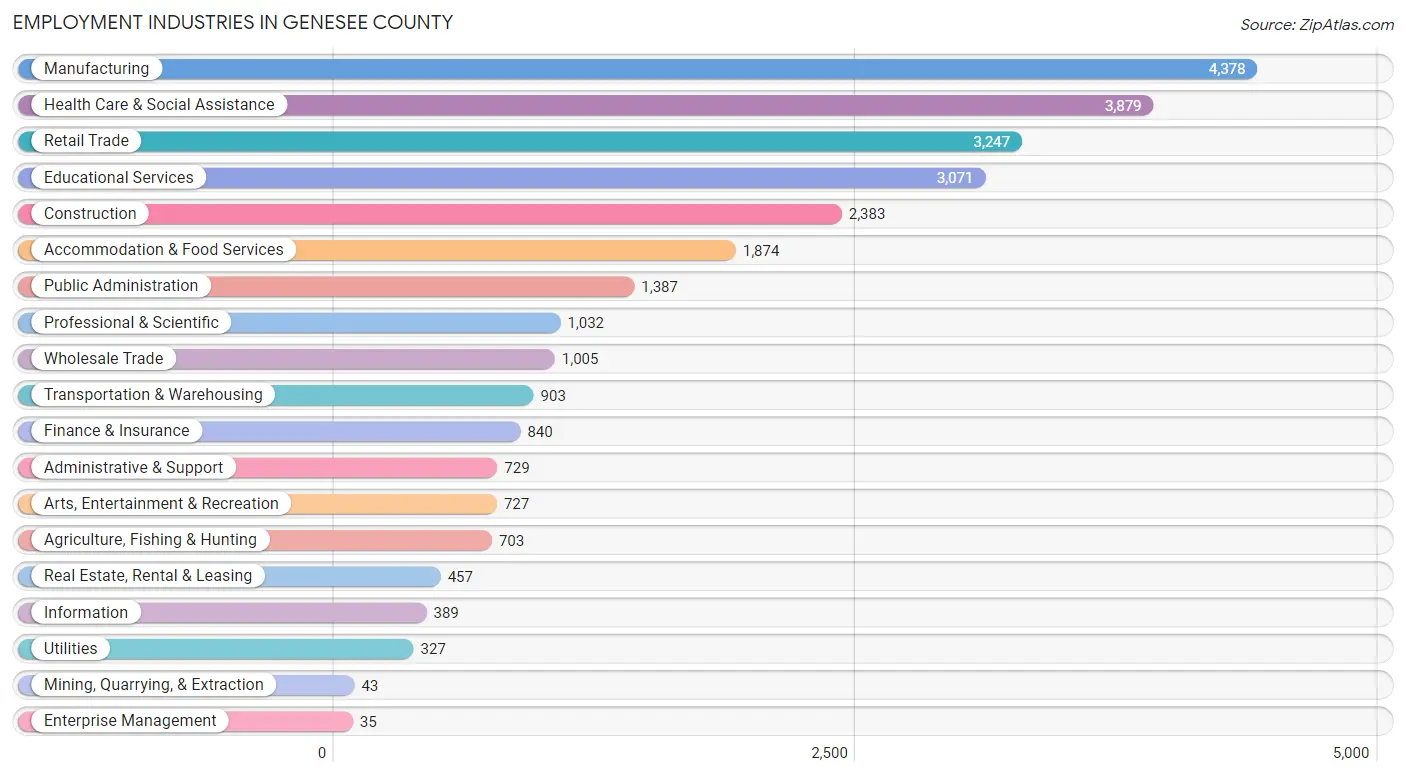
Employment Industries in Genesee County
The major employment industries in Genesee County include Manufacturing (4,378 | 15.1%), Health Care & Social Assistance (3,879 | 13.4%), Retail Trade (3,247 | 11.2%), Educational Services (3,071 | 10.6%), and Construction (2,383 | 8.3%).
Employment Industries by Sex in Genesee County
The Genesee County industries that see more men than women are Mining, Quarrying, & Extraction (100.0%), Utilities (93.9%), and Construction (85.1%), whereas the industries that tend to have a higher number of women are Health Care & Social Assistance (80.7%), Educational Services (75.3%), and Accommodation & Food Services (66.2%).
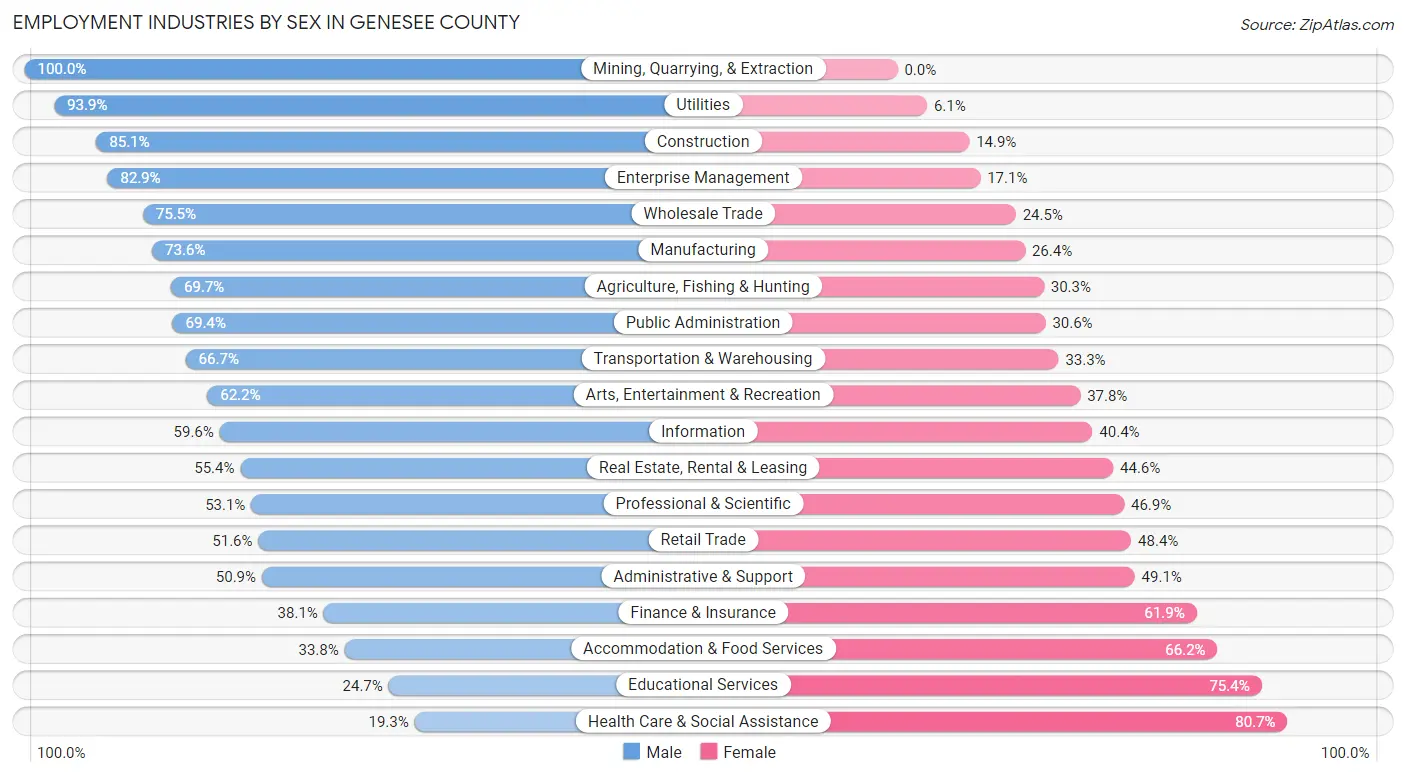
| Industry | Male | Female |
| Agriculture, Fishing & Hunting | 490 (69.7%) | 213 (30.3%) |
| Mining, Quarrying, & Extraction | 43 (100.0%) | 0 (0.0%) |
| Construction | 2,029 (85.1%) | 354 (14.9%) |
| Manufacturing | 3,222 (73.6%) | 1,156 (26.4%) |
| Wholesale Trade | 759 (75.5%) | 246 (24.5%) |
| Retail Trade | 1,676 (51.6%) | 1,571 (48.4%) |
| Transportation & Warehousing | 602 (66.7%) | 301 (33.3%) |
| Utilities | 307 (93.9%) | 20 (6.1%) |
| Information | 232 (59.6%) | 157 (40.4%) |
| Finance & Insurance | 320 (38.1%) | 520 (61.9%) |
| Real Estate, Rental & Leasing | 253 (55.4%) | 204 (44.6%) |
| Professional & Scientific | 548 (53.1%) | 484 (46.9%) |
| Enterprise Management | 29 (82.9%) | 6 (17.1%) |
| Administrative & Support | 371 (50.9%) | 358 (49.1%) |
| Educational Services | 757 (24.6%) | 2,314 (75.3%) |
| Health Care & Social Assistance | 748 (19.3%) | 3,131 (80.7%) |
| Arts, Entertainment & Recreation | 452 (62.2%) | 275 (37.8%) |
| Accommodation & Food Services | 633 (33.8%) | 1,241 (66.2%) |
| Public Administration | 962 (69.4%) | 425 (30.6%) |
| Total | 15,172 (52.5%) | 13,721 (47.5%) |
Education in Genesee County
School Enrollment in Genesee County
The most common levels of schooling among the 11,325 students in Genesee County are high school (2,767 | 24.4%), middle school (2,689 | 23.7%), and elementary school (2,416 | 21.3%).
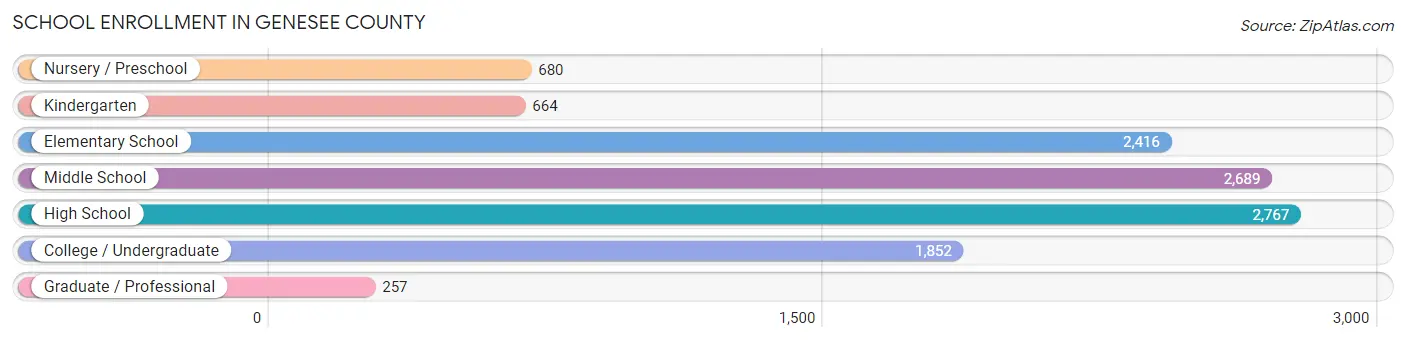
| School Level | # Students | % Students |
| Nursery / Preschool | 680 | 6.0% |
| Kindergarten | 664 | 5.9% |
| Elementary School | 2,416 | 21.3% |
| Middle School | 2,689 | 23.7% |
| High School | 2,767 | 24.4% |
| College / Undergraduate | 1,852 | 16.4% |
| Graduate / Professional | 257 | 2.3% |
| Total | 11,325 | 100.0% |
School Enrollment by Age by Funding Source in Genesee County
Out of a total of 11,325 students who are enrolled in schools in Genesee County, 1,665 (14.7%) attend a private institution, while the remaining 9,660 (85.3%) are enrolled in public schools. The age group of 20 to 24 year olds has the highest likelihood of being enrolled in private schools, with 296 (36.1% in the age bracket) enrolled. Conversely, the age group of 10 to 14 year olds has the lowest likelihood of being enrolled in a private school, with 3,165 (92.7% in the age bracket) attending a public institution.
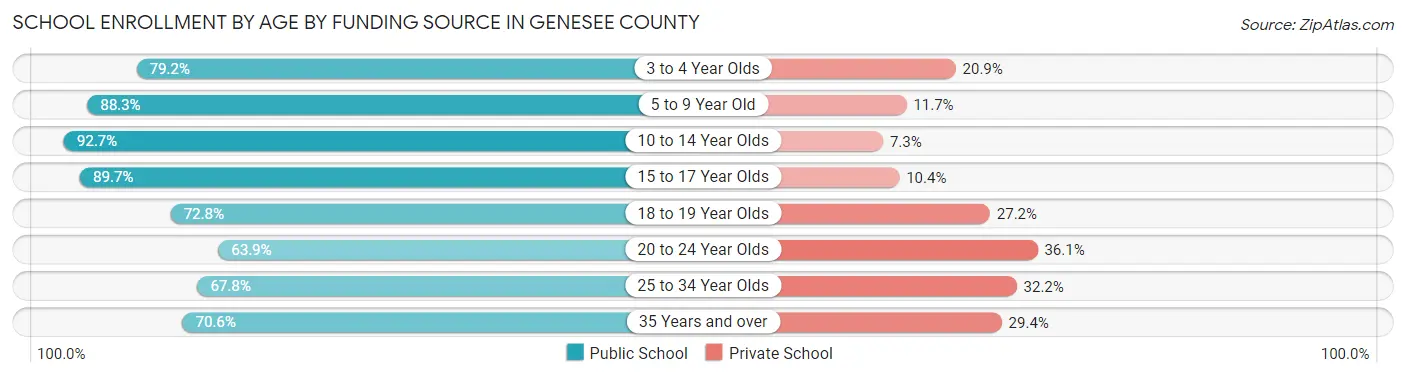
| Age Bracket | Public School | Private School |
| 3 to 4 Year Olds | 448 (79.1%) | 118 (20.8%) |
| 5 to 9 Year Old | 2,637 (88.3%) | 349 (11.7%) |
| 10 to 14 Year Olds | 3,165 (92.7%) | 250 (7.3%) |
| 15 to 17 Year Olds | 1,802 (89.6%) | 208 (10.3%) |
| 18 to 19 Year Olds | 628 (72.8%) | 235 (27.2%) |
| 20 to 24 Year Olds | 524 (63.9%) | 296 (36.1%) |
| 25 to 34 Year Olds | 202 (67.8%) | 96 (32.2%) |
| 35 Years and over | 259 (70.6%) | 108 (29.4%) |
| Total | 9,660 (85.3%) | 1,665 (14.7%) |
Educational Attainment by Field of Study in Genesee County
Education (2,167 | 20.8%), business (1,553 | 14.9%), science & technology (1,179 | 11.3%), arts & humanities (792 | 7.6%), and engineering (641 | 6.1%) are the most common fields of study among 10,419 individuals in Genesee County who have obtained a bachelor's degree or higher.
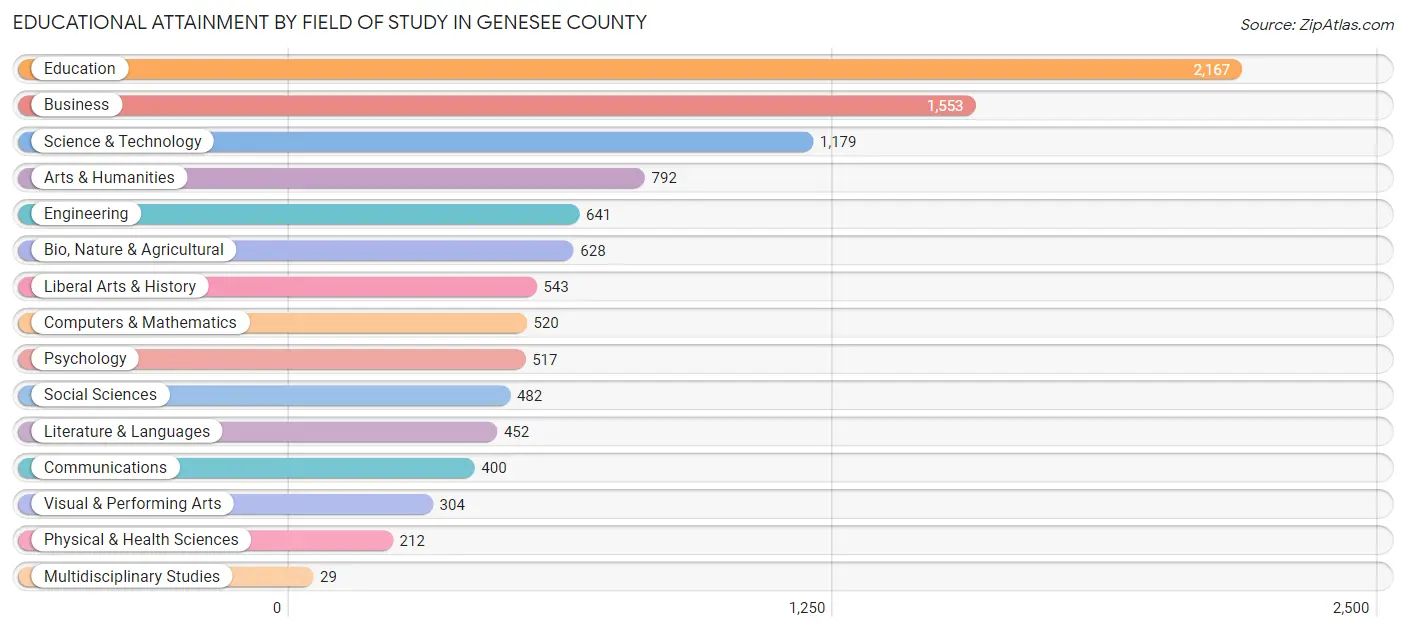
| Field of Study | # Graduates | % Graduates |
| Computers & Mathematics | 520 | 5.0% |
| Bio, Nature & Agricultural | 628 | 6.0% |
| Physical & Health Sciences | 212 | 2.0% |
| Psychology | 517 | 5.0% |
| Social Sciences | 482 | 4.6% |
| Engineering | 641 | 6.1% |
| Multidisciplinary Studies | 29 | 0.3% |
| Science & Technology | 1,179 | 11.3% |
| Business | 1,553 | 14.9% |
| Education | 2,167 | 20.8% |
| Literature & Languages | 452 | 4.3% |
| Liberal Arts & History | 543 | 5.2% |
| Visual & Performing Arts | 304 | 2.9% |
| Communications | 400 | 3.8% |
| Arts & Humanities | 792 | 7.6% |
| Total | 10,419 | 100.0% |
Transportation & Commute in Genesee County
Vehicle Availability by Sex in Genesee County
The most prevalent vehicle ownership categories in Genesee County are males with 2 vehicles (7,188, accounting for 48.4%) and females with 2 vehicles (6,023, making up 54.3%).
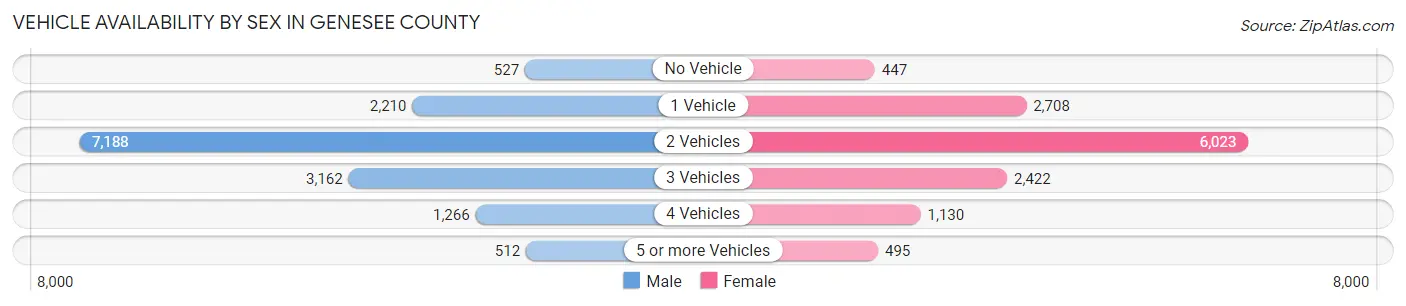
| Vehicles Available | Male | Female |
| No Vehicle | 527 (3.5%) | 447 (3.4%) |
| 1 Vehicle | 2,210 (14.9%) | 2,708 (20.5%) |
| 2 Vehicles | 7,188 (48.4%) | 6,023 (45.5%) |
| 3 Vehicles | 3,162 (21.3%) | 2,422 (18.3%) |
| 4 Vehicles | 1,266 (8.5%) | 1,130 (8.5%) |
| 5 or more Vehicles | 512 (3.4%) | 495 (3.7%) |
| Total | 14,865 (100.0%) | 13,225 (100.0%) |
Commute Time in Genesee County
The most frequently occuring commute durations in Genesee County are 15 to 19 minutes (4,213 commuters, 15.8%), 5 to 9 minutes (3,823 commuters, 14.3%), and 10 to 14 minutes (3,601 commuters, 13.5%).
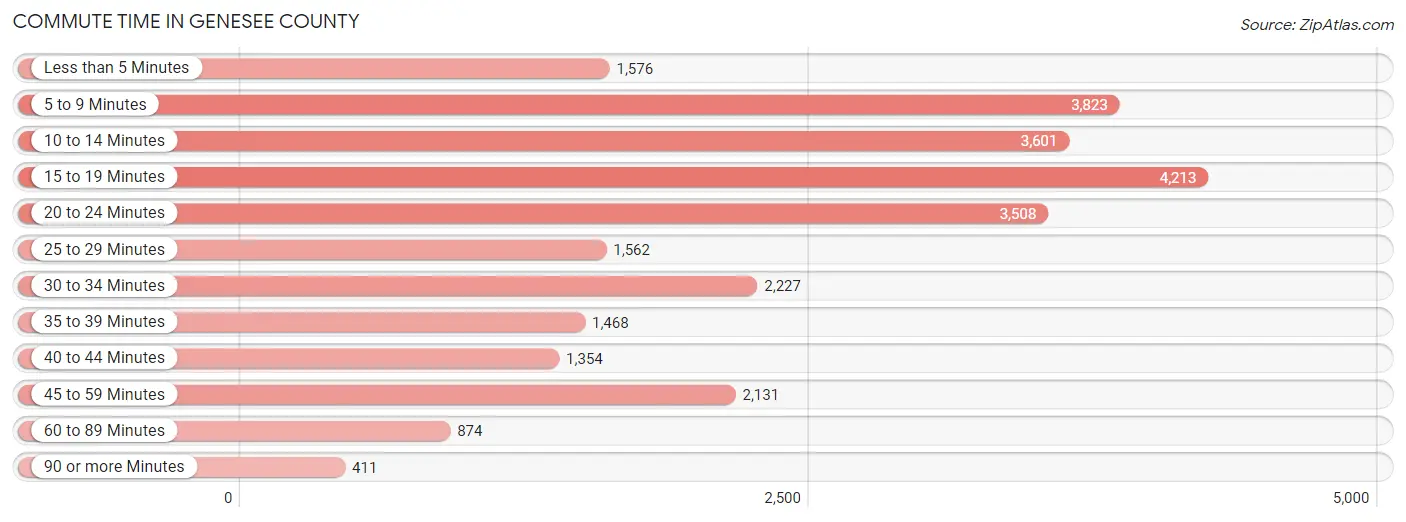
| Commute Time | # Commuters | % Commuters |
| Less than 5 Minutes | 1,576 | 5.9% |
| 5 to 9 Minutes | 3,823 | 14.3% |
| 10 to 14 Minutes | 3,601 | 13.5% |
| 15 to 19 Minutes | 4,213 | 15.8% |
| 20 to 24 Minutes | 3,508 | 13.1% |
| 25 to 29 Minutes | 1,562 | 5.8% |
| 30 to 34 Minutes | 2,227 | 8.3% |
| 35 to 39 Minutes | 1,468 | 5.5% |
| 40 to 44 Minutes | 1,354 | 5.1% |
| 45 to 59 Minutes | 2,131 | 8.0% |
| 60 to 89 Minutes | 874 | 3.3% |
| 90 or more Minutes | 411 | 1.5% |
Commute Time by Sex in Genesee County
The most common commute times in Genesee County are 15 to 19 minutes (1,831 commuters, 12.7%) for males and 15 to 19 minutes (2,382 commuters, 19.3%) for females.
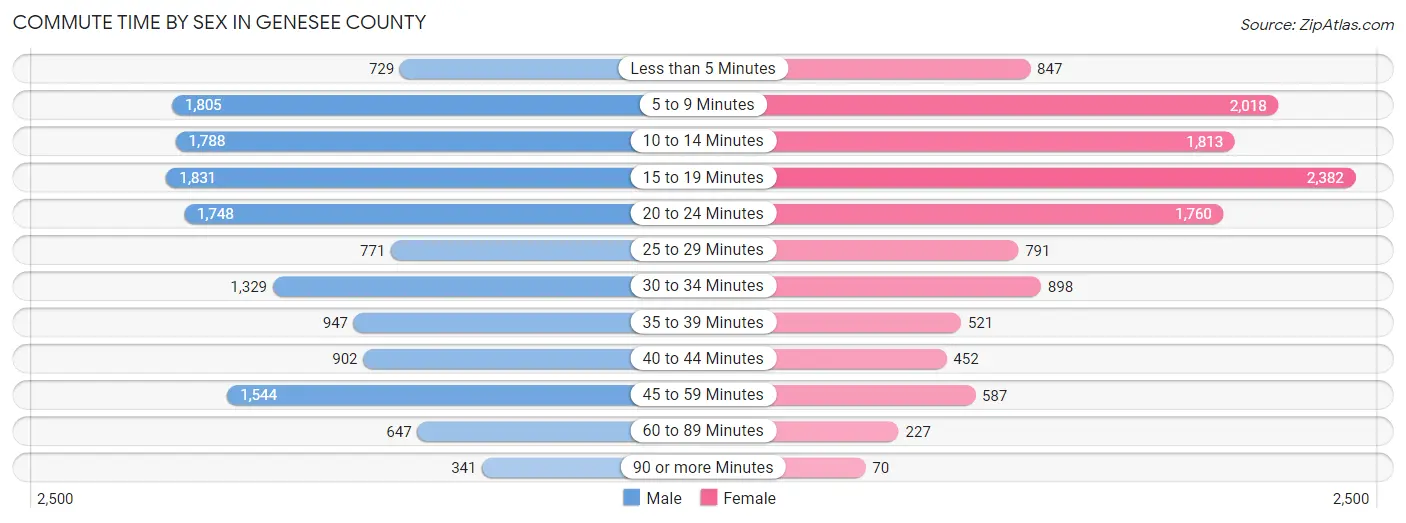
| Commute Time | Male | Female |
| Less than 5 Minutes | 729 (5.1%) | 847 (6.9%) |
| 5 to 9 Minutes | 1,805 (12.6%) | 2,018 (16.3%) |
| 10 to 14 Minutes | 1,788 (12.4%) | 1,813 (14.7%) |
| 15 to 19 Minutes | 1,831 (12.7%) | 2,382 (19.3%) |
| 20 to 24 Minutes | 1,748 (12.1%) | 1,760 (14.2%) |
| 25 to 29 Minutes | 771 (5.4%) | 791 (6.4%) |
| 30 to 34 Minutes | 1,329 (9.2%) | 898 (7.3%) |
| 35 to 39 Minutes | 947 (6.6%) | 521 (4.2%) |
| 40 to 44 Minutes | 902 (6.3%) | 452 (3.7%) |
| 45 to 59 Minutes | 1,544 (10.7%) | 587 (4.8%) |
| 60 to 89 Minutes | 647 (4.5%) | 227 (1.8%) |
| 90 or more Minutes | 341 (2.4%) | 70 (0.6%) |
Time of Departure to Work by Sex in Genesee County
The most frequent times of departure to work in Genesee County are 6:00 AM to 6:29 AM (1,908, 13.3%) for males and 7:30 AM to 7:59 AM (2,245, 18.1%) for females.
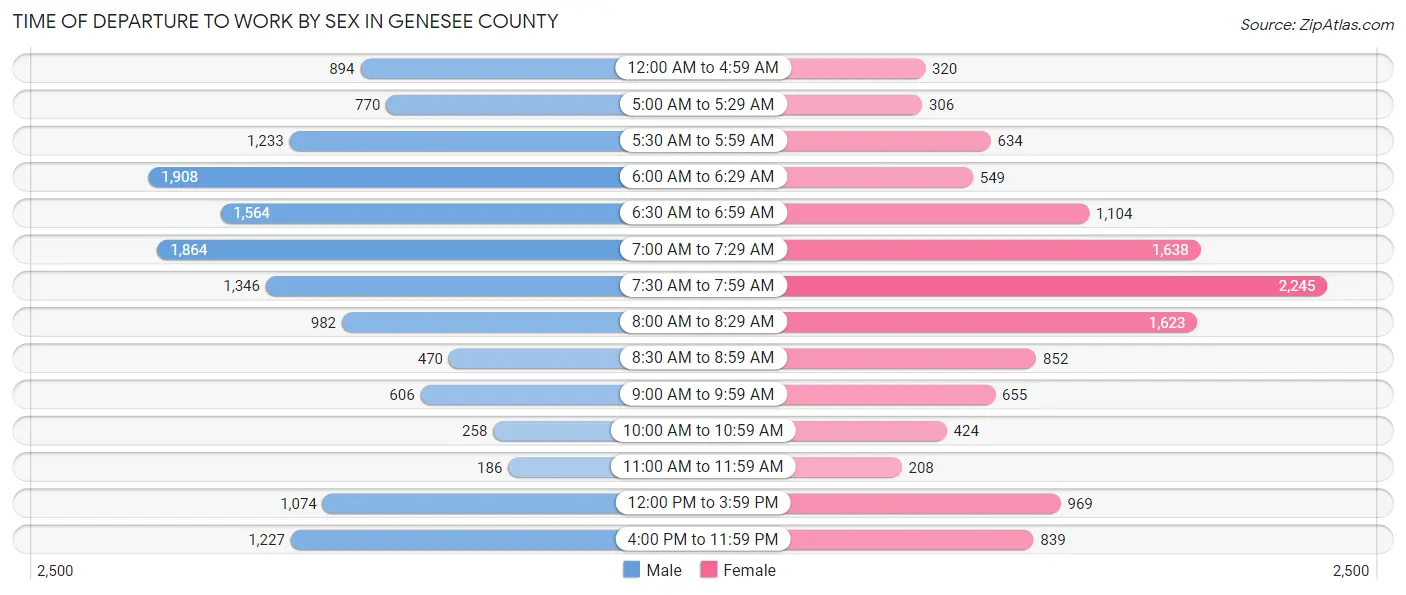
| Time of Departure | Male | Female |
| 12:00 AM to 4:59 AM | 894 (6.2%) | 320 (2.6%) |
| 5:00 AM to 5:29 AM | 770 (5.3%) | 306 (2.5%) |
| 5:30 AM to 5:59 AM | 1,233 (8.6%) | 634 (5.1%) |
| 6:00 AM to 6:29 AM | 1,908 (13.3%) | 549 (4.4%) |
| 6:30 AM to 6:59 AM | 1,564 (10.9%) | 1,104 (8.9%) |
| 7:00 AM to 7:29 AM | 1,864 (13.0%) | 1,638 (13.3%) |
| 7:30 AM to 7:59 AM | 1,346 (9.4%) | 2,245 (18.1%) |
| 8:00 AM to 8:29 AM | 982 (6.8%) | 1,623 (13.1%) |
| 8:30 AM to 8:59 AM | 470 (3.3%) | 852 (6.9%) |
| 9:00 AM to 9:59 AM | 606 (4.2%) | 655 (5.3%) |
| 10:00 AM to 10:59 AM | 258 (1.8%) | 424 (3.4%) |
| 11:00 AM to 11:59 AM | 186 (1.3%) | 208 (1.7%) |
| 12:00 PM to 3:59 PM | 1,074 (7.5%) | 969 (7.8%) |
| 4:00 PM to 11:59 PM | 1,227 (8.5%) | 839 (6.8%) |
| Total | 14,382 (100.0%) | 12,366 (100.0%) |
Housing Occupancy in Genesee County
Occupancy by Ownership in Genesee County
Of the total 24,416 dwellings in Genesee County, owner-occupied units account for 17,919 (73.4%), while renter-occupied units make up 6,497 (26.6%).
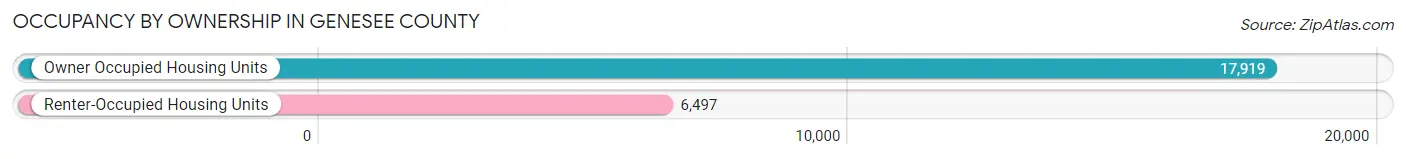
| Occupancy | # Housing Units | % Housing Units |
| Owner Occupied Housing Units | 17,919 | 73.4% |
| Renter-Occupied Housing Units | 6,497 | 26.6% |
| Total Occupied Housing Units | 24,416 | 100.0% |
Occupancy by Household Size in Genesee County
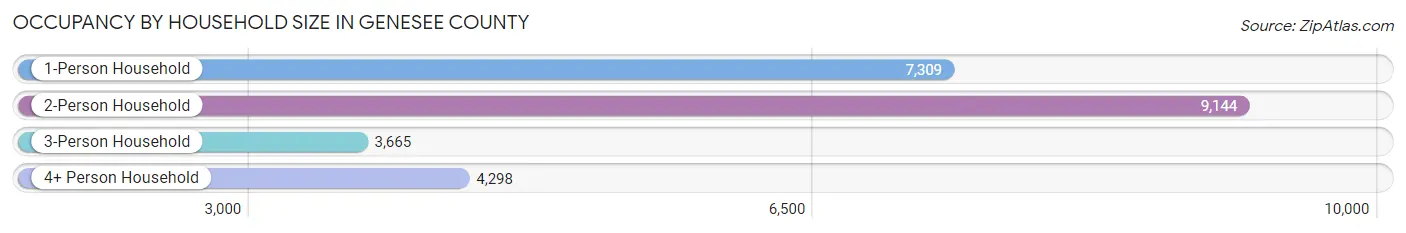
| Household Size | # Housing Units | % Housing Units |
| 1-Person Household | 7,309 | 29.9% |
| 2-Person Household | 9,144 | 37.4% |
| 3-Person Household | 3,665 | 15.0% |
| 4+ Person Household | 4,298 | 17.6% |
| Total Housing Units | 24,416 | 100.0% |
Occupancy by Ownership by Household Size in Genesee County
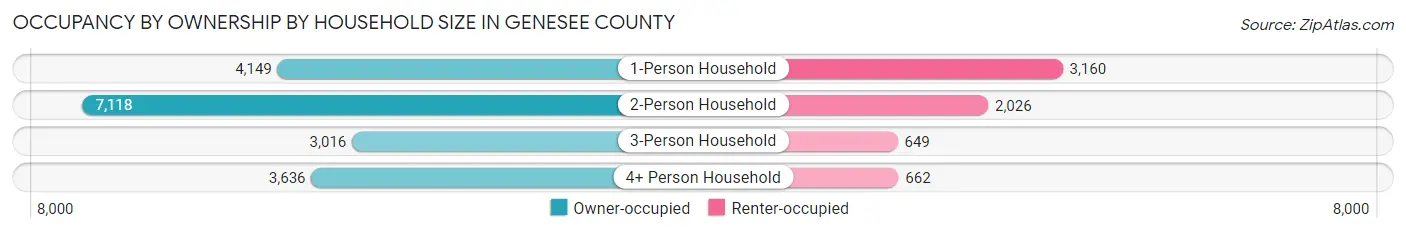
| Household Size | Owner-occupied | Renter-occupied |
| 1-Person Household | 4,149 (56.8%) | 3,160 (43.2%) |
| 2-Person Household | 7,118 (77.8%) | 2,026 (22.2%) |
| 3-Person Household | 3,016 (82.3%) | 649 (17.7%) |
| 4+ Person Household | 3,636 (84.6%) | 662 (15.4%) |
| Total Housing Units | 17,919 (73.4%) | 6,497 (26.6%) |
Occupancy by Educational Attainment in Genesee County
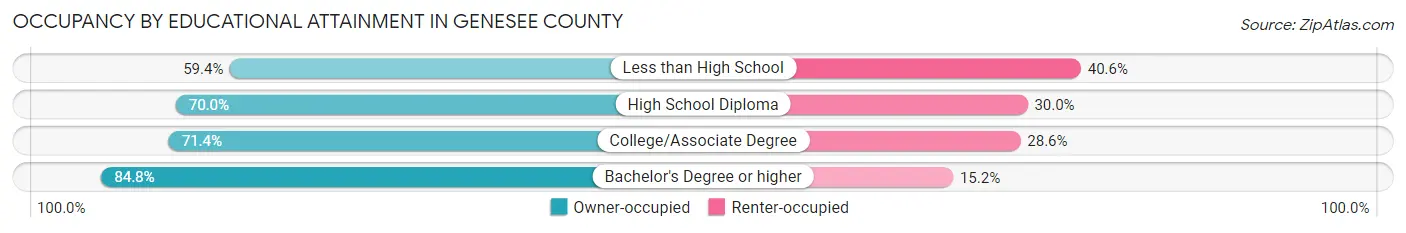
| Household Size | Owner-occupied | Renter-occupied |
| Less than High School | 1,015 (59.4%) | 693 (40.6%) |
| High School Diploma | 5,676 (70.0%) | 2,431 (30.0%) |
| College/Associate Degree | 6,141 (71.4%) | 2,459 (28.6%) |
| Bachelor's Degree or higher | 5,087 (84.8%) | 914 (15.2%) |
Occupancy by Age of Householder in Genesee County
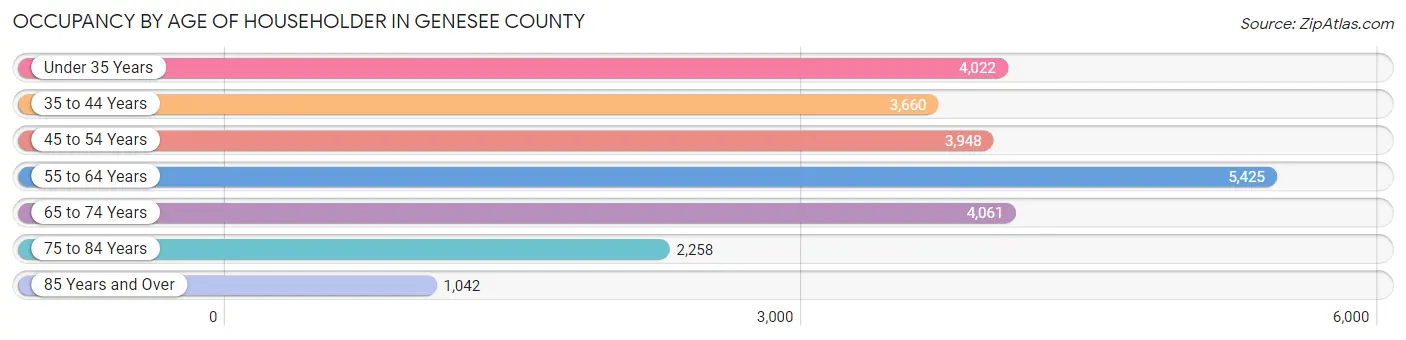
| Age Bracket | # Households | % Households |
| Under 35 Years | 4,022 | 16.5% |
| 35 to 44 Years | 3,660 | 15.0% |
| 45 to 54 Years | 3,948 | 16.2% |
| 55 to 64 Years | 5,425 | 22.2% |
| 65 to 74 Years | 4,061 | 16.6% |
| 75 to 84 Years | 2,258 | 9.2% |
| 85 Years and Over | 1,042 | 4.3% |
| Total | 24,416 | 100.0% |
Housing Finances in Genesee County
Median Income by Occupancy in Genesee County
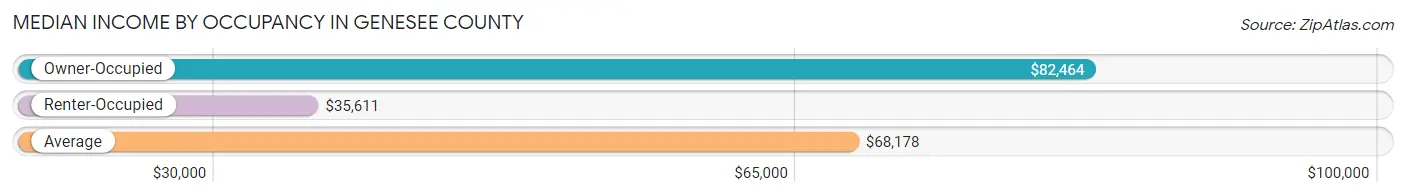
| Occupancy Type | # Households | Median Income |
| Owner-Occupied | 17,919 (73.4%) | $82,464 |
| Renter-Occupied | 6,497 (26.6%) | $35,611 |
| Average | 24,416 (100.0%) | $68,178 |
Occupancy by Householder Income Bracket in Genesee County
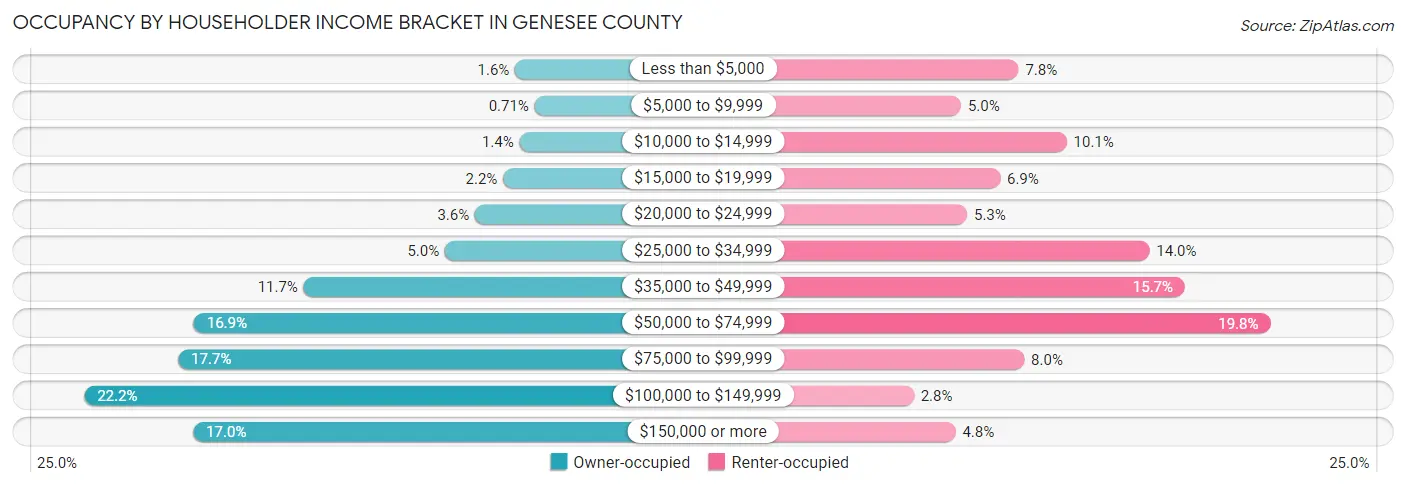
| Income Bracket | Owner-occupied | Renter-occupied |
| Less than $5,000 | 293 (1.6%) | 504 (7.8%) |
| $5,000 to $9,999 | 127 (0.7%) | 326 (5.0%) |
| $10,000 to $14,999 | 257 (1.4%) | 653 (10.1%) |
| $15,000 to $19,999 | 396 (2.2%) | 447 (6.9%) |
| $20,000 to $24,999 | 636 (3.5%) | 345 (5.3%) |
| $25,000 to $34,999 | 893 (5.0%) | 909 (14.0%) |
| $35,000 to $49,999 | 2,099 (11.7%) | 1,019 (15.7%) |
| $50,000 to $74,999 | 3,035 (16.9%) | 1,283 (19.8%) |
| $75,000 to $99,999 | 3,170 (17.7%) | 522 (8.0%) |
| $100,000 to $149,999 | 3,971 (22.2%) | 180 (2.8%) |
| $150,000 or more | 3,042 (17.0%) | 309 (4.8%) |
| Total | 17,919 (100.0%) | 6,497 (100.0%) |
Monthly Housing Cost Tiers in Genesee County
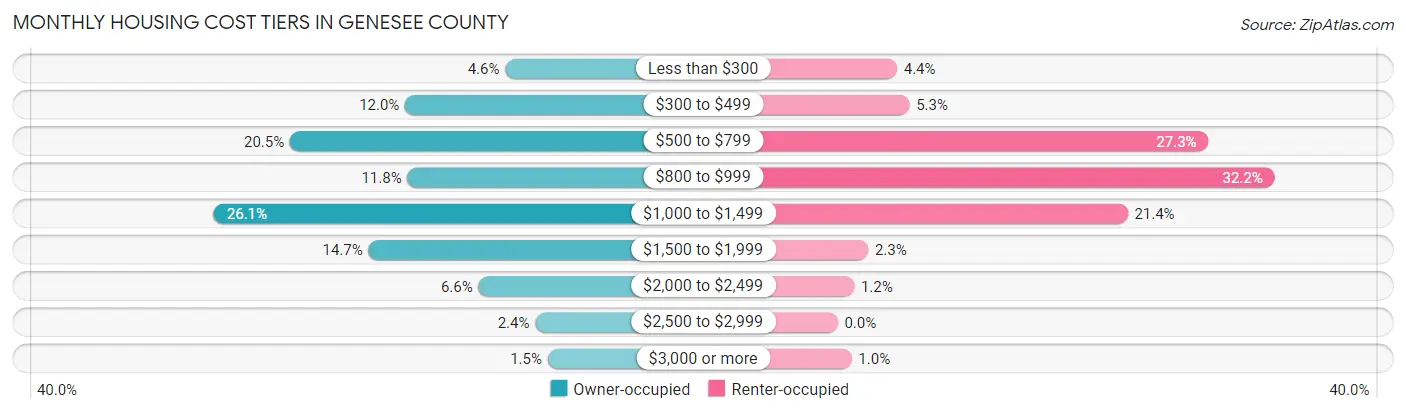
| Monthly Cost | Owner-occupied | Renter-occupied |
| Less than $300 | 825 (4.6%) | 284 (4.4%) |
| $300 to $499 | 2,145 (12.0%) | 344 (5.3%) |
| $500 to $799 | 3,665 (20.4%) | 1,775 (27.3%) |
| $800 to $999 | 2,115 (11.8%) | 2,092 (32.2%) |
| $1,000 to $1,499 | 4,670 (26.1%) | 1,388 (21.4%) |
| $1,500 to $1,999 | 2,629 (14.7%) | 146 (2.2%) |
| $2,000 to $2,499 | 1,178 (6.6%) | 79 (1.2%) |
| $2,500 to $2,999 | 428 (2.4%) | 0 (0.0%) |
| $3,000 or more | 264 (1.5%) | 67 (1.0%) |
| Total | 17,919 (100.0%) | 6,497 (100.0%) |
Physical Housing Characteristics in Genesee County
Housing Structures in Genesee County
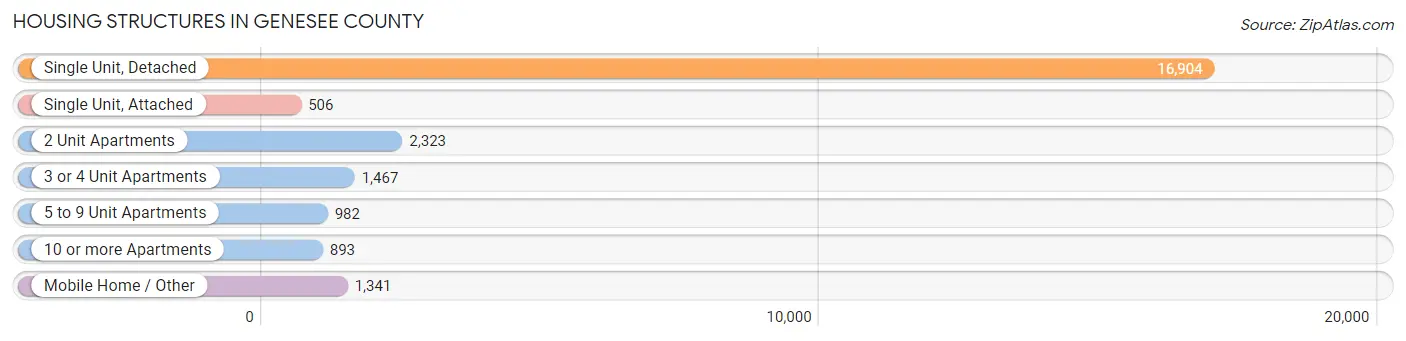
| Structure Type | # Housing Units | % Housing Units |
| Single Unit, Detached | 16,904 | 69.2% |
| Single Unit, Attached | 506 | 2.1% |
| 2 Unit Apartments | 2,323 | 9.5% |
| 3 or 4 Unit Apartments | 1,467 | 6.0% |
| 5 to 9 Unit Apartments | 982 | 4.0% |
| 10 or more Apartments | 893 | 3.7% |
| Mobile Home / Other | 1,341 | 5.5% |
| Total | 24,416 | 100.0% |
Housing Structures by Occupancy in Genesee County
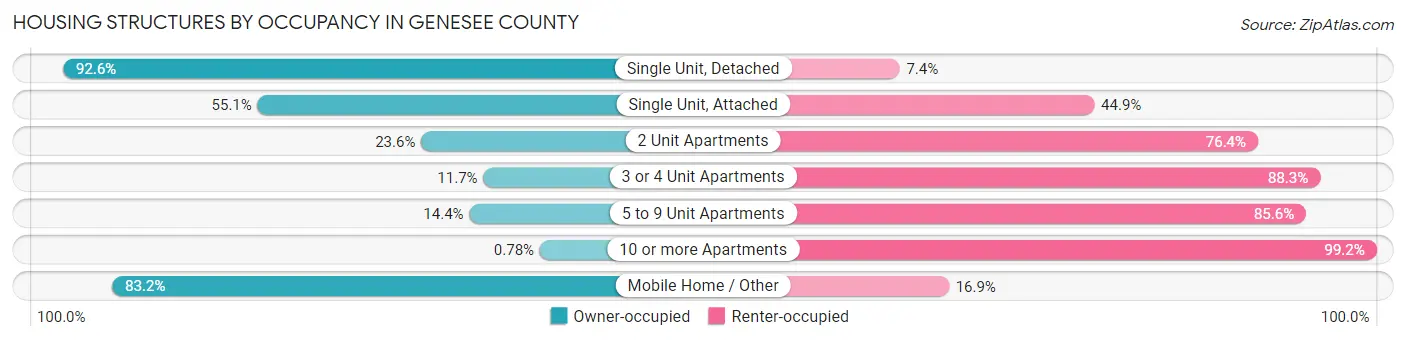
| Structure Type | Owner-occupied | Renter-occupied |
| Single Unit, Detached | 15,657 (92.6%) | 1,247 (7.4%) |
| Single Unit, Attached | 279 (55.1%) | 227 (44.9%) |
| 2 Unit Apartments | 549 (23.6%) | 1,774 (76.4%) |
| 3 or 4 Unit Apartments | 171 (11.7%) | 1,296 (88.3%) |
| 5 to 9 Unit Apartments | 141 (14.4%) | 841 (85.6%) |
| 10 or more Apartments | 7 (0.8%) | 886 (99.2%) |
| Mobile Home / Other | 1,115 (83.2%) | 226 (16.9%) |
| Total | 17,919 (73.4%) | 6,497 (26.6%) |
Housing Structures by Number of Rooms in Genesee County
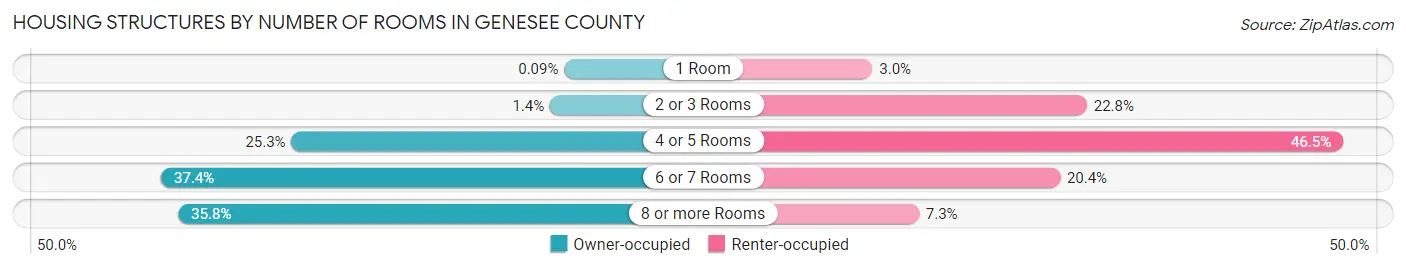
| Number of Rooms | Owner-occupied | Renter-occupied |
| 1 Room | 17 (0.1%) | 195 (3.0%) |
| 2 or 3 Rooms | 250 (1.4%) | 1,483 (22.8%) |
| 4 or 5 Rooms | 4,537 (25.3%) | 3,023 (46.5%) |
| 6 or 7 Rooms | 6,700 (37.4%) | 1,322 (20.3%) |
| 8 or more Rooms | 6,415 (35.8%) | 474 (7.3%) |
| Total | 17,919 (100.0%) | 6,497 (100.0%) |
Housing Structure by Heating Type in Genesee County
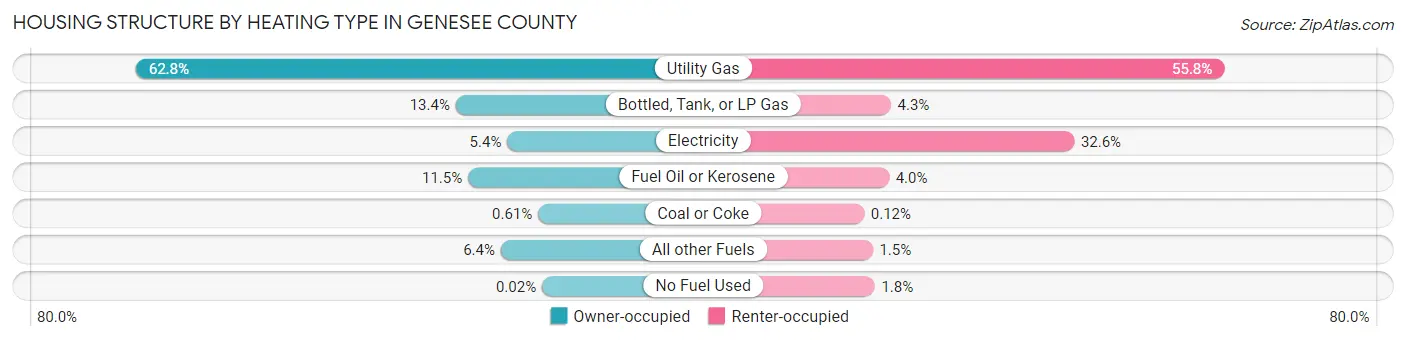
| Heating Type | Owner-occupied | Renter-occupied |
| Utility Gas | 11,254 (62.8%) | 3,626 (55.8%) |
| Bottled, Tank, or LP Gas | 2,392 (13.4%) | 277 (4.3%) |
| Electricity | 965 (5.4%) | 2,118 (32.6%) |
| Fuel Oil or Kerosene | 2,051 (11.5%) | 258 (4.0%) |
| Coal or Coke | 110 (0.6%) | 8 (0.1%) |
| All other Fuels | 1,144 (6.4%) | 95 (1.5%) |
| No Fuel Used | 3 (0.0%) | 115 (1.8%) |
| Total | 17,919 (100.0%) | 6,497 (100.0%) |
Household Vehicle Usage in Genesee County
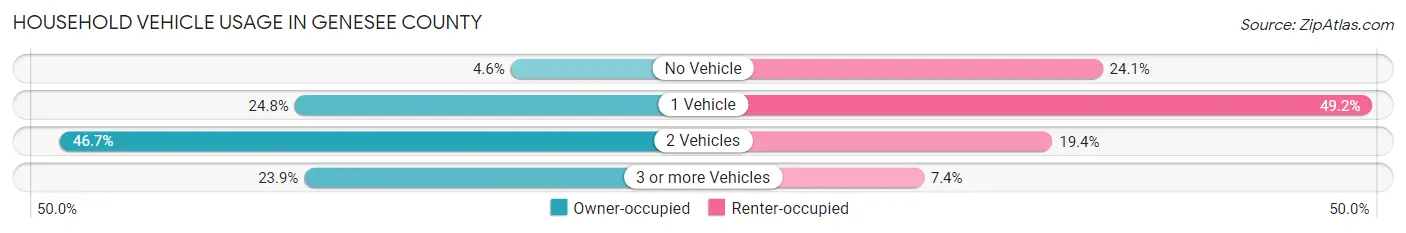
| Vehicles per Household | Owner-occupied | Renter-occupied |
| No Vehicle | 831 (4.6%) | 1,563 (24.1%) |
| 1 Vehicle | 4,442 (24.8%) | 3,198 (49.2%) |
| 2 Vehicles | 8,364 (46.7%) | 1,258 (19.4%) |
| 3 or more Vehicles | 4,282 (23.9%) | 478 (7.4%) |
| Total | 17,919 (100.0%) | 6,497 (100.0%) |
Real Estate & Mortgages in Genesee County
Real Estate and Mortgage Overview in Genesee County
| Characteristic | Without Mortgage | With Mortgage |
| Housing Units | 7,458 | 10,461 |
| Median Property Value | $138,600 | $155,200 |
| Median Household Income | $63,359 | $2,189 |
| Monthly Housing Costs | $604 | $258 |
| Real Estate Taxes | $3,338 | $355 |
Property Value by Mortgage Status in Genesee County
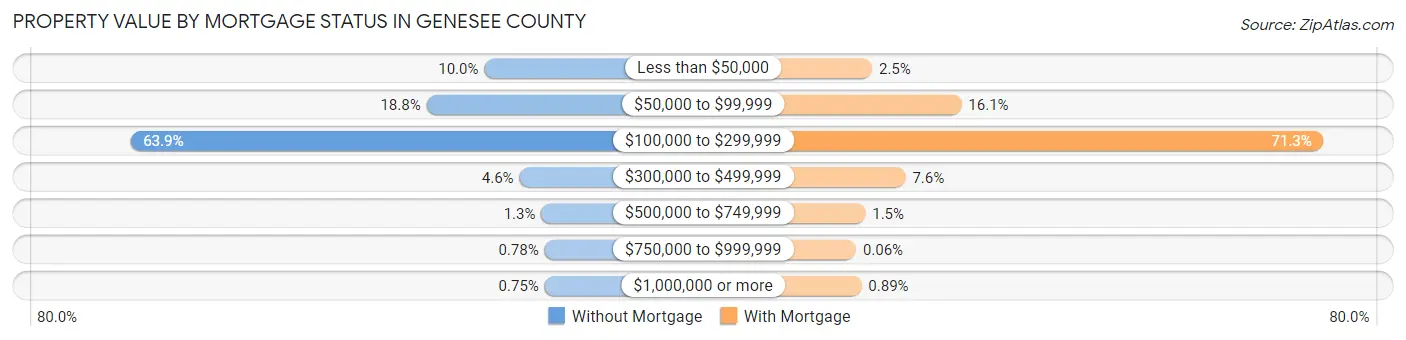
| Property Value | Without Mortgage | With Mortgage |
| Less than $50,000 | 742 (10.0%) | 263 (2.5%) |
| $50,000 to $99,999 | 1,399 (18.8%) | 1,687 (16.1%) |
| $100,000 to $299,999 | 4,766 (63.9%) | 7,461 (71.3%) |
| $300,000 to $499,999 | 343 (4.6%) | 796 (7.6%) |
| $500,000 to $749,999 | 94 (1.3%) | 155 (1.5%) |
| $750,000 to $999,999 | 58 (0.8%) | 6 (0.1%) |
| $1,000,000 or more | 56 (0.7%) | 93 (0.9%) |
| Total | 7,458 (100.0%) | 10,461 (100.0%) |
Household Income by Mortgage Status in Genesee County
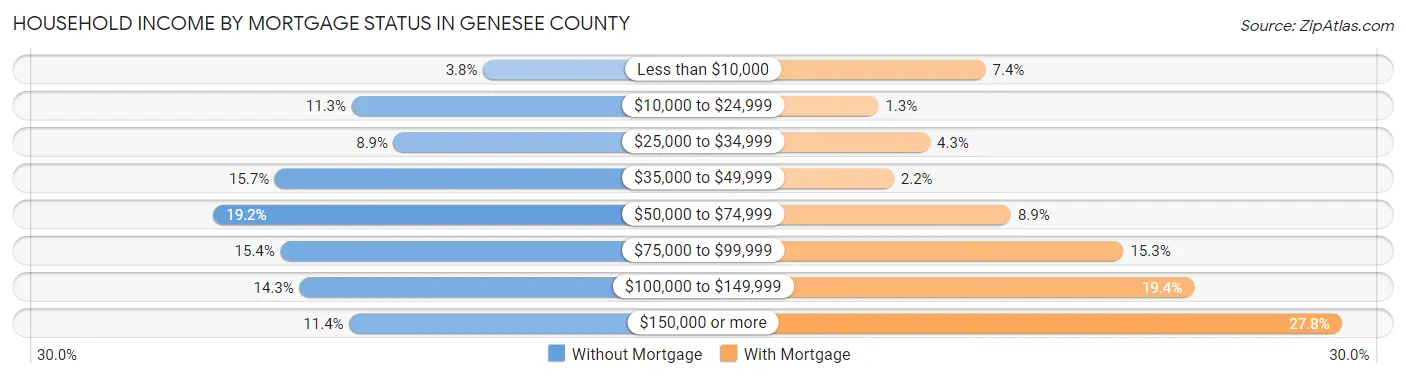
| Household Income | Without Mortgage | With Mortgage |
| Less than $10,000 | 283 (3.8%) | 777 (7.4%) |
| $10,000 to $24,999 | 843 (11.3%) | 137 (1.3%) |
| $25,000 to $34,999 | 664 (8.9%) | 446 (4.3%) |
| $35,000 to $49,999 | 1,170 (15.7%) | 229 (2.2%) |
| $50,000 to $74,999 | 1,433 (19.2%) | 929 (8.9%) |
| $75,000 to $99,999 | 1,146 (15.4%) | 1,602 (15.3%) |
| $100,000 to $149,999 | 1,066 (14.3%) | 2,024 (19.4%) |
| $150,000 or more | 853 (11.4%) | 2,905 (27.8%) |
| Total | 7,458 (100.0%) | 10,461 (100.0%) |
Property Value to Household Income Ratio in Genesee County
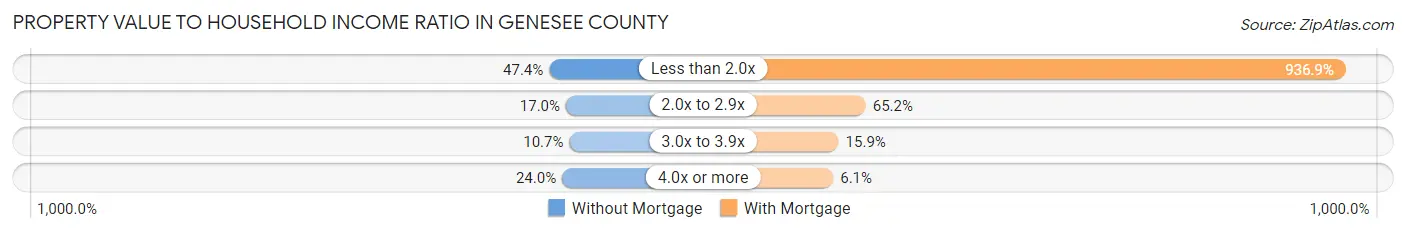
| Value-to-Income Ratio | Without Mortgage | With Mortgage |
| Less than 2.0x | 3,537 (47.4%) | 98,004 (936.8%) |
| 2.0x to 2.9x | 1,271 (17.0%) | 6,823 (65.2%) |
| 3.0x to 3.9x | 800 (10.7%) | 1,661 (15.9%) |
| 4.0x or more | 1,793 (24.0%) | 635 (6.1%) |
| Total | 7,458 (100.0%) | 10,461 (100.0%) |
Real Estate Taxes by Mortgage Status in Genesee County
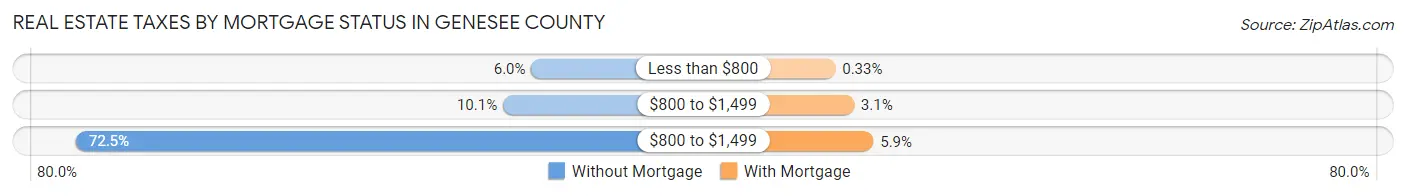
| Property Taxes | Without Mortgage | With Mortgage |
| Less than $800 | 444 (5.9%) | 35 (0.3%) |
| $800 to $1,499 | 753 (10.1%) | 319 (3.0%) |
| $800 to $1,499 | 5,407 (72.5%) | 615 (5.9%) |
| Total | 7,458 (100.0%) | 10,461 (100.0%) |
Health & Disability in Genesee County
Health Insurance Coverage by Age in Genesee County
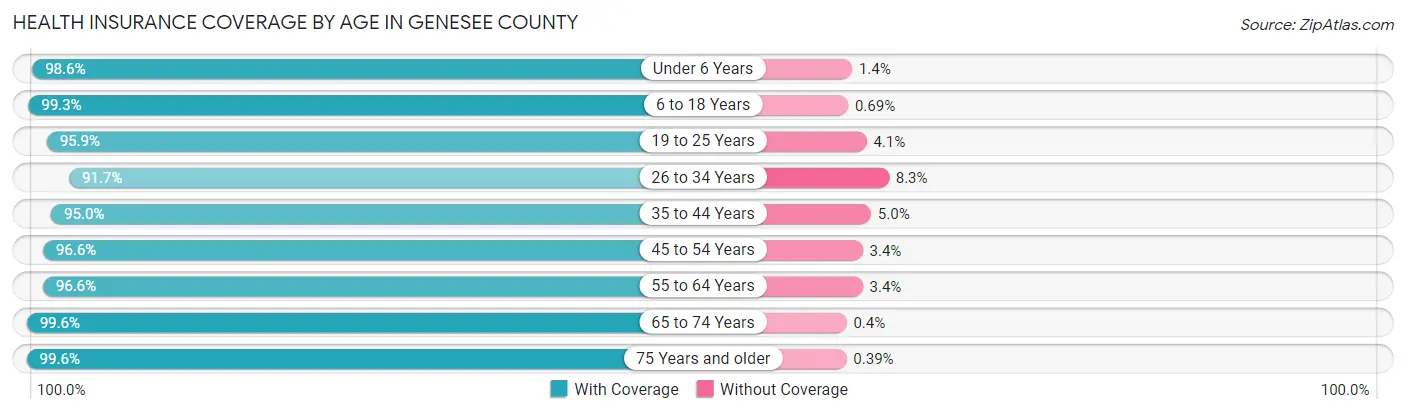
| Age Bracket | With Coverage | Without Coverage |
| Under 6 Years | 3,666 (98.6%) | 53 (1.4%) |
| 6 to 18 Years | 8,521 (99.3%) | 59 (0.7%) |
| 19 to 25 Years | 4,641 (95.9%) | 200 (4.1%) |
| 26 to 34 Years | 5,876 (91.7%) | 532 (8.3%) |
| 35 to 44 Years | 6,398 (95.0%) | 334 (5.0%) |
| 45 to 54 Years | 7,193 (96.6%) | 255 (3.4%) |
| 55 to 64 Years | 8,716 (96.6%) | 308 (3.4%) |
| 65 to 74 Years | 6,282 (99.6%) | 25 (0.4%) |
| 75 Years and older | 4,589 (99.6%) | 18 (0.4%) |
| Total | 55,882 (96.9%) | 1,784 (3.1%) |
Health Insurance Coverage by Citizenship Status in Genesee County
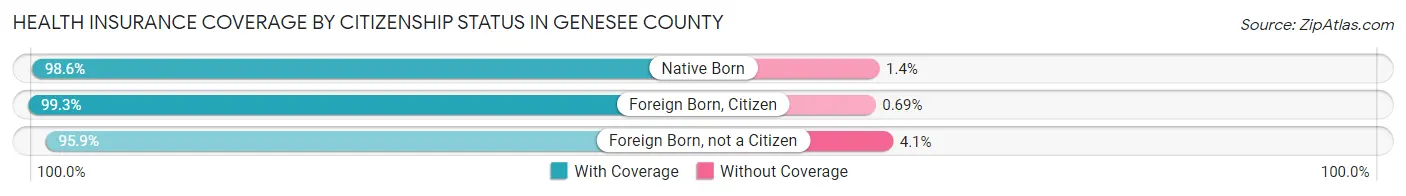
| Citizenship Status | With Coverage | Without Coverage |
| Native Born | 3,666 (98.6%) | 53 (1.4%) |
| Foreign Born, Citizen | 8,521 (99.3%) | 59 (0.7%) |
| Foreign Born, not a Citizen | 4,641 (95.9%) | 200 (4.1%) |
Health Insurance Coverage by Household Income in Genesee County
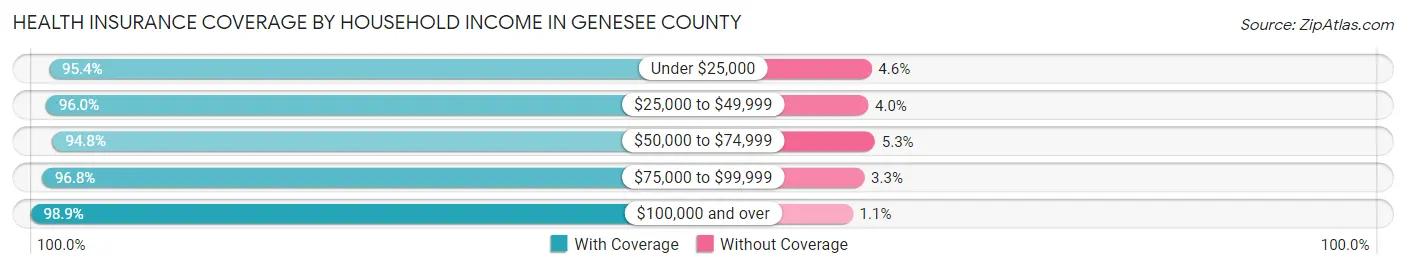
| Household Income | With Coverage | Without Coverage |
| Under $25,000 | 5,297 (95.4%) | 256 (4.6%) |
| $25,000 to $49,999 | 8,389 (96.0%) | 349 (4.0%) |
| $50,000 to $74,999 | 10,080 (94.8%) | 559 (5.2%) |
| $75,000 to $99,999 | 9,290 (96.8%) | 312 (3.3%) |
| $100,000 and over | 22,329 (98.9%) | 248 (1.1%) |
Public vs Private Health Insurance Coverage by Age in Genesee County
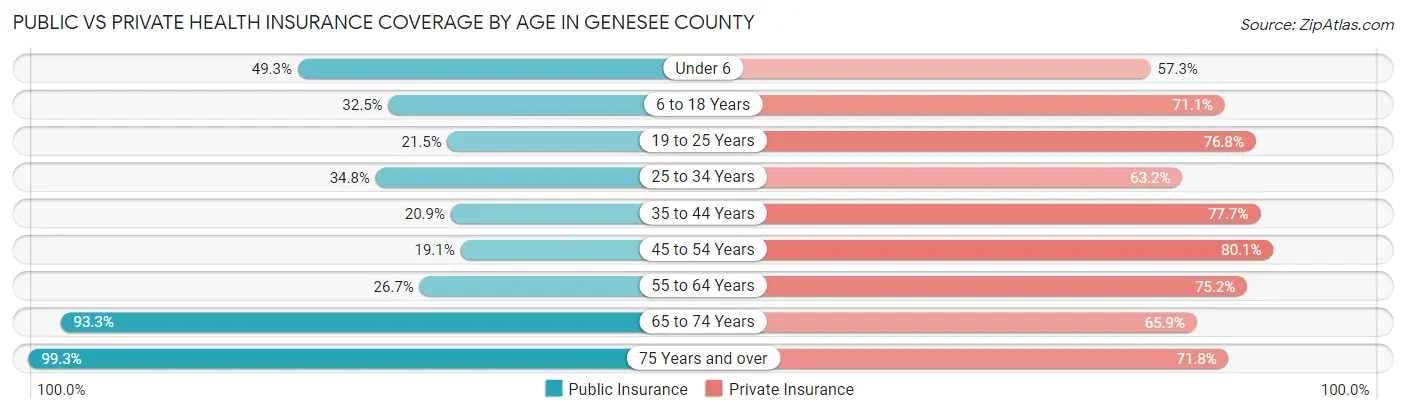
| Age Bracket | Public Insurance | Private Insurance |
| Under 6 | 1,833 (49.3%) | 2,132 (57.3%) |
| 6 to 18 Years | 2,786 (32.5%) | 6,101 (71.1%) |
| 19 to 25 Years | 1,041 (21.5%) | 3,720 (76.8%) |
| 25 to 34 Years | 2,232 (34.8%) | 4,050 (63.2%) |
| 35 to 44 Years | 1,406 (20.9%) | 5,228 (77.7%) |
| 45 to 54 Years | 1,422 (19.1%) | 5,966 (80.1%) |
| 55 to 64 Years | 2,408 (26.7%) | 6,790 (75.2%) |
| 65 to 74 Years | 5,886 (93.3%) | 4,155 (65.9%) |
| 75 Years and over | 4,574 (99.3%) | 3,308 (71.8%) |
| Total | 23,588 (40.9%) | 41,450 (71.9%) |
Disability Status by Sex by Age in Genesee County
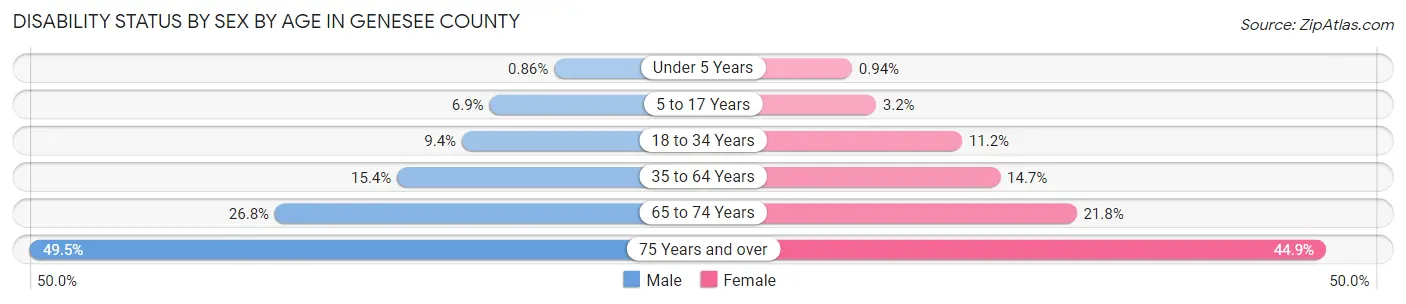
| Age Bracket | Male | Female |
| Under 5 Years | 13 (0.9%) | 14 (0.9%) |
| 5 to 17 Years | 308 (6.9%) | 137 (3.2%) |
| 18 to 34 Years | 574 (9.4%) | 628 (11.2%) |
| 35 to 64 Years | 1,811 (15.4%) | 1,684 (14.7%) |
| 65 to 74 Years | 828 (26.8%) | 700 (21.8%) |
| 75 Years and over | 934 (49.5%) | 1,222 (44.9%) |
Disability Class by Sex by Age in Genesee County
Disability Class: Hearing Difficulty
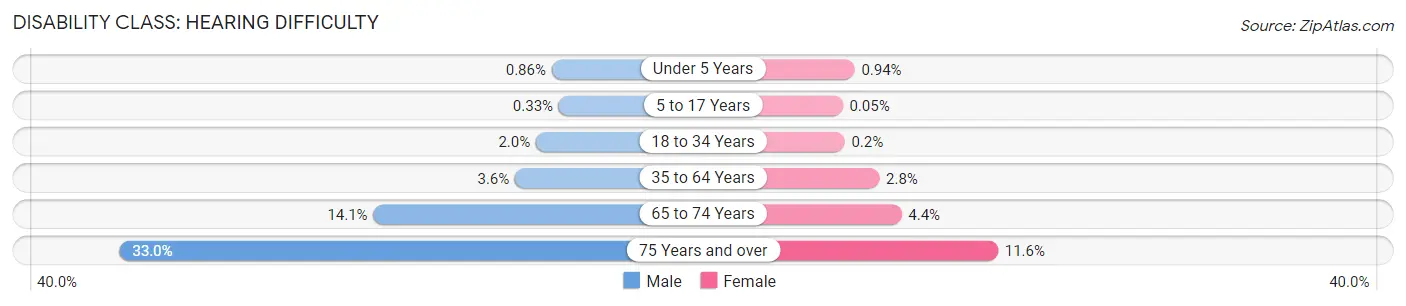
| Age Bracket | Male | Female |
| Under 5 Years | 13 (0.9%) | 14 (0.9%) |
| 5 to 17 Years | 15 (0.3%) | 2 (0.1%) |
| 18 to 34 Years | 124 (2.0%) | 11 (0.2%) |
| 35 to 64 Years | 420 (3.6%) | 317 (2.8%) |
| 65 to 74 Years | 436 (14.1%) | 142 (4.4%) |
| 75 Years and over | 622 (33.0%) | 315 (11.6%) |
Disability Class: Vision Difficulty
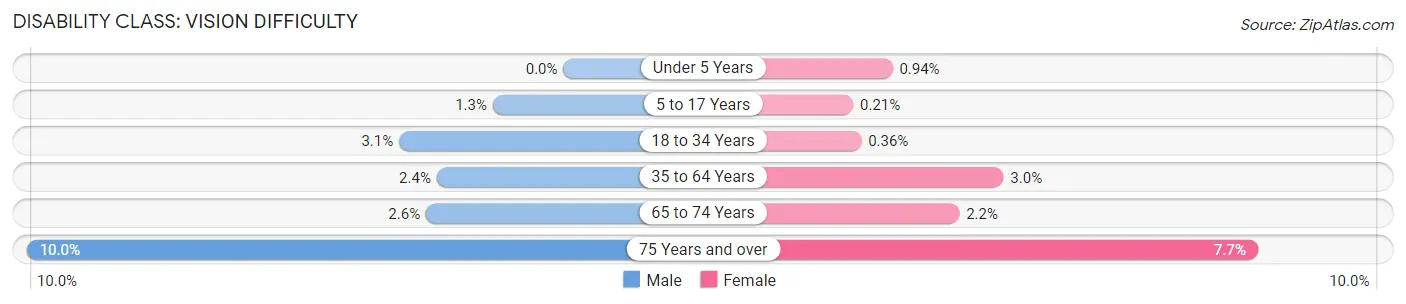
| Age Bracket | Male | Female |
| Under 5 Years | 0 (0.0%) | 14 (0.9%) |
| 5 to 17 Years | 59 (1.3%) | 9 (0.2%) |
| 18 to 34 Years | 186 (3.0%) | 20 (0.4%) |
| 35 to 64 Years | 276 (2.4%) | 344 (3.0%) |
| 65 to 74 Years | 79 (2.5%) | 70 (2.2%) |
| 75 Years and over | 188 (10.0%) | 210 (7.7%) |
Disability Class: Cognitive Difficulty
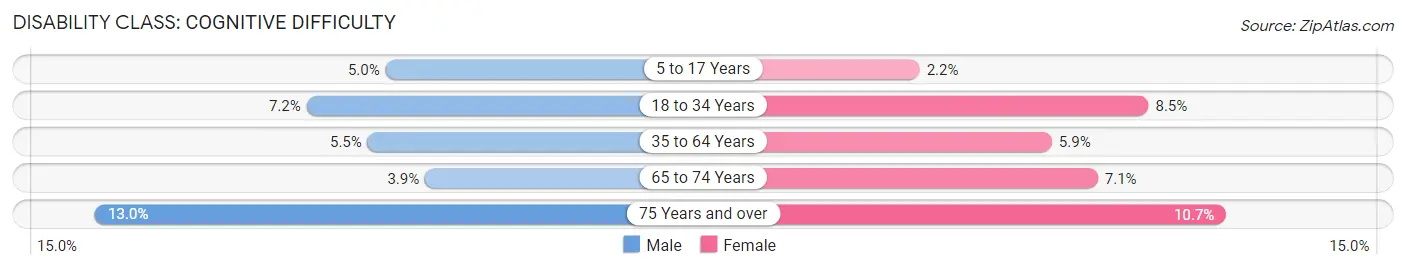
| Age Bracket | Male | Female |
| 5 to 17 Years | 222 (5.0%) | 94 (2.2%) |
| 18 to 34 Years | 436 (7.1%) | 481 (8.5%) |
| 35 to 64 Years | 640 (5.4%) | 671 (5.9%) |
| 65 to 74 Years | 119 (3.8%) | 229 (7.1%) |
| 75 Years and over | 246 (13.0%) | 291 (10.7%) |
Disability Class: Ambulatory Difficulty
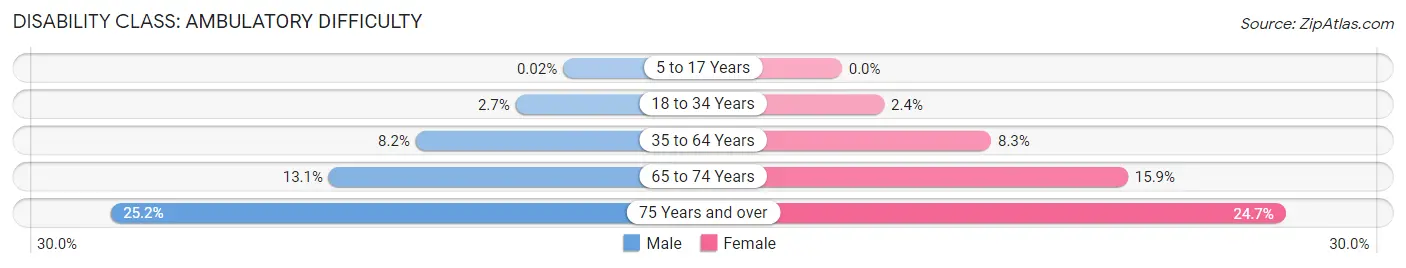
| Age Bracket | Male | Female |
| 5 to 17 Years | 1 (0.0%) | 0 (0.0%) |
| 18 to 34 Years | 162 (2.7%) | 133 (2.4%) |
| 35 to 64 Years | 965 (8.2%) | 953 (8.3%) |
| 65 to 74 Years | 404 (13.1%) | 512 (15.9%) |
| 75 Years and over | 476 (25.2%) | 672 (24.7%) |
Disability Class: Self-Care Difficulty
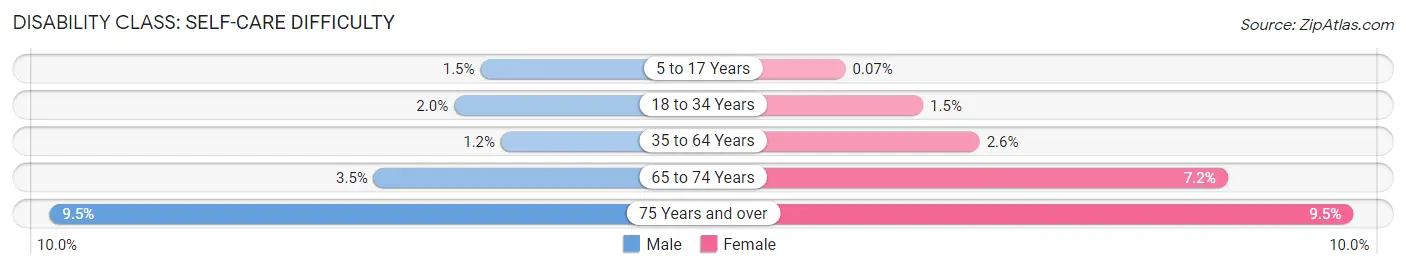
| Age Bracket | Male | Female |
| 5 to 17 Years | 69 (1.5%) | 3 (0.1%) |
| 18 to 34 Years | 124 (2.0%) | 85 (1.5%) |
| 35 to 64 Years | 136 (1.2%) | 294 (2.6%) |
| 65 to 74 Years | 109 (3.5%) | 230 (7.2%) |
| 75 Years and over | 180 (9.5%) | 258 (9.5%) |
Technology Access in Genesee County
Computing Device Access in Genesee County
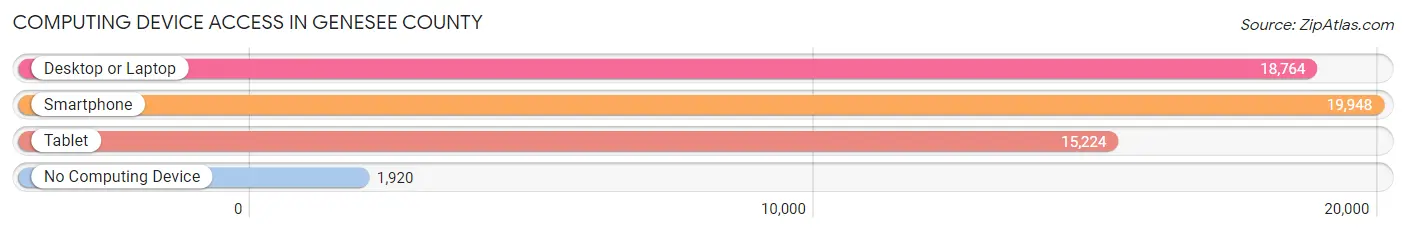
| Device Type | # Households | % Households |
| Desktop or Laptop | 18,764 | 76.8% |
| Smartphone | 19,948 | 81.7% |
| Tablet | 15,224 | 62.4% |
| No Computing Device | 1,920 | 7.9% |
| Total | 24,416 | 100.0% |
Internet Access in Genesee County
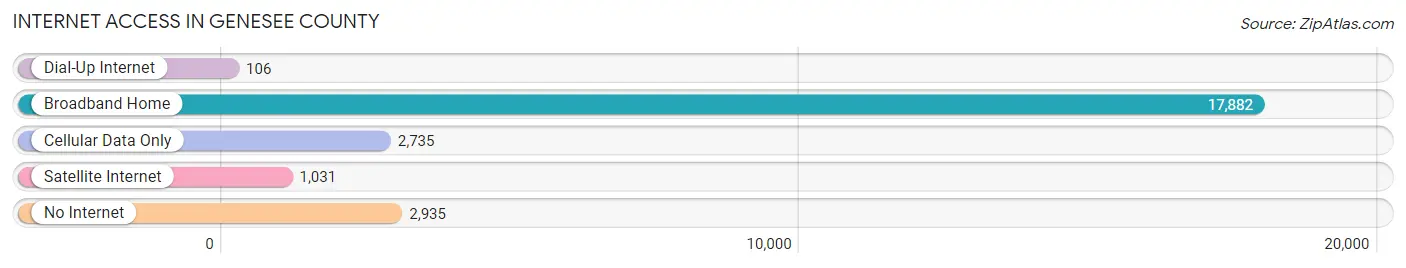
| Internet Type | # Households | % Households |
| Dial-Up Internet | 106 | 0.4% |
| Broadband Home | 17,882 | 73.2% |
| Cellular Data Only | 2,735 | 11.2% |
| Satellite Internet | 1,031 | 4.2% |
| No Internet | 2,935 | 12.0% |
| Total | 24,416 | 100.0% |
Genesee County Summary
Genesee County is located in the western part of New York State, and is part of the Buffalo-Niagara Falls metropolitan area. It is bordered by Wyoming County to the east, Livingston County to the south, Orleans County to the west, and Niagara County to the north. The county seat is Batavia, and the largest city is Rochester. Genesee County covers an area of 517 square miles, and has a population of approximately 60,000 people.
History
Genesee County was established in 1802, and was named after the Genesee River, which flows through the county. The county was originally part of Ontario County, and was later divided into Genesee and Livingston counties. The county was originally inhabited by the Seneca Nation of the Iroquois Confederacy, and was later settled by European immigrants.
The first settlers in the area were the French, who established trading posts in the area in the late 1600s. The British took control of the area in 1763, and the area was part of the Phelps and Gorham Purchase in 1788. The area was part of the Holland Purchase in 1792, and was divided into Genesee and Livingston counties in 1802.
The county was an important center of the abolitionist movement in the early 19th century, and was home to several prominent abolitionists, including Harriet Tubman and Frederick Douglass. The county was also an important center of the Underground Railroad, and was home to several safe houses for escaped slaves.
Geography
Genesee County is located in the western part of New York State, and is part of the Buffalo-Niagara Falls metropolitan area. It is bordered by Wyoming County to the east, Livingston County to the south, Orleans County to the west, and Niagara County to the north. The county seat is Batavia, and the largest city is Rochester.
The county is mostly flat, with rolling hills in the northern and eastern parts. The Genesee River flows through the county, and is the main source of water for the area. The county is also home to several lakes, including Honeoye Lake, Conesus Lake, and Hemlock Lake.
Economy
Genesee County has a diverse economy, with a mix of manufacturing, agriculture, and services. The county is home to several large companies, including Eastman Kodak, Xerox, and Wegmans. The county is also home to several smaller companies, including several wineries and craft breweries.
Agriculture is an important part of the county’s economy, and the county is home to several large farms. The county is also home to several dairy farms, and is one of the top producers of milk in the state.
Demographics
As of the 2010 census, the population of Genesee County was 59,945. The population is mostly white (90.2%), with small percentages of African Americans (4.2%), Asians (2.2%), and Hispanics (2.2%). The median household income is $50,945, and the median home value is $127,400.
The county is home to several colleges and universities, including the University of Rochester, Rochester Institute of Technology, and Genesee Community College. The county is also home to several museums, including the Genesee Country Village and Museum, and the Rochester Museum and Science Center.
Genesee County is a diverse and vibrant county, with a rich history and a strong economy. The county is home to several large companies, and is an important center of agriculture and education. The county is also home to several museums and cultural attractions, making it an attractive destination for visitors and residents alike.
Common Questions
What is Per Capita Income in Genesee County?
Per Capita income in Genesee County is $35,053.
What is the Median Family Income in Genesee County?
Median Family Income in Genesee County is $86,700.
What is the Median Household income in Genesee County?
Median Household Income in Genesee County is $68,178.
What is Income or Wage Gap in Genesee County?
Income or Wage Gap in Genesee County is 38.6%.
Women in Genesee County earn 61.4 cents for every dollar earned by a man.
What is Family Income Deficit in Genesee County?
Family Income Deficit in Genesee County is $10,556.
Families that are below poverty line in Genesee County earn $10,556 less on average than the poverty threshold level.
What is Inequality or Gini Index in Genesee County?
Inequality or Gini Index in Genesee County is 0.41.
What is the Total Population of Genesee County?
Total Population of Genesee County is 58,204.
What is the Total Male Population of Genesee County?
Total Male Population of Genesee County is 29,171.
What is the Total Female Population of Genesee County?
Total Female Population of Genesee County is 29,033.
What is the Ratio of Males per 100 Females in Genesee County?
There are 100.48 Males per 100 Females in Genesee County.
What is the Ratio of Females per 100 Males in Genesee County?
There are 99.53 Females per 100 Males in Genesee County.
What is the Median Population Age in Genesee County?
Median Population Age in Genesee County is 42.7 Years.
What is the Average Family Size in Genesee County
Average Family Size in Genesee County is 2.9 People.
What is the Average Household Size in Genesee County
Average Household Size in Genesee County is 2.3 People.
How Large is the Labor Force in Genesee County?
There are 30,319 People in the Labor Forcein in Genesee County.
What is the Percentage of People in the Labor Force in Genesee County?
63.7% of People are in the Labor Force in Genesee County.
What is the Unemployment Rate in Genesee County?
Unemployment Rate in Genesee County is 4.7%.