Erie County, NY Map & Demographics
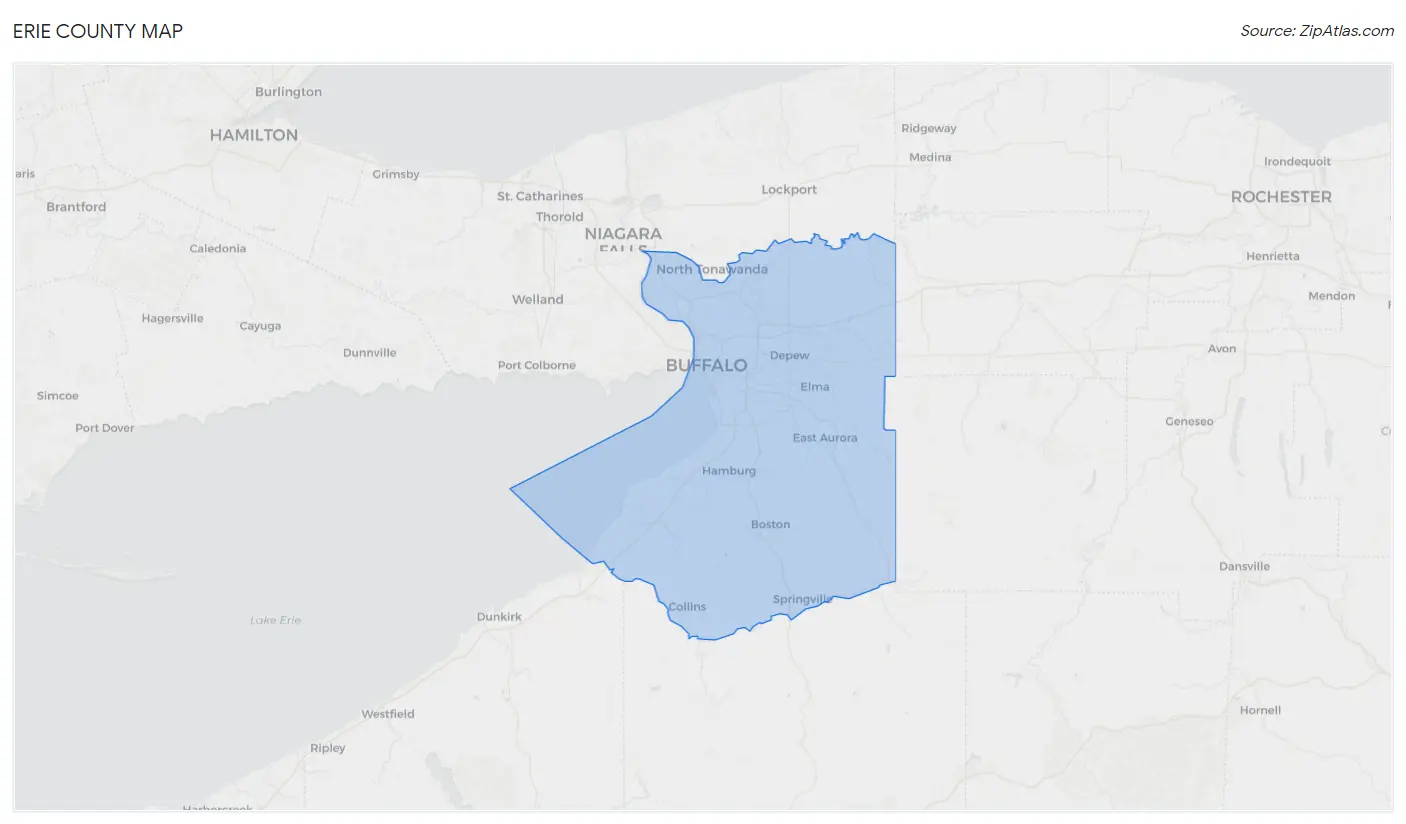
Erie County Map
Erie County Overview
$39,703
PER CAPITA INCOME
$92,038
AVG FAMILY INCOME
$68,014
AVG HOUSEHOLD INCOME
22.8%
WAGE / INCOME GAP [ % ]
77.2¢/ $1
WAGE / INCOME GAP [ $ ]
$10,930
FAMILY INCOME DEFICIT
0.46
INEQUALITY / GINI INDEX
951,232
TOTAL POPULATION
463,713
MALE POPULATION
487,519
FEMALE POPULATION
95.12
MALES / 100 FEMALES
105.13
FEMALES / 100 MALES
40.1
MEDIAN AGE
3.0
AVG FAMILY SIZE
2.3
AVG HOUSEHOLD SIZE
490,700
LABOR FORCE [ PEOPLE ]
62.7%
PERCENT IN LABOR FORCE
5.0%
UNEMPLOYMENT RATE
Income in Erie County
Income Overview in Erie County
Per Capita Income in Erie County is $39,703, while median incomes of families and households are $92,038 and $68,014 respectively.
| Characteristic | Number | Measure |
| Per Capita Income | 951,232 | $39,703 |
| Median Family Income | 233,370 | $92,038 |
| Mean Family Income | 233,370 | $113,505 |
| Median Household Income | 406,547 | $68,014 |
| Mean Household Income | 406,547 | $91,145 |
| Income Deficit | 233,370 | $10,930 |
| Wage / Income Gap (%) | 951,232 | 22.80% |
| Wage / Income Gap ($) | 951,232 | 77.20¢ per $1 |
| Gini / Inequality Index | 951,232 | 0.46 |
Earnings by Sex in Erie County
Average Earnings in Erie County are $42,704, $48,306 for men and $37,294 for women, a difference of 22.8%.
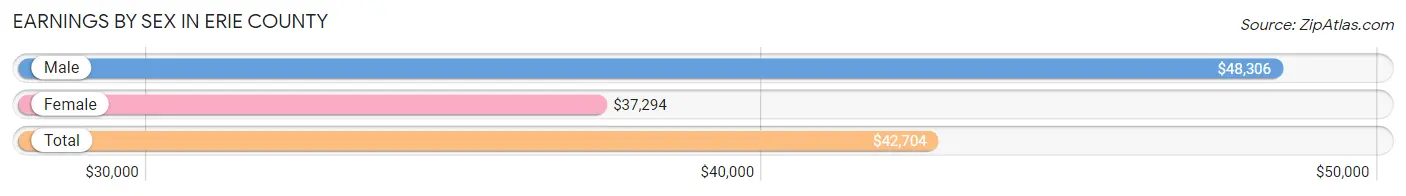
| Sex | Number | Average Earnings |
| Male | 264,967 (51.1%) | $48,306 |
| Female | 253,064 (48.8%) | $37,294 |
| Total | 518,031 (100.0%) | $42,704 |
Earnings by Sex by Income Bracket in Erie County
The most common earnings brackets in Erie County are $100,000+ for men (43,853 | 16.6%) and $75,000 to $99,999 for women (23,087 | 9.1%).
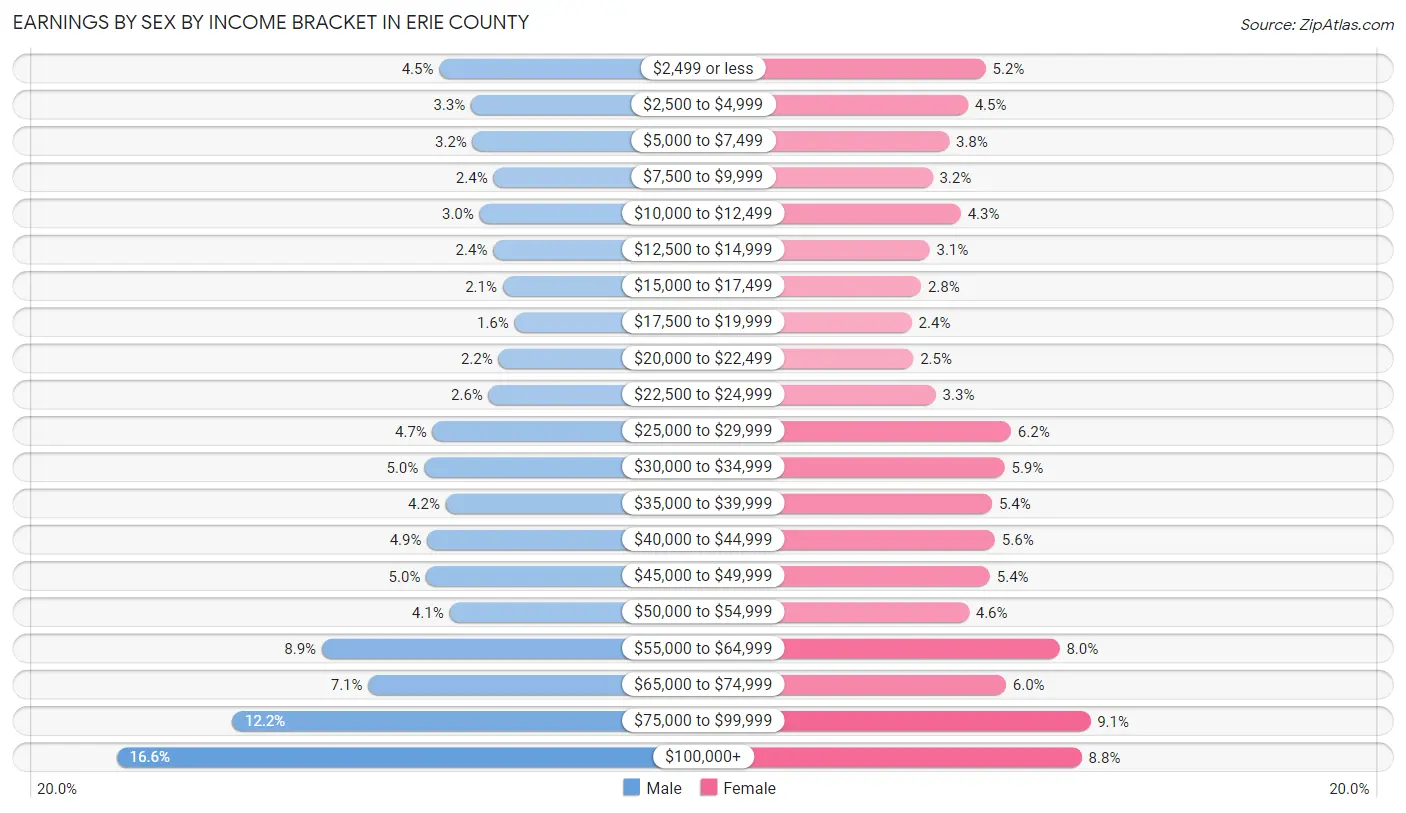
| Income | Male | Female |
| $2,499 or less | 11,810 (4.5%) | 13,161 (5.2%) |
| $2,500 to $4,999 | 8,653 (3.3%) | 11,469 (4.5%) |
| $5,000 to $7,499 | 8,506 (3.2%) | 9,691 (3.8%) |
| $7,500 to $9,999 | 6,439 (2.4%) | 8,115 (3.2%) |
| $10,000 to $12,499 | 7,825 (2.9%) | 10,804 (4.3%) |
| $12,500 to $14,999 | 6,475 (2.4%) | 7,839 (3.1%) |
| $15,000 to $17,499 | 5,521 (2.1%) | 7,042 (2.8%) |
| $17,500 to $19,999 | 4,353 (1.6%) | 6,148 (2.4%) |
| $20,000 to $22,499 | 5,941 (2.2%) | 6,295 (2.5%) |
| $22,500 to $24,999 | 6,914 (2.6%) | 8,436 (3.3%) |
| $25,000 to $29,999 | 12,490 (4.7%) | 15,571 (6.1%) |
| $30,000 to $34,999 | 13,317 (5.0%) | 14,966 (5.9%) |
| $35,000 to $39,999 | 11,180 (4.2%) | 13,773 (5.4%) |
| $40,000 to $44,999 | 13,012 (4.9%) | 14,040 (5.6%) |
| $45,000 to $49,999 | 13,126 (5.0%) | 13,564 (5.4%) |
| $50,000 to $54,999 | 10,810 (4.1%) | 11,559 (4.6%) |
| $55,000 to $64,999 | 23,471 (8.9%) | 20,160 (8.0%) |
| $65,000 to $74,999 | 18,855 (7.1%) | 15,074 (6.0%) |
| $75,000 to $99,999 | 32,416 (12.2%) | 23,087 (9.1%) |
| $100,000+ | 43,853 (16.6%) | 22,270 (8.8%) |
| Total | 264,967 (100.0%) | 253,064 (100.0%) |
Earnings by Sex by Educational Attainment in Erie County
Average earnings in Erie County are $56,499 for men and $43,907 for women, a difference of 22.3%. Men with an educational attainment of graduate degree enjoy the highest average annual earnings of $86,802, while those with less than high school education earn the least with $29,888. Women with an educational attainment of graduate degree earn the most with the average annual earnings of $68,020, while those with less than high school education have the smallest earnings of $20,467.

| Educational Attainment | Male Income | Female Income |
| Less than High School | $29,888 | $20,467 |
| High School Diploma | $44,587 | $28,941 |
| College or Associate's Degree | $52,481 | $38,507 |
| Bachelor's Degree | $69,370 | $51,513 |
| Graduate Degree | $86,802 | $68,020 |
| Total | $56,499 | $43,907 |
Family Income in Erie County
Family Income Brackets in Erie County
According to the Erie County family income data, there are 51,575 families falling into the $100,000 to $149,999 income range, which is the most common income bracket and makes up 22.1% of all families. Conversely, the $10,000 to $14,999 income bracket is the least frequent group with only 4,667 families (2.0%) belonging to this category.
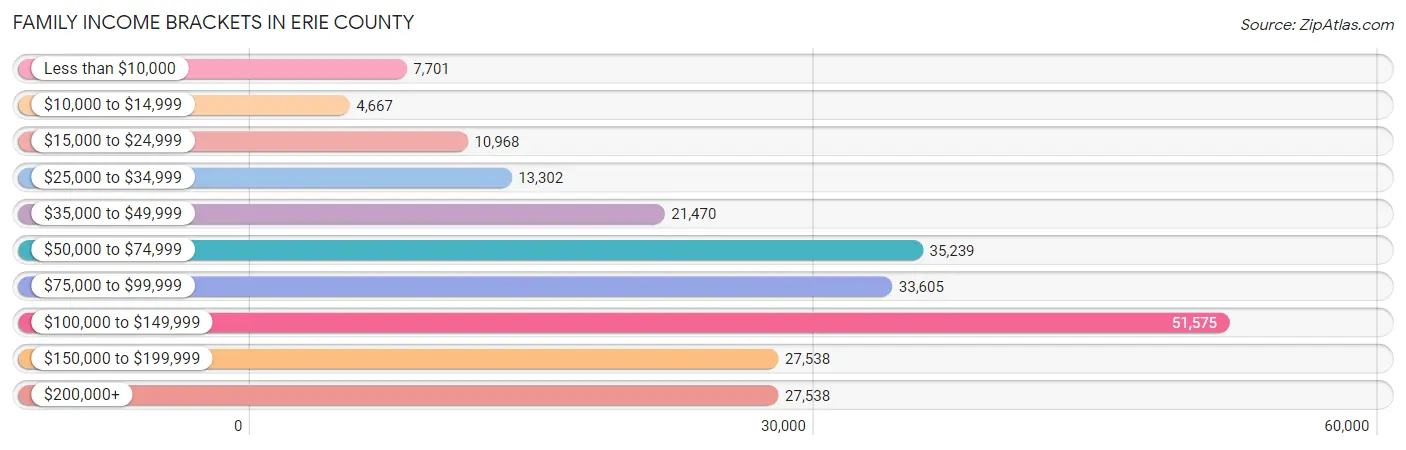
| Income Bracket | # Families | % Families |
| Less than $10,000 | 7,701 | 3.3% |
| $10,000 to $14,999 | 4,667 | 2.0% |
| $15,000 to $24,999 | 10,968 | 4.7% |
| $25,000 to $34,999 | 13,302 | 5.7% |
| $35,000 to $49,999 | 21,470 | 9.2% |
| $50,000 to $74,999 | 35,239 | 15.1% |
| $75,000 to $99,999 | 33,605 | 14.4% |
| $100,000 to $149,999 | 51,575 | 22.1% |
| $150,000 to $199,999 | 27,538 | 11.8% |
| $200,000+ | 27,538 | 11.8% |
Family Income by Famaliy Size in Erie County
4-person families (40,608 | 17.4%) account for the highest median family income in Erie County with $122,481 per family, while 2-person families (117,208 | 50.2%) have the highest median income of $40,032 per family member.
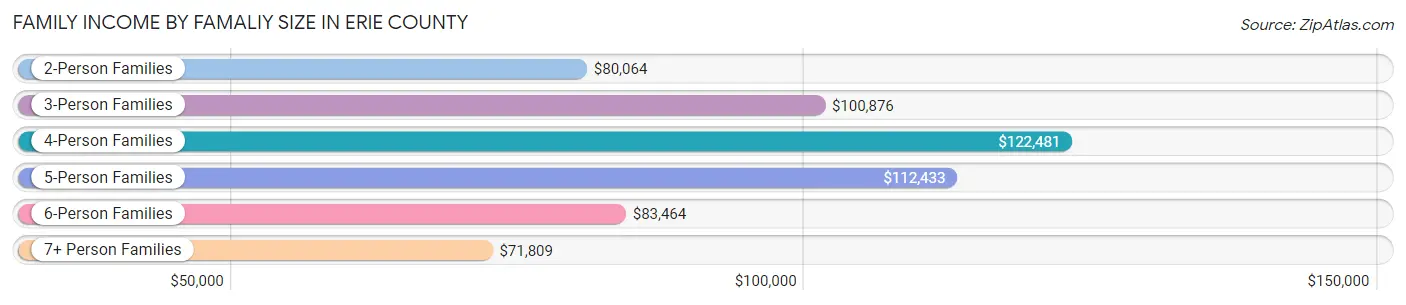
| Income Bracket | # Families | Median Income |
| 2-Person Families | 117,208 (50.2%) | $80,064 |
| 3-Person Families | 51,239 (22.0%) | $100,876 |
| 4-Person Families | 40,608 (17.4%) | $122,481 |
| 5-Person Families | 15,256 (6.5%) | $112,433 |
| 6-Person Families | 6,142 (2.6%) | $83,464 |
| 7+ Person Families | 2,917 (1.3%) | $71,809 |
| Total | 233,370 (100.0%) | $92,038 |
Family Income by Number of Earners in Erie County
The median family income in Erie County is $92,038, with families comprising 3+ earners (27,995) having the highest median family income of $150,237, while families with no earners (37,757) have the lowest median family income of $48,559, accounting for 12.0% and 16.2% of families, respectively.
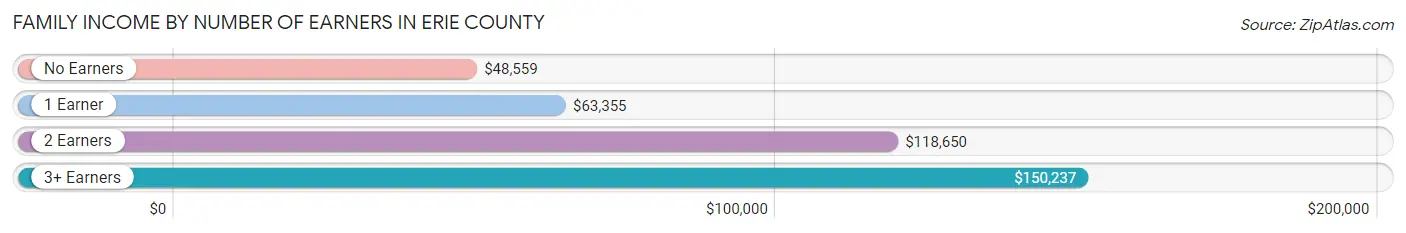
| Number of Earners | # Families | Median Income |
| No Earners | 37,757 (16.2%) | $48,559 |
| 1 Earner | 70,954 (30.4%) | $63,355 |
| 2 Earners | 96,664 (41.4%) | $118,650 |
| 3+ Earners | 27,995 (12.0%) | $150,237 |
| Total | 233,370 (100.0%) | $92,038 |
Household Income in Erie County
Household Income Brackets in Erie County
With 68,300 households falling in the category, the $100,000 to $149,999 income range is the most frequent in Erie County, accounting for 16.8% of all households. In contrast, only 18,701 households (4.6%) fall into the $10,000 to $14,999 income bracket, making it the least populous group.
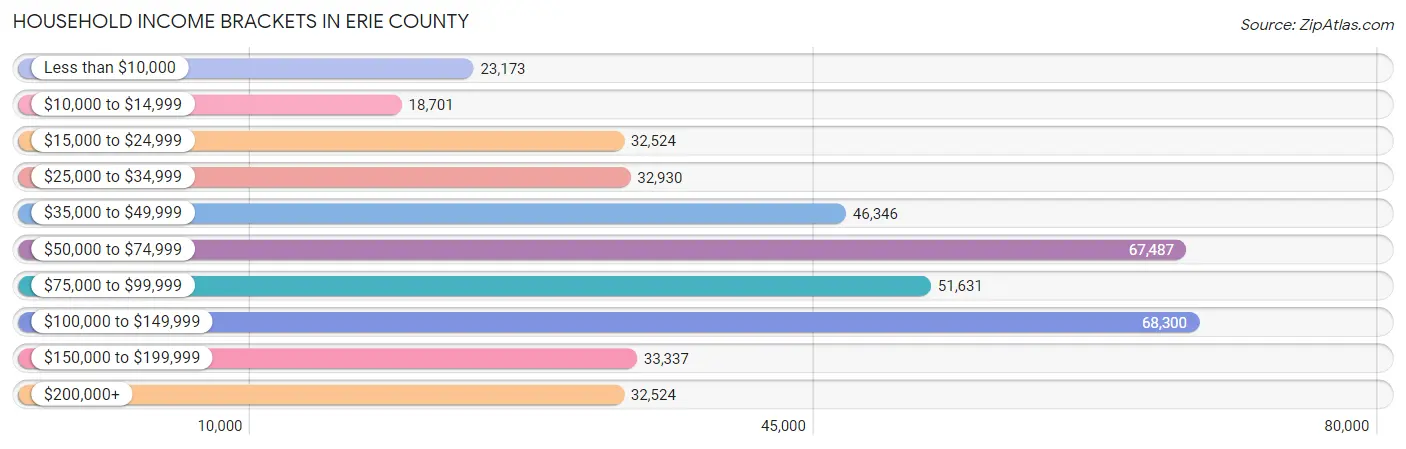
| Income Bracket | # Households | % Households |
| Less than $10,000 | 23,173 | 5.7% |
| $10,000 to $14,999 | 18,701 | 4.6% |
| $15,000 to $24,999 | 32,524 | 8.0% |
| $25,000 to $34,999 | 32,930 | 8.1% |
| $35,000 to $49,999 | 46,346 | 11.4% |
| $50,000 to $74,999 | 67,487 | 16.6% |
| $75,000 to $99,999 | 51,631 | 12.7% |
| $100,000 to $149,999 | 68,300 | 16.8% |
| $150,000 to $199,999 | 33,337 | 8.2% |
| $200,000+ | 32,524 | 8.0% |
Household Income by Householder Age in Erie County
The median household income in Erie County is $68,014, with the highest median household income of $83,097 found in the 45 to 64 years age bracket for the primary householder. A total of 149,733 households (36.8%) fall into this category. Meanwhile, the 15 to 24 years age bracket for the primary householder has the lowest median household income of $37,670, with 14,356 households (3.5%) in this group.
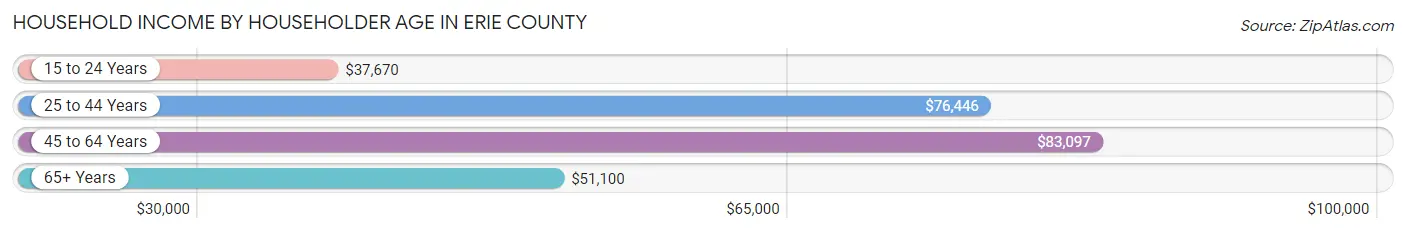
| Income Bracket | # Households | Median Income |
| 15 to 24 Years | 14,356 (3.5%) | $37,670 |
| 25 to 44 Years | 125,431 (30.8%) | $76,446 |
| 45 to 64 Years | 149,733 (36.8%) | $83,097 |
| 65+ Years | 117,027 (28.8%) | $51,100 |
| Total | 406,547 (100.0%) | $68,014 |
Poverty in Erie County
Income Below Poverty by Sex and Age in Erie County
With 12.9% poverty level for males and 14.5% for females among the residents of Erie County, 6 to 11 year old males and 18 to 24 year old females are the most vulnerable to poverty, with 7,134 males (22.1%) and 8,412 females (22.2%) in their respective age groups living below the poverty level.
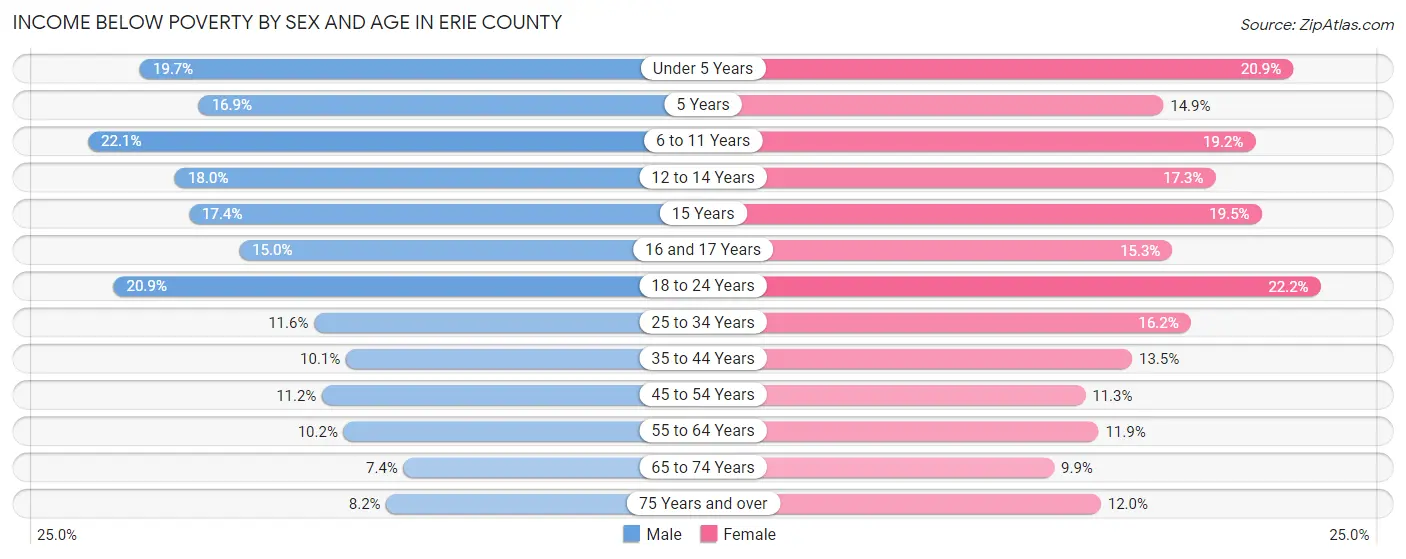
| Age Bracket | Male | Female |
| Under 5 Years | 4,927 (19.7%) | 5,113 (20.9%) |
| 5 Years | 895 (16.9%) | 798 (14.9%) |
| 6 to 11 Years | 7,134 (22.1%) | 6,114 (19.2%) |
| 12 to 14 Years | 2,872 (18.0%) | 2,445 (17.3%) |
| 15 Years | 968 (17.4%) | 1,105 (19.5%) |
| 16 and 17 Years | 1,722 (15.0%) | 1,655 (15.3%) |
| 18 to 24 Years | 8,023 (20.9%) | 8,412 (22.2%) |
| 25 to 34 Years | 7,664 (11.6%) | 10,657 (16.2%) |
| 35 to 44 Years | 5,605 (10.1%) | 7,624 (13.5%) |
| 45 to 54 Years | 6,263 (11.2%) | 6,521 (11.3%) |
| 55 to 64 Years | 6,631 (10.2%) | 8,293 (11.9%) |
| 65 to 74 Years | 3,491 (7.4%) | 5,263 (9.9%) |
| 75 Years and over | 2,277 (8.2%) | 5,151 (12.0%) |
| Total | 58,472 (12.9%) | 69,151 (14.5%) |
Income Above Poverty by Sex and Age in Erie County
According to the poverty statistics in Erie County, males aged 65 to 74 years and females aged 65 to 74 years are the age groups that are most secure financially, with 92.6% of males and 90.1% of females in these age groups living above the poverty line.
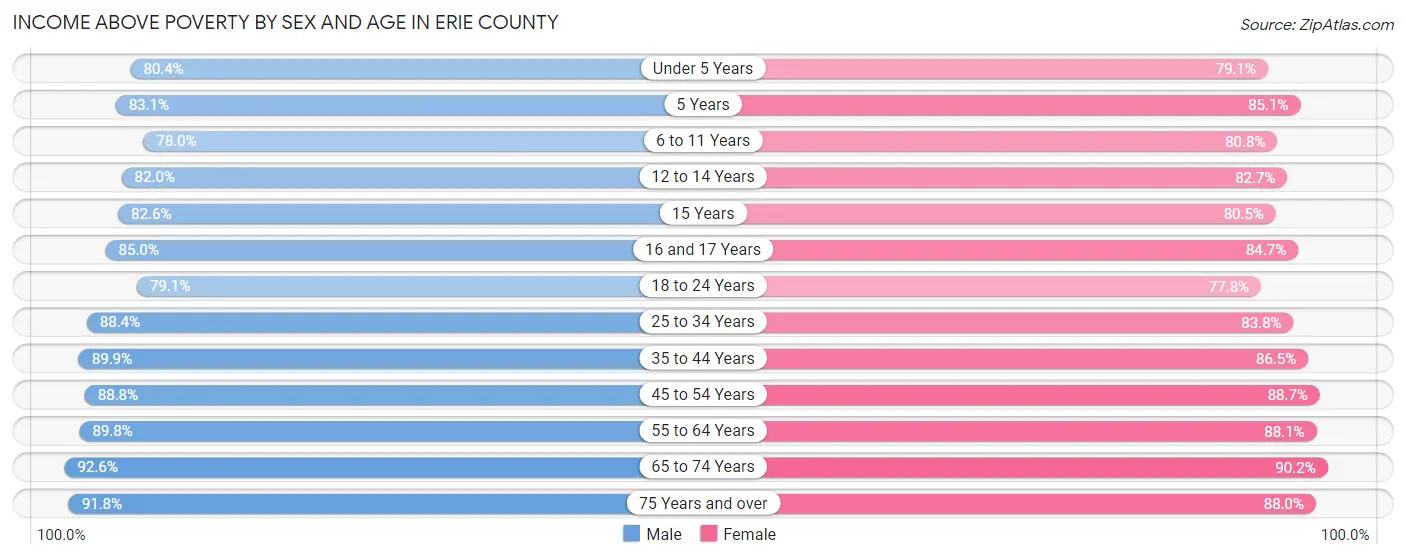
| Age Bracket | Male | Female |
| Under 5 Years | 20,146 (80.3%) | 19,300 (79.1%) |
| 5 Years | 4,396 (83.1%) | 4,552 (85.1%) |
| 6 to 11 Years | 25,219 (77.9%) | 25,758 (80.8%) |
| 12 to 14 Years | 13,063 (82.0%) | 11,662 (82.7%) |
| 15 Years | 4,605 (82.6%) | 4,569 (80.5%) |
| 16 and 17 Years | 9,730 (85.0%) | 9,141 (84.7%) |
| 18 to 24 Years | 30,413 (79.1%) | 29,466 (77.8%) |
| 25 to 34 Years | 58,644 (88.4%) | 55,221 (83.8%) |
| 35 to 44 Years | 50,012 (89.9%) | 48,959 (86.5%) |
| 45 to 54 Years | 49,697 (88.8%) | 51,174 (88.7%) |
| 55 to 64 Years | 58,417 (89.8%) | 61,311 (88.1%) |
| 65 to 74 Years | 43,628 (92.6%) | 48,172 (90.1%) |
| 75 Years and over | 25,456 (91.8%) | 37,691 (88.0%) |
| Total | 393,426 (87.1%) | 406,976 (85.5%) |
Income Below Poverty Among Married-Couple Families in Erie County
The poverty statistics for married-couple families in Erie County show that 4.6% or 7,580 of the total 164,281 families live below the poverty line. Families with 5 or more children have the highest poverty rate of 29.7%, comprising of 422 families. On the other hand, families with no children have the lowest poverty rate of 3.0%, which includes 3,049 families.
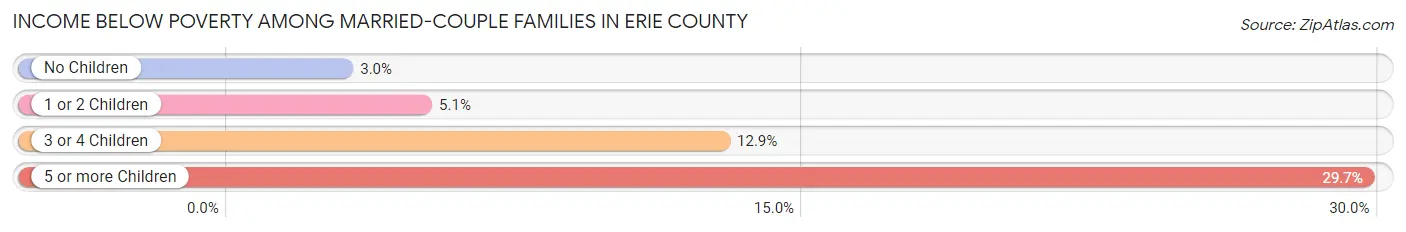
| Children | Above Poverty | Below Poverty |
| No Children | 98,185 (97.0%) | 3,049 (3.0%) |
| 1 or 2 Children | 46,465 (94.9%) | 2,480 (5.1%) |
| 3 or 4 Children | 11,051 (87.2%) | 1,629 (12.9%) |
| 5 or more Children | 1,000 (70.3%) | 422 (29.7%) |
| Total | 156,701 (95.4%) | 7,580 (4.6%) |
Income Below Poverty Among Single-Parent Households in Erie County
According to the poverty data in Erie County, 11.8% or 2,197 single-father households and 23.6% or 11,909 single-mother households are living below the poverty line. Among single-father households, those with 3 or 4 children have the highest poverty rate, with 548 households (44.6%) experiencing poverty. Likewise, among single-mother households, those with 5 or more children have the highest poverty rate, with 307 households (93.3%) falling below the poverty line.
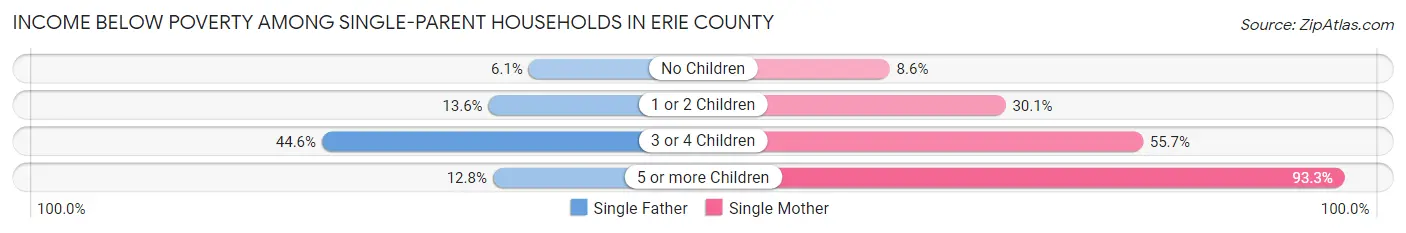
| Children | Single Father | Single Mother |
| No Children | 584 (6.1%) | 1,845 (8.6%) |
| 1 or 2 Children | 1,049 (13.6%) | 7,283 (30.1%) |
| 3 or 4 Children | 548 (44.6%) | 2,474 (55.7%) |
| 5 or more Children | 16 (12.8%) | 307 (93.3%) |
| Total | 2,197 (11.8%) | 11,909 (23.6%) |
Income Below Poverty Among Married-Couple vs Single-Parent Households in Erie County
The poverty data for Erie County shows that 7,580 of the married-couple family households (4.6%) and 14,106 of the single-parent households (20.4%) are living below the poverty level. Within the married-couple family households, those with 5 or more children have the highest poverty rate, with 422 households (29.7%) falling below the poverty line. Among the single-parent households, those with 5 or more children have the highest poverty rate, with 323 household (71.2%) living below poverty.
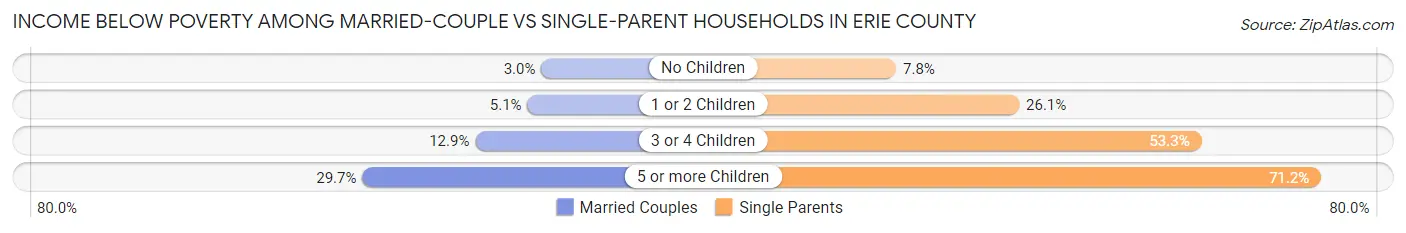
| Children | Married-Couple Families | Single-Parent Households |
| No Children | 3,049 (3.0%) | 2,429 (7.8%) |
| 1 or 2 Children | 2,480 (5.1%) | 8,332 (26.1%) |
| 3 or 4 Children | 1,629 (12.9%) | 3,022 (53.3%) |
| 5 or more Children | 422 (29.7%) | 323 (71.2%) |
| Total | 7,580 (4.6%) | 14,106 (20.4%) |
Race in Erie County
The most populous races in Erie County are White / Caucasian (717,085 | 75.4%), Black / African American (122,787 | 12.9%), and Hispanic or Latino (56,711 | 6.0%).
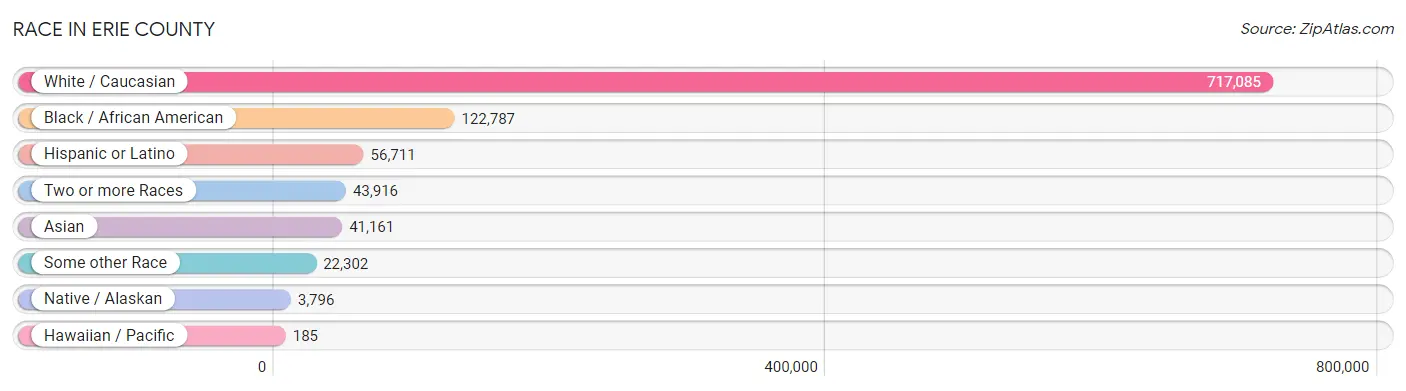
| Race | # Population | % Population |
| Asian | 41,161 | 4.3% |
| Black / African American | 122,787 | 12.9% |
| Hawaiian / Pacific | 185 | 0.0% |
| Hispanic or Latino | 56,711 | 6.0% |
| Native / Alaskan | 3,796 | 0.4% |
| White / Caucasian | 717,085 | 75.4% |
| Two or more Races | 43,916 | 4.6% |
| Some other Race | 22,302 | 2.3% |
| Total | 951,232 | 100.0% |
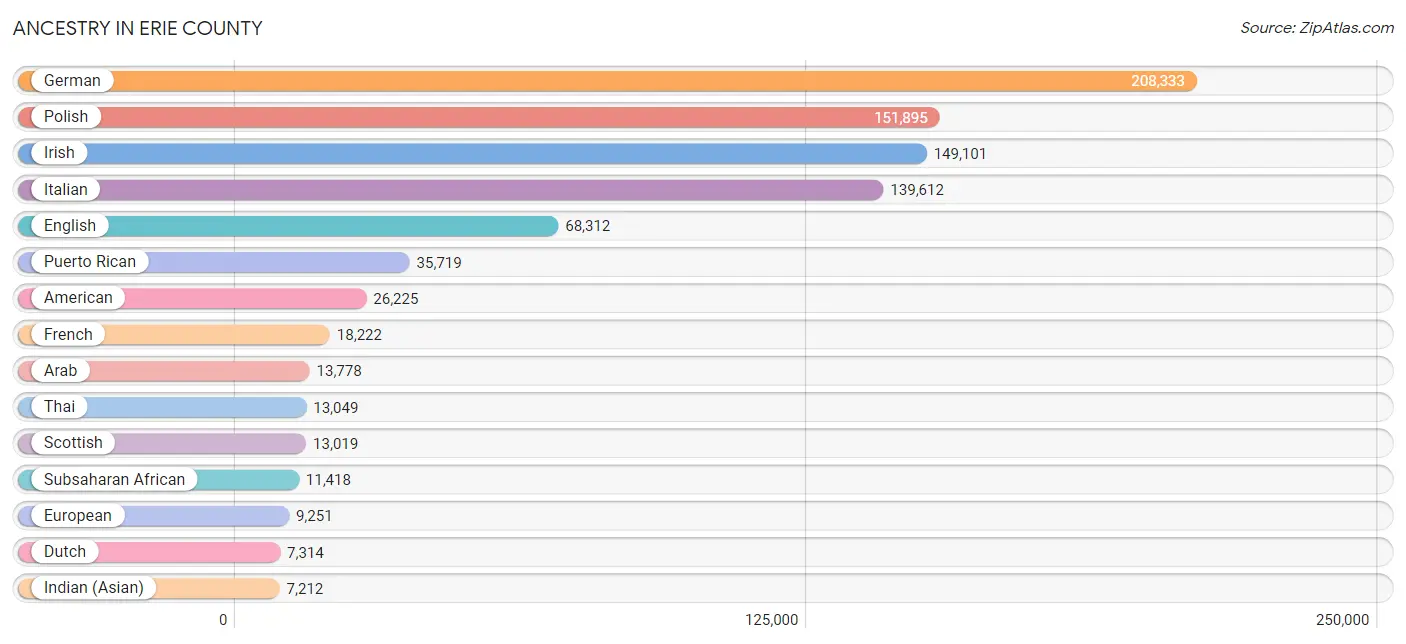
Ancestry in Erie County
The most populous ancestries reported in Erie County are German (208,333 | 21.9%), Polish (151,895 | 16.0%), Irish (149,101 | 15.7%), Italian (139,612 | 14.7%), and English (68,312 | 7.2%), together accounting for 75.4% of all Erie County residents.
| Ancestry | # Population | % Population |
| Afghan | 329 | 0.0% |
| African | 6,258 | 0.7% |
| Alaska Native | 4 | 0.0% |
| Albanian | 242 | 0.0% |
| Aleut | 25 | 0.0% |
| Alsatian | 129 | 0.0% |
| American | 26,225 | 2.8% |
| Apache | 10 | 0.0% |
| Arab | 13,778 | 1.5% |
| Argentinean | 229 | 0.0% |
| Armenian | 360 | 0.0% |
| Assyrian / Chaldean / Syriac | 5 | 0.0% |
| Australian | 112 | 0.0% |
| Austrian | 2,713 | 0.3% |
| Bahamian | 55 | 0.0% |
| Barbadian | 37 | 0.0% |
| Belgian | 622 | 0.1% |
| Belizean | 142 | 0.0% |
| Bermudan | 13 | 0.0% |
| Bhutanese | 1,170 | 0.1% |
| Blackfeet | 408 | 0.0% |
| Bolivian | 110 | 0.0% |
| Brazilian | 217 | 0.0% |
| British | 2,944 | 0.3% |
| British West Indian | 214 | 0.0% |
| Bulgarian | 249 | 0.0% |
| Burmese | 2,797 | 0.3% |
| Cajun | 82 | 0.0% |
| Cambodian | 59 | 0.0% |
| Canadian | 2,829 | 0.3% |
| Carpatho Rusyn | 21 | 0.0% |
| Celtic | 170 | 0.0% |
| Central American | 2,148 | 0.2% |
| Central American Indian | 444 | 0.1% |
| Cherokee | 943 | 0.1% |
| Chickasaw | 31 | 0.0% |
| Chilean | 58 | 0.0% |
| Chippewa | 90 | 0.0% |
| Choctaw | 8 | 0.0% |
| Colombian | 1,202 | 0.1% |
| Costa Rican | 207 | 0.0% |
| Cree | 36 | 0.0% |
| Creek | 26 | 0.0% |
| Croatian | 2,209 | 0.2% |
| Crow | 40 | 0.0% |
| Cuban | 1,470 | 0.2% |
| Czech | 1,338 | 0.1% |
| Czechoslovakian | 967 | 0.1% |
| Danish | 1,348 | 0.1% |
| Delaware | 79 | 0.0% |
| Dominican | 3,945 | 0.4% |
| Dutch | 7,314 | 0.8% |
| Dutch West Indian | 70 | 0.0% |
| Eastern European | 2,884 | 0.3% |
| Ecuadorian | 1,085 | 0.1% |
| Egyptian | 491 | 0.1% |
| English | 68,312 | 7.2% |
| Estonian | 116 | 0.0% |
| Ethiopian | 653 | 0.1% |
| European | 9,251 | 1.0% |
| Filipino | 266 | 0.0% |
| Finnish | 711 | 0.1% |
| French | 18,222 | 1.9% |
| French American Indian | 229 | 0.0% |
| French Canadian | 5,744 | 0.6% |
| German | 208,333 | 21.9% |
| German Russian | 191 | 0.0% |
| Ghanaian | 265 | 0.0% |
| Greek | 3,604 | 0.4% |
| Guamanian / Chamorro | 41 | 0.0% |
| Guatemalan | 655 | 0.1% |
| Guyanese | 394 | 0.0% |
| Haitian | 644 | 0.1% |
| Honduran | 339 | 0.0% |
| Hopi | 117 | 0.0% |
| Hungarian | 6,394 | 0.7% |
| Icelander | 65 | 0.0% |
| Indian (Asian) | 7,212 | 0.8% |
| Indonesian | 4,729 | 0.5% |
| Inupiat | 54 | 0.0% |
| Iranian | 430 | 0.1% |
| Iraqi | 1,743 | 0.2% |
| Irish | 149,101 | 15.7% |
| Iroquois | 4,744 | 0.5% |
| Israeli | 283 | 0.0% |
| Italian | 139,612 | 14.7% |
| Jamaican | 1,927 | 0.2% |
| Japanese | 42 | 0.0% |
| Jordanian | 161 | 0.0% |
| Kenyan | 24 | 0.0% |
| Korean | 1,916 | 0.2% |
| Laotian | 194 | 0.0% |
| Latvian | 464 | 0.1% |
| Lebanese | 3,730 | 0.4% |
| Liberian | 114 | 0.0% |
| Lithuanian | 1,388 | 0.2% |
| Lumbee | 11 | 0.0% |
| Luxembourger | 30 | 0.0% |
| Macedonian | 500 | 0.1% |
| Malaysian | 933 | 0.1% |
| Maltese | 38 | 0.0% |
| Mexican | 5,864 | 0.6% |
| Mexican American Indian | 114 | 0.0% |
| Mongolian | 44 | 0.0% |
| Moroccan | 607 | 0.1% |
| Native Hawaiian | 296 | 0.0% |
| Navajo | 47 | 0.0% |
| New Zealander | 8 | 0.0% |
| Nicaraguan | 103 | 0.0% |
| Nigerian | 691 | 0.1% |
| Northern European | 847 | 0.1% |
| Norwegian | 3,063 | 0.3% |
| Okinawan | 128 | 0.0% |
| Paiute | 15 | 0.0% |
| Pakistani | 1,146 | 0.1% |
| Palestinian | 168 | 0.0% |
| Panamanian | 162 | 0.0% |
| Paraguayan | 82 | 0.0% |
| Pennsylvania German | 192 | 0.0% |
| Peruvian | 510 | 0.1% |
| Polish | 151,895 | 16.0% |
| Portuguese | 978 | 0.1% |
| Puerto Rican | 35,719 | 3.8% |
| Romanian | 1,048 | 0.1% |
| Russian | 6,810 | 0.7% |
| Salvadoran | 613 | 0.1% |
| Samoan | 116 | 0.0% |
| Scandinavian | 1,574 | 0.2% |
| Scotch-Irish | 3,860 | 0.4% |
| Scottish | 13,019 | 1.4% |
| Seminole | 27 | 0.0% |
| Serbian | 982 | 0.1% |
| Sierra Leonean | 220 | 0.0% |
| Sioux | 113 | 0.0% |
| Slavic | 561 | 0.1% |
| Slovak | 1,010 | 0.1% |
| Slovene | 216 | 0.0% |
| Somali | 889 | 0.1% |
| South African | 261 | 0.0% |
| South American | 3,515 | 0.4% |
| South American Indian | 245 | 0.0% |
| Soviet Union | 42 | 0.0% |
| Spaniard | 956 | 0.1% |
| Spanish | 1,166 | 0.1% |
| Sri Lankan | 2,042 | 0.2% |
| Subsaharan African | 11,418 | 1.2% |
| Sudanese | 335 | 0.0% |
| Swedish | 5,855 | 0.6% |
| Swiss | 1,664 | 0.2% |
| Syrian | 1,140 | 0.1% |
| Taiwanese | 23 | 0.0% |
| Thai | 13,049 | 1.4% |
| Tlingit-Haida | 2 | 0.0% |
| Trinidadian and Tobagonian | 546 | 0.1% |
| Turkish | 1,112 | 0.1% |
| U.S. Virgin Islander | 18 | 0.0% |
| Ugandan | 87 | 0.0% |
| Ukrainian | 5,939 | 0.6% |
| Venezuelan | 235 | 0.0% |
| Vietnamese | 5,508 | 0.6% |
| Welsh | 3,929 | 0.4% |
| West Indian | 878 | 0.1% |
| Yugoslavian | 751 | 0.1% |
| Yup'ik | 15 | 0.0% | View All 164 Rows |
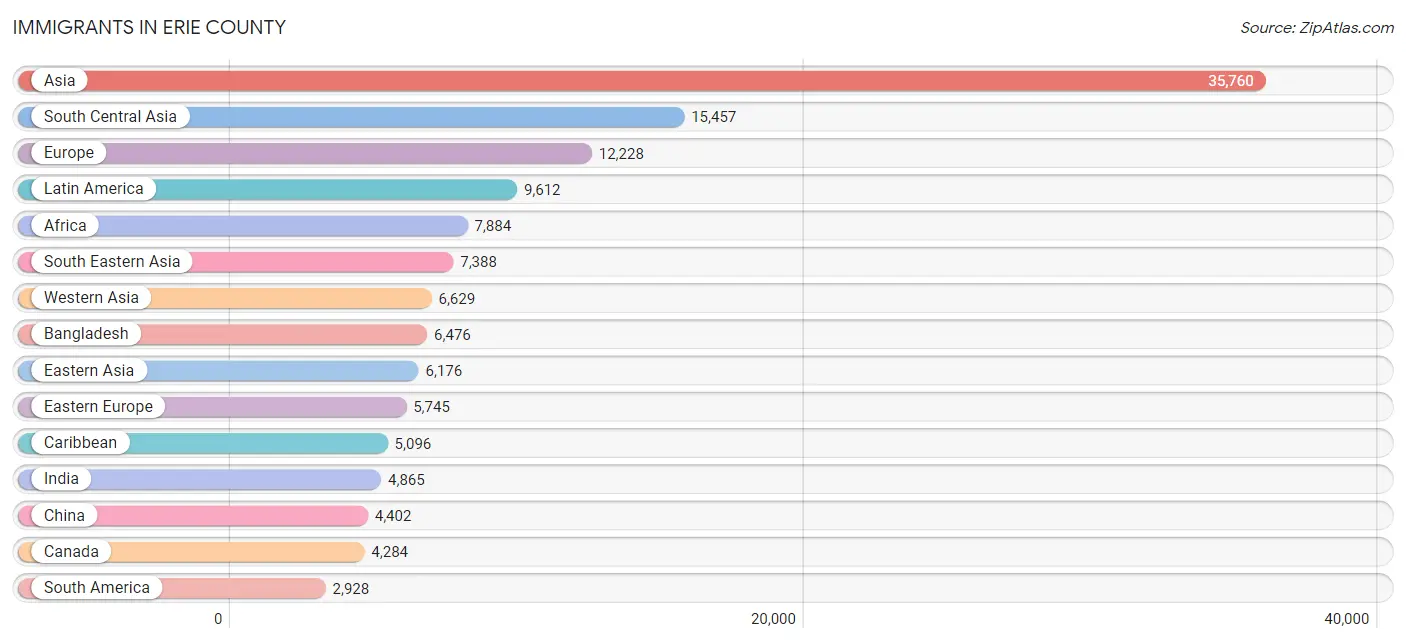
Immigrants in Erie County
The most numerous immigrant groups reported in Erie County came from Asia (35,760 | 3.8%), South Central Asia (15,457 | 1.6%), Europe (12,228 | 1.3%), Latin America (9,612 | 1.0%), and Africa (7,884 | 0.8%), together accounting for 8.5% of all Erie County residents.
| Immigration Origin | # Population | % Population |
| Afghanistan | 389 | 0.0% |
| Africa | 7,884 | 0.8% |
| Albania | 54 | 0.0% |
| Argentina | 109 | 0.0% |
| Armenia | 52 | 0.0% |
| Asia | 35,760 | 3.8% |
| Australia | 230 | 0.0% |
| Austria | 178 | 0.0% |
| Azores | 20 | 0.0% |
| Bangladesh | 6,476 | 0.7% |
| Barbados | 103 | 0.0% |
| Belarus | 348 | 0.0% |
| Belgium | 70 | 0.0% |
| Bolivia | 48 | 0.0% |
| Bosnia and Herzegovina | 484 | 0.1% |
| Brazil | 287 | 0.0% |
| Bulgaria | 194 | 0.0% |
| Cambodia | 16 | 0.0% |
| Cameroon | 47 | 0.0% |
| Canada | 4,284 | 0.4% |
| Caribbean | 5,096 | 0.5% |
| Central America | 1,588 | 0.2% |
| Chile | 12 | 0.0% |
| China | 4,402 | 0.5% |
| Colombia | 592 | 0.1% |
| Congo | 719 | 0.1% |
| Costa Rica | 49 | 0.0% |
| Croatia | 257 | 0.0% |
| Cuba | 666 | 0.1% |
| Czechoslovakia | 80 | 0.0% |
| Dominica | 13 | 0.0% |
| Dominican Republic | 1,702 | 0.2% |
| Eastern Africa | 2,639 | 0.3% |
| Eastern Asia | 6,176 | 0.6% |
| Eastern Europe | 5,745 | 0.6% |
| Ecuador | 834 | 0.1% |
| Egypt | 229 | 0.0% |
| El Salvador | 133 | 0.0% |
| England | 506 | 0.1% |
| Eritrea | 235 | 0.0% |
| Ethiopia | 392 | 0.0% |
| Europe | 12,228 | 1.3% |
| France | 322 | 0.0% |
| Germany | 1,879 | 0.2% |
| Ghana | 462 | 0.1% |
| Greece | 124 | 0.0% |
| Grenada | 11 | 0.0% |
| Guatemala | 375 | 0.0% |
| Guyana | 588 | 0.1% |
| Haiti | 422 | 0.0% |
| Honduras | 120 | 0.0% |
| Hong Kong | 367 | 0.0% |
| Hungary | 331 | 0.0% |
| India | 4,865 | 0.5% |
| Indonesia | 54 | 0.0% |
| Iran | 306 | 0.0% |
| Iraq | 1,877 | 0.2% |
| Ireland | 268 | 0.0% |
| Israel | 316 | 0.0% |
| Italy | 1,870 | 0.2% |
| Jamaica | 1,135 | 0.1% |
| Japan | 532 | 0.1% |
| Jordan | 189 | 0.0% |
| Kazakhstan | 69 | 0.0% |
| Kenya | 116 | 0.0% |
| Korea | 1,242 | 0.1% |
| Kuwait | 137 | 0.0% |
| Laos | 385 | 0.0% |
| Latin America | 9,612 | 1.0% |
| Latvia | 241 | 0.0% |
| Lebanon | 704 | 0.1% |
| Liberia | 328 | 0.0% |
| Lithuania | 47 | 0.0% |
| Malaysia | 291 | 0.0% |
| Mexico | 828 | 0.1% |
| Micronesia | 4 | 0.0% |
| Middle Africa | 1,749 | 0.2% |
| Moldova | 157 | 0.0% |
| Morocco | 212 | 0.0% |
| Nepal | 593 | 0.1% |
| Netherlands | 121 | 0.0% |
| Nicaragua | 14 | 0.0% |
| Nigeria | 582 | 0.1% |
| North Macedonia | 144 | 0.0% |
| Northern Africa | 1,064 | 0.1% |
| Northern Europe | 1,634 | 0.2% |
| Norway | 77 | 0.0% |
| Oceania | 281 | 0.0% |
| Pakistan | 1,144 | 0.1% |
| Panama | 69 | 0.0% |
| Peru | 144 | 0.0% |
| Philippines | 875 | 0.1% |
| Poland | 1,032 | 0.1% |
| Portugal | 29 | 0.0% |
| Romania | 500 | 0.1% |
| Russia | 738 | 0.1% |
| Saudi Arabia | 202 | 0.0% |
| Scotland | 136 | 0.0% |
| Senegal | 44 | 0.0% |
| Serbia | 88 | 0.0% |
| Sierra Leone | 85 | 0.0% |
| Singapore | 88 | 0.0% |
| Somalia | 681 | 0.1% |
| South Africa | 294 | 0.0% |
| South America | 2,928 | 0.3% |
| South Central Asia | 15,457 | 1.6% |
| South Eastern Asia | 7,388 | 0.8% |
| Southern Europe | 2,091 | 0.2% |
| Spain | 68 | 0.0% |
| Sri Lanka | 438 | 0.1% |
| St. Vincent and the Grenadines | 19 | 0.0% |
| Sudan | 502 | 0.1% |
| Sweden | 86 | 0.0% |
| Switzerland | 168 | 0.0% |
| Syria | 901 | 0.1% |
| Taiwan | 376 | 0.0% |
| Thailand | 1,516 | 0.2% |
| Trinidad and Tobago | 690 | 0.1% |
| Turkey | 217 | 0.0% |
| Uganda | 44 | 0.0% |
| Ukraine | 841 | 0.1% |
| Uzbekistan | 177 | 0.0% |
| Venezuela | 209 | 0.0% |
| Vietnam | 1,023 | 0.1% |
| West Indies | 131 | 0.0% |
| Western Africa | 1,788 | 0.2% |
| Western Asia | 6,629 | 0.7% |
| Western Europe | 2,738 | 0.3% |
| Yemen | 1,829 | 0.2% |
| Zaire | 911 | 0.1% |
| Zimbabwe | 26 | 0.0% | View All 131 Rows |
Sex and Age in Erie County
Sex and Age in Erie County
The most populous age groups in Erie County are 30 to 34 Years (33,902 | 7.3%) for men and 60 to 64 Years (35,032 | 7.2%) for women.
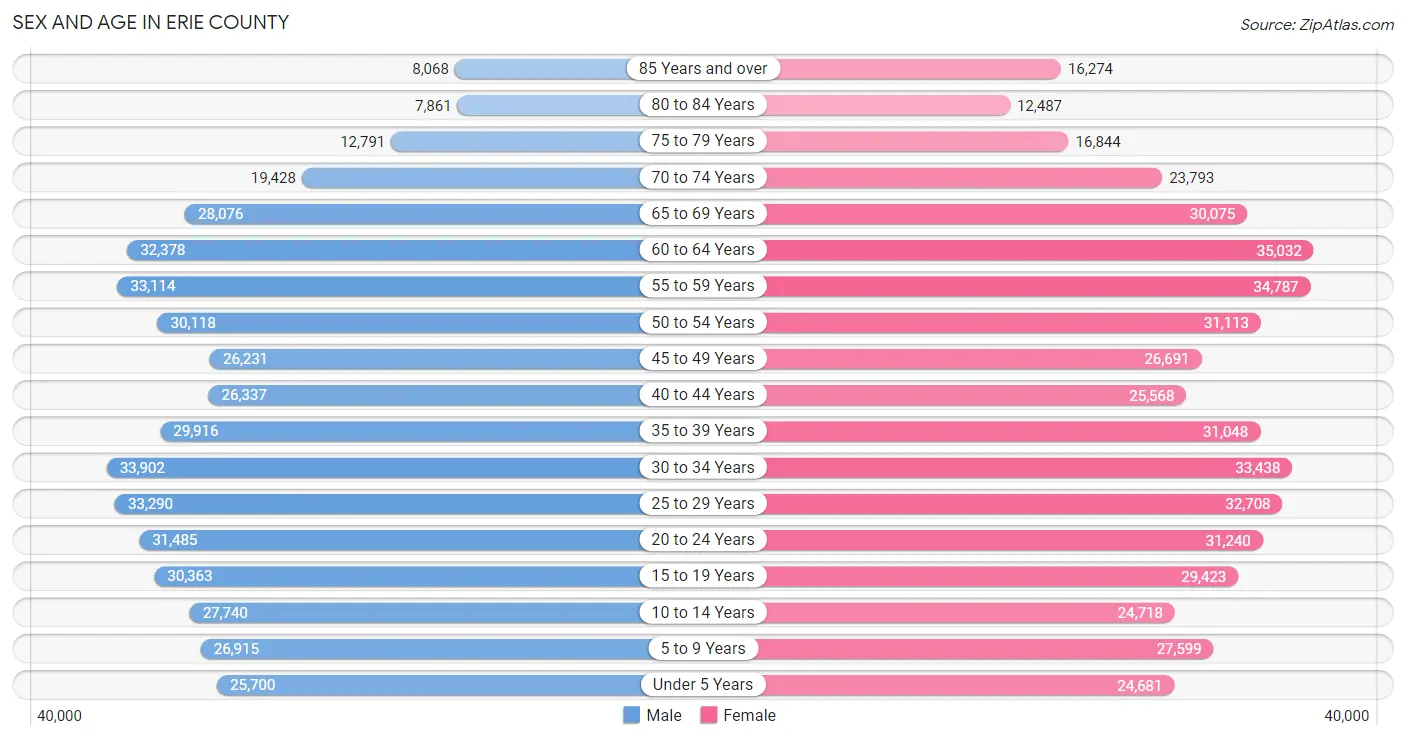
| Age Bracket | Male | Female |
| Under 5 Years | 25,700 (5.5%) | 24,681 (5.1%) |
| 5 to 9 Years | 26,915 (5.8%) | 27,599 (5.7%) |
| 10 to 14 Years | 27,740 (6.0%) | 24,718 (5.1%) |
| 15 to 19 Years | 30,363 (6.6%) | 29,423 (6.0%) |
| 20 to 24 Years | 31,485 (6.8%) | 31,240 (6.4%) |
| 25 to 29 Years | 33,290 (7.2%) | 32,708 (6.7%) |
| 30 to 34 Years | 33,902 (7.3%) | 33,438 (6.9%) |
| 35 to 39 Years | 29,916 (6.5%) | 31,048 (6.4%) |
| 40 to 44 Years | 26,337 (5.7%) | 25,568 (5.2%) |
| 45 to 49 Years | 26,231 (5.7%) | 26,691 (5.5%) |
| 50 to 54 Years | 30,118 (6.5%) | 31,113 (6.4%) |
| 55 to 59 Years | 33,114 (7.1%) | 34,787 (7.1%) |
| 60 to 64 Years | 32,378 (7.0%) | 35,032 (7.2%) |
| 65 to 69 Years | 28,076 (6.0%) | 30,075 (6.2%) |
| 70 to 74 Years | 19,428 (4.2%) | 23,793 (4.9%) |
| 75 to 79 Years | 12,791 (2.8%) | 16,844 (3.5%) |
| 80 to 84 Years | 7,861 (1.7%) | 12,487 (2.6%) |
| 85 Years and over | 8,068 (1.7%) | 16,274 (3.3%) |
| Total | 463,713 (100.0%) | 487,519 (100.0%) |
Families and Households in Erie County
Median Family Size in Erie County
The median family size in Erie County is 2.97 persons per family, with married-couple families (164,281 | 70.4%) accounting for the largest median family size of 3.04 persons per family. On the other hand, single male/father families (18,617 | 8.0%) represent the smallest median family size with 2.57 persons per family.
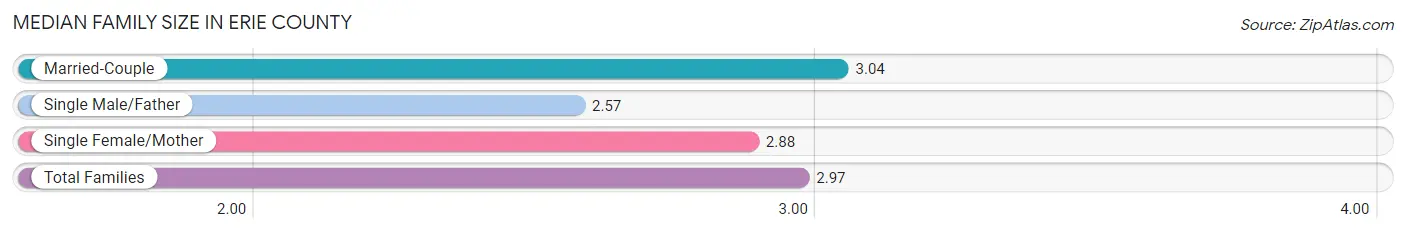
| Family Type | # Families | Family Size |
| Married-Couple | 164,281 (70.4%) | 3.04 |
| Single Male/Father | 18,617 (8.0%) | 2.57 |
| Single Female/Mother | 50,472 (21.6%) | 2.88 |
| Total Families | 233,370 (100.0%) | 2.97 |
Median Household Size in Erie County
The median household size in Erie County is 2.28 persons per household, with single female/mother households (50,472 | 12.4%) accounting for the largest median household size of 3.08 persons per household. non-family households (173,177 | 42.6%) represent the smallest median household size with 1.23 persons per household.
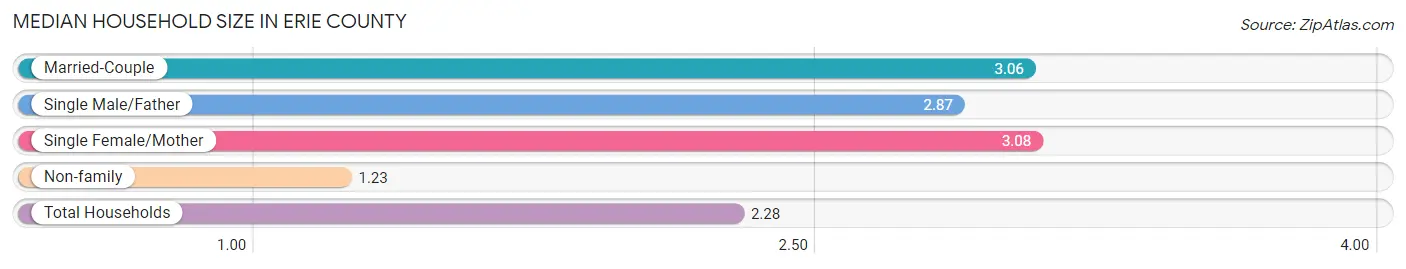
| Household Type | # Households | Household Size |
| Married-Couple | 164,281 (40.4%) | 3.06 |
| Single Male/Father | 18,617 (4.6%) | 2.87 |
| Single Female/Mother | 50,472 (12.4%) | 3.08 |
| Non-family | 173,177 (42.6%) | 1.23 |
| Total Households | 406,547 (100.0%) | 2.28 |
Household Size by Marriage Status in Erie County
Out of a total of 406,547 households in Erie County, 233,370 (57.4%) are family households, while 173,177 (42.6%) are nonfamily households. The most numerous type of family households are 2-person households, comprising 109,820, and the most common type of nonfamily households are 1-person households, comprising 141,410.
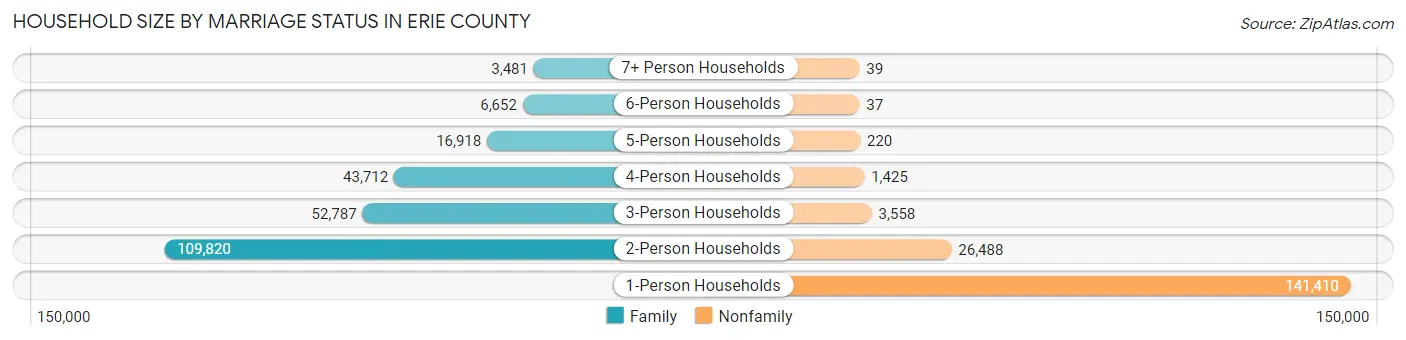
| Household Size | Family Households | Nonfamily Households |
| 1-Person Households | - | 141,410 (34.8%) |
| 2-Person Households | 109,820 (27.0%) | 26,488 (6.5%) |
| 3-Person Households | 52,787 (13.0%) | 3,558 (0.9%) |
| 4-Person Households | 43,712 (10.7%) | 1,425 (0.4%) |
| 5-Person Households | 16,918 (4.2%) | 220 (0.1%) |
| 6-Person Households | 6,652 (1.6%) | 37 (0.0%) |
| 7+ Person Households | 3,481 (0.9%) | 39 (0.0%) |
| Total | 233,370 (57.4%) | 173,177 (42.6%) |
Female Fertility in Erie County
Fertility by Age in Erie County
Average fertility rate in Erie County is 46.0 births per 1,000 women. Women in the age bracket of 20 to 34 years have the highest fertility rate with 74.0 births per 1,000 women. Women in the age bracket of 20 to 34 years acount for 72.0% of all women with births.
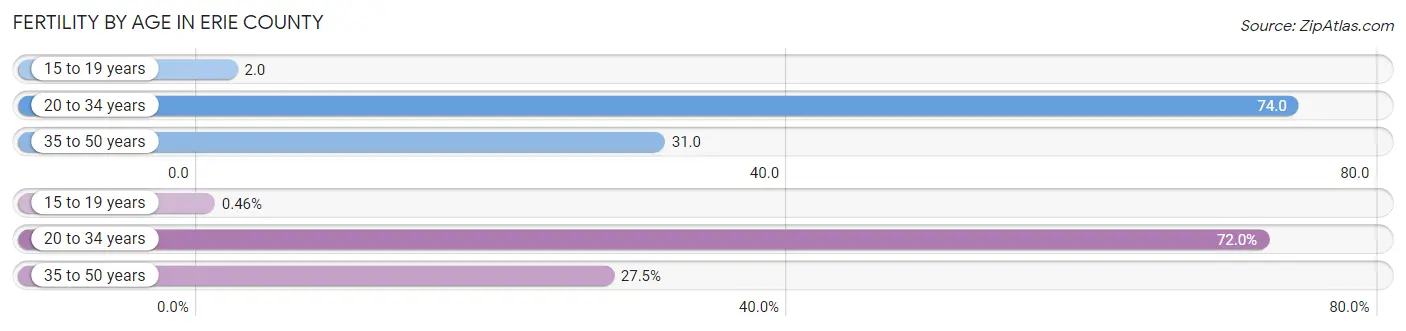
| Age Bracket | Women with Births | Births / 1,000 Women |
| 15 to 19 years | 46 (0.5%) | 2.0 |
| 20 to 34 years | 7,183 (72.0%) | 74.0 |
| 35 to 50 years | 2,748 (27.5%) | 31.0 |
| Total | 9,977 (100.0%) | 46.0 |
Fertility by Age by Marriage Status in Erie County
68.1% of women with births (9,977) in Erie County are married. The highest percentage of unmarried women with births falls into 15 to 19 years age bracket with 100.0% of them unmarried at the time of birth, while the lowest percentage of unmarried women with births belong to 35 to 50 years age bracket with 21.9% of them unmarried.
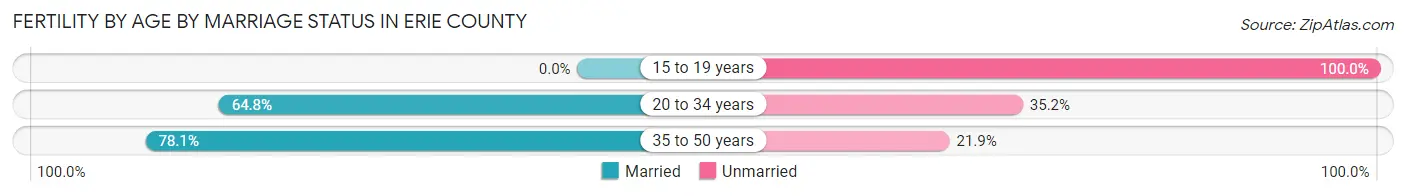
| Age Bracket | Married | Unmarried |
| 15 to 19 years | 0 (0.0%) | 46 (100.0%) |
| 20 to 34 years | 4,655 (64.8%) | 2,528 (35.2%) |
| 35 to 50 years | 2,146 (78.1%) | 602 (21.9%) |
| Total | 6,794 (68.1%) | 3,183 (31.9%) |
Fertility by Education in Erie County
Average fertility rate in Erie County is 46.0 births per 1,000 women. Women with the education attainment of graduate degree have the highest fertility rate of 57.0 births per 1,000 women, while women with the education attainment of less than high school have the lowest fertility at 38.0 births per 1,000 women. Women with the education attainment of college or associate's degree represent 27.7% of all women with births.
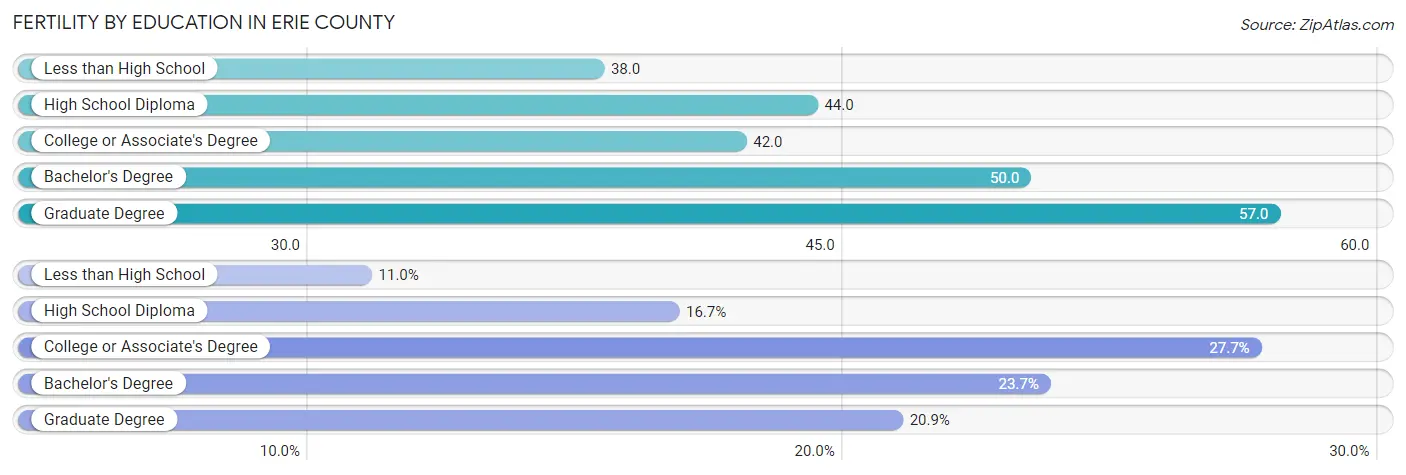
| Educational Attainment | Women with Births | Births / 1,000 Women |
| Less than High School | 1,095 (11.0%) | 38.0 |
| High School Diploma | 1,670 (16.7%) | 44.0 |
| College or Associate's Degree | 2,759 (27.7%) | 42.0 |
| Bachelor's Degree | 2,365 (23.7%) | 50.0 |
| Graduate Degree | 2,088 (20.9%) | 57.0 |
| Total | 9,977 (100.0%) | 46.0 |
Fertility by Education by Marriage Status in Erie County
31.9% of women with births in Erie County are unmarried. Women with the educational attainment of graduate degree are most likely to be married with 91.6% of them married at childbirth, while women with the educational attainment of high school diploma are least likely to be married with 55.1% of them unmarried at childbirth.
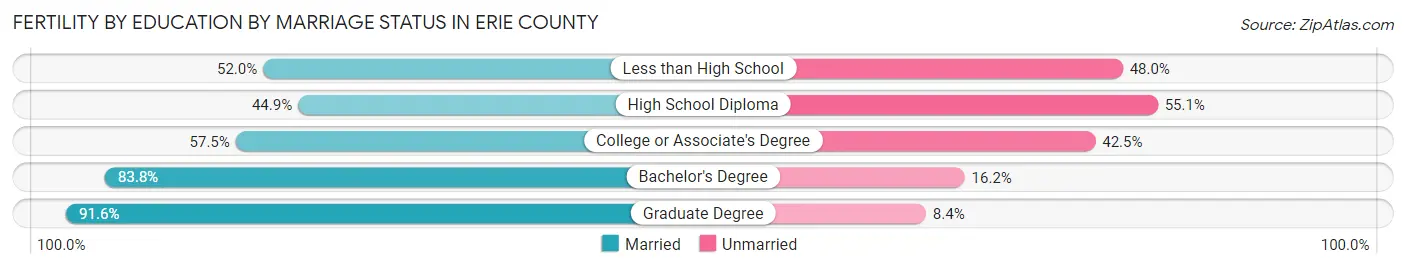
| Educational Attainment | Married | Unmarried |
| Less than High School | 569 (52.0%) | 526 (48.0%) |
| High School Diploma | 750 (44.9%) | 920 (55.1%) |
| College or Associate's Degree | 1,586 (57.5%) | 1,173 (42.5%) |
| Bachelor's Degree | 1,982 (83.8%) | 383 (16.2%) |
| Graduate Degree | 1,913 (91.6%) | 175 (8.4%) |
| Total | 6,794 (68.1%) | 3,183 (31.9%) |
Employment Characteristics in Erie County
Employment by Class of Employer in Erie County
Among the 455,254 employed individuals in Erie County, private company employees (293,381 | 64.4%), not-for-profit organizations (53,218 | 11.7%), and local government employees (39,387 | 8.6%) make up the most common classes of employment.
| Employer Class | # Employees | % Employees |
| Private Company Employees | 293,381 | 64.4% |
| Self-Employed (Incorporated) | 13,901 | 3.0% |
| Self-Employed (Not Incorporated) | 18,441 | 4.1% |
| Not-for-profit Organizations | 53,218 | 11.7% |
| Local Government Employees | 39,387 | 8.6% |
| State Government Employees | 26,158 | 5.8% |
| Federal Government Employees | 10,310 | 2.3% |
| Unpaid Family Workers | 458 | 0.1% |
| Total | 455,254 | 100.0% |
Employment Status by Age in Erie County
According to the labor force statistics for Erie County, out of the total population over 16 years of age (782,615), 62.7% or 490,700 individuals are in the labor force, with 5.0% or 24,535 of them unemployed. The age group with the highest labor force participation rate is 35 to 44 years, with 85.4% or 96,390 individuals in the labor force. Within the labor force, the 16 to 19 years age range has the highest percentage of unemployed individuals, with 12.0% or 2,539 of them being unemployed.
| Age Bracket | In Labor Force | Unemployed |
| 16 to 19 Years | 21,156 (43.6%) | 2,539 (12.0%) |
| 20 to 24 Years | 46,166 (73.6%) | 3,416 (7.4%) |
| 25 to 29 Years | 55,768 (84.5%) | 3,458 (6.2%) |
| 30 to 34 Years | 57,374 (85.2%) | 2,639 (4.6%) |
| 35 to 44 Years | 96,390 (85.4%) | 3,952 (4.1%) |
| 45 to 54 Years | 93,149 (81.6%) | 3,633 (3.9%) |
| 55 to 59 Years | 50,247 (74.0%) | 2,060 (4.1%) |
| 60 to 64 Years | 40,109 (59.5%) | 1,444 (3.6%) |
| 65 to 74 Years | 25,242 (24.9%) | 984 (3.9%) |
| 75 Years and over | 5,426 (7.3%) | 163 (3.0%) |
| Total | 490,700 (62.7%) | 24,535 (5.0%) |
Employment Status by Educational Attainment in Erie County
According to labor force statistics for Erie County, 79.3% of individuals (393,067) out of the total population between 25 and 64 years of age (495,671) are in the labor force, with 4.4% or 17,295 of them being unemployed. The group with the highest labor force participation rate are those with the educational attainment of bachelor's degree or higher, with 89.2% or 174,988 individuals in the labor force. Within the labor force, individuals with less than high school education have the highest percentage of unemployment, with 9.3% or 1,634 of them being unemployed.
| Educational Attainment | In Labor Force | Unemployed |
| Less than High School | 17,567 (50.1%) | 3,261 (9.3%) |
| High School Diploma | 80,379 (70.7%) | 7,390 (6.5%) |
| College / Associate Degree | 119,991 (79.6%) | 7,386 (4.9%) |
| Bachelor's Degree or higher | 174,988 (89.2%) | 4,904 (2.5%) |
| Total | 393,067 (79.3%) | 21,810 (4.4%) |
Employment Occupations by Sex in Erie County
Management, Business, Science and Arts Occupations
The most common Management, Business, Science and Arts occupations in Erie County are Community & Social Service (61,491 | 13.2%), Management (48,126 | 10.3%), Education Instruction & Library (35,815 | 7.7%), Health Diagnosing & Treating (35,181 | 7.5%), and Business & Financial (27,967 | 6.0%).
Management, Business, Science and Arts Occupations by Sex
Within the Management, Business, Science and Arts occupations in Erie County, the most male-oriented occupations are Architecture & Engineering (84.4%), Computers, Engineering & Science (77.0%), and Computers & Mathematics (76.9%), while the most female-oriented occupations are Health Diagnosing & Treating (75.1%), Health Technologists (73.3%), and Education Instruction & Library (72.4%).
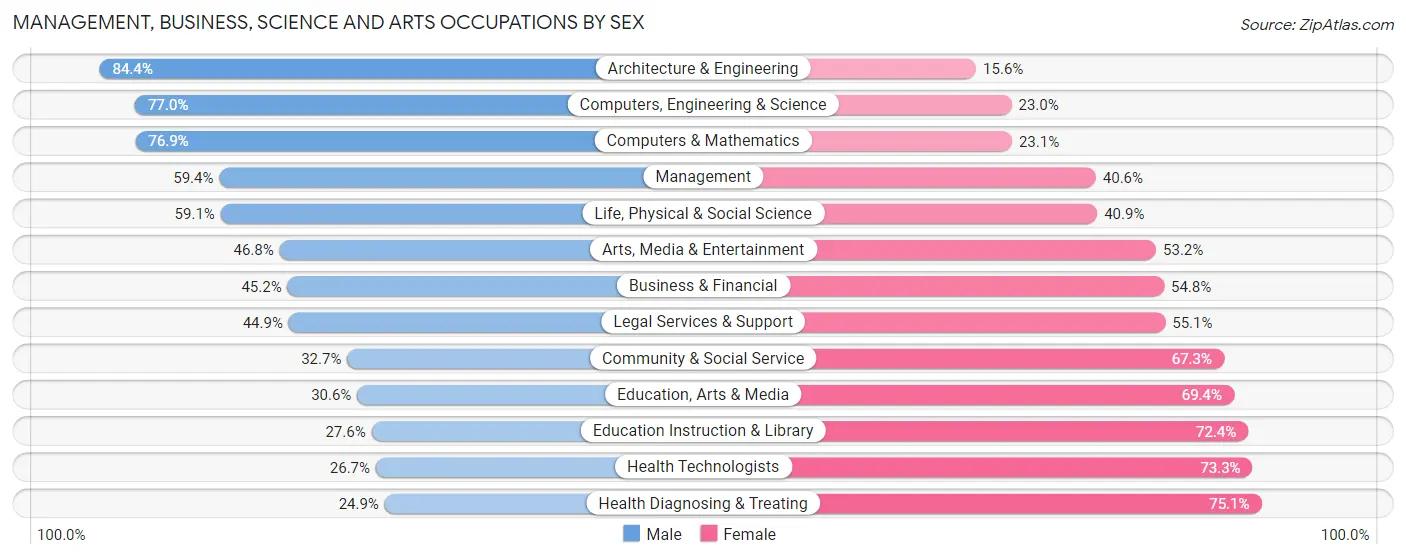
| Occupation | Male | Female |
| Management | 28,584 (59.4%) | 19,542 (40.6%) |
| Business & Financial | 12,631 (45.2%) | 15,336 (54.8%) |
| Computers, Engineering & Science | 20,538 (77.0%) | 6,145 (23.0%) |
| Computers & Mathematics | 9,406 (76.9%) | 2,829 (23.1%) |
| Architecture & Engineering | 8,660 (84.4%) | 1,605 (15.6%) |
| Life, Physical & Social Science | 2,472 (59.1%) | 1,711 (40.9%) |
| Community & Social Service | 20,107 (32.7%) | 41,384 (67.3%) |
| Education, Arts & Media | 3,161 (30.6%) | 7,162 (69.4%) |
| Legal Services & Support | 3,312 (44.9%) | 4,064 (55.1%) |
| Education Instruction & Library | 9,899 (27.6%) | 25,916 (72.4%) |
| Arts, Media & Entertainment | 3,735 (46.8%) | 4,242 (53.2%) |
| Health Diagnosing & Treating | 8,753 (24.9%) | 26,428 (75.1%) |
| Health Technologists | 6,680 (26.7%) | 18,311 (73.3%) |
| Total (Category) | 90,613 (45.4%) | 108,835 (54.6%) |
| Total (Overall) | 237,741 (51.0%) | 228,287 (49.0%) |
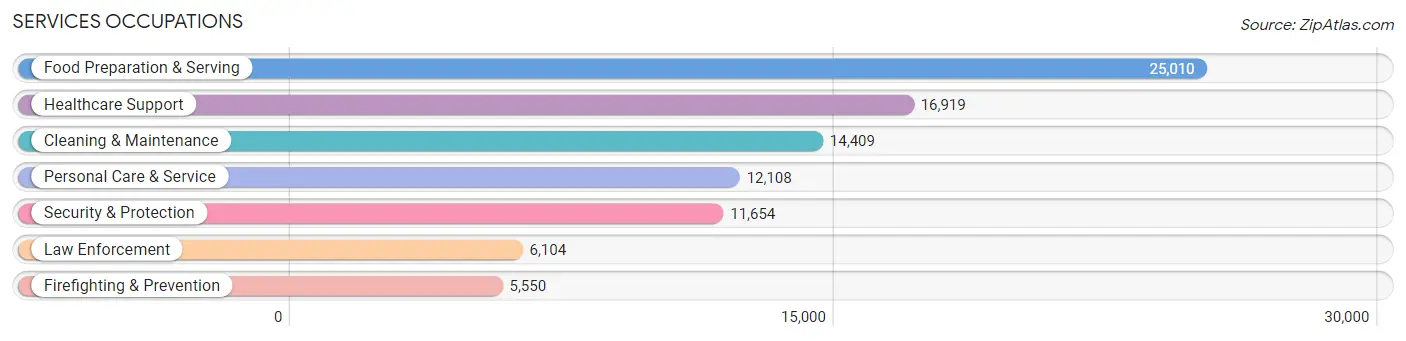
Services Occupations
The most common Services occupations in Erie County are Food Preparation & Serving (25,010 | 5.4%), Healthcare Support (16,919 | 3.6%), Cleaning & Maintenance (14,409 | 3.1%), Personal Care & Service (12,108 | 2.6%), and Security & Protection (11,654 | 2.5%).
Services Occupations by Sex
Within the Services occupations in Erie County, the most male-oriented occupations are Law Enforcement (83.9%), Security & Protection (75.2%), and Firefighting & Prevention (65.7%), while the most female-oriented occupations are Healthcare Support (79.8%), Personal Care & Service (74.1%), and Food Preparation & Serving (51.9%).
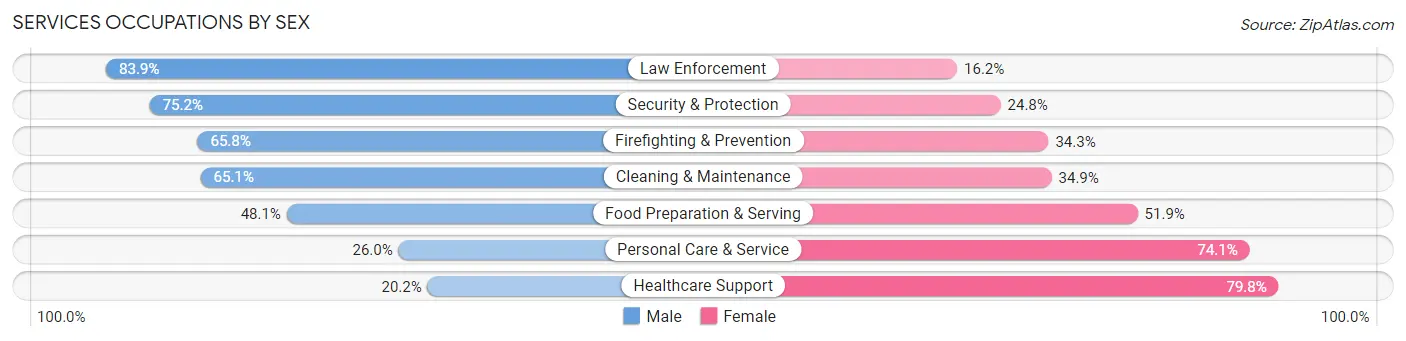
| Occupation | Male | Female |
| Healthcare Support | 3,419 (20.2%) | 13,500 (79.8%) |
| Security & Protection | 8,767 (75.2%) | 2,887 (24.8%) |
| Firefighting & Prevention | 3,649 (65.7%) | 1,901 (34.3%) |
| Law Enforcement | 5,118 (83.9%) | 986 (16.2%) |
| Food Preparation & Serving | 12,031 (48.1%) | 12,979 (51.9%) |
| Cleaning & Maintenance | 9,386 (65.1%) | 5,023 (34.9%) |
| Personal Care & Service | 3,142 (26.0%) | 8,966 (74.1%) |
| Total (Category) | 36,745 (45.9%) | 43,355 (54.1%) |
| Total (Overall) | 237,741 (51.0%) | 228,287 (49.0%) |
Sales and Office Occupations
The most common Sales and Office occupations in Erie County are Office & Administration (58,007 | 12.4%), and Sales & Related (46,684 | 10.0%).

Sales and Office Occupations by Sex
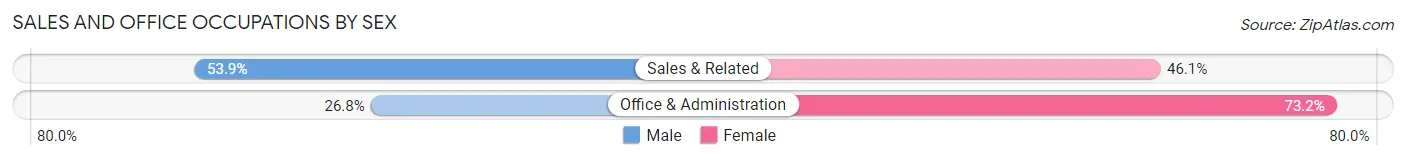
| Occupation | Male | Female |
| Sales & Related | 25,170 (53.9%) | 21,514 (46.1%) |
| Office & Administration | 15,535 (26.8%) | 42,472 (73.2%) |
| Total (Category) | 40,705 (38.9%) | 63,986 (61.1%) |
| Total (Overall) | 237,741 (51.0%) | 228,287 (49.0%) |
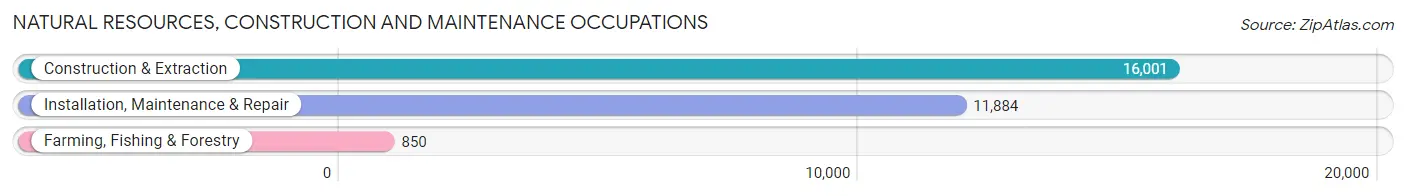
Natural Resources, Construction and Maintenance Occupations
The most common Natural Resources, Construction and Maintenance occupations in Erie County are Construction & Extraction (16,001 | 3.4%), Installation, Maintenance & Repair (11,884 | 2.5%), and Farming, Fishing & Forestry (850 | 0.2%).
Natural Resources, Construction and Maintenance Occupations by Sex
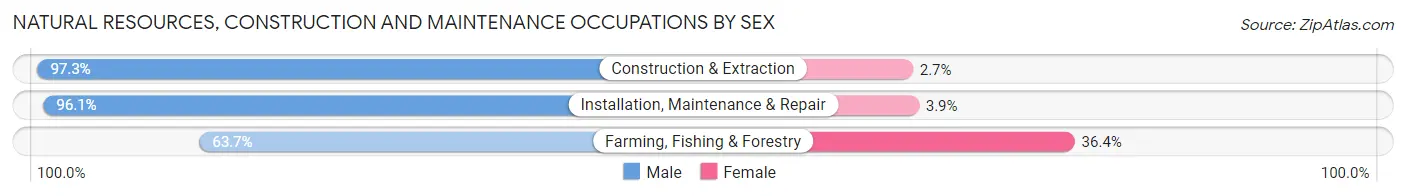
| Occupation | Male | Female |
| Farming, Fishing & Forestry | 541 (63.6%) | 309 (36.3%) |
| Construction & Extraction | 15,572 (97.3%) | 429 (2.7%) |
| Installation, Maintenance & Repair | 11,418 (96.1%) | 466 (3.9%) |
| Total (Category) | 27,531 (95.8%) | 1,204 (4.2%) |
| Total (Overall) | 237,741 (51.0%) | 228,287 (49.0%) |
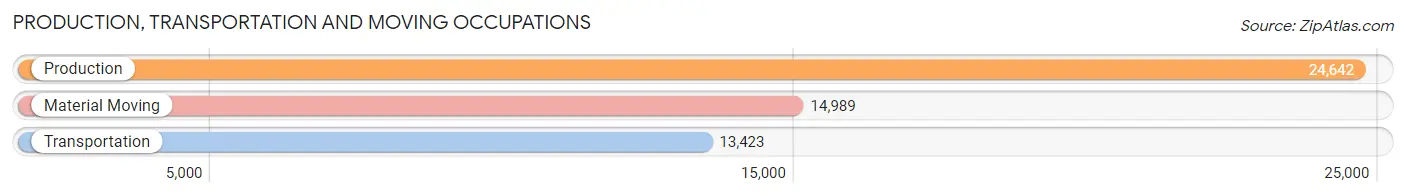
Production, Transportation and Moving Occupations
The most common Production, Transportation and Moving occupations in Erie County are Production (24,642 | 5.3%), Material Moving (14,989 | 3.2%), and Transportation (13,423 | 2.9%).
Production, Transportation and Moving Occupations by Sex
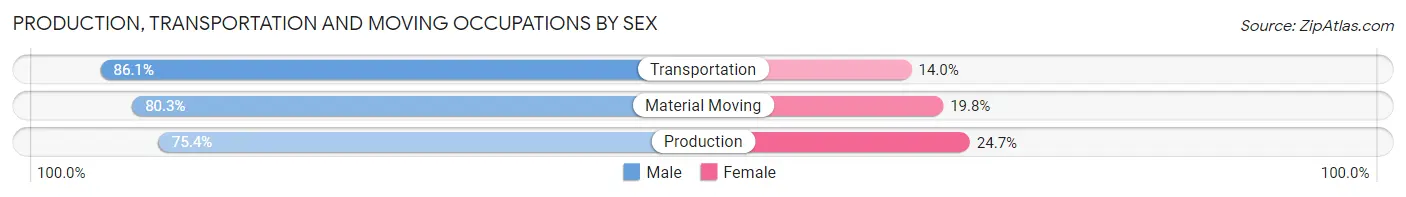
| Occupation | Male | Female |
| Production | 18,568 (75.3%) | 6,074 (24.6%) |
| Transportation | 11,551 (86.1%) | 1,872 (14.0%) |
| Material Moving | 12,028 (80.2%) | 2,961 (19.8%) |
| Total (Category) | 42,147 (79.4%) | 10,907 (20.6%) |
| Total (Overall) | 237,741 (51.0%) | 228,287 (49.0%) |
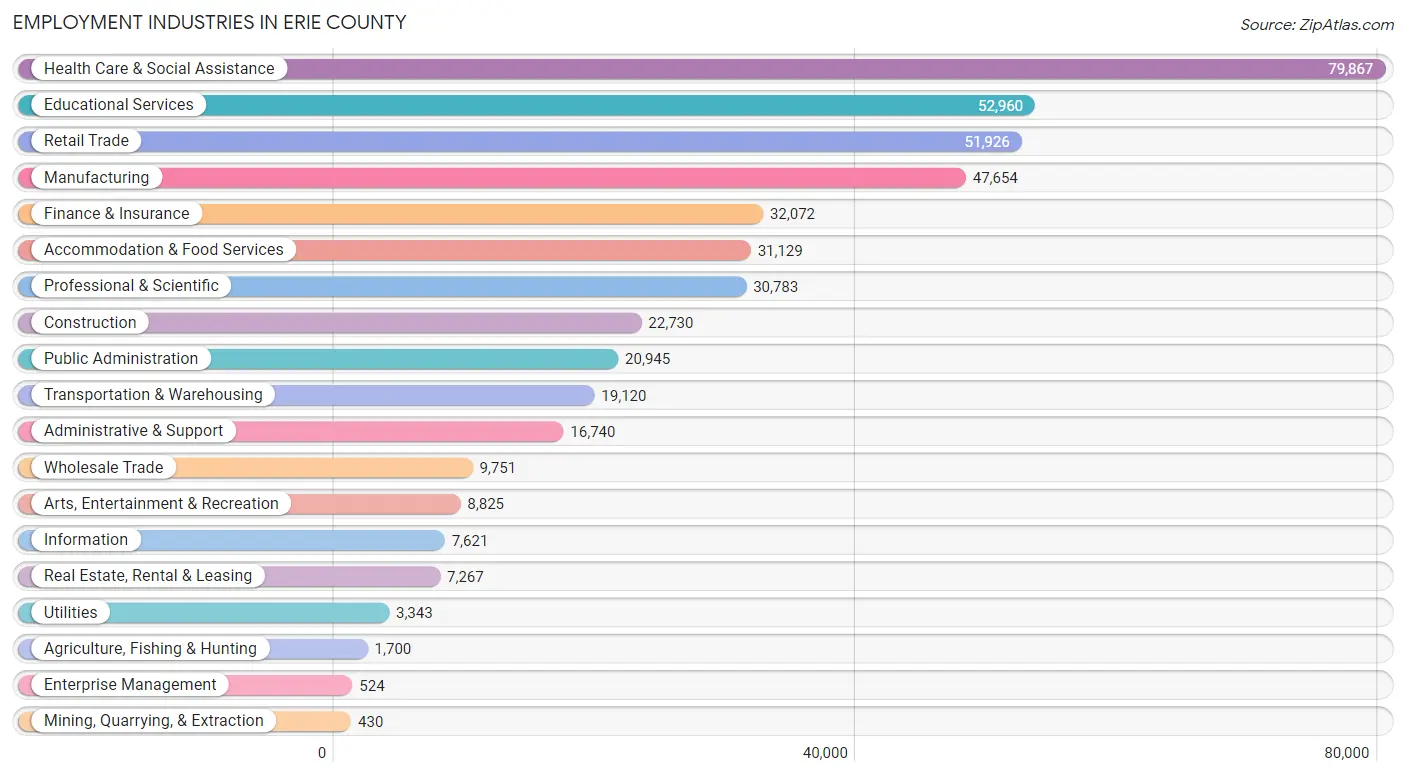
Employment Industries by Sex in Erie County
Employment Industries in Erie County
The major employment industries in Erie County include Health Care & Social Assistance (79,867 | 17.1%), Educational Services (52,960 | 11.4%), Retail Trade (51,926 | 11.1%), Manufacturing (47,654 | 10.2%), and Finance & Insurance (32,072 | 6.9%).
Employment Industries by Sex in Erie County
The Erie County industries that see more men than women are Construction (89.0%), Utilities (79.0%), and Mining, Quarrying, & Extraction (77.2%), whereas the industries that tend to have a higher number of women are Health Care & Social Assistance (75.2%), Educational Services (66.6%), and Finance & Insurance (58.4%).
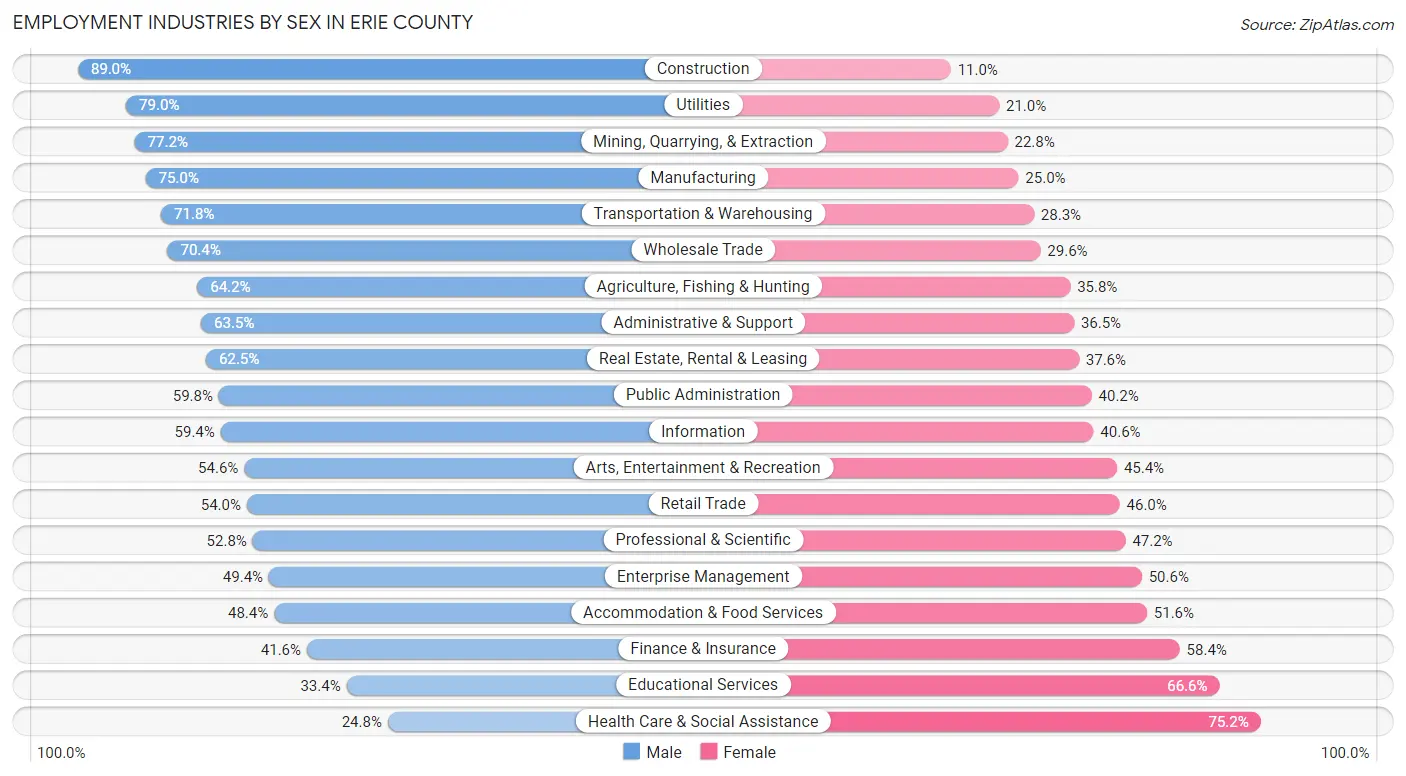
| Industry | Male | Female |
| Agriculture, Fishing & Hunting | 1,092 (64.2%) | 608 (35.8%) |
| Mining, Quarrying, & Extraction | 332 (77.2%) | 98 (22.8%) |
| Construction | 20,224 (89.0%) | 2,506 (11.0%) |
| Manufacturing | 35,722 (75.0%) | 11,932 (25.0%) |
| Wholesale Trade | 6,865 (70.4%) | 2,886 (29.6%) |
| Retail Trade | 28,045 (54.0%) | 23,881 (46.0%) |
| Transportation & Warehousing | 13,718 (71.8%) | 5,402 (28.2%) |
| Utilities | 2,640 (79.0%) | 703 (21.0%) |
| Information | 4,529 (59.4%) | 3,092 (40.6%) |
| Finance & Insurance | 13,334 (41.6%) | 18,738 (58.4%) |
| Real Estate, Rental & Leasing | 4,538 (62.5%) | 2,729 (37.6%) |
| Professional & Scientific | 16,253 (52.8%) | 14,530 (47.2%) |
| Enterprise Management | 259 (49.4%) | 265 (50.6%) |
| Administrative & Support | 10,623 (63.5%) | 6,117 (36.5%) |
| Educational Services | 17,673 (33.4%) | 35,287 (66.6%) |
| Health Care & Social Assistance | 19,842 (24.8%) | 60,025 (75.2%) |
| Arts, Entertainment & Recreation | 4,815 (54.6%) | 4,010 (45.4%) |
| Accommodation & Food Services | 15,056 (48.4%) | 16,073 (51.6%) |
| Public Administration | 12,526 (59.8%) | 8,419 (40.2%) |
| Total | 237,741 (51.0%) | 228,287 (49.0%) |
Education in Erie County
School Enrollment in Erie County
The most common levels of schooling among the 218,535 students in Erie County are college / undergraduate (51,703 | 23.7%), high school (44,157 | 20.2%), and elementary school (42,951 | 19.7%).
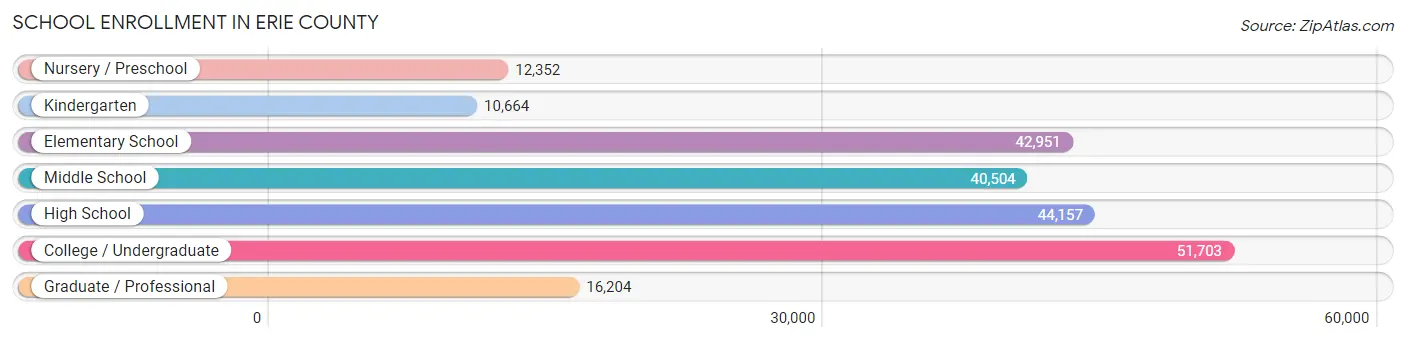
| School Level | # Students | % Students |
| Nursery / Preschool | 12,352 | 5.7% |
| Kindergarten | 10,664 | 4.9% |
| Elementary School | 42,951 | 19.7% |
| Middle School | 40,504 | 18.5% |
| High School | 44,157 | 20.2% |
| College / Undergraduate | 51,703 | 23.7% |
| Graduate / Professional | 16,204 | 7.4% |
| Total | 218,535 | 100.0% |
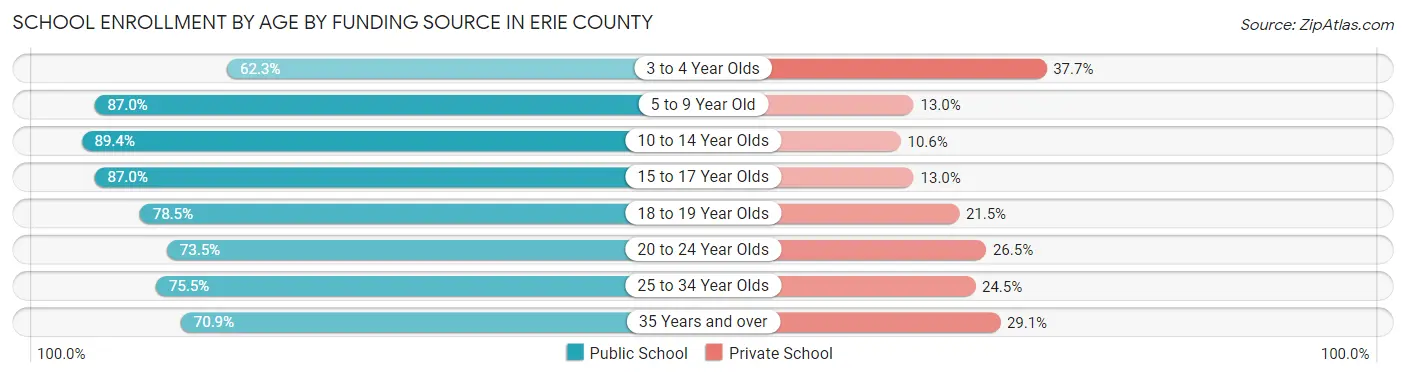
School Enrollment by Age by Funding Source in Erie County
Out of a total of 218,535 students who are enrolled in schools in Erie County, 38,462 (17.6%) attend a private institution, while the remaining 180,073 (82.4%) are enrolled in public schools. The age group of 3 to 4 year olds has the highest likelihood of being enrolled in private schools, with 3,975 (37.7% in the age bracket) enrolled. Conversely, the age group of 10 to 14 year olds has the lowest likelihood of being enrolled in a private school, with 45,543 (89.4% in the age bracket) attending a public institution.
| Age Bracket | Public School | Private School |
| 3 to 4 Year Olds | 6,561 (62.3%) | 3,975 (37.7%) |
| 5 to 9 Year Old | 44,610 (87.0%) | 6,676 (13.0%) |
| 10 to 14 Year Olds | 45,543 (89.4%) | 5,398 (10.6%) |
| 15 to 17 Year Olds | 28,578 (87.0%) | 4,283 (13.0%) |
| 18 to 19 Year Olds | 16,339 (78.5%) | 4,467 (21.5%) |
| 20 to 24 Year Olds | 20,930 (73.5%) | 7,552 (26.5%) |
| 25 to 34 Year Olds | 11,160 (75.5%) | 3,616 (24.5%) |
| 35 Years and over | 6,272 (70.9%) | 2,575 (29.1%) |
| Total | 180,073 (82.4%) | 38,462 (17.6%) |
Educational Attainment by Field of Study in Erie County
Business (47,906 | 18.0%), education (34,665 | 13.0%), science & technology (30,862 | 11.6%), social sciences (22,530 | 8.5%), and arts & humanities (16,398 | 6.2%) are the most common fields of study among 265,790 individuals in Erie County who have obtained a bachelor's degree or higher.
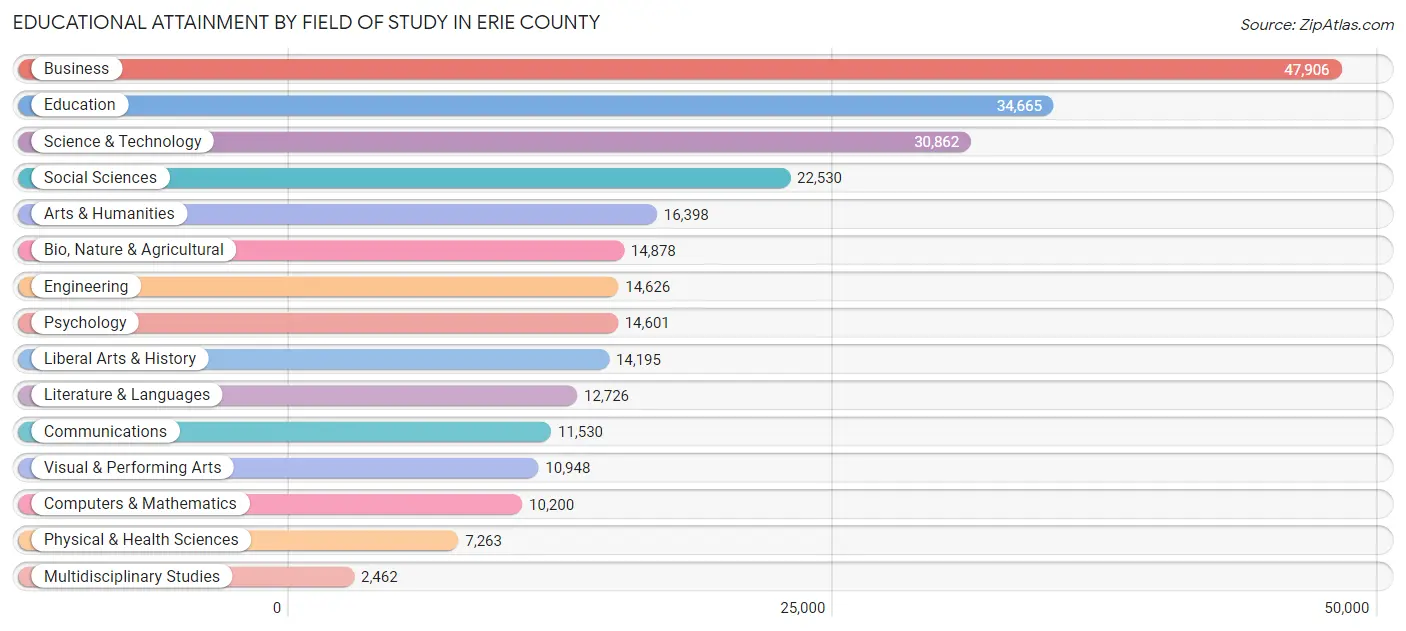
| Field of Study | # Graduates | % Graduates |
| Computers & Mathematics | 10,200 | 3.8% |
| Bio, Nature & Agricultural | 14,878 | 5.6% |
| Physical & Health Sciences | 7,263 | 2.7% |
| Psychology | 14,601 | 5.5% |
| Social Sciences | 22,530 | 8.5% |
| Engineering | 14,626 | 5.5% |
| Multidisciplinary Studies | 2,462 | 0.9% |
| Science & Technology | 30,862 | 11.6% |
| Business | 47,906 | 18.0% |
| Education | 34,665 | 13.0% |
| Literature & Languages | 12,726 | 4.8% |
| Liberal Arts & History | 14,195 | 5.3% |
| Visual & Performing Arts | 10,948 | 4.1% |
| Communications | 11,530 | 4.3% |
| Arts & Humanities | 16,398 | 6.2% |
| Total | 265,790 | 100.0% |
Transportation & Commute in Erie County
Vehicle Availability by Sex in Erie County
The most prevalent vehicle ownership categories in Erie County are males with 2 vehicles (107,490, accounting for 46.3%) and females with 2 vehicles (96,759, making up 49.0%).
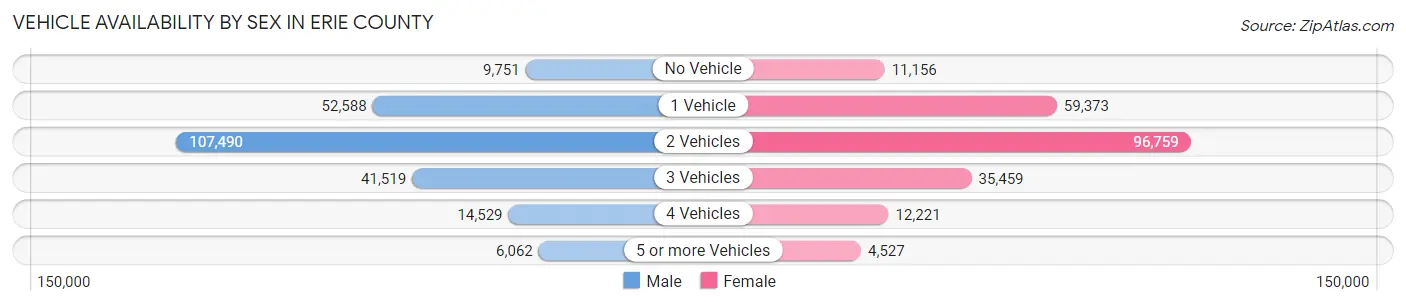
| Vehicles Available | Male | Female |
| No Vehicle | 9,751 (4.2%) | 11,156 (5.1%) |
| 1 Vehicle | 52,588 (22.7%) | 59,373 (27.1%) |
| 2 Vehicles | 107,490 (46.3%) | 96,759 (44.1%) |
| 3 Vehicles | 41,519 (17.9%) | 35,459 (16.2%) |
| 4 Vehicles | 14,529 (6.3%) | 12,221 (5.6%) |
| 5 or more Vehicles | 6,062 (2.6%) | 4,527 (2.1%) |
| Total | 231,939 (100.0%) | 219,495 (100.0%) |
Commute Time in Erie County
The most frequently occuring commute durations in Erie County are 15 to 19 minutes (78,198 commuters, 19.0%), 20 to 24 minutes (73,491 commuters, 17.9%), and 10 to 14 minutes (65,825 commuters, 16.0%).
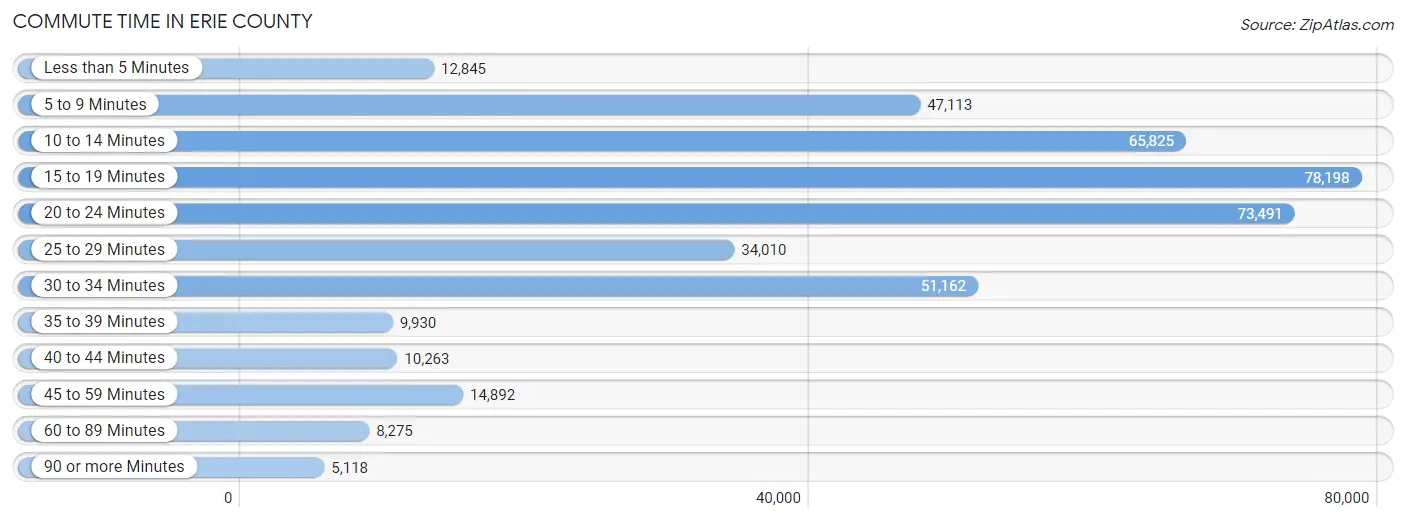
| Commute Time | # Commuters | % Commuters |
| Less than 5 Minutes | 12,845 | 3.1% |
| 5 to 9 Minutes | 47,113 | 11.5% |
| 10 to 14 Minutes | 65,825 | 16.0% |
| 15 to 19 Minutes | 78,198 | 19.0% |
| 20 to 24 Minutes | 73,491 | 17.9% |
| 25 to 29 Minutes | 34,010 | 8.3% |
| 30 to 34 Minutes | 51,162 | 12.4% |
| 35 to 39 Minutes | 9,930 | 2.4% |
| 40 to 44 Minutes | 10,263 | 2.5% |
| 45 to 59 Minutes | 14,892 | 3.6% |
| 60 to 89 Minutes | 8,275 | 2.0% |
| 90 or more Minutes | 5,118 | 1.2% |
Commute Time by Sex in Erie County
The most common commute times in Erie County are 15 to 19 minutes (39,626 commuters, 18.6%) for males and 15 to 19 minutes (38,572 commuters, 19.5%) for females.
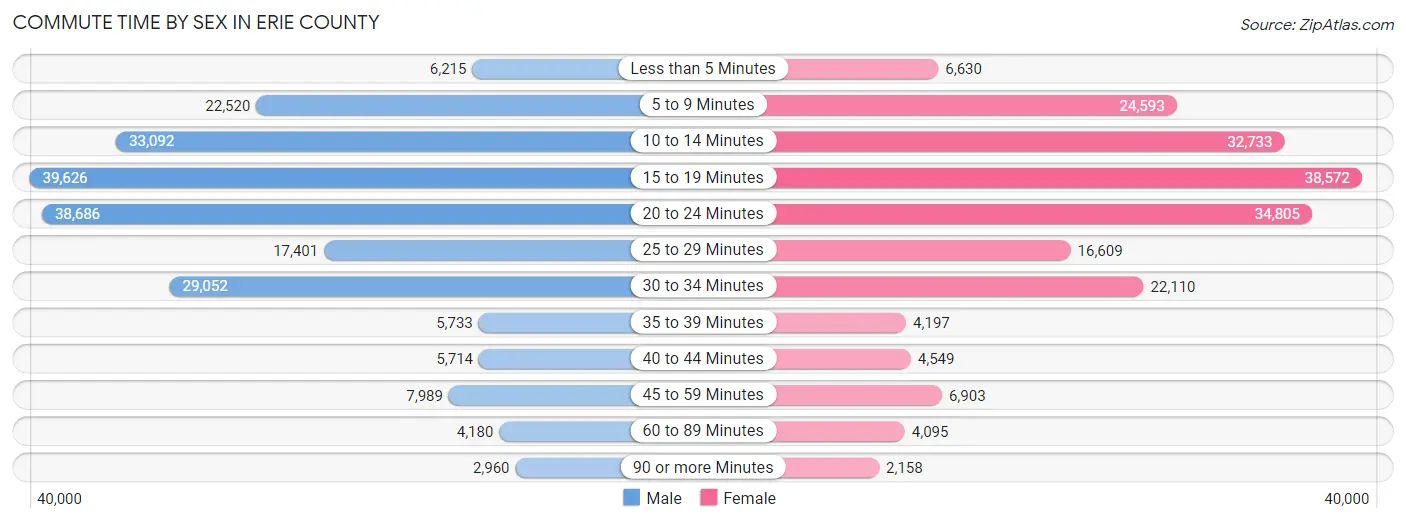
| Commute Time | Male | Female |
| Less than 5 Minutes | 6,215 (2.9%) | 6,630 (3.4%) |
| 5 to 9 Minutes | 22,520 (10.6%) | 24,593 (12.4%) |
| 10 to 14 Minutes | 33,092 (15.5%) | 32,733 (16.5%) |
| 15 to 19 Minutes | 39,626 (18.6%) | 38,572 (19.5%) |
| 20 to 24 Minutes | 38,686 (18.1%) | 34,805 (17.6%) |
| 25 to 29 Minutes | 17,401 (8.2%) | 16,609 (8.4%) |
| 30 to 34 Minutes | 29,052 (13.6%) | 22,110 (11.2%) |
| 35 to 39 Minutes | 5,733 (2.7%) | 4,197 (2.1%) |
| 40 to 44 Minutes | 5,714 (2.7%) | 4,549 (2.3%) |
| 45 to 59 Minutes | 7,989 (3.7%) | 6,903 (3.5%) |
| 60 to 89 Minutes | 4,180 (2.0%) | 4,095 (2.1%) |
| 90 or more Minutes | 2,960 (1.4%) | 2,158 (1.1%) |
Time of Departure to Work by Sex in Erie County
The most frequent times of departure to work in Erie County are 7:00 AM to 7:29 AM (28,513, 13.4%) for males and 7:30 AM to 7:59 AM (30,730, 15.5%) for females.
| Time of Departure | Male | Female |
| 12:00 AM to 4:59 AM | 7,307 (3.4%) | 3,404 (1.7%) |
| 5:00 AM to 5:29 AM | 6,563 (3.1%) | 3,389 (1.7%) |
| 5:30 AM to 5:59 AM | 9,566 (4.5%) | 5,773 (2.9%) |
| 6:00 AM to 6:29 AM | 16,638 (7.8%) | 11,013 (5.6%) |
| 6:30 AM to 6:59 AM | 23,486 (11.0%) | 17,930 (9.1%) |
| 7:00 AM to 7:29 AM | 28,513 (13.4%) | 29,787 (15.0%) |
| 7:30 AM to 7:59 AM | 26,135 (12.3%) | 30,730 (15.5%) |
| 8:00 AM to 8:29 AM | 26,154 (12.3%) | 29,031 (14.7%) |
| 8:30 AM to 8:59 AM | 12,962 (6.1%) | 16,713 (8.4%) |
| 9:00 AM to 9:59 AM | 12,860 (6.0%) | 14,118 (7.1%) |
| 10:00 AM to 10:59 AM | 5,862 (2.8%) | 5,950 (3.0%) |
| 11:00 AM to 11:59 AM | 3,266 (1.5%) | 2,820 (1.4%) |
| 12:00 PM to 3:59 PM | 18,378 (8.6%) | 14,327 (7.2%) |
| 4:00 PM to 11:59 PM | 15,478 (7.3%) | 12,969 (6.6%) |
| Total | 213,168 (100.0%) | 197,954 (100.0%) |
Housing Occupancy in Erie County
Occupancy by Ownership in Erie County
Of the total 406,547 dwellings in Erie County, owner-occupied units account for 264,980 (65.2%), while renter-occupied units make up 141,567 (34.8%).
| Occupancy | # Housing Units | % Housing Units |
| Owner Occupied Housing Units | 264,980 | 65.2% |
| Renter-Occupied Housing Units | 141,567 | 34.8% |
| Total Occupied Housing Units | 406,547 | 100.0% |
Occupancy by Household Size in Erie County
| Household Size | # Housing Units | % Housing Units |
| 1-Person Household | 141,410 | 34.8% |
| 2-Person Household | 136,308 | 33.5% |
| 3-Person Household | 56,345 | 13.9% |
| 4+ Person Household | 72,484 | 17.8% |
| Total Housing Units | 406,547 | 100.0% |
Occupancy by Ownership by Household Size in Erie County
| Household Size | Owner-occupied | Renter-occupied |
| 1-Person Household | 72,472 (51.2%) | 68,938 (48.7%) |
| 2-Person Household | 97,290 (71.4%) | 39,018 (28.6%) |
| 3-Person Household | 40,565 (72.0%) | 15,780 (28.0%) |
| 4+ Person Household | 54,653 (75.4%) | 17,831 (24.6%) |
| Total Housing Units | 264,980 (65.2%) | 141,567 (34.8%) |
Occupancy by Educational Attainment in Erie County
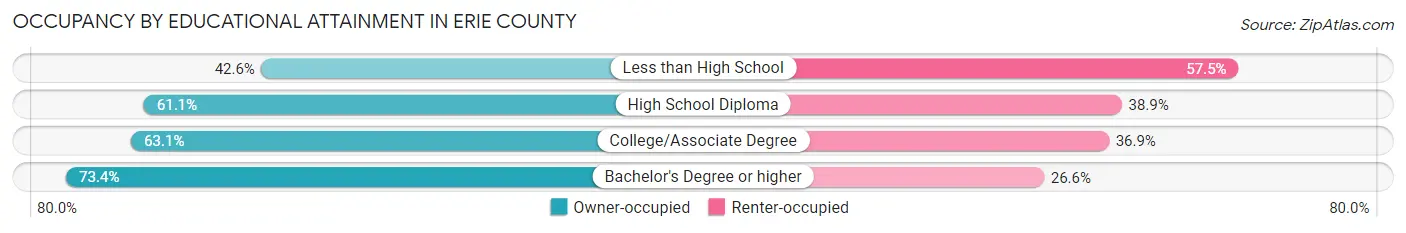
| Household Size | Owner-occupied | Renter-occupied |
| Less than High School | 11,340 (42.5%) | 15,310 (57.5%) |
| High School Diploma | 60,667 (61.1%) | 38,654 (38.9%) |
| College/Associate Degree | 79,881 (63.1%) | 46,669 (36.9%) |
| Bachelor's Degree or higher | 113,092 (73.4%) | 40,934 (26.6%) |
Occupancy by Age of Householder in Erie County
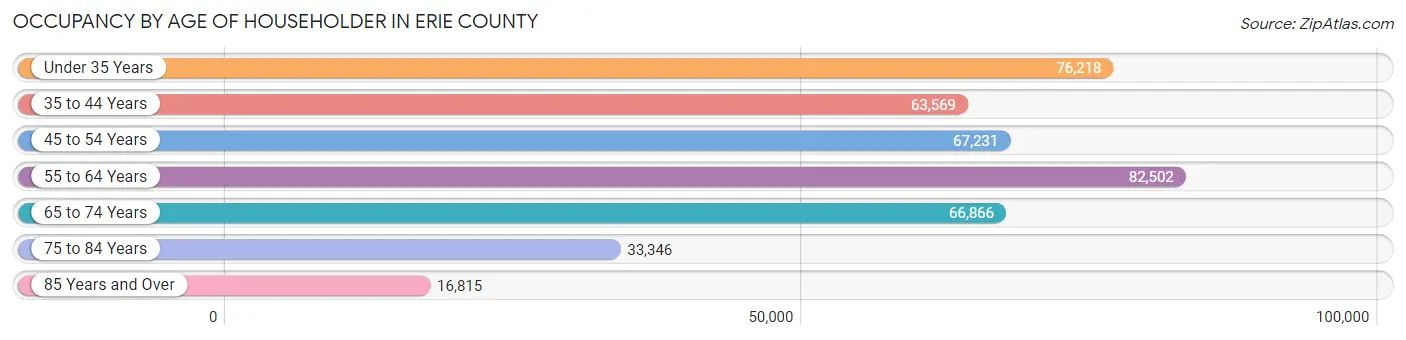
| Age Bracket | # Households | % Households |
| Under 35 Years | 76,218 | 18.8% |
| 35 to 44 Years | 63,569 | 15.6% |
| 45 to 54 Years | 67,231 | 16.5% |
| 55 to 64 Years | 82,502 | 20.3% |
| 65 to 74 Years | 66,866 | 16.5% |
| 75 to 84 Years | 33,346 | 8.2% |
| 85 Years and Over | 16,815 | 4.1% |
| Total | 406,547 | 100.0% |
Housing Finances in Erie County
Median Income by Occupancy in Erie County
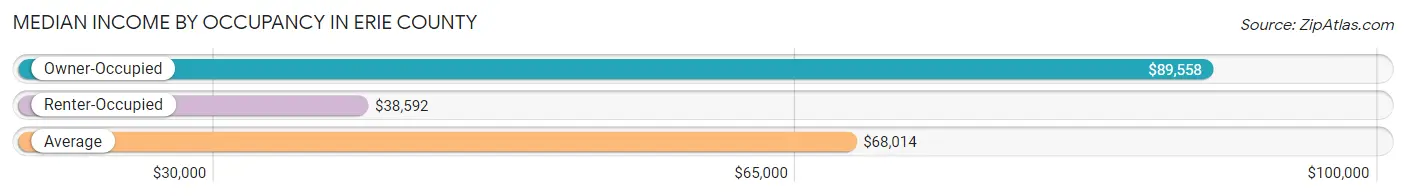
| Occupancy Type | # Households | Median Income |
| Owner-Occupied | 264,980 (65.2%) | $89,558 |
| Renter-Occupied | 141,567 (34.8%) | $38,592 |
| Average | 406,547 (100.0%) | $68,014 |
Occupancy by Householder Income Bracket in Erie County
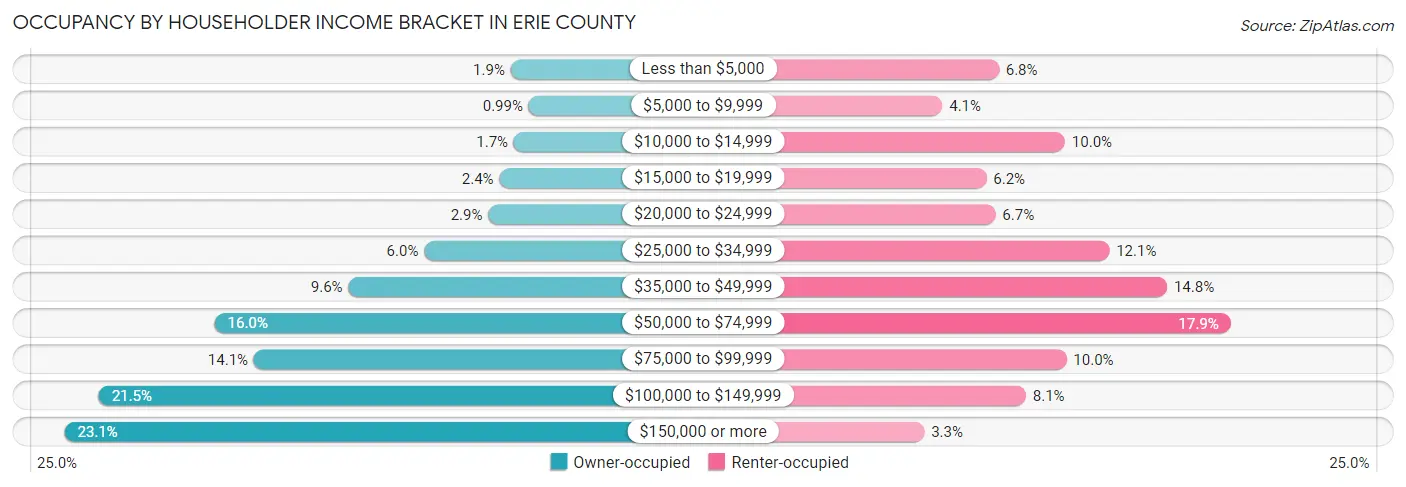
| Income Bracket | Owner-occupied | Renter-occupied |
| Less than $5,000 | 4,901 (1.8%) | 9,653 (6.8%) |
| $5,000 to $9,999 | 2,630 (1.0%) | 5,848 (4.1%) |
| $10,000 to $14,999 | 4,496 (1.7%) | 14,110 (10.0%) |
| $15,000 to $19,999 | 6,337 (2.4%) | 8,817 (6.2%) |
| $20,000 to $24,999 | 7,747 (2.9%) | 9,423 (6.7%) |
| $25,000 to $34,999 | 15,817 (6.0%) | 17,100 (12.1%) |
| $35,000 to $49,999 | 25,375 (9.6%) | 21,000 (14.8%) |
| $50,000 to $74,999 | 42,253 (16.0%) | 25,289 (17.9%) |
| $75,000 to $99,999 | 37,320 (14.1%) | 14,216 (10.0%) |
| $100,000 to $149,999 | 56,893 (21.5%) | 11,482 (8.1%) |
| $150,000 or more | 61,211 (23.1%) | 4,629 (3.3%) |
| Total | 264,980 (100.0%) | 141,567 (100.0%) |
Monthly Housing Cost Tiers in Erie County
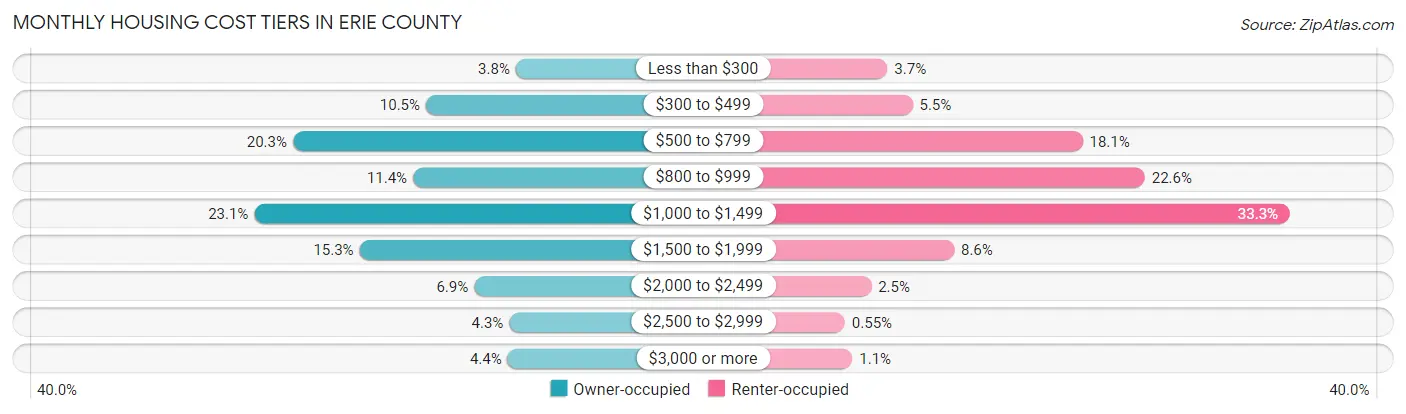
| Monthly Cost | Owner-occupied | Renter-occupied |
| Less than $300 | 10,157 (3.8%) | 5,203 (3.7%) |
| $300 to $499 | 27,701 (10.4%) | 7,830 (5.5%) |
| $500 to $799 | 53,652 (20.3%) | 25,548 (18.0%) |
| $800 to $999 | 30,196 (11.4%) | 32,049 (22.6%) |
| $1,000 to $1,499 | 61,193 (23.1%) | 47,177 (33.3%) |
| $1,500 to $1,999 | 40,646 (15.3%) | 12,155 (8.6%) |
| $2,000 to $2,499 | 18,273 (6.9%) | 3,521 (2.5%) |
| $2,500 to $2,999 | 11,427 (4.3%) | 775 (0.5%) |
| $3,000 or more | 11,735 (4.4%) | 1,556 (1.1%) |
| Total | 264,980 (100.0%) | 141,567 (100.0%) |
Physical Housing Characteristics in Erie County
Housing Structures in Erie County
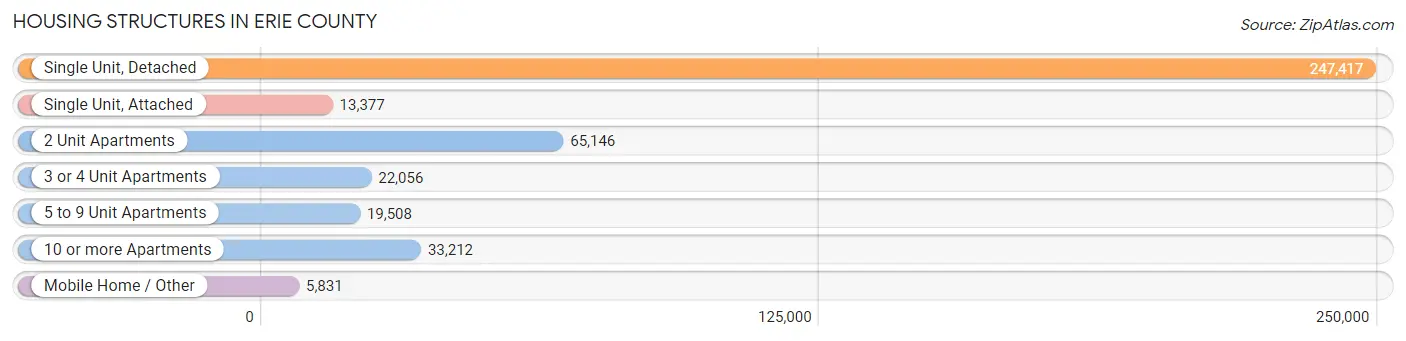
| Structure Type | # Housing Units | % Housing Units |
| Single Unit, Detached | 247,417 | 60.9% |
| Single Unit, Attached | 13,377 | 3.3% |
| 2 Unit Apartments | 65,146 | 16.0% |
| 3 or 4 Unit Apartments | 22,056 | 5.4% |
| 5 to 9 Unit Apartments | 19,508 | 4.8% |
| 10 or more Apartments | 33,212 | 8.2% |
| Mobile Home / Other | 5,831 | 1.4% |
| Total | 406,547 | 100.0% |
Housing Structures by Occupancy in Erie County
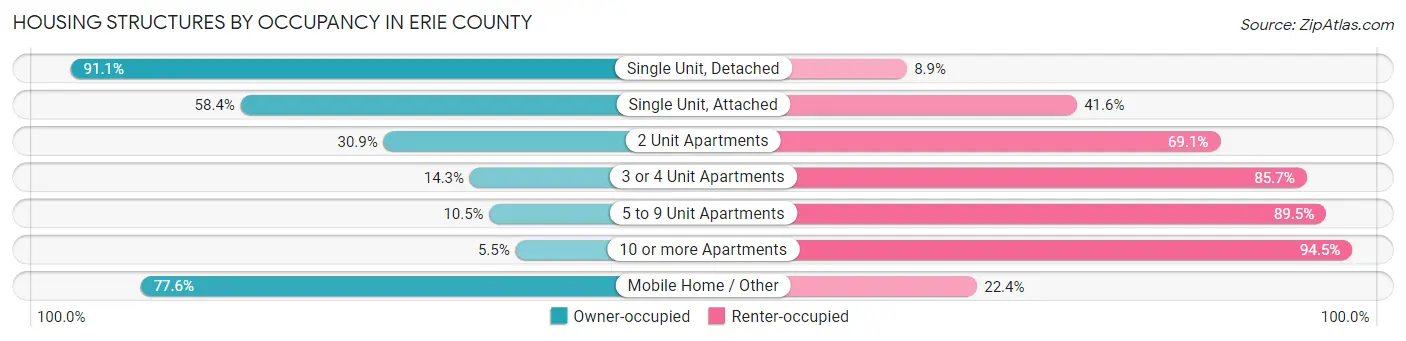
| Structure Type | Owner-occupied | Renter-occupied |
| Single Unit, Detached | 225,507 (91.1%) | 21,910 (8.9%) |
| Single Unit, Attached | 7,812 (58.4%) | 5,565 (41.6%) |
| 2 Unit Apartments | 20,121 (30.9%) | 45,025 (69.1%) |
| 3 or 4 Unit Apartments | 3,147 (14.3%) | 18,909 (85.7%) |
| 5 to 9 Unit Apartments | 2,049 (10.5%) | 17,459 (89.5%) |
| 10 or more Apartments | 1,817 (5.5%) | 31,395 (94.5%) |
| Mobile Home / Other | 4,527 (77.6%) | 1,304 (22.4%) |
| Total | 264,980 (65.2%) | 141,567 (34.8%) |
Housing Structures by Number of Rooms in Erie County
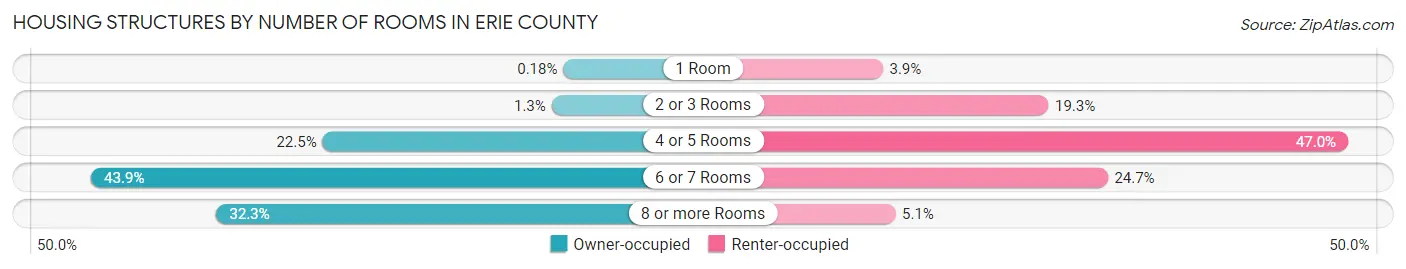
| Number of Rooms | Owner-occupied | Renter-occupied |
| 1 Room | 490 (0.2%) | 5,578 (3.9%) |
| 2 or 3 Rooms | 3,338 (1.3%) | 27,246 (19.3%) |
| 4 or 5 Rooms | 59,476 (22.5%) | 66,503 (47.0%) |
| 6 or 7 Rooms | 116,203 (43.9%) | 35,021 (24.7%) |
| 8 or more Rooms | 85,473 (32.3%) | 7,219 (5.1%) |
| Total | 264,980 (100.0%) | 141,567 (100.0%) |
Housing Structure by Heating Type in Erie County
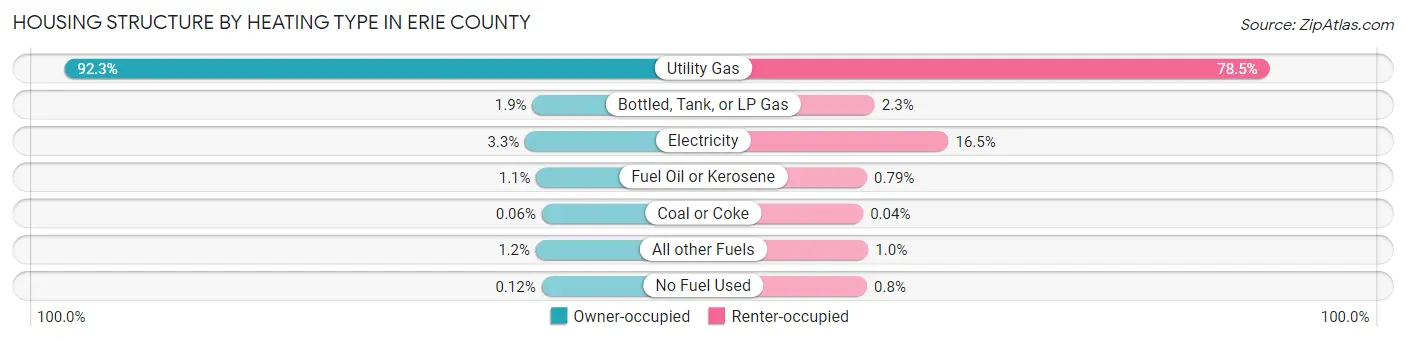
| Heating Type | Owner-occupied | Renter-occupied |
| Utility Gas | 244,639 (92.3%) | 111,157 (78.5%) |
| Bottled, Tank, or LP Gas | 4,968 (1.9%) | 3,235 (2.3%) |
| Electricity | 8,742 (3.3%) | 23,395 (16.5%) |
| Fuel Oil or Kerosene | 2,929 (1.1%) | 1,124 (0.8%) |
| Coal or Coke | 160 (0.1%) | 54 (0.0%) |
| All other Fuels | 3,222 (1.2%) | 1,473 (1.0%) |
| No Fuel Used | 320 (0.1%) | 1,129 (0.8%) |
| Total | 264,980 (100.0%) | 141,567 (100.0%) |
Household Vehicle Usage in Erie County
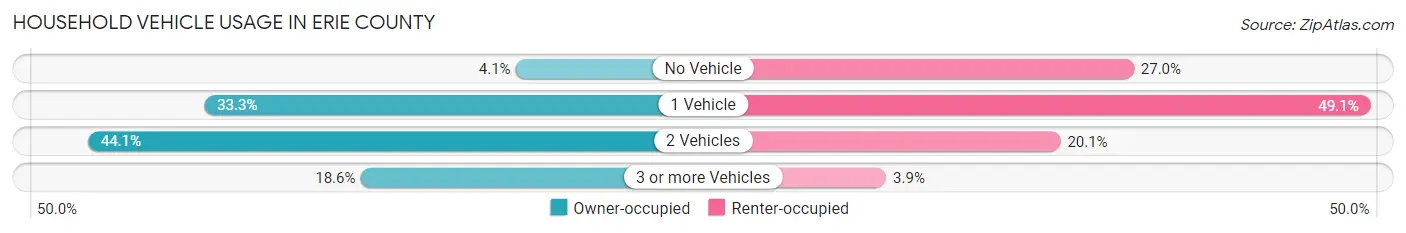
| Vehicles per Household | Owner-occupied | Renter-occupied |
| No Vehicle | 10,827 (4.1%) | 38,178 (27.0%) |
| 1 Vehicle | 88,100 (33.3%) | 69,455 (49.1%) |
| 2 Vehicles | 116,852 (44.1%) | 28,488 (20.1%) |
| 3 or more Vehicles | 49,201 (18.6%) | 5,446 (3.8%) |
| Total | 264,980 (100.0%) | 141,567 (100.0%) |
Real Estate & Mortgages in Erie County
Real Estate and Mortgage Overview in Erie County
| Characteristic | Without Mortgage | With Mortgage |
| Housing Units | 109,810 | 155,170 |
| Median Property Value | $179,200 | $211,000 |
| Median Household Income | $66,270 | $44,829 |
| Monthly Housing Costs | $614 | $11,424 |
| Real Estate Taxes | $3,847 | $3,082 |
Property Value by Mortgage Status in Erie County
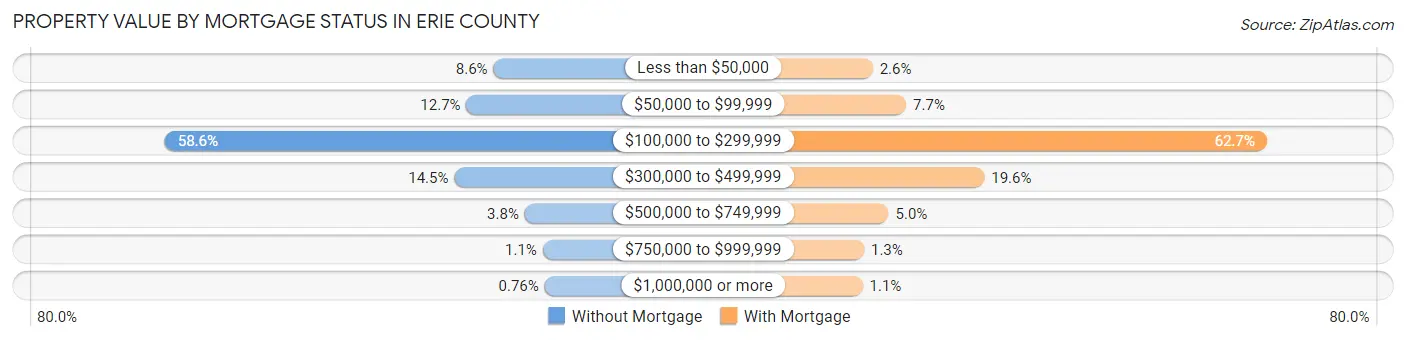
| Property Value | Without Mortgage | With Mortgage |
| Less than $50,000 | 9,395 (8.6%) | 4,073 (2.6%) |
| $50,000 to $99,999 | 13,929 (12.7%) | 11,969 (7.7%) |
| $100,000 to $299,999 | 64,387 (58.6%) | 97,230 (62.7%) |
| $300,000 to $499,999 | 15,944 (14.5%) | 30,440 (19.6%) |
| $500,000 to $749,999 | 4,165 (3.8%) | 7,803 (5.0%) |
| $750,000 to $999,999 | 1,155 (1.1%) | 2,000 (1.3%) |
| $1,000,000 or more | 835 (0.8%) | 1,655 (1.1%) |
| Total | 109,810 (100.0%) | 155,170 (100.0%) |
Household Income by Mortgage Status in Erie County
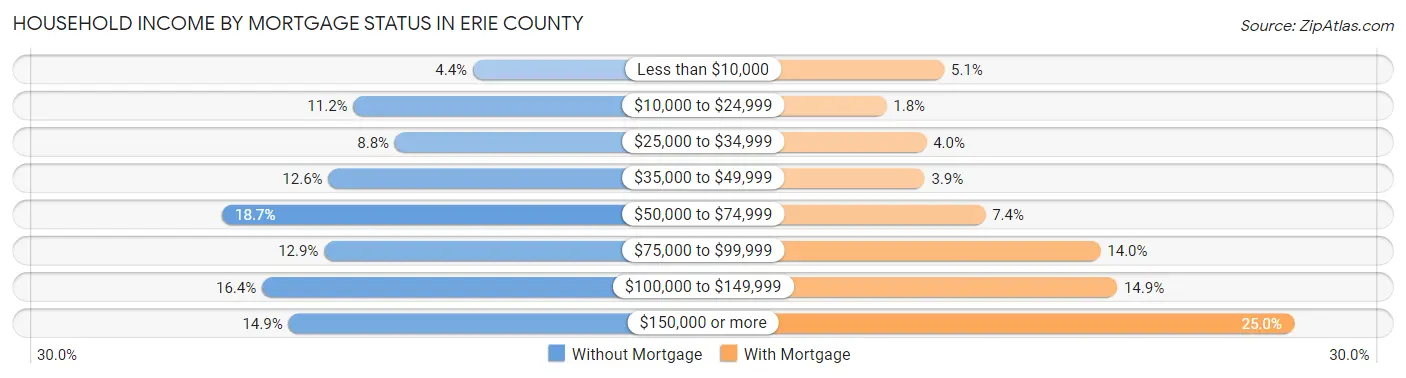
| Household Income | Without Mortgage | With Mortgage |
| Less than $10,000 | 4,807 (4.4%) | 7,859 (5.1%) |
| $10,000 to $24,999 | 12,306 (11.2%) | 2,724 (1.8%) |
| $25,000 to $34,999 | 9,707 (8.8%) | 6,274 (4.0%) |
| $35,000 to $49,999 | 13,875 (12.6%) | 6,110 (3.9%) |
| $50,000 to $74,999 | 20,543 (18.7%) | 11,500 (7.4%) |
| $75,000 to $99,999 | 14,144 (12.9%) | 21,710 (14.0%) |
| $100,000 to $149,999 | 18,046 (16.4%) | 23,176 (14.9%) |
| $150,000 or more | 16,382 (14.9%) | 38,847 (25.0%) |
| Total | 109,810 (100.0%) | 155,170 (100.0%) |
Property Value to Household Income Ratio in Erie County
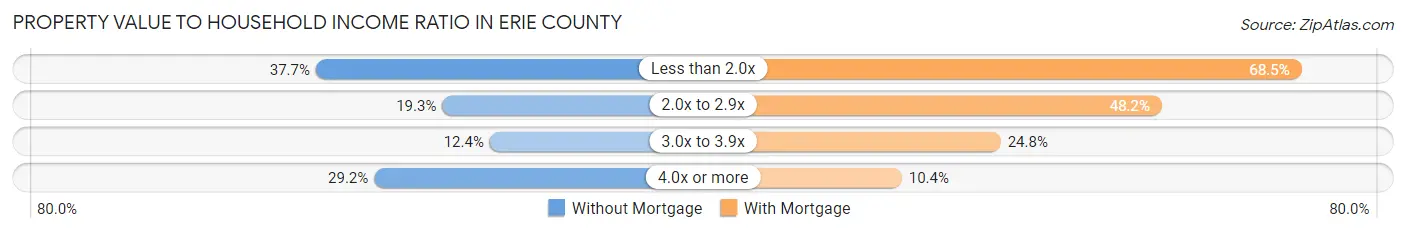
| Value-to-Income Ratio | Without Mortgage | With Mortgage |
| Less than 2.0x | 41,383 (37.7%) | 106,323 (68.5%) |
| 2.0x to 2.9x | 21,211 (19.3%) | 74,815 (48.2%) |
| 3.0x to 3.9x | 13,640 (12.4%) | 38,515 (24.8%) |
| 4.0x or more | 32,089 (29.2%) | 16,195 (10.4%) |
| Total | 109,810 (100.0%) | 155,170 (100.0%) |
Real Estate Taxes by Mortgage Status in Erie County
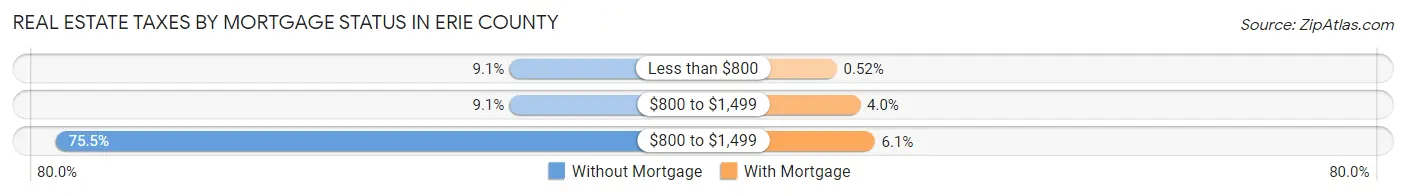
| Property Taxes | Without Mortgage | With Mortgage |
| Less than $800 | 9,933 (9.0%) | 803 (0.5%) |
| $800 to $1,499 | 9,946 (9.1%) | 6,130 (4.0%) |
| $800 to $1,499 | 82,858 (75.5%) | 9,423 (6.1%) |
| Total | 109,810 (100.0%) | 155,170 (100.0%) |
Health & Disability in Erie County
Health Insurance Coverage by Age in Erie County
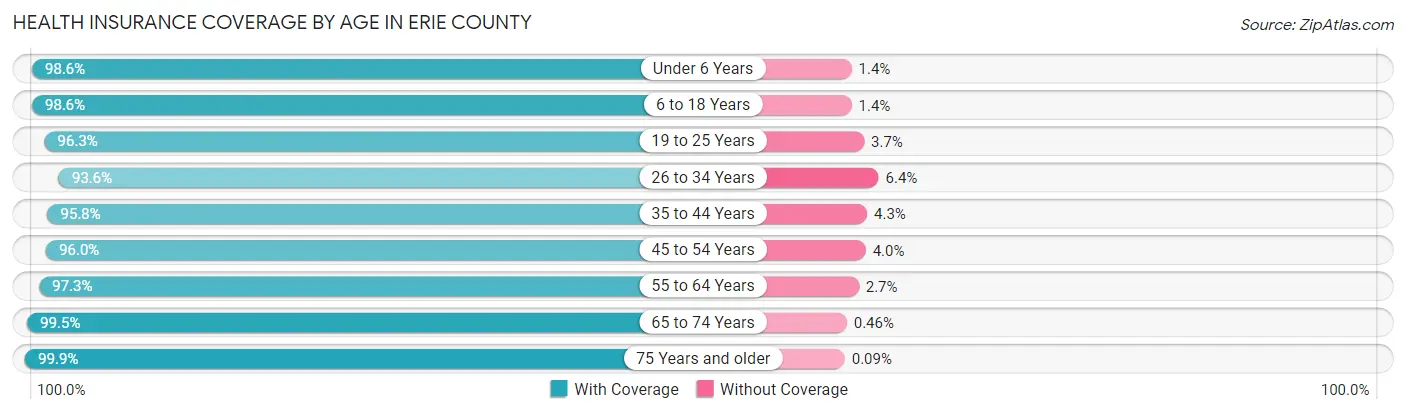
| Age Bracket | With Coverage | Without Coverage |
| Under 6 Years | 60,291 (98.6%) | 834 (1.4%) |
| 6 to 18 Years | 141,173 (98.6%) | 1,941 (1.4%) |
| 19 to 25 Years | 84,553 (96.3%) | 3,250 (3.7%) |
| 26 to 34 Years | 112,009 (93.6%) | 7,649 (6.4%) |
| 35 to 44 Years | 107,406 (95.8%) | 4,772 (4.3%) |
| 45 to 54 Years | 109,026 (96.0%) | 4,533 (4.0%) |
| 55 to 64 Years | 131,013 (97.3%) | 3,629 (2.7%) |
| 65 to 74 Years | 100,092 (99.5%) | 462 (0.5%) |
| 75 Years and older | 70,512 (99.9%) | 63 (0.1%) |
| Total | 916,075 (97.1%) | 27,133 (2.9%) |
Health Insurance Coverage by Citizenship Status in Erie County
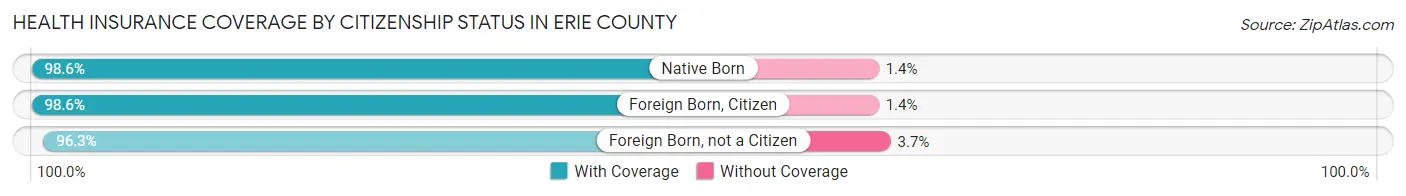
| Citizenship Status | With Coverage | Without Coverage |
| Native Born | 60,291 (98.6%) | 834 (1.4%) |
| Foreign Born, Citizen | 141,173 (98.6%) | 1,941 (1.4%) |
| Foreign Born, not a Citizen | 84,553 (96.3%) | 3,250 (3.7%) |
Health Insurance Coverage by Household Income in Erie County
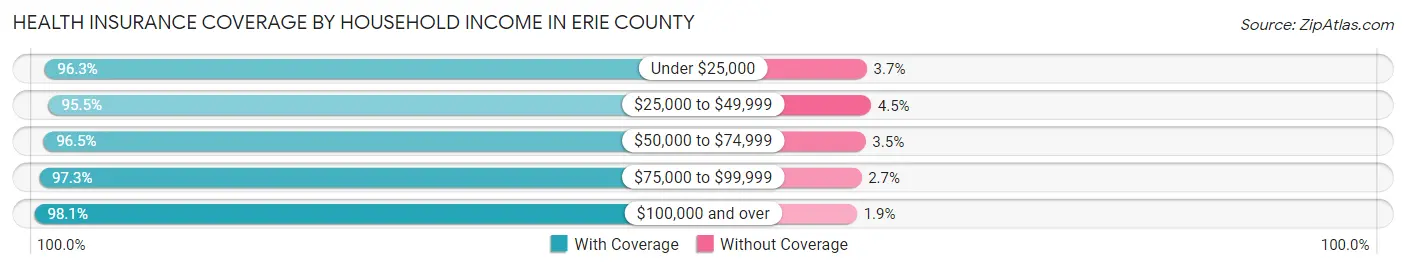
| Household Income | With Coverage | Without Coverage |
| Under $25,000 | 115,841 (96.3%) | 4,479 (3.7%) |
| $25,000 to $49,999 | 144,481 (95.5%) | 6,831 (4.5%) |
| $50,000 to $74,999 | 135,067 (96.5%) | 4,888 (3.5%) |
| $75,000 to $99,999 | 119,355 (97.3%) | 3,314 (2.7%) |
| $100,000 and over | 383,498 (98.1%) | 7,275 (1.9%) |
Public vs Private Health Insurance Coverage by Age in Erie County
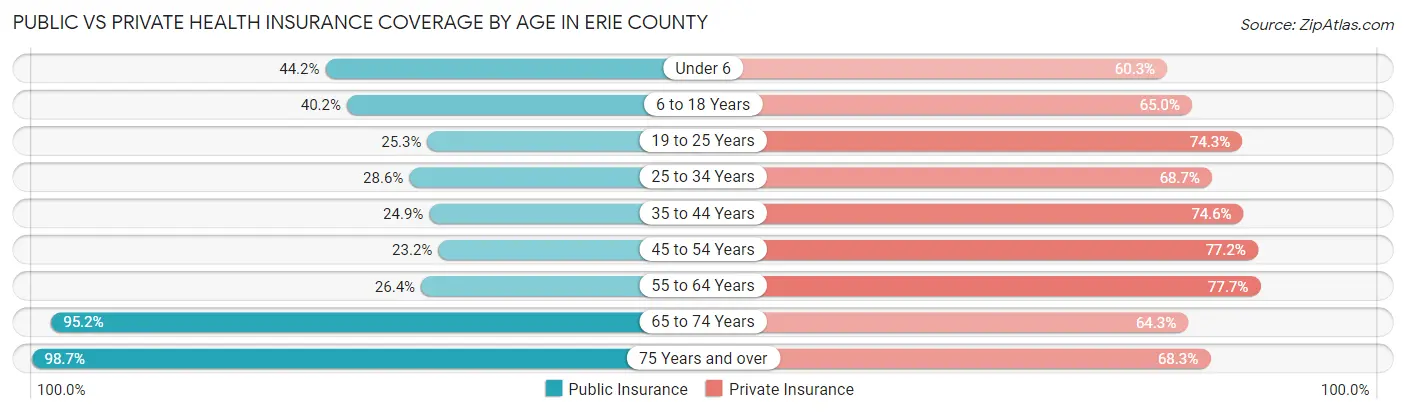
| Age Bracket | Public Insurance | Private Insurance |
| Under 6 | 27,003 (44.2%) | 36,882 (60.3%) |
| 6 to 18 Years | 57,516 (40.2%) | 92,961 (65.0%) |
| 19 to 25 Years | 22,173 (25.3%) | 65,222 (74.3%) |
| 25 to 34 Years | 34,250 (28.6%) | 82,151 (68.6%) |
| 35 to 44 Years | 27,943 (24.9%) | 83,627 (74.6%) |
| 45 to 54 Years | 26,393 (23.2%) | 87,652 (77.2%) |
| 55 to 64 Years | 35,601 (26.4%) | 104,555 (77.6%) |
| 65 to 74 Years | 95,758 (95.2%) | 64,606 (64.2%) |
| 75 Years and over | 69,654 (98.7%) | 48,231 (68.3%) |
| Total | 396,291 (42.0%) | 665,887 (70.6%) |
Disability Status by Sex by Age in Erie County
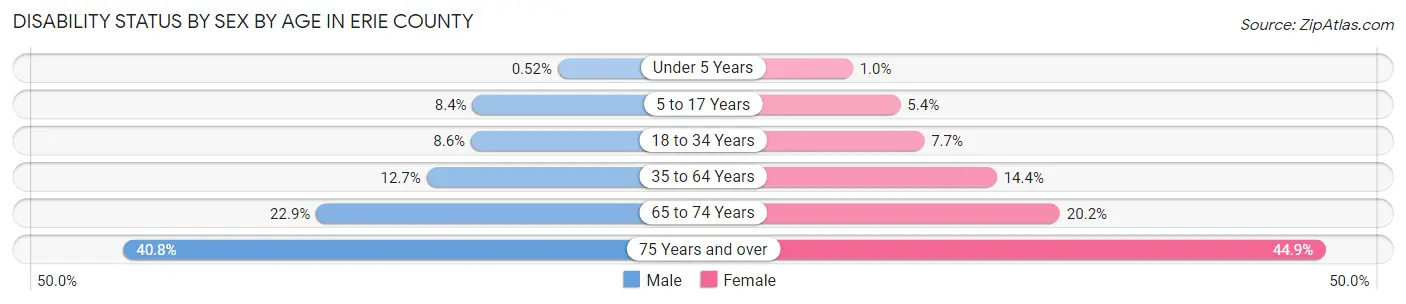
| Age Bracket | Male | Female |
| Under 5 Years | 134 (0.5%) | 250 (1.0%) |
| 5 to 17 Years | 6,062 (8.4%) | 3,752 (5.4%) |
| 18 to 34 Years | 9,486 (8.6%) | 8,411 (7.6%) |
| 35 to 64 Years | 22,395 (12.7%) | 26,441 (14.4%) |
| 65 to 74 Years | 10,808 (22.9%) | 10,814 (20.2%) |
| 75 Years and over | 11,326 (40.8%) | 19,213 (44.9%) |
Disability Class by Sex by Age in Erie County
Disability Class: Hearing Difficulty
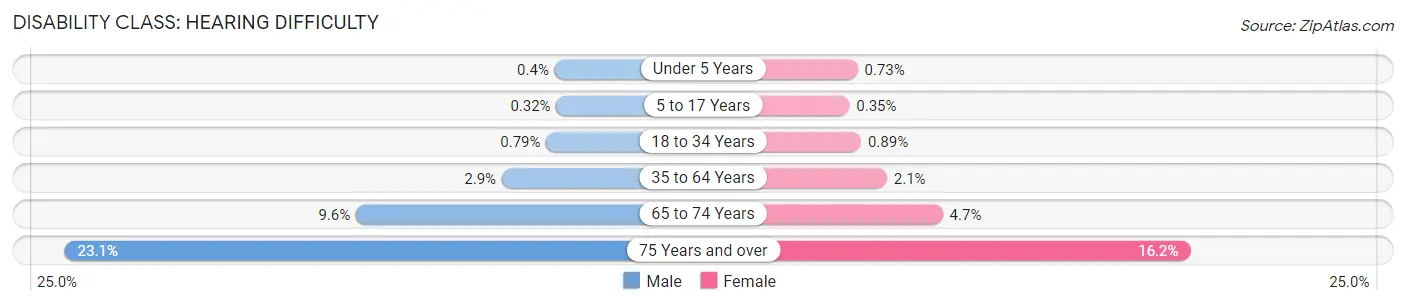
| Age Bracket | Male | Female |
| Under 5 Years | 103 (0.4%) | 180 (0.7%) |
| 5 to 17 Years | 227 (0.3%) | 239 (0.4%) |
| 18 to 34 Years | 875 (0.8%) | 983 (0.9%) |
| 35 to 64 Years | 5,027 (2.9%) | 3,849 (2.1%) |
| 65 to 74 Years | 4,532 (9.6%) | 2,500 (4.7%) |
| 75 Years and over | 6,417 (23.1%) | 6,929 (16.2%) |
Disability Class: Vision Difficulty
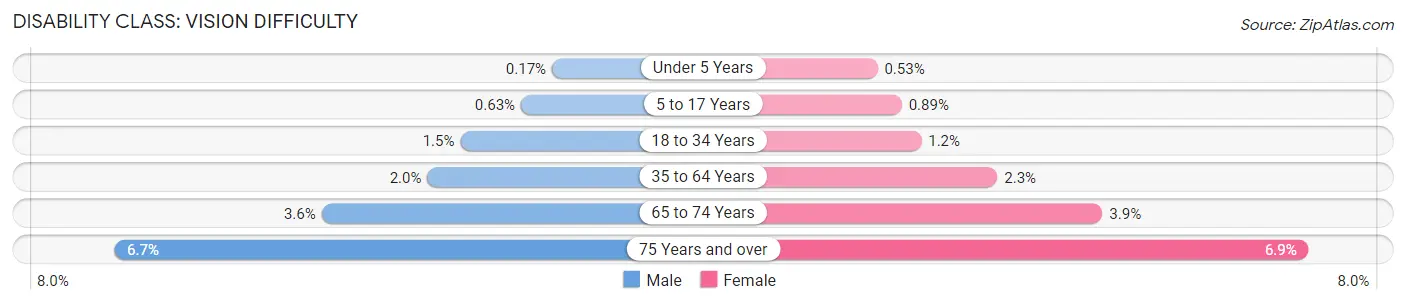
| Age Bracket | Male | Female |
| Under 5 Years | 44 (0.2%) | 131 (0.5%) |
| 5 to 17 Years | 449 (0.6%) | 616 (0.9%) |
| 18 to 34 Years | 1,696 (1.5%) | 1,293 (1.2%) |
| 35 to 64 Years | 3,571 (2.0%) | 4,256 (2.3%) |
| 65 to 74 Years | 1,691 (3.6%) | 2,068 (3.9%) |
| 75 Years and over | 1,850 (6.7%) | 2,969 (6.9%) |
Disability Class: Cognitive Difficulty
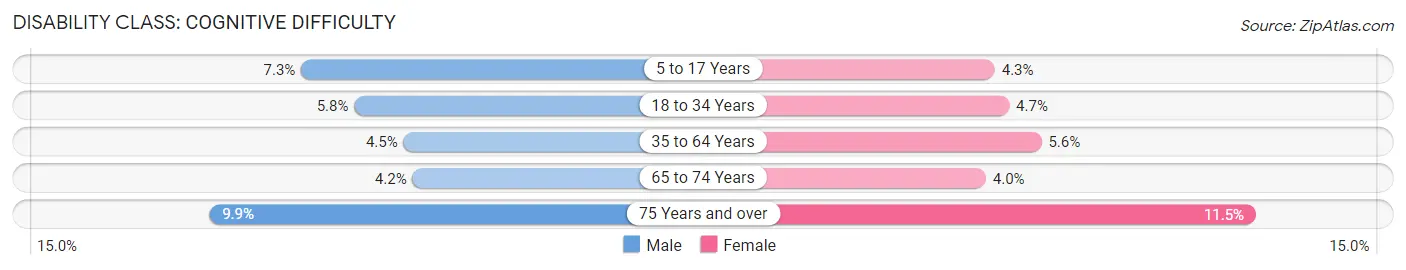
| Age Bracket | Male | Female |
| 5 to 17 Years | 5,246 (7.3%) | 2,934 (4.3%) |
| 18 to 34 Years | 6,432 (5.8%) | 5,126 (4.7%) |
| 35 to 64 Years | 7,852 (4.4%) | 10,227 (5.6%) |
| 65 to 74 Years | 1,980 (4.2%) | 2,145 (4.0%) |
| 75 Years and over | 2,734 (9.9%) | 4,938 (11.5%) |
Disability Class: Ambulatory Difficulty
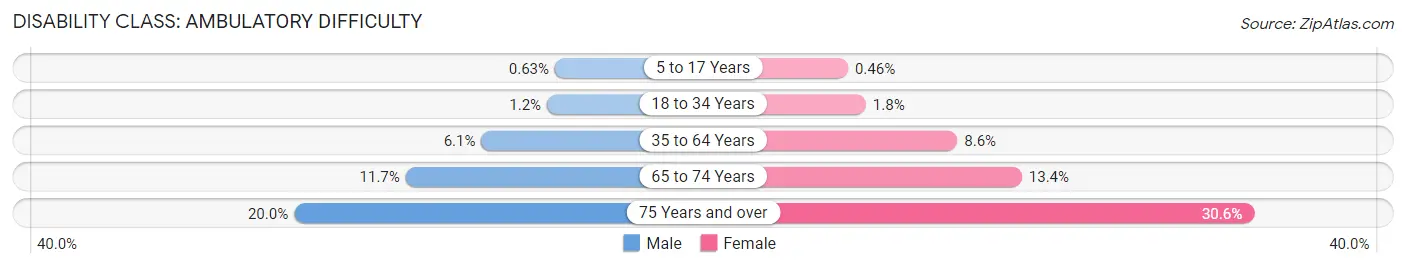
| Age Bracket | Male | Female |
| 5 to 17 Years | 455 (0.6%) | 315 (0.5%) |
| 18 to 34 Years | 1,344 (1.2%) | 1,969 (1.8%) |
| 35 to 64 Years | 10,755 (6.1%) | 15,780 (8.6%) |
| 65 to 74 Years | 5,516 (11.7%) | 7,145 (13.4%) |
| 75 Years and over | 5,546 (20.0%) | 13,108 (30.6%) |
Disability Class: Self-Care Difficulty
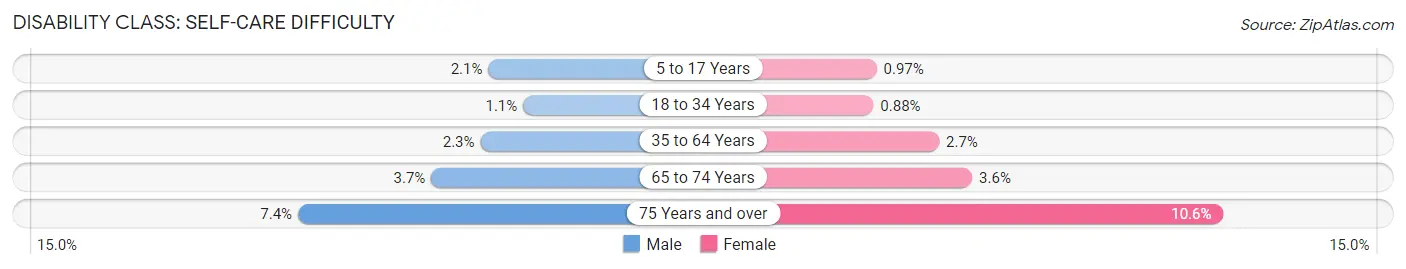
| Age Bracket | Male | Female |
| 5 to 17 Years | 1,504 (2.1%) | 666 (1.0%) |
| 18 to 34 Years | 1,243 (1.1%) | 967 (0.9%) |
| 35 to 64 Years | 4,076 (2.3%) | 4,985 (2.7%) |
| 65 to 74 Years | 1,734 (3.7%) | 1,941 (3.6%) |
| 75 Years and over | 2,049 (7.4%) | 4,548 (10.6%) |
Technology Access in Erie County
Computing Device Access in Erie County
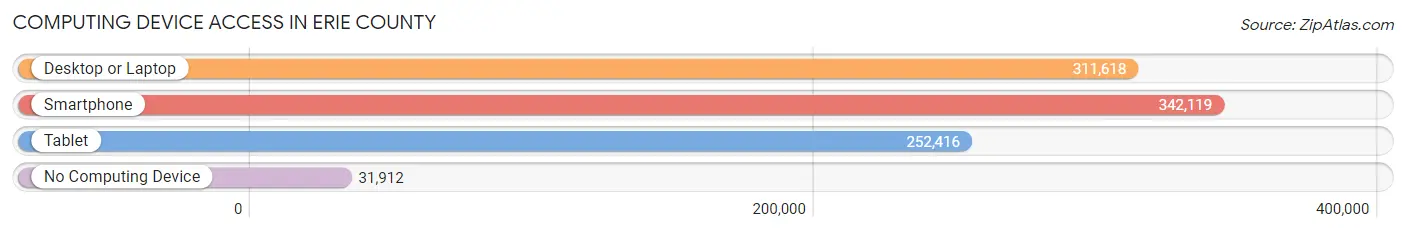
| Device Type | # Households | % Households |
| Desktop or Laptop | 311,618 | 76.6% |
| Smartphone | 342,119 | 84.2% |
| Tablet | 252,416 | 62.1% |
| No Computing Device | 31,912 | 7.9% |
| Total | 406,547 | 100.0% |
Internet Access in Erie County
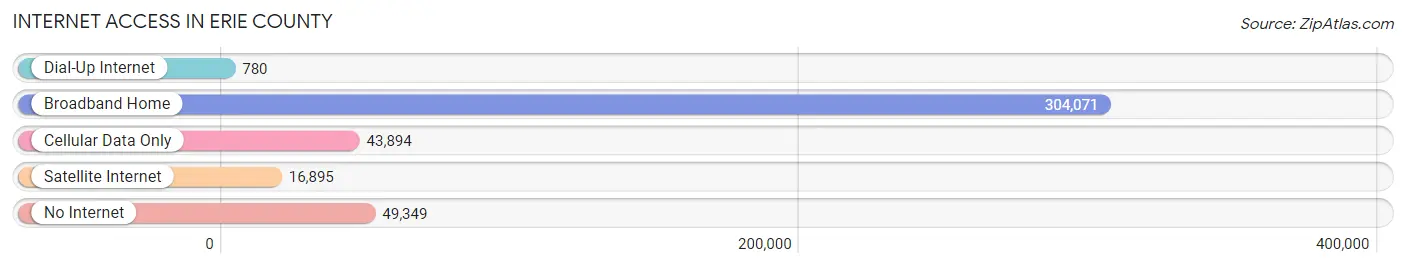
| Internet Type | # Households | % Households |
| Dial-Up Internet | 780 | 0.2% |
| Broadband Home | 304,071 | 74.8% |
| Cellular Data Only | 43,894 | 10.8% |
| Satellite Internet | 16,895 | 4.2% |
| No Internet | 49,349 | 12.1% |
| Total | 406,547 | 100.0% |
Erie County Summary
Erie County, New York is located in the western part of the state, along the shores of Lake Erie. It is the most populous county in the state, with a population of 919,040 in 2019. The county seat is Buffalo, the second-largest city in the state.
Geography
Erie County is located in the western part of New York State, along the shores of Lake Erie. It is bordered by Niagara County to the north, Genesee County to the east, Wyoming County to the south, and Chautauqua County to the west. The county covers an area of 1,058 square miles, making it the fourth-largest county in the state. The terrain is mostly flat, with some rolling hills in the northern and eastern parts of the county. The highest point in the county is the summit of South Hill, which has an elevation of 1,890 feet.
The county is home to several bodies of water, including Lake Erie, the Buffalo River, Cazenovia Creek, and Eighteenmile Creek. The Buffalo River is the largest river in the county, flowing through the city of Buffalo and emptying into Lake Erie.
Economy
Erie County has a diverse economy, with a mix of manufacturing, services, and agriculture. The county is home to several major employers, including the University at Buffalo, Kaleida Health, M&T Bank, and the Buffalo Niagara Medical Campus.
Manufacturing is a major part of the county's economy, with companies such as General Motors, Ford, and Delphi Automotive all having a presence in the county. The county is also home to several food processing companies, such as Rich Products Corporation and Tops Markets.
Agriculture is also an important part of the county's economy, with dairy farming being the most common type of farming. Other crops grown in the county include corn, soybeans, wheat, and hay.
Demographics
As of 2019, the population of Erie County was 919,040, making it the most populous county in the state. The population is fairly diverse, with the largest racial/ethnic groups being White (63.2%), African American (20.2%), Hispanic or Latino (13.2%), and Asian (3.2%).
The median household income in the county is $51,945, and the median home value is $133,400. The poverty rate is 13.3%, and the unemployment rate is 4.2%.
The largest cities in the county are Buffalo (258,959), Amherst (122,366), and Tonawanda (78,155). The county is also home to several smaller towns and villages, such as Cheektowaga, West Seneca, and Hamburg.
Conclusion
Erie County, New York is a diverse and vibrant county located in the western part of the state. It is the most populous county in the state, with a population of 919,040 in 2019. The county has a diverse economy, with a mix of manufacturing, services, and agriculture. The population is fairly diverse, with the largest racial/ethnic groups being White, African American, Hispanic or Latino, and Asian. The median household income in the county is $51,945, and the median home value is $133,400. The largest cities in the county are Buffalo, Amherst, and Tonawanda.
Common Questions
What is Per Capita Income in Erie County?
Per Capita income in Erie County is $39,703.
What is the Median Family Income in Erie County?
Median Family Income in Erie County is $92,038.
What is the Median Household income in Erie County?
Median Household Income in Erie County is $68,014.
What is Income or Wage Gap in Erie County?
Income or Wage Gap in Erie County is 22.8%.
Women in Erie County earn 77.2 cents for every dollar earned by a man.
What is Family Income Deficit in Erie County?
Family Income Deficit in Erie County is $10,930.
Families that are below poverty line in Erie County earn $10,930 less on average than the poverty threshold level.
What is Inequality or Gini Index in Erie County?
Inequality or Gini Index in Erie County is 0.46.
What is the Total Population of Erie County?
Total Population of Erie County is 951,232.
What is the Total Male Population of Erie County?
Total Male Population of Erie County is 463,713.
What is the Total Female Population of Erie County?
Total Female Population of Erie County is 487,519.
What is the Ratio of Males per 100 Females in Erie County?
There are 95.12 Males per 100 Females in Erie County.
What is the Ratio of Females per 100 Males in Erie County?
There are 105.13 Females per 100 Males in Erie County.
What is the Median Population Age in Erie County?
Median Population Age in Erie County is 40.1 Years.
What is the Average Family Size in Erie County
Average Family Size in Erie County is 3.0 People.
What is the Average Household Size in Erie County
Average Household Size in Erie County is 2.3 People.
How Large is the Labor Force in Erie County?
There are 490,700 People in the Labor Forcein in Erie County.
What is the Percentage of People in the Labor Force in Erie County?
62.7% of People are in the Labor Force in Erie County.
What is the Unemployment Rate in Erie County?
Unemployment Rate in Erie County is 5.0%.