Chautauqua County, NY Map & Demographics
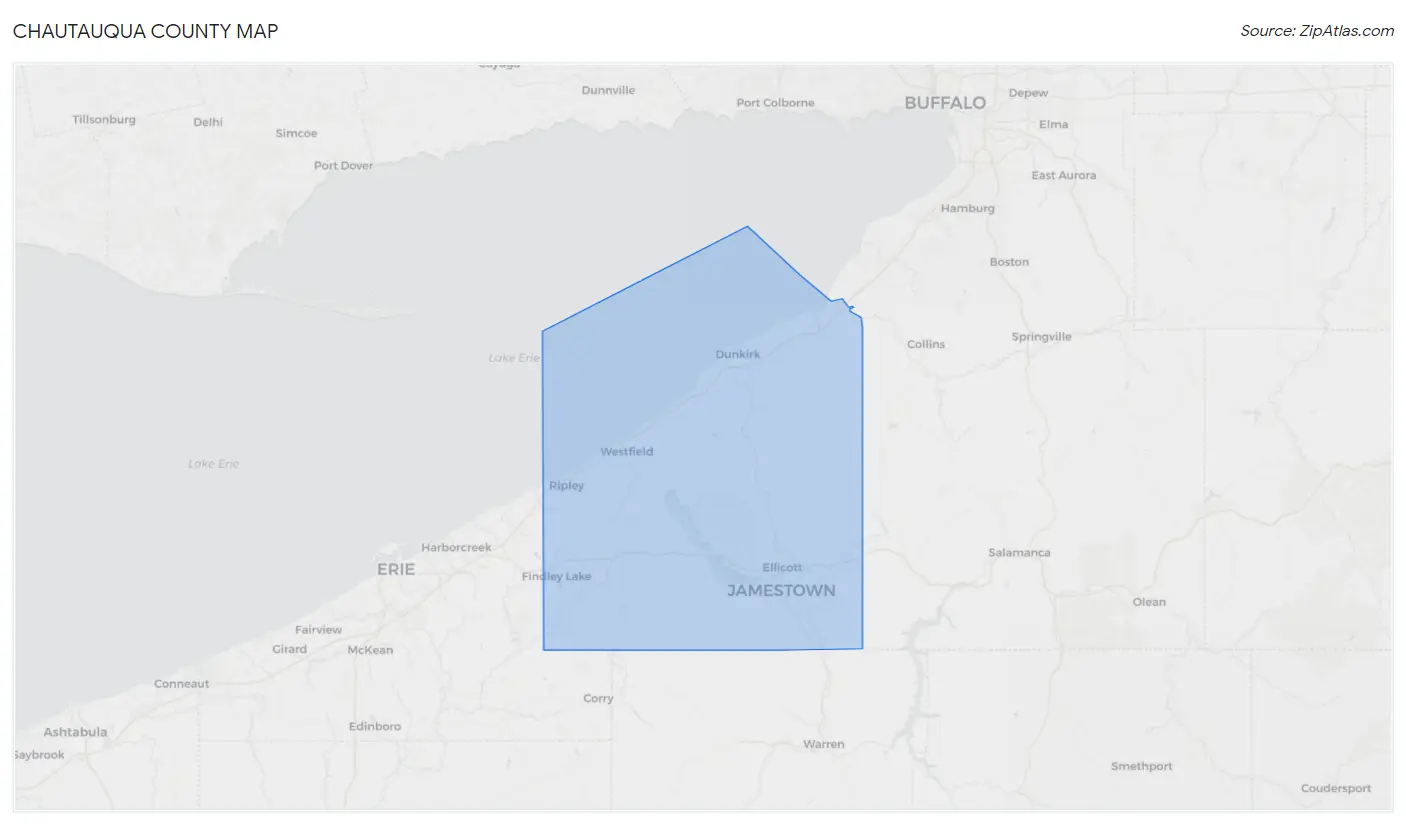
Chautauqua County Map
Chautauqua County Overview
$30,718
PER CAPITA INCOME
$73,650
AVG FAMILY INCOME
$54,625
AVG HOUSEHOLD INCOME
28.8%
WAGE / INCOME GAP [ % ]
71.2¢/ $1
WAGE / INCOME GAP [ $ ]
$10,592
FAMILY INCOME DEFICIT
0.45
INEQUALITY / GINI INDEX
127,440
TOTAL POPULATION
63,496
MALE POPULATION
63,944
FEMALE POPULATION
99.30
MALES / 100 FEMALES
100.71
FEMALES / 100 MALES
42.8
MEDIAN AGE
2.9
AVG FAMILY SIZE
2.3
AVG HOUSEHOLD SIZE
58,369
LABOR FORCE [ PEOPLE ]
55.7%
PERCENT IN LABOR FORCE
5.4%
UNEMPLOYMENT RATE
Chautauqua County Area Codes
Income in Chautauqua County
Income Overview in Chautauqua County
Per Capita Income in Chautauqua County is $30,718, while median incomes of families and households are $73,650 and $54,625 respectively.
| Characteristic | Number | Measure |
| Per Capita Income | 127,440 | $30,718 |
| Median Family Income | 31,591 | $73,650 |
| Mean Family Income | 31,591 | $88,111 |
| Median Household Income | 53,405 | $54,625 |
| Mean Household Income | 53,405 | $71,588 |
| Income Deficit | 31,591 | $10,592 |
| Wage / Income Gap (%) | 127,440 | 28.82% |
| Wage / Income Gap ($) | 127,440 | 71.18¢ per $1 |
| Gini / Inequality Index | 127,440 | 0.45 |
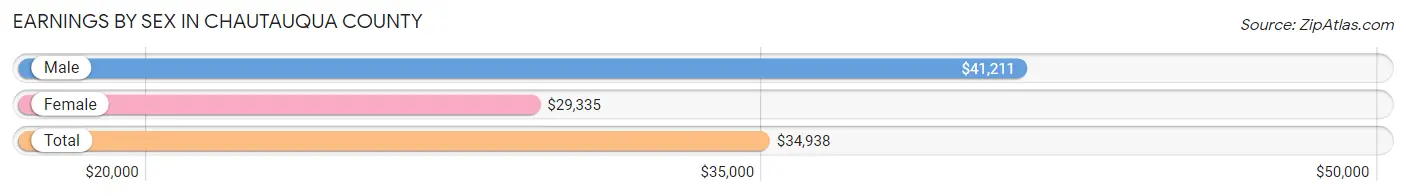
Earnings by Sex in Chautauqua County
Average Earnings in Chautauqua County are $34,938, $41,211 for men and $29,335 for women, a difference of 28.8%.
| Sex | Number | Average Earnings |
| Male | 32,074 (51.9%) | $41,211 |
| Female | 29,661 (48.0%) | $29,335 |
| Total | 61,735 (100.0%) | $34,938 |
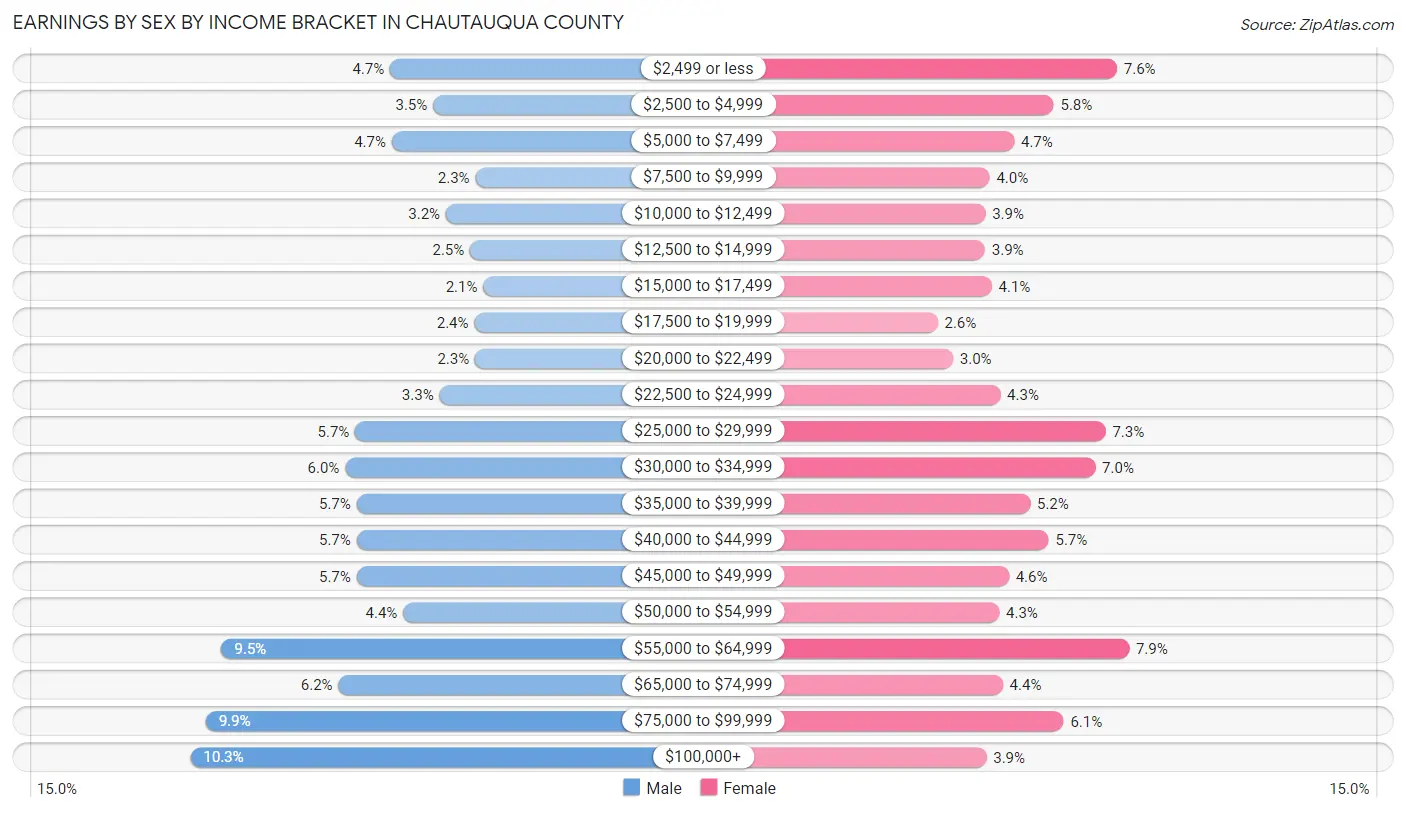
Earnings by Sex by Income Bracket in Chautauqua County
The most common earnings brackets in Chautauqua County are $100,000+ for men (3,316 | 10.3%) and $55,000 to $64,999 for women (2,351 | 7.9%).
| Income | Male | Female |
| $2,499 or less | 1,516 (4.7%) | 2,252 (7.6%) |
| $2,500 to $4,999 | 1,130 (3.5%) | 1,723 (5.8%) |
| $5,000 to $7,499 | 1,502 (4.7%) | 1,394 (4.7%) |
| $7,500 to $9,999 | 746 (2.3%) | 1,188 (4.0%) |
| $10,000 to $12,499 | 1,012 (3.2%) | 1,153 (3.9%) |
| $12,500 to $14,999 | 795 (2.5%) | 1,151 (3.9%) |
| $15,000 to $17,499 | 678 (2.1%) | 1,208 (4.1%) |
| $17,500 to $19,999 | 757 (2.4%) | 756 (2.5%) |
| $20,000 to $22,499 | 750 (2.3%) | 883 (3.0%) |
| $22,500 to $24,999 | 1,070 (3.3%) | 1,279 (4.3%) |
| $25,000 to $29,999 | 1,830 (5.7%) | 2,157 (7.3%) |
| $30,000 to $34,999 | 1,922 (6.0%) | 2,069 (7.0%) |
| $35,000 to $39,999 | 1,817 (5.7%) | 1,529 (5.1%) |
| $40,000 to $44,999 | 1,820 (5.7%) | 1,681 (5.7%) |
| $45,000 to $49,999 | 1,819 (5.7%) | 1,350 (4.5%) |
| $50,000 to $54,999 | 1,398 (4.4%) | 1,269 (4.3%) |
| $55,000 to $64,999 | 3,037 (9.5%) | 2,351 (7.9%) |
| $65,000 to $74,999 | 1,981 (6.2%) | 1,298 (4.4%) |
| $75,000 to $99,999 | 3,178 (9.9%) | 1,806 (6.1%) |
| $100,000+ | 3,316 (10.3%) | 1,164 (3.9%) |
| Total | 32,074 (100.0%) | 29,661 (100.0%) |
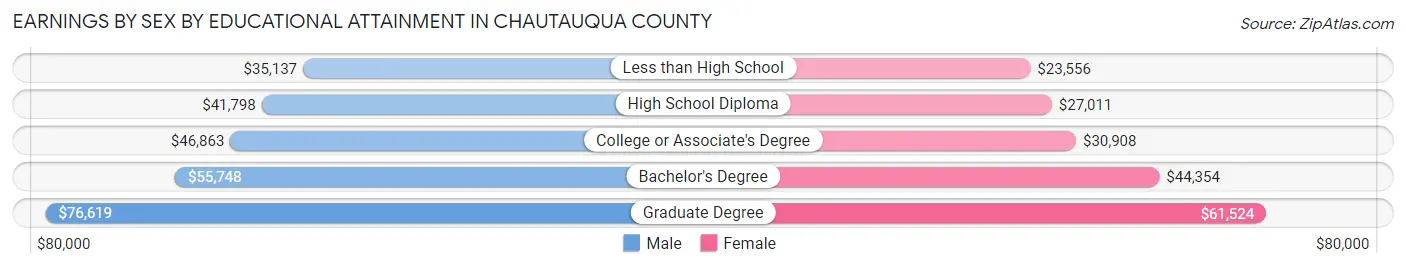
Earnings by Sex by Educational Attainment in Chautauqua County
Average earnings in Chautauqua County are $46,576 for men and $34,766 for women, a difference of 25.4%. Men with an educational attainment of graduate degree enjoy the highest average annual earnings of $76,619, while those with less than high school education earn the least with $35,137. Women with an educational attainment of graduate degree earn the most with the average annual earnings of $61,524, while those with less than high school education have the smallest earnings of $23,556.
| Educational Attainment | Male Income | Female Income |
| Less than High School | $35,137 | $23,556 |
| High School Diploma | $41,798 | $27,011 |
| College or Associate's Degree | $46,863 | $30,908 |
| Bachelor's Degree | $55,748 | $44,354 |
| Graduate Degree | $76,619 | $61,524 |
| Total | $46,576 | $34,766 |
Family Income in Chautauqua County
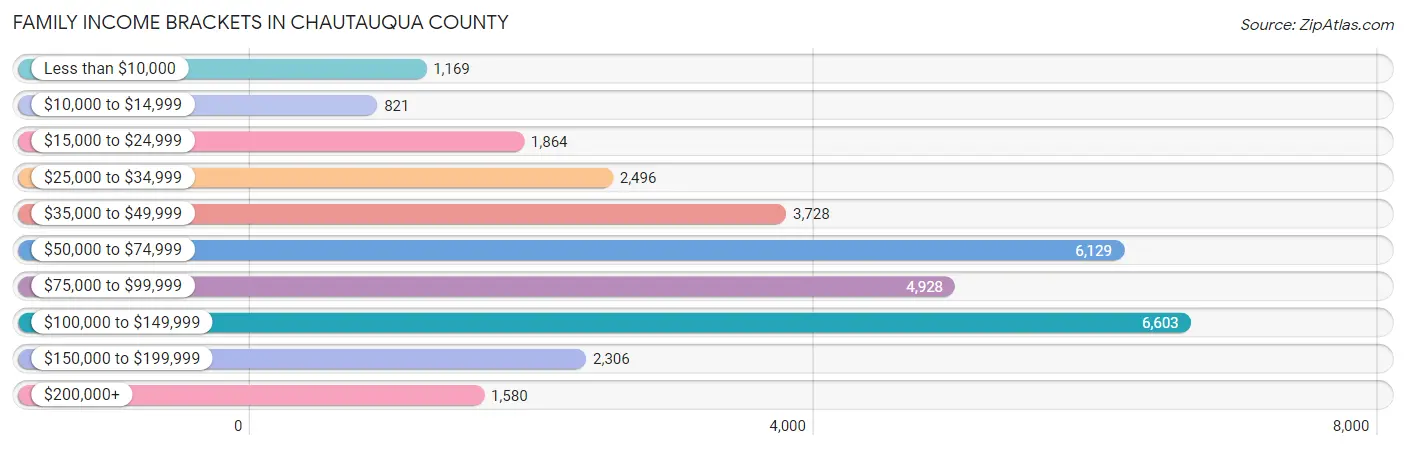
Family Income Brackets in Chautauqua County
According to the Chautauqua County family income data, there are 6,603 families falling into the $100,000 to $149,999 income range, which is the most common income bracket and makes up 20.9% of all families. Conversely, the $10,000 to $14,999 income bracket is the least frequent group with only 821 families (2.6%) belonging to this category.
| Income Bracket | # Families | % Families |
| Less than $10,000 | 1,169 | 3.7% |
| $10,000 to $14,999 | 821 | 2.6% |
| $15,000 to $24,999 | 1,864 | 5.9% |
| $25,000 to $34,999 | 2,496 | 7.9% |
| $35,000 to $49,999 | 3,728 | 11.8% |
| $50,000 to $74,999 | 6,129 | 19.4% |
| $75,000 to $99,999 | 4,928 | 15.6% |
| $100,000 to $149,999 | 6,603 | 20.9% |
| $150,000 to $199,999 | 2,306 | 7.3% |
| $200,000+ | 1,580 | 5.0% |
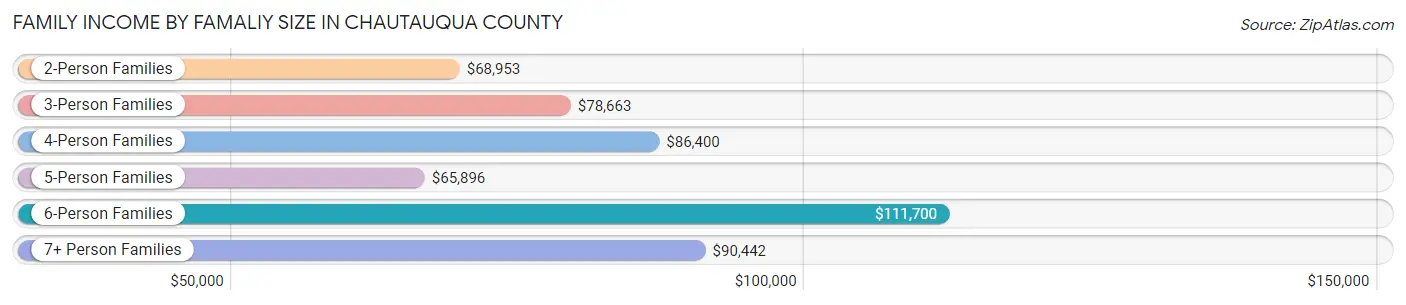
Family Income by Famaliy Size in Chautauqua County
6-person families (694 | 2.2%) account for the highest median family income in Chautauqua County with $111,700 per family, while 2-person families (16,771 | 53.1%) have the highest median income of $34,476 per family member.
| Income Bracket | # Families | Median Income |
| 2-Person Families | 16,771 (53.1%) | $68,953 |
| 3-Person Families | 6,977 (22.1%) | $78,663 |
| 4-Person Families | 4,612 (14.6%) | $86,400 |
| 5-Person Families | 2,068 (6.6%) | $65,896 |
| 6-Person Families | 694 (2.2%) | $111,700 |
| 7+ Person Families | 469 (1.5%) | $90,442 |
| Total | 31,591 (100.0%) | $73,650 |
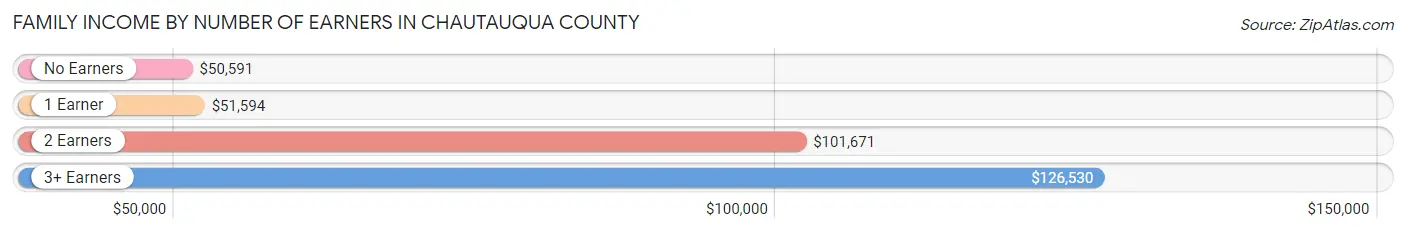
Family Income by Number of Earners in Chautauqua County
The median family income in Chautauqua County is $73,650, with families comprising 3+ earners (2,982) having the highest median family income of $126,530, while families with no earners (6,524) have the lowest median family income of $50,591, accounting for 9.4% and 20.6% of families, respectively.
| Number of Earners | # Families | Median Income |
| No Earners | 6,524 (20.6%) | $50,591 |
| 1 Earner | 10,759 (34.1%) | $51,594 |
| 2 Earners | 11,326 (35.8%) | $101,671 |
| 3+ Earners | 2,982 (9.4%) | $126,530 |
| Total | 31,591 (100.0%) | $73,650 |
Household Income in Chautauqua County
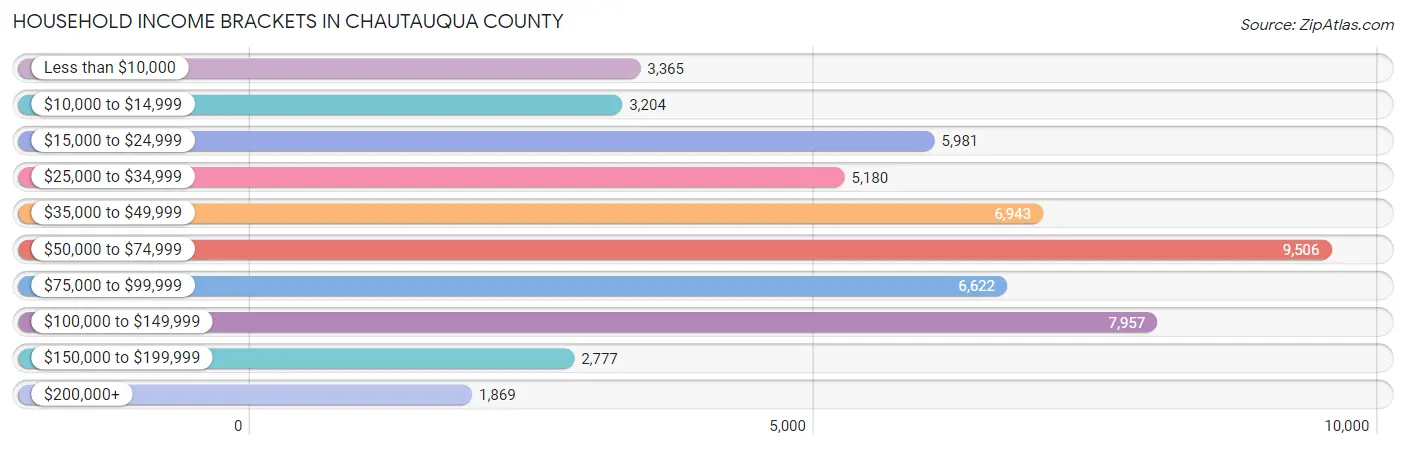
Household Income Brackets in Chautauqua County
With 9,506 households falling in the category, the $50,000 to $74,999 income range is the most frequent in Chautauqua County, accounting for 17.8% of all households. In contrast, only 1,869 households (3.5%) fall into the $200,000+ income bracket, making it the least populous group.
| Income Bracket | # Households | % Households |
| Less than $10,000 | 3,365 | 6.3% |
| $10,000 to $14,999 | 3,204 | 6.0% |
| $15,000 to $24,999 | 5,981 | 11.2% |
| $25,000 to $34,999 | 5,180 | 9.7% |
| $35,000 to $49,999 | 6,943 | 13.0% |
| $50,000 to $74,999 | 9,506 | 17.8% |
| $75,000 to $99,999 | 6,622 | 12.4% |
| $100,000 to $149,999 | 7,957 | 14.9% |
| $150,000 to $199,999 | 2,777 | 5.2% |
| $200,000+ | 1,869 | 3.5% |
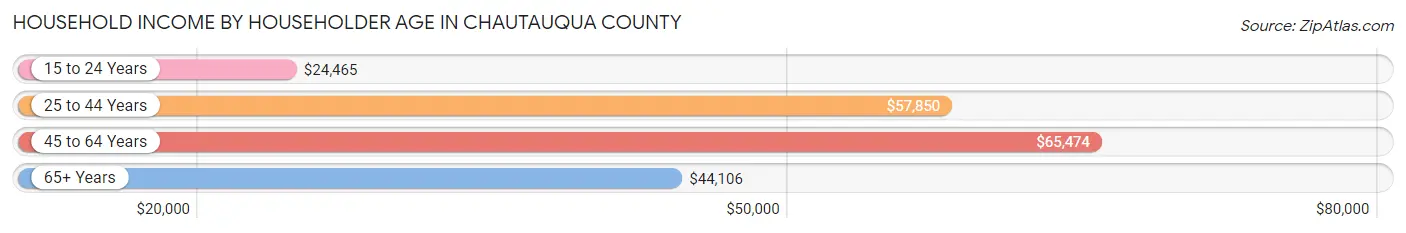
Household Income by Householder Age in Chautauqua County
The median household income in Chautauqua County is $54,625, with the highest median household income of $65,474 found in the 45 to 64 years age bracket for the primary householder. A total of 20,684 households (38.7%) fall into this category. Meanwhile, the 15 to 24 years age bracket for the primary householder has the lowest median household income of $24,465, with 1,805 households (3.4%) in this group.
| Income Bracket | # Households | Median Income |
| 15 to 24 Years | 1,805 (3.4%) | $24,465 |
| 25 to 44 Years | 13,942 (26.1%) | $57,850 |
| 45 to 64 Years | 20,684 (38.7%) | $65,474 |
| 65+ Years | 16,974 (31.8%) | $44,106 |
| Total | 53,405 (100.0%) | $54,625 |
Poverty in Chautauqua County
Income Below Poverty by Sex and Age in Chautauqua County
With 16.3% poverty level for males and 18.7% for females among the residents of Chautauqua County, under 5 year old males and 5 year old females are the most vulnerable to poverty, with 914 males (27.8%) and 230 females (38.1%) in their respective age groups living below the poverty level.

| Age Bracket | Male | Female |
| Under 5 Years | 914 (27.8%) | 1,061 (34.3%) |
| 5 Years | 157 (22.4%) | 230 (38.1%) |
| 6 to 11 Years | 1,168 (27.2%) | 953 (22.9%) |
| 12 to 14 Years | 544 (25.7%) | 429 (19.8%) |
| 15 Years | 120 (13.4%) | 88 (16.4%) |
| 16 and 17 Years | 260 (17.7%) | 328 (20.3%) |
| 18 to 24 Years | 1,211 (24.2%) | 1,592 (32.8%) |
| 25 to 34 Years | 1,259 (17.8%) | 1,699 (24.9%) |
| 35 to 44 Years | 1,032 (14.6%) | 1,220 (17.7%) |
| 45 to 54 Years | 1,108 (14.7%) | 1,253 (16.5%) |
| 55 to 64 Years | 1,102 (11.6%) | 1,361 (14.3%) |
| 65 to 74 Years | 663 (8.9%) | 749 (9.7%) |
| 75 Years and over | 404 (9.1%) | 608 (10.0%) |
| Total | 9,942 (16.3%) | 11,571 (18.7%) |
Income Above Poverty by Sex and Age in Chautauqua County
According to the poverty statistics in Chautauqua County, males aged 65 to 74 years and females aged 65 to 74 years are the age groups that are most secure financially, with 91.1% of males and 90.3% of females in these age groups living above the poverty line.
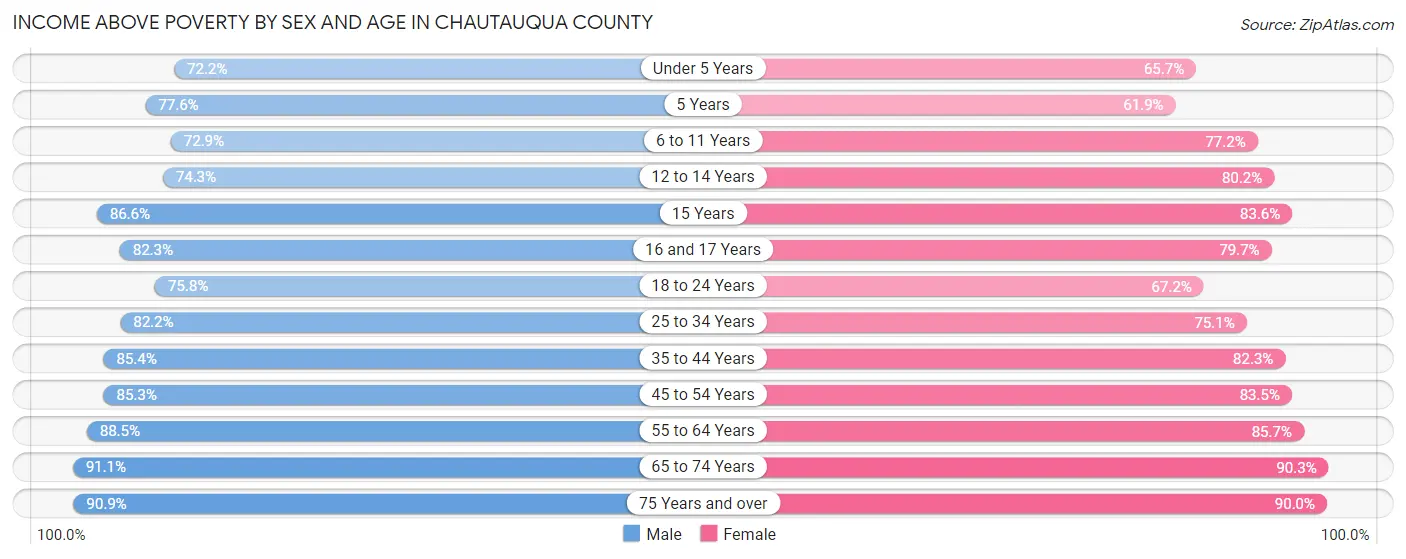
| Age Bracket | Male | Female |
| Under 5 Years | 2,379 (72.2%) | 2,036 (65.7%) |
| 5 Years | 543 (77.6%) | 374 (61.9%) |
| 6 to 11 Years | 3,134 (72.9%) | 3,217 (77.1%) |
| 12 to 14 Years | 1,575 (74.3%) | 1,742 (80.2%) |
| 15 Years | 775 (86.6%) | 448 (83.6%) |
| 16 and 17 Years | 1,211 (82.3%) | 1,291 (79.7%) |
| 18 to 24 Years | 3,792 (75.8%) | 3,256 (67.2%) |
| 25 to 34 Years | 5,825 (82.2%) | 5,126 (75.1%) |
| 35 to 44 Years | 6,012 (85.4%) | 5,668 (82.3%) |
| 45 to 54 Years | 6,451 (85.3%) | 6,345 (83.5%) |
| 55 to 64 Years | 8,440 (88.4%) | 8,181 (85.7%) |
| 65 to 74 Years | 6,757 (91.1%) | 6,999 (90.3%) |
| 75 Years and over | 4,049 (90.9%) | 5,490 (90.0%) |
| Total | 50,943 (83.7%) | 50,173 (81.3%) |
Income Below Poverty Among Married-Couple Families in Chautauqua County
The poverty statistics for married-couple families in Chautauqua County show that 5.2% or 1,196 of the total 22,942 families live below the poverty line. Families with 5 or more children have the highest poverty rate of 22.7%, comprising of 60 families. On the other hand, families with no children have the lowest poverty rate of 3.1%, which includes 465 families.
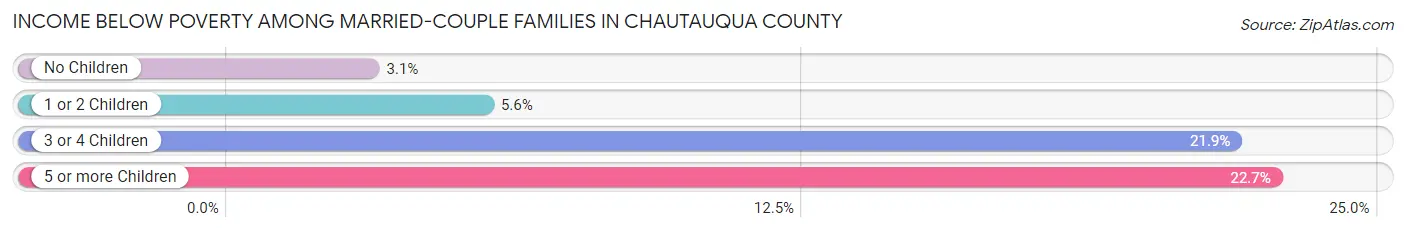
| Children | Above Poverty | Below Poverty |
| No Children | 14,656 (96.9%) | 465 (3.1%) |
| 1 or 2 Children | 5,684 (94.4%) | 335 (5.6%) |
| 3 or 4 Children | 1,202 (78.1%) | 336 (21.8%) |
| 5 or more Children | 204 (77.3%) | 60 (22.7%) |
| Total | 21,746 (94.8%) | 1,196 (5.2%) |
Income Below Poverty Among Single-Parent Households in Chautauqua County
According to the poverty data in Chautauqua County, 13.7% or 340 single-father households and 34.2% or 2,109 single-mother households are living below the poverty line. Among single-father households, those with 3 or 4 children have the highest poverty rate, with 56 households (29.5%) experiencing poverty. Likewise, among single-mother households, those with 5 or more children have the highest poverty rate, with 67 households (100.0%) falling below the poverty line.
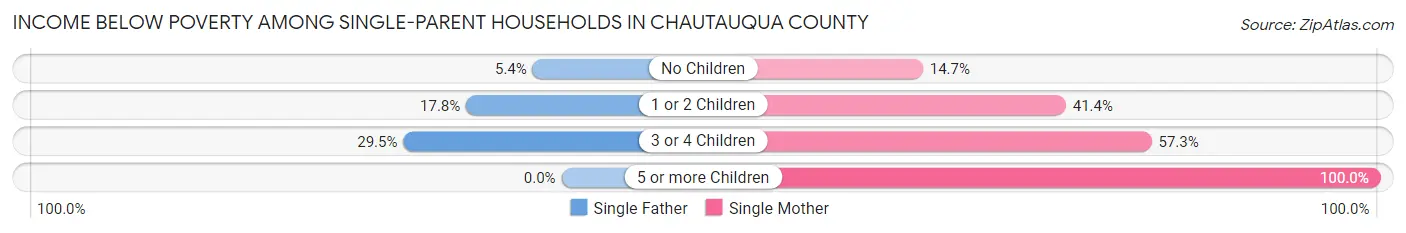
| Children | Single Father | Single Mother |
| No Children | 54 (5.4%) | 342 (14.7%) |
| 1 or 2 Children | 230 (17.8%) | 1,200 (41.4%) |
| 3 or 4 Children | 56 (29.5%) | 500 (57.3%) |
| 5 or more Children | 0 (0.0%) | 67 (100.0%) |
| Total | 340 (13.7%) | 2,109 (34.2%) |
Income Below Poverty Among Married-Couple vs Single-Parent Households in Chautauqua County
The poverty data for Chautauqua County shows that 1,196 of the married-couple family households (5.2%) and 2,449 of the single-parent households (28.3%) are living below the poverty level. Within the married-couple family households, those with 5 or more children have the highest poverty rate, with 60 households (22.7%) falling below the poverty line. Among the single-parent households, those with 5 or more children have the highest poverty rate, with 67 household (100.0%) living below poverty.
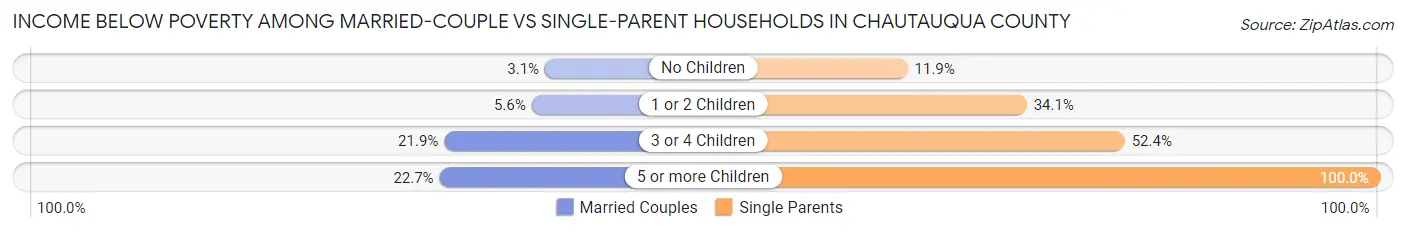
| Children | Married-Couple Families | Single-Parent Households |
| No Children | 465 (3.1%) | 396 (11.9%) |
| 1 or 2 Children | 335 (5.6%) | 1,430 (34.1%) |
| 3 or 4 Children | 336 (21.8%) | 556 (52.3%) |
| 5 or more Children | 60 (22.7%) | 67 (100.0%) |
| Total | 1,196 (5.2%) | 2,449 (28.3%) |
Race in Chautauqua County
The most populous races in Chautauqua County are White / Caucasian (113,168 | 88.8%), Hispanic or Latino (10,333 | 8.1%), and Two or more Races (5,516 | 4.3%).
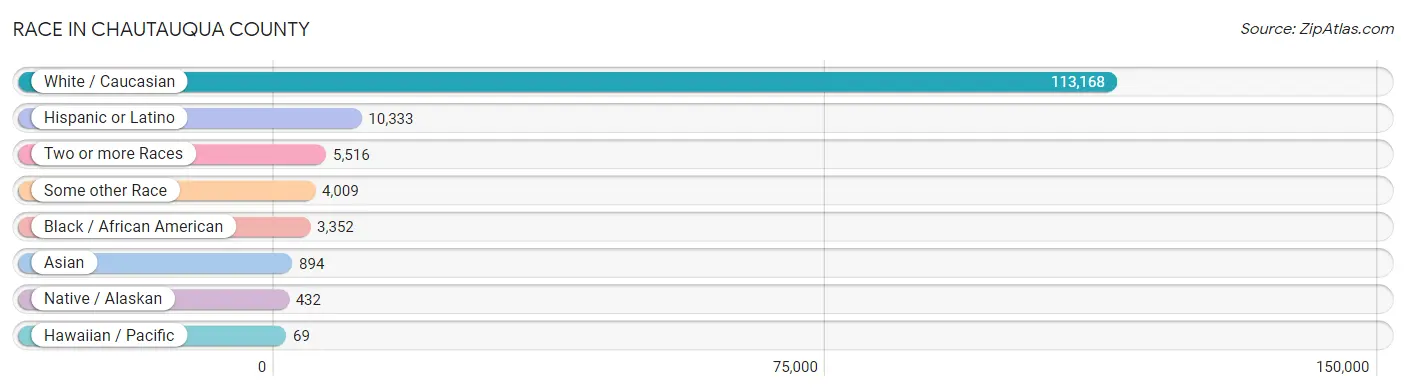
| Race | # Population | % Population |
| Asian | 894 | 0.7% |
| Black / African American | 3,352 | 2.6% |
| Hawaiian / Pacific | 69 | 0.1% |
| Hispanic or Latino | 10,333 | 8.1% |
| Native / Alaskan | 432 | 0.3% |
| White / Caucasian | 113,168 | 88.8% |
| Two or more Races | 5,516 | 4.3% |
| Some other Race | 4,009 | 3.2% |
| Total | 127,440 | 100.0% |
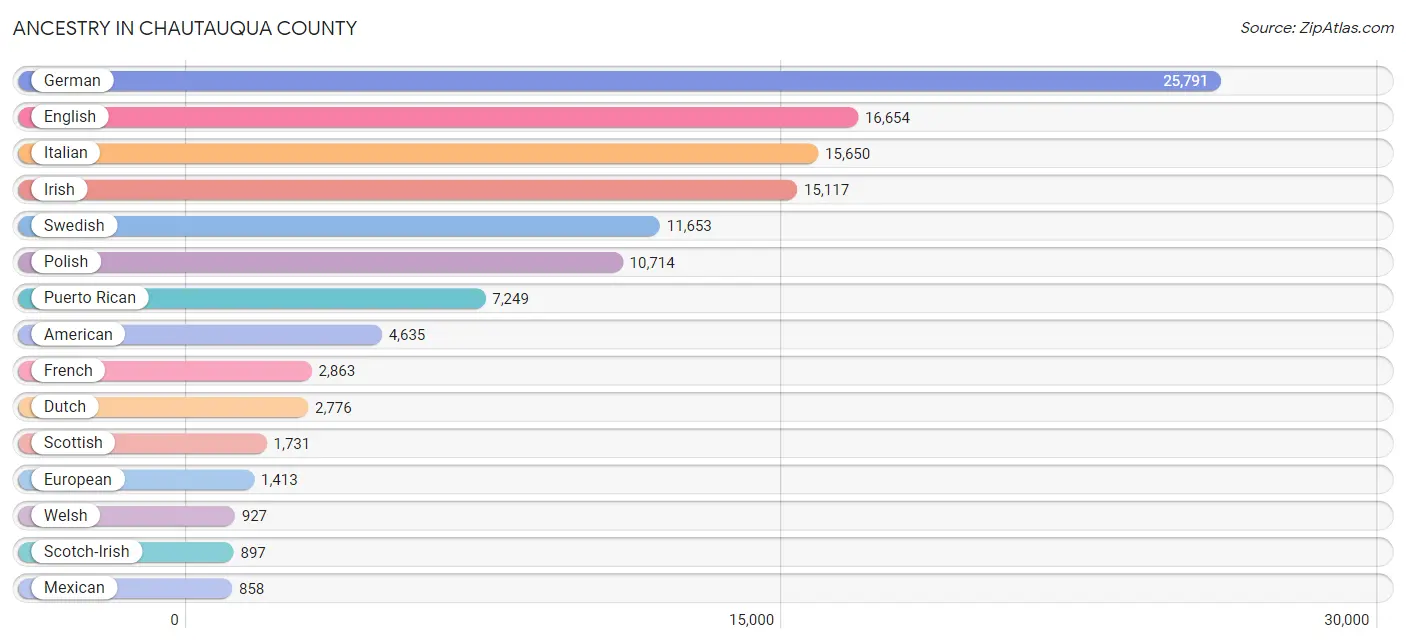
Ancestry in Chautauqua County
The most populous ancestries reported in Chautauqua County are German (25,791 | 20.2%), English (16,654 | 13.1%), Italian (15,650 | 12.3%), Irish (15,117 | 11.9%), and Swedish (11,653 | 9.1%), together accounting for 66.6% of all Chautauqua County residents.
| Ancestry | # Population | % Population |
| African | 77 | 0.1% |
| Albanian | 294 | 0.2% |
| Aleut | 11 | 0.0% |
| Alsatian | 8 | 0.0% |
| American | 4,635 | 3.6% |
| Apache | 6 | 0.0% |
| Arab | 213 | 0.2% |
| Argentinean | 4 | 0.0% |
| Armenian | 10 | 0.0% |
| Assyrian / Chaldean / Syriac | 8 | 0.0% |
| Australian | 9 | 0.0% |
| Austrian | 339 | 0.3% |
| Belgian | 20 | 0.0% |
| Belizean | 6 | 0.0% |
| Bhutanese | 36 | 0.0% |
| Blackfeet | 26 | 0.0% |
| Brazilian | 48 | 0.0% |
| British | 565 | 0.4% |
| British West Indian | 3 | 0.0% |
| Burmese | 81 | 0.1% |
| Canadian | 262 | 0.2% |
| Celtic | 21 | 0.0% |
| Central American | 703 | 0.5% |
| Central American Indian | 160 | 0.1% |
| Cherokee | 146 | 0.1% |
| Chilean | 14 | 0.0% |
| Chippewa | 38 | 0.0% |
| Colombian | 67 | 0.1% |
| Croatian | 54 | 0.0% |
| Cuban | 193 | 0.2% |
| Czech | 189 | 0.2% |
| Czechoslovakian | 59 | 0.1% |
| Danish | 402 | 0.3% |
| Delaware | 2 | 0.0% |
| Dominican | 527 | 0.4% |
| Dutch | 2,776 | 2.2% |
| Eastern European | 220 | 0.2% |
| Ecuadorian | 108 | 0.1% |
| English | 16,654 | 13.1% |
| Ethiopian | 6 | 0.0% |
| European | 1,413 | 1.1% |
| Filipino | 12 | 0.0% |
| Finnish | 63 | 0.1% |
| French | 2,863 | 2.2% |
| French American Indian | 57 | 0.0% |
| French Canadian | 367 | 0.3% |
| German | 25,791 | 20.2% |
| German Russian | 16 | 0.0% |
| Greek | 201 | 0.2% |
| Guatemalan | 293 | 0.2% |
| Guyanese | 47 | 0.0% |
| Haitian | 138 | 0.1% |
| Honduran | 89 | 0.1% |
| Hungarian | 425 | 0.3% |
| Indian (Asian) | 373 | 0.3% |
| Iraqi | 24 | 0.0% |
| Irish | 15,117 | 11.9% |
| Iroquois | 493 | 0.4% |
| Israeli | 8 | 0.0% |
| Italian | 15,650 | 12.3% |
| Jamaican | 85 | 0.1% |
| Japanese | 22 | 0.0% |
| Korean | 257 | 0.2% |
| Laotian | 4 | 0.0% |
| Latvian | 2 | 0.0% |
| Lebanese | 71 | 0.1% |
| Lithuanian | 150 | 0.1% |
| Lumbee | 8 | 0.0% |
| Malaysian | 80 | 0.1% |
| Mexican | 858 | 0.7% |
| Mexican American Indian | 80 | 0.1% |
| Mongolian | 6 | 0.0% |
| Native Hawaiian | 26 | 0.0% |
| Navajo | 36 | 0.0% |
| New Zealander | 3 | 0.0% |
| Nicaraguan | 9 | 0.0% |
| Nigerian | 30 | 0.0% |
| Northern European | 52 | 0.0% |
| Norwegian | 628 | 0.5% |
| Ottawa | 2 | 0.0% |
| Pakistani | 16 | 0.0% |
| Palestinian | 28 | 0.0% |
| Panamanian | 4 | 0.0% |
| Pennsylvania German | 400 | 0.3% |
| Peruvian | 63 | 0.1% |
| Polish | 10,714 | 8.4% |
| Portuguese | 111 | 0.1% |
| Puerto Rican | 7,249 | 5.7% |
| Romanian | 27 | 0.0% |
| Russian | 596 | 0.5% |
| Salvadoran | 308 | 0.2% |
| Samoan | 8 | 0.0% |
| Scandinavian | 776 | 0.6% |
| Scotch-Irish | 897 | 0.7% |
| Scottish | 1,731 | 1.4% |
| Serbian | 54 | 0.0% |
| Sierra Leonean | 5 | 0.0% |
| Sioux | 17 | 0.0% |
| Slavic | 25 | 0.0% |
| Slovak | 197 | 0.2% |
| Slovene | 161 | 0.1% |
| South African | 9 | 0.0% |
| South American | 447 | 0.4% |
| Spaniard | 60 | 0.1% |
| Spanish | 19 | 0.0% |
| Sri Lankan | 151 | 0.1% |
| Subsaharan African | 127 | 0.1% |
| Swedish | 11,653 | 9.1% |
| Swiss | 473 | 0.4% |
| Syrian | 36 | 0.0% |
| Thai | 208 | 0.2% |
| Trinidadian and Tobagonian | 76 | 0.1% |
| Turkish | 12 | 0.0% |
| Ukrainian | 422 | 0.3% |
| Uruguayan | 10 | 0.0% |
| Venezuelan | 171 | 0.1% |
| Welsh | 927 | 0.7% |
| West Indian | 173 | 0.1% |
| Yugoslavian | 53 | 0.0% | View All 119 Rows |
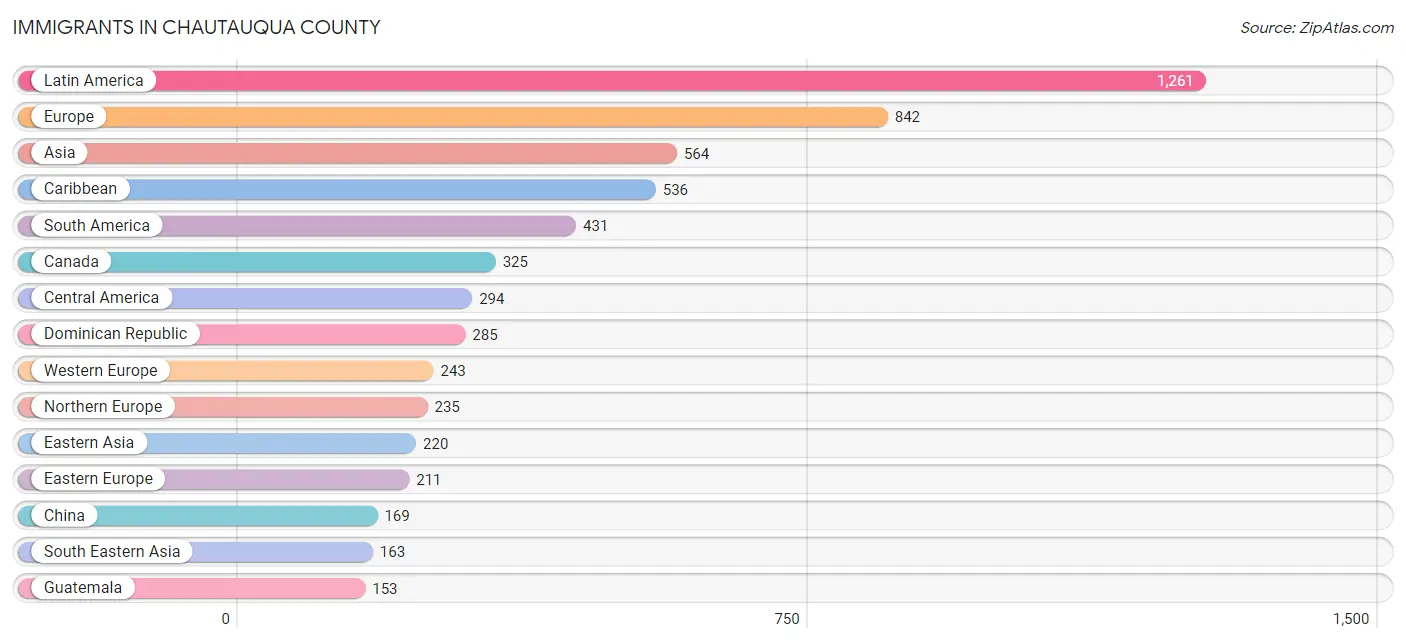
Immigrants in Chautauqua County
The most numerous immigrant groups reported in Chautauqua County came from Latin America (1,261 | 1.0%), Europe (842 | 0.7%), Asia (564 | 0.4%), Caribbean (536 | 0.4%), and South America (431 | 0.3%), together accounting for 2.9% of all Chautauqua County residents.
| Immigration Origin | # Population | % Population |
| Africa | 59 | 0.1% |
| Argentina | 24 | 0.0% |
| Asia | 564 | 0.4% |
| Australia | 42 | 0.0% |
| Austria | 2 | 0.0% |
| Bangladesh | 14 | 0.0% |
| Belgium | 42 | 0.0% |
| Brazil | 33 | 0.0% |
| Cambodia | 5 | 0.0% |
| Canada | 325 | 0.3% |
| Caribbean | 536 | 0.4% |
| Central America | 294 | 0.2% |
| Chile | 14 | 0.0% |
| China | 169 | 0.1% |
| Colombia | 71 | 0.1% |
| Cuba | 24 | 0.0% |
| Denmark | 34 | 0.0% |
| Dominican Republic | 285 | 0.2% |
| Eastern Africa | 5 | 0.0% |
| Eastern Asia | 220 | 0.2% |
| Eastern Europe | 211 | 0.2% |
| Ecuador | 26 | 0.0% |
| El Salvador | 55 | 0.0% |
| England | 64 | 0.1% |
| Ethiopia | 5 | 0.0% |
| Europe | 842 | 0.7% |
| France | 20 | 0.0% |
| Germany | 141 | 0.1% |
| Ghana | 2 | 0.0% |
| Guatemala | 153 | 0.1% |
| Guyana | 37 | 0.0% |
| Haiti | 118 | 0.1% |
| Hong Kong | 31 | 0.0% |
| Hungary | 6 | 0.0% |
| India | 96 | 0.1% |
| Iran | 11 | 0.0% |
| Israel | 1 | 0.0% |
| Italy | 132 | 0.1% |
| Jamaica | 41 | 0.0% |
| Japan | 4 | 0.0% |
| Korea | 47 | 0.0% |
| Laos | 46 | 0.0% |
| Latin America | 1,261 | 1.0% |
| Lebanon | 16 | 0.0% |
| Liberia | 8 | 0.0% |
| Mexico | 86 | 0.1% |
| Netherlands | 18 | 0.0% |
| Nigeria | 17 | 0.0% |
| Northern Europe | 235 | 0.2% |
| Oceania | 45 | 0.0% |
| Pakistan | 11 | 0.0% |
| Peru | 63 | 0.1% |
| Philippines | 24 | 0.0% |
| Portugal | 6 | 0.0% |
| Romania | 5 | 0.0% |
| Russia | 138 | 0.1% |
| Scotland | 3 | 0.0% |
| Senegal | 6 | 0.0% |
| South Africa | 21 | 0.0% |
| South America | 431 | 0.3% |
| South Central Asia | 134 | 0.1% |
| South Eastern Asia | 163 | 0.1% |
| Southern Europe | 153 | 0.1% |
| Spain | 15 | 0.0% |
| Sweden | 12 | 0.0% |
| Switzerland | 20 | 0.0% |
| Taiwan | 39 | 0.0% |
| Thailand | 10 | 0.0% |
| Trinidad and Tobago | 68 | 0.1% |
| Turkey | 12 | 0.0% |
| Ukraine | 56 | 0.0% |
| Uruguay | 10 | 0.0% |
| Venezuela | 153 | 0.1% |
| Vietnam | 78 | 0.1% |
| Western Africa | 33 | 0.0% |
| Western Asia | 29 | 0.0% |
| Western Europe | 243 | 0.2% | View All 77 Rows |
Sex and Age in Chautauqua County
Sex and Age in Chautauqua County
The most populous age groups in Chautauqua County are 60 to 64 Years (4,936 | 7.8%) for men and 60 to 64 Years (4,806 | 7.5%) for women.
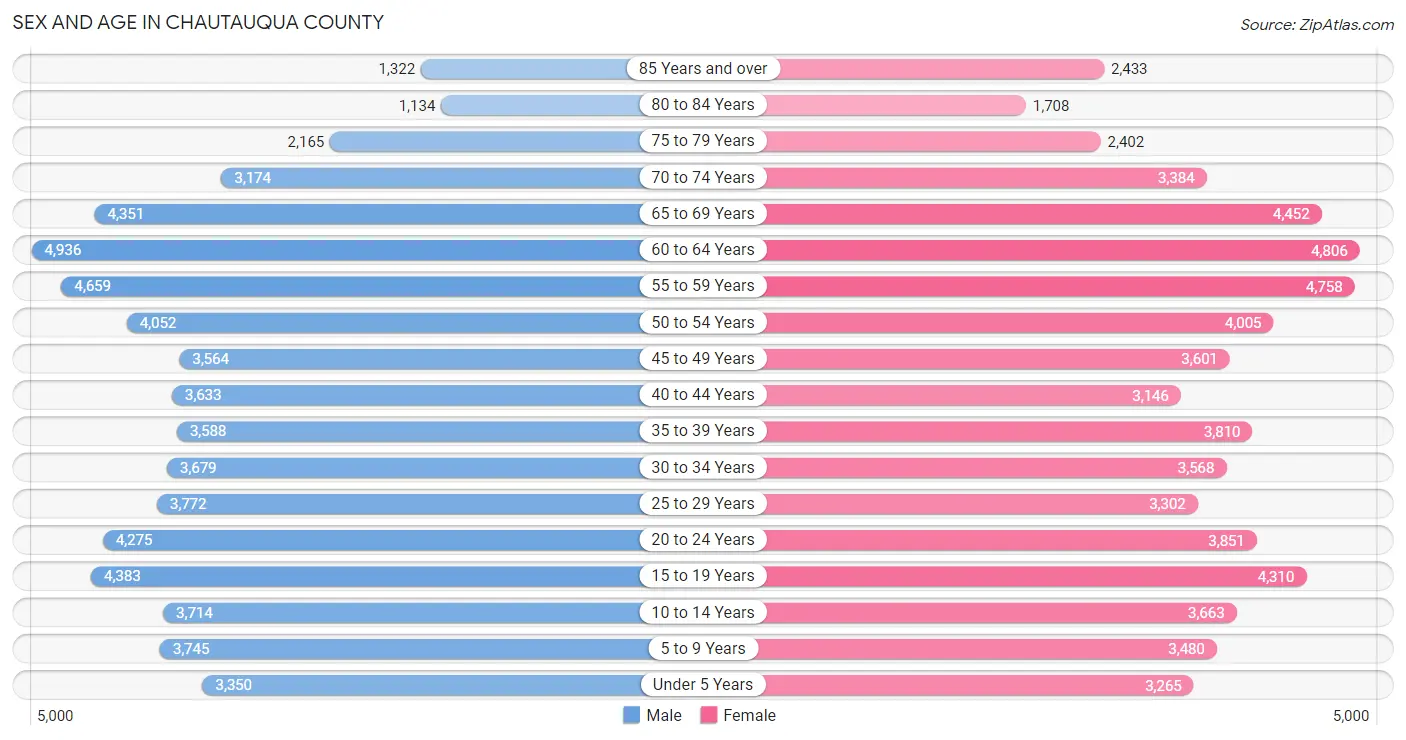
| Age Bracket | Male | Female |
| Under 5 Years | 3,350 (5.3%) | 3,265 (5.1%) |
| 5 to 9 Years | 3,745 (5.9%) | 3,480 (5.4%) |
| 10 to 14 Years | 3,714 (5.9%) | 3,663 (5.7%) |
| 15 to 19 Years | 4,383 (6.9%) | 4,310 (6.7%) |
| 20 to 24 Years | 4,275 (6.7%) | 3,851 (6.0%) |
| 25 to 29 Years | 3,772 (5.9%) | 3,302 (5.2%) |
| 30 to 34 Years | 3,679 (5.8%) | 3,568 (5.6%) |
| 35 to 39 Years | 3,588 (5.7%) | 3,810 (6.0%) |
| 40 to 44 Years | 3,633 (5.7%) | 3,146 (4.9%) |
| 45 to 49 Years | 3,564 (5.6%) | 3,601 (5.6%) |
| 50 to 54 Years | 4,052 (6.4%) | 4,005 (6.3%) |
| 55 to 59 Years | 4,659 (7.3%) | 4,758 (7.4%) |
| 60 to 64 Years | 4,936 (7.8%) | 4,806 (7.5%) |
| 65 to 69 Years | 4,351 (6.9%) | 4,452 (7.0%) |
| 70 to 74 Years | 3,174 (5.0%) | 3,384 (5.3%) |
| 75 to 79 Years | 2,165 (3.4%) | 2,402 (3.8%) |
| 80 to 84 Years | 1,134 (1.8%) | 1,708 (2.7%) |
| 85 Years and over | 1,322 (2.1%) | 2,433 (3.8%) |
| Total | 63,496 (100.0%) | 63,944 (100.0%) |
Families and Households in Chautauqua County
Median Family Size in Chautauqua County
The median family size in Chautauqua County is 2.92 persons per family, with single female/mother families (6,160 | 19.5%) accounting for the largest median family size of 3.04 persons per family. On the other hand, single male/father families (2,489 | 7.9%) represent the smallest median family size with 2.72 persons per family.
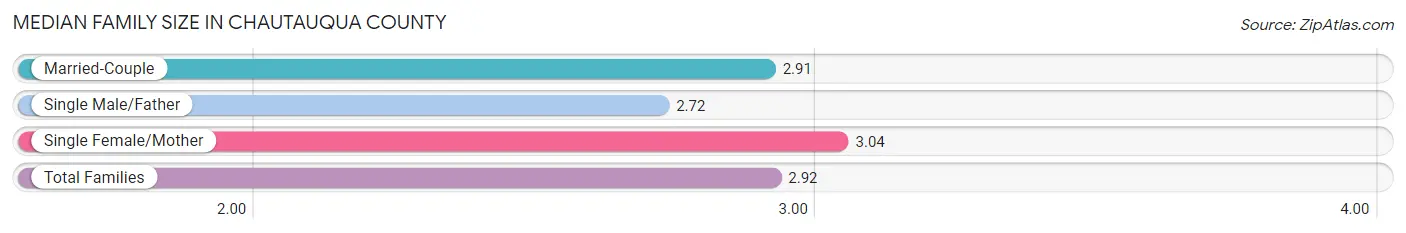
| Family Type | # Families | Family Size |
| Married-Couple | 22,942 (72.6%) | 2.91 |
| Single Male/Father | 2,489 (7.9%) | 2.72 |
| Single Female/Mother | 6,160 (19.5%) | 3.04 |
| Total Families | 31,591 (100.0%) | 2.92 |
Median Household Size in Chautauqua County
The median household size in Chautauqua County is 2.29 persons per household, with single female/mother households (6,160 | 11.5%) accounting for the largest median household size of 3.31 persons per household. non-family households (21,814 | 40.8%) represent the smallest median household size with 1.21 persons per household.
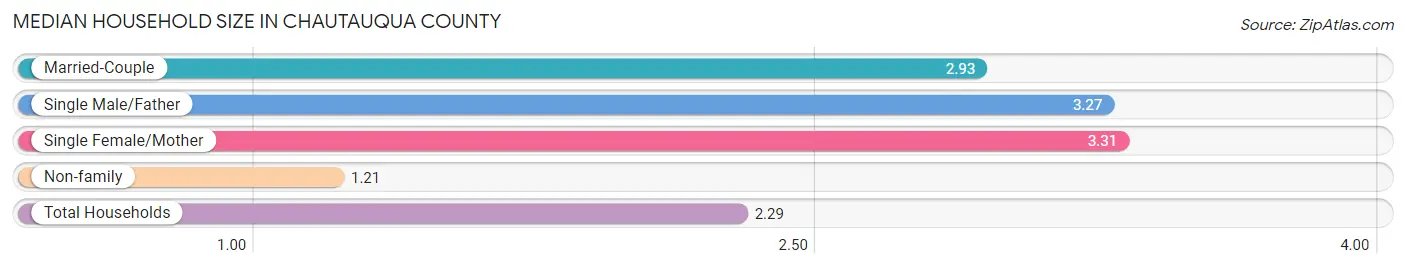
| Household Type | # Households | Household Size |
| Married-Couple | 22,942 (43.0%) | 2.93 |
| Single Male/Father | 2,489 (4.7%) | 3.27 |
| Single Female/Mother | 6,160 (11.5%) | 3.31 |
| Non-family | 21,814 (40.8%) | 1.21 |
| Total Households | 53,405 (100.0%) | 2.29 |
Household Size by Marriage Status in Chautauqua County
Out of a total of 53,405 households in Chautauqua County, 31,591 (59.2%) are family households, while 21,814 (40.8%) are nonfamily households. The most numerous type of family households are 2-person households, comprising 15,620, and the most common type of nonfamily households are 1-person households, comprising 18,391.
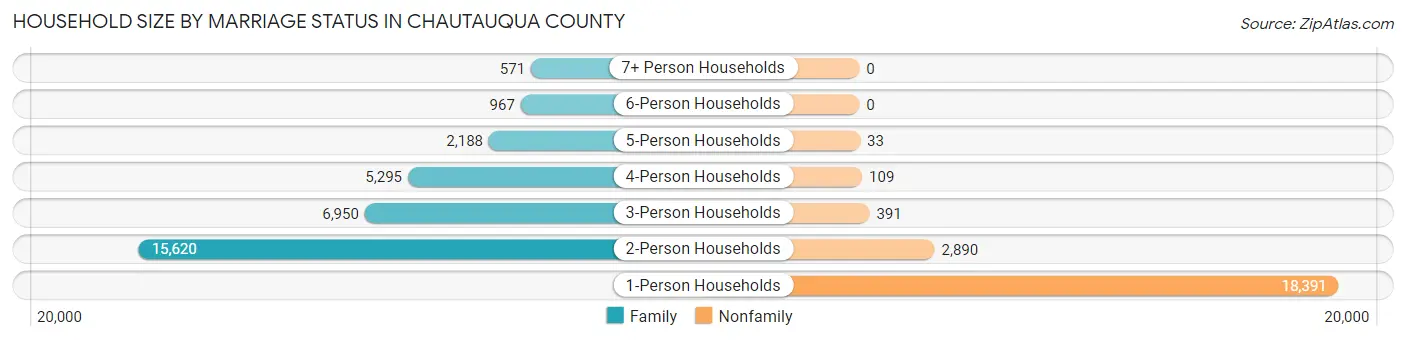
| Household Size | Family Households | Nonfamily Households |
| 1-Person Households | - | 18,391 (34.4%) |
| 2-Person Households | 15,620 (29.2%) | 2,890 (5.4%) |
| 3-Person Households | 6,950 (13.0%) | 391 (0.7%) |
| 4-Person Households | 5,295 (9.9%) | 109 (0.2%) |
| 5-Person Households | 2,188 (4.1%) | 33 (0.1%) |
| 6-Person Households | 967 (1.8%) | 0 (0.0%) |
| 7+ Person Households | 571 (1.1%) | 0 (0.0%) |
| Total | 31,591 (59.2%) | 21,814 (40.8%) |
Female Fertility in Chautauqua County
Fertility by Age in Chautauqua County
Average fertility rate in Chautauqua County is 55.0 births per 1,000 women. Women in the age bracket of 20 to 34 years have the highest fertility rate with 104.0 births per 1,000 women. Women in the age bracket of 20 to 34 years acount for 76.5% of all women with births.
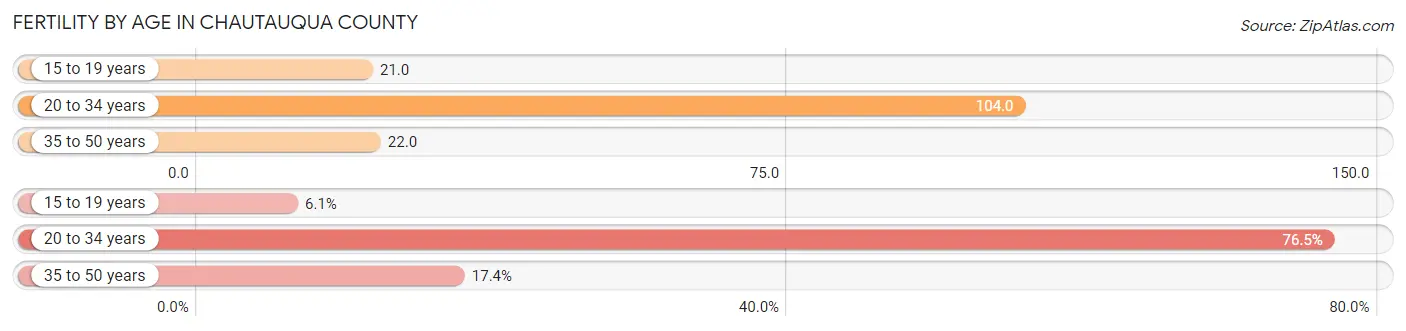
| Age Bracket | Women with Births | Births / 1,000 Women |
| 15 to 19 years | 89 (6.1%) | 21.0 |
| 20 to 34 years | 1,114 (76.5%) | 104.0 |
| 35 to 50 years | 254 (17.4%) | 22.0 |
| Total | 1,457 (100.0%) | 55.0 |
Fertility by Age by Marriage Status in Chautauqua County
55.7% of women with births (1,457) in Chautauqua County are married. The highest percentage of unmarried women with births falls into 15 to 19 years age bracket with 100.0% of them unmarried at the time of birth, while the lowest percentage of unmarried women with births belong to 35 to 50 years age bracket with 15.0% of them unmarried.
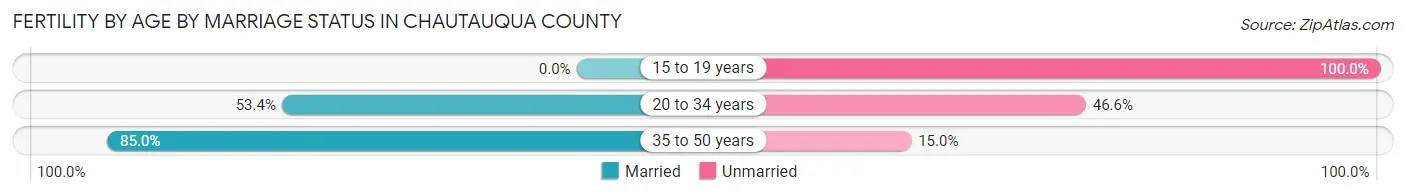
| Age Bracket | Married | Unmarried |
| 15 to 19 years | 0 (0.0%) | 89 (100.0%) |
| 20 to 34 years | 595 (53.4%) | 519 (46.6%) |
| 35 to 50 years | 216 (85.0%) | 38 (15.0%) |
| Total | 812 (55.7%) | 645 (44.3%) |
Fertility by Education in Chautauqua County
Average fertility rate in Chautauqua County is 55.0 births per 1,000 women. Women with the education attainment of less than high school have the highest fertility rate of 73.0 births per 1,000 women, while women with the education attainment of college or associate's degree have the lowest fertility at 34.0 births per 1,000 women. Women with the education attainment of high school diploma represent 29.0% of all women with births.
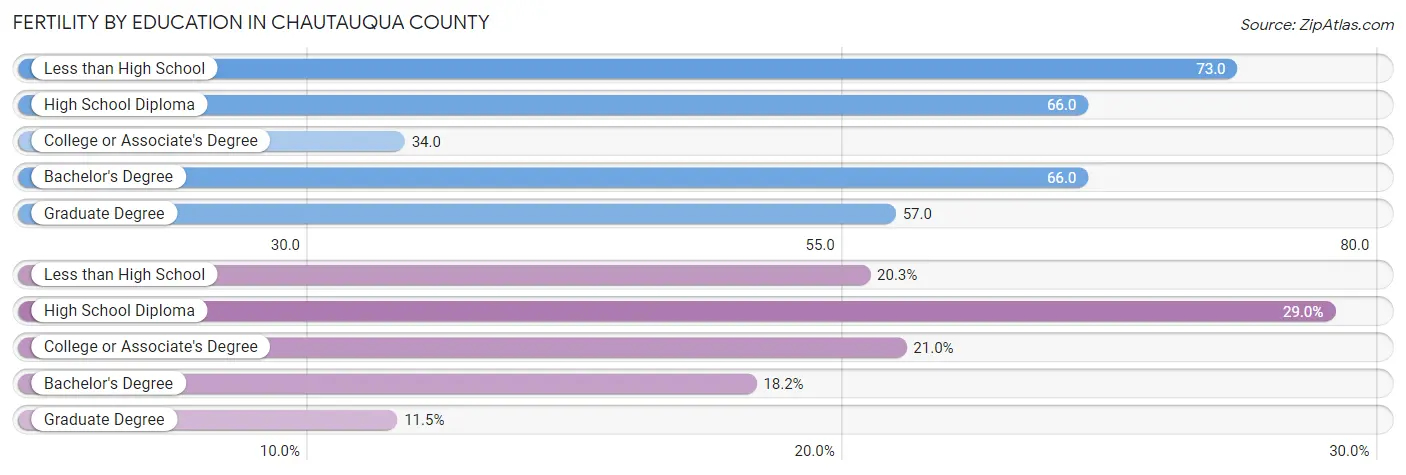
| Educational Attainment | Women with Births | Births / 1,000 Women |
| Less than High School | 296 (20.3%) | 73.0 |
| High School Diploma | 423 (29.0%) | 66.0 |
| College or Associate's Degree | 306 (21.0%) | 34.0 |
| Bachelor's Degree | 265 (18.2%) | 66.0 |
| Graduate Degree | 167 (11.5%) | 57.0 |
| Total | 1,457 (100.0%) | 55.0 |
Fertility by Education by Marriage Status in Chautauqua County
44.3% of women with births in Chautauqua County are unmarried. Women with the educational attainment of graduate degree are most likely to be married with 94.0% of them married at childbirth, while women with the educational attainment of high school diploma are least likely to be married with 67.1% of them unmarried at childbirth.
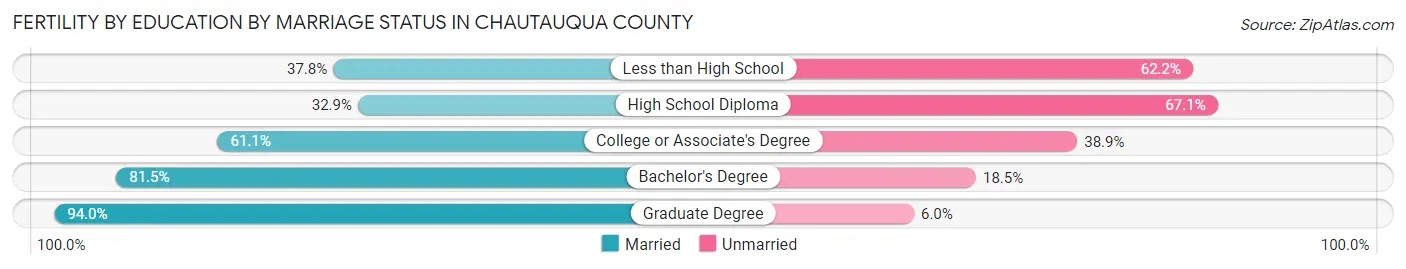
| Educational Attainment | Married | Unmarried |
| Less than High School | 112 (37.8%) | 184 (62.2%) |
| High School Diploma | 139 (32.9%) | 284 (67.1%) |
| College or Associate's Degree | 187 (61.1%) | 119 (38.9%) |
| Bachelor's Degree | 216 (81.5%) | 49 (18.5%) |
| Graduate Degree | 157 (94.0%) | 10 (6.0%) |
| Total | 812 (55.7%) | 645 (44.3%) |
Employment Characteristics in Chautauqua County
Employment by Class of Employer in Chautauqua County
Among the 53,861 employed individuals in Chautauqua County, private company employees (31,941 | 59.3%), not-for-profit organizations (6,258 | 11.6%), and local government employees (6,061 | 11.3%) make up the most common classes of employment.
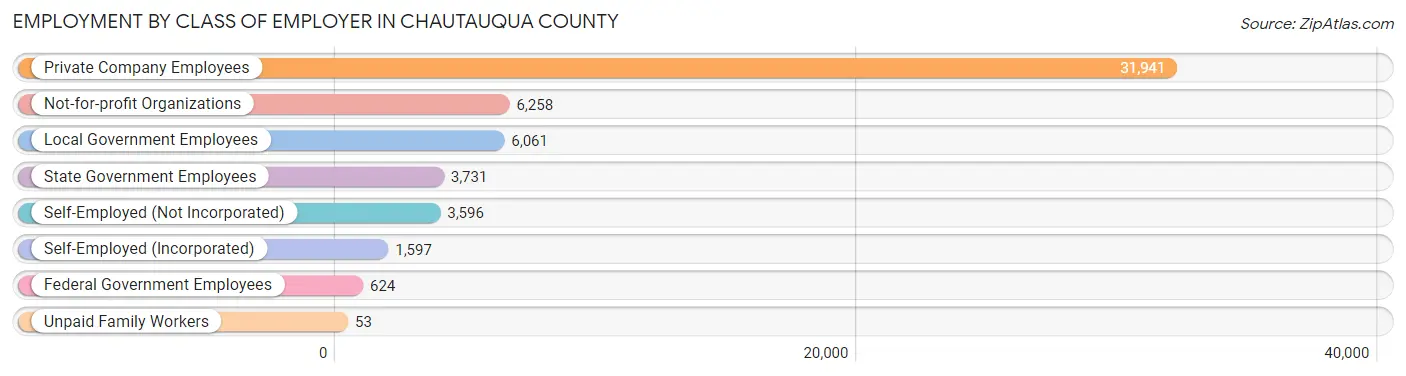
| Employer Class | # Employees | % Employees |
| Private Company Employees | 31,941 | 59.3% |
| Self-Employed (Incorporated) | 1,597 | 3.0% |
| Self-Employed (Not Incorporated) | 3,596 | 6.7% |
| Not-for-profit Organizations | 6,258 | 11.6% |
| Local Government Employees | 6,061 | 11.3% |
| State Government Employees | 3,731 | 6.9% |
| Federal Government Employees | 624 | 1.2% |
| Unpaid Family Workers | 53 | 0.1% |
| Total | 53,861 | 100.0% |
Employment Status by Age in Chautauqua County
According to the labor force statistics for Chautauqua County, out of the total population over 16 years of age (104,792), 55.7% or 58,369 individuals are in the labor force, with 5.4% or 3,152 of them unemployed. The age group with the highest labor force participation rate is 35 to 44 years, with 79.3% or 11,242 individuals in the labor force. Within the labor force, the 20 to 24 years age range has the highest percentage of unemployed individuals, with 13.5% or 776 of them being unemployed.
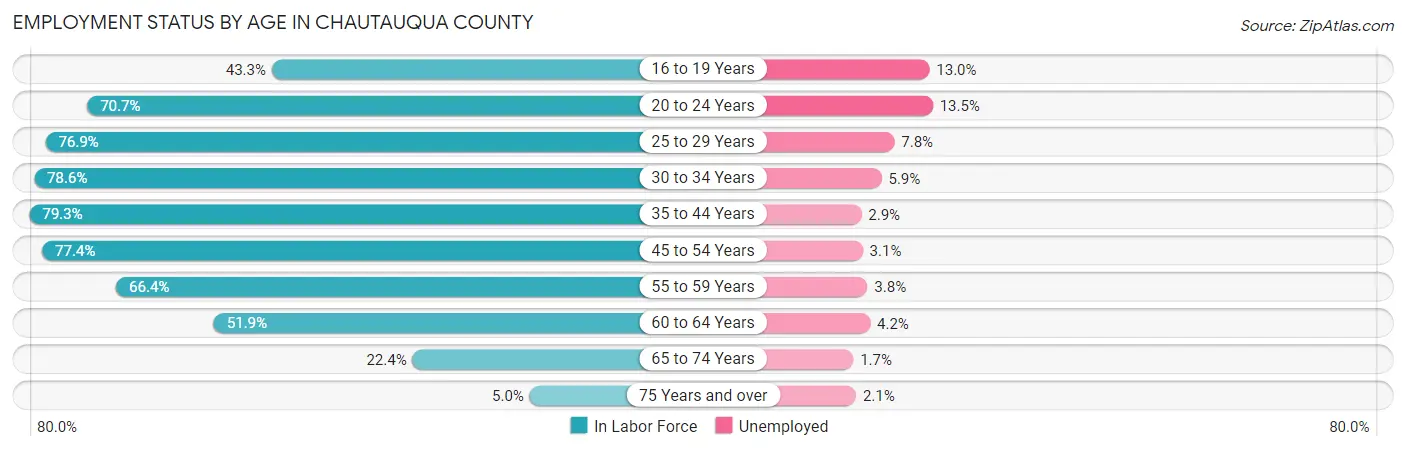
| Age Bracket | In Labor Force | Unemployed |
| 16 to 19 Years | 3,144 (43.3%) | 409 (13.0%) |
| 20 to 24 Years | 5,745 (70.7%) | 776 (13.5%) |
| 25 to 29 Years | 5,440 (76.9%) | 424 (7.8%) |
| 30 to 34 Years | 5,696 (78.6%) | 336 (5.9%) |
| 35 to 44 Years | 11,242 (79.3%) | 326 (2.9%) |
| 45 to 54 Years | 11,782 (77.4%) | 365 (3.1%) |
| 55 to 59 Years | 6,253 (66.4%) | 238 (3.8%) |
| 60 to 64 Years | 5,056 (51.9%) | 212 (4.2%) |
| 65 to 74 Years | 3,441 (22.4%) | 58 (1.7%) |
| 75 Years and over | 558 (5.0%) | 12 (2.1%) |
| Total | 58,369 (55.7%) | 3,152 (5.4%) |
Employment Status by Educational Attainment in Chautauqua County
According to labor force statistics for Chautauqua County, 72.3% of individuals (45,462) out of the total population between 25 and 64 years of age (62,879) are in the labor force, with 4.2% or 1,909 of them being unemployed. The group with the highest labor force participation rate are those with the educational attainment of bachelor's degree or higher, with 84.6% or 13,365 individuals in the labor force. Within the labor force, individuals with less than high school education have the highest percentage of unemployment, with 9.1% or 281 of them being unemployed.
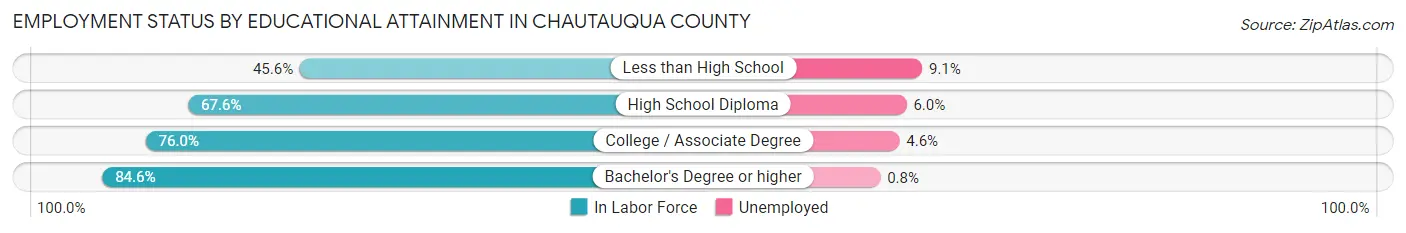
| Educational Attainment | In Labor Force | Unemployed |
| Less than High School | 3,087 (45.6%) | 616 (9.1%) |
| High School Diploma | 13,245 (67.6%) | 1,176 (6.0%) |
| College / Associate Degree | 15,746 (76.0%) | 953 (4.6%) |
| Bachelor's Degree or higher | 13,365 (84.6%) | 126 (0.8%) |
| Total | 45,462 (72.3%) | 2,641 (4.2%) |
Employment Occupations by Sex in Chautauqua County
Management, Business, Science and Arts Occupations
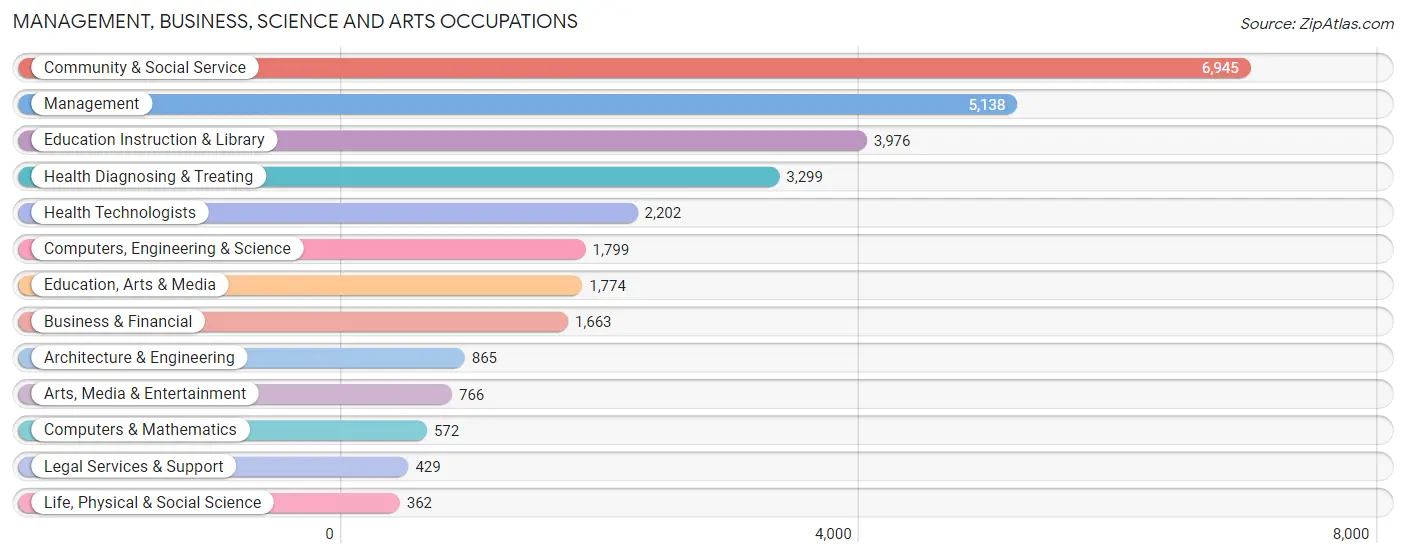
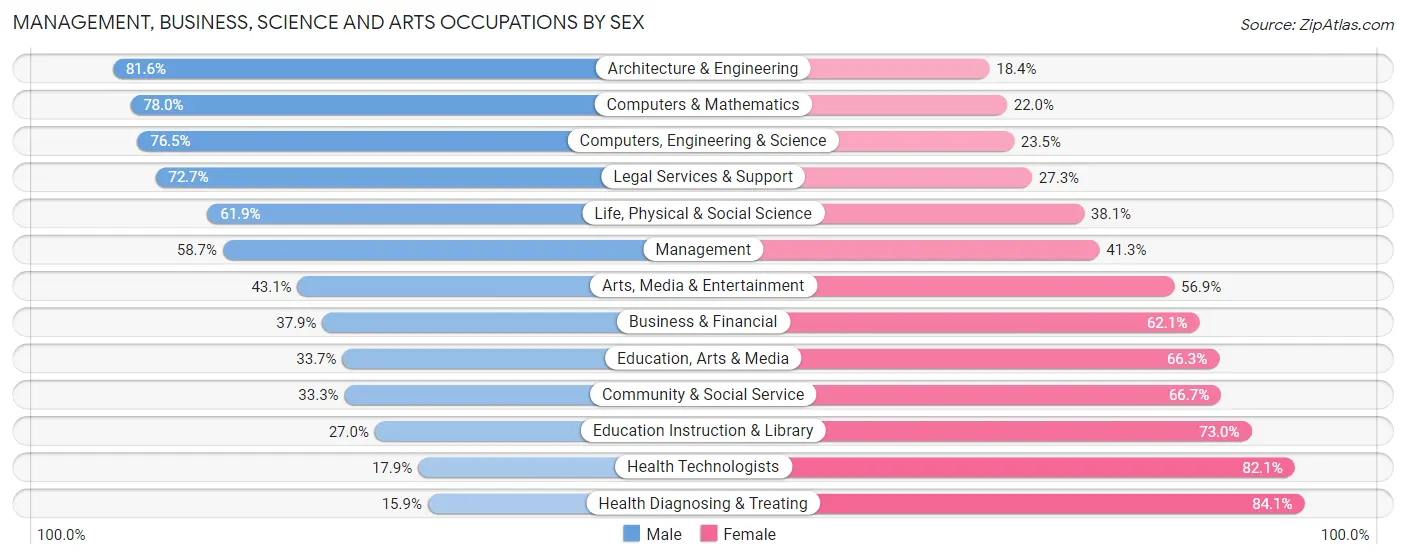
The most common Management, Business, Science and Arts occupations in Chautauqua County are Community & Social Service (6,945 | 12.6%), Management (5,138 | 9.3%), Education Instruction & Library (3,976 | 7.2%), Health Diagnosing & Treating (3,299 | 6.0%), and Health Technologists (2,202 | 4.0%).
Management, Business, Science and Arts Occupations by Sex
Within the Management, Business, Science and Arts occupations in Chautauqua County, the most male-oriented occupations are Architecture & Engineering (81.6%), Computers & Mathematics (78.0%), and Computers, Engineering & Science (76.5%), while the most female-oriented occupations are Health Diagnosing & Treating (84.1%), Health Technologists (82.1%), and Education Instruction & Library (73.0%).
| Occupation | Male | Female |
| Management | 3,014 (58.7%) | 2,124 (41.3%) |
| Business & Financial | 630 (37.9%) | 1,033 (62.1%) |
| Computers, Engineering & Science | 1,376 (76.5%) | 423 (23.5%) |
| Computers & Mathematics | 446 (78.0%) | 126 (22.0%) |
| Architecture & Engineering | 706 (81.6%) | 159 (18.4%) |
| Life, Physical & Social Science | 224 (61.9%) | 138 (38.1%) |
| Community & Social Service | 2,312 (33.3%) | 4,633 (66.7%) |
| Education, Arts & Media | 598 (33.7%) | 1,176 (66.3%) |
| Legal Services & Support | 312 (72.7%) | 117 (27.3%) |
| Education Instruction & Library | 1,072 (27.0%) | 2,904 (73.0%) |
| Arts, Media & Entertainment | 330 (43.1%) | 436 (56.9%) |
| Health Diagnosing & Treating | 525 (15.9%) | 2,774 (84.1%) |
| Health Technologists | 395 (17.9%) | 1,807 (82.1%) |
| Total (Category) | 7,857 (41.7%) | 10,987 (58.3%) |
| Total (Overall) | 28,646 (51.9%) | 26,530 (48.1%) |
Services Occupations
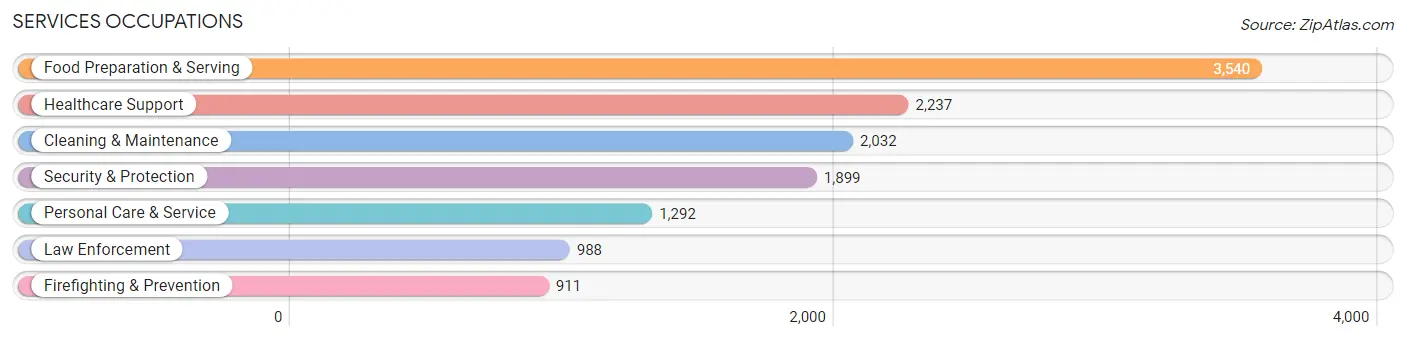
The most common Services occupations in Chautauqua County are Food Preparation & Serving (3,540 | 6.4%), Healthcare Support (2,237 | 4.1%), Cleaning & Maintenance (2,032 | 3.7%), Security & Protection (1,899 | 3.4%), and Personal Care & Service (1,292 | 2.3%).
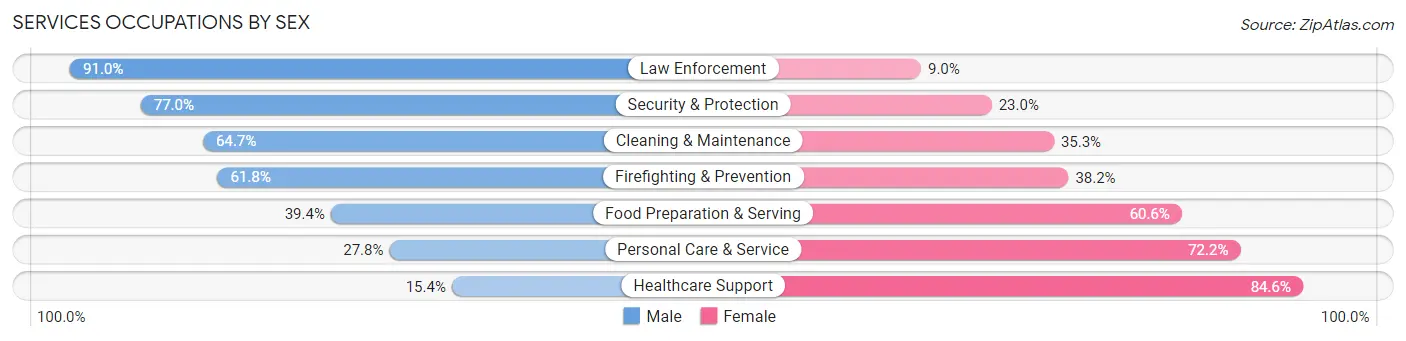
Services Occupations by Sex
Within the Services occupations in Chautauqua County, the most male-oriented occupations are Law Enforcement (91.0%), Security & Protection (77.0%), and Cleaning & Maintenance (64.7%), while the most female-oriented occupations are Healthcare Support (84.6%), Personal Care & Service (72.2%), and Food Preparation & Serving (60.6%).
| Occupation | Male | Female |
| Healthcare Support | 345 (15.4%) | 1,892 (84.6%) |
| Security & Protection | 1,462 (77.0%) | 437 (23.0%) |
| Firefighting & Prevention | 563 (61.8%) | 348 (38.2%) |
| Law Enforcement | 899 (91.0%) | 89 (9.0%) |
| Food Preparation & Serving | 1,394 (39.4%) | 2,146 (60.6%) |
| Cleaning & Maintenance | 1,314 (64.7%) | 718 (35.3%) |
| Personal Care & Service | 359 (27.8%) | 933 (72.2%) |
| Total (Category) | 4,874 (44.3%) | 6,126 (55.7%) |
| Total (Overall) | 28,646 (51.9%) | 26,530 (48.1%) |
Sales and Office Occupations
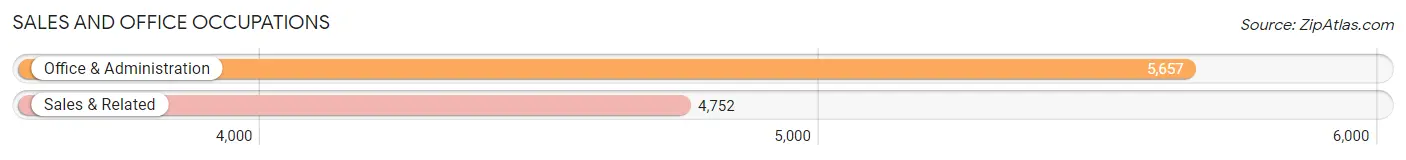
The most common Sales and Office occupations in Chautauqua County are Office & Administration (5,657 | 10.2%), and Sales & Related (4,752 | 8.6%).
Sales and Office Occupations by Sex
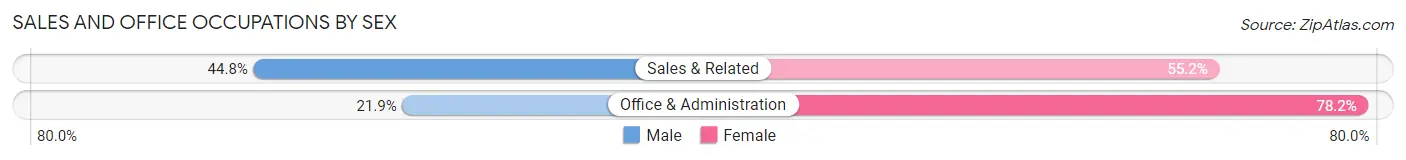
| Occupation | Male | Female |
| Sales & Related | 2,127 (44.8%) | 2,625 (55.2%) |
| Office & Administration | 1,236 (21.8%) | 4,421 (78.1%) |
| Total (Category) | 3,363 (32.3%) | 7,046 (67.7%) |
| Total (Overall) | 28,646 (51.9%) | 26,530 (48.1%) |
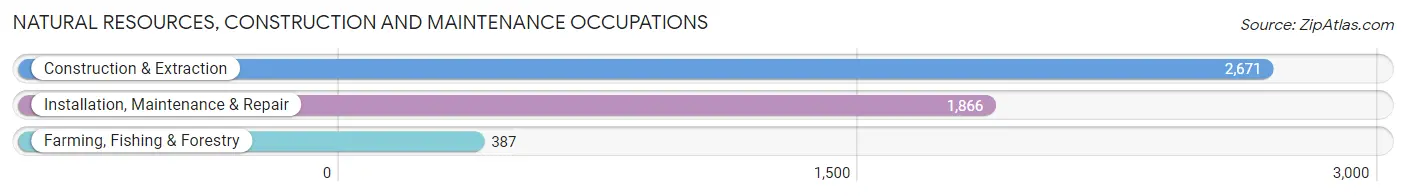
Natural Resources, Construction and Maintenance Occupations
The most common Natural Resources, Construction and Maintenance occupations in Chautauqua County are Construction & Extraction (2,671 | 4.8%), Installation, Maintenance & Repair (1,866 | 3.4%), and Farming, Fishing & Forestry (387 | 0.7%).
Natural Resources, Construction and Maintenance Occupations by Sex
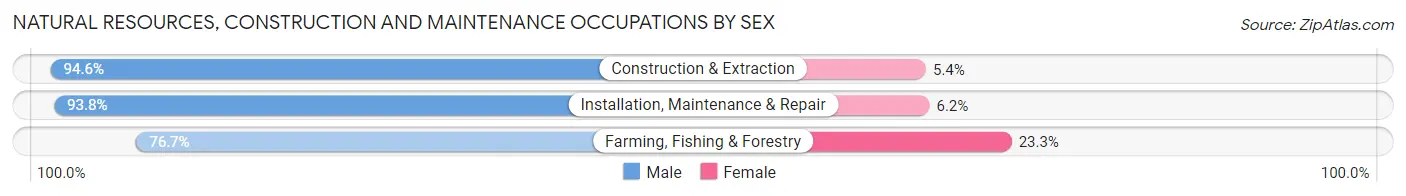
| Occupation | Male | Female |
| Farming, Fishing & Forestry | 297 (76.7%) | 90 (23.3%) |
| Construction & Extraction | 2,526 (94.6%) | 145 (5.4%) |
| Installation, Maintenance & Repair | 1,751 (93.8%) | 115 (6.2%) |
| Total (Category) | 4,574 (92.9%) | 350 (7.1%) |
| Total (Overall) | 28,646 (51.9%) | 26,530 (48.1%) |
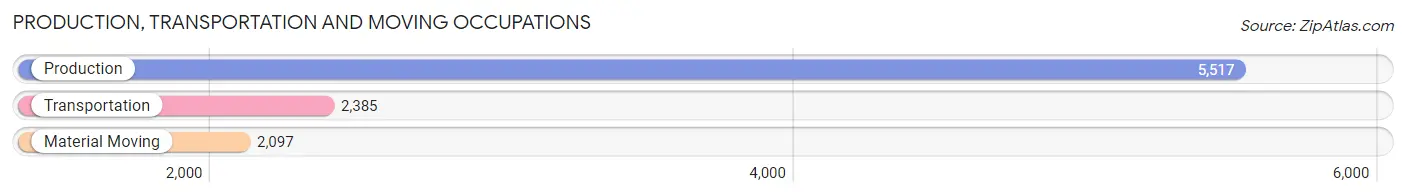
Production, Transportation and Moving Occupations
The most common Production, Transportation and Moving occupations in Chautauqua County are Production (5,517 | 10.0%), Transportation (2,385 | 4.3%), and Material Moving (2,097 | 3.8%).
Production, Transportation and Moving Occupations by Sex
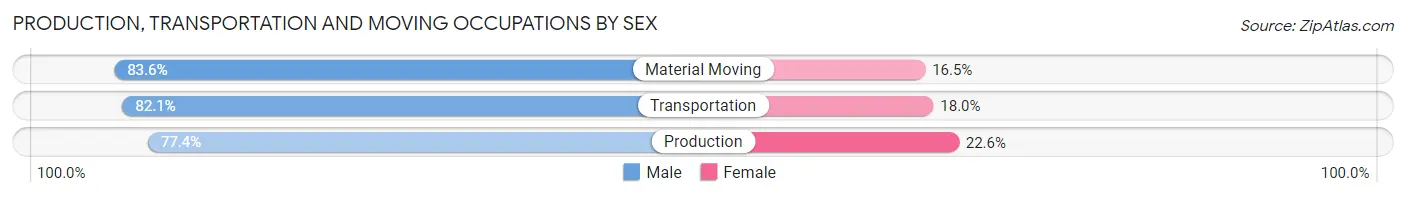
| Occupation | Male | Female |
| Production | 4,269 (77.4%) | 1,248 (22.6%) |
| Transportation | 1,957 (82.1%) | 428 (17.9%) |
| Material Moving | 1,752 (83.6%) | 345 (16.5%) |
| Total (Category) | 7,978 (79.8%) | 2,021 (20.2%) |
| Total (Overall) | 28,646 (51.9%) | 26,530 (48.1%) |
Employment Industries by Sex in Chautauqua County
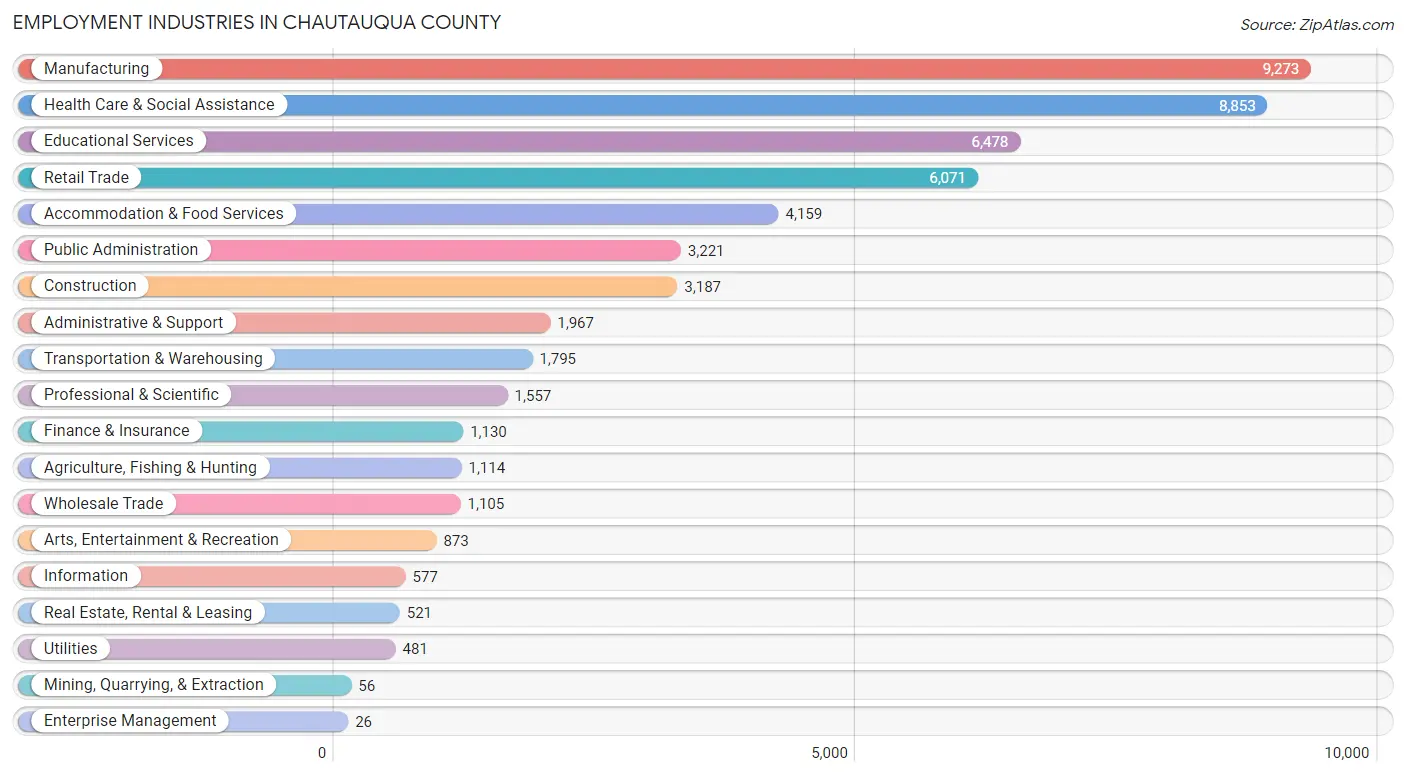
Employment Industries in Chautauqua County
The major employment industries in Chautauqua County include Manufacturing (9,273 | 16.8%), Health Care & Social Assistance (8,853 | 16.1%), Educational Services (6,478 | 11.7%), Retail Trade (6,071 | 11.0%), and Accommodation & Food Services (4,159 | 7.5%).
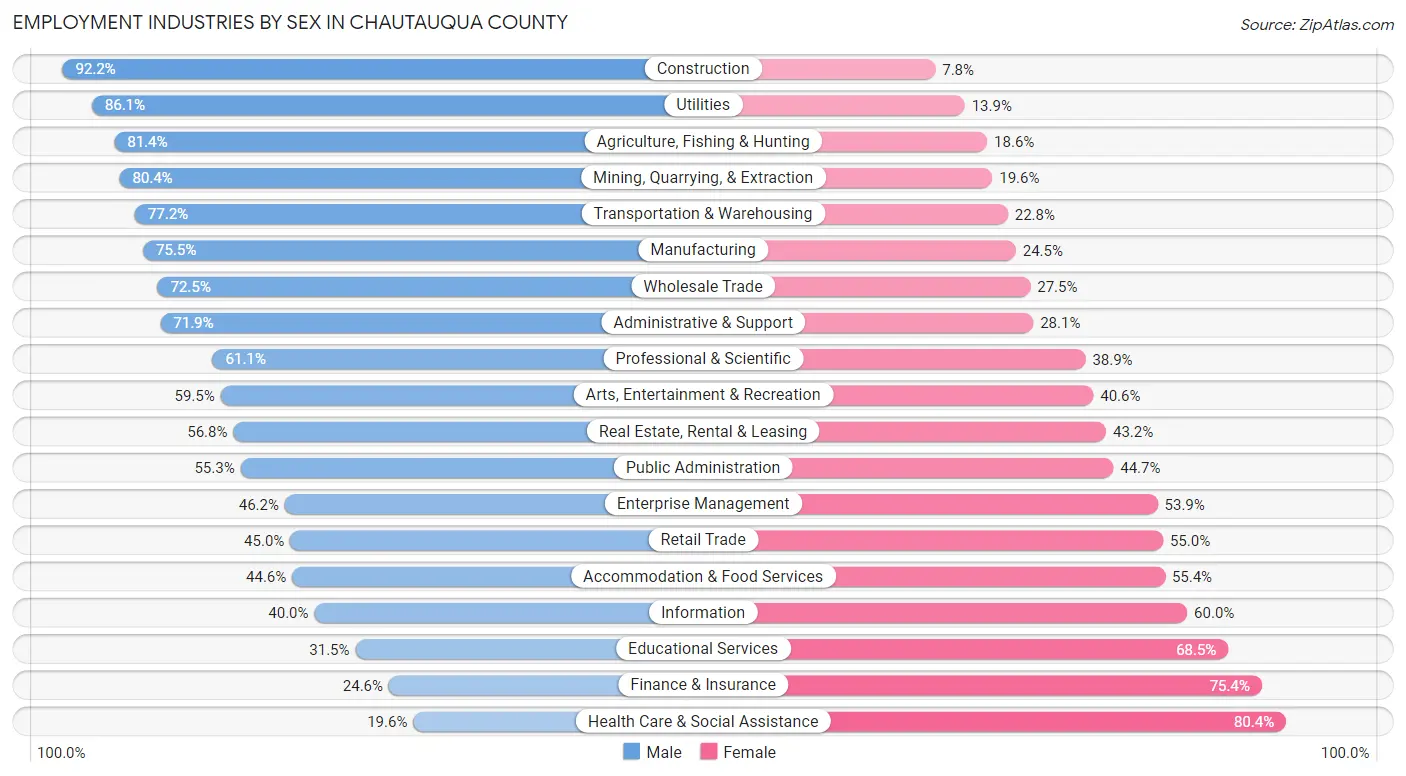
Employment Industries by Sex in Chautauqua County
The Chautauqua County industries that see more men than women are Construction (92.2%), Utilities (86.1%), and Agriculture, Fishing & Hunting (81.4%), whereas the industries that tend to have a higher number of women are Health Care & Social Assistance (80.4%), Finance & Insurance (75.4%), and Educational Services (68.5%).
| Industry | Male | Female |
| Agriculture, Fishing & Hunting | 907 (81.4%) | 207 (18.6%) |
| Mining, Quarrying, & Extraction | 45 (80.4%) | 11 (19.6%) |
| Construction | 2,937 (92.2%) | 250 (7.8%) |
| Manufacturing | 7,000 (75.5%) | 2,273 (24.5%) |
| Wholesale Trade | 801 (72.5%) | 304 (27.5%) |
| Retail Trade | 2,734 (45.0%) | 3,337 (55.0%) |
| Transportation & Warehousing | 1,385 (77.2%) | 410 (22.8%) |
| Utilities | 414 (86.1%) | 67 (13.9%) |
| Information | 231 (40.0%) | 346 (60.0%) |
| Finance & Insurance | 278 (24.6%) | 852 (75.4%) |
| Real Estate, Rental & Leasing | 296 (56.8%) | 225 (43.2%) |
| Professional & Scientific | 951 (61.1%) | 606 (38.9%) |
| Enterprise Management | 12 (46.2%) | 14 (53.8%) |
| Administrative & Support | 1,414 (71.9%) | 553 (28.1%) |
| Educational Services | 2,043 (31.5%) | 4,435 (68.5%) |
| Health Care & Social Assistance | 1,732 (19.6%) | 7,121 (80.4%) |
| Arts, Entertainment & Recreation | 519 (59.5%) | 354 (40.6%) |
| Accommodation & Food Services | 1,856 (44.6%) | 2,303 (55.4%) |
| Public Administration | 1,782 (55.3%) | 1,439 (44.7%) |
| Total | 28,646 (51.9%) | 26,530 (48.1%) |
Education in Chautauqua County
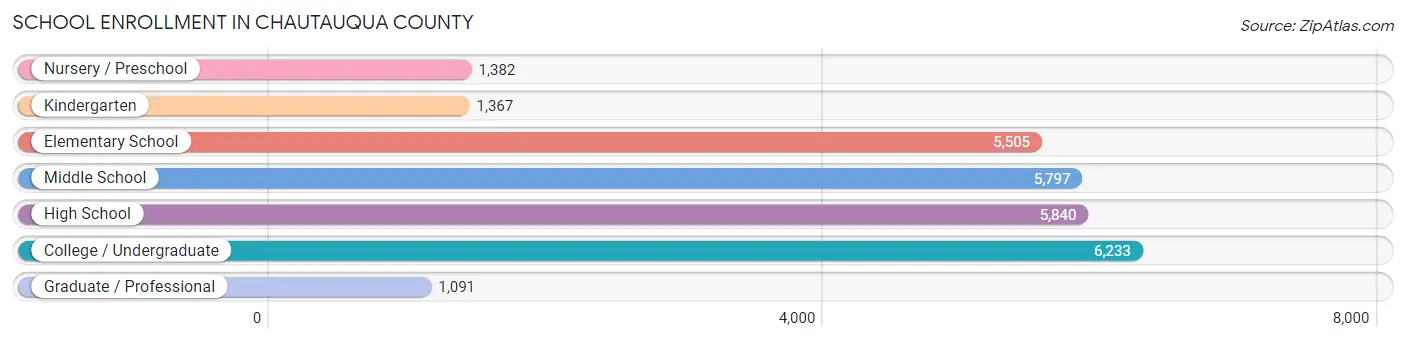
School Enrollment in Chautauqua County
The most common levels of schooling among the 27,215 students in Chautauqua County are college / undergraduate (6,233 | 22.9%), high school (5,840 | 21.5%), and middle school (5,797 | 21.3%).
| School Level | # Students | % Students |
| Nursery / Preschool | 1,382 | 5.1% |
| Kindergarten | 1,367 | 5.0% |
| Elementary School | 5,505 | 20.2% |
| Middle School | 5,797 | 21.3% |
| High School | 5,840 | 21.5% |
| College / Undergraduate | 6,233 | 22.9% |
| Graduate / Professional | 1,091 | 4.0% |
| Total | 27,215 | 100.0% |
School Enrollment by Age by Funding Source in Chautauqua County
Out of a total of 27,215 students who are enrolled in schools in Chautauqua County, 3,021 (11.1%) attend a private institution, while the remaining 24,194 (88.9%) are enrolled in public schools. The age group of 35 years and over has the highest likelihood of being enrolled in private schools, with 404 (44.7% in the age bracket) enrolled. Conversely, the age group of 15 to 17 year olds has the lowest likelihood of being enrolled in a private school, with 4,050 (92.9% in the age bracket) attending a public institution.
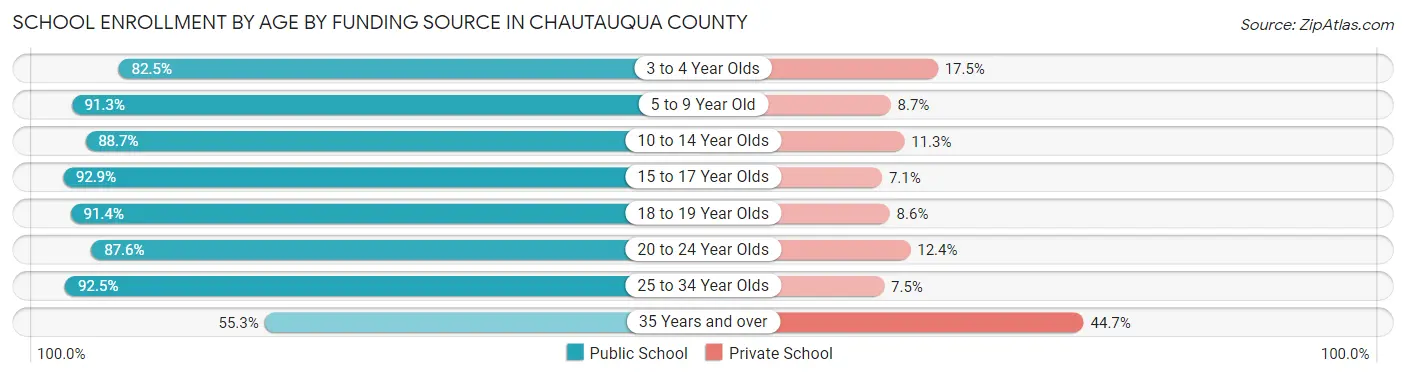
| Age Bracket | Public School | Private School |
| 3 to 4 Year Olds | 867 (82.5%) | 184 (17.5%) |
| 5 to 9 Year Old | 6,173 (91.3%) | 591 (8.7%) |
| 10 to 14 Year Olds | 6,296 (88.7%) | 801 (11.3%) |
| 15 to 17 Year Olds | 4,050 (92.9%) | 311 (7.1%) |
| 18 to 19 Year Olds | 2,517 (91.4%) | 236 (8.6%) |
| 20 to 24 Year Olds | 2,951 (87.6%) | 418 (12.4%) |
| 25 to 34 Year Olds | 847 (92.5%) | 69 (7.5%) |
| 35 Years and over | 500 (55.3%) | 404 (44.7%) |
| Total | 24,194 (88.9%) | 3,021 (11.1%) |
Educational Attainment by Field of Study in Chautauqua County
Education (5,179 | 22.0%), business (3,087 | 13.1%), science & technology (2,511 | 10.7%), social sciences (1,602 | 6.8%), and arts & humanities (1,494 | 6.4%) are the most common fields of study among 23,518 individuals in Chautauqua County who have obtained a bachelor's degree or higher.
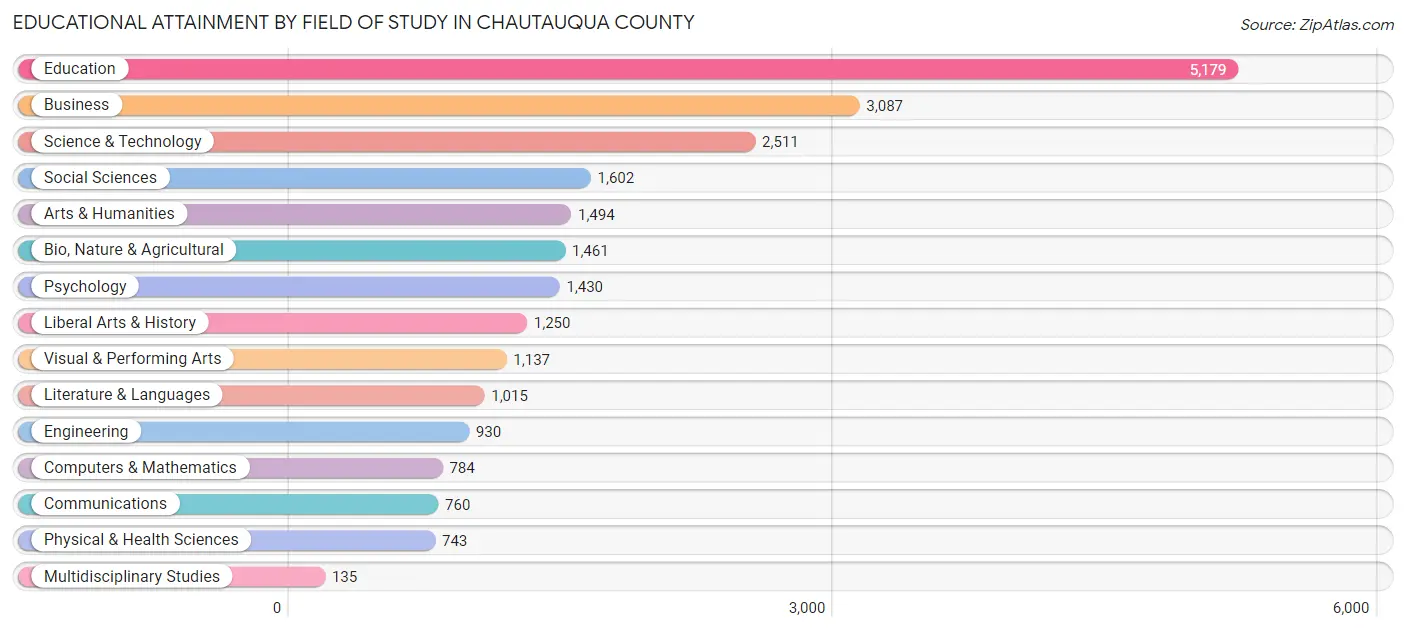
| Field of Study | # Graduates | % Graduates |
| Computers & Mathematics | 784 | 3.3% |
| Bio, Nature & Agricultural | 1,461 | 6.2% |
| Physical & Health Sciences | 743 | 3.2% |
| Psychology | 1,430 | 6.1% |
| Social Sciences | 1,602 | 6.8% |
| Engineering | 930 | 4.0% |
| Multidisciplinary Studies | 135 | 0.6% |
| Science & Technology | 2,511 | 10.7% |
| Business | 3,087 | 13.1% |
| Education | 5,179 | 22.0% |
| Literature & Languages | 1,015 | 4.3% |
| Liberal Arts & History | 1,250 | 5.3% |
| Visual & Performing Arts | 1,137 | 4.8% |
| Communications | 760 | 3.2% |
| Arts & Humanities | 1,494 | 6.4% |
| Total | 23,518 | 100.0% |
Transportation & Commute in Chautauqua County
Vehicle Availability by Sex in Chautauqua County
The most prevalent vehicle ownership categories in Chautauqua County are males with 2 vehicles (12,480, accounting for 44.6%) and females with 2 vehicles (10,801, making up 49.2%).
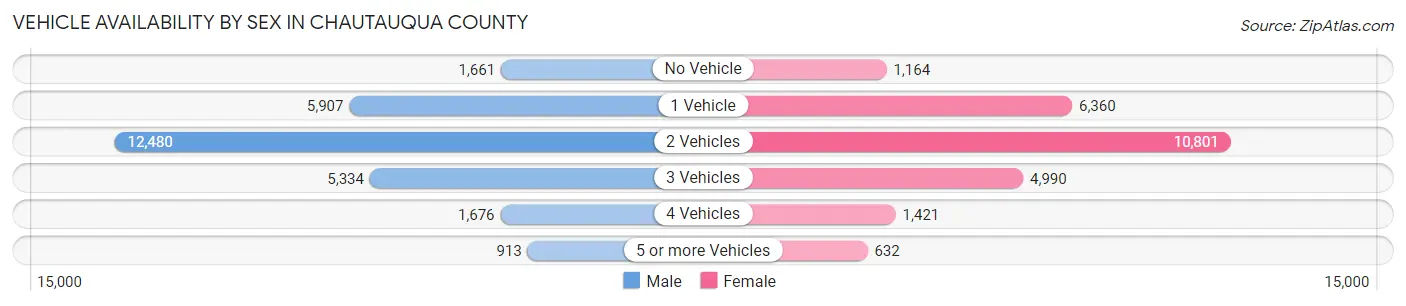
| Vehicles Available | Male | Female |
| No Vehicle | 1,661 (5.9%) | 1,164 (4.6%) |
| 1 Vehicle | 5,907 (21.1%) | 6,360 (25.1%) |
| 2 Vehicles | 12,480 (44.6%) | 10,801 (42.6%) |
| 3 Vehicles | 5,334 (19.1%) | 4,990 (19.7%) |
| 4 Vehicles | 1,676 (6.0%) | 1,421 (5.6%) |
| 5 or more Vehicles | 913 (3.3%) | 632 (2.5%) |
| Total | 27,971 (100.0%) | 25,368 (100.0%) |
Commute Time in Chautauqua County
The most frequently occuring commute durations in Chautauqua County are 5 to 9 minutes (10,323 commuters, 20.4%), 10 to 14 minutes (9,937 commuters, 19.6%), and 15 to 19 minutes (7,961 commuters, 15.7%).
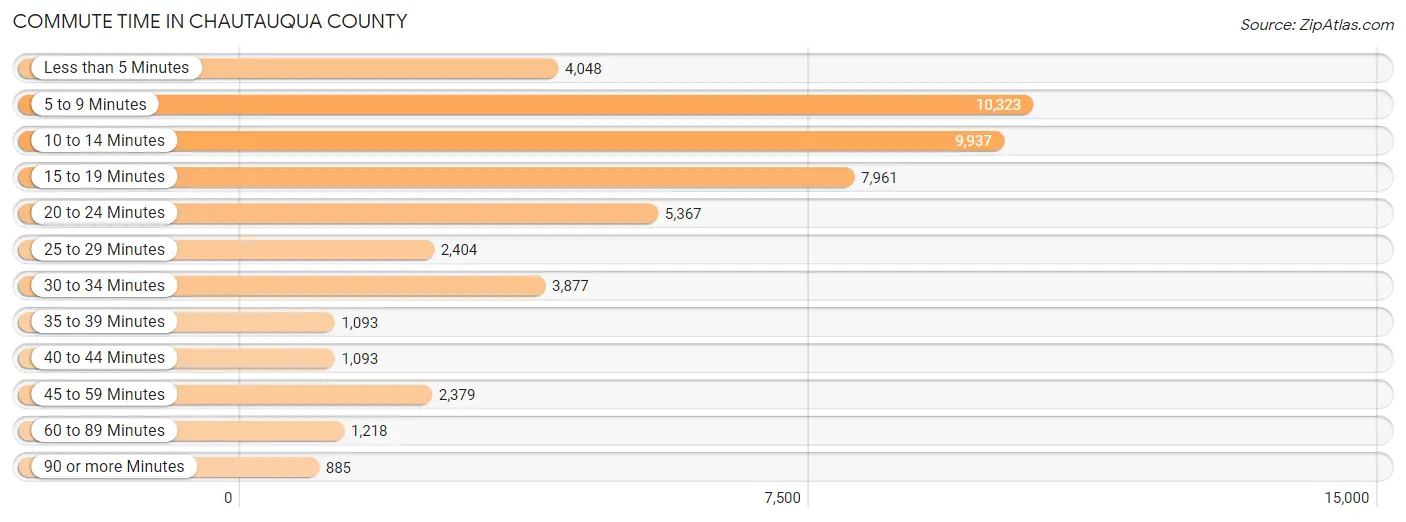
| Commute Time | # Commuters | % Commuters |
| Less than 5 Minutes | 4,048 | 8.0% |
| 5 to 9 Minutes | 10,323 | 20.4% |
| 10 to 14 Minutes | 9,937 | 19.6% |
| 15 to 19 Minutes | 7,961 | 15.7% |
| 20 to 24 Minutes | 5,367 | 10.6% |
| 25 to 29 Minutes | 2,404 | 4.8% |
| 30 to 34 Minutes | 3,877 | 7.7% |
| 35 to 39 Minutes | 1,093 | 2.2% |
| 40 to 44 Minutes | 1,093 | 2.2% |
| 45 to 59 Minutes | 2,379 | 4.7% |
| 60 to 89 Minutes | 1,218 | 2.4% |
| 90 or more Minutes | 885 | 1.8% |
Commute Time by Sex in Chautauqua County
The most common commute times in Chautauqua County are 10 to 14 minutes (5,487 commuters, 20.5%) for males and 5 to 9 minutes (5,076 commuters, 21.3%) for females.
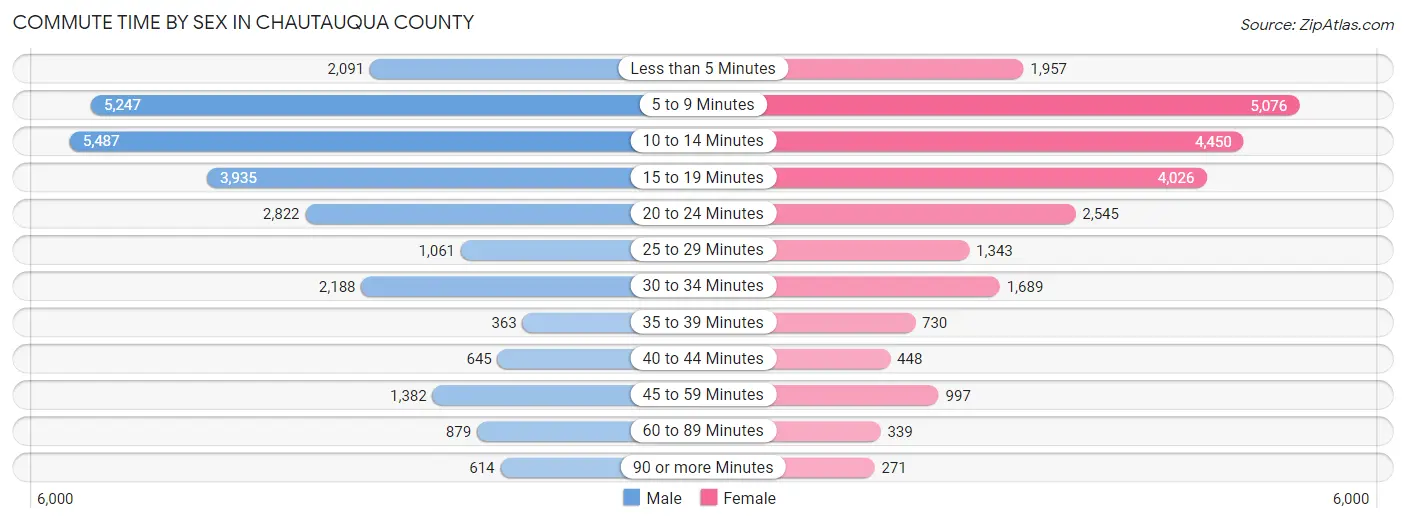
| Commute Time | Male | Female |
| Less than 5 Minutes | 2,091 (7.8%) | 1,957 (8.2%) |
| 5 to 9 Minutes | 5,247 (19.6%) | 5,076 (21.3%) |
| 10 to 14 Minutes | 5,487 (20.5%) | 4,450 (18.6%) |
| 15 to 19 Minutes | 3,935 (14.7%) | 4,026 (16.9%) |
| 20 to 24 Minutes | 2,822 (10.6%) | 2,545 (10.7%) |
| 25 to 29 Minutes | 1,061 (4.0%) | 1,343 (5.6%) |
| 30 to 34 Minutes | 2,188 (8.2%) | 1,689 (7.1%) |
| 35 to 39 Minutes | 363 (1.4%) | 730 (3.1%) |
| 40 to 44 Minutes | 645 (2.4%) | 448 (1.9%) |
| 45 to 59 Minutes | 1,382 (5.2%) | 997 (4.2%) |
| 60 to 89 Minutes | 879 (3.3%) | 339 (1.4%) |
| 90 or more Minutes | 614 (2.3%) | 271 (1.1%) |
Time of Departure to Work by Sex in Chautauqua County
The most frequent times of departure to work in Chautauqua County are 7:00 AM to 7:29 AM (3,193, 11.9%) for males and 7:30 AM to 7:59 AM (4,034, 16.9%) for females.
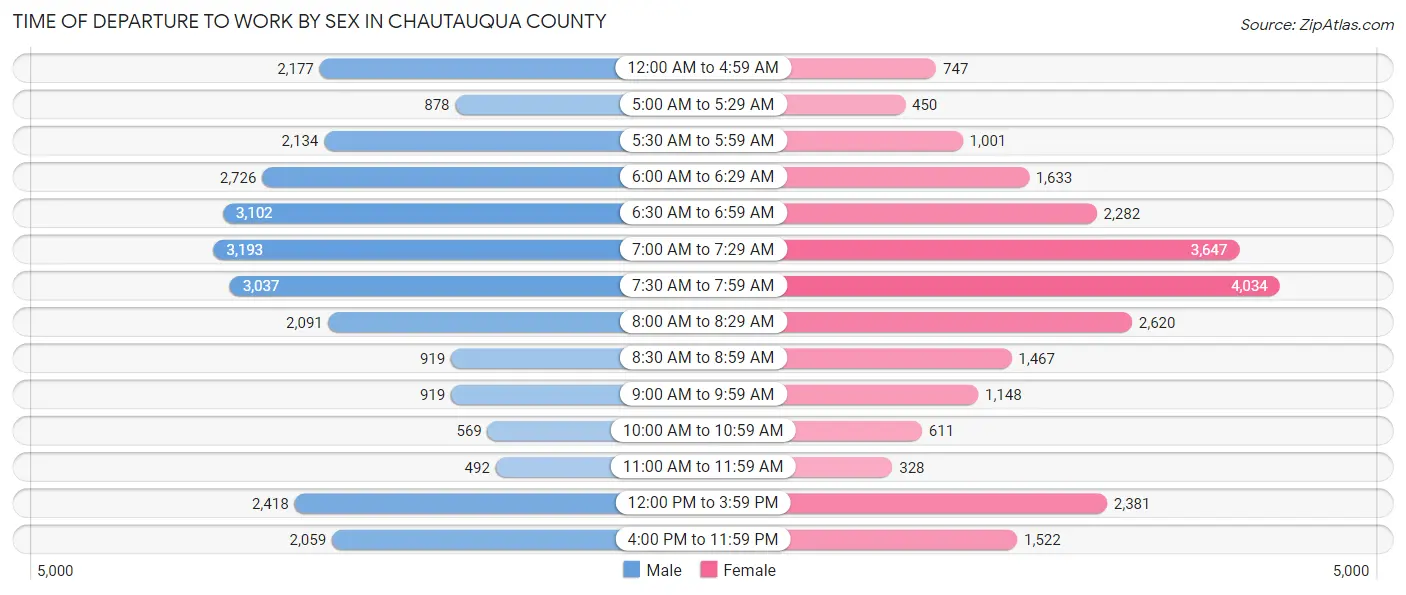
| Time of Departure | Male | Female |
| 12:00 AM to 4:59 AM | 2,177 (8.2%) | 747 (3.1%) |
| 5:00 AM to 5:29 AM | 878 (3.3%) | 450 (1.9%) |
| 5:30 AM to 5:59 AM | 2,134 (8.0%) | 1,001 (4.2%) |
| 6:00 AM to 6:29 AM | 2,726 (10.2%) | 1,633 (6.8%) |
| 6:30 AM to 6:59 AM | 3,102 (11.6%) | 2,282 (9.6%) |
| 7:00 AM to 7:29 AM | 3,193 (11.9%) | 3,647 (15.3%) |
| 7:30 AM to 7:59 AM | 3,037 (11.4%) | 4,034 (16.9%) |
| 8:00 AM to 8:29 AM | 2,091 (7.8%) | 2,620 (11.0%) |
| 8:30 AM to 8:59 AM | 919 (3.4%) | 1,467 (6.1%) |
| 9:00 AM to 9:59 AM | 919 (3.4%) | 1,148 (4.8%) |
| 10:00 AM to 10:59 AM | 569 (2.1%) | 611 (2.6%) |
| 11:00 AM to 11:59 AM | 492 (1.8%) | 328 (1.4%) |
| 12:00 PM to 3:59 PM | 2,418 (9.0%) | 2,381 (10.0%) |
| 4:00 PM to 11:59 PM | 2,059 (7.7%) | 1,522 (6.4%) |
| Total | 26,714 (100.0%) | 23,871 (100.0%) |
Housing Occupancy in Chautauqua County
Occupancy by Ownership in Chautauqua County
Of the total 53,405 dwellings in Chautauqua County, owner-occupied units account for 36,891 (69.1%), while renter-occupied units make up 16,514 (30.9%).
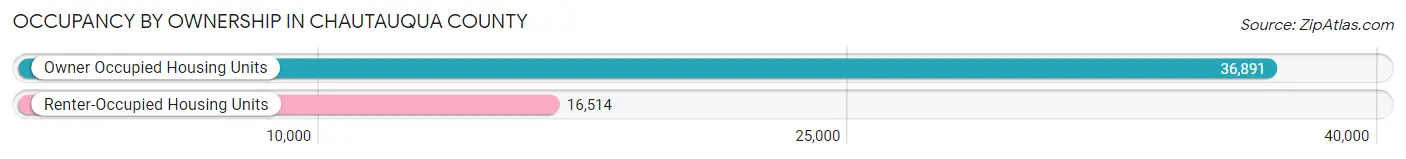
| Occupancy | # Housing Units | % Housing Units |
| Owner Occupied Housing Units | 36,891 | 69.1% |
| Renter-Occupied Housing Units | 16,514 | 30.9% |
| Total Occupied Housing Units | 53,405 | 100.0% |
Occupancy by Household Size in Chautauqua County
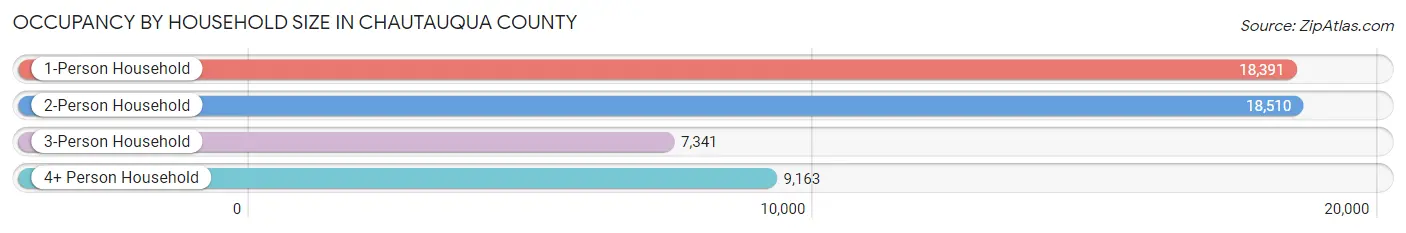
| Household Size | # Housing Units | % Housing Units |
| 1-Person Household | 18,391 | 34.4% |
| 2-Person Household | 18,510 | 34.7% |
| 3-Person Household | 7,341 | 13.8% |
| 4+ Person Household | 9,163 | 17.2% |
| Total Housing Units | 53,405 | 100.0% |
Occupancy by Ownership by Household Size in Chautauqua County
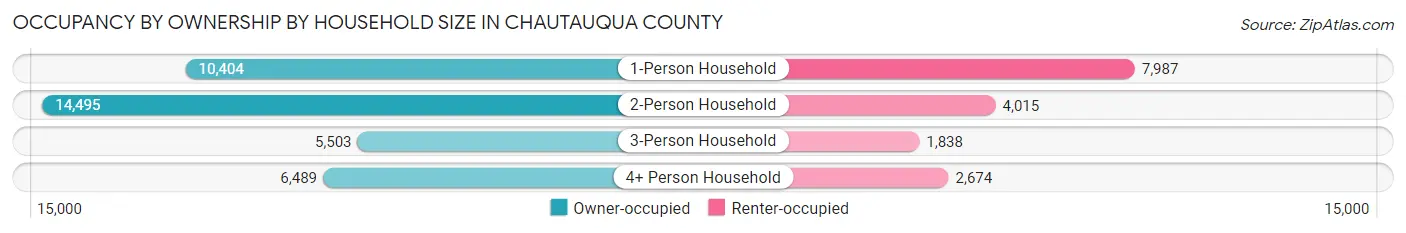
| Household Size | Owner-occupied | Renter-occupied |
| 1-Person Household | 10,404 (56.6%) | 7,987 (43.4%) |
| 2-Person Household | 14,495 (78.3%) | 4,015 (21.7%) |
| 3-Person Household | 5,503 (75.0%) | 1,838 (25.0%) |
| 4+ Person Household | 6,489 (70.8%) | 2,674 (29.2%) |
| Total Housing Units | 36,891 (69.1%) | 16,514 (30.9%) |
Occupancy by Educational Attainment in Chautauqua County
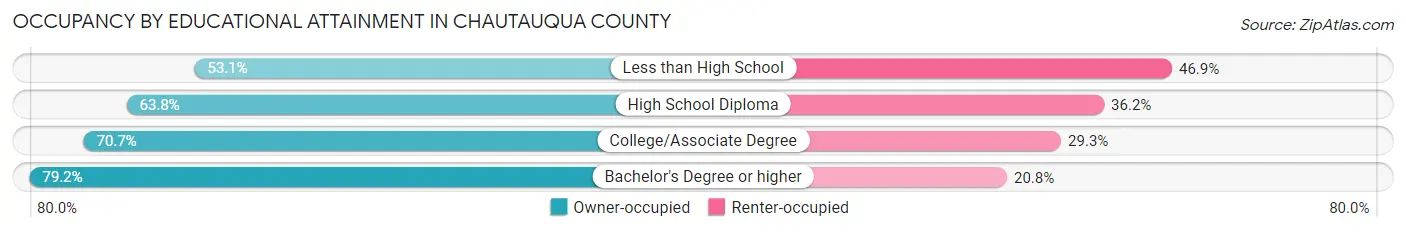
| Household Size | Owner-occupied | Renter-occupied |
| Less than High School | 2,500 (53.1%) | 2,211 (46.9%) |
| High School Diploma | 10,945 (63.8%) | 6,199 (36.2%) |
| College/Associate Degree | 12,804 (70.7%) | 5,316 (29.3%) |
| Bachelor's Degree or higher | 10,642 (79.2%) | 2,788 (20.8%) |
Occupancy by Age of Householder in Chautauqua County
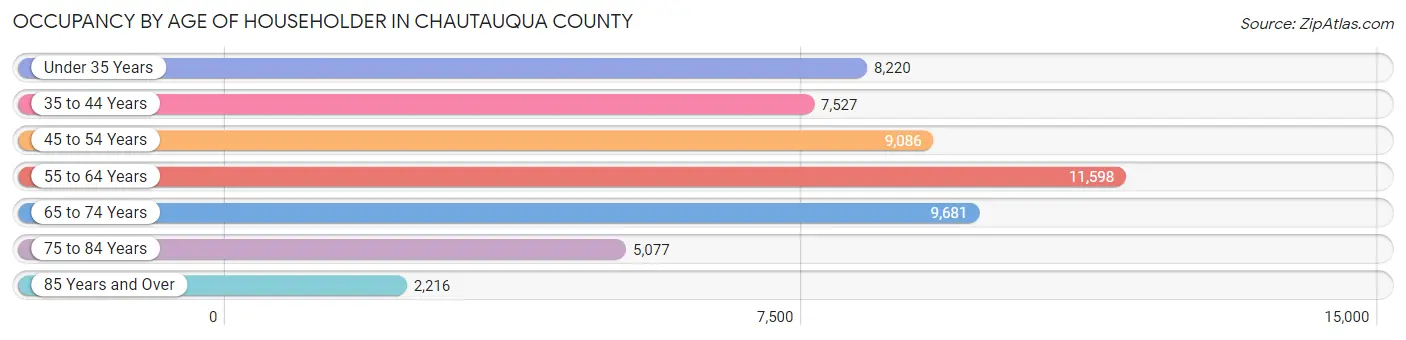
| Age Bracket | # Households | % Households |
| Under 35 Years | 8,220 | 15.4% |
| 35 to 44 Years | 7,527 | 14.1% |
| 45 to 54 Years | 9,086 | 17.0% |
| 55 to 64 Years | 11,598 | 21.7% |
| 65 to 74 Years | 9,681 | 18.1% |
| 75 to 84 Years | 5,077 | 9.5% |
| 85 Years and Over | 2,216 | 4.2% |
| Total | 53,405 | 100.0% |
Housing Finances in Chautauqua County
Median Income by Occupancy in Chautauqua County
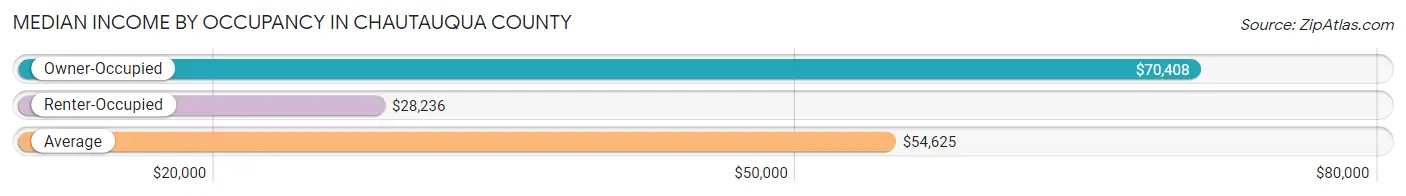
| Occupancy Type | # Households | Median Income |
| Owner-Occupied | 36,891 (69.1%) | $70,408 |
| Renter-Occupied | 16,514 (30.9%) | $28,236 |
| Average | 53,405 (100.0%) | $54,625 |
Occupancy by Householder Income Bracket in Chautauqua County
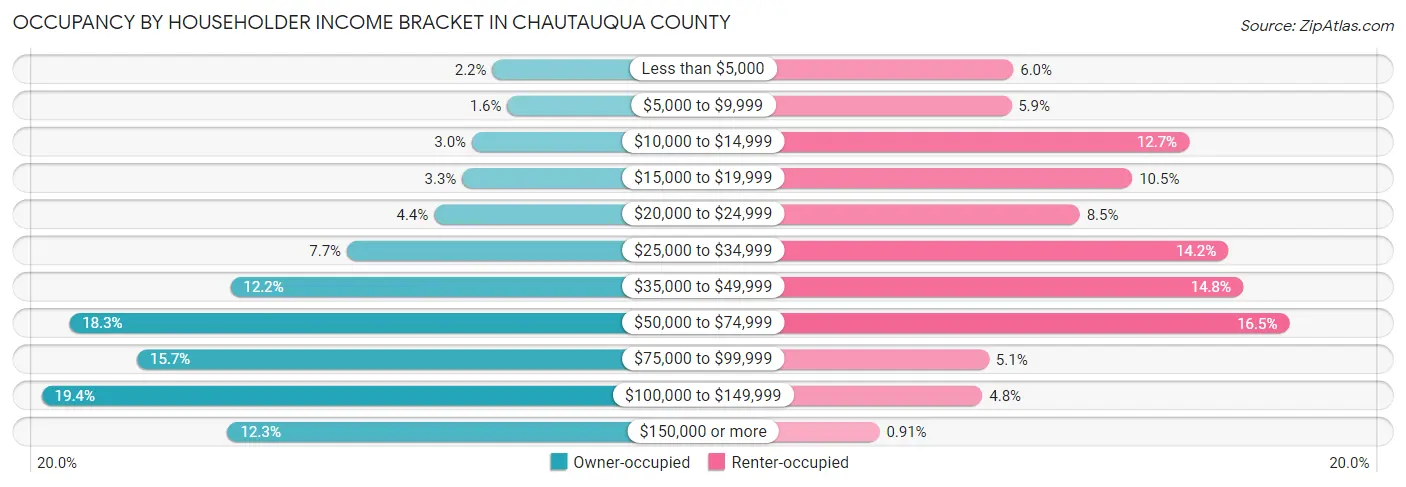
| Income Bracket | Owner-occupied | Renter-occupied |
| Less than $5,000 | 804 (2.2%) | 993 (6.0%) |
| $5,000 to $9,999 | 594 (1.6%) | 980 (5.9%) |
| $10,000 to $14,999 | 1,091 (3.0%) | 2,097 (12.7%) |
| $15,000 to $19,999 | 1,228 (3.3%) | 1,740 (10.5%) |
| $20,000 to $24,999 | 1,623 (4.4%) | 1,410 (8.5%) |
| $25,000 to $34,999 | 2,847 (7.7%) | 2,344 (14.2%) |
| $35,000 to $49,999 | 4,486 (12.2%) | 2,435 (14.7%) |
| $50,000 to $74,999 | 6,752 (18.3%) | 2,728 (16.5%) |
| $75,000 to $99,999 | 5,801 (15.7%) | 839 (5.1%) |
| $100,000 to $149,999 | 7,140 (19.4%) | 797 (4.8%) |
| $150,000 or more | 4,525 (12.3%) | 151 (0.9%) |
| Total | 36,891 (100.0%) | 16,514 (100.0%) |
Monthly Housing Cost Tiers in Chautauqua County
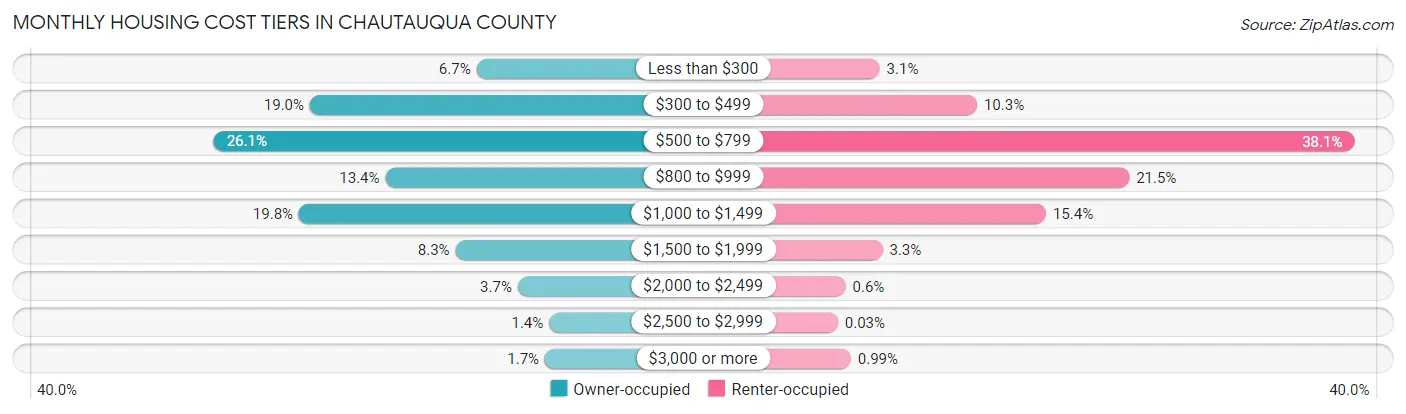
| Monthly Cost | Owner-occupied | Renter-occupied |
| Less than $300 | 2,478 (6.7%) | 513 (3.1%) |
| $300 to $499 | 7,006 (19.0%) | 1,698 (10.3%) |
| $500 to $799 | 9,617 (26.1%) | 6,285 (38.1%) |
| $800 to $999 | 4,955 (13.4%) | 3,549 (21.5%) |
| $1,000 to $1,499 | 7,305 (19.8%) | 2,537 (15.4%) |
| $1,500 to $1,999 | 3,051 (8.3%) | 549 (3.3%) |
| $2,000 to $2,499 | 1,356 (3.7%) | 99 (0.6%) |
| $2,500 to $2,999 | 505 (1.4%) | 5 (0.0%) |
| $3,000 or more | 618 (1.7%) | 163 (1.0%) |
| Total | 36,891 (100.0%) | 16,514 (100.0%) |
Physical Housing Characteristics in Chautauqua County
Housing Structures in Chautauqua County
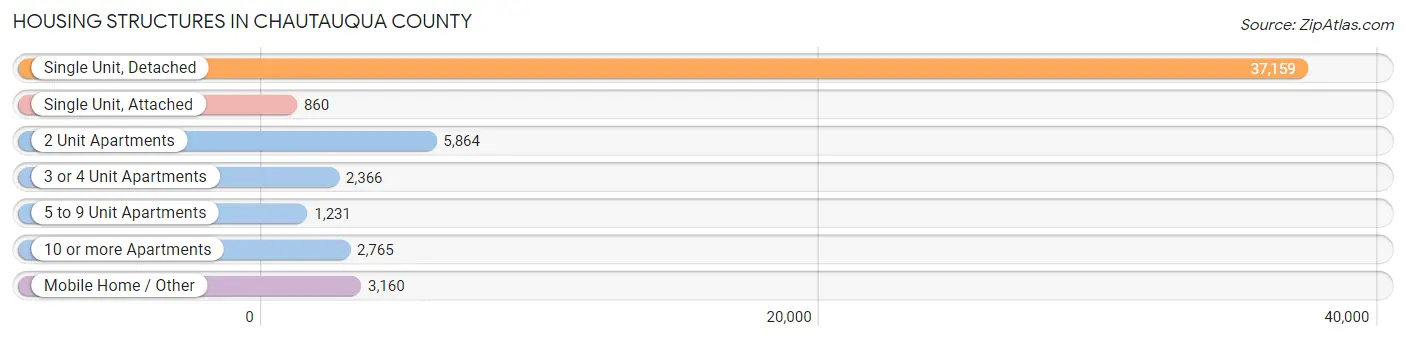
| Structure Type | # Housing Units | % Housing Units |
| Single Unit, Detached | 37,159 | 69.6% |
| Single Unit, Attached | 860 | 1.6% |
| 2 Unit Apartments | 5,864 | 11.0% |
| 3 or 4 Unit Apartments | 2,366 | 4.4% |
| 5 to 9 Unit Apartments | 1,231 | 2.3% |
| 10 or more Apartments | 2,765 | 5.2% |
| Mobile Home / Other | 3,160 | 5.9% |
| Total | 53,405 | 100.0% |
Housing Structures by Occupancy in Chautauqua County
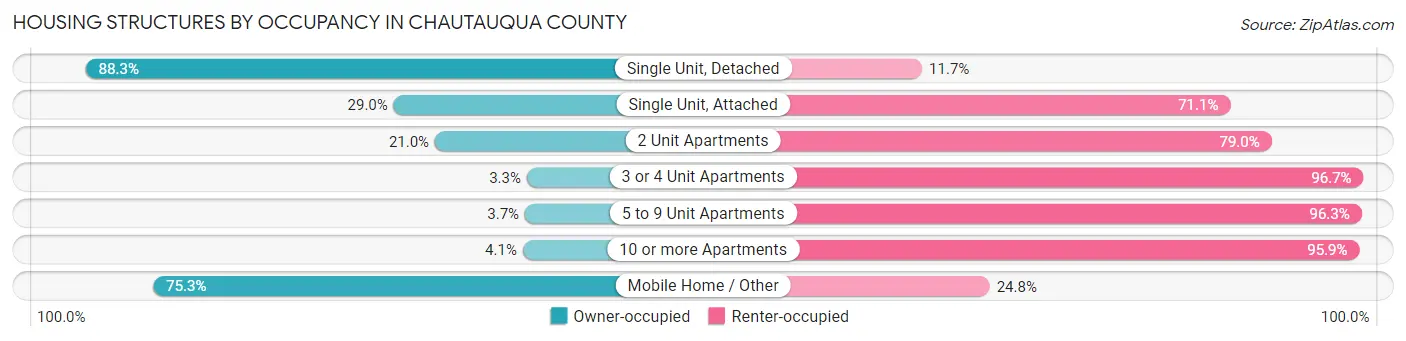
| Structure Type | Owner-occupied | Renter-occupied |
| Single Unit, Detached | 32,797 (88.3%) | 4,362 (11.7%) |
| Single Unit, Attached | 249 (28.9%) | 611 (71.1%) |
| 2 Unit Apartments | 1,231 (21.0%) | 4,633 (79.0%) |
| 3 or 4 Unit Apartments | 78 (3.3%) | 2,288 (96.7%) |
| 5 to 9 Unit Apartments | 45 (3.7%) | 1,186 (96.3%) |
| 10 or more Apartments | 113 (4.1%) | 2,652 (95.9%) |
| Mobile Home / Other | 2,378 (75.2%) | 782 (24.7%) |
| Total | 36,891 (69.1%) | 16,514 (30.9%) |
Housing Structures by Number of Rooms in Chautauqua County
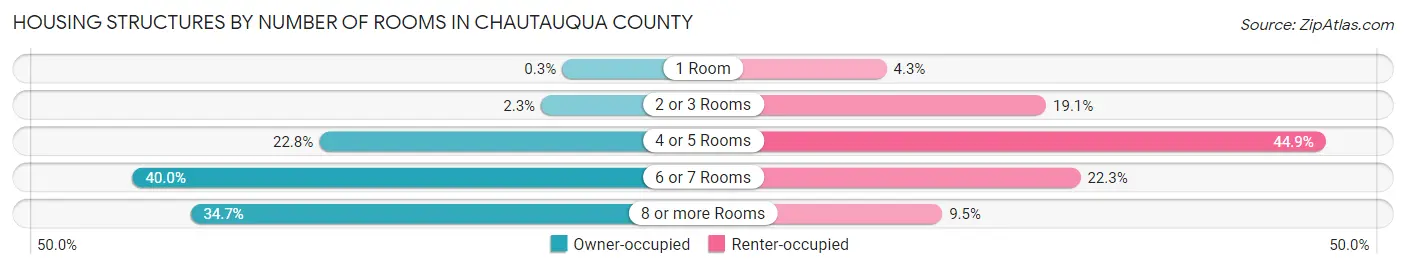
| Number of Rooms | Owner-occupied | Renter-occupied |
| 1 Room | 109 (0.3%) | 713 (4.3%) |
| 2 or 3 Rooms | 831 (2.2%) | 3,149 (19.1%) |
| 4 or 5 Rooms | 8,400 (22.8%) | 7,416 (44.9%) |
| 6 or 7 Rooms | 14,765 (40.0%) | 3,674 (22.3%) |
| 8 or more Rooms | 12,786 (34.7%) | 1,562 (9.5%) |
| Total | 36,891 (100.0%) | 16,514 (100.0%) |
Housing Structure by Heating Type in Chautauqua County
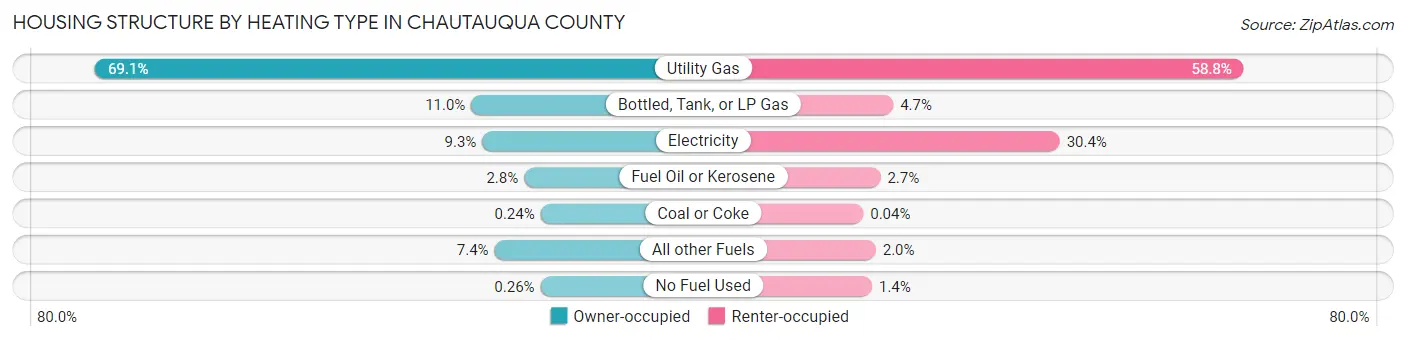
| Heating Type | Owner-occupied | Renter-occupied |
| Utility Gas | 25,497 (69.1%) | 9,715 (58.8%) |
| Bottled, Tank, or LP Gas | 4,044 (11.0%) | 772 (4.7%) |
| Electricity | 3,417 (9.3%) | 5,020 (30.4%) |
| Fuel Oil or Kerosene | 1,031 (2.8%) | 445 (2.7%) |
| Coal or Coke | 88 (0.2%) | 6 (0.0%) |
| All other Fuels | 2,719 (7.4%) | 326 (2.0%) |
| No Fuel Used | 95 (0.3%) | 230 (1.4%) |
| Total | 36,891 (100.0%) | 16,514 (100.0%) |
Household Vehicle Usage in Chautauqua County
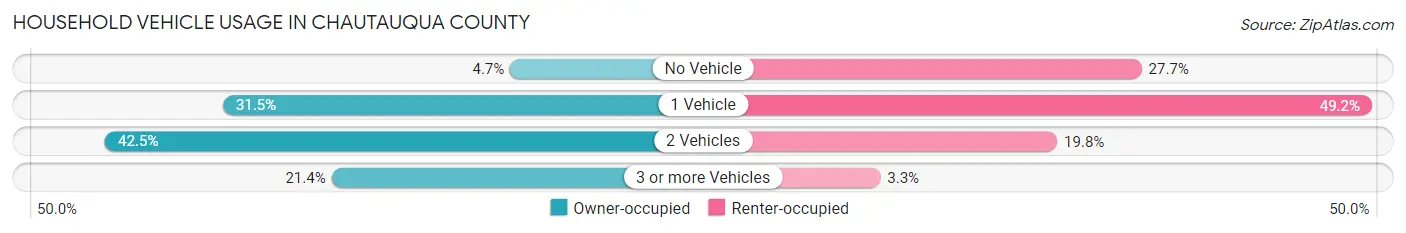
| Vehicles per Household | Owner-occupied | Renter-occupied |
| No Vehicle | 1,727 (4.7%) | 4,575 (27.7%) |
| 1 Vehicle | 11,617 (31.5%) | 8,121 (49.2%) |
| 2 Vehicles | 15,672 (42.5%) | 3,271 (19.8%) |
| 3 or more Vehicles | 7,875 (21.3%) | 547 (3.3%) |
| Total | 36,891 (100.0%) | 16,514 (100.0%) |
Real Estate & Mortgages in Chautauqua County
Real Estate and Mortgage Overview in Chautauqua County
| Characteristic | Without Mortgage | With Mortgage |
| Housing Units | 18,078 | 18,813 |
| Median Property Value | $99,600 | $121,700 |
| Median Household Income | $54,350 | $3,239 |
| Monthly Housing Costs | $496 | $589 |
| Real Estate Taxes | $2,493 | $447 |
Property Value by Mortgage Status in Chautauqua County
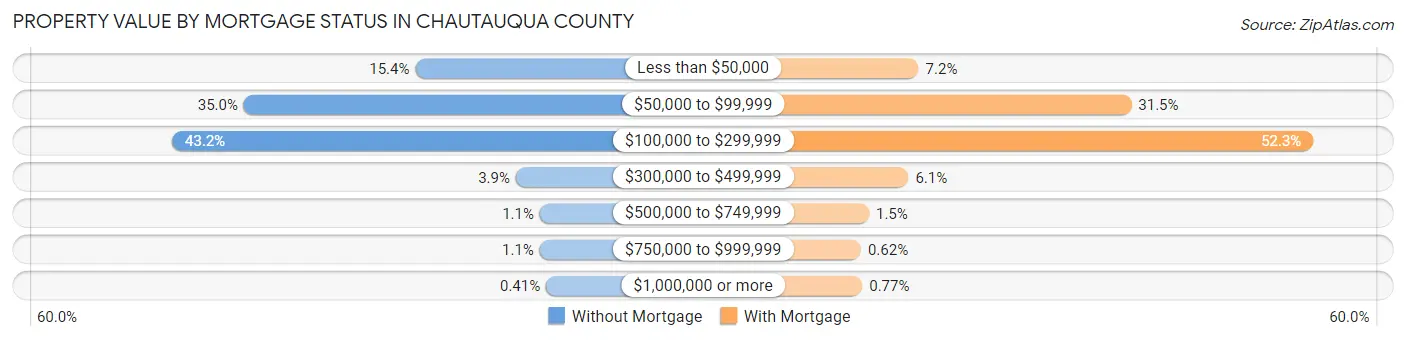
| Property Value | Without Mortgage | With Mortgage |
| Less than $50,000 | 2,775 (15.3%) | 1,356 (7.2%) |
| $50,000 to $99,999 | 6,319 (34.9%) | 5,930 (31.5%) |
| $100,000 to $299,999 | 7,803 (43.2%) | 9,840 (52.3%) |
| $300,000 to $499,999 | 698 (3.9%) | 1,138 (6.0%) |
| $500,000 to $749,999 | 203 (1.1%) | 289 (1.5%) |
| $750,000 to $999,999 | 205 (1.1%) | 116 (0.6%) |
| $1,000,000 or more | 75 (0.4%) | 144 (0.8%) |
| Total | 18,078 (100.0%) | 18,813 (100.0%) |
Household Income by Mortgage Status in Chautauqua County
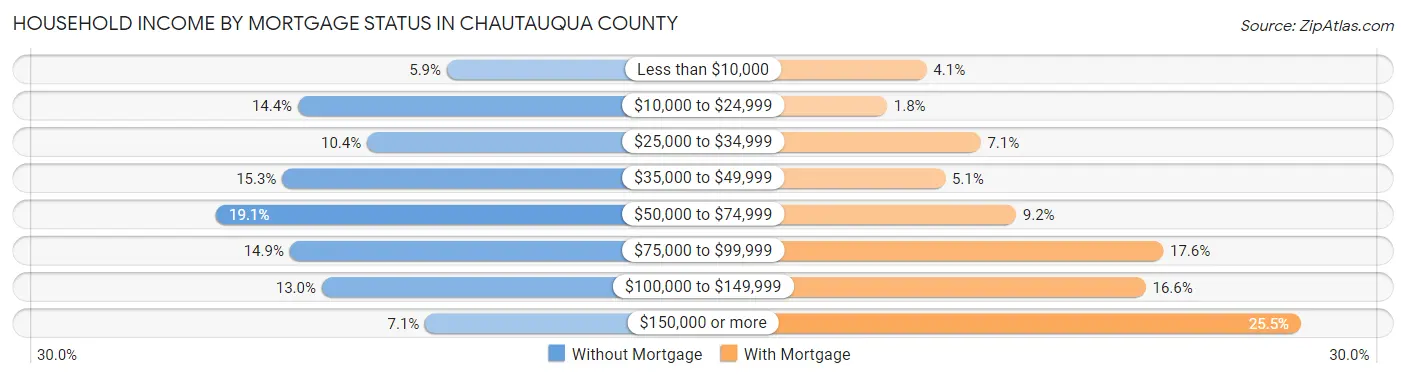
| Household Income | Without Mortgage | With Mortgage |
| Less than $10,000 | 1,062 (5.9%) | 761 (4.1%) |
| $10,000 to $24,999 | 2,599 (14.4%) | 336 (1.8%) |
| $25,000 to $34,999 | 1,886 (10.4%) | 1,343 (7.1%) |
| $35,000 to $49,999 | 2,762 (15.3%) | 961 (5.1%) |
| $50,000 to $74,999 | 3,446 (19.1%) | 1,724 (9.2%) |
| $75,000 to $99,999 | 2,684 (14.8%) | 3,306 (17.6%) |
| $100,000 to $149,999 | 2,353 (13.0%) | 3,117 (16.6%) |
| $150,000 or more | 1,286 (7.1%) | 4,787 (25.5%) |
| Total | 18,078 (100.0%) | 18,813 (100.0%) |
Property Value to Household Income Ratio in Chautauqua County
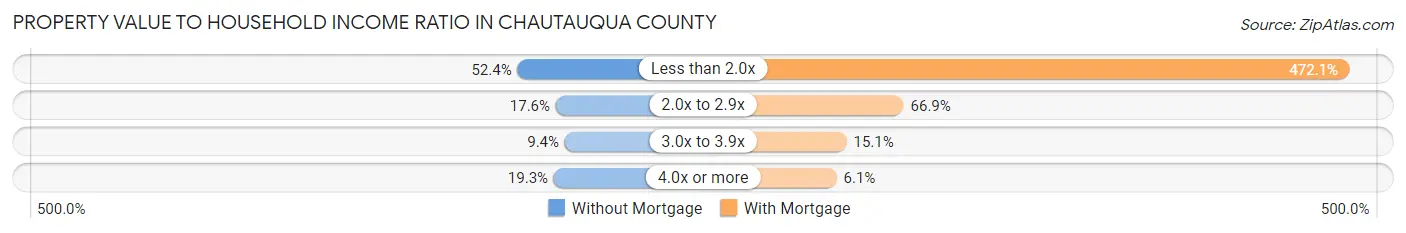
| Value-to-Income Ratio | Without Mortgage | With Mortgage |
| Less than 2.0x | 9,477 (52.4%) | 88,819 (472.1%) |
| 2.0x to 2.9x | 3,180 (17.6%) | 12,587 (66.9%) |
| 3.0x to 3.9x | 1,700 (9.4%) | 2,837 (15.1%) |
| 4.0x or more | 3,497 (19.3%) | 1,143 (6.1%) |
| Total | 18,078 (100.0%) | 18,813 (100.0%) |
Real Estate Taxes by Mortgage Status in Chautauqua County
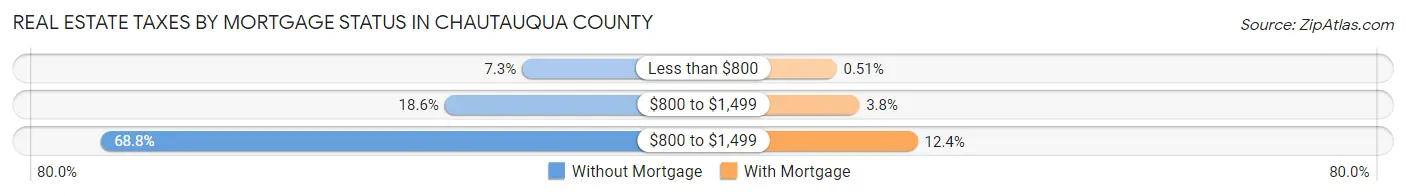
| Property Taxes | Without Mortgage | With Mortgage |
| Less than $800 | 1,323 (7.3%) | 96 (0.5%) |
| $800 to $1,499 | 3,367 (18.6%) | 718 (3.8%) |
| $800 to $1,499 | 12,437 (68.8%) | 2,326 (12.4%) |
| Total | 18,078 (100.0%) | 18,813 (100.0%) |
Health & Disability in Chautauqua County
Health Insurance Coverage by Age in Chautauqua County
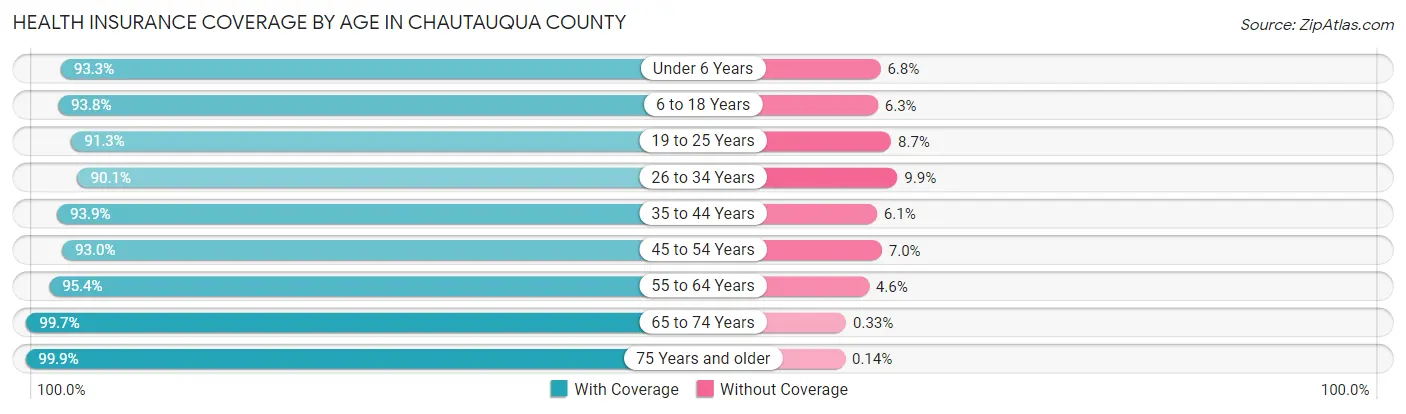
| Age Bracket | With Coverage | Without Coverage |
| Under 6 Years | 7,443 (93.2%) | 539 (6.8%) |
| 6 to 18 Years | 18,549 (93.8%) | 1,237 (6.2%) |
| 19 to 25 Years | 10,466 (91.3%) | 1,001 (8.7%) |
| 26 to 34 Years | 11,288 (90.1%) | 1,240 (9.9%) |
| 35 to 44 Years | 13,085 (93.9%) | 847 (6.1%) |
| 45 to 54 Years | 14,096 (93.0%) | 1,061 (7.0%) |
| 55 to 64 Years | 18,208 (95.4%) | 876 (4.6%) |
| 65 to 74 Years | 15,118 (99.7%) | 50 (0.3%) |
| 75 Years and older | 10,536 (99.9%) | 15 (0.1%) |
| Total | 118,789 (94.5%) | 6,866 (5.5%) |
Health Insurance Coverage by Citizenship Status in Chautauqua County
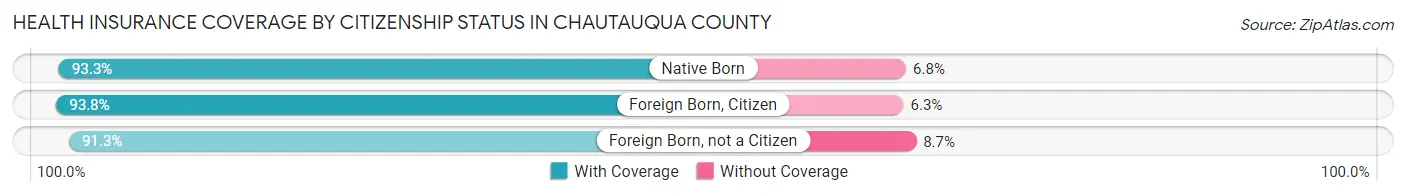
| Citizenship Status | With Coverage | Without Coverage |
| Native Born | 7,443 (93.2%) | 539 (6.8%) |
| Foreign Born, Citizen | 18,549 (93.8%) | 1,237 (6.2%) |
| Foreign Born, not a Citizen | 10,466 (91.3%) | 1,001 (8.7%) |
Health Insurance Coverage by Household Income in Chautauqua County
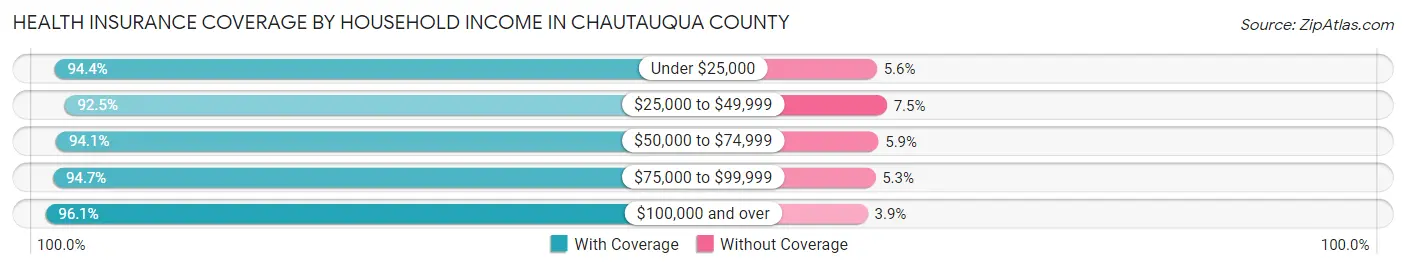
| Household Income | With Coverage | Without Coverage |
| Under $25,000 | 19,261 (94.4%) | 1,143 (5.6%) |
| $25,000 to $49,999 | 22,671 (92.5%) | 1,832 (7.5%) |
| $50,000 to $74,999 | 21,069 (94.1%) | 1,322 (5.9%) |
| $75,000 to $99,999 | 16,378 (94.7%) | 921 (5.3%) |
| $100,000 and over | 36,155 (96.1%) | 1,467 (3.9%) |
Public vs Private Health Insurance Coverage by Age in Chautauqua County
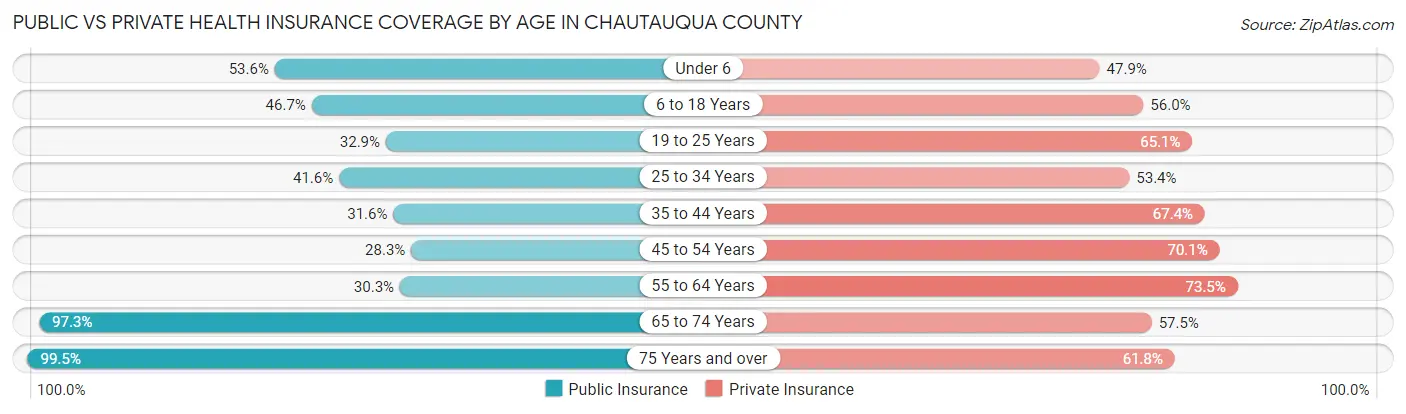
| Age Bracket | Public Insurance | Private Insurance |
| Under 6 | 4,276 (53.6%) | 3,820 (47.9%) |
| 6 to 18 Years | 9,245 (46.7%) | 11,076 (56.0%) |
| 19 to 25 Years | 3,777 (32.9%) | 7,460 (65.1%) |
| 25 to 34 Years | 5,215 (41.6%) | 6,687 (53.4%) |
| 35 to 44 Years | 4,399 (31.6%) | 9,389 (67.4%) |
| 45 to 54 Years | 4,282 (28.2%) | 10,627 (70.1%) |
| 55 to 64 Years | 5,791 (30.3%) | 14,020 (73.5%) |
| 65 to 74 Years | 14,759 (97.3%) | 8,725 (57.5%) |
| 75 Years and over | 10,493 (99.5%) | 6,521 (61.8%) |
| Total | 62,237 (49.5%) | 78,325 (62.3%) |
Disability Status by Sex by Age in Chautauqua County
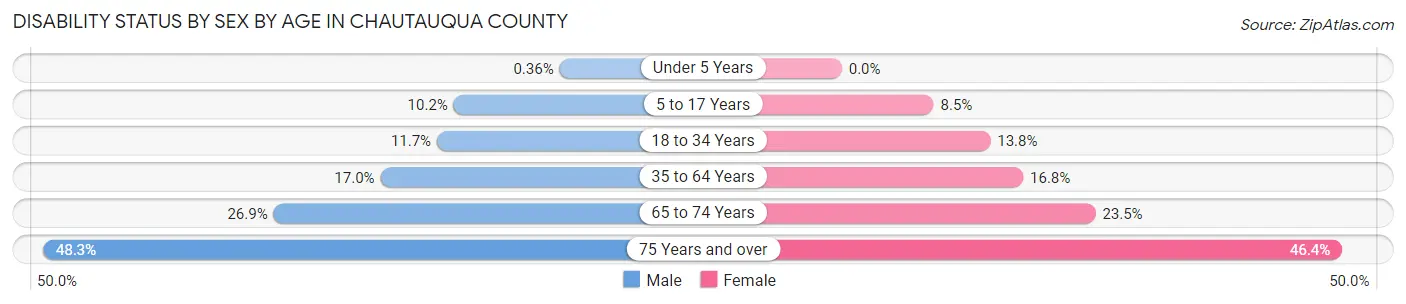
| Age Bracket | Male | Female |
| Under 5 Years | 12 (0.4%) | 0 (0.0%) |
| 5 to 17 Years | 1,004 (10.2%) | 795 (8.5%) |
| 18 to 34 Years | 1,546 (11.7%) | 1,760 (13.8%) |
| 35 to 64 Years | 4,100 (17.0%) | 4,045 (16.8%) |
| 65 to 74 Years | 1,996 (26.9%) | 1,824 (23.5%) |
| 75 Years and over | 2,151 (48.3%) | 2,831 (46.4%) |
Disability Class by Sex by Age in Chautauqua County
Disability Class: Hearing Difficulty
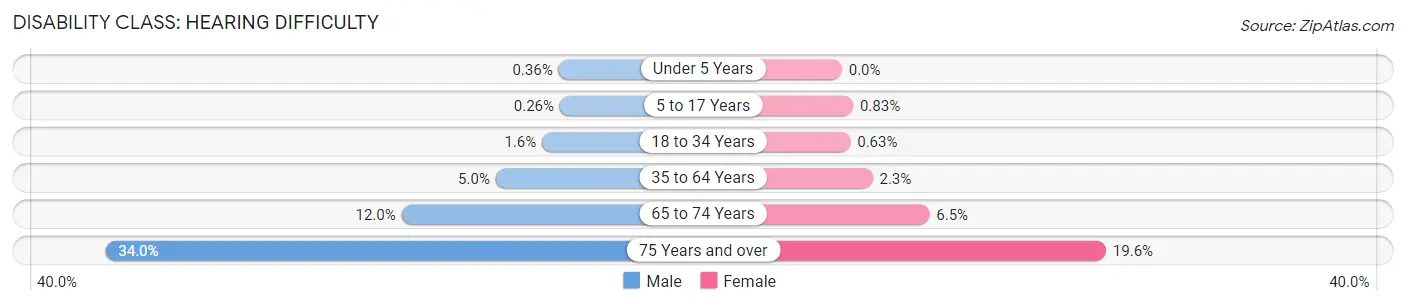
| Age Bracket | Male | Female |
| Under 5 Years | 12 (0.4%) | 0 (0.0%) |
| 5 to 17 Years | 26 (0.3%) | 77 (0.8%) |
| 18 to 34 Years | 208 (1.6%) | 80 (0.6%) |
| 35 to 64 Years | 1,211 (5.0%) | 548 (2.3%) |
| 65 to 74 Years | 891 (12.0%) | 504 (6.5%) |
| 75 Years and over | 1,514 (34.0%) | 1,196 (19.6%) |
Disability Class: Vision Difficulty
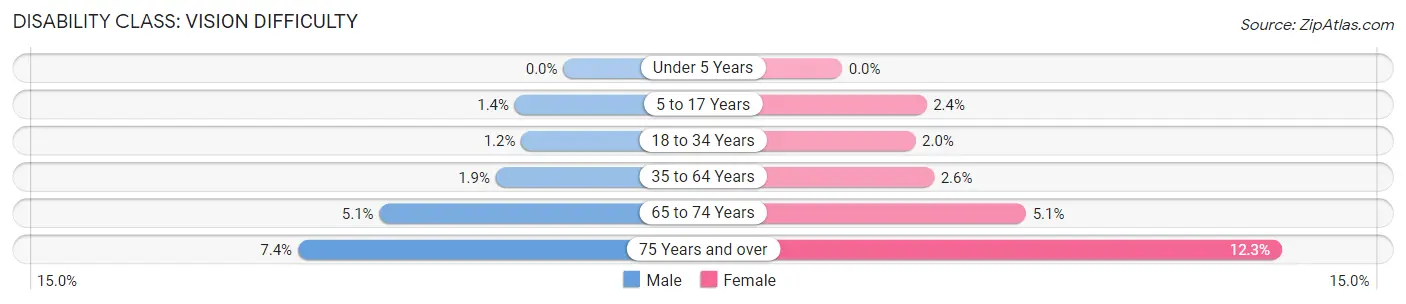
| Age Bracket | Male | Female |
| Under 5 Years | 0 (0.0%) | 0 (0.0%) |
| 5 to 17 Years | 133 (1.3%) | 219 (2.4%) |
| 18 to 34 Years | 154 (1.2%) | 261 (2.0%) |
| 35 to 64 Years | 455 (1.9%) | 614 (2.6%) |
| 65 to 74 Years | 380 (5.1%) | 397 (5.1%) |
| 75 Years and over | 329 (7.4%) | 747 (12.2%) |
Disability Class: Cognitive Difficulty
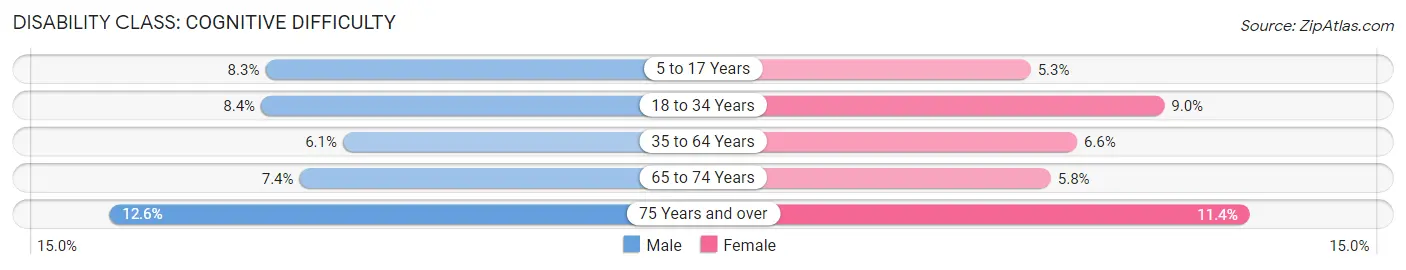
| Age Bracket | Male | Female |
| 5 to 17 Years | 819 (8.3%) | 491 (5.3%) |
| 18 to 34 Years | 1,110 (8.4%) | 1,147 (9.0%) |
| 35 to 64 Years | 1,482 (6.1%) | 1,575 (6.6%) |
| 65 to 74 Years | 545 (7.3%) | 451 (5.8%) |
| 75 Years and over | 563 (12.6%) | 692 (11.4%) |
Disability Class: Ambulatory Difficulty
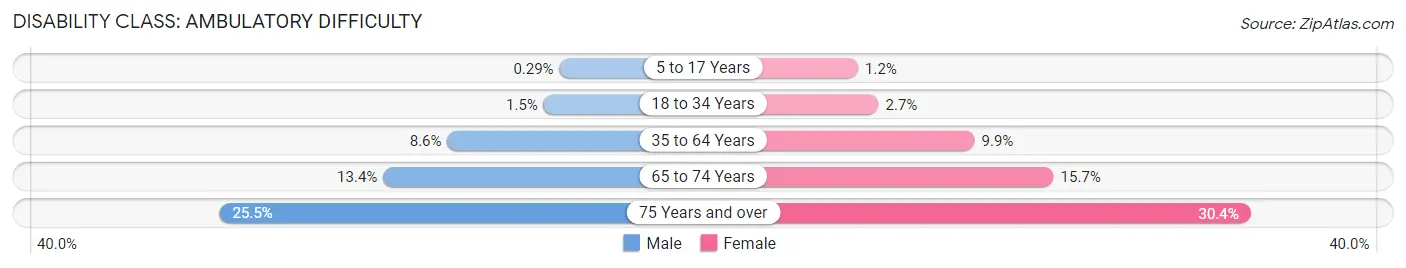
| Age Bracket | Male | Female |
| 5 to 17 Years | 29 (0.3%) | 113 (1.2%) |
| 18 to 34 Years | 192 (1.5%) | 349 (2.7%) |
| 35 to 64 Years | 2,080 (8.6%) | 2,369 (9.9%) |
| 65 to 74 Years | 993 (13.4%) | 1,219 (15.7%) |
| 75 Years and over | 1,137 (25.5%) | 1,851 (30.3%) |
Disability Class: Self-Care Difficulty
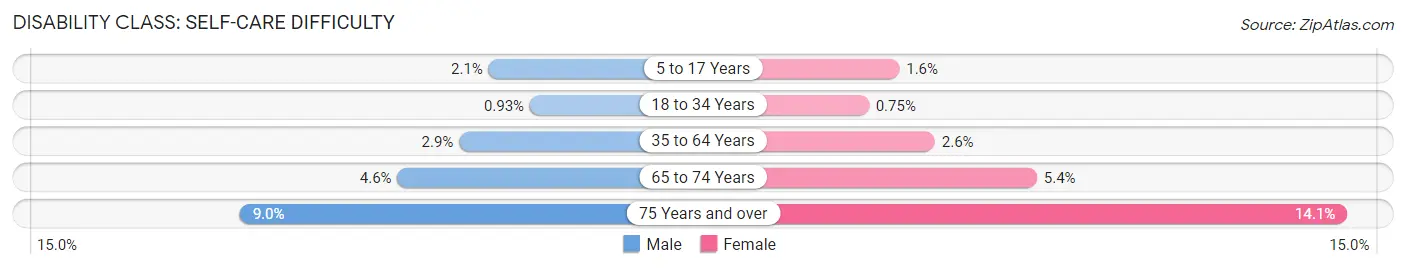
| Age Bracket | Male | Female |
| 5 to 17 Years | 205 (2.1%) | 149 (1.6%) |
| 18 to 34 Years | 123 (0.9%) | 96 (0.7%) |
| 35 to 64 Years | 699 (2.9%) | 623 (2.6%) |
| 65 to 74 Years | 343 (4.6%) | 421 (5.4%) |
| 75 Years and over | 401 (9.0%) | 858 (14.1%) |
Technology Access in Chautauqua County
Computing Device Access in Chautauqua County
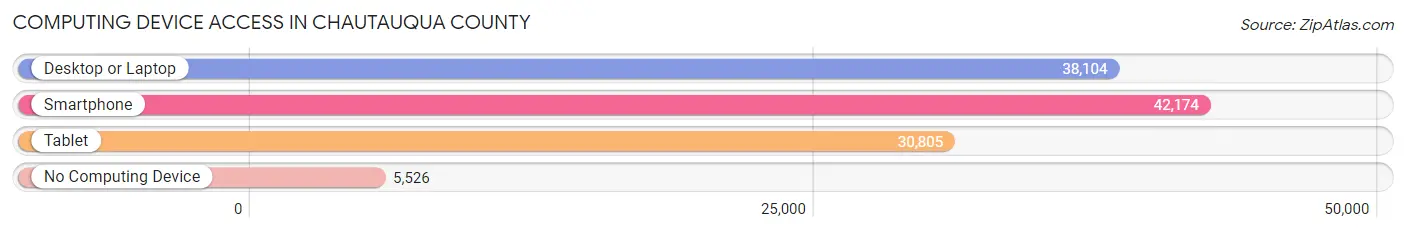
| Device Type | # Households | % Households |
| Desktop or Laptop | 38,104 | 71.4% |
| Smartphone | 42,174 | 79.0% |
| Tablet | 30,805 | 57.7% |
| No Computing Device | 5,526 | 10.3% |
| Total | 53,405 | 100.0% |
Internet Access in Chautauqua County
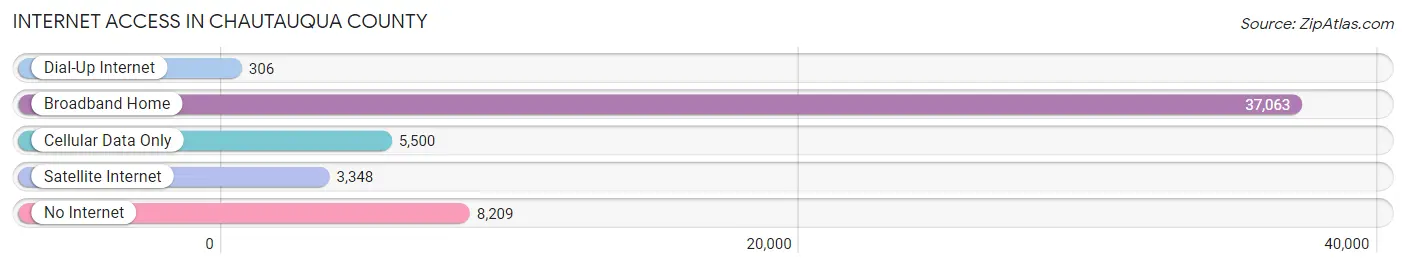
| Internet Type | # Households | % Households |
| Dial-Up Internet | 306 | 0.6% |
| Broadband Home | 37,063 | 69.4% |
| Cellular Data Only | 5,500 | 10.3% |
| Satellite Internet | 3,348 | 6.3% |
| No Internet | 8,209 | 15.4% |
| Total | 53,405 | 100.0% |
Chautauqua County Summary
Chautauqua County, New York is located in the westernmost part of the state, bordering Lake Erie and the Canadian province of Ontario. It is part of the Buffalo-Niagara Falls metropolitan area and is home to a population of 134,905 people as of the 2010 census. The county seat is Mayville, and the largest city is Jamestown.
History
Chautauqua County was formed in 1808 from parts of Genesee County and Ontario County. It was named after the Chautauqua Lake, which was named after the Chautauqua Institution, a religious and educational center founded in 1874. The county was originally home to the Seneca Nation of the Iroquois Confederacy, and the area was later settled by European immigrants.
The county was an important center of the Underground Railroad, with many Quaker families providing shelter and assistance to escaped slaves. During the Civil War, the county was a major supplier of food and other supplies to the Union Army.
Geography
Chautauqua County covers an area of 1,065 square miles and is located in the western part of New York State. It is bordered by Lake Erie to the west, Cattaraugus County to the east, Erie County to the north, and Pennsylvania to the south. The county is divided into two parts by Chautauqua Lake, which is the largest natural lake in the state.
The terrain of the county is generally flat, with rolling hills in the east and south. The highest point in the county is the summit of Mount Baldy, which has an elevation of 1,890 feet. The county is home to several state parks, including Allegany State Park, Chautauqua Gorge State Park, and Long Point State Park.
Economy
The economy of Chautauqua County is largely based on agriculture, manufacturing, and tourism. The county is home to several large agricultural operations, including dairy farms, vineyards, and fruit orchards. The manufacturing sector is dominated by the production of furniture, plastics, and metal products.
Tourism is an important part of the county’s economy, with visitors drawn to the area’s many lakes, parks, and historic sites. The Chautauqua Institution is a popular destination, as is the nearby Chautauqua Lake.
Demographics
As of the 2010 census, the population of Chautauqua County was 134,905. The racial makeup of the county was 94.3% White, 2.2% African American, 0.7% Native American, 0.7% Asian, 0.2% Pacific Islander, and 1.9% from two or more races. Hispanic or Latino of any race were 2.7% of the population.
The median household income in the county was $45,945, and the median family income was $54,945. The per capita income was $22,945. About 11.2% of the population was below the poverty line.
Chautauqua County is home to a diverse population, with a variety of religious and cultural backgrounds. The county is home to several churches, including the First Presbyterian Church of Jamestown, the First Baptist Church of Mayville, and the St. James Catholic Church of Dunkirk. The county is also home to several museums, including the Roger Tory Peterson Institute of Natural History and the Chautauqua County Historical Society.
Common Questions
What is Per Capita Income in Chautauqua County?
Per Capita income in Chautauqua County is $30,718.
What is the Median Family Income in Chautauqua County?
Median Family Income in Chautauqua County is $73,650.
What is the Median Household income in Chautauqua County?
Median Household Income in Chautauqua County is $54,625.
What is Income or Wage Gap in Chautauqua County?
Income or Wage Gap in Chautauqua County is 28.8%.
Women in Chautauqua County earn 71.2 cents for every dollar earned by a man.
What is Family Income Deficit in Chautauqua County?
Family Income Deficit in Chautauqua County is $10,592.
Families that are below poverty line in Chautauqua County earn $10,592 less on average than the poverty threshold level.
What is Inequality or Gini Index in Chautauqua County?
Inequality or Gini Index in Chautauqua County is 0.45.
What is the Total Population of Chautauqua County?
Total Population of Chautauqua County is 127,440.
What is the Total Male Population of Chautauqua County?
Total Male Population of Chautauqua County is 63,496.
What is the Total Female Population of Chautauqua County?
Total Female Population of Chautauqua County is 63,944.
What is the Ratio of Males per 100 Females in Chautauqua County?
There are 99.30 Males per 100 Females in Chautauqua County.
What is the Ratio of Females per 100 Males in Chautauqua County?
There are 100.71 Females per 100 Males in Chautauqua County.
What is the Median Population Age in Chautauqua County?
Median Population Age in Chautauqua County is 42.8 Years.
What is the Average Family Size in Chautauqua County
Average Family Size in Chautauqua County is 2.9 People.
What is the Average Household Size in Chautauqua County
Average Household Size in Chautauqua County is 2.3 People.
How Large is the Labor Force in Chautauqua County?
There are 58,369 People in the Labor Forcein in Chautauqua County.
What is the Percentage of People in the Labor Force in Chautauqua County?
55.7% of People are in the Labor Force in Chautauqua County.
What is the Unemployment Rate in Chautauqua County?
Unemployment Rate in Chautauqua County is 5.4%.