Angelica, NY Map & Demographics
Angelica Map
Angelica Overview
$31,271
PER CAPITA INCOME
$73,750
AVG FAMILY INCOME
$51,250
AVG HOUSEHOLD INCOME
12.4%
WAGE / INCOME GAP [ % ]
87.6¢/ $1
WAGE / INCOME GAP [ $ ]
0.38
INEQUALITY / GINI INDEX
625
TOTAL POPULATION
276
MALE POPULATION
349
FEMALE POPULATION
79.08
MALES / 100 FEMALES
126.45
FEMALES / 100 MALES
44.2
MEDIAN AGE
2.7
AVG FAMILY SIZE
2.2
AVG HOUSEHOLD SIZE
292
LABOR FORCE [ PEOPLE ]
56.7%
PERCENT IN LABOR FORCE
6.5%
UNEMPLOYMENT RATE
Angelica Zip Codes
Angelica Area Codes
Income in Angelica
Income Overview in Angelica
Per Capita Income in Angelica is $31,271, while median incomes of families and households are $73,750 and $51,250 respectively.
| Characteristic | Number | Measure |
| Per Capita Income | 625 | $31,271 |
| Median Family Income | 168 | $73,750 |
| Mean Family Income | 168 | $75,879 |
| Median Household Income | 287 | $51,250 |
| Mean Household Income | 287 | $65,900 |
| Income Deficit | 168 | $0 |
| Wage / Income Gap (%) | 625 | 12.36% |
| Wage / Income Gap ($) | 625 | 87.64¢ per $1 |
| Gini / Inequality Index | 625 | 0.38 |
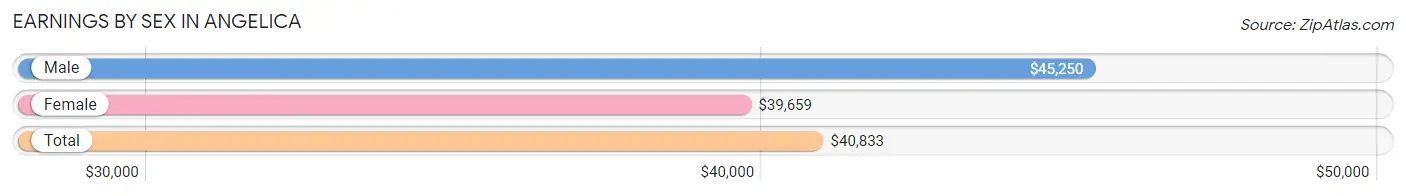
Earnings by Sex in Angelica
Average Earnings in Angelica are $40,833, $45,250 for men and $39,659 for women, a difference of 12.4%.
| Sex | Number | Average Earnings |
| Male | 139 (44.8%) | $45,250 |
| Female | 171 (55.2%) | $39,659 |
| Total | 310 (100.0%) | $40,833 |
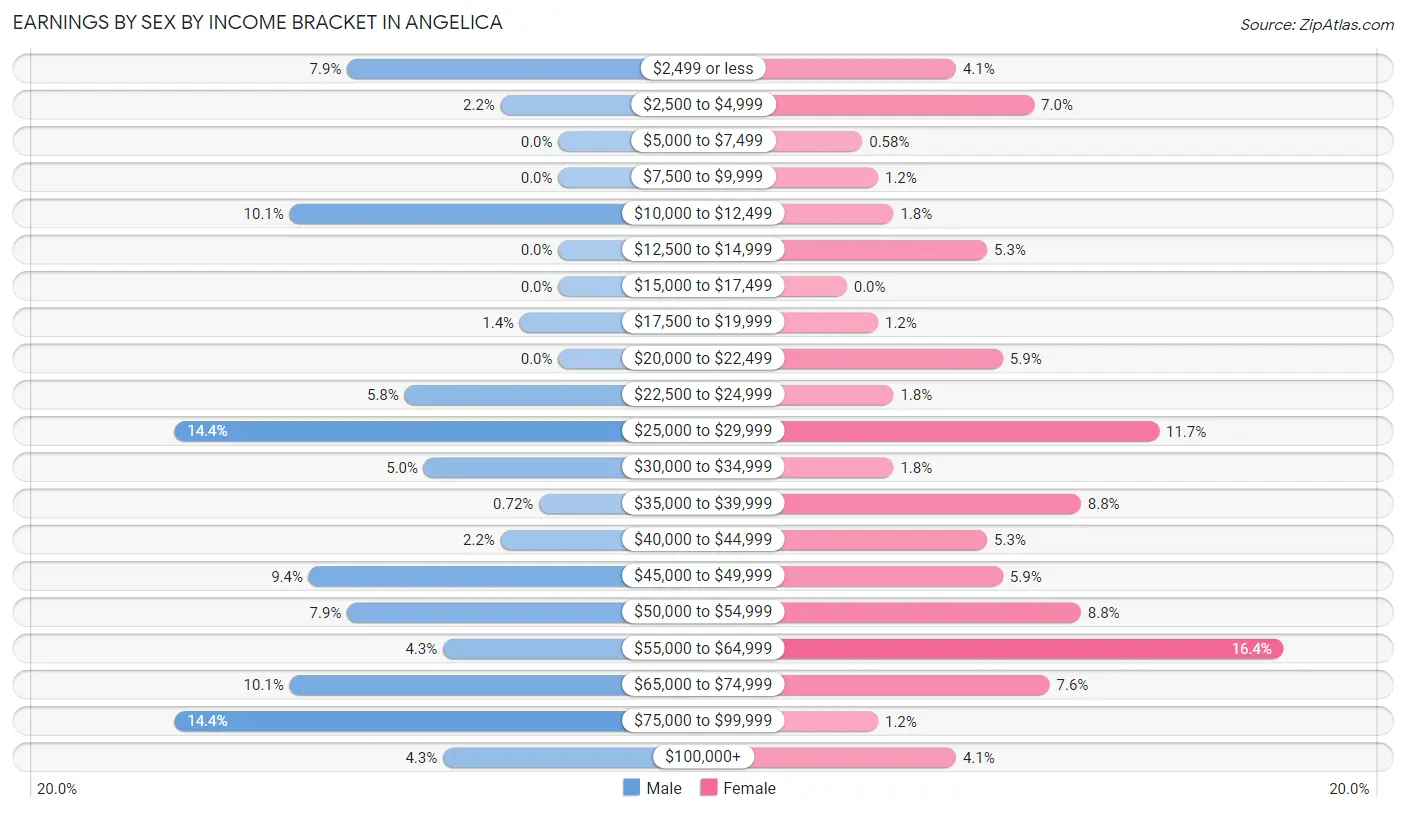
Earnings by Sex by Income Bracket in Angelica
The most common earnings brackets in Angelica are $25,000 to $29,999 for men (20 | 14.4%) and $55,000 to $64,999 for women (28 | 16.4%).
| Income | Male | Female |
| $2,499 or less | 11 (7.9%) | 7 (4.1%) |
| $2,500 to $4,999 | 3 (2.2%) | 12 (7.0%) |
| $5,000 to $7,499 | 0 (0.0%) | 1 (0.6%) |
| $7,500 to $9,999 | 0 (0.0%) | 2 (1.2%) |
| $10,000 to $12,499 | 14 (10.1%) | 3 (1.8%) |
| $12,500 to $14,999 | 0 (0.0%) | 9 (5.3%) |
| $15,000 to $17,499 | 0 (0.0%) | 0 (0.0%) |
| $17,500 to $19,999 | 2 (1.4%) | 2 (1.2%) |
| $20,000 to $22,499 | 0 (0.0%) | 10 (5.9%) |
| $22,500 to $24,999 | 8 (5.8%) | 3 (1.8%) |
| $25,000 to $29,999 | 20 (14.4%) | 20 (11.7%) |
| $30,000 to $34,999 | 7 (5.0%) | 3 (1.8%) |
| $35,000 to $39,999 | 1 (0.7%) | 15 (8.8%) |
| $40,000 to $44,999 | 3 (2.2%) | 9 (5.3%) |
| $45,000 to $49,999 | 13 (9.3%) | 10 (5.9%) |
| $50,000 to $54,999 | 11 (7.9%) | 15 (8.8%) |
| $55,000 to $64,999 | 6 (4.3%) | 28 (16.4%) |
| $65,000 to $74,999 | 14 (10.1%) | 13 (7.6%) |
| $75,000 to $99,999 | 20 (14.4%) | 2 (1.2%) |
| $100,000+ | 6 (4.3%) | 7 (4.1%) |
| Total | 139 (100.0%) | 171 (100.0%) |
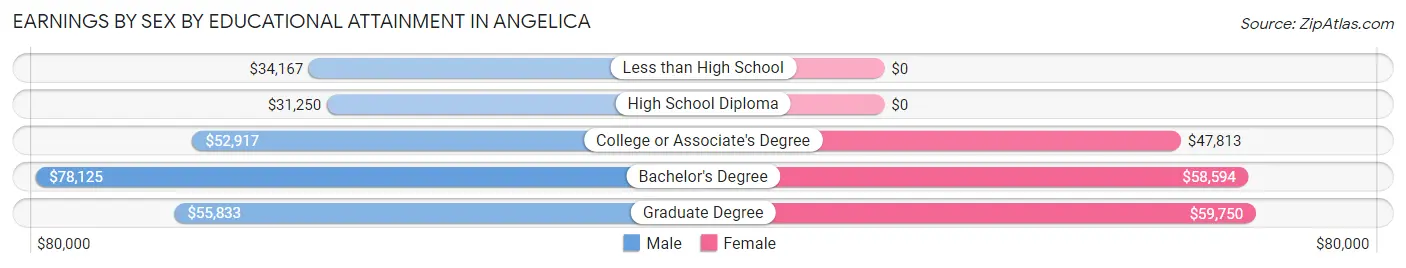
Earnings by Sex by Educational Attainment in Angelica
Average earnings in Angelica are $46,750 for men and $48,500 for women, a difference of 3.6%. Men with an educational attainment of bachelor's degree enjoy the highest average annual earnings of $78,125, while those with high school diploma education earn the least with $31,250. Women with an educational attainment of graduate degree earn the most with the average annual earnings of $59,750, while those with college or associate's degree education have the smallest earnings of $47,813.
| Educational Attainment | Male Income | Female Income |
| Less than High School | $34,167 | $0 |
| High School Diploma | $31,250 | $0 |
| College or Associate's Degree | $52,917 | $47,813 |
| Bachelor's Degree | $78,125 | $58,594 |
| Graduate Degree | $55,833 | $59,750 |
| Total | $46,750 | $48,500 |
Family Income in Angelica
Family Income Brackets in Angelica
According to the Angelica family income data, there are 50 families falling into the $75,000 to $99,999 income range, which is the most common income bracket and makes up 29.8% of all families. Conversely, the $200,000+ income bracket is the least frequent group with only 3 families (1.8%) belonging to this category.
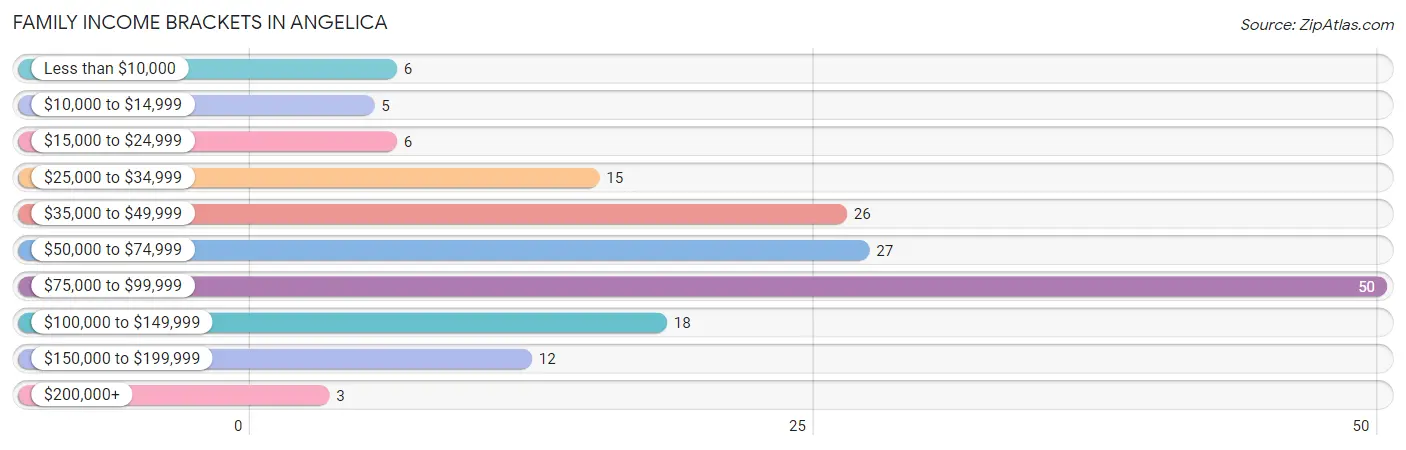
| Income Bracket | # Families | % Families |
| Less than $10,000 | 6 | 3.6% |
| $10,000 to $14,999 | 5 | 3.0% |
| $15,000 to $24,999 | 6 | 3.6% |
| $25,000 to $34,999 | 15 | 8.9% |
| $35,000 to $49,999 | 26 | 15.5% |
| $50,000 to $74,999 | 27 | 16.1% |
| $75,000 to $99,999 | 50 | 29.8% |
| $100,000 to $149,999 | 18 | 10.7% |
| $150,000 to $199,999 | 12 | 7.1% |
| $200,000+ | 3 | 1.8% |
Family Income by Famaliy Size in Angelica
5-person families (11 | 6.6%) account for the highest median family income in Angelica with $79,583 per family, while 2-person families (106 | 63.1%) have the highest median income of $35,893 per family member.
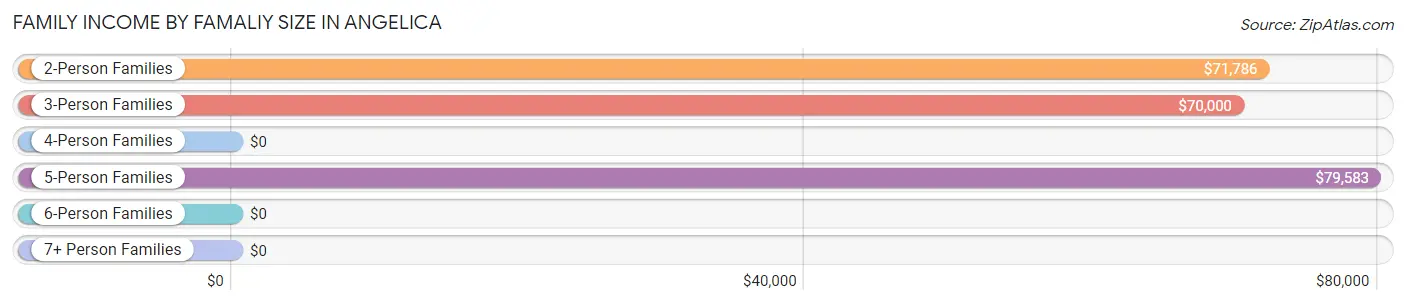
| Income Bracket | # Families | Median Income |
| 2-Person Families | 106 (63.1%) | $71,786 |
| 3-Person Families | 36 (21.4%) | $70,000 |
| 4-Person Families | 15 (8.9%) | $0 |
| 5-Person Families | 11 (6.6%) | $79,583 |
| 6-Person Families | 0 (0.0%) | $0 |
| 7+ Person Families | 0 (0.0%) | $0 |
| Total | 168 (100.0%) | $73,750 |
Family Income by Number of Earners in Angelica
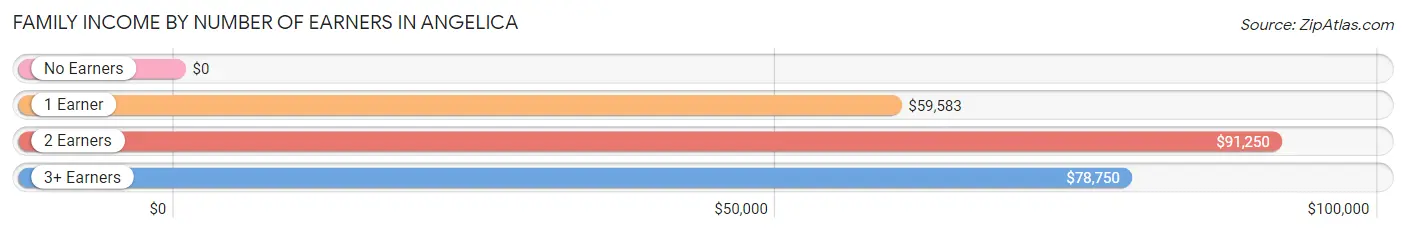
| Number of Earners | # Families | Median Income |
| No Earners | 36 (21.4%) | $0 |
| 1 Earner | 73 (43.4%) | $59,583 |
| 2 Earners | 50 (29.8%) | $91,250 |
| 3+ Earners | 9 (5.4%) | $78,750 |
| Total | 168 (100.0%) | $73,750 |
Household Income in Angelica
Household Income Brackets in Angelica
With 67 households falling in the category, the $35,000 to $49,999 income range is the most frequent in Angelica, accounting for 23.3% of all households. In contrast, only 3 households (1.1%) fall into the $200,000+ income bracket, making it the least populous group.
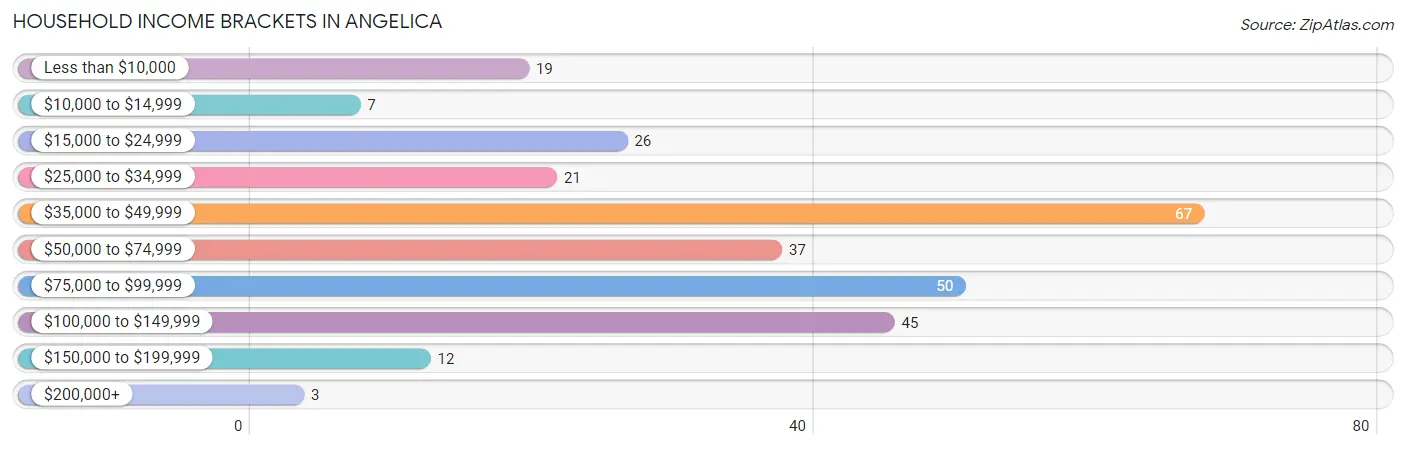
| Income Bracket | # Households | % Households |
| Less than $10,000 | 19 | 6.6% |
| $10,000 to $14,999 | 7 | 2.4% |
| $15,000 to $24,999 | 26 | 9.1% |
| $25,000 to $34,999 | 21 | 7.3% |
| $35,000 to $49,999 | 67 | 23.3% |
| $50,000 to $74,999 | 37 | 12.9% |
| $75,000 to $99,999 | 50 | 17.4% |
| $100,000 to $149,999 | 45 | 15.7% |
| $150,000 to $199,999 | 12 | 4.2% |
| $200,000+ | 3 | 1.0% |
Household Income by Householder Age in Angelica
The median household income in Angelica is $51,250, with the highest median household income of $59,375 found in the 45 to 64 years age bracket for the primary householder. A total of 89 households (31.0%) fall into this category. Meanwhile, the 15 to 24 years age bracket for the primary householder has the lowest median household income of $0, with 16 households (5.6%) in this group.
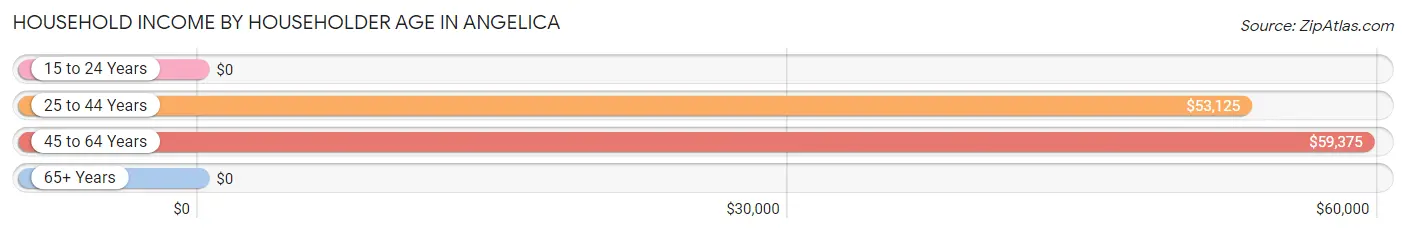
| Income Bracket | # Households | Median Income |
| 15 to 24 Years | 16 (5.6%) | $0 |
| 25 to 44 Years | 77 (26.8%) | $53,125 |
| 45 to 64 Years | 89 (31.0%) | $59,375 |
| 65+ Years | 105 (36.6%) | $0 |
| Total | 287 (100.0%) | $51,250 |
Poverty in Angelica
Income Below Poverty by Sex and Age in Angelica
With 16.3% poverty level for males and 14.3% for females among the residents of Angelica, 18 to 24 year old males and 6 to 11 year old females are the most vulnerable to poverty, with 1 males (100.0%) and 6 females (27.3%) in their respective age groups living below the poverty level.
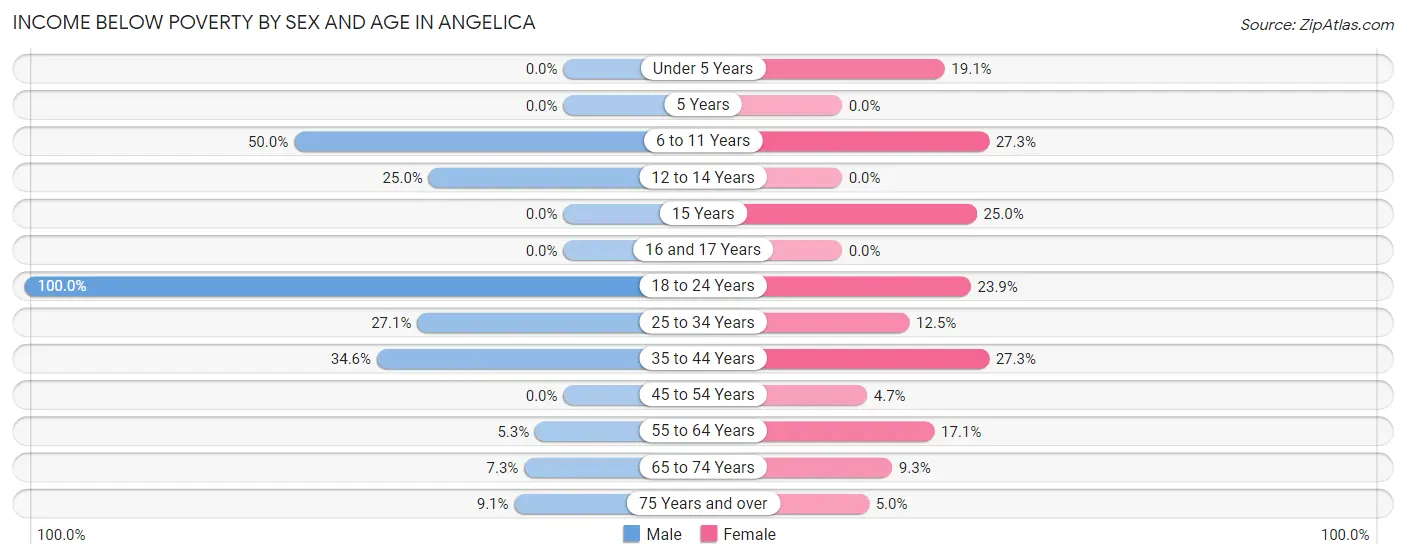
| Age Bracket | Male | Female |
| Under 5 Years | 0 (0.0%) | 4 (19.1%) |
| 5 Years | 0 (0.0%) | 0 (0.0%) |
| 6 to 11 Years | 8 (50.0%) | 6 (27.3%) |
| 12 to 14 Years | 3 (25.0%) | 0 (0.0%) |
| 15 Years | 0 (0.0%) | 3 (25.0%) |
| 16 and 17 Years | 0 (0.0%) | 0 (0.0%) |
| 18 to 24 Years | 1 (100.0%) | 11 (23.9%) |
| 25 to 34 Years | 16 (27.1%) | 6 (12.5%) |
| 35 to 44 Years | 9 (34.6%) | 6 (27.3%) |
| 45 to 54 Years | 0 (0.0%) | 2 (4.6%) |
| 55 to 64 Years | 2 (5.3%) | 6 (17.1%) |
| 65 to 74 Years | 4 (7.3%) | 4 (9.3%) |
| 75 Years and over | 2 (9.1%) | 2 (5.0%) |
| Total | 45 (16.3%) | 50 (14.3%) |
Income Above Poverty by Sex and Age in Angelica
According to the poverty statistics in Angelica, males aged under 5 years and females aged 5 years are the age groups that are most secure financially, with 100.0% of males and 100.0% of females in these age groups living above the poverty line.
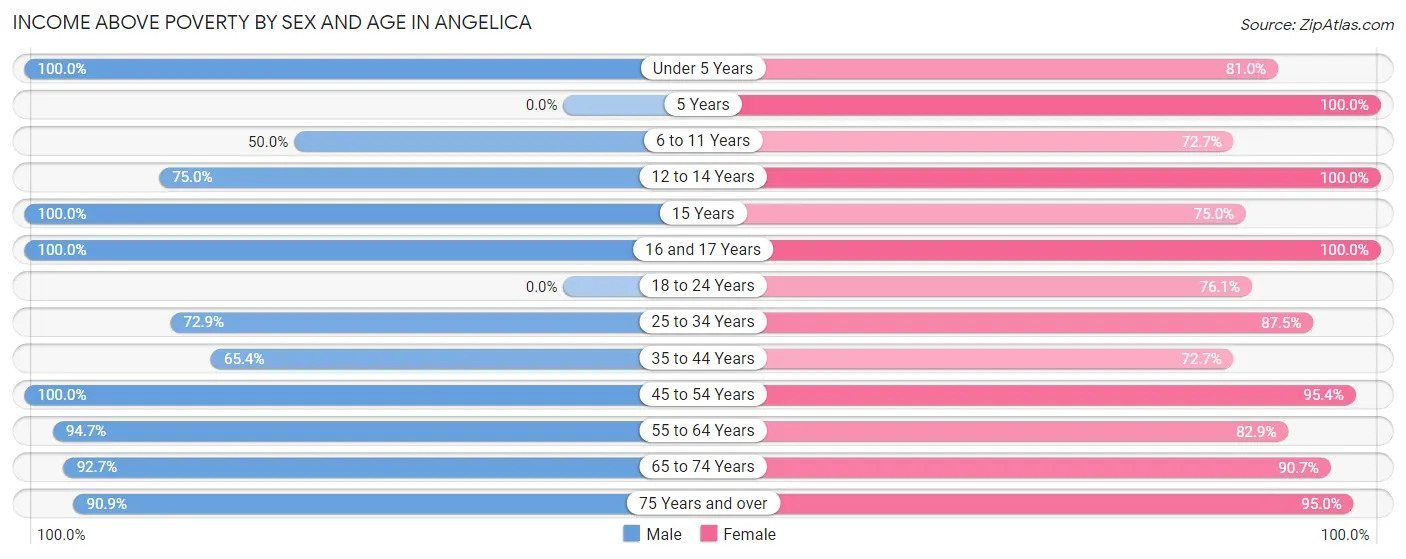
| Age Bracket | Male | Female |
| Under 5 Years | 7 (100.0%) | 17 (80.9%) |
| 5 Years | 0 (0.0%) | 4 (100.0%) |
| 6 to 11 Years | 8 (50.0%) | 16 (72.7%) |
| 12 to 14 Years | 9 (75.0%) | 11 (100.0%) |
| 15 Years | 5 (100.0%) | 9 (75.0%) |
| 16 and 17 Years | 5 (100.0%) | 2 (100.0%) |
| 18 to 24 Years | 0 (0.0%) | 35 (76.1%) |
| 25 to 34 Years | 43 (72.9%) | 42 (87.5%) |
| 35 to 44 Years | 17 (65.4%) | 16 (72.7%) |
| 45 to 54 Years | 30 (100.0%) | 41 (95.4%) |
| 55 to 64 Years | 36 (94.7%) | 29 (82.9%) |
| 65 to 74 Years | 51 (92.7%) | 39 (90.7%) |
| 75 Years and over | 20 (90.9%) | 38 (95.0%) |
| Total | 231 (83.7%) | 299 (85.7%) |
Income Below Poverty Among Married-Couple Families in Angelica
The poverty statistics for married-couple families in Angelica show that 7.5% or 8 of the total 106 families live below the poverty line. Families with no children have the highest poverty rate of 9.4%, comprising of 8 families. On the other hand, families with 1 or 2 children have the lowest poverty rate of 0.0%, which includes 0 families.
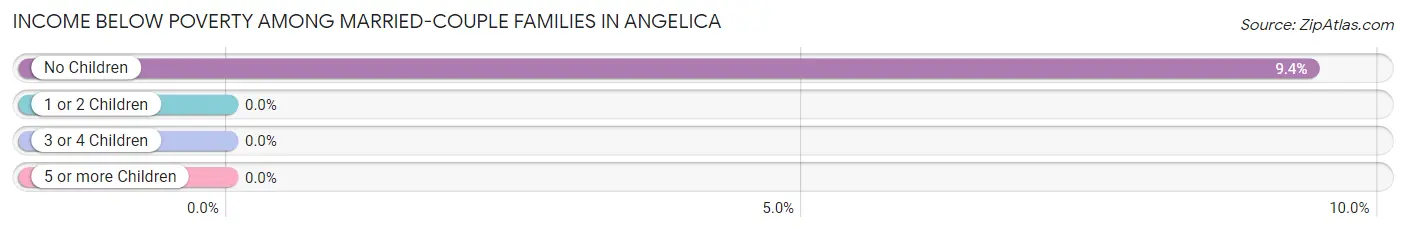
| Children | Above Poverty | Below Poverty |
| No Children | 77 (90.6%) | 8 (9.4%) |
| 1 or 2 Children | 13 (100.0%) | 0 (0.0%) |
| 3 or 4 Children | 8 (100.0%) | 0 (0.0%) |
| 5 or more Children | 0 (0.0%) | 0 (0.0%) |
| Total | 98 (92.4%) | 8 (7.5%) |
Income Below Poverty Among Single-Parent Households in Angelica
According to the poverty data in Angelica, 7.4% or 2 single-father households and 14.3% or 5 single-mother households are living below the poverty line. Among single-father households, those with 3 or 4 children have the highest poverty rate, with 2 households (100.0%) experiencing poverty. Likewise, among single-mother households, those with 3 or 4 children have the highest poverty rate, with 5 households (100.0%) falling below the poverty line.
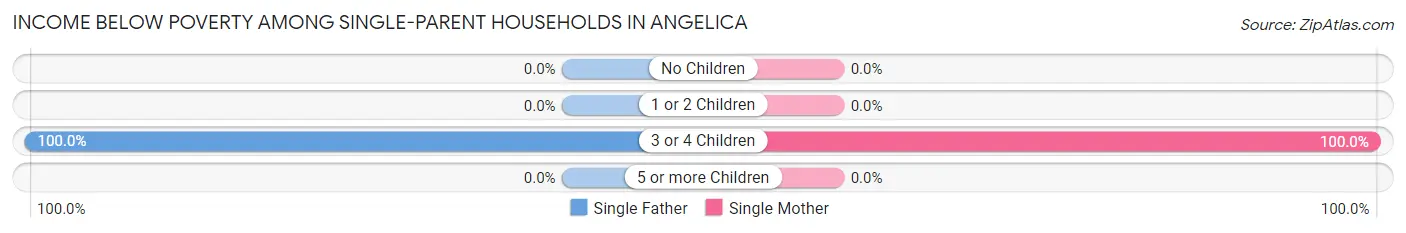
| Children | Single Father | Single Mother |
| No Children | 0 (0.0%) | 0 (0.0%) |
| 1 or 2 Children | 0 (0.0%) | 0 (0.0%) |
| 3 or 4 Children | 2 (100.0%) | 5 (100.0%) |
| 5 or more Children | 0 (0.0%) | 0 (0.0%) |
| Total | 2 (7.4%) | 5 (14.3%) |
Income Below Poverty Among Married-Couple vs Single-Parent Households in Angelica
The poverty data for Angelica shows that 8 of the married-couple family households (7.5%) and 7 of the single-parent households (11.3%) are living below the poverty level. Within the married-couple family households, those with no children have the highest poverty rate, with 8 households (9.4%) falling below the poverty line. Among the single-parent households, those with 3 or 4 children have the highest poverty rate, with 7 household (100.0%) living below poverty.
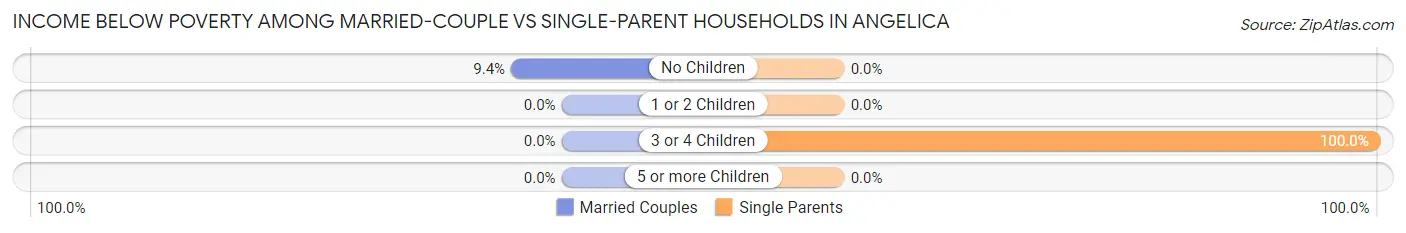
| Children | Married-Couple Families | Single-Parent Households |
| No Children | 8 (9.4%) | 0 (0.0%) |
| 1 or 2 Children | 0 (0.0%) | 0 (0.0%) |
| 3 or 4 Children | 0 (0.0%) | 7 (100.0%) |
| 5 or more Children | 0 (0.0%) | 0 (0.0%) |
| Total | 8 (7.5%) | 7 (11.3%) |
Race in Angelica
The most populous races in Angelica are White / Caucasian (594 | 95.0%), Two or more Races (19 | 3.0%), and Asian (6 | 1.0%).
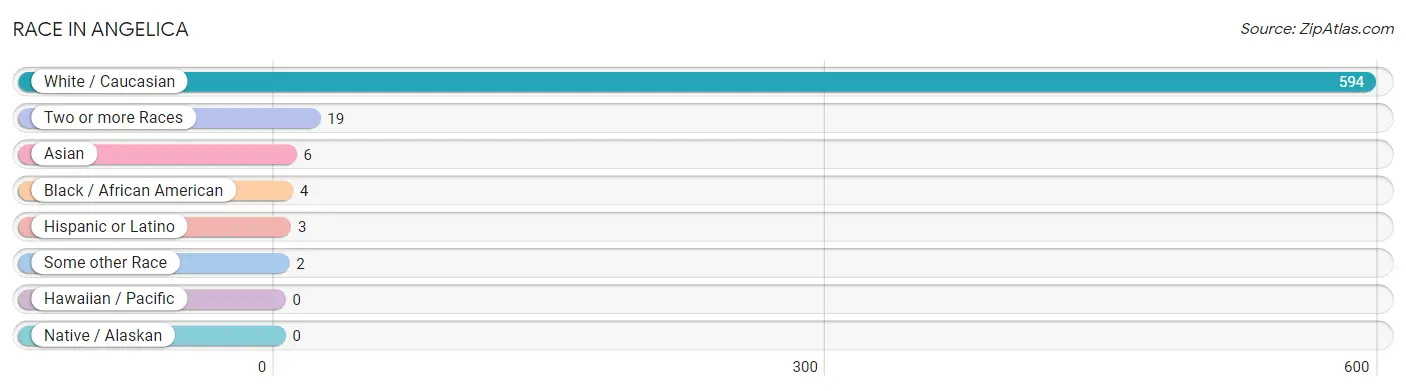
| Race | # Population | % Population |
| Asian | 6 | 1.0% |
| Black / African American | 4 | 0.6% |
| Hawaiian / Pacific | 0 | 0.0% |
| Hispanic or Latino | 3 | 0.5% |
| Native / Alaskan | 0 | 0.0% |
| White / Caucasian | 594 | 95.0% |
| Two or more Races | 19 | 3.0% |
| Some other Race | 2 | 0.3% |
| Total | 625 | 100.0% |
Ancestry in Angelica
The most populous ancestries reported in Angelica are German (142 | 22.7%), Irish (92 | 14.7%), English (67 | 10.7%), Italian (57 | 9.1%), and American (55 | 8.8%), together accounting for 66.1% of all Angelica residents.
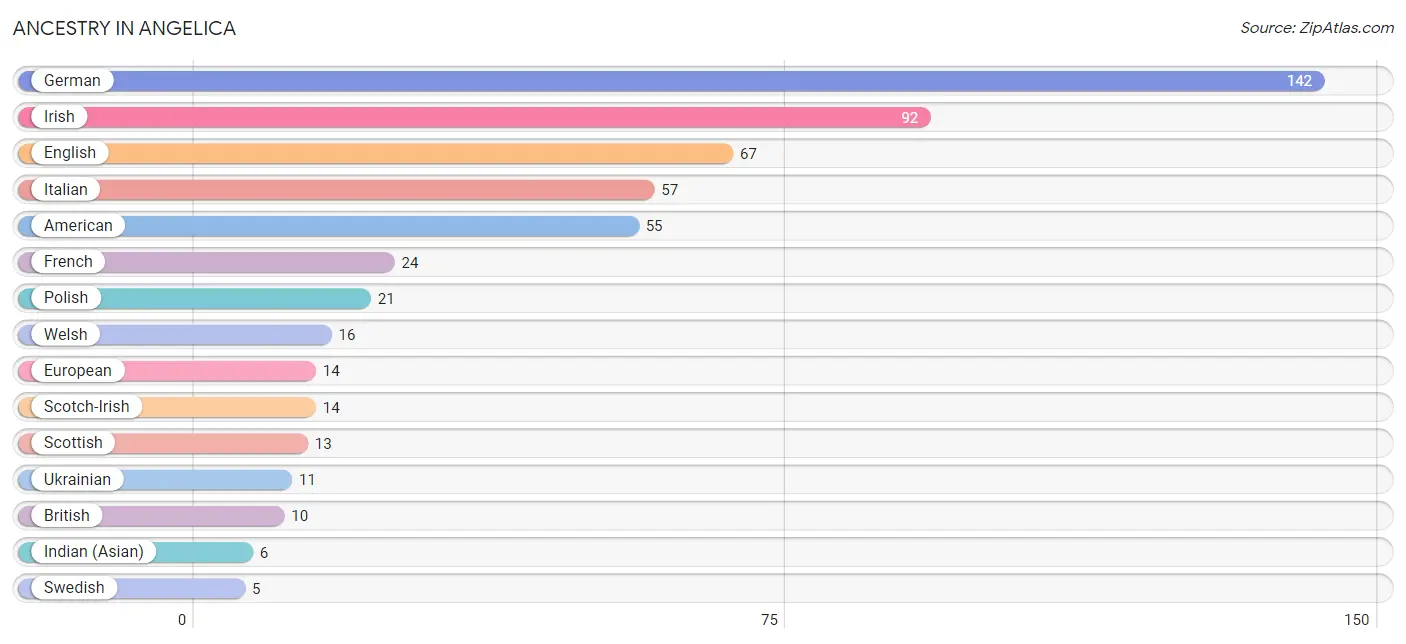
| Ancestry | # Population | % Population |
| American | 55 | 8.8% |
| British | 10 | 1.6% |
| Dominican | 3 | 0.5% |
| Dutch | 4 | 0.6% |
| English | 67 | 10.7% |
| European | 14 | 2.2% |
| French | 24 | 3.8% |
| German | 142 | 22.7% |
| Indian (Asian) | 6 | 1.0% |
| Irish | 92 | 14.7% |
| Italian | 57 | 9.1% |
| Northern European | 2 | 0.3% |
| Polish | 21 | 3.4% |
| Russian | 1 | 0.2% |
| Scotch-Irish | 14 | 2.2% |
| Scottish | 13 | 2.1% |
| Subsaharan African | 1 | 0.2% |
| Swedish | 5 | 0.8% |
| Ukrainian | 11 | 1.8% |
| Welsh | 16 | 2.6% | View All 20 Rows |
Immigrants in Angelica
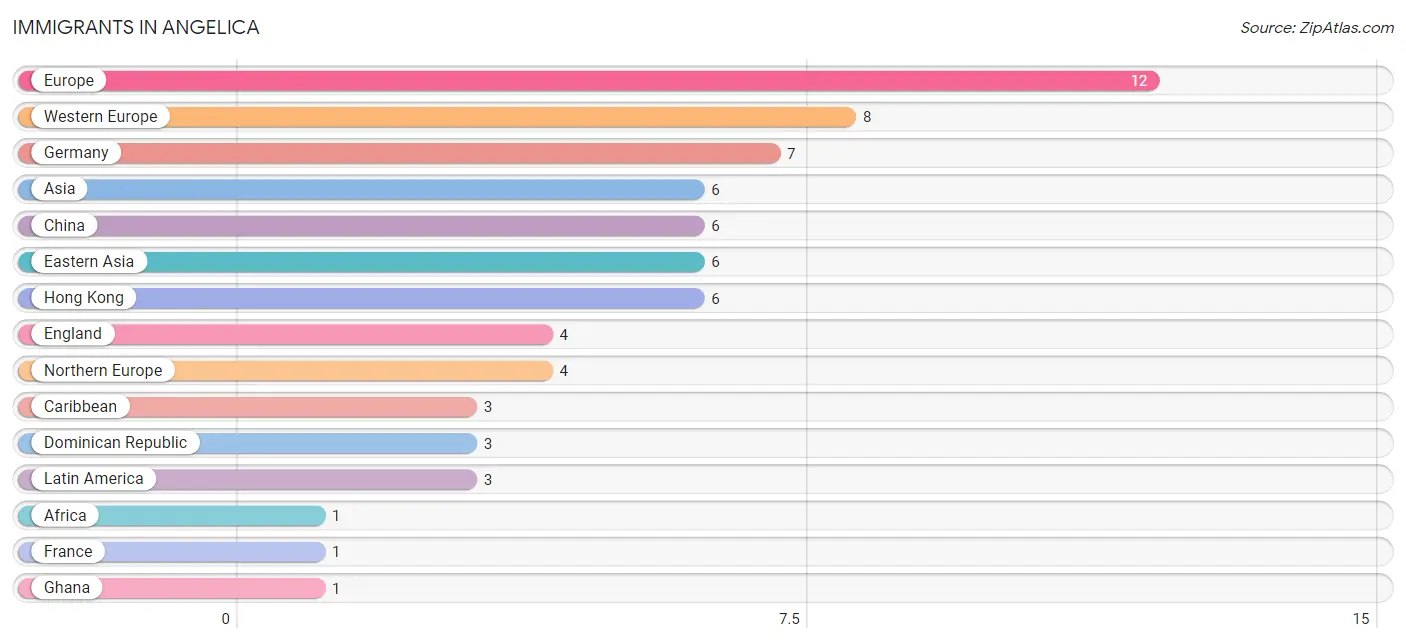
The most numerous immigrant groups reported in Angelica came from Europe (12 | 1.9%), Western Europe (8 | 1.3%), Germany (7 | 1.1%), Asia (6 | 1.0%), and China (6 | 1.0%), together accounting for 6.2% of all Angelica residents.
| Immigration Origin | # Population | % Population |
| Africa | 1 | 0.2% |
| Asia | 6 | 1.0% |
| Caribbean | 3 | 0.5% |
| China | 6 | 1.0% |
| Dominican Republic | 3 | 0.5% |
| Eastern Asia | 6 | 1.0% |
| England | 4 | 0.6% |
| Europe | 12 | 1.9% |
| France | 1 | 0.2% |
| Germany | 7 | 1.1% |
| Ghana | 1 | 0.2% |
| Hong Kong | 6 | 1.0% |
| Latin America | 3 | 0.5% |
| Northern Europe | 4 | 0.6% |
| Western Africa | 1 | 0.2% |
| Western Europe | 8 | 1.3% | View All 16 Rows |
Sex and Age in Angelica
Sex and Age in Angelica
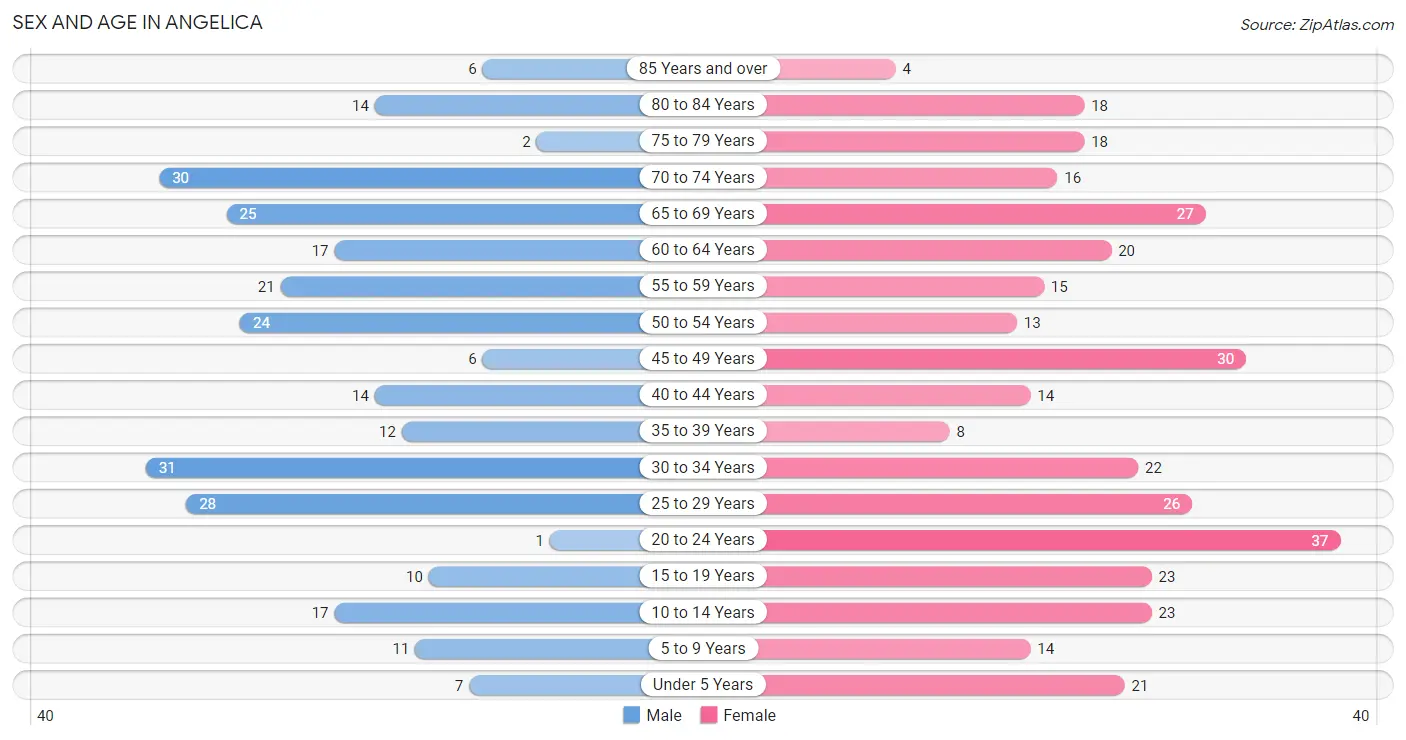
The most populous age groups in Angelica are 30 to 34 Years (31 | 11.2%) for men and 20 to 24 Years (37 | 10.6%) for women.
| Age Bracket | Male | Female |
| Under 5 Years | 7 (2.5%) | 21 (6.0%) |
| 5 to 9 Years | 11 (4.0%) | 14 (4.0%) |
| 10 to 14 Years | 17 (6.2%) | 23 (6.6%) |
| 15 to 19 Years | 10 (3.6%) | 23 (6.6%) |
| 20 to 24 Years | 1 (0.4%) | 37 (10.6%) |
| 25 to 29 Years | 28 (10.1%) | 26 (7.4%) |
| 30 to 34 Years | 31 (11.2%) | 22 (6.3%) |
| 35 to 39 Years | 12 (4.3%) | 8 (2.3%) |
| 40 to 44 Years | 14 (5.1%) | 14 (4.0%) |
| 45 to 49 Years | 6 (2.2%) | 30 (8.6%) |
| 50 to 54 Years | 24 (8.7%) | 13 (3.7%) |
| 55 to 59 Years | 21 (7.6%) | 15 (4.3%) |
| 60 to 64 Years | 17 (6.2%) | 20 (5.7%) |
| 65 to 69 Years | 25 (9.1%) | 27 (7.7%) |
| 70 to 74 Years | 30 (10.9%) | 16 (4.6%) |
| 75 to 79 Years | 2 (0.7%) | 18 (5.2%) |
| 80 to 84 Years | 14 (5.1%) | 18 (5.2%) |
| 85 Years and over | 6 (2.2%) | 4 (1.1%) |
| Total | 276 (100.0%) | 349 (100.0%) |
Families and Households in Angelica
Median Family Size in Angelica
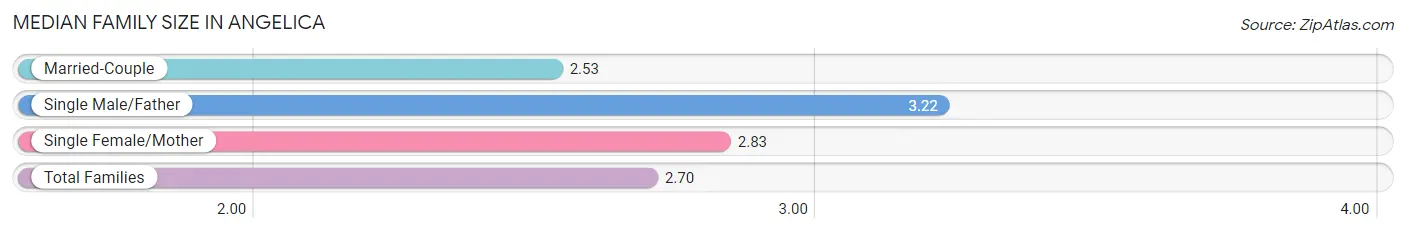
The median family size in Angelica is 2.70 persons per family, with single male/father families (27 | 16.1%) accounting for the largest median family size of 3.22 persons per family. On the other hand, married-couple families (106 | 63.1%) represent the smallest median family size with 2.53 persons per family.
| Family Type | # Families | Family Size |
| Married-Couple | 106 (63.1%) | 2.53 |
| Single Male/Father | 27 (16.1%) | 3.22 |
| Single Female/Mother | 35 (20.8%) | 2.83 |
| Total Families | 168 (100.0%) | 2.70 |
Median Household Size in Angelica
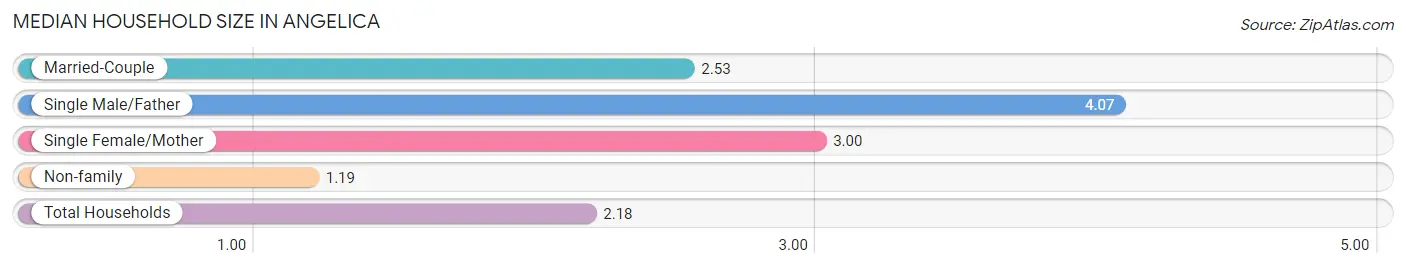
The median household size in Angelica is 2.18 persons per household, with single male/father households (27 | 9.4%) accounting for the largest median household size of 4.07 persons per household. non-family households (119 | 41.5%) represent the smallest median household size with 1.19 persons per household.
| Household Type | # Households | Household Size |
| Married-Couple | 106 (36.9%) | 2.53 |
| Single Male/Father | 27 (9.4%) | 4.07 |
| Single Female/Mother | 35 (12.2%) | 3.00 |
| Non-family | 119 (41.5%) | 1.19 |
| Total Households | 287 (100.0%) | 2.18 |
Household Size by Marriage Status in Angelica
Out of a total of 287 households in Angelica, 168 (58.5%) are family households, while 119 (41.5%) are nonfamily households. The most numerous type of family households are 2-person households, comprising 98, and the most common type of nonfamily households are 1-person households, comprising 93.
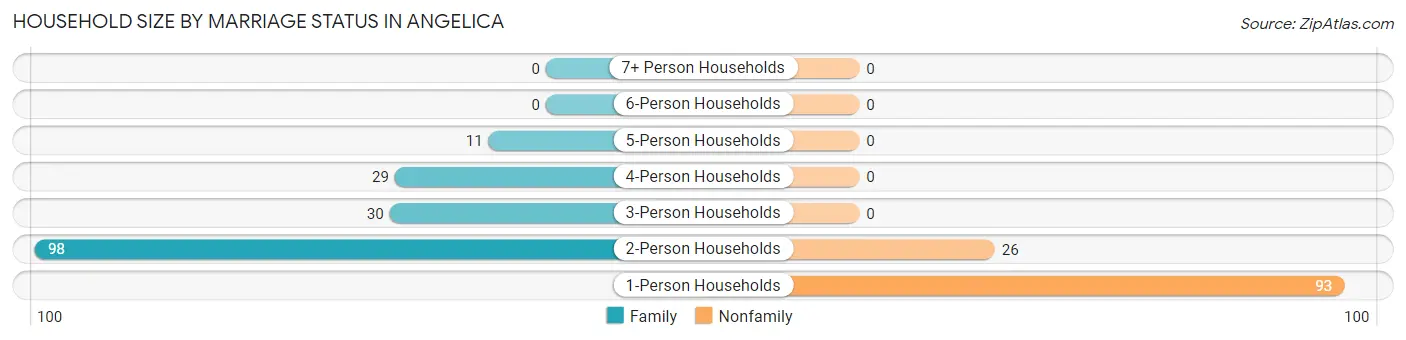
| Household Size | Family Households | Nonfamily Households |
| 1-Person Households | - | 93 (32.4%) |
| 2-Person Households | 98 (34.2%) | 26 (9.1%) |
| 3-Person Households | 30 (10.4%) | 0 (0.0%) |
| 4-Person Households | 29 (10.1%) | 0 (0.0%) |
| 5-Person Households | 11 (3.8%) | 0 (0.0%) |
| 6-Person Households | 0 (0.0%) | 0 (0.0%) |
| 7+ Person Households | 0 (0.0%) | 0 (0.0%) |
| Total | 168 (58.5%) | 119 (41.5%) |
Female Fertility in Angelica
Fertility by Age in Angelica
Average fertility rate in Angelica is 18.0 births per 1,000 women. Women in the age bracket of 20 to 34 years have the highest fertility rate with 35.0 births per 1,000 women. Women in the age bracket of 20 to 34 years acount for 100.0% of all women with births.
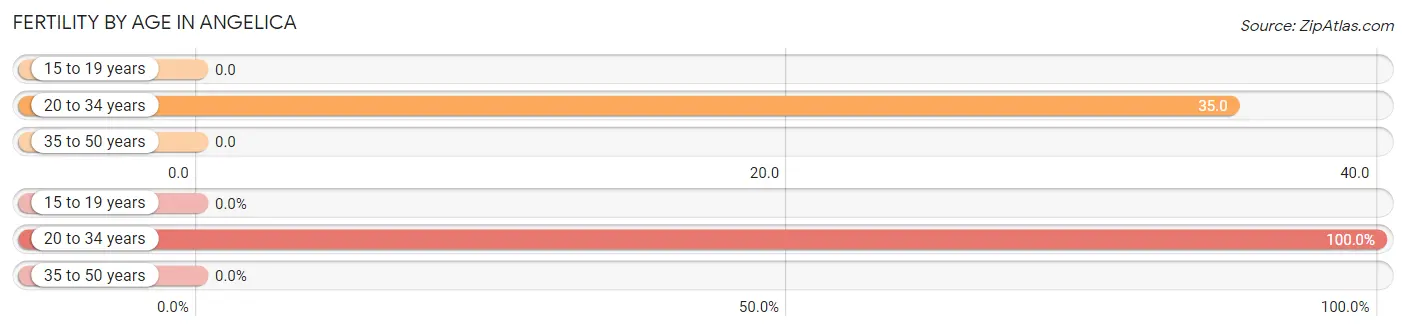
| Age Bracket | Women with Births | Births / 1,000 Women |
| 15 to 19 years | 0 (0.0%) | 0.0 |
| 20 to 34 years | 3 (100.0%) | 35.0 |
| 35 to 50 years | 0 (0.0%) | 0.0 |
| Total | 3 (100.0%) | 18.0 |
Fertility by Age by Marriage Status in Angelica
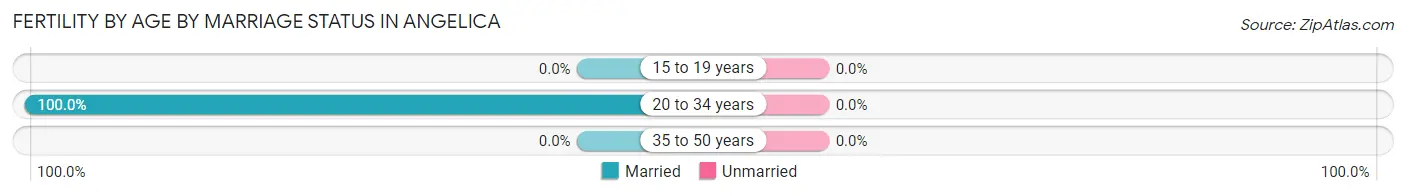
| Age Bracket | Married | Unmarried |
| 15 to 19 years | 0 (0.0%) | 0 (0.0%) |
| 20 to 34 years | 3 (100.0%) | 0 (0.0%) |
| 35 to 50 years | 0 (0.0%) | 0 (0.0%) |
| Total | 3 (100.0%) | 0 (0.0%) |
Fertility by Education in Angelica
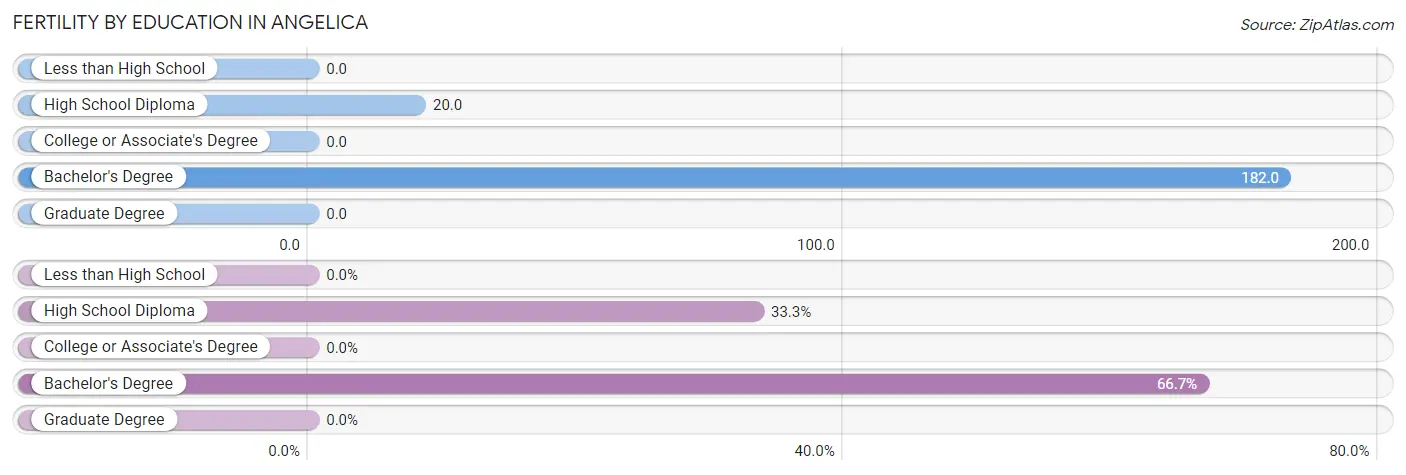
| Educational Attainment | Women with Births | Births / 1,000 Women |
| Less than High School | 0 (0.0%) | 0.0 |
| High School Diploma | 1 (33.3%) | 20.0 |
| College or Associate's Degree | 0 (0.0%) | 0.0 |
| Bachelor's Degree | 2 (66.7%) | 182.0 |
| Graduate Degree | 0 (0.0%) | 0.0 |
| Total | 3 (100.0%) | 18.0 |
Fertility by Education by Marriage Status in Angelica
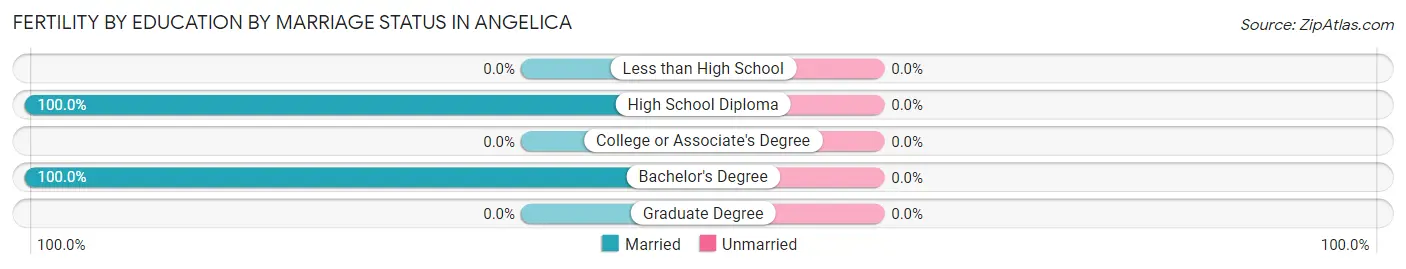
| Educational Attainment | Married | Unmarried |
| Less than High School | 0 (0.0%) | 0 (0.0%) |
| High School Diploma | 1 (100.0%) | 0 (0.0%) |
| College or Associate's Degree | 0 (0.0%) | 0 (0.0%) |
| Bachelor's Degree | 2 (100.0%) | 0 (0.0%) |
| Graduate Degree | 0 (0.0%) | 0 (0.0%) |
| Total | 3 (100.0%) | 0 (0.0%) |
Employment Characteristics in Angelica
Employment by Class of Employer in Angelica
Among the 269 employed individuals in Angelica, private company employees (135 | 50.2%), not-for-profit organizations (43 | 16.0%), and state government employees (40 | 14.9%) make up the most common classes of employment.
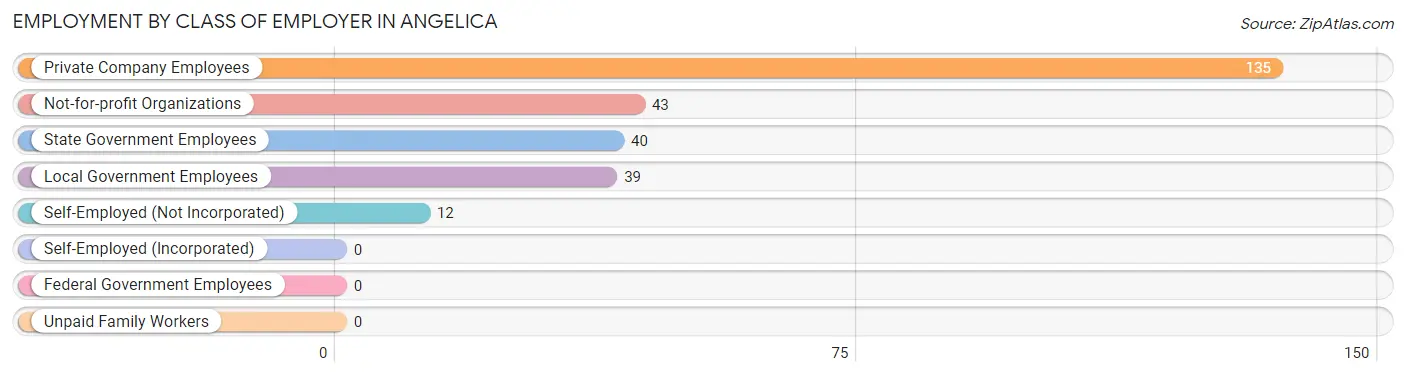
| Employer Class | # Employees | % Employees |
| Private Company Employees | 135 | 50.2% |
| Self-Employed (Incorporated) | 0 | 0.0% |
| Self-Employed (Not Incorporated) | 12 | 4.5% |
| Not-for-profit Organizations | 43 | 16.0% |
| Local Government Employees | 39 | 14.5% |
| State Government Employees | 40 | 14.9% |
| Federal Government Employees | 0 | 0.0% |
| Unpaid Family Workers | 0 | 0.0% |
| Total | 269 | 100.0% |
Employment Status by Age in Angelica
According to the labor force statistics for Angelica, out of the total population over 16 years of age (515), 56.7% or 292 individuals are in the labor force, with 6.5% or 19 of them unemployed. The age group with the highest labor force participation rate is 25 to 29 years, with 100.0% or 54 individuals in the labor force. Within the labor force, the 25 to 29 years age range has the highest percentage of unemployed individuals, with 22.2% or 12 of them being unemployed.
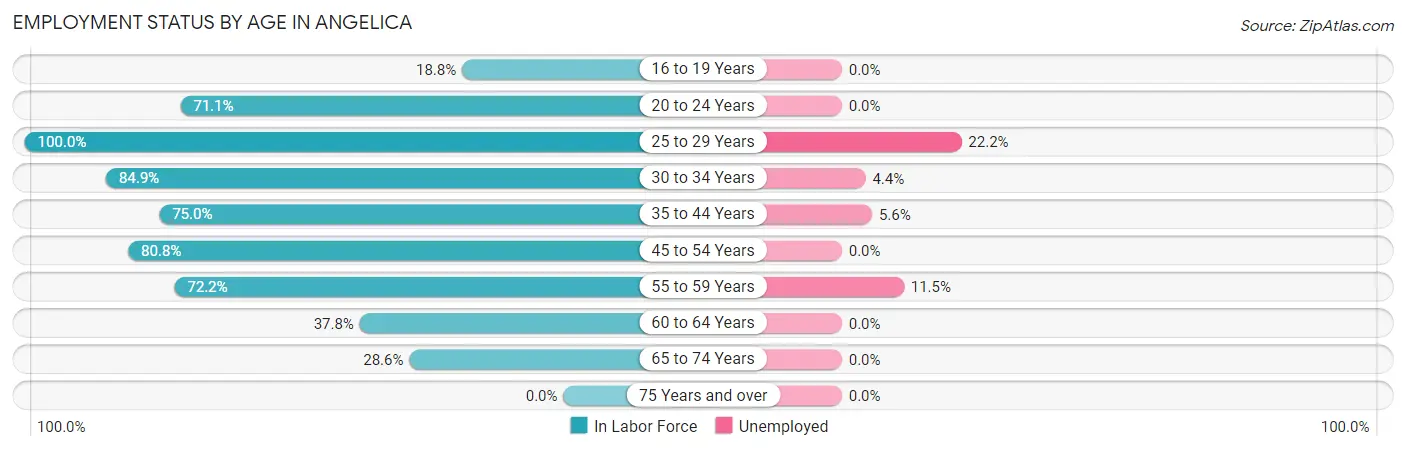
| Age Bracket | In Labor Force | Unemployed |
| 16 to 19 Years | 3 (18.8%) | 0 (0.0%) |
| 20 to 24 Years | 27 (71.1%) | 0 (0.0%) |
| 25 to 29 Years | 54 (100.0%) | 12 (22.2%) |
| 30 to 34 Years | 45 (84.9%) | 2 (4.4%) |
| 35 to 44 Years | 36 (75.0%) | 2 (5.6%) |
| 45 to 54 Years | 59 (80.8%) | 0 (0.0%) |
| 55 to 59 Years | 26 (72.2%) | 3 (11.5%) |
| 60 to 64 Years | 14 (37.8%) | 0 (0.0%) |
| 65 to 74 Years | 28 (28.6%) | 0 (0.0%) |
| 75 Years and over | 0 (0.0%) | 0 (0.0%) |
| Total | 292 (56.7%) | 19 (6.5%) |
Employment Status by Educational Attainment in Angelica
According to labor force statistics for Angelica, 77.7% of individuals (234) out of the total population between 25 and 64 years of age (301) are in the labor force, with 8.1% or 19 of them being unemployed. The group with the highest labor force participation rate are those with the educational attainment of bachelor's degree or higher, with 85.1% or 57 individuals in the labor force. Within the labor force, individuals with less than high school education have the highest percentage of unemployment, with 18.2% or 2 of them being unemployed.
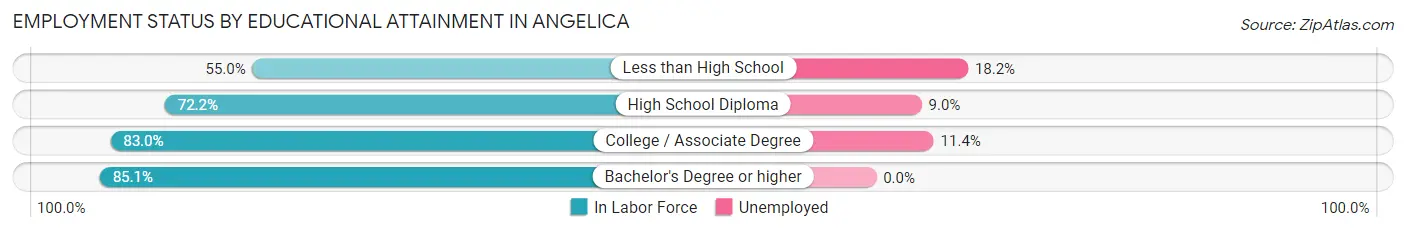
| Educational Attainment | In Labor Force | Unemployed |
| Less than High School | 11 (55.0%) | 4 (18.2%) |
| High School Diploma | 78 (72.2%) | 10 (9.0%) |
| College / Associate Degree | 88 (83.0%) | 12 (11.4%) |
| Bachelor's Degree or higher | 57 (85.1%) | 0 (0.0%) |
| Total | 234 (77.7%) | 24 (8.1%) |
Employment Occupations by Sex in Angelica
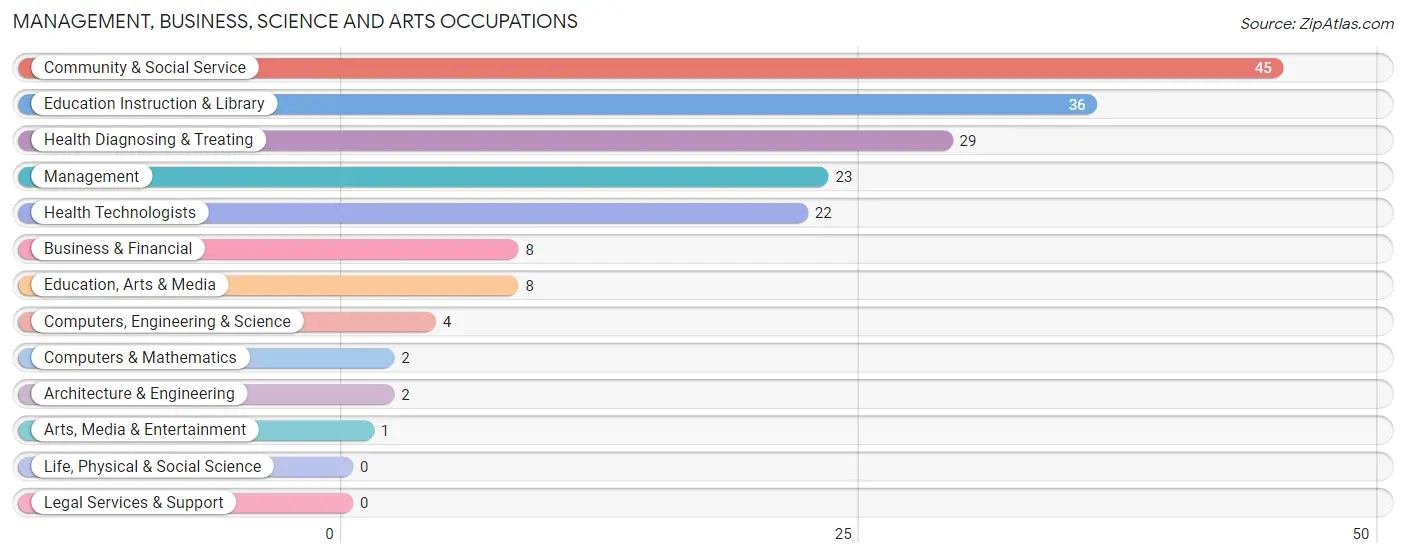
Management, Business, Science and Arts Occupations
The most common Management, Business, Science and Arts occupations in Angelica are Community & Social Service (45 | 16.5%), Education Instruction & Library (36 | 13.2%), Health Diagnosing & Treating (29 | 10.6%), Management (23 | 8.4%), and Health Technologists (22 | 8.1%).
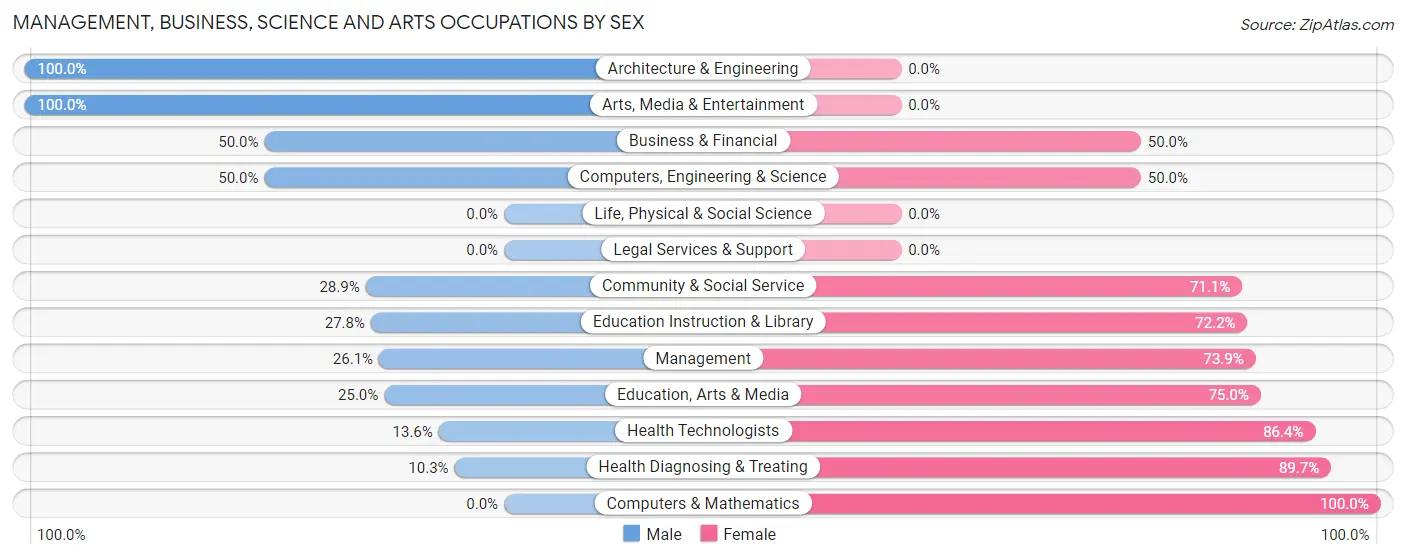
Management, Business, Science and Arts Occupations by Sex
Within the Management, Business, Science and Arts occupations in Angelica, the most male-oriented occupations are Architecture & Engineering (100.0%), Arts, Media & Entertainment (100.0%), and Business & Financial (50.0%), while the most female-oriented occupations are Computers & Mathematics (100.0%), Health Diagnosing & Treating (89.7%), and Health Technologists (86.4%).
| Occupation | Male | Female |
| Management | 6 (26.1%) | 17 (73.9%) |
| Business & Financial | 4 (50.0%) | 4 (50.0%) |
| Computers, Engineering & Science | 2 (50.0%) | 2 (50.0%) |
| Computers & Mathematics | 0 (0.0%) | 2 (100.0%) |
| Architecture & Engineering | 2 (100.0%) | 0 (0.0%) |
| Life, Physical & Social Science | 0 (0.0%) | 0 (0.0%) |
| Community & Social Service | 13 (28.9%) | 32 (71.1%) |
| Education, Arts & Media | 2 (25.0%) | 6 (75.0%) |
| Legal Services & Support | 0 (0.0%) | 0 (0.0%) |
| Education Instruction & Library | 10 (27.8%) | 26 (72.2%) |
| Arts, Media & Entertainment | 1 (100.0%) | 0 (0.0%) |
| Health Diagnosing & Treating | 3 (10.3%) | 26 (89.7%) |
| Health Technologists | 3 (13.6%) | 19 (86.4%) |
| Total (Category) | 28 (25.7%) | 81 (74.3%) |
| Total (Overall) | 116 (42.5%) | 157 (57.5%) |
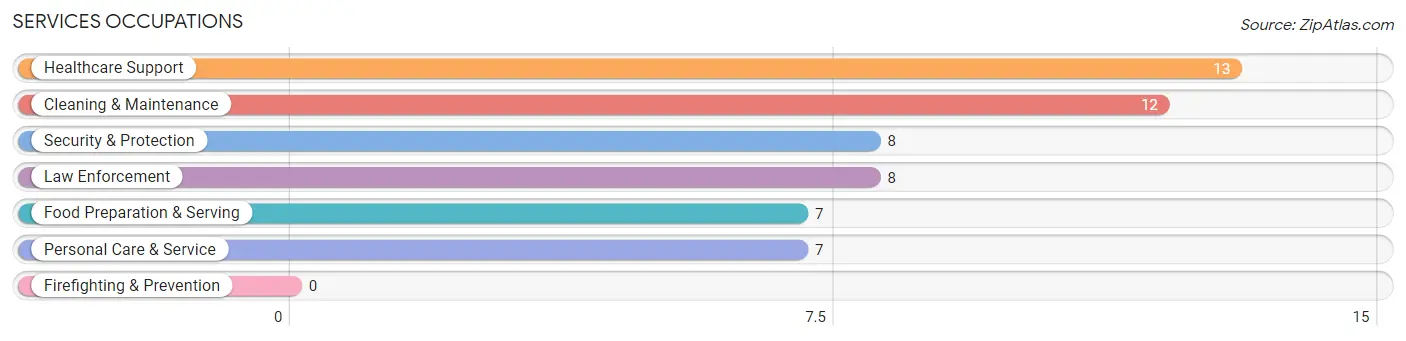
Services Occupations
The most common Services occupations in Angelica are Healthcare Support (13 | 4.8%), Cleaning & Maintenance (12 | 4.4%), Security & Protection (8 | 2.9%), Law Enforcement (8 | 2.9%), and Food Preparation & Serving (7 | 2.6%).
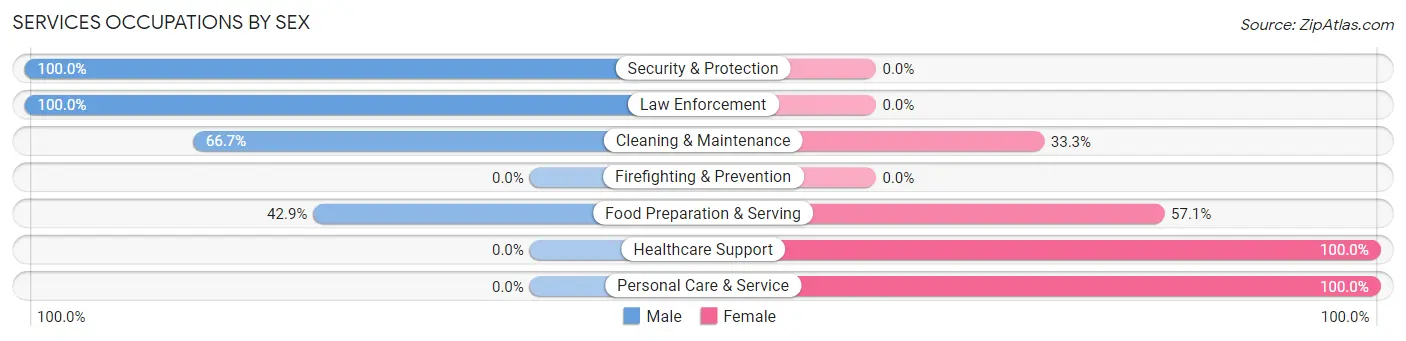
Services Occupations by Sex
Within the Services occupations in Angelica, the most male-oriented occupations are Security & Protection (100.0%), Law Enforcement (100.0%), and Cleaning & Maintenance (66.7%), while the most female-oriented occupations are Healthcare Support (100.0%), Personal Care & Service (100.0%), and Food Preparation & Serving (57.1%).
| Occupation | Male | Female |
| Healthcare Support | 0 (0.0%) | 13 (100.0%) |
| Security & Protection | 8 (100.0%) | 0 (0.0%) |
| Firefighting & Prevention | 0 (0.0%) | 0 (0.0%) |
| Law Enforcement | 8 (100.0%) | 0 (0.0%) |
| Food Preparation & Serving | 3 (42.9%) | 4 (57.1%) |
| Cleaning & Maintenance | 8 (66.7%) | 4 (33.3%) |
| Personal Care & Service | 0 (0.0%) | 7 (100.0%) |
| Total (Category) | 19 (40.4%) | 28 (59.6%) |
| Total (Overall) | 116 (42.5%) | 157 (57.5%) |
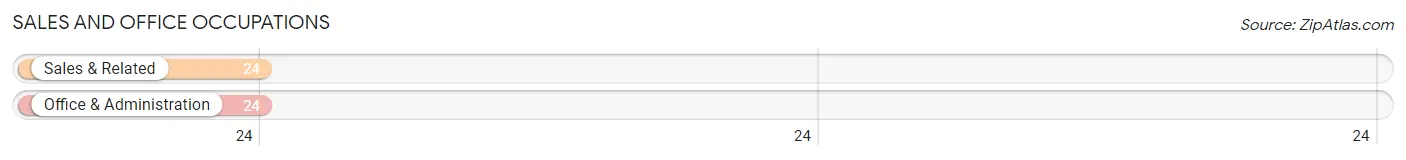
Sales and Office Occupations
The most common Sales and Office occupations in Angelica are Sales & Related (24 | 8.8%), and Office & Administration (24 | 8.8%).
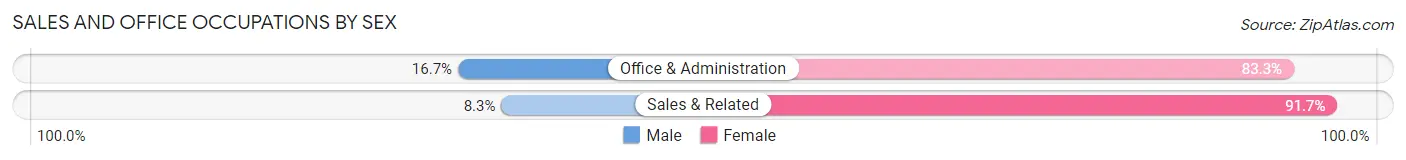
Sales and Office Occupations by Sex
| Occupation | Male | Female |
| Sales & Related | 2 (8.3%) | 22 (91.7%) |
| Office & Administration | 4 (16.7%) | 20 (83.3%) |
| Total (Category) | 6 (12.5%) | 42 (87.5%) |
| Total (Overall) | 116 (42.5%) | 157 (57.5%) |
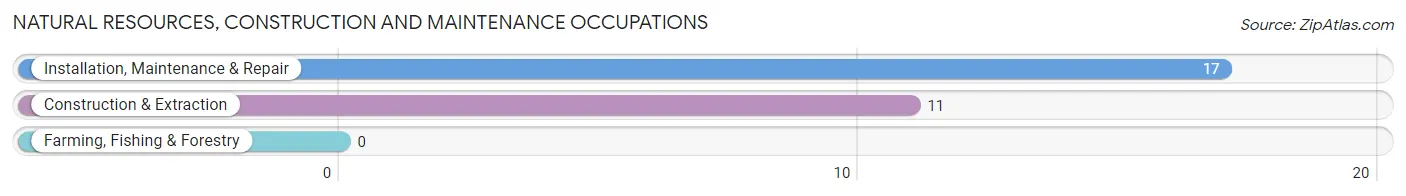
Natural Resources, Construction and Maintenance Occupations
The most common Natural Resources, Construction and Maintenance occupations in Angelica are Installation, Maintenance & Repair (17 | 6.2%), and Construction & Extraction (11 | 4.0%).
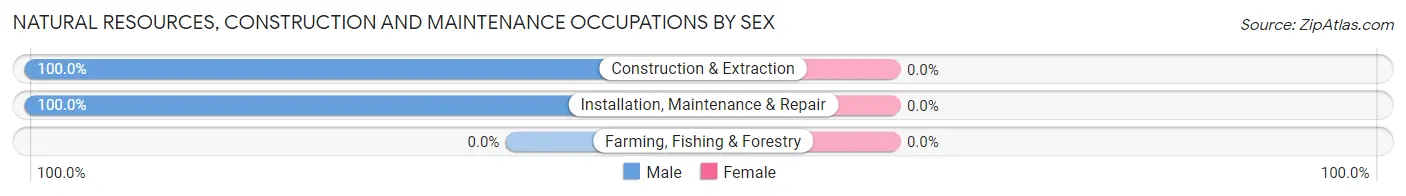
Natural Resources, Construction and Maintenance Occupations by Sex
| Occupation | Male | Female |
| Farming, Fishing & Forestry | 0 (0.0%) | 0 (0.0%) |
| Construction & Extraction | 11 (100.0%) | 0 (0.0%) |
| Installation, Maintenance & Repair | 17 (100.0%) | 0 (0.0%) |
| Total (Category) | 28 (100.0%) | 0 (0.0%) |
| Total (Overall) | 116 (42.5%) | 157 (57.5%) |
Production, Transportation and Moving Occupations
The most common Production, Transportation and Moving occupations in Angelica are Production (17 | 6.2%), Transportation (13 | 4.8%), and Material Moving (11 | 4.0%).
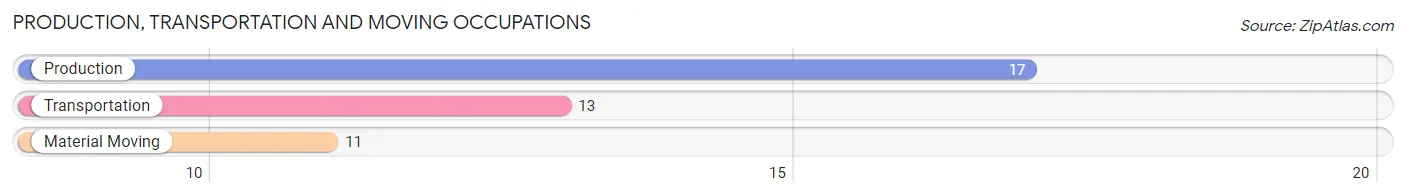
Production, Transportation and Moving Occupations by Sex
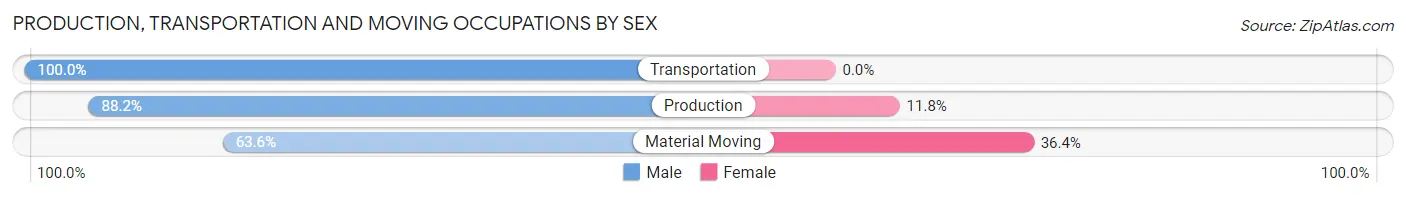
| Occupation | Male | Female |
| Production | 15 (88.2%) | 2 (11.8%) |
| Transportation | 13 (100.0%) | 0 (0.0%) |
| Material Moving | 7 (63.6%) | 4 (36.4%) |
| Total (Category) | 35 (85.4%) | 6 (14.6%) |
| Total (Overall) | 116 (42.5%) | 157 (57.5%) |
Employment Industries by Sex in Angelica
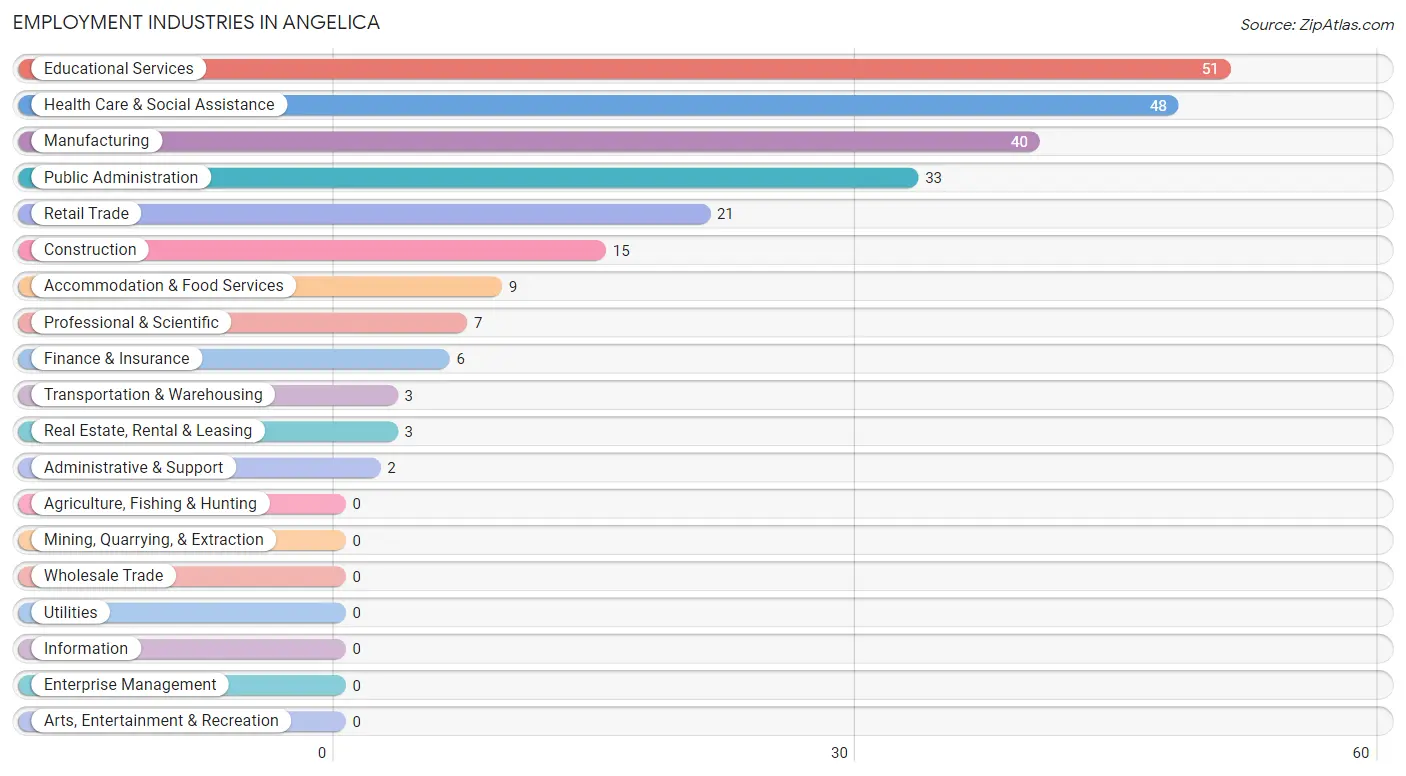
Employment Industries in Angelica
The major employment industries in Angelica include Educational Services (51 | 18.7%), Health Care & Social Assistance (48 | 17.6%), Manufacturing (40 | 14.6%), Public Administration (33 | 12.1%), and Retail Trade (21 | 7.7%).
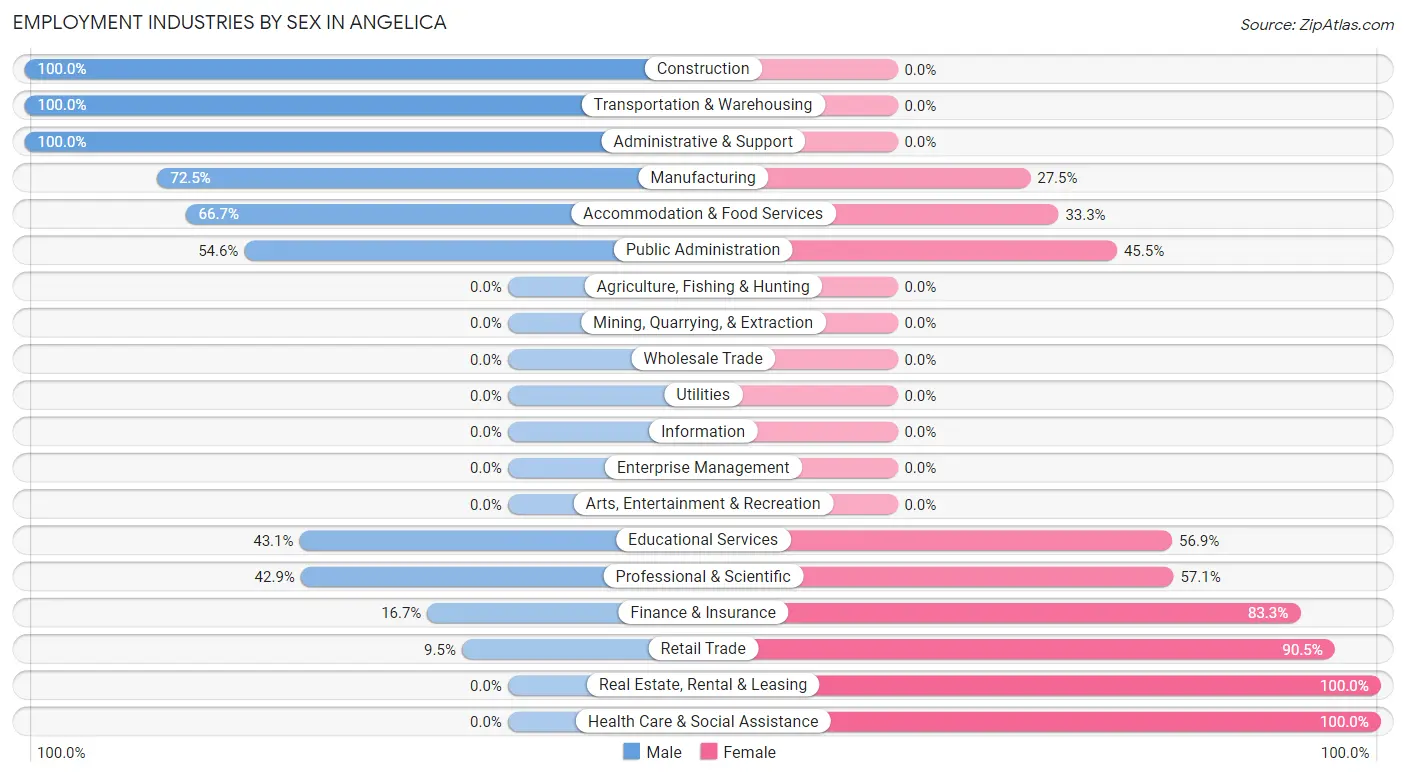
Employment Industries by Sex in Angelica
The Angelica industries that see more men than women are Construction (100.0%), Transportation & Warehousing (100.0%), and Administrative & Support (100.0%), whereas the industries that tend to have a higher number of women are Real Estate, Rental & Leasing (100.0%), Health Care & Social Assistance (100.0%), and Retail Trade (90.5%).
| Industry | Male | Female |
| Agriculture, Fishing & Hunting | 0 (0.0%) | 0 (0.0%) |
| Mining, Quarrying, & Extraction | 0 (0.0%) | 0 (0.0%) |
| Construction | 15 (100.0%) | 0 (0.0%) |
| Manufacturing | 29 (72.5%) | 11 (27.5%) |
| Wholesale Trade | 0 (0.0%) | 0 (0.0%) |
| Retail Trade | 2 (9.5%) | 19 (90.5%) |
| Transportation & Warehousing | 3 (100.0%) | 0 (0.0%) |
| Utilities | 0 (0.0%) | 0 (0.0%) |
| Information | 0 (0.0%) | 0 (0.0%) |
| Finance & Insurance | 1 (16.7%) | 5 (83.3%) |
| Real Estate, Rental & Leasing | 0 (0.0%) | 3 (100.0%) |
| Professional & Scientific | 3 (42.9%) | 4 (57.1%) |
| Enterprise Management | 0 (0.0%) | 0 (0.0%) |
| Administrative & Support | 2 (100.0%) | 0 (0.0%) |
| Educational Services | 22 (43.1%) | 29 (56.9%) |
| Health Care & Social Assistance | 0 (0.0%) | 48 (100.0%) |
| Arts, Entertainment & Recreation | 0 (0.0%) | 0 (0.0%) |
| Accommodation & Food Services | 6 (66.7%) | 3 (33.3%) |
| Public Administration | 18 (54.5%) | 15 (45.5%) |
| Total | 116 (42.5%) | 157 (57.5%) |
Education in Angelica
School Enrollment in Angelica
The most common levels of schooling among the 103 students in Angelica are high school (31 | 30.1%), elementary school (26 | 25.2%), and middle school (22 | 21.4%).
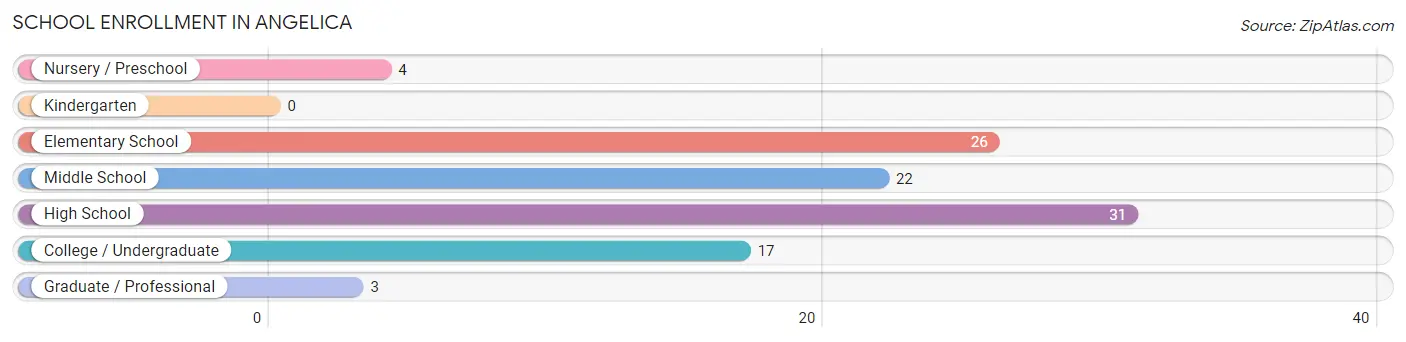
| School Level | # Students | % Students |
| Nursery / Preschool | 4 | 3.9% |
| Kindergarten | 0 | 0.0% |
| Elementary School | 26 | 25.2% |
| Middle School | 22 | 21.4% |
| High School | 31 | 30.1% |
| College / Undergraduate | 17 | 16.5% |
| Graduate / Professional | 3 | 2.9% |
| Total | 103 | 100.0% |
School Enrollment by Age by Funding Source in Angelica
Out of a total of 103 students who are enrolled in schools in Angelica, 19 (18.4%) attend a private institution, while the remaining 84 (81.6%) are enrolled in public schools. The age group of 25 to 34 year olds has the highest likelihood of being enrolled in private schools, with 3 (100.0% in the age bracket) enrolled. Conversely, the age group of 18 to 19 year olds has the lowest likelihood of being enrolled in a private school, with 9 (100.0% in the age bracket) attending a public institution.
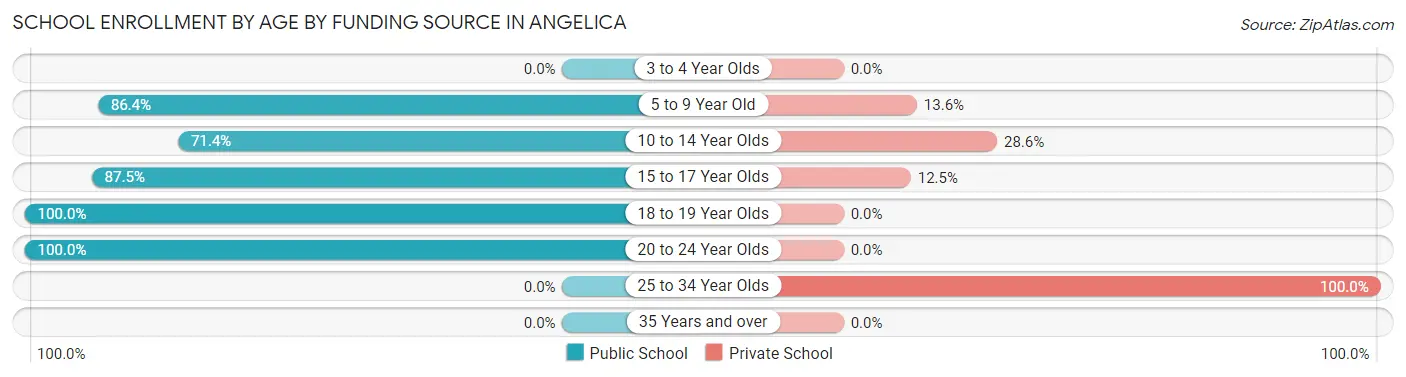
| Age Bracket | Public School | Private School |
| 3 to 4 Year Olds | 0 (0.0%) | 0 (0.0%) |
| 5 to 9 Year Old | 19 (86.4%) | 3 (13.6%) |
| 10 to 14 Year Olds | 25 (71.4%) | 10 (28.6%) |
| 15 to 17 Year Olds | 21 (87.5%) | 3 (12.5%) |
| 18 to 19 Year Olds | 9 (100.0%) | 0 (0.0%) |
| 20 to 24 Year Olds | 10 (100.0%) | 0 (0.0%) |
| 25 to 34 Year Olds | 0 (0.0%) | 3 (100.0%) |
| 35 Years and over | 0 (0.0%) | 0 (0.0%) |
| Total | 84 (81.6%) | 19 (18.4%) |
Educational Attainment by Field of Study in Angelica
Education (31 | 27.0%), business (16 | 13.9%), bio, nature & agricultural (14 | 12.2%), science & technology (12 | 10.4%), and social sciences (9 | 7.8%) are the most common fields of study among 115 individuals in Angelica who have obtained a bachelor's degree or higher.
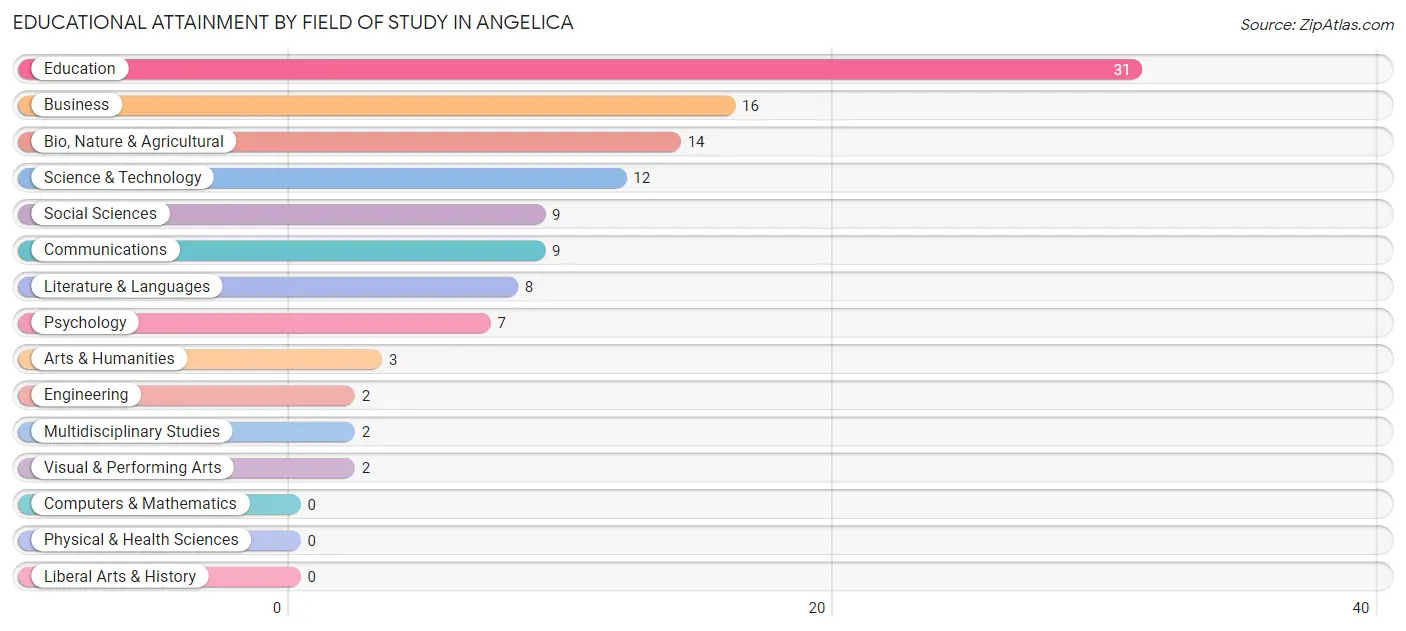
| Field of Study | # Graduates | % Graduates |
| Computers & Mathematics | 0 | 0.0% |
| Bio, Nature & Agricultural | 14 | 12.2% |
| Physical & Health Sciences | 0 | 0.0% |
| Psychology | 7 | 6.1% |
| Social Sciences | 9 | 7.8% |
| Engineering | 2 | 1.7% |
| Multidisciplinary Studies | 2 | 1.7% |
| Science & Technology | 12 | 10.4% |
| Business | 16 | 13.9% |
| Education | 31 | 27.0% |
| Literature & Languages | 8 | 7.0% |
| Liberal Arts & History | 0 | 0.0% |
| Visual & Performing Arts | 2 | 1.7% |
| Communications | 9 | 7.8% |
| Arts & Humanities | 3 | 2.6% |
| Total | 115 | 100.0% |
Transportation & Commute in Angelica
Vehicle Availability by Sex in Angelica
The most prevalent vehicle ownership categories in Angelica are males with 2 vehicles (72, accounting for 63.2%) and females with 2 vehicles (103, making up 46.5%).
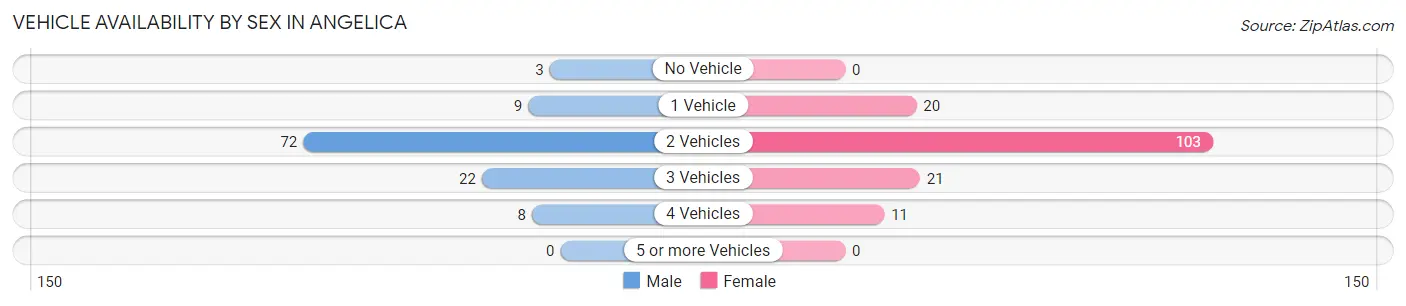
| Vehicles Available | Male | Female |
| No Vehicle | 3 (2.6%) | 0 (0.0%) |
| 1 Vehicle | 9 (7.9%) | 20 (12.9%) |
| 2 Vehicles | 72 (63.2%) | 103 (66.4%) |
| 3 Vehicles | 22 (19.3%) | 21 (13.6%) |
| 4 Vehicles | 8 (7.0%) | 11 (7.1%) |
| 5 or more Vehicles | 0 (0.0%) | 0 (0.0%) |
| Total | 114 (100.0%) | 155 (100.0%) |
Commute Time in Angelica
The most frequently occuring commute durations in Angelica are 10 to 14 minutes (50 commuters, 18.8%), 15 to 19 minutes (37 commuters, 13.9%), and 30 to 34 minutes (34 commuters, 12.8%).
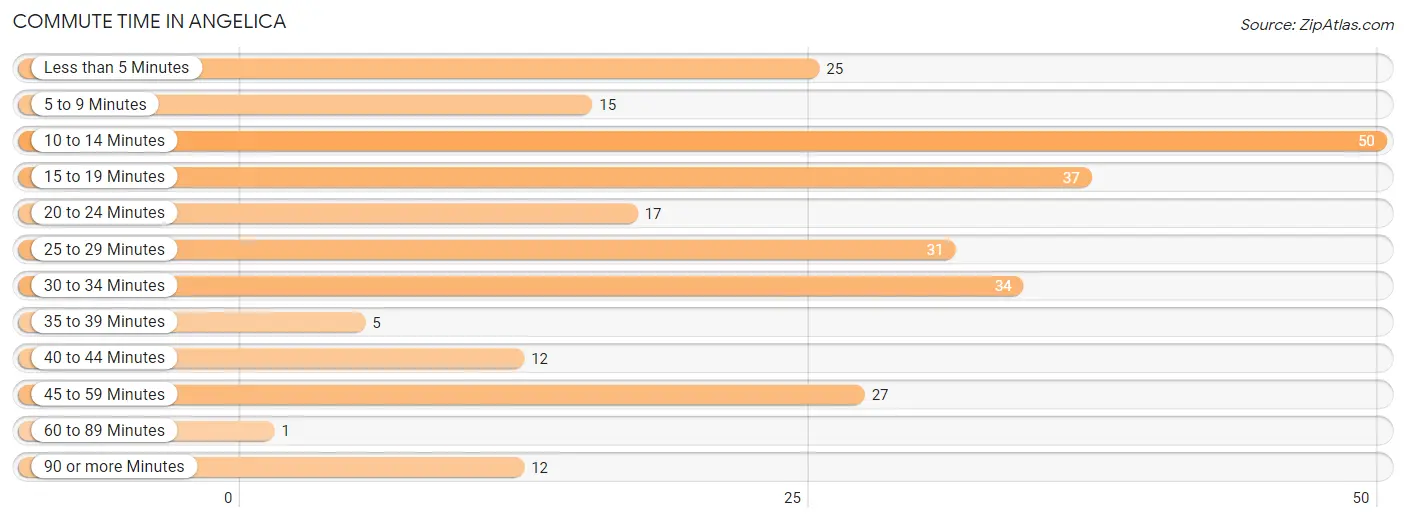
| Commute Time | # Commuters | % Commuters |
| Less than 5 Minutes | 25 | 9.4% |
| 5 to 9 Minutes | 15 | 5.6% |
| 10 to 14 Minutes | 50 | 18.8% |
| 15 to 19 Minutes | 37 | 13.9% |
| 20 to 24 Minutes | 17 | 6.4% |
| 25 to 29 Minutes | 31 | 11.7% |
| 30 to 34 Minutes | 34 | 12.8% |
| 35 to 39 Minutes | 5 | 1.9% |
| 40 to 44 Minutes | 12 | 4.5% |
| 45 to 59 Minutes | 27 | 10.2% |
| 60 to 89 Minutes | 1 | 0.4% |
| 90 or more Minutes | 12 | 4.5% |
Commute Time by Sex in Angelica
The most common commute times in Angelica are 15 to 19 minutes (22 commuters, 19.5%) for males and 10 to 14 minutes (34 commuters, 22.2%) for females.
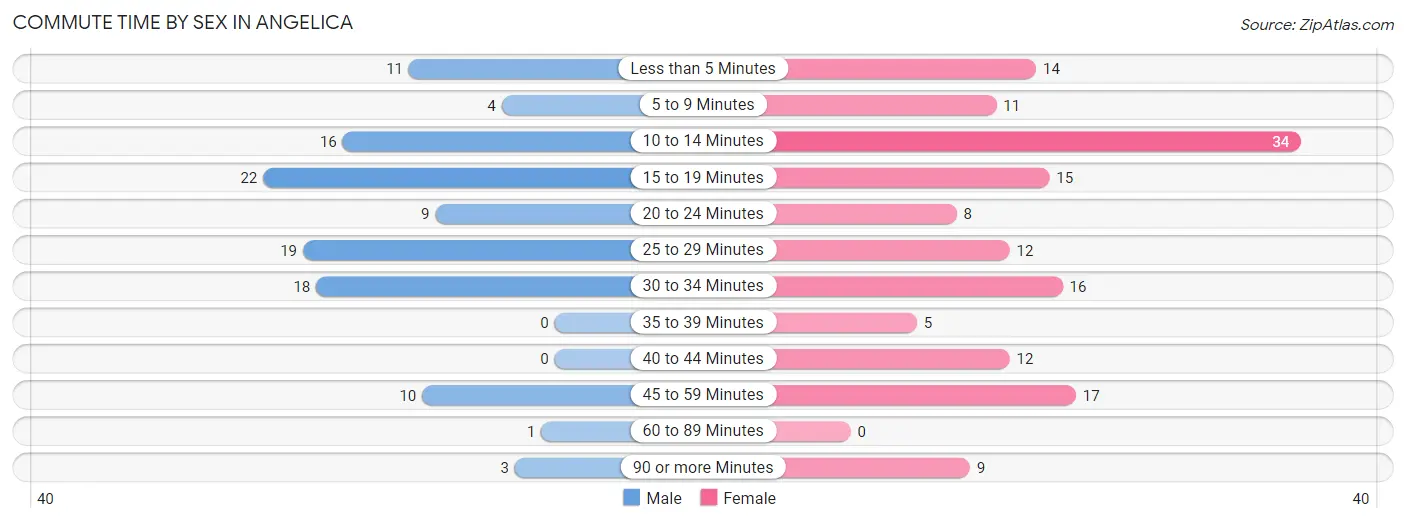
| Commute Time | Male | Female |
| Less than 5 Minutes | 11 (9.7%) | 14 (9.1%) |
| 5 to 9 Minutes | 4 (3.5%) | 11 (7.2%) |
| 10 to 14 Minutes | 16 (14.2%) | 34 (22.2%) |
| 15 to 19 Minutes | 22 (19.5%) | 15 (9.8%) |
| 20 to 24 Minutes | 9 (8.0%) | 8 (5.2%) |
| 25 to 29 Minutes | 19 (16.8%) | 12 (7.8%) |
| 30 to 34 Minutes | 18 (15.9%) | 16 (10.5%) |
| 35 to 39 Minutes | 0 (0.0%) | 5 (3.3%) |
| 40 to 44 Minutes | 0 (0.0%) | 12 (7.8%) |
| 45 to 59 Minutes | 10 (8.8%) | 17 (11.1%) |
| 60 to 89 Minutes | 1 (0.9%) | 0 (0.0%) |
| 90 or more Minutes | 3 (2.6%) | 9 (5.9%) |
Time of Departure to Work by Sex in Angelica
The most frequent times of departure to work in Angelica are 7:00 AM to 7:29 AM (27, 23.9%) for males and 7:30 AM to 7:59 AM (46, 30.1%) for females.
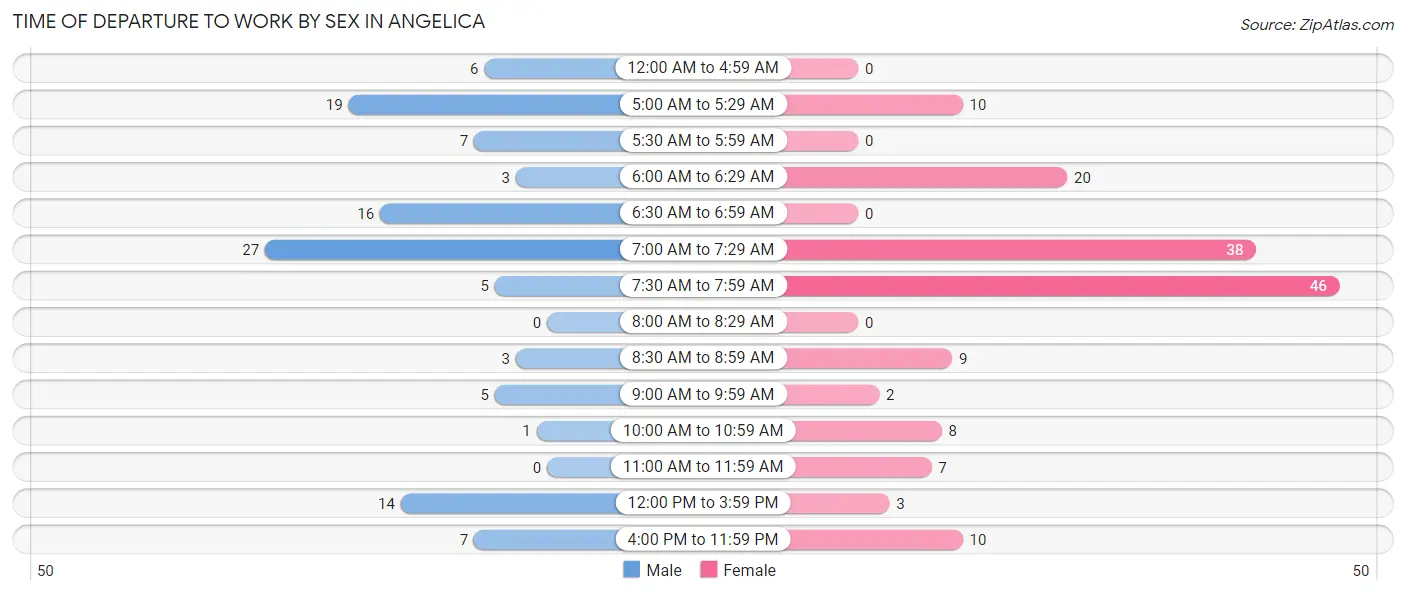
| Time of Departure | Male | Female |
| 12:00 AM to 4:59 AM | 6 (5.3%) | 0 (0.0%) |
| 5:00 AM to 5:29 AM | 19 (16.8%) | 10 (6.5%) |
| 5:30 AM to 5:59 AM | 7 (6.2%) | 0 (0.0%) |
| 6:00 AM to 6:29 AM | 3 (2.6%) | 20 (13.1%) |
| 6:30 AM to 6:59 AM | 16 (14.2%) | 0 (0.0%) |
| 7:00 AM to 7:29 AM | 27 (23.9%) | 38 (24.8%) |
| 7:30 AM to 7:59 AM | 5 (4.4%) | 46 (30.1%) |
| 8:00 AM to 8:29 AM | 0 (0.0%) | 0 (0.0%) |
| 8:30 AM to 8:59 AM | 3 (2.6%) | 9 (5.9%) |
| 9:00 AM to 9:59 AM | 5 (4.4%) | 2 (1.3%) |
| 10:00 AM to 10:59 AM | 1 (0.9%) | 8 (5.2%) |
| 11:00 AM to 11:59 AM | 0 (0.0%) | 7 (4.6%) |
| 12:00 PM to 3:59 PM | 14 (12.4%) | 3 (2.0%) |
| 4:00 PM to 11:59 PM | 7 (6.2%) | 10 (6.5%) |
| Total | 113 (100.0%) | 153 (100.0%) |
Housing Occupancy in Angelica
Occupancy by Ownership in Angelica
Of the total 287 dwellings in Angelica, owner-occupied units account for 223 (77.7%), while renter-occupied units make up 64 (22.3%).
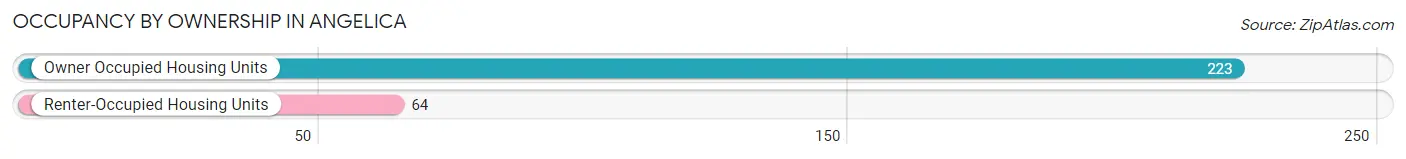
| Occupancy | # Housing Units | % Housing Units |
| Owner Occupied Housing Units | 223 | 77.7% |
| Renter-Occupied Housing Units | 64 | 22.3% |
| Total Occupied Housing Units | 287 | 100.0% |
Occupancy by Household Size in Angelica
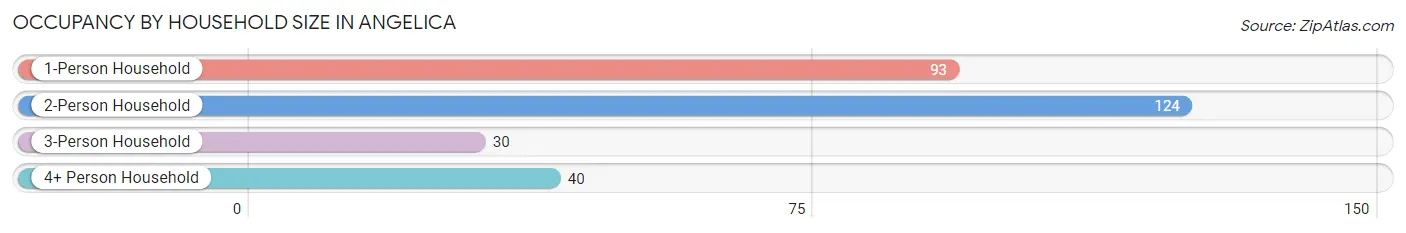
| Household Size | # Housing Units | % Housing Units |
| 1-Person Household | 93 | 32.4% |
| 2-Person Household | 124 | 43.2% |
| 3-Person Household | 30 | 10.4% |
| 4+ Person Household | 40 | 13.9% |
| Total Housing Units | 287 | 100.0% |
Occupancy by Ownership by Household Size in Angelica
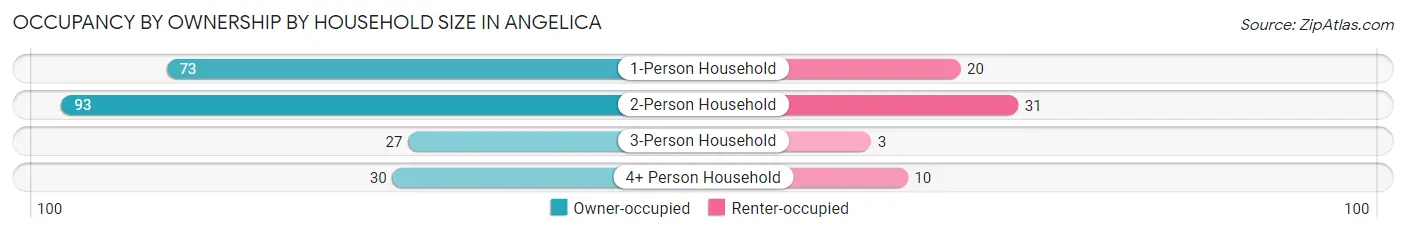
| Household Size | Owner-occupied | Renter-occupied |
| 1-Person Household | 73 (78.5%) | 20 (21.5%) |
| 2-Person Household | 93 (75.0%) | 31 (25.0%) |
| 3-Person Household | 27 (90.0%) | 3 (10.0%) |
| 4+ Person Household | 30 (75.0%) | 10 (25.0%) |
| Total Housing Units | 223 (77.7%) | 64 (22.3%) |
Occupancy by Educational Attainment in Angelica
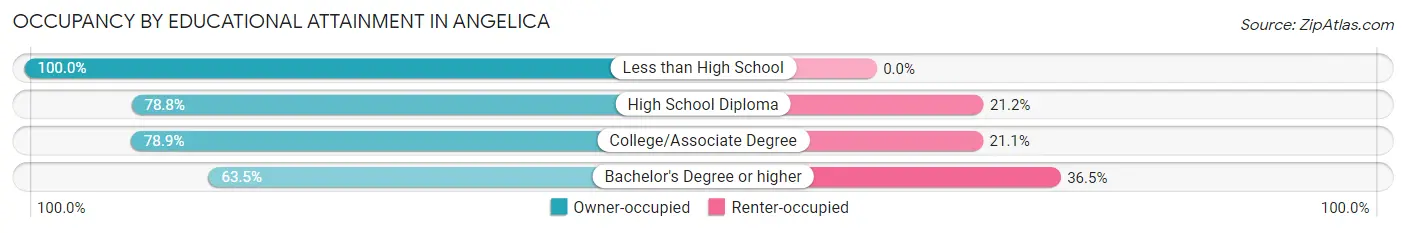
| Household Size | Owner-occupied | Renter-occupied |
| Less than High School | 38 (100.0%) | 0 (0.0%) |
| High School Diploma | 52 (78.8%) | 14 (21.2%) |
| College/Associate Degree | 86 (78.9%) | 23 (21.1%) |
| Bachelor's Degree or higher | 47 (63.5%) | 27 (36.5%) |
Occupancy by Age of Householder in Angelica
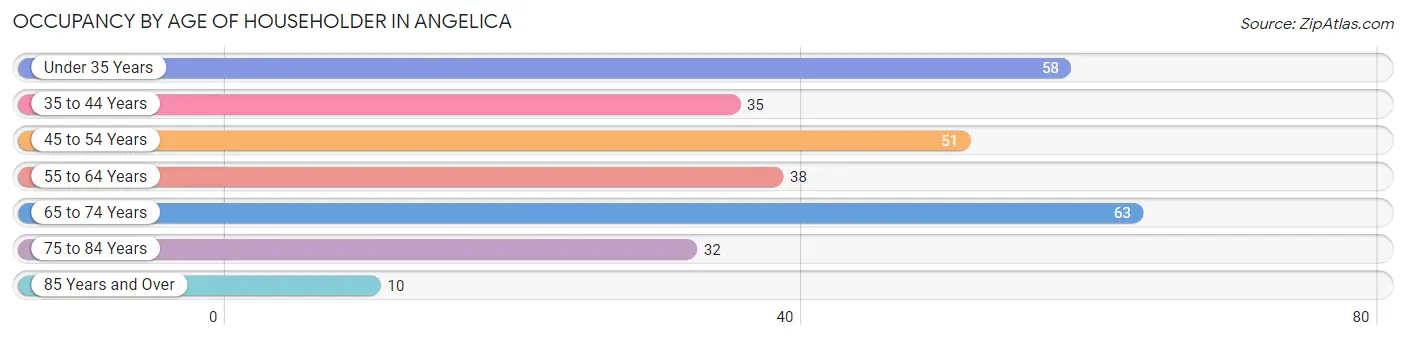
| Age Bracket | # Households | % Households |
| Under 35 Years | 58 | 20.2% |
| 35 to 44 Years | 35 | 12.2% |
| 45 to 54 Years | 51 | 17.8% |
| 55 to 64 Years | 38 | 13.2% |
| 65 to 74 Years | 63 | 22.0% |
| 75 to 84 Years | 32 | 11.2% |
| 85 Years and Over | 10 | 3.5% |
| Total | 287 | 100.0% |
Housing Finances in Angelica
Median Income by Occupancy in Angelica
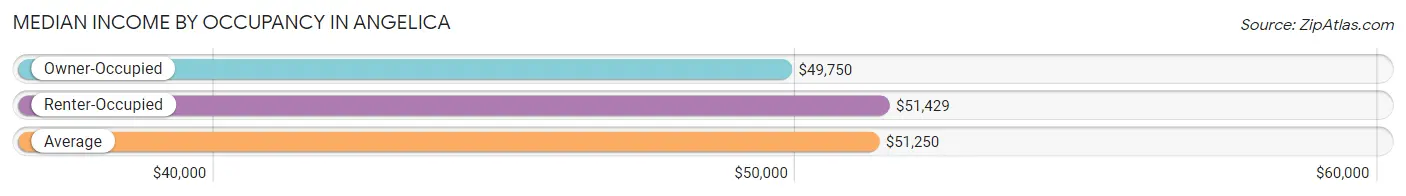
| Occupancy Type | # Households | Median Income |
| Owner-Occupied | 223 (77.7%) | $49,750 |
| Renter-Occupied | 64 (22.3%) | $51,429 |
| Average | 287 (100.0%) | $51,250 |
Occupancy by Householder Income Bracket in Angelica
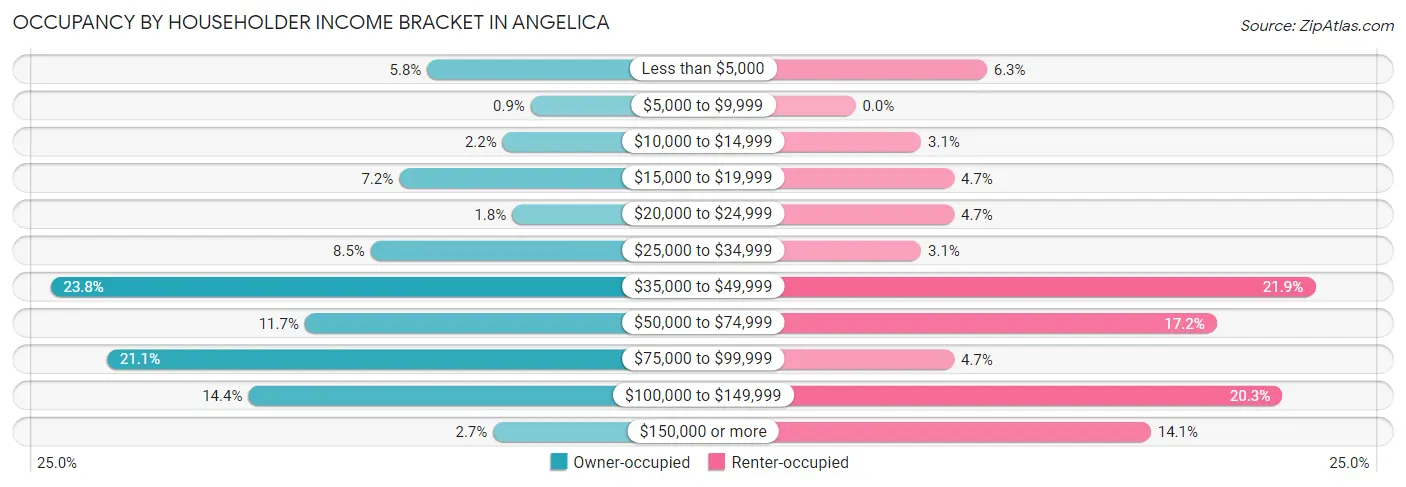
| Income Bracket | Owner-occupied | Renter-occupied |
| Less than $5,000 | 13 (5.8%) | 4 (6.2%) |
| $5,000 to $9,999 | 2 (0.9%) | 0 (0.0%) |
| $10,000 to $14,999 | 5 (2.2%) | 2 (3.1%) |
| $15,000 to $19,999 | 16 (7.2%) | 3 (4.7%) |
| $20,000 to $24,999 | 4 (1.8%) | 3 (4.7%) |
| $25,000 to $34,999 | 19 (8.5%) | 2 (3.1%) |
| $35,000 to $49,999 | 53 (23.8%) | 14 (21.9%) |
| $50,000 to $74,999 | 26 (11.7%) | 11 (17.2%) |
| $75,000 to $99,999 | 47 (21.1%) | 3 (4.7%) |
| $100,000 to $149,999 | 32 (14.3%) | 13 (20.3%) |
| $150,000 or more | 6 (2.7%) | 9 (14.1%) |
| Total | 223 (100.0%) | 64 (100.0%) |
Monthly Housing Cost Tiers in Angelica
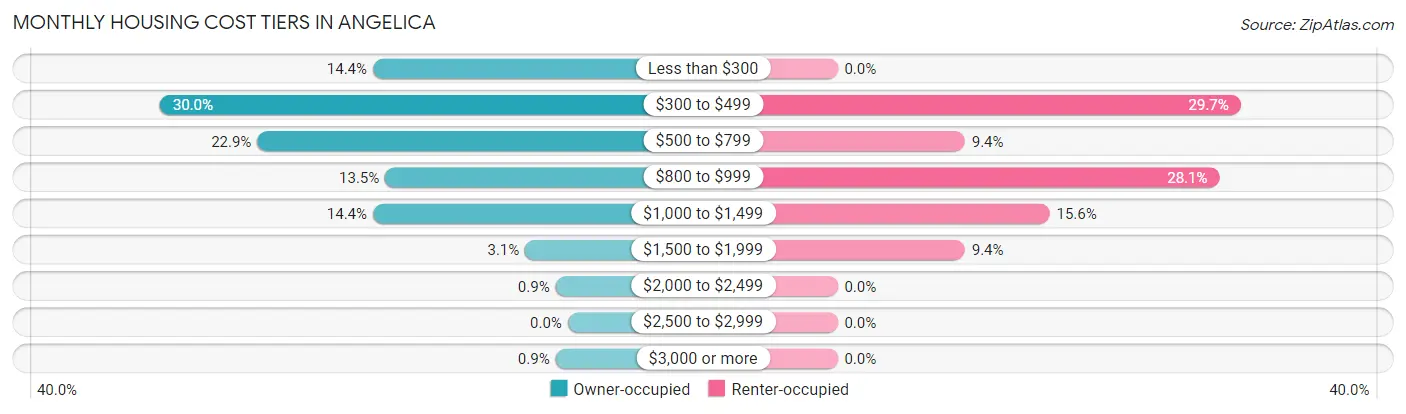
| Monthly Cost | Owner-occupied | Renter-occupied |
| Less than $300 | 32 (14.3%) | 0 (0.0%) |
| $300 to $499 | 67 (30.0%) | 19 (29.7%) |
| $500 to $799 | 51 (22.9%) | 6 (9.4%) |
| $800 to $999 | 30 (13.5%) | 18 (28.1%) |
| $1,000 to $1,499 | 32 (14.3%) | 10 (15.6%) |
| $1,500 to $1,999 | 7 (3.1%) | 6 (9.4%) |
| $2,000 to $2,499 | 2 (0.9%) | 0 (0.0%) |
| $2,500 to $2,999 | 0 (0.0%) | 0 (0.0%) |
| $3,000 or more | 2 (0.9%) | 0 (0.0%) |
| Total | 223 (100.0%) | 64 (100.0%) |
Physical Housing Characteristics in Angelica
Housing Structures in Angelica
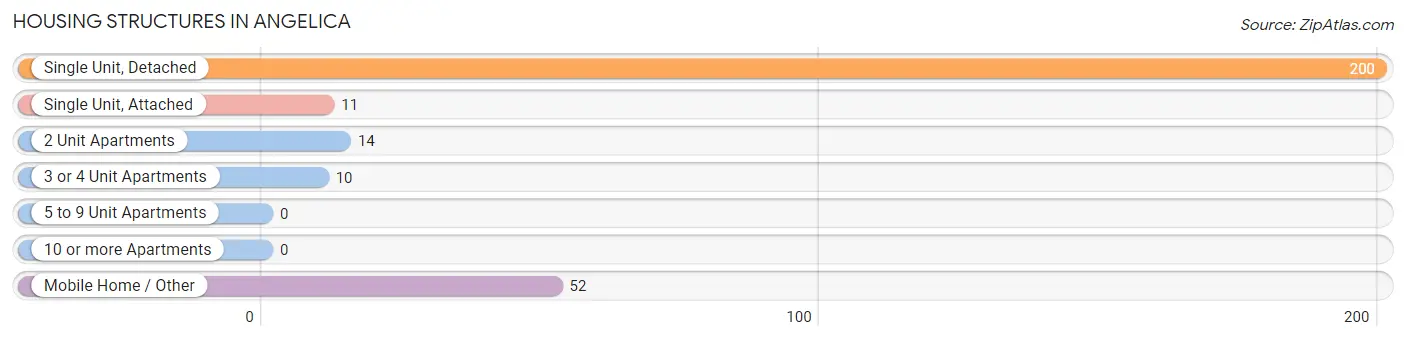
| Structure Type | # Housing Units | % Housing Units |
| Single Unit, Detached | 200 | 69.7% |
| Single Unit, Attached | 11 | 3.8% |
| 2 Unit Apartments | 14 | 4.9% |
| 3 or 4 Unit Apartments | 10 | 3.5% |
| 5 to 9 Unit Apartments | 0 | 0.0% |
| 10 or more Apartments | 0 | 0.0% |
| Mobile Home / Other | 52 | 18.1% |
| Total | 287 | 100.0% |
Housing Structures by Occupancy in Angelica
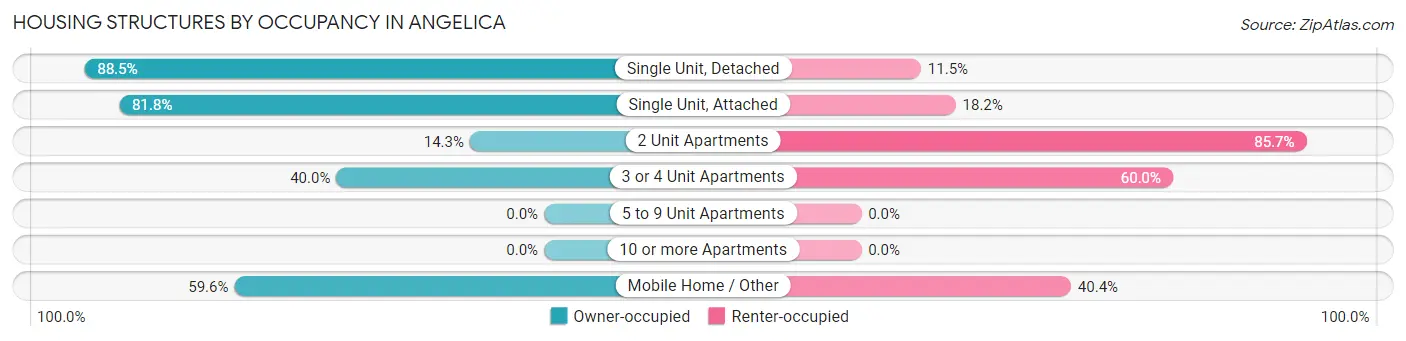
| Structure Type | Owner-occupied | Renter-occupied |
| Single Unit, Detached | 177 (88.5%) | 23 (11.5%) |
| Single Unit, Attached | 9 (81.8%) | 2 (18.2%) |
| 2 Unit Apartments | 2 (14.3%) | 12 (85.7%) |
| 3 or 4 Unit Apartments | 4 (40.0%) | 6 (60.0%) |
| 5 to 9 Unit Apartments | 0 (0.0%) | 0 (0.0%) |
| 10 or more Apartments | 0 (0.0%) | 0 (0.0%) |
| Mobile Home / Other | 31 (59.6%) | 21 (40.4%) |
| Total | 223 (77.7%) | 64 (22.3%) |
Housing Structures by Number of Rooms in Angelica
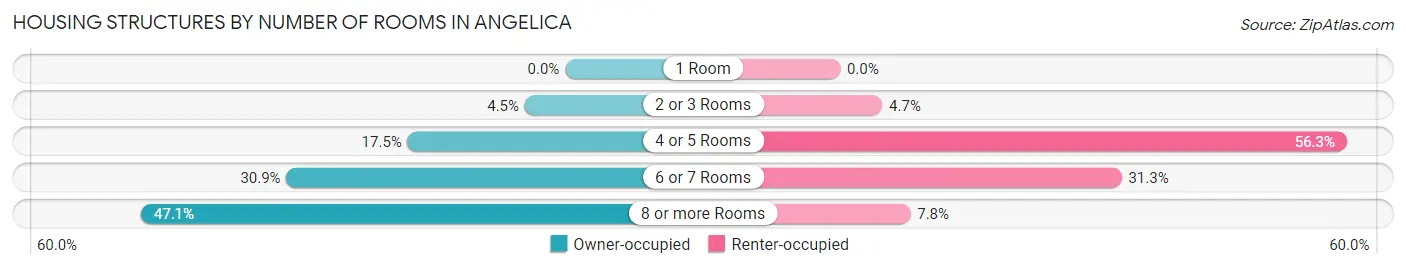
| Number of Rooms | Owner-occupied | Renter-occupied |
| 1 Room | 0 (0.0%) | 0 (0.0%) |
| 2 or 3 Rooms | 10 (4.5%) | 3 (4.7%) |
| 4 or 5 Rooms | 39 (17.5%) | 36 (56.2%) |
| 6 or 7 Rooms | 69 (30.9%) | 20 (31.2%) |
| 8 or more Rooms | 105 (47.1%) | 5 (7.8%) |
| Total | 223 (100.0%) | 64 (100.0%) |
Housing Structure by Heating Type in Angelica
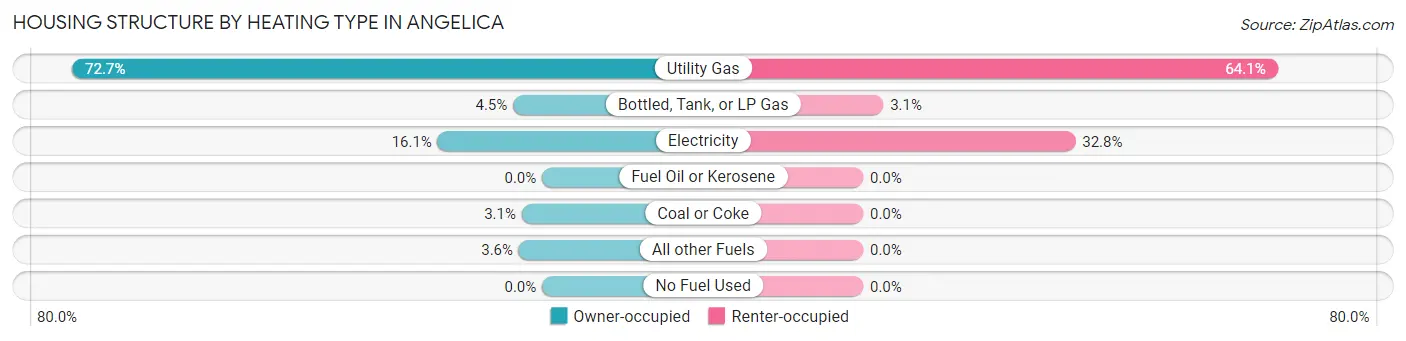
| Heating Type | Owner-occupied | Renter-occupied |
| Utility Gas | 162 (72.7%) | 41 (64.1%) |
| Bottled, Tank, or LP Gas | 10 (4.5%) | 2 (3.1%) |
| Electricity | 36 (16.1%) | 21 (32.8%) |
| Fuel Oil or Kerosene | 0 (0.0%) | 0 (0.0%) |
| Coal or Coke | 7 (3.1%) | 0 (0.0%) |
| All other Fuels | 8 (3.6%) | 0 (0.0%) |
| No Fuel Used | 0 (0.0%) | 0 (0.0%) |
| Total | 223 (100.0%) | 64 (100.0%) |
Household Vehicle Usage in Angelica
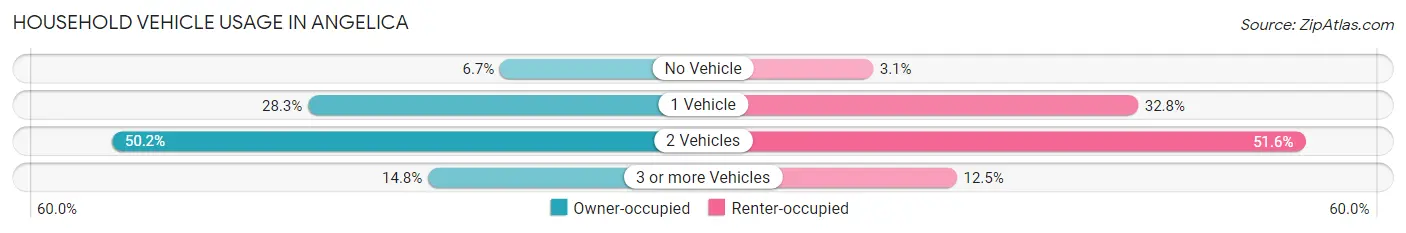
| Vehicles per Household | Owner-occupied | Renter-occupied |
| No Vehicle | 15 (6.7%) | 2 (3.1%) |
| 1 Vehicle | 63 (28.2%) | 21 (32.8%) |
| 2 Vehicles | 112 (50.2%) | 33 (51.6%) |
| 3 or more Vehicles | 33 (14.8%) | 8 (12.5%) |
| Total | 223 (100.0%) | 64 (100.0%) |
Real Estate & Mortgages in Angelica
Real Estate and Mortgage Overview in Angelica
| Characteristic | Without Mortgage | With Mortgage |
| Housing Units | 135 | 88 |
| Median Property Value | $64,100 | $75,900 |
| Median Household Income | $44,554 | $4 |
| Monthly Housing Costs | $427 | $0 |
| Real Estate Taxes | $1,804 | $4 |
Property Value by Mortgage Status in Angelica
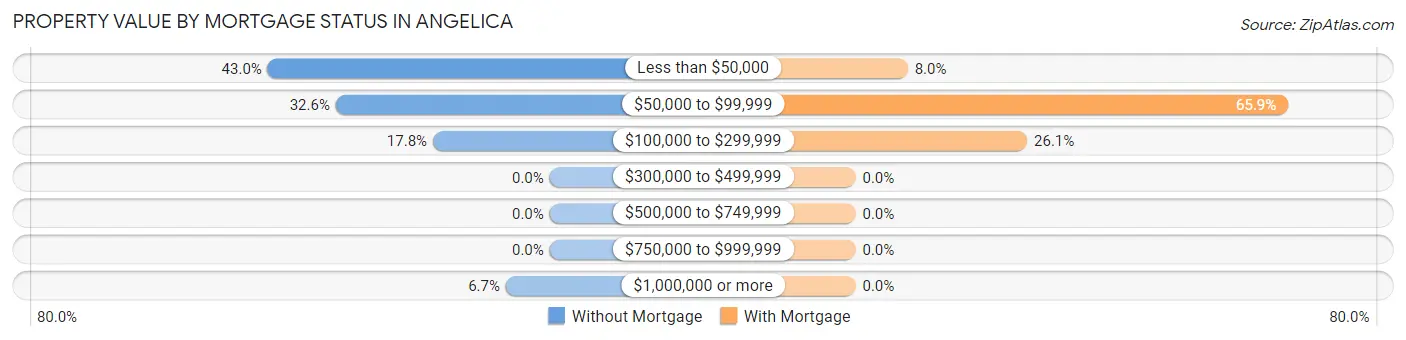
| Property Value | Without Mortgage | With Mortgage |
| Less than $50,000 | 58 (43.0%) | 7 (8.0%) |
| $50,000 to $99,999 | 44 (32.6%) | 58 (65.9%) |
| $100,000 to $299,999 | 24 (17.8%) | 23 (26.1%) |
| $300,000 to $499,999 | 0 (0.0%) | 0 (0.0%) |
| $500,000 to $749,999 | 0 (0.0%) | 0 (0.0%) |
| $750,000 to $999,999 | 0 (0.0%) | 0 (0.0%) |
| $1,000,000 or more | 9 (6.7%) | 0 (0.0%) |
| Total | 135 (100.0%) | 88 (100.0%) |
Household Income by Mortgage Status in Angelica
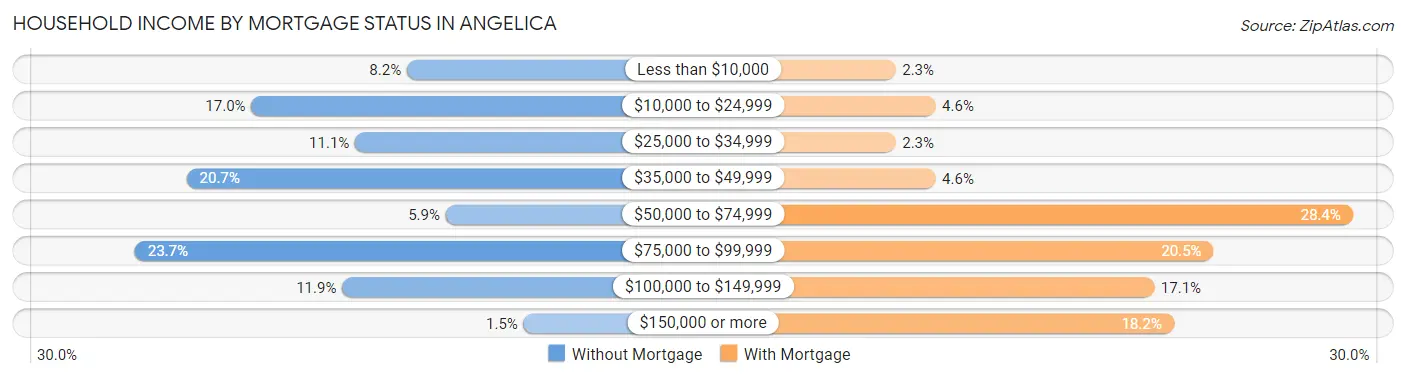
| Household Income | Without Mortgage | With Mortgage |
| Less than $10,000 | 11 (8.2%) | 2 (2.3%) |
| $10,000 to $24,999 | 23 (17.0%) | 4 (4.5%) |
| $25,000 to $34,999 | 15 (11.1%) | 2 (2.3%) |
| $35,000 to $49,999 | 28 (20.7%) | 4 (4.5%) |
| $50,000 to $74,999 | 8 (5.9%) | 25 (28.4%) |
| $75,000 to $99,999 | 32 (23.7%) | 18 (20.4%) |
| $100,000 to $149,999 | 16 (11.8%) | 15 (17.1%) |
| $150,000 or more | 2 (1.5%) | 16 (18.2%) |
| Total | 135 (100.0%) | 88 (100.0%) |
Property Value to Household Income Ratio in Angelica
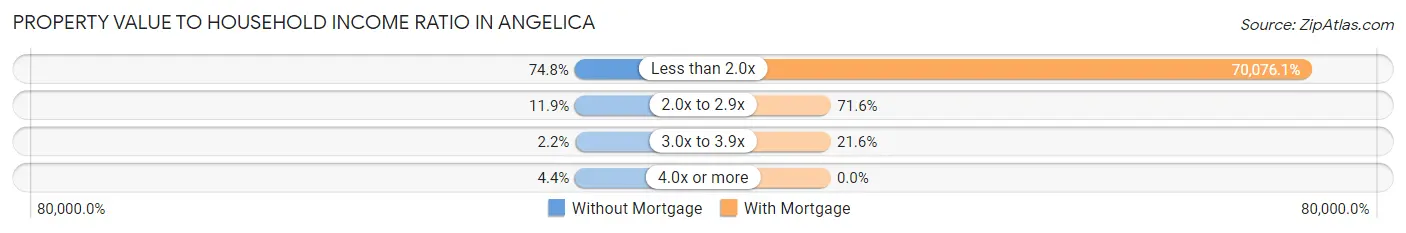
| Value-to-Income Ratio | Without Mortgage | With Mortgage |
| Less than 2.0x | 101 (74.8%) | 61,667 (70,076.1%) |
| 2.0x to 2.9x | 16 (11.8%) | 63 (71.6%) |
| 3.0x to 3.9x | 3 (2.2%) | 19 (21.6%) |
| 4.0x or more | 6 (4.4%) | 0 (0.0%) |
| Total | 135 (100.0%) | 88 (100.0%) |
Real Estate Taxes by Mortgage Status in Angelica
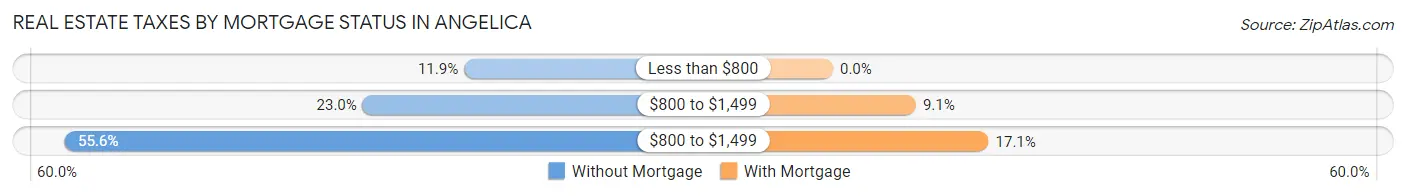
| Property Taxes | Without Mortgage | With Mortgage |
| Less than $800 | 16 (11.8%) | 0 (0.0%) |
| $800 to $1,499 | 31 (23.0%) | 8 (9.1%) |
| $800 to $1,499 | 75 (55.6%) | 15 (17.1%) |
| Total | 135 (100.0%) | 88 (100.0%) |
Health & Disability in Angelica
Health Insurance Coverage by Age in Angelica
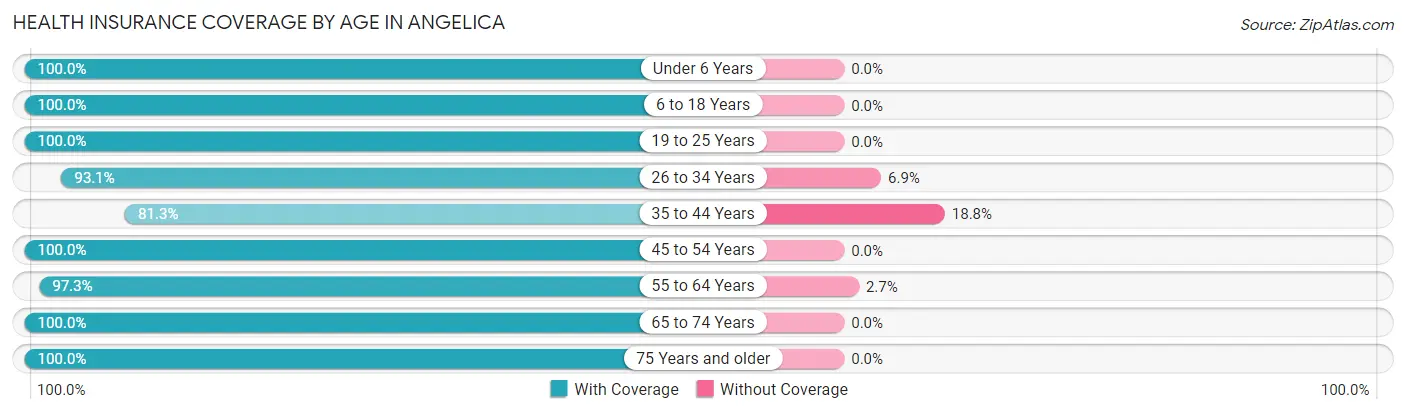
| Age Bracket | With Coverage | Without Coverage |
| Under 6 Years | 32 (100.0%) | 0 (0.0%) |
| 6 to 18 Years | 91 (100.0%) | 0 (0.0%) |
| 19 to 25 Years | 46 (100.0%) | 0 (0.0%) |
| 26 to 34 Years | 95 (93.1%) | 7 (6.9%) |
| 35 to 44 Years | 39 (81.2%) | 9 (18.8%) |
| 45 to 54 Years | 73 (100.0%) | 0 (0.0%) |
| 55 to 64 Years | 71 (97.3%) | 2 (2.7%) |
| 65 to 74 Years | 98 (100.0%) | 0 (0.0%) |
| 75 Years and older | 62 (100.0%) | 0 (0.0%) |
| Total | 607 (97.1%) | 18 (2.9%) |
Health Insurance Coverage by Citizenship Status in Angelica
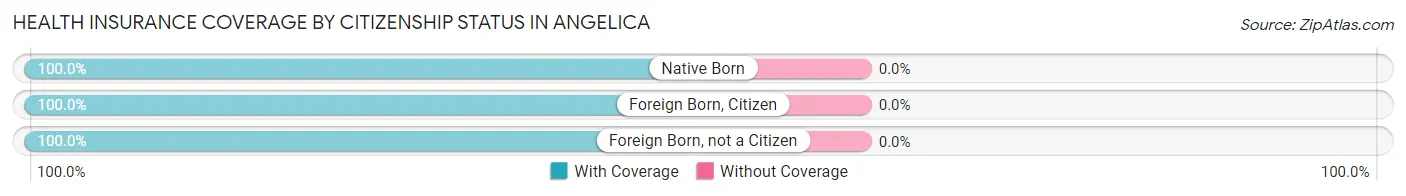
| Citizenship Status | With Coverage | Without Coverage |
| Native Born | 32 (100.0%) | 0 (0.0%) |
| Foreign Born, Citizen | 91 (100.0%) | 0 (0.0%) |
| Foreign Born, not a Citizen | 46 (100.0%) | 0 (0.0%) |
Health Insurance Coverage by Household Income in Angelica
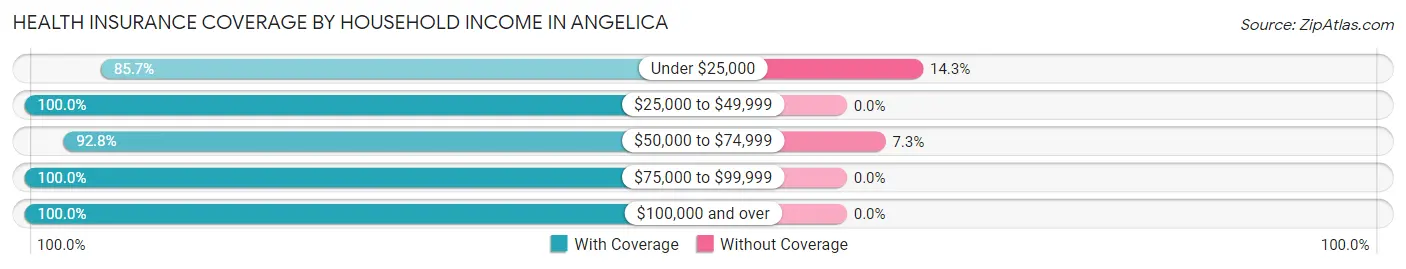
| Household Income | With Coverage | Without Coverage |
| Under $25,000 | 78 (85.7%) | 13 (14.3%) |
| $25,000 to $49,999 | 153 (100.0%) | 0 (0.0%) |
| $50,000 to $74,999 | 64 (92.7%) | 5 (7.2%) |
| $75,000 to $99,999 | 154 (100.0%) | 0 (0.0%) |
| $100,000 and over | 158 (100.0%) | 0 (0.0%) |
Public vs Private Health Insurance Coverage by Age in Angelica
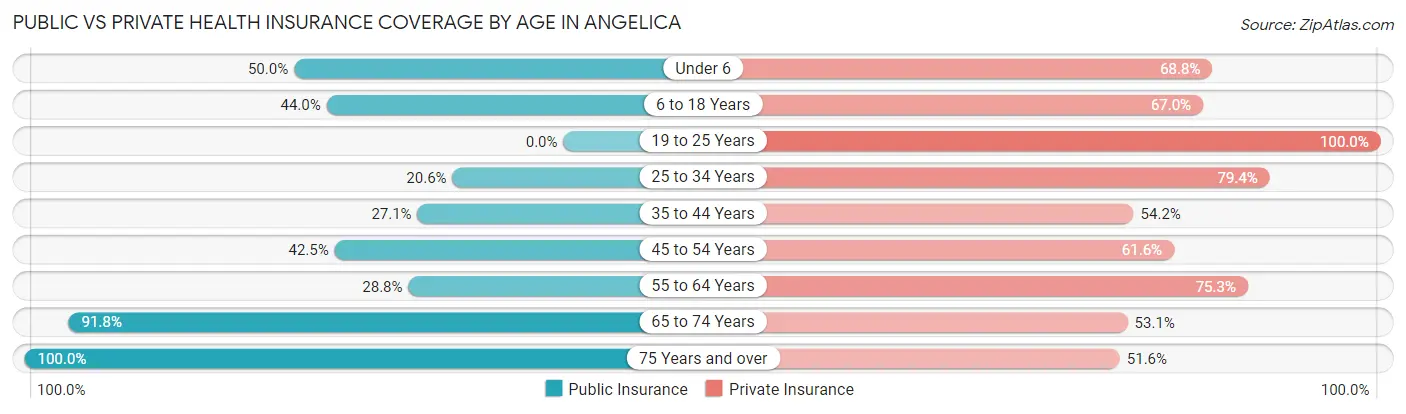
| Age Bracket | Public Insurance | Private Insurance |
| Under 6 | 16 (50.0%) | 22 (68.8%) |
| 6 to 18 Years | 40 (44.0%) | 61 (67.0%) |
| 19 to 25 Years | 0 (0.0%) | 46 (100.0%) |
| 25 to 34 Years | 21 (20.6%) | 81 (79.4%) |
| 35 to 44 Years | 13 (27.1%) | 26 (54.2%) |
| 45 to 54 Years | 31 (42.5%) | 45 (61.6%) |
| 55 to 64 Years | 21 (28.8%) | 55 (75.3%) |
| 65 to 74 Years | 90 (91.8%) | 52 (53.1%) |
| 75 Years and over | 62 (100.0%) | 32 (51.6%) |
| Total | 294 (47.0%) | 420 (67.2%) |
Disability Status by Sex by Age in Angelica
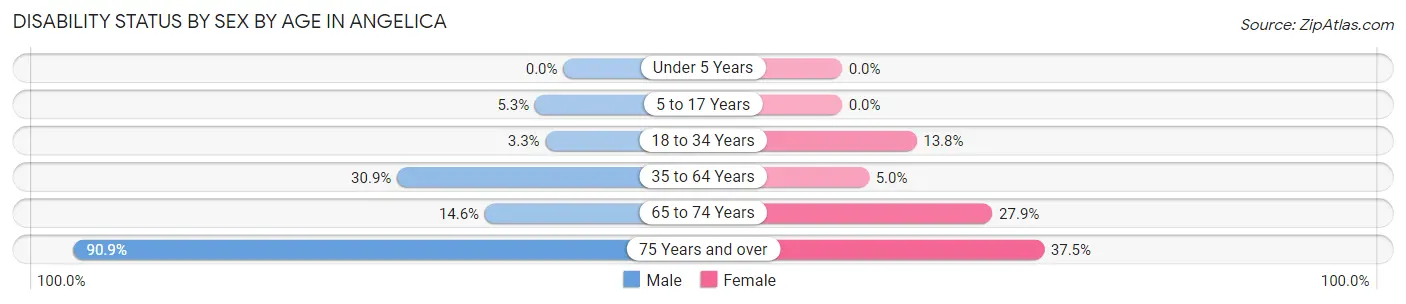
| Age Bracket | Male | Female |
| Under 5 Years | 0 (0.0%) | 0 (0.0%) |
| 5 to 17 Years | 2 (5.3%) | 0 (0.0%) |
| 18 to 34 Years | 2 (3.3%) | 13 (13.8%) |
| 35 to 64 Years | 29 (30.8%) | 5 (5.0%) |
| 65 to 74 Years | 8 (14.5%) | 12 (27.9%) |
| 75 Years and over | 20 (90.9%) | 15 (37.5%) |
Disability Class by Sex by Age in Angelica
Disability Class: Hearing Difficulty
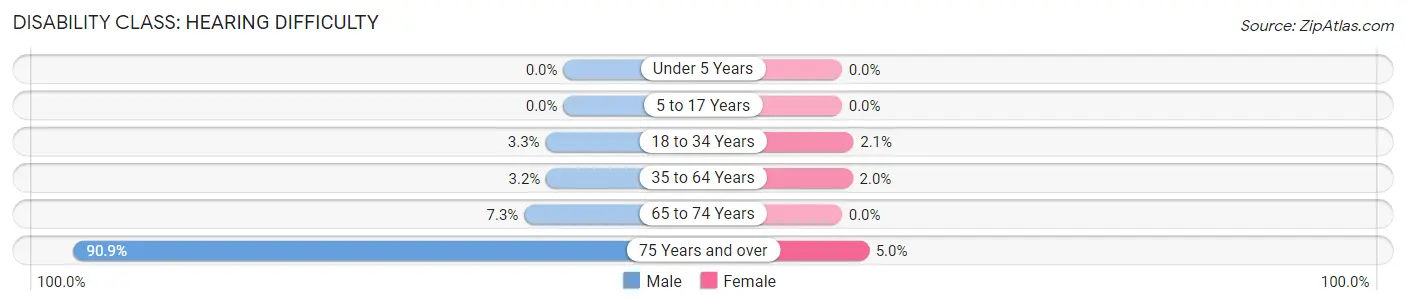
| Age Bracket | Male | Female |
| Under 5 Years | 0 (0.0%) | 0 (0.0%) |
| 5 to 17 Years | 0 (0.0%) | 0 (0.0%) |
| 18 to 34 Years | 2 (3.3%) | 2 (2.1%) |
| 35 to 64 Years | 3 (3.2%) | 2 (2.0%) |
| 65 to 74 Years | 4 (7.3%) | 0 (0.0%) |
| 75 Years and over | 20 (90.9%) | 2 (5.0%) |
Disability Class: Vision Difficulty
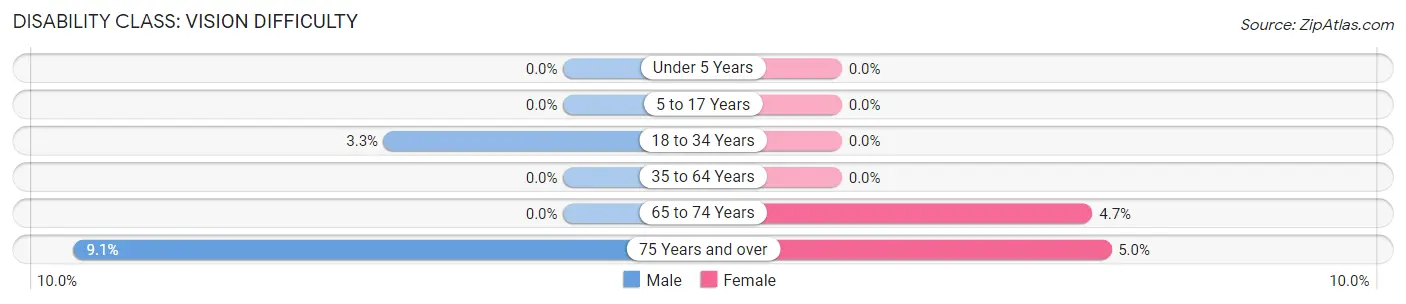
| Age Bracket | Male | Female |
| Under 5 Years | 0 (0.0%) | 0 (0.0%) |
| 5 to 17 Years | 0 (0.0%) | 0 (0.0%) |
| 18 to 34 Years | 2 (3.3%) | 0 (0.0%) |
| 35 to 64 Years | 0 (0.0%) | 0 (0.0%) |
| 65 to 74 Years | 0 (0.0%) | 2 (4.6%) |
| 75 Years and over | 2 (9.1%) | 2 (5.0%) |
Disability Class: Cognitive Difficulty
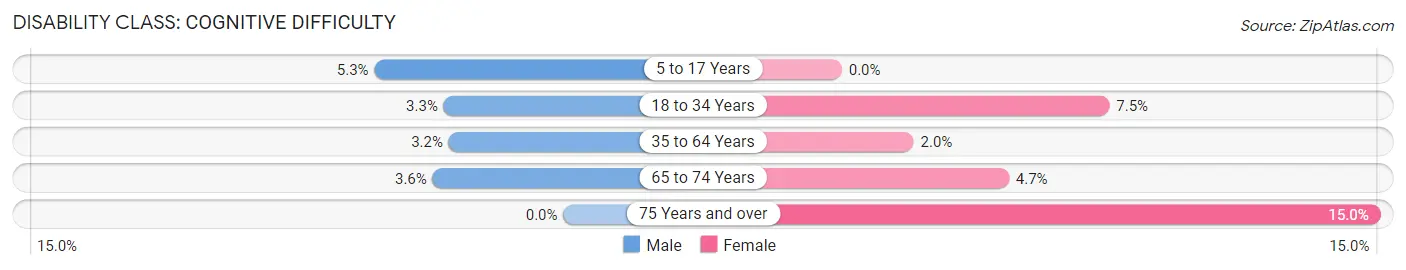
| Age Bracket | Male | Female |
| 5 to 17 Years | 2 (5.3%) | 0 (0.0%) |
| 18 to 34 Years | 2 (3.3%) | 7 (7.4%) |
| 35 to 64 Years | 3 (3.2%) | 2 (2.0%) |
| 65 to 74 Years | 2 (3.6%) | 2 (4.6%) |
| 75 Years and over | 0 (0.0%) | 6 (15.0%) |
Disability Class: Ambulatory Difficulty
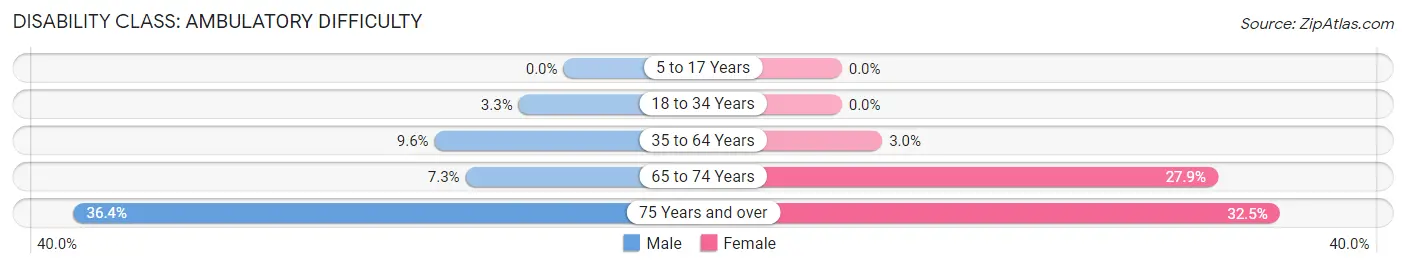
| Age Bracket | Male | Female |
| 5 to 17 Years | 0 (0.0%) | 0 (0.0%) |
| 18 to 34 Years | 2 (3.3%) | 0 (0.0%) |
| 35 to 64 Years | 9 (9.6%) | 3 (3.0%) |
| 65 to 74 Years | 4 (7.3%) | 12 (27.9%) |
| 75 Years and over | 8 (36.4%) | 13 (32.5%) |
Disability Class: Self-Care Difficulty
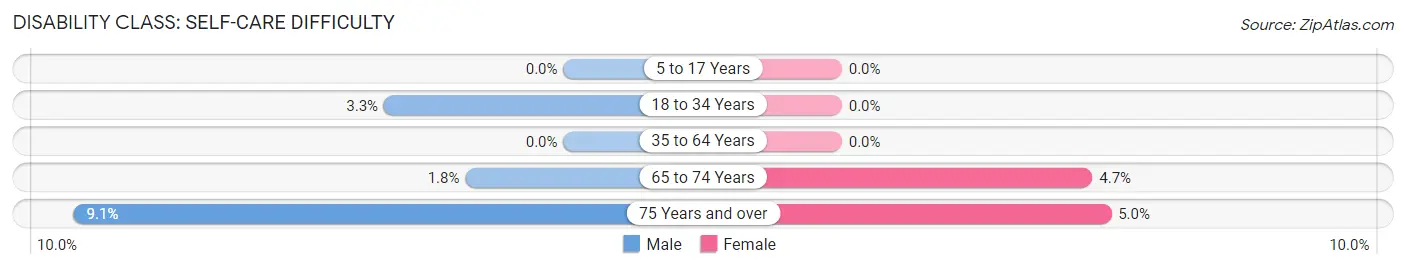
| Age Bracket | Male | Female |
| 5 to 17 Years | 0 (0.0%) | 0 (0.0%) |
| 18 to 34 Years | 2 (3.3%) | 0 (0.0%) |
| 35 to 64 Years | 0 (0.0%) | 0 (0.0%) |
| 65 to 74 Years | 1 (1.8%) | 2 (4.6%) |
| 75 Years and over | 2 (9.1%) | 2 (5.0%) |
Technology Access in Angelica
Computing Device Access in Angelica
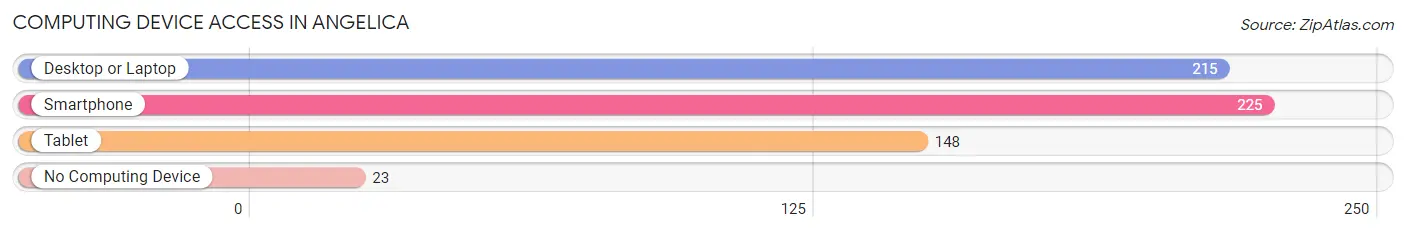
| Device Type | # Households | % Households |
| Desktop or Laptop | 215 | 74.9% |
| Smartphone | 225 | 78.4% |
| Tablet | 148 | 51.6% |
| No Computing Device | 23 | 8.0% |
| Total | 287 | 100.0% |
Internet Access in Angelica
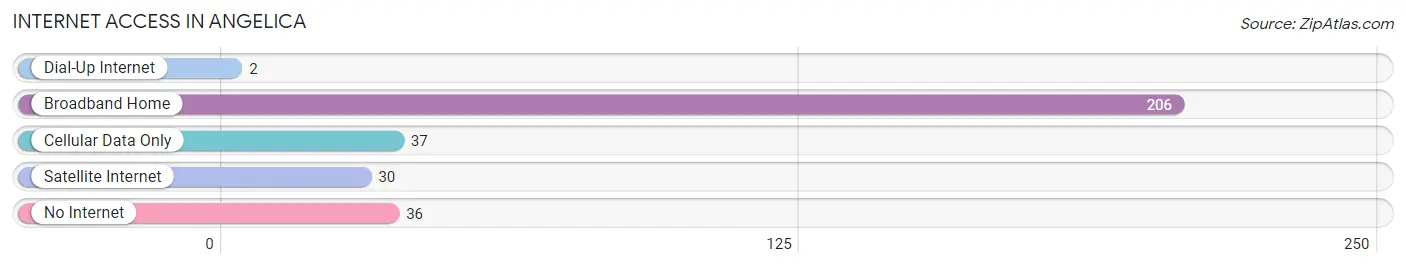
| Internet Type | # Households | % Households |
| Dial-Up Internet | 2 | 0.7% |
| Broadband Home | 206 | 71.8% |
| Cellular Data Only | 37 | 12.9% |
| Satellite Internet | 30 | 10.4% |
| No Internet | 36 | 12.5% |
| Total | 287 | 100.0% |
Angelica Summary
Angelica is a small town located in the western part of New York State, in Allegany County. It is situated on the banks of the Genesee River, and is surrounded by rolling hills and farmland. The town has a population of 1,845 people, according to the 2010 census.
History
Angelica was founded in 1789 by a group of settlers from Connecticut. The town was named after Angelica Schuyler Church, the daughter of General Philip Schuyler, a Revolutionary War hero. The town was originally part of the Town of Angelica, which was created in 1808. In 1817, the Town of Angelica was divided into two towns, Angelica and Willing.
The town of Angelica was an important stop on the Underground Railroad, and was home to several prominent abolitionists. In 1851, the first African-American church in the area was founded in Angelica.
Geography
Angelica is located in the western part of New York State, in Allegany County. It is situated on the banks of the Genesee River, and is surrounded by rolling hills and farmland. The town has a total area of 2.2 square miles, all of which is land.
The town is located near several state parks, including Letchworth State Park, Allegany State Park, and Stony Brook State Park. The town is also close to the Finger Lakes region, which is known for its wineries and outdoor recreation.
Economy
The economy of Angelica is largely based on agriculture and tourism. The town is home to several farms, which produce a variety of crops, including corn, soybeans, and hay. The town is also home to several wineries, which attract tourists from all over the region.
The town is also home to several small businesses, including restaurants, shops, and a local newspaper. The town is also home to a small manufacturing plant, which produces plastic products.
Demographics
According to the 2010 census, the population of Angelica was 1,845 people. The racial makeup of the town was 97.2% White, 0.7% African American, 0.3% Native American, 0.2% Asian, 0.1% Pacific Islander, 0.2% from other races, and 1.3% from two or more races. Hispanic or Latino of any race were 1.3% of the population.
The median household income in Angelica was $37,917, and the median family income was $45,000. The per capita income for the town was $18,945. About 11.2% of families and 14.2% of the population were below the poverty line, including 18.2% of those under age 18 and 8.3% of those age 65 or over.
Common Questions
What is Per Capita Income in Angelica?
Per Capita income in Angelica is $31,271.
What is the Median Family Income in Angelica?
Median Family Income in Angelica is $73,750.
What is the Median Household income in Angelica?
Median Household Income in Angelica is $51,250.
What is Income or Wage Gap in Angelica?
Income or Wage Gap in Angelica is 12.4%.
Women in Angelica earn 87.6 cents for every dollar earned by a man.
What is Inequality or Gini Index in Angelica?
Inequality or Gini Index in Angelica is 0.38.
What is the Total Population of Angelica?
Total Population of Angelica is 625.
What is the Total Male Population of Angelica?
Total Male Population of Angelica is 276.
What is the Total Female Population of Angelica?
Total Female Population of Angelica is 349.
What is the Ratio of Males per 100 Females in Angelica?
There are 79.08 Males per 100 Females in Angelica.
What is the Ratio of Females per 100 Males in Angelica?
There are 126.45 Females per 100 Males in Angelica.
What is the Median Population Age in Angelica?
Median Population Age in Angelica is 44.2 Years.
What is the Average Family Size in Angelica
Average Family Size in Angelica is 2.7 People.
What is the Average Household Size in Angelica
Average Household Size in Angelica is 2.2 People.
How Large is the Labor Force in Angelica?
There are 292 People in the Labor Forcein in Angelica.
What is the Percentage of People in the Labor Force in Angelica?
56.7% of People are in the Labor Force in Angelica.
What is the Unemployment Rate in Angelica?
Unemployment Rate in Angelica is 6.5%.