Pottawattamie Park, IN Map & Demographics
Pottawattamie Park Map
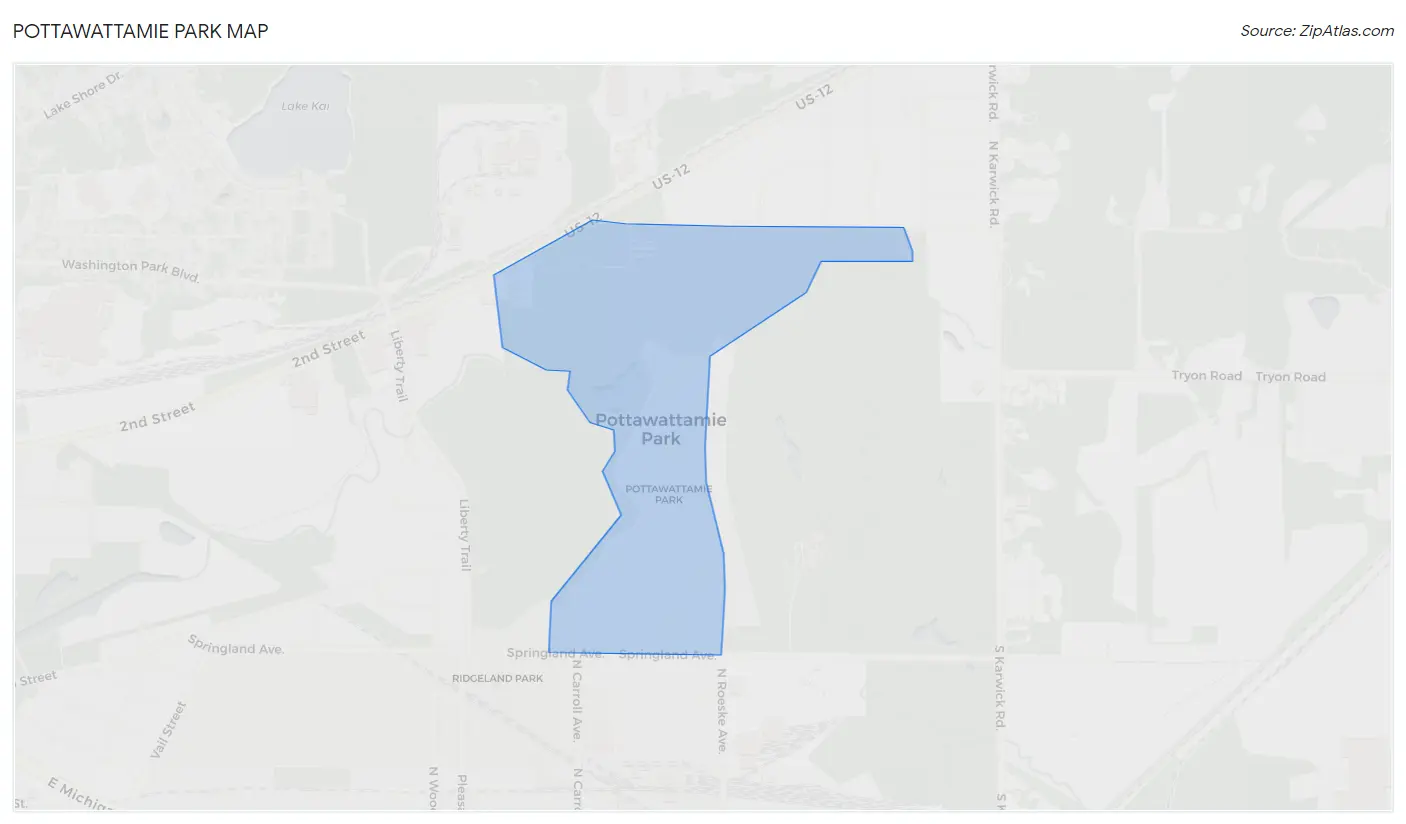
Pottawattamie Park Overview
$50,887
PER CAPITA INCOME
$120,938
AVG FAMILY INCOME
$96,719
AVG HOUSEHOLD INCOME
54.3%
WAGE / INCOME GAP [ % ]
45.7¢/ $1
WAGE / INCOME GAP [ $ ]
0.41
INEQUALITY / GINI INDEX
317
TOTAL POPULATION
175
MALE POPULATION
142
FEMALE POPULATION
123.24
MALES / 100 FEMALES
81.14
FEMALES / 100 MALES
45.3
MEDIAN AGE
3.1
AVG FAMILY SIZE
2.5
AVG HOUSEHOLD SIZE
191
LABOR FORCE [ PEOPLE ]
68.7%
PERCENT IN LABOR FORCE
2.1%
UNEMPLOYMENT RATE
Pottawattamie Park Area Codes
Income in Pottawattamie Park
Income Overview in Pottawattamie Park
Per Capita Income in Pottawattamie Park is $50,887, while median incomes of families and households are $120,938 and $96,719 respectively.
| Characteristic | Number | Measure |
| Per Capita Income | 317 | $50,887 |
| Median Family Income | 84 | $120,938 |
| Mean Family Income | 84 | $122,490 |
| Median Household Income | 125 | $96,719 |
| Mean Household Income | 125 | $123,050 |
| Income Deficit | 84 | $0 |
| Wage / Income Gap (%) | 317 | 54.28% |
| Wage / Income Gap ($) | 317 | 45.72¢ per $1 |
| Gini / Inequality Index | 317 | 0.41 |
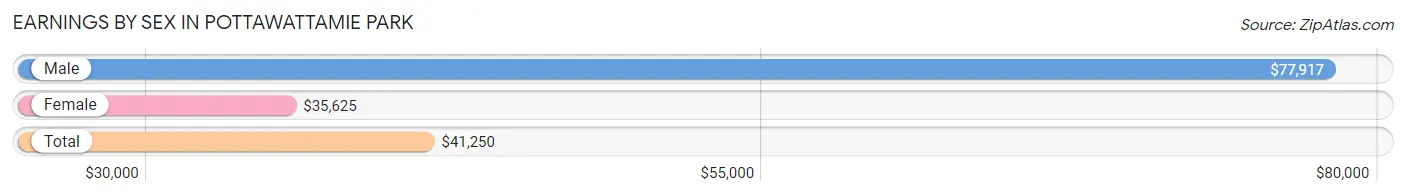
Earnings by Sex in Pottawattamie Park
Average Earnings in Pottawattamie Park are $41,250, $77,917 for men and $35,625 for women, a difference of 54.3%.
| Sex | Number | Average Earnings |
| Male | 108 (55.7%) | $77,917 |
| Female | 86 (44.3%) | $35,625 |
| Total | 194 (100.0%) | $41,250 |
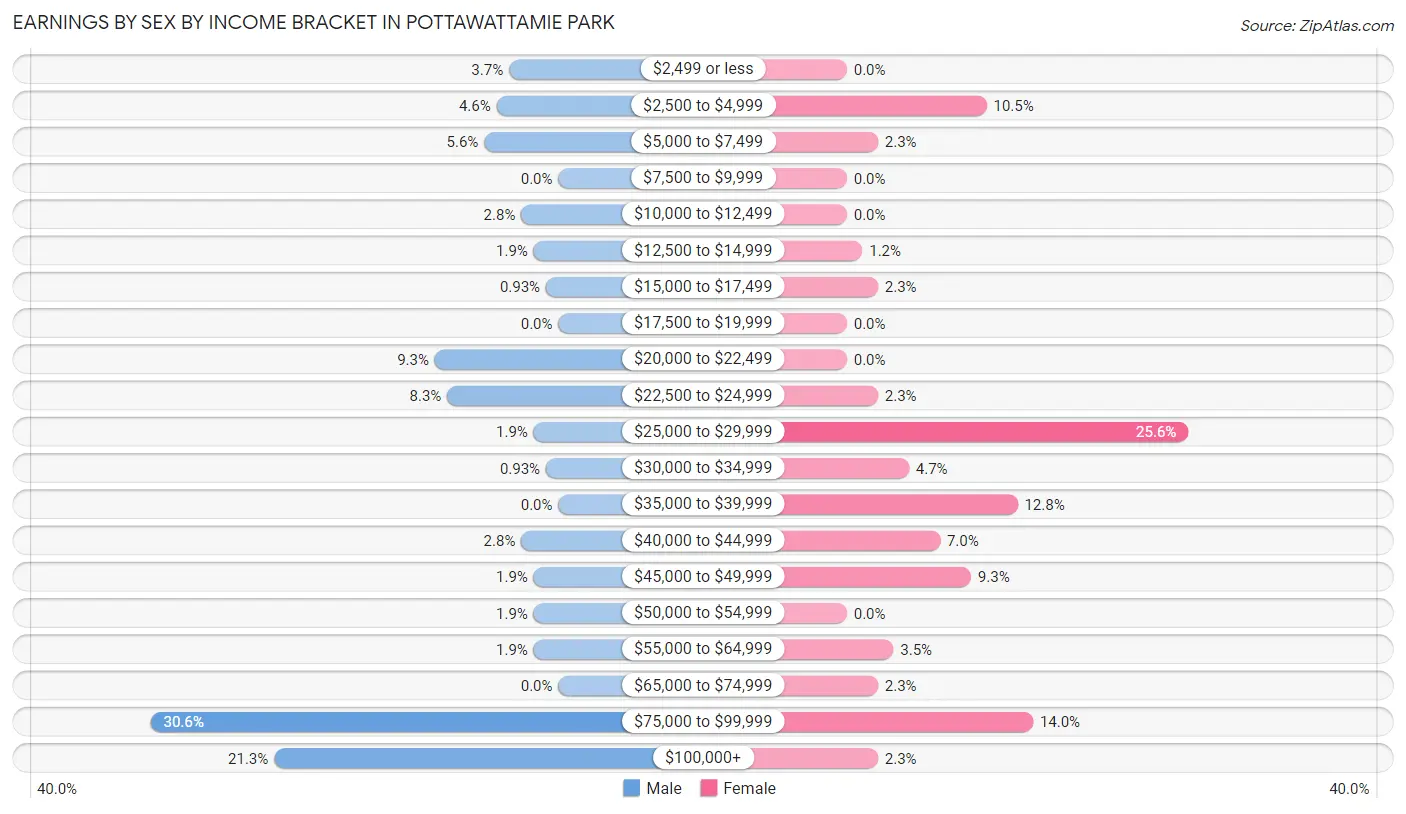
Earnings by Sex by Income Bracket in Pottawattamie Park
The most common earnings brackets in Pottawattamie Park are $75,000 to $99,999 for men (33 | 30.6%) and $25,000 to $29,999 for women (22 | 25.6%).
| Income | Male | Female |
| $2,499 or less | 4 (3.7%) | 0 (0.0%) |
| $2,500 to $4,999 | 5 (4.6%) | 9 (10.5%) |
| $5,000 to $7,499 | 6 (5.6%) | 2 (2.3%) |
| $7,500 to $9,999 | 0 (0.0%) | 0 (0.0%) |
| $10,000 to $12,499 | 3 (2.8%) | 0 (0.0%) |
| $12,500 to $14,999 | 2 (1.8%) | 1 (1.2%) |
| $15,000 to $17,499 | 1 (0.9%) | 2 (2.3%) |
| $17,500 to $19,999 | 0 (0.0%) | 0 (0.0%) |
| $20,000 to $22,499 | 10 (9.3%) | 0 (0.0%) |
| $22,500 to $24,999 | 9 (8.3%) | 2 (2.3%) |
| $25,000 to $29,999 | 2 (1.8%) | 22 (25.6%) |
| $30,000 to $34,999 | 1 (0.9%) | 4 (4.6%) |
| $35,000 to $39,999 | 0 (0.0%) | 11 (12.8%) |
| $40,000 to $44,999 | 3 (2.8%) | 6 (7.0%) |
| $45,000 to $49,999 | 2 (1.8%) | 8 (9.3%) |
| $50,000 to $54,999 | 2 (1.8%) | 0 (0.0%) |
| $55,000 to $64,999 | 2 (1.8%) | 3 (3.5%) |
| $65,000 to $74,999 | 0 (0.0%) | 2 (2.3%) |
| $75,000 to $99,999 | 33 (30.6%) | 12 (14.0%) |
| $100,000+ | 23 (21.3%) | 2 (2.3%) |
| Total | 108 (100.0%) | 86 (100.0%) |
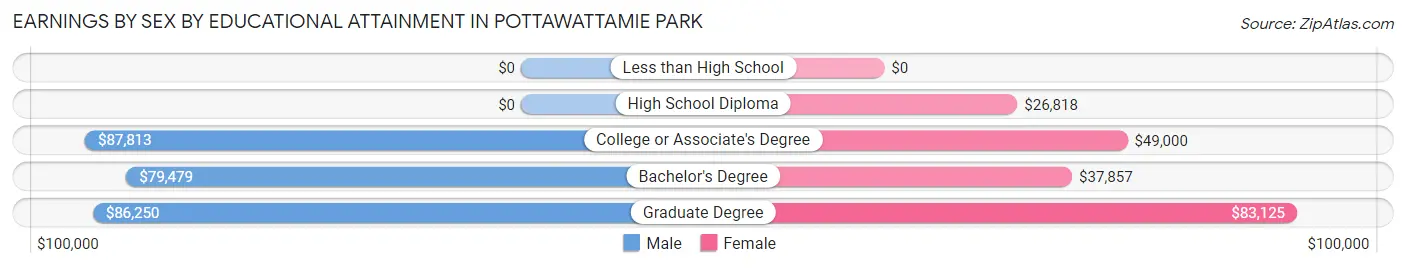
Earnings by Sex by Educational Attainment in Pottawattamie Park
Average earnings in Pottawattamie Park are $79,896 for men and $38,393 for women, a difference of 51.9%. Men with an educational attainment of college or associate's degree enjoy the highest average annual earnings of $87,813, while those with bachelor's degree education earn the least with $79,479. Women with an educational attainment of graduate degree earn the most with the average annual earnings of $83,125, while those with high school diploma education have the smallest earnings of $26,818.
| Educational Attainment | Male Income | Female Income |
| Less than High School | - | - |
| High School Diploma | - | - |
| College or Associate's Degree | $87,813 | $49,000 |
| Bachelor's Degree | $79,479 | $37,857 |
| Graduate Degree | $86,250 | $83,125 |
| Total | $79,896 | $38,393 |
Family Income in Pottawattamie Park
Family Income Brackets in Pottawattamie Park
According to the Pottawattamie Park family income data, there are 23 families falling into the $100,000 to $149,999 income range, which is the most common income bracket and makes up 27.4% of all families.
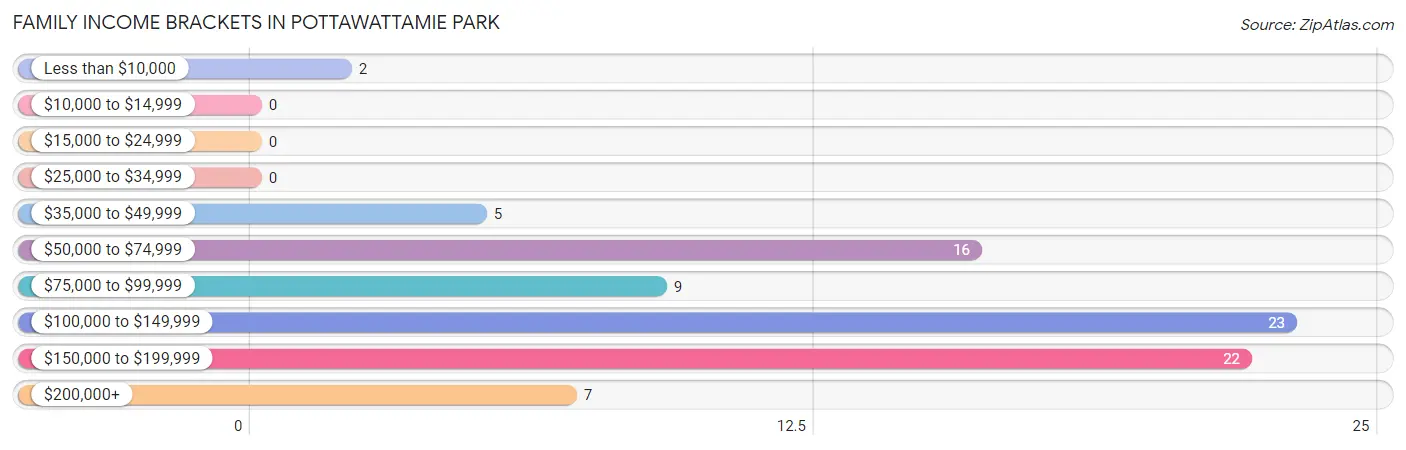
| Income Bracket | # Families | % Families |
| Less than $10,000 | 2 | 2.4% |
| $10,000 to $14,999 | 0 | 0.0% |
| $15,000 to $24,999 | 0 | 0.0% |
| $25,000 to $34,999 | 0 | 0.0% |
| $35,000 to $49,999 | 5 | 6.0% |
| $50,000 to $74,999 | 16 | 19.0% |
| $75,000 to $99,999 | 9 | 10.7% |
| $100,000 to $149,999 | 23 | 27.4% |
| $150,000 to $199,999 | 22 | 26.2% |
| $200,000+ | 7 | 8.3% |
Family Income by Famaliy Size in Pottawattamie Park
4-person families (17 | 20.2%) account for the highest median family income in Pottawattamie Park with $155,625 per family, while 2-person families (45 | 53.6%) have the highest median income of $54,062 per family member.
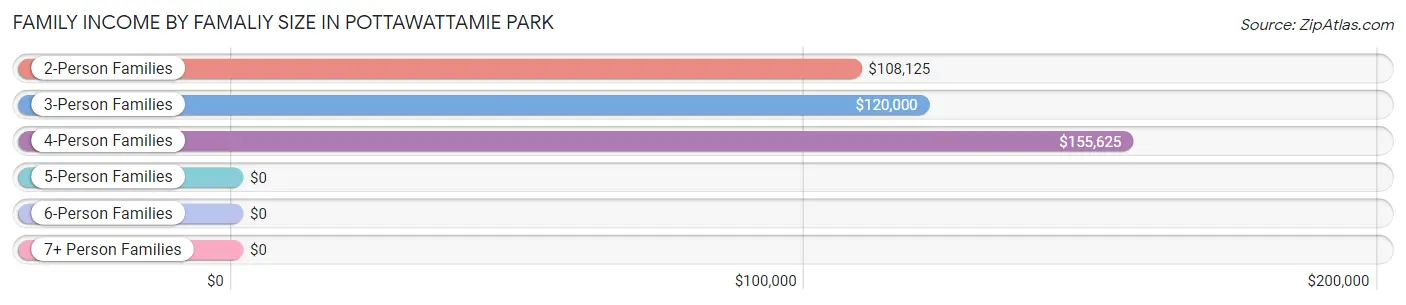
| Income Bracket | # Families | Median Income |
| 2-Person Families | 45 (53.6%) | $108,125 |
| 3-Person Families | 20 (23.8%) | $120,000 |
| 4-Person Families | 17 (20.2%) | $155,625 |
| 5-Person Families | 0 (0.0%) | $0 |
| 6-Person Families | 2 (2.4%) | $0 |
| 7+ Person Families | 0 (0.0%) | $0 |
| Total | 84 (100.0%) | $120,938 |
Family Income by Number of Earners in Pottawattamie Park
The median family income in Pottawattamie Park is $120,938, with families comprising 3+ earners (15) having the highest median family income of $172,679, while families with 1 earner (12) have the lowest median family income of $61,250, accounting for 17.9% and 14.3% of families, respectively.
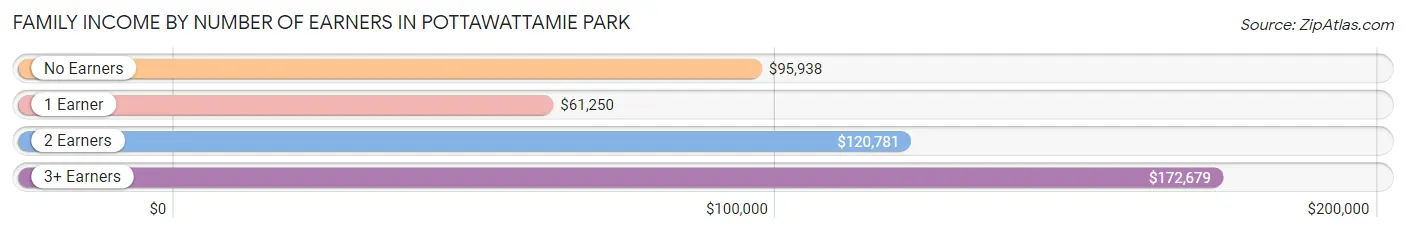
| Number of Earners | # Families | Median Income |
| No Earners | 14 (16.7%) | $95,938 |
| 1 Earner | 12 (14.3%) | $61,250 |
| 2 Earners | 43 (51.2%) | $120,781 |
| 3+ Earners | 15 (17.9%) | $172,679 |
| Total | 84 (100.0%) | $120,938 |
Household Income in Pottawattamie Park
Household Income Brackets in Pottawattamie Park
With 25 households falling in the category, the $100,000 to $149,999 income range is the most frequent in Pottawattamie Park, accounting for 20.0% of all households.
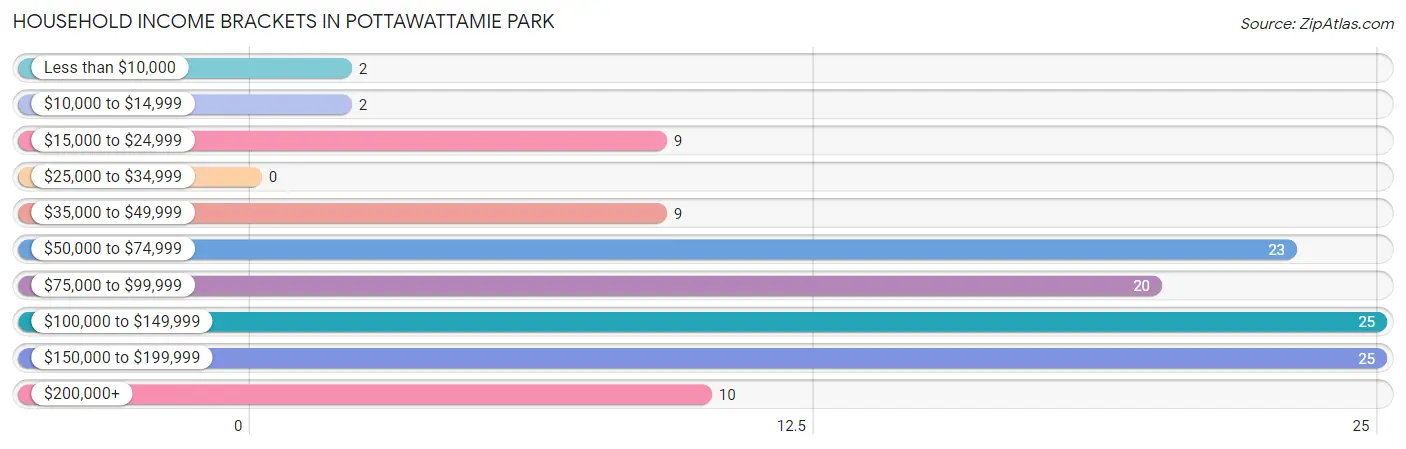
| Income Bracket | # Households | % Households |
| Less than $10,000 | 2 | 1.6% |
| $10,000 to $14,999 | 2 | 1.6% |
| $15,000 to $24,999 | 9 | 7.2% |
| $25,000 to $34,999 | 0 | 0.0% |
| $35,000 to $49,999 | 9 | 7.2% |
| $50,000 to $74,999 | 23 | 18.4% |
| $75,000 to $99,999 | 20 | 16.0% |
| $100,000 to $149,999 | 25 | 20.0% |
| $150,000 to $199,999 | 25 | 20.0% |
| $200,000+ | 10 | 8.0% |
Household Income by Householder Age in Pottawattamie Park
The median household income in Pottawattamie Park is $96,719, with the highest median household income of $120,250 found in the 45 to 64 years age bracket for the primary householder. A total of 49 households (39.2%) fall into this category.
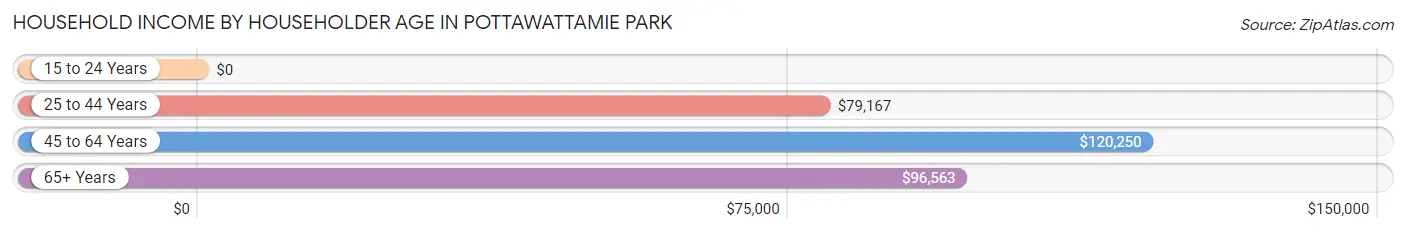
| Income Bracket | # Households | Median Income |
| 15 to 24 Years | 0 (0.0%) | $0 |
| 25 to 44 Years | 28 (22.4%) | $79,167 |
| 45 to 64 Years | 49 (39.2%) | $120,250 |
| 65+ Years | 48 (38.4%) | $96,563 |
| Total | 125 (100.0%) | $96,719 |
Poverty in Pottawattamie Park
Income Below Poverty by Sex and Age in Pottawattamie Park
With 5.1% poverty level for males and 3.5% for females among the residents of Pottawattamie Park, 25 to 34 year old males and 45 to 54 year old females are the most vulnerable to poverty, with 2 males (40.0%) and 2 females (11.8%) in their respective age groups living below the poverty level.
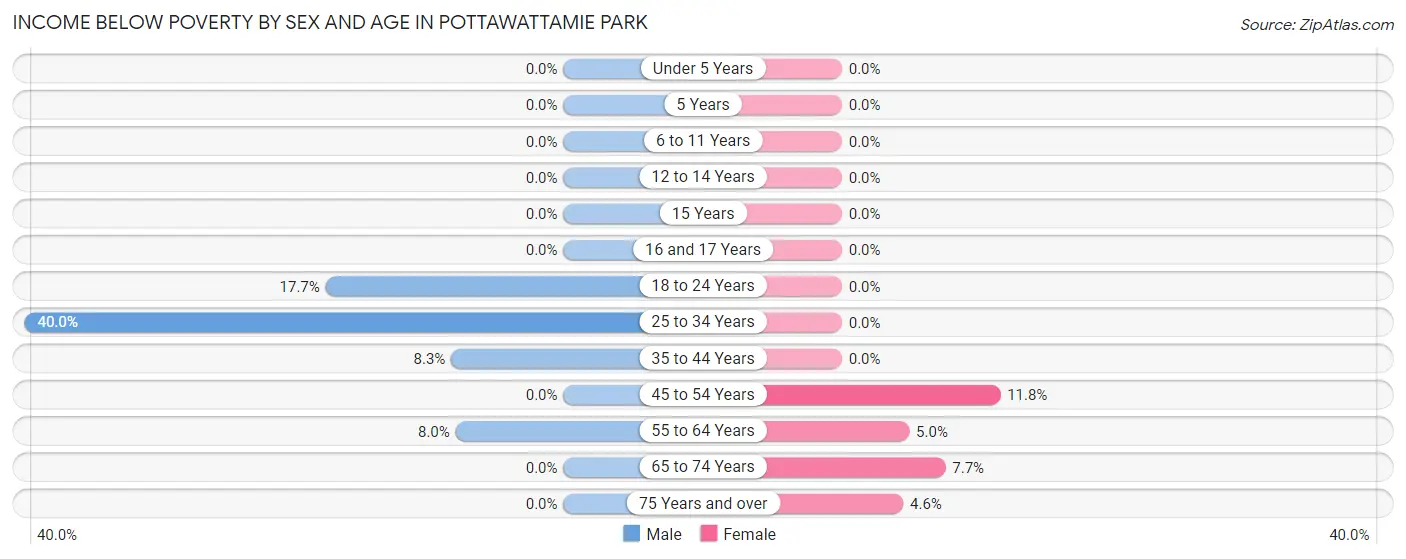
| Age Bracket | Male | Female |
| Under 5 Years | 0 (0.0%) | 0 (0.0%) |
| 5 Years | 0 (0.0%) | 0 (0.0%) |
| 6 to 11 Years | 0 (0.0%) | 0 (0.0%) |
| 12 to 14 Years | 0 (0.0%) | 0 (0.0%) |
| 15 Years | 0 (0.0%) | 0 (0.0%) |
| 16 and 17 Years | 0 (0.0%) | 0 (0.0%) |
| 18 to 24 Years | 3 (17.6%) | 0 (0.0%) |
| 25 to 34 Years | 2 (40.0%) | 0 (0.0%) |
| 35 to 44 Years | 2 (8.3%) | 0 (0.0%) |
| 45 to 54 Years | 0 (0.0%) | 2 (11.8%) |
| 55 to 64 Years | 2 (8.0%) | 1 (5.0%) |
| 65 to 74 Years | 0 (0.0%) | 1 (7.7%) |
| 75 Years and over | 0 (0.0%) | 1 (4.5%) |
| Total | 9 (5.1%) | 5 (3.5%) |
Income Above Poverty by Sex and Age in Pottawattamie Park
According to the poverty statistics in Pottawattamie Park, males aged under 5 years and females aged 6 to 11 years are the age groups that are most secure financially, with 100.0% of males and 100.0% of females in these age groups living above the poverty line.
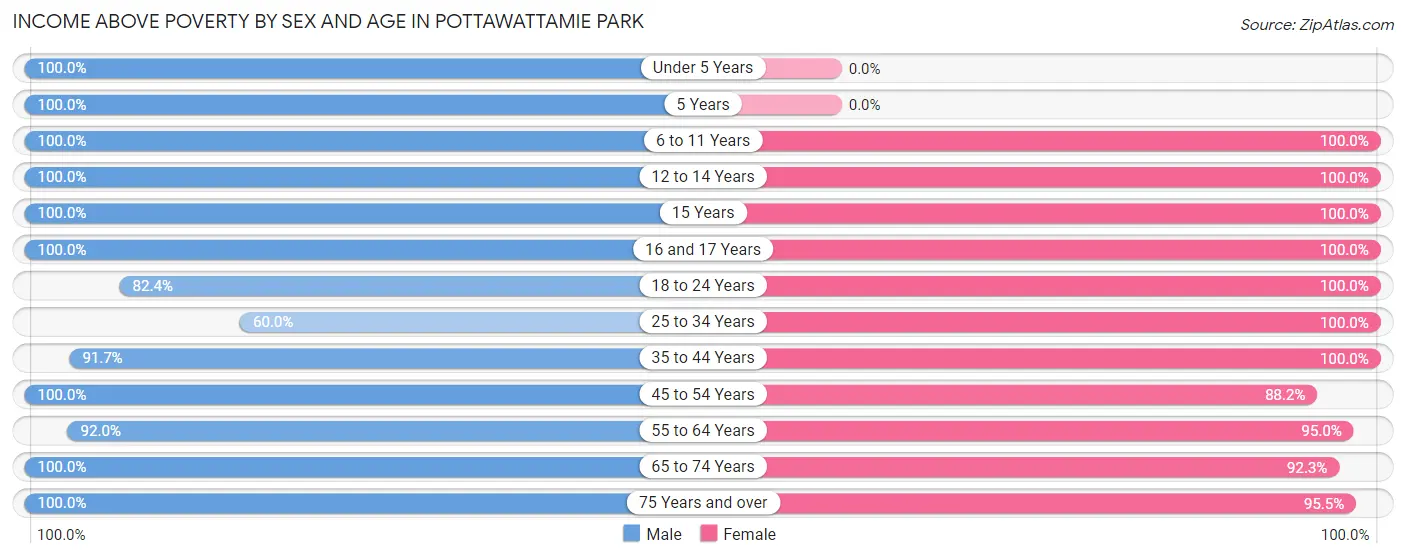
| Age Bracket | Male | Female |
| Under 5 Years | 17 (100.0%) | 0 (0.0%) |
| 5 Years | 2 (100.0%) | 0 (0.0%) |
| 6 to 11 Years | 4 (100.0%) | 7 (100.0%) |
| 12 to 14 Years | 2 (100.0%) | 3 (100.0%) |
| 15 Years | 2 (100.0%) | 2 (100.0%) |
| 16 and 17 Years | 14 (100.0%) | 8 (100.0%) |
| 18 to 24 Years | 14 (82.4%) | 8 (100.0%) |
| 25 to 34 Years | 3 (60.0%) | 21 (100.0%) |
| 35 to 44 Years | 22 (91.7%) | 21 (100.0%) |
| 45 to 54 Years | 33 (100.0%) | 15 (88.2%) |
| 55 to 64 Years | 23 (92.0%) | 19 (95.0%) |
| 65 to 74 Years | 13 (100.0%) | 12 (92.3%) |
| 75 Years and over | 17 (100.0%) | 21 (95.5%) |
| Total | 166 (94.9%) | 137 (96.5%) |
Income Below Poverty Among Married-Couple Families in Pottawattamie Park
The poverty statistics for married-couple families in Pottawattamie Park show that 2.6% or 2 of the total 76 families live below the poverty line. Families with no children have the highest poverty rate of 3.9%, comprising of 2 families. On the other hand, families with 1 or 2 children have the lowest poverty rate of 0.0%, which includes 0 families.
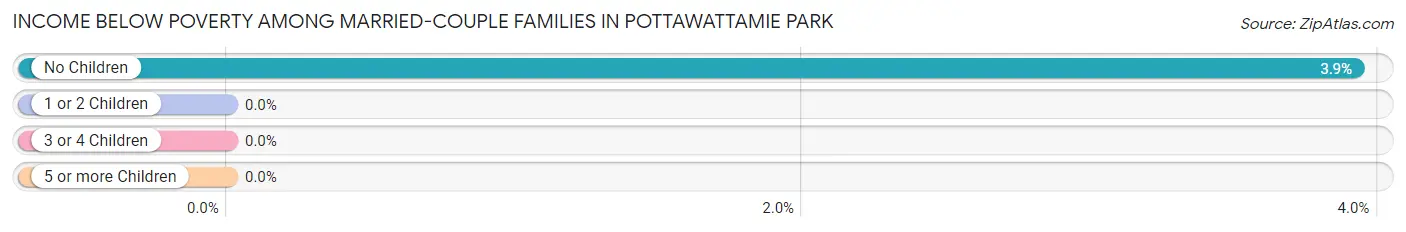
| Children | Above Poverty | Below Poverty |
| No Children | 49 (96.1%) | 2 (3.9%) |
| 1 or 2 Children | 25 (100.0%) | 0 (0.0%) |
| 3 or 4 Children | 0 (0.0%) | 0 (0.0%) |
| 5 or more Children | 0 (0.0%) | 0 (0.0%) |
| Total | 74 (97.4%) | 2 (2.6%) |
Income Below Poverty Among Single-Parent Households in Pottawattamie Park
| Children | Single Father | Single Mother |
| No Children | 0 (0.0%) | 0 (0.0%) |
| 1 or 2 Children | 0 (0.0%) | 0 (0.0%) |
| 3 or 4 Children | 0 (0.0%) | 0 (0.0%) |
| 5 or more Children | 0 (0.0%) | 0 (0.0%) |
| Total | 0 (0.0%) | 0 (0.0%) |
Income Below Poverty Among Married-Couple vs Single-Parent Households in Pottawattamie Park
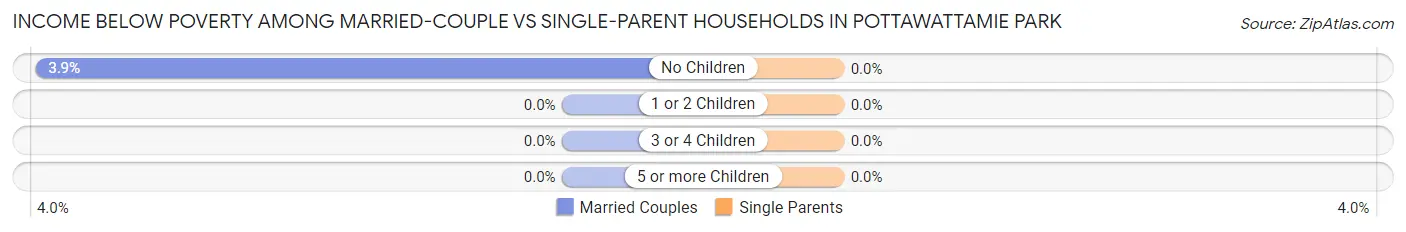
| Children | Married-Couple Families | Single-Parent Households |
| No Children | 2 (3.9%) | 0 (0.0%) |
| 1 or 2 Children | 0 (0.0%) | 0 (0.0%) |
| 3 or 4 Children | 0 (0.0%) | 0 (0.0%) |
| 5 or more Children | 0 (0.0%) | 0 (0.0%) |
| Total | 2 (2.6%) | 0 (0.0%) |
Race in Pottawattamie Park
The most populous races in Pottawattamie Park are White / Caucasian (255 | 80.4%), Black / African American (56 | 17.7%), and Hispanic or Latino (8 | 2.5%).
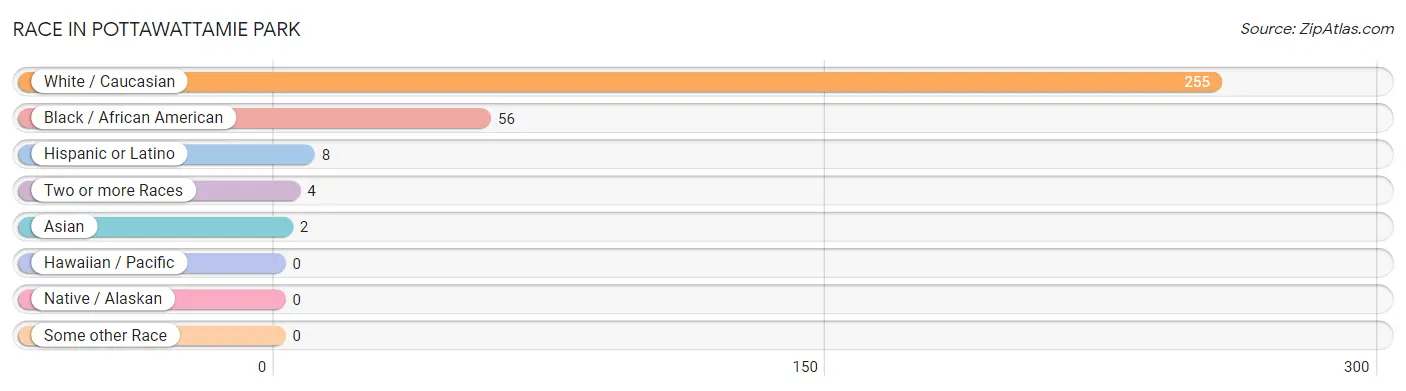
| Race | # Population | % Population |
| Asian | 2 | 0.6% |
| Black / African American | 56 | 17.7% |
| Hawaiian / Pacific | 0 | 0.0% |
| Hispanic or Latino | 8 | 2.5% |
| Native / Alaskan | 0 | 0.0% |
| White / Caucasian | 255 | 80.4% |
| Two or more Races | 4 | 1.3% |
| Some other Race | 0 | 0.0% |
| Total | 317 | 100.0% |
Ancestry in Pottawattamie Park
The most populous ancestries reported in Pottawattamie Park are German (97 | 30.6%), Irish (52 | 16.4%), English (50 | 15.8%), Polish (41 | 12.9%), and Greek (23 | 7.3%), together accounting for 83.0% of all Pottawattamie Park residents.
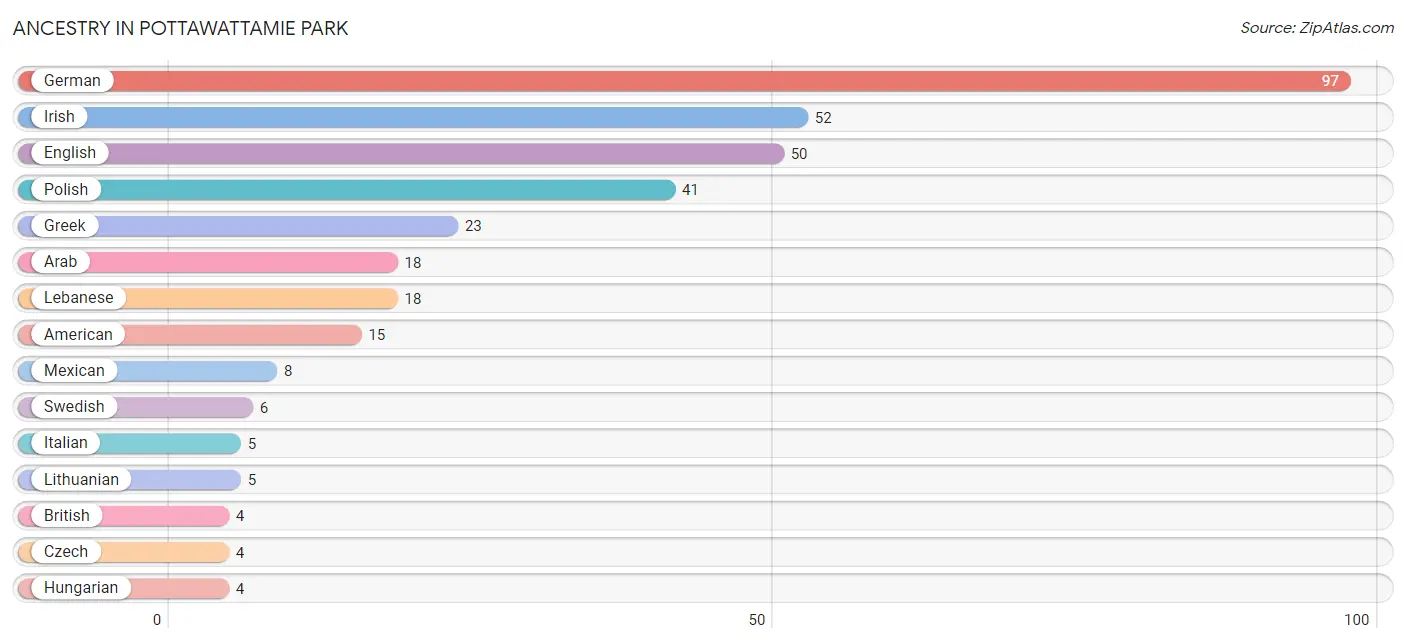
| Ancestry | # Population | % Population |
| American | 15 | 4.7% |
| Arab | 18 | 5.7% |
| Belgian | 2 | 0.6% |
| Bhutanese | 2 | 0.6% |
| British | 4 | 1.3% |
| Croatian | 1 | 0.3% |
| Czech | 4 | 1.3% |
| Dutch | 3 | 0.9% |
| English | 50 | 15.8% |
| French | 2 | 0.6% |
| German | 97 | 30.6% |
| Greek | 23 | 7.3% |
| Hungarian | 4 | 1.3% |
| Irish | 52 | 16.4% |
| Italian | 5 | 1.6% |
| Lebanese | 18 | 5.7% |
| Lithuanian | 5 | 1.6% |
| Mexican | 8 | 2.5% |
| Norwegian | 1 | 0.3% |
| Pennsylvania German | 1 | 0.3% |
| Polish | 41 | 12.9% |
| Scandinavian | 3 | 0.9% |
| Scottish | 2 | 0.6% |
| Swedish | 6 | 1.9% |
| Swiss | 4 | 1.3% |
| Ukrainian | 3 | 0.9% |
| Welsh | 1 | 0.3% | View All 27 Rows |
Immigrants in Pottawattamie Park
The most numerous immigrant groups reported in Pottawattamie Park came from Europe (6 | 1.9%), Greece (6 | 1.9%), Southern Europe (6 | 1.9%), Asia (1 | 0.3%), and Lebanon (1 | 0.3%), together accounting for 6.3% of all Pottawattamie Park residents.
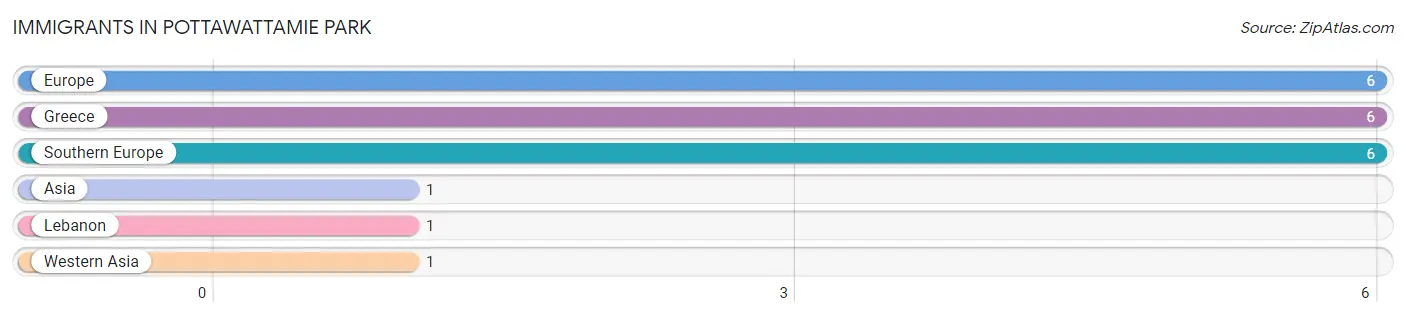
| Immigration Origin | # Population | % Population |
| Asia | 1 | 0.3% |
| Europe | 6 | 1.9% |
| Greece | 6 | 1.9% |
| Lebanon | 1 | 0.3% |
| Southern Europe | 6 | 1.9% |
| Western Asia | 1 | 0.3% | View All 6 Rows |
Sex and Age in Pottawattamie Park
Sex and Age in Pottawattamie Park
The most populous age groups in Pottawattamie Park are 15 to 19 Years (18 | 10.3%) for men and 30 to 34 Years (15 | 10.6%) for women.
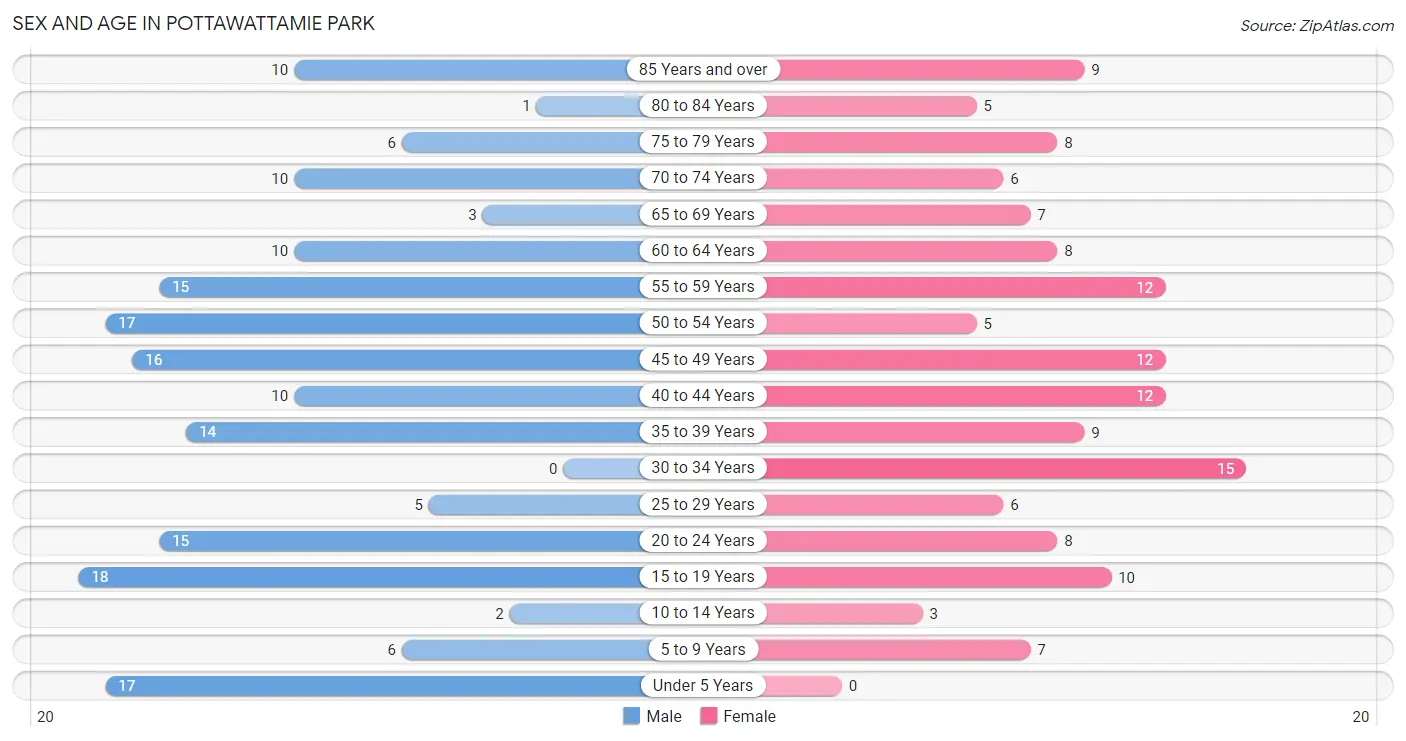
| Age Bracket | Male | Female |
| Under 5 Years | 17 (9.7%) | 0 (0.0%) |
| 5 to 9 Years | 6 (3.4%) | 7 (4.9%) |
| 10 to 14 Years | 2 (1.1%) | 3 (2.1%) |
| 15 to 19 Years | 18 (10.3%) | 10 (7.0%) |
| 20 to 24 Years | 15 (8.6%) | 8 (5.6%) |
| 25 to 29 Years | 5 (2.9%) | 6 (4.2%) |
| 30 to 34 Years | 0 (0.0%) | 15 (10.6%) |
| 35 to 39 Years | 14 (8.0%) | 9 (6.3%) |
| 40 to 44 Years | 10 (5.7%) | 12 (8.5%) |
| 45 to 49 Years | 16 (9.1%) | 12 (8.5%) |
| 50 to 54 Years | 17 (9.7%) | 5 (3.5%) |
| 55 to 59 Years | 15 (8.6%) | 12 (8.5%) |
| 60 to 64 Years | 10 (5.7%) | 8 (5.6%) |
| 65 to 69 Years | 3 (1.7%) | 7 (4.9%) |
| 70 to 74 Years | 10 (5.7%) | 6 (4.2%) |
| 75 to 79 Years | 6 (3.4%) | 8 (5.6%) |
| 80 to 84 Years | 1 (0.6%) | 5 (3.5%) |
| 85 Years and over | 10 (5.7%) | 9 (6.3%) |
| Total | 175 (100.0%) | 142 (100.0%) |
Families and Households in Pottawattamie Park
Median Family Size in Pottawattamie Park
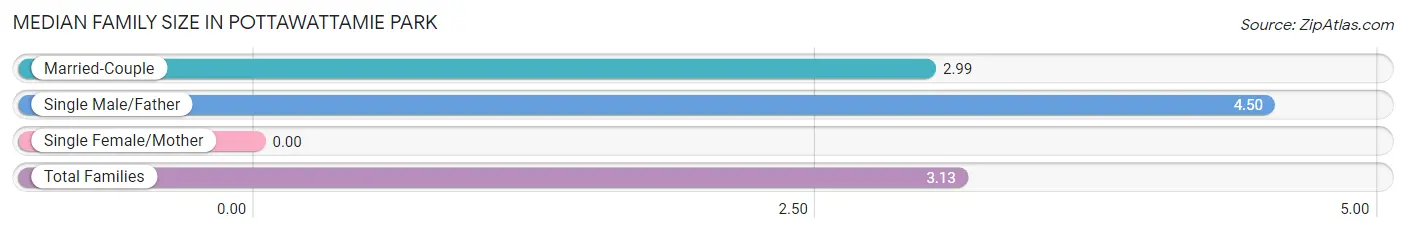
| Family Type | # Families | Family Size |
| Married-Couple | 76 (90.5%) | 2.99 |
| Single Male/Father | 8 (9.5%) | 4.50 |
| Single Female/Mother | 0 (0.0%) | - |
| Total Families | 84 (100.0%) | 3.13 |
Median Household Size in Pottawattamie Park
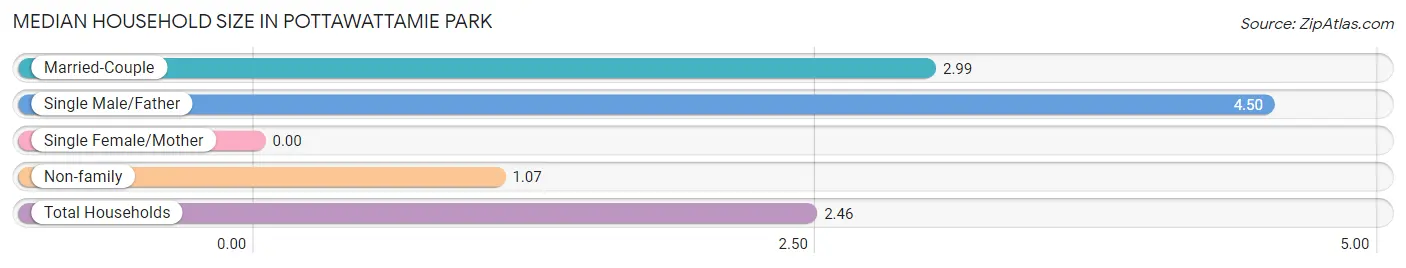
| Household Type | # Households | Household Size |
| Married-Couple | 76 (60.8%) | 2.99 |
| Single Male/Father | 8 (6.4%) | 4.50 |
| Single Female/Mother | 0 (0.0%) | - |
| Non-family | 41 (32.8%) | 1.07 |
| Total Households | 125 (100.0%) | 2.46 |
Household Size by Marriage Status in Pottawattamie Park
Out of a total of 125 households in Pottawattamie Park, 84 (67.2%) are family households, while 41 (32.8%) are nonfamily households. The most numerous type of family households are 2-person households, comprising 45, and the most common type of nonfamily households are 1-person households, comprising 38.
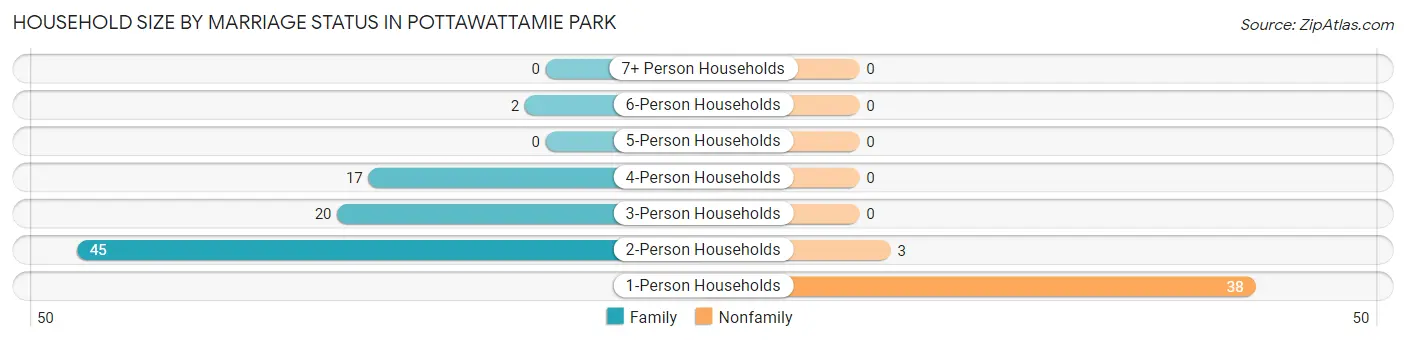
| Household Size | Family Households | Nonfamily Households |
| 1-Person Households | - | 38 (30.4%) |
| 2-Person Households | 45 (36.0%) | 3 (2.4%) |
| 3-Person Households | 20 (16.0%) | 0 (0.0%) |
| 4-Person Households | 17 (13.6%) | 0 (0.0%) |
| 5-Person Households | 0 (0.0%) | 0 (0.0%) |
| 6-Person Households | 2 (1.6%) | 0 (0.0%) |
| 7+ Person Households | 0 (0.0%) | 0 (0.0%) |
| Total | 84 (67.2%) | 41 (32.8%) |
Female Fertility in Pottawattamie Park
Fertility by Age in Pottawattamie Park
| Age Bracket | Women with Births | Births / 1,000 Women |
| 15 to 19 years | 0 (0.0%) | 0.0 |
| 20 to 34 years | 0 (0.0%) | 0.0 |
| 35 to 50 years | 0 (0.0%) | 0.0 |
| Total | 0 (0.0%) | 0.0 |
Fertility by Age by Marriage Status in Pottawattamie Park
| Age Bracket | Married | Unmarried |
| 15 to 19 years | 0 (0.0%) | 0 (0.0%) |
| 20 to 34 years | 0 (0.0%) | 0 (0.0%) |
| 35 to 50 years | 0 (0.0%) | 0 (0.0%) |
| Total | 0 (0.0%) | 0 (0.0%) |
Fertility by Education in Pottawattamie Park
| Educational Attainment | Women with Births | Births / 1,000 Women |
| Less than High School | 0 (0.0%) | 0.0 |
| High School Diploma | 0 (0.0%) | 0.0 |
| College or Associate's Degree | 0 (0.0%) | 0.0 |
| Bachelor's Degree | 0 (0.0%) | 0.0 |
| Graduate Degree | 0 (0.0%) | 0.0 |
| Total | 0 (0.0%) | 0.0 |
Fertility by Education by Marriage Status in Pottawattamie Park
| Educational Attainment | Married | Unmarried |
| Less than High School | 0 (0.0%) | 0 (0.0%) |
| High School Diploma | 0 (0.0%) | 0 (0.0%) |
| College or Associate's Degree | 0 (0.0%) | 0 (0.0%) |
| Bachelor's Degree | 0 (0.0%) | 0 (0.0%) |
| Graduate Degree | 0 (0.0%) | 0 (0.0%) |
| Total | 0 (0.0%) | 0 (0.0%) |
Employment Characteristics in Pottawattamie Park
Employment by Class of Employer in Pottawattamie Park
Among the 175 employed individuals in Pottawattamie Park, private company employees (131 | 74.9%), not-for-profit organizations (13 | 7.4%), and self-employed (not incorporated) (11 | 6.3%) make up the most common classes of employment.
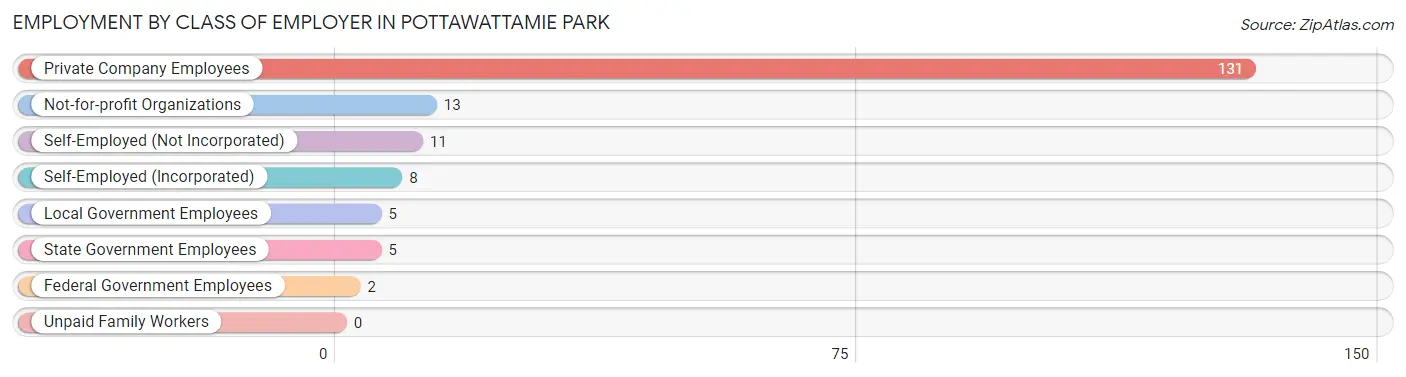
| Employer Class | # Employees | % Employees |
| Private Company Employees | 131 | 74.9% |
| Self-Employed (Incorporated) | 8 | 4.6% |
| Self-Employed (Not Incorporated) | 11 | 6.3% |
| Not-for-profit Organizations | 13 | 7.4% |
| Local Government Employees | 5 | 2.9% |
| State Government Employees | 5 | 2.9% |
| Federal Government Employees | 2 | 1.1% |
| Unpaid Family Workers | 0 | 0.0% |
| Total | 175 | 100.0% |
Employment Status by Age in Pottawattamie Park
According to the labor force statistics for Pottawattamie Park, out of the total population over 16 years of age (278), 68.7% or 191 individuals are in the labor force, with 2.1% or 4 of them unemployed. The age group with the highest labor force participation rate is 20 to 24 years, with 100.0% or 23 individuals in the labor force. Within the labor force, the 16 to 19 years age range has the highest percentage of unemployed individuals, with 33.3% or 3 of them being unemployed.
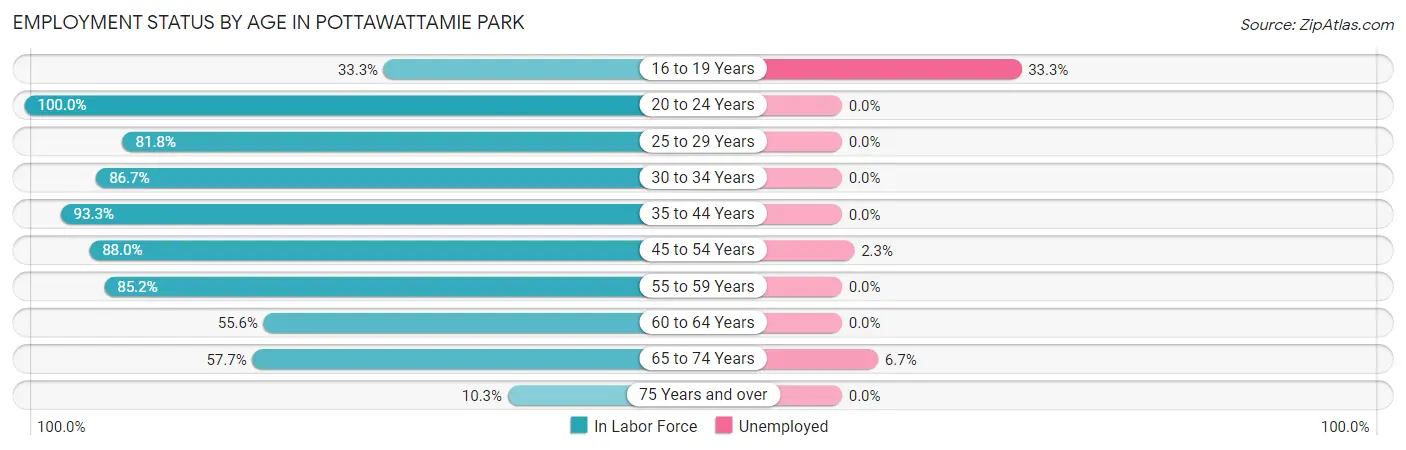
| Age Bracket | In Labor Force | Unemployed |
| 16 to 19 Years | 8 (33.3%) | 3 (33.3%) |
| 20 to 24 Years | 23 (100.0%) | 0 (0.0%) |
| 25 to 29 Years | 9 (81.8%) | 0 (0.0%) |
| 30 to 34 Years | 13 (86.7%) | 0 (0.0%) |
| 35 to 44 Years | 42 (93.3%) | 0 (0.0%) |
| 45 to 54 Years | 44 (88.0%) | 1 (2.3%) |
| 55 to 59 Years | 23 (85.2%) | 0 (0.0%) |
| 60 to 64 Years | 10 (55.6%) | 0 (0.0%) |
| 65 to 74 Years | 15 (57.7%) | 1 (6.7%) |
| 75 Years and over | 4 (10.3%) | 0 (0.0%) |
| Total | 191 (68.7%) | 4 (2.1%) |
Employment Status by Educational Attainment in Pottawattamie Park
According to labor force statistics for Pottawattamie Park, 84.9% of individuals (141) out of the total population between 25 and 64 years of age (166) are in the labor force, with 0.7% or 1 of them being unemployed. The group with the highest labor force participation rate are those with the educational attainment of bachelor's degree or higher, with 94.3% or 82 individuals in the labor force. Within the labor force, individuals with bachelor's degree or higher education have the highest percentage of unemployment, with 1.2% or 1 of them being unemployed.
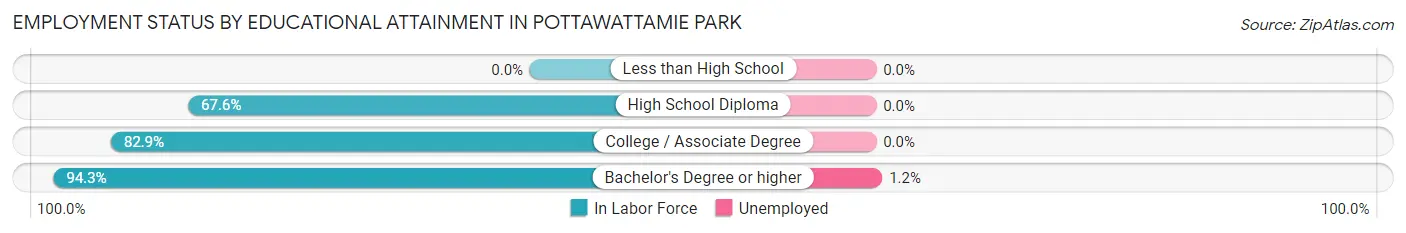
| Educational Attainment | In Labor Force | Unemployed |
| Less than High School | 0 (0.0%) | 0 (0.0%) |
| High School Diploma | 25 (67.6%) | 0 (0.0%) |
| College / Associate Degree | 34 (82.9%) | 0 (0.0%) |
| Bachelor's Degree or higher | 82 (94.3%) | 1 (1.2%) |
| Total | 141 (84.9%) | 1 (0.7%) |
Employment Occupations by Sex in Pottawattamie Park
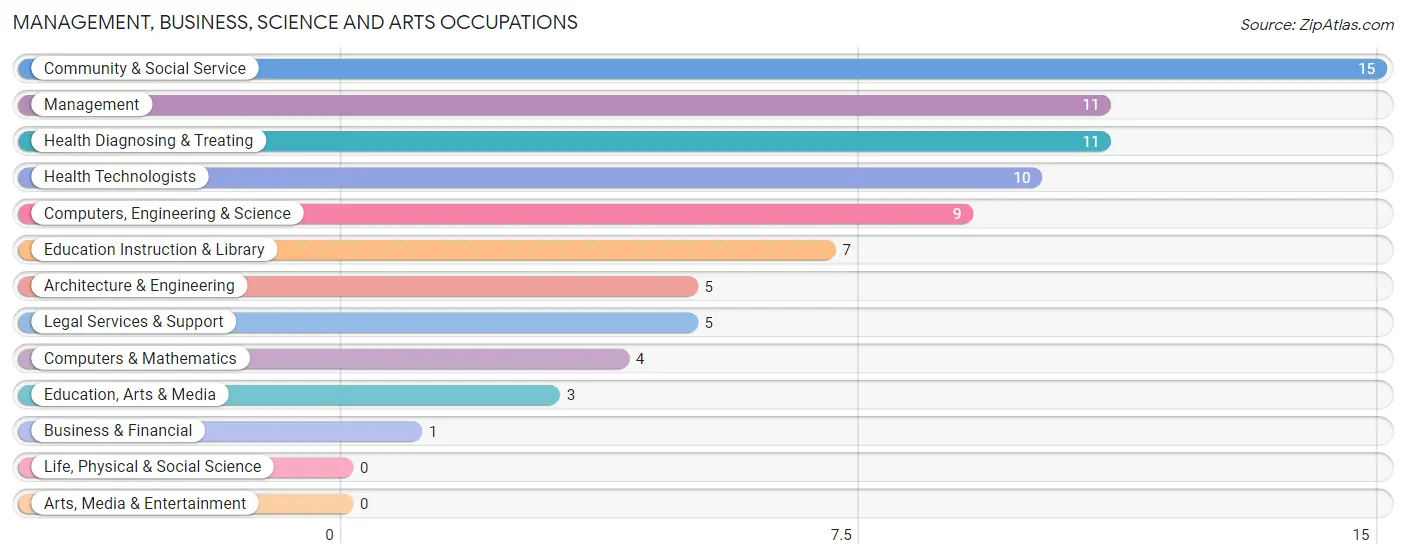
Management, Business, Science and Arts Occupations
The most common Management, Business, Science and Arts occupations in Pottawattamie Park are Community & Social Service (15 | 8.1%), Management (11 | 5.9%), Health Diagnosing & Treating (11 | 5.9%), Health Technologists (10 | 5.4%), and Computers, Engineering & Science (9 | 4.9%).
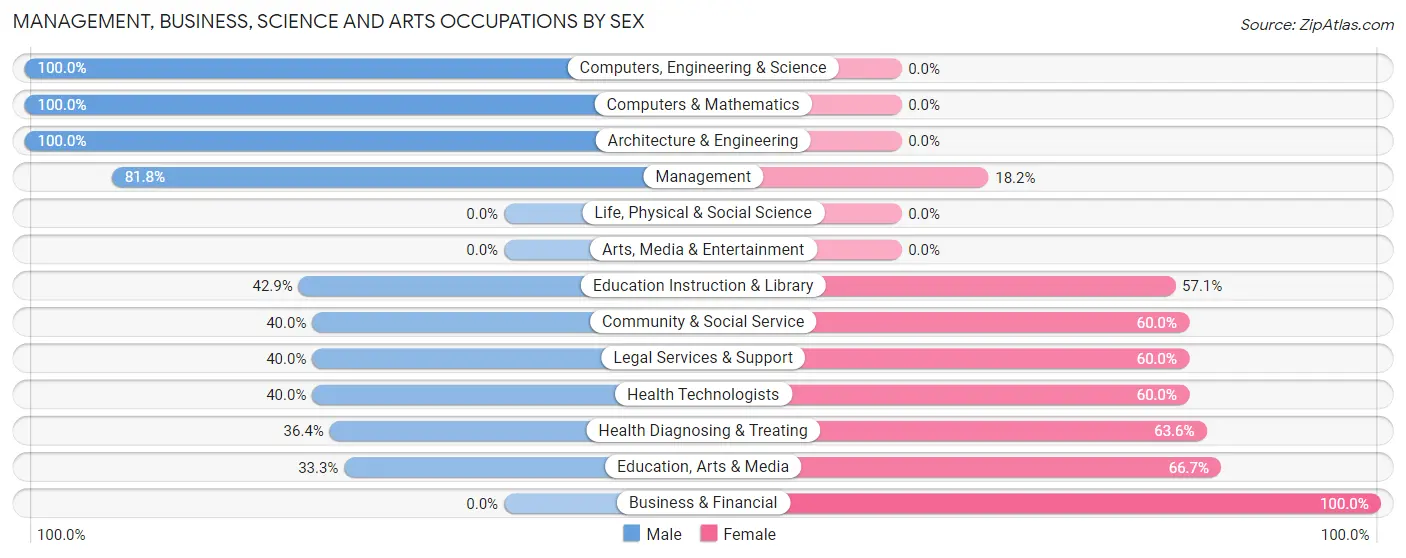
Management, Business, Science and Arts Occupations by Sex
Within the Management, Business, Science and Arts occupations in Pottawattamie Park, the most male-oriented occupations are Computers, Engineering & Science (100.0%), Computers & Mathematics (100.0%), and Architecture & Engineering (100.0%), while the most female-oriented occupations are Business & Financial (100.0%), Education, Arts & Media (66.7%), and Health Diagnosing & Treating (63.6%).
| Occupation | Male | Female |
| Management | 9 (81.8%) | 2 (18.2%) |
| Business & Financial | 0 (0.0%) | 1 (100.0%) |
| Computers, Engineering & Science | 9 (100.0%) | 0 (0.0%) |
| Computers & Mathematics | 4 (100.0%) | 0 (0.0%) |
| Architecture & Engineering | 5 (100.0%) | 0 (0.0%) |
| Life, Physical & Social Science | 0 (0.0%) | 0 (0.0%) |
| Community & Social Service | 6 (40.0%) | 9 (60.0%) |
| Education, Arts & Media | 1 (33.3%) | 2 (66.7%) |
| Legal Services & Support | 2 (40.0%) | 3 (60.0%) |
| Education Instruction & Library | 3 (42.9%) | 4 (57.1%) |
| Arts, Media & Entertainment | 0 (0.0%) | 0 (0.0%) |
| Health Diagnosing & Treating | 4 (36.4%) | 7 (63.6%) |
| Health Technologists | 4 (40.0%) | 6 (60.0%) |
| Total (Category) | 28 (59.6%) | 19 (40.4%) |
| Total (Overall) | 103 (55.7%) | 82 (44.3%) |
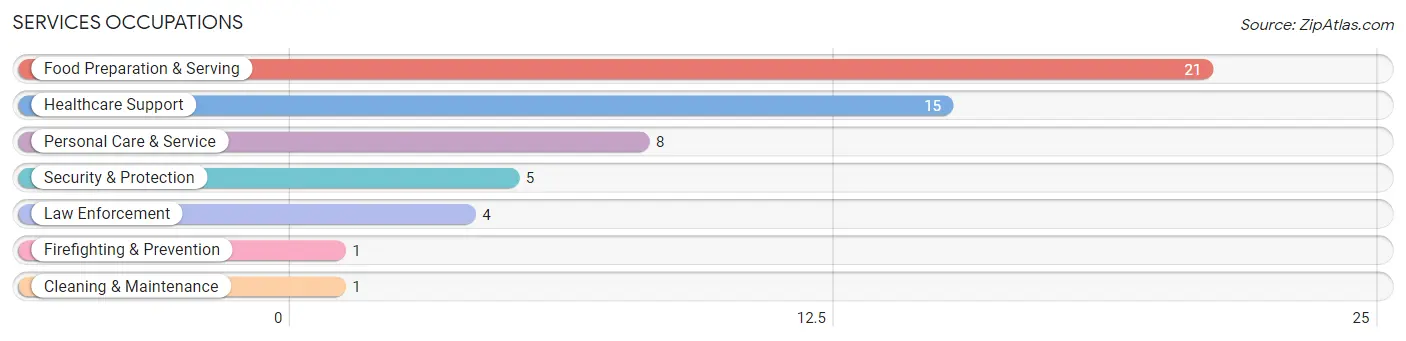
Services Occupations
The most common Services occupations in Pottawattamie Park are Food Preparation & Serving (21 | 11.4%), Healthcare Support (15 | 8.1%), Personal Care & Service (8 | 4.3%), Security & Protection (5 | 2.7%), and Law Enforcement (4 | 2.2%).
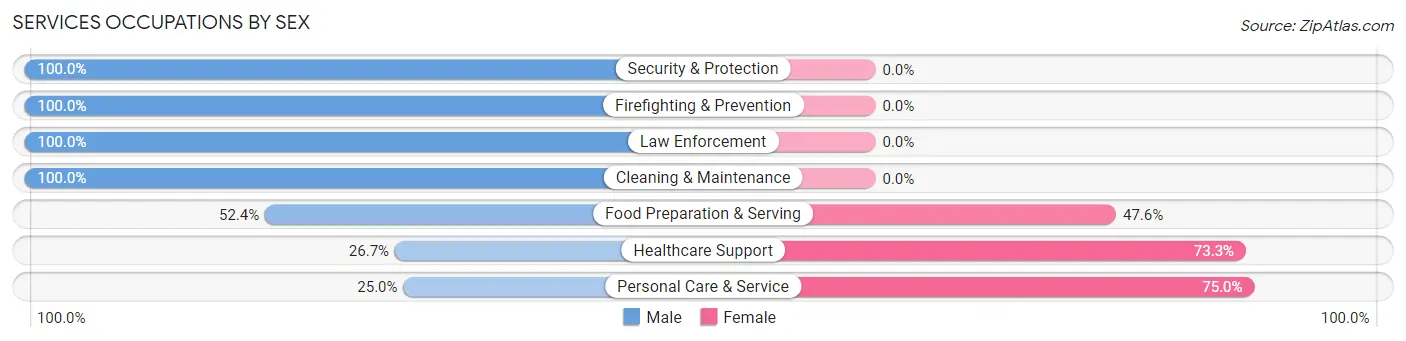
Services Occupations by Sex
Within the Services occupations in Pottawattamie Park, the most male-oriented occupations are Security & Protection (100.0%), Firefighting & Prevention (100.0%), and Law Enforcement (100.0%), while the most female-oriented occupations are Personal Care & Service (75.0%), Healthcare Support (73.3%), and Food Preparation & Serving (47.6%).
| Occupation | Male | Female |
| Healthcare Support | 4 (26.7%) | 11 (73.3%) |
| Security & Protection | 5 (100.0%) | 0 (0.0%) |
| Firefighting & Prevention | 1 (100.0%) | 0 (0.0%) |
| Law Enforcement | 4 (100.0%) | 0 (0.0%) |
| Food Preparation & Serving | 11 (52.4%) | 10 (47.6%) |
| Cleaning & Maintenance | 1 (100.0%) | 0 (0.0%) |
| Personal Care & Service | 2 (25.0%) | 6 (75.0%) |
| Total (Category) | 23 (46.0%) | 27 (54.0%) |
| Total (Overall) | 103 (55.7%) | 82 (44.3%) |
Sales and Office Occupations
The most common Sales and Office occupations in Pottawattamie Park are Sales & Related (29 | 15.7%), and Office & Administration (27 | 14.6%).
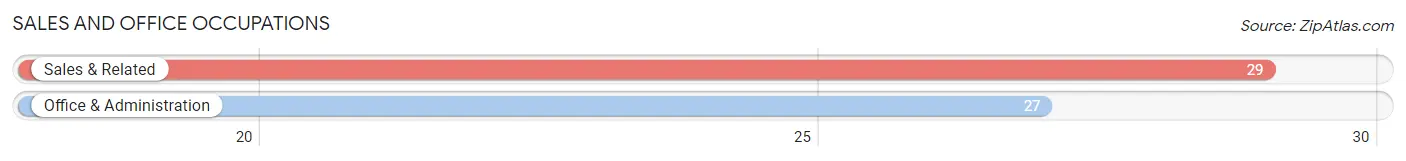
Sales and Office Occupations by Sex
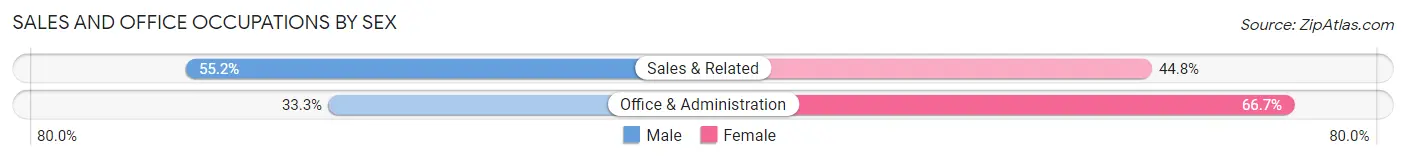
| Occupation | Male | Female |
| Sales & Related | 16 (55.2%) | 13 (44.8%) |
| Office & Administration | 9 (33.3%) | 18 (66.7%) |
| Total (Category) | 25 (44.6%) | 31 (55.4%) |
| Total (Overall) | 103 (55.7%) | 82 (44.3%) |
Natural Resources, Construction and Maintenance Occupations
The most common Natural Resources, Construction and Maintenance occupations in Pottawattamie Park are Construction & Extraction (3 | 1.6%), and Installation, Maintenance & Repair (1 | 0.5%).
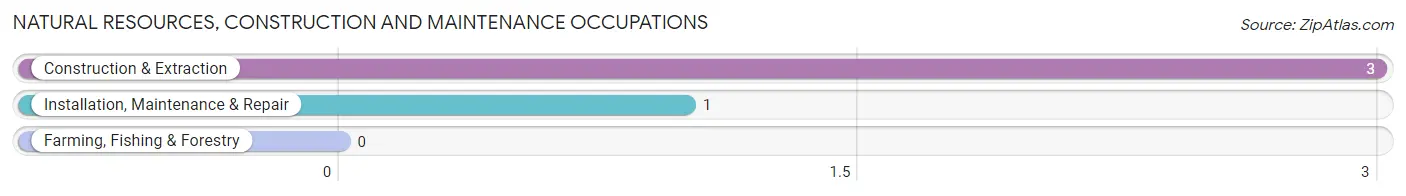
Natural Resources, Construction and Maintenance Occupations by Sex
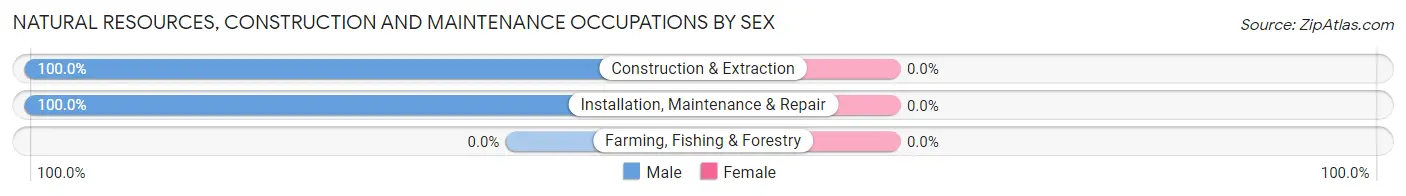
| Occupation | Male | Female |
| Farming, Fishing & Forestry | 0 (0.0%) | 0 (0.0%) |
| Construction & Extraction | 3 (100.0%) | 0 (0.0%) |
| Installation, Maintenance & Repair | 1 (100.0%) | 0 (0.0%) |
| Total (Category) | 4 (100.0%) | 0 (0.0%) |
| Total (Overall) | 103 (55.7%) | 82 (44.3%) |
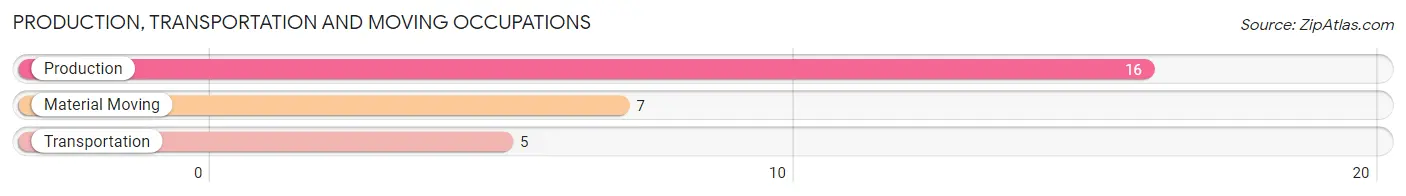
Production, Transportation and Moving Occupations
The most common Production, Transportation and Moving occupations in Pottawattamie Park are Production (16 | 8.6%), Material Moving (7 | 3.8%), and Transportation (5 | 2.7%).
Production, Transportation and Moving Occupations by Sex
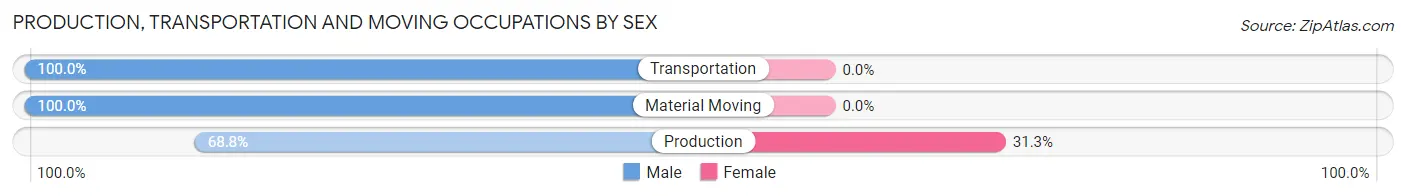
| Occupation | Male | Female |
| Production | 11 (68.8%) | 5 (31.2%) |
| Transportation | 5 (100.0%) | 0 (0.0%) |
| Material Moving | 7 (100.0%) | 0 (0.0%) |
| Total (Category) | 23 (82.1%) | 5 (17.9%) |
| Total (Overall) | 103 (55.7%) | 82 (44.3%) |
Employment Industries by Sex in Pottawattamie Park
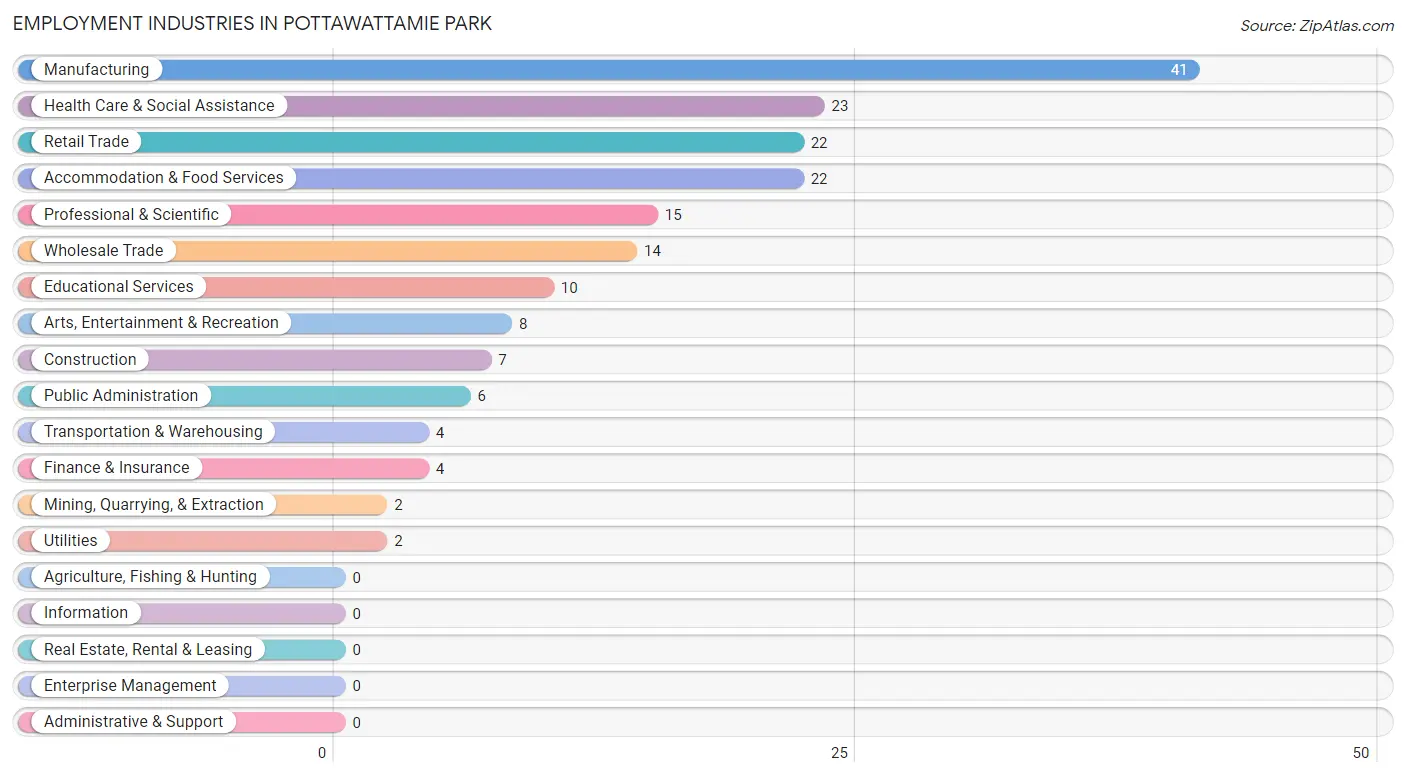
Employment Industries in Pottawattamie Park
The major employment industries in Pottawattamie Park include Manufacturing (41 | 22.2%), Health Care & Social Assistance (23 | 12.4%), Retail Trade (22 | 11.9%), Accommodation & Food Services (22 | 11.9%), and Professional & Scientific (15 | 8.1%).
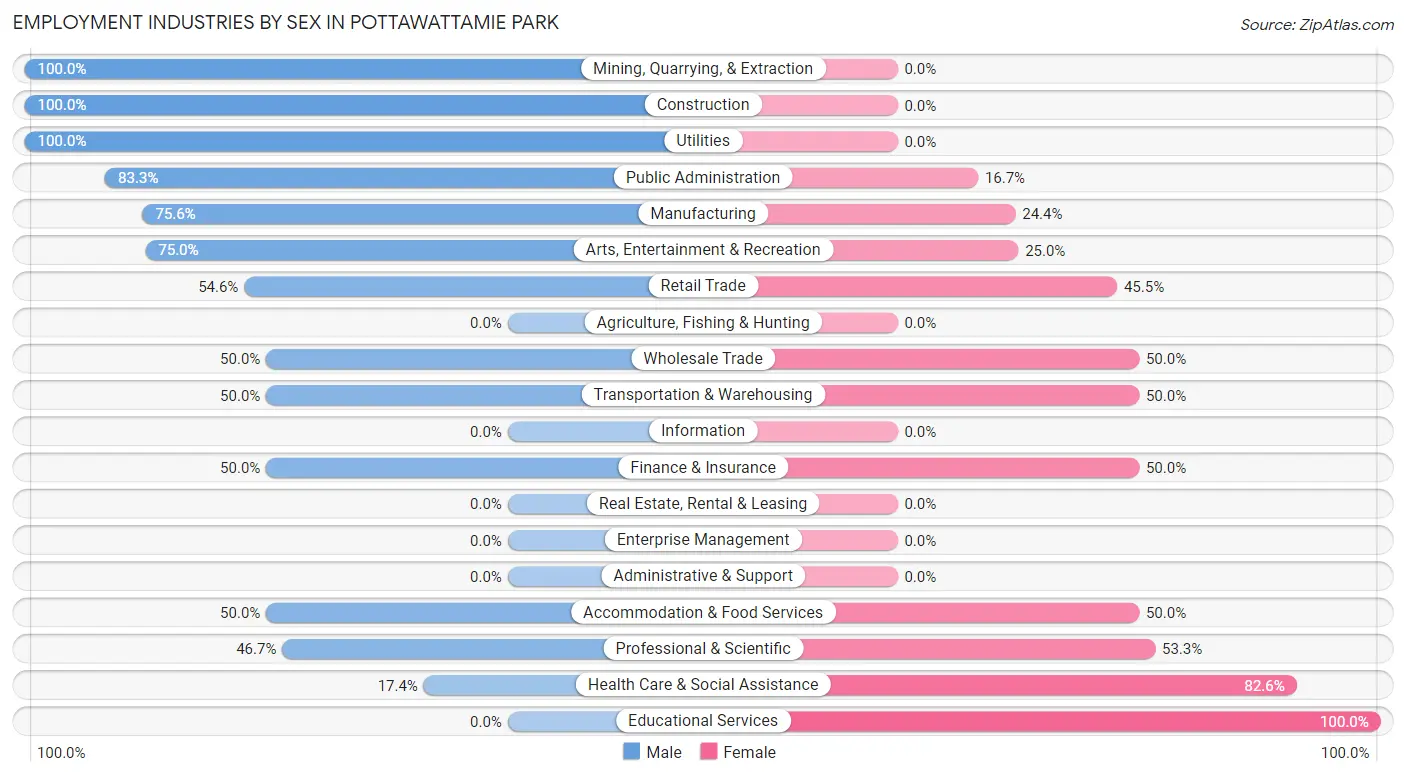
Employment Industries by Sex in Pottawattamie Park
The Pottawattamie Park industries that see more men than women are Mining, Quarrying, & Extraction (100.0%), Construction (100.0%), and Utilities (100.0%), whereas the industries that tend to have a higher number of women are Educational Services (100.0%), Health Care & Social Assistance (82.6%), and Professional & Scientific (53.3%).
| Industry | Male | Female |
| Agriculture, Fishing & Hunting | 0 (0.0%) | 0 (0.0%) |
| Mining, Quarrying, & Extraction | 2 (100.0%) | 0 (0.0%) |
| Construction | 7 (100.0%) | 0 (0.0%) |
| Manufacturing | 31 (75.6%) | 10 (24.4%) |
| Wholesale Trade | 7 (50.0%) | 7 (50.0%) |
| Retail Trade | 12 (54.5%) | 10 (45.5%) |
| Transportation & Warehousing | 2 (50.0%) | 2 (50.0%) |
| Utilities | 2 (100.0%) | 0 (0.0%) |
| Information | 0 (0.0%) | 0 (0.0%) |
| Finance & Insurance | 2 (50.0%) | 2 (50.0%) |
| Real Estate, Rental & Leasing | 0 (0.0%) | 0 (0.0%) |
| Professional & Scientific | 7 (46.7%) | 8 (53.3%) |
| Enterprise Management | 0 (0.0%) | 0 (0.0%) |
| Administrative & Support | 0 (0.0%) | 0 (0.0%) |
| Educational Services | 0 (0.0%) | 10 (100.0%) |
| Health Care & Social Assistance | 4 (17.4%) | 19 (82.6%) |
| Arts, Entertainment & Recreation | 6 (75.0%) | 2 (25.0%) |
| Accommodation & Food Services | 11 (50.0%) | 11 (50.0%) |
| Public Administration | 5 (83.3%) | 1 (16.7%) |
| Total | 103 (55.7%) | 82 (44.3%) |
Education in Pottawattamie Park
School Enrollment in Pottawattamie Park
The most common levels of schooling among the 67 students in Pottawattamie Park are high school (24 | 35.8%), college / undergraduate (13 | 19.4%), and elementary school (11 | 16.4%).
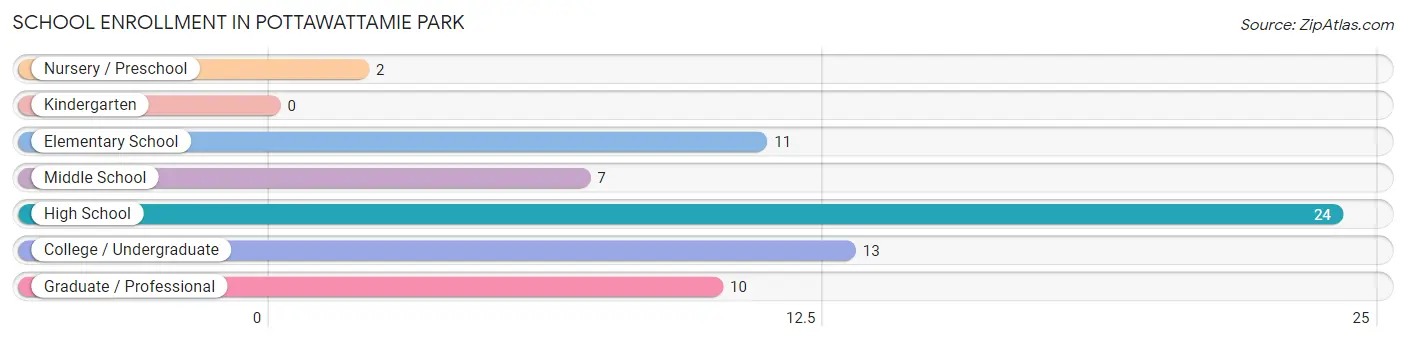
| School Level | # Students | % Students |
| Nursery / Preschool | 2 | 3.0% |
| Kindergarten | 0 | 0.0% |
| Elementary School | 11 | 16.4% |
| Middle School | 7 | 10.4% |
| High School | 24 | 35.8% |
| College / Undergraduate | 13 | 19.4% |
| Graduate / Professional | 10 | 14.9% |
| Total | 67 | 100.0% |
School Enrollment by Age by Funding Source in Pottawattamie Park
Out of a total of 67 students who are enrolled in schools in Pottawattamie Park, 17 (25.4%) attend a private institution, while the remaining 50 (74.6%) are enrolled in public schools. The age group of 20 to 24 year olds has the highest likelihood of being enrolled in private schools, with 9 (81.8% in the age bracket) enrolled. Conversely, the age group of 25 to 34 year olds has the lowest likelihood of being enrolled in a private school, with 2 (100.0% in the age bracket) attending a public institution.
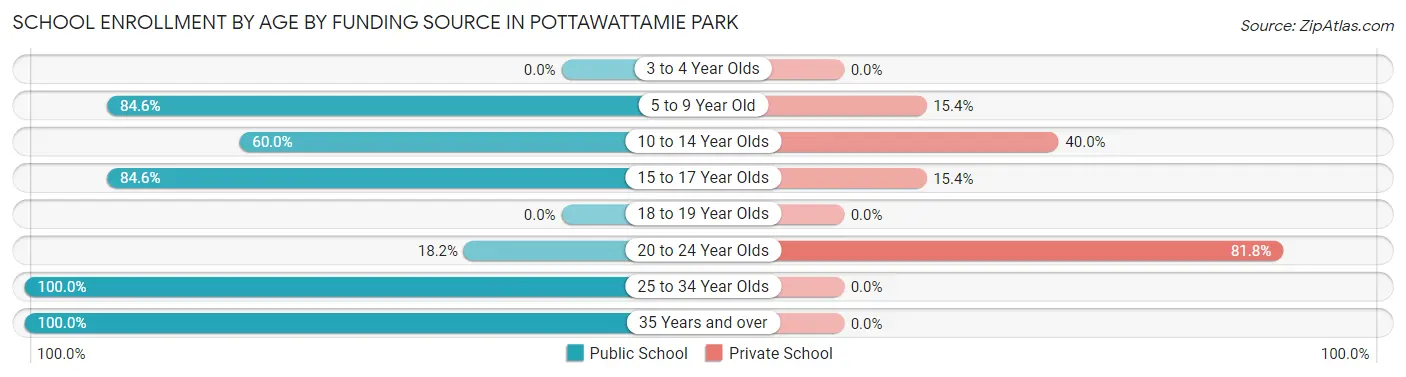
| Age Bracket | Public School | Private School |
| 3 to 4 Year Olds | 0 (0.0%) | 0 (0.0%) |
| 5 to 9 Year Old | 11 (84.6%) | 2 (15.4%) |
| 10 to 14 Year Olds | 3 (60.0%) | 2 (40.0%) |
| 15 to 17 Year Olds | 22 (84.6%) | 4 (15.4%) |
| 18 to 19 Year Olds | 0 (0.0%) | 0 (0.0%) |
| 20 to 24 Year Olds | 2 (18.2%) | 9 (81.8%) |
| 25 to 34 Year Olds | 2 (100.0%) | 0 (0.0%) |
| 35 Years and over | 10 (100.0%) | 0 (0.0%) |
| Total | 50 (74.6%) | 17 (25.4%) |
Educational Attainment by Field of Study in Pottawattamie Park
Business (23 | 19.5%), education (16 | 13.6%), arts & humanities (15 | 12.7%), social sciences (11 | 9.3%), and engineering (11 | 9.3%) are the most common fields of study among 118 individuals in Pottawattamie Park who have obtained a bachelor's degree or higher.
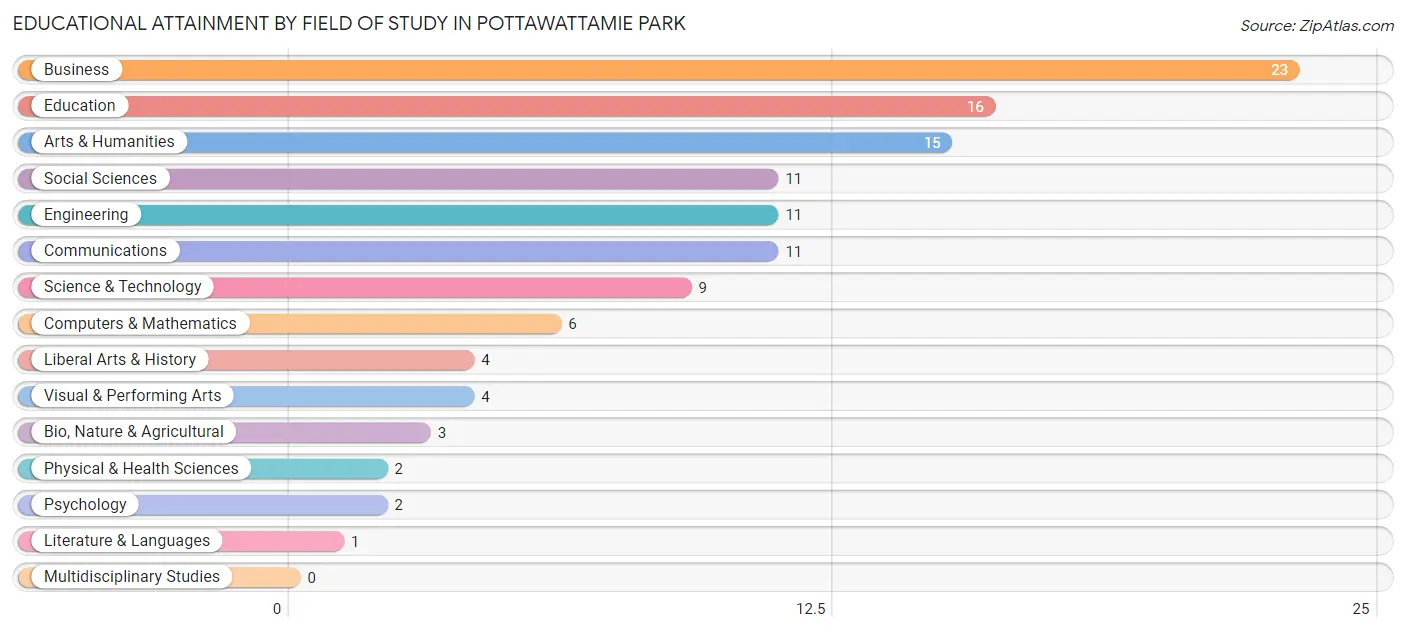
| Field of Study | # Graduates | % Graduates |
| Computers & Mathematics | 6 | 5.1% |
| Bio, Nature & Agricultural | 3 | 2.5% |
| Physical & Health Sciences | 2 | 1.7% |
| Psychology | 2 | 1.7% |
| Social Sciences | 11 | 9.3% |
| Engineering | 11 | 9.3% |
| Multidisciplinary Studies | 0 | 0.0% |
| Science & Technology | 9 | 7.6% |
| Business | 23 | 19.5% |
| Education | 16 | 13.6% |
| Literature & Languages | 1 | 0.9% |
| Liberal Arts & History | 4 | 3.4% |
| Visual & Performing Arts | 4 | 3.4% |
| Communications | 11 | 9.3% |
| Arts & Humanities | 15 | 12.7% |
| Total | 118 | 100.0% |
Transportation & Commute in Pottawattamie Park
Vehicle Availability by Sex in Pottawattamie Park
The most prevalent vehicle ownership categories in Pottawattamie Park are males with 2 vehicles (45, accounting for 45.5%) and females with 2 vehicles (26, making up 59.2%).
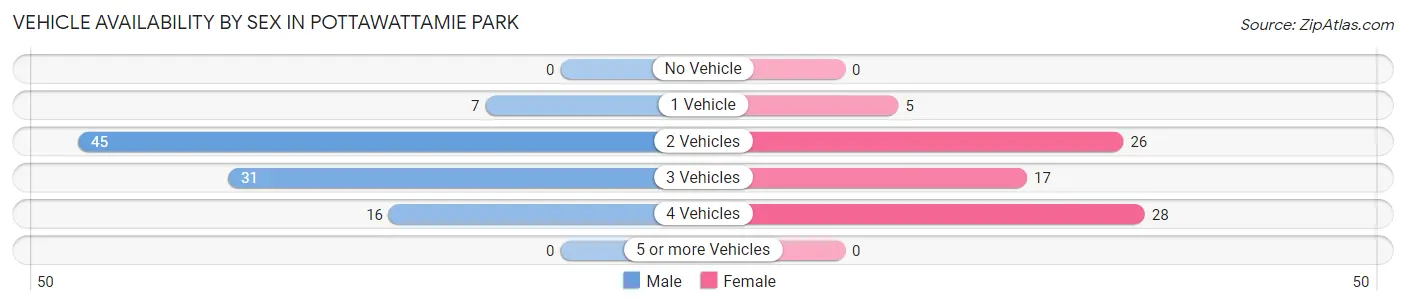
| Vehicles Available | Male | Female |
| No Vehicle | 0 (0.0%) | 0 (0.0%) |
| 1 Vehicle | 7 (7.1%) | 5 (6.6%) |
| 2 Vehicles | 45 (45.5%) | 26 (34.2%) |
| 3 Vehicles | 31 (31.3%) | 17 (22.4%) |
| 4 Vehicles | 16 (16.2%) | 28 (36.8%) |
| 5 or more Vehicles | 0 (0.0%) | 0 (0.0%) |
| Total | 99 (100.0%) | 76 (100.0%) |
Commute Time in Pottawattamie Park
The most frequently occuring commute durations in Pottawattamie Park are 10 to 14 minutes (39 commuters, 25.5%), 30 to 34 minutes (26 commuters, 17.0%), and 5 to 9 minutes (22 commuters, 14.4%).
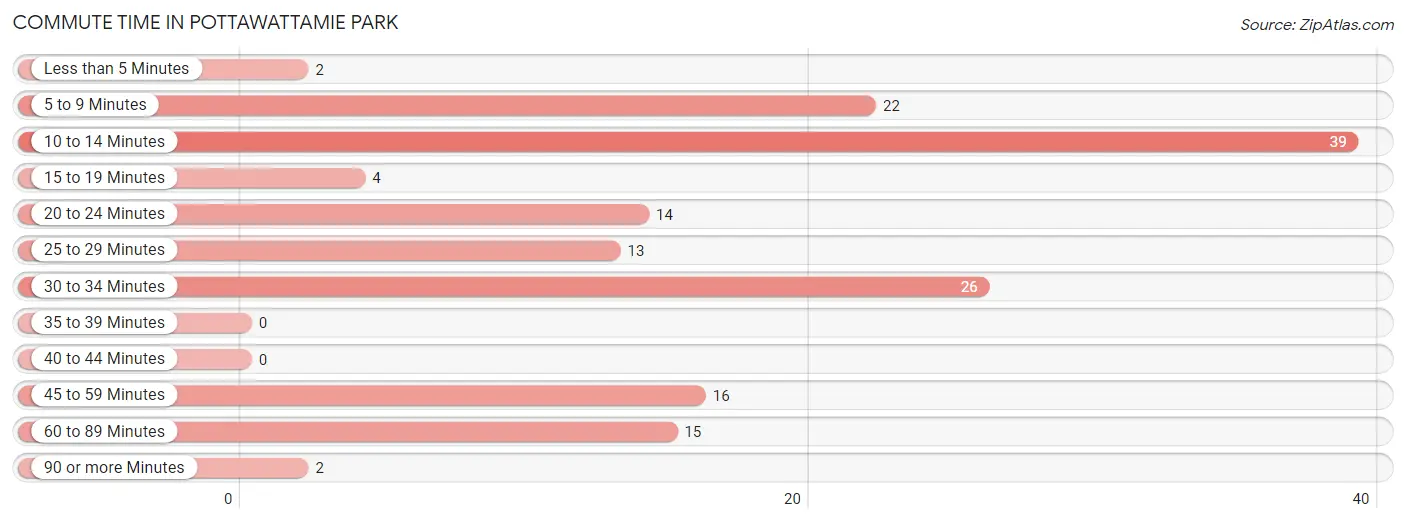
| Commute Time | # Commuters | % Commuters |
| Less than 5 Minutes | 2 | 1.3% |
| 5 to 9 Minutes | 22 | 14.4% |
| 10 to 14 Minutes | 39 | 25.5% |
| 15 to 19 Minutes | 4 | 2.6% |
| 20 to 24 Minutes | 14 | 9.1% |
| 25 to 29 Minutes | 13 | 8.5% |
| 30 to 34 Minutes | 26 | 17.0% |
| 35 to 39 Minutes | 0 | 0.0% |
| 40 to 44 Minutes | 0 | 0.0% |
| 45 to 59 Minutes | 16 | 10.5% |
| 60 to 89 Minutes | 15 | 9.8% |
| 90 or more Minutes | 2 | 1.3% |
Commute Time by Sex in Pottawattamie Park
The most common commute times in Pottawattamie Park are 5 to 9 minutes (14 commuters, 16.7%) for males and 10 to 14 minutes (29 commuters, 42.0%) for females.
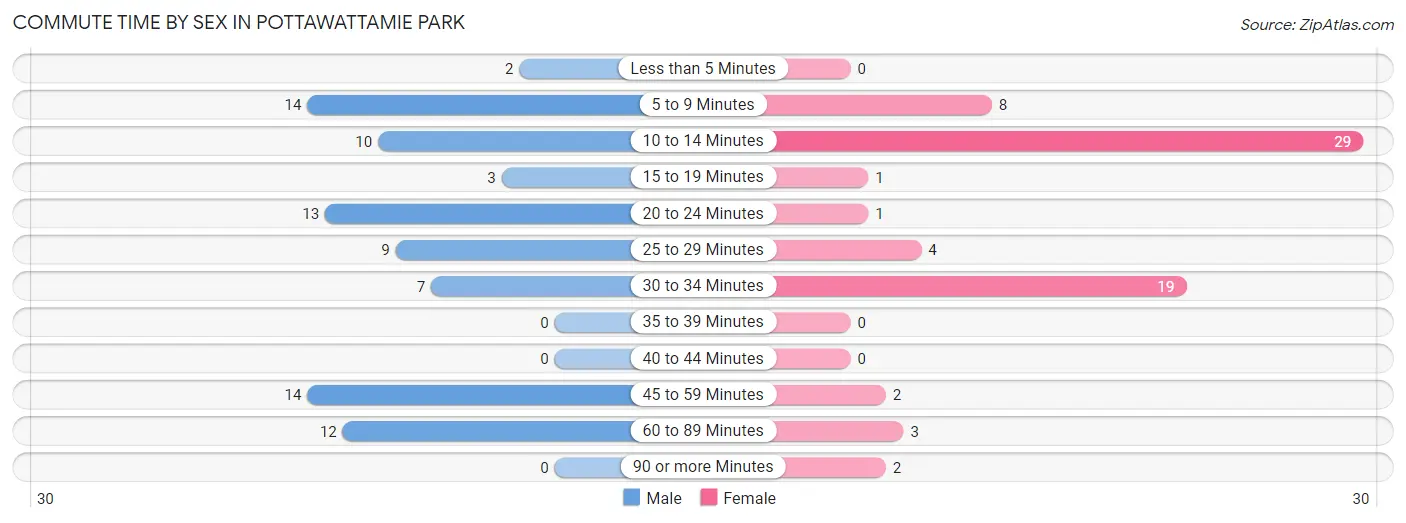
| Commute Time | Male | Female |
| Less than 5 Minutes | 2 (2.4%) | 0 (0.0%) |
| 5 to 9 Minutes | 14 (16.7%) | 8 (11.6%) |
| 10 to 14 Minutes | 10 (11.9%) | 29 (42.0%) |
| 15 to 19 Minutes | 3 (3.6%) | 1 (1.5%) |
| 20 to 24 Minutes | 13 (15.5%) | 1 (1.5%) |
| 25 to 29 Minutes | 9 (10.7%) | 4 (5.8%) |
| 30 to 34 Minutes | 7 (8.3%) | 19 (27.5%) |
| 35 to 39 Minutes | 0 (0.0%) | 0 (0.0%) |
| 40 to 44 Minutes | 0 (0.0%) | 0 (0.0%) |
| 45 to 59 Minutes | 14 (16.7%) | 2 (2.9%) |
| 60 to 89 Minutes | 12 (14.3%) | 3 (4.3%) |
| 90 or more Minutes | 0 (0.0%) | 2 (2.9%) |
Time of Departure to Work by Sex in Pottawattamie Park
The most frequent times of departure to work in Pottawattamie Park are 7:00 AM to 7:29 AM (14, 16.7%) for males and 6:30 AM to 6:59 AM (15, 21.7%) for females.
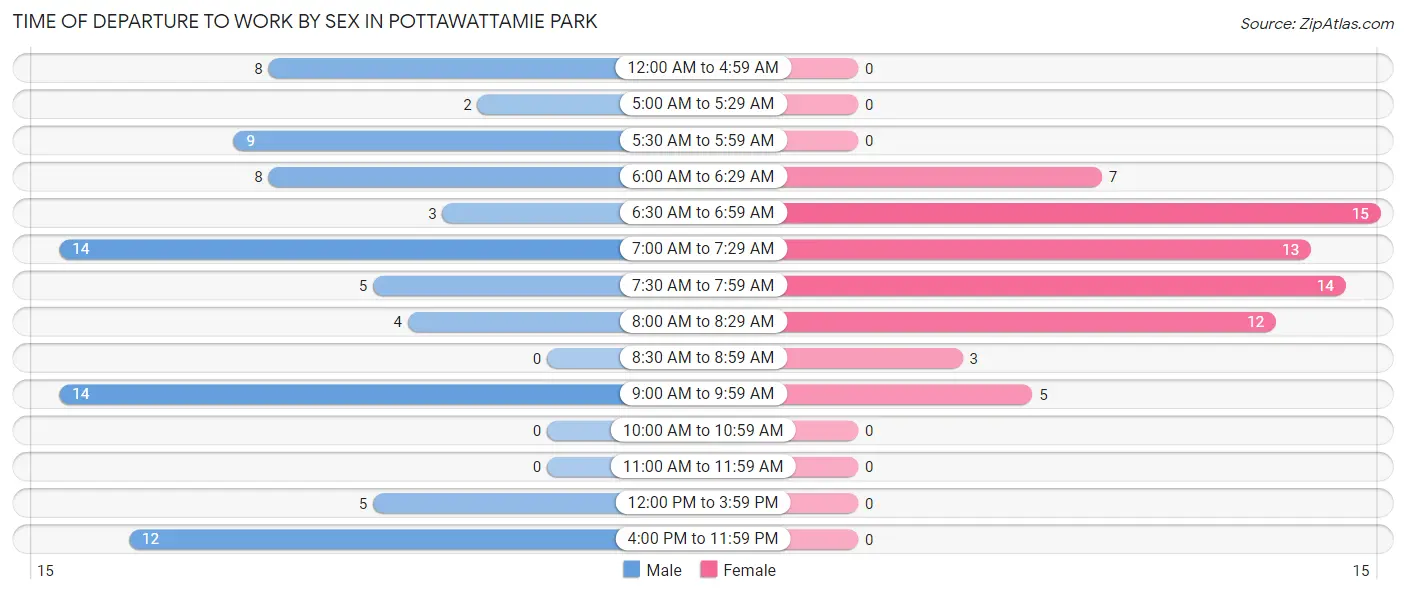
| Time of Departure | Male | Female |
| 12:00 AM to 4:59 AM | 8 (9.5%) | 0 (0.0%) |
| 5:00 AM to 5:29 AM | 2 (2.4%) | 0 (0.0%) |
| 5:30 AM to 5:59 AM | 9 (10.7%) | 0 (0.0%) |
| 6:00 AM to 6:29 AM | 8 (9.5%) | 7 (10.1%) |
| 6:30 AM to 6:59 AM | 3 (3.6%) | 15 (21.7%) |
| 7:00 AM to 7:29 AM | 14 (16.7%) | 13 (18.8%) |
| 7:30 AM to 7:59 AM | 5 (5.9%) | 14 (20.3%) |
| 8:00 AM to 8:29 AM | 4 (4.8%) | 12 (17.4%) |
| 8:30 AM to 8:59 AM | 0 (0.0%) | 3 (4.3%) |
| 9:00 AM to 9:59 AM | 14 (16.7%) | 5 (7.2%) |
| 10:00 AM to 10:59 AM | 0 (0.0%) | 0 (0.0%) |
| 11:00 AM to 11:59 AM | 0 (0.0%) | 0 (0.0%) |
| 12:00 PM to 3:59 PM | 5 (5.9%) | 0 (0.0%) |
| 4:00 PM to 11:59 PM | 12 (14.3%) | 0 (0.0%) |
| Total | 84 (100.0%) | 69 (100.0%) |
Housing Occupancy in Pottawattamie Park
Occupancy by Ownership in Pottawattamie Park
Of the total 125 dwellings in Pottawattamie Park, owner-occupied units account for 121 (96.8%), while renter-occupied units make up 4 (3.2%).
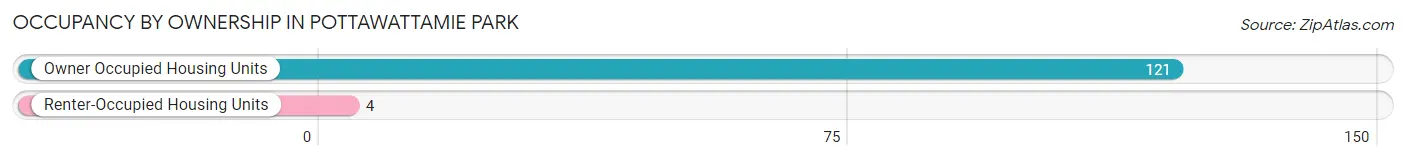
| Occupancy | # Housing Units | % Housing Units |
| Owner Occupied Housing Units | 121 | 96.8% |
| Renter-Occupied Housing Units | 4 | 3.2% |
| Total Occupied Housing Units | 125 | 100.0% |
Occupancy by Household Size in Pottawattamie Park
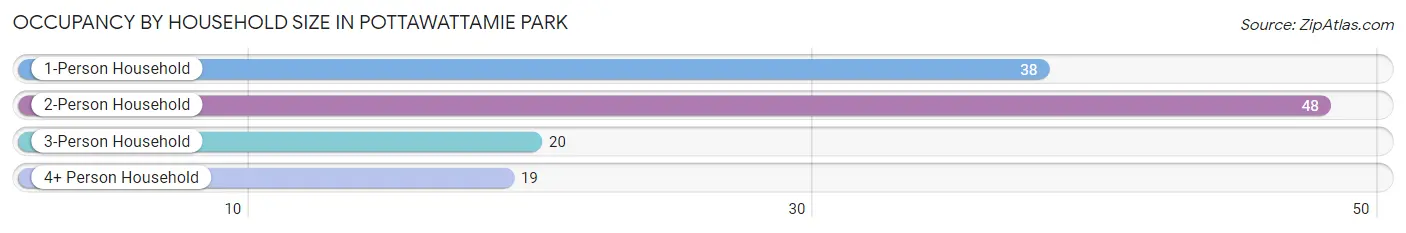
| Household Size | # Housing Units | % Housing Units |
| 1-Person Household | 38 | 30.4% |
| 2-Person Household | 48 | 38.4% |
| 3-Person Household | 20 | 16.0% |
| 4+ Person Household | 19 | 15.2% |
| Total Housing Units | 125 | 100.0% |
Occupancy by Ownership by Household Size in Pottawattamie Park
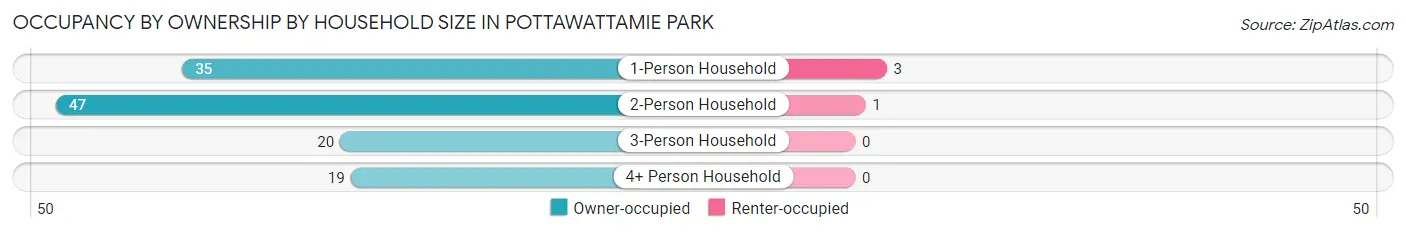
| Household Size | Owner-occupied | Renter-occupied |
| 1-Person Household | 35 (92.1%) | 3 (7.9%) |
| 2-Person Household | 47 (97.9%) | 1 (2.1%) |
| 3-Person Household | 20 (100.0%) | 0 (0.0%) |
| 4+ Person Household | 19 (100.0%) | 0 (0.0%) |
| Total Housing Units | 121 (96.8%) | 4 (3.2%) |
Occupancy by Educational Attainment in Pottawattamie Park
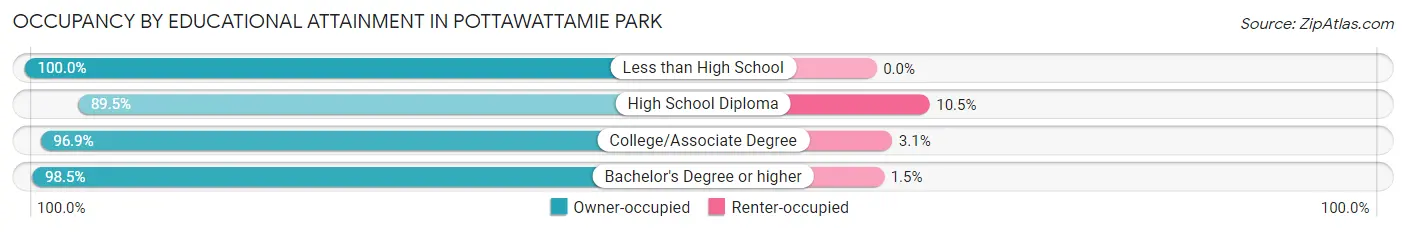
| Household Size | Owner-occupied | Renter-occupied |
| Less than High School | 7 (100.0%) | 0 (0.0%) |
| High School Diploma | 17 (89.5%) | 2 (10.5%) |
| College/Associate Degree | 31 (96.9%) | 1 (3.1%) |
| Bachelor's Degree or higher | 66 (98.5%) | 1 (1.5%) |
Occupancy by Age of Householder in Pottawattamie Park
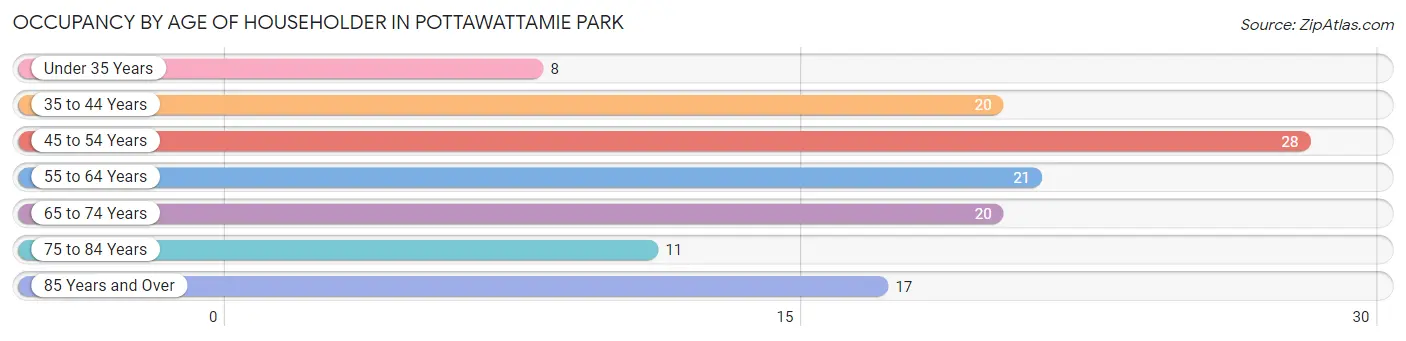
| Age Bracket | # Households | % Households |
| Under 35 Years | 8 | 6.4% |
| 35 to 44 Years | 20 | 16.0% |
| 45 to 54 Years | 28 | 22.4% |
| 55 to 64 Years | 21 | 16.8% |
| 65 to 74 Years | 20 | 16.0% |
| 75 to 84 Years | 11 | 8.8% |
| 85 Years and Over | 17 | 13.6% |
| Total | 125 | 100.0% |
Housing Finances in Pottawattamie Park
Median Income by Occupancy in Pottawattamie Park
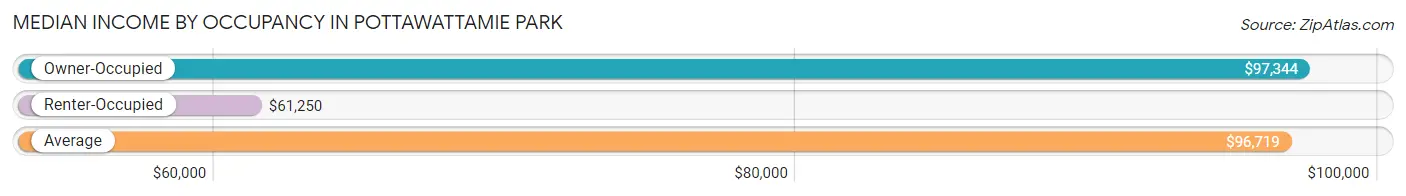
| Occupancy Type | # Households | Median Income |
| Owner-Occupied | 121 (96.8%) | $97,344 |
| Renter-Occupied | 4 (3.2%) | $61,250 |
| Average | 125 (100.0%) | $96,719 |
Occupancy by Householder Income Bracket in Pottawattamie Park
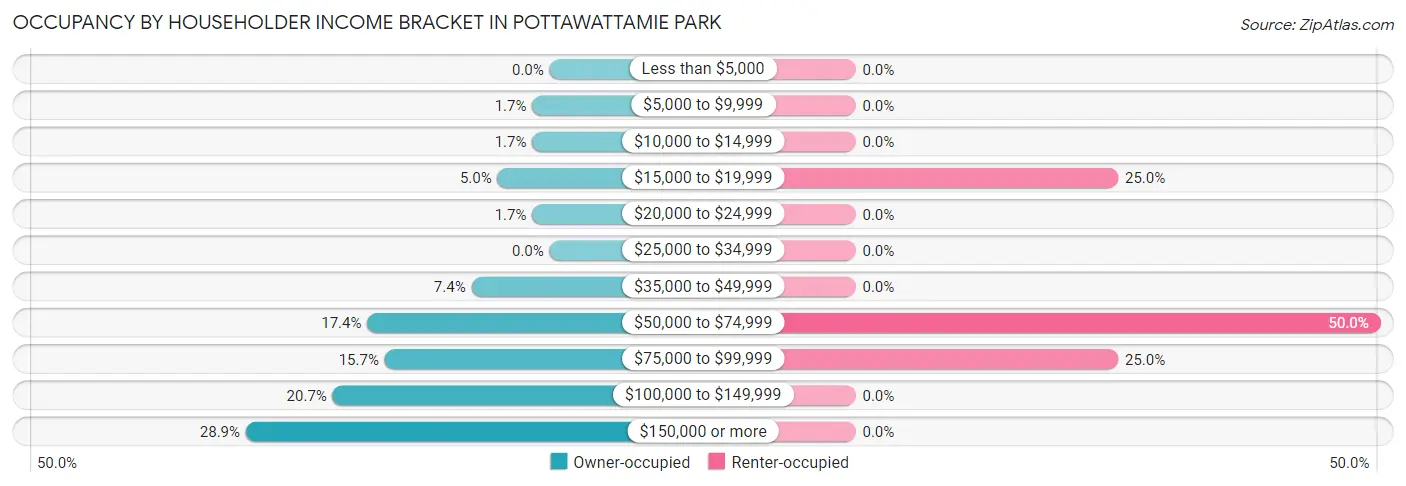
| Income Bracket | Owner-occupied | Renter-occupied |
| Less than $5,000 | 0 (0.0%) | 0 (0.0%) |
| $5,000 to $9,999 | 2 (1.7%) | 0 (0.0%) |
| $10,000 to $14,999 | 2 (1.7%) | 0 (0.0%) |
| $15,000 to $19,999 | 6 (5.0%) | 1 (25.0%) |
| $20,000 to $24,999 | 2 (1.7%) | 0 (0.0%) |
| $25,000 to $34,999 | 0 (0.0%) | 0 (0.0%) |
| $35,000 to $49,999 | 9 (7.4%) | 0 (0.0%) |
| $50,000 to $74,999 | 21 (17.4%) | 2 (50.0%) |
| $75,000 to $99,999 | 19 (15.7%) | 1 (25.0%) |
| $100,000 to $149,999 | 25 (20.7%) | 0 (0.0%) |
| $150,000 or more | 35 (28.9%) | 0 (0.0%) |
| Total | 121 (100.0%) | 4 (100.0%) |
Monthly Housing Cost Tiers in Pottawattamie Park
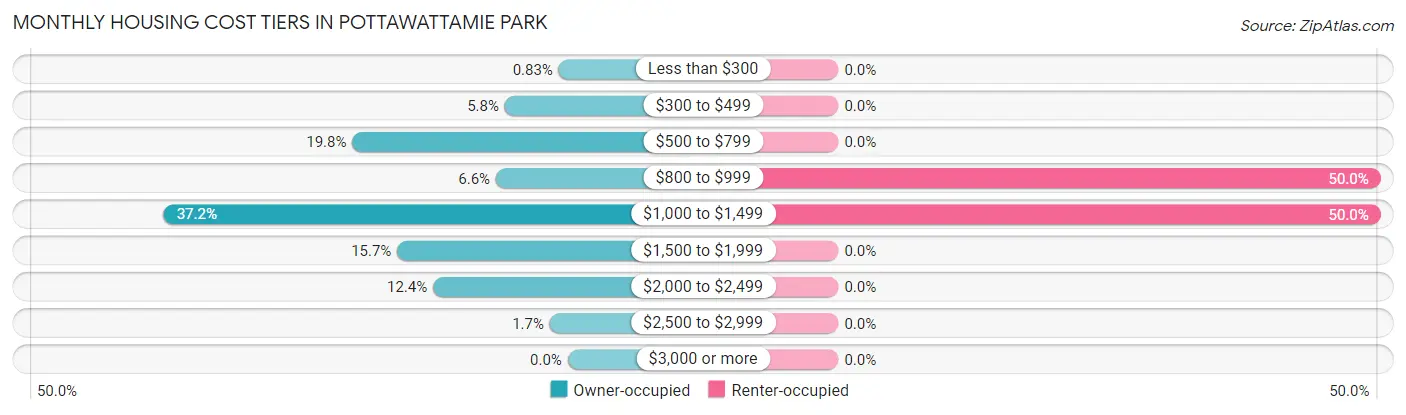
| Monthly Cost | Owner-occupied | Renter-occupied |
| Less than $300 | 1 (0.8%) | 0 (0.0%) |
| $300 to $499 | 7 (5.8%) | 0 (0.0%) |
| $500 to $799 | 24 (19.8%) | 0 (0.0%) |
| $800 to $999 | 8 (6.6%) | 2 (50.0%) |
| $1,000 to $1,499 | 45 (37.2%) | 2 (50.0%) |
| $1,500 to $1,999 | 19 (15.7%) | 0 (0.0%) |
| $2,000 to $2,499 | 15 (12.4%) | 0 (0.0%) |
| $2,500 to $2,999 | 2 (1.7%) | 0 (0.0%) |
| $3,000 or more | 0 (0.0%) | 0 (0.0%) |
| Total | 121 (100.0%) | 4 (100.0%) |
Physical Housing Characteristics in Pottawattamie Park
Housing Structures in Pottawattamie Park
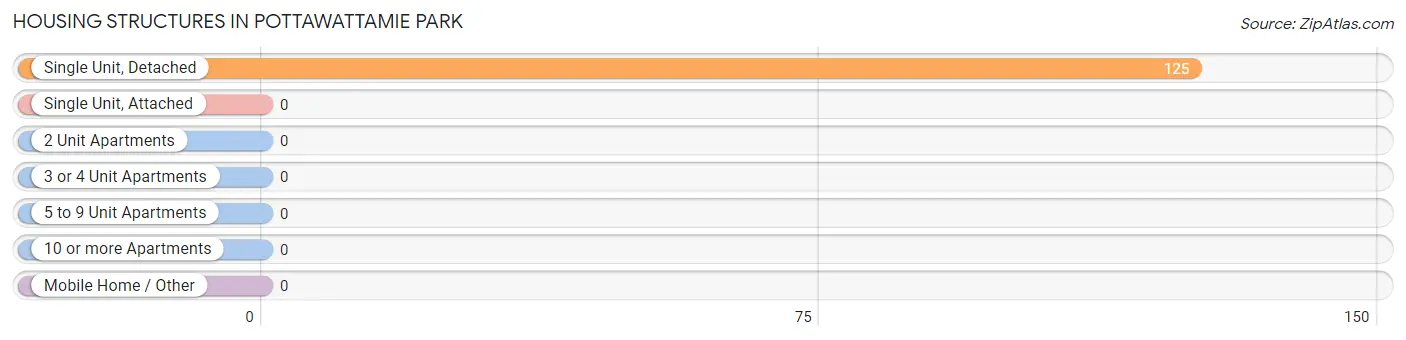
| Structure Type | # Housing Units | % Housing Units |
| Single Unit, Detached | 125 | 100.0% |
| Single Unit, Attached | 0 | 0.0% |
| 2 Unit Apartments | 0 | 0.0% |
| 3 or 4 Unit Apartments | 0 | 0.0% |
| 5 to 9 Unit Apartments | 0 | 0.0% |
| 10 or more Apartments | 0 | 0.0% |
| Mobile Home / Other | 0 | 0.0% |
| Total | 125 | 100.0% |
Housing Structures by Occupancy in Pottawattamie Park
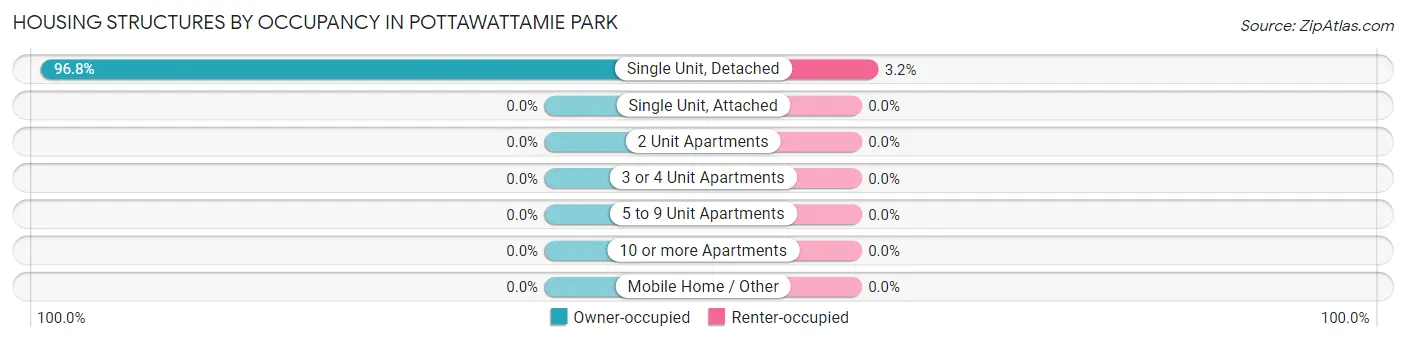
| Structure Type | Owner-occupied | Renter-occupied |
| Single Unit, Detached | 121 (96.8%) | 4 (3.2%) |
| Single Unit, Attached | 0 (0.0%) | 0 (0.0%) |
| 2 Unit Apartments | 0 (0.0%) | 0 (0.0%) |
| 3 or 4 Unit Apartments | 0 (0.0%) | 0 (0.0%) |
| 5 to 9 Unit Apartments | 0 (0.0%) | 0 (0.0%) |
| 10 or more Apartments | 0 (0.0%) | 0 (0.0%) |
| Mobile Home / Other | 0 (0.0%) | 0 (0.0%) |
| Total | 121 (96.8%) | 4 (3.2%) |
Housing Structures by Number of Rooms in Pottawattamie Park
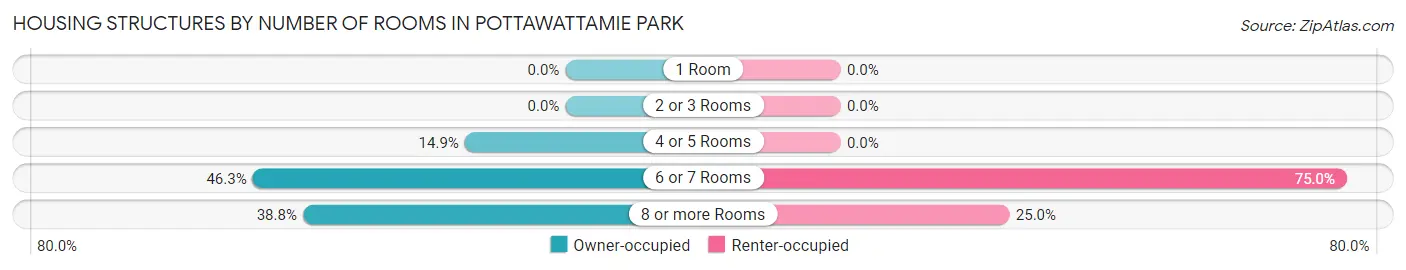
| Number of Rooms | Owner-occupied | Renter-occupied |
| 1 Room | 0 (0.0%) | 0 (0.0%) |
| 2 or 3 Rooms | 0 (0.0%) | 0 (0.0%) |
| 4 or 5 Rooms | 18 (14.9%) | 0 (0.0%) |
| 6 or 7 Rooms | 56 (46.3%) | 3 (75.0%) |
| 8 or more Rooms | 47 (38.8%) | 1 (25.0%) |
| Total | 121 (100.0%) | 4 (100.0%) |
Housing Structure by Heating Type in Pottawattamie Park
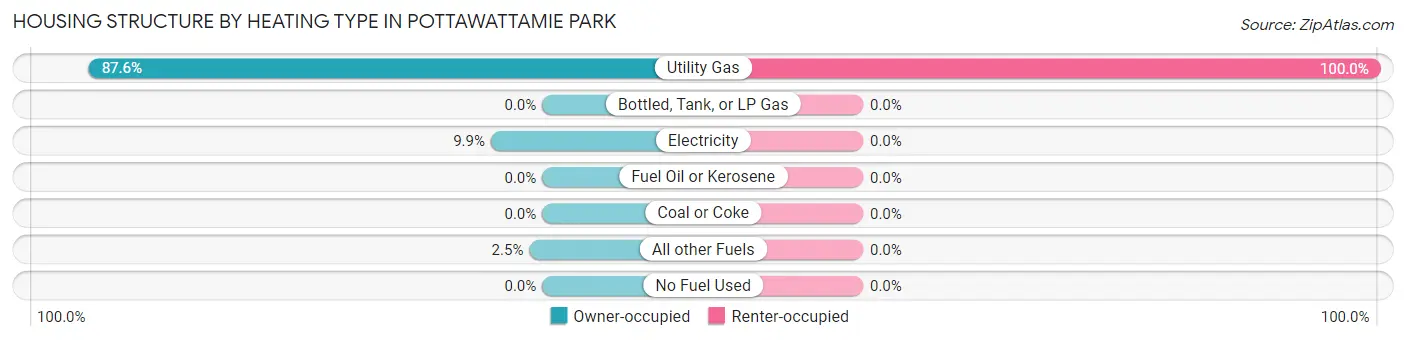
| Heating Type | Owner-occupied | Renter-occupied |
| Utility Gas | 106 (87.6%) | 4 (100.0%) |
| Bottled, Tank, or LP Gas | 0 (0.0%) | 0 (0.0%) |
| Electricity | 12 (9.9%) | 0 (0.0%) |
| Fuel Oil or Kerosene | 0 (0.0%) | 0 (0.0%) |
| Coal or Coke | 0 (0.0%) | 0 (0.0%) |
| All other Fuels | 3 (2.5%) | 0 (0.0%) |
| No Fuel Used | 0 (0.0%) | 0 (0.0%) |
| Total | 121 (100.0%) | 4 (100.0%) |
Household Vehicle Usage in Pottawattamie Park
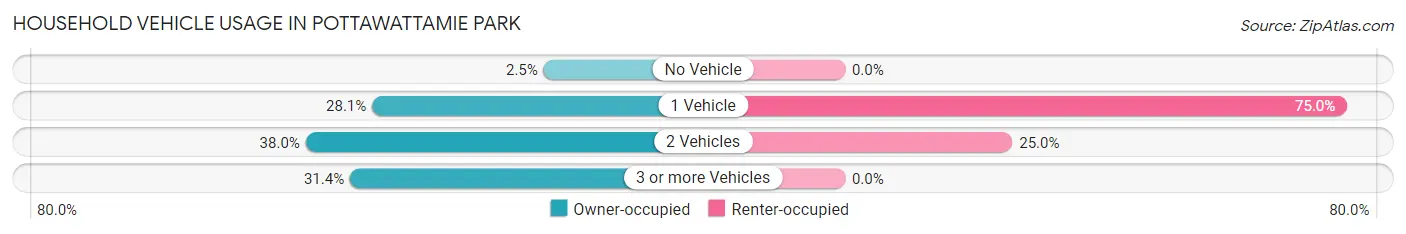
| Vehicles per Household | Owner-occupied | Renter-occupied |
| No Vehicle | 3 (2.5%) | 0 (0.0%) |
| 1 Vehicle | 34 (28.1%) | 3 (75.0%) |
| 2 Vehicles | 46 (38.0%) | 1 (25.0%) |
| 3 or more Vehicles | 38 (31.4%) | 0 (0.0%) |
| Total | 121 (100.0%) | 4 (100.0%) |
Real Estate & Mortgages in Pottawattamie Park
Real Estate and Mortgage Overview in Pottawattamie Park
| Characteristic | Without Mortgage | With Mortgage |
| Housing Units | 31 | 90 |
| Median Property Value | $153,100 | $204,400 |
| Median Household Income | $95,156 | $28 |
| Monthly Housing Costs | $554 | $0 |
| Real Estate Taxes | $1,583 | $0 |
Property Value by Mortgage Status in Pottawattamie Park
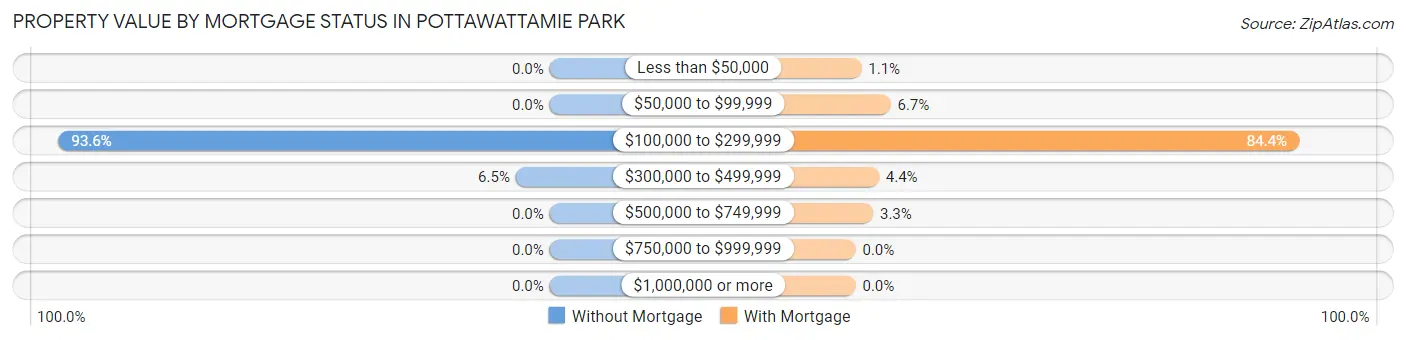
| Property Value | Without Mortgage | With Mortgage |
| Less than $50,000 | 0 (0.0%) | 1 (1.1%) |
| $50,000 to $99,999 | 0 (0.0%) | 6 (6.7%) |
| $100,000 to $299,999 | 29 (93.5%) | 76 (84.4%) |
| $300,000 to $499,999 | 2 (6.5%) | 4 (4.4%) |
| $500,000 to $749,999 | 0 (0.0%) | 3 (3.3%) |
| $750,000 to $999,999 | 0 (0.0%) | 0 (0.0%) |
| $1,000,000 or more | 0 (0.0%) | 0 (0.0%) |
| Total | 31 (100.0%) | 90 (100.0%) |
Household Income by Mortgage Status in Pottawattamie Park
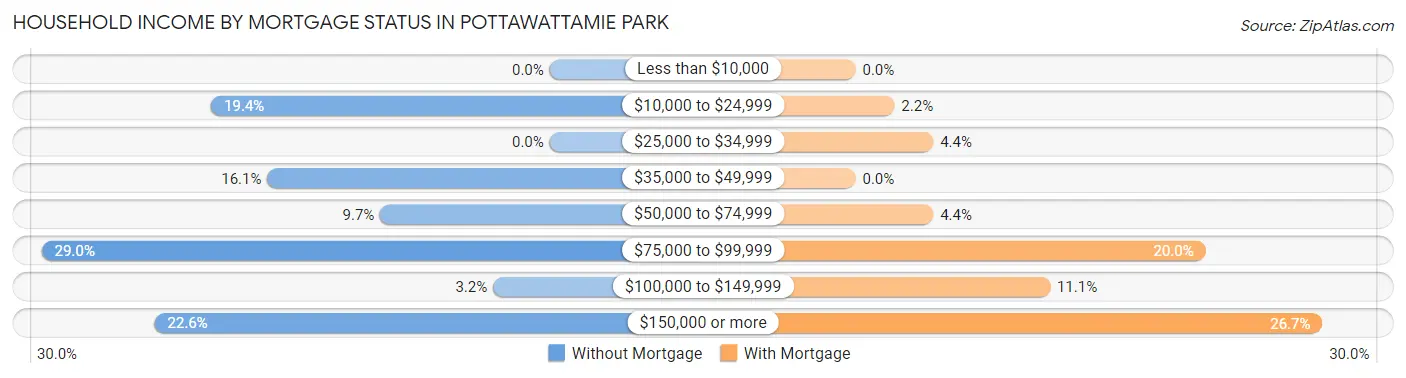
| Household Income | Without Mortgage | With Mortgage |
| Less than $10,000 | 0 (0.0%) | 0 (0.0%) |
| $10,000 to $24,999 | 6 (19.4%) | 2 (2.2%) |
| $25,000 to $34,999 | 0 (0.0%) | 4 (4.4%) |
| $35,000 to $49,999 | 5 (16.1%) | 0 (0.0%) |
| $50,000 to $74,999 | 3 (9.7%) | 4 (4.4%) |
| $75,000 to $99,999 | 9 (29.0%) | 18 (20.0%) |
| $100,000 to $149,999 | 1 (3.2%) | 10 (11.1%) |
| $150,000 or more | 7 (22.6%) | 24 (26.7%) |
| Total | 31 (100.0%) | 90 (100.0%) |
Property Value to Household Income Ratio in Pottawattamie Park
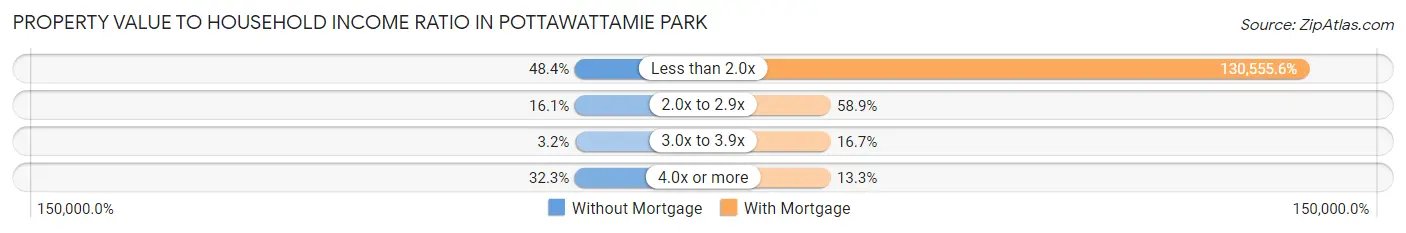
| Value-to-Income Ratio | Without Mortgage | With Mortgage |
| Less than 2.0x | 15 (48.4%) | 117,500 (130,555.6%) |
| 2.0x to 2.9x | 5 (16.1%) | 53 (58.9%) |
| 3.0x to 3.9x | 1 (3.2%) | 15 (16.7%) |
| 4.0x or more | 10 (32.3%) | 12 (13.3%) |
| Total | 31 (100.0%) | 90 (100.0%) |
Real Estate Taxes by Mortgage Status in Pottawattamie Park
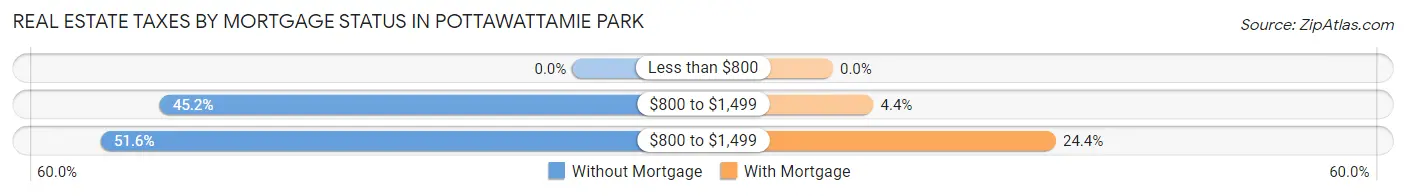
| Property Taxes | Without Mortgage | With Mortgage |
| Less than $800 | 0 (0.0%) | 0 (0.0%) |
| $800 to $1,499 | 14 (45.2%) | 4 (4.4%) |
| $800 to $1,499 | 16 (51.6%) | 22 (24.4%) |
| Total | 31 (100.0%) | 90 (100.0%) |
Health & Disability in Pottawattamie Park
Health Insurance Coverage by Age in Pottawattamie Park
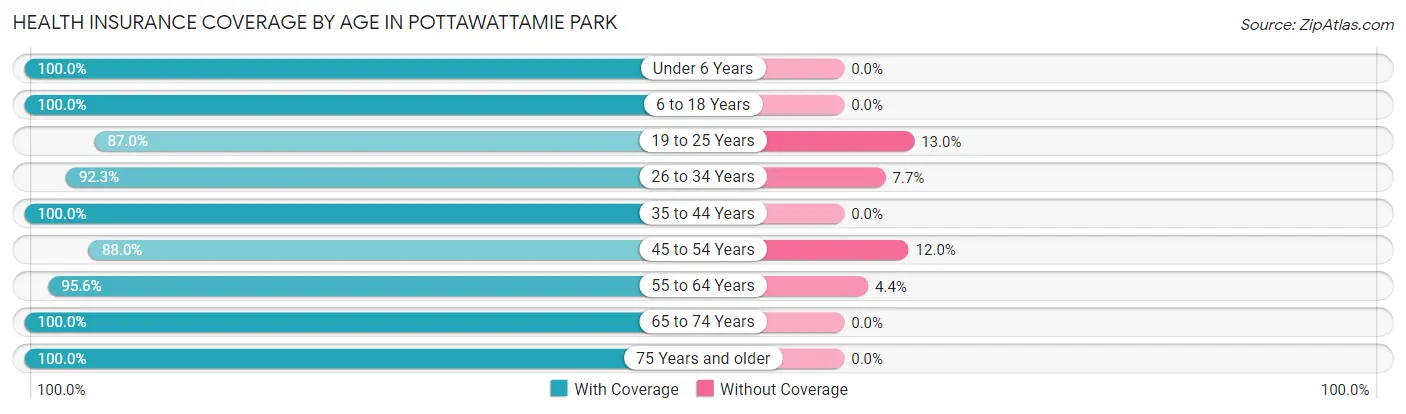
| Age Bracket | With Coverage | Without Coverage |
| Under 6 Years | 19 (100.0%) | 0 (0.0%) |
| 6 to 18 Years | 42 (100.0%) | 0 (0.0%) |
| 19 to 25 Years | 20 (87.0%) | 3 (13.0%) |
| 26 to 34 Years | 24 (92.3%) | 2 (7.7%) |
| 35 to 44 Years | 45 (100.0%) | 0 (0.0%) |
| 45 to 54 Years | 44 (88.0%) | 6 (12.0%) |
| 55 to 64 Years | 43 (95.6%) | 2 (4.4%) |
| 65 to 74 Years | 26 (100.0%) | 0 (0.0%) |
| 75 Years and older | 39 (100.0%) | 0 (0.0%) |
| Total | 302 (95.9%) | 13 (4.1%) |
Health Insurance Coverage by Citizenship Status in Pottawattamie Park
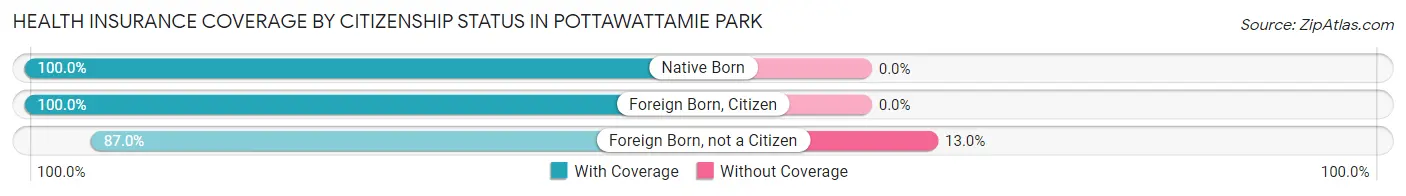
| Citizenship Status | With Coverage | Without Coverage |
| Native Born | 19 (100.0%) | 0 (0.0%) |
| Foreign Born, Citizen | 42 (100.0%) | 0 (0.0%) |
| Foreign Born, not a Citizen | 20 (87.0%) | 3 (13.0%) |
Health Insurance Coverage by Household Income in Pottawattamie Park
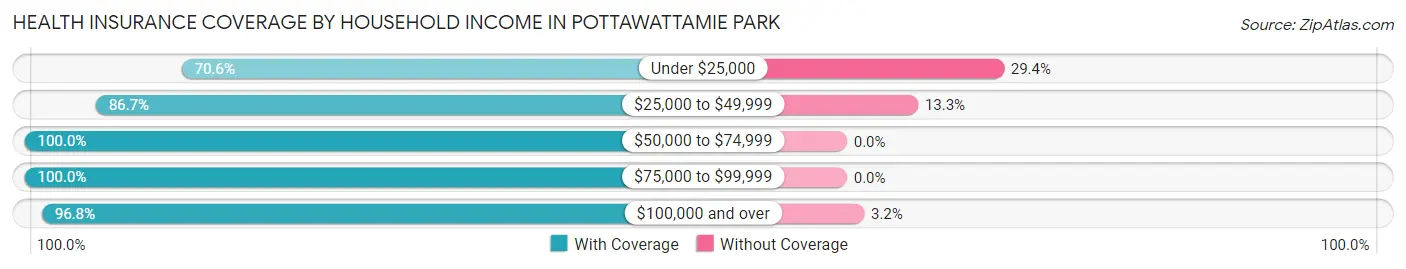
| Household Income | With Coverage | Without Coverage |
| Under $25,000 | 12 (70.6%) | 5 (29.4%) |
| $25,000 to $49,999 | 13 (86.7%) | 2 (13.3%) |
| $50,000 to $74,999 | 62 (100.0%) | 0 (0.0%) |
| $75,000 to $99,999 | 25 (100.0%) | 0 (0.0%) |
| $100,000 and over | 180 (96.8%) | 6 (3.2%) |
Public vs Private Health Insurance Coverage by Age in Pottawattamie Park
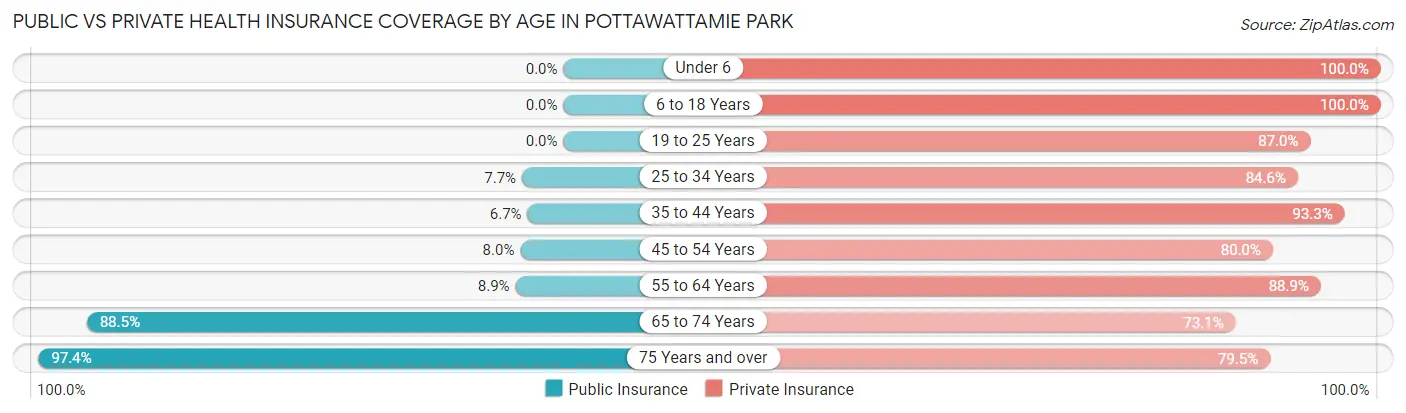
| Age Bracket | Public Insurance | Private Insurance |
| Under 6 | 0 (0.0%) | 19 (100.0%) |
| 6 to 18 Years | 0 (0.0%) | 42 (100.0%) |
| 19 to 25 Years | 0 (0.0%) | 20 (87.0%) |
| 25 to 34 Years | 2 (7.7%) | 22 (84.6%) |
| 35 to 44 Years | 3 (6.7%) | 42 (93.3%) |
| 45 to 54 Years | 4 (8.0%) | 40 (80.0%) |
| 55 to 64 Years | 4 (8.9%) | 40 (88.9%) |
| 65 to 74 Years | 23 (88.5%) | 19 (73.1%) |
| 75 Years and over | 38 (97.4%) | 31 (79.5%) |
| Total | 74 (23.5%) | 275 (87.3%) |
Disability Status by Sex by Age in Pottawattamie Park
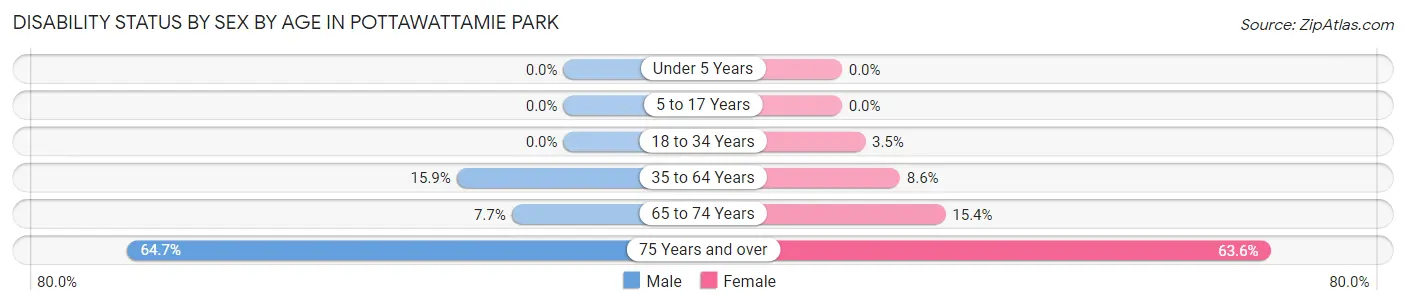
| Age Bracket | Male | Female |
| Under 5 Years | 0 (0.0%) | 0 (0.0%) |
| 5 to 17 Years | 0 (0.0%) | 0 (0.0%) |
| 18 to 34 Years | 0 (0.0%) | 1 (3.5%) |
| 35 to 64 Years | 13 (15.9%) | 5 (8.6%) |
| 65 to 74 Years | 1 (7.7%) | 2 (15.4%) |
| 75 Years and over | 11 (64.7%) | 14 (63.6%) |
Disability Class by Sex by Age in Pottawattamie Park
Disability Class: Hearing Difficulty
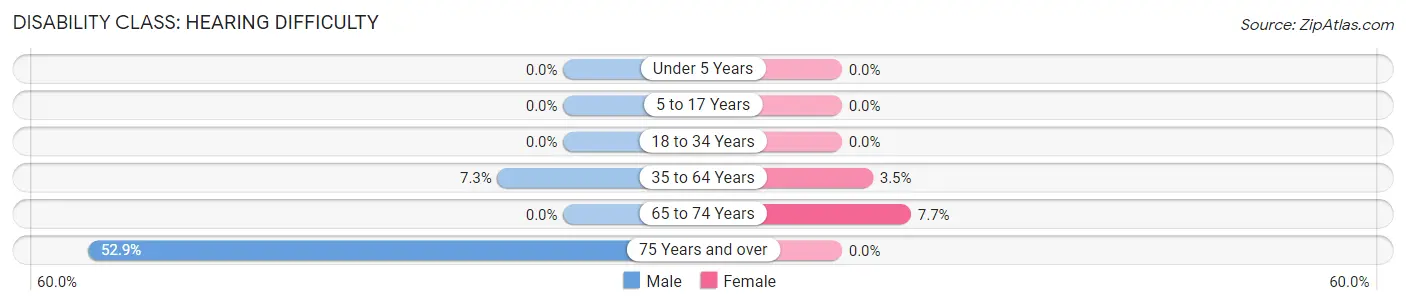
| Age Bracket | Male | Female |
| Under 5 Years | 0 (0.0%) | 0 (0.0%) |
| 5 to 17 Years | 0 (0.0%) | 0 (0.0%) |
| 18 to 34 Years | 0 (0.0%) | 0 (0.0%) |
| 35 to 64 Years | 6 (7.3%) | 2 (3.5%) |
| 65 to 74 Years | 0 (0.0%) | 1 (7.7%) |
| 75 Years and over | 9 (52.9%) | 0 (0.0%) |
Disability Class: Vision Difficulty
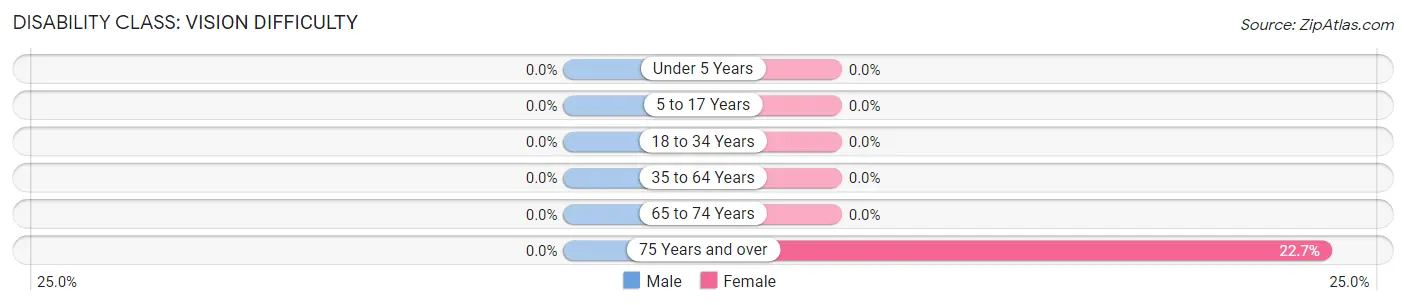
| Age Bracket | Male | Female |
| Under 5 Years | 0 (0.0%) | 0 (0.0%) |
| 5 to 17 Years | 0 (0.0%) | 0 (0.0%) |
| 18 to 34 Years | 0 (0.0%) | 0 (0.0%) |
| 35 to 64 Years | 0 (0.0%) | 0 (0.0%) |
| 65 to 74 Years | 0 (0.0%) | 0 (0.0%) |
| 75 Years and over | 0 (0.0%) | 5 (22.7%) |
Disability Class: Cognitive Difficulty
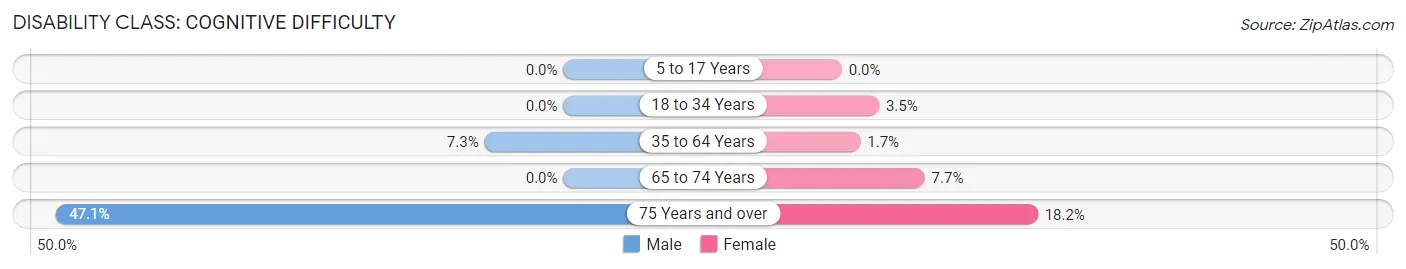
| Age Bracket | Male | Female |
| 5 to 17 Years | 0 (0.0%) | 0 (0.0%) |
| 18 to 34 Years | 0 (0.0%) | 1 (3.5%) |
| 35 to 64 Years | 6 (7.3%) | 1 (1.7%) |
| 65 to 74 Years | 0 (0.0%) | 1 (7.7%) |
| 75 Years and over | 8 (47.1%) | 4 (18.2%) |
Disability Class: Ambulatory Difficulty
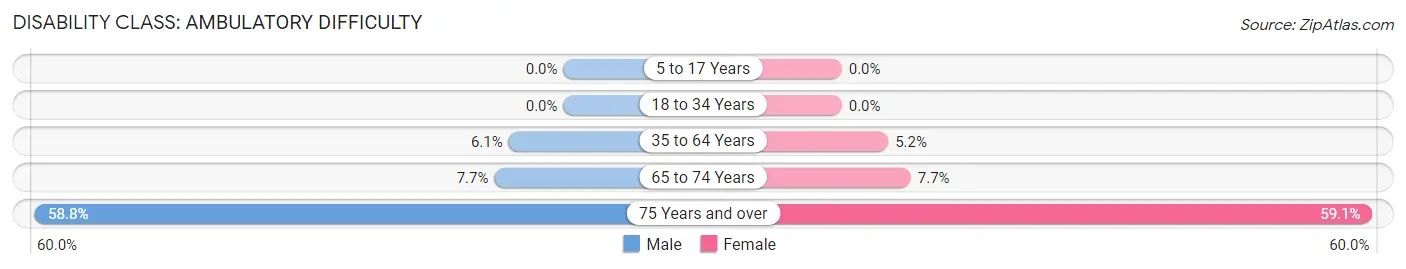
| Age Bracket | Male | Female |
| 5 to 17 Years | 0 (0.0%) | 0 (0.0%) |
| 18 to 34 Years | 0 (0.0%) | 0 (0.0%) |
| 35 to 64 Years | 5 (6.1%) | 3 (5.2%) |
| 65 to 74 Years | 1 (7.7%) | 1 (7.7%) |
| 75 Years and over | 10 (58.8%) | 13 (59.1%) |
Disability Class: Self-Care Difficulty
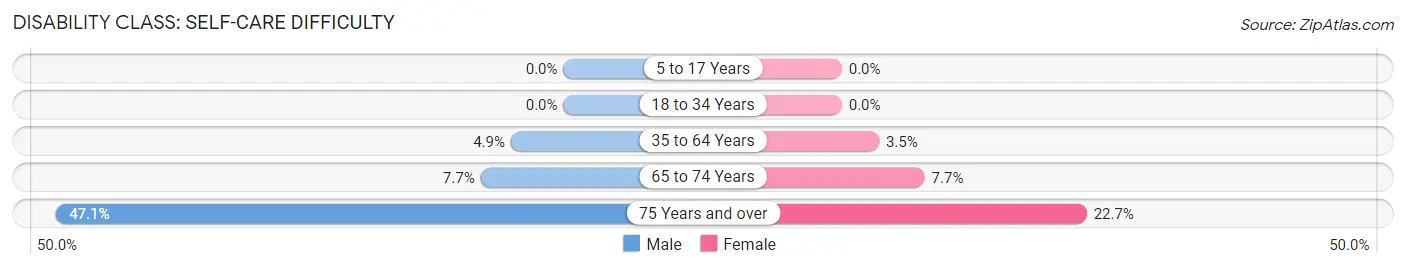
| Age Bracket | Male | Female |
| 5 to 17 Years | 0 (0.0%) | 0 (0.0%) |
| 18 to 34 Years | 0 (0.0%) | 0 (0.0%) |
| 35 to 64 Years | 4 (4.9%) | 2 (3.5%) |
| 65 to 74 Years | 1 (7.7%) | 1 (7.7%) |
| 75 Years and over | 8 (47.1%) | 5 (22.7%) |
Technology Access in Pottawattamie Park
Computing Device Access in Pottawattamie Park
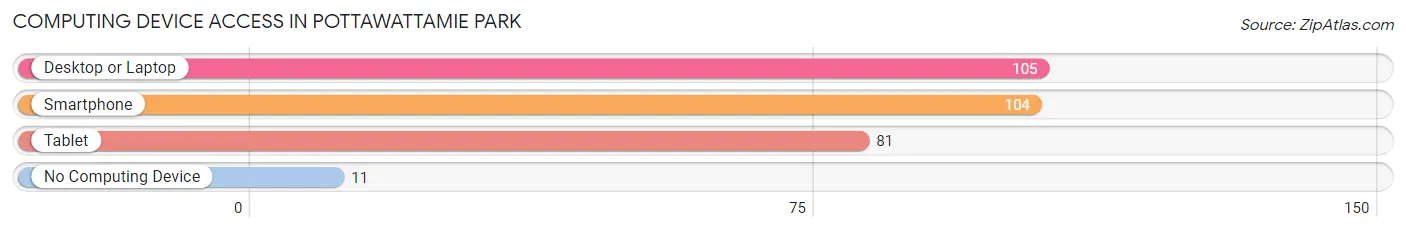
| Device Type | # Households | % Households |
| Desktop or Laptop | 105 | 84.0% |
| Smartphone | 104 | 83.2% |
| Tablet | 81 | 64.8% |
| No Computing Device | 11 | 8.8% |
| Total | 125 | 100.0% |
Internet Access in Pottawattamie Park
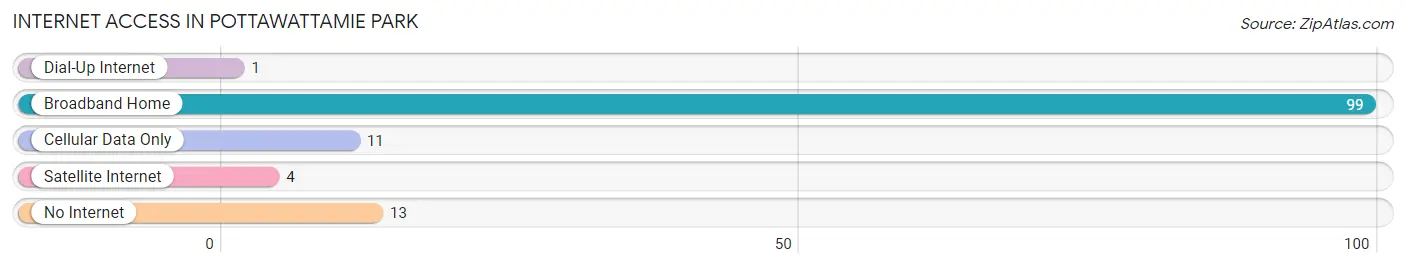
| Internet Type | # Households | % Households |
| Dial-Up Internet | 1 | 0.8% |
| Broadband Home | 99 | 79.2% |
| Cellular Data Only | 11 | 8.8% |
| Satellite Internet | 4 | 3.2% |
| No Internet | 13 | 10.4% |
| Total | 125 | 100.0% |
Pottawattamie Park Summary
Pottawattamie Park is a small town located in Porter County, Indiana, United States. The population was 1,845 at the 2010 census. It is part of the Valparaiso, IN Metropolitan Statistical Area.
History
Pottawattamie Park was founded in 1836 by a group of settlers from New York. The town was named after the Pottawatomie Native American tribe, which had inhabited the area prior to the settlers’ arrival. The town was originally a farming community, but in the late 19th century, it began to develop into a resort town. The town was known for its natural beauty and its proximity to Lake Michigan.
In the early 20th century, the town began to attract more visitors, and the population began to grow. The town was incorporated in 1921, and the first mayor was elected in 1922.
In the 1950s, the town began to experience a decline in population as people moved away to larger cities. However, in the late 1970s, the town began to experience a resurgence in population as people began to move back to the area.
Geography
Pottawattamie Park is located in Porter County, Indiana, United States. The town is situated on the shores of Lake Michigan, and is bordered by the towns of Chesterton, Porter, and Burns Harbor. The town is located approximately 40 miles east of Chicago, and is part of the Valparaiso, IN Metropolitan Statistical Area.
The town has a total area of 1.2 square miles, all of which is land. The town is located at an elevation of 645 feet above sea level.
Economy
The economy of Pottawattamie Park is largely based on tourism. The town is home to several resorts and hotels, as well as a variety of restaurants and shops. The town is also home to a number of small businesses, including a marina, a golf course, and a winery.
Demographics
As of the 2010 census, there were 1,845 people, 745 households, and 486 families residing in the town. The population density was 1,541.7 people per square mile. The racial makeup of the town was 94.3% White, 0.7% African American, 0.2% Native American, 0.7% Asian, 0.1% Pacific Islander, 1.7% from other races, and 2.1% from two or more races. Hispanic or Latino of any race were 4.2% of the population.
The median income for a household in the town was $45,000, and the median income for a family was $50,000. The per capita income for the town was $20,000. About 8.3% of families and 10.2% of the population were below the poverty line, including 14.2% of those under age 18 and 5.2% of those age 65 or over.
Common Questions
What is Per Capita Income in Pottawattamie Park?
Per Capita income in Pottawattamie Park is $50,887.
What is the Median Family Income in Pottawattamie Park?
Median Family Income in Pottawattamie Park is $120,938.
What is the Median Household income in Pottawattamie Park?
Median Household Income in Pottawattamie Park is $96,719.
What is Income or Wage Gap in Pottawattamie Park?
Income or Wage Gap in Pottawattamie Park is 54.3%.
Women in Pottawattamie Park earn 45.7 cents for every dollar earned by a man.
What is Inequality or Gini Index in Pottawattamie Park?
Inequality or Gini Index in Pottawattamie Park is 0.41.
What is the Total Population of Pottawattamie Park?
Total Population of Pottawattamie Park is 317.
What is the Total Male Population of Pottawattamie Park?
Total Male Population of Pottawattamie Park is 175.
What is the Total Female Population of Pottawattamie Park?
Total Female Population of Pottawattamie Park is 142.
What is the Ratio of Males per 100 Females in Pottawattamie Park?
There are 123.24 Males per 100 Females in Pottawattamie Park.
What is the Ratio of Females per 100 Males in Pottawattamie Park?
There are 81.14 Females per 100 Males in Pottawattamie Park.
What is the Median Population Age in Pottawattamie Park?
Median Population Age in Pottawattamie Park is 45.3 Years.
What is the Average Family Size in Pottawattamie Park
Average Family Size in Pottawattamie Park is 3.1 People.
What is the Average Household Size in Pottawattamie Park
Average Household Size in Pottawattamie Park is 2.5 People.
How Large is the Labor Force in Pottawattamie Park?
There are 191 People in the Labor Forcein in Pottawattamie Park.
What is the Percentage of People in the Labor Force in Pottawattamie Park?
68.7% of People are in the Labor Force in Pottawattamie Park.
What is the Unemployment Rate in Pottawattamie Park?
Unemployment Rate in Pottawattamie Park is 2.1%.