Kicking Horse, MT Map & Demographics
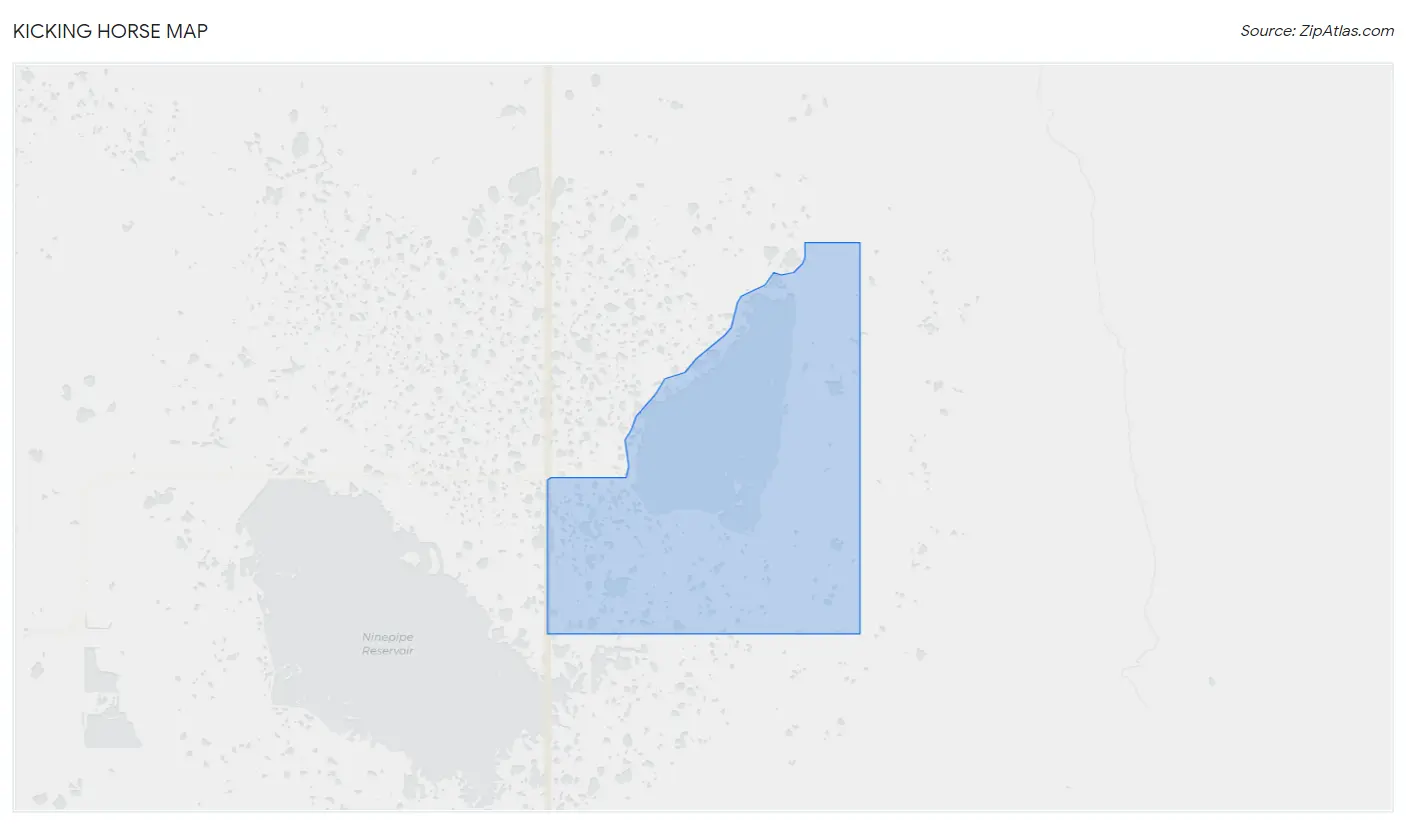
Kicking Horse Map
Kicking Horse Overview
$40,878
PER CAPITA INCOME
$74,357
AVG FAMILY INCOME
$74,036
AVG HOUSEHOLD INCOME
0.17
INEQUALITY / GINI INDEX
106
TOTAL POPULATION
56
MALE POPULATION
50
FEMALE POPULATION
112.00
MALES / 100 FEMALES
89.29
FEMALES / 100 MALES
63.5
MEDIAN AGE
1.9
AVG FAMILY SIZE
1.7
AVG HOUSEHOLD SIZE
79
LABOR FORCE [ PEOPLE ]
74.5%
PERCENT IN LABOR FORCE
Income in Kicking Horse
Income Overview in Kicking Horse
Per Capita Income in Kicking Horse is $40,878, while median incomes of families and households are $74,357 and $74,036 respectively.
| Characteristic | Number | Measure |
| Per Capita Income | 106 | $40,878 |
| Median Family Income | 52 | $74,357 |
| Mean Family Income | 52 | $81,867 |
| Median Household Income | 61 | $74,036 |
| Mean Household Income | 61 | $72,605 |
| Income Deficit | 52 | $0 |
| Wage / Income Gap (%) | 106 | 0.00% |
| Wage / Income Gap ($) | 106 | 100.00¢ per $1 |
| Gini / Inequality Index | 106 | 0.17 |
Earnings by Sex in Kicking Horse
| Sex | Number | Average Earnings |
| Male | 37 (46.8%) | $0 |
| Female | 42 (53.2%) | $0 |
| Total | 79 (100.0%) | $0 |
Earnings by Sex by Income Bracket in Kicking Horse
The most common earnings brackets in Kicking Horse are $10,000 to $12,499 for men (28 | 75.7%) and $50,000 to $54,999 for women (35 | 83.3%).
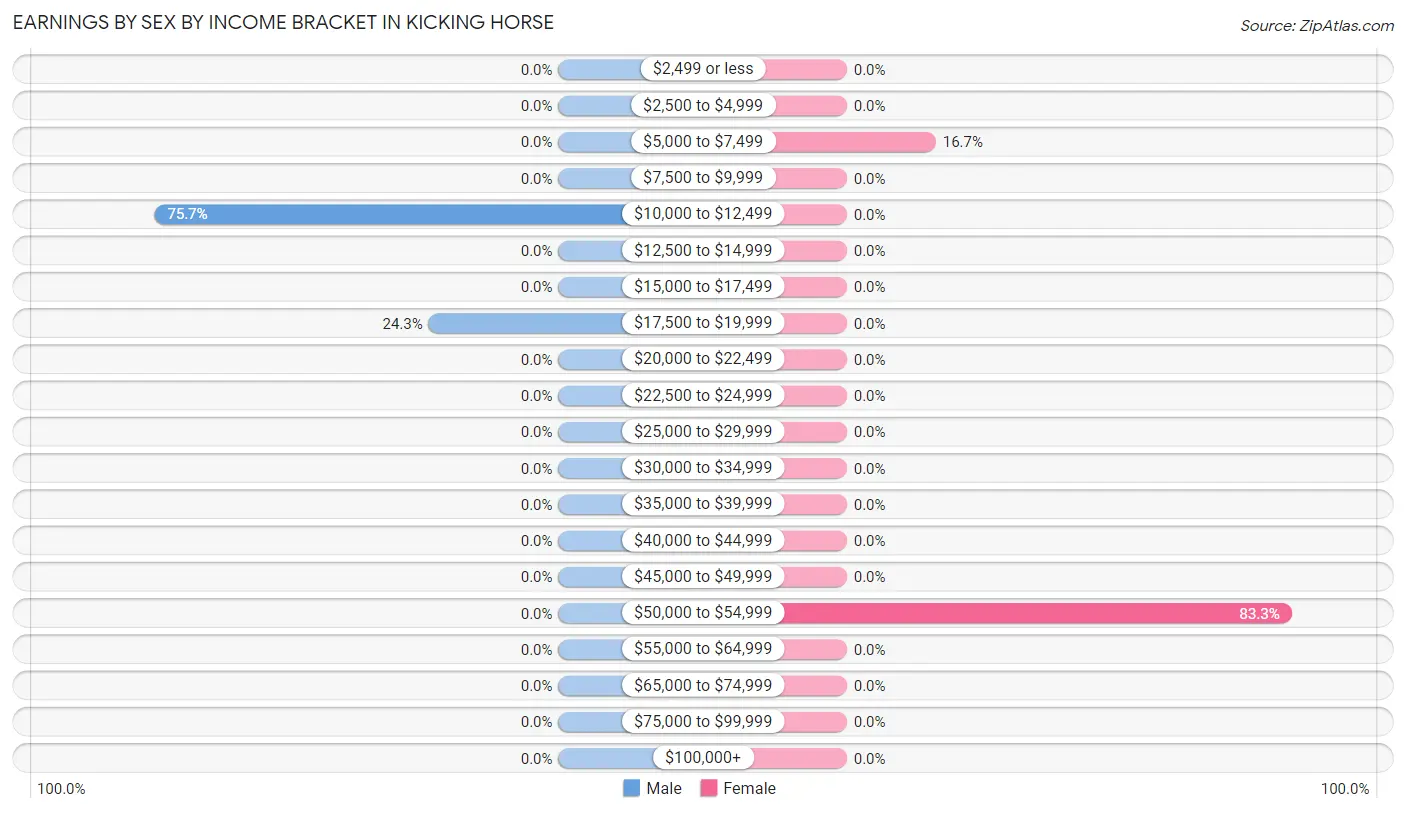
| Income | Male | Female |
| $2,499 or less | 0 (0.0%) | 0 (0.0%) |
| $2,500 to $4,999 | 0 (0.0%) | 0 (0.0%) |
| $5,000 to $7,499 | 0 (0.0%) | 7 (16.7%) |
| $7,500 to $9,999 | 0 (0.0%) | 0 (0.0%) |
| $10,000 to $12,499 | 28 (75.7%) | 0 (0.0%) |
| $12,500 to $14,999 | 0 (0.0%) | 0 (0.0%) |
| $15,000 to $17,499 | 0 (0.0%) | 0 (0.0%) |
| $17,500 to $19,999 | 9 (24.3%) | 0 (0.0%) |
| $20,000 to $22,499 | 0 (0.0%) | 0 (0.0%) |
| $22,500 to $24,999 | 0 (0.0%) | 0 (0.0%) |
| $25,000 to $29,999 | 0 (0.0%) | 0 (0.0%) |
| $30,000 to $34,999 | 0 (0.0%) | 0 (0.0%) |
| $35,000 to $39,999 | 0 (0.0%) | 0 (0.0%) |
| $40,000 to $44,999 | 0 (0.0%) | 0 (0.0%) |
| $45,000 to $49,999 | 0 (0.0%) | 0 (0.0%) |
| $50,000 to $54,999 | 0 (0.0%) | 35 (83.3%) |
| $55,000 to $64,999 | 0 (0.0%) | 0 (0.0%) |
| $65,000 to $74,999 | 0 (0.0%) | 0 (0.0%) |
| $75,000 to $99,999 | 0 (0.0%) | 0 (0.0%) |
| $100,000+ | 0 (0.0%) | 0 (0.0%) |
| Total | 37 (100.0%) | 42 (100.0%) |
Earnings by Sex by Educational Attainment in Kicking Horse
| Educational Attainment | Male Income | Female Income |
| Less than High School | - | - |
| High School Diploma | - | - |
| College or Associate's Degree | - | - |
| Bachelor's Degree | - | - |
| Graduate Degree | - | - |
| Total | - | - |
Family Income in Kicking Horse
Family Income Brackets in Kicking Horse
According to the Kicking Horse family income data, there are 35 families falling into the $50,000 to $74,999 income range, which is the most common income bracket and makes up 67.3% of all families.
| Income Bracket | # Families | % Families |
| Less than $10,000 | 0 | 0.0% |
| $10,000 to $14,999 | 0 | 0.0% |
| $15,000 to $24,999 | 0 | 0.0% |
| $25,000 to $34,999 | 0 | 0.0% |
| $35,000 to $49,999 | 0 | 0.0% |
| $50,000 to $74,999 | 35 | 67.3% |
| $75,000 to $99,999 | 10 | 19.2% |
| $100,000 to $149,999 | 7 | 13.5% |
| $150,000 to $199,999 | 0 | 0.0% |
| $200,000+ | 0 | 0.0% |
Family Income by Famaliy Size in Kicking Horse
2-person families (52 | 100.0%) account for the highest median family income in Kicking Horse with $74,357 per family, while 2-person families (52 | 100.0%) have the highest median income of $37,178 per family member.
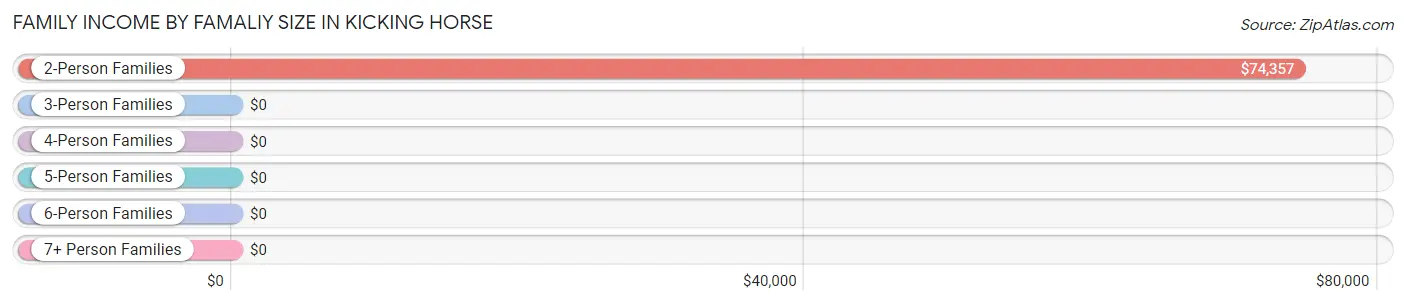
| Income Bracket | # Families | Median Income |
| 2-Person Families | 52 (100.0%) | $74,357 |
| 3-Person Families | 0 (0.0%) | $0 |
| 4-Person Families | 0 (0.0%) | $0 |
| 5-Person Families | 0 (0.0%) | $0 |
| 6-Person Families | 0 (0.0%) | $0 |
| 7+ Person Families | 0 (0.0%) | $0 |
| Total | 52 (100.0%) | $74,357 |
Family Income by Number of Earners in Kicking Horse
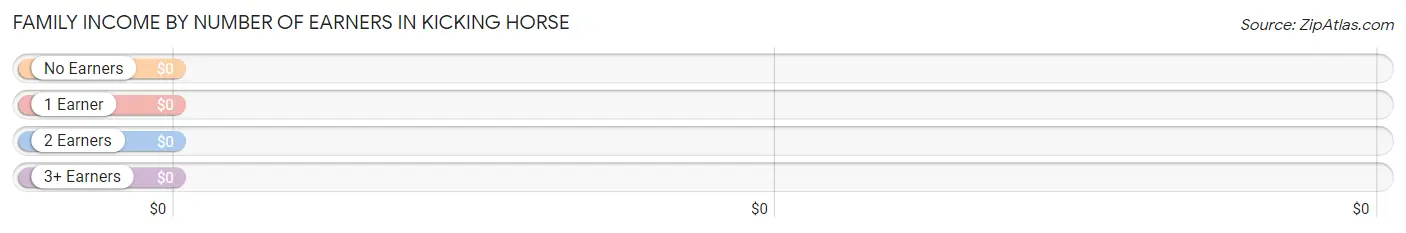
| Number of Earners | # Families | Median Income |
| No Earners | 10 (19.2%) | $0 |
| 1 Earner | 7 (13.5%) | $0 |
| 2 Earners | 35 (67.3%) | $0 |
| 3+ Earners | 0 (0.0%) | $0 |
| Total | 52 (100.0%) | $74,357 |
Household Income in Kicking Horse
Household Income Brackets in Kicking Horse
With 35 households falling in the category, the $50,000 to $74,999 income range is the most frequent in Kicking Horse, accounting for 57.4% of all households.
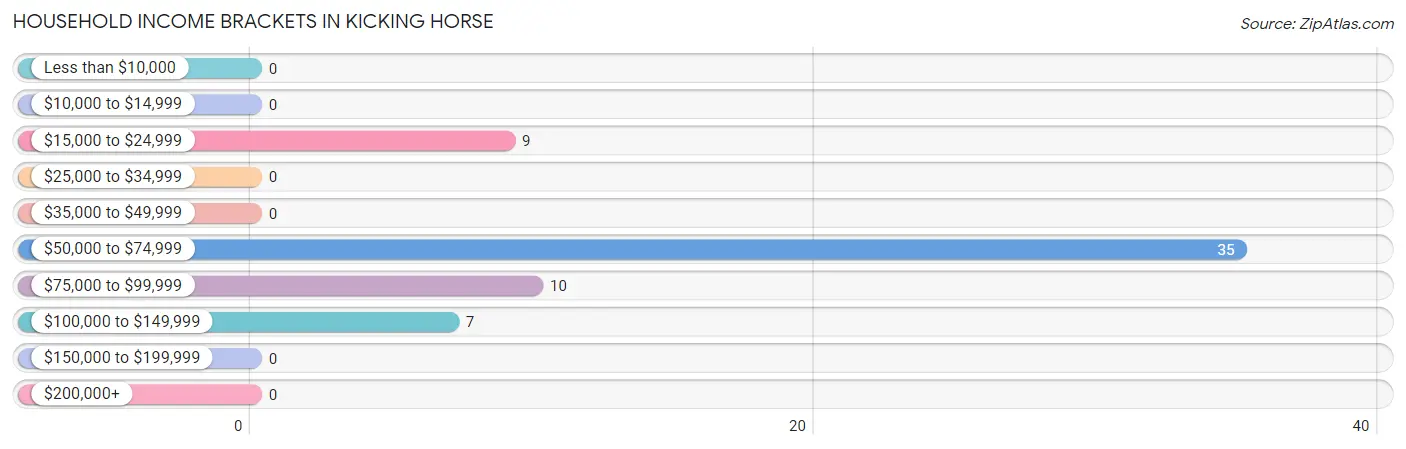
| Income Bracket | # Households | % Households |
| Less than $10,000 | 0 | 0.0% |
| $10,000 to $14,999 | 0 | 0.0% |
| $15,000 to $24,999 | 9 | 14.8% |
| $25,000 to $34,999 | 0 | 0.0% |
| $35,000 to $49,999 | 0 | 0.0% |
| $50,000 to $74,999 | 35 | 57.4% |
| $75,000 to $99,999 | 10 | 16.4% |
| $100,000 to $149,999 | 7 | 11.5% |
| $150,000 to $199,999 | 0 | 0.0% |
| $200,000+ | 0 | 0.0% |
Household Income by Householder Age in Kicking Horse
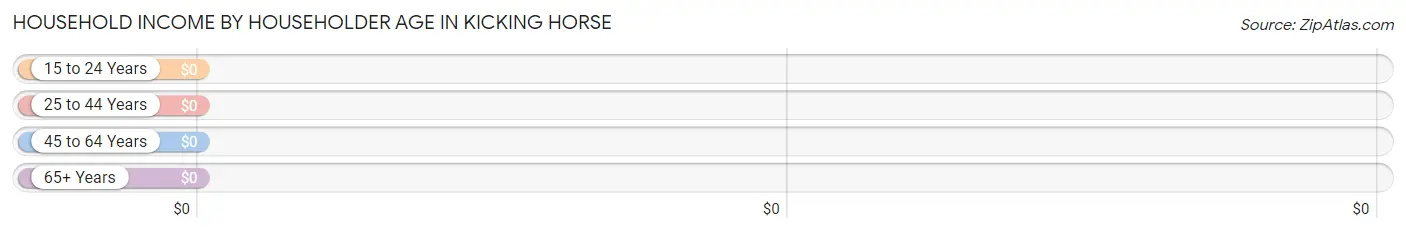
| Income Bracket | # Households | Median Income |
| 15 to 24 Years | 0 (0.0%) | $0 |
| 25 to 44 Years | 9 (14.7%) | $0 |
| 45 to 64 Years | 35 (57.4%) | $0 |
| 65+ Years | 17 (27.9%) | $0 |
| Total | 61 (100.0%) | $74,036 |
Poverty in Kicking Horse
Income Below Poverty by Sex and Age in Kicking Horse
| Age Bracket | Male | Female |
| Under 5 Years | 0 (0.0%) | 0 (0.0%) |
| 5 Years | 0 (0.0%) | 0 (0.0%) |
| 6 to 11 Years | 0 (0.0%) | 0 (0.0%) |
| 12 to 14 Years | 0 (0.0%) | 0 (0.0%) |
| 15 Years | 0 (0.0%) | 0 (0.0%) |
| 16 and 17 Years | 0 (0.0%) | 0 (0.0%) |
| 18 to 24 Years | 0 (0.0%) | 0 (0.0%) |
| 25 to 34 Years | 0 (0.0%) | 0 (0.0%) |
| 35 to 44 Years | 0 (0.0%) | 0 (0.0%) |
| 45 to 54 Years | 0 (0.0%) | 0 (0.0%) |
| 55 to 64 Years | 0 (0.0%) | 0 (0.0%) |
| 65 to 74 Years | 0 (0.0%) | 0 (0.0%) |
| 75 Years and over | 0 (0.0%) | 0 (0.0%) |
| Total | 0 (0.0%) | 0 (0.0%) |
Income Above Poverty by Sex and Age in Kicking Horse
According to the poverty statistics in Kicking Horse, males aged 25 to 34 years and females aged 55 to 64 years are the age groups that are most secure financially, with 100.0% of males and 100.0% of females in these age groups living above the poverty line.
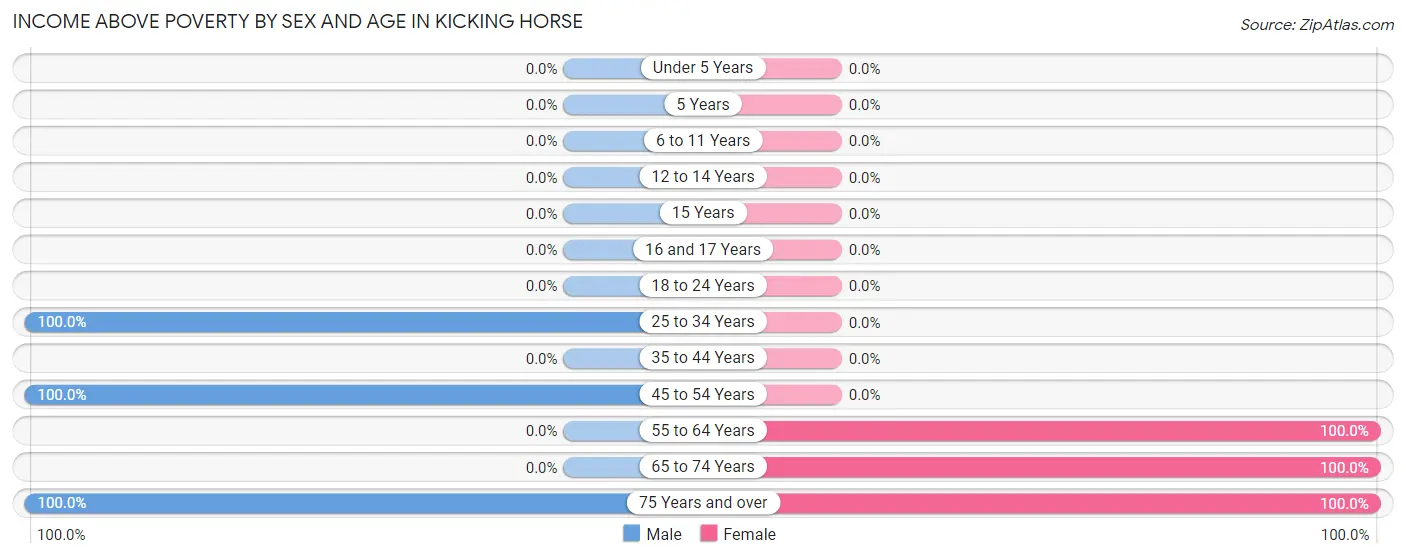
| Age Bracket | Male | Female |
| Under 5 Years | 0 (0.0%) | 0 (0.0%) |
| 5 Years | 0 (0.0%) | 0 (0.0%) |
| 6 to 11 Years | 0 (0.0%) | 0 (0.0%) |
| 12 to 14 Years | 0 (0.0%) | 0 (0.0%) |
| 15 Years | 0 (0.0%) | 0 (0.0%) |
| 16 and 17 Years | 0 (0.0%) | 0 (0.0%) |
| 18 to 24 Years | 0 (0.0%) | 0 (0.0%) |
| 25 to 34 Years | 9 (100.0%) | 0 (0.0%) |
| 35 to 44 Years | 0 (0.0%) | 0 (0.0%) |
| 45 to 54 Years | 28 (100.0%) | 0 (0.0%) |
| 55 to 64 Years | 0 (0.0%) | 35 (100.0%) |
| 65 to 74 Years | 0 (0.0%) | 7 (100.0%) |
| 75 Years and over | 19 (100.0%) | 8 (100.0%) |
| Total | 56 (100.0%) | 50 (100.0%) |
Income Below Poverty Among Married-Couple Families in Kicking Horse
| Children | Above Poverty | Below Poverty |
| No Children | 52 (100.0%) | 0 (0.0%) |
| 1 or 2 Children | 0 (0.0%) | 0 (0.0%) |
| 3 or 4 Children | 0 (0.0%) | 0 (0.0%) |
| 5 or more Children | 0 (0.0%) | 0 (0.0%) |
| Total | 52 (100.0%) | 0 (0.0%) |
Income Below Poverty Among Single-Parent Households in Kicking Horse
| Children | Single Father | Single Mother |
| No Children | 0 (0.0%) | 0 (0.0%) |
| 1 or 2 Children | 0 (0.0%) | 0 (0.0%) |
| 3 or 4 Children | 0 (0.0%) | 0 (0.0%) |
| 5 or more Children | 0 (0.0%) | 0 (0.0%) |
| Total | 0 (0.0%) | 0 (0.0%) |
Income Below Poverty Among Married-Couple vs Single-Parent Households in Kicking Horse
| Children | Married-Couple Families | Single-Parent Households |
| No Children | 0 (0.0%) | 0 (0.0%) |
| 1 or 2 Children | 0 (0.0%) | 0 (0.0%) |
| 3 or 4 Children | 0 (0.0%) | 0 (0.0%) |
| 5 or more Children | 0 (0.0%) | 0 (0.0%) |
| Total | 0 (0.0%) | 0 (0.0%) |
Race in Kicking Horse
The most populous races in Kicking Horse are White / Caucasian (69 | 65.1%), Native / Alaskan (37 | 34.9%), and Hispanic or Latino (28 | 26.4%).
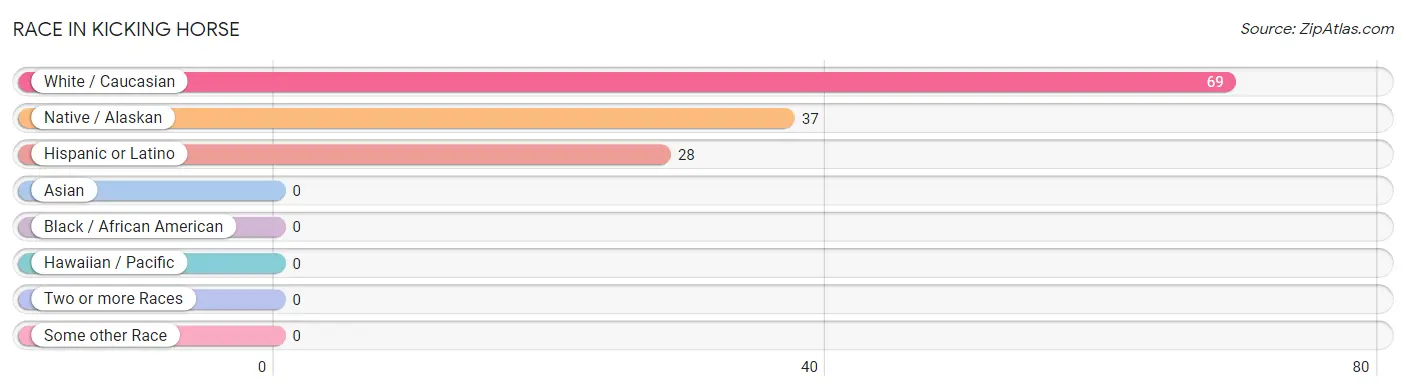
| Race | # Population | % Population |
| Asian | 0 | 0.0% |
| Black / African American | 0 | 0.0% |
| Hawaiian / Pacific | 0 | 0.0% |
| Hispanic or Latino | 28 | 26.4% |
| Native / Alaskan | 37 | 34.9% |
| White / Caucasian | 69 | 65.1% |
| Two or more Races | 0 | 0.0% |
| Some other Race | 0 | 0.0% |
| Total | 106 | 100.0% |
Ancestry in Kicking Horse
The most populous ancestries reported in Kicking Horse are Irish (43 | 40.6%), Norwegian (35 | 33.0%), Mexican (28 | 26.4%), German (10 | 9.4%), and Greek (10 | 9.4%), together accounting for 118.9% of all Kicking Horse residents.
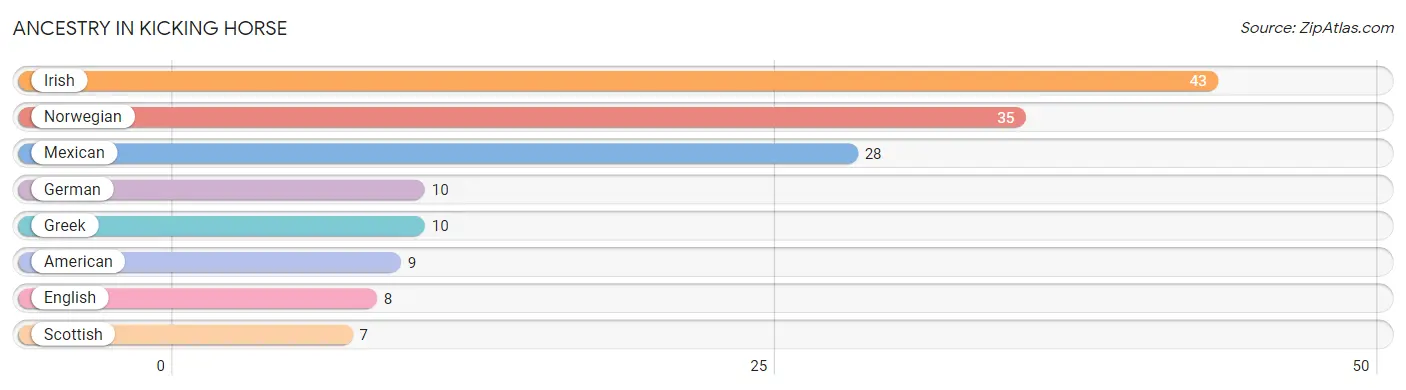
| Ancestry | # Population | % Population |
| American | 9 | 8.5% |
| English | 8 | 7.5% |
| German | 10 | 9.4% |
| Greek | 10 | 9.4% |
| Irish | 43 | 40.6% |
| Mexican | 28 | 26.4% |
| Norwegian | 35 | 33.0% |
| Scottish | 7 | 6.6% | View All 8 Rows |
Immigrants in Kicking Horse

| Immigration Origin | # Population | % Population | View All 0 Rows |
Sex and Age in Kicking Horse
Sex and Age in Kicking Horse
The most populous age groups in Kicking Horse are 45 to 49 Years (28 | 50.0%) for men and 60 to 64 Years (35 | 70.0%) for women.
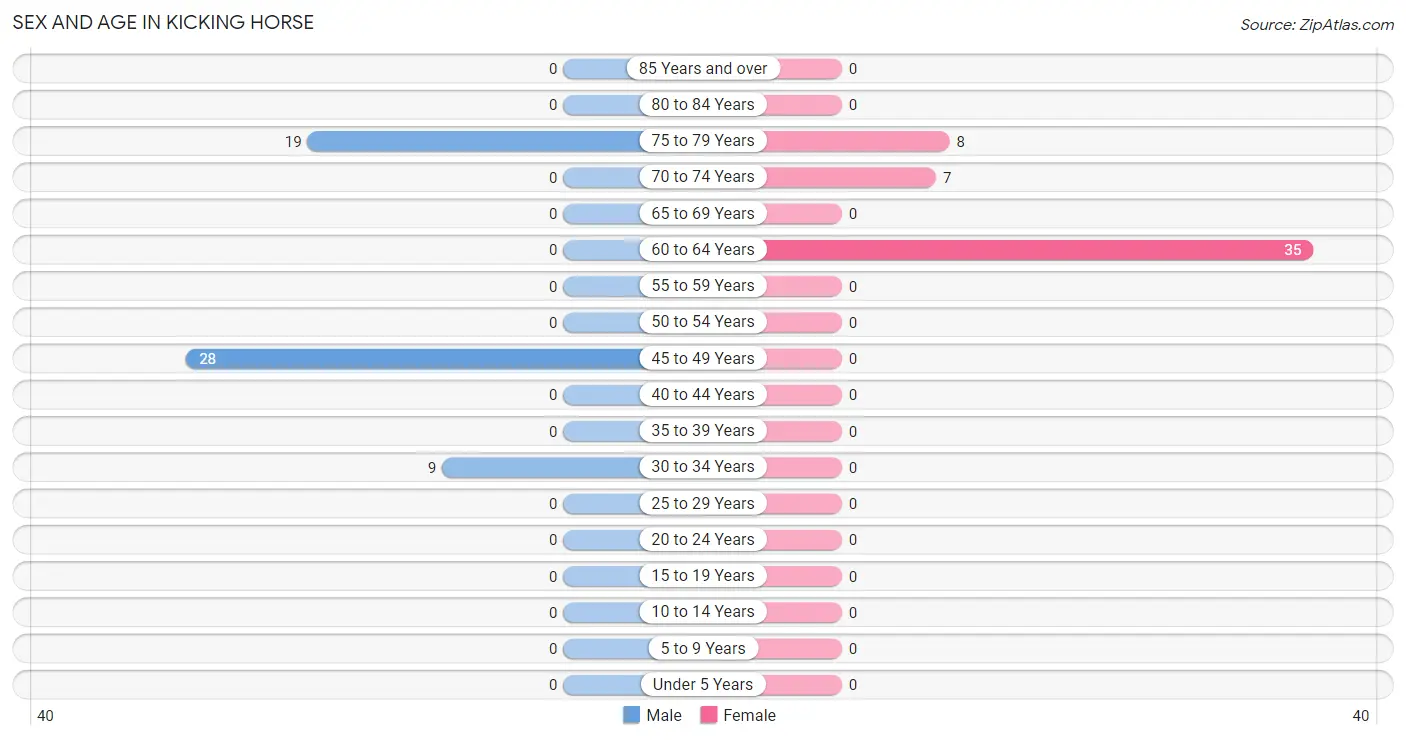
| Age Bracket | Male | Female |
| Under 5 Years | 0 (0.0%) | 0 (0.0%) |
| 5 to 9 Years | 0 (0.0%) | 0 (0.0%) |
| 10 to 14 Years | 0 (0.0%) | 0 (0.0%) |
| 15 to 19 Years | 0 (0.0%) | 0 (0.0%) |
| 20 to 24 Years | 0 (0.0%) | 0 (0.0%) |
| 25 to 29 Years | 0 (0.0%) | 0 (0.0%) |
| 30 to 34 Years | 9 (16.1%) | 0 (0.0%) |
| 35 to 39 Years | 0 (0.0%) | 0 (0.0%) |
| 40 to 44 Years | 0 (0.0%) | 0 (0.0%) |
| 45 to 49 Years | 28 (50.0%) | 0 (0.0%) |
| 50 to 54 Years | 0 (0.0%) | 0 (0.0%) |
| 55 to 59 Years | 0 (0.0%) | 0 (0.0%) |
| 60 to 64 Years | 0 (0.0%) | 35 (70.0%) |
| 65 to 69 Years | 0 (0.0%) | 0 (0.0%) |
| 70 to 74 Years | 0 (0.0%) | 7 (14.0%) |
| 75 to 79 Years | 19 (33.9%) | 8 (16.0%) |
| 80 to 84 Years | 0 (0.0%) | 0 (0.0%) |
| 85 Years and over | 0 (0.0%) | 0 (0.0%) |
| Total | 56 (100.0%) | 50 (100.0%) |
Families and Households in Kicking Horse
Median Family Size in Kicking Horse
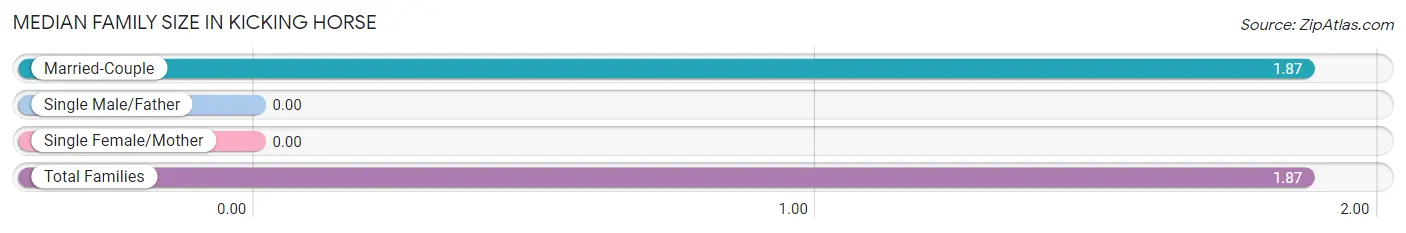
| Family Type | # Families | Family Size |
| Married-Couple | 52 (100.0%) | 1.87 |
| Single Male/Father | 0 (0.0%) | - |
| Single Female/Mother | 0 (0.0%) | - |
| Total Families | 52 (100.0%) | 1.87 |
Median Household Size in Kicking Horse
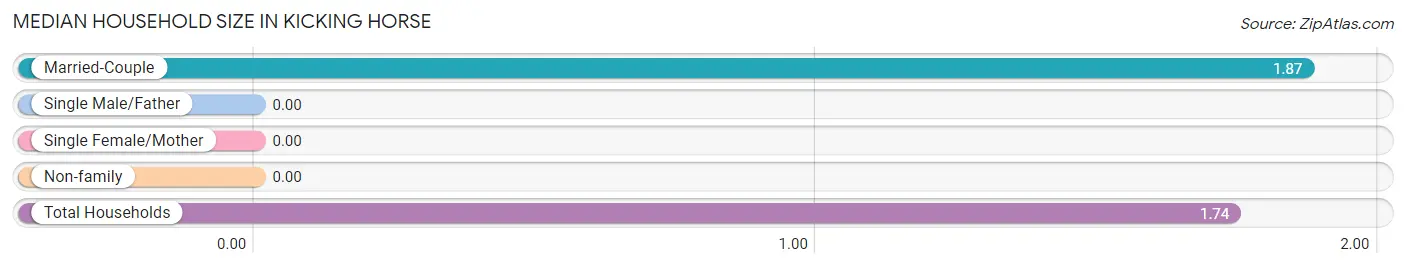
| Household Type | # Households | Household Size |
| Married-Couple | 52 (85.3%) | 1.87 |
| Single Male/Father | 0 (0.0%) | - |
| Single Female/Mother | 0 (0.0%) | - |
| Non-family | 9 (14.7%) | - |
| Total Households | 61 (100.0%) | 1.74 |
Household Size by Marriage Status in Kicking Horse
Out of a total of 61 households in Kicking Horse, 52 (85.3%) are family households, while 9 (14.7%) are nonfamily households. The most numerous type of family households are 2-person households, comprising 52, and the most common type of nonfamily households are 1-person households, comprising 9.
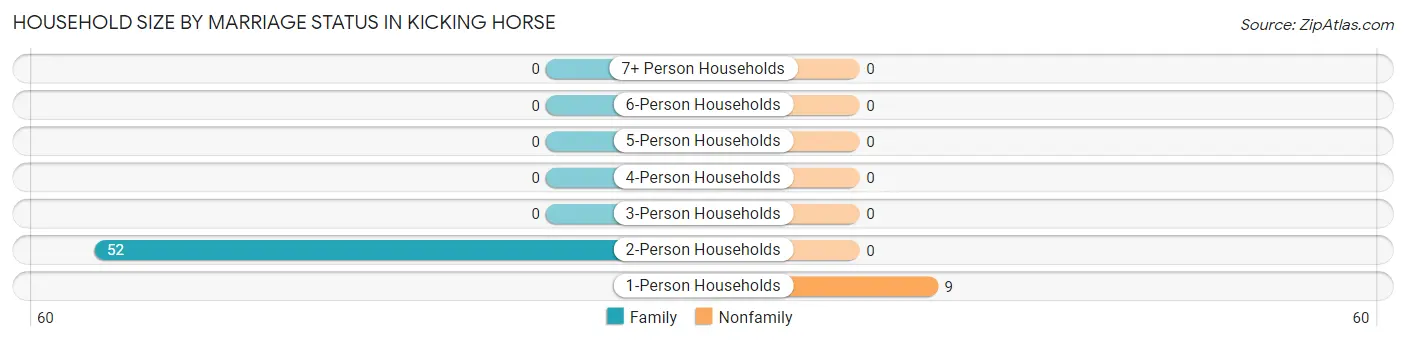
| Household Size | Family Households | Nonfamily Households |
| 1-Person Households | - | 9 (14.7%) |
| 2-Person Households | 52 (85.3%) | 0 (0.0%) |
| 3-Person Households | 0 (0.0%) | 0 (0.0%) |
| 4-Person Households | 0 (0.0%) | 0 (0.0%) |
| 5-Person Households | 0 (0.0%) | 0 (0.0%) |
| 6-Person Households | 0 (0.0%) | 0 (0.0%) |
| 7+ Person Households | 0 (0.0%) | 0 (0.0%) |
| Total | 52 (85.3%) | 9 (14.7%) |
Female Fertility in Kicking Horse
Fertility by Age in Kicking Horse
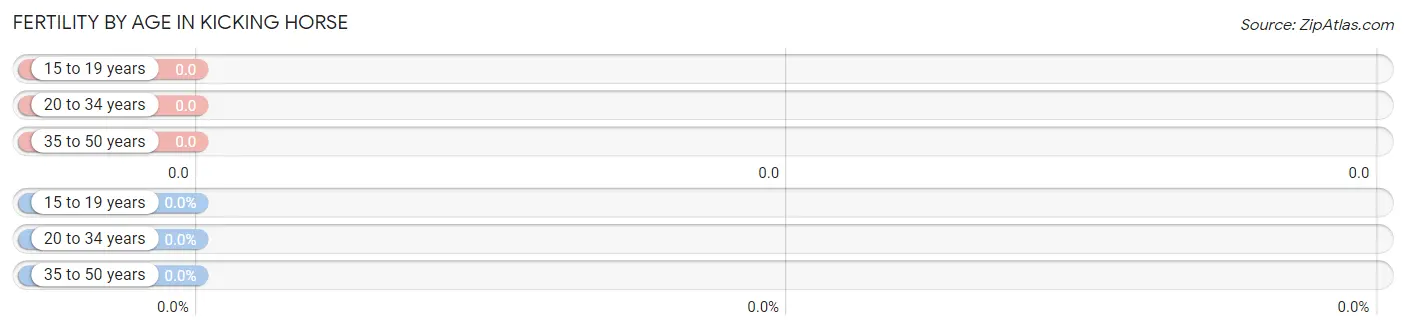
| Age Bracket | Women with Births | Births / 1,000 Women |
| 15 to 19 years | 0 (0.0%) | 0.0 |
| 20 to 34 years | 0 (0.0%) | 0.0 |
| 35 to 50 years | 0 (0.0%) | 0.0 |
| Total | 0 (0.0%) | 0.0 |
Fertility by Age by Marriage Status in Kicking Horse
| Age Bracket | Married | Unmarried |
| 15 to 19 years | 0 (0.0%) | 0 (0.0%) |
| 20 to 34 years | 0 (0.0%) | 0 (0.0%) |
| 35 to 50 years | 0 (0.0%) | 0 (0.0%) |
| Total | 0 (0.0%) | 0 (0.0%) |
Fertility by Education in Kicking Horse
| Educational Attainment | Women with Births | Births / 1,000 Women |
| Less than High School | 0 (0.0%) | 0.0 |
| High School Diploma | 0 (0.0%) | 0.0 |
| College or Associate's Degree | 0 (0.0%) | 0.0 |
| Bachelor's Degree | 0 (0.0%) | 0.0 |
| Graduate Degree | 0 (0.0%) | 0.0 |
| Total | 0 (0.0%) | 0.0 |
Fertility by Education by Marriage Status in Kicking Horse
| Educational Attainment | Married | Unmarried |
| Less than High School | 0 (0.0%) | 0 (0.0%) |
| High School Diploma | 0 (0.0%) | 0 (0.0%) |
| College or Associate's Degree | 0 (0.0%) | 0 (0.0%) |
| Bachelor's Degree | 0 (0.0%) | 0 (0.0%) |
| Graduate Degree | 0 (0.0%) | 0 (0.0%) |
| Total | 0 (0.0%) | 0 (0.0%) |
Employment Characteristics in Kicking Horse
Employment by Class of Employer in Kicking Horse
Among the 79 employed individuals in Kicking Horse, local government employees (72 | 91.1%), and self-employed (not incorporated) (7 | 8.9%) make up the most common classes of employment.
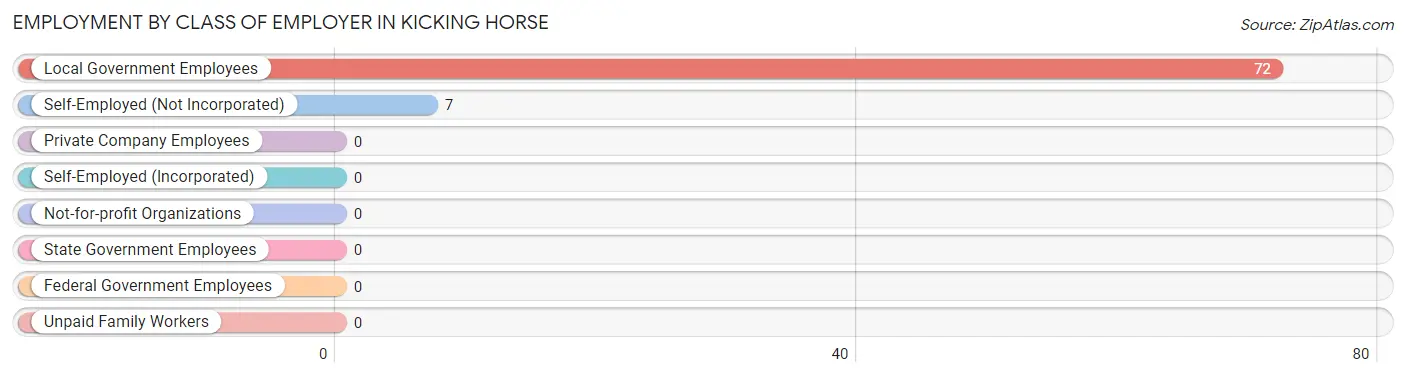
| Employer Class | # Employees | % Employees |
| Private Company Employees | 0 | 0.0% |
| Self-Employed (Incorporated) | 0 | 0.0% |
| Self-Employed (Not Incorporated) | 7 | 8.9% |
| Not-for-profit Organizations | 0 | 0.0% |
| Local Government Employees | 72 | 91.1% |
| State Government Employees | 0 | 0.0% |
| Federal Government Employees | 0 | 0.0% |
| Unpaid Family Workers | 0 | 0.0% |
| Total | 79 | 100.0% |
Employment Status by Age in Kicking Horse
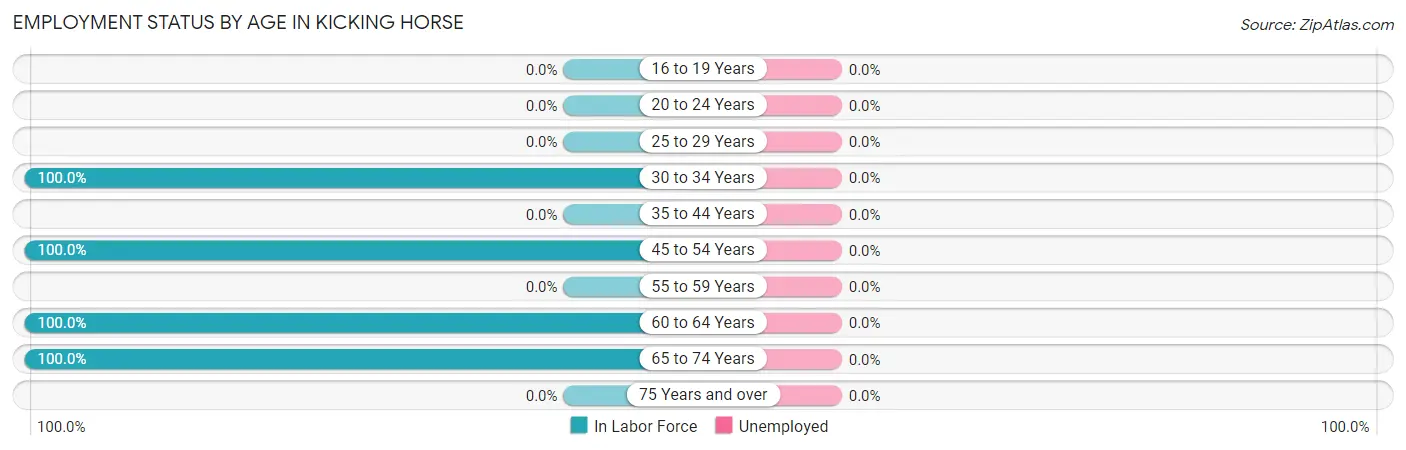
| Age Bracket | In Labor Force | Unemployed |
| 16 to 19 Years | 0 (0.0%) | 0 (0.0%) |
| 20 to 24 Years | 0 (0.0%) | 0 (0.0%) |
| 25 to 29 Years | 0 (0.0%) | 0 (0.0%) |
| 30 to 34 Years | 9 (100.0%) | 0 (0.0%) |
| 35 to 44 Years | 0 (0.0%) | 0 (0.0%) |
| 45 to 54 Years | 28 (100.0%) | 0 (0.0%) |
| 55 to 59 Years | 0 (0.0%) | 0 (0.0%) |
| 60 to 64 Years | 35 (100.0%) | 0 (0.0%) |
| 65 to 74 Years | 7 (100.0%) | 0 (0.0%) |
| 75 Years and over | 0 (0.0%) | 0 (0.0%) |
| Total | 79 (74.5%) | 0 (0.0%) |
Employment Status by Educational Attainment in Kicking Horse
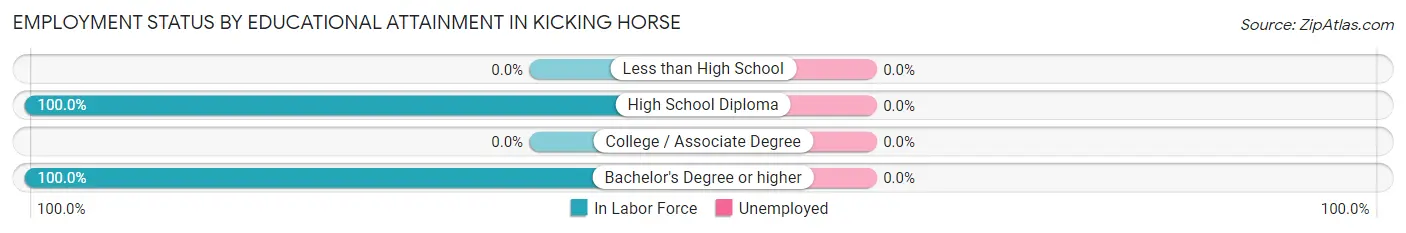
| Educational Attainment | In Labor Force | Unemployed |
| Less than High School | 0 (0.0%) | 0 (0.0%) |
| High School Diploma | 9 (100.0%) | 0 (0.0%) |
| College / Associate Degree | 0 (0.0%) | 0 (0.0%) |
| Bachelor's Degree or higher | 63 (100.0%) | 0 (0.0%) |
| Total | 72 (100.0%) | 0 (0.0%) |
Employment Occupations by Sex in Kicking Horse
Management, Business, Science and Arts Occupations
The most common Management, Business, Science and Arts occupations in Kicking Horse are Community & Social Service (63 | 79.7%), and Education Instruction & Library (63 | 79.7%).
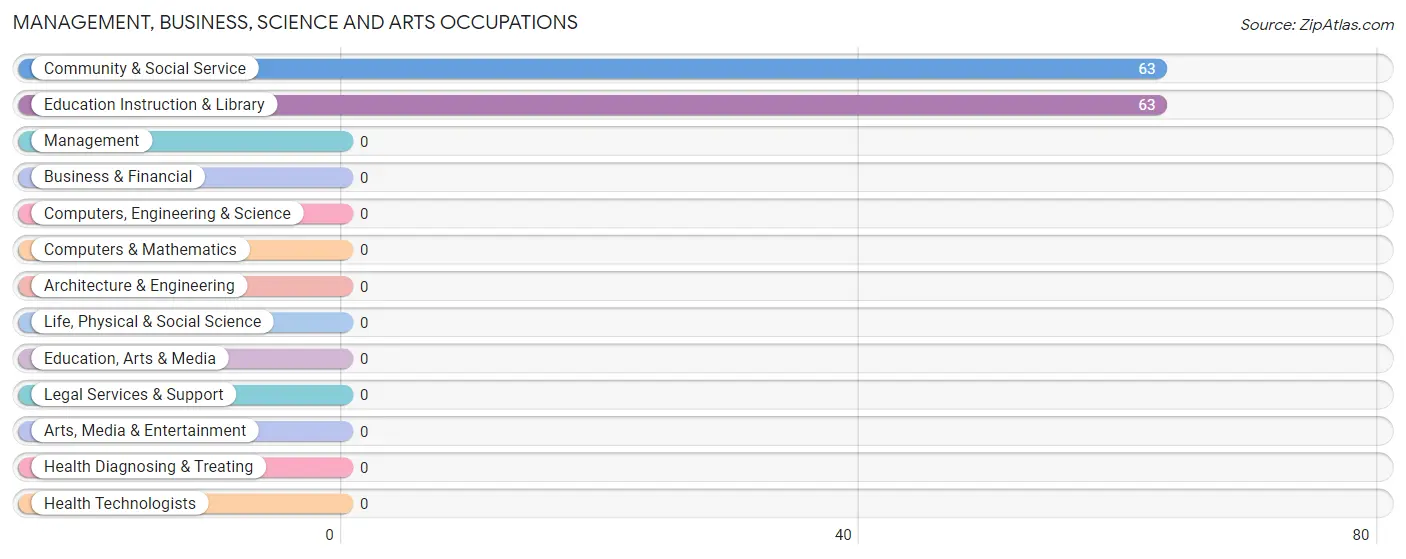
Management, Business, Science and Arts Occupations by Sex
Within the Management, Business, Science and Arts occupations in Kicking Horse, the most male-oriented occupations are Community & Social Service (44.4%), and Education Instruction & Library (44.4%), while the most female-oriented occupations are Community & Social Service (55.6%), and Education Instruction & Library (55.6%).
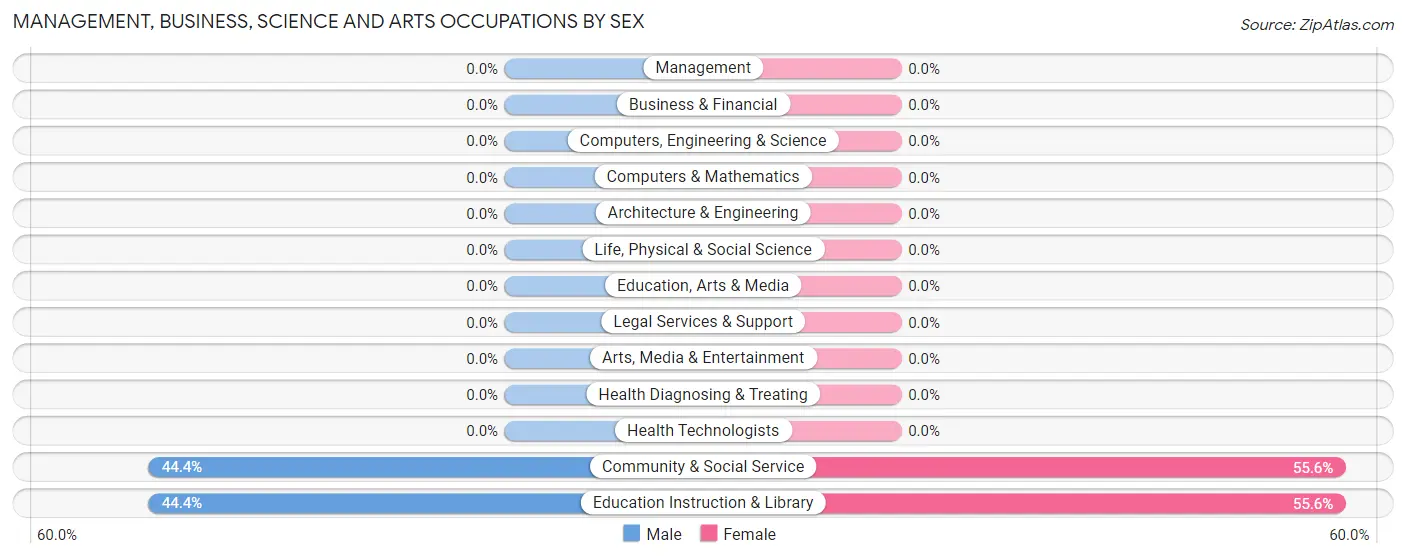
| Occupation | Male | Female |
| Management | 0 (0.0%) | 0 (0.0%) |
| Business & Financial | 0 (0.0%) | 0 (0.0%) |
| Computers, Engineering & Science | 0 (0.0%) | 0 (0.0%) |
| Computers & Mathematics | 0 (0.0%) | 0 (0.0%) |
| Architecture & Engineering | 0 (0.0%) | 0 (0.0%) |
| Life, Physical & Social Science | 0 (0.0%) | 0 (0.0%) |
| Community & Social Service | 28 (44.4%) | 35 (55.6%) |
| Education, Arts & Media | 0 (0.0%) | 0 (0.0%) |
| Legal Services & Support | 0 (0.0%) | 0 (0.0%) |
| Education Instruction & Library | 28 (44.4%) | 35 (55.6%) |
| Arts, Media & Entertainment | 0 (0.0%) | 0 (0.0%) |
| Health Diagnosing & Treating | 0 (0.0%) | 0 (0.0%) |
| Health Technologists | 0 (0.0%) | 0 (0.0%) |
| Total (Category) | 28 (44.4%) | 35 (55.6%) |
| Total (Overall) | 37 (46.8%) | 42 (53.2%) |
Services Occupations
Services Occupations by Sex
| Occupation | Male | Female |
| Healthcare Support | 0 (0.0%) | 0 (0.0%) |
| Security & Protection | 0 (0.0%) | 0 (0.0%) |
| Firefighting & Prevention | 0 (0.0%) | 0 (0.0%) |
| Law Enforcement | 0 (0.0%) | 0 (0.0%) |
| Food Preparation & Serving | 0 (0.0%) | 0 (0.0%) |
| Cleaning & Maintenance | 0 (0.0%) | 0 (0.0%) |
| Personal Care & Service | 0 (0.0%) | 0 (0.0%) |
| Total (Category) | 0 (0.0%) | 0 (0.0%) |
| Total (Overall) | 37 (46.8%) | 42 (53.2%) |
Sales and Office Occupations
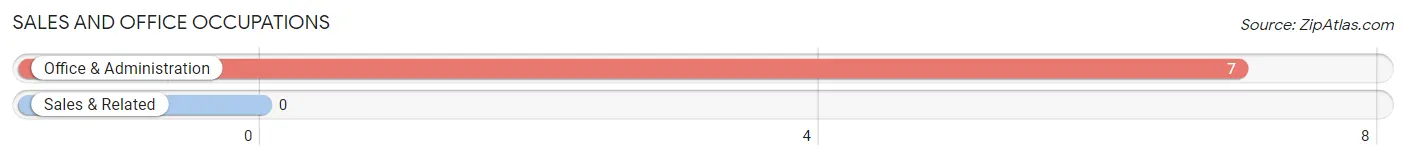
The most common Sales and Office occupations in Kicking Horse are , and Office & Administration (7 | 8.9%).
Sales and Office Occupations by Sex
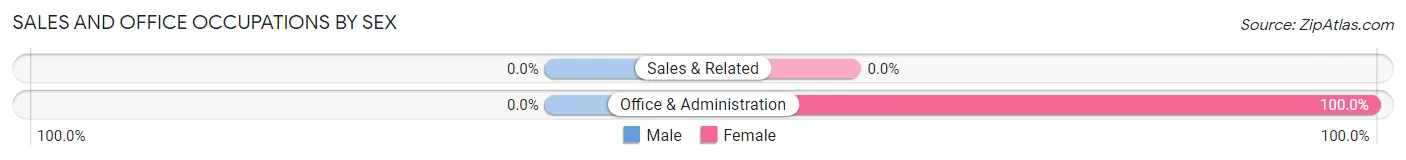
| Occupation | Male | Female |
| Sales & Related | 0 (0.0%) | 0 (0.0%) |
| Office & Administration | 0 (0.0%) | 7 (100.0%) |
| Total (Category) | 0 (0.0%) | 7 (100.0%) |
| Total (Overall) | 37 (46.8%) | 42 (53.2%) |
Natural Resources, Construction and Maintenance Occupations
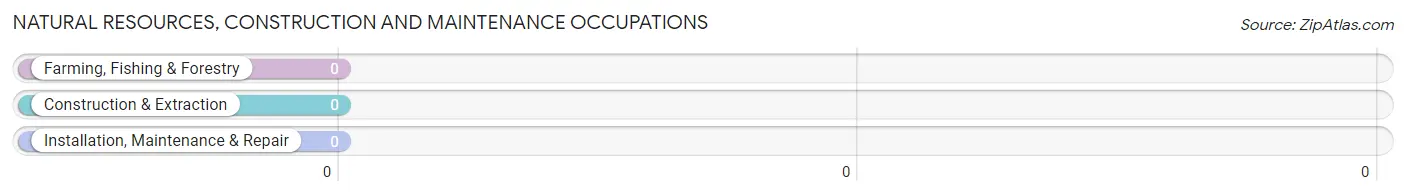
Natural Resources, Construction and Maintenance Occupations by Sex
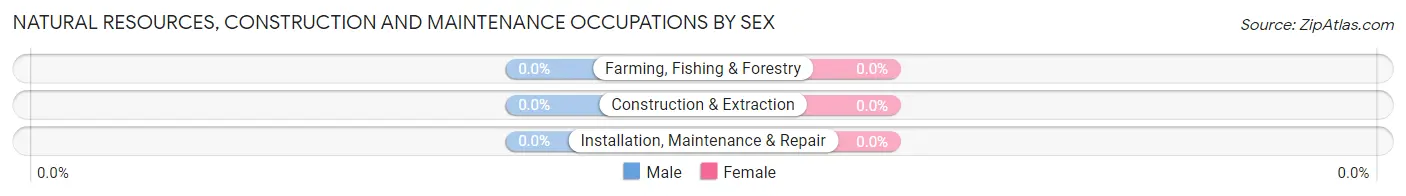
| Occupation | Male | Female |
| Farming, Fishing & Forestry | 0 (0.0%) | 0 (0.0%) |
| Construction & Extraction | 0 (0.0%) | 0 (0.0%) |
| Installation, Maintenance & Repair | 0 (0.0%) | 0 (0.0%) |
| Total (Category) | 0 (0.0%) | 0 (0.0%) |
| Total (Overall) | 37 (46.8%) | 42 (53.2%) |
Production, Transportation and Moving Occupations
The most common Production, Transportation and Moving occupations in Kicking Horse are , and Material Moving (9 | 11.4%).
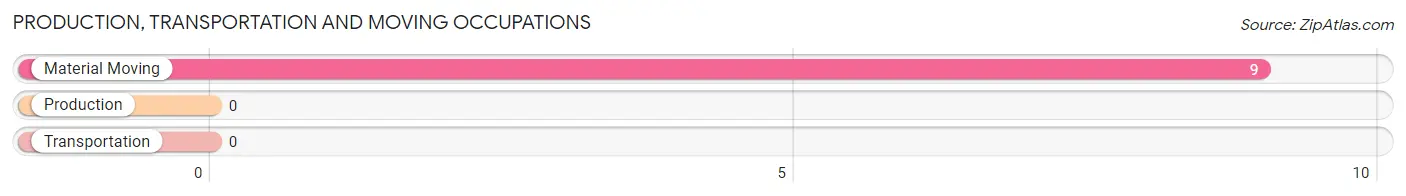
Production, Transportation and Moving Occupations by Sex
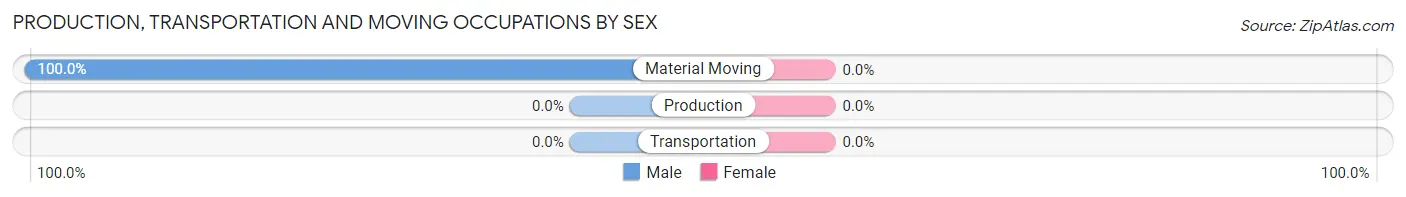
| Occupation | Male | Female |
| Production | 0 (0.0%) | 0 (0.0%) |
| Transportation | 0 (0.0%) | 0 (0.0%) |
| Material Moving | 9 (100.0%) | 0 (0.0%) |
| Total (Category) | 9 (100.0%) | 0 (0.0%) |
| Total (Overall) | 37 (46.8%) | 42 (53.2%) |
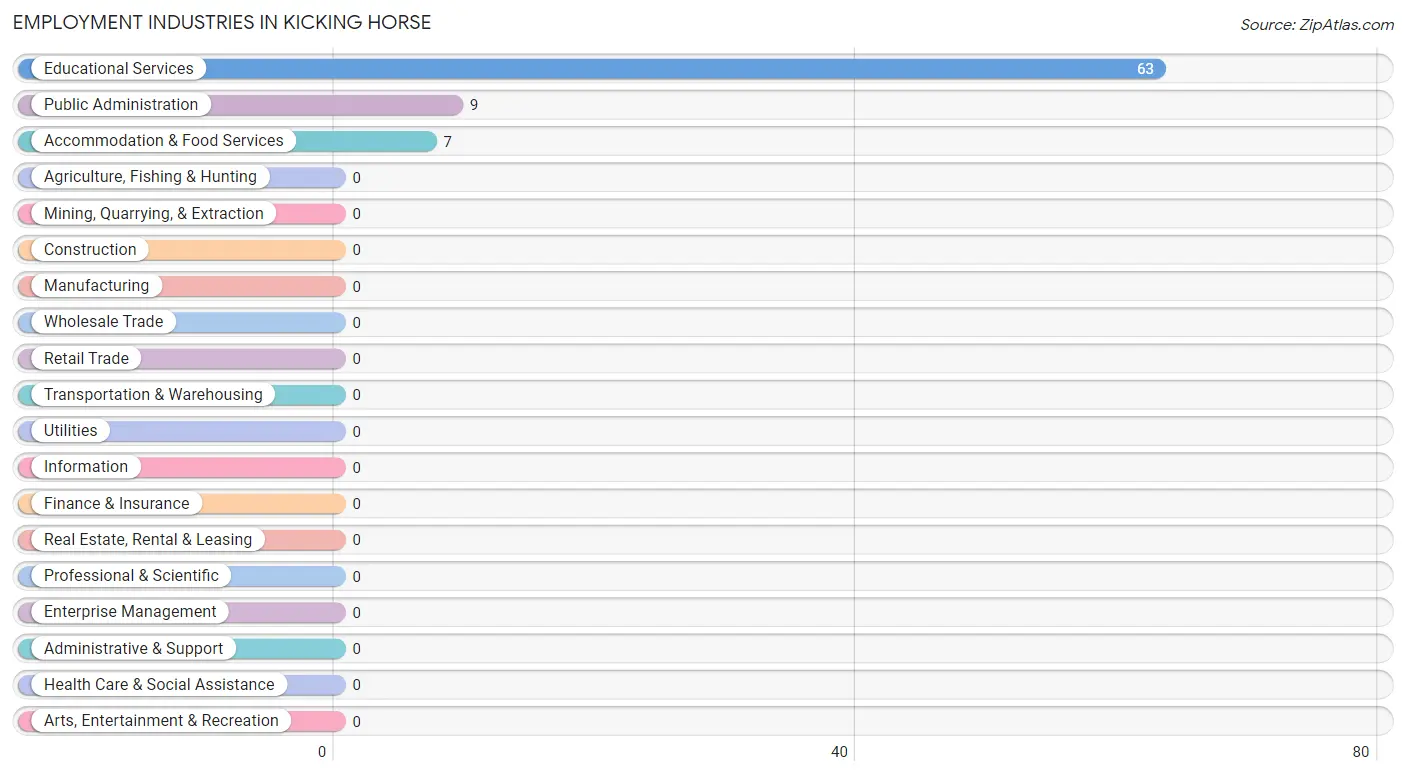
Employment Industries by Sex in Kicking Horse
Employment Industries in Kicking Horse
The major employment industries in Kicking Horse include Educational Services (63 | 79.7%), Public Administration (9 | 11.4%), and Accommodation & Food Services (7 | 8.9%).
Employment Industries by Sex in Kicking Horse
The Kicking Horse industries that see more men than women are Public Administration (100.0%), and Educational Services (44.4%), whereas the industries that tend to have a higher number of women are Accommodation & Food Services (100.0%), and Educational Services (55.6%).
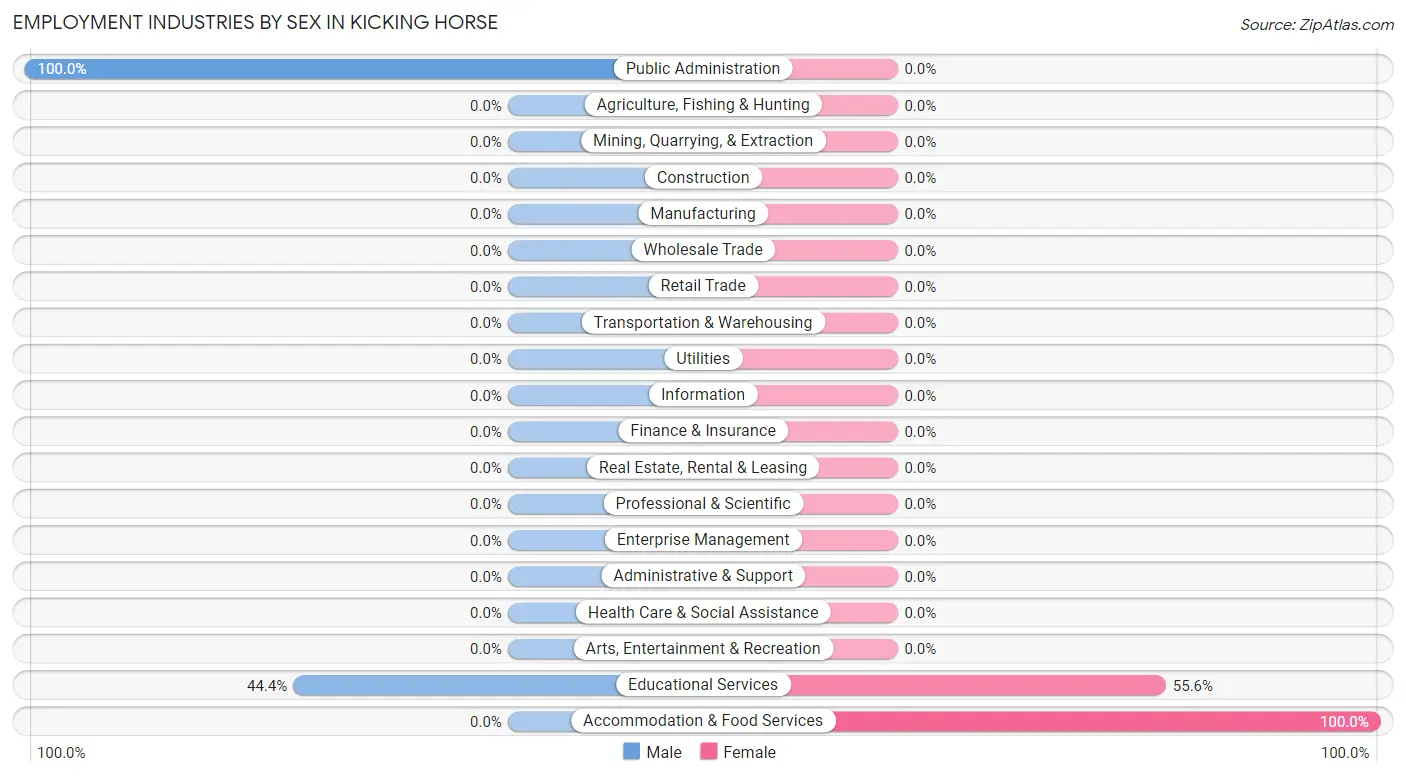
| Industry | Male | Female |
| Agriculture, Fishing & Hunting | 0 (0.0%) | 0 (0.0%) |
| Mining, Quarrying, & Extraction | 0 (0.0%) | 0 (0.0%) |
| Construction | 0 (0.0%) | 0 (0.0%) |
| Manufacturing | 0 (0.0%) | 0 (0.0%) |
| Wholesale Trade | 0 (0.0%) | 0 (0.0%) |
| Retail Trade | 0 (0.0%) | 0 (0.0%) |
| Transportation & Warehousing | 0 (0.0%) | 0 (0.0%) |
| Utilities | 0 (0.0%) | 0 (0.0%) |
| Information | 0 (0.0%) | 0 (0.0%) |
| Finance & Insurance | 0 (0.0%) | 0 (0.0%) |
| Real Estate, Rental & Leasing | 0 (0.0%) | 0 (0.0%) |
| Professional & Scientific | 0 (0.0%) | 0 (0.0%) |
| Enterprise Management | 0 (0.0%) | 0 (0.0%) |
| Administrative & Support | 0 (0.0%) | 0 (0.0%) |
| Educational Services | 28 (44.4%) | 35 (55.6%) |
| Health Care & Social Assistance | 0 (0.0%) | 0 (0.0%) |
| Arts, Entertainment & Recreation | 0 (0.0%) | 0 (0.0%) |
| Accommodation & Food Services | 0 (0.0%) | 7 (100.0%) |
| Public Administration | 9 (100.0%) | 0 (0.0%) |
| Total | 37 (46.8%) | 42 (53.2%) |
Education in Kicking Horse
School Enrollment in Kicking Horse
| School Level | # Students | % Students |
| Nursery / Preschool | 0 | 0.0% |
| Kindergarten | 0 | 0.0% |
| Elementary School | 0 | 0.0% |
| Middle School | 0 | 0.0% |
| High School | 0 | 0.0% |
| College / Undergraduate | 0 | 0.0% |
| Graduate / Professional | 0 | 0.0% |
| Total | 0 | 0.0% |
School Enrollment by Age by Funding Source in Kicking Horse
| Age Bracket | Public School | Private School |
| 3 to 4 Year Olds | 0 (0.0%) | 0 (0.0%) |
| 5 to 9 Year Old | 0 (0.0%) | 0 (0.0%) |
| 10 to 14 Year Olds | 0 (0.0%) | 0 (0.0%) |
| 15 to 17 Year Olds | 0 (0.0%) | 0 (0.0%) |
| 18 to 19 Year Olds | 0 (0.0%) | 0 (0.0%) |
| 20 to 24 Year Olds | 0 (0.0%) | 0 (0.0%) |
| 25 to 34 Year Olds | 0 (0.0%) | 0 (0.0%) |
| 35 Years and over | 0 (0.0%) | 0 (0.0%) |
| Total | 0 (0.0%) | 0 (0.0%) |
Educational Attainment by Field of Study in Kicking Horse
Education (70 | 88.6%), and bio, nature & agricultural (9 | 11.4%) are the most common fields of study among 79 individuals in Kicking Horse who have obtained a bachelor's degree or higher.
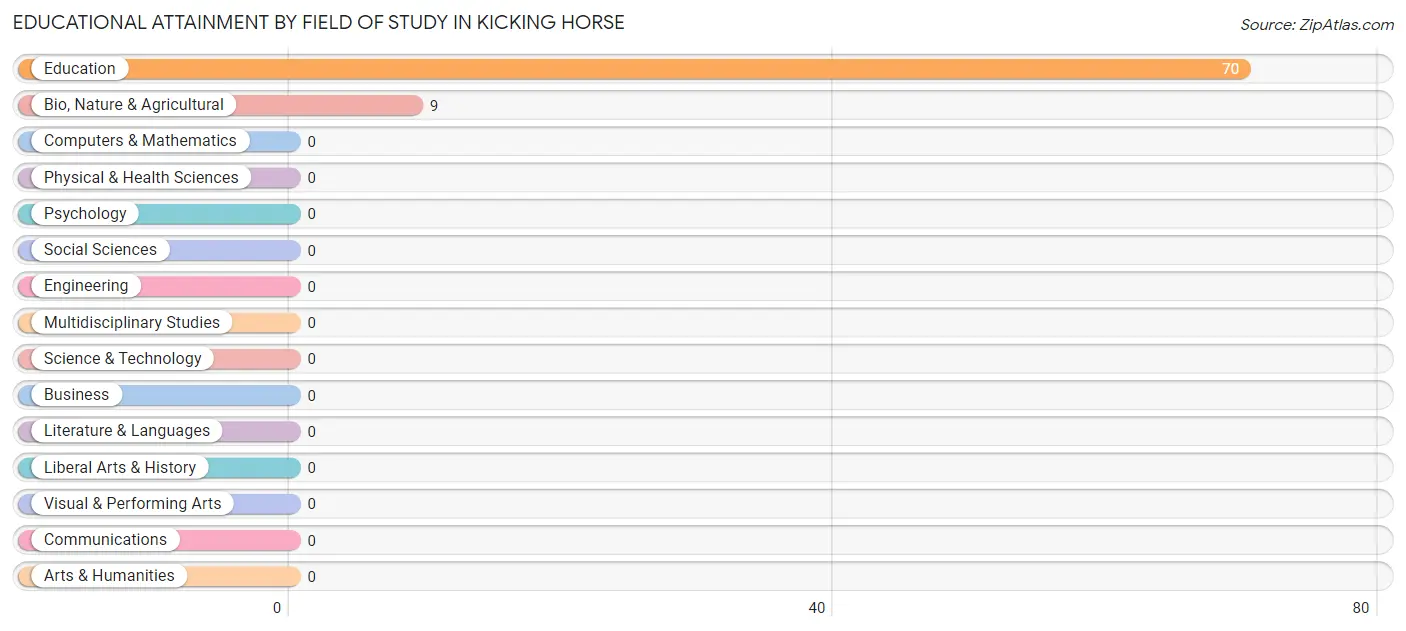
| Field of Study | # Graduates | % Graduates |
| Computers & Mathematics | 0 | 0.0% |
| Bio, Nature & Agricultural | 9 | 11.4% |
| Physical & Health Sciences | 0 | 0.0% |
| Psychology | 0 | 0.0% |
| Social Sciences | 0 | 0.0% |
| Engineering | 0 | 0.0% |
| Multidisciplinary Studies | 0 | 0.0% |
| Science & Technology | 0 | 0.0% |
| Business | 0 | 0.0% |
| Education | 70 | 88.6% |
| Literature & Languages | 0 | 0.0% |
| Liberal Arts & History | 0 | 0.0% |
| Visual & Performing Arts | 0 | 0.0% |
| Communications | 0 | 0.0% |
| Arts & Humanities | 0 | 0.0% |
| Total | 79 | 100.0% |
Transportation & Commute in Kicking Horse
Vehicle Availability by Sex in Kicking Horse
The most prevalent vehicle ownership categories in Kicking Horse are males with 2 vehicles (37, accounting for 100.0%) and females with 2 vehicles (35, making up 88.1%).
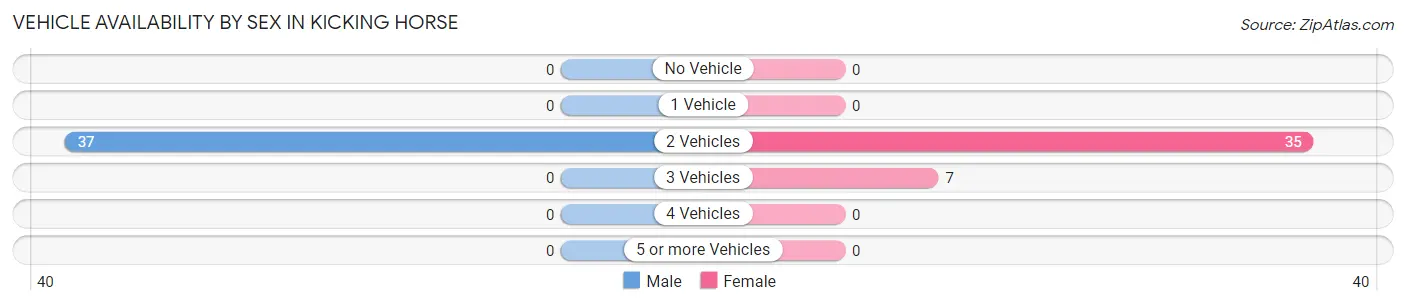
| Vehicles Available | Male | Female |
| No Vehicle | 0 (0.0%) | 0 (0.0%) |
| 1 Vehicle | 0 (0.0%) | 0 (0.0%) |
| 2 Vehicles | 37 (100.0%) | 35 (83.3%) |
| 3 Vehicles | 0 (0.0%) | 7 (16.7%) |
| 4 Vehicles | 0 (0.0%) | 0 (0.0%) |
| 5 or more Vehicles | 0 (0.0%) | 0 (0.0%) |
| Total | 37 (100.0%) | 42 (100.0%) |
Commute Time in Kicking Horse
The most frequently occuring commute durations in Kicking Horse are 15 to 19 minutes (72 commuters, 91.1%), 5 to 9 minutes (7 commuters, 8.9%), and less than 5 minutes (0 commuters, 0.0%).
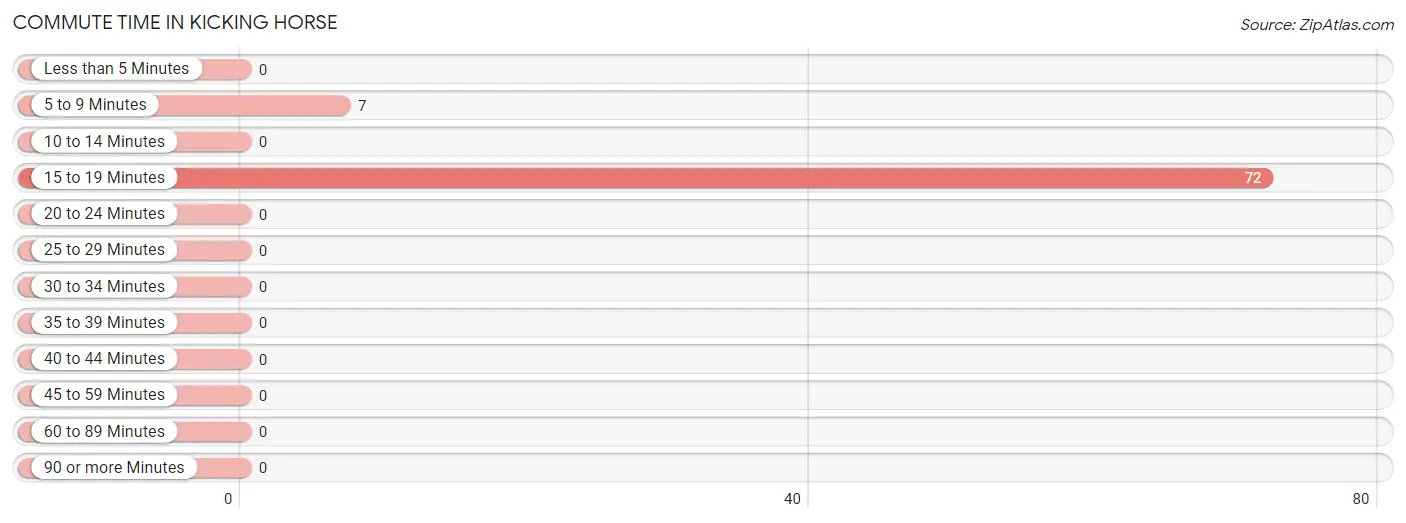
| Commute Time | # Commuters | % Commuters |
| Less than 5 Minutes | 0 | 0.0% |
| 5 to 9 Minutes | 7 | 8.9% |
| 10 to 14 Minutes | 0 | 0.0% |
| 15 to 19 Minutes | 72 | 91.1% |
| 20 to 24 Minutes | 0 | 0.0% |
| 25 to 29 Minutes | 0 | 0.0% |
| 30 to 34 Minutes | 0 | 0.0% |
| 35 to 39 Minutes | 0 | 0.0% |
| 40 to 44 Minutes | 0 | 0.0% |
| 45 to 59 Minutes | 0 | 0.0% |
| 60 to 89 Minutes | 0 | 0.0% |
| 90 or more Minutes | 0 | 0.0% |
Commute Time by Sex in Kicking Horse
The most common commute times in Kicking Horse are 15 to 19 minutes (37 commuters, 100.0%) for males and 15 to 19 minutes (35 commuters, 83.3%) for females.
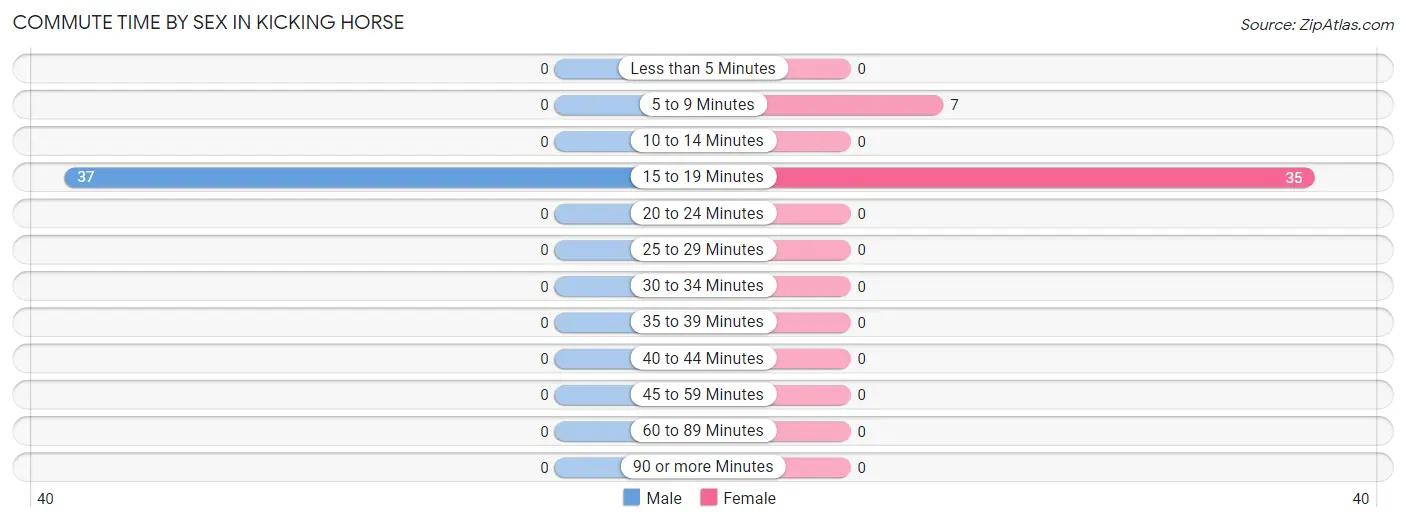
| Commute Time | Male | Female |
| Less than 5 Minutes | 0 (0.0%) | 0 (0.0%) |
| 5 to 9 Minutes | 0 (0.0%) | 7 (16.7%) |
| 10 to 14 Minutes | 0 (0.0%) | 0 (0.0%) |
| 15 to 19 Minutes | 37 (100.0%) | 35 (83.3%) |
| 20 to 24 Minutes | 0 (0.0%) | 0 (0.0%) |
| 25 to 29 Minutes | 0 (0.0%) | 0 (0.0%) |
| 30 to 34 Minutes | 0 (0.0%) | 0 (0.0%) |
| 35 to 39 Minutes | 0 (0.0%) | 0 (0.0%) |
| 40 to 44 Minutes | 0 (0.0%) | 0 (0.0%) |
| 45 to 59 Minutes | 0 (0.0%) | 0 (0.0%) |
| 60 to 89 Minutes | 0 (0.0%) | 0 (0.0%) |
| 90 or more Minutes | 0 (0.0%) | 0 (0.0%) |
Time of Departure to Work by Sex in Kicking Horse
The most frequent times of departure to work in Kicking Horse are 7:30 AM to 7:59 AM (28, 75.7%) for males and 7:00 AM to 7:29 AM (35, 83.3%) for females.
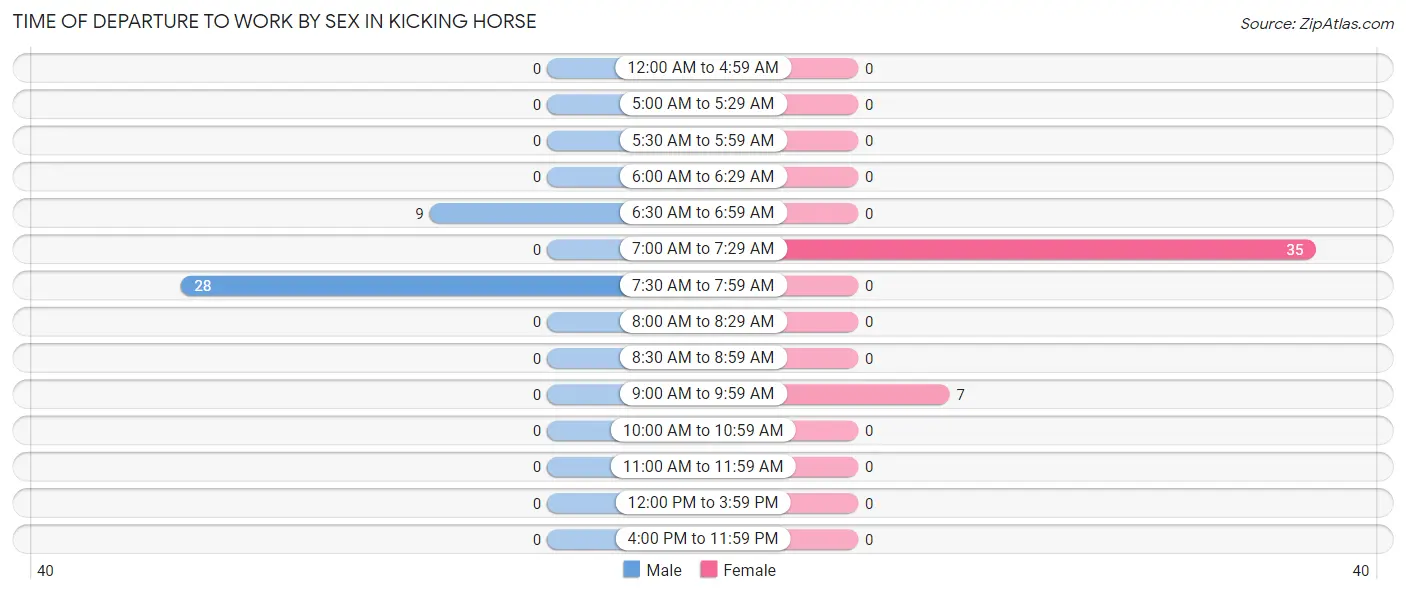
| Time of Departure | Male | Female |
| 12:00 AM to 4:59 AM | 0 (0.0%) | 0 (0.0%) |
| 5:00 AM to 5:29 AM | 0 (0.0%) | 0 (0.0%) |
| 5:30 AM to 5:59 AM | 0 (0.0%) | 0 (0.0%) |
| 6:00 AM to 6:29 AM | 0 (0.0%) | 0 (0.0%) |
| 6:30 AM to 6:59 AM | 9 (24.3%) | 0 (0.0%) |
| 7:00 AM to 7:29 AM | 0 (0.0%) | 35 (83.3%) |
| 7:30 AM to 7:59 AM | 28 (75.7%) | 0 (0.0%) |
| 8:00 AM to 8:29 AM | 0 (0.0%) | 0 (0.0%) |
| 8:30 AM to 8:59 AM | 0 (0.0%) | 0 (0.0%) |
| 9:00 AM to 9:59 AM | 0 (0.0%) | 7 (16.7%) |
| 10:00 AM to 10:59 AM | 0 (0.0%) | 0 (0.0%) |
| 11:00 AM to 11:59 AM | 0 (0.0%) | 0 (0.0%) |
| 12:00 PM to 3:59 PM | 0 (0.0%) | 0 (0.0%) |
| 4:00 PM to 11:59 PM | 0 (0.0%) | 0 (0.0%) |
| Total | 37 (100.0%) | 42 (100.0%) |
Housing Occupancy in Kicking Horse
Occupancy by Ownership in Kicking Horse
Of the total 61 dwellings in Kicking Horse, owner-occupied units account for 17 (27.9%), while renter-occupied units make up 44 (72.1%).
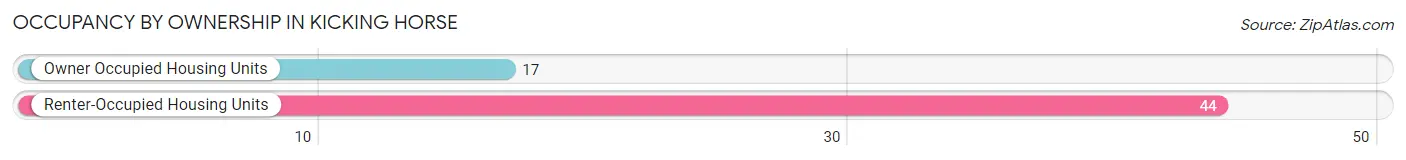
| Occupancy | # Housing Units | % Housing Units |
| Owner Occupied Housing Units | 17 | 27.9% |
| Renter-Occupied Housing Units | 44 | 72.1% |
| Total Occupied Housing Units | 61 | 100.0% |
Occupancy by Household Size in Kicking Horse
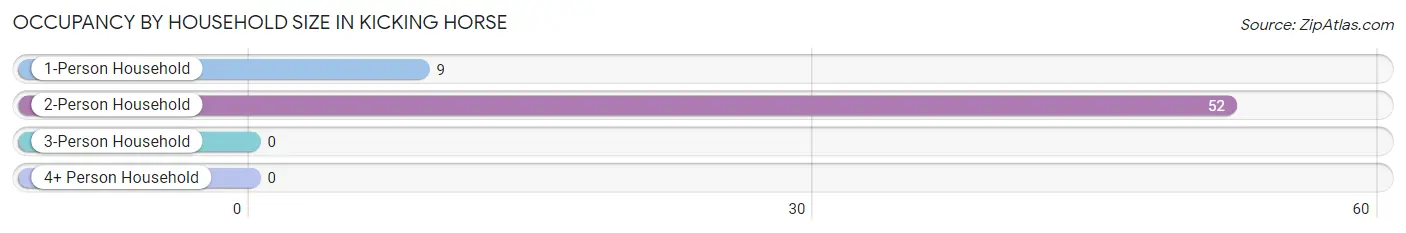
| Household Size | # Housing Units | % Housing Units |
| 1-Person Household | 9 | 14.7% |
| 2-Person Household | 52 | 85.3% |
| 3-Person Household | 0 | 0.0% |
| 4+ Person Household | 0 | 0.0% |
| Total Housing Units | 61 | 100.0% |
Occupancy by Ownership by Household Size in Kicking Horse
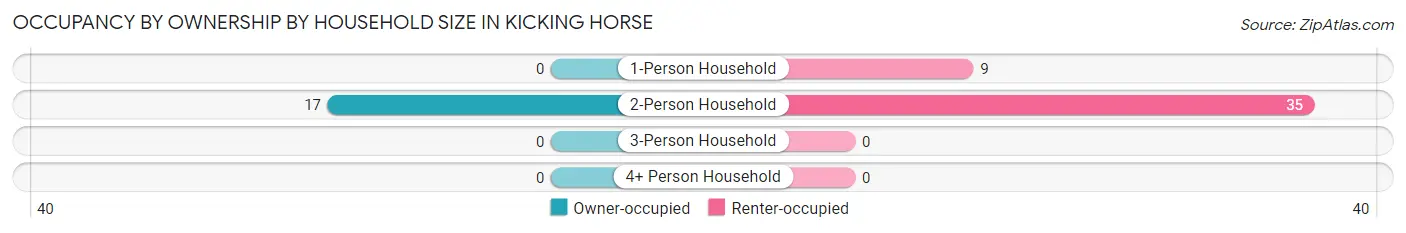
| Household Size | Owner-occupied | Renter-occupied |
| 1-Person Household | 0 (0.0%) | 9 (100.0%) |
| 2-Person Household | 17 (32.7%) | 35 (67.3%) |
| 3-Person Household | 0 (0.0%) | 0 (0.0%) |
| 4+ Person Household | 0 (0.0%) | 0 (0.0%) |
| Total Housing Units | 17 (27.9%) | 44 (72.1%) |
Occupancy by Educational Attainment in Kicking Horse
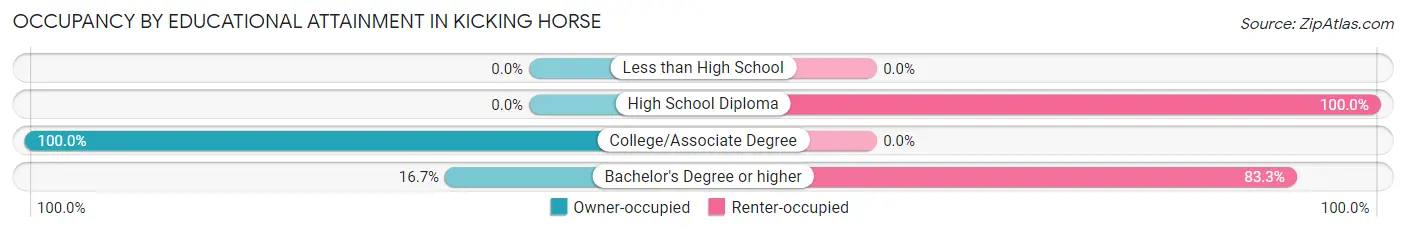
| Household Size | Owner-occupied | Renter-occupied |
| Less than High School | 0 (0.0%) | 0 (0.0%) |
| High School Diploma | 0 (0.0%) | 9 (100.0%) |
| College/Associate Degree | 10 (100.0%) | 0 (0.0%) |
| Bachelor's Degree or higher | 7 (16.7%) | 35 (83.3%) |
Occupancy by Age of Householder in Kicking Horse
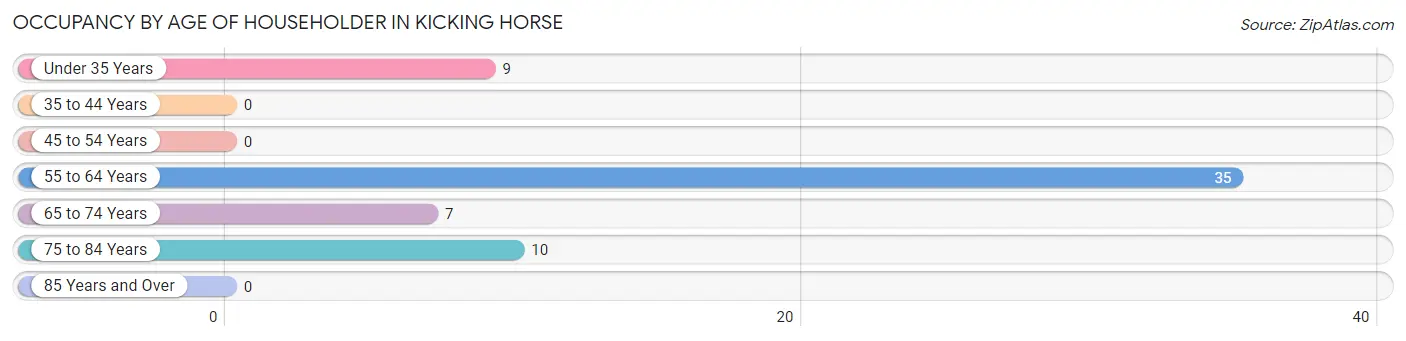
| Age Bracket | # Households | % Households |
| Under 35 Years | 9 | 14.7% |
| 35 to 44 Years | 0 | 0.0% |
| 45 to 54 Years | 0 | 0.0% |
| 55 to 64 Years | 35 | 57.4% |
| 65 to 74 Years | 7 | 11.5% |
| 75 to 84 Years | 10 | 16.4% |
| 85 Years and Over | 0 | 0.0% |
| Total | 61 | 100.0% |
Housing Finances in Kicking Horse
Median Income by Occupancy in Kicking Horse
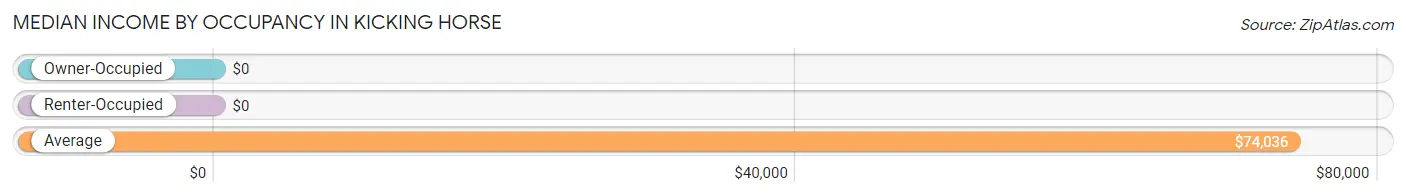
| Occupancy Type | # Households | Median Income |
| Owner-Occupied | 17 (27.9%) | $0 |
| Renter-Occupied | 44 (72.1%) | $0 |
| Average | 61 (100.0%) | $74,036 |
Occupancy by Householder Income Bracket in Kicking Horse
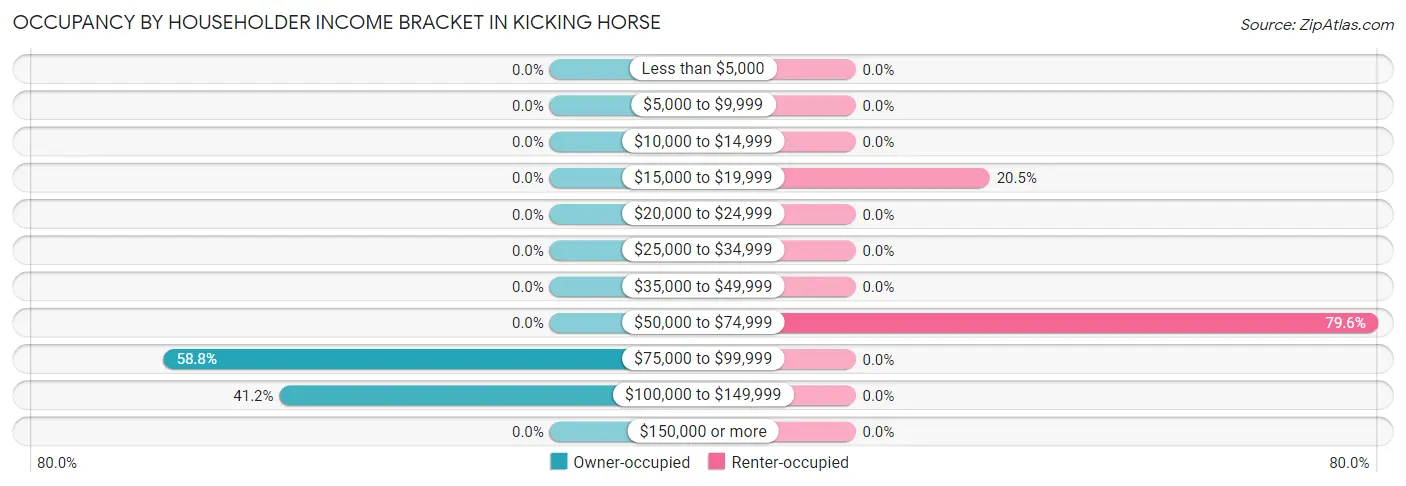
| Income Bracket | Owner-occupied | Renter-occupied |
| Less than $5,000 | 0 (0.0%) | 0 (0.0%) |
| $5,000 to $9,999 | 0 (0.0%) | 0 (0.0%) |
| $10,000 to $14,999 | 0 (0.0%) | 0 (0.0%) |
| $15,000 to $19,999 | 0 (0.0%) | 9 (20.4%) |
| $20,000 to $24,999 | 0 (0.0%) | 0 (0.0%) |
| $25,000 to $34,999 | 0 (0.0%) | 0 (0.0%) |
| $35,000 to $49,999 | 0 (0.0%) | 0 (0.0%) |
| $50,000 to $74,999 | 0 (0.0%) | 35 (79.5%) |
| $75,000 to $99,999 | 10 (58.8%) | 0 (0.0%) |
| $100,000 to $149,999 | 7 (41.2%) | 0 (0.0%) |
| $150,000 or more | 0 (0.0%) | 0 (0.0%) |
| Total | 17 (100.0%) | 44 (100.0%) |
Monthly Housing Cost Tiers in Kicking Horse
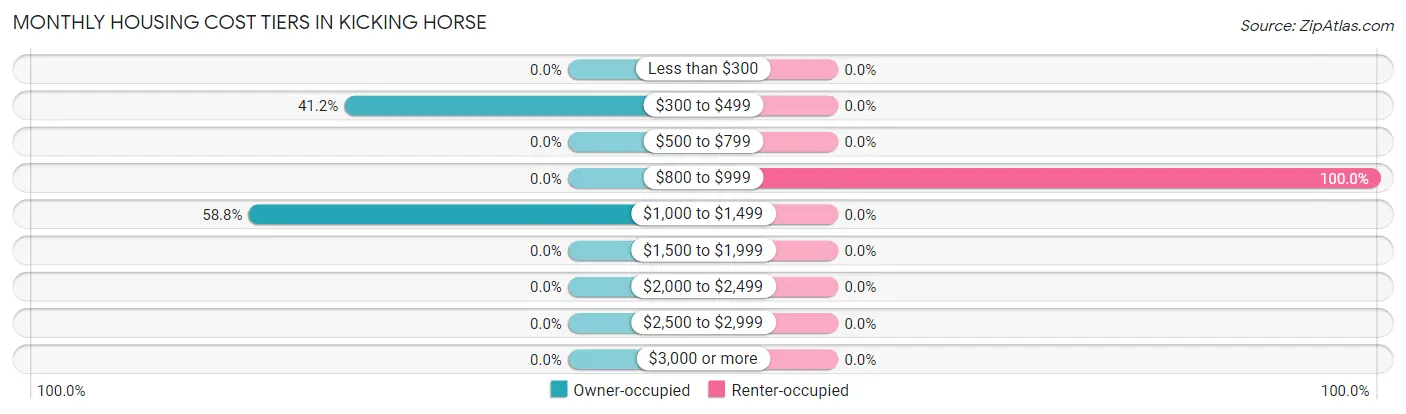
| Monthly Cost | Owner-occupied | Renter-occupied |
| Less than $300 | 0 (0.0%) | 0 (0.0%) |
| $300 to $499 | 7 (41.2%) | 0 (0.0%) |
| $500 to $799 | 0 (0.0%) | 0 (0.0%) |
| $800 to $999 | 0 (0.0%) | 44 (100.0%) |
| $1,000 to $1,499 | 10 (58.8%) | 0 (0.0%) |
| $1,500 to $1,999 | 0 (0.0%) | 0 (0.0%) |
| $2,000 to $2,499 | 0 (0.0%) | 0 (0.0%) |
| $2,500 to $2,999 | 0 (0.0%) | 0 (0.0%) |
| $3,000 or more | 0 (0.0%) | 0 (0.0%) |
| Total | 17 (100.0%) | 44 (100.0%) |
Physical Housing Characteristics in Kicking Horse
Housing Structures in Kicking Horse
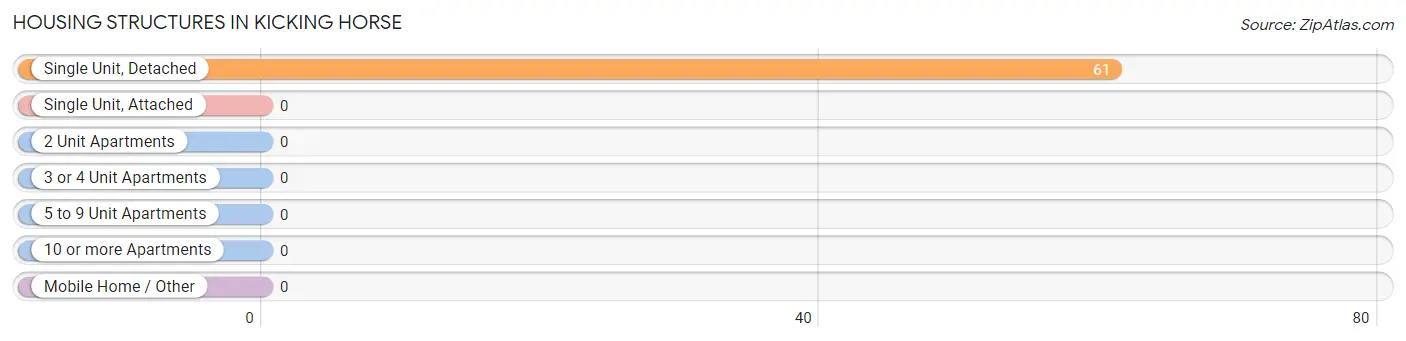
| Structure Type | # Housing Units | % Housing Units |
| Single Unit, Detached | 61 | 100.0% |
| Single Unit, Attached | 0 | 0.0% |
| 2 Unit Apartments | 0 | 0.0% |
| 3 or 4 Unit Apartments | 0 | 0.0% |
| 5 to 9 Unit Apartments | 0 | 0.0% |
| 10 or more Apartments | 0 | 0.0% |
| Mobile Home / Other | 0 | 0.0% |
| Total | 61 | 100.0% |
Housing Structures by Occupancy in Kicking Horse
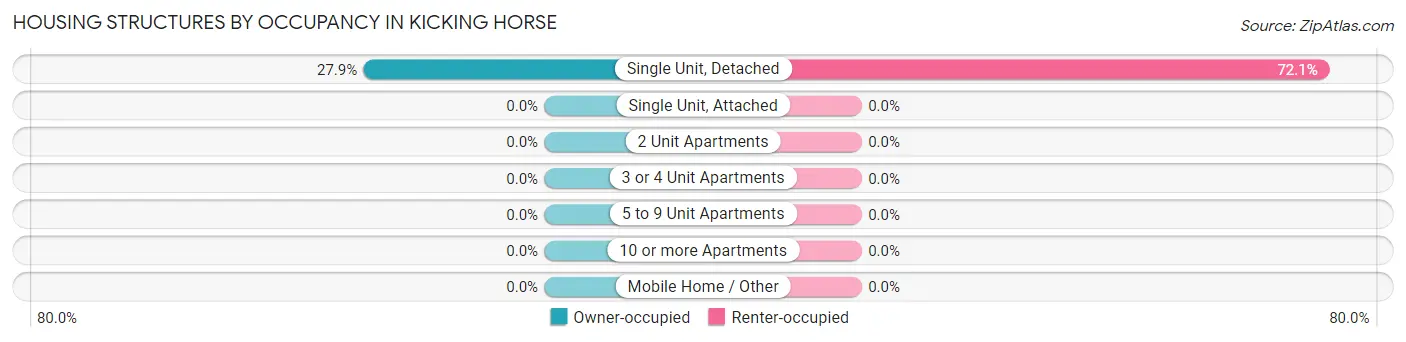
| Structure Type | Owner-occupied | Renter-occupied |
| Single Unit, Detached | 17 (27.9%) | 44 (72.1%) |
| Single Unit, Attached | 0 (0.0%) | 0 (0.0%) |
| 2 Unit Apartments | 0 (0.0%) | 0 (0.0%) |
| 3 or 4 Unit Apartments | 0 (0.0%) | 0 (0.0%) |
| 5 to 9 Unit Apartments | 0 (0.0%) | 0 (0.0%) |
| 10 or more Apartments | 0 (0.0%) | 0 (0.0%) |
| Mobile Home / Other | 0 (0.0%) | 0 (0.0%) |
| Total | 17 (27.9%) | 44 (72.1%) |
Housing Structures by Number of Rooms in Kicking Horse
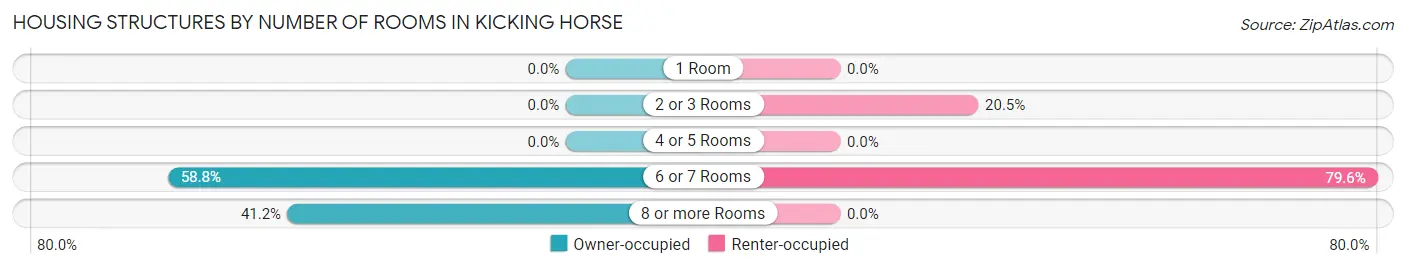
| Number of Rooms | Owner-occupied | Renter-occupied |
| 1 Room | 0 (0.0%) | 0 (0.0%) |
| 2 or 3 Rooms | 0 (0.0%) | 9 (20.4%) |
| 4 or 5 Rooms | 0 (0.0%) | 0 (0.0%) |
| 6 or 7 Rooms | 10 (58.8%) | 35 (79.5%) |
| 8 or more Rooms | 7 (41.2%) | 0 (0.0%) |
| Total | 17 (100.0%) | 44 (100.0%) |
Housing Structure by Heating Type in Kicking Horse
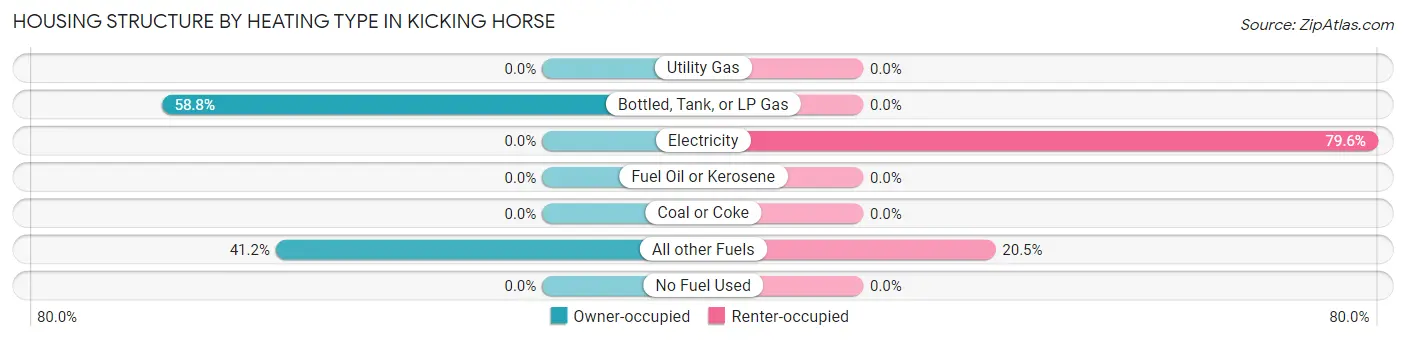
| Heating Type | Owner-occupied | Renter-occupied |
| Utility Gas | 0 (0.0%) | 0 (0.0%) |
| Bottled, Tank, or LP Gas | 10 (58.8%) | 0 (0.0%) |
| Electricity | 0 (0.0%) | 35 (79.5%) |
| Fuel Oil or Kerosene | 0 (0.0%) | 0 (0.0%) |
| Coal or Coke | 0 (0.0%) | 0 (0.0%) |
| All other Fuels | 7 (41.2%) | 9 (20.4%) |
| No Fuel Used | 0 (0.0%) | 0 (0.0%) |
| Total | 17 (100.0%) | 44 (100.0%) |
Household Vehicle Usage in Kicking Horse
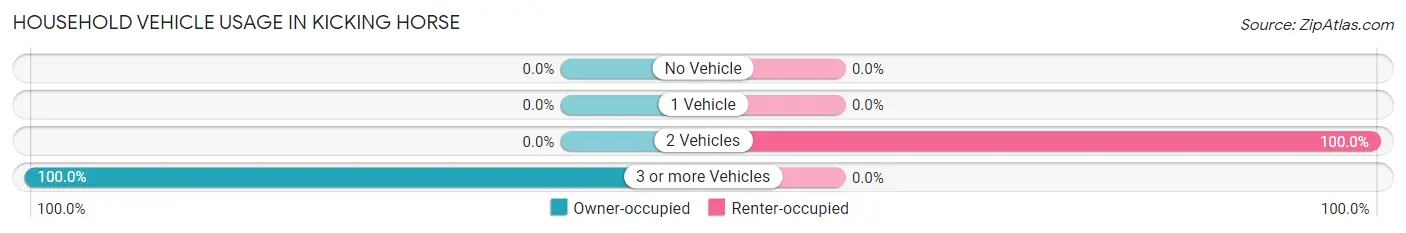
| Vehicles per Household | Owner-occupied | Renter-occupied |
| No Vehicle | 0 (0.0%) | 0 (0.0%) |
| 1 Vehicle | 0 (0.0%) | 0 (0.0%) |
| 2 Vehicles | 0 (0.0%) | 44 (100.0%) |
| 3 or more Vehicles | 17 (100.0%) | 0 (0.0%) |
| Total | 17 (100.0%) | 44 (100.0%) |
Real Estate & Mortgages in Kicking Horse
Real Estate and Mortgage Overview in Kicking Horse
| Characteristic | Without Mortgage | With Mortgage |
| Housing Units | 17 | 0 |
| Median Property Value | - | - |
| Median Household Income | - | - |
| Monthly Housing Costs | - | - |
| Real Estate Taxes | - | - |
Property Value by Mortgage Status in Kicking Horse
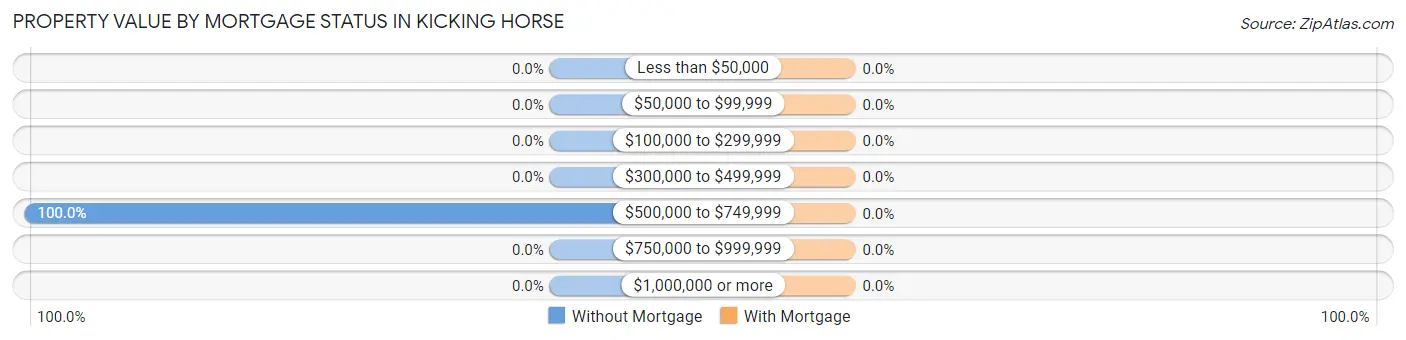
| Property Value | Without Mortgage | With Mortgage |
| Less than $50,000 | 0 (0.0%) | 0 (0.0%) |
| $50,000 to $99,999 | 0 (0.0%) | 0 (0.0%) |
| $100,000 to $299,999 | 0 (0.0%) | 0 (0.0%) |
| $300,000 to $499,999 | 0 (0.0%) | 0 (0.0%) |
| $500,000 to $749,999 | 17 (100.0%) | 0 (0.0%) |
| $750,000 to $999,999 | 0 (0.0%) | 0 (0.0%) |
| $1,000,000 or more | 0 (0.0%) | 0 (0.0%) |
| Total | 17 (100.0%) | 0 (0.0%) |
Household Income by Mortgage Status in Kicking Horse
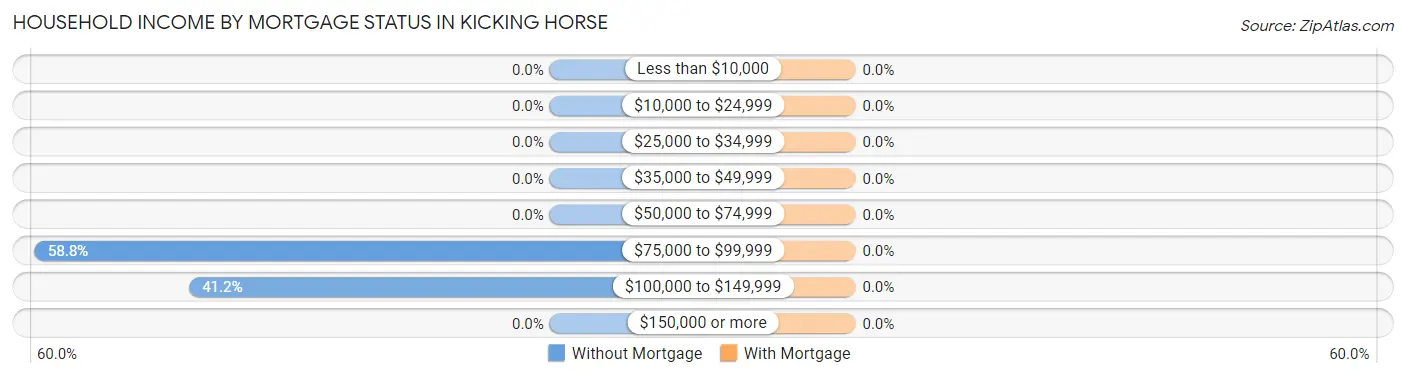
| Household Income | Without Mortgage | With Mortgage |
| Less than $10,000 | 0 (0.0%) | 0 (0.0%) |
| $10,000 to $24,999 | 0 (0.0%) | 0 (0.0%) |
| $25,000 to $34,999 | 0 (0.0%) | 0 (0.0%) |
| $35,000 to $49,999 | 0 (0.0%) | 0 (0.0%) |
| $50,000 to $74,999 | 0 (0.0%) | 0 (0.0%) |
| $75,000 to $99,999 | 10 (58.8%) | 0 (0.0%) |
| $100,000 to $149,999 | 7 (41.2%) | 0 (0.0%) |
| $150,000 or more | 0 (0.0%) | 0 (0.0%) |
| Total | 17 (100.0%) | 0 (0.0%) |
Property Value to Household Income Ratio in Kicking Horse
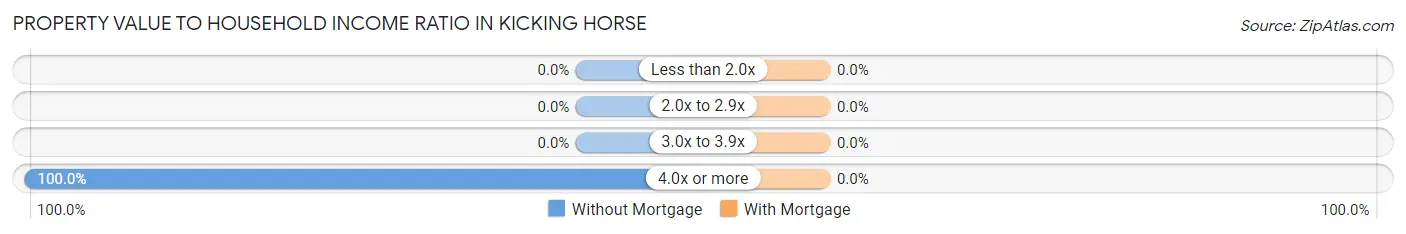
| Value-to-Income Ratio | Without Mortgage | With Mortgage |
| Less than 2.0x | 0 (0.0%) | 0 (0.0%) |
| 2.0x to 2.9x | 0 (0.0%) | 0 (0.0%) |
| 3.0x to 3.9x | 0 (0.0%) | 0 (0.0%) |
| 4.0x or more | 17 (100.0%) | 0 (0.0%) |
| Total | 17 (100.0%) | 0 (0.0%) |
Real Estate Taxes by Mortgage Status in Kicking Horse
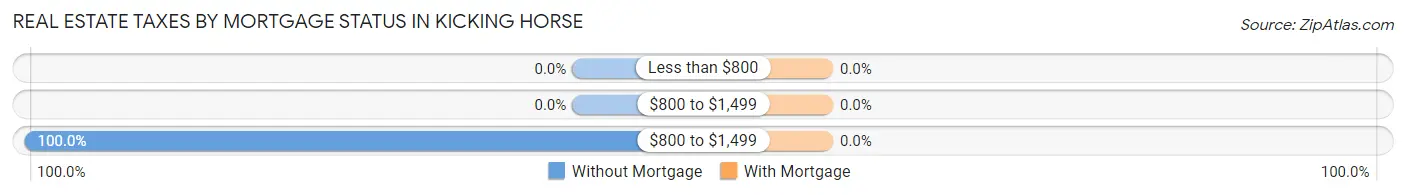
| Property Taxes | Without Mortgage | With Mortgage |
| Less than $800 | 0 (0.0%) | 0 (0.0%) |
| $800 to $1,499 | 0 (0.0%) | 0 (0.0%) |
| $800 to $1,499 | 17 (100.0%) | 0 (0.0%) |
| Total | 17 (100.0%) | 0 (0.0%) |
Health & Disability in Kicking Horse
Health Insurance Coverage by Age in Kicking Horse
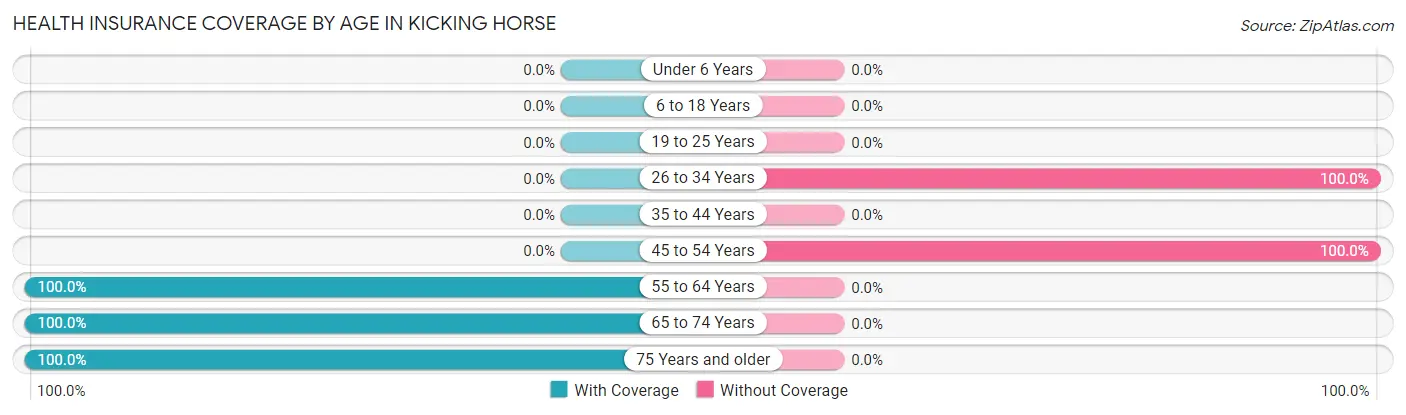
| Age Bracket | With Coverage | Without Coverage |
| Under 6 Years | 0 (0.0%) | 0 (0.0%) |
| 6 to 18 Years | 0 (0.0%) | 0 (0.0%) |
| 19 to 25 Years | 0 (0.0%) | 0 (0.0%) |
| 26 to 34 Years | 0 (0.0%) | 9 (100.0%) |
| 35 to 44 Years | 0 (0.0%) | 0 (0.0%) |
| 45 to 54 Years | 0 (0.0%) | 28 (100.0%) |
| 55 to 64 Years | 35 (100.0%) | 0 (0.0%) |
| 65 to 74 Years | 7 (100.0%) | 0 (0.0%) |
| 75 Years and older | 27 (100.0%) | 0 (0.0%) |
| Total | 69 (65.1%) | 37 (34.9%) |
Health Insurance Coverage by Citizenship Status in Kicking Horse
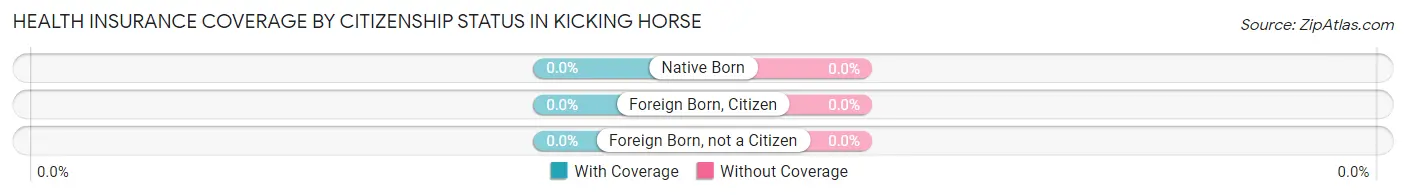
| Citizenship Status | With Coverage | Without Coverage |
| Native Born | 0 (0.0%) | 0 (0.0%) |
| Foreign Born, Citizen | 0 (0.0%) | 0 (0.0%) |
| Foreign Born, not a Citizen | 0 (0.0%) | 0 (0.0%) |
Health Insurance Coverage by Household Income in Kicking Horse
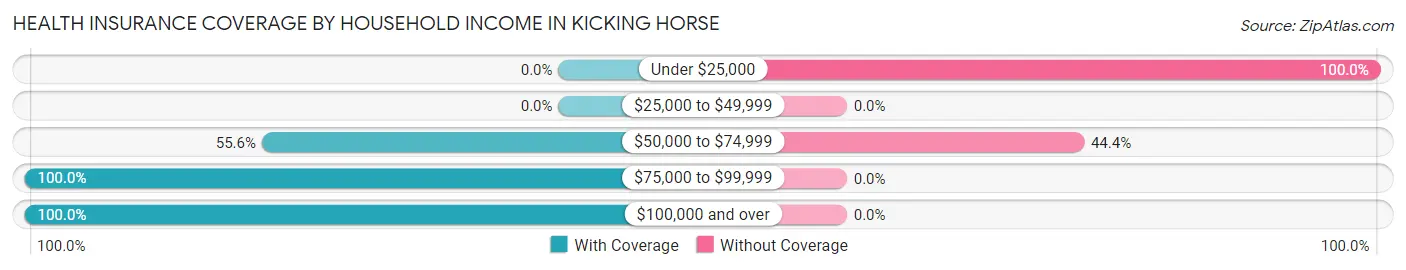
| Household Income | With Coverage | Without Coverage |
| Under $25,000 | 0 (0.0%) | 9 (100.0%) |
| $25,000 to $49,999 | 0 (0.0%) | 0 (0.0%) |
| $50,000 to $74,999 | 35 (55.6%) | 28 (44.4%) |
| $75,000 to $99,999 | 18 (100.0%) | 0 (0.0%) |
| $100,000 and over | 16 (100.0%) | 0 (0.0%) |
Public vs Private Health Insurance Coverage by Age in Kicking Horse
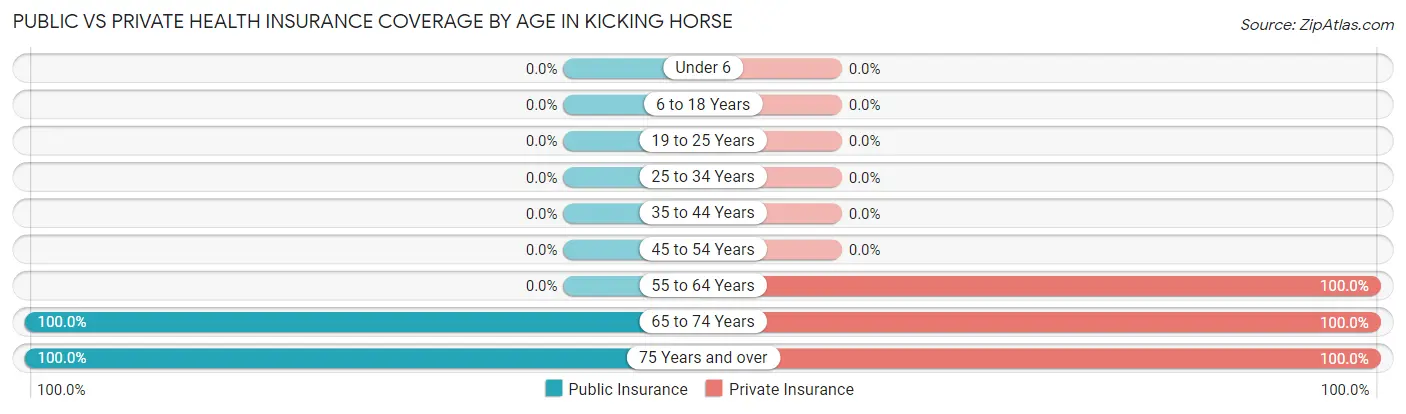
| Age Bracket | Public Insurance | Private Insurance |
| Under 6 | 0 (0.0%) | 0 (0.0%) |
| 6 to 18 Years | 0 (0.0%) | 0 (0.0%) |
| 19 to 25 Years | 0 (0.0%) | 0 (0.0%) |
| 25 to 34 Years | 0 (0.0%) | 0 (0.0%) |
| 35 to 44 Years | 0 (0.0%) | 0 (0.0%) |
| 45 to 54 Years | 0 (0.0%) | 0 (0.0%) |
| 55 to 64 Years | 0 (0.0%) | 35 (100.0%) |
| 65 to 74 Years | 7 (100.0%) | 7 (100.0%) |
| 75 Years and over | 27 (100.0%) | 27 (100.0%) |
| Total | 34 (32.1%) | 69 (65.1%) |
Disability Status by Sex by Age in Kicking Horse
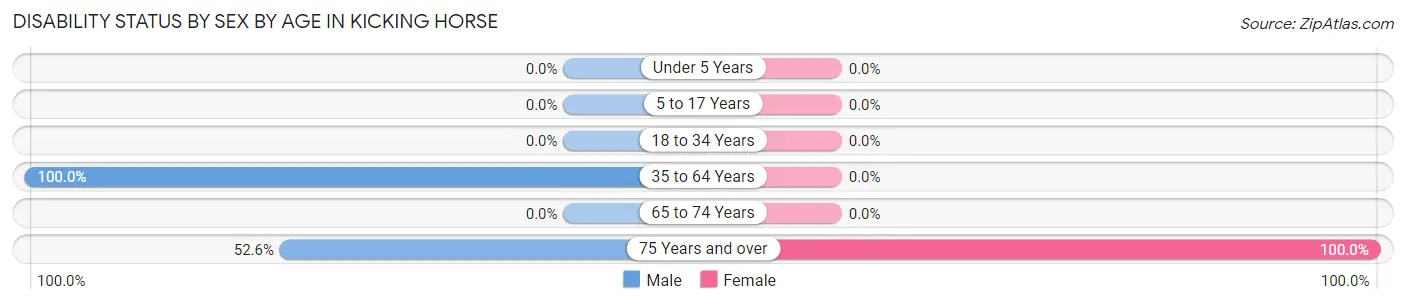
| Age Bracket | Male | Female |
| Under 5 Years | 0 (0.0%) | 0 (0.0%) |
| 5 to 17 Years | 0 (0.0%) | 0 (0.0%) |
| 18 to 34 Years | 0 (0.0%) | 0 (0.0%) |
| 35 to 64 Years | 28 (100.0%) | 0 (0.0%) |
| 65 to 74 Years | 0 (0.0%) | 0 (0.0%) |
| 75 Years and over | 10 (52.6%) | 8 (100.0%) |
Disability Class by Sex by Age in Kicking Horse
Disability Class: Hearing Difficulty
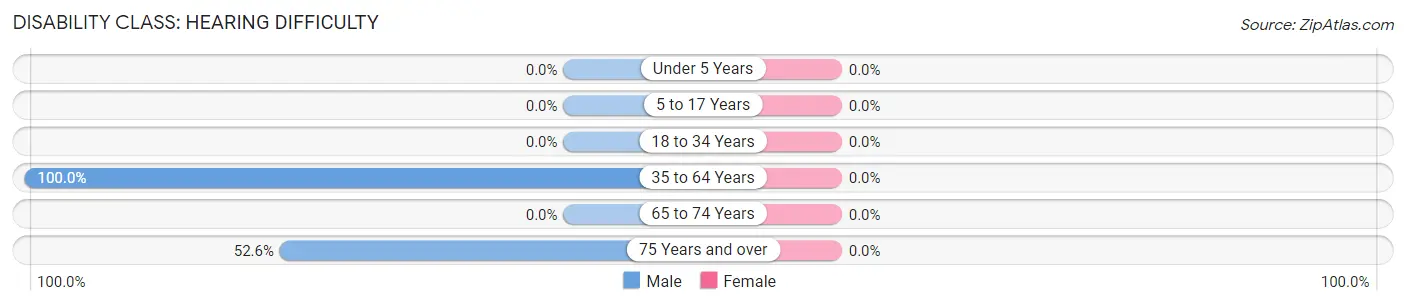
| Age Bracket | Male | Female |
| Under 5 Years | 0 (0.0%) | 0 (0.0%) |
| 5 to 17 Years | 0 (0.0%) | 0 (0.0%) |
| 18 to 34 Years | 0 (0.0%) | 0 (0.0%) |
| 35 to 64 Years | 28 (100.0%) | 0 (0.0%) |
| 65 to 74 Years | 0 (0.0%) | 0 (0.0%) |
| 75 Years and over | 10 (52.6%) | 0 (0.0%) |
Disability Class: Vision Difficulty
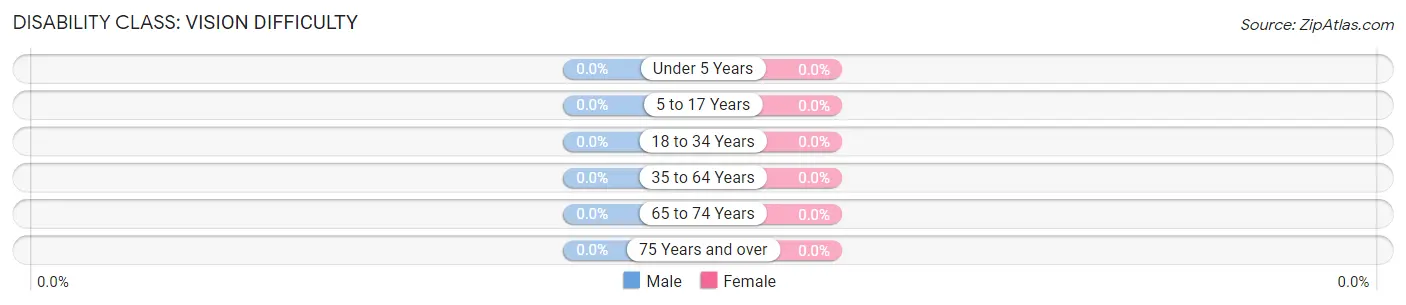
| Age Bracket | Male | Female |
| Under 5 Years | 0 (0.0%) | 0 (0.0%) |
| 5 to 17 Years | 0 (0.0%) | 0 (0.0%) |
| 18 to 34 Years | 0 (0.0%) | 0 (0.0%) |
| 35 to 64 Years | 0 (0.0%) | 0 (0.0%) |
| 65 to 74 Years | 0 (0.0%) | 0 (0.0%) |
| 75 Years and over | 0 (0.0%) | 0 (0.0%) |
Disability Class: Cognitive Difficulty
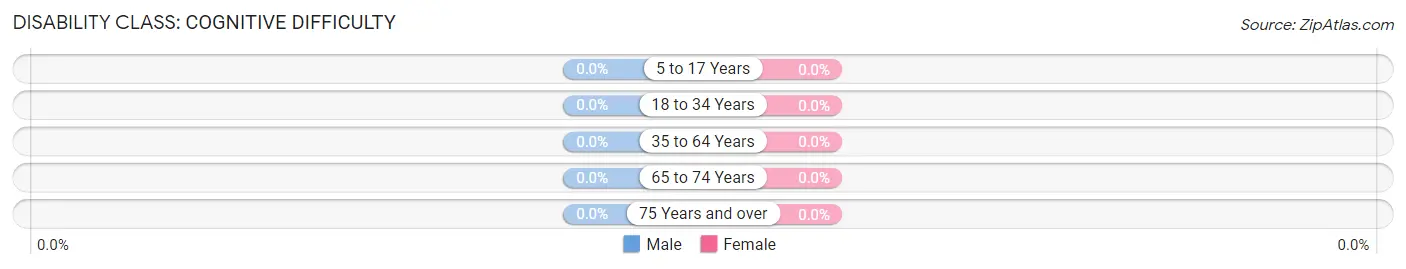
| Age Bracket | Male | Female |
| 5 to 17 Years | 0 (0.0%) | 0 (0.0%) |
| 18 to 34 Years | 0 (0.0%) | 0 (0.0%) |
| 35 to 64 Years | 0 (0.0%) | 0 (0.0%) |
| 65 to 74 Years | 0 (0.0%) | 0 (0.0%) |
| 75 Years and over | 0 (0.0%) | 0 (0.0%) |
Disability Class: Ambulatory Difficulty
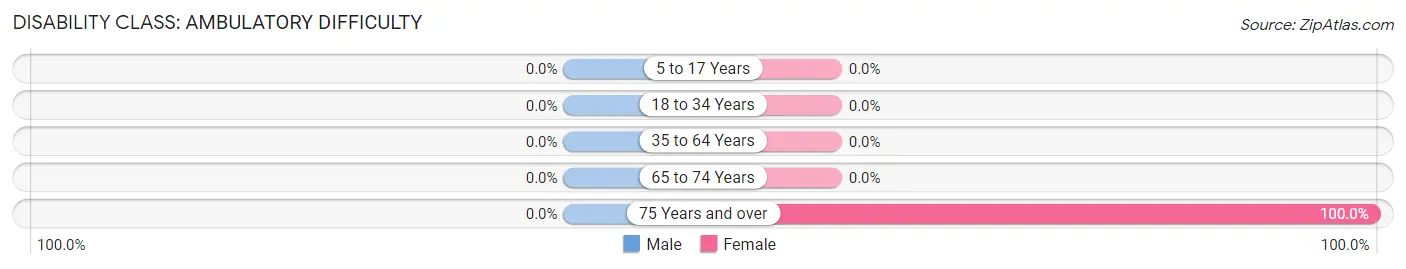
| Age Bracket | Male | Female |
| 5 to 17 Years | 0 (0.0%) | 0 (0.0%) |
| 18 to 34 Years | 0 (0.0%) | 0 (0.0%) |
| 35 to 64 Years | 0 (0.0%) | 0 (0.0%) |
| 65 to 74 Years | 0 (0.0%) | 0 (0.0%) |
| 75 Years and over | 0 (0.0%) | 8 (100.0%) |
Disability Class: Self-Care Difficulty

| Age Bracket | Male | Female |
| 5 to 17 Years | 0 (0.0%) | 0 (0.0%) |
| 18 to 34 Years | 0 (0.0%) | 0 (0.0%) |
| 35 to 64 Years | 0 (0.0%) | 0 (0.0%) |
| 65 to 74 Years | 0 (0.0%) | 0 (0.0%) |
| 75 Years and over | 0 (0.0%) | 0 (0.0%) |
Technology Access in Kicking Horse
Computing Device Access in Kicking Horse
| Device Type | # Households | % Households |
| Desktop or Laptop | 52 | 85.3% |
| Smartphone | 61 | 100.0% |
| Tablet | 54 | 88.5% |
| No Computing Device | 0 | 0.0% |
| Total | 61 | 100.0% |
Internet Access in Kicking Horse
| Internet Type | # Households | % Households |
| Dial-Up Internet | 0 | 0.0% |
| Broadband Home | 61 | 100.0% |
| Cellular Data Only | 0 | 0.0% |
| Satellite Internet | 0 | 0.0% |
| No Internet | 0 | 0.0% |
| Total | 61 | 100.0% |
Kicking Horse Summary
Kicking Horse, Montana is a small town located in the western part of the state, near the Idaho border. It is situated in the foothills of the Rocky Mountains, and is surrounded by stunning natural beauty. The town has a population of just over 500 people, and is known for its small-town charm and friendly atmosphere.
History
Kicking Horse was founded in 1883 by a group of settlers from the nearby town of Bozeman. The settlers were looking for a place to settle and raise their families, and they chose the area because of its beautiful scenery and abundant natural resources. The town was named after a nearby mountain, which was named after a Native American legend about a horse that kicked a mountain into the sky.
The town quickly grew, and by the early 1900s, it had become a bustling center of commerce and industry. The town was home to several sawmills, a flour mill, a blacksmith shop, and a general store. The town also had a post office, a school, and a church.
Geography
Kicking Horse is located in the western part of Montana, near the Idaho border. It is situated in the foothills of the Rocky Mountains, and is surrounded by stunning natural beauty. The town is located at an elevation of 4,500 feet, and is surrounded by mountains, forests, and rivers. The nearby Kootenai River is a popular destination for fishing and rafting.
The climate in Kicking Horse is generally mild, with warm summers and cold winters. The average temperature in the summer is around 70 degrees Fahrenheit, and the average temperature in the winter is around 20 degrees Fahrenheit.
Economy
Kicking Horse has a small but vibrant economy. The town is home to several small businesses, including a general store, a restaurant, and a gas station. The town also has a small sawmill, which provides jobs for many of the town’s residents.
The town is also home to several tourist attractions, including a museum, a historic hotel, and a ski resort. The ski resort is a popular destination for tourists, and it provides jobs for many of the town’s residents.
Demographics
Kicking Horse has a population of just over 500 people. The town is predominantly white, with a small percentage of Native American and Hispanic residents. The median household income in the town is around $40,000, and the median home value is around $150,000.
Kicking Horse is a small but vibrant town, with a rich history and a friendly atmosphere. The town is surrounded by stunning natural beauty, and it is a popular destination for tourists and outdoor enthusiasts. The town has a small but vibrant economy, and it is a great place to live and work.
Common Questions
What is Per Capita Income in Kicking Horse?
Per Capita income in Kicking Horse is $40,878.
What is the Median Family Income in Kicking Horse?
Median Family Income in Kicking Horse is $74,357.
What is the Median Household income in Kicking Horse?
Median Household Income in Kicking Horse is $74,036.
What is Inequality or Gini Index in Kicking Horse?
Inequality or Gini Index in Kicking Horse is 0.17.
What is the Total Population of Kicking Horse?
Total Population of Kicking Horse is 106.
What is the Total Male Population of Kicking Horse?
Total Male Population of Kicking Horse is 56.
What is the Total Female Population of Kicking Horse?
Total Female Population of Kicking Horse is 50.
What is the Ratio of Males per 100 Females in Kicking Horse?
There are 112.00 Males per 100 Females in Kicking Horse.
What is the Ratio of Females per 100 Males in Kicking Horse?
There are 89.29 Females per 100 Males in Kicking Horse.
What is the Median Population Age in Kicking Horse?
Median Population Age in Kicking Horse is 63.5 Years.
What is the Average Family Size in Kicking Horse
Average Family Size in Kicking Horse is 1.9 People.
What is the Average Household Size in Kicking Horse
Average Household Size in Kicking Horse is 1.7 People.
How Large is the Labor Force in Kicking Horse?
There are 79 People in the Labor Forcein in Kicking Horse.
What is the Percentage of People in the Labor Force in Kicking Horse?
74.5% of People are in the Labor Force in Kicking Horse.