Tarpon Springs, FL Map & Demographics
Tarpon Springs Map
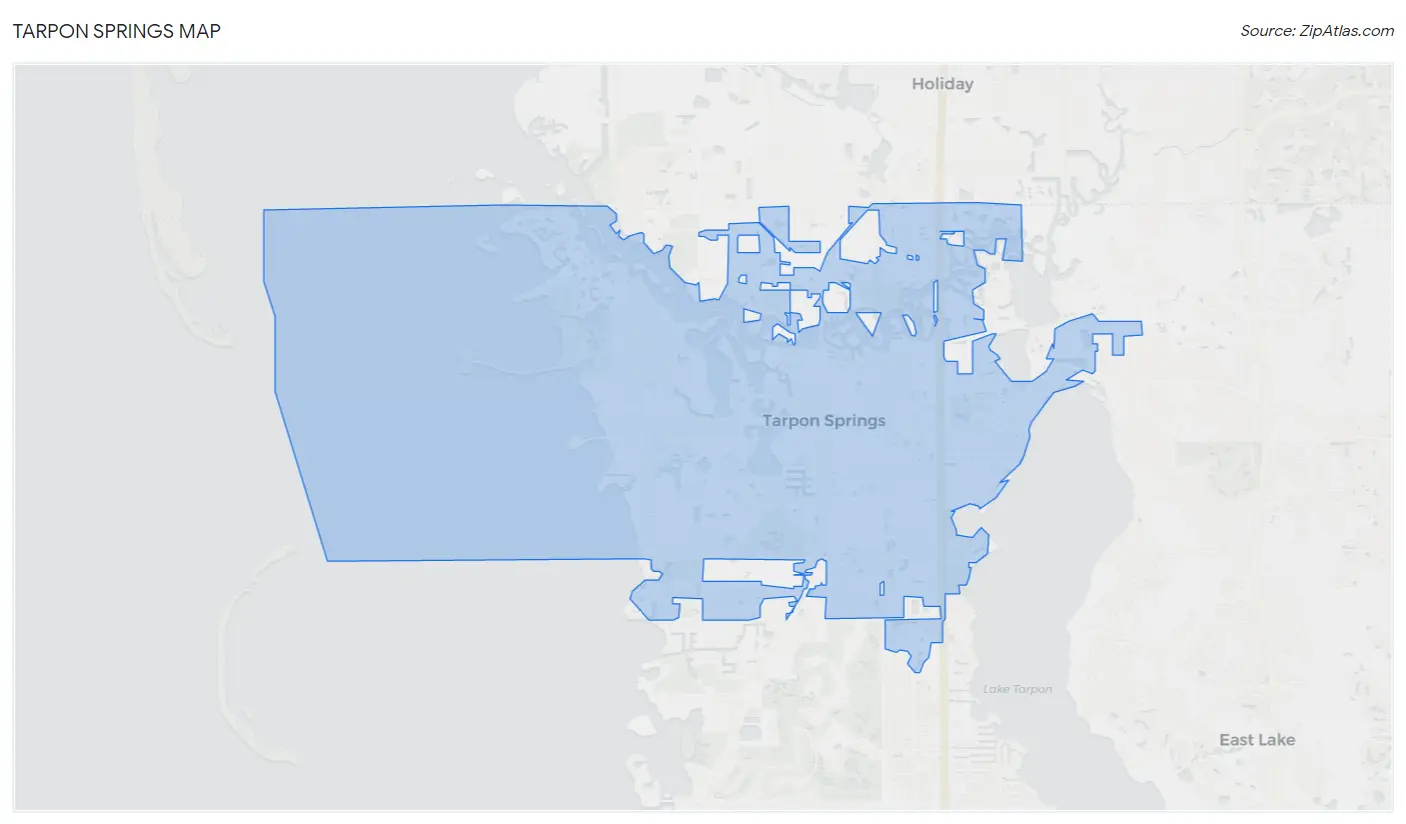
Tarpon Springs Overview
$49,150
PER CAPITA INCOME
$87,950
AVG FAMILY INCOME
$63,836
AVG HOUSEHOLD INCOME
18.0%
WAGE / INCOME GAP [ % ]
82.0¢/ $1
WAGE / INCOME GAP [ $ ]
0.54
INEQUALITY / GINI INDEX
25,355
TOTAL POPULATION
12,042
MALE POPULATION
13,313
FEMALE POPULATION
90.45
MALES / 100 FEMALES
110.55
FEMALES / 100 MALES
54.1
MEDIAN AGE
2.9
AVG FAMILY SIZE
2.2
AVG HOUSEHOLD SIZE
11,341
LABOR FORCE [ PEOPLE ]
50.7%
PERCENT IN LABOR FORCE
5.5%
UNEMPLOYMENT RATE
Tarpon Springs Area Codes
Income in Tarpon Springs
Income Overview in Tarpon Springs
Per Capita Income in Tarpon Springs is $49,150, while median incomes of families and households are $87,950 and $63,836 respectively.
| Characteristic | Number | Measure |
| Per Capita Income | 25,355 | $49,150 |
| Median Family Income | 6,458 | $87,950 |
| Mean Family Income | 6,458 | $112,170 |
| Median Household Income | 11,300 | $63,836 |
| Mean Household Income | 11,300 | $105,908 |
| Income Deficit | 6,458 | $0 |
| Wage / Income Gap (%) | 25,355 | 18.02% |
| Wage / Income Gap ($) | 25,355 | 81.98¢ per $1 |
| Gini / Inequality Index | 25,355 | 0.54 |
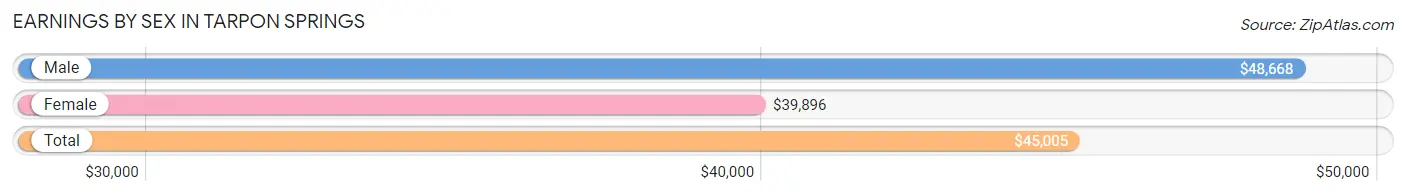
Earnings by Sex in Tarpon Springs
Average Earnings in Tarpon Springs are $45,005, $48,668 for men and $39,896 for women, a difference of 18.0%.
| Sex | Number | Average Earnings |
| Male | 6,372 (53.6%) | $48,668 |
| Female | 5,518 (46.4%) | $39,896 |
| Total | 11,890 (100.0%) | $45,005 |
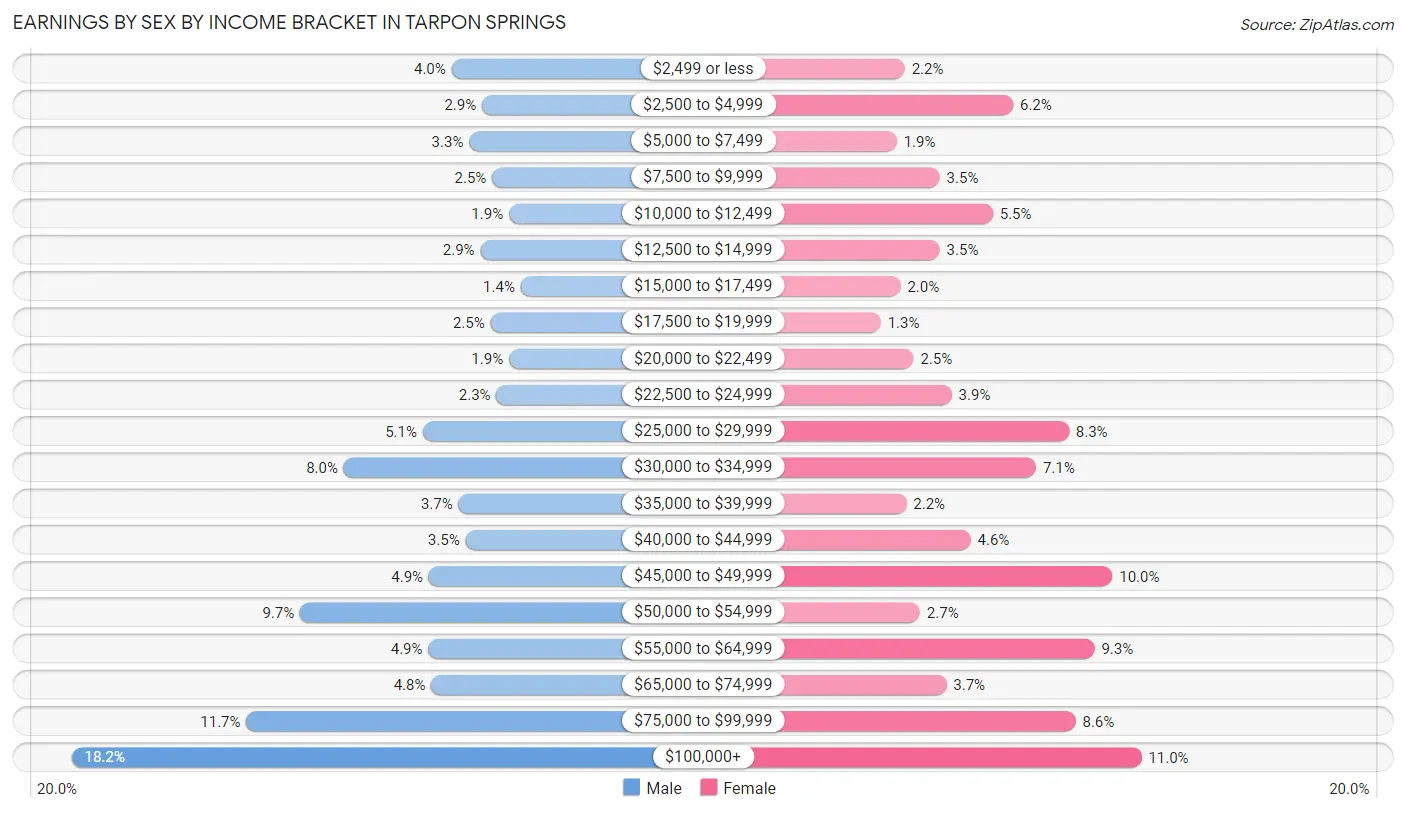
Earnings by Sex by Income Bracket in Tarpon Springs
The most common earnings brackets in Tarpon Springs are $100,000+ for men (1,162 | 18.2%) and $100,000+ for women (609 | 11.0%).
| Income | Male | Female |
| $2,499 or less | 255 (4.0%) | 120 (2.2%) |
| $2,500 to $4,999 | 182 (2.9%) | 344 (6.2%) |
| $5,000 to $7,499 | 213 (3.3%) | 103 (1.9%) |
| $7,500 to $9,999 | 158 (2.5%) | 192 (3.5%) |
| $10,000 to $12,499 | 118 (1.8%) | 302 (5.5%) |
| $12,500 to $14,999 | 186 (2.9%) | 192 (3.5%) |
| $15,000 to $17,499 | 90 (1.4%) | 111 (2.0%) |
| $17,500 to $19,999 | 162 (2.5%) | 70 (1.3%) |
| $20,000 to $22,499 | 118 (1.8%) | 138 (2.5%) |
| $22,500 to $24,999 | 148 (2.3%) | 217 (3.9%) |
| $25,000 to $29,999 | 324 (5.1%) | 459 (8.3%) |
| $30,000 to $34,999 | 512 (8.0%) | 391 (7.1%) |
| $35,000 to $39,999 | 238 (3.7%) | 123 (2.2%) |
| $40,000 to $44,999 | 222 (3.5%) | 256 (4.6%) |
| $45,000 to $49,999 | 309 (4.9%) | 549 (10.0%) |
| $50,000 to $54,999 | 617 (9.7%) | 151 (2.7%) |
| $55,000 to $64,999 | 310 (4.9%) | 512 (9.3%) |
| $65,000 to $74,999 | 303 (4.8%) | 206 (3.7%) |
| $75,000 to $99,999 | 745 (11.7%) | 473 (8.6%) |
| $100,000+ | 1,162 (18.2%) | 609 (11.0%) |
| Total | 6,372 (100.0%) | 5,518 (100.0%) |
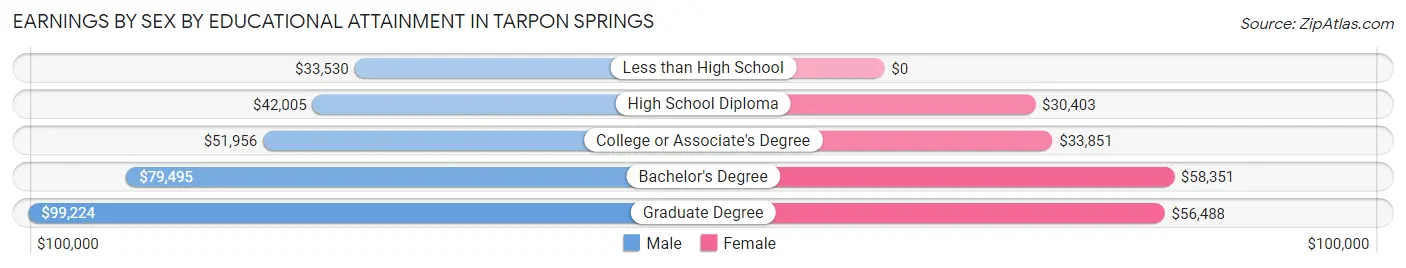
Earnings by Sex by Educational Attainment in Tarpon Springs
Average earnings in Tarpon Springs are $51,495 for men and $45,000 for women, a difference of 12.6%. Men with an educational attainment of graduate degree enjoy the highest average annual earnings of $99,224, while those with less than high school education earn the least with $33,530. Women with an educational attainment of bachelor's degree earn the most with the average annual earnings of $58,351, while those with high school diploma education have the smallest earnings of $30,403.
| Educational Attainment | Male Income | Female Income |
| Less than High School | $33,530 | $0 |
| High School Diploma | $42,005 | $30,403 |
| College or Associate's Degree | $51,956 | $33,851 |
| Bachelor's Degree | $79,495 | $58,351 |
| Graduate Degree | $99,224 | $56,488 |
| Total | $51,495 | $45,000 |
Family Income in Tarpon Springs
Family Income Brackets in Tarpon Springs
According to the Tarpon Springs family income data, there are 1,253 families falling into the $100,000 to $149,999 income range, which is the most common income bracket and makes up 19.4% of all families. Conversely, the $10,000 to $14,999 income bracket is the least frequent group with only 52 families (0.8%) belonging to this category.
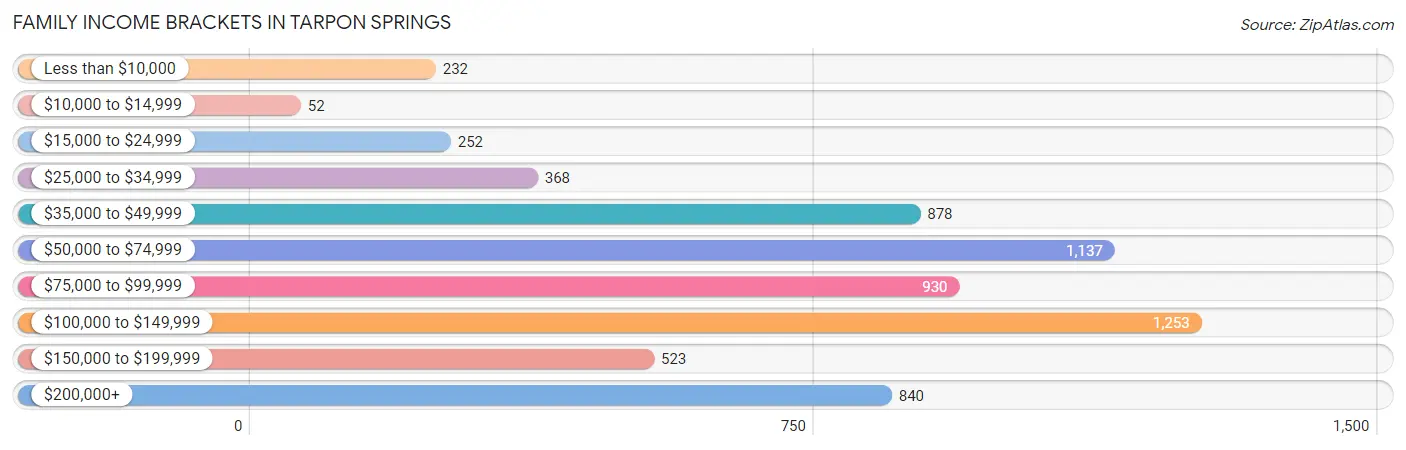
| Income Bracket | # Families | % Families |
| Less than $10,000 | 232 | 3.6% |
| $10,000 to $14,999 | 52 | 0.8% |
| $15,000 to $24,999 | 252 | 3.9% |
| $25,000 to $34,999 | 368 | 5.7% |
| $35,000 to $49,999 | 878 | 13.6% |
| $50,000 to $74,999 | 1,137 | 17.6% |
| $75,000 to $99,999 | 930 | 14.4% |
| $100,000 to $149,999 | 1,253 | 19.4% |
| $150,000 to $199,999 | 523 | 8.1% |
| $200,000+ | 840 | 13.0% |
Family Income by Famaliy Size in Tarpon Springs
3-person families (1,417 | 21.9%) account for the highest median family income in Tarpon Springs with $110,060 per family, while 3-person families (1,417 | 21.9%) have the highest median income of $36,687 per family member.
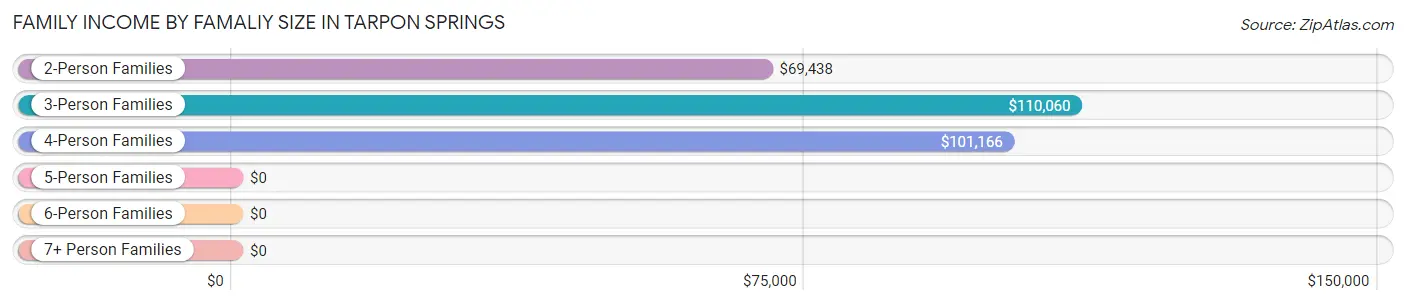
| Income Bracket | # Families | Median Income |
| 2-Person Families | 3,813 (59.0%) | $69,438 |
| 3-Person Families | 1,417 (21.9%) | $110,060 |
| 4-Person Families | 969 (15.0%) | $101,166 |
| 5-Person Families | 172 (2.7%) | $0 |
| 6-Person Families | 37 (0.6%) | $0 |
| 7+ Person Families | 50 (0.8%) | $0 |
| Total | 6,458 (100.0%) | $87,950 |
Family Income by Number of Earners in Tarpon Springs
The median family income in Tarpon Springs is $87,950, with families comprising 3+ earners (605) having the highest median family income of $139,226, while families with no earners (1,528) have the lowest median family income of $51,354, accounting for 9.4% and 23.7% of families, respectively.
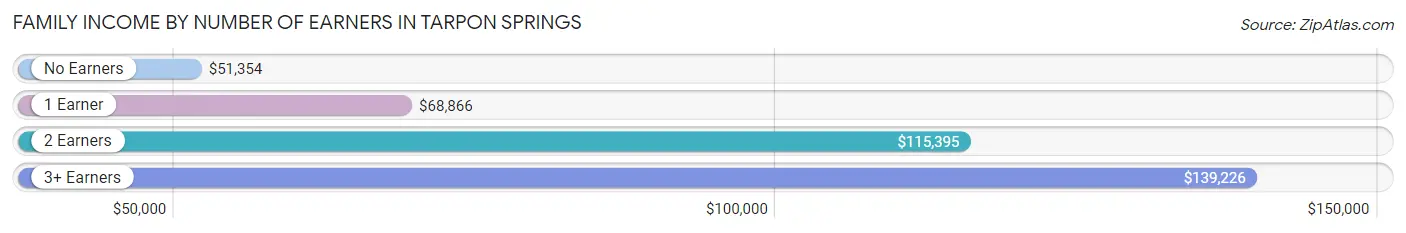
| Number of Earners | # Families | Median Income |
| No Earners | 1,528 (23.7%) | $51,354 |
| 1 Earner | 2,473 (38.3%) | $68,866 |
| 2 Earners | 1,852 (28.7%) | $115,395 |
| 3+ Earners | 605 (9.4%) | $139,226 |
| Total | 6,458 (100.0%) | $87,950 |
Household Income in Tarpon Springs
Household Income Brackets in Tarpon Springs
With 1,763 households falling in the category, the $100,000 to $149,999 income range is the most frequent in Tarpon Springs, accounting for 15.6% of all households. In contrast, only 588 households (5.2%) fall into the $150,000 to $199,999 income bracket, making it the least populous group.
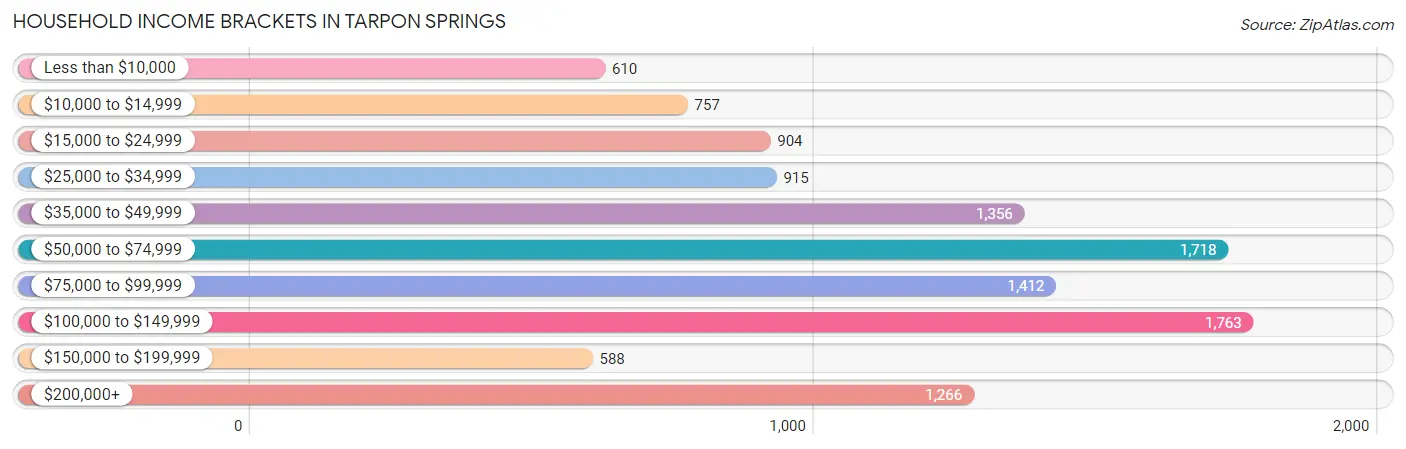
| Income Bracket | # Households | % Households |
| Less than $10,000 | 610 | 5.4% |
| $10,000 to $14,999 | 757 | 6.7% |
| $15,000 to $24,999 | 904 | 8.0% |
| $25,000 to $34,999 | 915 | 8.1% |
| $35,000 to $49,999 | 1,356 | 12.0% |
| $50,000 to $74,999 | 1,718 | 15.2% |
| $75,000 to $99,999 | 1,412 | 12.5% |
| $100,000 to $149,999 | 1,763 | 15.6% |
| $150,000 to $199,999 | 588 | 5.2% |
| $200,000+ | 1,266 | 11.2% |
Household Income by Householder Age in Tarpon Springs
The median household income in Tarpon Springs is $63,836, with the highest median household income of $94,146 found in the 25 to 44 years age bracket for the primary householder. A total of 1,693 households (15.0%) fall into this category. Meanwhile, the 15 to 24 years age bracket for the primary householder has the lowest median household income of $0, with 103 households (0.9%) in this group.
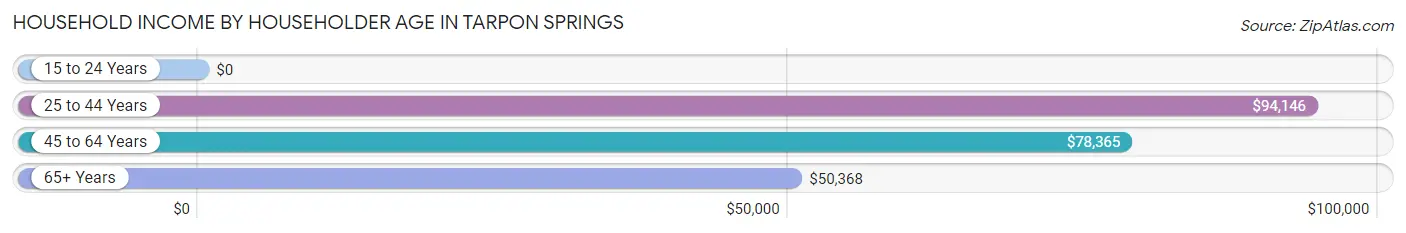
| Income Bracket | # Households | Median Income |
| 15 to 24 Years | 103 (0.9%) | $0 |
| 25 to 44 Years | 1,693 (15.0%) | $94,146 |
| 45 to 64 Years | 4,473 (39.6%) | $78,365 |
| 65+ Years | 5,031 (44.5%) | $50,368 |
| Total | 11,300 (100.0%) | $63,836 |
Poverty in Tarpon Springs
Income Below Poverty by Sex and Age in Tarpon Springs
With 9.1% poverty level for males and 12.0% for females among the residents of Tarpon Springs, 15 year old males and 15 year old females are the most vulnerable to poverty, with 39 males (25.5%) and 52 females (28.9%) in their respective age groups living below the poverty level.
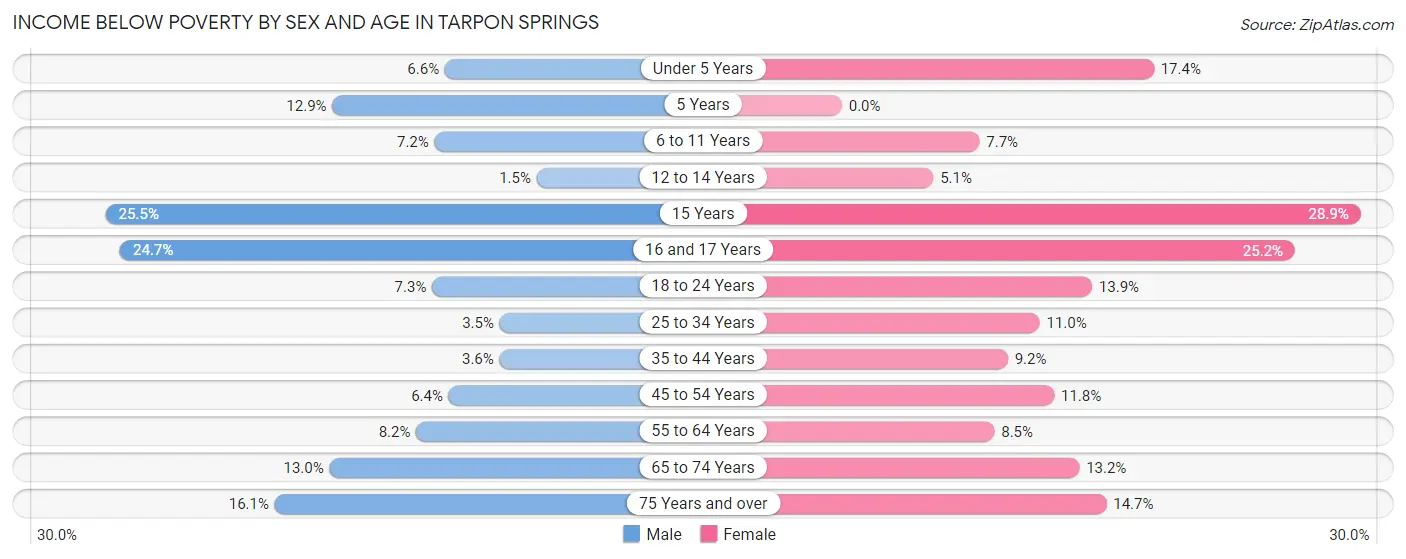
| Age Bracket | Male | Female |
| Under 5 Years | 29 (6.6%) | 82 (17.4%) |
| 5 Years | 9 (12.9%) | 0 (0.0%) |
| 6 to 11 Years | 35 (7.2%) | 38 (7.7%) |
| 12 to 14 Years | 4 (1.5%) | 14 (5.1%) |
| 15 Years | 39 (25.5%) | 52 (28.9%) |
| 16 and 17 Years | 38 (24.7%) | 55 (25.2%) |
| 18 to 24 Years | 47 (7.3%) | 122 (13.9%) |
| 25 to 34 Years | 38 (3.5%) | 117 (11.0%) |
| 35 to 44 Years | 45 (3.5%) | 103 (9.2%) |
| 45 to 54 Years | 101 (6.4%) | 205 (11.8%) |
| 55 to 64 Years | 172 (8.2%) | 192 (8.5%) |
| 65 to 74 Years | 240 (13.0%) | 307 (13.2%) |
| 75 Years and over | 271 (16.1%) | 298 (14.7%) |
| Total | 1,068 (9.1%) | 1,585 (12.0%) |
Income Above Poverty by Sex and Age in Tarpon Springs
According to the poverty statistics in Tarpon Springs, males aged 12 to 14 years and females aged 5 years are the age groups that are most secure financially, with 98.5% of males and 100.0% of females in these age groups living above the poverty line.
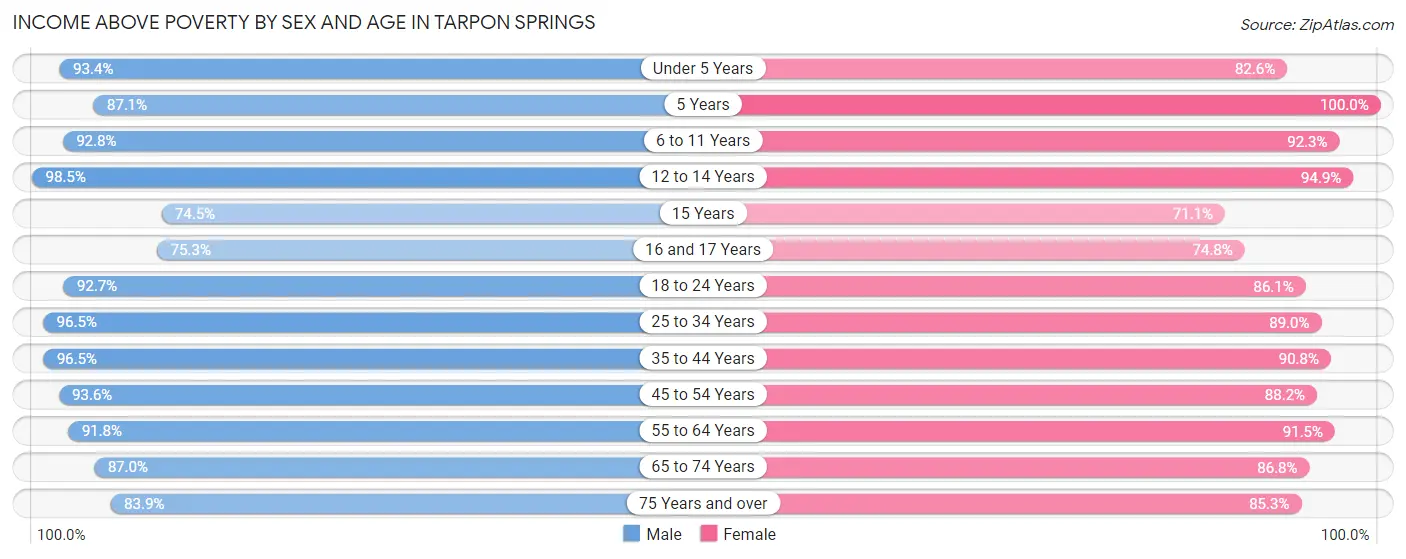
| Age Bracket | Male | Female |
| Under 5 Years | 411 (93.4%) | 390 (82.6%) |
| 5 Years | 61 (87.1%) | 119 (100.0%) |
| 6 to 11 Years | 453 (92.8%) | 458 (92.3%) |
| 12 to 14 Years | 266 (98.5%) | 261 (94.9%) |
| 15 Years | 114 (74.5%) | 128 (71.1%) |
| 16 and 17 Years | 116 (75.3%) | 163 (74.8%) |
| 18 to 24 Years | 597 (92.7%) | 754 (86.1%) |
| 25 to 34 Years | 1,034 (96.5%) | 946 (89.0%) |
| 35 to 44 Years | 1,222 (96.5%) | 1,012 (90.8%) |
| 45 to 54 Years | 1,482 (93.6%) | 1,529 (88.2%) |
| 55 to 64 Years | 1,929 (91.8%) | 2,069 (91.5%) |
| 65 to 74 Years | 1,603 (87.0%) | 2,016 (86.8%) |
| 75 Years and over | 1,415 (83.9%) | 1,725 (85.3%) |
| Total | 10,703 (90.9%) | 11,570 (87.9%) |
Income Below Poverty Among Married-Couple Families in Tarpon Springs
The poverty statistics for married-couple families in Tarpon Springs show that 2.9% or 146 of the total 5,018 families live below the poverty line. Families with 5 or more children have the highest poverty rate of 100.0%, comprising of 3 families. On the other hand, families with 3 or 4 children have the lowest poverty rate of 0.0%, which includes 0 families.
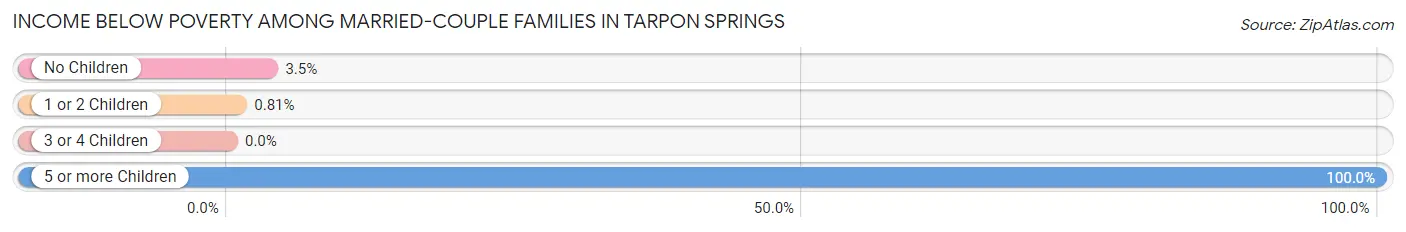
| Children | Above Poverty | Below Poverty |
| No Children | 3,668 (96.5%) | 134 (3.5%) |
| 1 or 2 Children | 1,106 (99.2%) | 9 (0.8%) |
| 3 or 4 Children | 98 (100.0%) | 0 (0.0%) |
| 5 or more Children | 0 (0.0%) | 3 (100.0%) |
| Total | 4,872 (97.1%) | 146 (2.9%) |
Income Below Poverty Among Single-Parent Households in Tarpon Springs
According to the poverty data in Tarpon Springs, 6.4% or 10 single-father households and 16.5% or 212 single-mother households are living below the poverty line. Among single-father households, those with no children have the highest poverty rate, with 10 households (14.1%) experiencing poverty. Likewise, among single-mother households, those with 3 or 4 children have the highest poverty rate, with 64 households (56.6%) falling below the poverty line.
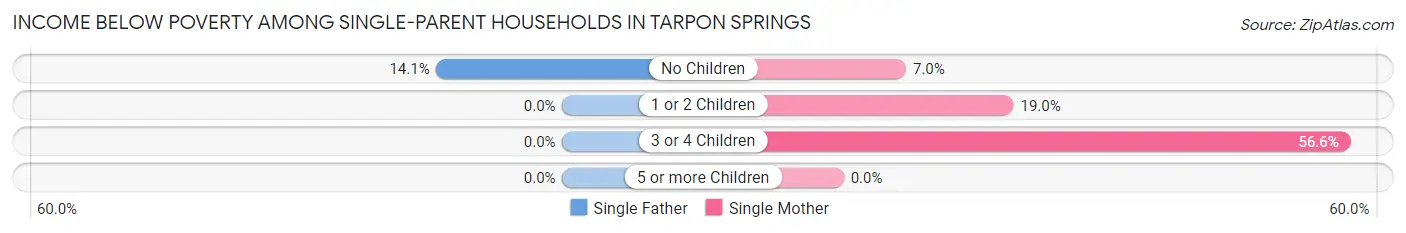
| Children | Single Father | Single Mother |
| No Children | 10 (14.1%) | 43 (7.0%) |
| 1 or 2 Children | 0 (0.0%) | 105 (19.0%) |
| 3 or 4 Children | 0 (0.0%) | 64 (56.6%) |
| 5 or more Children | 0 (0.0%) | 0 (0.0%) |
| Total | 10 (6.4%) | 212 (16.5%) |
Income Below Poverty Among Married-Couple vs Single-Parent Households in Tarpon Springs
The poverty data for Tarpon Springs shows that 146 of the married-couple family households (2.9%) and 222 of the single-parent households (15.4%) are living below the poverty level. Within the married-couple family households, those with 5 or more children have the highest poverty rate, with 3 households (100.0%) falling below the poverty line. Among the single-parent households, those with 3 or 4 children have the highest poverty rate, with 64 household (56.6%) living below poverty.
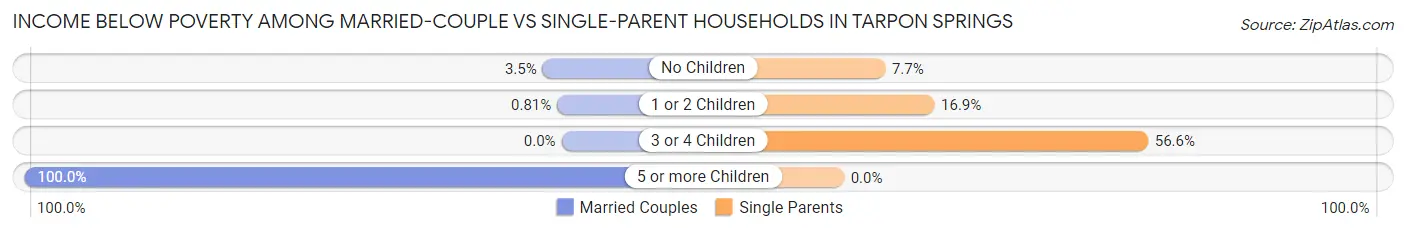
| Children | Married-Couple Families | Single-Parent Households |
| No Children | 134 (3.5%) | 53 (7.7%) |
| 1 or 2 Children | 9 (0.8%) | 105 (16.9%) |
| 3 or 4 Children | 0 (0.0%) | 64 (56.6%) |
| 5 or more Children | 3 (100.0%) | 0 (0.0%) |
| Total | 146 (2.9%) | 222 (15.4%) |
Race in Tarpon Springs
The most populous races in Tarpon Springs are White / Caucasian (21,051 | 83.0%), Hispanic or Latino (2,936 | 11.6%), and Two or more Races (1,909 | 7.5%).
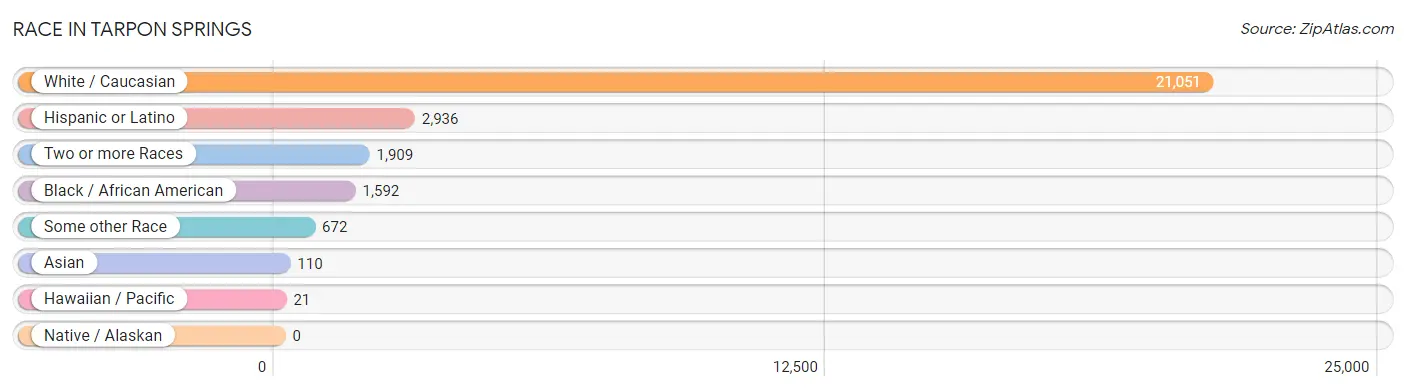
| Race | # Population | % Population |
| Asian | 110 | 0.4% |
| Black / African American | 1,592 | 6.3% |
| Hawaiian / Pacific | 21 | 0.1% |
| Hispanic or Latino | 2,936 | 11.6% |
| Native / Alaskan | 0 | 0.0% |
| White / Caucasian | 21,051 | 83.0% |
| Two or more Races | 1,909 | 7.5% |
| Some other Race | 672 | 2.6% |
| Total | 25,355 | 100.0% |
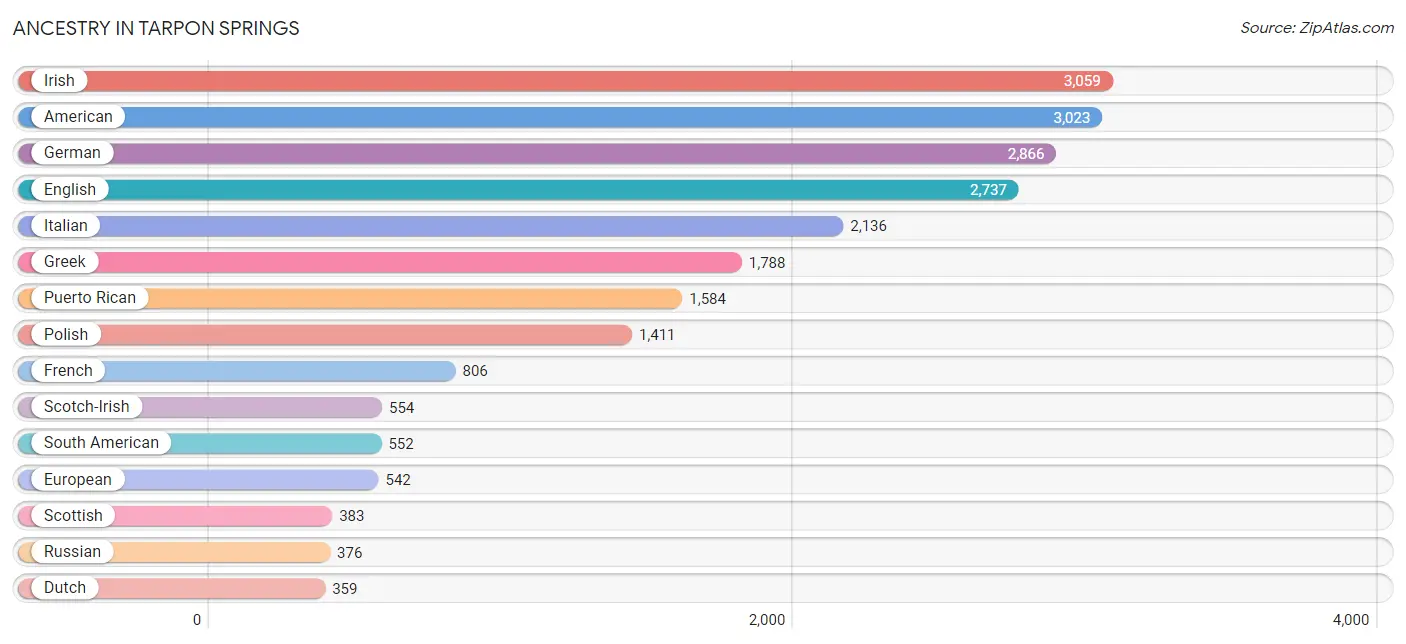
Ancestry in Tarpon Springs
The most populous ancestries reported in Tarpon Springs are Irish (3,059 | 12.1%), American (3,023 | 11.9%), German (2,866 | 11.3%), English (2,737 | 10.8%), and Italian (2,136 | 8.4%), together accounting for 54.5% of all Tarpon Springs residents.
| Ancestry | # Population | % Population |
| African | 47 | 0.2% |
| Albanian | 163 | 0.6% |
| American | 3,023 | 11.9% |
| Arab | 47 | 0.2% |
| Argentinean | 72 | 0.3% |
| Austrian | 13 | 0.1% |
| Belgian | 67 | 0.3% |
| Bhutanese | 28 | 0.1% |
| Blackfeet | 18 | 0.1% |
| Brazilian | 36 | 0.1% |
| British | 144 | 0.6% |
| Burmese | 29 | 0.1% |
| Canadian | 129 | 0.5% |
| Carpatho Rusyn | 20 | 0.1% |
| Central American Indian | 27 | 0.1% |
| Cherokee | 38 | 0.2% |
| Colombian | 311 | 1.2% |
| Croatian | 36 | 0.1% |
| Cuban | 156 | 0.6% |
| Cypriot | 12 | 0.1% |
| Czech | 62 | 0.2% |
| Czechoslovakian | 47 | 0.2% |
| Danish | 95 | 0.4% |
| Dominican | 154 | 0.6% |
| Dutch | 359 | 1.4% |
| Eastern European | 50 | 0.2% |
| Ecuadorian | 155 | 0.6% |
| English | 2,737 | 10.8% |
| Estonian | 169 | 0.7% |
| Ethiopian | 35 | 0.1% |
| European | 542 | 2.1% |
| Finnish | 19 | 0.1% |
| French | 806 | 3.2% |
| French Canadian | 246 | 1.0% |
| German | 2,866 | 11.3% |
| Greek | 1,788 | 7.0% |
| Guamanian / Chamorro | 62 | 0.2% |
| Haitian | 27 | 0.1% |
| Hungarian | 91 | 0.4% |
| Iranian | 9 | 0.0% |
| Irish | 3,059 | 12.1% |
| Italian | 2,136 | 8.4% |
| Jamaican | 96 | 0.4% |
| Korean | 164 | 0.6% |
| Latvian | 8 | 0.0% |
| Lithuanian | 30 | 0.1% |
| Macedonian | 55 | 0.2% |
| Mexican | 289 | 1.1% |
| Mexican American Indian | 35 | 0.1% |
| Northern European | 79 | 0.3% |
| Norwegian | 183 | 0.7% |
| Pennsylvania German | 14 | 0.1% |
| Peruvian | 14 | 0.1% |
| Polish | 1,411 | 5.6% |
| Portuguese | 74 | 0.3% |
| Puerto Rican | 1,584 | 6.2% |
| Romanian | 14 | 0.1% |
| Russian | 376 | 1.5% |
| Scandinavian | 24 | 0.1% |
| Scotch-Irish | 554 | 2.2% |
| Scottish | 383 | 1.5% |
| Serbian | 15 | 0.1% |
| Slovak | 51 | 0.2% |
| Slovene | 48 | 0.2% |
| South American | 552 | 2.2% |
| Spaniard | 32 | 0.1% |
| Spanish | 21 | 0.1% |
| Sri Lankan | 15 | 0.1% |
| Subsaharan African | 82 | 0.3% |
| Swedish | 253 | 1.0% |
| Swiss | 28 | 0.1% |
| Thai | 14 | 0.1% |
| Turkish | 70 | 0.3% |
| Ukrainian | 183 | 0.7% |
| Welsh | 222 | 0.9% |
| West Indian | 27 | 0.1% | View All 76 Rows |
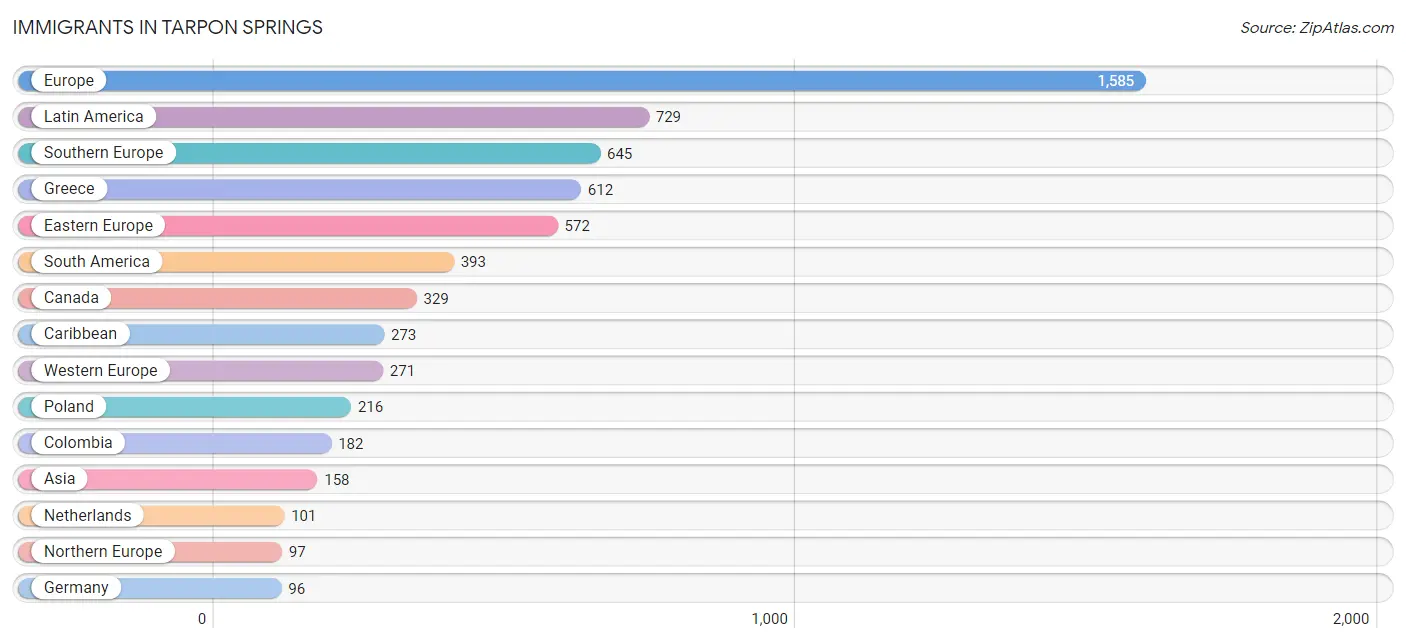
Immigrants in Tarpon Springs
The most numerous immigrant groups reported in Tarpon Springs came from Europe (1,585 | 6.2%), Latin America (729 | 2.9%), Southern Europe (645 | 2.5%), Greece (612 | 2.4%), and Eastern Europe (572 | 2.3%), together accounting for 16.3% of all Tarpon Springs residents.
| Immigration Origin | # Population | % Population |
| Africa | 57 | 0.2% |
| Albania | 82 | 0.3% |
| Argentina | 78 | 0.3% |
| Asia | 158 | 0.6% |
| Belgium | 16 | 0.1% |
| Brazil | 43 | 0.2% |
| Canada | 329 | 1.3% |
| Caribbean | 273 | 1.1% |
| Central America | 63 | 0.3% |
| Colombia | 182 | 0.7% |
| Croatia | 14 | 0.1% |
| Cuba | 20 | 0.1% |
| Czechoslovakia | 46 | 0.2% |
| Dominican Republic | 87 | 0.3% |
| Eastern Africa | 16 | 0.1% |
| Eastern Asia | 11 | 0.0% |
| Eastern Europe | 572 | 2.3% |
| Ecuador | 67 | 0.3% |
| Egypt | 21 | 0.1% |
| England | 41 | 0.2% |
| Ethiopia | 16 | 0.1% |
| Europe | 1,585 | 6.2% |
| France | 31 | 0.1% |
| Germany | 96 | 0.4% |
| Greece | 612 | 2.4% |
| Guyana | 9 | 0.0% |
| Haiti | 82 | 0.3% |
| India | 8 | 0.0% |
| Iran | 9 | 0.0% |
| Ireland | 29 | 0.1% |
| Italy | 33 | 0.1% |
| Jamaica | 67 | 0.3% |
| Japan | 11 | 0.0% |
| Jordan | 37 | 0.2% |
| Kazakhstan | 32 | 0.1% |
| Latin America | 729 | 2.9% |
| Lithuania | 18 | 0.1% |
| Mexico | 63 | 0.3% |
| Netherlands | 101 | 0.4% |
| Northern Africa | 21 | 0.1% |
| Northern Europe | 97 | 0.4% |
| Peru | 14 | 0.1% |
| Philippines | 45 | 0.2% |
| Poland | 216 | 0.9% |
| Russia | 13 | 0.1% |
| Scotland | 27 | 0.1% |
| Serbia | 14 | 0.1% |
| South Africa | 20 | 0.1% |
| South America | 393 | 1.5% |
| South Central Asia | 49 | 0.2% |
| South Eastern Asia | 55 | 0.2% |
| Southern Europe | 645 | 2.5% |
| St. Vincent and the Grenadines | 17 | 0.1% |
| Switzerland | 27 | 0.1% |
| Turkey | 6 | 0.0% |
| Vietnam | 10 | 0.0% |
| Western Asia | 43 | 0.2% |
| Western Europe | 271 | 1.1% | View All 58 Rows |
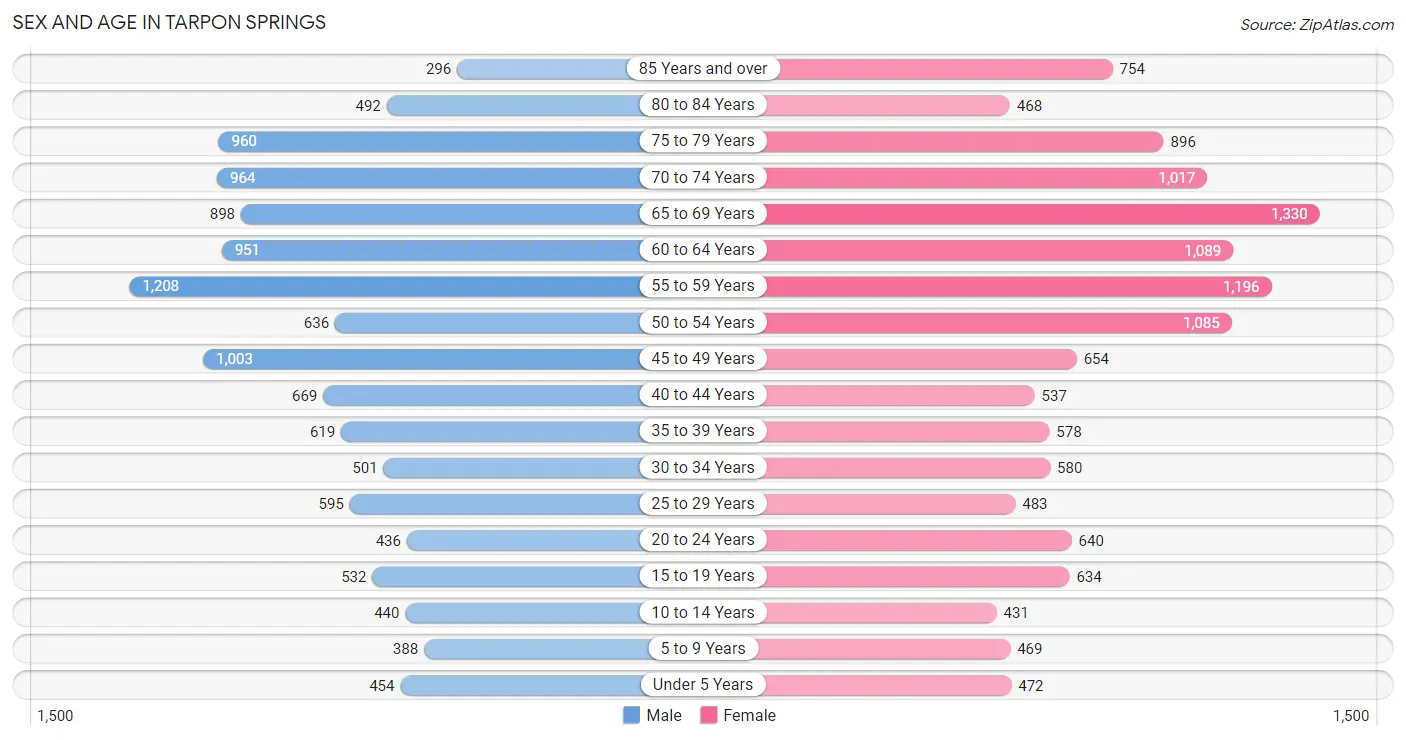
Sex and Age in Tarpon Springs
Sex and Age in Tarpon Springs
The most populous age groups in Tarpon Springs are 55 to 59 Years (1,208 | 10.0%) for men and 65 to 69 Years (1,330 | 10.0%) for women.
| Age Bracket | Male | Female |
| Under 5 Years | 454 (3.8%) | 472 (3.5%) |
| 5 to 9 Years | 388 (3.2%) | 469 (3.5%) |
| 10 to 14 Years | 440 (3.6%) | 431 (3.2%) |
| 15 to 19 Years | 532 (4.4%) | 634 (4.8%) |
| 20 to 24 Years | 436 (3.6%) | 640 (4.8%) |
| 25 to 29 Years | 595 (4.9%) | 483 (3.6%) |
| 30 to 34 Years | 501 (4.2%) | 580 (4.4%) |
| 35 to 39 Years | 619 (5.1%) | 578 (4.3%) |
| 40 to 44 Years | 669 (5.6%) | 537 (4.0%) |
| 45 to 49 Years | 1,003 (8.3%) | 654 (4.9%) |
| 50 to 54 Years | 636 (5.3%) | 1,085 (8.2%) |
| 55 to 59 Years | 1,208 (10.0%) | 1,196 (9.0%) |
| 60 to 64 Years | 951 (7.9%) | 1,089 (8.2%) |
| 65 to 69 Years | 898 (7.5%) | 1,330 (10.0%) |
| 70 to 74 Years | 964 (8.0%) | 1,017 (7.6%) |
| 75 to 79 Years | 960 (8.0%) | 896 (6.7%) |
| 80 to 84 Years | 492 (4.1%) | 468 (3.5%) |
| 85 Years and over | 296 (2.5%) | 754 (5.7%) |
| Total | 12,042 (100.0%) | 13,313 (100.0%) |
Families and Households in Tarpon Springs
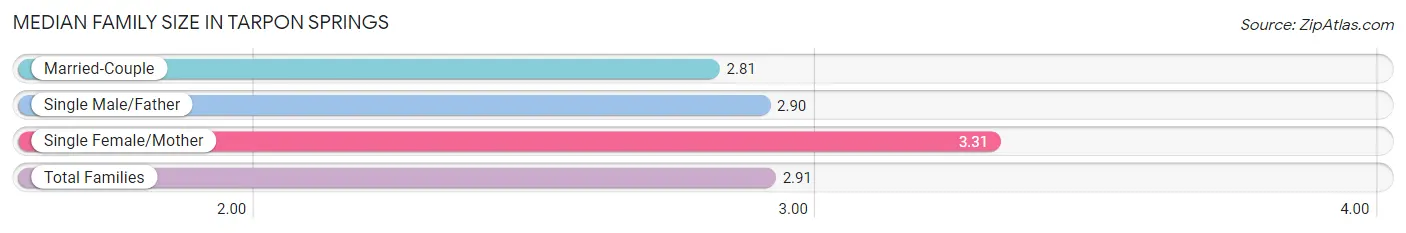
Median Family Size in Tarpon Springs
The median family size in Tarpon Springs is 2.91 persons per family, with single female/mother families (1,284 | 19.9%) accounting for the largest median family size of 3.31 persons per family. On the other hand, married-couple families (5,018 | 77.7%) represent the smallest median family size with 2.81 persons per family.
| Family Type | # Families | Family Size |
| Married-Couple | 5,018 (77.7%) | 2.81 |
| Single Male/Father | 156 (2.4%) | 2.90 |
| Single Female/Mother | 1,284 (19.9%) | 3.31 |
| Total Families | 6,458 (100.0%) | 2.91 |
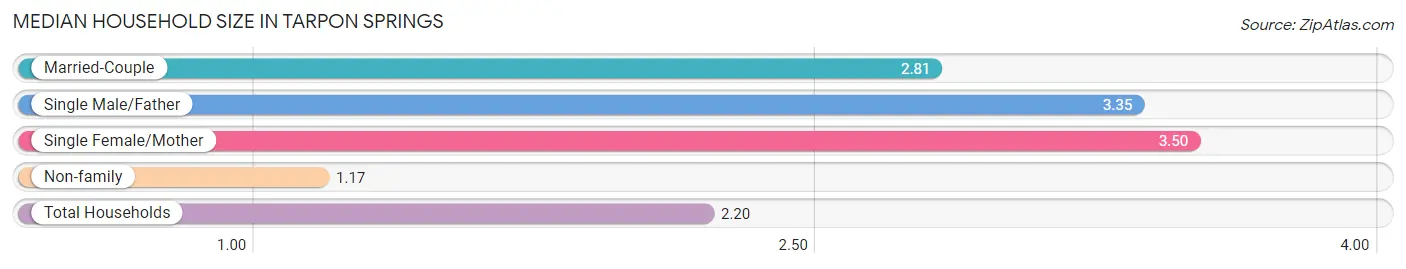
Median Household Size in Tarpon Springs
The median household size in Tarpon Springs is 2.20 persons per household, with single female/mother households (1,284 | 11.4%) accounting for the largest median household size of 3.5 persons per household. non-family households (4,842 | 42.8%) represent the smallest median household size with 1.17 persons per household.
| Household Type | # Households | Household Size |
| Married-Couple | 5,018 (44.4%) | 2.81 |
| Single Male/Father | 156 (1.4%) | 3.35 |
| Single Female/Mother | 1,284 (11.4%) | 3.50 |
| Non-family | 4,842 (42.8%) | 1.17 |
| Total Households | 11,300 (100.0%) | 2.20 |
Household Size by Marriage Status in Tarpon Springs
Out of a total of 11,300 households in Tarpon Springs, 6,458 (57.2%) are family households, while 4,842 (42.8%) are nonfamily households. The most numerous type of family households are 2-person households, comprising 3,678, and the most common type of nonfamily households are 1-person households, comprising 4,148.
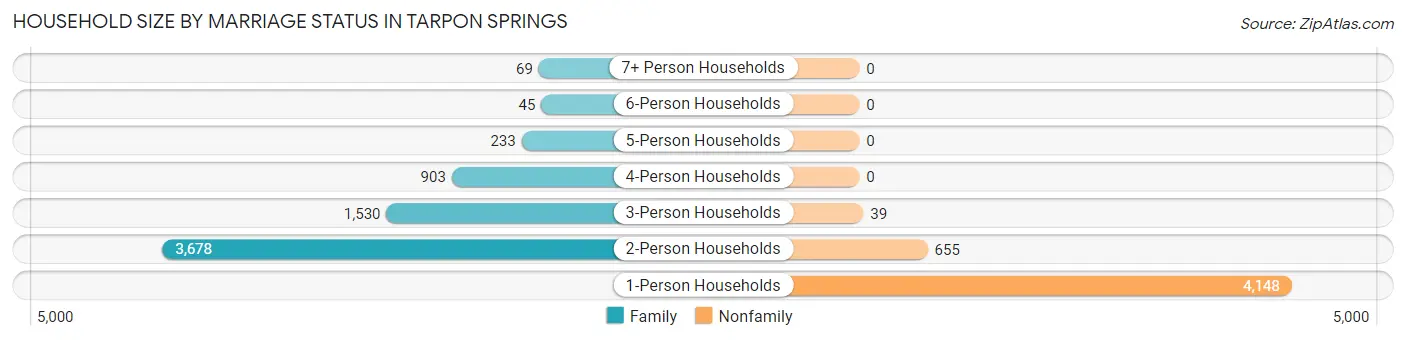
| Household Size | Family Households | Nonfamily Households |
| 1-Person Households | - | 4,148 (36.7%) |
| 2-Person Households | 3,678 (32.6%) | 655 (5.8%) |
| 3-Person Households | 1,530 (13.5%) | 39 (0.4%) |
| 4-Person Households | 903 (8.0%) | 0 (0.0%) |
| 5-Person Households | 233 (2.1%) | 0 (0.0%) |
| 6-Person Households | 45 (0.4%) | 0 (0.0%) |
| 7+ Person Households | 69 (0.6%) | 0 (0.0%) |
| Total | 6,458 (57.2%) | 4,842 (42.8%) |
Female Fertility in Tarpon Springs
Fertility by Age in Tarpon Springs
Average fertility rate in Tarpon Springs is 49.0 births per 1,000 women. Women in the age bracket of 15 to 19 years have the highest fertility rate with 69.0 births per 1,000 women. Women in the age bracket of 20 to 34 years acount for 52.3% of all women with births.
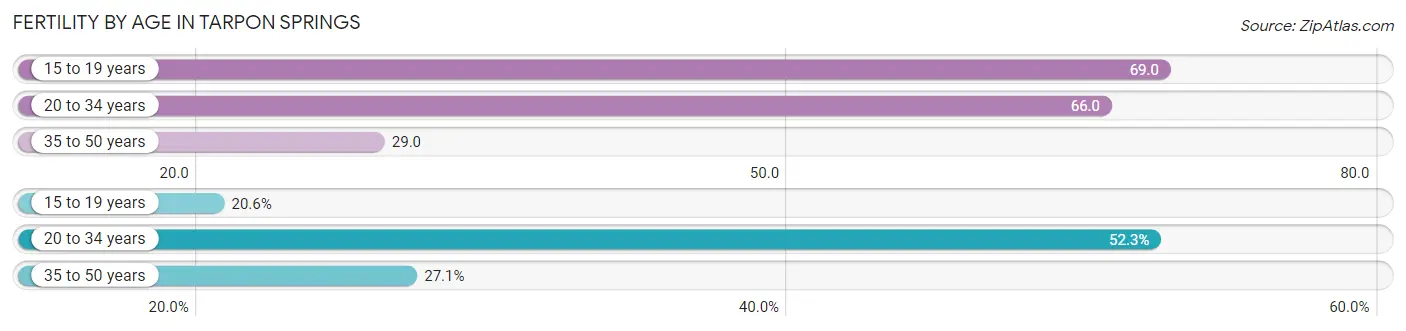
| Age Bracket | Women with Births | Births / 1,000 Women |
| 15 to 19 years | 44 (20.6%) | 69.0 |
| 20 to 34 years | 112 (52.3%) | 66.0 |
| 35 to 50 years | 58 (27.1%) | 29.0 |
| Total | 214 (100.0%) | 49.0 |
Fertility by Age by Marriage Status in Tarpon Springs
69.6% of women with births (214) in Tarpon Springs are married. The highest percentage of unmarried women with births falls into 15 to 19 years age bracket with 100.0% of them unmarried at the time of birth, while the lowest percentage of unmarried women with births belong to 35 to 50 years age bracket with 0.0% of them unmarried.
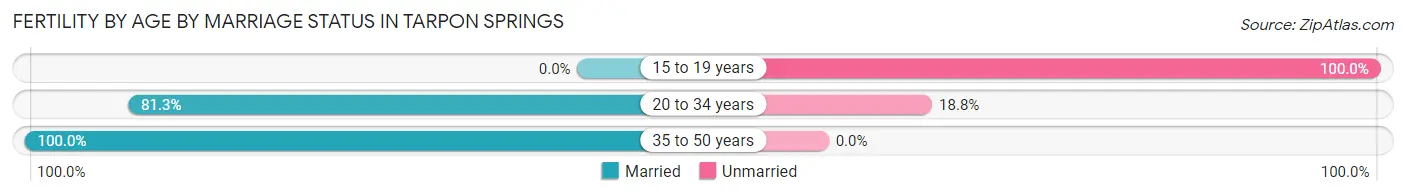
| Age Bracket | Married | Unmarried |
| 15 to 19 years | 0 (0.0%) | 44 (100.0%) |
| 20 to 34 years | 91 (81.2%) | 21 (18.8%) |
| 35 to 50 years | 58 (100.0%) | 0 (0.0%) |
| Total | 149 (69.6%) | 65 (30.4%) |
Fertility by Education in Tarpon Springs
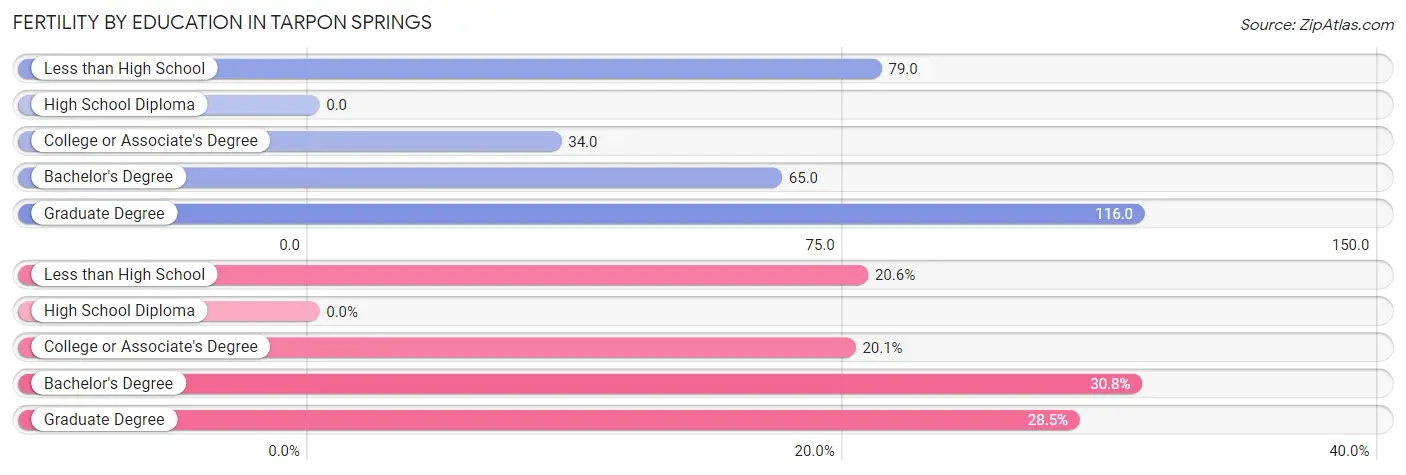
| Educational Attainment | Women with Births | Births / 1,000 Women |
| Less than High School | 44 (20.6%) | 79.0 |
| High School Diploma | 0 (0.0%) | 0.0 |
| College or Associate's Degree | 43 (20.1%) | 34.0 |
| Bachelor's Degree | 66 (30.8%) | 65.0 |
| Graduate Degree | 61 (28.5%) | 116.0 |
| Total | 214 (100.0%) | 49.0 |
Fertility by Education by Marriage Status in Tarpon Springs
30.4% of women with births in Tarpon Springs are unmarried. Women with the educational attainment of bachelor's degree are most likely to be married with 100.0% of them married at childbirth, while women with the educational attainment of less than high school are least likely to be married with 100.0% of them unmarried at childbirth.
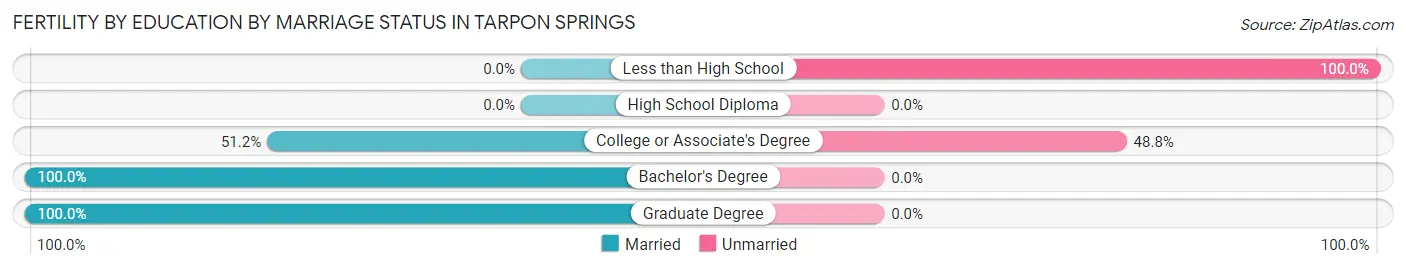
| Educational Attainment | Married | Unmarried |
| Less than High School | 0 (0.0%) | 44 (100.0%) |
| High School Diploma | 0 (0.0%) | 0 (0.0%) |
| College or Associate's Degree | 22 (51.2%) | 21 (48.8%) |
| Bachelor's Degree | 66 (100.0%) | 0 (0.0%) |
| Graduate Degree | 61 (100.0%) | 0 (0.0%) |
| Total | 149 (69.6%) | 65 (30.4%) |
Employment Characteristics in Tarpon Springs
Employment by Class of Employer in Tarpon Springs
Among the 10,500 employed individuals in Tarpon Springs, private company employees (7,208 | 68.6%), not-for-profit organizations (896 | 8.5%), and self-employed (incorporated) (684 | 6.5%) make up the most common classes of employment.
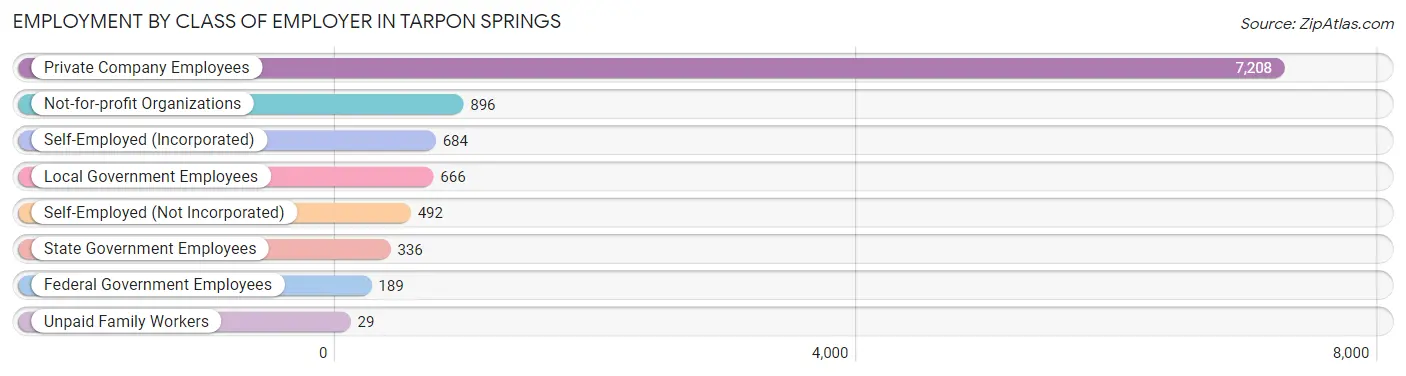
| Employer Class | # Employees | % Employees |
| Private Company Employees | 7,208 | 68.6% |
| Self-Employed (Incorporated) | 684 | 6.5% |
| Self-Employed (Not Incorporated) | 492 | 4.7% |
| Not-for-profit Organizations | 896 | 8.5% |
| Local Government Employees | 666 | 6.3% |
| State Government Employees | 336 | 3.2% |
| Federal Government Employees | 189 | 1.8% |
| Unpaid Family Workers | 29 | 0.3% |
| Total | 10,500 | 100.0% |
Employment Status by Age in Tarpon Springs
According to the labor force statistics for Tarpon Springs, out of the total population over 16 years of age (22,368), 50.7% or 11,341 individuals are in the labor force, with 5.5% or 624 of them unemployed. The age group with the highest labor force participation rate is 20 to 24 years, with 83.5% or 898 individuals in the labor force. Within the labor force, the 25 to 29 years age range has the highest percentage of unemployed individuals, with 12.2% or 100 of them being unemployed.
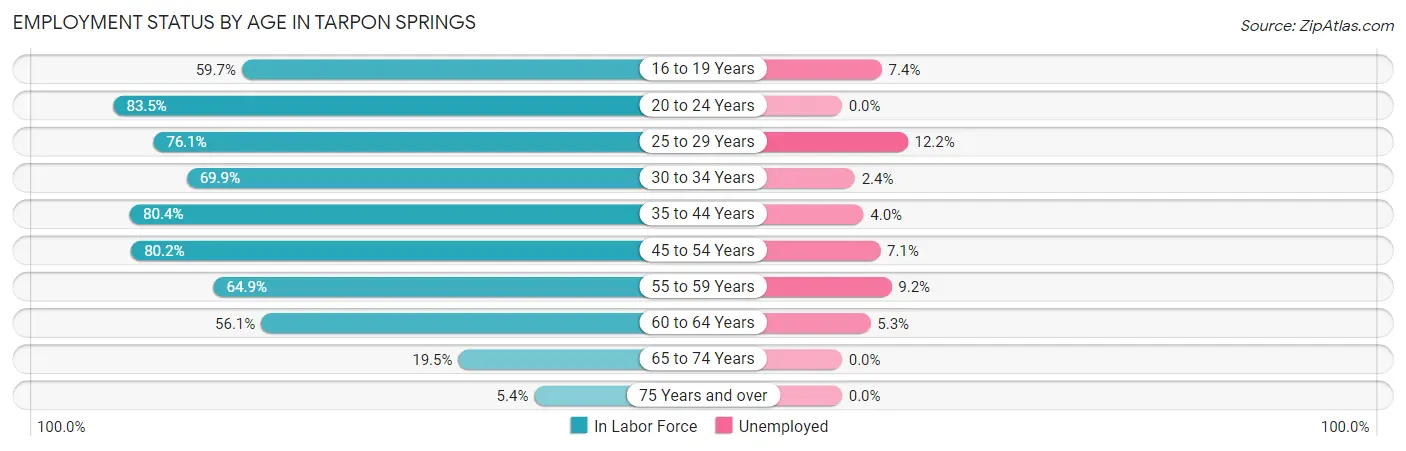
| Age Bracket | In Labor Force | Unemployed |
| 16 to 19 Years | 497 (59.7%) | 37 (7.4%) |
| 20 to 24 Years | 898 (83.5%) | 0 (0.0%) |
| 25 to 29 Years | 820 (76.1%) | 100 (12.2%) |
| 30 to 34 Years | 756 (69.9%) | 18 (2.4%) |
| 35 to 44 Years | 1,932 (80.4%) | 77 (4.0%) |
| 45 to 54 Years | 2,709 (80.2%) | 192 (7.1%) |
| 55 to 59 Years | 1,560 (64.9%) | 144 (9.2%) |
| 60 to 64 Years | 1,144 (56.1%) | 61 (5.3%) |
| 65 to 74 Years | 821 (19.5%) | 0 (0.0%) |
| 75 Years and over | 209 (5.4%) | 0 (0.0%) |
| Total | 11,341 (50.7%) | 624 (5.5%) |
Employment Status by Educational Attainment in Tarpon Springs
According to labor force statistics for Tarpon Springs, 72.0% of individuals (8,916) out of the total population between 25 and 64 years of age (12,384) are in the labor force, with 6.6% or 588 of them being unemployed. The group with the highest labor force participation rate are those with the educational attainment of college / associate degree, with 77.5% or 3,153 individuals in the labor force. Within the labor force, individuals with less than high school education have the highest percentage of unemployment, with 11.2% or 53 of them being unemployed.
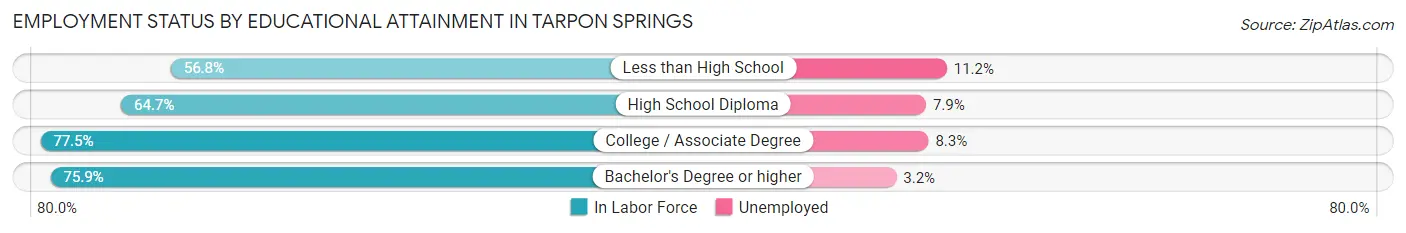
| Educational Attainment | In Labor Force | Unemployed |
| Less than High School | 472 (56.8%) | 93 (11.2%) |
| High School Diploma | 2,217 (64.7%) | 271 (7.9%) |
| College / Associate Degree | 3,153 (77.5%) | 338 (8.3%) |
| Bachelor's Degree or higher | 3,080 (75.9%) | 130 (3.2%) |
| Total | 8,916 (72.0%) | 817 (6.6%) |
Employment Occupations by Sex in Tarpon Springs
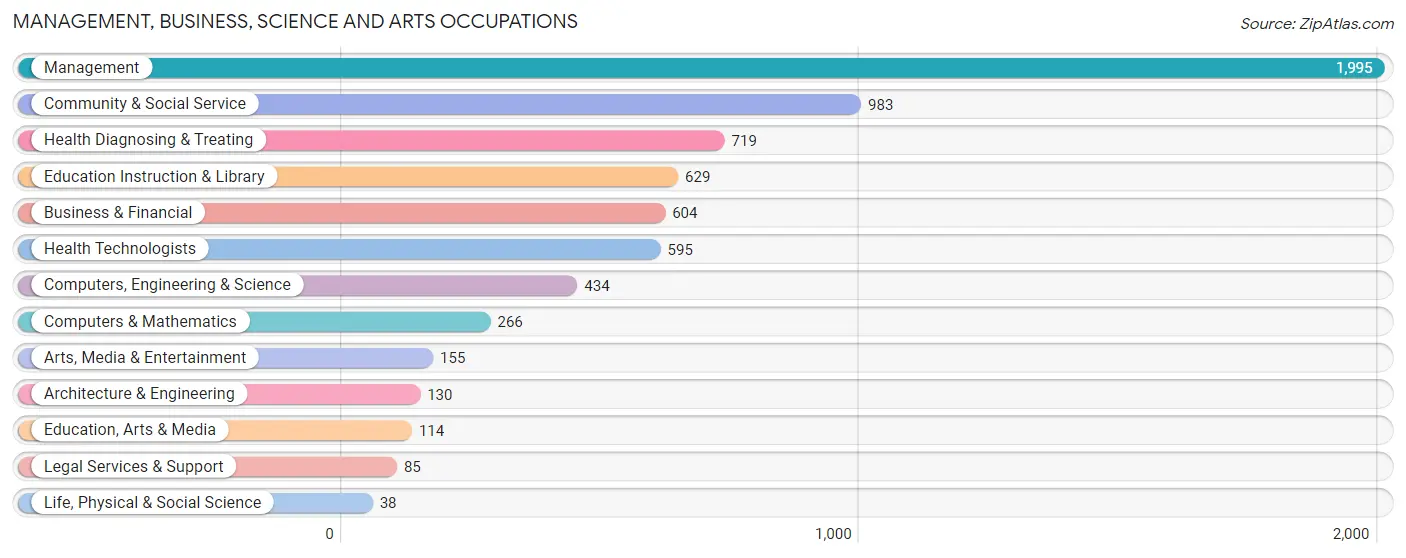
Management, Business, Science and Arts Occupations
The most common Management, Business, Science and Arts occupations in Tarpon Springs are Management (1,995 | 18.6%), Community & Social Service (983 | 9.2%), Health Diagnosing & Treating (719 | 6.7%), Education Instruction & Library (629 | 5.9%), and Business & Financial (604 | 5.7%).
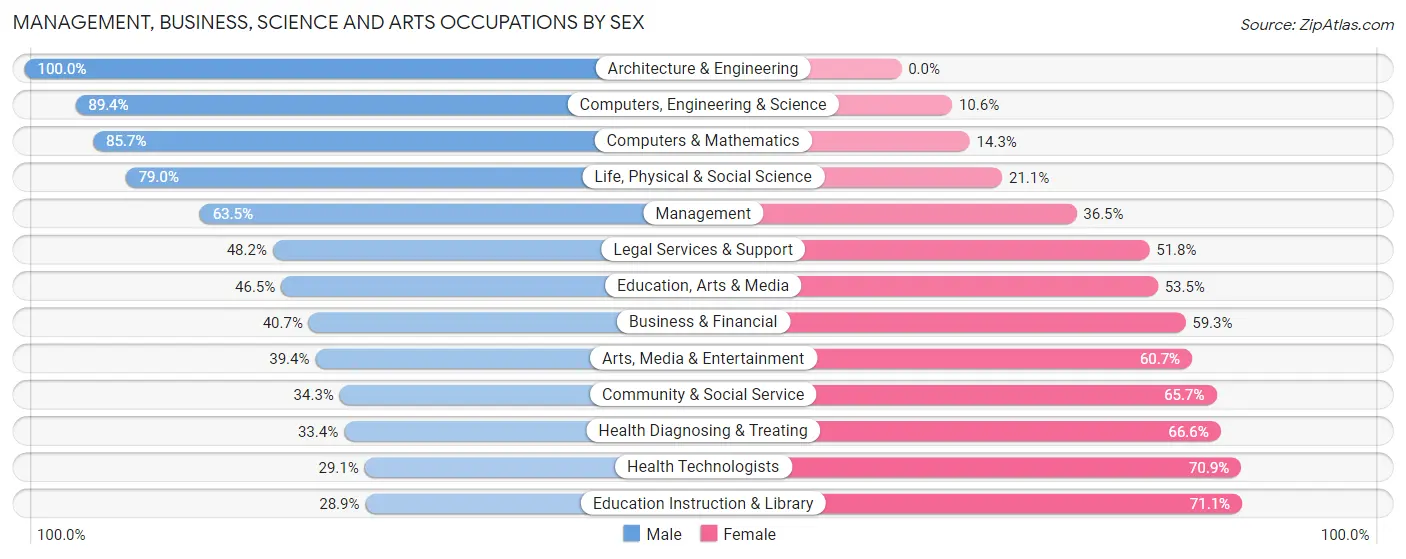
Management, Business, Science and Arts Occupations by Sex
Within the Management, Business, Science and Arts occupations in Tarpon Springs, the most male-oriented occupations are Architecture & Engineering (100.0%), Computers, Engineering & Science (89.4%), and Computers & Mathematics (85.7%), while the most female-oriented occupations are Education Instruction & Library (71.1%), Health Technologists (70.9%), and Health Diagnosing & Treating (66.6%).
| Occupation | Male | Female |
| Management | 1,266 (63.5%) | 729 (36.5%) |
| Business & Financial | 246 (40.7%) | 358 (59.3%) |
| Computers, Engineering & Science | 388 (89.4%) | 46 (10.6%) |
| Computers & Mathematics | 228 (85.7%) | 38 (14.3%) |
| Architecture & Engineering | 130 (100.0%) | 0 (0.0%) |
| Life, Physical & Social Science | 30 (78.9%) | 8 (21.0%) |
| Community & Social Service | 337 (34.3%) | 646 (65.7%) |
| Education, Arts & Media | 53 (46.5%) | 61 (53.5%) |
| Legal Services & Support | 41 (48.2%) | 44 (51.8%) |
| Education Instruction & Library | 182 (28.9%) | 447 (71.1%) |
| Arts, Media & Entertainment | 61 (39.4%) | 94 (60.7%) |
| Health Diagnosing & Treating | 240 (33.4%) | 479 (66.6%) |
| Health Technologists | 173 (29.1%) | 422 (70.9%) |
| Total (Category) | 2,477 (52.3%) | 2,258 (47.7%) |
| Total (Overall) | 5,761 (53.9%) | 4,934 (46.1%) |
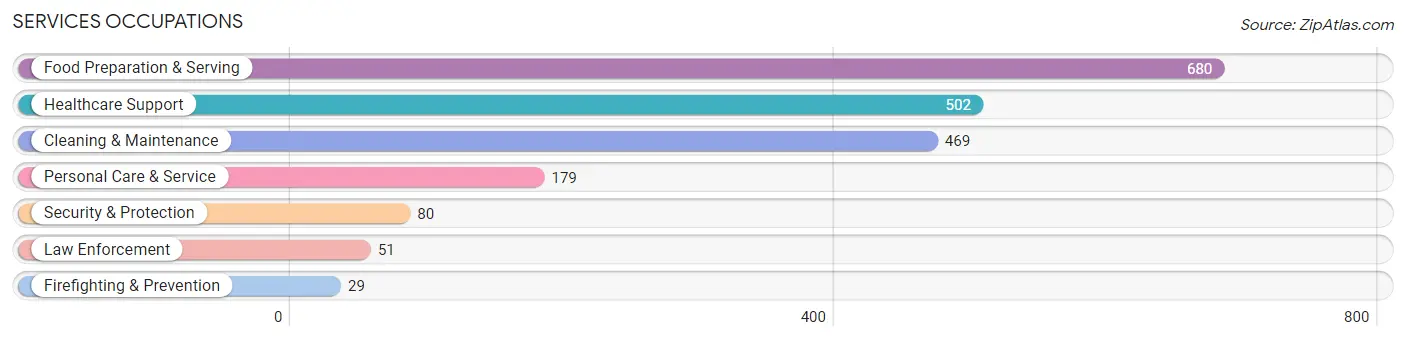
Services Occupations
The most common Services occupations in Tarpon Springs are Food Preparation & Serving (680 | 6.4%), Healthcare Support (502 | 4.7%), Cleaning & Maintenance (469 | 4.4%), Personal Care & Service (179 | 1.7%), and Security & Protection (80 | 0.7%).
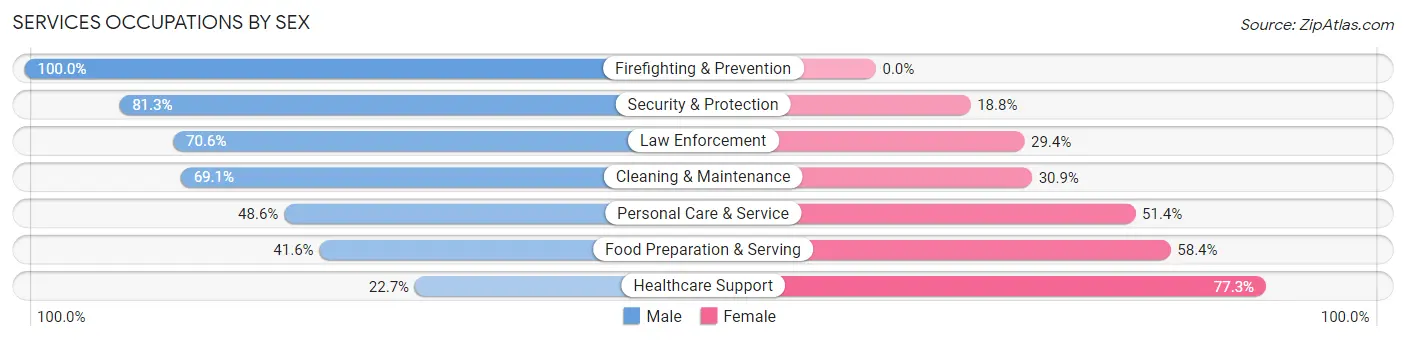
Services Occupations by Sex
Within the Services occupations in Tarpon Springs, the most male-oriented occupations are Firefighting & Prevention (100.0%), Security & Protection (81.2%), and Law Enforcement (70.6%), while the most female-oriented occupations are Healthcare Support (77.3%), Food Preparation & Serving (58.4%), and Personal Care & Service (51.4%).
| Occupation | Male | Female |
| Healthcare Support | 114 (22.7%) | 388 (77.3%) |
| Security & Protection | 65 (81.2%) | 15 (18.8%) |
| Firefighting & Prevention | 29 (100.0%) | 0 (0.0%) |
| Law Enforcement | 36 (70.6%) | 15 (29.4%) |
| Food Preparation & Serving | 283 (41.6%) | 397 (58.4%) |
| Cleaning & Maintenance | 324 (69.1%) | 145 (30.9%) |
| Personal Care & Service | 87 (48.6%) | 92 (51.4%) |
| Total (Category) | 873 (45.7%) | 1,037 (54.3%) |
| Total (Overall) | 5,761 (53.9%) | 4,934 (46.1%) |
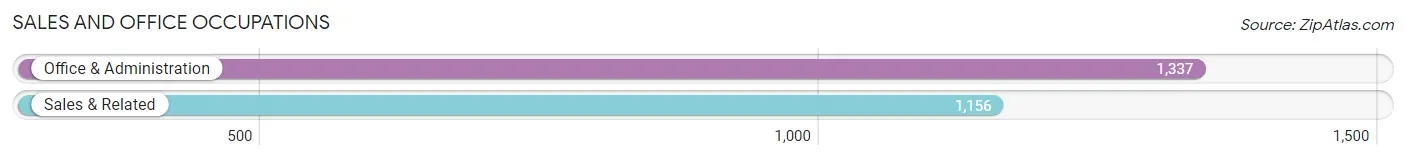
Sales and Office Occupations
The most common Sales and Office occupations in Tarpon Springs are Office & Administration (1,337 | 12.5%), and Sales & Related (1,156 | 10.8%).
Sales and Office Occupations by Sex
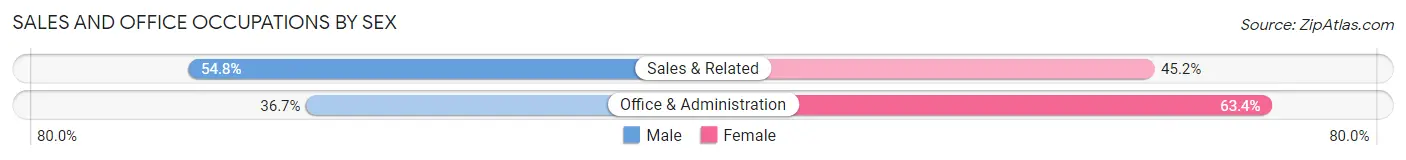
| Occupation | Male | Female |
| Sales & Related | 634 (54.8%) | 522 (45.2%) |
| Office & Administration | 490 (36.6%) | 847 (63.3%) |
| Total (Category) | 1,124 (45.1%) | 1,369 (54.9%) |
| Total (Overall) | 5,761 (53.9%) | 4,934 (46.1%) |
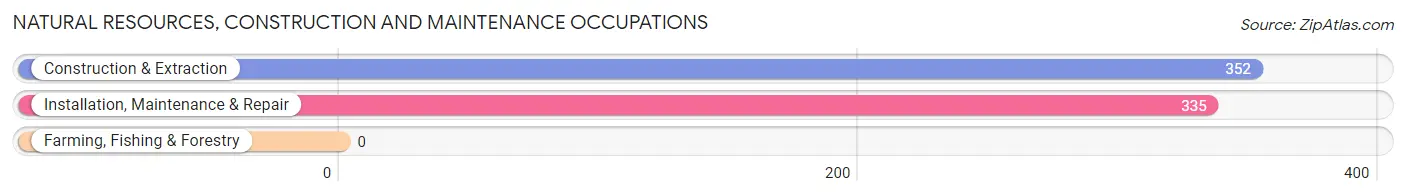
Natural Resources, Construction and Maintenance Occupations
The most common Natural Resources, Construction and Maintenance occupations in Tarpon Springs are Construction & Extraction (352 | 3.3%), and Installation, Maintenance & Repair (335 | 3.1%).
Natural Resources, Construction and Maintenance Occupations by Sex
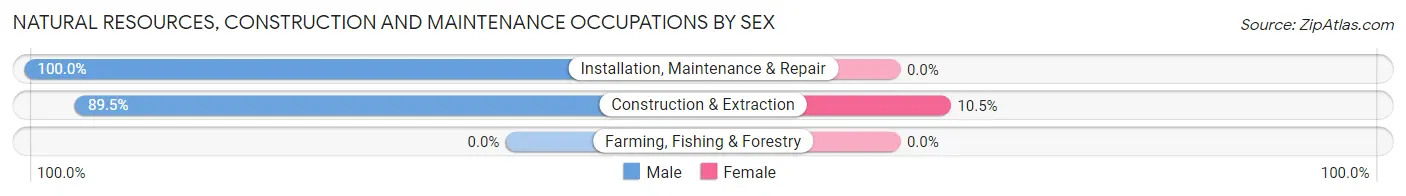
| Occupation | Male | Female |
| Farming, Fishing & Forestry | 0 (0.0%) | 0 (0.0%) |
| Construction & Extraction | 315 (89.5%) | 37 (10.5%) |
| Installation, Maintenance & Repair | 335 (100.0%) | 0 (0.0%) |
| Total (Category) | 650 (94.6%) | 37 (5.4%) |
| Total (Overall) | 5,761 (53.9%) | 4,934 (46.1%) |
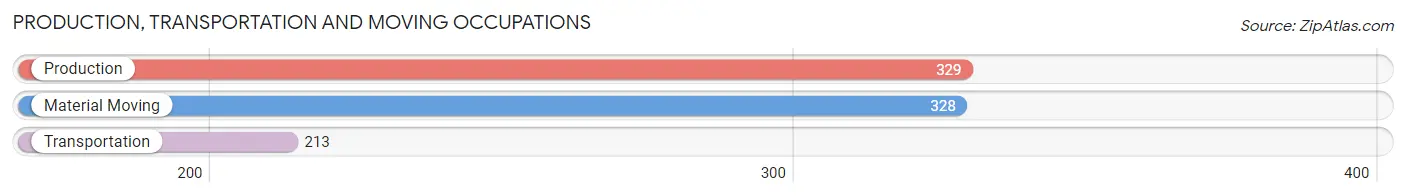
Production, Transportation and Moving Occupations
The most common Production, Transportation and Moving occupations in Tarpon Springs are Production (329 | 3.1%), Material Moving (328 | 3.1%), and Transportation (213 | 2.0%).
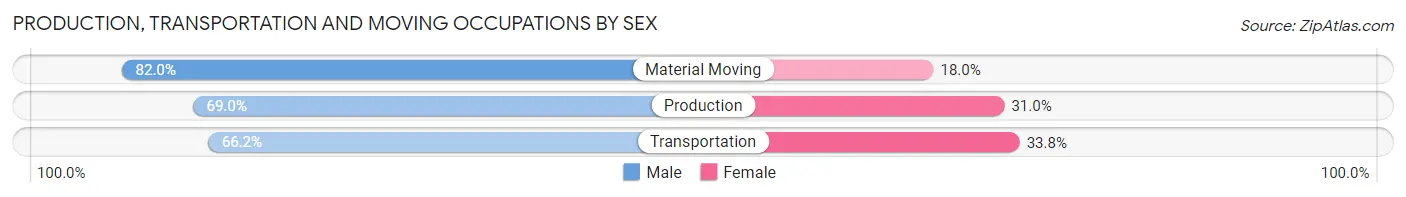
Production, Transportation and Moving Occupations by Sex
| Occupation | Male | Female |
| Production | 227 (69.0%) | 102 (31.0%) |
| Transportation | 141 (66.2%) | 72 (33.8%) |
| Material Moving | 269 (82.0%) | 59 (18.0%) |
| Total (Category) | 637 (73.2%) | 233 (26.8%) |
| Total (Overall) | 5,761 (53.9%) | 4,934 (46.1%) |
Employment Industries by Sex in Tarpon Springs
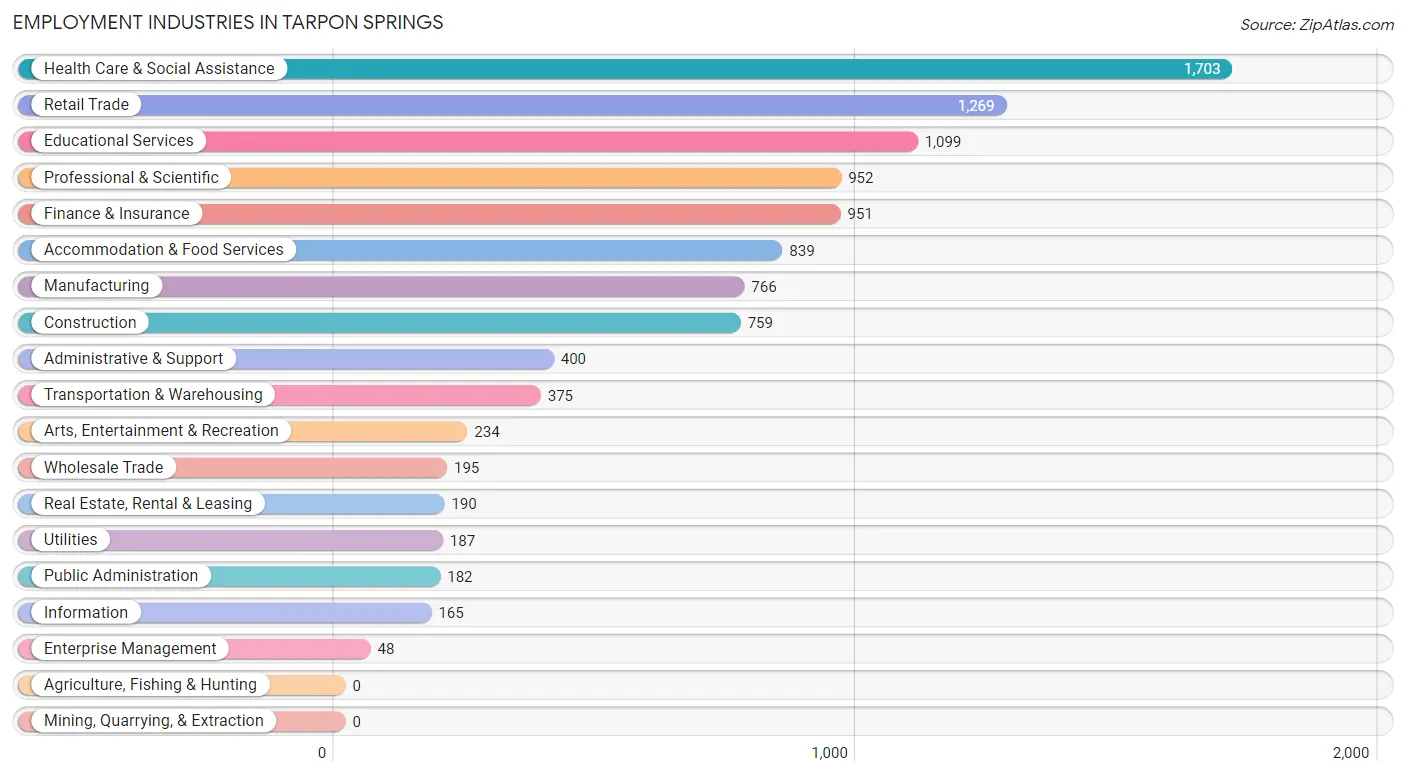
Employment Industries in Tarpon Springs
The major employment industries in Tarpon Springs include Health Care & Social Assistance (1,703 | 15.9%), Retail Trade (1,269 | 11.9%), Educational Services (1,099 | 10.3%), Professional & Scientific (952 | 8.9%), and Finance & Insurance (951 | 8.9%).
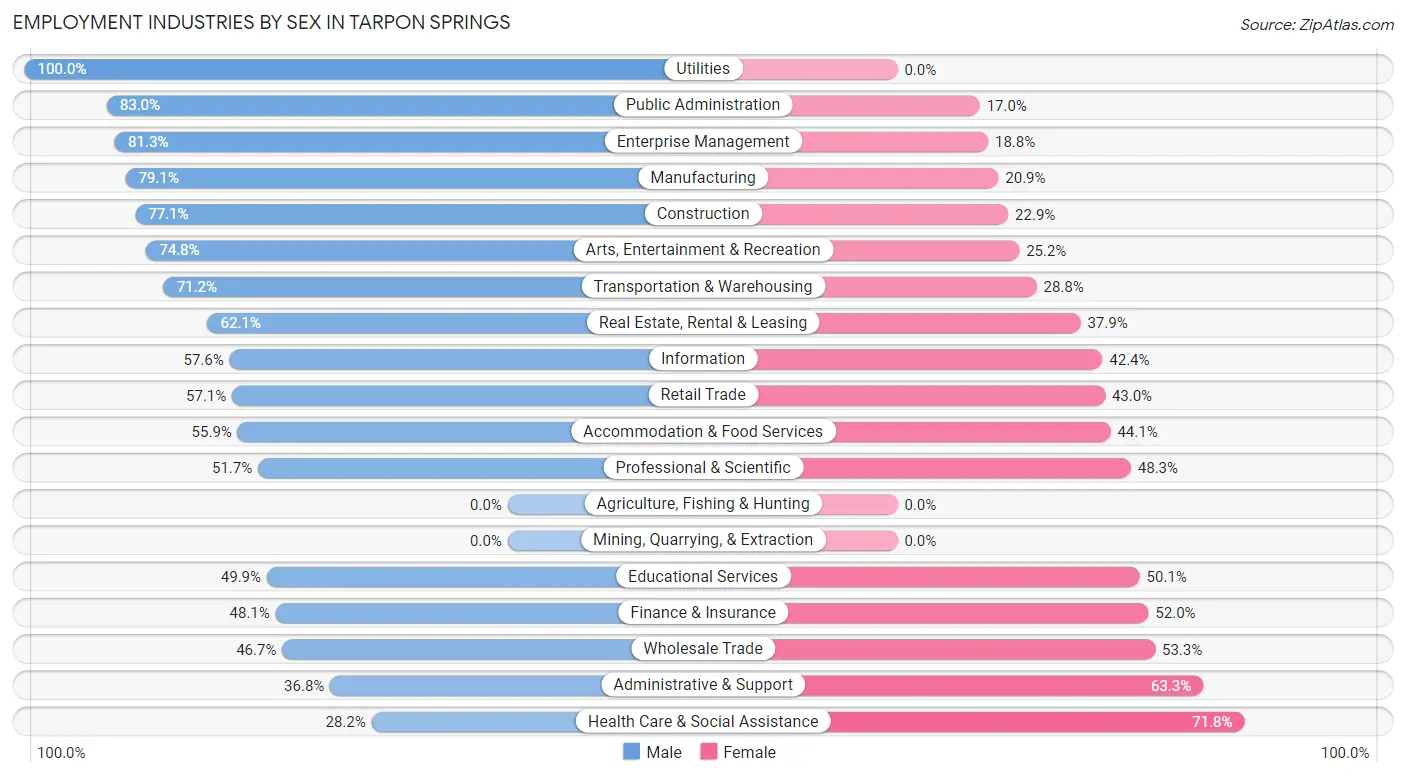
Employment Industries by Sex in Tarpon Springs
The Tarpon Springs industries that see more men than women are Utilities (100.0%), Public Administration (83.0%), and Enterprise Management (81.2%), whereas the industries that tend to have a higher number of women are Health Care & Social Assistance (71.8%), Administrative & Support (63.2%), and Wholesale Trade (53.3%).
| Industry | Male | Female |
| Agriculture, Fishing & Hunting | 0 (0.0%) | 0 (0.0%) |
| Mining, Quarrying, & Extraction | 0 (0.0%) | 0 (0.0%) |
| Construction | 585 (77.1%) | 174 (22.9%) |
| Manufacturing | 606 (79.1%) | 160 (20.9%) |
| Wholesale Trade | 91 (46.7%) | 104 (53.3%) |
| Retail Trade | 724 (57.1%) | 545 (42.9%) |
| Transportation & Warehousing | 267 (71.2%) | 108 (28.8%) |
| Utilities | 187 (100.0%) | 0 (0.0%) |
| Information | 95 (57.6%) | 70 (42.4%) |
| Finance & Insurance | 457 (48.0%) | 494 (51.9%) |
| Real Estate, Rental & Leasing | 118 (62.1%) | 72 (37.9%) |
| Professional & Scientific | 492 (51.7%) | 460 (48.3%) |
| Enterprise Management | 39 (81.2%) | 9 (18.8%) |
| Administrative & Support | 147 (36.7%) | 253 (63.2%) |
| Educational Services | 548 (49.9%) | 551 (50.1%) |
| Health Care & Social Assistance | 480 (28.2%) | 1,223 (71.8%) |
| Arts, Entertainment & Recreation | 175 (74.8%) | 59 (25.2%) |
| Accommodation & Food Services | 469 (55.9%) | 370 (44.1%) |
| Public Administration | 151 (83.0%) | 31 (17.0%) |
| Total | 5,761 (53.9%) | 4,934 (46.1%) |
Education in Tarpon Springs
School Enrollment in Tarpon Springs
The most common levels of schooling among the 4,134 students in Tarpon Springs are college / undergraduate (1,254 | 30.3%), high school (1,002 | 24.2%), and middle school (644 | 15.6%).
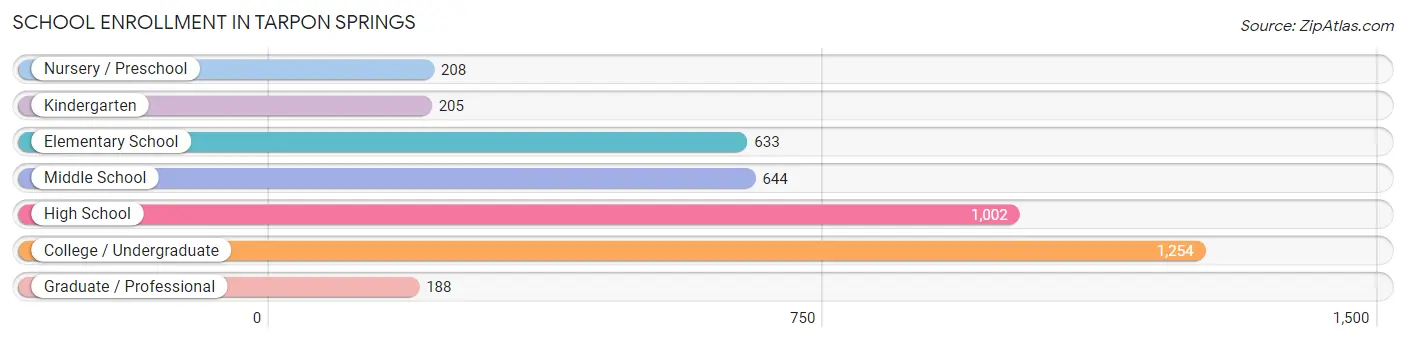
| School Level | # Students | % Students |
| Nursery / Preschool | 208 | 5.0% |
| Kindergarten | 205 | 5.0% |
| Elementary School | 633 | 15.3% |
| Middle School | 644 | 15.6% |
| High School | 1,002 | 24.2% |
| College / Undergraduate | 1,254 | 30.3% |
| Graduate / Professional | 188 | 4.5% |
| Total | 4,134 | 100.0% |
School Enrollment by Age by Funding Source in Tarpon Springs
Out of a total of 4,134 students who are enrolled in schools in Tarpon Springs, 455 (11.0%) attend a private institution, while the remaining 3,679 (89.0%) are enrolled in public schools. The age group of 3 to 4 year olds has the highest likelihood of being enrolled in private schools, with 42 (26.9% in the age bracket) enrolled. Conversely, the age group of 18 to 19 year olds has the lowest likelihood of being enrolled in a private school, with 328 (100.0% in the age bracket) attending a public institution.
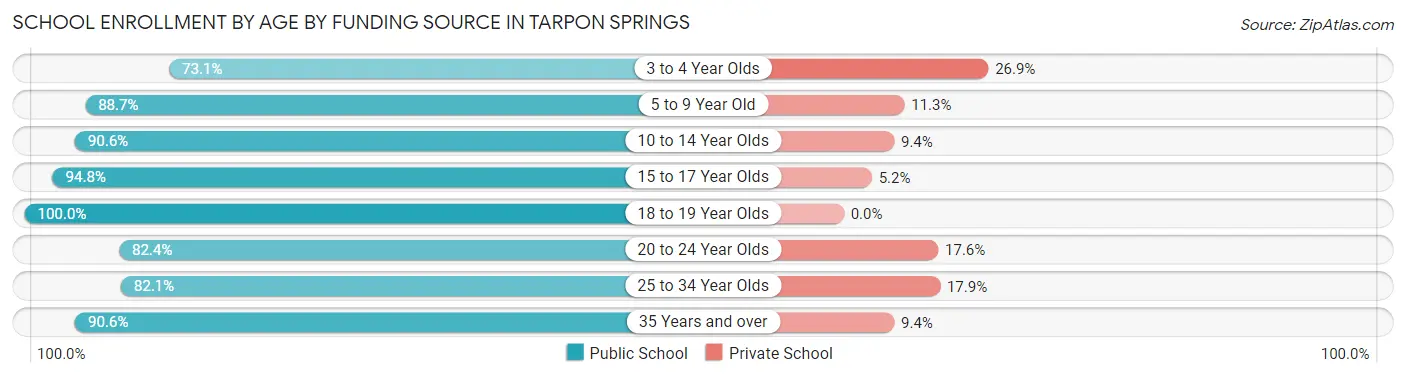
| Age Bracket | Public School | Private School |
| 3 to 4 Year Olds | 114 (73.1%) | 42 (26.9%) |
| 5 to 9 Year Old | 715 (88.7%) | 91 (11.3%) |
| 10 to 14 Year Olds | 773 (90.6%) | 80 (9.4%) |
| 15 to 17 Year Olds | 634 (94.8%) | 35 (5.2%) |
| 18 to 19 Year Olds | 328 (100.0%) | 0 (0.0%) |
| 20 to 24 Year Olds | 459 (82.4%) | 98 (17.6%) |
| 25 to 34 Year Olds | 366 (82.1%) | 80 (17.9%) |
| 35 Years and over | 289 (90.6%) | 30 (9.4%) |
| Total | 3,679 (89.0%) | 455 (11.0%) |
Educational Attainment by Field of Study in Tarpon Springs
Business (1,777 | 24.8%), education (843 | 11.7%), science & technology (647 | 9.0%), engineering (594 | 8.3%), and liberal arts & history (516 | 7.2%) are the most common fields of study among 7,177 individuals in Tarpon Springs who have obtained a bachelor's degree or higher.
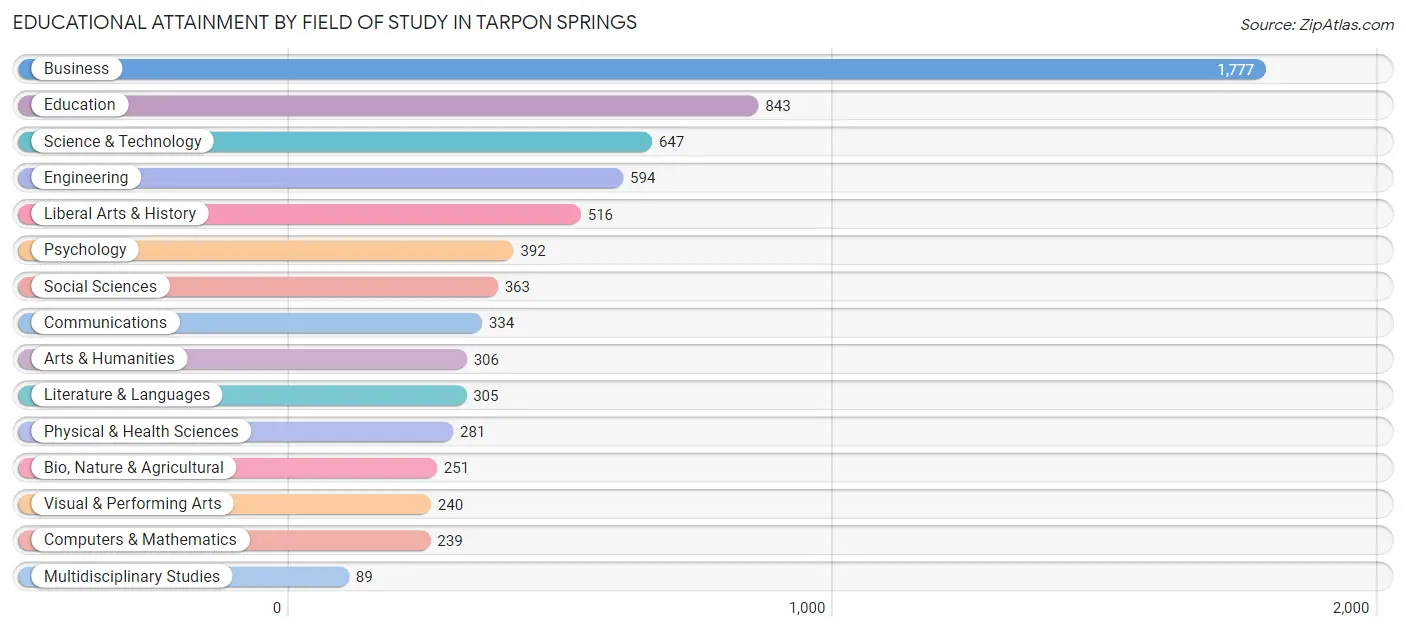
| Field of Study | # Graduates | % Graduates |
| Computers & Mathematics | 239 | 3.3% |
| Bio, Nature & Agricultural | 251 | 3.5% |
| Physical & Health Sciences | 281 | 3.9% |
| Psychology | 392 | 5.5% |
| Social Sciences | 363 | 5.1% |
| Engineering | 594 | 8.3% |
| Multidisciplinary Studies | 89 | 1.2% |
| Science & Technology | 647 | 9.0% |
| Business | 1,777 | 24.8% |
| Education | 843 | 11.7% |
| Literature & Languages | 305 | 4.3% |
| Liberal Arts & History | 516 | 7.2% |
| Visual & Performing Arts | 240 | 3.3% |
| Communications | 334 | 4.6% |
| Arts & Humanities | 306 | 4.3% |
| Total | 7,177 | 100.0% |
Transportation & Commute in Tarpon Springs
Vehicle Availability by Sex in Tarpon Springs
The most prevalent vehicle ownership categories in Tarpon Springs are males with 2 vehicles (2,445, accounting for 43.2%) and females with 2 vehicles (2,050, making up 50.5%).
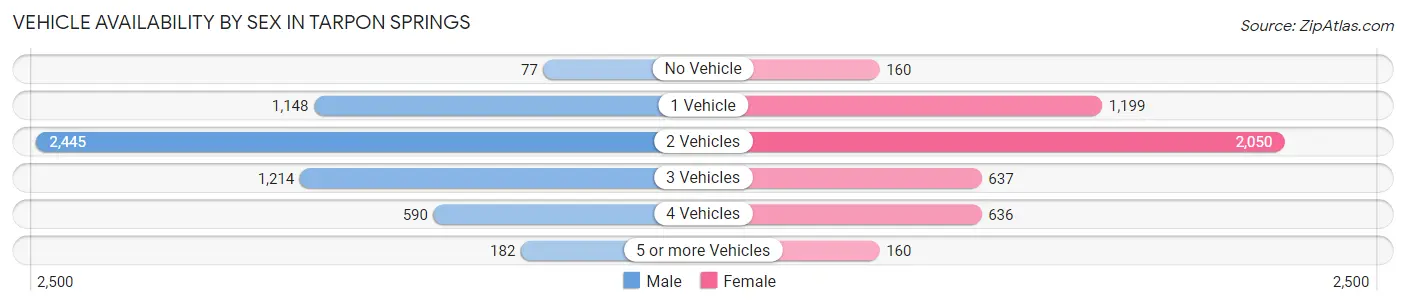
| Vehicles Available | Male | Female |
| No Vehicle | 77 (1.4%) | 160 (3.3%) |
| 1 Vehicle | 1,148 (20.3%) | 1,199 (24.8%) |
| 2 Vehicles | 2,445 (43.2%) | 2,050 (42.3%) |
| 3 Vehicles | 1,214 (21.5%) | 637 (13.2%) |
| 4 Vehicles | 590 (10.4%) | 636 (13.1%) |
| 5 or more Vehicles | 182 (3.2%) | 160 (3.3%) |
| Total | 5,656 (100.0%) | 4,842 (100.0%) |
Commute Time in Tarpon Springs
The most frequently occuring commute durations in Tarpon Springs are 45 to 59 minutes (1,315 commuters, 15.1%), 30 to 34 minutes (1,212 commuters, 13.9%), and 5 to 9 minutes (1,049 commuters, 12.1%).
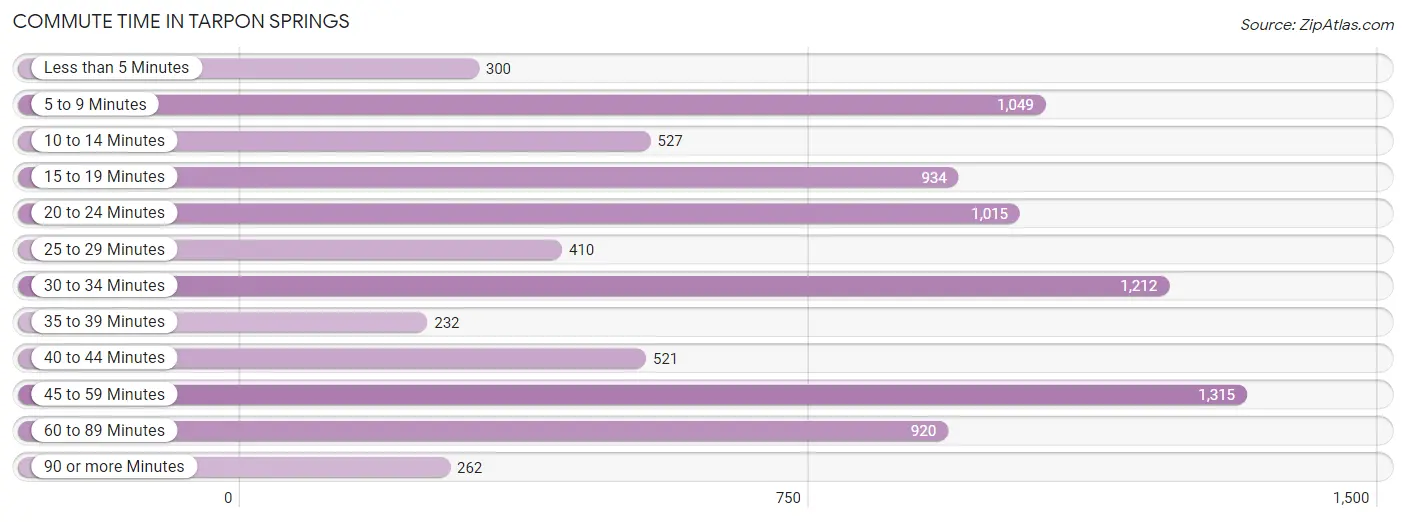
| Commute Time | # Commuters | % Commuters |
| Less than 5 Minutes | 300 | 3.5% |
| 5 to 9 Minutes | 1,049 | 12.1% |
| 10 to 14 Minutes | 527 | 6.1% |
| 15 to 19 Minutes | 934 | 10.7% |
| 20 to 24 Minutes | 1,015 | 11.7% |
| 25 to 29 Minutes | 410 | 4.7% |
| 30 to 34 Minutes | 1,212 | 13.9% |
| 35 to 39 Minutes | 232 | 2.7% |
| 40 to 44 Minutes | 521 | 6.0% |
| 45 to 59 Minutes | 1,315 | 15.1% |
| 60 to 89 Minutes | 920 | 10.6% |
| 90 or more Minutes | 262 | 3.0% |
Commute Time by Sex in Tarpon Springs
The most common commute times in Tarpon Springs are 30 to 34 minutes (664 commuters, 13.9%) for males and 45 to 59 minutes (713 commuters, 18.2%) for females.
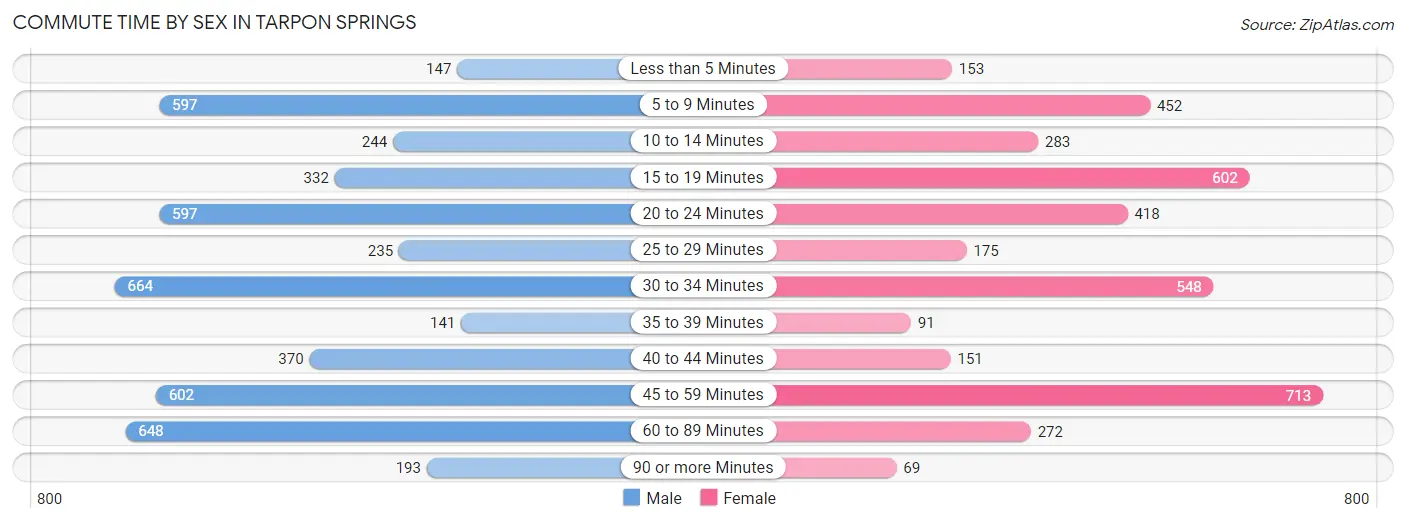
| Commute Time | Male | Female |
| Less than 5 Minutes | 147 (3.1%) | 153 (3.9%) |
| 5 to 9 Minutes | 597 (12.5%) | 452 (11.5%) |
| 10 to 14 Minutes | 244 (5.1%) | 283 (7.2%) |
| 15 to 19 Minutes | 332 (7.0%) | 602 (15.3%) |
| 20 to 24 Minutes | 597 (12.5%) | 418 (10.6%) |
| 25 to 29 Minutes | 235 (4.9%) | 175 (4.5%) |
| 30 to 34 Minutes | 664 (13.9%) | 548 (14.0%) |
| 35 to 39 Minutes | 141 (3.0%) | 91 (2.3%) |
| 40 to 44 Minutes | 370 (7.8%) | 151 (3.8%) |
| 45 to 59 Minutes | 602 (12.6%) | 713 (18.2%) |
| 60 to 89 Minutes | 648 (13.6%) | 272 (6.9%) |
| 90 or more Minutes | 193 (4.1%) | 69 (1.8%) |
Time of Departure to Work by Sex in Tarpon Springs
The most frequent times of departure to work in Tarpon Springs are 7:00 AM to 7:29 AM (712, 14.9%) for males and 8:00 AM to 8:29 AM (688, 17.5%) for females.
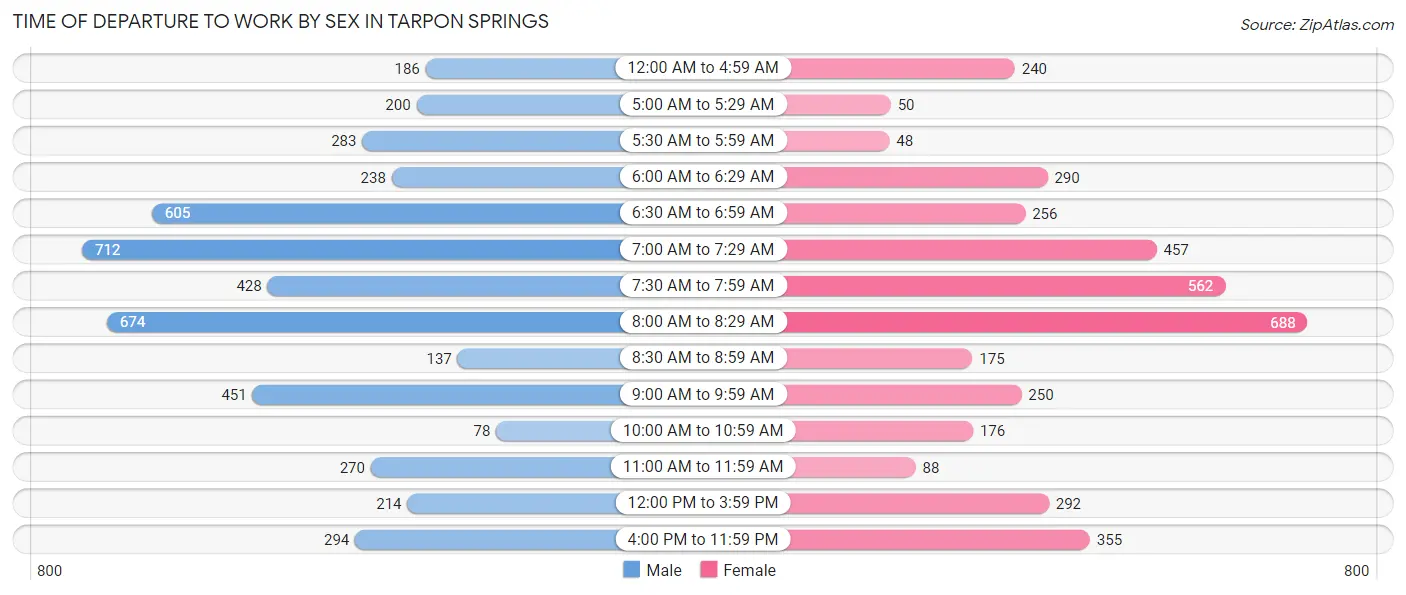
| Time of Departure | Male | Female |
| 12:00 AM to 4:59 AM | 186 (3.9%) | 240 (6.1%) |
| 5:00 AM to 5:29 AM | 200 (4.2%) | 50 (1.3%) |
| 5:30 AM to 5:59 AM | 283 (5.9%) | 48 (1.2%) |
| 6:00 AM to 6:29 AM | 238 (5.0%) | 290 (7.4%) |
| 6:30 AM to 6:59 AM | 605 (12.7%) | 256 (6.5%) |
| 7:00 AM to 7:29 AM | 712 (14.9%) | 457 (11.6%) |
| 7:30 AM to 7:59 AM | 428 (9.0%) | 562 (14.3%) |
| 8:00 AM to 8:29 AM | 674 (14.1%) | 688 (17.5%) |
| 8:30 AM to 8:59 AM | 137 (2.9%) | 175 (4.5%) |
| 9:00 AM to 9:59 AM | 451 (9.5%) | 250 (6.4%) |
| 10:00 AM to 10:59 AM | 78 (1.6%) | 176 (4.5%) |
| 11:00 AM to 11:59 AM | 270 (5.7%) | 88 (2.2%) |
| 12:00 PM to 3:59 PM | 214 (4.5%) | 292 (7.4%) |
| 4:00 PM to 11:59 PM | 294 (6.2%) | 355 (9.0%) |
| Total | 4,770 (100.0%) | 3,927 (100.0%) |
Housing Occupancy in Tarpon Springs
Occupancy by Ownership in Tarpon Springs
Of the total 11,300 dwellings in Tarpon Springs, owner-occupied units account for 8,936 (79.1%), while renter-occupied units make up 2,364 (20.9%).
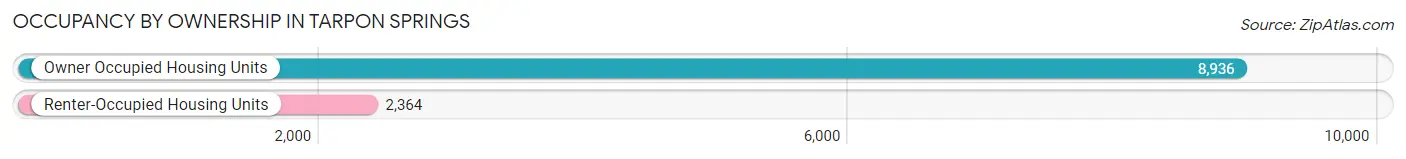
| Occupancy | # Housing Units | % Housing Units |
| Owner Occupied Housing Units | 8,936 | 79.1% |
| Renter-Occupied Housing Units | 2,364 | 20.9% |
| Total Occupied Housing Units | 11,300 | 100.0% |
Occupancy by Household Size in Tarpon Springs
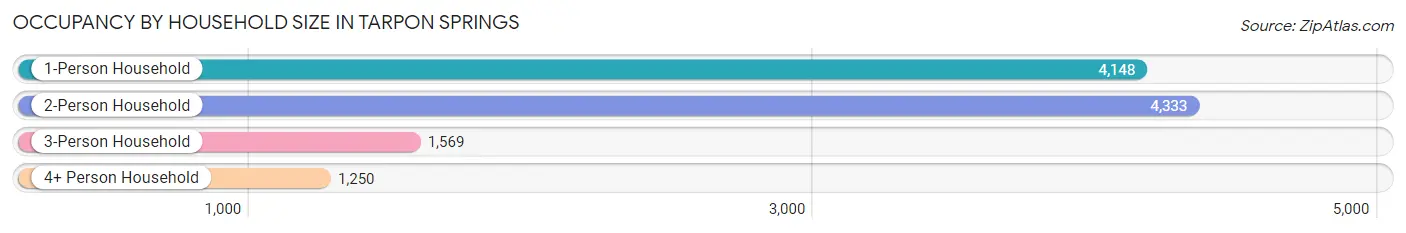
| Household Size | # Housing Units | % Housing Units |
| 1-Person Household | 4,148 | 36.7% |
| 2-Person Household | 4,333 | 38.4% |
| 3-Person Household | 1,569 | 13.9% |
| 4+ Person Household | 1,250 | 11.1% |
| Total Housing Units | 11,300 | 100.0% |
Occupancy by Ownership by Household Size in Tarpon Springs
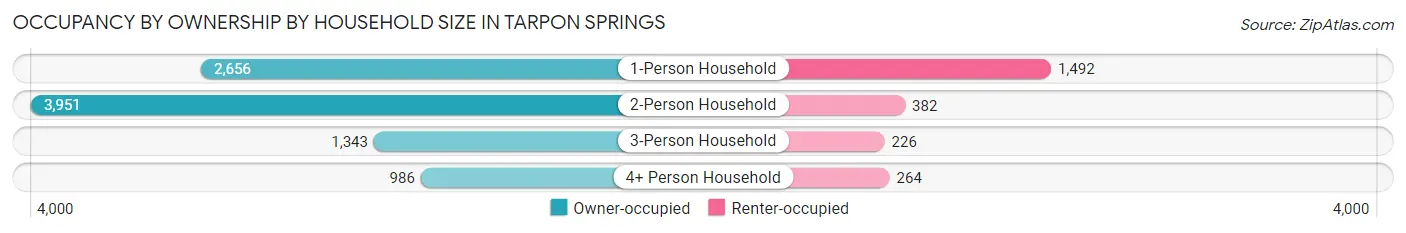
| Household Size | Owner-occupied | Renter-occupied |
| 1-Person Household | 2,656 (64.0%) | 1,492 (36.0%) |
| 2-Person Household | 3,951 (91.2%) | 382 (8.8%) |
| 3-Person Household | 1,343 (85.6%) | 226 (14.4%) |
| 4+ Person Household | 986 (78.9%) | 264 (21.1%) |
| Total Housing Units | 8,936 (79.1%) | 2,364 (20.9%) |
Occupancy by Educational Attainment in Tarpon Springs
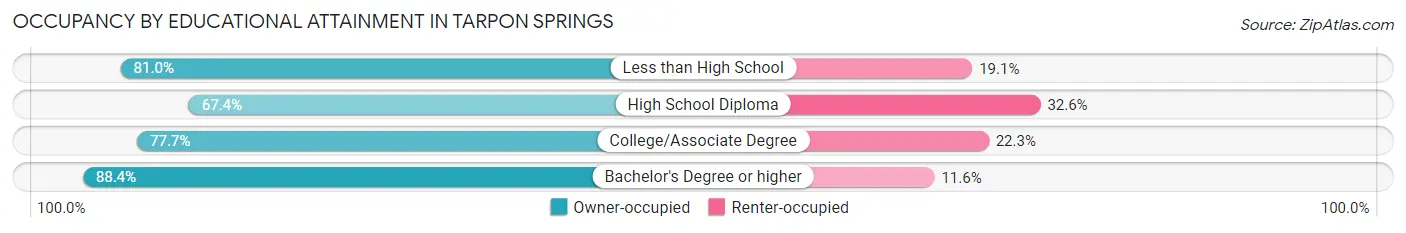
| Household Size | Owner-occupied | Renter-occupied |
| Less than High School | 442 (80.9%) | 104 (19.1%) |
| High School Diploma | 1,917 (67.4%) | 926 (32.6%) |
| College/Associate Degree | 3,027 (77.7%) | 870 (22.3%) |
| Bachelor's Degree or higher | 3,550 (88.4%) | 464 (11.6%) |
Occupancy by Age of Householder in Tarpon Springs
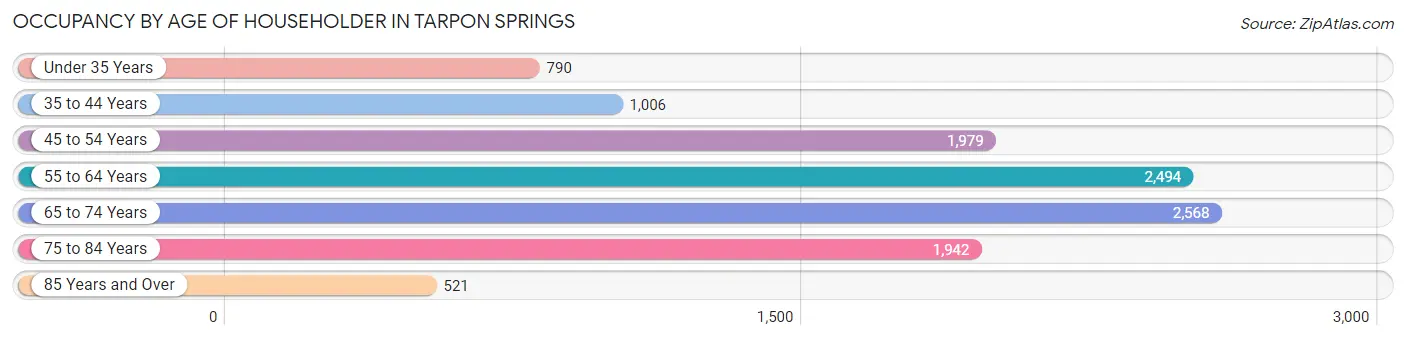
| Age Bracket | # Households | % Households |
| Under 35 Years | 790 | 7.0% |
| 35 to 44 Years | 1,006 | 8.9% |
| 45 to 54 Years | 1,979 | 17.5% |
| 55 to 64 Years | 2,494 | 22.1% |
| 65 to 74 Years | 2,568 | 22.7% |
| 75 to 84 Years | 1,942 | 17.2% |
| 85 Years and Over | 521 | 4.6% |
| Total | 11,300 | 100.0% |
Housing Finances in Tarpon Springs
Median Income by Occupancy in Tarpon Springs
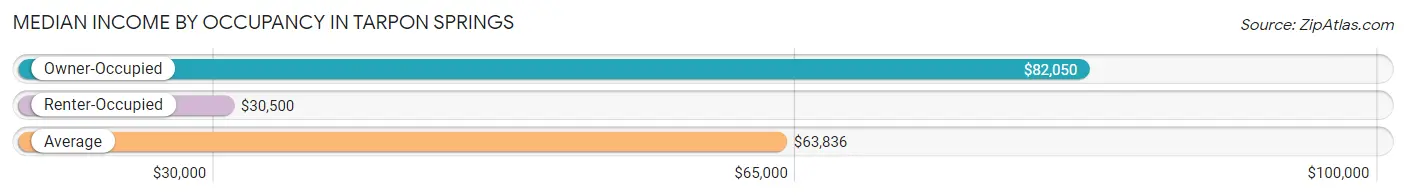
| Occupancy Type | # Households | Median Income |
| Owner-Occupied | 8,936 (79.1%) | $82,050 |
| Renter-Occupied | 2,364 (20.9%) | $30,500 |
| Average | 11,300 (100.0%) | $63,836 |
Occupancy by Householder Income Bracket in Tarpon Springs
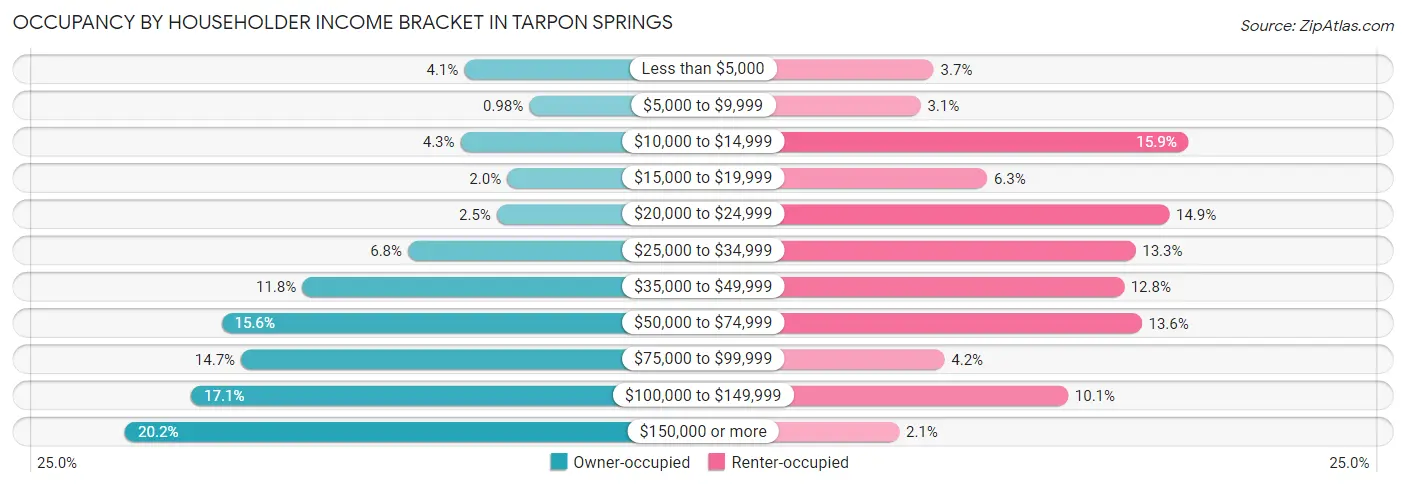
| Income Bracket | Owner-occupied | Renter-occupied |
| Less than $5,000 | 364 (4.1%) | 88 (3.7%) |
| $5,000 to $9,999 | 88 (1.0%) | 73 (3.1%) |
| $10,000 to $14,999 | 380 (4.3%) | 375 (15.9%) |
| $15,000 to $19,999 | 181 (2.0%) | 148 (6.3%) |
| $20,000 to $24,999 | 225 (2.5%) | 353 (14.9%) |
| $25,000 to $34,999 | 603 (6.8%) | 315 (13.3%) |
| $35,000 to $49,999 | 1,054 (11.8%) | 302 (12.8%) |
| $50,000 to $74,999 | 1,396 (15.6%) | 322 (13.6%) |
| $75,000 to $99,999 | 1,314 (14.7%) | 100 (4.2%) |
| $100,000 to $149,999 | 1,525 (17.1%) | 239 (10.1%) |
| $150,000 or more | 1,806 (20.2%) | 49 (2.1%) |
| Total | 8,936 (100.0%) | 2,364 (100.0%) |
Monthly Housing Cost Tiers in Tarpon Springs
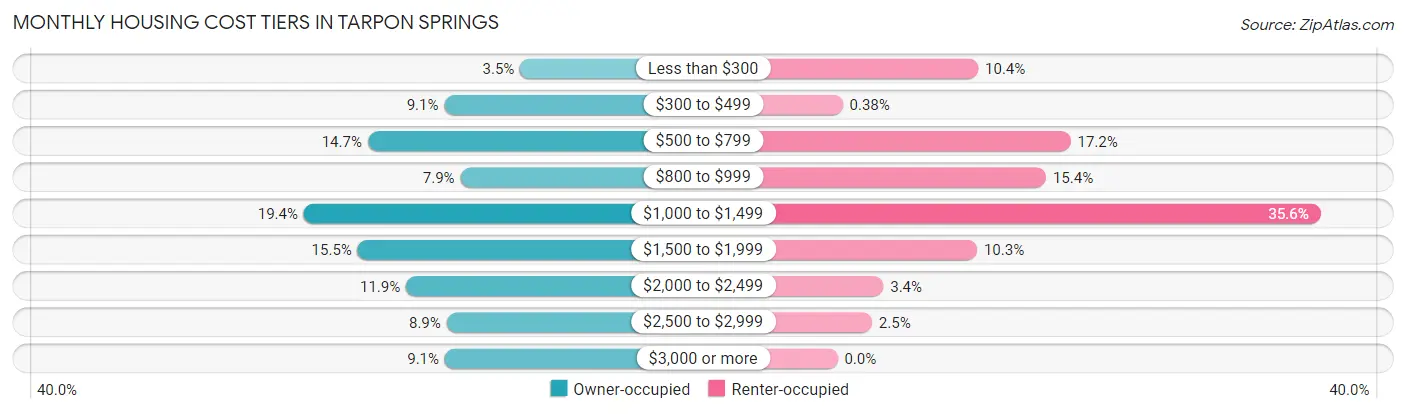
| Monthly Cost | Owner-occupied | Renter-occupied |
| Less than $300 | 313 (3.5%) | 245 (10.4%) |
| $300 to $499 | 812 (9.1%) | 9 (0.4%) |
| $500 to $799 | 1,316 (14.7%) | 406 (17.2%) |
| $800 to $999 | 706 (7.9%) | 363 (15.4%) |
| $1,000 to $1,499 | 1,737 (19.4%) | 841 (35.6%) |
| $1,500 to $1,999 | 1,382 (15.5%) | 243 (10.3%) |
| $2,000 to $2,499 | 1,064 (11.9%) | 80 (3.4%) |
| $2,500 to $2,999 | 797 (8.9%) | 60 (2.5%) |
| $3,000 or more | 809 (9.0%) | 0 (0.0%) |
| Total | 8,936 (100.0%) | 2,364 (100.0%) |
Physical Housing Characteristics in Tarpon Springs
Housing Structures in Tarpon Springs
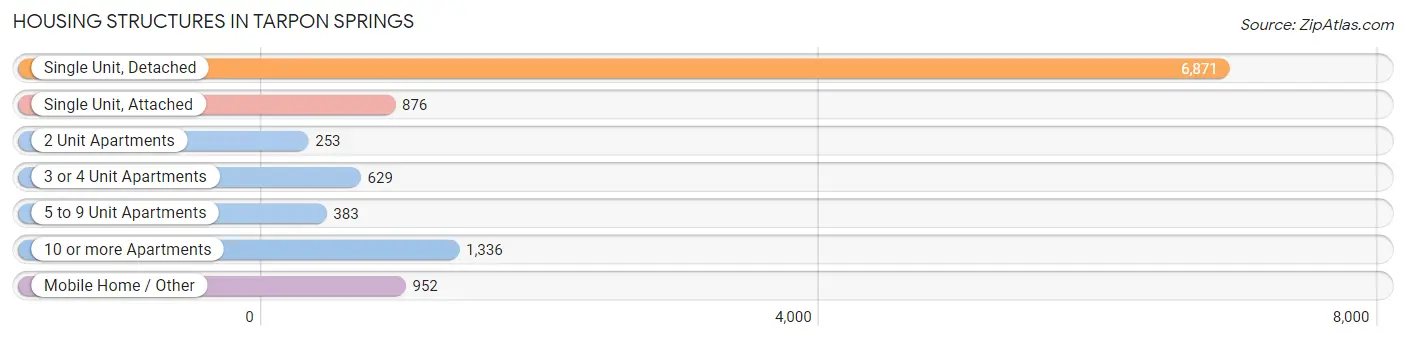
| Structure Type | # Housing Units | % Housing Units |
| Single Unit, Detached | 6,871 | 60.8% |
| Single Unit, Attached | 876 | 7.7% |
| 2 Unit Apartments | 253 | 2.2% |
| 3 or 4 Unit Apartments | 629 | 5.6% |
| 5 to 9 Unit Apartments | 383 | 3.4% |
| 10 or more Apartments | 1,336 | 11.8% |
| Mobile Home / Other | 952 | 8.4% |
| Total | 11,300 | 100.0% |
Housing Structures by Occupancy in Tarpon Springs
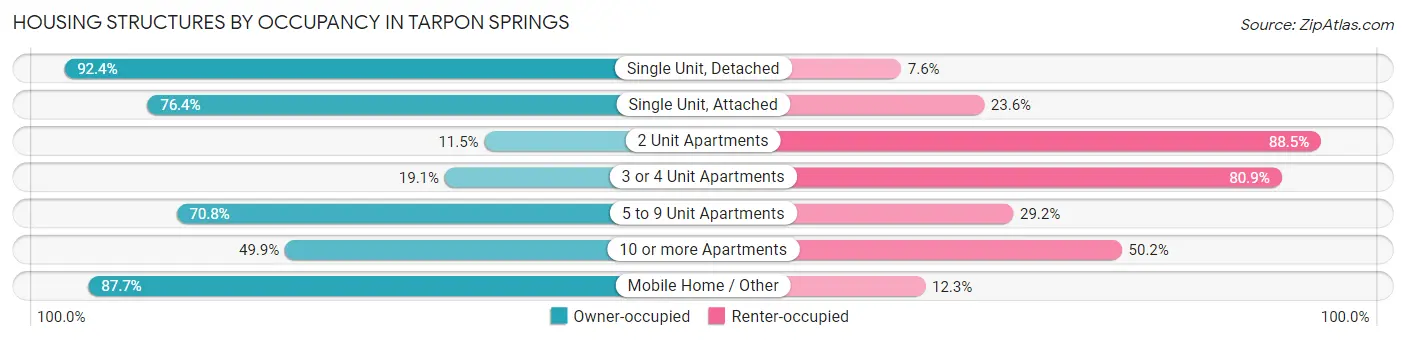
| Structure Type | Owner-occupied | Renter-occupied |
| Single Unit, Detached | 6,346 (92.4%) | 525 (7.6%) |
| Single Unit, Attached | 669 (76.4%) | 207 (23.6%) |
| 2 Unit Apartments | 29 (11.5%) | 224 (88.5%) |
| 3 or 4 Unit Apartments | 120 (19.1%) | 509 (80.9%) |
| 5 to 9 Unit Apartments | 271 (70.8%) | 112 (29.2%) |
| 10 or more Apartments | 666 (49.8%) | 670 (50.1%) |
| Mobile Home / Other | 835 (87.7%) | 117 (12.3%) |
| Total | 8,936 (79.1%) | 2,364 (20.9%) |
Housing Structures by Number of Rooms in Tarpon Springs
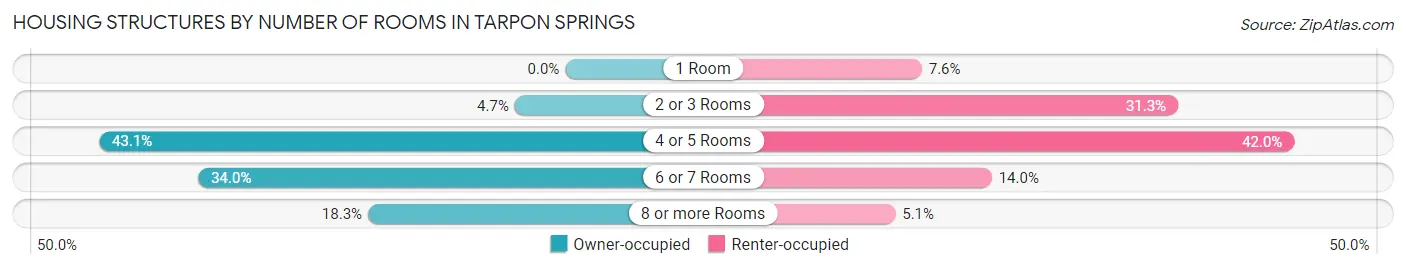
| Number of Rooms | Owner-occupied | Renter-occupied |
| 1 Room | 0 (0.0%) | 179 (7.6%) |
| 2 or 3 Rooms | 417 (4.7%) | 739 (31.3%) |
| 4 or 5 Rooms | 3,853 (43.1%) | 993 (42.0%) |
| 6 or 7 Rooms | 3,035 (34.0%) | 332 (14.0%) |
| 8 or more Rooms | 1,631 (18.2%) | 121 (5.1%) |
| Total | 8,936 (100.0%) | 2,364 (100.0%) |
Housing Structure by Heating Type in Tarpon Springs
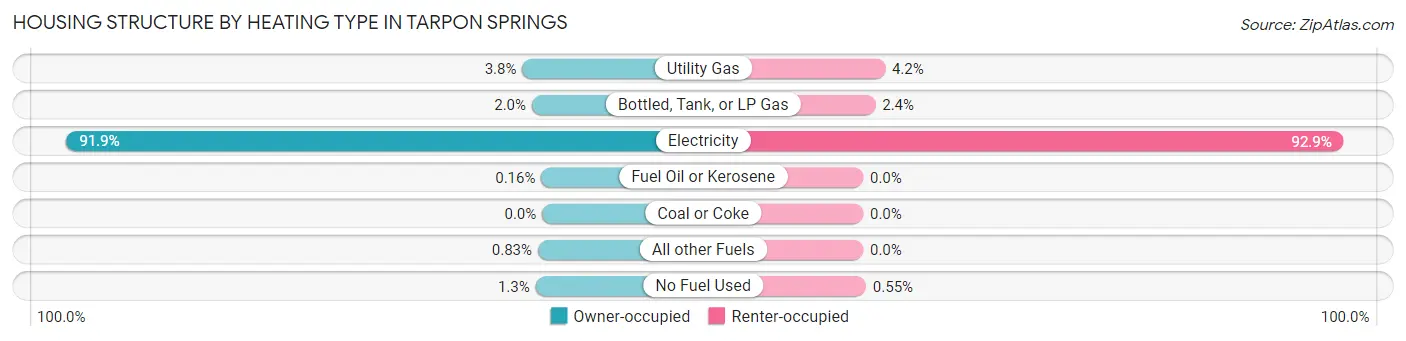
| Heating Type | Owner-occupied | Renter-occupied |
| Utility Gas | 342 (3.8%) | 100 (4.2%) |
| Bottled, Tank, or LP Gas | 177 (2.0%) | 56 (2.4%) |
| Electricity | 8,216 (91.9%) | 2,195 (92.8%) |
| Fuel Oil or Kerosene | 14 (0.2%) | 0 (0.0%) |
| Coal or Coke | 0 (0.0%) | 0 (0.0%) |
| All other Fuels | 74 (0.8%) | 0 (0.0%) |
| No Fuel Used | 113 (1.3%) | 13 (0.5%) |
| Total | 8,936 (100.0%) | 2,364 (100.0%) |
Household Vehicle Usage in Tarpon Springs
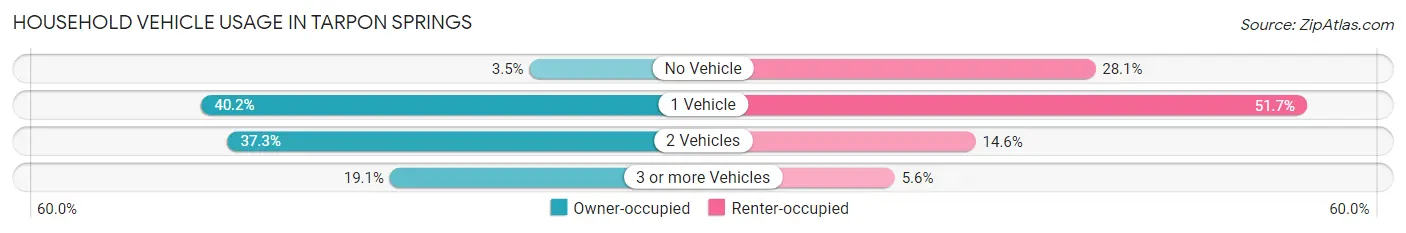
| Vehicles per Household | Owner-occupied | Renter-occupied |
| No Vehicle | 308 (3.5%) | 663 (28.1%) |
| 1 Vehicle | 3,592 (40.2%) | 1,223 (51.7%) |
| 2 Vehicles | 3,330 (37.3%) | 346 (14.6%) |
| 3 or more Vehicles | 1,706 (19.1%) | 132 (5.6%) |
| Total | 8,936 (100.0%) | 2,364 (100.0%) |
Real Estate & Mortgages in Tarpon Springs
Real Estate and Mortgage Overview in Tarpon Springs
| Characteristic | Without Mortgage | With Mortgage |
| Housing Units | 3,770 | 5,166 |
| Median Property Value | $234,700 | $326,700 |
| Median Household Income | $55,396 | $1,194 |
| Monthly Housing Costs | $726 | $752 |
| Real Estate Taxes | $1,854 | $181 |
Property Value by Mortgage Status in Tarpon Springs
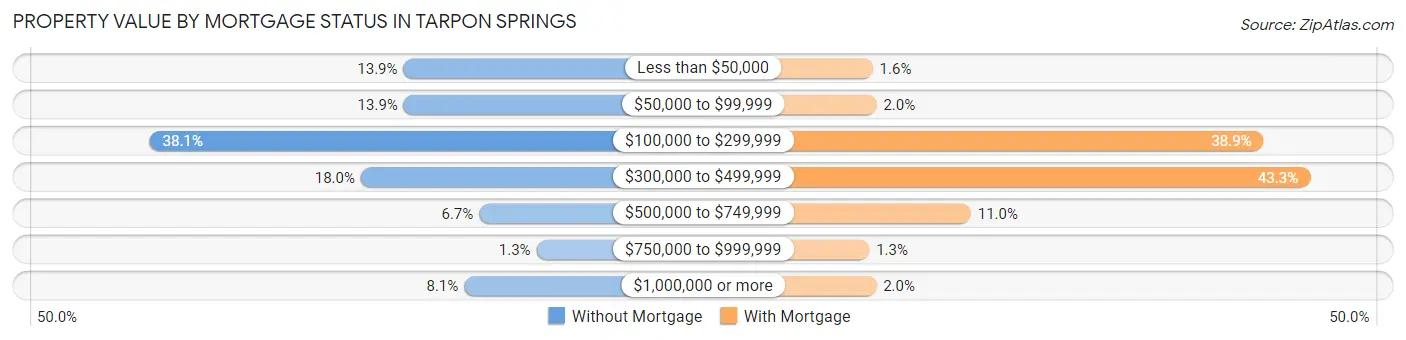
| Property Value | Without Mortgage | With Mortgage |
| Less than $50,000 | 525 (13.9%) | 84 (1.6%) |
| $50,000 to $99,999 | 524 (13.9%) | 103 (2.0%) |
| $100,000 to $299,999 | 1,436 (38.1%) | 2,007 (38.9%) |
| $300,000 to $499,999 | 678 (18.0%) | 2,236 (43.3%) |
| $500,000 to $749,999 | 253 (6.7%) | 567 (11.0%) |
| $750,000 to $999,999 | 47 (1.3%) | 67 (1.3%) |
| $1,000,000 or more | 307 (8.1%) | 102 (2.0%) |
| Total | 3,770 (100.0%) | 5,166 (100.0%) |
Household Income by Mortgage Status in Tarpon Springs
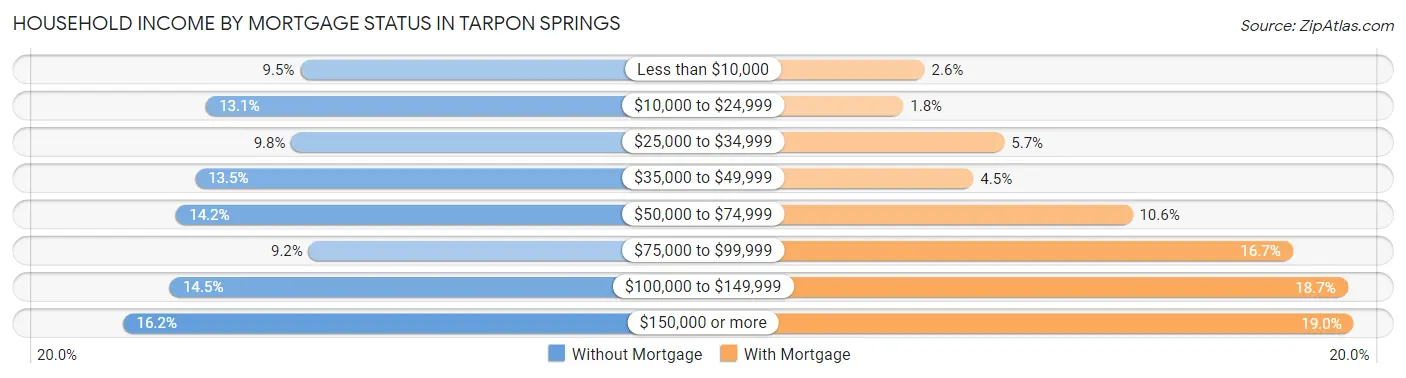
| Household Income | Without Mortgage | With Mortgage |
| Less than $10,000 | 358 (9.5%) | 136 (2.6%) |
| $10,000 to $24,999 | 493 (13.1%) | 94 (1.8%) |
| $25,000 to $34,999 | 371 (9.8%) | 293 (5.7%) |
| $35,000 to $49,999 | 509 (13.5%) | 232 (4.5%) |
| $50,000 to $74,999 | 536 (14.2%) | 545 (10.5%) |
| $75,000 to $99,999 | 346 (9.2%) | 860 (16.7%) |
| $100,000 to $149,999 | 545 (14.5%) | 968 (18.7%) |
| $150,000 or more | 612 (16.2%) | 980 (19.0%) |
| Total | 3,770 (100.0%) | 5,166 (100.0%) |
Property Value to Household Income Ratio in Tarpon Springs
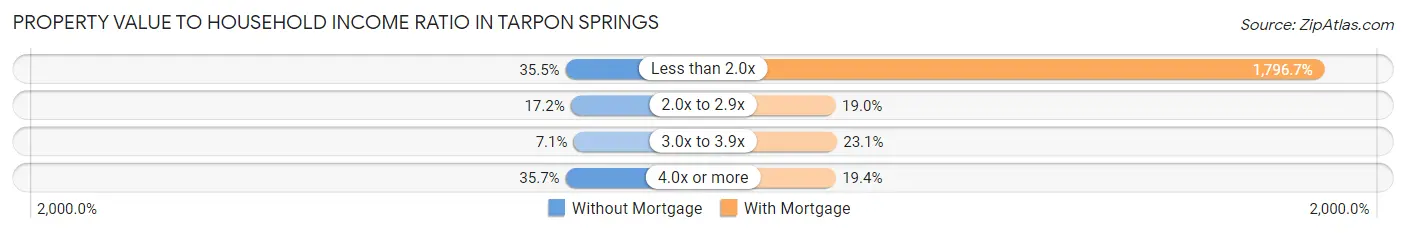
| Value-to-Income Ratio | Without Mortgage | With Mortgage |
| Less than 2.0x | 1,338 (35.5%) | 92,815 (1,796.6%) |
| 2.0x to 2.9x | 648 (17.2%) | 983 (19.0%) |
| 3.0x to 3.9x | 266 (7.1%) | 1,195 (23.1%) |
| 4.0x or more | 1,345 (35.7%) | 1,000 (19.4%) |
| Total | 3,770 (100.0%) | 5,166 (100.0%) |
Real Estate Taxes by Mortgage Status in Tarpon Springs
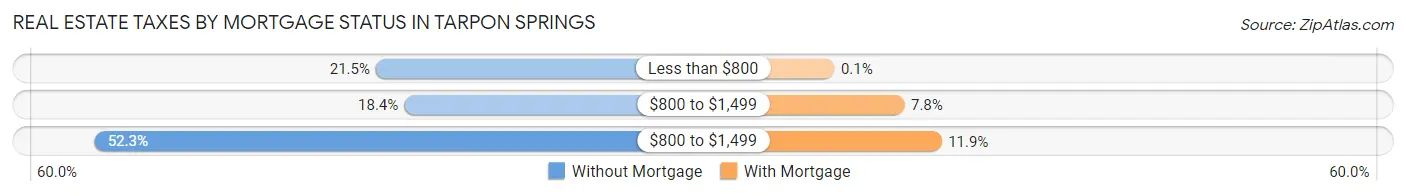
| Property Taxes | Without Mortgage | With Mortgage |
| Less than $800 | 811 (21.5%) | 5 (0.1%) |
| $800 to $1,499 | 694 (18.4%) | 402 (7.8%) |
| $800 to $1,499 | 1,972 (52.3%) | 612 (11.8%) |
| Total | 3,770 (100.0%) | 5,166 (100.0%) |
Health & Disability in Tarpon Springs
Health Insurance Coverage by Age in Tarpon Springs
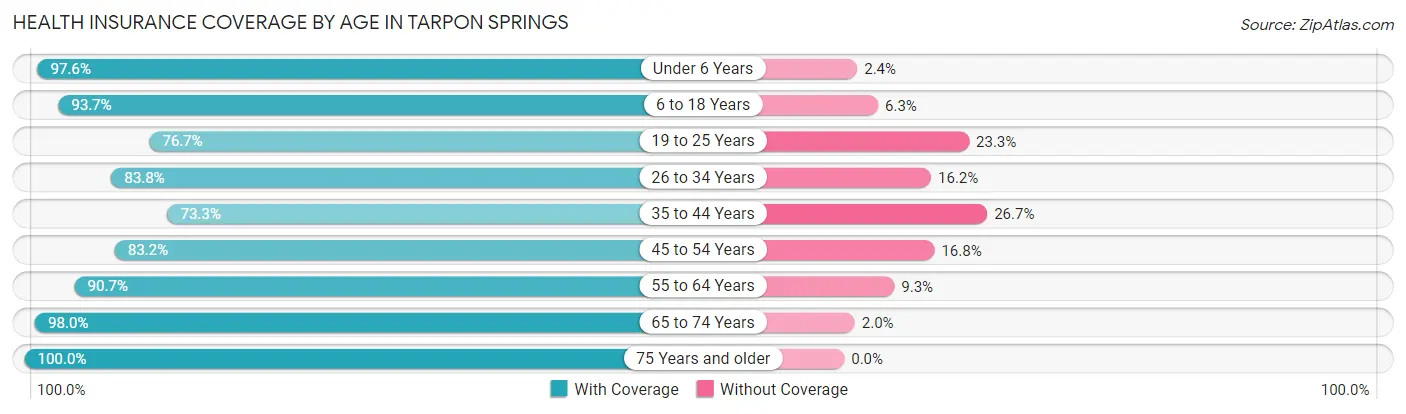
| Age Bracket | With Coverage | Without Coverage |
| Under 6 Years | 1,088 (97.6%) | 27 (2.4%) |
| 6 to 18 Years | 2,335 (93.7%) | 157 (6.3%) |
| 19 to 25 Years | 1,177 (76.7%) | 357 (23.3%) |
| 26 to 34 Years | 1,553 (83.8%) | 300 (16.2%) |
| 35 to 44 Years | 1,747 (73.3%) | 635 (26.7%) |
| 45 to 54 Years | 2,759 (83.2%) | 558 (16.8%) |
| 55 to 64 Years | 3,955 (90.7%) | 407 (9.3%) |
| 65 to 74 Years | 4,084 (98.0%) | 82 (2.0%) |
| 75 Years and older | 3,709 (100.0%) | 0 (0.0%) |
| Total | 22,407 (89.9%) | 2,523 (10.1%) |
Health Insurance Coverage by Citizenship Status in Tarpon Springs
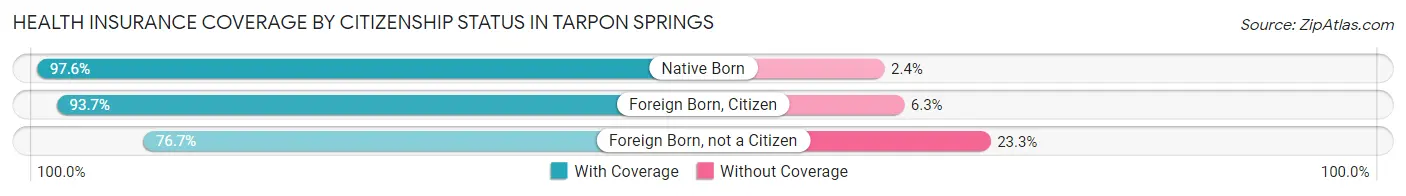
| Citizenship Status | With Coverage | Without Coverage |
| Native Born | 1,088 (97.6%) | 27 (2.4%) |
| Foreign Born, Citizen | 2,335 (93.7%) | 157 (6.3%) |
| Foreign Born, not a Citizen | 1,177 (76.7%) | 357 (23.3%) |
Health Insurance Coverage by Household Income in Tarpon Springs
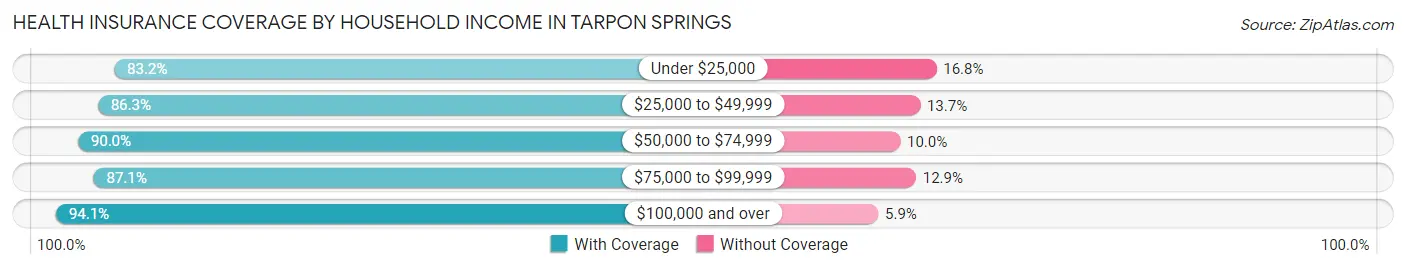
| Household Income | With Coverage | Without Coverage |
| Under $25,000 | 2,638 (83.2%) | 531 (16.8%) |
| $25,000 to $49,999 | 3,499 (86.3%) | 556 (13.7%) |
| $50,000 to $74,999 | 3,724 (90.0%) | 413 (10.0%) |
| $75,000 to $99,999 | 2,895 (87.1%) | 430 (12.9%) |
| $100,000 and over | 9,509 (94.1%) | 593 (5.9%) |
Public vs Private Health Insurance Coverage by Age in Tarpon Springs
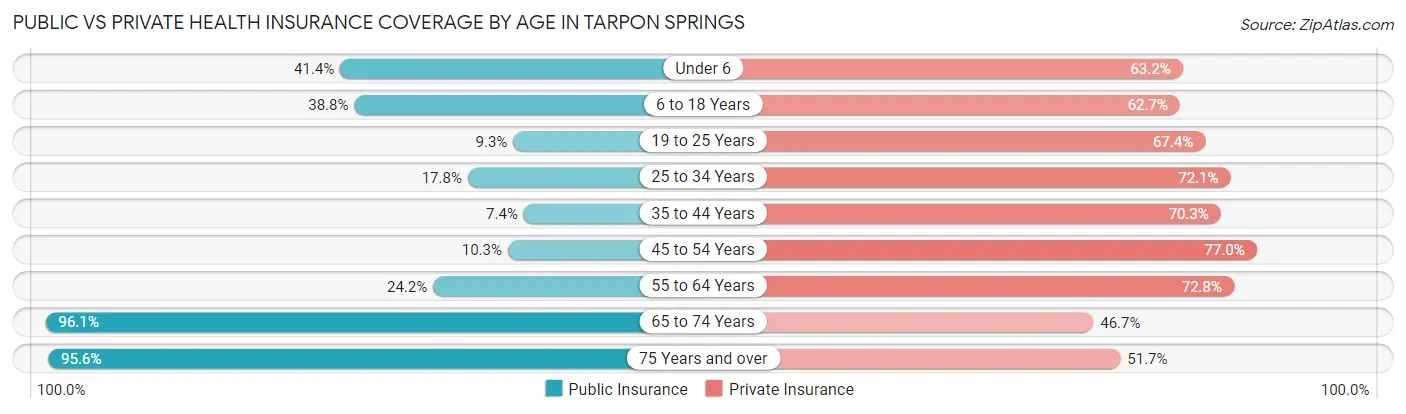
| Age Bracket | Public Insurance | Private Insurance |
| Under 6 | 462 (41.4%) | 705 (63.2%) |
| 6 to 18 Years | 967 (38.8%) | 1,563 (62.7%) |
| 19 to 25 Years | 143 (9.3%) | 1,034 (67.4%) |
| 25 to 34 Years | 329 (17.7%) | 1,336 (72.1%) |
| 35 to 44 Years | 175 (7.3%) | 1,675 (70.3%) |
| 45 to 54 Years | 342 (10.3%) | 2,554 (77.0%) |
| 55 to 64 Years | 1,055 (24.2%) | 3,174 (72.8%) |
| 65 to 74 Years | 4,004 (96.1%) | 1,945 (46.7%) |
| 75 Years and over | 3,547 (95.6%) | 1,918 (51.7%) |
| Total | 11,024 (44.2%) | 15,904 (63.8%) |
Disability Status by Sex by Age in Tarpon Springs
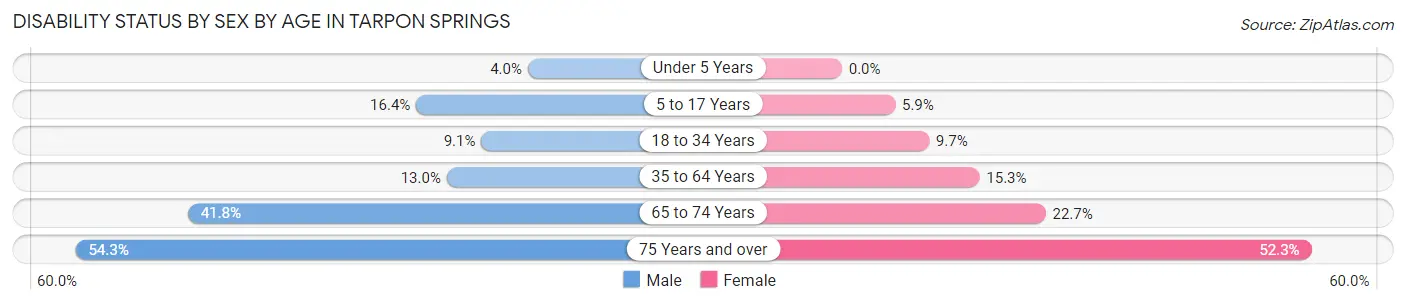
| Age Bracket | Male | Female |
| Under 5 Years | 18 (4.0%) | 0 (0.0%) |
| 5 to 17 Years | 186 (16.4%) | 77 (5.9%) |
| 18 to 34 Years | 155 (9.1%) | 188 (9.7%) |
| 35 to 64 Years | 643 (13.0%) | 783 (15.3%) |
| 65 to 74 Years | 771 (41.8%) | 527 (22.7%) |
| 75 Years and over | 916 (54.3%) | 1,058 (52.3%) |
Disability Class by Sex by Age in Tarpon Springs
Disability Class: Hearing Difficulty
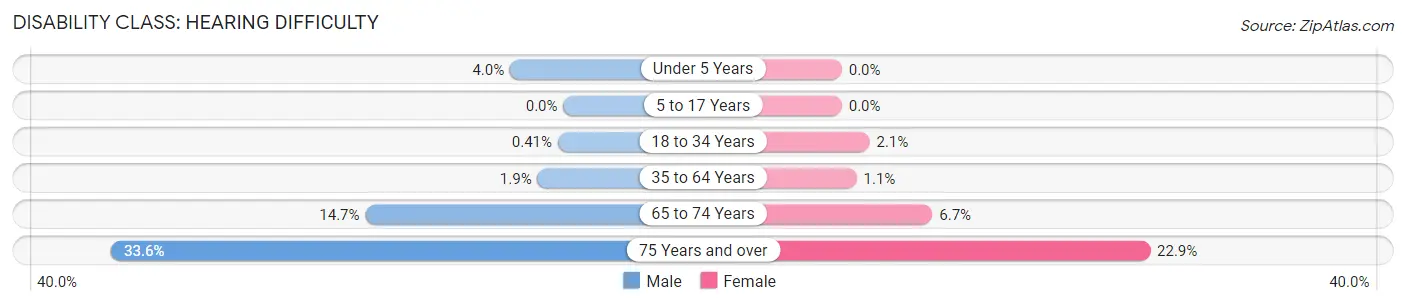
| Age Bracket | Male | Female |
| Under 5 Years | 18 (4.0%) | 0 (0.0%) |
| 5 to 17 Years | 0 (0.0%) | 0 (0.0%) |
| 18 to 34 Years | 7 (0.4%) | 40 (2.1%) |
| 35 to 64 Years | 95 (1.9%) | 56 (1.1%) |
| 65 to 74 Years | 271 (14.7%) | 156 (6.7%) |
| 75 Years and over | 566 (33.6%) | 463 (22.9%) |
Disability Class: Vision Difficulty
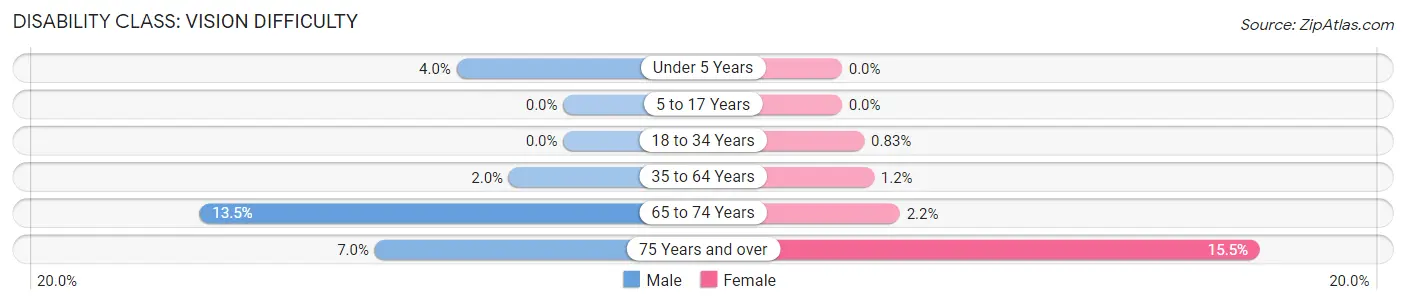
| Age Bracket | Male | Female |
| Under 5 Years | 18 (4.0%) | 0 (0.0%) |
| 5 to 17 Years | 0 (0.0%) | 0 (0.0%) |
| 18 to 34 Years | 0 (0.0%) | 16 (0.8%) |
| 35 to 64 Years | 100 (2.0%) | 61 (1.2%) |
| 65 to 74 Years | 249 (13.5%) | 50 (2.1%) |
| 75 Years and over | 118 (7.0%) | 314 (15.5%) |
Disability Class: Cognitive Difficulty
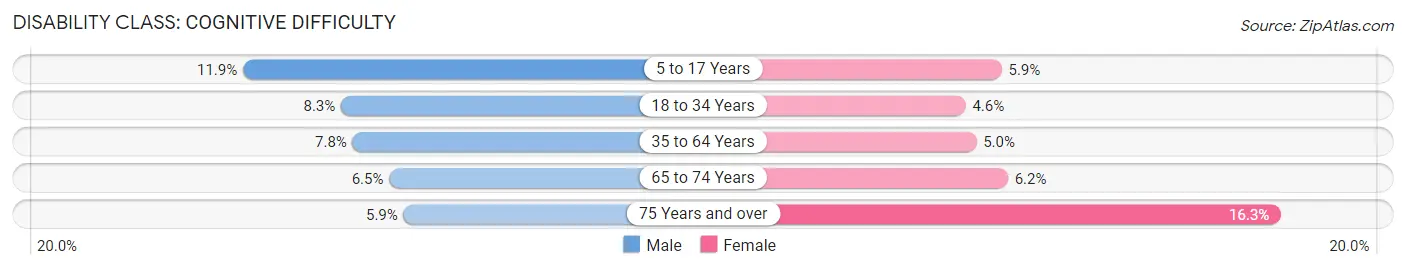
| Age Bracket | Male | Female |
| 5 to 17 Years | 135 (11.9%) | 77 (5.9%) |
| 18 to 34 Years | 140 (8.3%) | 89 (4.6%) |
| 35 to 64 Years | 387 (7.8%) | 255 (5.0%) |
| 65 to 74 Years | 119 (6.5%) | 143 (6.2%) |
| 75 Years and over | 100 (5.9%) | 330 (16.3%) |
Disability Class: Ambulatory Difficulty
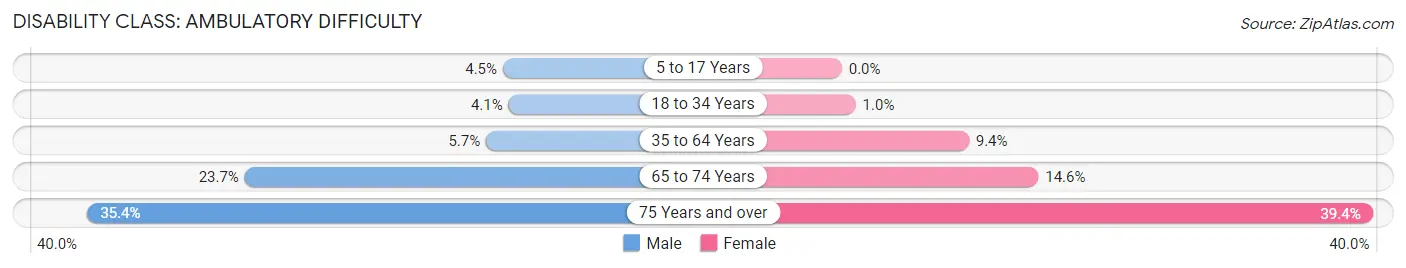
| Age Bracket | Male | Female |
| 5 to 17 Years | 51 (4.5%) | 0 (0.0%) |
| 18 to 34 Years | 69 (4.1%) | 20 (1.0%) |
| 35 to 64 Years | 284 (5.7%) | 482 (9.4%) |
| 65 to 74 Years | 436 (23.7%) | 339 (14.6%) |
| 75 Years and over | 596 (35.3%) | 797 (39.4%) |
Disability Class: Self-Care Difficulty
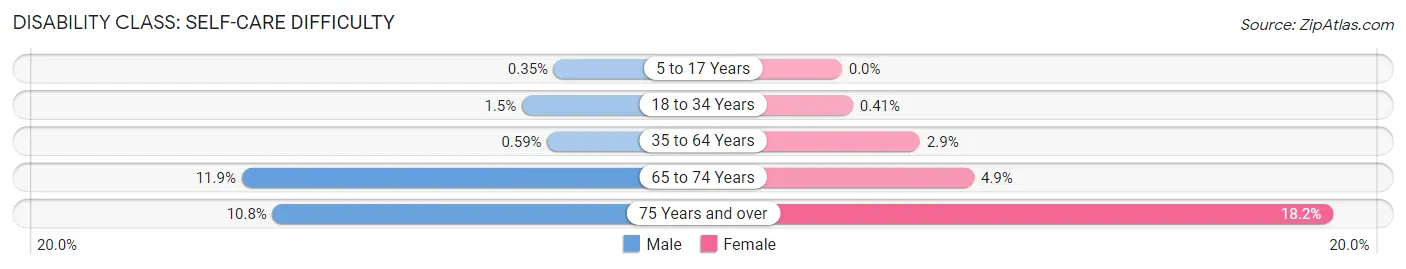
| Age Bracket | Male | Female |
| 5 to 17 Years | 4 (0.4%) | 0 (0.0%) |
| 18 to 34 Years | 26 (1.5%) | 8 (0.4%) |
| 35 to 64 Years | 29 (0.6%) | 148 (2.9%) |
| 65 to 74 Years | 220 (11.9%) | 114 (4.9%) |
| 75 Years and over | 182 (10.8%) | 369 (18.2%) |
Technology Access in Tarpon Springs
Computing Device Access in Tarpon Springs
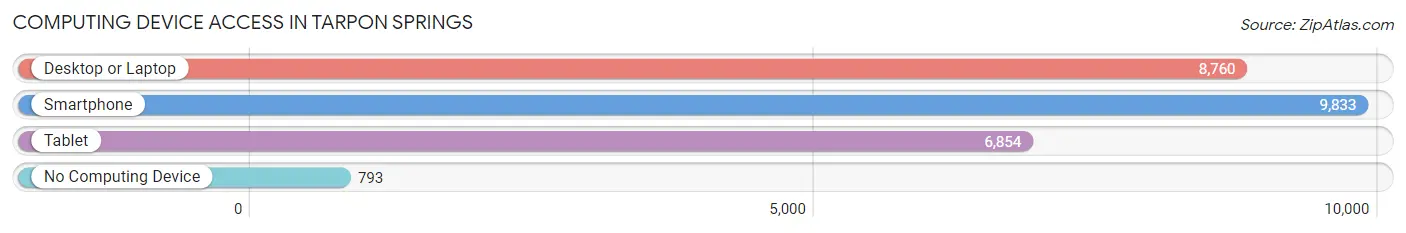
| Device Type | # Households | % Households |
| Desktop or Laptop | 8,760 | 77.5% |
| Smartphone | 9,833 | 87.0% |
| Tablet | 6,854 | 60.7% |
| No Computing Device | 793 | 7.0% |
| Total | 11,300 | 100.0% |
Internet Access in Tarpon Springs
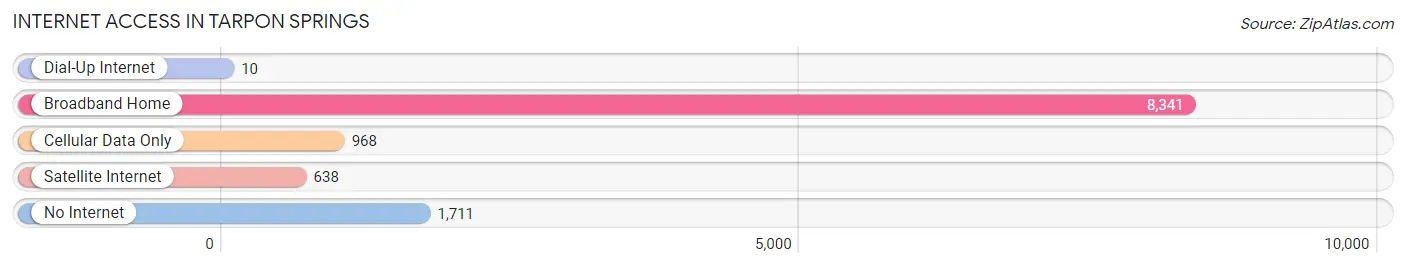
| Internet Type | # Households | % Households |
| Dial-Up Internet | 10 | 0.1% |
| Broadband Home | 8,341 | 73.8% |
| Cellular Data Only | 968 | 8.6% |
| Satellite Internet | 638 | 5.7% |
| No Internet | 1,711 | 15.1% |
| Total | 11,300 | 100.0% |
Tarpon Springs Summary
Tarpon Springs is a city located in Pinellas County, Florida, United States. It is located on the Gulf of Mexico, about 35 miles northwest of Tampa. The population was 23,484 at the 2010 census, making it the largest city in Pinellas County. The city is known for its Greek heritage, its sponge industry, and its tourist attractions.
Geography
Tarpon Springs is located at 28°09'N 82°44'W (28.15, -82.73). According to the United States Census Bureau, the city has a total area of 11.2 square miles (29.0 km2), of which 10.2 square miles (26.4 km2) is land and 1.0 square mile (2.6 km2) (8.90%) is water.
The city is located on the Gulf of Mexico, about 35 miles northwest of Tampa. It is bordered by the cities of Oldsmar to the north, Palm Harbor to the east, and Holiday to the south.
History
Tarpon Springs was first settled in 1876 by Greek sponge divers who had come to the area to harvest the abundant natural sponges. The city was incorporated in 1887 and was named after the tarpon fish, which were abundant in the area.
The sponge industry was the mainstay of the city's economy for many years. In the early 1900s, the sponge industry was so successful that Tarpon Springs was known as the "Sponge Capital of the World." The industry declined in the 1950s, but the city still retains its Greek heritage and is home to many Greek restaurants and businesses.
Economy
Tarpon Springs is a tourist destination, with many attractions, including the Sponge Docks, the historic Greek Village, and the Tarpon Springs Aquarium. The city also has a vibrant arts and culture scene, with several galleries, museums, and performing arts venues.
The city's economy is also supported by a variety of industries, including manufacturing, retail, and healthcare. The city is home to several large employers, including the Anclote Power Plant, the Tarpon Springs Sponge Exchange, and the Tarpon Springs Medical Center.
Demographics
As of the 2010 census, there were 23,484 people, 9,845 households, and 6,541 families residing in the city. The population density was 2,310.3 people per square mile (895.2/km2). There were 10,845 housing units at an average density of 1,062.3 per square mile (410.3/km2). The racial makeup of the city was 81.2% White, 8.3% African American, 0.3% Native American, 2.2% Asian, 0.1% Pacific Islander, 5.2% from other races, and 2.8% from two or more races. Hispanic or Latino of any race were 16.2% of the population.
There were 9,845 households, out of which 24.3% had children under the age of 18 living with them, 48.2% were married couples living together, 12.7% had a female householder with no husband present, and 34.2% were non-families. 28.2% of all households were made up of individuals, and 12.3% had someone living alone who was 65 years of age or older. The average household size was 2.37 and the average family size was 2.88.
In the city, the population was spread out, with 20.7% under the age of 18, 7.2% from 18 to 24, 25.3% from 25 to 44, 27.2% from 45 to 64, and 19.6% who were 65 years of age or older. The median age was 42 years. For every 100 females, there were 93.2 males. For every 100 females age 18 and over, there were 90.2 males.
The median income for a household in the city was $41,945, and the median income for a family was $50,945. Males had a median income of $37,813 versus $27,945 for females. The per capita income for the city was $22,945. About 8.2% of families and 11.2% of the population were below the poverty line, including 15.2% of those under age 18 and 8.2% of those age 65 or over.
Common Questions
What is Per Capita Income in Tarpon Springs?
Per Capita income in Tarpon Springs is $49,150.
What is the Median Family Income in Tarpon Springs?
Median Family Income in Tarpon Springs is $87,950.
What is the Median Household income in Tarpon Springs?
Median Household Income in Tarpon Springs is $63,836.
What is Income or Wage Gap in Tarpon Springs?
Income or Wage Gap in Tarpon Springs is 18.0%.
Women in Tarpon Springs earn 82.0 cents for every dollar earned by a man.
What is Inequality or Gini Index in Tarpon Springs?
Inequality or Gini Index in Tarpon Springs is 0.54.
What is the Total Population of Tarpon Springs?
Total Population of Tarpon Springs is 25,355.
What is the Total Male Population of Tarpon Springs?
Total Male Population of Tarpon Springs is 12,042.
What is the Total Female Population of Tarpon Springs?
Total Female Population of Tarpon Springs is 13,313.
What is the Ratio of Males per 100 Females in Tarpon Springs?
There are 90.45 Males per 100 Females in Tarpon Springs.
What is the Ratio of Females per 100 Males in Tarpon Springs?
There are 110.55 Females per 100 Males in Tarpon Springs.
What is the Median Population Age in Tarpon Springs?
Median Population Age in Tarpon Springs is 54.1 Years.
What is the Average Family Size in Tarpon Springs
Average Family Size in Tarpon Springs is 2.9 People.
What is the Average Household Size in Tarpon Springs
Average Household Size in Tarpon Springs is 2.2 People.
How Large is the Labor Force in Tarpon Springs?
There are 11,341 People in the Labor Forcein in Tarpon Springs.
What is the Percentage of People in the Labor Force in Tarpon Springs?
50.7% of People are in the Labor Force in Tarpon Springs.
What is the Unemployment Rate in Tarpon Springs?
Unemployment Rate in Tarpon Springs is 5.5%.