Paw Paw, WV Map & Demographics
Paw Paw Map
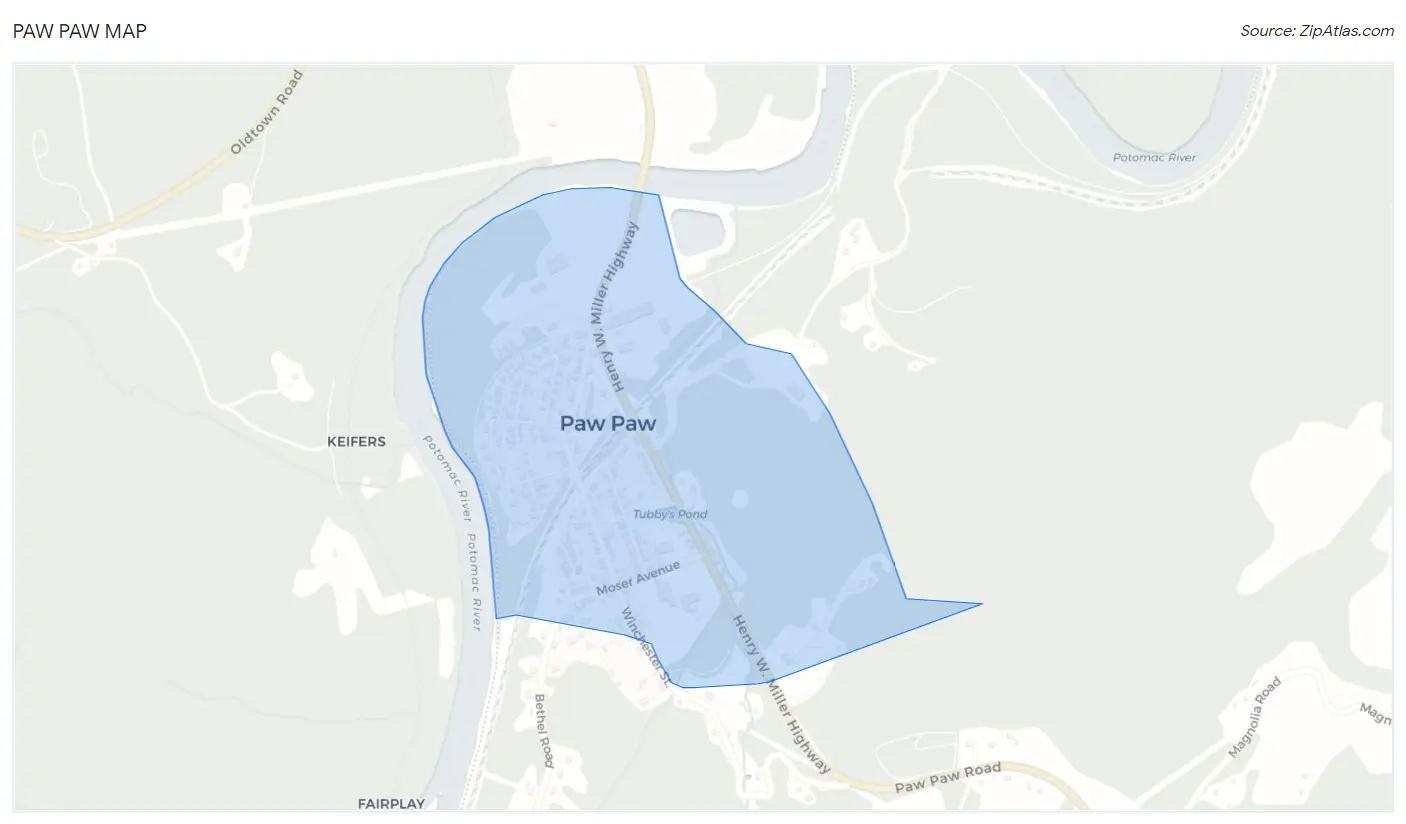
Paw Paw Overview
$23,810
PER CAPITA INCOME
$44,293
AVG FAMILY INCOME
$58,750
AVG HOUSEHOLD INCOME
50.3%
WAGE / INCOME GAP [ % ]
49.7¢/ $1
WAGE / INCOME GAP [ $ ]
0.33
INEQUALITY / GINI INDEX
463
TOTAL POPULATION
240
MALE POPULATION
223
FEMALE POPULATION
107.62
MALES / 100 FEMALES
92.92
FEMALES / 100 MALES
47.7
MEDIAN AGE
3.0
AVG FAMILY SIZE
2.6
AVG HOUSEHOLD SIZE
204
LABOR FORCE [ PEOPLE ]
55.3%
PERCENT IN LABOR FORCE
14.2%
UNEMPLOYMENT RATE
Paw Paw Zip Codes
Income in Paw Paw
Income Overview in Paw Paw
Per Capita Income in Paw Paw is $23,810, while median incomes of families and households are $44,293 and $58,750 respectively.
| Characteristic | Number | Measure |
| Per Capita Income | 463 | $23,810 |
| Median Family Income | 135 | $44,293 |
| Mean Family Income | 135 | $60,833 |
| Median Household Income | 175 | $58,750 |
| Mean Household Income | 175 | $57,713 |
| Income Deficit | 135 | $0 |
| Wage / Income Gap (%) | 463 | 50.31% |
| Wage / Income Gap ($) | 463 | 49.69¢ per $1 |
| Gini / Inequality Index | 463 | 0.33 |
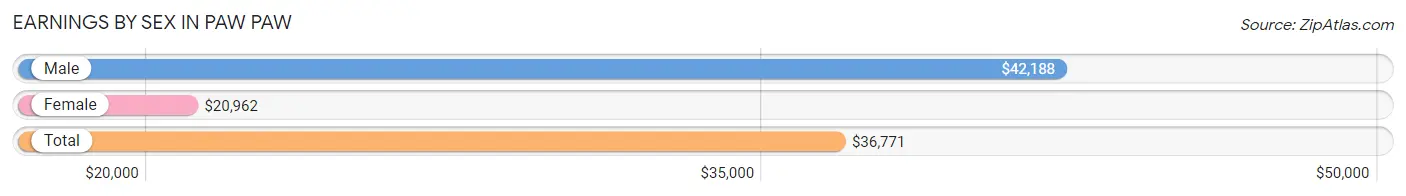
Earnings by Sex in Paw Paw
Average Earnings in Paw Paw are $36,771, $42,188 for men and $20,962 for women, a difference of 50.3%.
| Sex | Number | Average Earnings |
| Male | 149 (69.3%) | $42,188 |
| Female | 66 (30.7%) | $20,962 |
| Total | 215 (100.0%) | $36,771 |
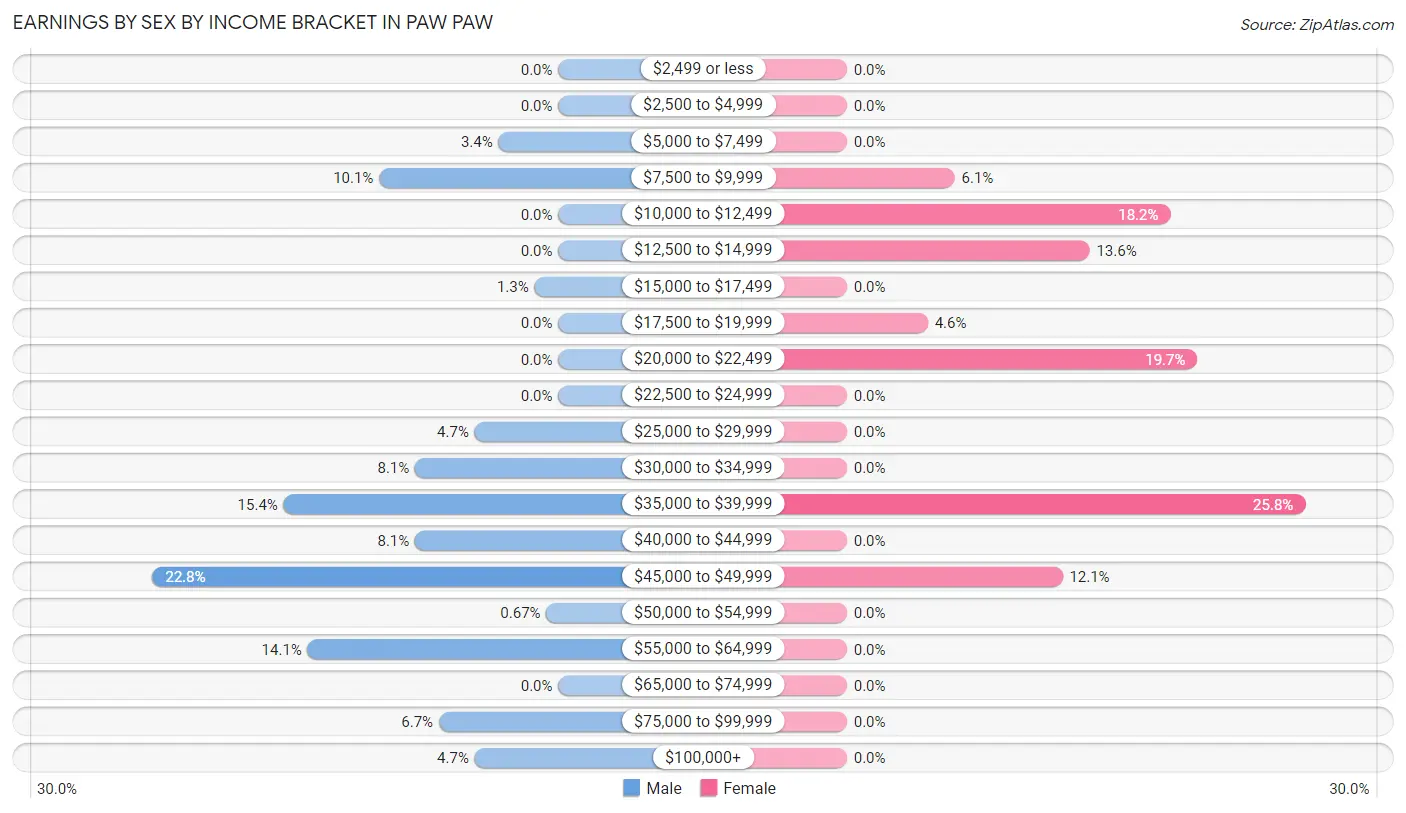
Earnings by Sex by Income Bracket in Paw Paw
The most common earnings brackets in Paw Paw are $45,000 to $49,999 for men (34 | 22.8%) and $35,000 to $39,999 for women (17 | 25.8%).
| Income | Male | Female |
| $2,499 or less | 0 (0.0%) | 0 (0.0%) |
| $2,500 to $4,999 | 0 (0.0%) | 0 (0.0%) |
| $5,000 to $7,499 | 5 (3.4%) | 0 (0.0%) |
| $7,500 to $9,999 | 15 (10.1%) | 4 (6.1%) |
| $10,000 to $12,499 | 0 (0.0%) | 12 (18.2%) |
| $12,500 to $14,999 | 0 (0.0%) | 9 (13.6%) |
| $15,000 to $17,499 | 2 (1.3%) | 0 (0.0%) |
| $17,500 to $19,999 | 0 (0.0%) | 3 (4.5%) |
| $20,000 to $22,499 | 0 (0.0%) | 13 (19.7%) |
| $22,500 to $24,999 | 0 (0.0%) | 0 (0.0%) |
| $25,000 to $29,999 | 7 (4.7%) | 0 (0.0%) |
| $30,000 to $34,999 | 12 (8.1%) | 0 (0.0%) |
| $35,000 to $39,999 | 23 (15.4%) | 17 (25.8%) |
| $40,000 to $44,999 | 12 (8.1%) | 0 (0.0%) |
| $45,000 to $49,999 | 34 (22.8%) | 8 (12.1%) |
| $50,000 to $54,999 | 1 (0.7%) | 0 (0.0%) |
| $55,000 to $64,999 | 21 (14.1%) | 0 (0.0%) |
| $65,000 to $74,999 | 0 (0.0%) | 0 (0.0%) |
| $75,000 to $99,999 | 10 (6.7%) | 0 (0.0%) |
| $100,000+ | 7 (4.7%) | 0 (0.0%) |
| Total | 149 (100.0%) | 66 (100.0%) |
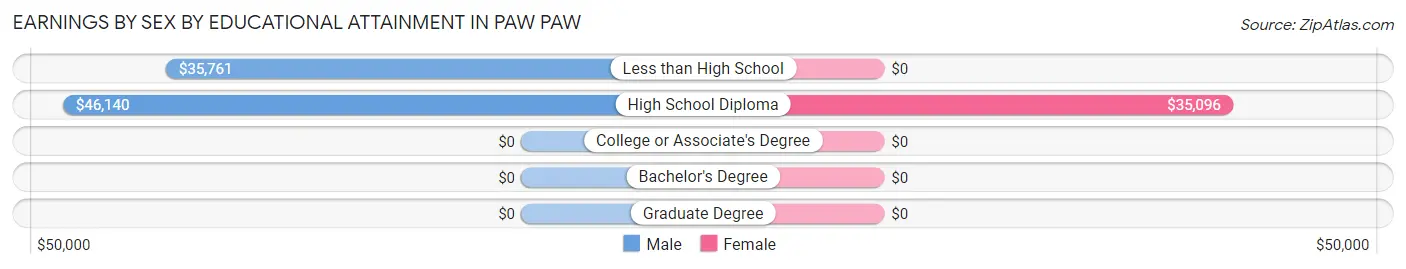
Earnings by Sex by Educational Attainment in Paw Paw
Average earnings in Paw Paw are $45,037 for men and $20,962 for women, a difference of 53.5%. Men with an educational attainment of high school diploma enjoy the highest average annual earnings of $46,140, while those with less than high school education earn the least with $35,761. Women with an educational attainment of high school diploma earn the most with the average annual earnings of $35,096, while those with high school diploma education have the smallest earnings of $35,096.
| Educational Attainment | Male Income | Female Income |
| Less than High School | $35,761 | $0 |
| High School Diploma | $46,140 | $35,096 |
| College or Associate's Degree | - | - |
| Bachelor's Degree | - | - |
| Graduate Degree | - | - |
| Total | $45,037 | $20,962 |
Family Income in Paw Paw
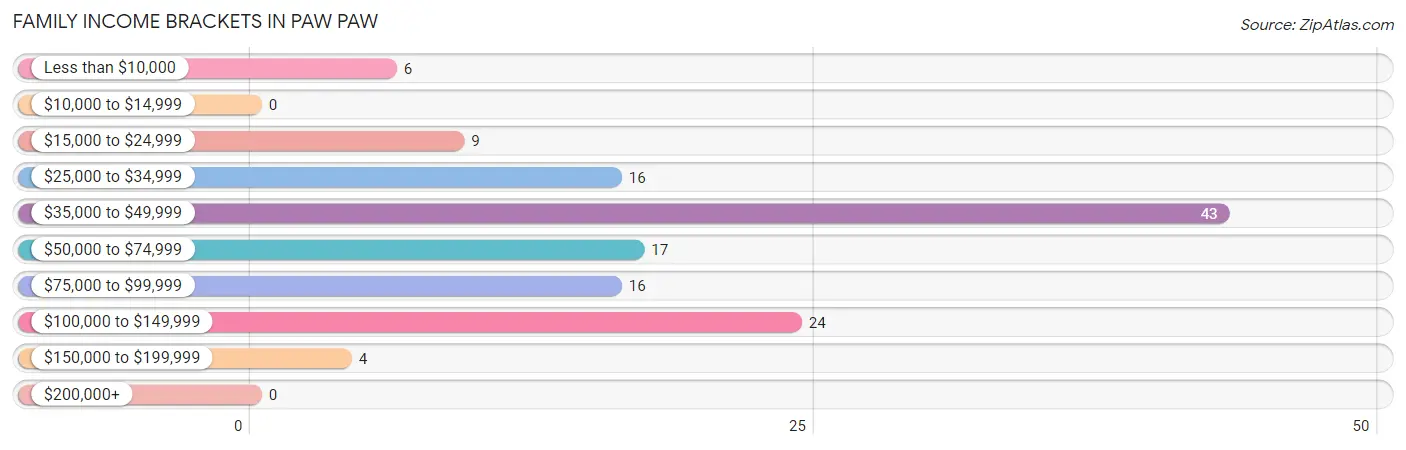
Family Income Brackets in Paw Paw
According to the Paw Paw family income data, there are 43 families falling into the $35,000 to $49,999 income range, which is the most common income bracket and makes up 31.9% of all families.
| Income Bracket | # Families | % Families |
| Less than $10,000 | 6 | 4.4% |
| $10,000 to $14,999 | 0 | 0.0% |
| $15,000 to $24,999 | 9 | 6.7% |
| $25,000 to $34,999 | 16 | 11.9% |
| $35,000 to $49,999 | 43 | 31.9% |
| $50,000 to $74,999 | 17 | 12.6% |
| $75,000 to $99,999 | 16 | 11.9% |
| $100,000 to $149,999 | 24 | 17.8% |
| $150,000 to $199,999 | 4 | 3.0% |
| $200,000+ | 0 | 0.0% |
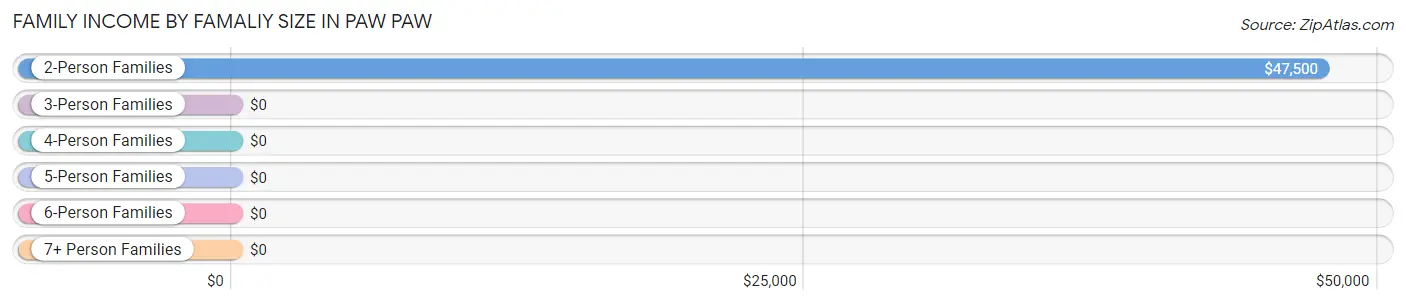
Family Income by Famaliy Size in Paw Paw
2-person families (66 | 48.9%) account for the highest median family income in Paw Paw with $47,500 per family, while 2-person families (66 | 48.9%) have the highest median income of $23,750 per family member.
| Income Bracket | # Families | Median Income |
| 2-Person Families | 66 (48.9%) | $47,500 |
| 3-Person Families | 16 (11.8%) | $0 |
| 4-Person Families | 30 (22.2%) | $0 |
| 5-Person Families | 22 (16.3%) | $0 |
| 6-Person Families | 1 (0.7%) | $0 |
| 7+ Person Families | 0 (0.0%) | $0 |
| Total | 135 (100.0%) | $44,293 |
Family Income by Number of Earners in Paw Paw
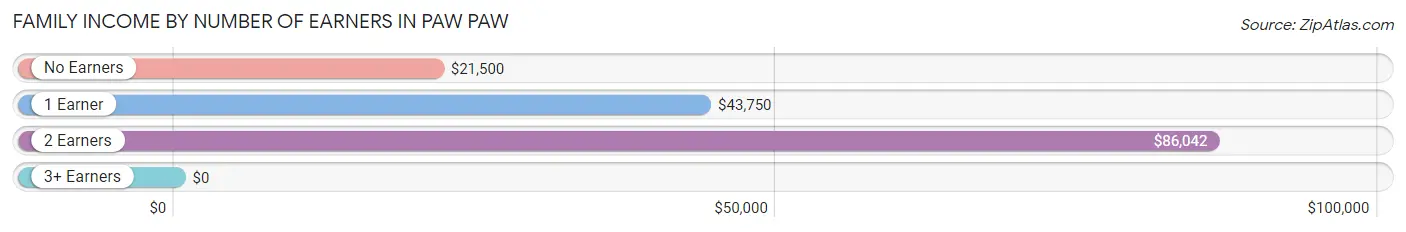
| Number of Earners | # Families | Median Income |
| No Earners | 26 (19.3%) | $21,500 |
| 1 Earner | 49 (36.3%) | $43,750 |
| 2 Earners | 57 (42.2%) | $86,042 |
| 3+ Earners | 3 (2.2%) | $0 |
| Total | 135 (100.0%) | $44,293 |
Household Income in Paw Paw
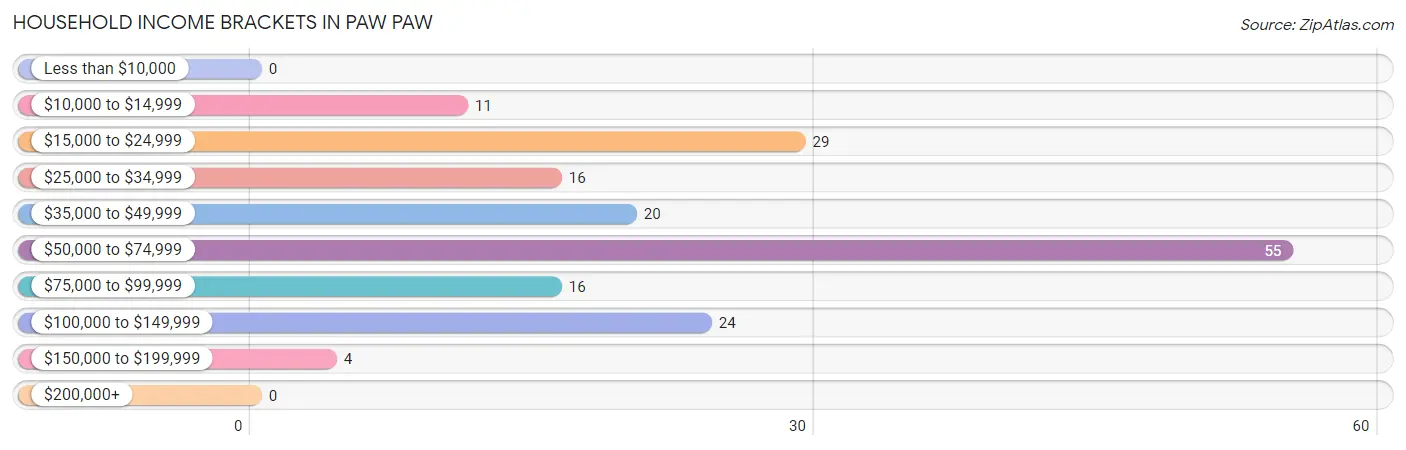
Household Income Brackets in Paw Paw
With 55 households falling in the category, the $50,000 to $74,999 income range is the most frequent in Paw Paw, accounting for 31.4% of all households.
| Income Bracket | # Households | % Households |
| Less than $10,000 | 0 | 0.0% |
| $10,000 to $14,999 | 11 | 6.3% |
| $15,000 to $24,999 | 29 | 16.6% |
| $25,000 to $34,999 | 16 | 9.1% |
| $35,000 to $49,999 | 20 | 11.4% |
| $50,000 to $74,999 | 55 | 31.4% |
| $75,000 to $99,999 | 16 | 9.1% |
| $100,000 to $149,999 | 24 | 13.7% |
| $150,000 to $199,999 | 4 | 2.3% |
| $200,000+ | 0 | 0.0% |
Household Income by Householder Age in Paw Paw
The median household income in Paw Paw is $58,750, with the highest median household income of $61,856 found in the 45 to 64 years age bracket for the primary householder. A total of 79 households (45.1%) fall into this category.
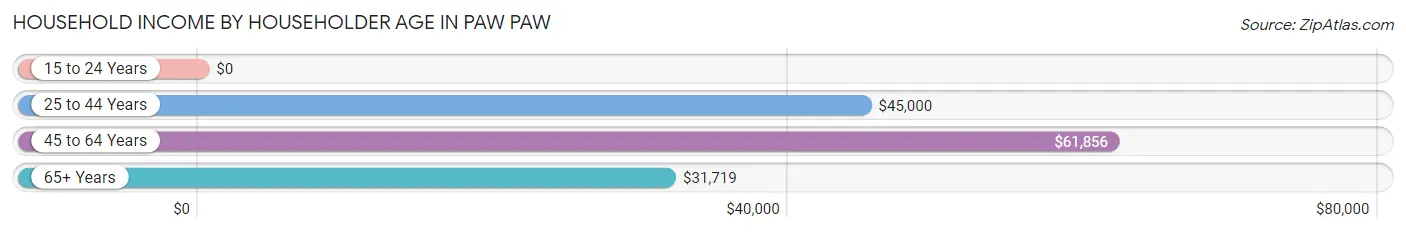
| Income Bracket | # Households | Median Income |
| 15 to 24 Years | 0 (0.0%) | $0 |
| 25 to 44 Years | 36 (20.6%) | $45,000 |
| 45 to 64 Years | 79 (45.1%) | $61,856 |
| 65+ Years | 60 (34.3%) | $31,719 |
| Total | 175 (100.0%) | $58,750 |
Poverty in Paw Paw
Income Below Poverty by Sex and Age in Paw Paw
With 5.4% poverty level for males and 15.7% for females among the residents of Paw Paw, 25 to 34 year old males and 6 to 11 year old females are the most vulnerable to poverty, with 5 males (71.4%) and 10 females (71.4%) in their respective age groups living below the poverty level.
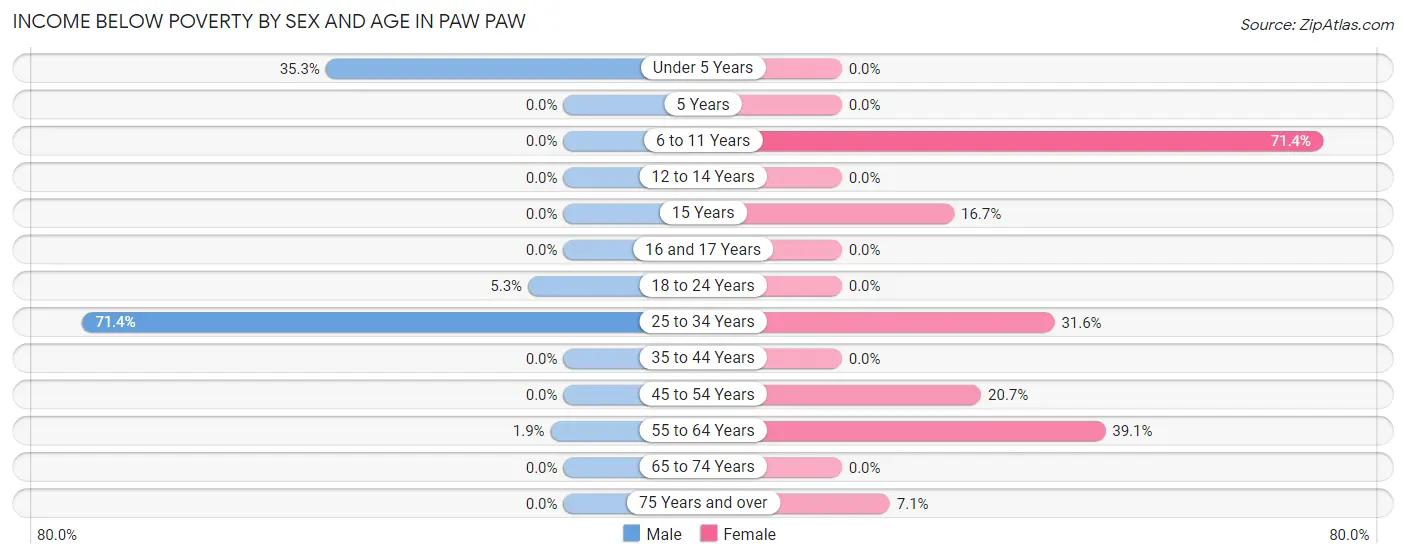
| Age Bracket | Male | Female |
| Under 5 Years | 6 (35.3%) | 0 (0.0%) |
| 5 Years | 0 (0.0%) | 0 (0.0%) |
| 6 to 11 Years | 0 (0.0%) | 10 (71.4%) |
| 12 to 14 Years | 0 (0.0%) | 0 (0.0%) |
| 15 Years | 0 (0.0%) | 3 (16.7%) |
| 16 and 17 Years | 0 (0.0%) | 0 (0.0%) |
| 18 to 24 Years | 1 (5.3%) | 0 (0.0%) |
| 25 to 34 Years | 5 (71.4%) | 6 (31.6%) |
| 35 to 44 Years | 0 (0.0%) | 0 (0.0%) |
| 45 to 54 Years | 0 (0.0%) | 6 (20.7%) |
| 55 to 64 Years | 1 (1.9%) | 9 (39.1%) |
| 65 to 74 Years | 0 (0.0%) | 0 (0.0%) |
| 75 Years and over | 0 (0.0%) | 1 (7.1%) |
| Total | 13 (5.4%) | 35 (15.7%) |
Income Above Poverty by Sex and Age in Paw Paw
According to the poverty statistics in Paw Paw, males aged 6 to 11 years and females aged 12 to 14 years are the age groups that are most secure financially, with 100.0% of males and 100.0% of females in these age groups living above the poverty line.
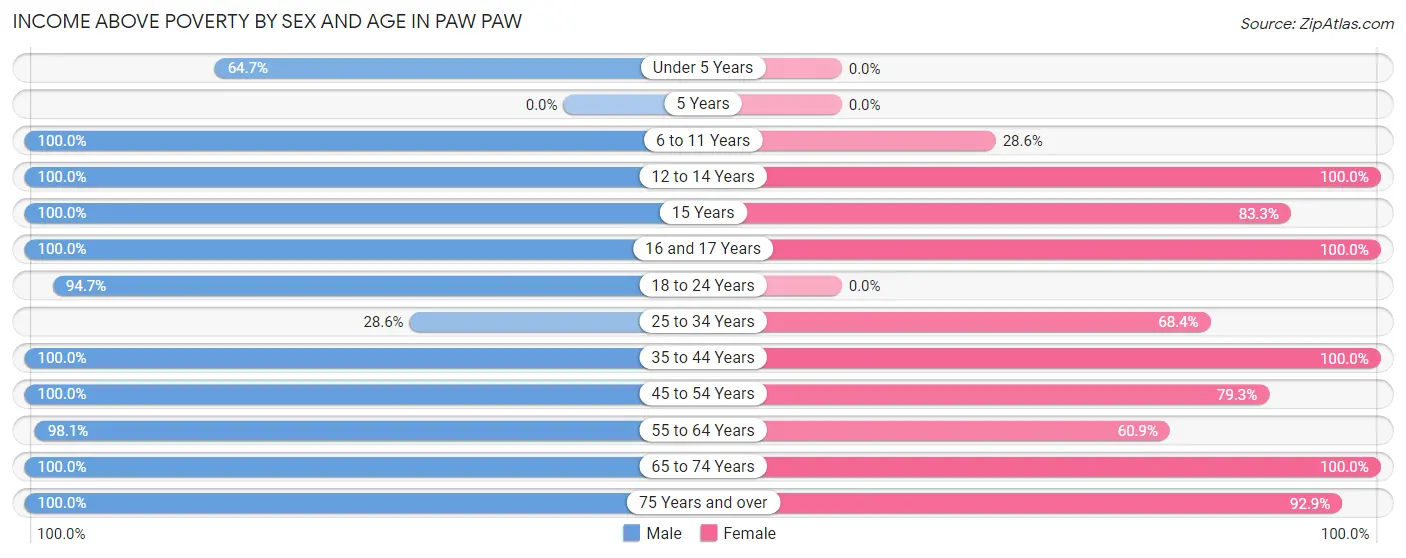
| Age Bracket | Male | Female |
| Under 5 Years | 11 (64.7%) | 0 (0.0%) |
| 5 Years | 0 (0.0%) | 0 (0.0%) |
| 6 to 11 Years | 13 (100.0%) | 4 (28.6%) |
| 12 to 14 Years | 6 (100.0%) | 24 (100.0%) |
| 15 Years | 2 (100.0%) | 15 (83.3%) |
| 16 and 17 Years | 10 (100.0%) | 19 (100.0%) |
| 18 to 24 Years | 18 (94.7%) | 0 (0.0%) |
| 25 to 34 Years | 2 (28.6%) | 13 (68.4%) |
| 35 to 44 Years | 14 (100.0%) | 22 (100.0%) |
| 45 to 54 Years | 59 (100.0%) | 23 (79.3%) |
| 55 to 64 Years | 51 (98.1%) | 14 (60.9%) |
| 65 to 74 Years | 25 (100.0%) | 41 (100.0%) |
| 75 Years and over | 16 (100.0%) | 13 (92.9%) |
| Total | 227 (94.6%) | 188 (84.3%) |
Income Below Poverty Among Married-Couple Families in Paw Paw
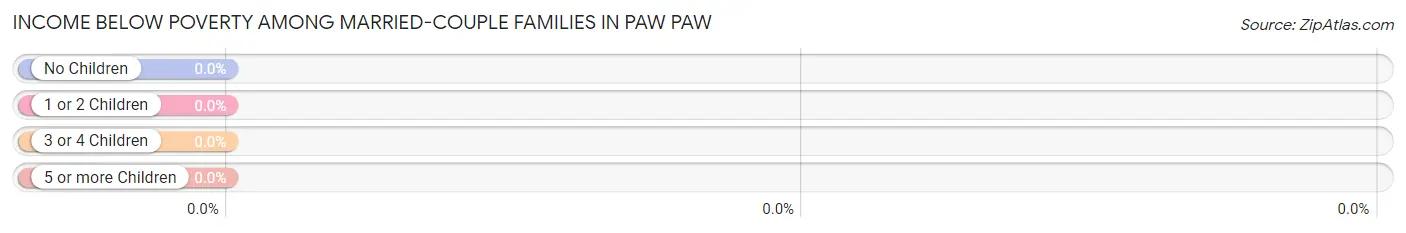
| Children | Above Poverty | Below Poverty |
| No Children | 51 (100.0%) | 0 (0.0%) |
| 1 or 2 Children | 24 (100.0%) | 0 (0.0%) |
| 3 or 4 Children | 13 (100.0%) | 0 (0.0%) |
| 5 or more Children | 0 (0.0%) | 0 (0.0%) |
| Total | 88 (100.0%) | 0 (0.0%) |
Income Below Poverty Among Single-Parent Households in Paw Paw

| Children | Single Father | Single Mother |
| No Children | 0 (0.0%) | 0 (0.0%) |
| 1 or 2 Children | 0 (0.0%) | 0 (0.0%) |
| 3 or 4 Children | 0 (0.0%) | 6 (100.0%) |
| 5 or more Children | 0 (0.0%) | 0 (0.0%) |
| Total | 0 (0.0%) | 6 (27.3%) |
Income Below Poverty Among Married-Couple vs Single-Parent Households in Paw Paw
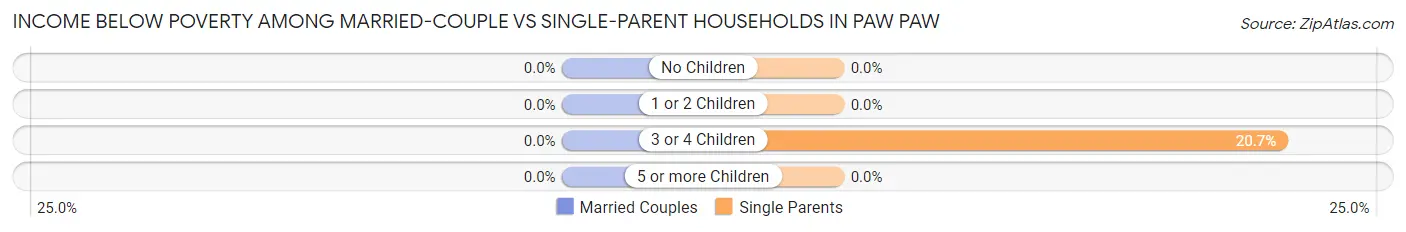
| Children | Married-Couple Families | Single-Parent Households |
| No Children | 0 (0.0%) | 0 (0.0%) |
| 1 or 2 Children | 0 (0.0%) | 0 (0.0%) |
| 3 or 4 Children | 0 (0.0%) | 6 (20.7%) |
| 5 or more Children | 0 (0.0%) | 0 (0.0%) |
| Total | 0 (0.0%) | 6 (12.8%) |
Race in Paw Paw
The most populous races in Paw Paw are White / Caucasian (358 | 77.3%), Two or more Races (68 | 14.7%), and Hispanic or Latino (53 | 11.5%).
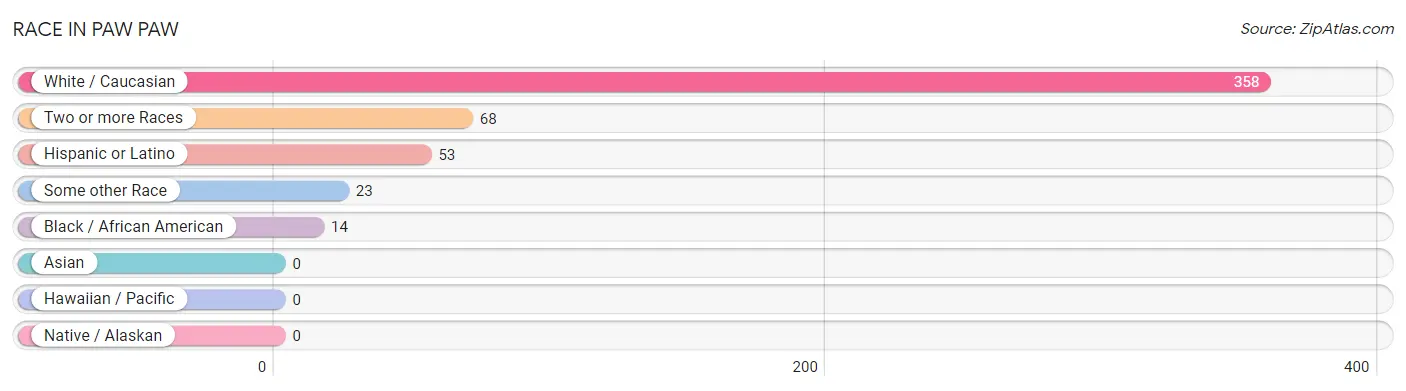
| Race | # Population | % Population |
| Asian | 0 | 0.0% |
| Black / African American | 14 | 3.0% |
| Hawaiian / Pacific | 0 | 0.0% |
| Hispanic or Latino | 53 | 11.5% |
| Native / Alaskan | 0 | 0.0% |
| White / Caucasian | 358 | 77.3% |
| Two or more Races | 68 | 14.7% |
| Some other Race | 23 | 5.0% |
| Total | 463 | 100.0% |
Ancestry in Paw Paw
The most populous ancestries reported in Paw Paw are German (71 | 15.3%), Irish (63 | 13.6%), Greek (61 | 13.2%), Central American (53 | 11.5%), and Salvadoran (53 | 11.5%), together accounting for 65.0% of all Paw Paw residents.
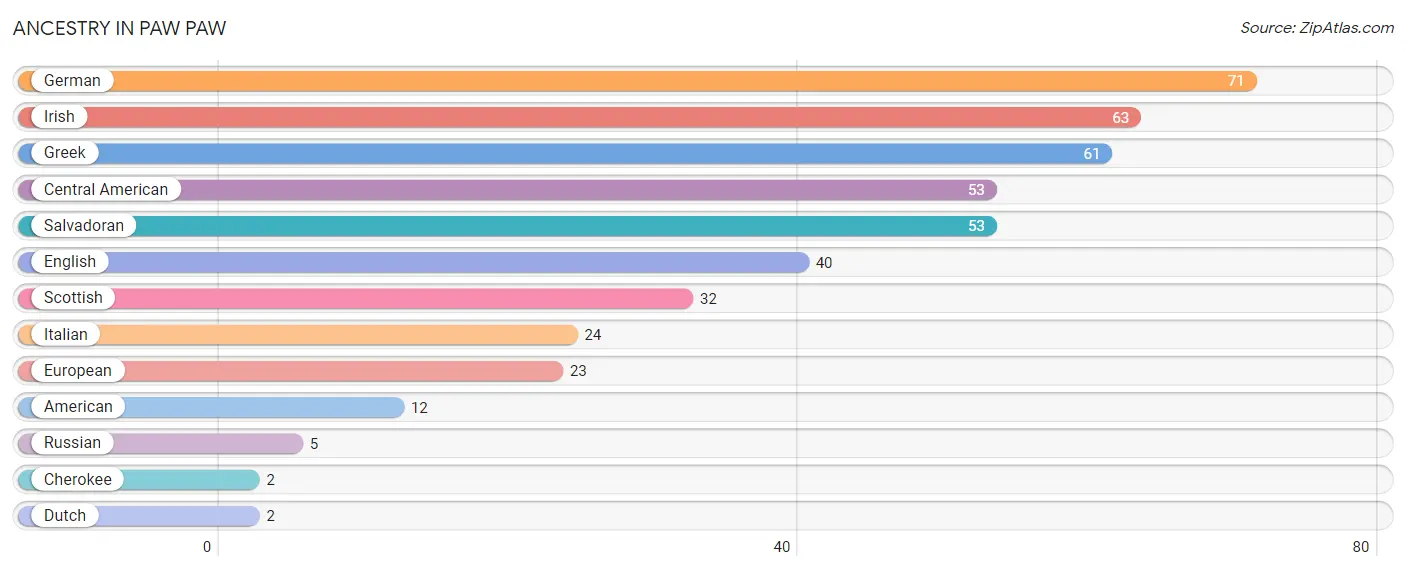
| Ancestry | # Population | % Population |
| American | 12 | 2.6% |
| Central American | 53 | 11.5% |
| Cherokee | 2 | 0.4% |
| Dutch | 2 | 0.4% |
| English | 40 | 8.6% |
| European | 23 | 5.0% |
| German | 71 | 15.3% |
| Greek | 61 | 13.2% |
| Irish | 63 | 13.6% |
| Italian | 24 | 5.2% |
| Russian | 5 | 1.1% |
| Salvadoran | 53 | 11.5% |
| Scottish | 32 | 6.9% | View All 13 Rows |
Immigrants in Paw Paw
The most numerous immigrant groups reported in Paw Paw came from Central America (23 | 5.0%), El Salvador (23 | 5.0%), and Latin America (23 | 5.0%), together accounting for 14.9% of all Paw Paw residents.
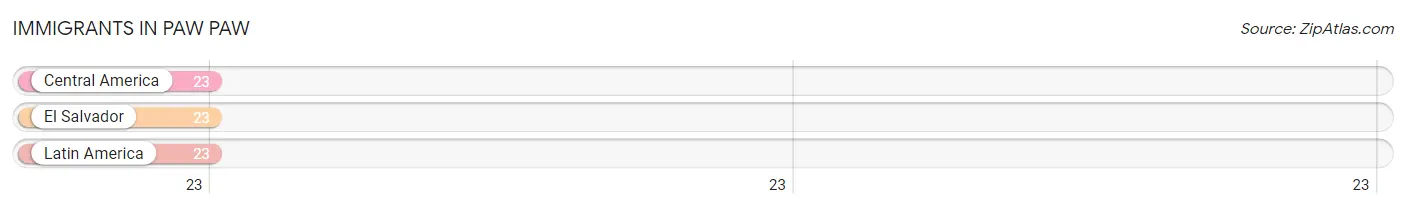
| Immigration Origin | # Population | % Population |
| Central America | 23 | 5.0% |
| El Salvador | 23 | 5.0% |
| Latin America | 23 | 5.0% | View All 3 Rows |
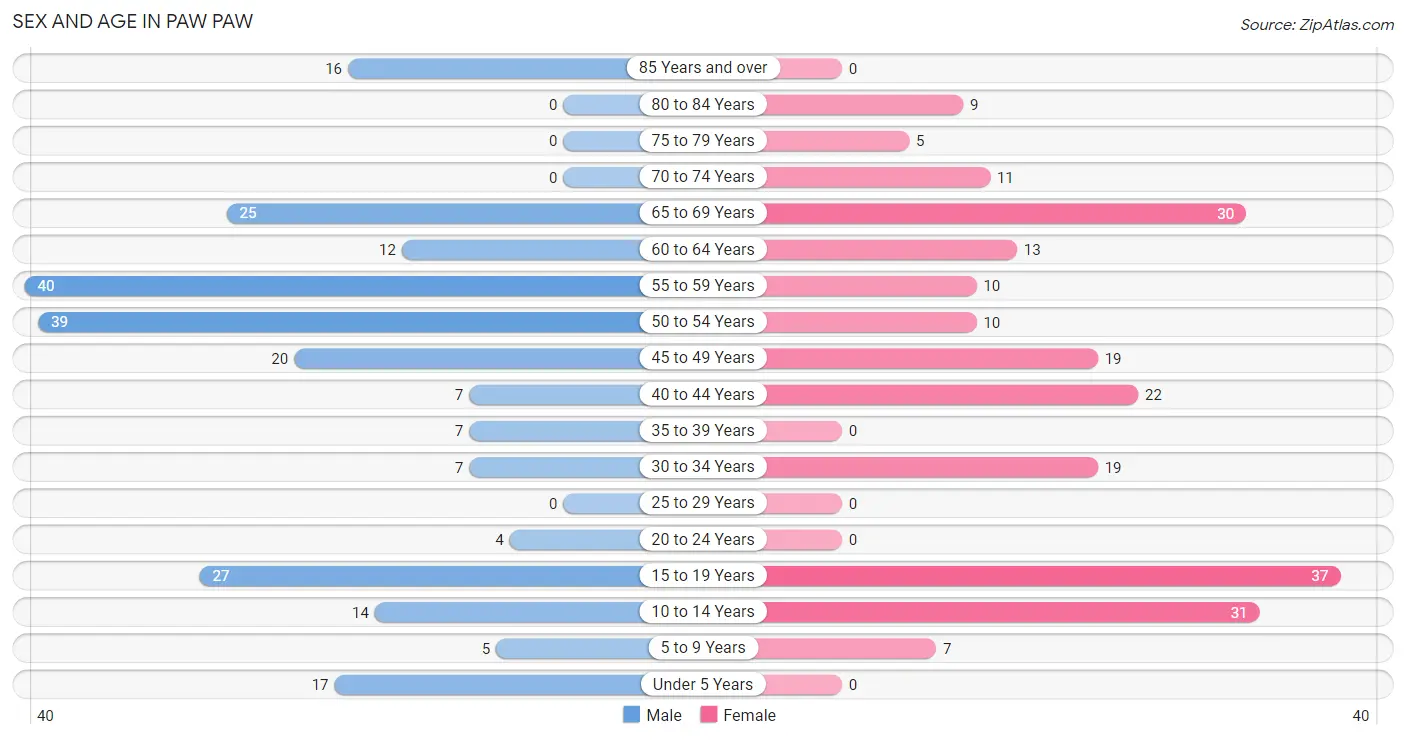
Sex and Age in Paw Paw
Sex and Age in Paw Paw
The most populous age groups in Paw Paw are 55 to 59 Years (40 | 16.7%) for men and 15 to 19 Years (37 | 16.6%) for women.
| Age Bracket | Male | Female |
| Under 5 Years | 17 (7.1%) | 0 (0.0%) |
| 5 to 9 Years | 5 (2.1%) | 7 (3.1%) |
| 10 to 14 Years | 14 (5.8%) | 31 (13.9%) |
| 15 to 19 Years | 27 (11.3%) | 37 (16.6%) |
| 20 to 24 Years | 4 (1.7%) | 0 (0.0%) |
| 25 to 29 Years | 0 (0.0%) | 0 (0.0%) |
| 30 to 34 Years | 7 (2.9%) | 19 (8.5%) |
| 35 to 39 Years | 7 (2.9%) | 0 (0.0%) |
| 40 to 44 Years | 7 (2.9%) | 22 (9.9%) |
| 45 to 49 Years | 20 (8.3%) | 19 (8.5%) |
| 50 to 54 Years | 39 (16.3%) | 10 (4.5%) |
| 55 to 59 Years | 40 (16.7%) | 10 (4.5%) |
| 60 to 64 Years | 12 (5.0%) | 13 (5.8%) |
| 65 to 69 Years | 25 (10.4%) | 30 (13.5%) |
| 70 to 74 Years | 0 (0.0%) | 11 (4.9%) |
| 75 to 79 Years | 0 (0.0%) | 5 (2.2%) |
| 80 to 84 Years | 0 (0.0%) | 9 (4.0%) |
| 85 Years and over | 16 (6.7%) | 0 (0.0%) |
| Total | 240 (100.0%) | 223 (100.0%) |
Families and Households in Paw Paw
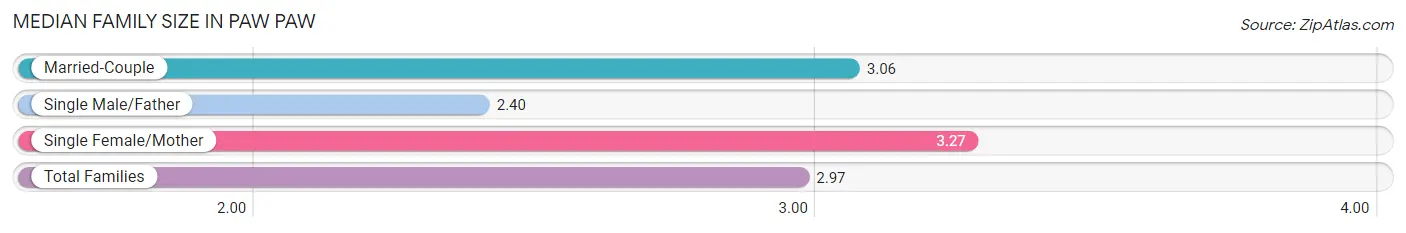
Median Family Size in Paw Paw
The median family size in Paw Paw is 2.97 persons per family, with single female/mother families (22 | 16.3%) accounting for the largest median family size of 3.27 persons per family. On the other hand, single male/father families (25 | 18.5%) represent the smallest median family size with 2.40 persons per family.
| Family Type | # Families | Family Size |
| Married-Couple | 88 (65.2%) | 3.06 |
| Single Male/Father | 25 (18.5%) | 2.40 |
| Single Female/Mother | 22 (16.3%) | 3.27 |
| Total Families | 135 (100.0%) | 2.97 |
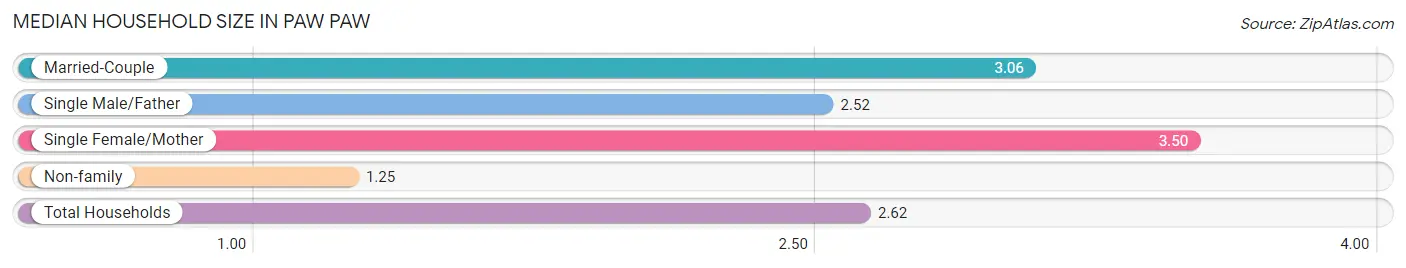
Median Household Size in Paw Paw
The median household size in Paw Paw is 2.62 persons per household, with single female/mother households (22 | 12.6%) accounting for the largest median household size of 3.5 persons per household. non-family households (40 | 22.9%) represent the smallest median household size with 1.25 persons per household.
| Household Type | # Households | Household Size |
| Married-Couple | 88 (50.3%) | 3.06 |
| Single Male/Father | 25 (14.3%) | 2.52 |
| Single Female/Mother | 22 (12.6%) | 3.50 |
| Non-family | 40 (22.9%) | 1.25 |
| Total Households | 175 (100.0%) | 2.62 |
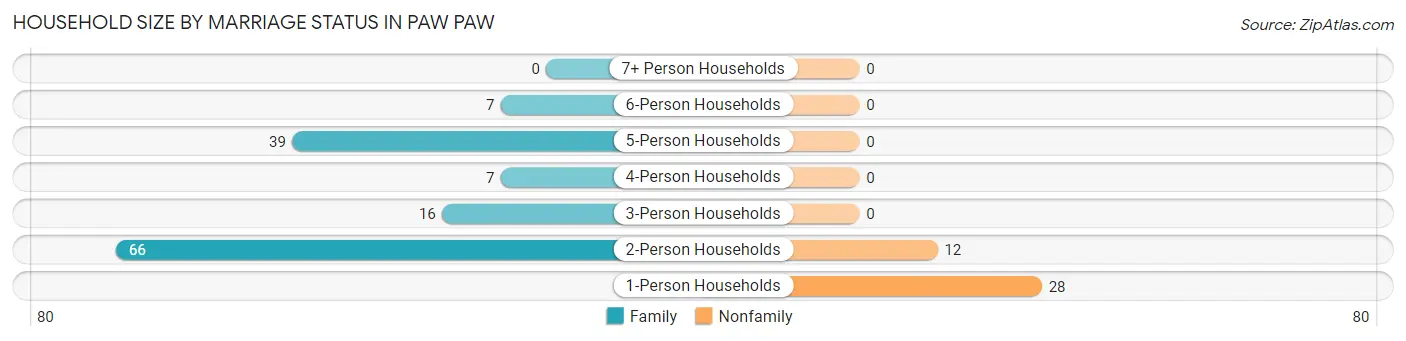
Household Size by Marriage Status in Paw Paw
Out of a total of 175 households in Paw Paw, 135 (77.1%) are family households, while 40 (22.9%) are nonfamily households. The most numerous type of family households are 2-person households, comprising 66, and the most common type of nonfamily households are 1-person households, comprising 28.
| Household Size | Family Households | Nonfamily Households |
| 1-Person Households | - | 28 (16.0%) |
| 2-Person Households | 66 (37.7%) | 12 (6.9%) |
| 3-Person Households | 16 (9.1%) | 0 (0.0%) |
| 4-Person Households | 7 (4.0%) | 0 (0.0%) |
| 5-Person Households | 39 (22.3%) | 0 (0.0%) |
| 6-Person Households | 7 (4.0%) | 0 (0.0%) |
| 7+ Person Households | 0 (0.0%) | 0 (0.0%) |
| Total | 135 (77.1%) | 40 (22.9%) |
Female Fertility in Paw Paw
Fertility by Age in Paw Paw
| Age Bracket | Women with Births | Births / 1,000 Women |
| 15 to 19 years | 0 (0.0%) | 0.0 |
| 20 to 34 years | 0 (0.0%) | 0.0 |
| 35 to 50 years | 0 (0.0%) | 0.0 |
| Total | 0 (0.0%) | 0.0 |
Fertility by Age by Marriage Status in Paw Paw
| Age Bracket | Married | Unmarried |
| 15 to 19 years | 0 (0.0%) | 0 (0.0%) |
| 20 to 34 years | 0 (0.0%) | 0 (0.0%) |
| 35 to 50 years | 0 (0.0%) | 0 (0.0%) |
| Total | 0 (0.0%) | 0 (0.0%) |
Fertility by Education in Paw Paw
| Educational Attainment | Women with Births | Births / 1,000 Women |
| Less than High School | 0 (0.0%) | 0.0 |
| High School Diploma | 0 (0.0%) | 0.0 |
| College or Associate's Degree | 0 (0.0%) | 0.0 |
| Bachelor's Degree | 0 (0.0%) | 0.0 |
| Graduate Degree | 0 (0.0%) | 0.0 |
| Total | 0 (0.0%) | 0.0 |
Fertility by Education by Marriage Status in Paw Paw
| Educational Attainment | Married | Unmarried |
| Less than High School | 0 (0.0%) | 0 (0.0%) |
| High School Diploma | 0 (0.0%) | 0 (0.0%) |
| College or Associate's Degree | 0 (0.0%) | 0 (0.0%) |
| Bachelor's Degree | 0 (0.0%) | 0 (0.0%) |
| Graduate Degree | 0 (0.0%) | 0 (0.0%) |
| Total | 0 (0.0%) | 0 (0.0%) |
Employment Characteristics in Paw Paw
Employment by Class of Employer in Paw Paw
Among the 168 employed individuals in Paw Paw, private company employees (106 | 63.1%), local government employees (26 | 15.5%), and not-for-profit organizations (18 | 10.7%) make up the most common classes of employment.
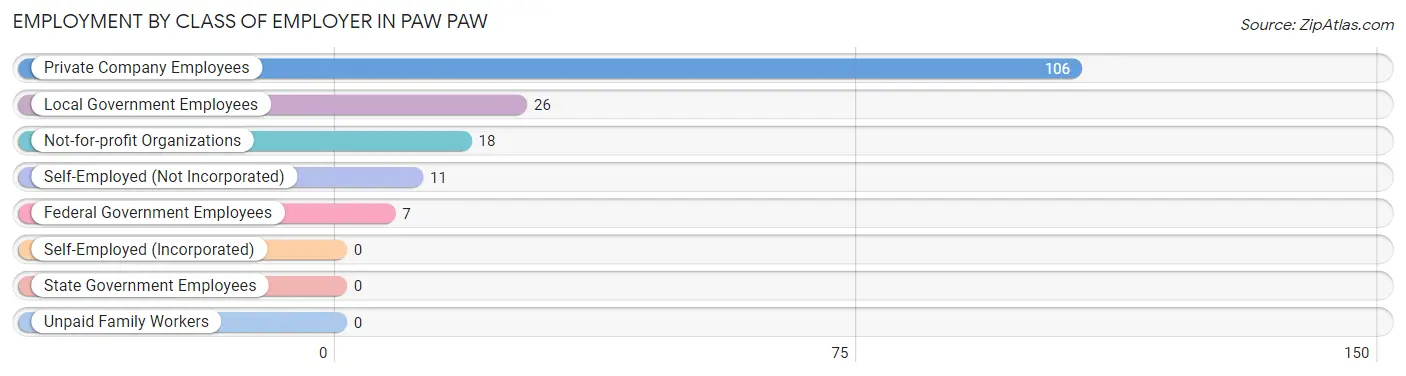
| Employer Class | # Employees | % Employees |
| Private Company Employees | 106 | 63.1% |
| Self-Employed (Incorporated) | 0 | 0.0% |
| Self-Employed (Not Incorporated) | 11 | 6.6% |
| Not-for-profit Organizations | 18 | 10.7% |
| Local Government Employees | 26 | 15.5% |
| State Government Employees | 0 | 0.0% |
| Federal Government Employees | 7 | 4.2% |
| Unpaid Family Workers | 0 | 0.0% |
| Total | 168 | 100.0% |
Employment Status by Age in Paw Paw
According to the labor force statistics for Paw Paw, out of the total population over 16 years of age (369), 55.3% or 204 individuals are in the labor force, with 14.2% or 29 of them unemployed. The age group with the highest labor force participation rate is 20 to 24 years, with 100.0% or 4 individuals in the labor force. Within the labor force, the 55 to 59 years age range has the highest percentage of unemployed individuals, with 53.5% or 23 of them being unemployed.
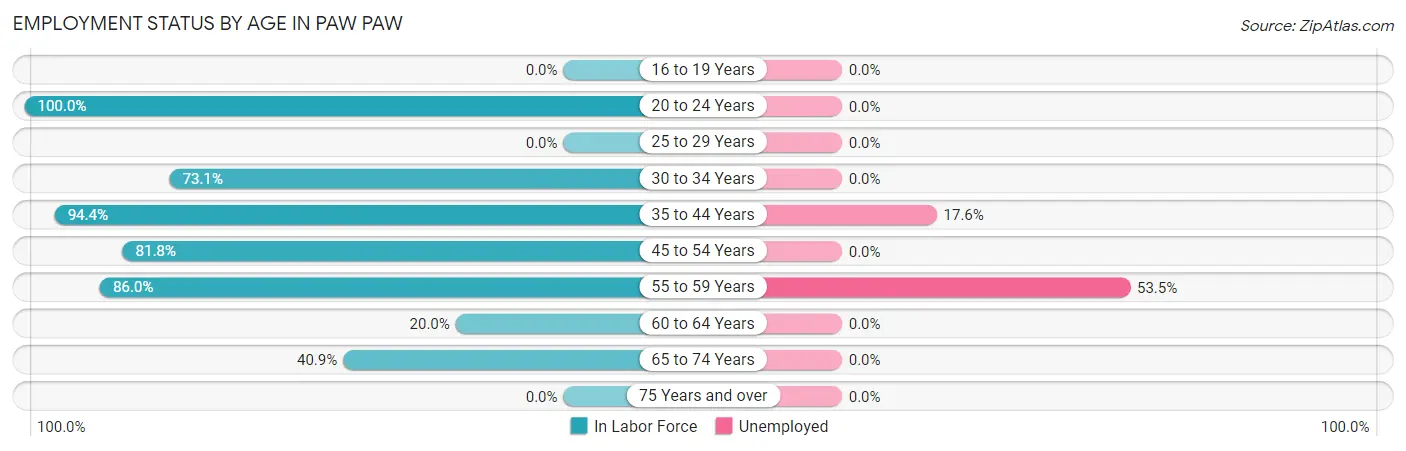
| Age Bracket | In Labor Force | Unemployed |
| 16 to 19 Years | 0 (0.0%) | 0 (0.0%) |
| 20 to 24 Years | 4 (100.0%) | 0 (0.0%) |
| 25 to 29 Years | 0 (0.0%) | 0 (0.0%) |
| 30 to 34 Years | 19 (73.1%) | 0 (0.0%) |
| 35 to 44 Years | 34 (94.4%) | 6 (17.6%) |
| 45 to 54 Years | 72 (81.8%) | 0 (0.0%) |
| 55 to 59 Years | 43 (86.0%) | 23 (53.5%) |
| 60 to 64 Years | 5 (20.0%) | 0 (0.0%) |
| 65 to 74 Years | 27 (40.9%) | 0 (0.0%) |
| 75 Years and over | 0 (0.0%) | 0 (0.0%) |
| Total | 204 (55.3%) | 29 (14.2%) |
Employment Status by Educational Attainment in Paw Paw
According to labor force statistics for Paw Paw, 76.9% of individuals (173) out of the total population between 25 and 64 years of age (225) are in the labor force, with 16.8% or 29 of them being unemployed. The group with the highest labor force participation rate are those with the educational attainment of high school diploma, with 78.6% or 81 individuals in the labor force. Within the labor force, individuals with less than high school education have the highest percentage of unemployment, with 54.8% or 23 of them being unemployed.
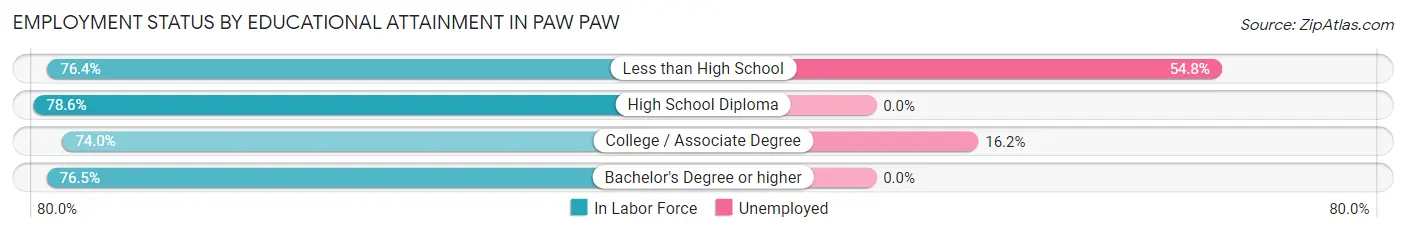
| Educational Attainment | In Labor Force | Unemployed |
| Less than High School | 42 (76.4%) | 30 (54.8%) |
| High School Diploma | 81 (78.6%) | 0 (0.0%) |
| College / Associate Degree | 37 (74.0%) | 8 (16.2%) |
| Bachelor's Degree or higher | 13 (76.5%) | 0 (0.0%) |
| Total | 173 (76.9%) | 38 (16.8%) |
Employment Occupations by Sex in Paw Paw
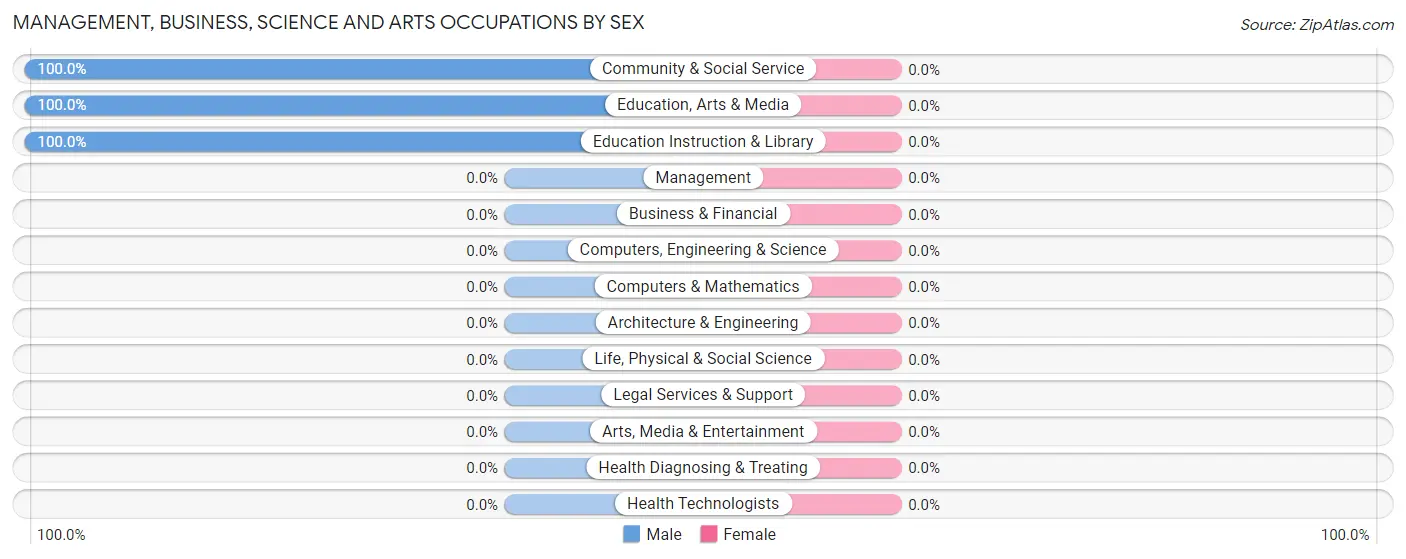
Management, Business, Science and Arts Occupations
The most common Management, Business, Science and Arts occupations in Paw Paw are Community & Social Service (18 | 10.3%), Education Instruction & Library (13 | 7.4%), and Education, Arts & Media (5 | 2.9%).
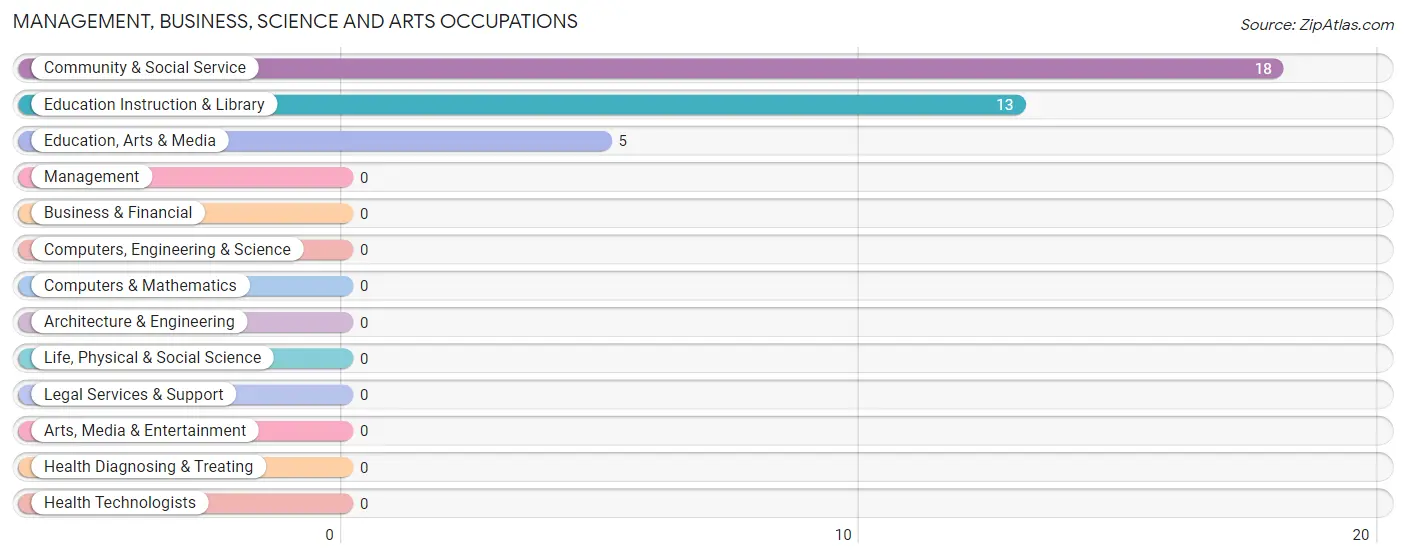
Management, Business, Science and Arts Occupations by Sex
| Occupation | Male | Female |
| Management | 0 (0.0%) | 0 (0.0%) |
| Business & Financial | 0 (0.0%) | 0 (0.0%) |
| Computers, Engineering & Science | 0 (0.0%) | 0 (0.0%) |
| Computers & Mathematics | 0 (0.0%) | 0 (0.0%) |
| Architecture & Engineering | 0 (0.0%) | 0 (0.0%) |
| Life, Physical & Social Science | 0 (0.0%) | 0 (0.0%) |
| Community & Social Service | 18 (100.0%) | 0 (0.0%) |
| Education, Arts & Media | 5 (100.0%) | 0 (0.0%) |
| Legal Services & Support | 0 (0.0%) | 0 (0.0%) |
| Education Instruction & Library | 13 (100.0%) | 0 (0.0%) |
| Arts, Media & Entertainment | 0 (0.0%) | 0 (0.0%) |
| Health Diagnosing & Treating | 0 (0.0%) | 0 (0.0%) |
| Health Technologists | 0 (0.0%) | 0 (0.0%) |
| Total (Category) | 18 (100.0%) | 0 (0.0%) |
| Total (Overall) | 123 (70.3%) | 52 (29.7%) |
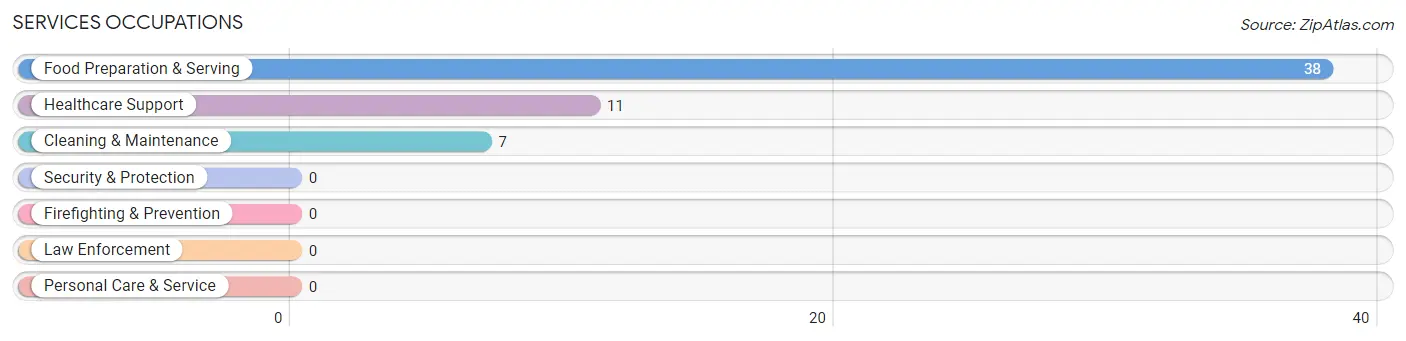
Services Occupations
The most common Services occupations in Paw Paw are Food Preparation & Serving (38 | 21.7%), Healthcare Support (11 | 6.3%), and Cleaning & Maintenance (7 | 4.0%).
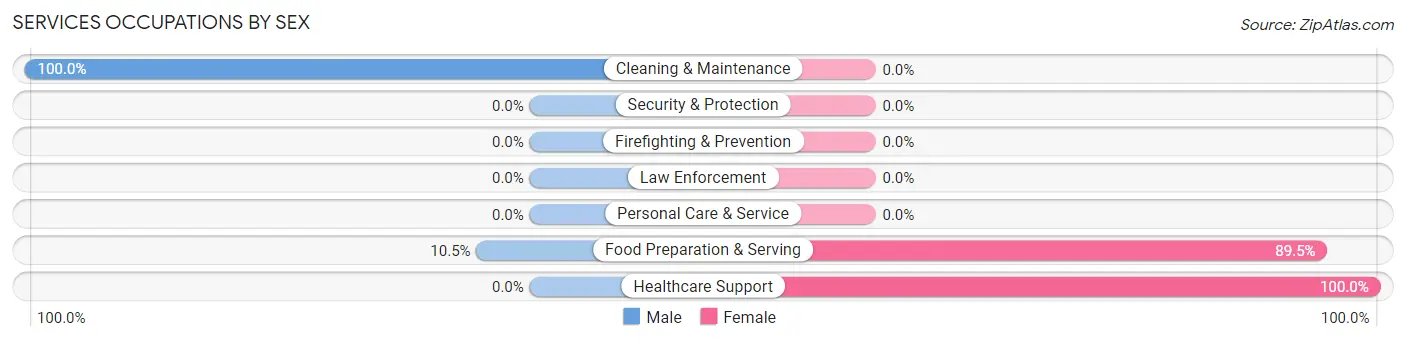
Services Occupations by Sex
Within the Services occupations in Paw Paw, the most male-oriented occupations are Cleaning & Maintenance (100.0%), and Food Preparation & Serving (10.5%), while the most female-oriented occupations are Healthcare Support (100.0%), and Food Preparation & Serving (89.5%).
| Occupation | Male | Female |
| Healthcare Support | 0 (0.0%) | 11 (100.0%) |
| Security & Protection | 0 (0.0%) | 0 (0.0%) |
| Firefighting & Prevention | 0 (0.0%) | 0 (0.0%) |
| Law Enforcement | 0 (0.0%) | 0 (0.0%) |
| Food Preparation & Serving | 4 (10.5%) | 34 (89.5%) |
| Cleaning & Maintenance | 7 (100.0%) | 0 (0.0%) |
| Personal Care & Service | 0 (0.0%) | 0 (0.0%) |
| Total (Category) | 11 (19.6%) | 45 (80.4%) |
| Total (Overall) | 123 (70.3%) | 52 (29.7%) |
Sales and Office Occupations
The most common Sales and Office occupations in Paw Paw are Sales & Related (10 | 5.7%), and Office & Administration (5 | 2.9%).
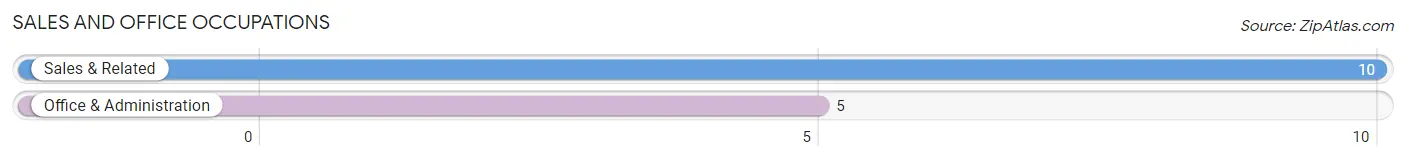
Sales and Office Occupations by Sex
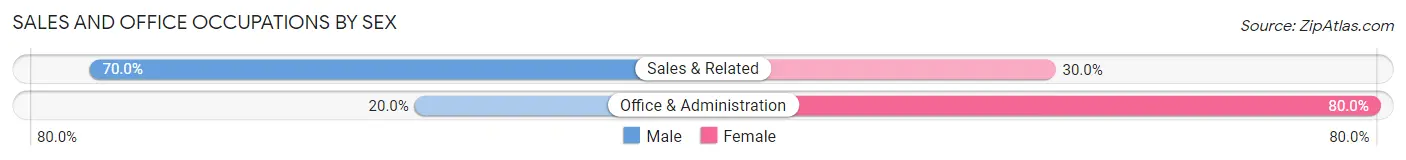
| Occupation | Male | Female |
| Sales & Related | 7 (70.0%) | 3 (30.0%) |
| Office & Administration | 1 (20.0%) | 4 (80.0%) |
| Total (Category) | 8 (53.3%) | 7 (46.7%) |
| Total (Overall) | 123 (70.3%) | 52 (29.7%) |
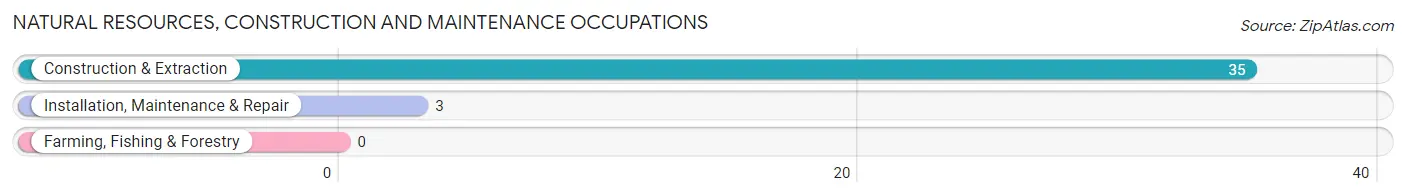
Natural Resources, Construction and Maintenance Occupations
The most common Natural Resources, Construction and Maintenance occupations in Paw Paw are Construction & Extraction (35 | 20.0%), and Installation, Maintenance & Repair (3 | 1.7%).
Natural Resources, Construction and Maintenance Occupations by Sex
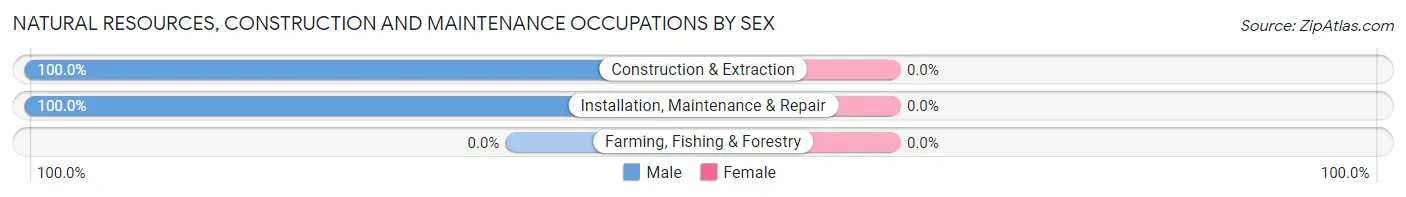
| Occupation | Male | Female |
| Farming, Fishing & Forestry | 0 (0.0%) | 0 (0.0%) |
| Construction & Extraction | 35 (100.0%) | 0 (0.0%) |
| Installation, Maintenance & Repair | 3 (100.0%) | 0 (0.0%) |
| Total (Category) | 38 (100.0%) | 0 (0.0%) |
| Total (Overall) | 123 (70.3%) | 52 (29.7%) |
Production, Transportation and Moving Occupations
The most common Production, Transportation and Moving occupations in Paw Paw are Material Moving (29 | 16.6%), and Production (19 | 10.9%).
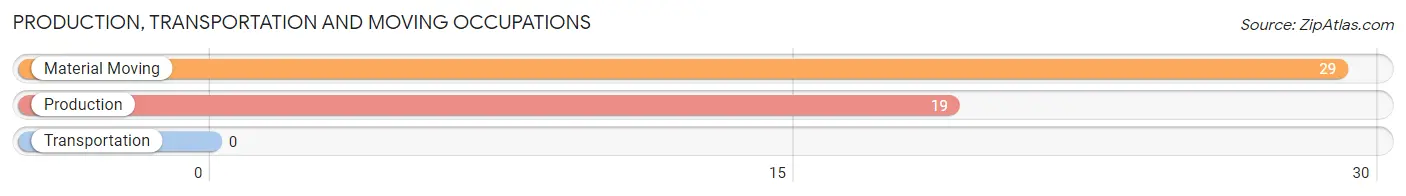
Production, Transportation and Moving Occupations by Sex
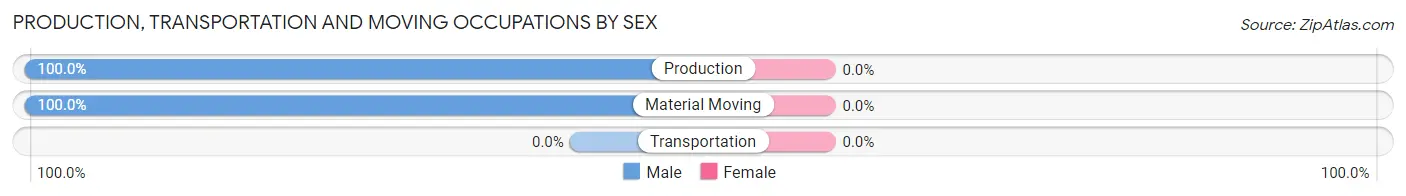
| Occupation | Male | Female |
| Production | 19 (100.0%) | 0 (0.0%) |
| Transportation | 0 (0.0%) | 0 (0.0%) |
| Material Moving | 29 (100.0%) | 0 (0.0%) |
| Total (Category) | 48 (100.0%) | 0 (0.0%) |
| Total (Overall) | 123 (70.3%) | 52 (29.7%) |
Employment Industries by Sex in Paw Paw
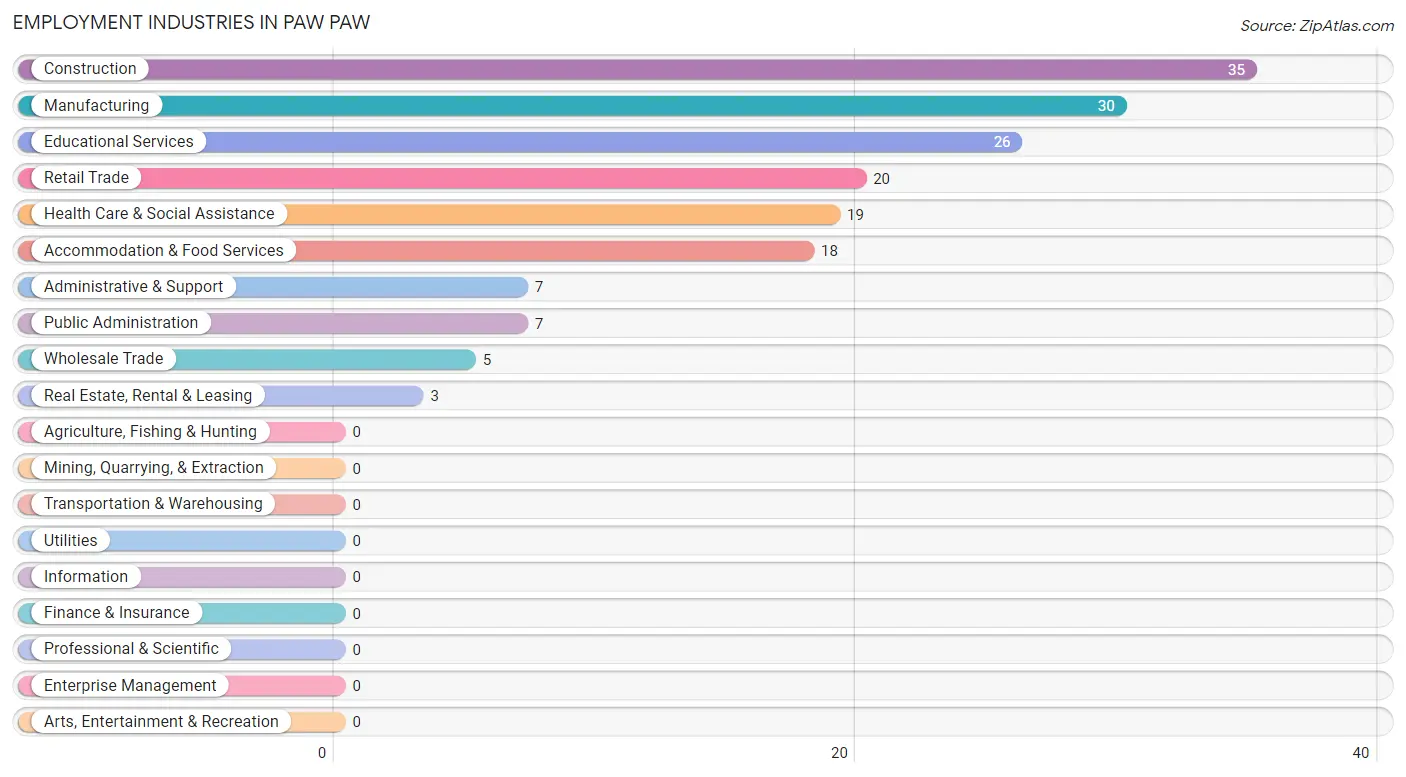
Employment Industries in Paw Paw
The major employment industries in Paw Paw include Construction (35 | 20.0%), Manufacturing (30 | 17.1%), Educational Services (26 | 14.9%), Retail Trade (20 | 11.4%), and Health Care & Social Assistance (19 | 10.9%).
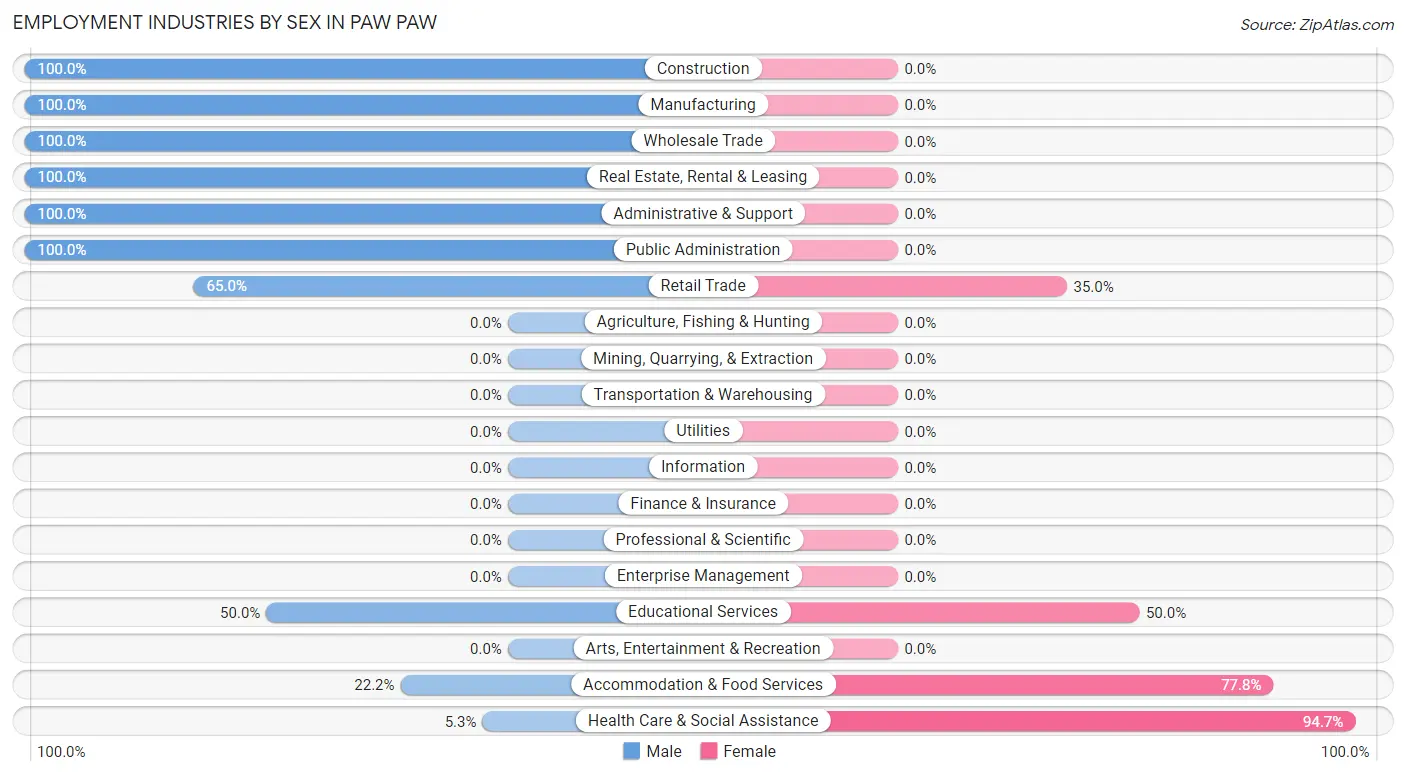
Employment Industries by Sex in Paw Paw
The Paw Paw industries that see more men than women are Construction (100.0%), Manufacturing (100.0%), and Wholesale Trade (100.0%), whereas the industries that tend to have a higher number of women are Health Care & Social Assistance (94.7%), Accommodation & Food Services (77.8%), and Educational Services (50.0%).
| Industry | Male | Female |
| Agriculture, Fishing & Hunting | 0 (0.0%) | 0 (0.0%) |
| Mining, Quarrying, & Extraction | 0 (0.0%) | 0 (0.0%) |
| Construction | 35 (100.0%) | 0 (0.0%) |
| Manufacturing | 30 (100.0%) | 0 (0.0%) |
| Wholesale Trade | 5 (100.0%) | 0 (0.0%) |
| Retail Trade | 13 (65.0%) | 7 (35.0%) |
| Transportation & Warehousing | 0 (0.0%) | 0 (0.0%) |
| Utilities | 0 (0.0%) | 0 (0.0%) |
| Information | 0 (0.0%) | 0 (0.0%) |
| Finance & Insurance | 0 (0.0%) | 0 (0.0%) |
| Real Estate, Rental & Leasing | 3 (100.0%) | 0 (0.0%) |
| Professional & Scientific | 0 (0.0%) | 0 (0.0%) |
| Enterprise Management | 0 (0.0%) | 0 (0.0%) |
| Administrative & Support | 7 (100.0%) | 0 (0.0%) |
| Educational Services | 13 (50.0%) | 13 (50.0%) |
| Health Care & Social Assistance | 1 (5.3%) | 18 (94.7%) |
| Arts, Entertainment & Recreation | 0 (0.0%) | 0 (0.0%) |
| Accommodation & Food Services | 4 (22.2%) | 14 (77.8%) |
| Public Administration | 7 (100.0%) | 0 (0.0%) |
| Total | 123 (70.3%) | 52 (29.7%) |
Education in Paw Paw
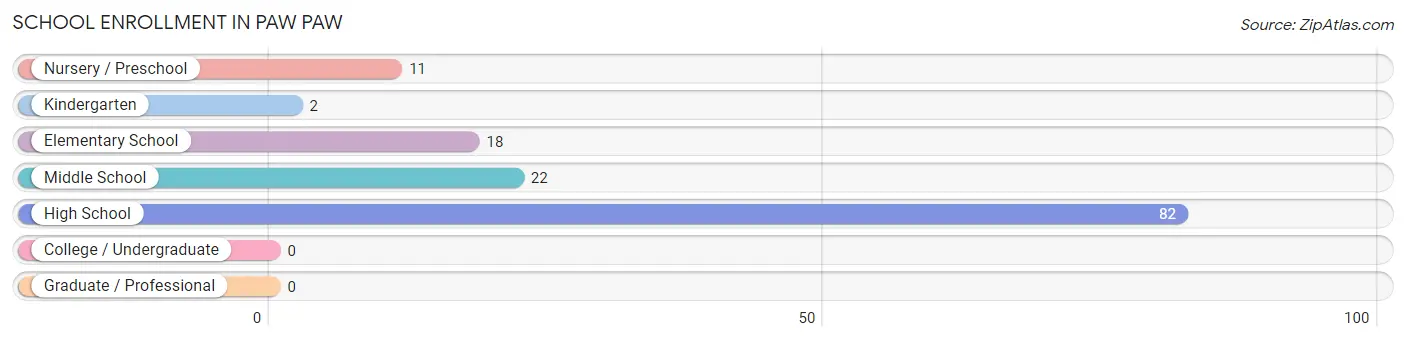
School Enrollment in Paw Paw
The most common levels of schooling among the 135 students in Paw Paw are high school (82 | 60.7%), middle school (22 | 16.3%), and elementary school (18 | 13.3%).
| School Level | # Students | % Students |
| Nursery / Preschool | 11 | 8.2% |
| Kindergarten | 2 | 1.5% |
| Elementary School | 18 | 13.3% |
| Middle School | 22 | 16.3% |
| High School | 82 | 60.7% |
| College / Undergraduate | 0 | 0.0% |
| Graduate / Professional | 0 | 0.0% |
| Total | 135 | 100.0% |
School Enrollment by Age by Funding Source in Paw Paw
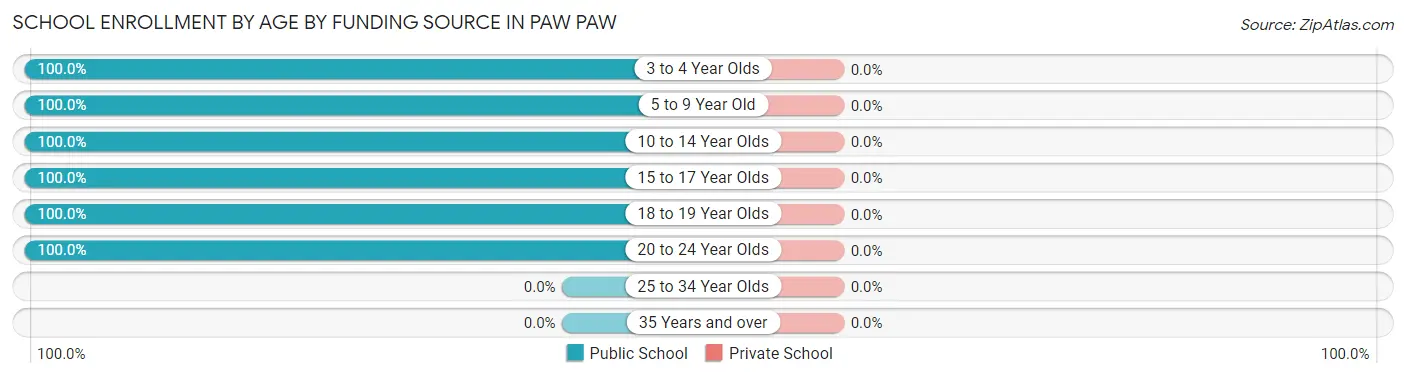
| Age Bracket | Public School | Private School |
| 3 to 4 Year Olds | 11 (100.0%) | 0 (0.0%) |
| 5 to 9 Year Old | 12 (100.0%) | 0 (0.0%) |
| 10 to 14 Year Olds | 45 (100.0%) | 0 (0.0%) |
| 15 to 17 Year Olds | 49 (100.0%) | 0 (0.0%) |
| 18 to 19 Year Olds | 14 (100.0%) | 0 (0.0%) |
| 20 to 24 Year Olds | 4 (100.0%) | 0 (0.0%) |
| 25 to 34 Year Olds | 0 (0.0%) | 0 (0.0%) |
| 35 Years and over | 0 (0.0%) | 0 (0.0%) |
| Total | 135 (100.0%) | 0 (0.0%) |
Educational Attainment by Field of Study in Paw Paw
Education (15 | 83.3%), and liberal arts & history (3 | 16.7%) are the most common fields of study among 18 individuals in Paw Paw who have obtained a bachelor's degree or higher.
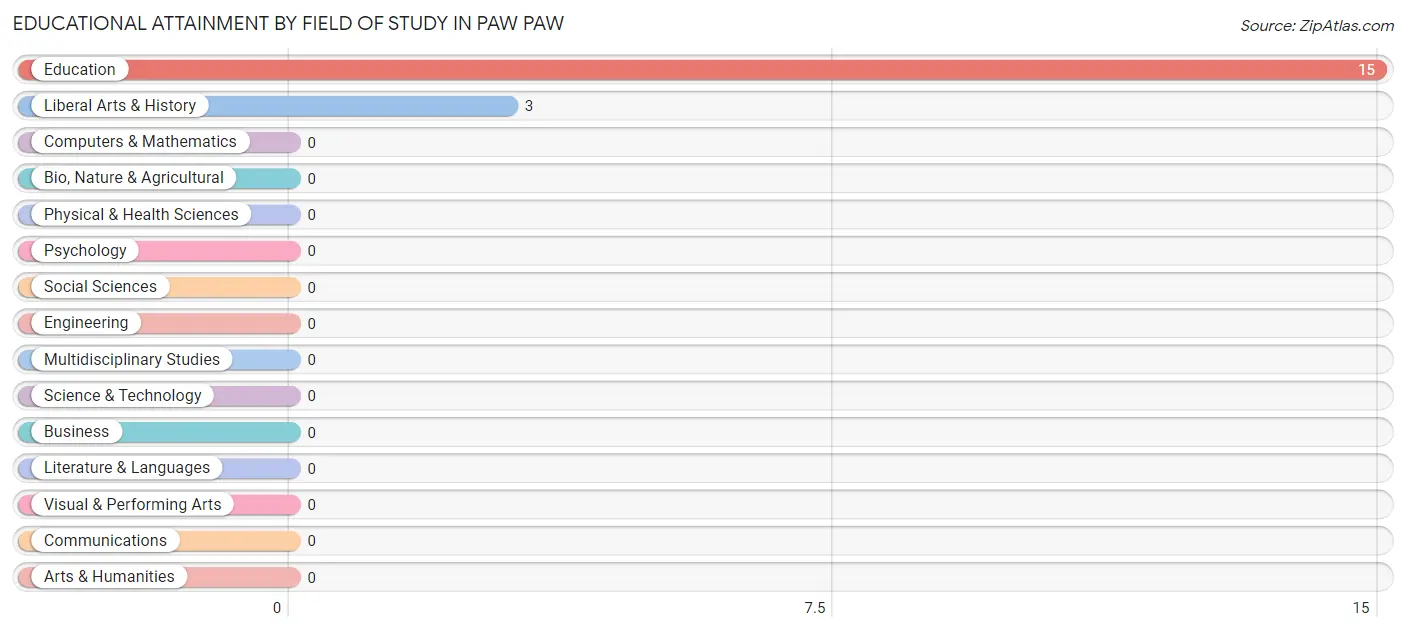
| Field of Study | # Graduates | % Graduates |
| Computers & Mathematics | 0 | 0.0% |
| Bio, Nature & Agricultural | 0 | 0.0% |
| Physical & Health Sciences | 0 | 0.0% |
| Psychology | 0 | 0.0% |
| Social Sciences | 0 | 0.0% |
| Engineering | 0 | 0.0% |
| Multidisciplinary Studies | 0 | 0.0% |
| Science & Technology | 0 | 0.0% |
| Business | 0 | 0.0% |
| Education | 15 | 83.3% |
| Literature & Languages | 0 | 0.0% |
| Liberal Arts & History | 3 | 16.7% |
| Visual & Performing Arts | 0 | 0.0% |
| Communications | 0 | 0.0% |
| Arts & Humanities | 0 | 0.0% |
| Total | 18 | 100.0% |
Transportation & Commute in Paw Paw
Vehicle Availability by Sex in Paw Paw
The most prevalent vehicle ownership categories in Paw Paw are males with 2 vehicles (40, accounting for 34.8%) and females with 2 vehicles (34, making up 76.9%).
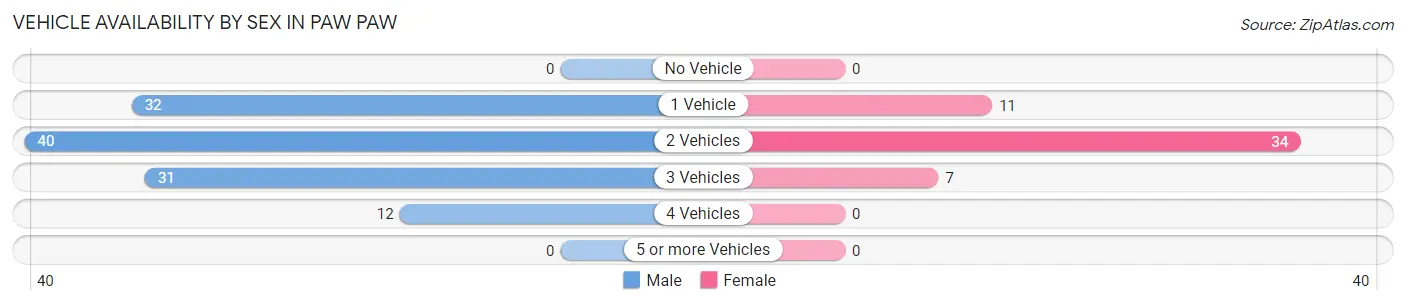
| Vehicles Available | Male | Female |
| No Vehicle | 0 (0.0%) | 0 (0.0%) |
| 1 Vehicle | 32 (27.8%) | 11 (21.1%) |
| 2 Vehicles | 40 (34.8%) | 34 (65.4%) |
| 3 Vehicles | 31 (27.0%) | 7 (13.5%) |
| 4 Vehicles | 12 (10.4%) | 0 (0.0%) |
| 5 or more Vehicles | 0 (0.0%) | 0 (0.0%) |
| Total | 115 (100.0%) | 52 (100.0%) |
Commute Time in Paw Paw
The most frequently occuring commute durations in Paw Paw are 5 to 9 minutes (51 commuters, 31.1%), 45 to 59 minutes (41 commuters, 25.0%), and 90 or more minutes (23 commuters, 14.0%).
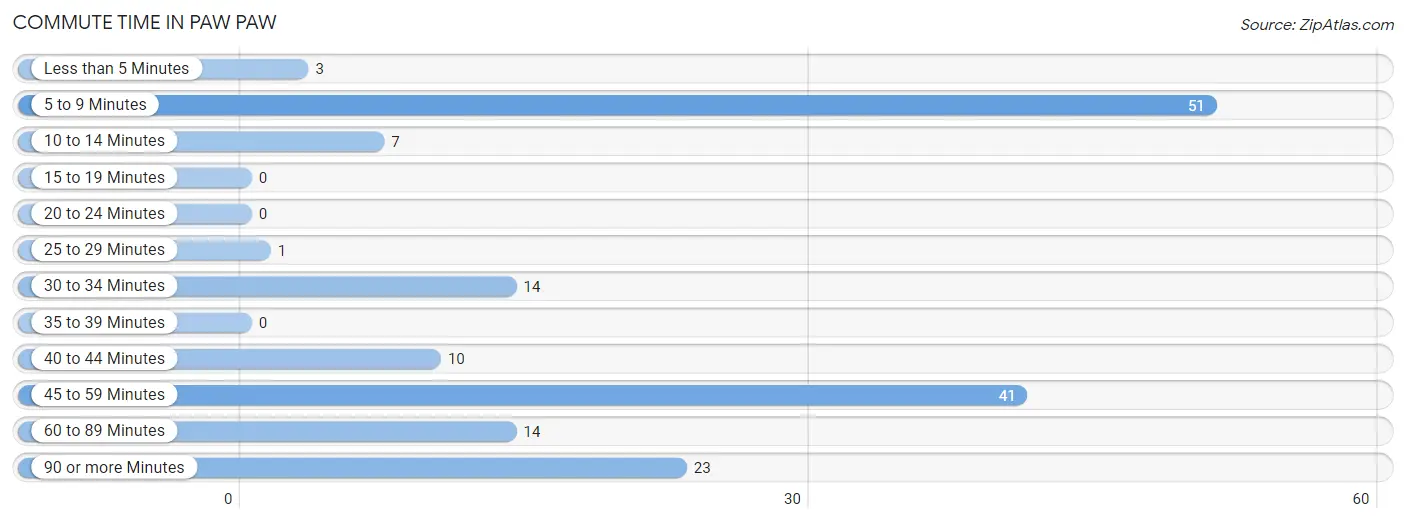
| Commute Time | # Commuters | % Commuters |
| Less than 5 Minutes | 3 | 1.8% |
| 5 to 9 Minutes | 51 | 31.1% |
| 10 to 14 Minutes | 7 | 4.3% |
| 15 to 19 Minutes | 0 | 0.0% |
| 20 to 24 Minutes | 0 | 0.0% |
| 25 to 29 Minutes | 1 | 0.6% |
| 30 to 34 Minutes | 14 | 8.5% |
| 35 to 39 Minutes | 0 | 0.0% |
| 40 to 44 Minutes | 10 | 6.1% |
| 45 to 59 Minutes | 41 | 25.0% |
| 60 to 89 Minutes | 14 | 8.5% |
| 90 or more Minutes | 23 | 14.0% |
Commute Time by Sex in Paw Paw
The most common commute times in Paw Paw are 45 to 59 minutes (37 commuters, 31.9%) for males and 5 to 9 minutes (35 commuters, 72.9%) for females.
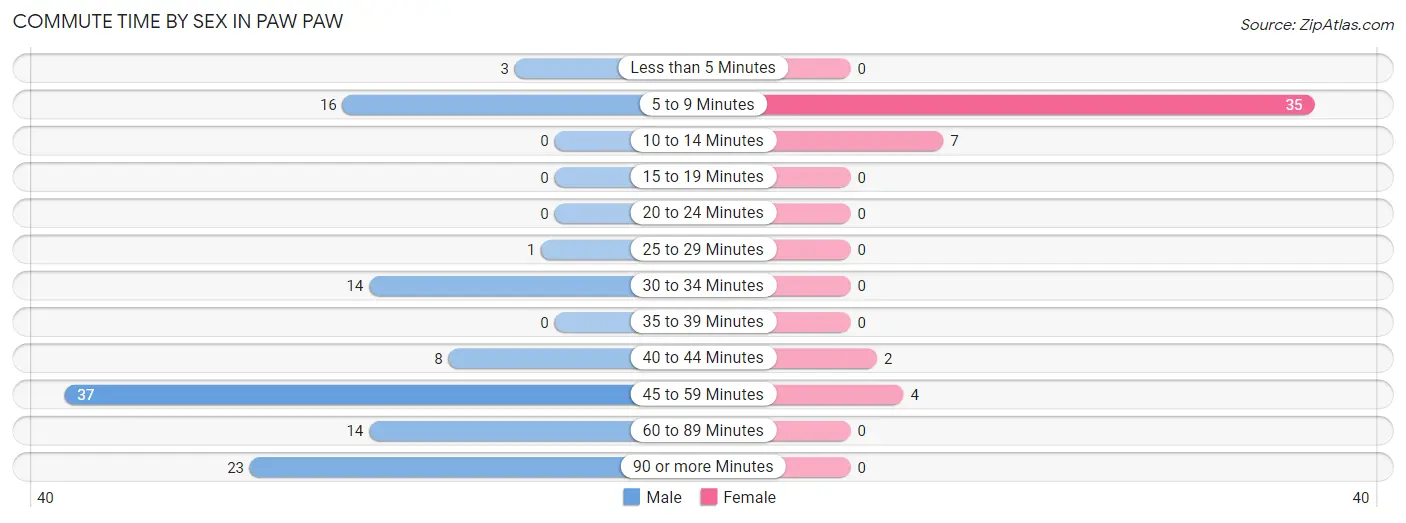
| Commute Time | Male | Female |
| Less than 5 Minutes | 3 (2.6%) | 0 (0.0%) |
| 5 to 9 Minutes | 16 (13.8%) | 35 (72.9%) |
| 10 to 14 Minutes | 0 (0.0%) | 7 (14.6%) |
| 15 to 19 Minutes | 0 (0.0%) | 0 (0.0%) |
| 20 to 24 Minutes | 0 (0.0%) | 0 (0.0%) |
| 25 to 29 Minutes | 1 (0.9%) | 0 (0.0%) |
| 30 to 34 Minutes | 14 (12.1%) | 0 (0.0%) |
| 35 to 39 Minutes | 0 (0.0%) | 0 (0.0%) |
| 40 to 44 Minutes | 8 (6.9%) | 2 (4.2%) |
| 45 to 59 Minutes | 37 (31.9%) | 4 (8.3%) |
| 60 to 89 Minutes | 14 (12.1%) | 0 (0.0%) |
| 90 or more Minutes | 23 (19.8%) | 0 (0.0%) |
Time of Departure to Work by Sex in Paw Paw
The most frequent times of departure to work in Paw Paw are 5:00 AM to 5:29 AM (28, 24.1%) for males and 5:30 AM to 5:59 AM (20, 41.7%) for females.
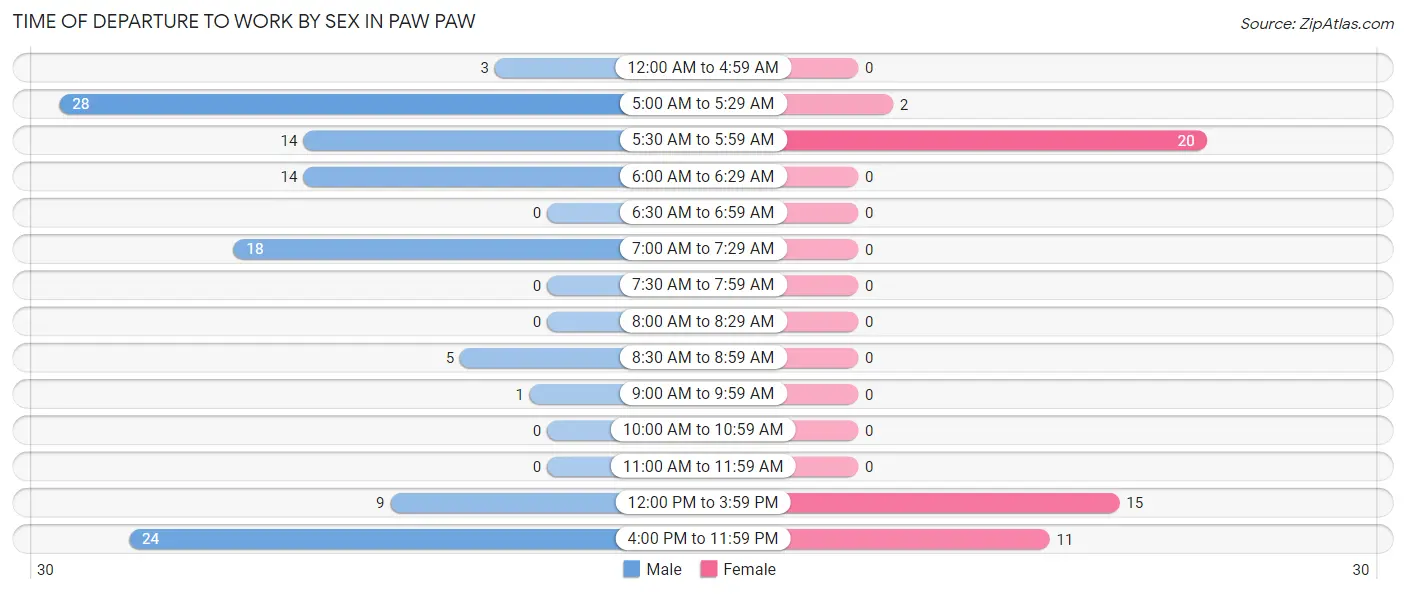
| Time of Departure | Male | Female |
| 12:00 AM to 4:59 AM | 3 (2.6%) | 0 (0.0%) |
| 5:00 AM to 5:29 AM | 28 (24.1%) | 2 (4.2%) |
| 5:30 AM to 5:59 AM | 14 (12.1%) | 20 (41.7%) |
| 6:00 AM to 6:29 AM | 14 (12.1%) | 0 (0.0%) |
| 6:30 AM to 6:59 AM | 0 (0.0%) | 0 (0.0%) |
| 7:00 AM to 7:29 AM | 18 (15.5%) | 0 (0.0%) |
| 7:30 AM to 7:59 AM | 0 (0.0%) | 0 (0.0%) |
| 8:00 AM to 8:29 AM | 0 (0.0%) | 0 (0.0%) |
| 8:30 AM to 8:59 AM | 5 (4.3%) | 0 (0.0%) |
| 9:00 AM to 9:59 AM | 1 (0.9%) | 0 (0.0%) |
| 10:00 AM to 10:59 AM | 0 (0.0%) | 0 (0.0%) |
| 11:00 AM to 11:59 AM | 0 (0.0%) | 0 (0.0%) |
| 12:00 PM to 3:59 PM | 9 (7.8%) | 15 (31.2%) |
| 4:00 PM to 11:59 PM | 24 (20.7%) | 11 (22.9%) |
| Total | 116 (100.0%) | 48 (100.0%) |
Housing Occupancy in Paw Paw
Occupancy by Ownership in Paw Paw
Of the total 175 dwellings in Paw Paw, owner-occupied units account for 117 (66.9%), while renter-occupied units make up 58 (33.1%).
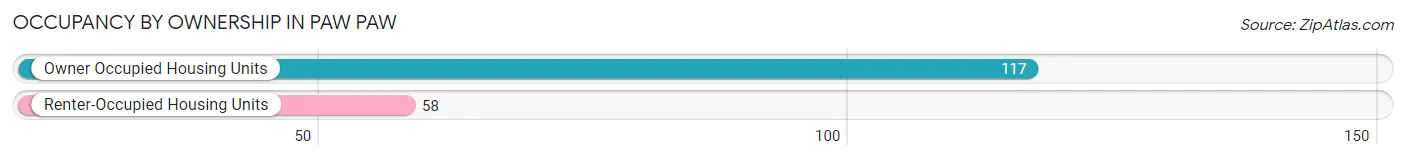
| Occupancy | # Housing Units | % Housing Units |
| Owner Occupied Housing Units | 117 | 66.9% |
| Renter-Occupied Housing Units | 58 | 33.1% |
| Total Occupied Housing Units | 175 | 100.0% |
Occupancy by Household Size in Paw Paw
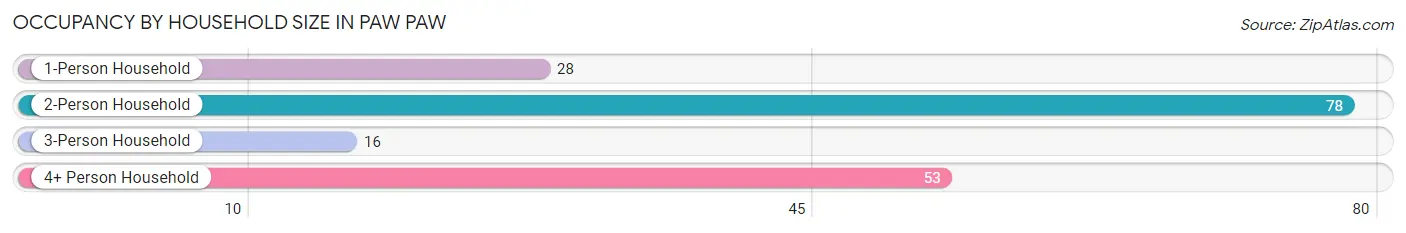
| Household Size | # Housing Units | % Housing Units |
| 1-Person Household | 28 | 16.0% |
| 2-Person Household | 78 | 44.6% |
| 3-Person Household | 16 | 9.1% |
| 4+ Person Household | 53 | 30.3% |
| Total Housing Units | 175 | 100.0% |
Occupancy by Ownership by Household Size in Paw Paw
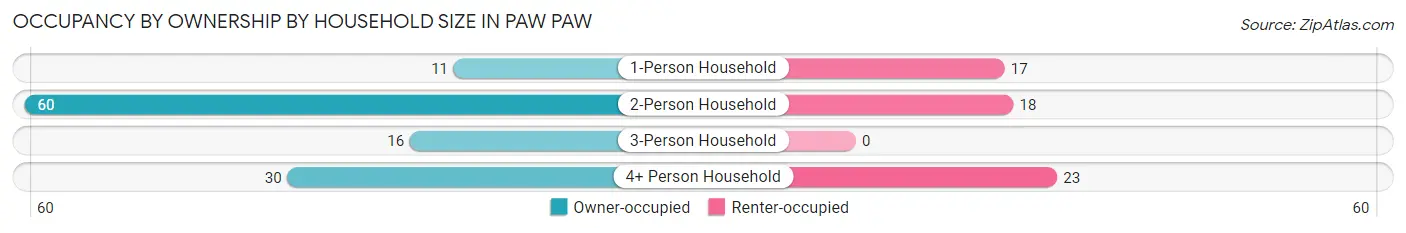
| Household Size | Owner-occupied | Renter-occupied |
| 1-Person Household | 11 (39.3%) | 17 (60.7%) |
| 2-Person Household | 60 (76.9%) | 18 (23.1%) |
| 3-Person Household | 16 (100.0%) | 0 (0.0%) |
| 4+ Person Household | 30 (56.6%) | 23 (43.4%) |
| Total Housing Units | 117 (66.9%) | 58 (33.1%) |
Occupancy by Educational Attainment in Paw Paw
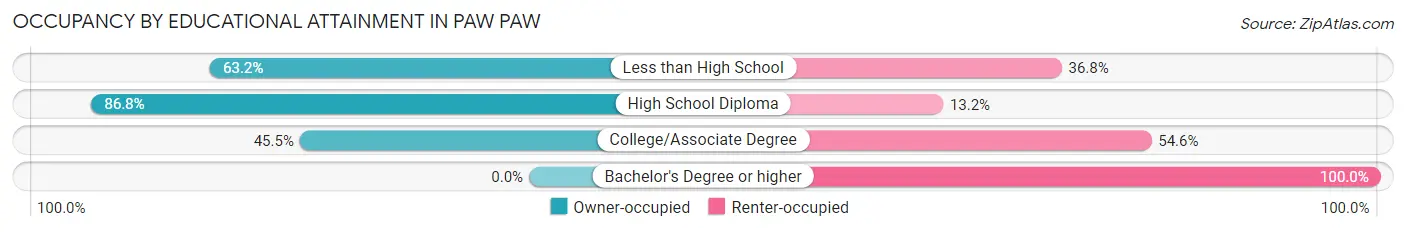
| Household Size | Owner-occupied | Renter-occupied |
| Less than High School | 43 (63.2%) | 25 (36.8%) |
| High School Diploma | 59 (86.8%) | 9 (13.2%) |
| College/Associate Degree | 15 (45.5%) | 18 (54.5%) |
| Bachelor's Degree or higher | 0 (0.0%) | 6 (100.0%) |
Occupancy by Age of Householder in Paw Paw
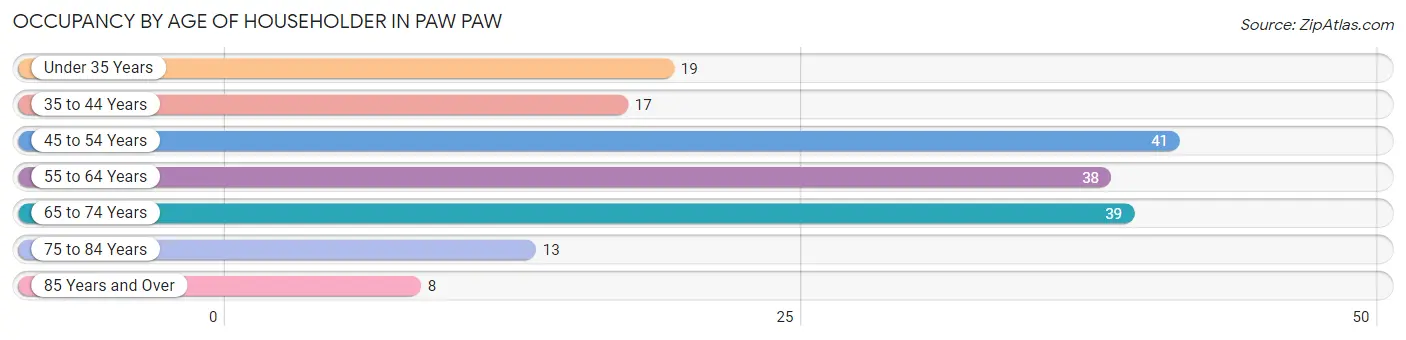
| Age Bracket | # Households | % Households |
| Under 35 Years | 19 | 10.9% |
| 35 to 44 Years | 17 | 9.7% |
| 45 to 54 Years | 41 | 23.4% |
| 55 to 64 Years | 38 | 21.7% |
| 65 to 74 Years | 39 | 22.3% |
| 75 to 84 Years | 13 | 7.4% |
| 85 Years and Over | 8 | 4.6% |
| Total | 175 | 100.0% |
Housing Finances in Paw Paw
Median Income by Occupancy in Paw Paw
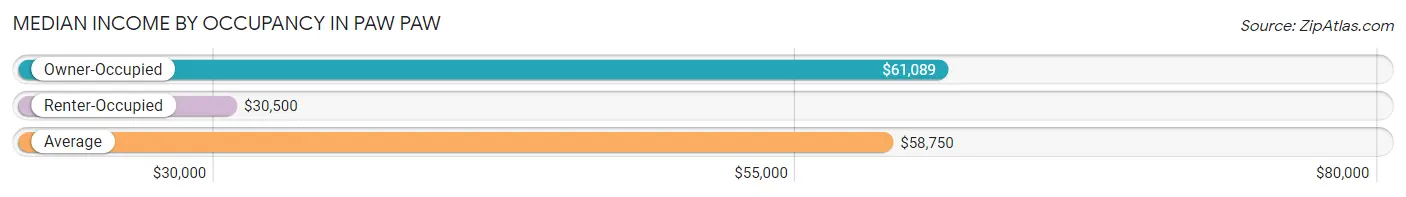
| Occupancy Type | # Households | Median Income |
| Owner-Occupied | 117 (66.9%) | $61,089 |
| Renter-Occupied | 58 (33.1%) | $30,500 |
| Average | 175 (100.0%) | $58,750 |
Occupancy by Householder Income Bracket in Paw Paw
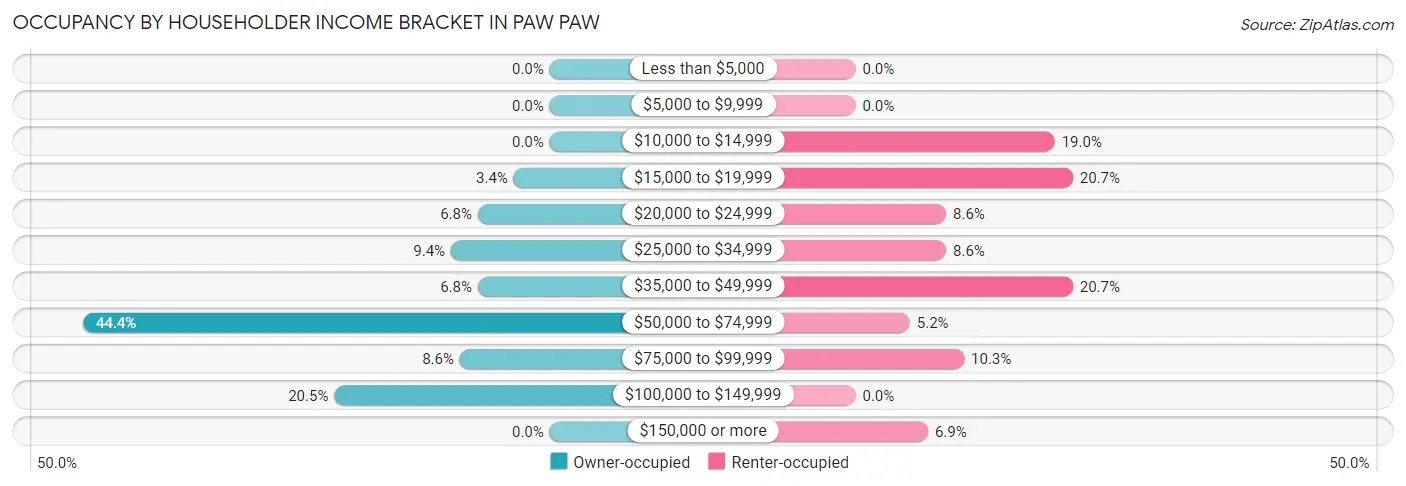
| Income Bracket | Owner-occupied | Renter-occupied |
| Less than $5,000 | 0 (0.0%) | 0 (0.0%) |
| $5,000 to $9,999 | 0 (0.0%) | 0 (0.0%) |
| $10,000 to $14,999 | 0 (0.0%) | 11 (19.0%) |
| $15,000 to $19,999 | 4 (3.4%) | 12 (20.7%) |
| $20,000 to $24,999 | 8 (6.8%) | 5 (8.6%) |
| $25,000 to $34,999 | 11 (9.4%) | 5 (8.6%) |
| $35,000 to $49,999 | 8 (6.8%) | 12 (20.7%) |
| $50,000 to $74,999 | 52 (44.4%) | 3 (5.2%) |
| $75,000 to $99,999 | 10 (8.6%) | 6 (10.3%) |
| $100,000 to $149,999 | 24 (20.5%) | 0 (0.0%) |
| $150,000 or more | 0 (0.0%) | 4 (6.9%) |
| Total | 117 (100.0%) | 58 (100.0%) |
Monthly Housing Cost Tiers in Paw Paw
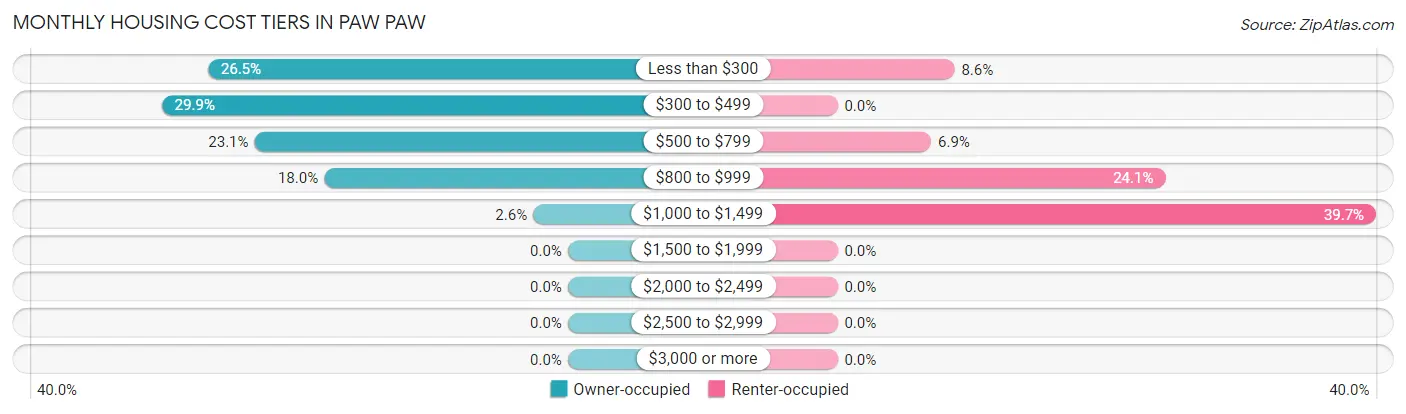
| Monthly Cost | Owner-occupied | Renter-occupied |
| Less than $300 | 31 (26.5%) | 5 (8.6%) |
| $300 to $499 | 35 (29.9%) | 0 (0.0%) |
| $500 to $799 | 27 (23.1%) | 4 (6.9%) |
| $800 to $999 | 21 (17.9%) | 14 (24.1%) |
| $1,000 to $1,499 | 3 (2.6%) | 23 (39.7%) |
| $1,500 to $1,999 | 0 (0.0%) | 0 (0.0%) |
| $2,000 to $2,499 | 0 (0.0%) | 0 (0.0%) |
| $2,500 to $2,999 | 0 (0.0%) | 0 (0.0%) |
| $3,000 or more | 0 (0.0%) | 0 (0.0%) |
| Total | 117 (100.0%) | 58 (100.0%) |
Physical Housing Characteristics in Paw Paw
Housing Structures in Paw Paw
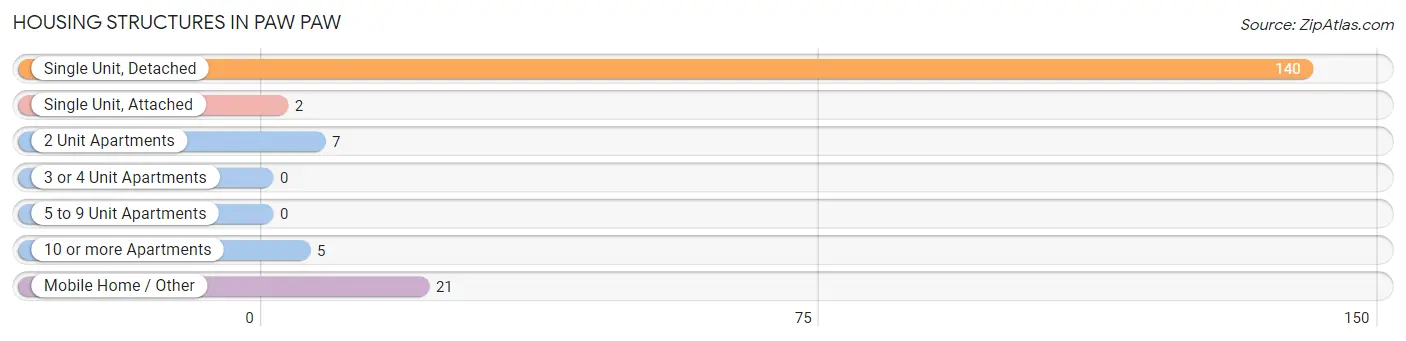
| Structure Type | # Housing Units | % Housing Units |
| Single Unit, Detached | 140 | 80.0% |
| Single Unit, Attached | 2 | 1.1% |
| 2 Unit Apartments | 7 | 4.0% |
| 3 or 4 Unit Apartments | 0 | 0.0% |
| 5 to 9 Unit Apartments | 0 | 0.0% |
| 10 or more Apartments | 5 | 2.9% |
| Mobile Home / Other | 21 | 12.0% |
| Total | 175 | 100.0% |
Housing Structures by Occupancy in Paw Paw
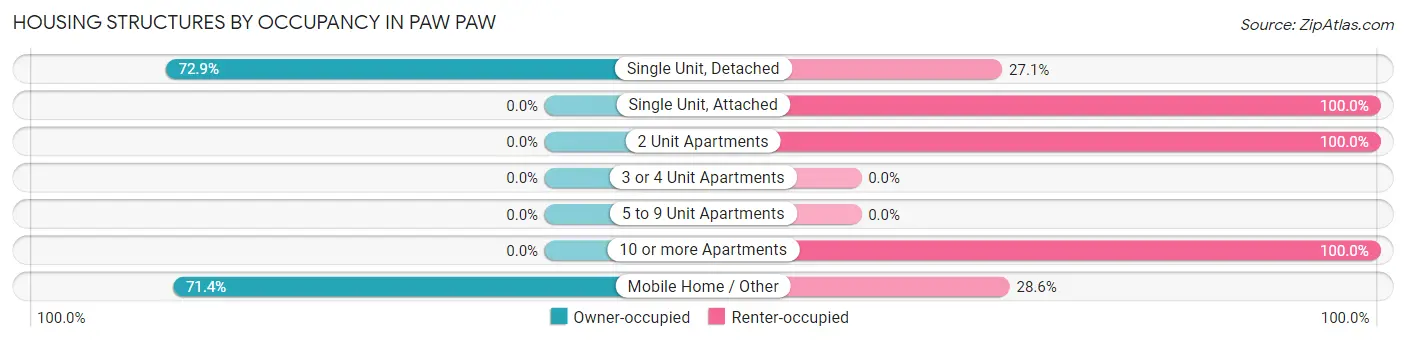
| Structure Type | Owner-occupied | Renter-occupied |
| Single Unit, Detached | 102 (72.9%) | 38 (27.1%) |
| Single Unit, Attached | 0 (0.0%) | 2 (100.0%) |
| 2 Unit Apartments | 0 (0.0%) | 7 (100.0%) |
| 3 or 4 Unit Apartments | 0 (0.0%) | 0 (0.0%) |
| 5 to 9 Unit Apartments | 0 (0.0%) | 0 (0.0%) |
| 10 or more Apartments | 0 (0.0%) | 5 (100.0%) |
| Mobile Home / Other | 15 (71.4%) | 6 (28.6%) |
| Total | 117 (66.9%) | 58 (33.1%) |
Housing Structures by Number of Rooms in Paw Paw
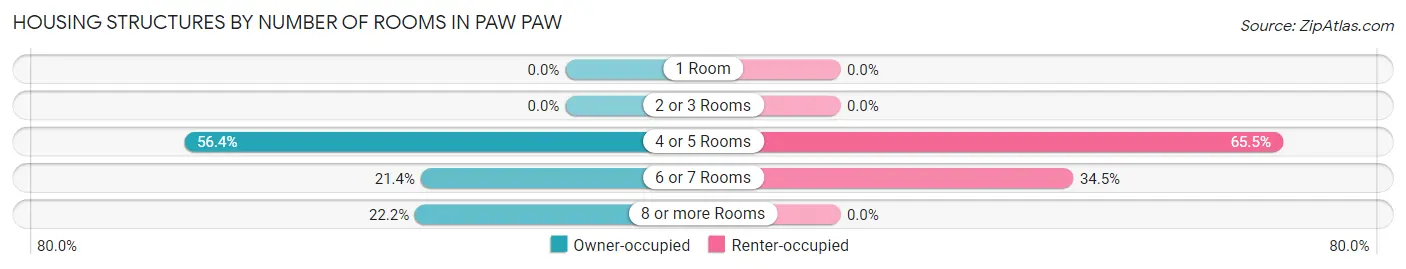
| Number of Rooms | Owner-occupied | Renter-occupied |
| 1 Room | 0 (0.0%) | 0 (0.0%) |
| 2 or 3 Rooms | 0 (0.0%) | 0 (0.0%) |
| 4 or 5 Rooms | 66 (56.4%) | 38 (65.5%) |
| 6 or 7 Rooms | 25 (21.4%) | 20 (34.5%) |
| 8 or more Rooms | 26 (22.2%) | 0 (0.0%) |
| Total | 117 (100.0%) | 58 (100.0%) |
Housing Structure by Heating Type in Paw Paw
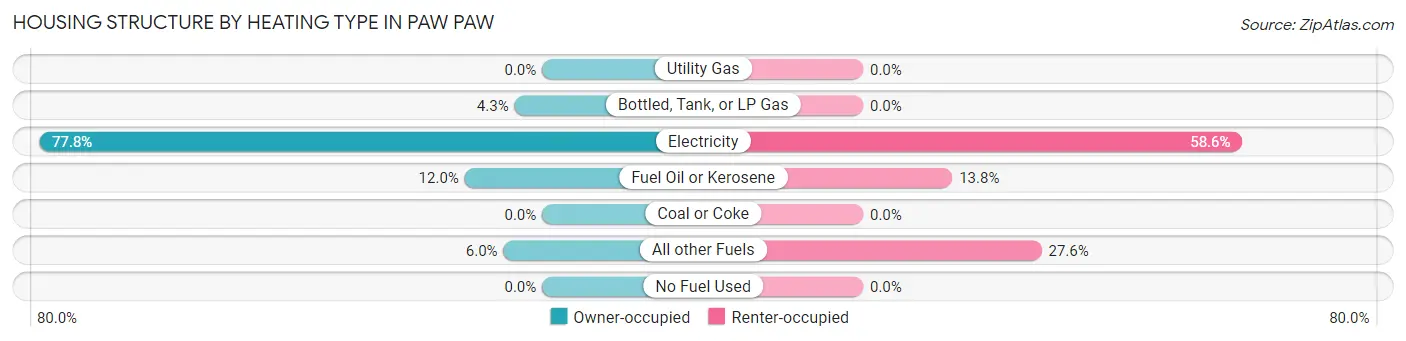
| Heating Type | Owner-occupied | Renter-occupied |
| Utility Gas | 0 (0.0%) | 0 (0.0%) |
| Bottled, Tank, or LP Gas | 5 (4.3%) | 0 (0.0%) |
| Electricity | 91 (77.8%) | 34 (58.6%) |
| Fuel Oil or Kerosene | 14 (12.0%) | 8 (13.8%) |
| Coal or Coke | 0 (0.0%) | 0 (0.0%) |
| All other Fuels | 7 (6.0%) | 16 (27.6%) |
| No Fuel Used | 0 (0.0%) | 0 (0.0%) |
| Total | 117 (100.0%) | 58 (100.0%) |
Household Vehicle Usage in Paw Paw
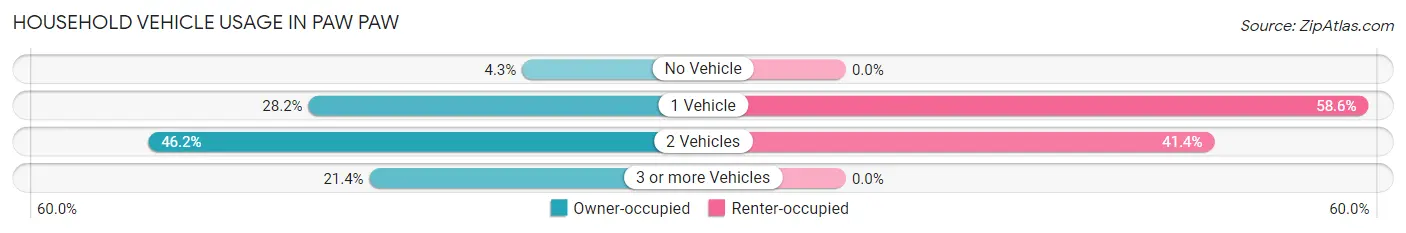
| Vehicles per Household | Owner-occupied | Renter-occupied |
| No Vehicle | 5 (4.3%) | 0 (0.0%) |
| 1 Vehicle | 33 (28.2%) | 34 (58.6%) |
| 2 Vehicles | 54 (46.2%) | 24 (41.4%) |
| 3 or more Vehicles | 25 (21.4%) | 0 (0.0%) |
| Total | 117 (100.0%) | 58 (100.0%) |
Real Estate & Mortgages in Paw Paw
Real Estate and Mortgage Overview in Paw Paw
| Characteristic | Without Mortgage | With Mortgage |
| Housing Units | 87 | 30 |
| Median Property Value | $81,100 | $95,400 |
| Median Household Income | $60,524 | $0 |
| Monthly Housing Costs | $381 | $0 |
| Real Estate Taxes | $1,014 | $0 |
Property Value by Mortgage Status in Paw Paw
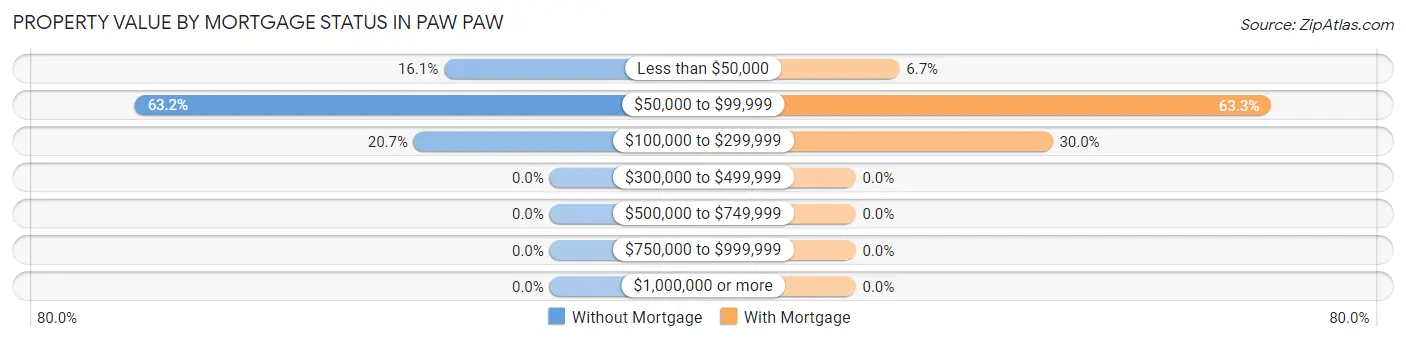
| Property Value | Without Mortgage | With Mortgage |
| Less than $50,000 | 14 (16.1%) | 2 (6.7%) |
| $50,000 to $99,999 | 55 (63.2%) | 19 (63.3%) |
| $100,000 to $299,999 | 18 (20.7%) | 9 (30.0%) |
| $300,000 to $499,999 | 0 (0.0%) | 0 (0.0%) |
| $500,000 to $749,999 | 0 (0.0%) | 0 (0.0%) |
| $750,000 to $999,999 | 0 (0.0%) | 0 (0.0%) |
| $1,000,000 or more | 0 (0.0%) | 0 (0.0%) |
| Total | 87 (100.0%) | 30 (100.0%) |
Household Income by Mortgage Status in Paw Paw

| Household Income | Without Mortgage | With Mortgage |
| Less than $10,000 | 0 (0.0%) | 0 (0.0%) |
| $10,000 to $24,999 | 12 (13.8%) | 0 (0.0%) |
| $25,000 to $34,999 | 11 (12.6%) | 0 (0.0%) |
| $35,000 to $49,999 | 0 (0.0%) | 0 (0.0%) |
| $50,000 to $74,999 | 52 (59.8%) | 8 (26.7%) |
| $75,000 to $99,999 | 10 (11.5%) | 0 (0.0%) |
| $100,000 to $149,999 | 2 (2.3%) | 0 (0.0%) |
| $150,000 or more | 0 (0.0%) | 22 (73.3%) |
| Total | 87 (100.0%) | 30 (100.0%) |
Property Value to Household Income Ratio in Paw Paw
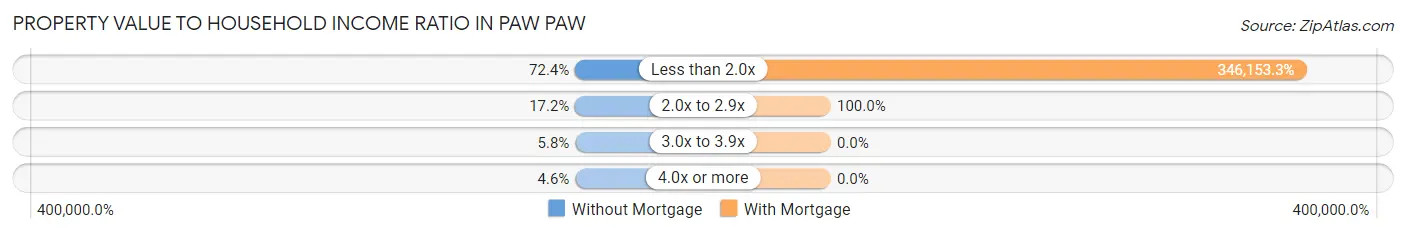
| Value-to-Income Ratio | Without Mortgage | With Mortgage |
| Less than 2.0x | 63 (72.4%) | 103,846 (346,153.3%) |
| 2.0x to 2.9x | 15 (17.2%) | 30 (100.0%) |
| 3.0x to 3.9x | 5 (5.8%) | 0 (0.0%) |
| 4.0x or more | 4 (4.6%) | 0 (0.0%) |
| Total | 87 (100.0%) | 30 (100.0%) |
Real Estate Taxes by Mortgage Status in Paw Paw
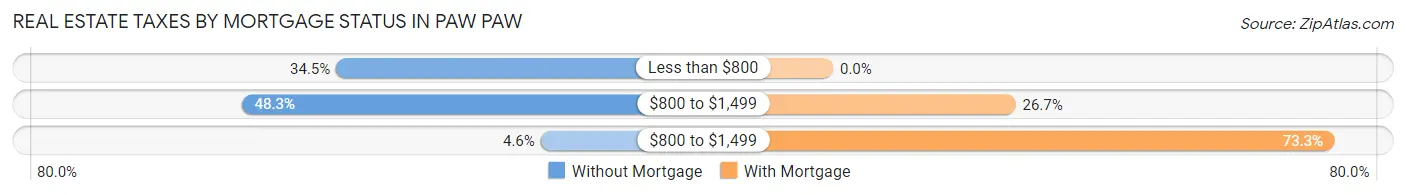
| Property Taxes | Without Mortgage | With Mortgage |
| Less than $800 | 30 (34.5%) | 0 (0.0%) |
| $800 to $1,499 | 42 (48.3%) | 8 (26.7%) |
| $800 to $1,499 | 4 (4.6%) | 22 (73.3%) |
| Total | 87 (100.0%) | 30 (100.0%) |
Health & Disability in Paw Paw
Health Insurance Coverage by Age in Paw Paw
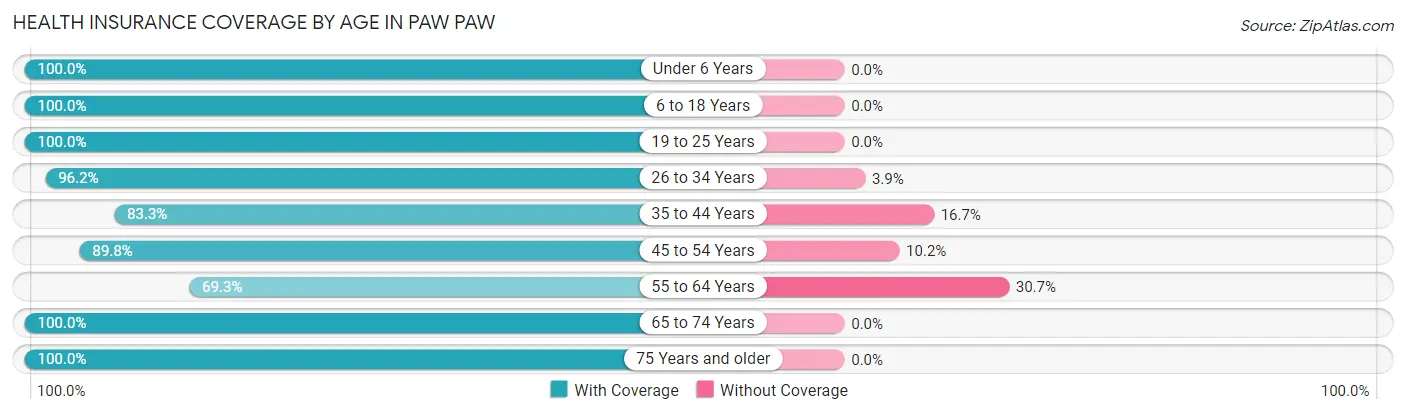
| Age Bracket | With Coverage | Without Coverage |
| Under 6 Years | 17 (100.0%) | 0 (0.0%) |
| 6 to 18 Years | 120 (100.0%) | 0 (0.0%) |
| 19 to 25 Years | 5 (100.0%) | 0 (0.0%) |
| 26 to 34 Years | 25 (96.2%) | 1 (3.8%) |
| 35 to 44 Years | 30 (83.3%) | 6 (16.7%) |
| 45 to 54 Years | 79 (89.8%) | 9 (10.2%) |
| 55 to 64 Years | 52 (69.3%) | 23 (30.7%) |
| 65 to 74 Years | 66 (100.0%) | 0 (0.0%) |
| 75 Years and older | 30 (100.0%) | 0 (0.0%) |
| Total | 424 (91.6%) | 39 (8.4%) |
Health Insurance Coverage by Citizenship Status in Paw Paw
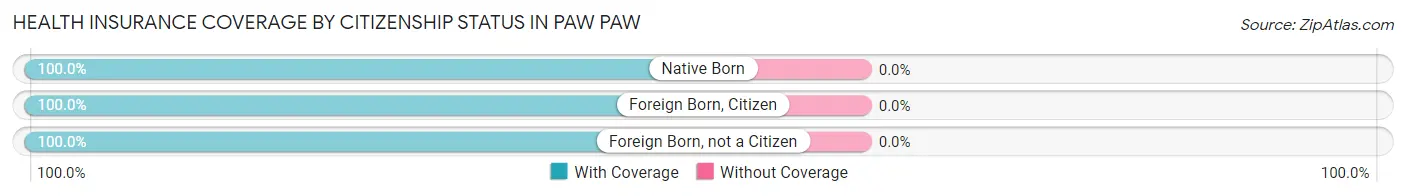
| Citizenship Status | With Coverage | Without Coverage |
| Native Born | 17 (100.0%) | 0 (0.0%) |
| Foreign Born, Citizen | 120 (100.0%) | 0 (0.0%) |
| Foreign Born, not a Citizen | 5 (100.0%) | 0 (0.0%) |
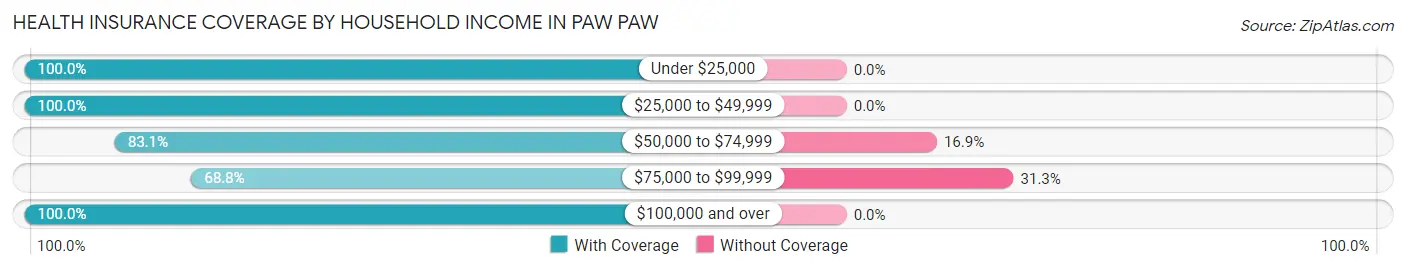
Health Insurance Coverage by Household Income in Paw Paw
| Household Income | With Coverage | Without Coverage |
| Under $25,000 | 78 (100.0%) | 0 (0.0%) |
| $25,000 to $49,999 | 92 (100.0%) | 0 (0.0%) |
| $50,000 to $74,999 | 118 (83.1%) | 24 (16.9%) |
| $75,000 to $99,999 | 33 (68.8%) | 15 (31.2%) |
| $100,000 and over | 99 (100.0%) | 0 (0.0%) |
Public vs Private Health Insurance Coverage by Age in Paw Paw
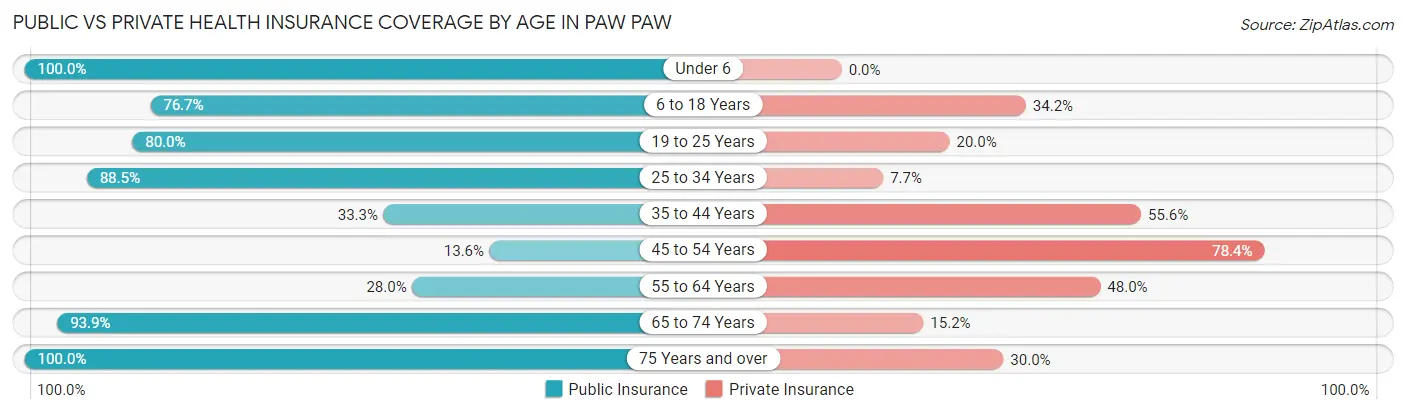
| Age Bracket | Public Insurance | Private Insurance |
| Under 6 | 17 (100.0%) | 0 (0.0%) |
| 6 to 18 Years | 92 (76.7%) | 41 (34.2%) |
| 19 to 25 Years | 4 (80.0%) | 1 (20.0%) |
| 25 to 34 Years | 23 (88.5%) | 2 (7.7%) |
| 35 to 44 Years | 12 (33.3%) | 20 (55.6%) |
| 45 to 54 Years | 12 (13.6%) | 69 (78.4%) |
| 55 to 64 Years | 21 (28.0%) | 36 (48.0%) |
| 65 to 74 Years | 62 (93.9%) | 10 (15.1%) |
| 75 Years and over | 30 (100.0%) | 9 (30.0%) |
| Total | 273 (59.0%) | 188 (40.6%) |
Disability Status by Sex by Age in Paw Paw
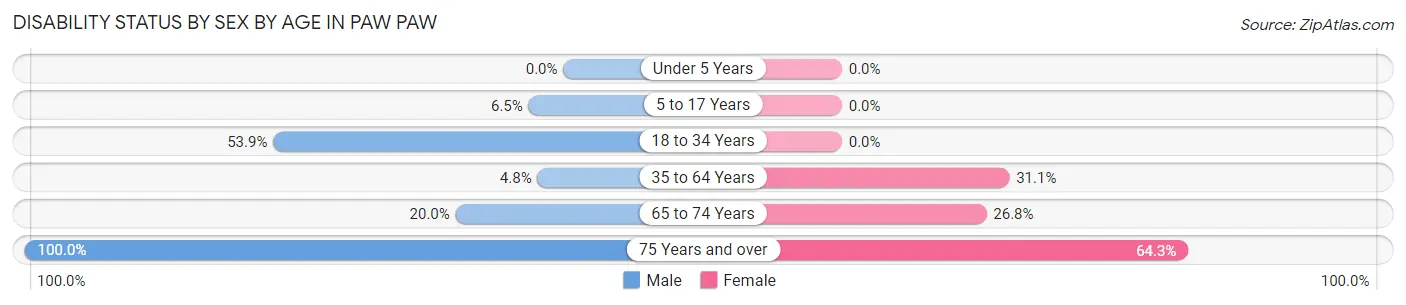
| Age Bracket | Male | Female |
| Under 5 Years | 0 (0.0%) | 0 (0.0%) |
| 5 to 17 Years | 2 (6.5%) | 0 (0.0%) |
| 18 to 34 Years | 14 (53.8%) | 0 (0.0%) |
| 35 to 64 Years | 6 (4.8%) | 23 (31.1%) |
| 65 to 74 Years | 5 (20.0%) | 11 (26.8%) |
| 75 Years and over | 16 (100.0%) | 9 (64.3%) |
Disability Class by Sex by Age in Paw Paw
Disability Class: Hearing Difficulty
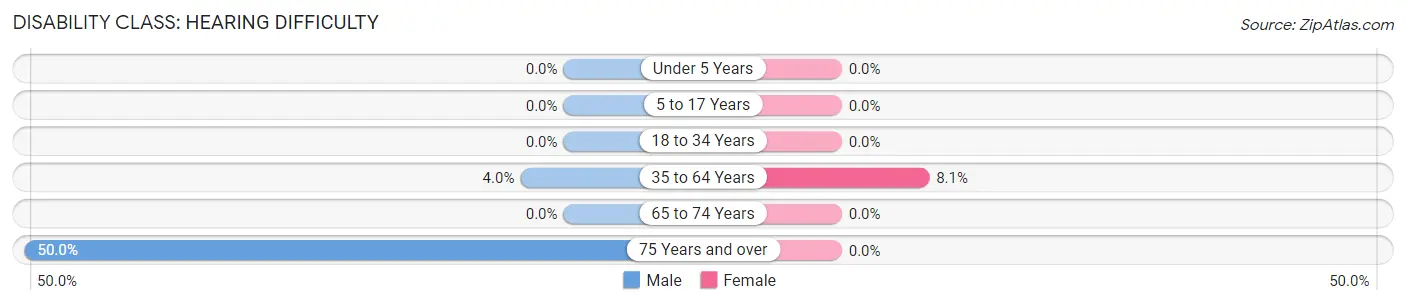
| Age Bracket | Male | Female |
| Under 5 Years | 0 (0.0%) | 0 (0.0%) |
| 5 to 17 Years | 0 (0.0%) | 0 (0.0%) |
| 18 to 34 Years | 0 (0.0%) | 0 (0.0%) |
| 35 to 64 Years | 5 (4.0%) | 6 (8.1%) |
| 65 to 74 Years | 0 (0.0%) | 0 (0.0%) |
| 75 Years and over | 8 (50.0%) | 0 (0.0%) |
Disability Class: Vision Difficulty
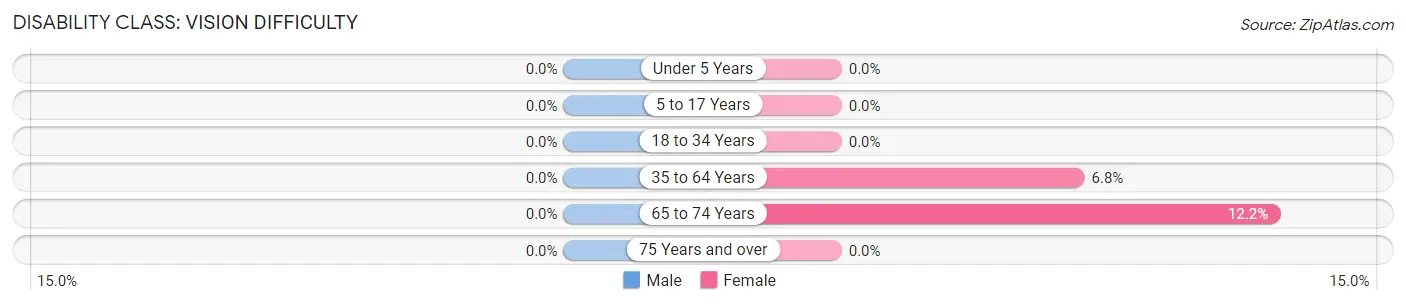
| Age Bracket | Male | Female |
| Under 5 Years | 0 (0.0%) | 0 (0.0%) |
| 5 to 17 Years | 0 (0.0%) | 0 (0.0%) |
| 18 to 34 Years | 0 (0.0%) | 0 (0.0%) |
| 35 to 64 Years | 0 (0.0%) | 5 (6.8%) |
| 65 to 74 Years | 0 (0.0%) | 5 (12.2%) |
| 75 Years and over | 0 (0.0%) | 0 (0.0%) |
Disability Class: Cognitive Difficulty
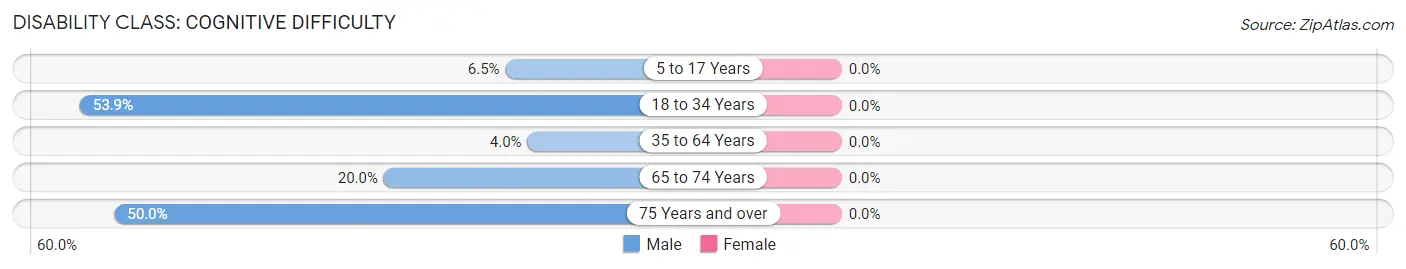
| Age Bracket | Male | Female |
| 5 to 17 Years | 2 (6.5%) | 0 (0.0%) |
| 18 to 34 Years | 14 (53.8%) | 0 (0.0%) |
| 35 to 64 Years | 5 (4.0%) | 0 (0.0%) |
| 65 to 74 Years | 5 (20.0%) | 0 (0.0%) |
| 75 Years and over | 8 (50.0%) | 0 (0.0%) |
Disability Class: Ambulatory Difficulty
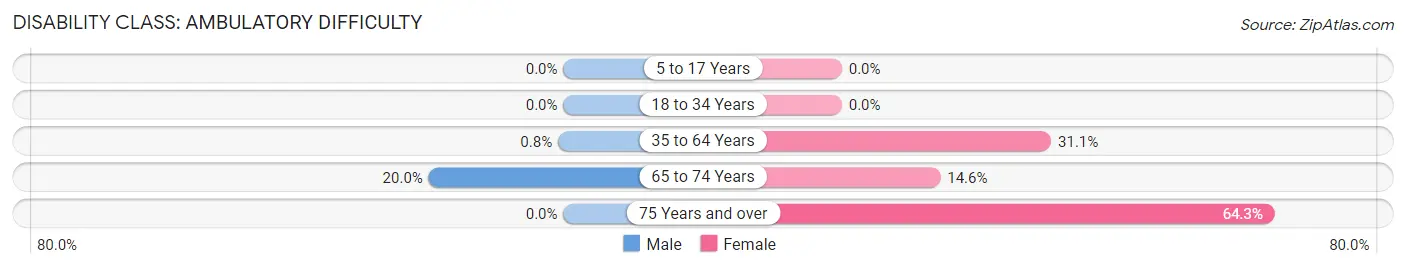
| Age Bracket | Male | Female |
| 5 to 17 Years | 0 (0.0%) | 0 (0.0%) |
| 18 to 34 Years | 0 (0.0%) | 0 (0.0%) |
| 35 to 64 Years | 1 (0.8%) | 23 (31.1%) |
| 65 to 74 Years | 5 (20.0%) | 6 (14.6%) |
| 75 Years and over | 0 (0.0%) | 9 (64.3%) |
Disability Class: Self-Care Difficulty
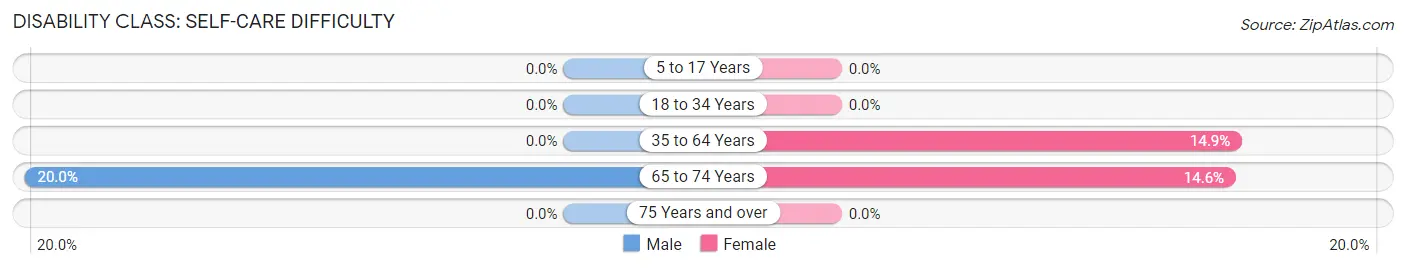
| Age Bracket | Male | Female |
| 5 to 17 Years | 0 (0.0%) | 0 (0.0%) |
| 18 to 34 Years | 0 (0.0%) | 0 (0.0%) |
| 35 to 64 Years | 0 (0.0%) | 11 (14.9%) |
| 65 to 74 Years | 5 (20.0%) | 6 (14.6%) |
| 75 Years and over | 0 (0.0%) | 0 (0.0%) |
Technology Access in Paw Paw
Computing Device Access in Paw Paw
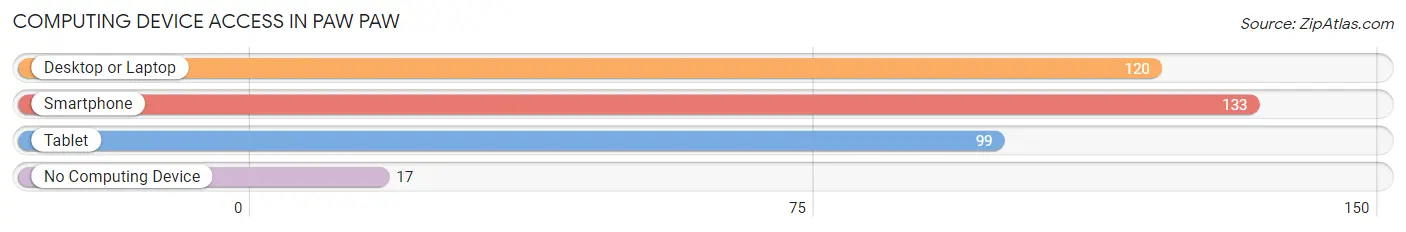
| Device Type | # Households | % Households |
| Desktop or Laptop | 120 | 68.6% |
| Smartphone | 133 | 76.0% |
| Tablet | 99 | 56.6% |
| No Computing Device | 17 | 9.7% |
| Total | 175 | 100.0% |
Internet Access in Paw Paw
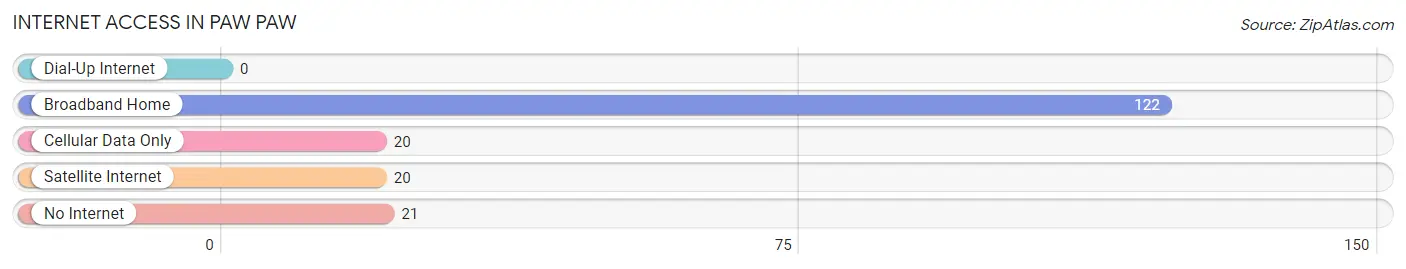
| Internet Type | # Households | % Households |
| Dial-Up Internet | 0 | 0.0% |
| Broadband Home | 122 | 69.7% |
| Cellular Data Only | 20 | 11.4% |
| Satellite Internet | 20 | 11.4% |
| No Internet | 21 | 12.0% |
| Total | 175 | 100.0% |
Paw Paw Summary
Paw Paw is a small town located in the Eastern Panhandle of West Virginia, United States. It is situated in Morgan County, and is part of the Cumberland, MD-WV Metropolitan Statistical Area. The town was founded in 1820 and has a population of approximately 500 people.
History
Paw Paw was founded in 1820 by a group of settlers from Pennsylvania. The town was named after the Paw Paw tree, which was abundant in the area. The town was originally a farming community, and the first post office was established in 1825. In 1836, the town was incorporated and the first school was built.
In the late 19th century, the town began to grow and develop. The Baltimore and Ohio Railroad was built through the town in 1872, and the town became a popular stop for travelers. The railroad also brought new businesses to the area, including a sawmill, a gristmill, and a tannery.
In the early 20th century, the town continued to grow and develop. The first bank was established in 1910, and the first telephone service was established in 1912. The town also had a newspaper, the Paw Paw News, which was published from 1912 to 1925.
Geography
Paw Paw is located in the Eastern Panhandle of West Virginia, in Morgan County. It is situated at the intersection of US Route 522 and West Virginia Route 9. The town is located in the Appalachian Mountains, and is surrounded by rolling hills and forests. The town is located approximately 30 miles south of Cumberland, Maryland, and approximately 50 miles west of Washington, D.C.
The climate in Paw Paw is humid subtropical, with hot, humid summers and cold, wet winters. The average annual temperature is 54°F, and the average annual precipitation is 41 inches.
Economy
The economy of Paw Paw is largely based on agriculture and tourism. The town is home to several farms, which produce a variety of crops, including corn, soybeans, hay, and wheat. The town is also home to several wineries, which produce a variety of wines.
Tourism is also an important part of the economy. The town is home to several historic sites, including the Paw Paw Historic District, which is listed on the National Register of Historic Places. The town is also home to several parks, including the Paw Paw State Park, which offers camping, fishing, and hiking.
Demographics
As of the 2010 census, the population of Paw Paw was 498. The racial makeup of the town was 97.2% White, 0.6% African American, 0.2% Native American, 0.2% Asian, 0.2% from other races, and 1.8% from two or more races. The median household income was $37,500, and the median family income was $45,000.
The town is served by the Morgan County School District, which includes two elementary schools, one middle school, and one high school. The town is also home to the Paw Paw Public Library, which offers a variety of books, magazines, and other materials.
Common Questions
What is Per Capita Income in Paw Paw?
Per Capita income in Paw Paw is $23,810.
What is the Median Family Income in Paw Paw?
Median Family Income in Paw Paw is $44,293.
What is the Median Household income in Paw Paw?
Median Household Income in Paw Paw is $58,750.
What is Income or Wage Gap in Paw Paw?
Income or Wage Gap in Paw Paw is 50.3%.
Women in Paw Paw earn 49.7 cents for every dollar earned by a man.
What is Inequality or Gini Index in Paw Paw?
Inequality or Gini Index in Paw Paw is 0.33.
What is the Total Population of Paw Paw?
Total Population of Paw Paw is 463.
What is the Total Male Population of Paw Paw?
Total Male Population of Paw Paw is 240.
What is the Total Female Population of Paw Paw?
Total Female Population of Paw Paw is 223.
What is the Ratio of Males per 100 Females in Paw Paw?
There are 107.62 Males per 100 Females in Paw Paw.
What is the Ratio of Females per 100 Males in Paw Paw?
There are 92.92 Females per 100 Males in Paw Paw.
What is the Median Population Age in Paw Paw?
Median Population Age in Paw Paw is 47.7 Years.
What is the Average Family Size in Paw Paw
Average Family Size in Paw Paw is 3.0 People.
What is the Average Household Size in Paw Paw
Average Household Size in Paw Paw is 2.6 People.
How Large is the Labor Force in Paw Paw?
There are 204 People in the Labor Forcein in Paw Paw.
What is the Percentage of People in the Labor Force in Paw Paw?
55.3% of People are in the Labor Force in Paw Paw.
What is the Unemployment Rate in Paw Paw?
Unemployment Rate in Paw Paw is 14.2%.