Lazy Lake, FL Map & Demographics
Lazy Lake Map
Lazy Lake Overview
$11,668
PER CAPITA INCOME
$18,825
AVG FAMILY INCOME
$18,843
AVG HOUSEHOLD INCOME
0.18
INEQUALITY / GINI INDEX
143
TOTAL POPULATION
70
MALE POPULATION
73
FEMALE POPULATION
95.89
MALES / 100 FEMALES
104.29
FEMALES / 100 MALES
62.1
MEDIAN AGE
2.0
AVG FAMILY SIZE
2.0
AVG HOUSEHOLD SIZE
3
LABOR FORCE [ PEOPLE ]
2.1%
PERCENT IN LABOR FORCE
Lazy Lake Area Codes
Income in Lazy Lake
Income Overview in Lazy Lake
Per Capita Income in Lazy Lake is $11,668, while median incomes of families and households are $18,825 and $18,843 respectively.
| Characteristic | Number | Measure |
| Per Capita Income | 143 | $11,668 |
| Median Family Income | 71 | $18,825 |
| Mean Family Income | 71 | $20,885 |
| Median Household Income | 72 | $18,843 |
| Mean Household Income | 72 | $22,586 |
| Income Deficit | 71 | $0 |
| Wage / Income Gap (%) | 143 | 0.00% |
| Wage / Income Gap ($) | 143 | 100.00¢ per $1 |
| Gini / Inequality Index | 143 | 0.18 |
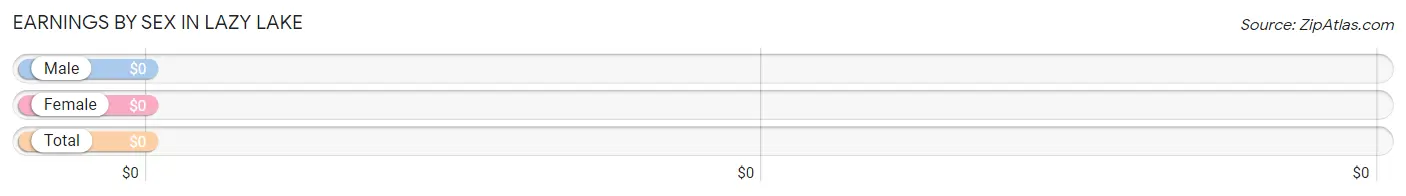
Earnings by Sex in Lazy Lake
| Sex | Number | Average Earnings |
| Male | 0 (0.0%) | $0 |
| Female | 3 (100.0%) | $0 |
| Total | 3 (100.0%) | $0 |
Earnings by Sex by Income Bracket in Lazy Lake
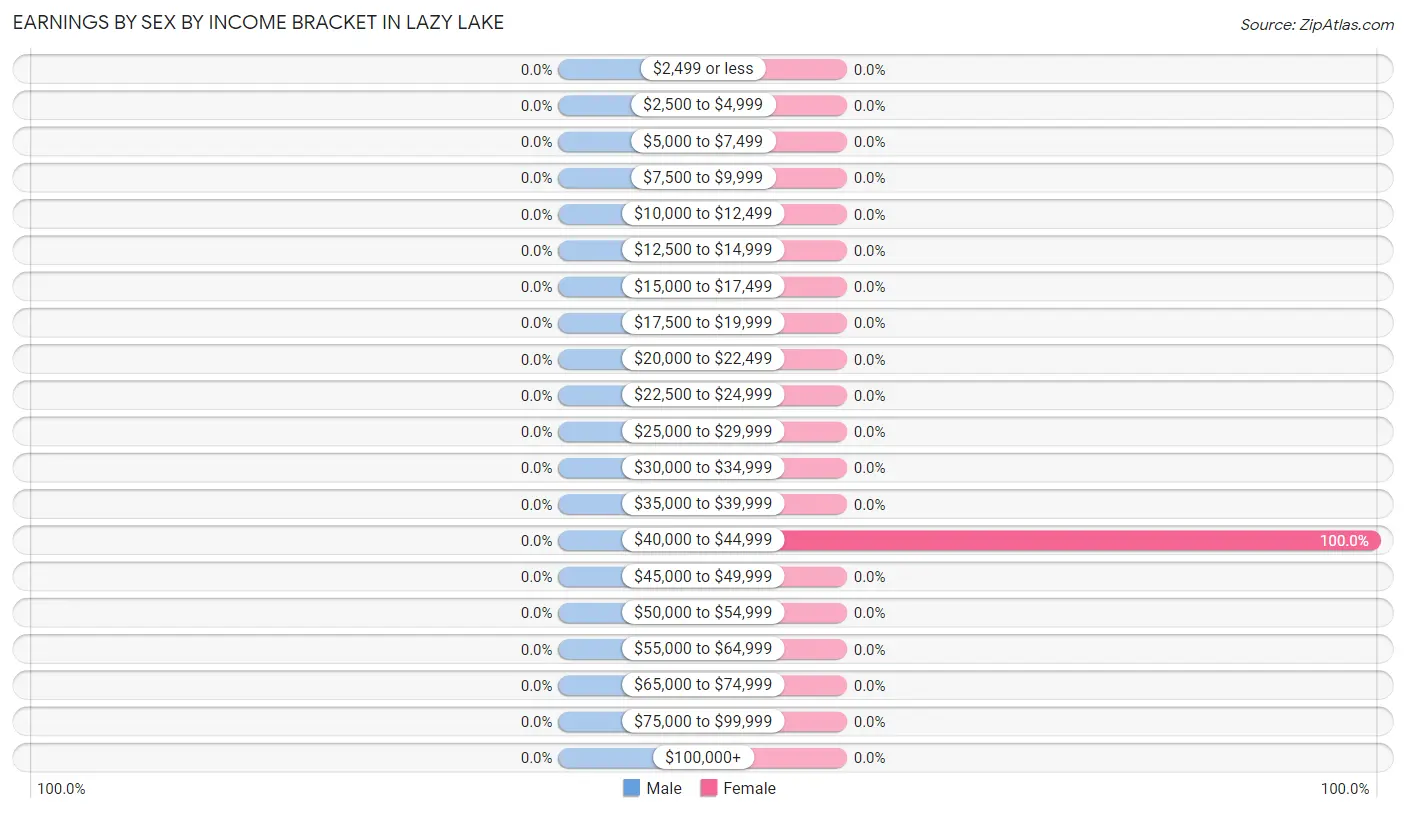
| Income | Male | Female |
| $2,499 or less | 0 (0.0%) | 0 (0.0%) |
| $2,500 to $4,999 | 0 (0.0%) | 0 (0.0%) |
| $5,000 to $7,499 | 0 (0.0%) | 0 (0.0%) |
| $7,500 to $9,999 | 0 (0.0%) | 0 (0.0%) |
| $10,000 to $12,499 | 0 (0.0%) | 0 (0.0%) |
| $12,500 to $14,999 | 0 (0.0%) | 0 (0.0%) |
| $15,000 to $17,499 | 0 (0.0%) | 0 (0.0%) |
| $17,500 to $19,999 | 0 (0.0%) | 0 (0.0%) |
| $20,000 to $22,499 | 0 (0.0%) | 0 (0.0%) |
| $22,500 to $24,999 | 0 (0.0%) | 0 (0.0%) |
| $25,000 to $29,999 | 0 (0.0%) | 0 (0.0%) |
| $30,000 to $34,999 | 0 (0.0%) | 0 (0.0%) |
| $35,000 to $39,999 | 0 (0.0%) | 0 (0.0%) |
| $40,000 to $44,999 | 0 (0.0%) | 3 (100.0%) |
| $45,000 to $49,999 | 0 (0.0%) | 0 (0.0%) |
| $50,000 to $54,999 | 0 (0.0%) | 0 (0.0%) |
| $55,000 to $64,999 | 0 (0.0%) | 0 (0.0%) |
| $65,000 to $74,999 | 0 (0.0%) | 0 (0.0%) |
| $75,000 to $99,999 | 0 (0.0%) | 0 (0.0%) |
| $100,000+ | 0 (0.0%) | 0 (0.0%) |
| Total | 0 (0.0%) | 3 (100.0%) |
Earnings by Sex by Educational Attainment in Lazy Lake
| Educational Attainment | Male Income | Female Income |
| Less than High School | - | - |
| High School Diploma | - | - |
| College or Associate's Degree | - | - |
| Bachelor's Degree | - | - |
| Graduate Degree | - | - |
| Total | - | - |
Family Income in Lazy Lake
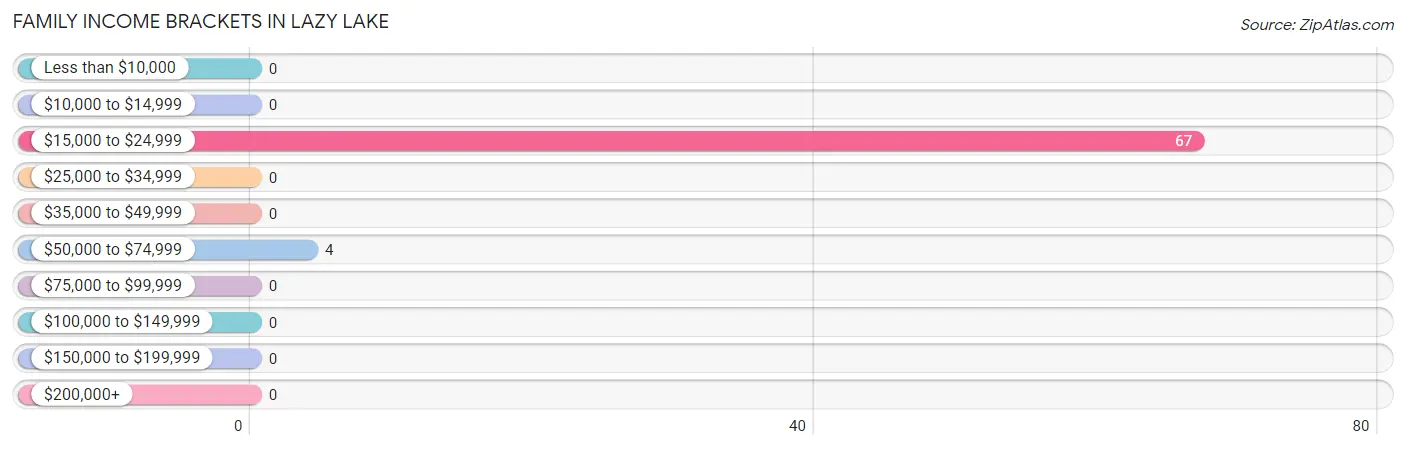
Family Income Brackets in Lazy Lake
According to the Lazy Lake family income data, there are 67 families falling into the $15,000 to $24,999 income range, which is the most common income bracket and makes up 94.4% of all families.
| Income Bracket | # Families | % Families |
| Less than $10,000 | 0 | 0.0% |
| $10,000 to $14,999 | 0 | 0.0% |
| $15,000 to $24,999 | 67 | 94.4% |
| $25,000 to $34,999 | 0 | 0.0% |
| $35,000 to $49,999 | 0 | 0.0% |
| $50,000 to $74,999 | 4 | 5.6% |
| $75,000 to $99,999 | 0 | 0.0% |
| $100,000 to $149,999 | 0 | 0.0% |
| $150,000 to $199,999 | 0 | 0.0% |
| $200,000+ | 0 | 0.0% |
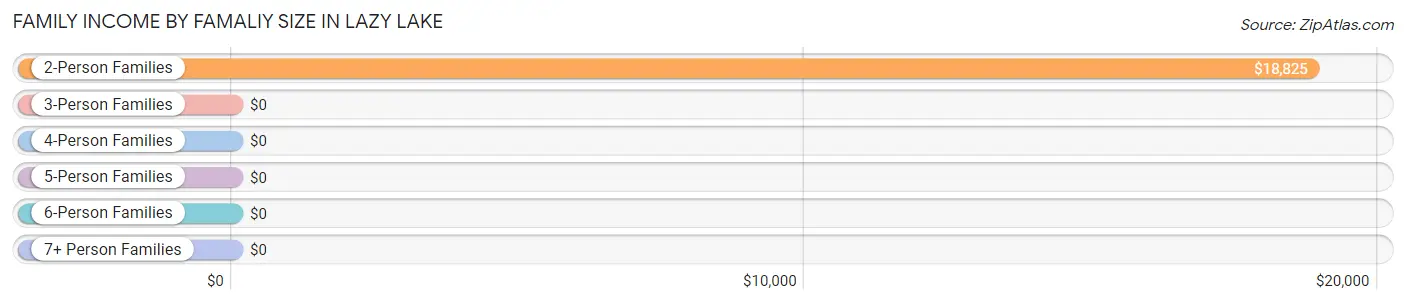
Family Income by Famaliy Size in Lazy Lake
2-person families (71 | 100.0%) account for the highest median family income in Lazy Lake with $18,825 per family, while 2-person families (71 | 100.0%) have the highest median income of $9,412 per family member.
| Income Bracket | # Families | Median Income |
| 2-Person Families | 71 (100.0%) | $18,825 |
| 3-Person Families | 0 (0.0%) | $0 |
| 4-Person Families | 0 (0.0%) | $0 |
| 5-Person Families | 0 (0.0%) | $0 |
| 6-Person Families | 0 (0.0%) | $0 |
| 7+ Person Families | 0 (0.0%) | $0 |
| Total | 71 (100.0%) | $18,825 |
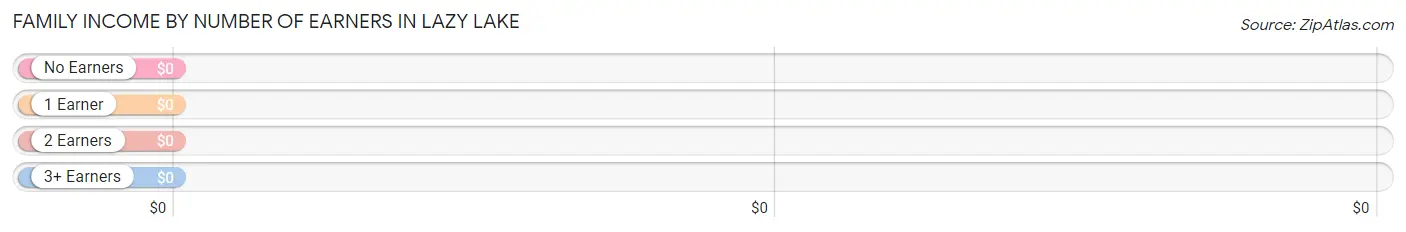
Family Income by Number of Earners in Lazy Lake
| Number of Earners | # Families | Median Income |
| No Earners | 69 (97.2%) | $0 |
| 1 Earner | 2 (2.8%) | $0 |
| 2 Earners | 0 (0.0%) | $0 |
| 3+ Earners | 0 (0.0%) | $0 |
| Total | 71 (100.0%) | $18,825 |
Household Income in Lazy Lake
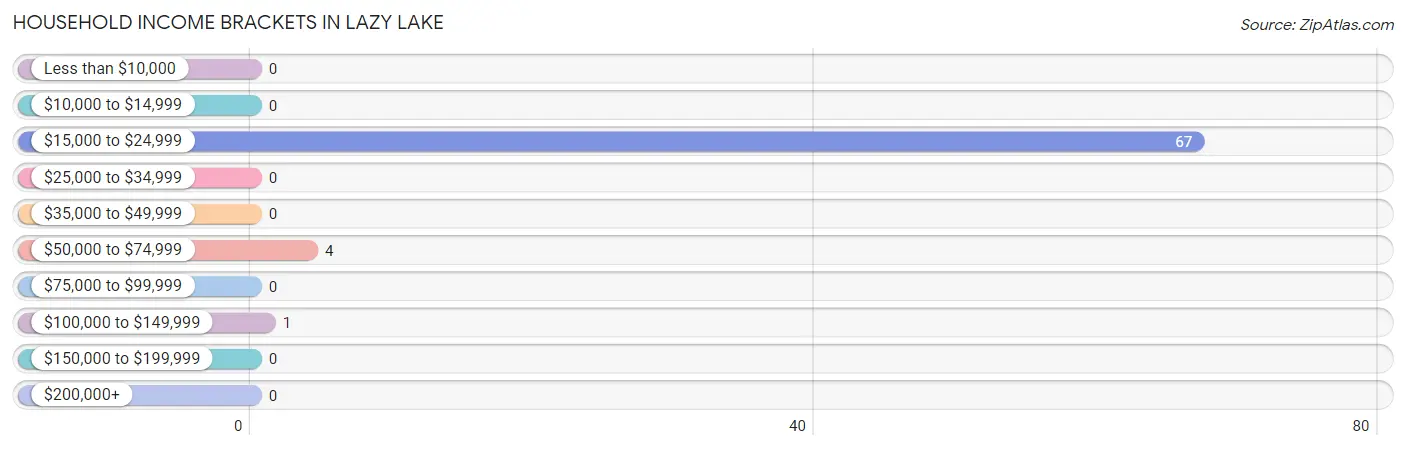
Household Income Brackets in Lazy Lake
With 67 households falling in the category, the $15,000 to $24,999 income range is the most frequent in Lazy Lake, accounting for 93.1% of all households.
| Income Bracket | # Households | % Households |
| Less than $10,000 | 0 | 0.0% |
| $10,000 to $14,999 | 0 | 0.0% |
| $15,000 to $24,999 | 67 | 93.1% |
| $25,000 to $34,999 | 0 | 0.0% |
| $35,000 to $49,999 | 0 | 0.0% |
| $50,000 to $74,999 | 4 | 5.6% |
| $75,000 to $99,999 | 0 | 0.0% |
| $100,000 to $149,999 | 1 | 1.4% |
| $150,000 to $199,999 | 0 | 0.0% |
| $200,000+ | 0 | 0.0% |
Household Income by Householder Age in Lazy Lake
The median household income in Lazy Lake is $18,843, with the highest median household income of $68,125 found in the 65+ years age bracket for the primary householder. A total of 5 households (6.9%) fall into this category.
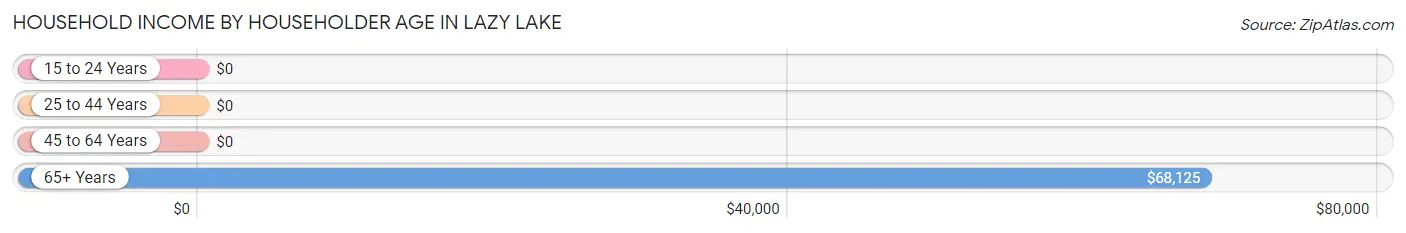
| Income Bracket | # Households | Median Income |
| 15 to 24 Years | 0 (0.0%) | $0 |
| 25 to 44 Years | 0 (0.0%) | $0 |
| 45 to 64 Years | 67 (93.1%) | $0 |
| 65+ Years | 5 (6.9%) | $68,125 |
| Total | 72 (100.0%) | $18,843 |
Poverty in Lazy Lake
Income Below Poverty by Sex and Age in Lazy Lake
With 95.7% poverty level for males and 90.4% for females among the residents of Lazy Lake, 55 to 64 year old males and 55 to 64 year old females are the most vulnerable to poverty, with 67 males (100.0%) and 66 females (95.7%) in their respective age groups living below the poverty level.
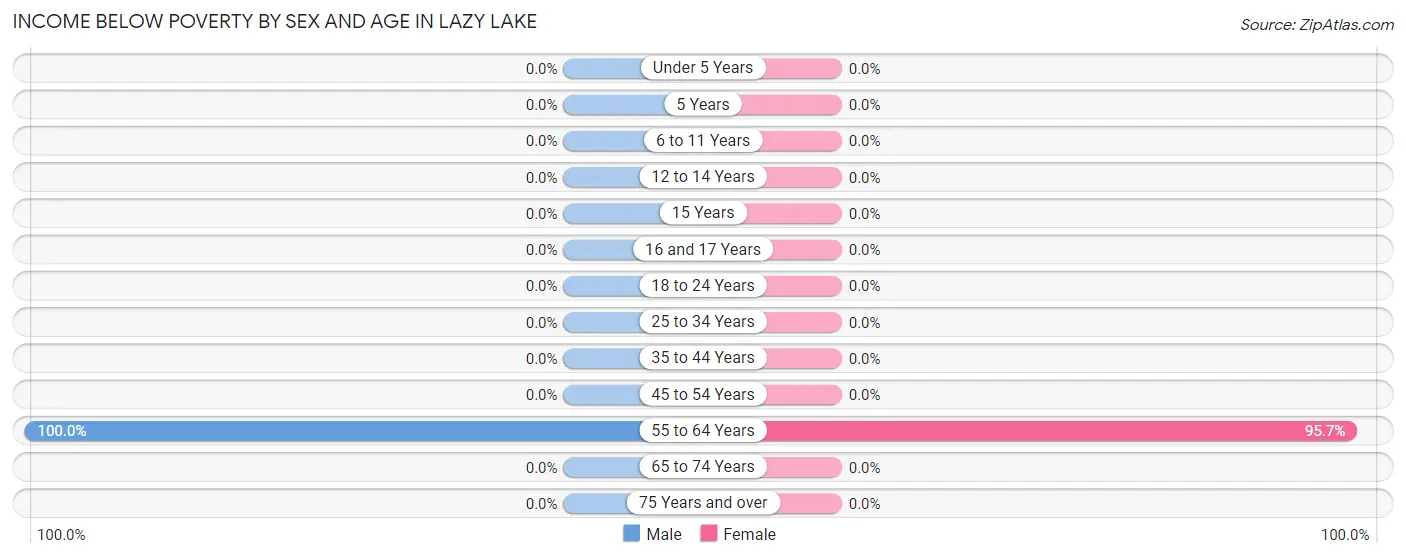
| Age Bracket | Male | Female |
| Under 5 Years | 0 (0.0%) | 0 (0.0%) |
| 5 Years | 0 (0.0%) | 0 (0.0%) |
| 6 to 11 Years | 0 (0.0%) | 0 (0.0%) |
| 12 to 14 Years | 0 (0.0%) | 0 (0.0%) |
| 15 Years | 0 (0.0%) | 0 (0.0%) |
| 16 and 17 Years | 0 (0.0%) | 0 (0.0%) |
| 18 to 24 Years | 0 (0.0%) | 0 (0.0%) |
| 25 to 34 Years | 0 (0.0%) | 0 (0.0%) |
| 35 to 44 Years | 0 (0.0%) | 0 (0.0%) |
| 45 to 54 Years | 0 (0.0%) | 0 (0.0%) |
| 55 to 64 Years | 67 (100.0%) | 66 (95.7%) |
| 65 to 74 Years | 0 (0.0%) | 0 (0.0%) |
| 75 Years and over | 0 (0.0%) | 0 (0.0%) |
| Total | 67 (95.7%) | 66 (90.4%) |
Income Above Poverty by Sex and Age in Lazy Lake
According to the poverty statistics in Lazy Lake, males aged 65 to 74 years and females aged 65 to 74 years are the age groups that are most secure financially, with 100.0% of males and 100.0% of females in these age groups living above the poverty line.
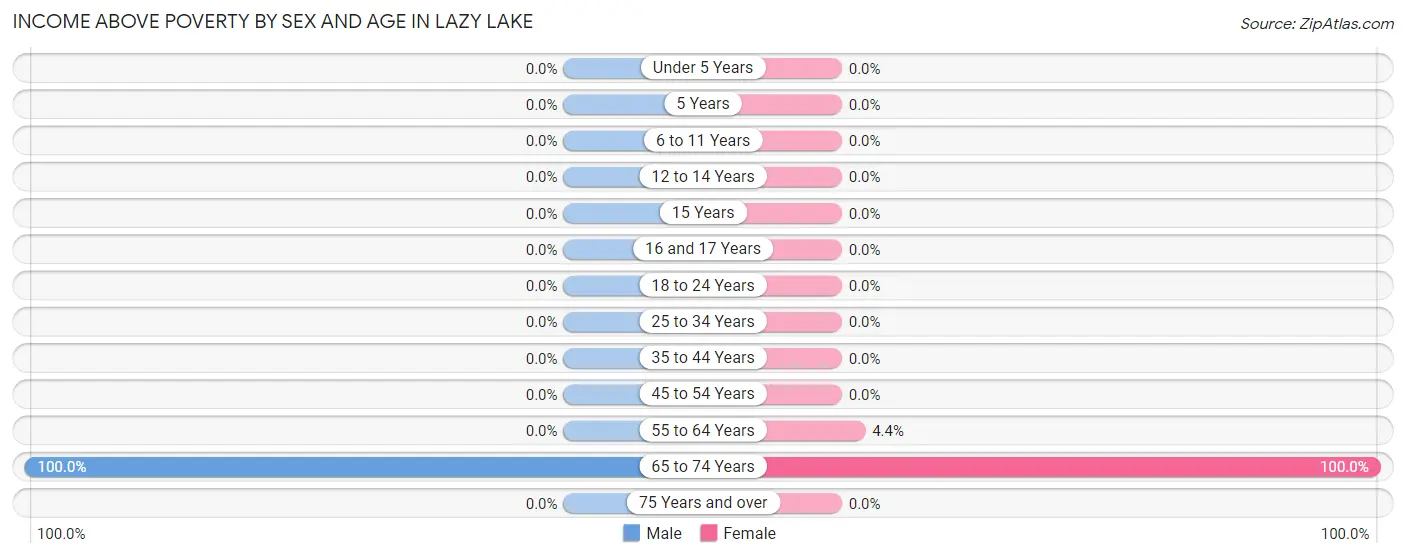
| Age Bracket | Male | Female |
| Under 5 Years | 0 (0.0%) | 0 (0.0%) |
| 5 Years | 0 (0.0%) | 0 (0.0%) |
| 6 to 11 Years | 0 (0.0%) | 0 (0.0%) |
| 12 to 14 Years | 0 (0.0%) | 0 (0.0%) |
| 15 Years | 0 (0.0%) | 0 (0.0%) |
| 16 and 17 Years | 0 (0.0%) | 0 (0.0%) |
| 18 to 24 Years | 0 (0.0%) | 0 (0.0%) |
| 25 to 34 Years | 0 (0.0%) | 0 (0.0%) |
| 35 to 44 Years | 0 (0.0%) | 0 (0.0%) |
| 45 to 54 Years | 0 (0.0%) | 0 (0.0%) |
| 55 to 64 Years | 0 (0.0%) | 3 (4.3%) |
| 65 to 74 Years | 3 (100.0%) | 4 (100.0%) |
| 75 Years and over | 0 (0.0%) | 0 (0.0%) |
| Total | 3 (4.3%) | 7 (9.6%) |
Income Below Poverty Among Married-Couple Families in Lazy Lake
The poverty statistics for married-couple families in Lazy Lake show that 94.4% or 67 of the total 71 families live below the poverty line. Families with no children have the highest poverty rate of 94.4%, comprising of 67 families. On the other hand, families with no children have the lowest poverty rate of 94.4%, which includes 67 families.
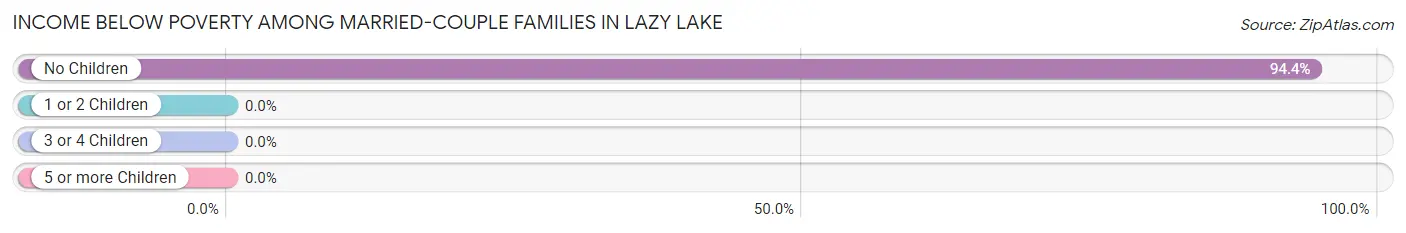
| Children | Above Poverty | Below Poverty |
| No Children | 4 (5.6%) | 67 (94.4%) |
| 1 or 2 Children | 0 (0.0%) | 0 (0.0%) |
| 3 or 4 Children | 0 (0.0%) | 0 (0.0%) |
| 5 or more Children | 0 (0.0%) | 0 (0.0%) |
| Total | 4 (5.6%) | 67 (94.4%) |
Income Below Poverty Among Single-Parent Households in Lazy Lake
| Children | Single Father | Single Mother |
| No Children | 0 (0.0%) | 0 (0.0%) |
| 1 or 2 Children | 0 (0.0%) | 0 (0.0%) |
| 3 or 4 Children | 0 (0.0%) | 0 (0.0%) |
| 5 or more Children | 0 (0.0%) | 0 (0.0%) |
| Total | 0 (0.0%) | 0 (0.0%) |
Income Below Poverty Among Married-Couple vs Single-Parent Households in Lazy Lake
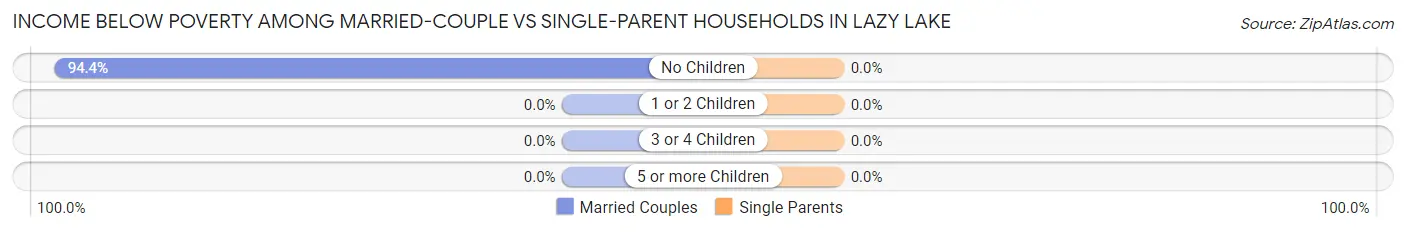
| Children | Married-Couple Families | Single-Parent Households |
| No Children | 67 (94.4%) | 0 (0.0%) |
| 1 or 2 Children | 0 (0.0%) | 0 (0.0%) |
| 3 or 4 Children | 0 (0.0%) | 0 (0.0%) |
| 5 or more Children | 0 (0.0%) | 0 (0.0%) |
| Total | 67 (94.4%) | 0 (0.0%) |
Race in Lazy Lake
The most populous races in Lazy Lake are , and White / Caucasian (143 | 100.0%).
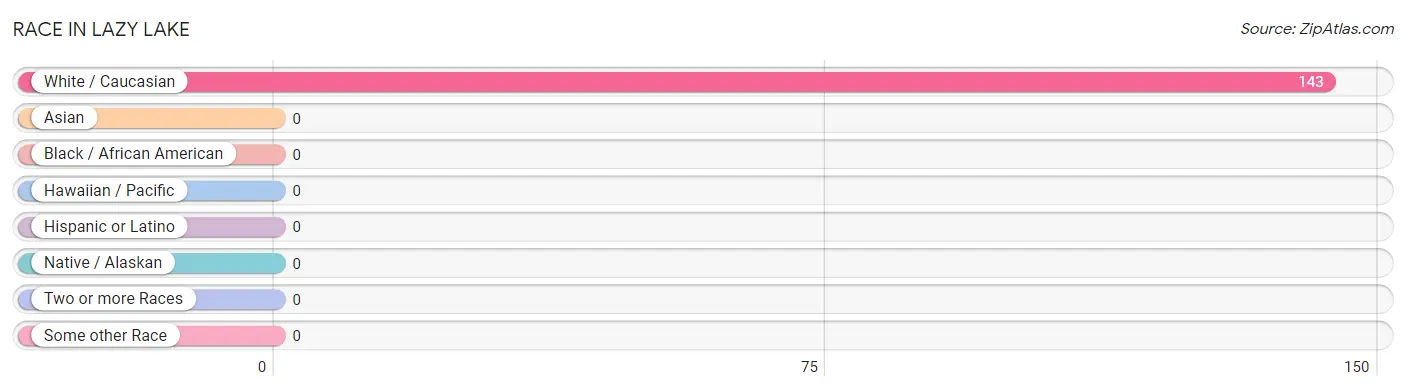
| Race | # Population | % Population |
| Asian | 0 | 0.0% |
| Black / African American | 0 | 0.0% |
| Hawaiian / Pacific | 0 | 0.0% |
| Hispanic or Latino | 0 | 0.0% |
| Native / Alaskan | 0 | 0.0% |
| White / Caucasian | 143 | 100.0% |
| Two or more Races | 0 | 0.0% |
| Some other Race | 0 | 0.0% |
| Total | 143 | 100.0% |
Ancestry in Lazy Lake
The most populous ancestries reported in Lazy Lake are Greek (133 | 93.0%), Italian (66 | 46.2%), English (7 | 4.9%), Polish (3 | 2.1%), and French (2 | 1.4%), together accounting for 147.6% of all Lazy Lake residents.
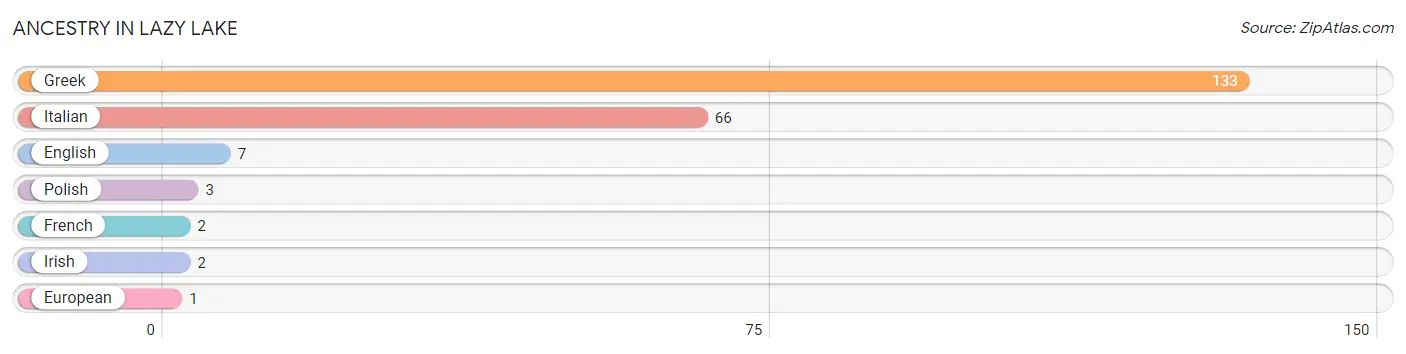
| Ancestry | # Population | % Population |
| English | 7 | 4.9% |
| European | 1 | 0.7% |
| French | 2 | 1.4% |
| Greek | 133 | 93.0% |
| Irish | 2 | 1.4% |
| Italian | 66 | 46.2% |
| Polish | 3 | 2.1% | View All 7 Rows |
Immigrants in Lazy Lake

| Immigration Origin | # Population | % Population | View All 0 Rows |
Sex and Age in Lazy Lake
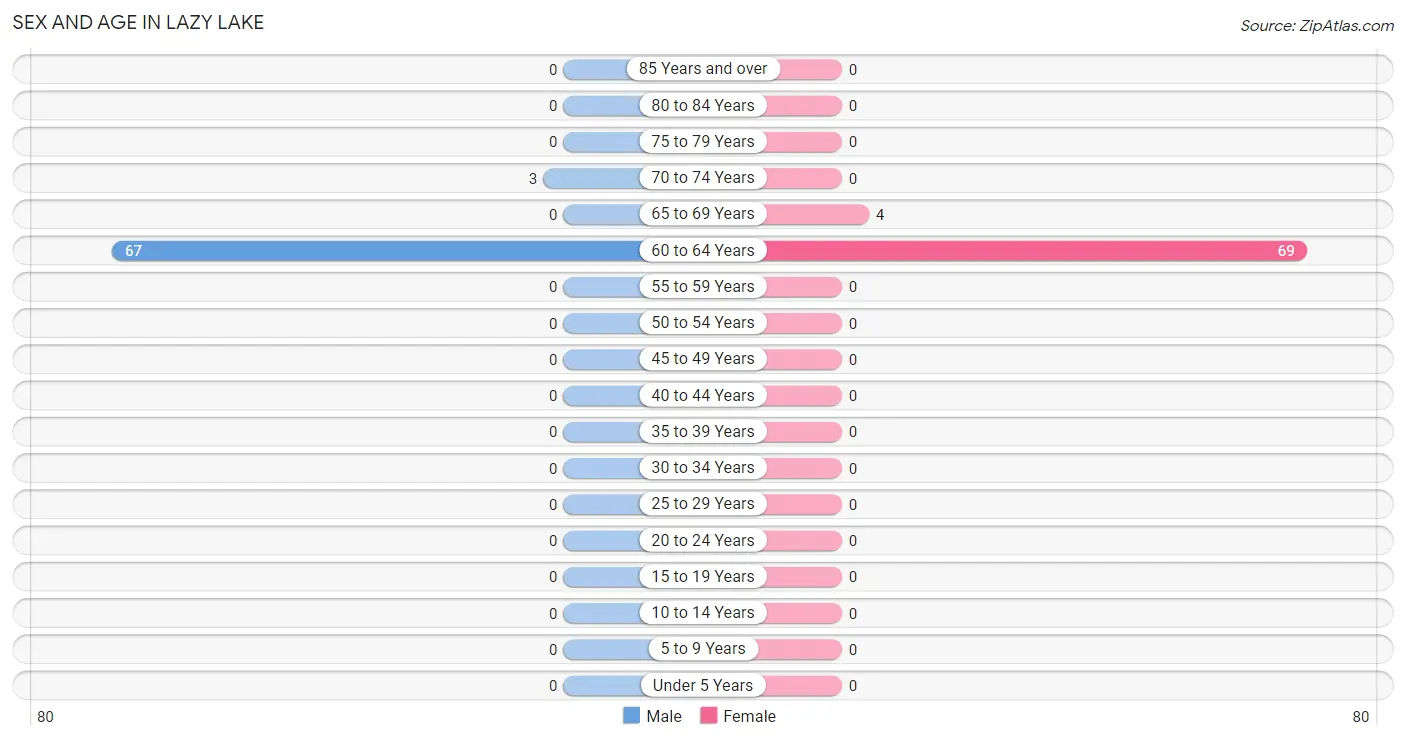
Sex and Age in Lazy Lake
The most populous age groups in Lazy Lake are 60 to 64 Years (67 | 95.7%) for men and 60 to 64 Years (69 | 94.5%) for women.
| Age Bracket | Male | Female |
| Under 5 Years | 0 (0.0%) | 0 (0.0%) |
| 5 to 9 Years | 0 (0.0%) | 0 (0.0%) |
| 10 to 14 Years | 0 (0.0%) | 0 (0.0%) |
| 15 to 19 Years | 0 (0.0%) | 0 (0.0%) |
| 20 to 24 Years | 0 (0.0%) | 0 (0.0%) |
| 25 to 29 Years | 0 (0.0%) | 0 (0.0%) |
| 30 to 34 Years | 0 (0.0%) | 0 (0.0%) |
| 35 to 39 Years | 0 (0.0%) | 0 (0.0%) |
| 40 to 44 Years | 0 (0.0%) | 0 (0.0%) |
| 45 to 49 Years | 0 (0.0%) | 0 (0.0%) |
| 50 to 54 Years | 0 (0.0%) | 0 (0.0%) |
| 55 to 59 Years | 0 (0.0%) | 0 (0.0%) |
| 60 to 64 Years | 67 (95.7%) | 69 (94.5%) |
| 65 to 69 Years | 0 (0.0%) | 4 (5.5%) |
| 70 to 74 Years | 3 (4.3%) | 0 (0.0%) |
| 75 to 79 Years | 0 (0.0%) | 0 (0.0%) |
| 80 to 84 Years | 0 (0.0%) | 0 (0.0%) |
| 85 Years and over | 0 (0.0%) | 0 (0.0%) |
| Total | 70 (100.0%) | 73 (100.0%) |
Families and Households in Lazy Lake
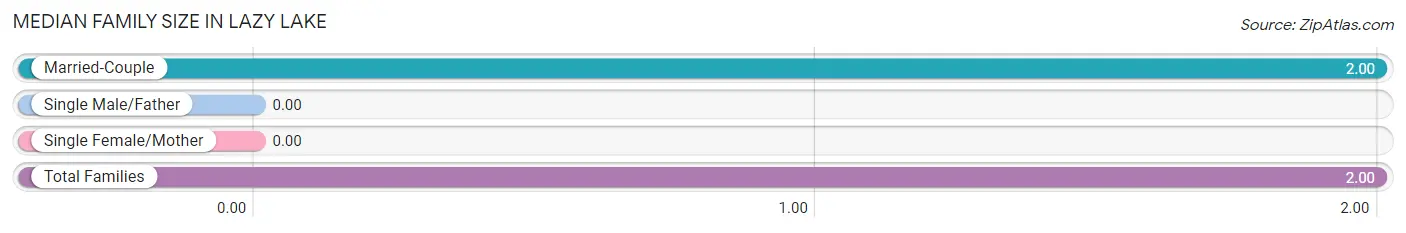
Median Family Size in Lazy Lake
| Family Type | # Families | Family Size |
| Married-Couple | 71 (100.0%) | 2.00 |
| Single Male/Father | 0 (0.0%) | - |
| Single Female/Mother | 0 (0.0%) | - |
| Total Families | 71 (100.0%) | 2.00 |
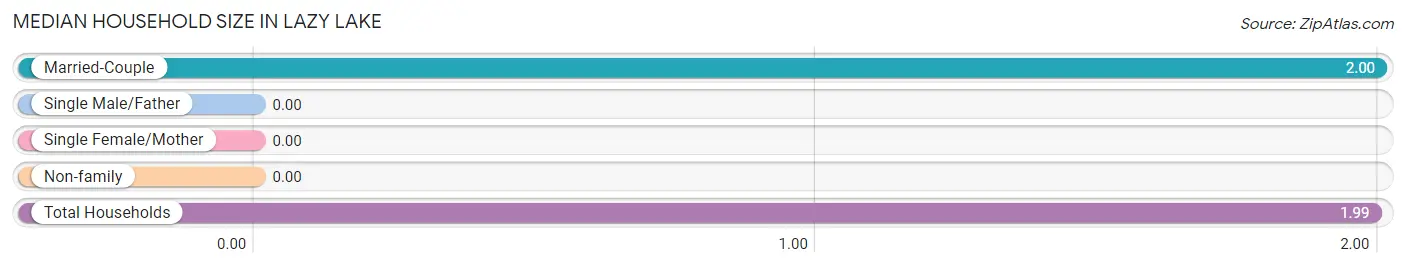
Median Household Size in Lazy Lake
| Household Type | # Households | Household Size |
| Married-Couple | 71 (98.6%) | 2.00 |
| Single Male/Father | 0 (0.0%) | - |
| Single Female/Mother | 0 (0.0%) | - |
| Non-family | 1 (1.4%) | - |
| Total Households | 72 (100.0%) | 1.99 |
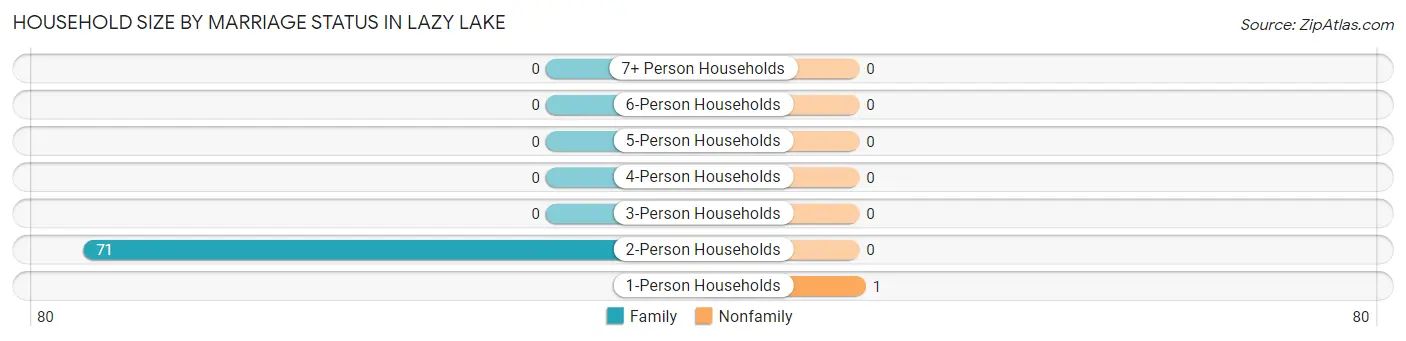
Household Size by Marriage Status in Lazy Lake
Out of a total of 72 households in Lazy Lake, 71 (98.6%) are family households, while 1 (1.4%) are nonfamily households. The most numerous type of family households are 2-person households, comprising 71, and the most common type of nonfamily households are 1-person households, comprising 1.
| Household Size | Family Households | Nonfamily Households |
| 1-Person Households | - | 1 (1.4%) |
| 2-Person Households | 71 (98.6%) | 0 (0.0%) |
| 3-Person Households | 0 (0.0%) | 0 (0.0%) |
| 4-Person Households | 0 (0.0%) | 0 (0.0%) |
| 5-Person Households | 0 (0.0%) | 0 (0.0%) |
| 6-Person Households | 0 (0.0%) | 0 (0.0%) |
| 7+ Person Households | 0 (0.0%) | 0 (0.0%) |
| Total | 71 (98.6%) | 1 (1.4%) |
Female Fertility in Lazy Lake
Fertility by Age in Lazy Lake
| Age Bracket | Women with Births | Births / 1,000 Women |
| 15 to 19 years | 0 (0.0%) | 0.0 |
| 20 to 34 years | 0 (0.0%) | 0.0 |
| 35 to 50 years | 0 (0.0%) | 0.0 |
| Total | 0 (0.0%) | 0.0 |
Fertility by Age by Marriage Status in Lazy Lake
| Age Bracket | Married | Unmarried |
| 15 to 19 years | 0 (0.0%) | 0 (0.0%) |
| 20 to 34 years | 0 (0.0%) | 0 (0.0%) |
| 35 to 50 years | 0 (0.0%) | 0 (0.0%) |
| Total | 0 (0.0%) | 0 (0.0%) |
Fertility by Education in Lazy Lake
| Educational Attainment | Women with Births | Births / 1,000 Women |
| Less than High School | 0 (0.0%) | 0.0 |
| High School Diploma | 0 (0.0%) | 0.0 |
| College or Associate's Degree | 0 (0.0%) | 0.0 |
| Bachelor's Degree | 0 (0.0%) | 0.0 |
| Graduate Degree | 0 (0.0%) | 0.0 |
| Total | 0 (0.0%) | 0.0 |
Fertility by Education by Marriage Status in Lazy Lake
| Educational Attainment | Married | Unmarried |
| Less than High School | 0 (0.0%) | 0 (0.0%) |
| High School Diploma | 0 (0.0%) | 0 (0.0%) |
| College or Associate's Degree | 0 (0.0%) | 0 (0.0%) |
| Bachelor's Degree | 0 (0.0%) | 0 (0.0%) |
| Graduate Degree | 0 (0.0%) | 0 (0.0%) |
| Total | 0 (0.0%) | 0 (0.0%) |
Employment Characteristics in Lazy Lake
Employment by Class of Employer in Lazy Lake
Among the 3 employed individuals in Lazy Lake, , and not-for-profit organizations (3 | 100.0%) make up the most common classes of employment.
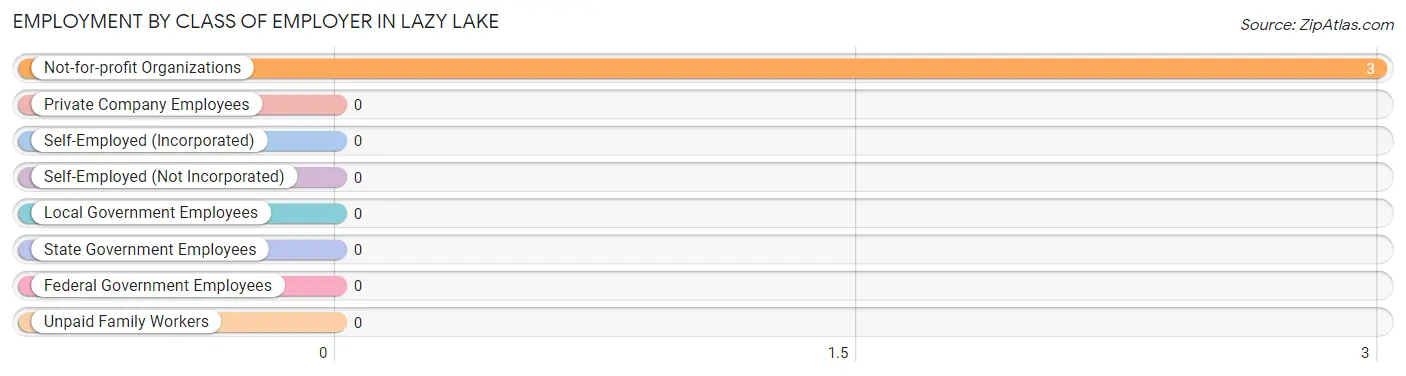
| Employer Class | # Employees | % Employees |
| Private Company Employees | 0 | 0.0% |
| Self-Employed (Incorporated) | 0 | 0.0% |
| Self-Employed (Not Incorporated) | 0 | 0.0% |
| Not-for-profit Organizations | 3 | 100.0% |
| Local Government Employees | 0 | 0.0% |
| State Government Employees | 0 | 0.0% |
| Federal Government Employees | 0 | 0.0% |
| Unpaid Family Workers | 0 | 0.0% |
| Total | 3 | 100.0% |
Employment Status by Age in Lazy Lake
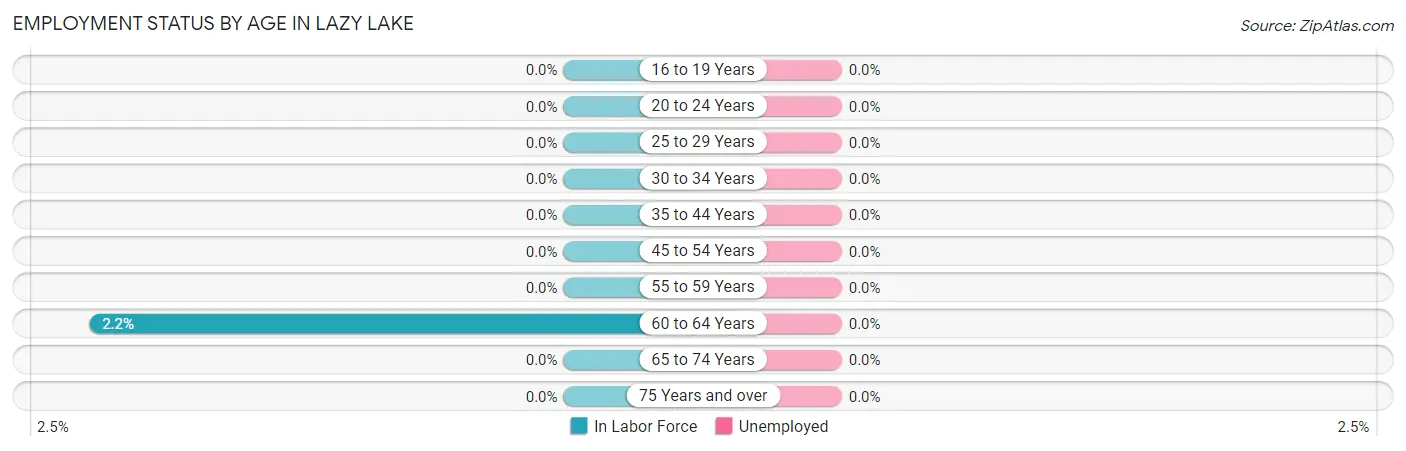
| Age Bracket | In Labor Force | Unemployed |
| 16 to 19 Years | 0 (0.0%) | 0 (0.0%) |
| 20 to 24 Years | 0 (0.0%) | 0 (0.0%) |
| 25 to 29 Years | 0 (0.0%) | 0 (0.0%) |
| 30 to 34 Years | 0 (0.0%) | 0 (0.0%) |
| 35 to 44 Years | 0 (0.0%) | 0 (0.0%) |
| 45 to 54 Years | 0 (0.0%) | 0 (0.0%) |
| 55 to 59 Years | 0 (0.0%) | 0 (0.0%) |
| 60 to 64 Years | 3 (2.2%) | 0 (0.0%) |
| 65 to 74 Years | 0 (0.0%) | 0 (0.0%) |
| 75 Years and over | 0 (0.0%) | 0 (0.0%) |
| Total | 3 (2.1%) | 0 (0.0%) |
Employment Status by Educational Attainment in Lazy Lake
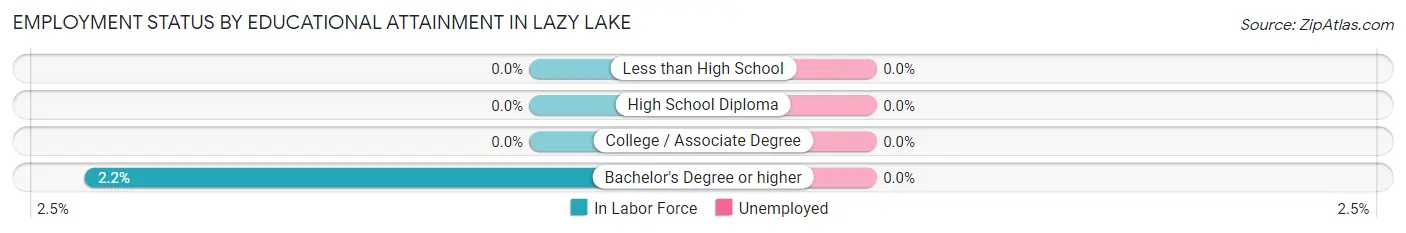
| Educational Attainment | In Labor Force | Unemployed |
| Less than High School | 0 (0.0%) | 0 (0.0%) |
| High School Diploma | 0 (0.0%) | 0 (0.0%) |
| College / Associate Degree | 0 (0.0%) | 0 (0.0%) |
| Bachelor's Degree or higher | 3 (2.2%) | 0 (0.0%) |
| Total | 3 (2.2%) | 0 (0.0%) |
Employment Occupations by Sex in Lazy Lake
Management, Business, Science and Arts Occupations
The most common Management, Business, Science and Arts occupations in Lazy Lake are Community & Social Service (3 | 100.0%), and Education Instruction & Library (3 | 100.0%).
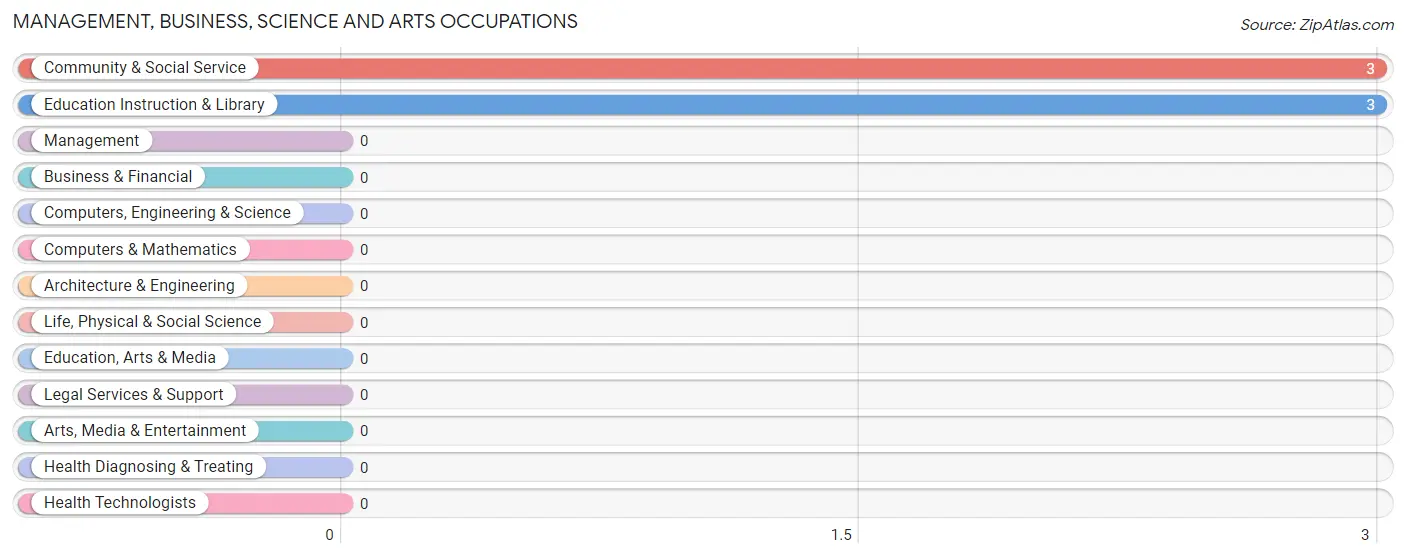
Management, Business, Science and Arts Occupations by Sex
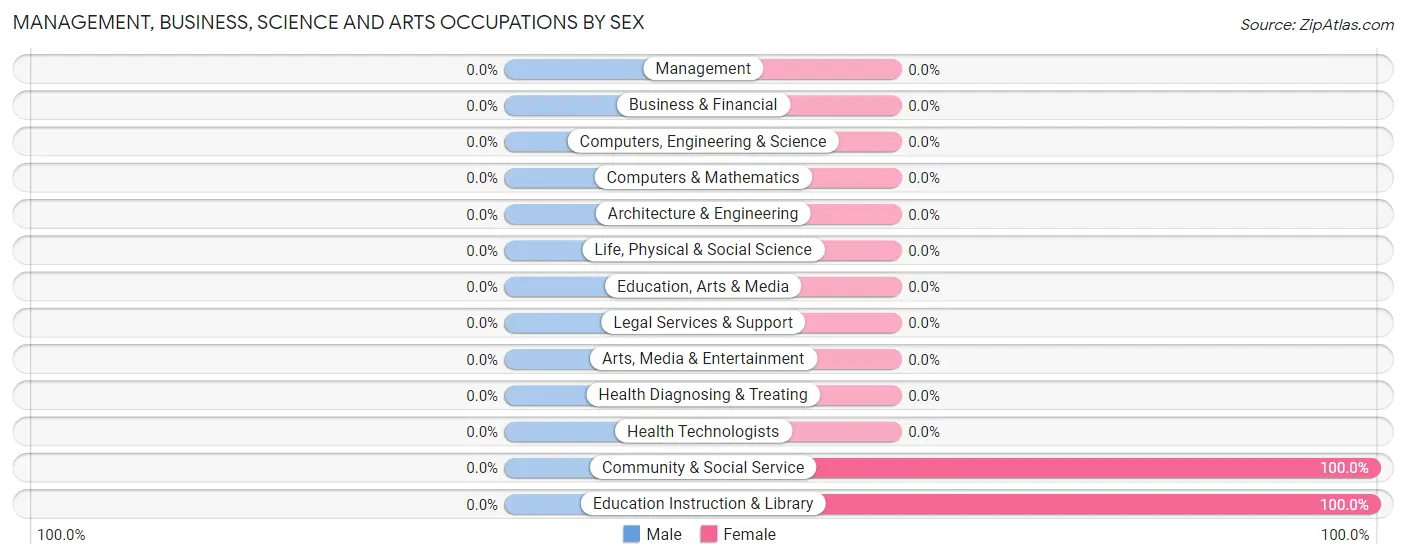
| Occupation | Male | Female |
| Management | 0 (0.0%) | 0 (0.0%) |
| Business & Financial | 0 (0.0%) | 0 (0.0%) |
| Computers, Engineering & Science | 0 (0.0%) | 0 (0.0%) |
| Computers & Mathematics | 0 (0.0%) | 0 (0.0%) |
| Architecture & Engineering | 0 (0.0%) | 0 (0.0%) |
| Life, Physical & Social Science | 0 (0.0%) | 0 (0.0%) |
| Community & Social Service | 0 (0.0%) | 3 (100.0%) |
| Education, Arts & Media | 0 (0.0%) | 0 (0.0%) |
| Legal Services & Support | 0 (0.0%) | 0 (0.0%) |
| Education Instruction & Library | 0 (0.0%) | 3 (100.0%) |
| Arts, Media & Entertainment | 0 (0.0%) | 0 (0.0%) |
| Health Diagnosing & Treating | 0 (0.0%) | 0 (0.0%) |
| Health Technologists | 0 (0.0%) | 0 (0.0%) |
| Total (Category) | 0 (0.0%) | 3 (100.0%) |
| Total (Overall) | 0 (0.0%) | 3 (100.0%) |
Services Occupations
Services Occupations by Sex
| Occupation | Male | Female |
| Healthcare Support | 0 (0.0%) | 0 (0.0%) |
| Security & Protection | 0 (0.0%) | 0 (0.0%) |
| Firefighting & Prevention | 0 (0.0%) | 0 (0.0%) |
| Law Enforcement | 0 (0.0%) | 0 (0.0%) |
| Food Preparation & Serving | 0 (0.0%) | 0 (0.0%) |
| Cleaning & Maintenance | 0 (0.0%) | 0 (0.0%) |
| Personal Care & Service | 0 (0.0%) | 0 (0.0%) |
| Total (Category) | 0 (0.0%) | 0 (0.0%) |
| Total (Overall) | 0 (0.0%) | 3 (100.0%) |
Sales and Office Occupations
Sales and Office Occupations by Sex
| Occupation | Male | Female |
| Sales & Related | 0 (0.0%) | 0 (0.0%) |
| Office & Administration | 0 (0.0%) | 0 (0.0%) |
| Total (Category) | 0 (0.0%) | 0 (0.0%) |
| Total (Overall) | 0 (0.0%) | 3 (100.0%) |
Natural Resources, Construction and Maintenance Occupations
Natural Resources, Construction and Maintenance Occupations by Sex
| Occupation | Male | Female |
| Farming, Fishing & Forestry | 0 (0.0%) | 0 (0.0%) |
| Construction & Extraction | 0 (0.0%) | 0 (0.0%) |
| Installation, Maintenance & Repair | 0 (0.0%) | 0 (0.0%) |
| Total (Category) | 0 (0.0%) | 0 (0.0%) |
| Total (Overall) | 0 (0.0%) | 3 (100.0%) |
Production, Transportation and Moving Occupations
Production, Transportation and Moving Occupations by Sex
| Occupation | Male | Female |
| Production | 0 (0.0%) | 0 (0.0%) |
| Transportation | 0 (0.0%) | 0 (0.0%) |
| Material Moving | 0 (0.0%) | 0 (0.0%) |
| Total (Category) | 0 (0.0%) | 0 (0.0%) |
| Total (Overall) | 0 (0.0%) | 3 (100.0%) |
Employment Industries by Sex in Lazy Lake
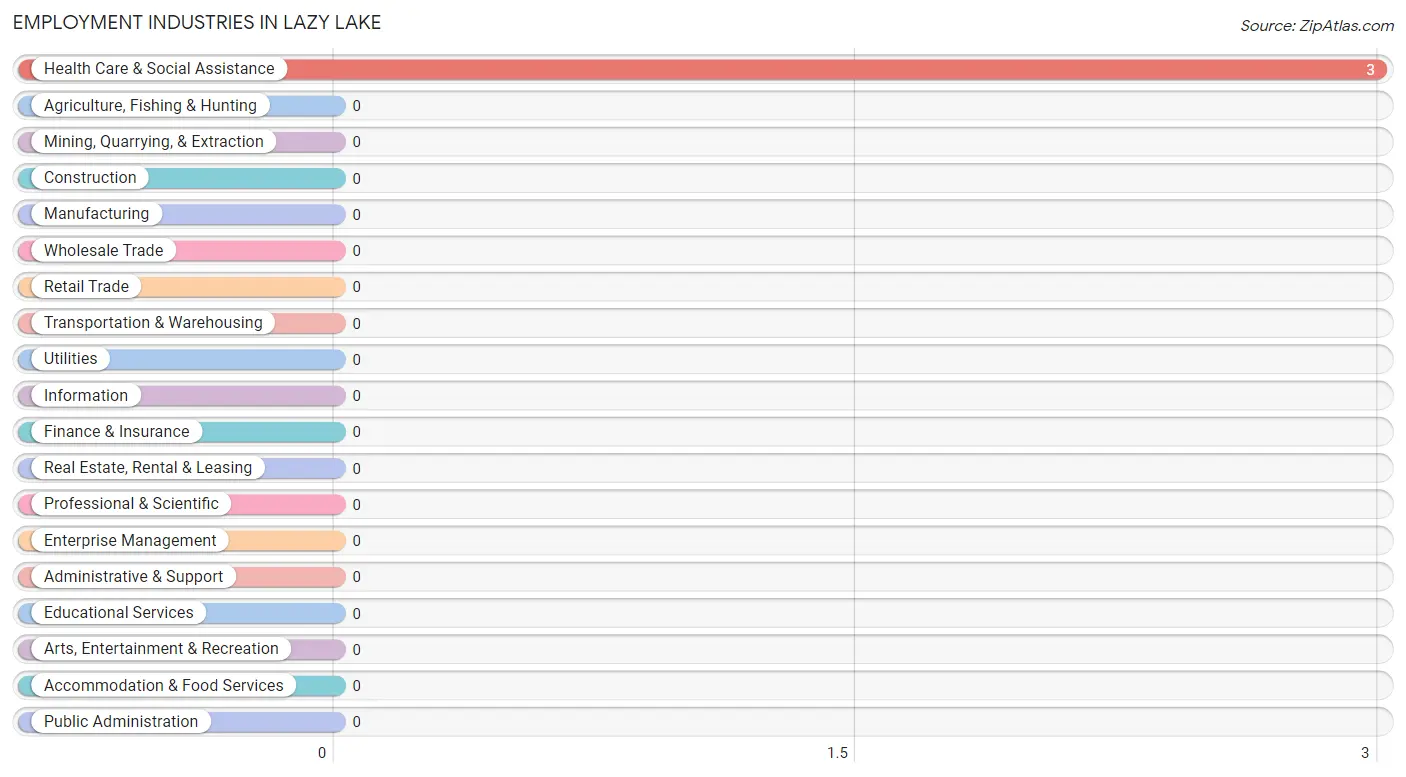
Employment Industries in Lazy Lake
The major employment industries in Lazy Lake include , and Health Care & Social Assistance (3 | 100.0%).
Employment Industries by Sex in Lazy Lake
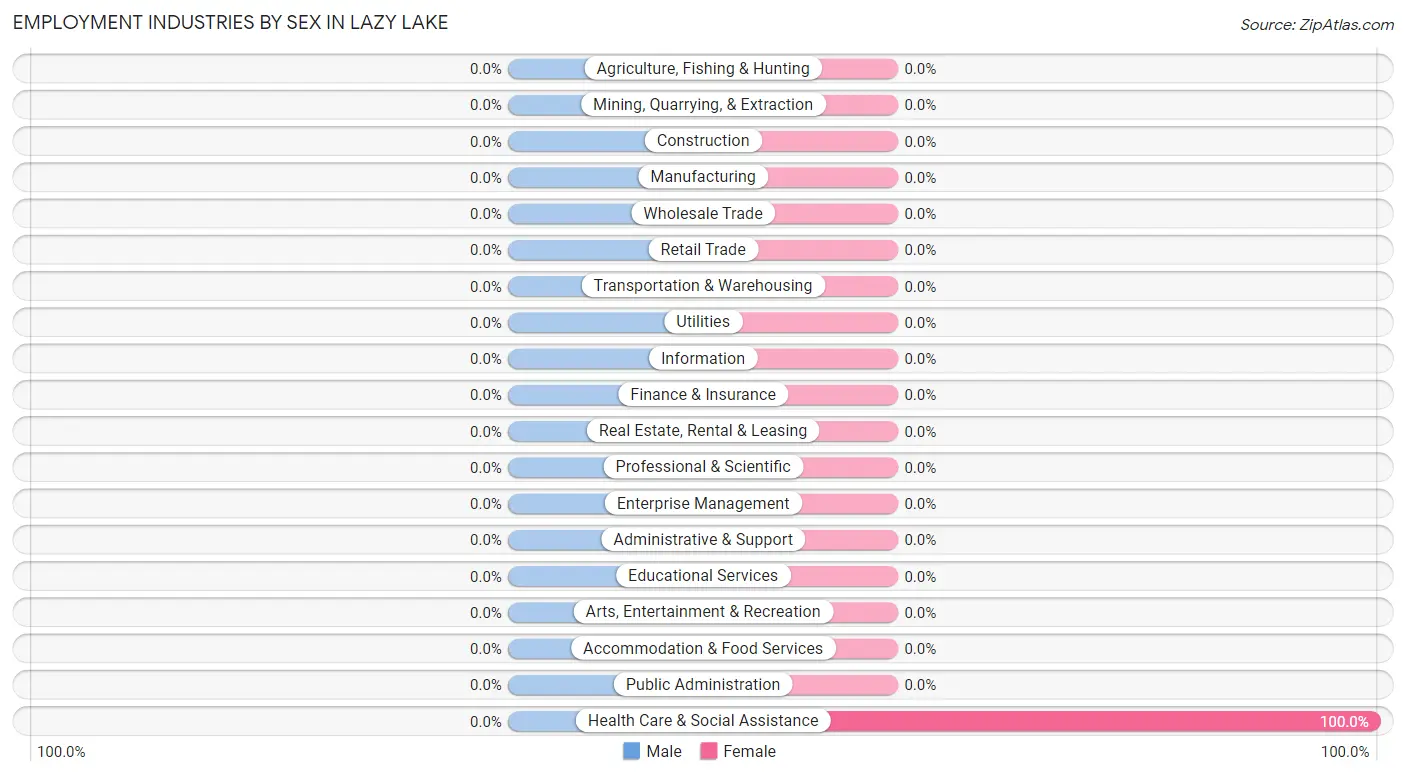
| Industry | Male | Female |
| Agriculture, Fishing & Hunting | 0 (0.0%) | 0 (0.0%) |
| Mining, Quarrying, & Extraction | 0 (0.0%) | 0 (0.0%) |
| Construction | 0 (0.0%) | 0 (0.0%) |
| Manufacturing | 0 (0.0%) | 0 (0.0%) |
| Wholesale Trade | 0 (0.0%) | 0 (0.0%) |
| Retail Trade | 0 (0.0%) | 0 (0.0%) |
| Transportation & Warehousing | 0 (0.0%) | 0 (0.0%) |
| Utilities | 0 (0.0%) | 0 (0.0%) |
| Information | 0 (0.0%) | 0 (0.0%) |
| Finance & Insurance | 0 (0.0%) | 0 (0.0%) |
| Real Estate, Rental & Leasing | 0 (0.0%) | 0 (0.0%) |
| Professional & Scientific | 0 (0.0%) | 0 (0.0%) |
| Enterprise Management | 0 (0.0%) | 0 (0.0%) |
| Administrative & Support | 0 (0.0%) | 0 (0.0%) |
| Educational Services | 0 (0.0%) | 0 (0.0%) |
| Health Care & Social Assistance | 0 (0.0%) | 3 (100.0%) |
| Arts, Entertainment & Recreation | 0 (0.0%) | 0 (0.0%) |
| Accommodation & Food Services | 0 (0.0%) | 0 (0.0%) |
| Public Administration | 0 (0.0%) | 0 (0.0%) |
| Total | 0 (0.0%) | 3 (100.0%) |
Education in Lazy Lake
School Enrollment in Lazy Lake
| School Level | # Students | % Students |
| Nursery / Preschool | 0 | 0.0% |
| Kindergarten | 0 | 0.0% |
| Elementary School | 0 | 0.0% |
| Middle School | 0 | 0.0% |
| High School | 0 | 0.0% |
| College / Undergraduate | 0 | 0.0% |
| Graduate / Professional | 0 | 0.0% |
| Total | 0 | 0.0% |
School Enrollment by Age by Funding Source in Lazy Lake
| Age Bracket | Public School | Private School |
| 3 to 4 Year Olds | 0 (0.0%) | 0 (0.0%) |
| 5 to 9 Year Old | 0 (0.0%) | 0 (0.0%) |
| 10 to 14 Year Olds | 0 (0.0%) | 0 (0.0%) |
| 15 to 17 Year Olds | 0 (0.0%) | 0 (0.0%) |
| 18 to 19 Year Olds | 0 (0.0%) | 0 (0.0%) |
| 20 to 24 Year Olds | 0 (0.0%) | 0 (0.0%) |
| 25 to 34 Year Olds | 0 (0.0%) | 0 (0.0%) |
| 35 Years and over | 0 (0.0%) | 0 (0.0%) |
| Total | 0 (0.0%) | 0 (0.0%) |
Educational Attainment by Field of Study in Lazy Lake
Science & technology (133 | 48.9%), physical & health sciences (67 | 24.6%), bio, nature & agricultural (66 | 24.3%), visual & performing arts (3 | 1.1%), and business (2 | 0.7%) are the most common fields of study among 272 individuals in Lazy Lake who have obtained a bachelor's degree or higher.
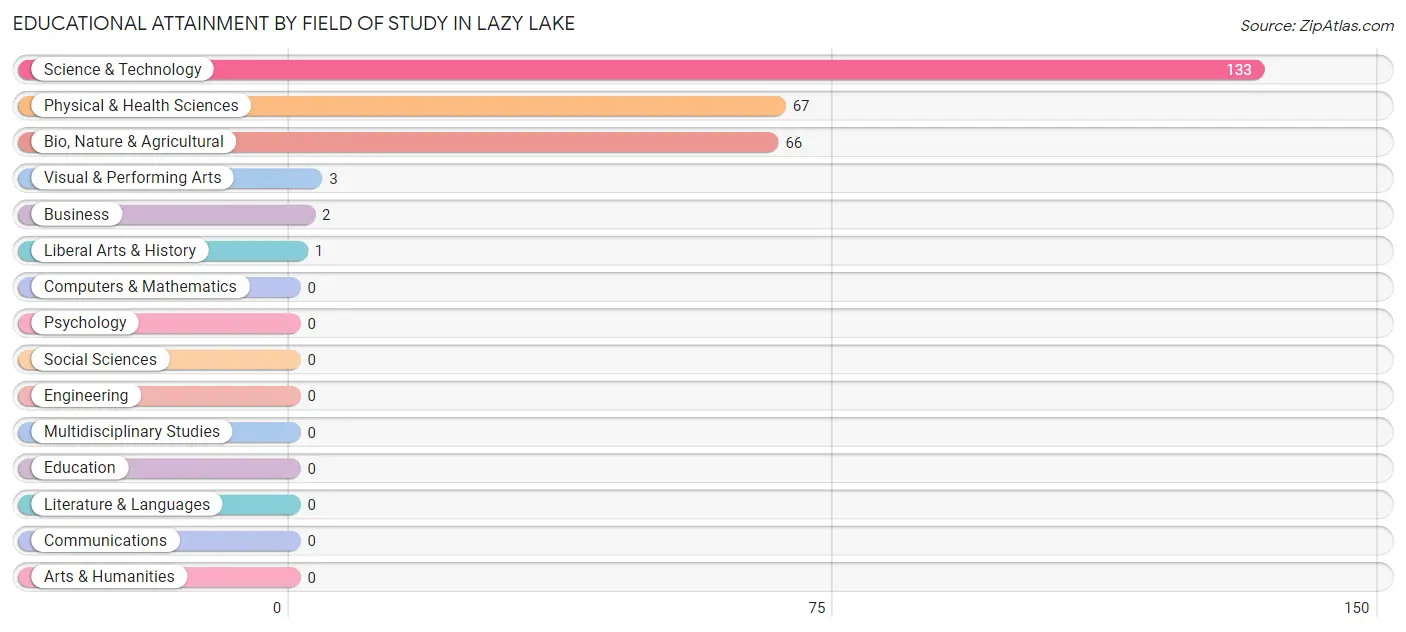
| Field of Study | # Graduates | % Graduates |
| Computers & Mathematics | 0 | 0.0% |
| Bio, Nature & Agricultural | 66 | 24.3% |
| Physical & Health Sciences | 67 | 24.6% |
| Psychology | 0 | 0.0% |
| Social Sciences | 0 | 0.0% |
| Engineering | 0 | 0.0% |
| Multidisciplinary Studies | 0 | 0.0% |
| Science & Technology | 133 | 48.9% |
| Business | 2 | 0.7% |
| Education | 0 | 0.0% |
| Literature & Languages | 0 | 0.0% |
| Liberal Arts & History | 1 | 0.4% |
| Visual & Performing Arts | 3 | 1.1% |
| Communications | 0 | 0.0% |
| Arts & Humanities | 0 | 0.0% |
| Total | 272 | 100.0% |
Transportation & Commute in Lazy Lake
Vehicle Availability by Sex in Lazy Lake
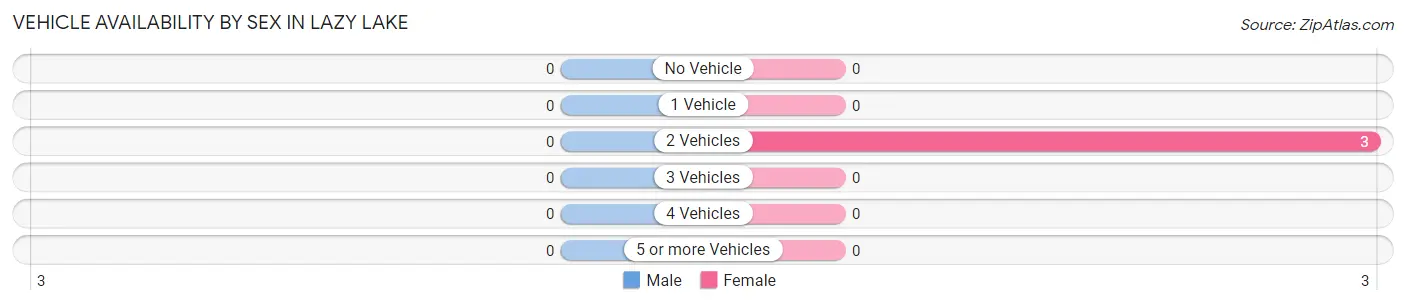
| Vehicles Available | Male | Female |
| No Vehicle | 0 (0.0%) | 0 (0.0%) |
| 1 Vehicle | 0 (0.0%) | 0 (0.0%) |
| 2 Vehicles | 0 (0.0%) | 3 (100.0%) |
| 3 Vehicles | 0 (0.0%) | 0 (0.0%) |
| 4 Vehicles | 0 (0.0%) | 0 (0.0%) |
| 5 or more Vehicles | 0 (0.0%) | 0 (0.0%) |
| Total | 0 (0.0%) | 3 (100.0%) |
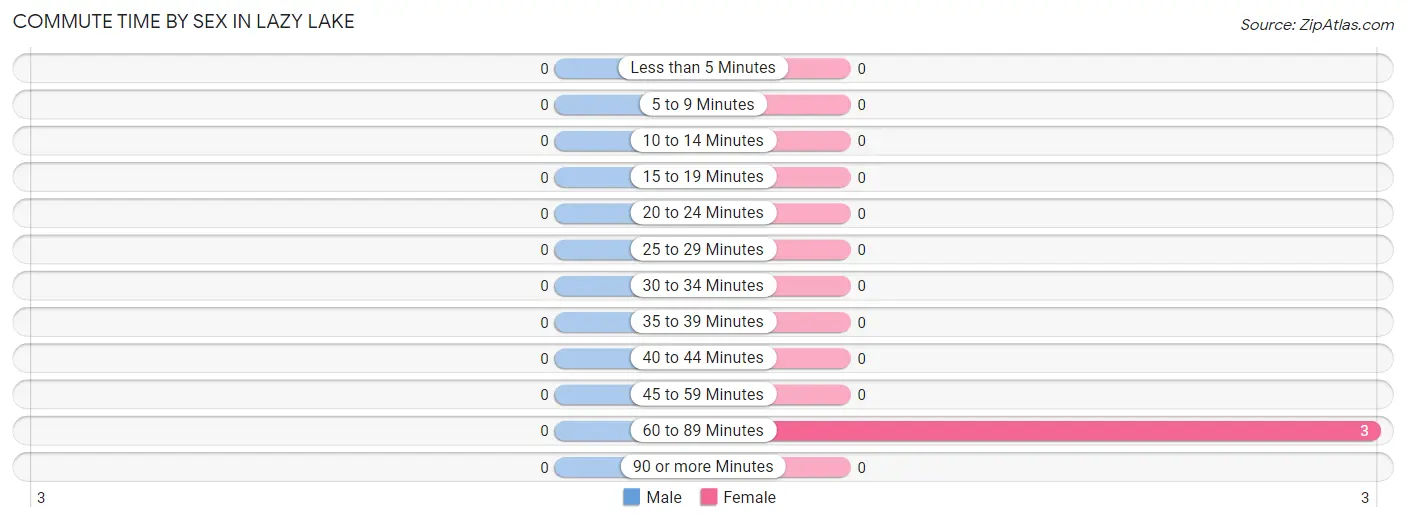
Commute Time in Lazy Lake
The most frequently occuring commute durations in Lazy Lake are 60 to 89 minutes (3 commuters, 100.0%), less than 5 minutes (0 commuters, 0.0%), and 5 to 9 minutes (0 commuters, 0.0%).
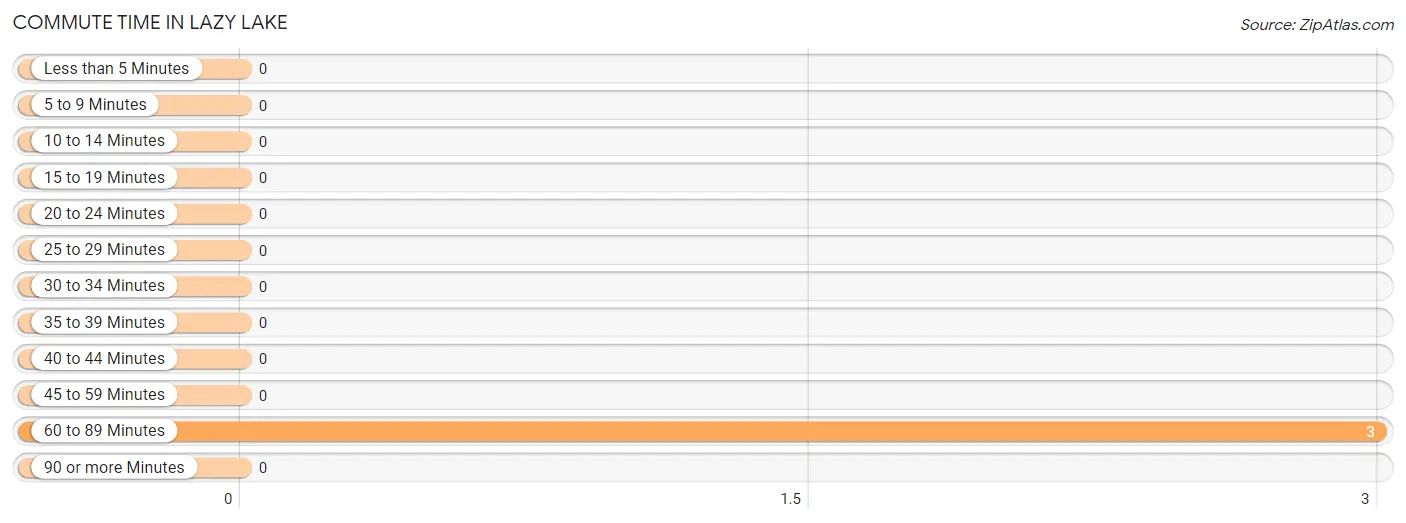
| Commute Time | # Commuters | % Commuters |
| Less than 5 Minutes | 0 | 0.0% |
| 5 to 9 Minutes | 0 | 0.0% |
| 10 to 14 Minutes | 0 | 0.0% |
| 15 to 19 Minutes | 0 | 0.0% |
| 20 to 24 Minutes | 0 | 0.0% |
| 25 to 29 Minutes | 0 | 0.0% |
| 30 to 34 Minutes | 0 | 0.0% |
| 35 to 39 Minutes | 0 | 0.0% |
| 40 to 44 Minutes | 0 | 0.0% |
| 45 to 59 Minutes | 0 | 0.0% |
| 60 to 89 Minutes | 3 | 100.0% |
| 90 or more Minutes | 0 | 0.0% |
Commute Time by Sex in Lazy Lake
| Commute Time | Male | Female |
| Less than 5 Minutes | 0 (0.0%) | 0 (0.0%) |
| 5 to 9 Minutes | 0 (0.0%) | 0 (0.0%) |
| 10 to 14 Minutes | 0 (0.0%) | 0 (0.0%) |
| 15 to 19 Minutes | 0 (0.0%) | 0 (0.0%) |
| 20 to 24 Minutes | 0 (0.0%) | 0 (0.0%) |
| 25 to 29 Minutes | 0 (0.0%) | 0 (0.0%) |
| 30 to 34 Minutes | 0 (0.0%) | 0 (0.0%) |
| 35 to 39 Minutes | 0 (0.0%) | 0 (0.0%) |
| 40 to 44 Minutes | 0 (0.0%) | 0 (0.0%) |
| 45 to 59 Minutes | 0 (0.0%) | 0 (0.0%) |
| 60 to 89 Minutes | 0 (0.0%) | 3 (100.0%) |
| 90 or more Minutes | 0 (0.0%) | 0 (0.0%) |
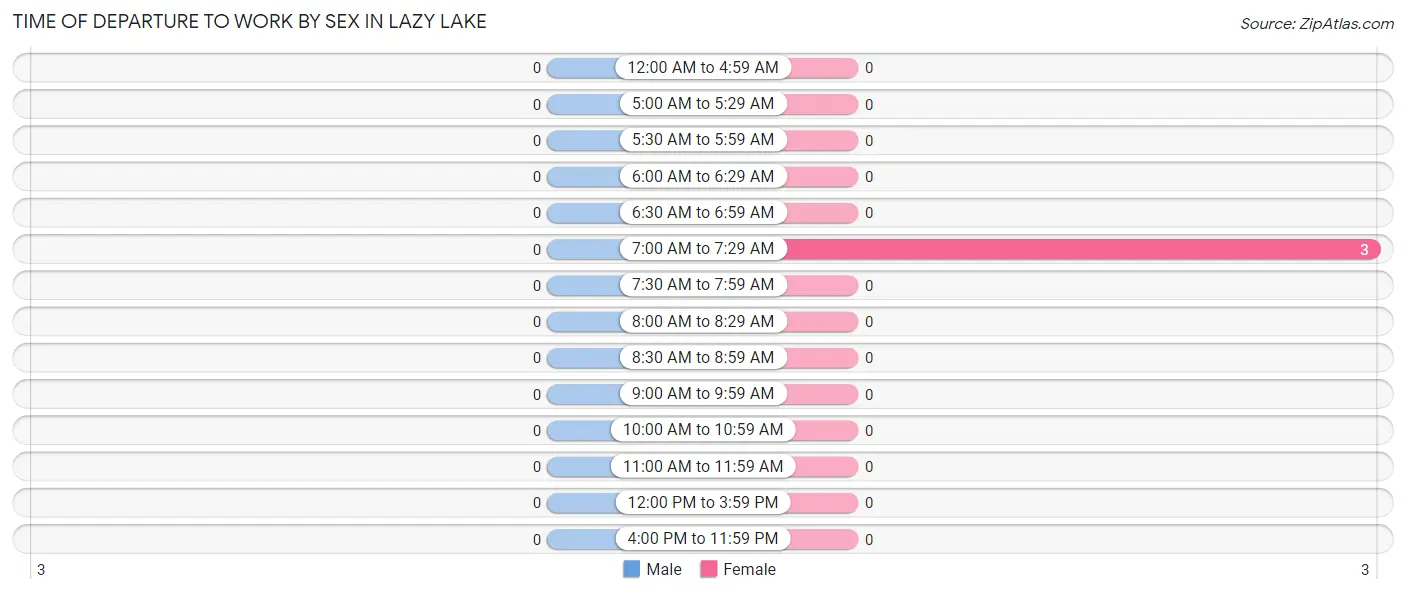
Time of Departure to Work by Sex in Lazy Lake
| Time of Departure | Male | Female |
| 12:00 AM to 4:59 AM | 0 (0.0%) | 0 (0.0%) |
| 5:00 AM to 5:29 AM | 0 (0.0%) | 0 (0.0%) |
| 5:30 AM to 5:59 AM | 0 (0.0%) | 0 (0.0%) |
| 6:00 AM to 6:29 AM | 0 (0.0%) | 0 (0.0%) |
| 6:30 AM to 6:59 AM | 0 (0.0%) | 0 (0.0%) |
| 7:00 AM to 7:29 AM | 0 (0.0%) | 3 (100.0%) |
| 7:30 AM to 7:59 AM | 0 (0.0%) | 0 (0.0%) |
| 8:00 AM to 8:29 AM | 0 (0.0%) | 0 (0.0%) |
| 8:30 AM to 8:59 AM | 0 (0.0%) | 0 (0.0%) |
| 9:00 AM to 9:59 AM | 0 (0.0%) | 0 (0.0%) |
| 10:00 AM to 10:59 AM | 0 (0.0%) | 0 (0.0%) |
| 11:00 AM to 11:59 AM | 0 (0.0%) | 0 (0.0%) |
| 12:00 PM to 3:59 PM | 0 (0.0%) | 0 (0.0%) |
| 4:00 PM to 11:59 PM | 0 (0.0%) | 0 (0.0%) |
| Total | 0 (0.0%) | 3 (100.0%) |
Housing Occupancy in Lazy Lake
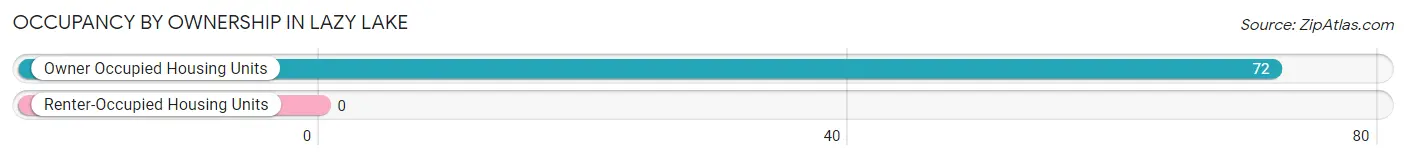
Occupancy by Ownership in Lazy Lake
Of the total 72 dwellings in Lazy Lake, owner-occupied units account for 72 (100.0%), while renter-occupied units make up 0 (0.0%).
| Occupancy | # Housing Units | % Housing Units |
| Owner Occupied Housing Units | 72 | 100.0% |
| Renter-Occupied Housing Units | 0 | 0.0% |
| Total Occupied Housing Units | 72 | 100.0% |
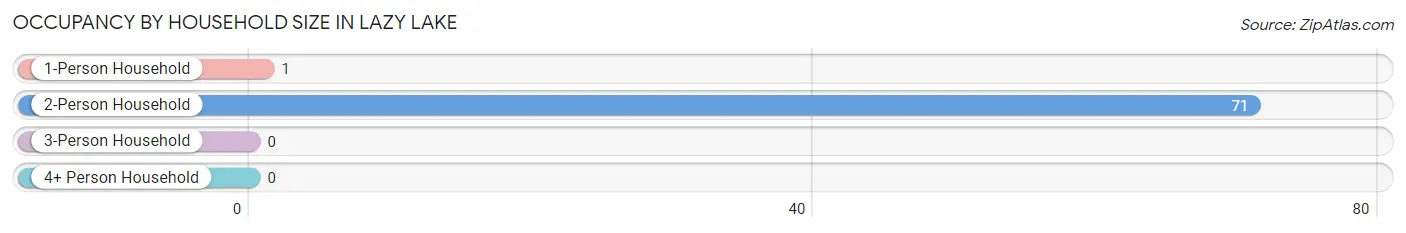
Occupancy by Household Size in Lazy Lake
| Household Size | # Housing Units | % Housing Units |
| 1-Person Household | 1 | 1.4% |
| 2-Person Household | 71 | 98.6% |
| 3-Person Household | 0 | 0.0% |
| 4+ Person Household | 0 | 0.0% |
| Total Housing Units | 72 | 100.0% |
Occupancy by Ownership by Household Size in Lazy Lake
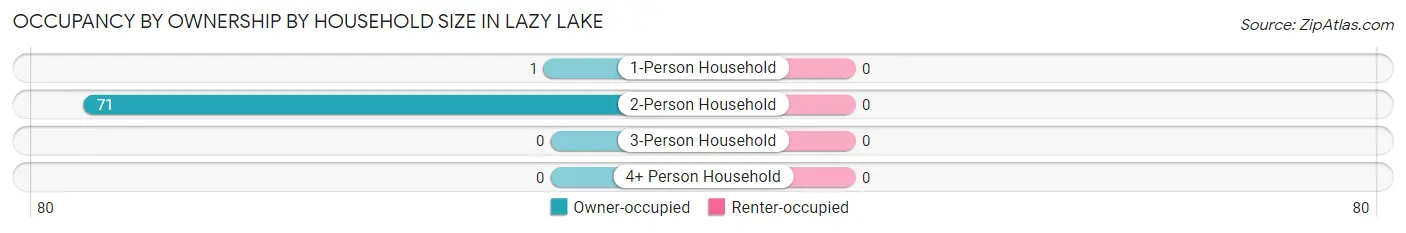
| Household Size | Owner-occupied | Renter-occupied |
| 1-Person Household | 1 (100.0%) | 0 (0.0%) |
| 2-Person Household | 71 (100.0%) | 0 (0.0%) |
| 3-Person Household | 0 (0.0%) | 0 (0.0%) |
| 4+ Person Household | 0 (0.0%) | 0 (0.0%) |
| Total Housing Units | 72 (100.0%) | 0 (0.0%) |
Occupancy by Educational Attainment in Lazy Lake
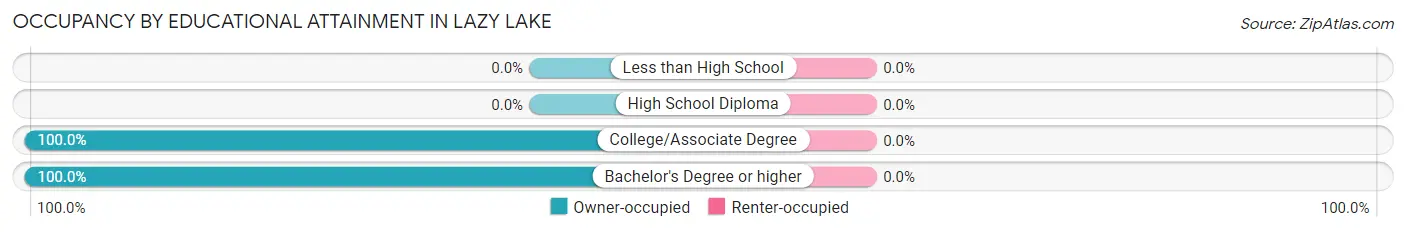
| Household Size | Owner-occupied | Renter-occupied |
| Less than High School | 0 (0.0%) | 0 (0.0%) |
| High School Diploma | 0 (0.0%) | 0 (0.0%) |
| College/Associate Degree | 2 (100.0%) | 0 (0.0%) |
| Bachelor's Degree or higher | 70 (100.0%) | 0 (0.0%) |
Occupancy by Age of Householder in Lazy Lake
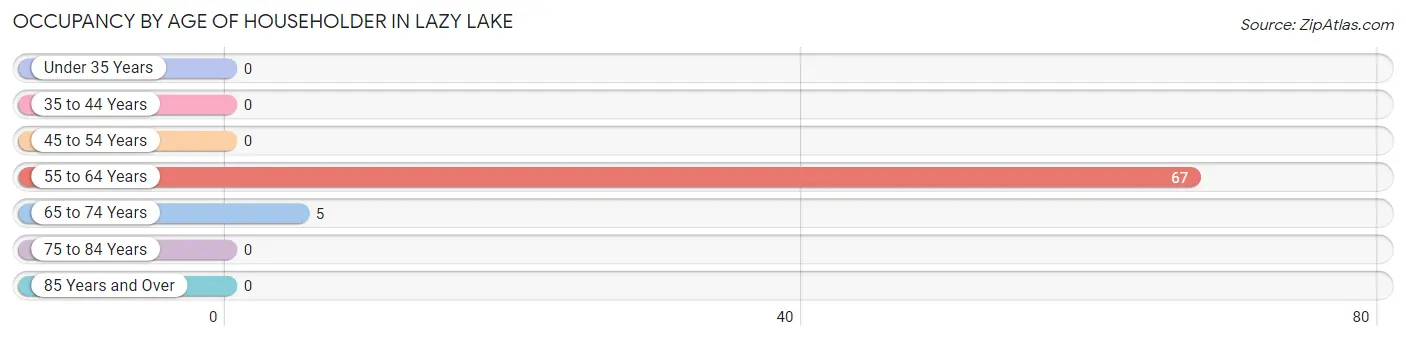
| Age Bracket | # Households | % Households |
| Under 35 Years | 0 | 0.0% |
| 35 to 44 Years | 0 | 0.0% |
| 45 to 54 Years | 0 | 0.0% |
| 55 to 64 Years | 67 | 93.1% |
| 65 to 74 Years | 5 | 6.9% |
| 75 to 84 Years | 0 | 0.0% |
| 85 Years and Over | 0 | 0.0% |
| Total | 72 | 100.0% |
Housing Finances in Lazy Lake
Median Income by Occupancy in Lazy Lake
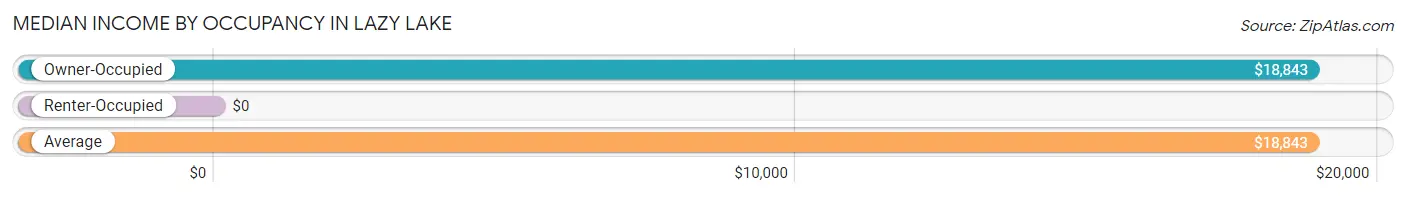
| Occupancy Type | # Households | Median Income |
| Owner-Occupied | 72 (100.0%) | $18,843 |
| Renter-Occupied | 0 (0.0%) | $0 |
| Average | 72 (100.0%) | $18,843 |
Occupancy by Householder Income Bracket in Lazy Lake
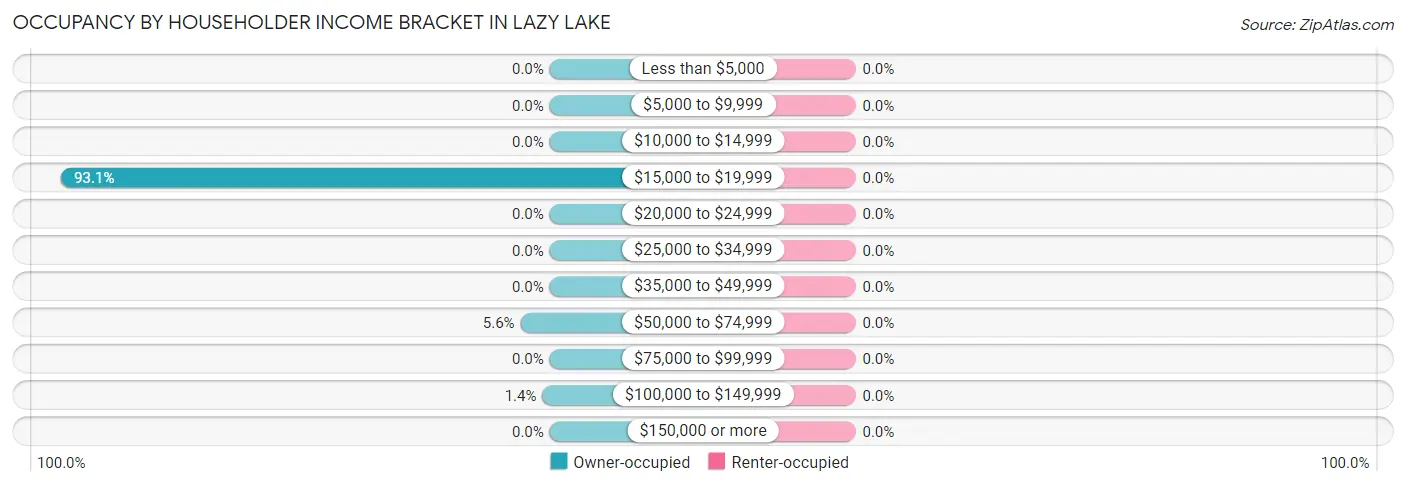
| Income Bracket | Owner-occupied | Renter-occupied |
| Less than $5,000 | 0 (0.0%) | 0 (0.0%) |
| $5,000 to $9,999 | 0 (0.0%) | 0 (0.0%) |
| $10,000 to $14,999 | 0 (0.0%) | 0 (0.0%) |
| $15,000 to $19,999 | 67 (93.1%) | 0 (0.0%) |
| $20,000 to $24,999 | 0 (0.0%) | 0 (0.0%) |
| $25,000 to $34,999 | 0 (0.0%) | 0 (0.0%) |
| $35,000 to $49,999 | 0 (0.0%) | 0 (0.0%) |
| $50,000 to $74,999 | 4 (5.6%) | 0 (0.0%) |
| $75,000 to $99,999 | 0 (0.0%) | 0 (0.0%) |
| $100,000 to $149,999 | 1 (1.4%) | 0 (0.0%) |
| $150,000 or more | 0 (0.0%) | 0 (0.0%) |
| Total | 72 (100.0%) | 0 (0.0%) |
Monthly Housing Cost Tiers in Lazy Lake
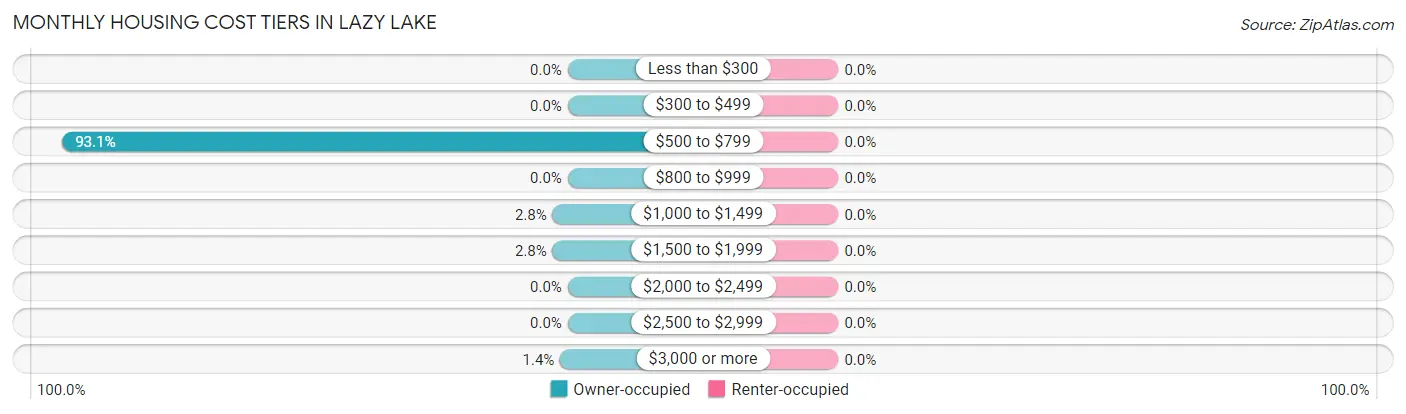
| Monthly Cost | Owner-occupied | Renter-occupied |
| Less than $300 | 0 (0.0%) | 0 (0.0%) |
| $300 to $499 | 0 (0.0%) | 0 (0.0%) |
| $500 to $799 | 67 (93.1%) | 0 (0.0%) |
| $800 to $999 | 0 (0.0%) | 0 (0.0%) |
| $1,000 to $1,499 | 2 (2.8%) | 0 (0.0%) |
| $1,500 to $1,999 | 2 (2.8%) | 0 (0.0%) |
| $2,000 to $2,499 | 0 (0.0%) | 0 (0.0%) |
| $2,500 to $2,999 | 0 (0.0%) | 0 (0.0%) |
| $3,000 or more | 1 (1.4%) | 0 (0.0%) |
| Total | 72 (100.0%) | 0 (0.0%) |
Physical Housing Characteristics in Lazy Lake
Housing Structures in Lazy Lake
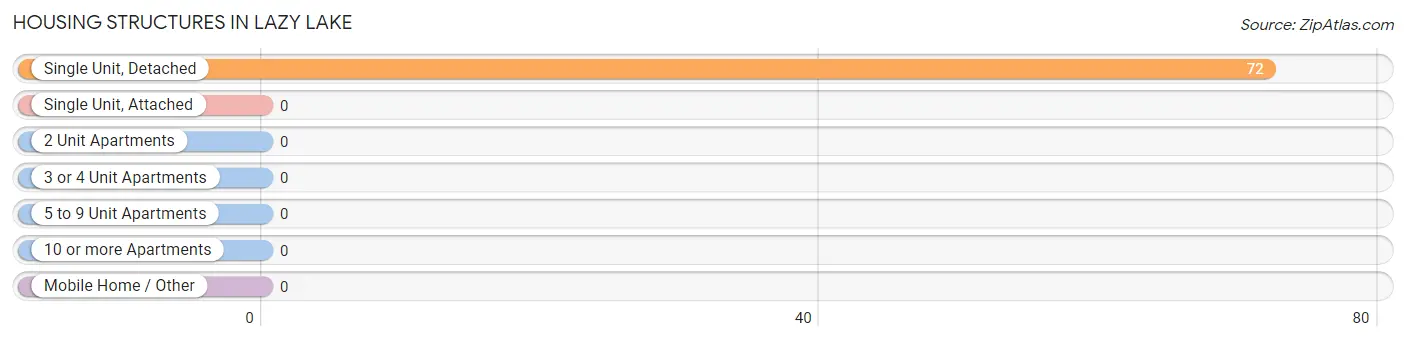
| Structure Type | # Housing Units | % Housing Units |
| Single Unit, Detached | 72 | 100.0% |
| Single Unit, Attached | 0 | 0.0% |
| 2 Unit Apartments | 0 | 0.0% |
| 3 or 4 Unit Apartments | 0 | 0.0% |
| 5 to 9 Unit Apartments | 0 | 0.0% |
| 10 or more Apartments | 0 | 0.0% |
| Mobile Home / Other | 0 | 0.0% |
| Total | 72 | 100.0% |
Housing Structures by Occupancy in Lazy Lake
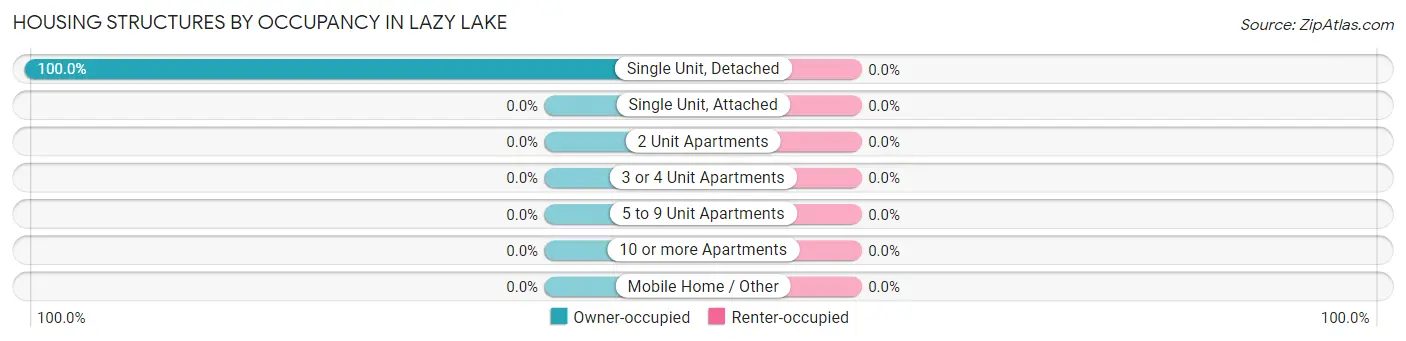
| Structure Type | Owner-occupied | Renter-occupied |
| Single Unit, Detached | 72 (100.0%) | 0 (0.0%) |
| Single Unit, Attached | 0 (0.0%) | 0 (0.0%) |
| 2 Unit Apartments | 0 (0.0%) | 0 (0.0%) |
| 3 or 4 Unit Apartments | 0 (0.0%) | 0 (0.0%) |
| 5 to 9 Unit Apartments | 0 (0.0%) | 0 (0.0%) |
| 10 or more Apartments | 0 (0.0%) | 0 (0.0%) |
| Mobile Home / Other | 0 (0.0%) | 0 (0.0%) |
| Total | 72 (100.0%) | 0 (0.0%) |
Housing Structures by Number of Rooms in Lazy Lake
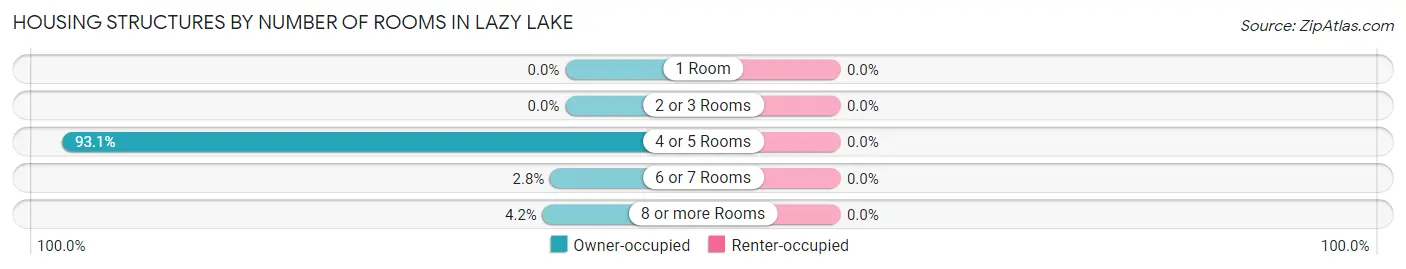
| Number of Rooms | Owner-occupied | Renter-occupied |
| 1 Room | 0 (0.0%) | 0 (0.0%) |
| 2 or 3 Rooms | 0 (0.0%) | 0 (0.0%) |
| 4 or 5 Rooms | 67 (93.1%) | 0 (0.0%) |
| 6 or 7 Rooms | 2 (2.8%) | 0 (0.0%) |
| 8 or more Rooms | 3 (4.2%) | 0 (0.0%) |
| Total | 72 (100.0%) | 0 (0.0%) |
Housing Structure by Heating Type in Lazy Lake
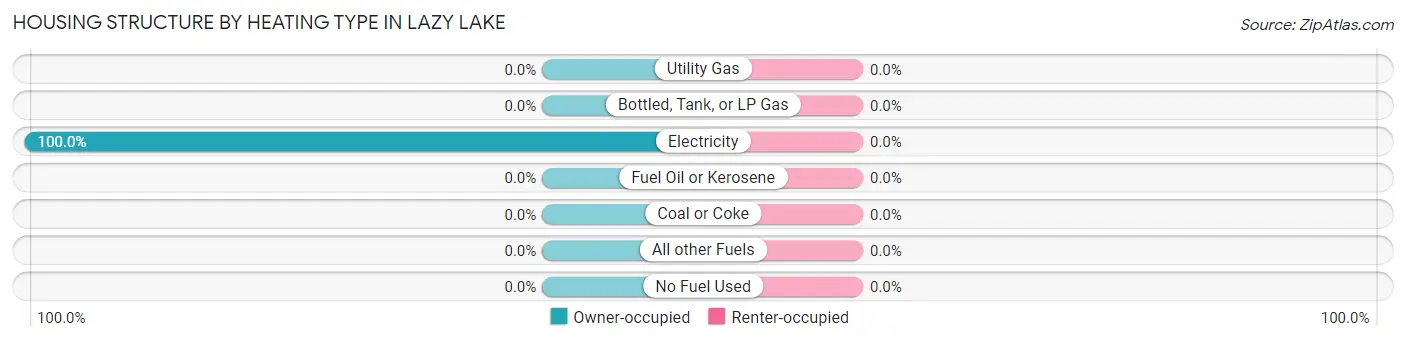
| Heating Type | Owner-occupied | Renter-occupied |
| Utility Gas | 0 (0.0%) | 0 (0.0%) |
| Bottled, Tank, or LP Gas | 0 (0.0%) | 0 (0.0%) |
| Electricity | 72 (100.0%) | 0 (0.0%) |
| Fuel Oil or Kerosene | 0 (0.0%) | 0 (0.0%) |
| Coal or Coke | 0 (0.0%) | 0 (0.0%) |
| All other Fuels | 0 (0.0%) | 0 (0.0%) |
| No Fuel Used | 0 (0.0%) | 0 (0.0%) |
| Total | 72 (100.0%) | 0 (0.0%) |
Household Vehicle Usage in Lazy Lake
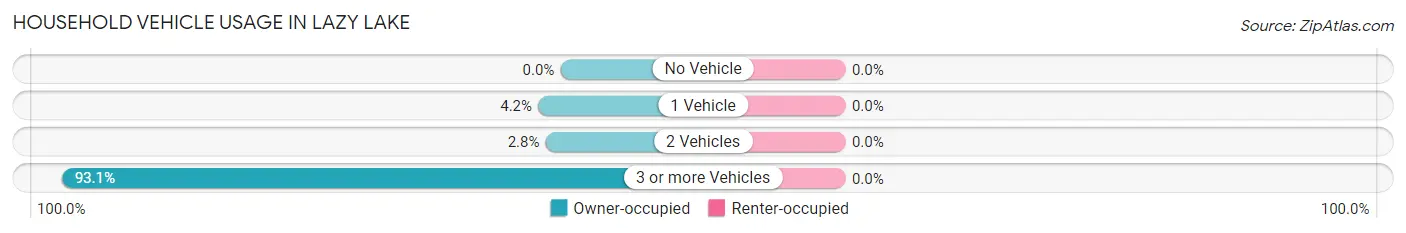
| Vehicles per Household | Owner-occupied | Renter-occupied |
| No Vehicle | 0 (0.0%) | 0 (0.0%) |
| 1 Vehicle | 3 (4.2%) | 0 (0.0%) |
| 2 Vehicles | 2 (2.8%) | 0 (0.0%) |
| 3 or more Vehicles | 67 (93.1%) | 0 (0.0%) |
| Total | 72 (100.0%) | 0 (0.0%) |
Real Estate & Mortgages in Lazy Lake
Real Estate and Mortgage Overview in Lazy Lake
| Characteristic | Without Mortgage | With Mortgage |
| Housing Units | 69 | 3 |
| Median Property Value | - | - |
| Median Household Income | - | - |
| Monthly Housing Costs | - | - |
| Real Estate Taxes | - | - |
Property Value by Mortgage Status in Lazy Lake
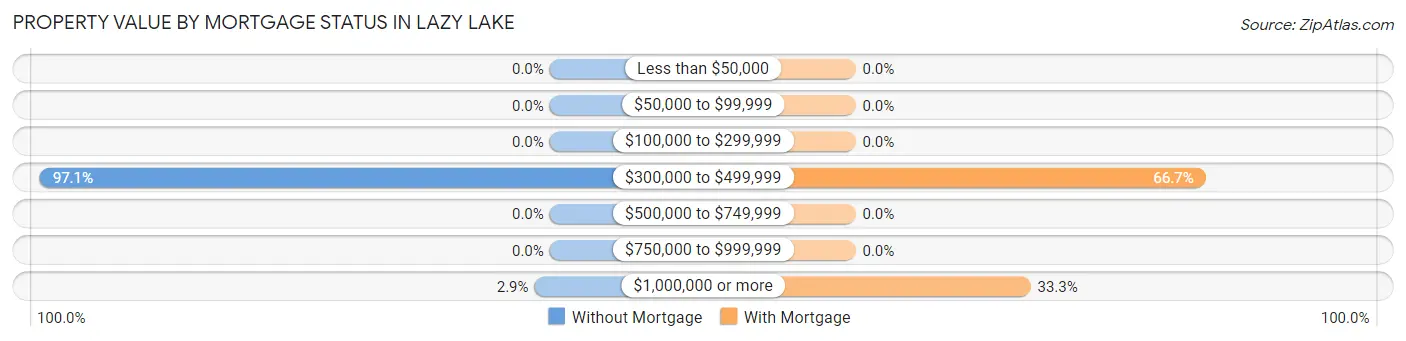
| Property Value | Without Mortgage | With Mortgage |
| Less than $50,000 | 0 (0.0%) | 0 (0.0%) |
| $50,000 to $99,999 | 0 (0.0%) | 0 (0.0%) |
| $100,000 to $299,999 | 0 (0.0%) | 0 (0.0%) |
| $300,000 to $499,999 | 67 (97.1%) | 2 (66.7%) |
| $500,000 to $749,999 | 0 (0.0%) | 0 (0.0%) |
| $750,000 to $999,999 | 0 (0.0%) | 0 (0.0%) |
| $1,000,000 or more | 2 (2.9%) | 1 (33.3%) |
| Total | 69 (100.0%) | 3 (100.0%) |
Household Income by Mortgage Status in Lazy Lake
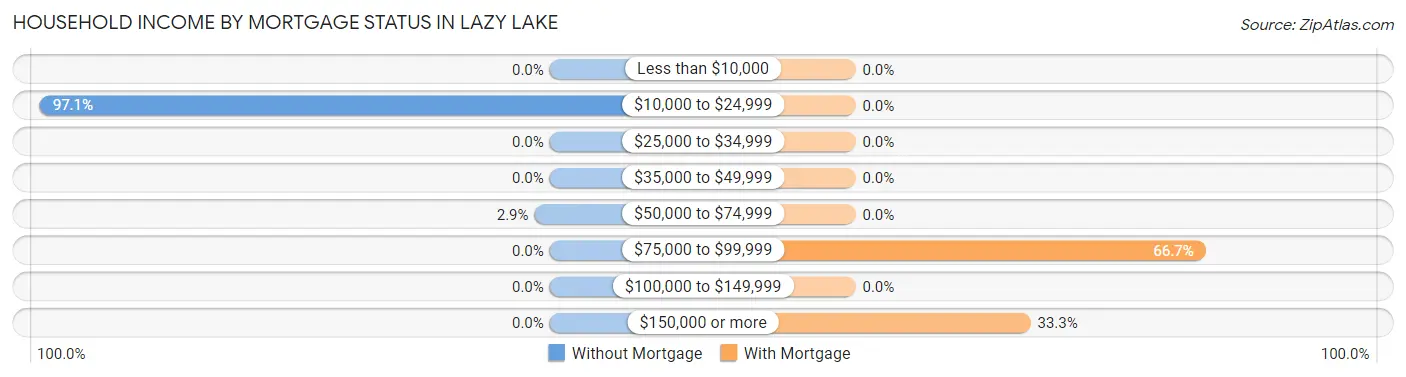
| Household Income | Without Mortgage | With Mortgage |
| Less than $10,000 | 0 (0.0%) | 0 (0.0%) |
| $10,000 to $24,999 | 67 (97.1%) | 0 (0.0%) |
| $25,000 to $34,999 | 0 (0.0%) | 0 (0.0%) |
| $35,000 to $49,999 | 0 (0.0%) | 0 (0.0%) |
| $50,000 to $74,999 | 2 (2.9%) | 0 (0.0%) |
| $75,000 to $99,999 | 0 (0.0%) | 2 (66.7%) |
| $100,000 to $149,999 | 0 (0.0%) | 0 (0.0%) |
| $150,000 or more | 0 (0.0%) | 1 (33.3%) |
| Total | 69 (100.0%) | 3 (100.0%) |
Property Value to Household Income Ratio in Lazy Lake
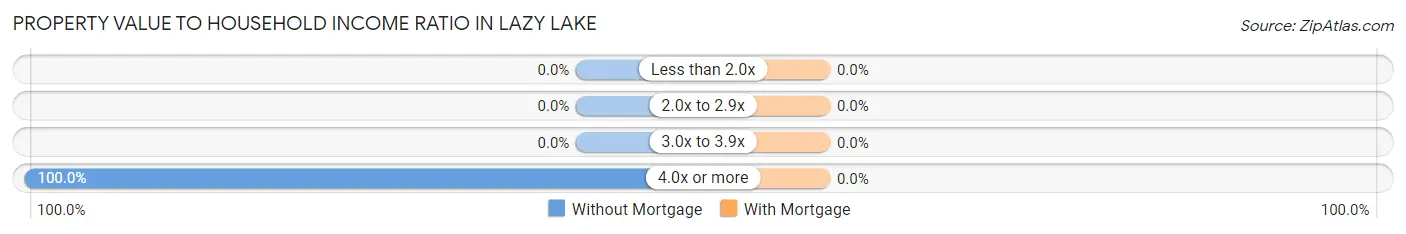
| Value-to-Income Ratio | Without Mortgage | With Mortgage |
| Less than 2.0x | 0 (0.0%) | 0 (0.0%) |
| 2.0x to 2.9x | 0 (0.0%) | 0 (0.0%) |
| 3.0x to 3.9x | 0 (0.0%) | 0 (0.0%) |
| 4.0x or more | 69 (100.0%) | 0 (0.0%) |
| Total | 69 (100.0%) | 3 (100.0%) |
Real Estate Taxes by Mortgage Status in Lazy Lake
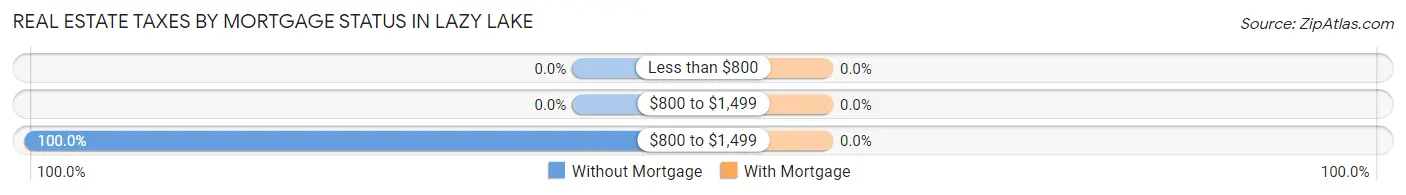
| Property Taxes | Without Mortgage | With Mortgage |
| Less than $800 | 0 (0.0%) | 0 (0.0%) |
| $800 to $1,499 | 0 (0.0%) | 0 (0.0%) |
| $800 to $1,499 | 69 (100.0%) | 0 (0.0%) |
| Total | 69 (100.0%) | 3 (100.0%) |
Health & Disability in Lazy Lake
Health Insurance Coverage by Age in Lazy Lake
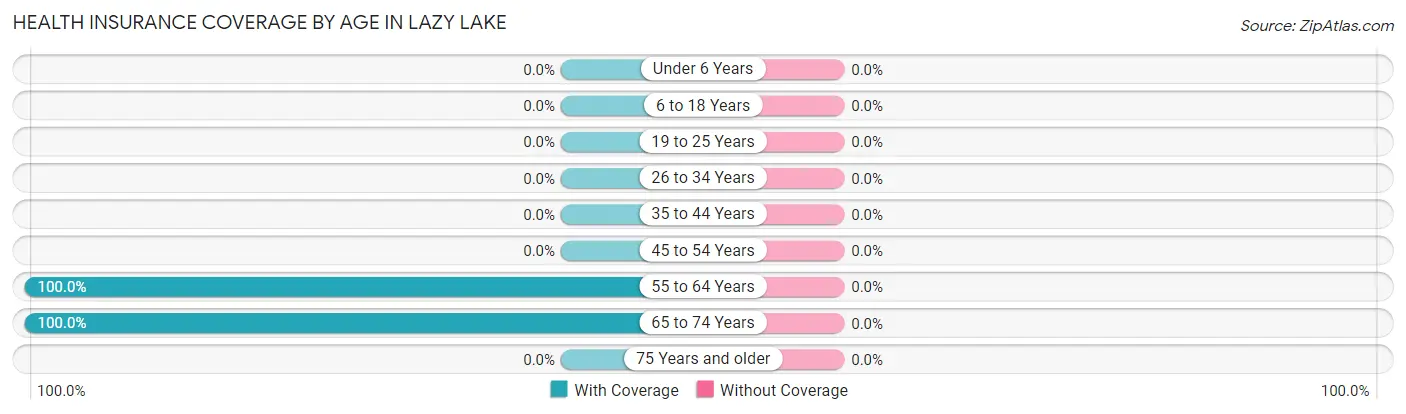
| Age Bracket | With Coverage | Without Coverage |
| Under 6 Years | 0 (0.0%) | 0 (0.0%) |
| 6 to 18 Years | 0 (0.0%) | 0 (0.0%) |
| 19 to 25 Years | 0 (0.0%) | 0 (0.0%) |
| 26 to 34 Years | 0 (0.0%) | 0 (0.0%) |
| 35 to 44 Years | 0 (0.0%) | 0 (0.0%) |
| 45 to 54 Years | 0 (0.0%) | 0 (0.0%) |
| 55 to 64 Years | 136 (100.0%) | 0 (0.0%) |
| 65 to 74 Years | 7 (100.0%) | 0 (0.0%) |
| 75 Years and older | 0 (0.0%) | 0 (0.0%) |
| Total | 143 (100.0%) | 0 (0.0%) |
Health Insurance Coverage by Citizenship Status in Lazy Lake
| Citizenship Status | With Coverage | Without Coverage |
| Native Born | 0 (0.0%) | 0 (0.0%) |
| Foreign Born, Citizen | 0 (0.0%) | 0 (0.0%) |
| Foreign Born, not a Citizen | 0 (0.0%) | 0 (0.0%) |
Health Insurance Coverage by Household Income in Lazy Lake
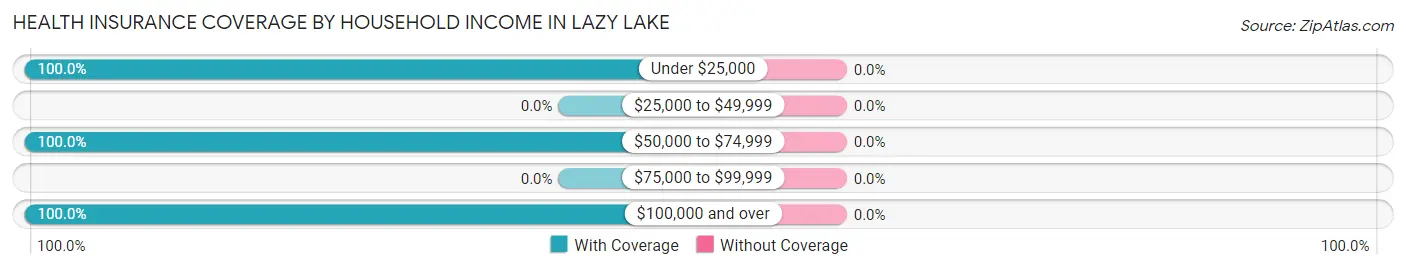
| Household Income | With Coverage | Without Coverage |
| Under $25,000 | 133 (100.0%) | 0 (0.0%) |
| $25,000 to $49,999 | 0 (0.0%) | 0 (0.0%) |
| $50,000 to $74,999 | 9 (100.0%) | 0 (0.0%) |
| $75,000 to $99,999 | 0 (0.0%) | 0 (0.0%) |
| $100,000 and over | 1 (100.0%) | 0 (0.0%) |
Public vs Private Health Insurance Coverage by Age in Lazy Lake
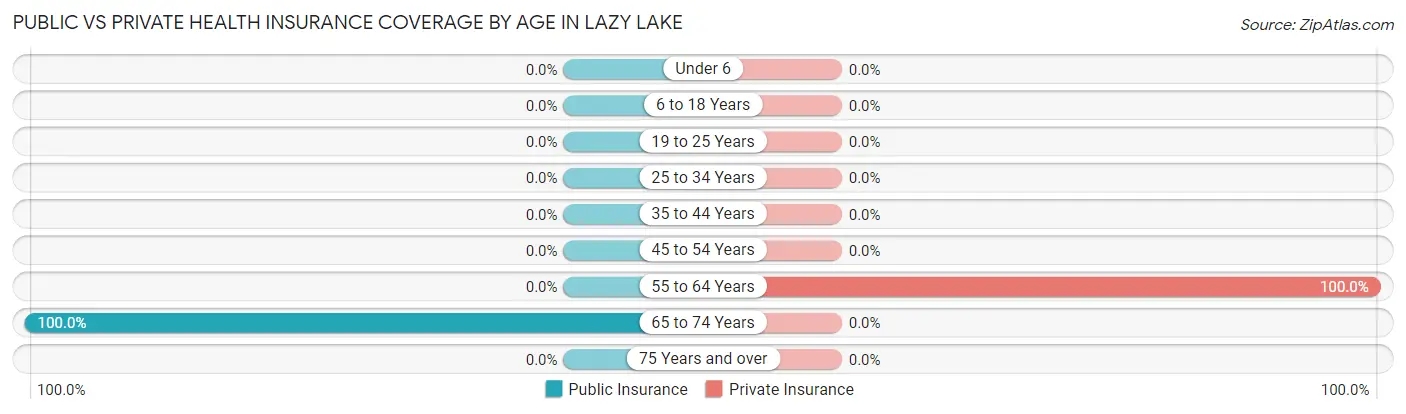
| Age Bracket | Public Insurance | Private Insurance |
| Under 6 | 0 (0.0%) | 0 (0.0%) |
| 6 to 18 Years | 0 (0.0%) | 0 (0.0%) |
| 19 to 25 Years | 0 (0.0%) | 0 (0.0%) |
| 25 to 34 Years | 0 (0.0%) | 0 (0.0%) |
| 35 to 44 Years | 0 (0.0%) | 0 (0.0%) |
| 45 to 54 Years | 0 (0.0%) | 0 (0.0%) |
| 55 to 64 Years | 0 (0.0%) | 136 (100.0%) |
| 65 to 74 Years | 7 (100.0%) | 0 (0.0%) |
| 75 Years and over | 0 (0.0%) | 0 (0.0%) |
| Total | 7 (4.9%) | 136 (95.1%) |
Disability Status by Sex by Age in Lazy Lake
| Age Bracket | Male | Female |
| Under 5 Years | 0 (0.0%) | 0 (0.0%) |
| 5 to 17 Years | 0 (0.0%) | 0 (0.0%) |
| 18 to 34 Years | 0 (0.0%) | 0 (0.0%) |
| 35 to 64 Years | 0 (0.0%) | 0 (0.0%) |
| 65 to 74 Years | 0 (0.0%) | 0 (0.0%) |
| 75 Years and over | 0 (0.0%) | 0 (0.0%) |
Disability Class by Sex by Age in Lazy Lake
Disability Class: Hearing Difficulty
| Age Bracket | Male | Female |
| Under 5 Years | 0 (0.0%) | 0 (0.0%) |
| 5 to 17 Years | 0 (0.0%) | 0 (0.0%) |
| 18 to 34 Years | 0 (0.0%) | 0 (0.0%) |
| 35 to 64 Years | 0 (0.0%) | 0 (0.0%) |
| 65 to 74 Years | 0 (0.0%) | 0 (0.0%) |
| 75 Years and over | 0 (0.0%) | 0 (0.0%) |
Disability Class: Vision Difficulty
| Age Bracket | Male | Female |
| Under 5 Years | 0 (0.0%) | 0 (0.0%) |
| 5 to 17 Years | 0 (0.0%) | 0 (0.0%) |
| 18 to 34 Years | 0 (0.0%) | 0 (0.0%) |
| 35 to 64 Years | 0 (0.0%) | 0 (0.0%) |
| 65 to 74 Years | 0 (0.0%) | 0 (0.0%) |
| 75 Years and over | 0 (0.0%) | 0 (0.0%) |
Disability Class: Cognitive Difficulty
| Age Bracket | Male | Female |
| 5 to 17 Years | 0 (0.0%) | 0 (0.0%) |
| 18 to 34 Years | 0 (0.0%) | 0 (0.0%) |
| 35 to 64 Years | 0 (0.0%) | 0 (0.0%) |
| 65 to 74 Years | 0 (0.0%) | 0 (0.0%) |
| 75 Years and over | 0 (0.0%) | 0 (0.0%) |
Disability Class: Ambulatory Difficulty
| Age Bracket | Male | Female |
| 5 to 17 Years | 0 (0.0%) | 0 (0.0%) |
| 18 to 34 Years | 0 (0.0%) | 0 (0.0%) |
| 35 to 64 Years | 0 (0.0%) | 0 (0.0%) |
| 65 to 74 Years | 0 (0.0%) | 0 (0.0%) |
| 75 Years and over | 0 (0.0%) | 0 (0.0%) |
Disability Class: Self-Care Difficulty
| Age Bracket | Male | Female |
| 5 to 17 Years | 0 (0.0%) | 0 (0.0%) |
| 18 to 34 Years | 0 (0.0%) | 0 (0.0%) |
| 35 to 64 Years | 0 (0.0%) | 0 (0.0%) |
| 65 to 74 Years | 0 (0.0%) | 0 (0.0%) |
| 75 Years and over | 0 (0.0%) | 0 (0.0%) |
Technology Access in Lazy Lake
Computing Device Access in Lazy Lake
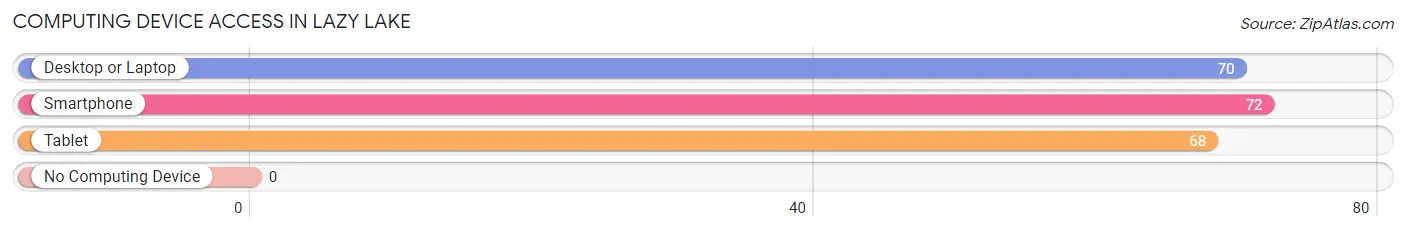
| Device Type | # Households | % Households |
| Desktop or Laptop | 70 | 97.2% |
| Smartphone | 72 | 100.0% |
| Tablet | 68 | 94.4% |
| No Computing Device | 0 | 0.0% |
| Total | 72 | 100.0% |
Internet Access in Lazy Lake
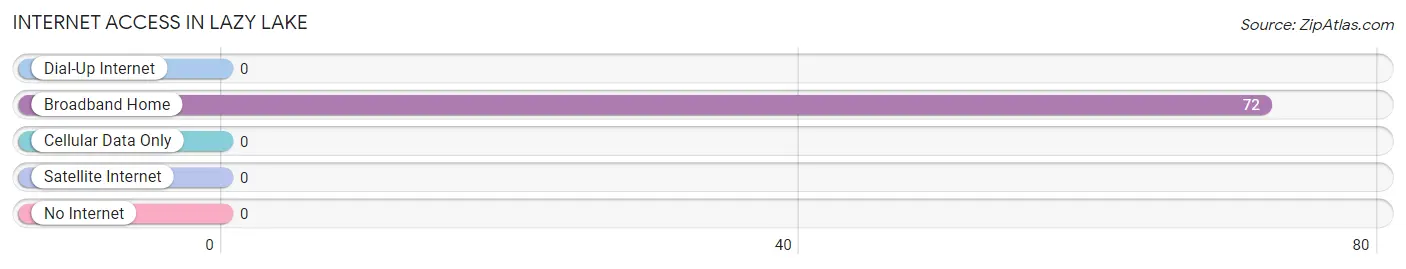
| Internet Type | # Households | % Households |
| Dial-Up Internet | 0 | 0.0% |
| Broadband Home | 72 | 100.0% |
| Cellular Data Only | 0 | 0.0% |
| Satellite Internet | 0 | 0.0% |
| No Internet | 0 | 0.0% |
| Total | 72 | 100.0% |
Lazy Lake Summary
Lazy Lake is a small village located in Broward County, Florida. It is situated between the cities of Wilton Manors and Oakland Park, and is bordered by the North Fork of the Middle River. The village is home to approximately 200 people, and is known for its quiet, laid-back atmosphere.
History
Lazy Lake was founded in the early 1950s by a group of developers who wanted to create a small, peaceful community. The village was originally named “Lazy Lake Estates” and was designed to be a residential area with a few small businesses. The developers also built a small lake in the center of the village, which gave the community its name.
In the late 1950s, the village was incorporated as a municipality. The village was governed by a mayor and a five-member council. The village was also home to a volunteer fire department and a police department.
Geography
Lazy Lake is located in southeastern Florida, in Broward County. It is situated between the cities of Wilton Manors and Oakland Park, and is bordered by the North Fork of the Middle River. The village covers an area of 0.2 square miles, and is home to approximately 200 people.
The village is located in a subtropical climate, with hot, humid summers and mild, dry winters. The average temperature in the summer is around 90°F, and the average temperature in the winter is around 70°F.
Economy
The economy of Lazy Lake is largely based on tourism and small businesses. The village is home to several small businesses, including restaurants, shops, and a marina. The village also attracts tourists who come to enjoy the peaceful atmosphere and the lake.
Demographics
As of the 2010 census, the population of Lazy Lake was approximately 200 people. The racial makeup of the village was 94.5% White, 2.5% African American, 0.5% Asian, and 2.5% from other races. The median household income was $50,000, and the median age was 44 years.
Conclusion
Lazy Lake is a small village located in Broward County, Florida. It is known for its peaceful atmosphere and its small businesses. The village is home to approximately 200 people, and is largely supported by tourism and small businesses. The village is also home to a volunteer fire department and a police department.
Common Questions
What is Per Capita Income in Lazy Lake?
Per Capita income in Lazy Lake is $11,668.
What is the Median Family Income in Lazy Lake?
Median Family Income in Lazy Lake is $18,825.
What is the Median Household income in Lazy Lake?
Median Household Income in Lazy Lake is $18,843.
What is Inequality or Gini Index in Lazy Lake?
Inequality or Gini Index in Lazy Lake is 0.18.
What is the Total Population of Lazy Lake?
Total Population of Lazy Lake is 143.
What is the Total Male Population of Lazy Lake?
Total Male Population of Lazy Lake is 70.
What is the Total Female Population of Lazy Lake?
Total Female Population of Lazy Lake is 73.
What is the Ratio of Males per 100 Females in Lazy Lake?
There are 95.89 Males per 100 Females in Lazy Lake.
What is the Ratio of Females per 100 Males in Lazy Lake?
There are 104.29 Females per 100 Males in Lazy Lake.
What is the Median Population Age in Lazy Lake?
Median Population Age in Lazy Lake is 62.1 Years.
What is the Average Family Size in Lazy Lake
Average Family Size in Lazy Lake is 2.0 People.
What is the Average Household Size in Lazy Lake
Average Household Size in Lazy Lake is 2.0 People.
How Large is the Labor Force in Lazy Lake?
There are 3 People in the Labor Forcein in Lazy Lake.
What is the Percentage of People in the Labor Force in Lazy Lake?
2.1% of People are in the Labor Force in Lazy Lake.