Herman, NE Map & Demographics
Herman Map
Herman Overview
$25,369
PER CAPITA INCOME
$49,063
AVG FAMILY INCOME
$65,000
AVG HOUSEHOLD INCOME
7.0%
WAGE / INCOME GAP [ % ]
93.0¢/ $1
WAGE / INCOME GAP [ $ ]
0.31
INEQUALITY / GINI INDEX
360
TOTAL POPULATION
203
MALE POPULATION
157
FEMALE POPULATION
129.30
MALES / 100 FEMALES
77.34
FEMALES / 100 MALES
22.0
MEDIAN AGE
2.9
AVG FAMILY SIZE
2.5
AVG HOUSEHOLD SIZE
240
LABOR FORCE [ PEOPLE ]
76.7%
PERCENT IN LABOR FORCE
1.7%
UNEMPLOYMENT RATE
Herman Zip Codes
Herman Area Codes
Income in Herman
Income Overview in Herman
Per Capita Income in Herman is $25,369, while median incomes of families and households are $49,063 and $65,000 respectively.
| Characteristic | Number | Measure |
| Per Capita Income | 360 | $25,369 |
| Median Family Income | 63 | $49,063 |
| Mean Family Income | 63 | $73,405 |
| Median Household Income | 144 | $65,000 |
| Mean Household Income | 144 | $64,321 |
| Income Deficit | 63 | $0 |
| Wage / Income Gap (%) | 360 | 7.03% |
| Wage / Income Gap ($) | 360 | 92.97¢ per $1 |
| Gini / Inequality Index | 360 | 0.31 |
Earnings by Sex in Herman
Average Earnings in Herman are $21,108, $19,836 for men and $21,335 for women, a difference of 7.0%.
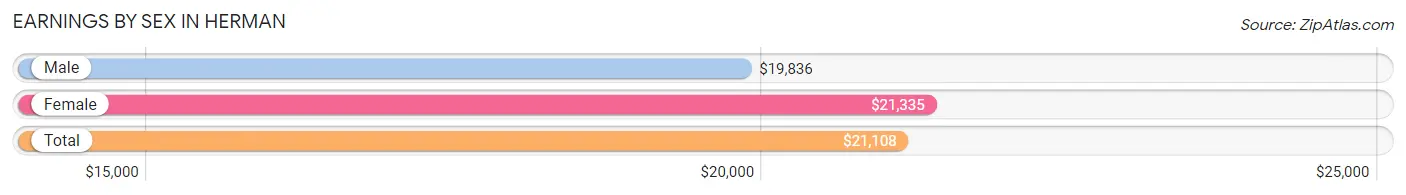
| Sex | Number | Average Earnings |
| Male | 144 (58.3%) | $19,836 |
| Female | 103 (41.7%) | $21,335 |
| Total | 247 (100.0%) | $21,108 |
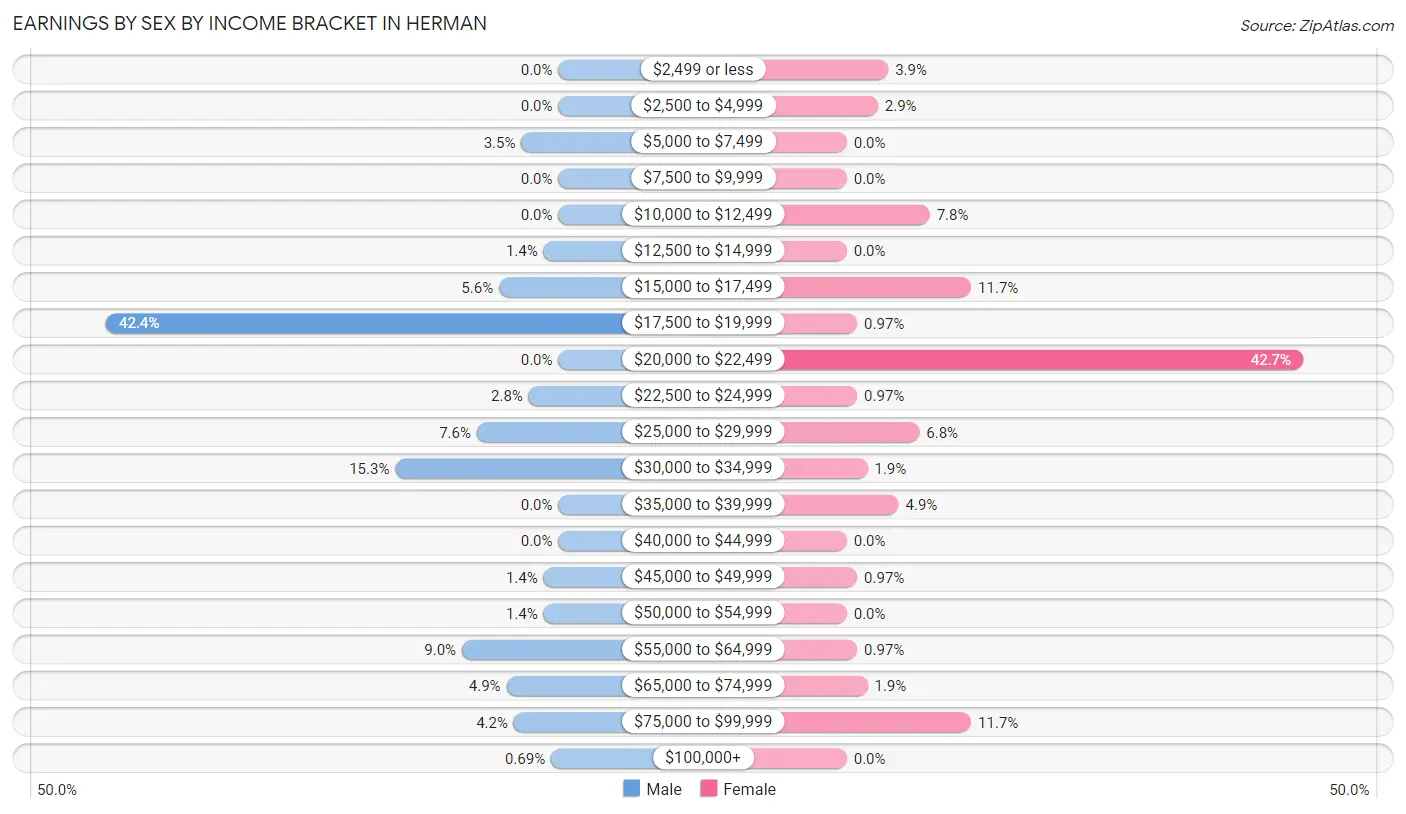
Earnings by Sex by Income Bracket in Herman
The most common earnings brackets in Herman are $17,500 to $19,999 for men (61 | 42.4%) and $20,000 to $22,499 for women (44 | 42.7%).
| Income | Male | Female |
| $2,499 or less | 0 (0.0%) | 4 (3.9%) |
| $2,500 to $4,999 | 0 (0.0%) | 3 (2.9%) |
| $5,000 to $7,499 | 5 (3.5%) | 0 (0.0%) |
| $7,500 to $9,999 | 0 (0.0%) | 0 (0.0%) |
| $10,000 to $12,499 | 0 (0.0%) | 8 (7.8%) |
| $12,500 to $14,999 | 2 (1.4%) | 0 (0.0%) |
| $15,000 to $17,499 | 8 (5.6%) | 12 (11.7%) |
| $17,500 to $19,999 | 61 (42.4%) | 1 (1.0%) |
| $20,000 to $22,499 | 0 (0.0%) | 44 (42.7%) |
| $22,500 to $24,999 | 4 (2.8%) | 1 (1.0%) |
| $25,000 to $29,999 | 11 (7.6%) | 7 (6.8%) |
| $30,000 to $34,999 | 22 (15.3%) | 2 (1.9%) |
| $35,000 to $39,999 | 0 (0.0%) | 5 (4.9%) |
| $40,000 to $44,999 | 0 (0.0%) | 0 (0.0%) |
| $45,000 to $49,999 | 2 (1.4%) | 1 (1.0%) |
| $50,000 to $54,999 | 2 (1.4%) | 0 (0.0%) |
| $55,000 to $64,999 | 13 (9.0%) | 1 (1.0%) |
| $65,000 to $74,999 | 7 (4.9%) | 2 (1.9%) |
| $75,000 to $99,999 | 6 (4.2%) | 12 (11.7%) |
| $100,000+ | 1 (0.7%) | 0 (0.0%) |
| Total | 144 (100.0%) | 103 (100.0%) |
Earnings by Sex by Educational Attainment in Herman
Average earnings in Herman are $55,625 for men and $22,500 for women, a difference of 59.6%. Men with an educational attainment of college or associate's degree enjoy the highest average annual earnings of $59,000, while those with bachelor's degree education earn the least with $58,750. Women with an educational attainment of high school diploma earn the most with the average annual earnings of $16,250, while those with high school diploma education have the smallest earnings of $16,250.
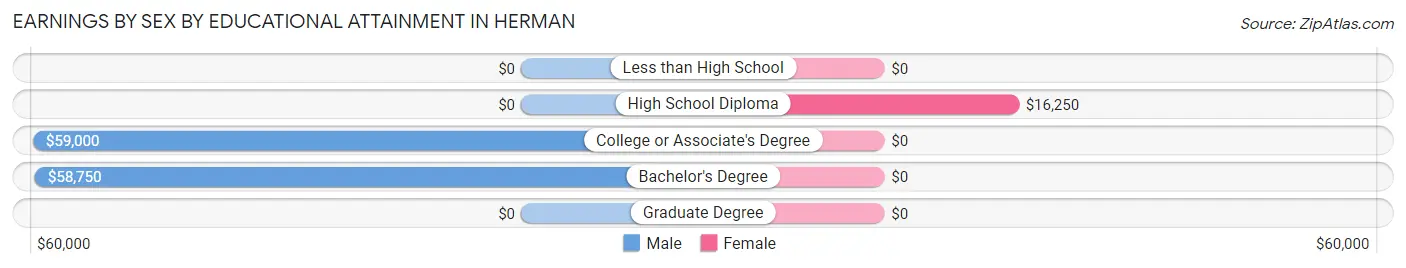
| Educational Attainment | Male Income | Female Income |
| Less than High School | - | - |
| High School Diploma | - | - |
| College or Associate's Degree | $59,000 | $0 |
| Bachelor's Degree | $58,750 | $0 |
| Graduate Degree | - | - |
| Total | $55,625 | $22,500 |
Family Income in Herman
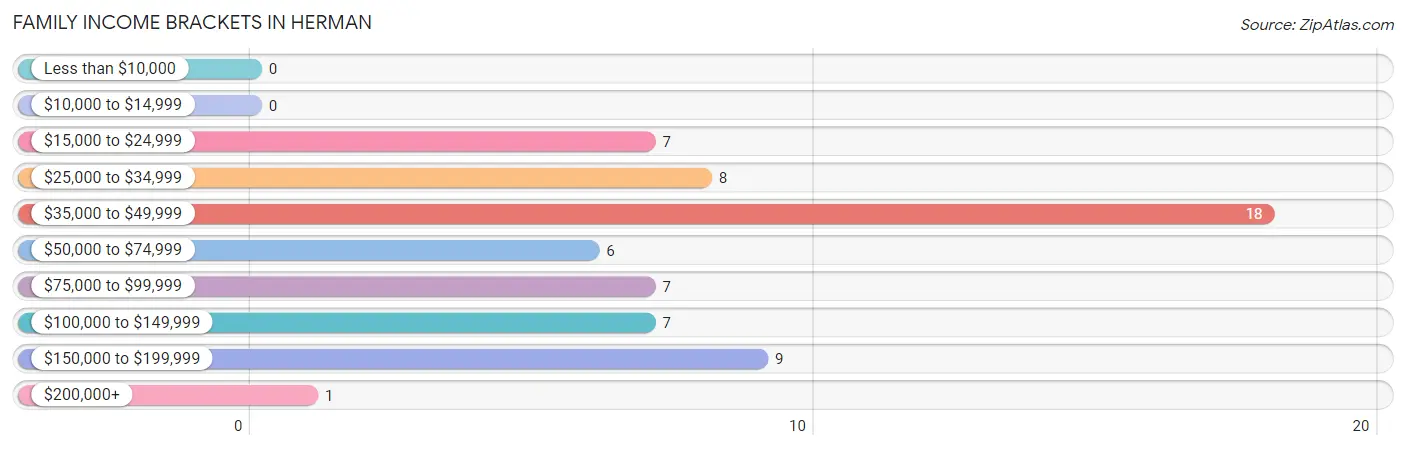
Family Income Brackets in Herman
According to the Herman family income data, there are 18 families falling into the $35,000 to $49,999 income range, which is the most common income bracket and makes up 28.6% of all families.
| Income Bracket | # Families | % Families |
| Less than $10,000 | 0 | 0.0% |
| $10,000 to $14,999 | 0 | 0.0% |
| $15,000 to $24,999 | 7 | 11.1% |
| $25,000 to $34,999 | 8 | 12.7% |
| $35,000 to $49,999 | 18 | 28.6% |
| $50,000 to $74,999 | 6 | 9.5% |
| $75,000 to $99,999 | 7 | 11.1% |
| $100,000 to $149,999 | 7 | 11.1% |
| $150,000 to $199,999 | 9 | 14.3% |
| $200,000+ | 1 | 1.6% |
Family Income by Famaliy Size in Herman
| Income Bracket | # Families | Median Income |
| 2-Person Families | 33 (52.4%) | $0 |
| 3-Person Families | 17 (27.0%) | $0 |
| 4-Person Families | 0 (0.0%) | $0 |
| 5-Person Families | 13 (20.6%) | $0 |
| 6-Person Families | 0 (0.0%) | $0 |
| 7+ Person Families | 0 (0.0%) | $0 |
| Total | 63 (100.0%) | $49,063 |
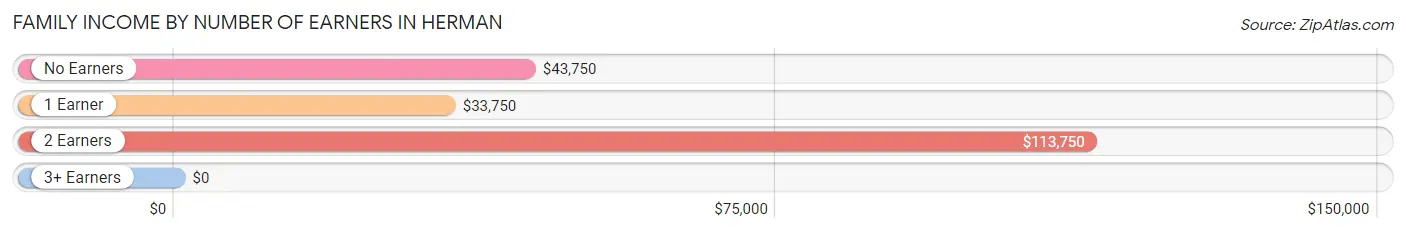
Family Income by Number of Earners in Herman
| Number of Earners | # Families | Median Income |
| No Earners | 14 (22.2%) | $43,750 |
| 1 Earner | 18 (28.6%) | $33,750 |
| 2 Earners | 29 (46.0%) | $113,750 |
| 3+ Earners | 2 (3.2%) | $0 |
| Total | 63 (100.0%) | $49,063 |
Household Income in Herman
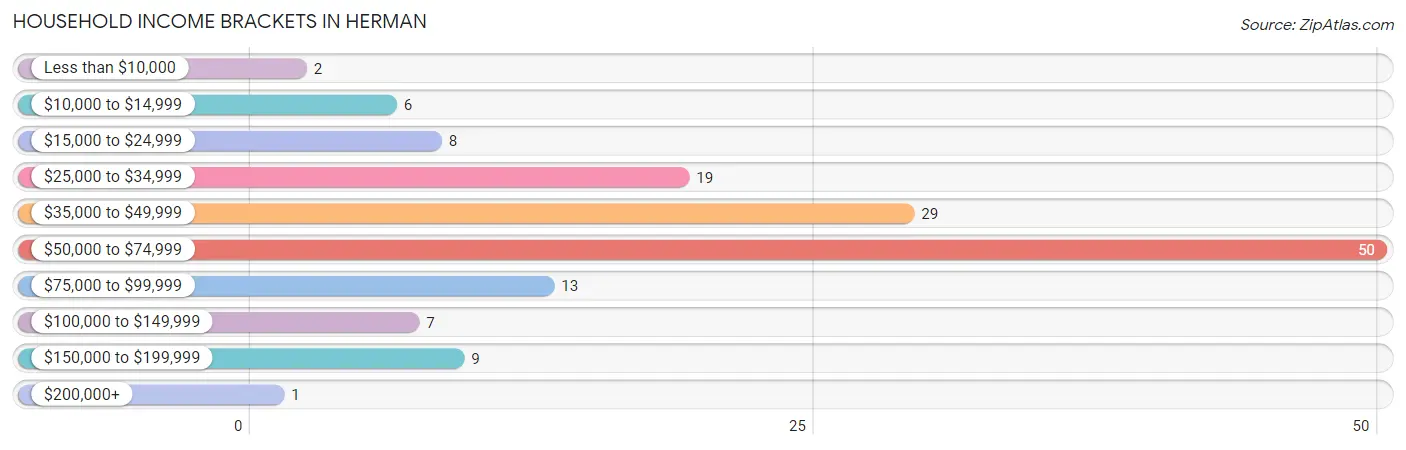
Household Income Brackets in Herman
With 50 households falling in the category, the $50,000 to $74,999 income range is the most frequent in Herman, accounting for 34.7% of all households. In contrast, only 1 households (0.7%) fall into the $200,000+ income bracket, making it the least populous group.
| Income Bracket | # Households | % Households |
| Less than $10,000 | 2 | 1.4% |
| $10,000 to $14,999 | 6 | 4.2% |
| $15,000 to $24,999 | 8 | 5.6% |
| $25,000 to $34,999 | 19 | 13.2% |
| $35,000 to $49,999 | 29 | 20.1% |
| $50,000 to $74,999 | 50 | 34.7% |
| $75,000 to $99,999 | 13 | 9.0% |
| $100,000 to $149,999 | 7 | 4.9% |
| $150,000 to $199,999 | 9 | 6.3% |
| $200,000+ | 1 | 0.7% |
Household Income by Householder Age in Herman
The median household income in Herman is $65,000, with the highest median household income of $53,125 found in the 25 to 44 years age bracket for the primary householder. A total of 17 households (11.8%) fall into this category. Meanwhile, the 15 to 24 years age bracket for the primary householder has the lowest median household income of $0, with 41 households (28.5%) in this group.
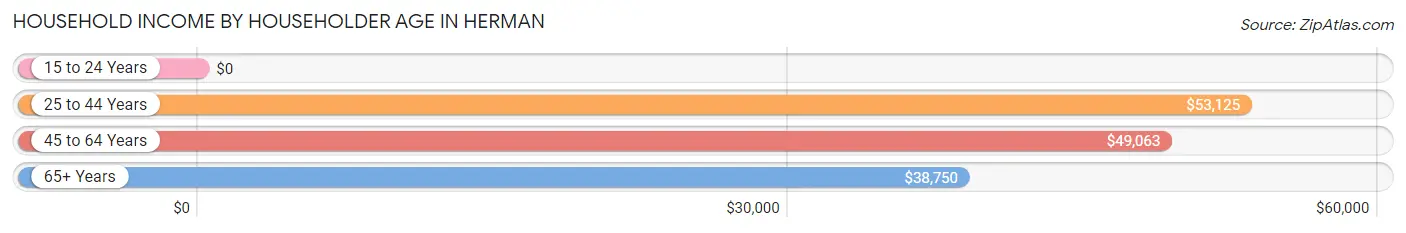
| Income Bracket | # Households | Median Income |
| 15 to 24 Years | 41 (28.5%) | $0 |
| 25 to 44 Years | 17 (11.8%) | $53,125 |
| 45 to 64 Years | 55 (38.2%) | $49,063 |
| 65+ Years | 31 (21.5%) | $38,750 |
| Total | 144 (100.0%) | $65,000 |
Poverty in Herman
Income Below Poverty by Sex and Age in Herman
With 8.4% poverty level for males and 11.5% for females among the residents of Herman, 6 to 11 year old males and 25 to 34 year old females are the most vulnerable to poverty, with 4 males (57.1%) and 7 females (70.0%) in their respective age groups living below the poverty level.
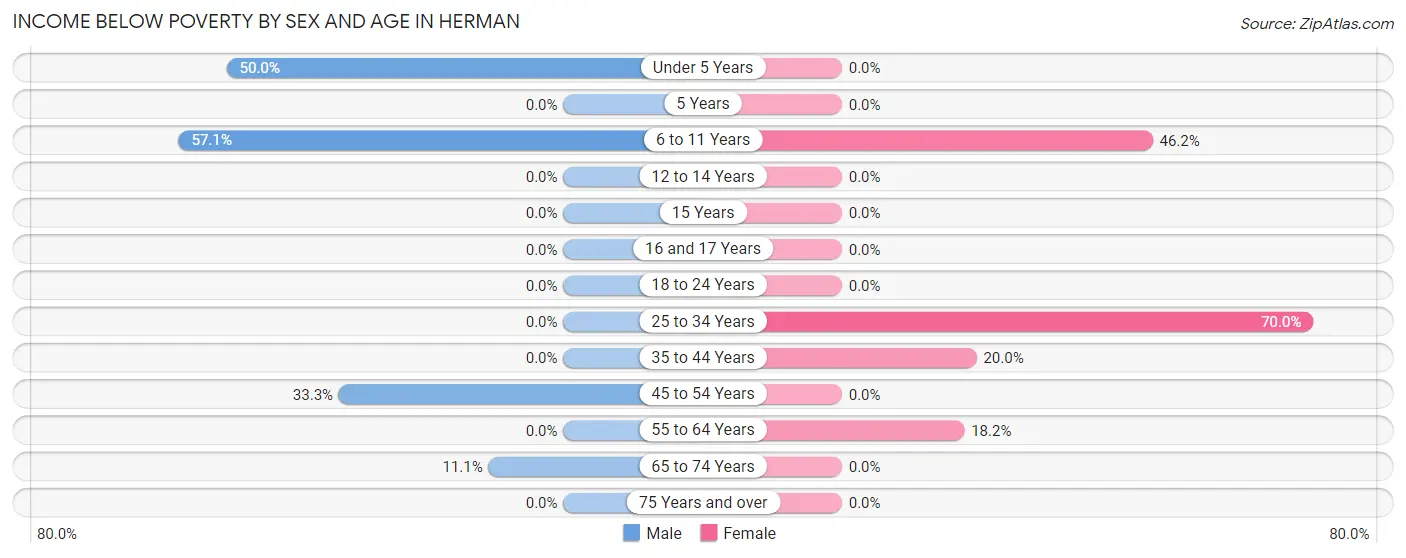
| Age Bracket | Male | Female |
| Under 5 Years | 6 (50.0%) | 0 (0.0%) |
| 5 Years | 0 (0.0%) | 0 (0.0%) |
| 6 to 11 Years | 4 (57.1%) | 6 (46.2%) |
| 12 to 14 Years | 0 (0.0%) | 0 (0.0%) |
| 15 Years | 0 (0.0%) | 0 (0.0%) |
| 16 and 17 Years | 0 (0.0%) | 0 (0.0%) |
| 18 to 24 Years | 0 (0.0%) | 0 (0.0%) |
| 25 to 34 Years | 0 (0.0%) | 7 (70.0%) |
| 35 to 44 Years | 0 (0.0%) | 1 (20.0%) |
| 45 to 54 Years | 5 (33.3%) | 0 (0.0%) |
| 55 to 64 Years | 0 (0.0%) | 4 (18.2%) |
| 65 to 74 Years | 2 (11.1%) | 0 (0.0%) |
| 75 Years and over | 0 (0.0%) | 0 (0.0%) |
| Total | 17 (8.4%) | 18 (11.5%) |
Income Above Poverty by Sex and Age in Herman
According to the poverty statistics in Herman, males aged 12 to 14 years and females aged under 5 years are the age groups that are most secure financially, with 100.0% of males and 100.0% of females in these age groups living above the poverty line.
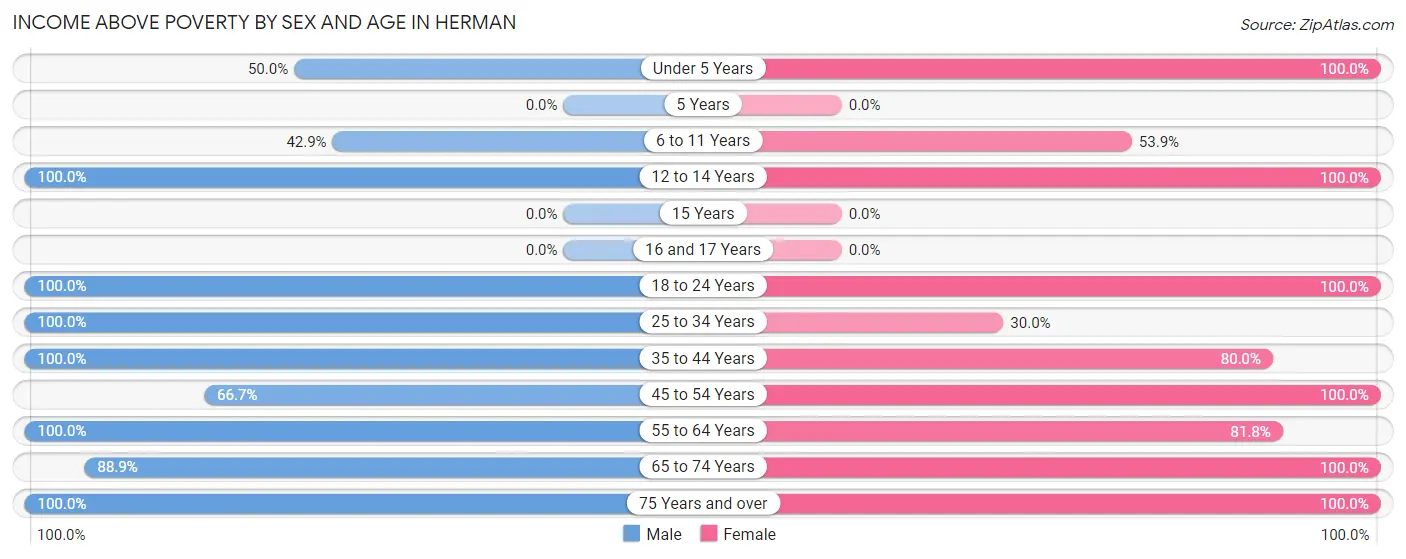
| Age Bracket | Male | Female |
| Under 5 Years | 6 (50.0%) | 12 (100.0%) |
| 5 Years | 0 (0.0%) | 0 (0.0%) |
| 6 to 11 Years | 3 (42.9%) | 7 (53.8%) |
| 12 to 14 Years | 1 (100.0%) | 2 (100.0%) |
| 15 Years | 0 (0.0%) | 0 (0.0%) |
| 16 and 17 Years | 0 (0.0%) | 0 (0.0%) |
| 18 to 24 Years | 91 (100.0%) | 50 (100.0%) |
| 25 to 34 Years | 20 (100.0%) | 3 (30.0%) |
| 35 to 44 Years | 8 (100.0%) | 4 (80.0%) |
| 45 to 54 Years | 10 (66.7%) | 21 (100.0%) |
| 55 to 64 Years | 28 (100.0%) | 18 (81.8%) |
| 65 to 74 Years | 16 (88.9%) | 18 (100.0%) |
| 75 Years and over | 3 (100.0%) | 4 (100.0%) |
| Total | 186 (91.6%) | 139 (88.5%) |
Income Below Poverty Among Married-Couple Families in Herman
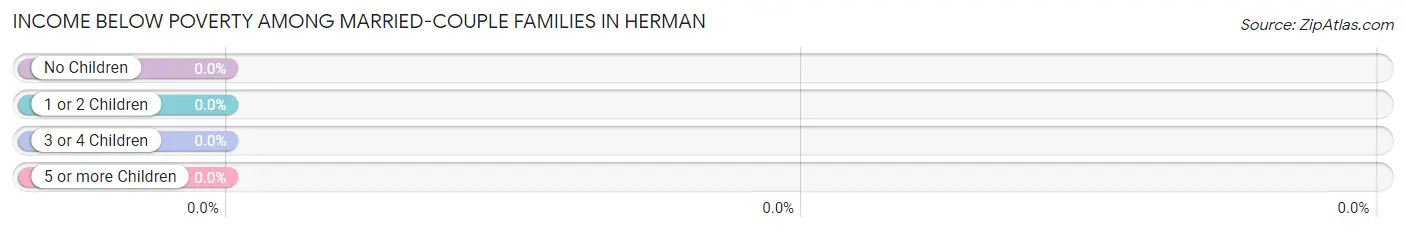
| Children | Above Poverty | Below Poverty |
| No Children | 41 (100.0%) | 0 (0.0%) |
| 1 or 2 Children | 3 (100.0%) | 0 (0.0%) |
| 3 or 4 Children | 5 (100.0%) | 0 (0.0%) |
| 5 or more Children | 0 (0.0%) | 0 (0.0%) |
| Total | 49 (100.0%) | 0 (0.0%) |
Income Below Poverty Among Single-Parent Households in Herman
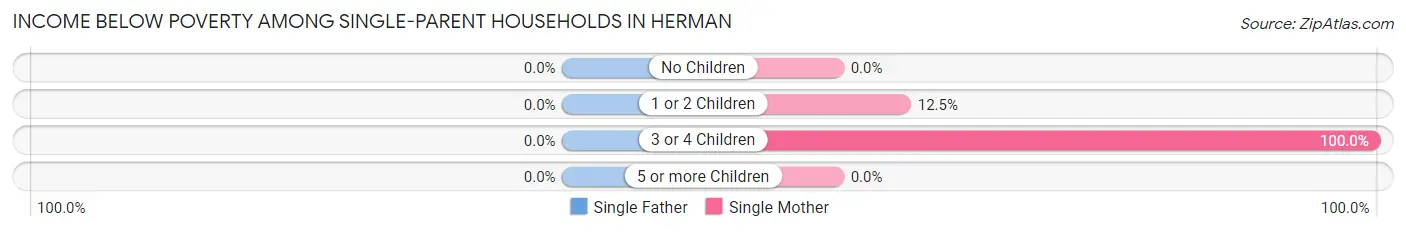
| Children | Single Father | Single Mother |
| No Children | 0 (0.0%) | 0 (0.0%) |
| 1 or 2 Children | 0 (0.0%) | 1 (12.5%) |
| 3 or 4 Children | 0 (0.0%) | 6 (100.0%) |
| 5 or more Children | 0 (0.0%) | 0 (0.0%) |
| Total | 0 (0.0%) | 7 (50.0%) |
Income Below Poverty Among Married-Couple vs Single-Parent Households in Herman
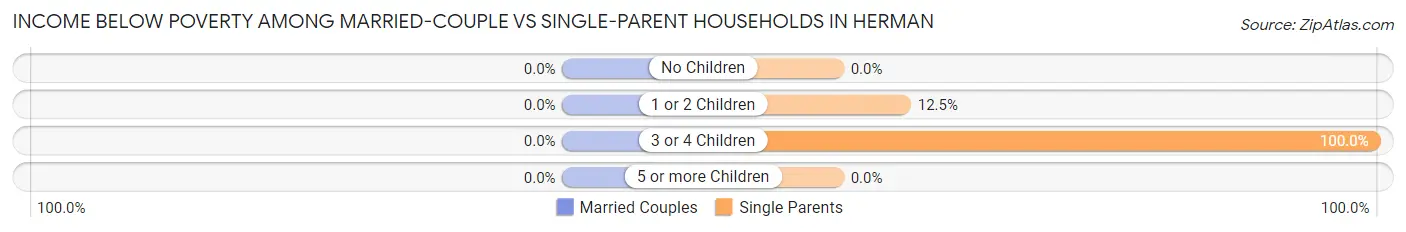
| Children | Married-Couple Families | Single-Parent Households |
| No Children | 0 (0.0%) | 0 (0.0%) |
| 1 or 2 Children | 0 (0.0%) | 1 (12.5%) |
| 3 or 4 Children | 0 (0.0%) | 6 (100.0%) |
| 5 or more Children | 0 (0.0%) | 0 (0.0%) |
| Total | 0 (0.0%) | 7 (50.0%) |
Race in Herman
The most populous races in Herman are White / Caucasian (352 | 97.8%), Hispanic or Latino (3 | 0.8%), and Native / Alaskan (3 | 0.8%).
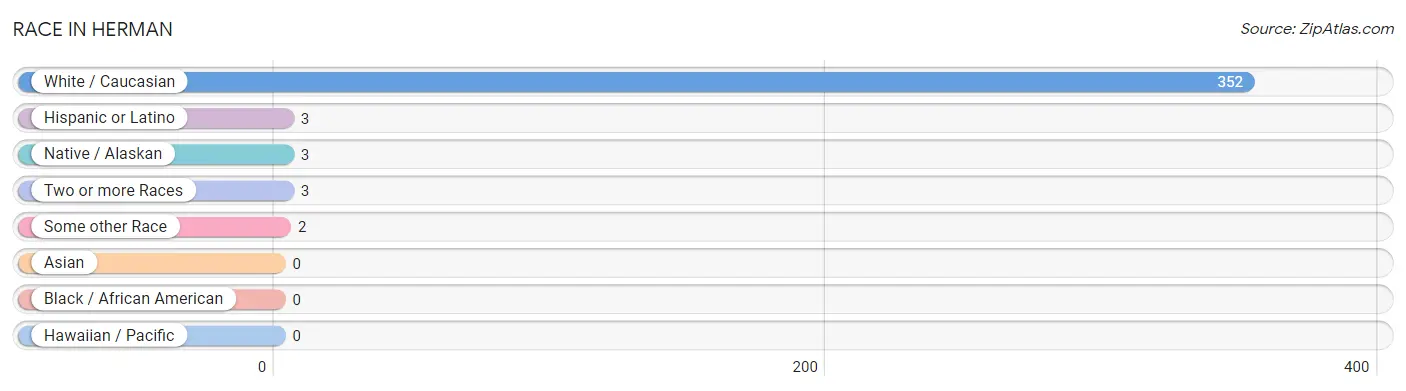
| Race | # Population | % Population |
| Asian | 0 | 0.0% |
| Black / African American | 0 | 0.0% |
| Hawaiian / Pacific | 0 | 0.0% |
| Hispanic or Latino | 3 | 0.8% |
| Native / Alaskan | 3 | 0.8% |
| White / Caucasian | 352 | 97.8% |
| Two or more Races | 3 | 0.8% |
| Some other Race | 2 | 0.6% |
| Total | 360 | 100.0% |
Ancestry in Herman
The most populous ancestries reported in Herman are German (123 | 34.2%), French (62 | 17.2%), Greek (61 | 16.9%), Irish (35 | 9.7%), and American (29 | 8.1%), together accounting for 86.1% of all Herman residents.
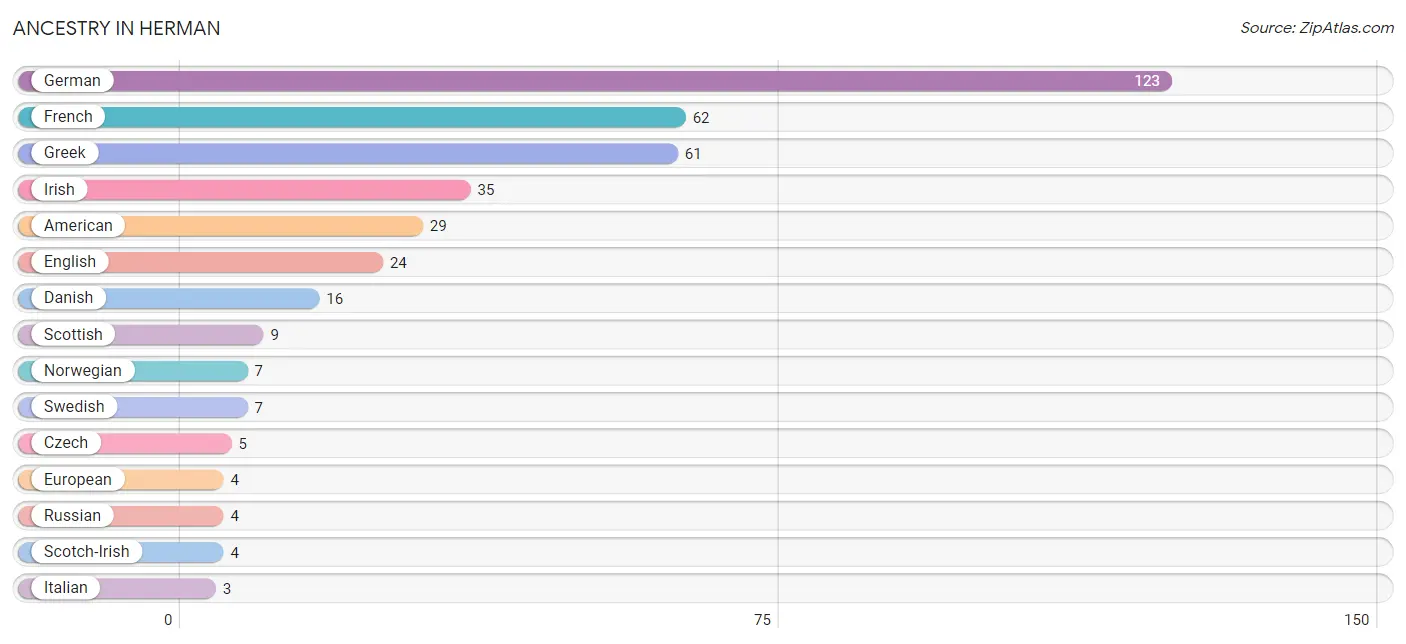
| Ancestry | # Population | % Population |
| American | 29 | 8.1% |
| Central American | 1 | 0.3% |
| Cherokee | 2 | 0.6% |
| Czech | 5 | 1.4% |
| Czechoslovakian | 2 | 0.6% |
| Danish | 16 | 4.4% |
| English | 24 | 6.7% |
| European | 4 | 1.1% |
| French | 62 | 17.2% |
| German | 123 | 34.2% |
| Greek | 61 | 16.9% |
| Irish | 35 | 9.7% |
| Italian | 3 | 0.8% |
| Mexican | 2 | 0.6% |
| Norwegian | 7 | 1.9% |
| Panamanian | 1 | 0.3% |
| Russian | 4 | 1.1% |
| Scotch-Irish | 4 | 1.1% |
| Scottish | 9 | 2.5% |
| Swedish | 7 | 1.9% | View All 20 Rows |
Immigrants in Herman
The most numerous immigrant groups reported in Herman came from Central America (2 | 0.6%), Latin America (2 | 0.6%), and Mexico (2 | 0.6%), together accounting for 1.7% of all Herman residents.
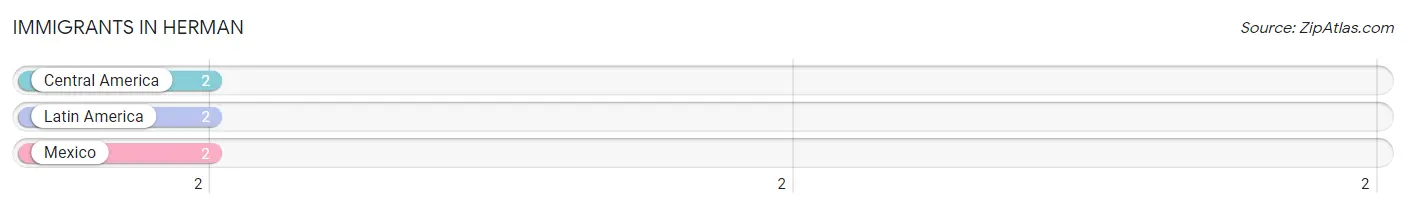
| Immigration Origin | # Population | % Population |
| Central America | 2 | 0.6% |
| Latin America | 2 | 0.6% |
| Mexico | 2 | 0.6% | View All 3 Rows |
Sex and Age in Herman
Sex and Age in Herman
The most populous age groups in Herman are 20 to 24 Years (67 | 33.0%) for men and 15 to 19 Years (39 | 24.8%) for women.
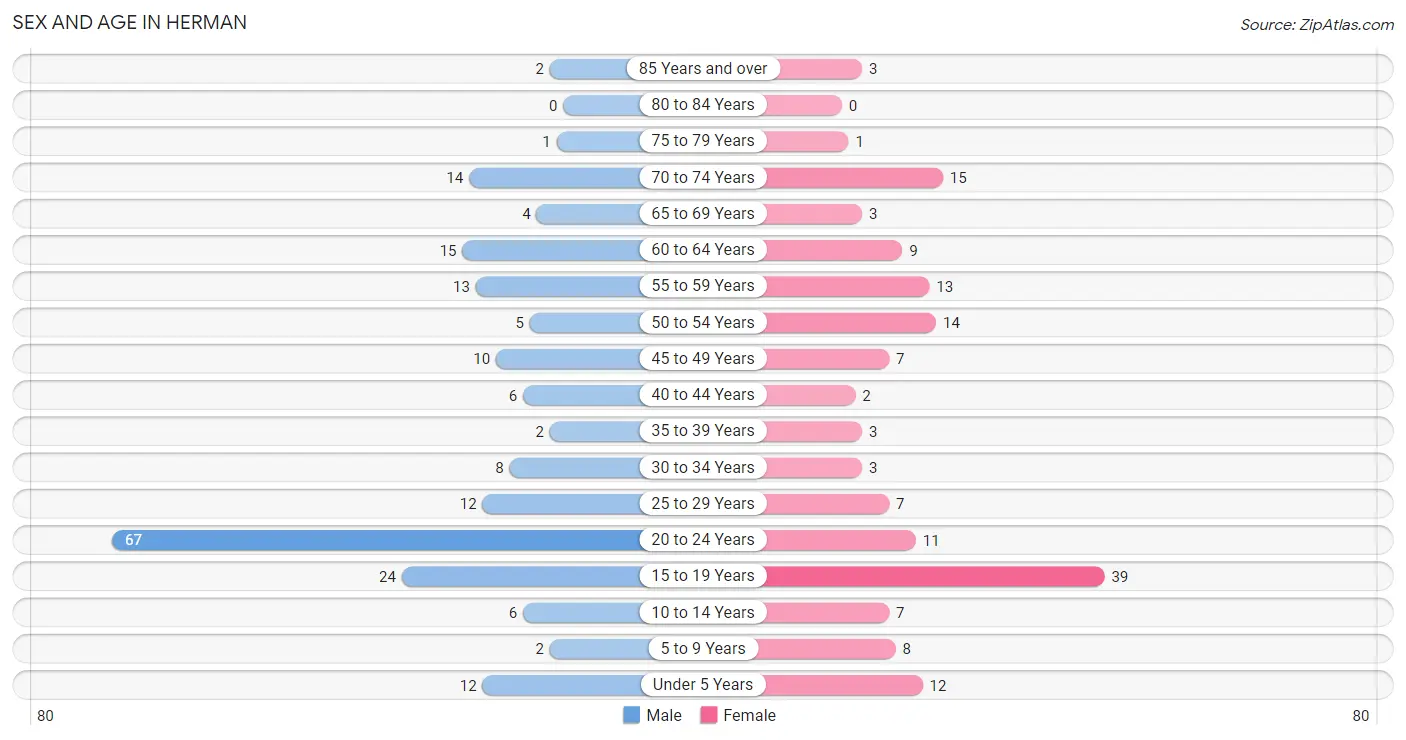
| Age Bracket | Male | Female |
| Under 5 Years | 12 (5.9%) | 12 (7.6%) |
| 5 to 9 Years | 2 (1.0%) | 8 (5.1%) |
| 10 to 14 Years | 6 (3.0%) | 7 (4.5%) |
| 15 to 19 Years | 24 (11.8%) | 39 (24.8%) |
| 20 to 24 Years | 67 (33.0%) | 11 (7.0%) |
| 25 to 29 Years | 12 (5.9%) | 7 (4.5%) |
| 30 to 34 Years | 8 (3.9%) | 3 (1.9%) |
| 35 to 39 Years | 2 (1.0%) | 3 (1.9%) |
| 40 to 44 Years | 6 (3.0%) | 2 (1.3%) |
| 45 to 49 Years | 10 (4.9%) | 7 (4.5%) |
| 50 to 54 Years | 5 (2.5%) | 14 (8.9%) |
| 55 to 59 Years | 13 (6.4%) | 13 (8.3%) |
| 60 to 64 Years | 15 (7.4%) | 9 (5.7%) |
| 65 to 69 Years | 4 (2.0%) | 3 (1.9%) |
| 70 to 74 Years | 14 (6.9%) | 15 (9.6%) |
| 75 to 79 Years | 1 (0.5%) | 1 (0.6%) |
| 80 to 84 Years | 0 (0.0%) | 0 (0.0%) |
| 85 Years and over | 2 (1.0%) | 3 (1.9%) |
| Total | 203 (100.0%) | 157 (100.0%) |
Families and Households in Herman
Median Family Size in Herman
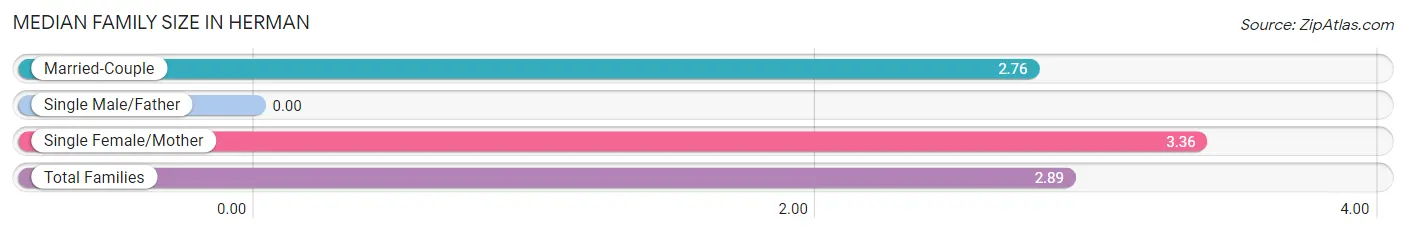
| Family Type | # Families | Family Size |
| Married-Couple | 49 (77.8%) | 2.76 |
| Single Male/Father | 0 (0.0%) | - |
| Single Female/Mother | 14 (22.2%) | 3.36 |
| Total Families | 63 (100.0%) | 2.89 |
Median Household Size in Herman
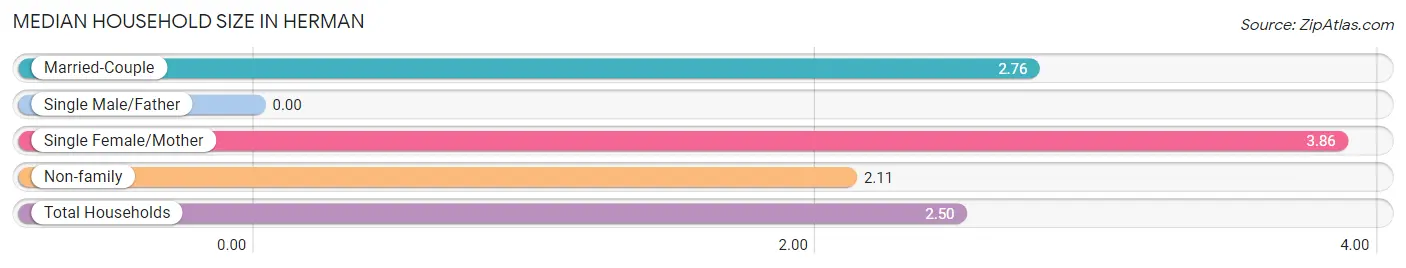
| Household Type | # Households | Household Size |
| Married-Couple | 49 (34.0%) | 2.76 |
| Single Male/Father | 0 (0.0%) | - |
| Single Female/Mother | 14 (9.7%) | 3.86 |
| Non-family | 81 (56.2%) | 2.11 |
| Total Households | 144 (100.0%) | 2.50 |
Household Size by Marriage Status in Herman
Out of a total of 144 households in Herman, 63 (43.8%) are family households, while 81 (56.2%) are nonfamily households. The most numerous type of family households are 2-person households, comprising 33, and the most common type of nonfamily households are 3-person households, comprising 39.
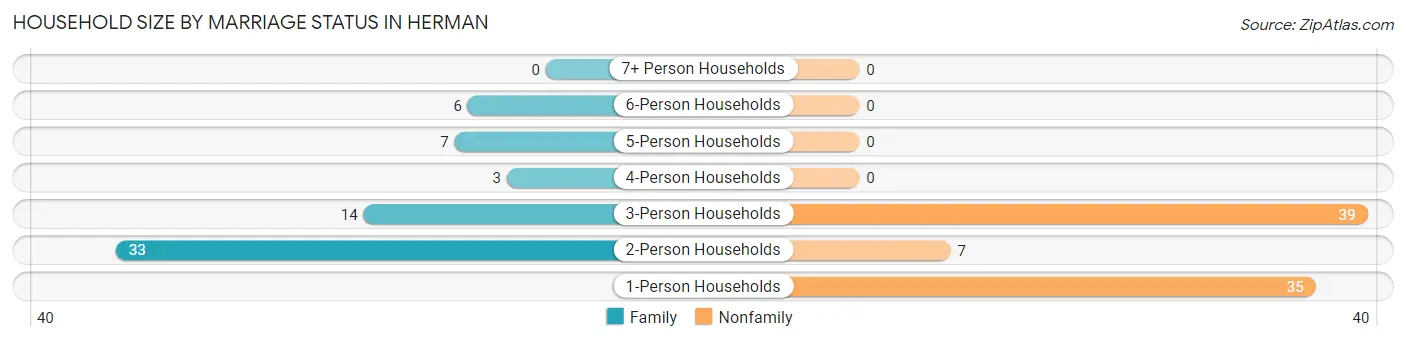
| Household Size | Family Households | Nonfamily Households |
| 1-Person Households | - | 35 (24.3%) |
| 2-Person Households | 33 (22.9%) | 7 (4.9%) |
| 3-Person Households | 14 (9.7%) | 39 (27.1%) |
| 4-Person Households | 3 (2.1%) | 0 (0.0%) |
| 5-Person Households | 7 (4.9%) | 0 (0.0%) |
| 6-Person Households | 6 (4.2%) | 0 (0.0%) |
| 7+ Person Households | 0 (0.0%) | 0 (0.0%) |
| Total | 63 (43.8%) | 81 (56.2%) |
Female Fertility in Herman
Fertility by Age in Herman
Average fertility rate in Herman is 41.0 births per 1,000 women. Women in the age bracket of 20 to 34 years have the highest fertility rate with 143.0 births per 1,000 women. Women in the age bracket of 20 to 34 years acount for 100.0% of all women with births.
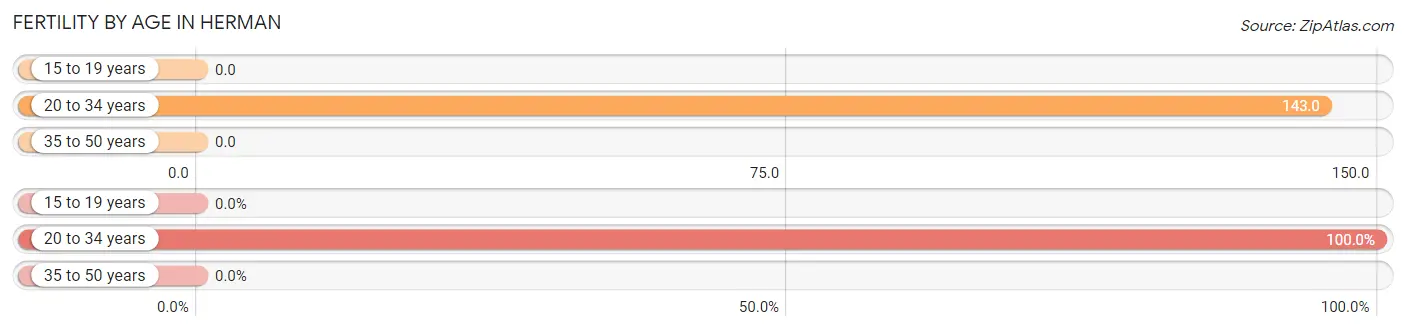
| Age Bracket | Women with Births | Births / 1,000 Women |
| 15 to 19 years | 0 (0.0%) | 0.0 |
| 20 to 34 years | 3 (100.0%) | 143.0 |
| 35 to 50 years | 0 (0.0%) | 0.0 |
| Total | 3 (100.0%) | 41.0 |
Fertility by Age by Marriage Status in Herman
33.3% of women with births (3) in Herman are married. The highest percentage of unmarried women with births falls into 20 to 34 years age bracket with 66.7% of them unmarried at the time of birth, while the lowest percentage of unmarried women with births belong to 20 to 34 years age bracket with 66.7% of them unmarried.
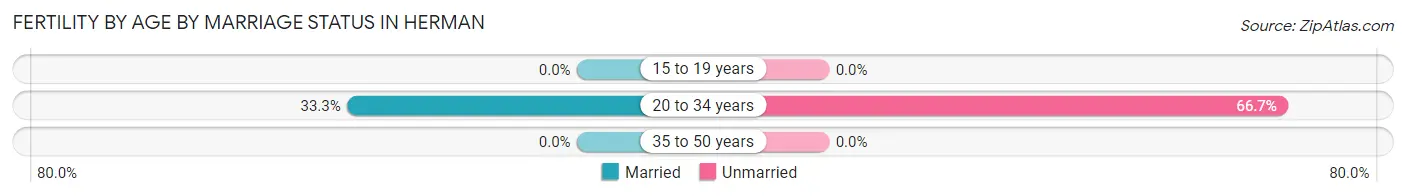
| Age Bracket | Married | Unmarried |
| 15 to 19 years | 0 (0.0%) | 0 (0.0%) |
| 20 to 34 years | 1 (33.3%) | 2 (66.7%) |
| 35 to 50 years | 0 (0.0%) | 0 (0.0%) |
| Total | 1 (33.3%) | 2 (66.7%) |
Fertility by Education in Herman
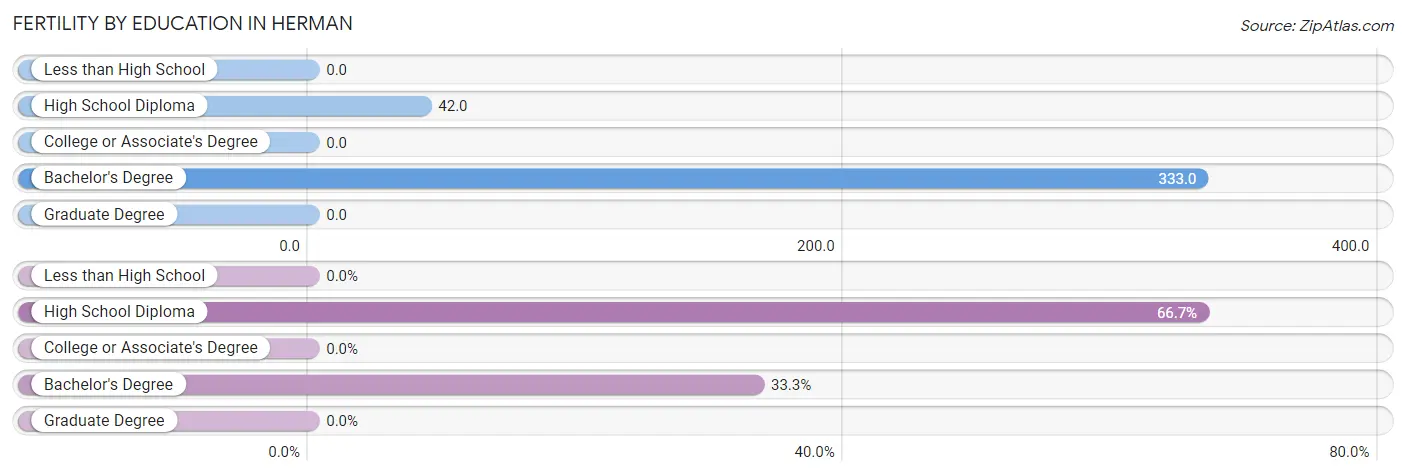
| Educational Attainment | Women with Births | Births / 1,000 Women |
| Less than High School | 0 (0.0%) | 0.0 |
| High School Diploma | 2 (66.7%) | 42.0 |
| College or Associate's Degree | 0 (0.0%) | 0.0 |
| Bachelor's Degree | 1 (33.3%) | 333.0 |
| Graduate Degree | 0 (0.0%) | 0.0 |
| Total | 3 (100.0%) | 41.0 |
Fertility by Education by Marriage Status in Herman
66.7% of women with births in Herman are unmarried. Women with the educational attainment of bachelor's degree are most likely to be married with 100.0% of them married at childbirth, while women with the educational attainment of high school diploma are least likely to be married with 100.0% of them unmarried at childbirth.
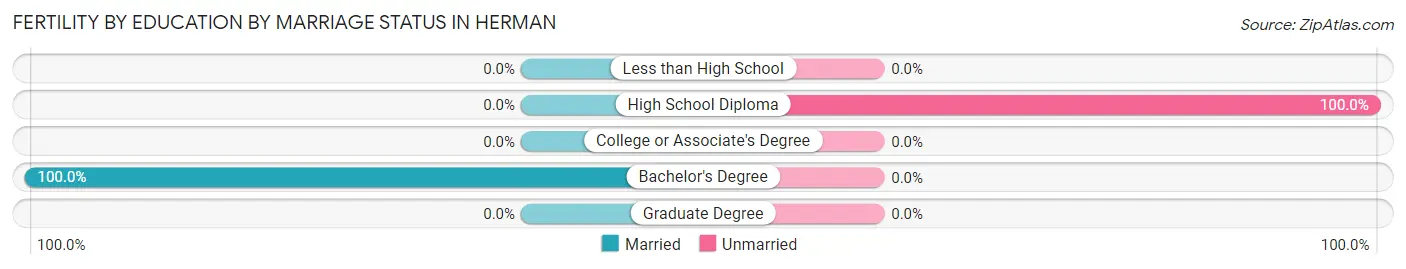
| Educational Attainment | Married | Unmarried |
| Less than High School | 0 (0.0%) | 0 (0.0%) |
| High School Diploma | 0 (0.0%) | 2 (100.0%) |
| College or Associate's Degree | 0 (0.0%) | 0 (0.0%) |
| Bachelor's Degree | 1 (100.0%) | 0 (0.0%) |
| Graduate Degree | 0 (0.0%) | 0 (0.0%) |
| Total | 1 (33.3%) | 2 (66.7%) |
Employment Characteristics in Herman
Employment by Class of Employer in Herman
Among the 231 employed individuals in Herman, private company employees (199 | 86.2%), self-employed (not incorporated) (12 | 5.2%), and local government employees (8 | 3.5%) make up the most common classes of employment.
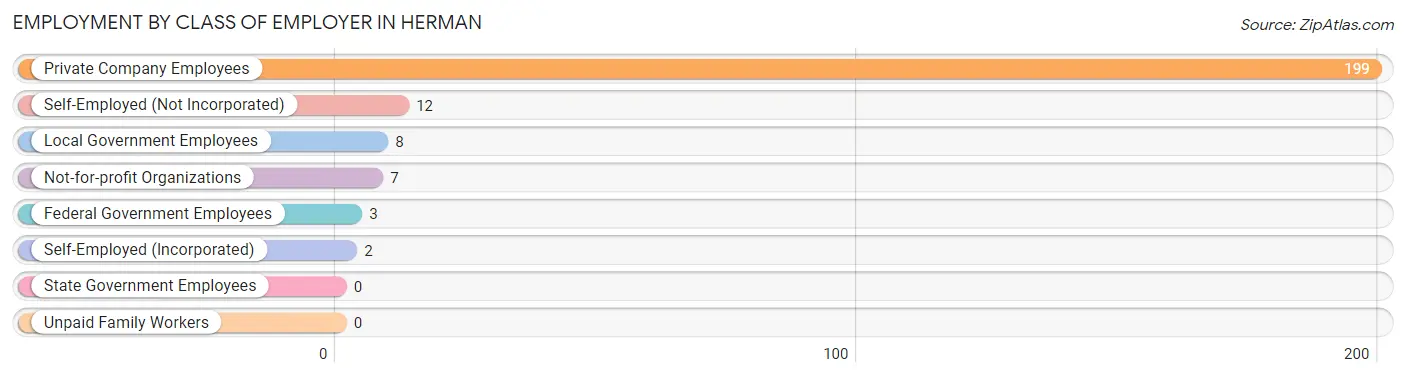
| Employer Class | # Employees | % Employees |
| Private Company Employees | 199 | 86.2% |
| Self-Employed (Incorporated) | 2 | 0.9% |
| Self-Employed (Not Incorporated) | 12 | 5.2% |
| Not-for-profit Organizations | 7 | 3.0% |
| Local Government Employees | 8 | 3.5% |
| State Government Employees | 0 | 0.0% |
| Federal Government Employees | 3 | 1.3% |
| Unpaid Family Workers | 0 | 0.0% |
| Total | 231 | 100.0% |
Employment Status by Age in Herman
According to the labor force statistics for Herman, out of the total population over 16 years of age (313), 76.7% or 240 individuals are in the labor force, with 1.7% or 4 of them unemployed. The age group with the highest labor force participation rate is 16 to 19 years, with 100.0% or 63 individuals in the labor force. Within the labor force, the 20 to 24 years age range has the highest percentage of unemployed individuals, with 5.5% or 4 of them being unemployed.
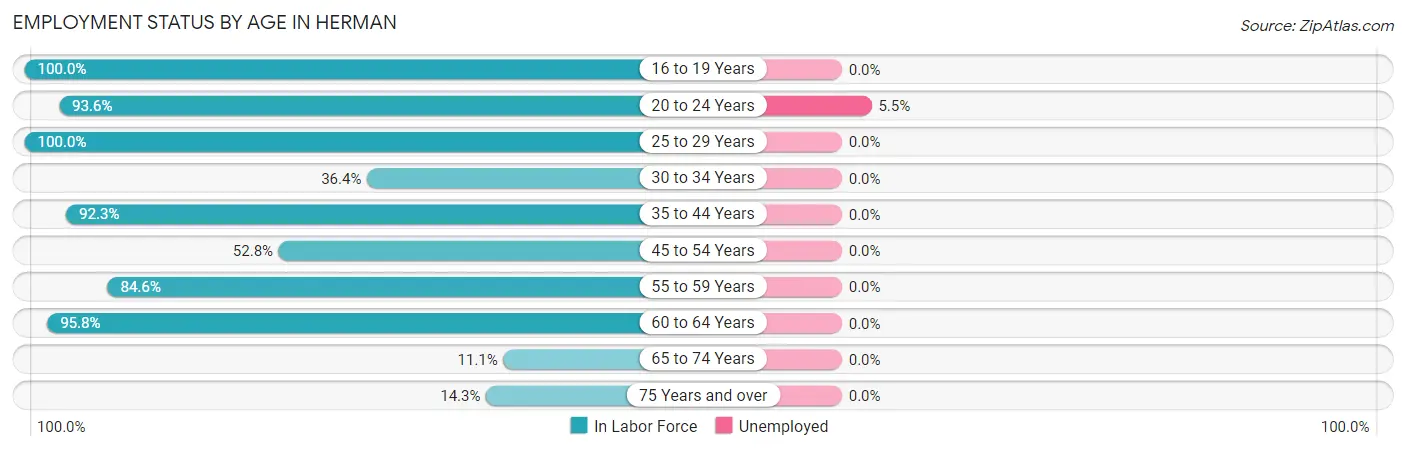
| Age Bracket | In Labor Force | Unemployed |
| 16 to 19 Years | 63 (100.0%) | 0 (0.0%) |
| 20 to 24 Years | 73 (93.6%) | 4 (5.5%) |
| 25 to 29 Years | 19 (100.0%) | 0 (0.0%) |
| 30 to 34 Years | 4 (36.4%) | 0 (0.0%) |
| 35 to 44 Years | 12 (92.3%) | 0 (0.0%) |
| 45 to 54 Years | 19 (52.8%) | 0 (0.0%) |
| 55 to 59 Years | 22 (84.6%) | 0 (0.0%) |
| 60 to 64 Years | 23 (95.8%) | 0 (0.0%) |
| 65 to 74 Years | 4 (11.1%) | 0 (0.0%) |
| 75 Years and over | 1 (14.3%) | 0 (0.0%) |
| Total | 240 (76.7%) | 4 (1.7%) |
Employment Status by Educational Attainment in Herman
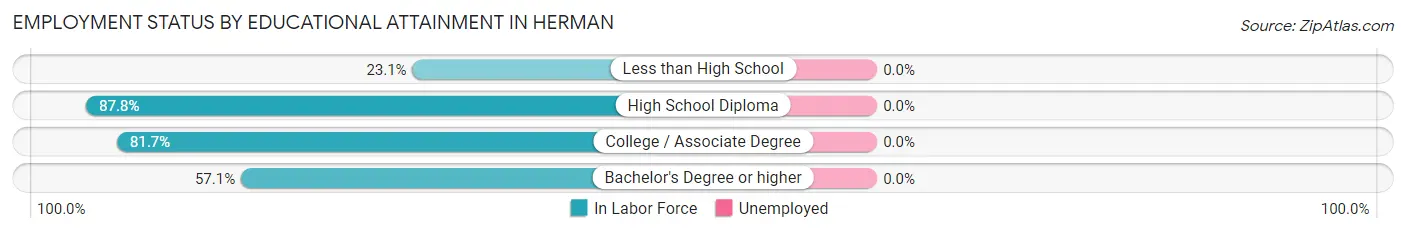
| Educational Attainment | In Labor Force | Unemployed |
| Less than High School | 3 (23.1%) | 0 (0.0%) |
| High School Diploma | 43 (87.8%) | 0 (0.0%) |
| College / Associate Degree | 49 (81.7%) | 0 (0.0%) |
| Bachelor's Degree or higher | 4 (57.1%) | 0 (0.0%) |
| Total | 99 (76.7%) | 0 (0.0%) |
Employment Occupations by Sex in Herman
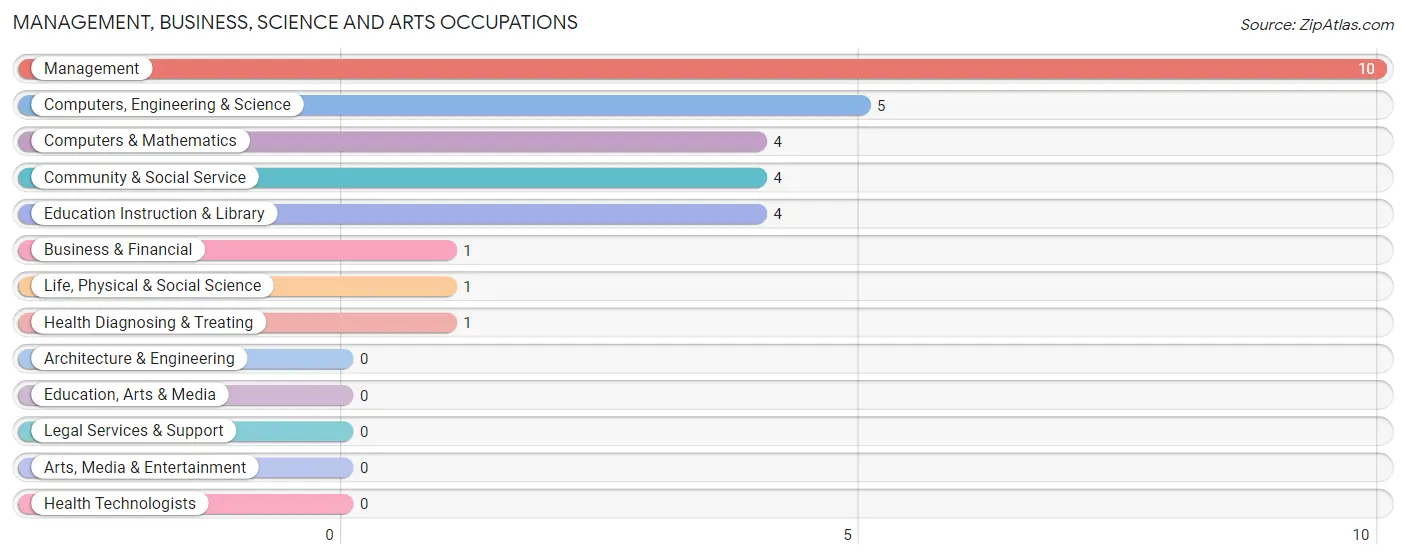
Management, Business, Science and Arts Occupations
The most common Management, Business, Science and Arts occupations in Herman are Management (10 | 4.2%), Computers, Engineering & Science (5 | 2.1%), Computers & Mathematics (4 | 1.7%), Community & Social Service (4 | 1.7%), and Education Instruction & Library (4 | 1.7%).
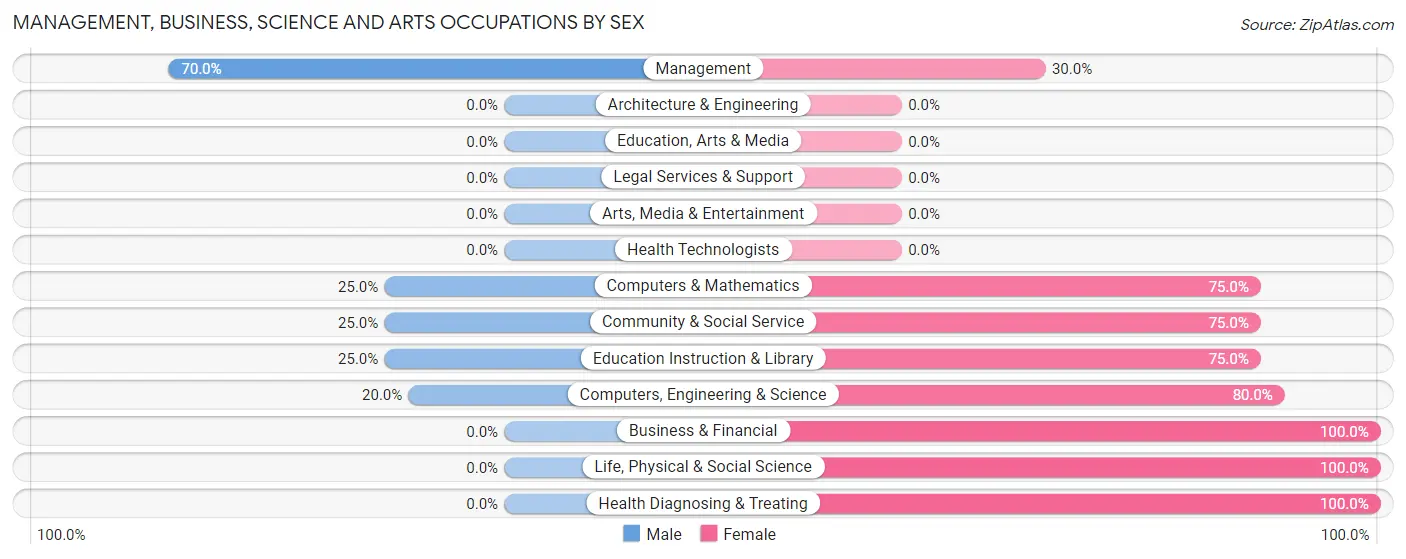
Management, Business, Science and Arts Occupations by Sex
Within the Management, Business, Science and Arts occupations in Herman, the most male-oriented occupations are Management (70.0%), Computers & Mathematics (25.0%), and Community & Social Service (25.0%), while the most female-oriented occupations are Business & Financial (100.0%), Life, Physical & Social Science (100.0%), and Health Diagnosing & Treating (100.0%).
| Occupation | Male | Female |
| Management | 7 (70.0%) | 3 (30.0%) |
| Business & Financial | 0 (0.0%) | 1 (100.0%) |
| Computers, Engineering & Science | 1 (20.0%) | 4 (80.0%) |
| Computers & Mathematics | 1 (25.0%) | 3 (75.0%) |
| Architecture & Engineering | 0 (0.0%) | 0 (0.0%) |
| Life, Physical & Social Science | 0 (0.0%) | 1 (100.0%) |
| Community & Social Service | 1 (25.0%) | 3 (75.0%) |
| Education, Arts & Media | 0 (0.0%) | 0 (0.0%) |
| Legal Services & Support | 0 (0.0%) | 0 (0.0%) |
| Education Instruction & Library | 1 (25.0%) | 3 (75.0%) |
| Arts, Media & Entertainment | 0 (0.0%) | 0 (0.0%) |
| Health Diagnosing & Treating | 0 (0.0%) | 1 (100.0%) |
| Health Technologists | 0 (0.0%) | 0 (0.0%) |
| Total (Category) | 9 (42.9%) | 12 (57.1%) |
| Total (Overall) | 143 (60.6%) | 93 (39.4%) |
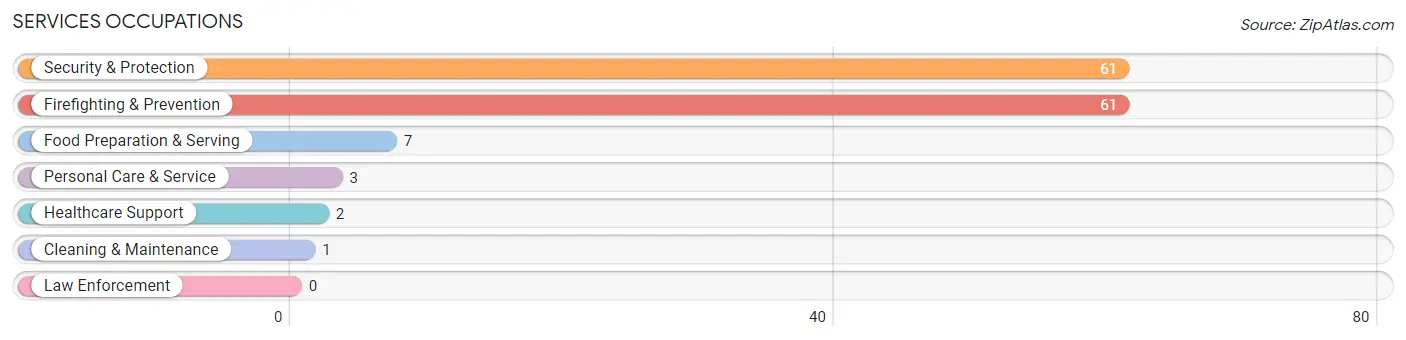
Services Occupations
The most common Services occupations in Herman are Security & Protection (61 | 25.9%), Firefighting & Prevention (61 | 25.9%), Food Preparation & Serving (7 | 3.0%), Personal Care & Service (3 | 1.3%), and Healthcare Support (2 | 0.9%).
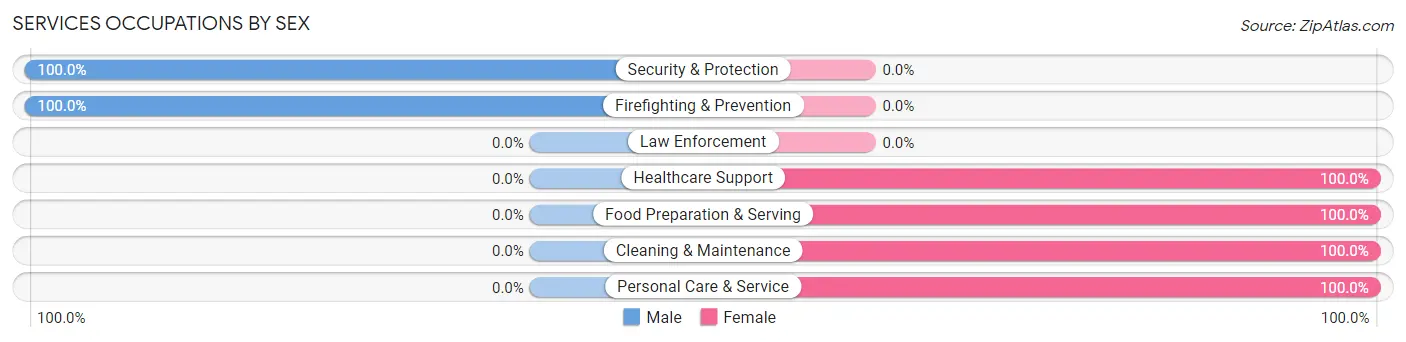
Services Occupations by Sex
Within the Services occupations in Herman, the most male-oriented occupations are Security & Protection (100.0%), and Firefighting & Prevention (100.0%), while the most female-oriented occupations are Healthcare Support (100.0%), Food Preparation & Serving (100.0%), and Cleaning & Maintenance (100.0%).
| Occupation | Male | Female |
| Healthcare Support | 0 (0.0%) | 2 (100.0%) |
| Security & Protection | 61 (100.0%) | 0 (0.0%) |
| Firefighting & Prevention | 61 (100.0%) | 0 (0.0%) |
| Law Enforcement | 0 (0.0%) | 0 (0.0%) |
| Food Preparation & Serving | 0 (0.0%) | 7 (100.0%) |
| Cleaning & Maintenance | 0 (0.0%) | 1 (100.0%) |
| Personal Care & Service | 0 (0.0%) | 3 (100.0%) |
| Total (Category) | 61 (82.4%) | 13 (17.6%) |
| Total (Overall) | 143 (60.6%) | 93 (39.4%) |
Sales and Office Occupations
The most common Sales and Office occupations in Herman are Office & Administration (52 | 22.0%), and Sales & Related (12 | 5.1%).
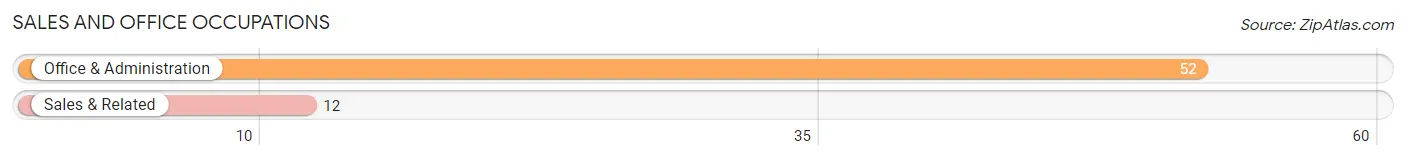
Sales and Office Occupations by Sex
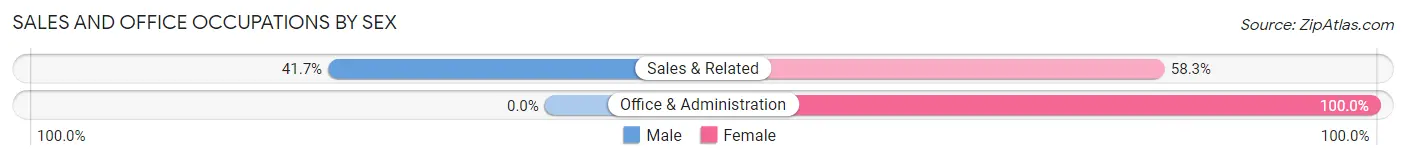
| Occupation | Male | Female |
| Sales & Related | 5 (41.7%) | 7 (58.3%) |
| Office & Administration | 0 (0.0%) | 52 (100.0%) |
| Total (Category) | 5 (7.8%) | 59 (92.2%) |
| Total (Overall) | 143 (60.6%) | 93 (39.4%) |
Natural Resources, Construction and Maintenance Occupations
The most common Natural Resources, Construction and Maintenance occupations in Herman are Construction & Extraction (35 | 14.8%), and Installation, Maintenance & Repair (20 | 8.5%).
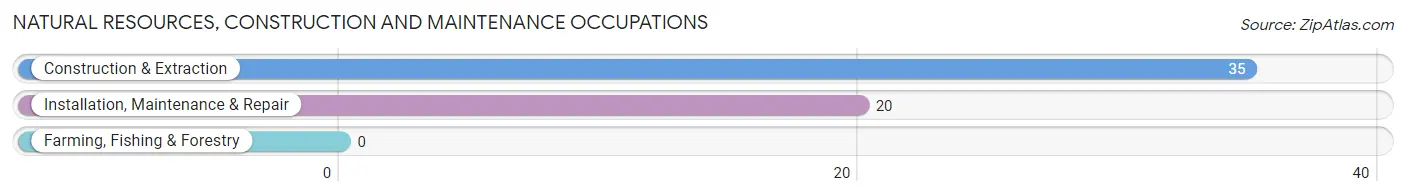
Natural Resources, Construction and Maintenance Occupations by Sex
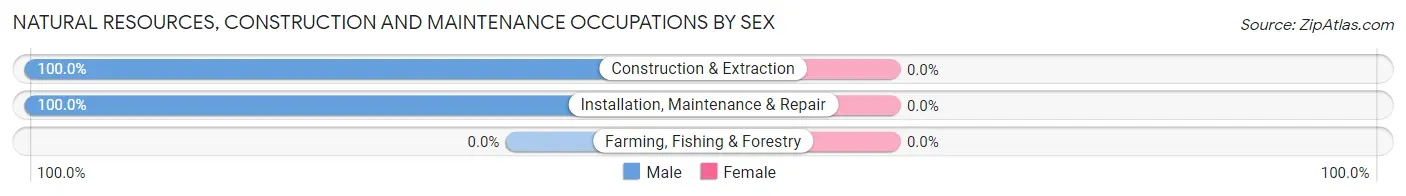
| Occupation | Male | Female |
| Farming, Fishing & Forestry | 0 (0.0%) | 0 (0.0%) |
| Construction & Extraction | 35 (100.0%) | 0 (0.0%) |
| Installation, Maintenance & Repair | 20 (100.0%) | 0 (0.0%) |
| Total (Category) | 55 (100.0%) | 0 (0.0%) |
| Total (Overall) | 143 (60.6%) | 93 (39.4%) |
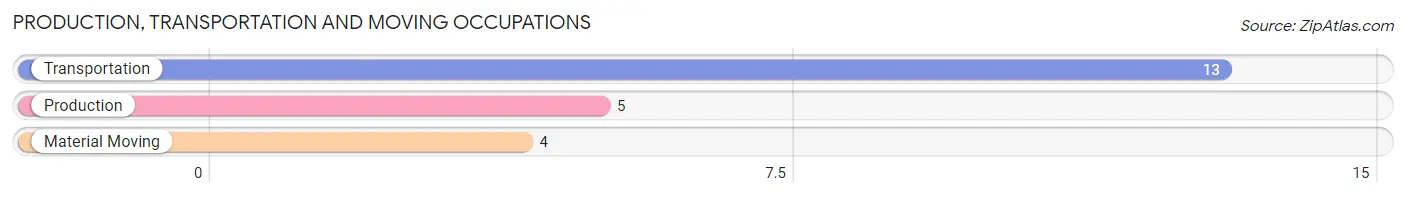
Production, Transportation and Moving Occupations
The most common Production, Transportation and Moving occupations in Herman are Transportation (13 | 5.5%), Production (5 | 2.1%), and Material Moving (4 | 1.7%).
Production, Transportation and Moving Occupations by Sex
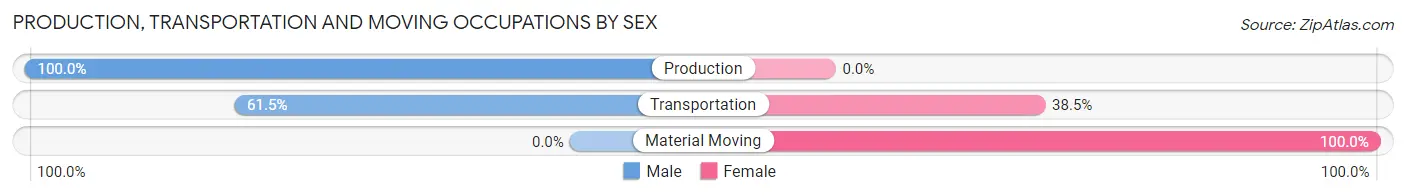
| Occupation | Male | Female |
| Production | 5 (100.0%) | 0 (0.0%) |
| Transportation | 8 (61.5%) | 5 (38.5%) |
| Material Moving | 0 (0.0%) | 4 (100.0%) |
| Total (Category) | 13 (59.1%) | 9 (40.9%) |
| Total (Overall) | 143 (60.6%) | 93 (39.4%) |
Employment Industries by Sex in Herman
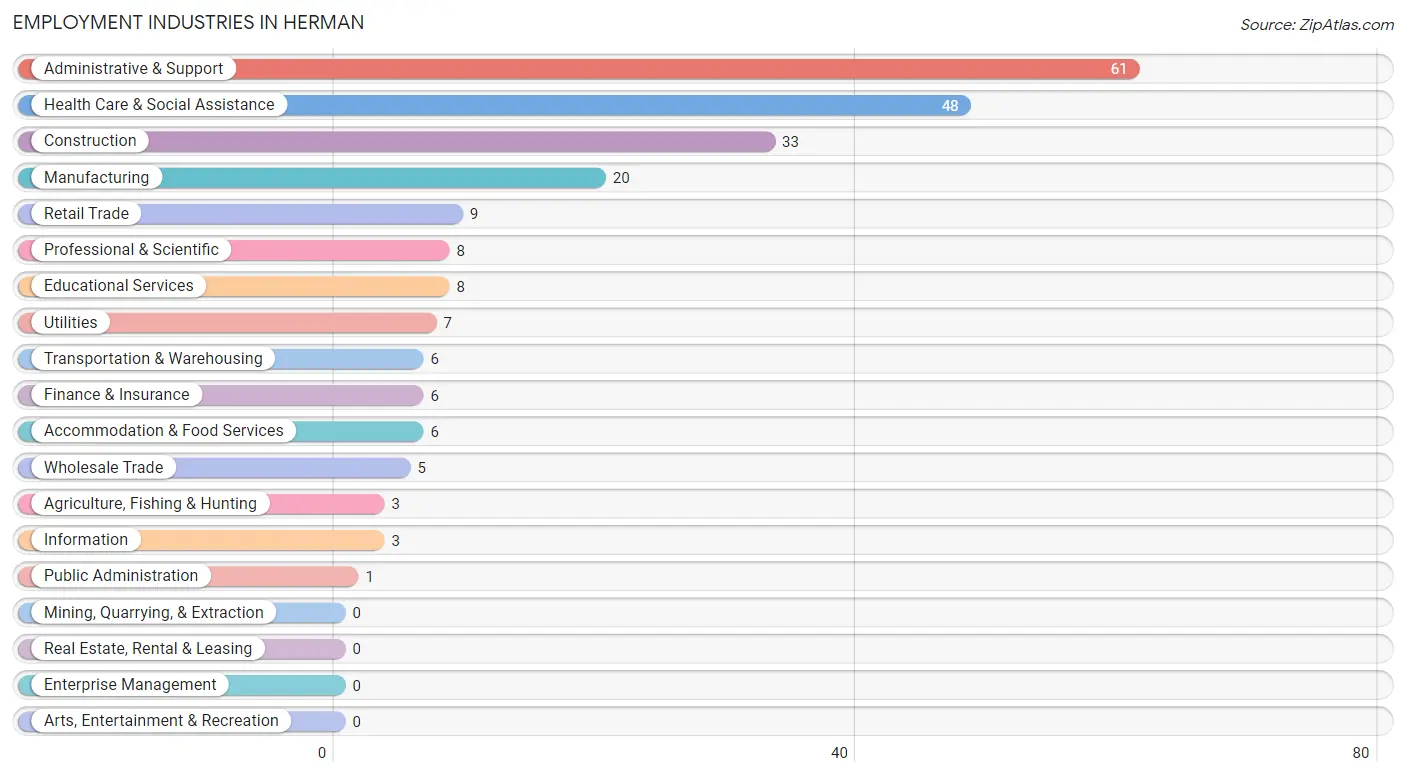
Employment Industries in Herman
The major employment industries in Herman include Administrative & Support (61 | 25.9%), Health Care & Social Assistance (48 | 20.3%), Construction (33 | 14.0%), Manufacturing (20 | 8.5%), and Retail Trade (9 | 3.8%).
Employment Industries by Sex in Herman
The Herman industries that see more men than women are Construction (100.0%), Wholesale Trade (100.0%), and Retail Trade (100.0%), whereas the industries that tend to have a higher number of women are Utilities (100.0%), Educational Services (100.0%), and Health Care & Social Assistance (100.0%).
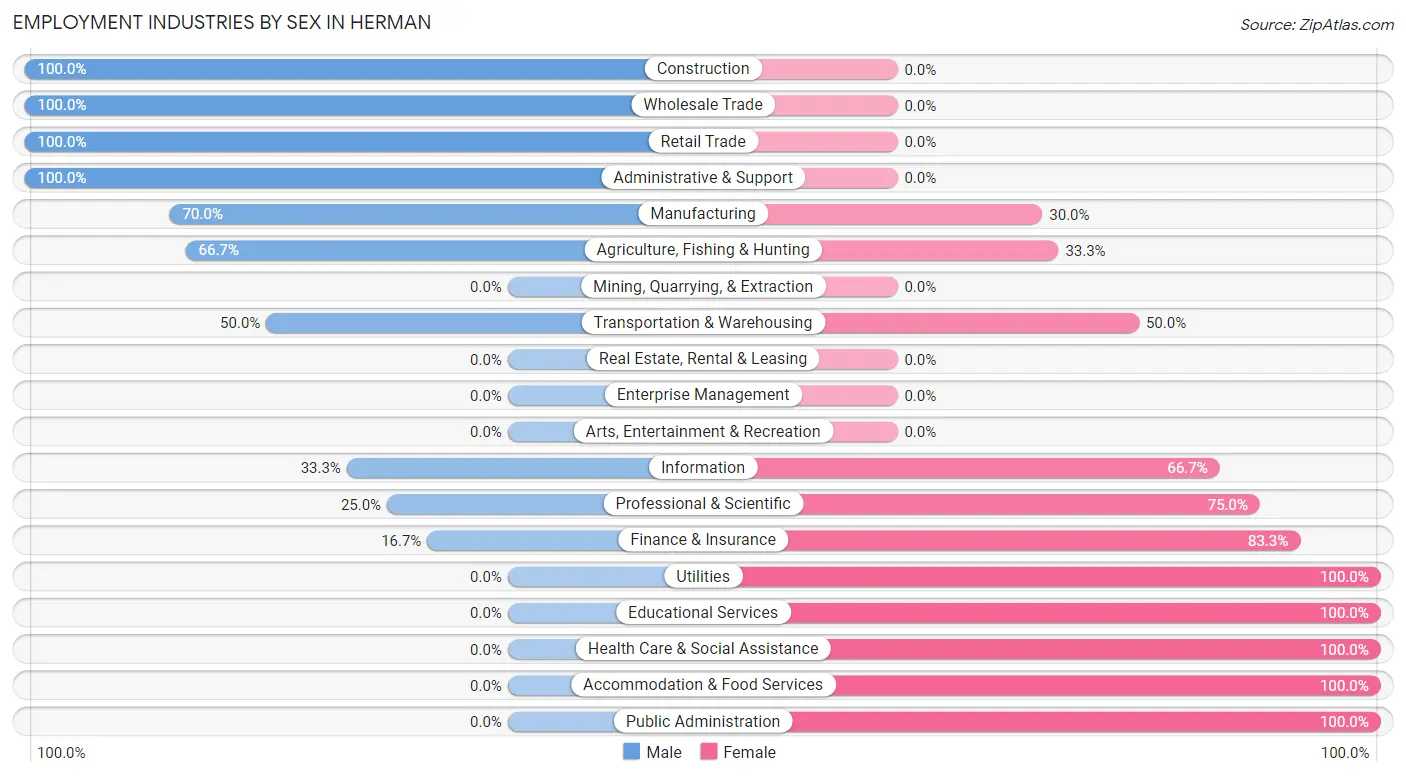
| Industry | Male | Female |
| Agriculture, Fishing & Hunting | 2 (66.7%) | 1 (33.3%) |
| Mining, Quarrying, & Extraction | 0 (0.0%) | 0 (0.0%) |
| Construction | 33 (100.0%) | 0 (0.0%) |
| Manufacturing | 14 (70.0%) | 6 (30.0%) |
| Wholesale Trade | 5 (100.0%) | 0 (0.0%) |
| Retail Trade | 9 (100.0%) | 0 (0.0%) |
| Transportation & Warehousing | 3 (50.0%) | 3 (50.0%) |
| Utilities | 0 (0.0%) | 7 (100.0%) |
| Information | 1 (33.3%) | 2 (66.7%) |
| Finance & Insurance | 1 (16.7%) | 5 (83.3%) |
| Real Estate, Rental & Leasing | 0 (0.0%) | 0 (0.0%) |
| Professional & Scientific | 2 (25.0%) | 6 (75.0%) |
| Enterprise Management | 0 (0.0%) | 0 (0.0%) |
| Administrative & Support | 61 (100.0%) | 0 (0.0%) |
| Educational Services | 0 (0.0%) | 8 (100.0%) |
| Health Care & Social Assistance | 0 (0.0%) | 48 (100.0%) |
| Arts, Entertainment & Recreation | 0 (0.0%) | 0 (0.0%) |
| Accommodation & Food Services | 0 (0.0%) | 6 (100.0%) |
| Public Administration | 0 (0.0%) | 1 (100.0%) |
| Total | 143 (60.6%) | 93 (39.4%) |
Education in Herman
School Enrollment in Herman
The most common levels of schooling among the 21 students in Herman are elementary school (16 | 76.2%), middle school (4 | 19.1%), and high school (1 | 4.8%).
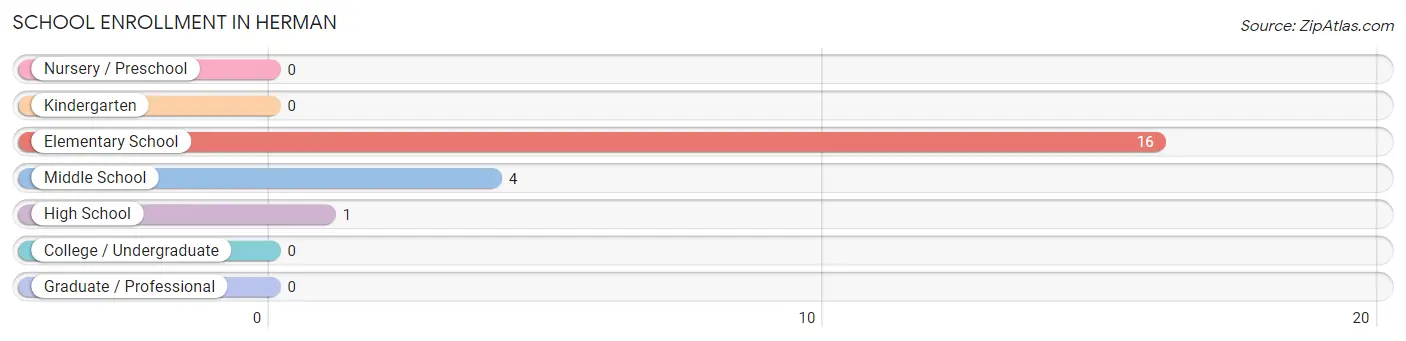
| School Level | # Students | % Students |
| Nursery / Preschool | 0 | 0.0% |
| Kindergarten | 0 | 0.0% |
| Elementary School | 16 | 76.2% |
| Middle School | 4 | 19.1% |
| High School | 1 | 4.8% |
| College / Undergraduate | 0 | 0.0% |
| Graduate / Professional | 0 | 0.0% |
| Total | 21 | 100.0% |
School Enrollment by Age by Funding Source in Herman
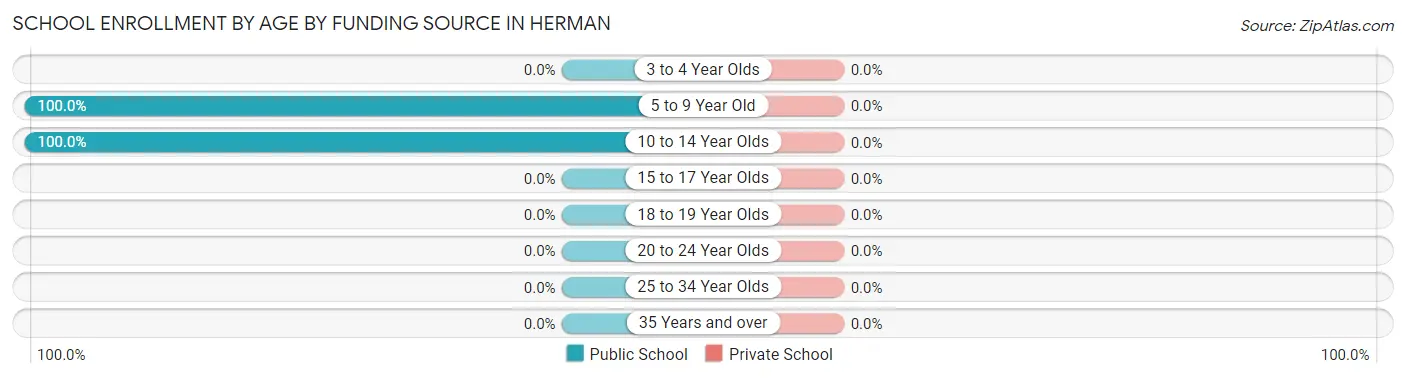
| Age Bracket | Public School | Private School |
| 3 to 4 Year Olds | 0 (0.0%) | 0 (0.0%) |
| 5 to 9 Year Old | 9 (100.0%) | 0 (0.0%) |
| 10 to 14 Year Olds | 12 (100.0%) | 0 (0.0%) |
| 15 to 17 Year Olds | 0 (0.0%) | 0 (0.0%) |
| 18 to 19 Year Olds | 0 (0.0%) | 0 (0.0%) |
| 20 to 24 Year Olds | 0 (0.0%) | 0 (0.0%) |
| 25 to 34 Year Olds | 0 (0.0%) | 0 (0.0%) |
| 35 Years and over | 0 (0.0%) | 0 (0.0%) |
| Total | 21 (100.0%) | 0 (0.0%) |
Educational Attainment by Field of Study in Herman
Business (2 | 22.2%), communications (2 | 22.2%), computers & mathematics (1 | 11.1%), social sciences (1 | 11.1%), and engineering (1 | 11.1%) are the most common fields of study among 9 individuals in Herman who have obtained a bachelor's degree or higher.
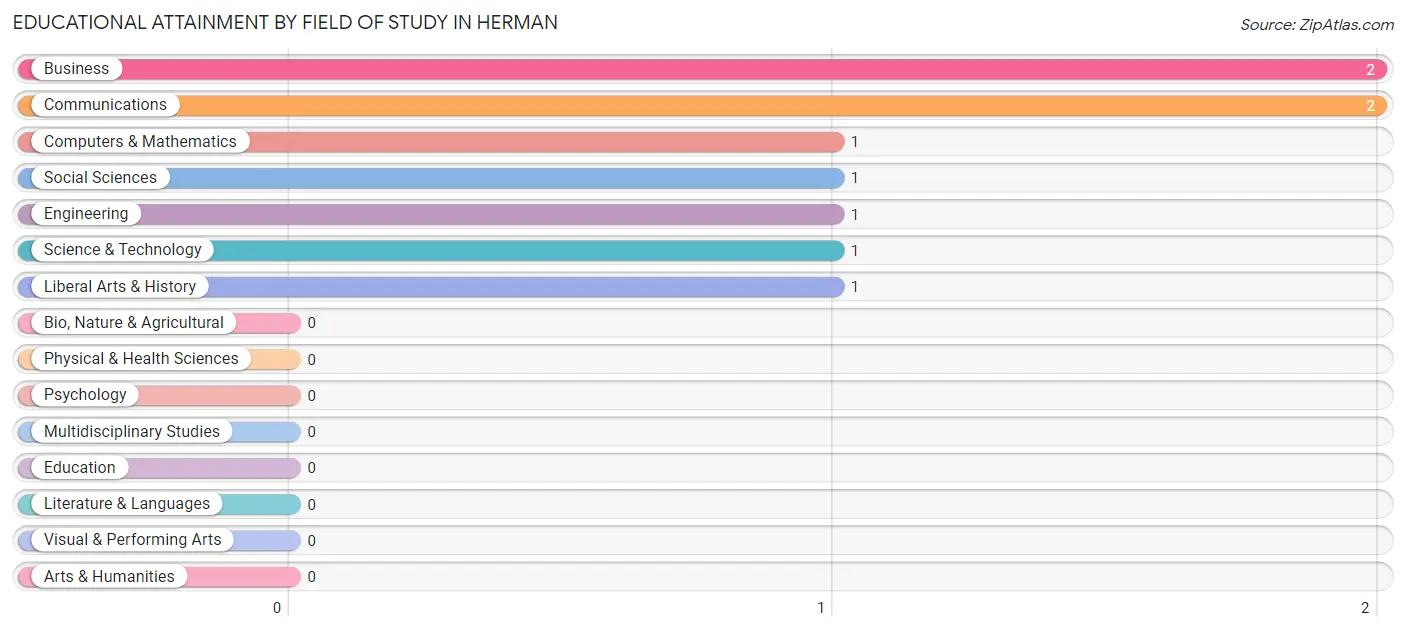
| Field of Study | # Graduates | % Graduates |
| Computers & Mathematics | 1 | 11.1% |
| Bio, Nature & Agricultural | 0 | 0.0% |
| Physical & Health Sciences | 0 | 0.0% |
| Psychology | 0 | 0.0% |
| Social Sciences | 1 | 11.1% |
| Engineering | 1 | 11.1% |
| Multidisciplinary Studies | 0 | 0.0% |
| Science & Technology | 1 | 11.1% |
| Business | 2 | 22.2% |
| Education | 0 | 0.0% |
| Literature & Languages | 0 | 0.0% |
| Liberal Arts & History | 1 | 11.1% |
| Visual & Performing Arts | 0 | 0.0% |
| Communications | 2 | 22.2% |
| Arts & Humanities | 0 | 0.0% |
| Total | 9 | 100.0% |
Transportation & Commute in Herman
Vehicle Availability by Sex in Herman
The most prevalent vehicle ownership categories in Herman are males with 3 vehicles (106, accounting for 74.1%) and females with 3 vehicles (56, making up 120.4%).
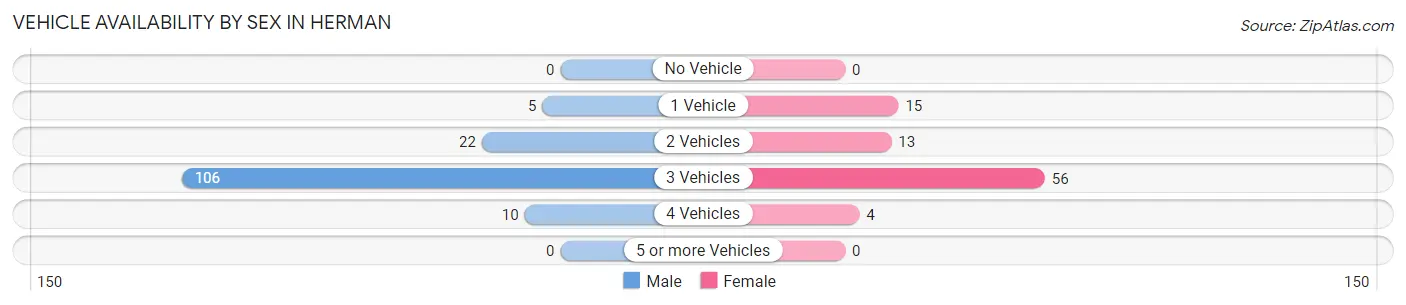
| Vehicles Available | Male | Female |
| No Vehicle | 0 (0.0%) | 0 (0.0%) |
| 1 Vehicle | 5 (3.5%) | 15 (17.1%) |
| 2 Vehicles | 22 (15.4%) | 13 (14.8%) |
| 3 Vehicles | 106 (74.1%) | 56 (63.6%) |
| 4 Vehicles | 10 (7.0%) | 4 (4.5%) |
| 5 or more Vehicles | 0 (0.0%) | 0 (0.0%) |
| Total | 143 (100.0%) | 88 (100.0%) |
Commute Time in Herman
The most frequently occuring commute durations in Herman are 45 to 59 minutes (150 commuters, 68.5%), 20 to 24 minutes (16 commuters, 7.3%), and 15 to 19 minutes (15 commuters, 6.9%).
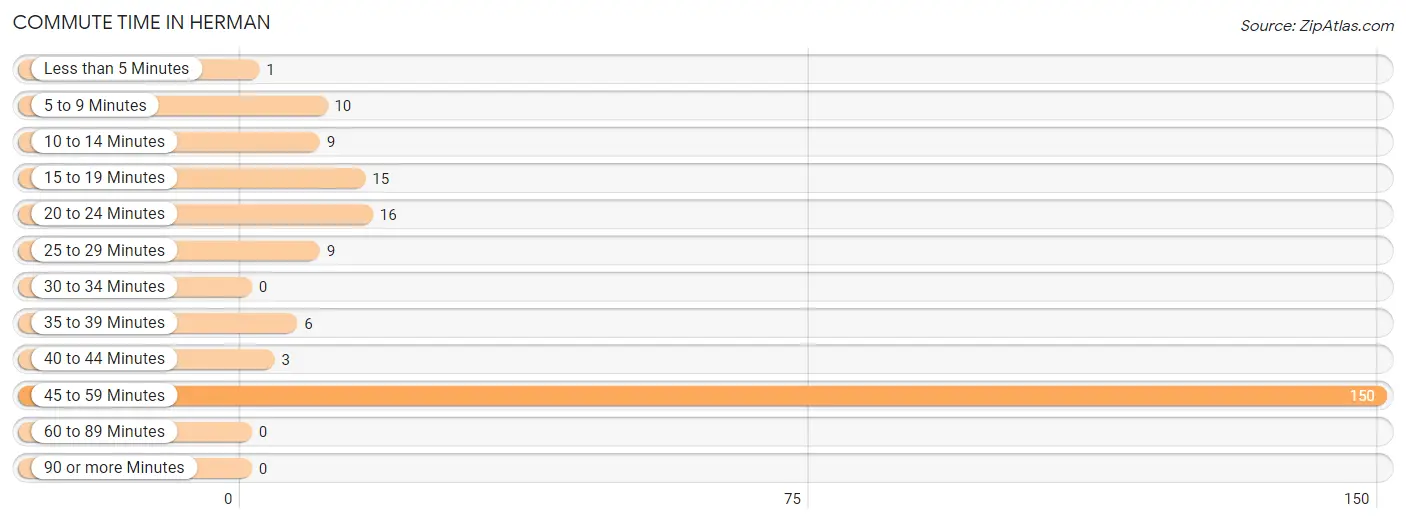
| Commute Time | # Commuters | % Commuters |
| Less than 5 Minutes | 1 | 0.5% |
| 5 to 9 Minutes | 10 | 4.6% |
| 10 to 14 Minutes | 9 | 4.1% |
| 15 to 19 Minutes | 15 | 6.9% |
| 20 to 24 Minutes | 16 | 7.3% |
| 25 to 29 Minutes | 9 | 4.1% |
| 30 to 34 Minutes | 0 | 0.0% |
| 35 to 39 Minutes | 6 | 2.7% |
| 40 to 44 Minutes | 3 | 1.4% |
| 45 to 59 Minutes | 150 | 68.5% |
| 60 to 89 Minutes | 0 | 0.0% |
| 90 or more Minutes | 0 | 0.0% |
Commute Time by Sex in Herman
The most common commute times in Herman are 45 to 59 minutes (101 commuters, 75.4%) for males and 45 to 59 minutes (49 commuters, 57.7%) for females.
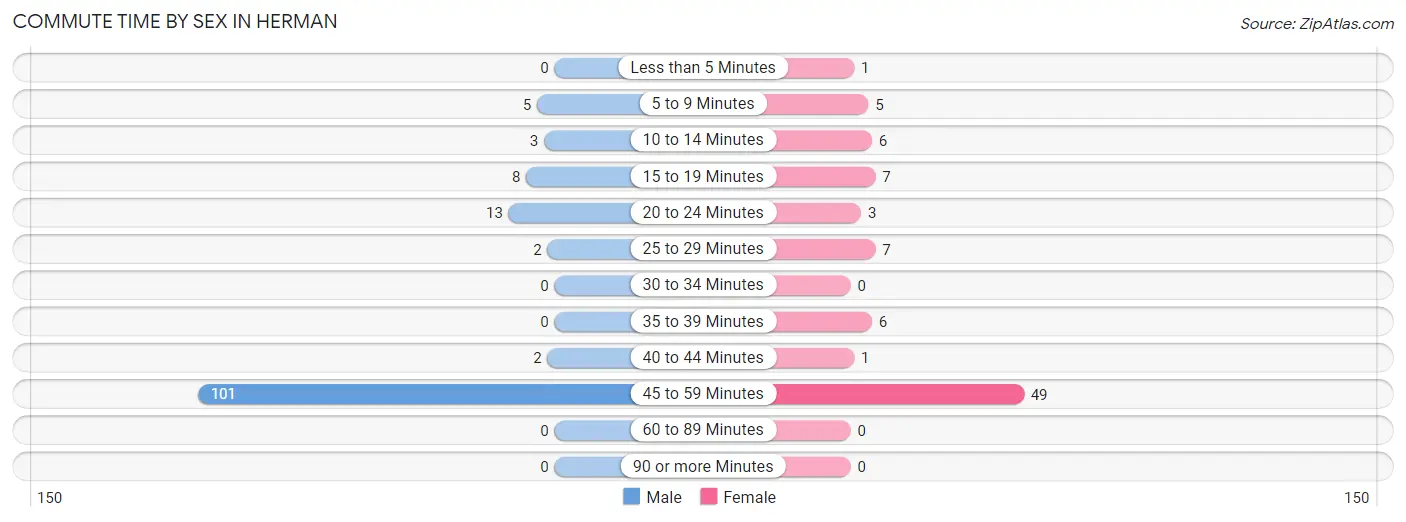
| Commute Time | Male | Female |
| Less than 5 Minutes | 0 (0.0%) | 1 (1.2%) |
| 5 to 9 Minutes | 5 (3.7%) | 5 (5.9%) |
| 10 to 14 Minutes | 3 (2.2%) | 6 (7.1%) |
| 15 to 19 Minutes | 8 (6.0%) | 7 (8.2%) |
| 20 to 24 Minutes | 13 (9.7%) | 3 (3.5%) |
| 25 to 29 Minutes | 2 (1.5%) | 7 (8.2%) |
| 30 to 34 Minutes | 0 (0.0%) | 0 (0.0%) |
| 35 to 39 Minutes | 0 (0.0%) | 6 (7.1%) |
| 40 to 44 Minutes | 2 (1.5%) | 1 (1.2%) |
| 45 to 59 Minutes | 101 (75.4%) | 49 (57.7%) |
| 60 to 89 Minutes | 0 (0.0%) | 0 (0.0%) |
| 90 or more Minutes | 0 (0.0%) | 0 (0.0%) |
Time of Departure to Work by Sex in Herman
The most frequent times of departure to work in Herman are 5:00 AM to 5:29 AM (61, 45.5%) for males and 7:00 AM to 7:29 AM (42, 49.4%) for females.
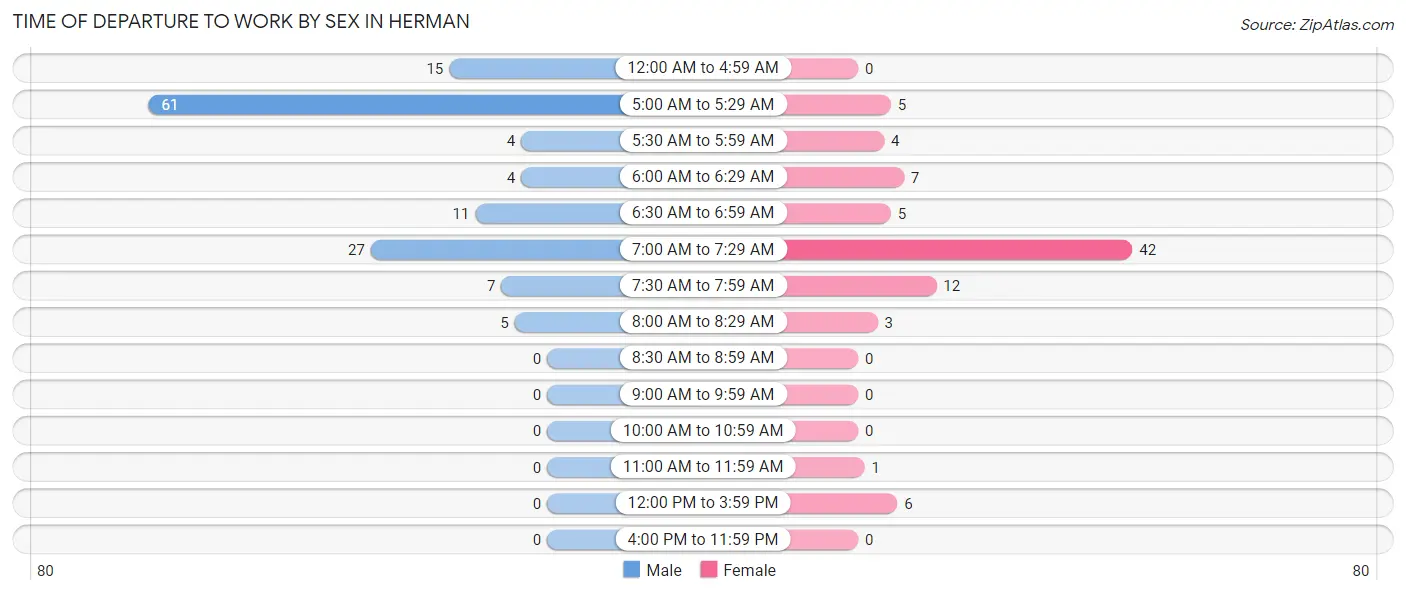
| Time of Departure | Male | Female |
| 12:00 AM to 4:59 AM | 15 (11.2%) | 0 (0.0%) |
| 5:00 AM to 5:29 AM | 61 (45.5%) | 5 (5.9%) |
| 5:30 AM to 5:59 AM | 4 (3.0%) | 4 (4.7%) |
| 6:00 AM to 6:29 AM | 4 (3.0%) | 7 (8.2%) |
| 6:30 AM to 6:59 AM | 11 (8.2%) | 5 (5.9%) |
| 7:00 AM to 7:29 AM | 27 (20.2%) | 42 (49.4%) |
| 7:30 AM to 7:59 AM | 7 (5.2%) | 12 (14.1%) |
| 8:00 AM to 8:29 AM | 5 (3.7%) | 3 (3.5%) |
| 8:30 AM to 8:59 AM | 0 (0.0%) | 0 (0.0%) |
| 9:00 AM to 9:59 AM | 0 (0.0%) | 0 (0.0%) |
| 10:00 AM to 10:59 AM | 0 (0.0%) | 0 (0.0%) |
| 11:00 AM to 11:59 AM | 0 (0.0%) | 1 (1.2%) |
| 12:00 PM to 3:59 PM | 0 (0.0%) | 6 (7.1%) |
| 4:00 PM to 11:59 PM | 0 (0.0%) | 0 (0.0%) |
| Total | 134 (100.0%) | 85 (100.0%) |
Housing Occupancy in Herman
Occupancy by Ownership in Herman
Of the total 144 dwellings in Herman, owner-occupied units account for 87 (60.4%), while renter-occupied units make up 57 (39.6%).
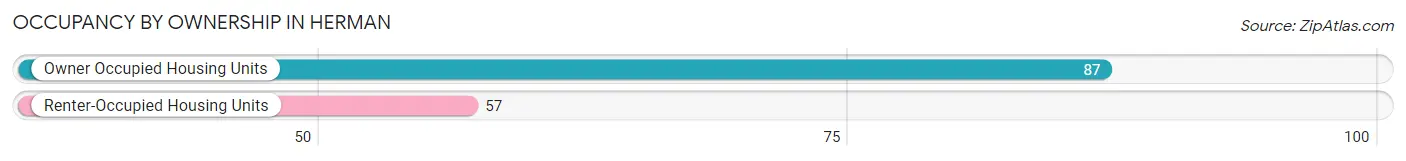
| Occupancy | # Housing Units | % Housing Units |
| Owner Occupied Housing Units | 87 | 60.4% |
| Renter-Occupied Housing Units | 57 | 39.6% |
| Total Occupied Housing Units | 144 | 100.0% |
Occupancy by Household Size in Herman
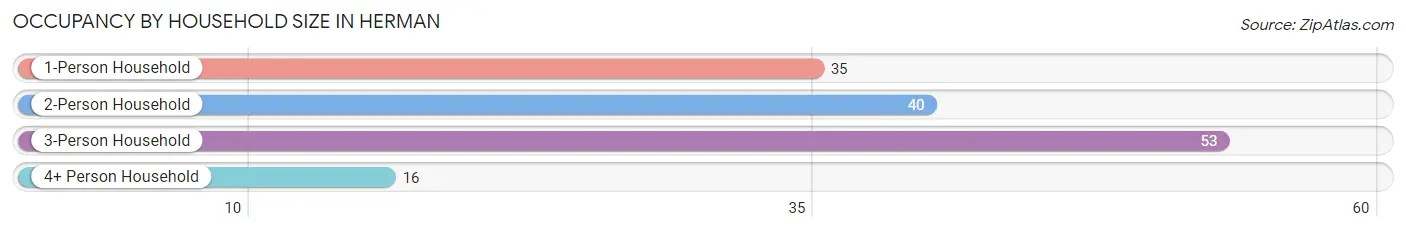
| Household Size | # Housing Units | % Housing Units |
| 1-Person Household | 35 | 24.3% |
| 2-Person Household | 40 | 27.8% |
| 3-Person Household | 53 | 36.8% |
| 4+ Person Household | 16 | 11.1% |
| Total Housing Units | 144 | 100.0% |
Occupancy by Ownership by Household Size in Herman
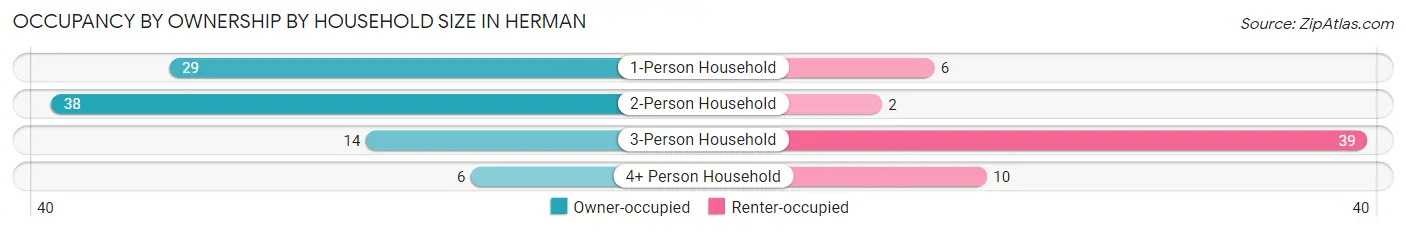
| Household Size | Owner-occupied | Renter-occupied |
| 1-Person Household | 29 (82.9%) | 6 (17.1%) |
| 2-Person Household | 38 (95.0%) | 2 (5.0%) |
| 3-Person Household | 14 (26.4%) | 39 (73.6%) |
| 4+ Person Household | 6 (37.5%) | 10 (62.5%) |
| Total Housing Units | 87 (60.4%) | 57 (39.6%) |
Occupancy by Educational Attainment in Herman
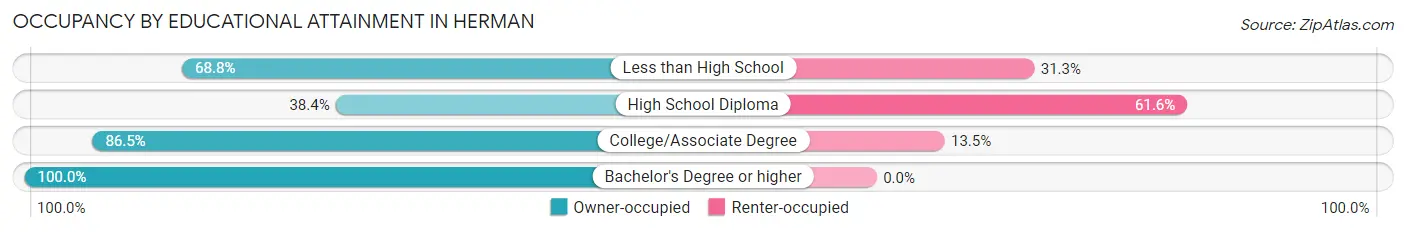
| Household Size | Owner-occupied | Renter-occupied |
| Less than High School | 11 (68.8%) | 5 (31.2%) |
| High School Diploma | 28 (38.4%) | 45 (61.6%) |
| College/Associate Degree | 45 (86.5%) | 7 (13.5%) |
| Bachelor's Degree or higher | 3 (100.0%) | 0 (0.0%) |
Occupancy by Age of Householder in Herman
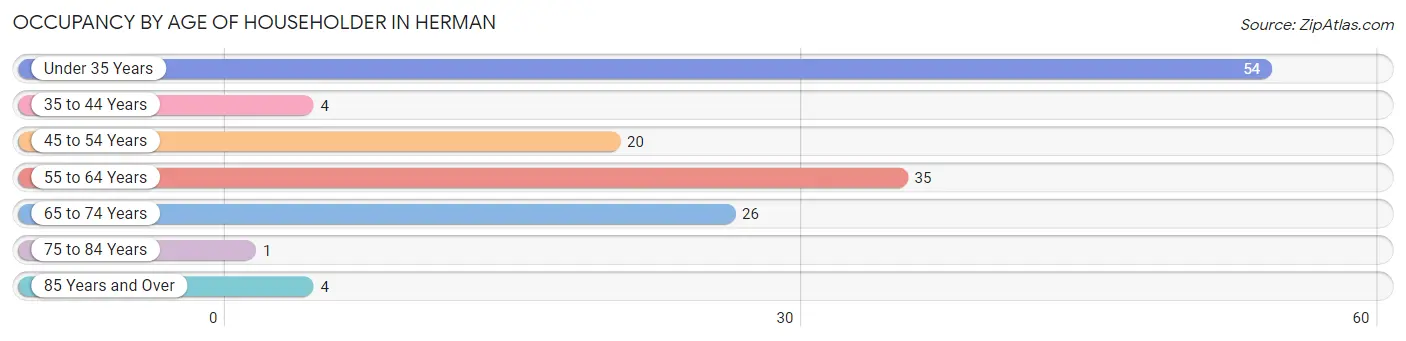
| Age Bracket | # Households | % Households |
| Under 35 Years | 54 | 37.5% |
| 35 to 44 Years | 4 | 2.8% |
| 45 to 54 Years | 20 | 13.9% |
| 55 to 64 Years | 35 | 24.3% |
| 65 to 74 Years | 26 | 18.1% |
| 75 to 84 Years | 1 | 0.7% |
| 85 Years and Over | 4 | 2.8% |
| Total | 144 | 100.0% |
Housing Finances in Herman
Median Income by Occupancy in Herman
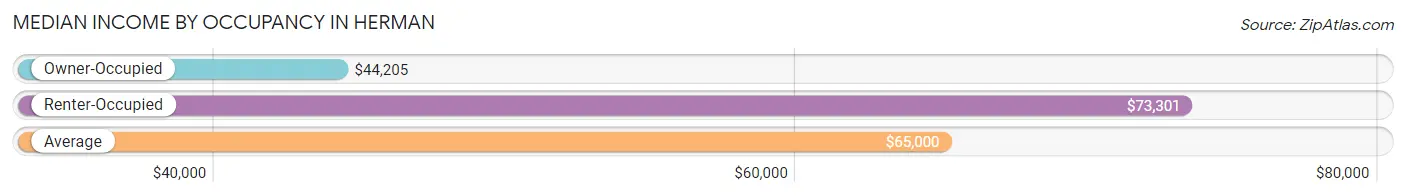
| Occupancy Type | # Households | Median Income |
| Owner-Occupied | 87 (60.4%) | $44,205 |
| Renter-Occupied | 57 (39.6%) | $73,301 |
| Average | 144 (100.0%) | $65,000 |
Occupancy by Householder Income Bracket in Herman
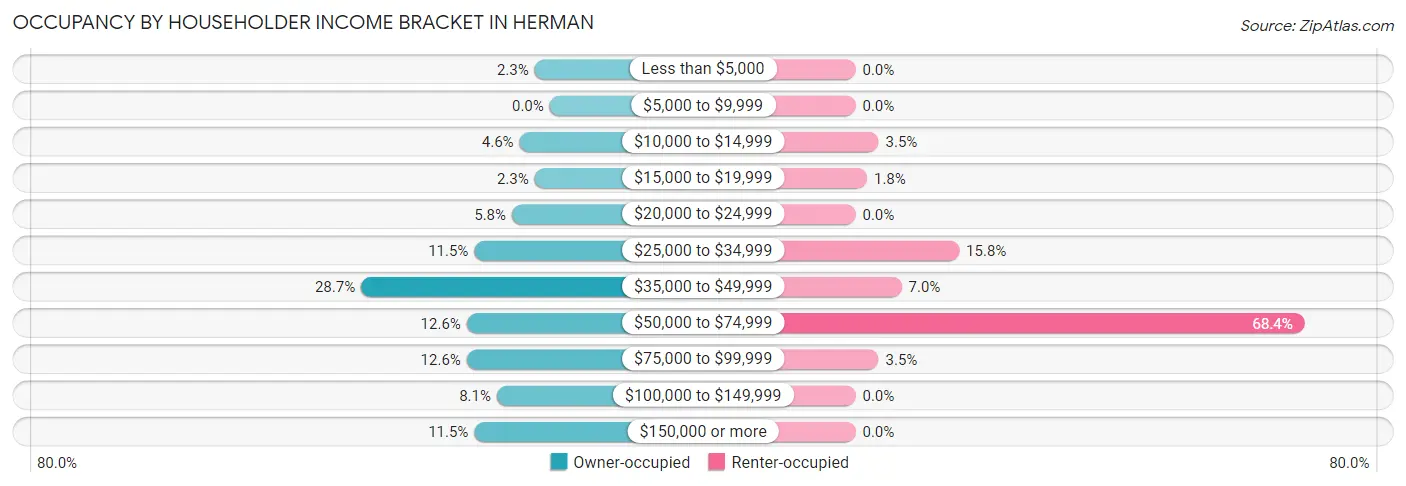
| Income Bracket | Owner-occupied | Renter-occupied |
| Less than $5,000 | 2 (2.3%) | 0 (0.0%) |
| $5,000 to $9,999 | 0 (0.0%) | 0 (0.0%) |
| $10,000 to $14,999 | 4 (4.6%) | 2 (3.5%) |
| $15,000 to $19,999 | 2 (2.3%) | 1 (1.8%) |
| $20,000 to $24,999 | 5 (5.8%) | 0 (0.0%) |
| $25,000 to $34,999 | 10 (11.5%) | 9 (15.8%) |
| $35,000 to $49,999 | 25 (28.7%) | 4 (7.0%) |
| $50,000 to $74,999 | 11 (12.6%) | 39 (68.4%) |
| $75,000 to $99,999 | 11 (12.6%) | 2 (3.5%) |
| $100,000 to $149,999 | 7 (8.1%) | 0 (0.0%) |
| $150,000 or more | 10 (11.5%) | 0 (0.0%) |
| Total | 87 (100.0%) | 57 (100.0%) |
Monthly Housing Cost Tiers in Herman
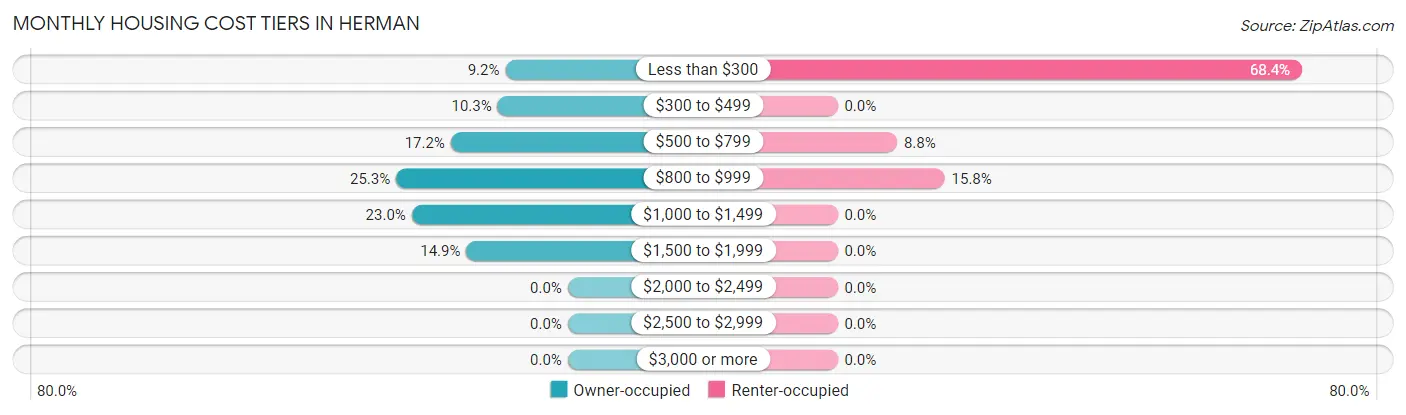
| Monthly Cost | Owner-occupied | Renter-occupied |
| Less than $300 | 8 (9.2%) | 39 (68.4%) |
| $300 to $499 | 9 (10.3%) | 0 (0.0%) |
| $500 to $799 | 15 (17.2%) | 5 (8.8%) |
| $800 to $999 | 22 (25.3%) | 9 (15.8%) |
| $1,000 to $1,499 | 20 (23.0%) | 0 (0.0%) |
| $1,500 to $1,999 | 13 (14.9%) | 0 (0.0%) |
| $2,000 to $2,499 | 0 (0.0%) | 0 (0.0%) |
| $2,500 to $2,999 | 0 (0.0%) | 0 (0.0%) |
| $3,000 or more | 0 (0.0%) | 0 (0.0%) |
| Total | 87 (100.0%) | 57 (100.0%) |
Physical Housing Characteristics in Herman
Housing Structures in Herman
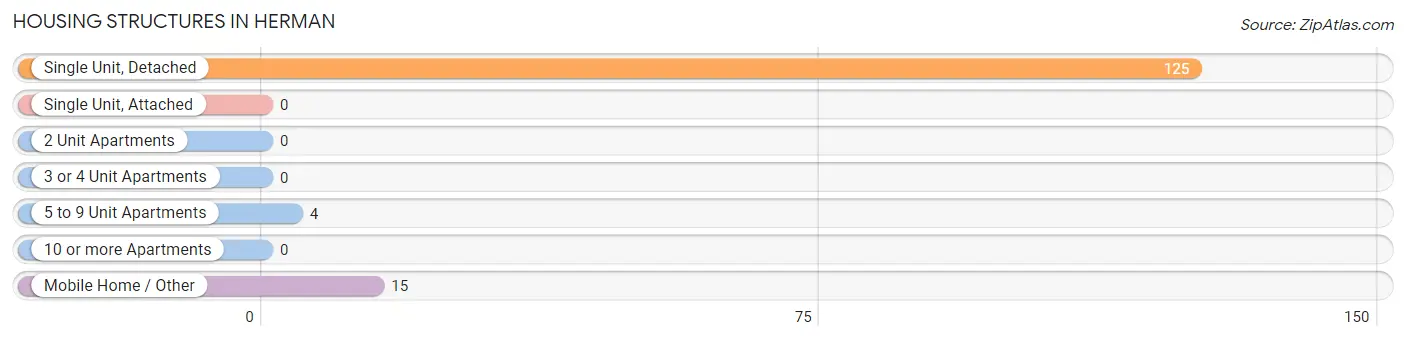
| Structure Type | # Housing Units | % Housing Units |
| Single Unit, Detached | 125 | 86.8% |
| Single Unit, Attached | 0 | 0.0% |
| 2 Unit Apartments | 0 | 0.0% |
| 3 or 4 Unit Apartments | 0 | 0.0% |
| 5 to 9 Unit Apartments | 4 | 2.8% |
| 10 or more Apartments | 0 | 0.0% |
| Mobile Home / Other | 15 | 10.4% |
| Total | 144 | 100.0% |
Housing Structures by Occupancy in Herman
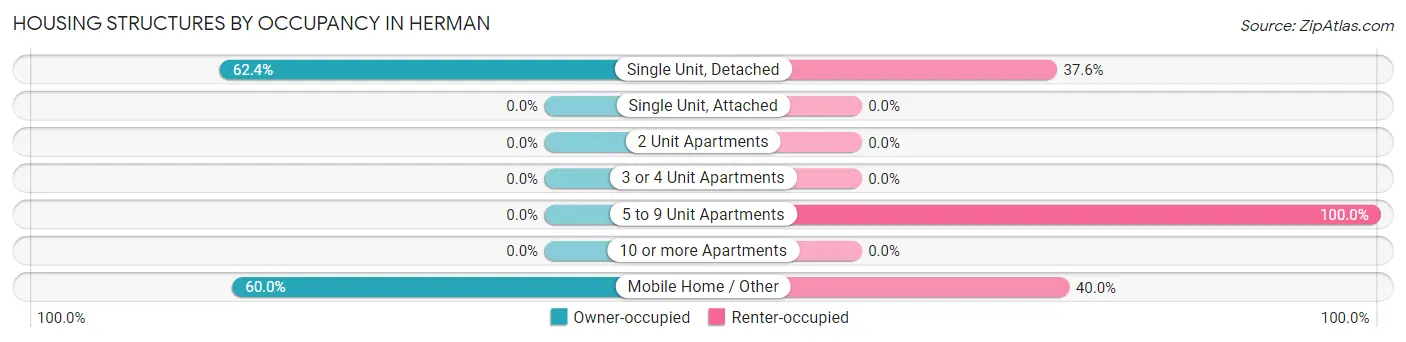
| Structure Type | Owner-occupied | Renter-occupied |
| Single Unit, Detached | 78 (62.4%) | 47 (37.6%) |
| Single Unit, Attached | 0 (0.0%) | 0 (0.0%) |
| 2 Unit Apartments | 0 (0.0%) | 0 (0.0%) |
| 3 or 4 Unit Apartments | 0 (0.0%) | 0 (0.0%) |
| 5 to 9 Unit Apartments | 0 (0.0%) | 4 (100.0%) |
| 10 or more Apartments | 0 (0.0%) | 0 (0.0%) |
| Mobile Home / Other | 9 (60.0%) | 6 (40.0%) |
| Total | 87 (60.4%) | 57 (39.6%) |
Housing Structures by Number of Rooms in Herman
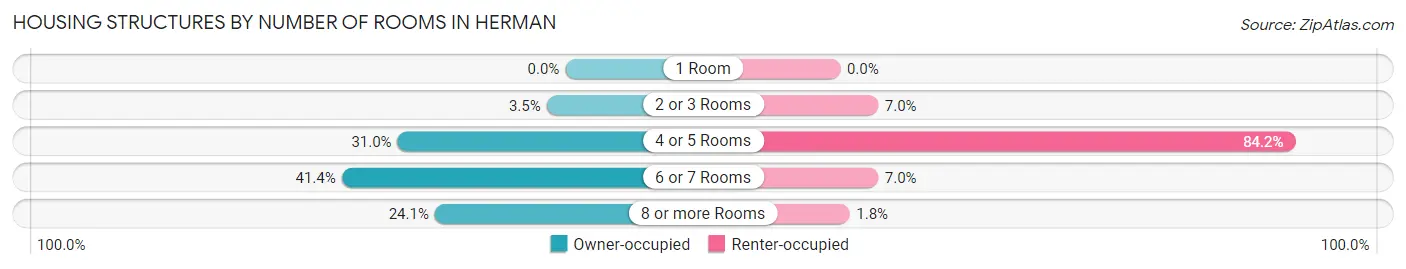
| Number of Rooms | Owner-occupied | Renter-occupied |
| 1 Room | 0 (0.0%) | 0 (0.0%) |
| 2 or 3 Rooms | 3 (3.5%) | 4 (7.0%) |
| 4 or 5 Rooms | 27 (31.0%) | 48 (84.2%) |
| 6 or 7 Rooms | 36 (41.4%) | 4 (7.0%) |
| 8 or more Rooms | 21 (24.1%) | 1 (1.8%) |
| Total | 87 (100.0%) | 57 (100.0%) |
Housing Structure by Heating Type in Herman
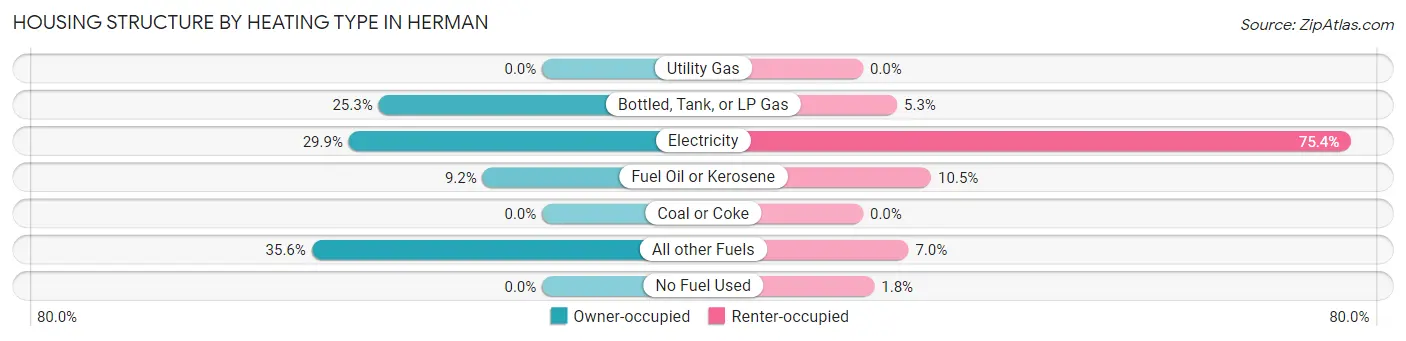
| Heating Type | Owner-occupied | Renter-occupied |
| Utility Gas | 0 (0.0%) | 0 (0.0%) |
| Bottled, Tank, or LP Gas | 22 (25.3%) | 3 (5.3%) |
| Electricity | 26 (29.9%) | 43 (75.4%) |
| Fuel Oil or Kerosene | 8 (9.2%) | 6 (10.5%) |
| Coal or Coke | 0 (0.0%) | 0 (0.0%) |
| All other Fuels | 31 (35.6%) | 4 (7.0%) |
| No Fuel Used | 0 (0.0%) | 1 (1.8%) |
| Total | 87 (100.0%) | 57 (100.0%) |
Household Vehicle Usage in Herman
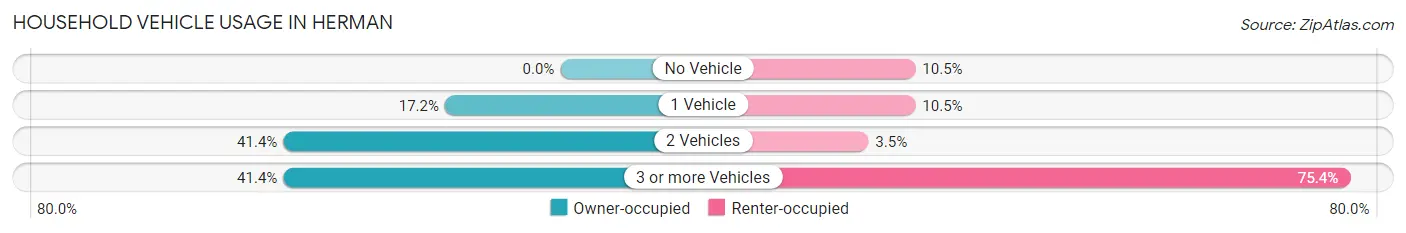
| Vehicles per Household | Owner-occupied | Renter-occupied |
| No Vehicle | 0 (0.0%) | 6 (10.5%) |
| 1 Vehicle | 15 (17.2%) | 6 (10.5%) |
| 2 Vehicles | 36 (41.4%) | 2 (3.5%) |
| 3 or more Vehicles | 36 (41.4%) | 43 (75.4%) |
| Total | 87 (100.0%) | 57 (100.0%) |
Real Estate & Mortgages in Herman
Real Estate and Mortgage Overview in Herman
| Characteristic | Without Mortgage | With Mortgage |
| Housing Units | 39 | 48 |
| Median Property Value | $83,900 | $123,100 |
| Median Household Income | $43,875 | $4 |
| Monthly Housing Costs | $536 | $0 |
| Real Estate Taxes | $1,141 | $2 |
Property Value by Mortgage Status in Herman
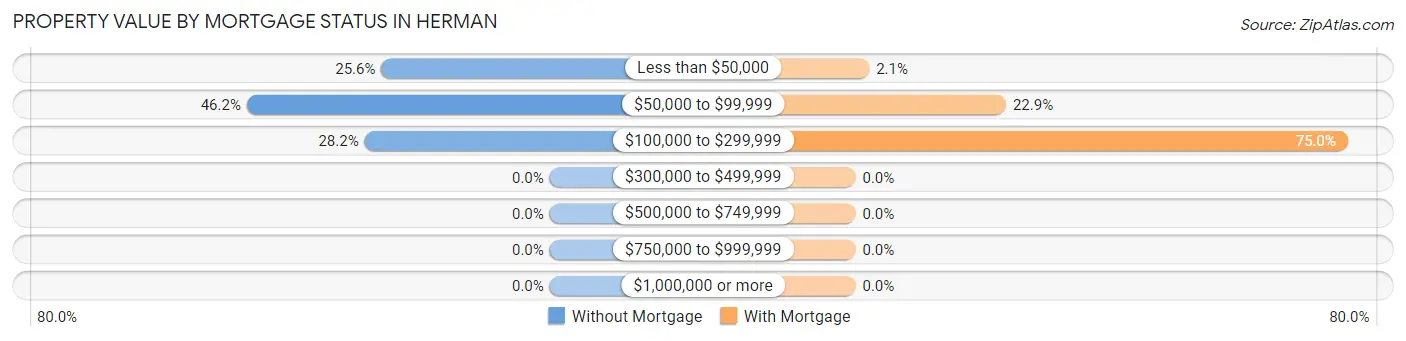
| Property Value | Without Mortgage | With Mortgage |
| Less than $50,000 | 10 (25.6%) | 1 (2.1%) |
| $50,000 to $99,999 | 18 (46.2%) | 11 (22.9%) |
| $100,000 to $299,999 | 11 (28.2%) | 36 (75.0%) |
| $300,000 to $499,999 | 0 (0.0%) | 0 (0.0%) |
| $500,000 to $749,999 | 0 (0.0%) | 0 (0.0%) |
| $750,000 to $999,999 | 0 (0.0%) | 0 (0.0%) |
| $1,000,000 or more | 0 (0.0%) | 0 (0.0%) |
| Total | 39 (100.0%) | 48 (100.0%) |
Household Income by Mortgage Status in Herman
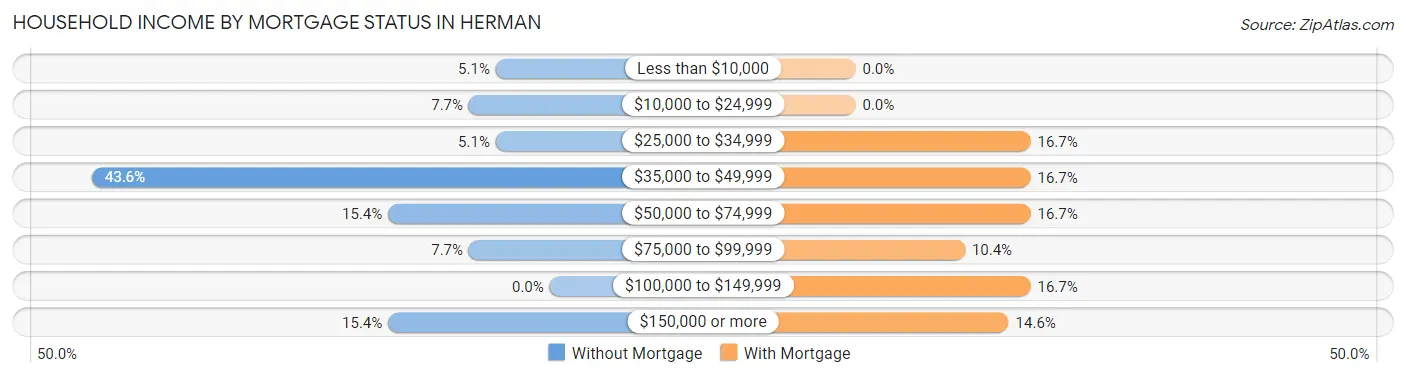
| Household Income | Without Mortgage | With Mortgage |
| Less than $10,000 | 2 (5.1%) | 0 (0.0%) |
| $10,000 to $24,999 | 3 (7.7%) | 0 (0.0%) |
| $25,000 to $34,999 | 2 (5.1%) | 8 (16.7%) |
| $35,000 to $49,999 | 17 (43.6%) | 8 (16.7%) |
| $50,000 to $74,999 | 6 (15.4%) | 8 (16.7%) |
| $75,000 to $99,999 | 3 (7.7%) | 5 (10.4%) |
| $100,000 to $149,999 | 0 (0.0%) | 8 (16.7%) |
| $150,000 or more | 6 (15.4%) | 7 (14.6%) |
| Total | 39 (100.0%) | 48 (100.0%) |
Property Value to Household Income Ratio in Herman
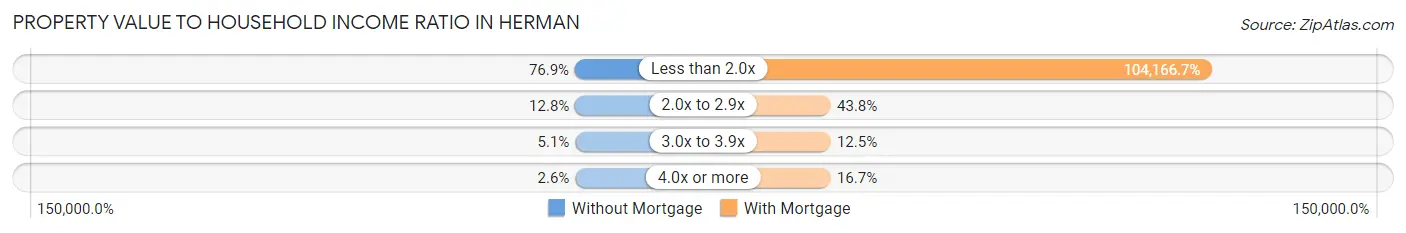
| Value-to-Income Ratio | Without Mortgage | With Mortgage |
| Less than 2.0x | 30 (76.9%) | 50,000 (104,166.7%) |
| 2.0x to 2.9x | 5 (12.8%) | 21 (43.8%) |
| 3.0x to 3.9x | 2 (5.1%) | 6 (12.5%) |
| 4.0x or more | 1 (2.6%) | 8 (16.7%) |
| Total | 39 (100.0%) | 48 (100.0%) |
Real Estate Taxes by Mortgage Status in Herman
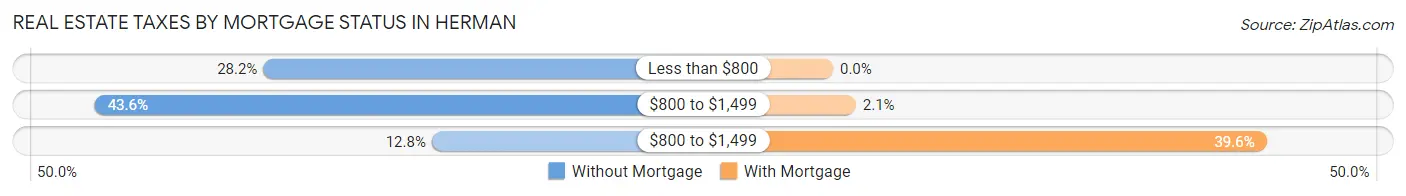
| Property Taxes | Without Mortgage | With Mortgage |
| Less than $800 | 11 (28.2%) | 0 (0.0%) |
| $800 to $1,499 | 17 (43.6%) | 1 (2.1%) |
| $800 to $1,499 | 5 (12.8%) | 19 (39.6%) |
| Total | 39 (100.0%) | 48 (100.0%) |
Health & Disability in Herman
Health Insurance Coverage by Age in Herman
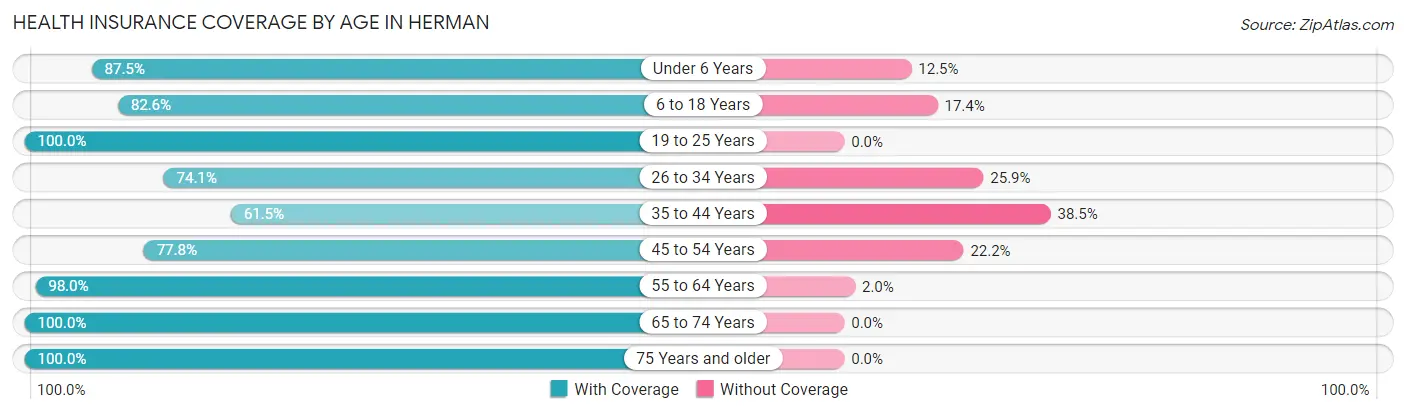
| Age Bracket | With Coverage | Without Coverage |
| Under 6 Years | 21 (87.5%) | 3 (12.5%) |
| 6 to 18 Years | 19 (82.6%) | 4 (17.4%) |
| 19 to 25 Years | 144 (100.0%) | 0 (0.0%) |
| 26 to 34 Years | 20 (74.1%) | 7 (25.9%) |
| 35 to 44 Years | 8 (61.5%) | 5 (38.5%) |
| 45 to 54 Years | 28 (77.8%) | 8 (22.2%) |
| 55 to 64 Years | 49 (98.0%) | 1 (2.0%) |
| 65 to 74 Years | 36 (100.0%) | 0 (0.0%) |
| 75 Years and older | 7 (100.0%) | 0 (0.0%) |
| Total | 332 (92.2%) | 28 (7.8%) |
Health Insurance Coverage by Citizenship Status in Herman
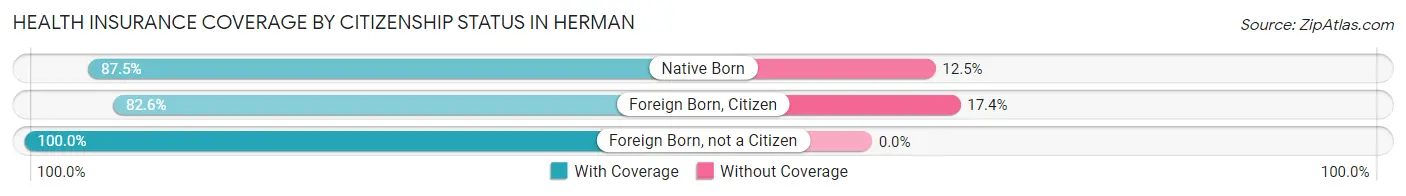
| Citizenship Status | With Coverage | Without Coverage |
| Native Born | 21 (87.5%) | 3 (12.5%) |
| Foreign Born, Citizen | 19 (82.6%) | 4 (17.4%) |
| Foreign Born, not a Citizen | 144 (100.0%) | 0 (0.0%) |
Health Insurance Coverage by Household Income in Herman
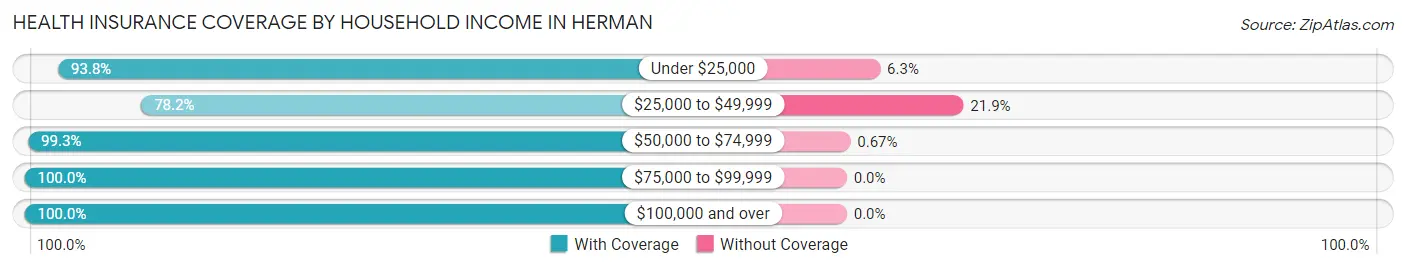
| Household Income | With Coverage | Without Coverage |
| Under $25,000 | 15 (93.8%) | 1 (6.2%) |
| $25,000 to $49,999 | 93 (78.1%) | 26 (21.8%) |
| $50,000 to $74,999 | 149 (99.3%) | 1 (0.7%) |
| $75,000 to $99,999 | 31 (100.0%) | 0 (0.0%) |
| $100,000 and over | 44 (100.0%) | 0 (0.0%) |
Public vs Private Health Insurance Coverage by Age in Herman
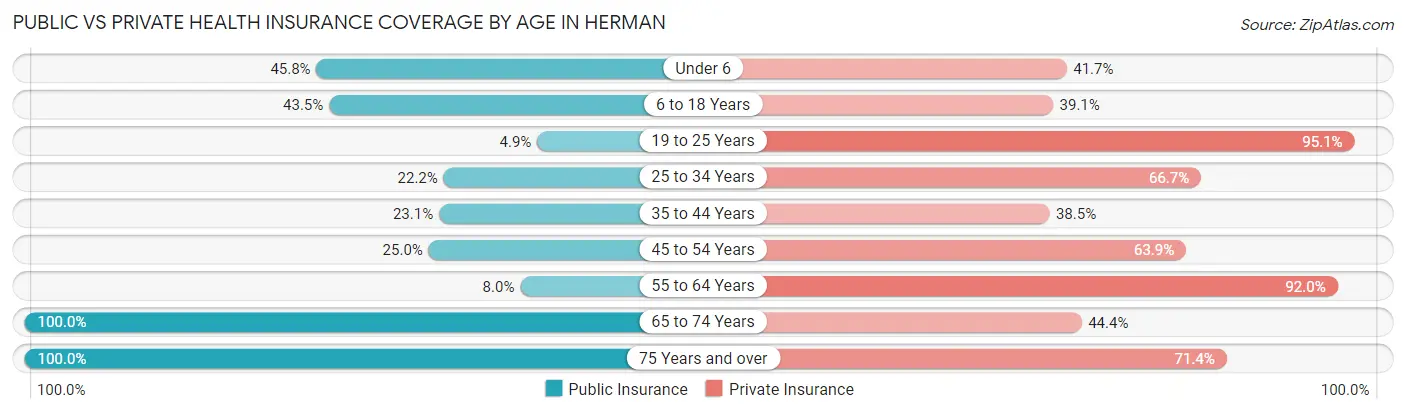
| Age Bracket | Public Insurance | Private Insurance |
| Under 6 | 11 (45.8%) | 10 (41.7%) |
| 6 to 18 Years | 10 (43.5%) | 9 (39.1%) |
| 19 to 25 Years | 7 (4.9%) | 137 (95.1%) |
| 25 to 34 Years | 6 (22.2%) | 18 (66.7%) |
| 35 to 44 Years | 3 (23.1%) | 5 (38.5%) |
| 45 to 54 Years | 9 (25.0%) | 23 (63.9%) |
| 55 to 64 Years | 4 (8.0%) | 46 (92.0%) |
| 65 to 74 Years | 36 (100.0%) | 16 (44.4%) |
| 75 Years and over | 7 (100.0%) | 5 (71.4%) |
| Total | 93 (25.8%) | 269 (74.7%) |
Disability Status by Sex by Age in Herman
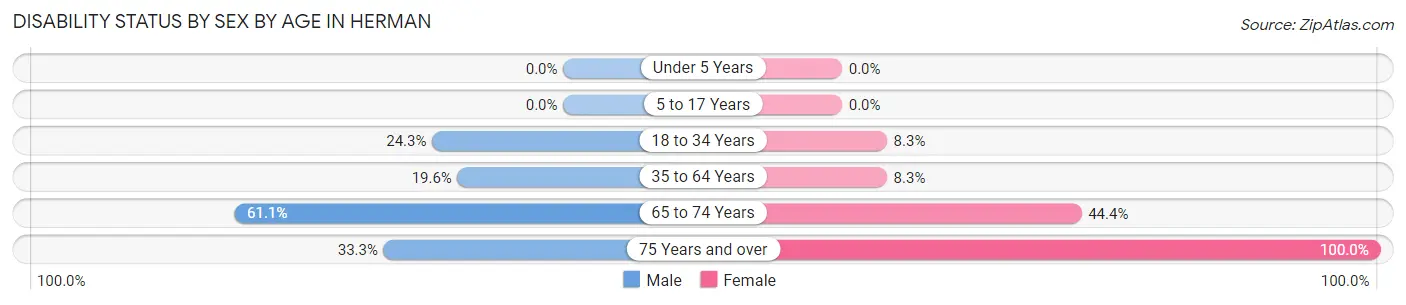
| Age Bracket | Male | Female |
| Under 5 Years | 0 (0.0%) | 0 (0.0%) |
| 5 to 17 Years | 0 (0.0%) | 0 (0.0%) |
| 18 to 34 Years | 27 (24.3%) | 5 (8.3%) |
| 35 to 64 Years | 10 (19.6%) | 4 (8.3%) |
| 65 to 74 Years | 11 (61.1%) | 8 (44.4%) |
| 75 Years and over | 1 (33.3%) | 4 (100.0%) |
Disability Class by Sex by Age in Herman
Disability Class: Hearing Difficulty
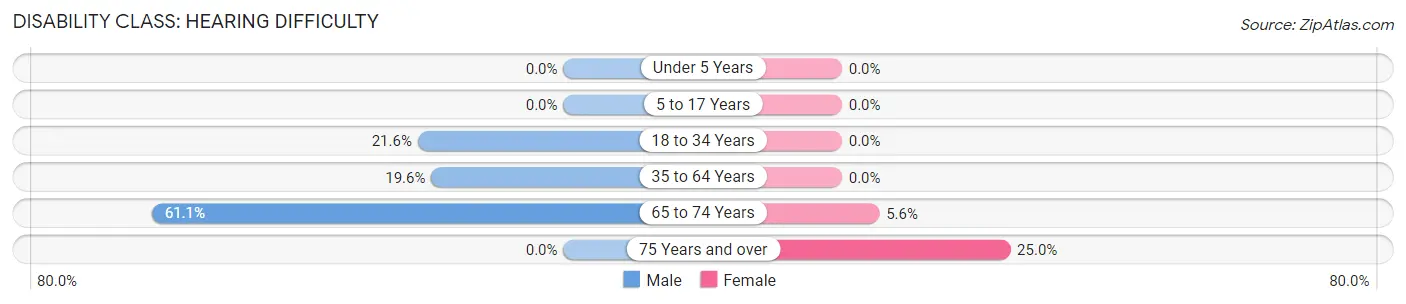
| Age Bracket | Male | Female |
| Under 5 Years | 0 (0.0%) | 0 (0.0%) |
| 5 to 17 Years | 0 (0.0%) | 0 (0.0%) |
| 18 to 34 Years | 24 (21.6%) | 0 (0.0%) |
| 35 to 64 Years | 10 (19.6%) | 0 (0.0%) |
| 65 to 74 Years | 11 (61.1%) | 1 (5.6%) |
| 75 Years and over | 0 (0.0%) | 1 (25.0%) |
Disability Class: Vision Difficulty
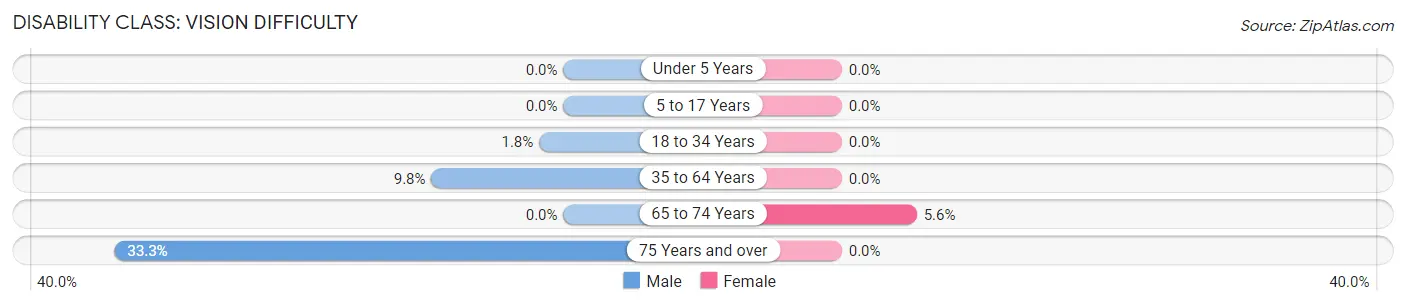
| Age Bracket | Male | Female |
| Under 5 Years | 0 (0.0%) | 0 (0.0%) |
| 5 to 17 Years | 0 (0.0%) | 0 (0.0%) |
| 18 to 34 Years | 2 (1.8%) | 0 (0.0%) |
| 35 to 64 Years | 5 (9.8%) | 0 (0.0%) |
| 65 to 74 Years | 0 (0.0%) | 1 (5.6%) |
| 75 Years and over | 1 (33.3%) | 0 (0.0%) |
Disability Class: Cognitive Difficulty
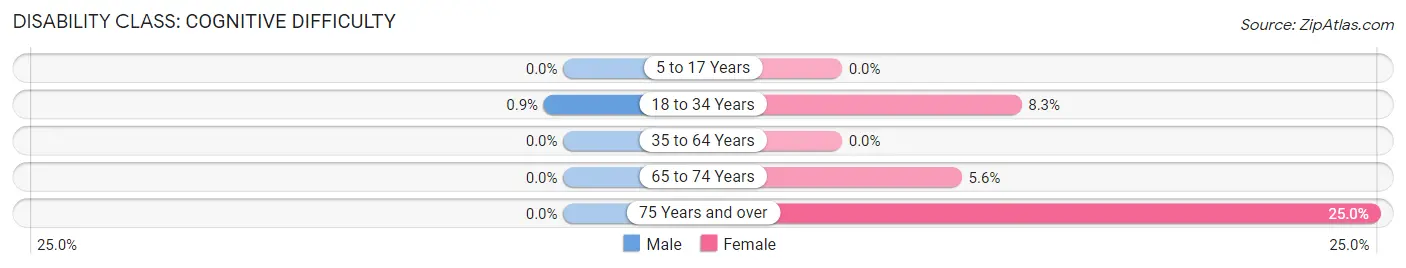
| Age Bracket | Male | Female |
| 5 to 17 Years | 0 (0.0%) | 0 (0.0%) |
| 18 to 34 Years | 1 (0.9%) | 5 (8.3%) |
| 35 to 64 Years | 0 (0.0%) | 0 (0.0%) |
| 65 to 74 Years | 0 (0.0%) | 1 (5.6%) |
| 75 Years and over | 0 (0.0%) | 1 (25.0%) |
Disability Class: Ambulatory Difficulty
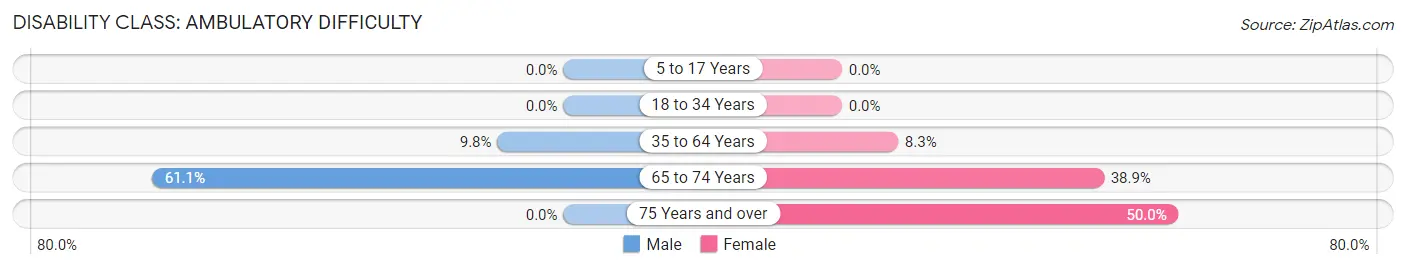
| Age Bracket | Male | Female |
| 5 to 17 Years | 0 (0.0%) | 0 (0.0%) |
| 18 to 34 Years | 0 (0.0%) | 0 (0.0%) |
| 35 to 64 Years | 5 (9.8%) | 4 (8.3%) |
| 65 to 74 Years | 11 (61.1%) | 7 (38.9%) |
| 75 Years and over | 0 (0.0%) | 2 (50.0%) |
Disability Class: Self-Care Difficulty
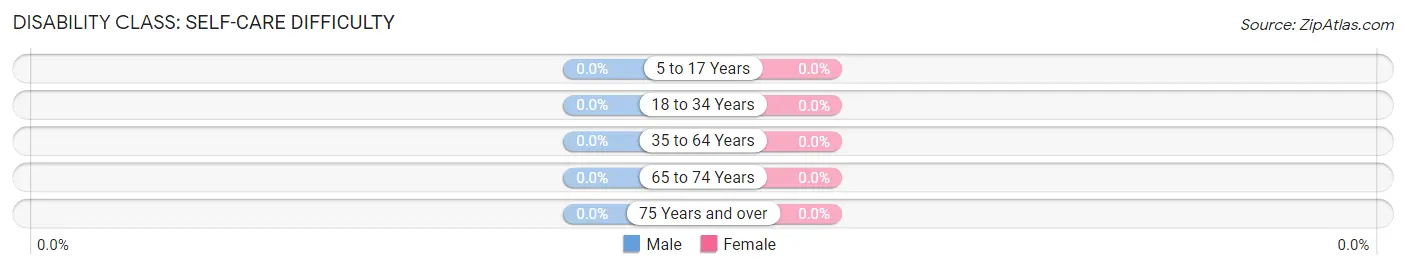
| Age Bracket | Male | Female |
| 5 to 17 Years | 0 (0.0%) | 0 (0.0%) |
| 18 to 34 Years | 0 (0.0%) | 0 (0.0%) |
| 35 to 64 Years | 0 (0.0%) | 0 (0.0%) |
| 65 to 74 Years | 0 (0.0%) | 0 (0.0%) |
| 75 Years and over | 0 (0.0%) | 0 (0.0%) |
Technology Access in Herman
Computing Device Access in Herman
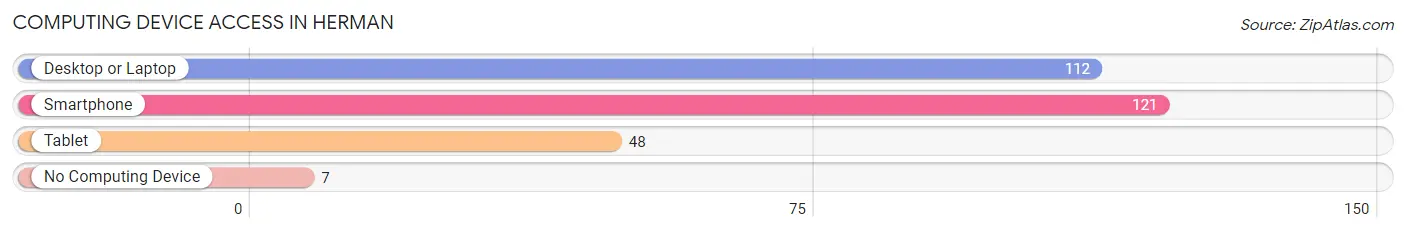
| Device Type | # Households | % Households |
| Desktop or Laptop | 112 | 77.8% |
| Smartphone | 121 | 84.0% |
| Tablet | 48 | 33.3% |
| No Computing Device | 7 | 4.9% |
| Total | 144 | 100.0% |
Internet Access in Herman
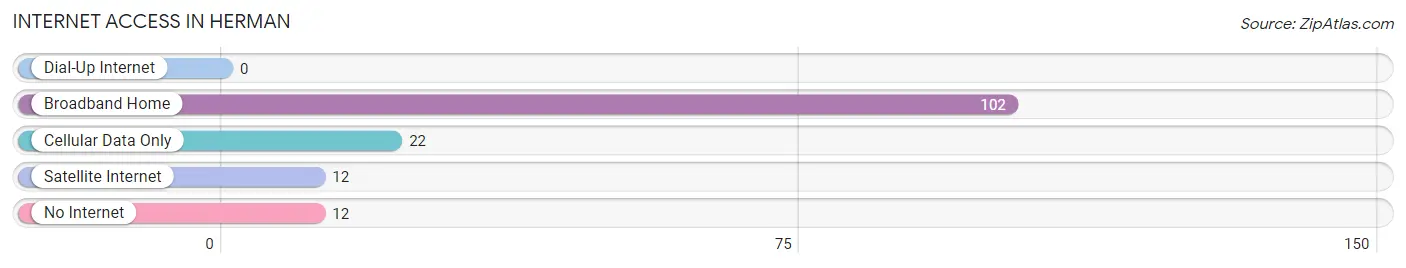
| Internet Type | # Households | % Households |
| Dial-Up Internet | 0 | 0.0% |
| Broadband Home | 102 | 70.8% |
| Cellular Data Only | 22 | 15.3% |
| Satellite Internet | 12 | 8.3% |
| No Internet | 12 | 8.3% |
| Total | 144 | 100.0% |
Herman Summary
Herman is a small village located in Dodge County, Nebraska, United States. It is situated on the banks of the Platte River, approximately 25 miles northwest of Omaha. The population of Herman was estimated to be 545 in the year 2000.
History
Herman was founded in 1856 by German immigrants who had come to the area in search of a better life. The town was named after Hermann, a German hero of the Napoleonic Wars. The first settlers built a log cabin and a small store, and the town quickly grew. By the late 1800s, Herman had become a thriving agricultural community, with a population of over 500.
In the early 1900s, Herman was a major stop on the Union Pacific Railroad. The railroad brought new people and businesses to the area, and the town continued to grow. In the 1920s, the town was home to a number of businesses, including a bank, a hotel, a movie theater, and a variety of stores.
Geography
Herman is located in the eastern part of Dodge County, Nebraska. It is situated on the banks of the Platte River, approximately 25 miles northwest of Omaha. The town is surrounded by rolling hills and farmland, and is located in the heart of the Great Plains.
The climate in Herman is generally mild, with hot summers and cold winters. The average temperature in the summer is around 80 degrees Fahrenheit, and the average temperature in the winter is around 20 degrees Fahrenheit.
Economy
Herman’s economy is largely based on agriculture. The town is home to a number of farms, which produce a variety of crops, including corn, soybeans, and wheat. The town also has a number of businesses, including a bank, a hotel, a movie theater, and a variety of stores.
Demographics
As of the 2000 census, the population of Herman was 545. The racial makeup of the town was 97.3% White, 0.2% African American, 0.2% Native American, 0.4% Asian, 0.2% from other races, and 1.7% from two or more races. Hispanic or Latino of any race were 0.7% of the population.
The median income for a household in Herman was $37,500, and the median income for a family was $45,000. The per capita income for the town was $17,845. About 8.2% of families and 10.2% of the population were below the poverty line, including 11.3% of those under age 18 and 8.3% of those age 65 or over.
Herman is a small town with a rich history and a strong sense of community. The town is home to a variety of businesses, and the economy is largely based on agriculture. The population of Herman is diverse, and the town is a great place to live and work.
Common Questions
What is Per Capita Income in Herman?
Per Capita income in Herman is $25,369.
What is the Median Family Income in Herman?
Median Family Income in Herman is $49,063.
What is the Median Household income in Herman?
Median Household Income in Herman is $65,000.
What is Income or Wage Gap in Herman?
Income or Wage Gap in Herman is 7.0%.
Women in Herman earn 93.0 cents for every dollar earned by a man.
What is Inequality or Gini Index in Herman?
Inequality or Gini Index in Herman is 0.31.
What is the Total Population of Herman?
Total Population of Herman is 360.
What is the Total Male Population of Herman?
Total Male Population of Herman is 203.
What is the Total Female Population of Herman?
Total Female Population of Herman is 157.
What is the Ratio of Males per 100 Females in Herman?
There are 129.30 Males per 100 Females in Herman.
What is the Ratio of Females per 100 Males in Herman?
There are 77.34 Females per 100 Males in Herman.
What is the Median Population Age in Herman?
Median Population Age in Herman is 22.0 Years.
What is the Average Family Size in Herman
Average Family Size in Herman is 2.9 People.
What is the Average Household Size in Herman
Average Household Size in Herman is 2.5 People.
How Large is the Labor Force in Herman?
There are 240 People in the Labor Forcein in Herman.
What is the Percentage of People in the Labor Force in Herman?
76.7% of People are in the Labor Force in Herman.
What is the Unemployment Rate in Herman?
Unemployment Rate in Herman is 1.7%.