Bent Creek, NC Map & Demographics
Bent Creek Map
Bent Creek Overview
$47,322
PER CAPITA INCOME
$106,833
AVG FAMILY INCOME
$77,355
AVG HOUSEHOLD INCOME
38.6%
WAGE / INCOME GAP [ % ]
61.4¢/ $1
WAGE / INCOME GAP [ $ ]
0.51
INEQUALITY / GINI INDEX
1,536
TOTAL POPULATION
722
MALE POPULATION
814
FEMALE POPULATION
88.70
MALES / 100 FEMALES
112.74
FEMALES / 100 MALES
41.6
MEDIAN AGE
3.7
AVG FAMILY SIZE
3.1
AVG HOUSEHOLD SIZE
902
LABOR FORCE [ PEOPLE ]
77.2%
PERCENT IN LABOR FORCE
13.7%
UNEMPLOYMENT RATE
Income in Bent Creek
Income Overview in Bent Creek
Per Capita Income in Bent Creek is $47,322, while median incomes of families and households are $106,833 and $77,355 respectively.
| Characteristic | Number | Measure |
| Per Capita Income | 1,536 | $47,322 |
| Median Family Income | 318 | $106,833 |
| Mean Family Income | 318 | $182,880 |
| Median Household Income | 499 | $77,355 |
| Mean Household Income | 499 | $139,328 |
| Income Deficit | 318 | $0 |
| Wage / Income Gap (%) | 1,536 | 38.62% |
| Wage / Income Gap ($) | 1,536 | 61.38¢ per $1 |
| Gini / Inequality Index | 1,536 | 0.51 |
Earnings by Sex in Bent Creek
Average Earnings in Bent Creek are $48,185, $56,029 for men and $34,391 for women, a difference of 38.6%.
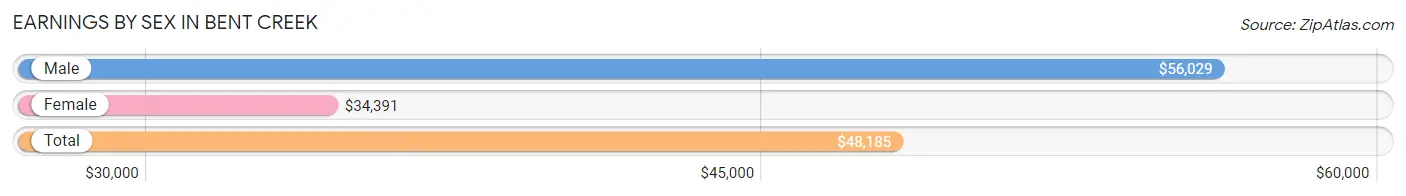
| Sex | Number | Average Earnings |
| Male | 404 (48.1%) | $56,029 |
| Female | 435 (51.8%) | $34,391 |
| Total | 839 (100.0%) | $48,185 |
Earnings by Sex by Income Bracket in Bent Creek
The most common earnings brackets in Bent Creek are $100,000+ for men (96 | 23.8%) and $25,000 to $29,999 for women (69 | 15.9%).
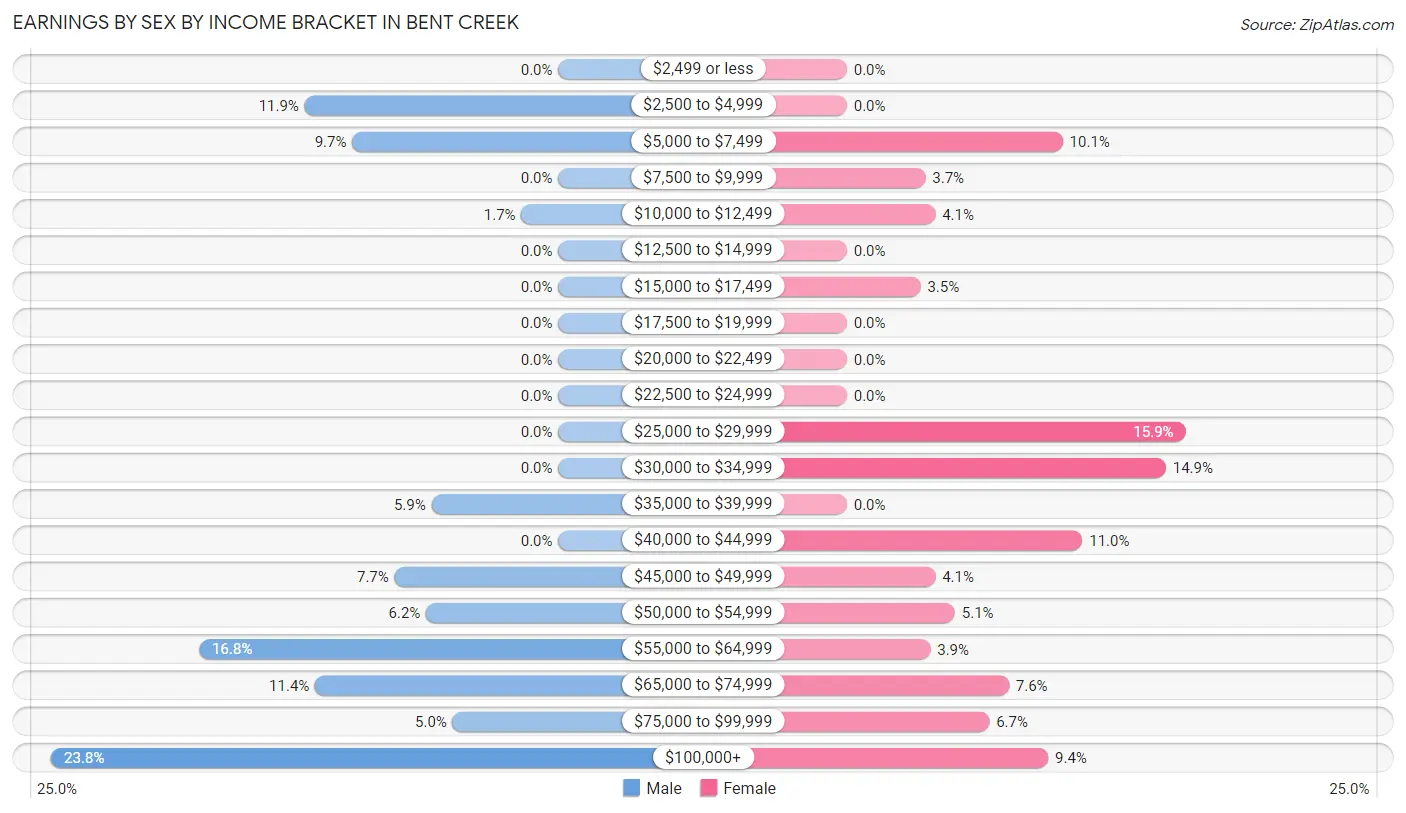
| Income | Male | Female |
| $2,499 or less | 0 (0.0%) | 0 (0.0%) |
| $2,500 to $4,999 | 48 (11.9%) | 0 (0.0%) |
| $5,000 to $7,499 | 39 (9.7%) | 44 (10.1%) |
| $7,500 to $9,999 | 0 (0.0%) | 16 (3.7%) |
| $10,000 to $12,499 | 7 (1.7%) | 18 (4.1%) |
| $12,500 to $14,999 | 0 (0.0%) | 0 (0.0%) |
| $15,000 to $17,499 | 0 (0.0%) | 15 (3.5%) |
| $17,500 to $19,999 | 0 (0.0%) | 0 (0.0%) |
| $20,000 to $22,499 | 0 (0.0%) | 0 (0.0%) |
| $22,500 to $24,999 | 0 (0.0%) | 0 (0.0%) |
| $25,000 to $29,999 | 0 (0.0%) | 69 (15.9%) |
| $30,000 to $34,999 | 0 (0.0%) | 65 (14.9%) |
| $35,000 to $39,999 | 24 (5.9%) | 0 (0.0%) |
| $40,000 to $44,999 | 0 (0.0%) | 48 (11.0%) |
| $45,000 to $49,999 | 31 (7.7%) | 18 (4.1%) |
| $50,000 to $54,999 | 25 (6.2%) | 22 (5.1%) |
| $55,000 to $64,999 | 68 (16.8%) | 17 (3.9%) |
| $65,000 to $74,999 | 46 (11.4%) | 33 (7.6%) |
| $75,000 to $99,999 | 20 (5.0%) | 29 (6.7%) |
| $100,000+ | 96 (23.8%) | 41 (9.4%) |
| Total | 404 (100.0%) | 435 (100.0%) |
Earnings by Sex by Educational Attainment in Bent Creek
Average earnings in Bent Creek are $65,515 for men and $40,365 for women, a difference of 38.4%. Men with an educational attainment of graduate degree enjoy the highest average annual earnings of $148,105, while those with graduate degree education earn the least with $148,105. Women with an educational attainment of college or associate's degree earn the most with the average annual earnings of $41,432, while those with high school diploma education have the smallest earnings of $29,167.
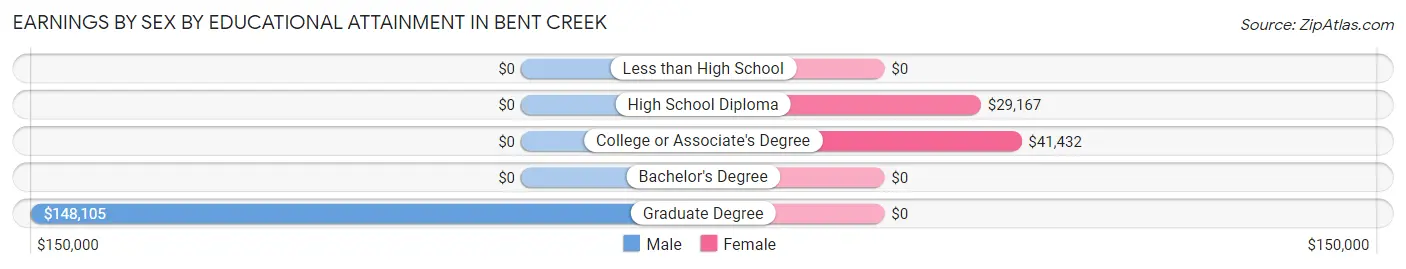
| Educational Attainment | Male Income | Female Income |
| Less than High School | - | - |
| High School Diploma | - | - |
| College or Associate's Degree | - | - |
| Bachelor's Degree | - | - |
| Graduate Degree | $148,105 | $0 |
| Total | $65,515 | $40,365 |
Family Income in Bent Creek
Family Income Brackets in Bent Creek
According to the Bent Creek family income data, there are 76 families falling into the $100,000 to $149,999 income range, which is the most common income bracket and makes up 23.9% of all families.
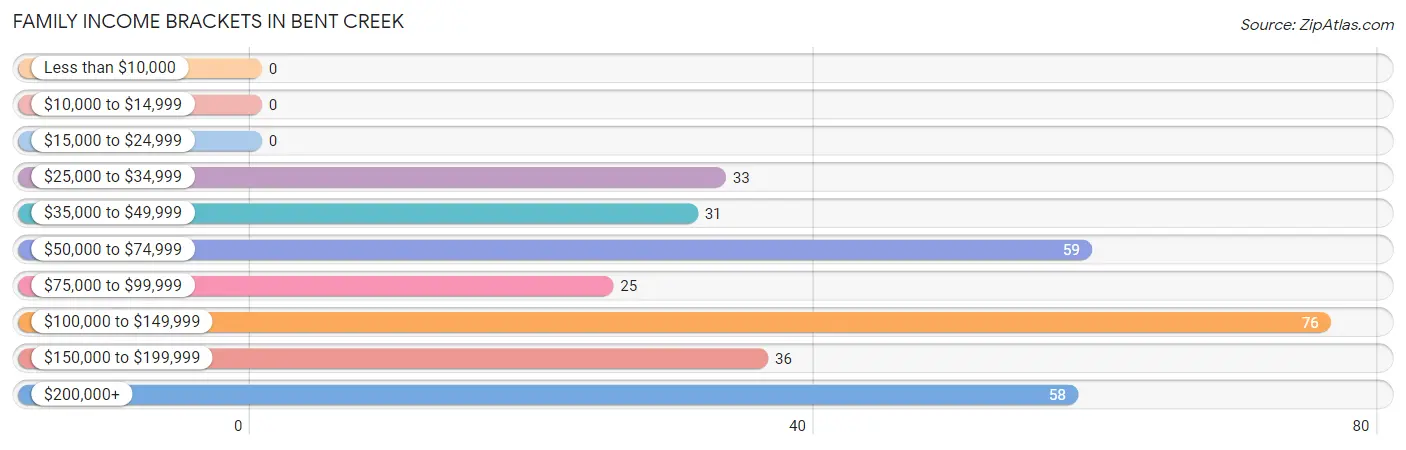
| Income Bracket | # Families | % Families |
| Less than $10,000 | 0 | 0.0% |
| $10,000 to $14,999 | 0 | 0.0% |
| $15,000 to $24,999 | 0 | 0.0% |
| $25,000 to $34,999 | 33 | 10.4% |
| $35,000 to $49,999 | 31 | 9.7% |
| $50,000 to $74,999 | 59 | 18.6% |
| $75,000 to $99,999 | 25 | 7.9% |
| $100,000 to $149,999 | 76 | 23.9% |
| $150,000 to $199,999 | 36 | 11.3% |
| $200,000+ | 58 | 18.2% |
Family Income by Famaliy Size in Bent Creek
3-person families (135 | 42.4%) account for the highest median family income in Bent Creek with $118,578 per family, while 3-person families (135 | 42.4%) have the highest median income of $39,526 per family member.
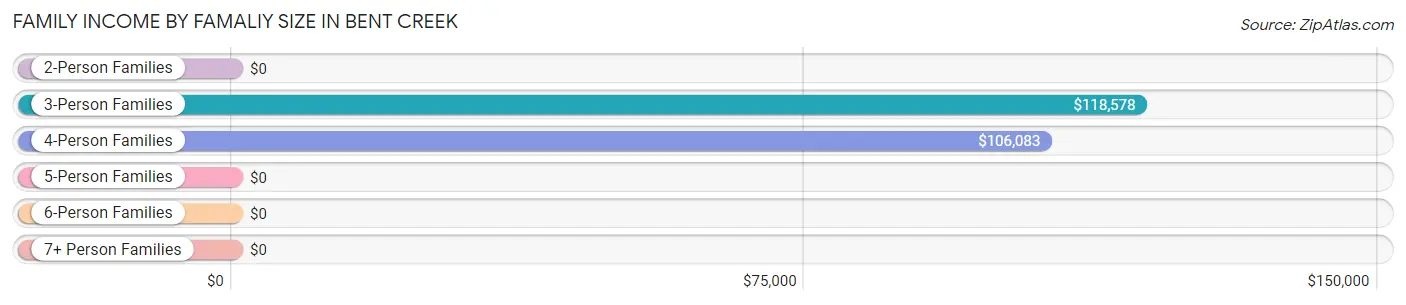
| Income Bracket | # Families | Median Income |
| 2-Person Families | 42 (13.2%) | $0 |
| 3-Person Families | 135 (42.4%) | $118,578 |
| 4-Person Families | 141 (44.3%) | $106,083 |
| 5-Person Families | 0 (0.0%) | $0 |
| 6-Person Families | 0 (0.0%) | $0 |
| 7+ Person Families | 0 (0.0%) | $0 |
| Total | 318 (100.0%) | $106,833 |
Family Income by Number of Earners in Bent Creek
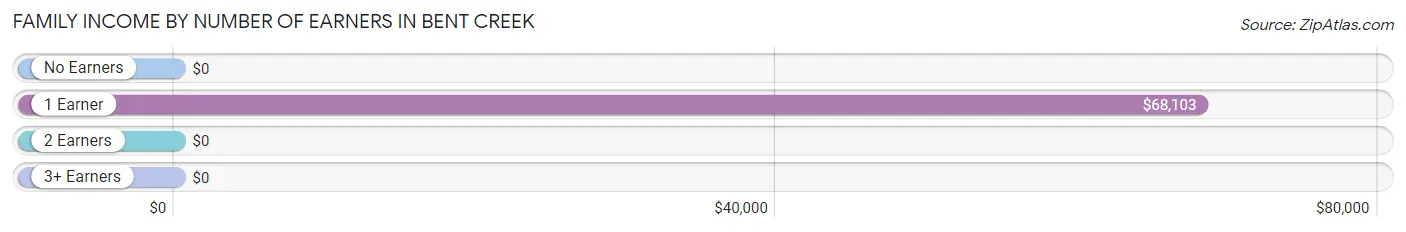
| Number of Earners | # Families | Median Income |
| No Earners | 37 (11.6%) | $0 |
| 1 Earner | 120 (37.7%) | $68,103 |
| 2 Earners | 121 (38.1%) | $0 |
| 3+ Earners | 40 (12.6%) | $0 |
| Total | 318 (100.0%) | $106,833 |
Household Income in Bent Creek
Household Income Brackets in Bent Creek
With 120 households falling in the category, the $75,000 to $99,999 income range is the most frequent in Bent Creek, accounting for 24.0% of all households.
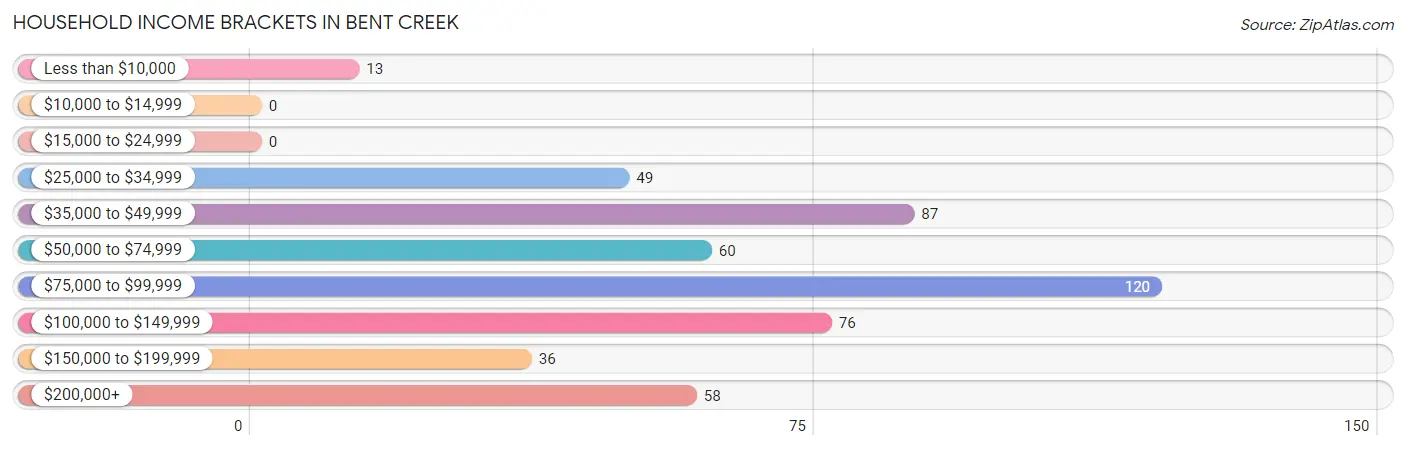
| Income Bracket | # Households | % Households |
| Less than $10,000 | 13 | 2.6% |
| $10,000 to $14,999 | 0 | 0.0% |
| $15,000 to $24,999 | 0 | 0.0% |
| $25,000 to $34,999 | 49 | 9.8% |
| $35,000 to $49,999 | 87 | 17.4% |
| $50,000 to $74,999 | 60 | 12.0% |
| $75,000 to $99,999 | 120 | 24.0% |
| $100,000 to $149,999 | 76 | 15.2% |
| $150,000 to $199,999 | 36 | 7.2% |
| $200,000+ | 58 | 11.6% |
Household Income by Householder Age in Bent Creek
The median household income in Bent Creek is $77,355, with the highest median household income of $76,053 found in the 65+ years age bracket for the primary householder. A total of 166 households (33.3%) fall into this category.
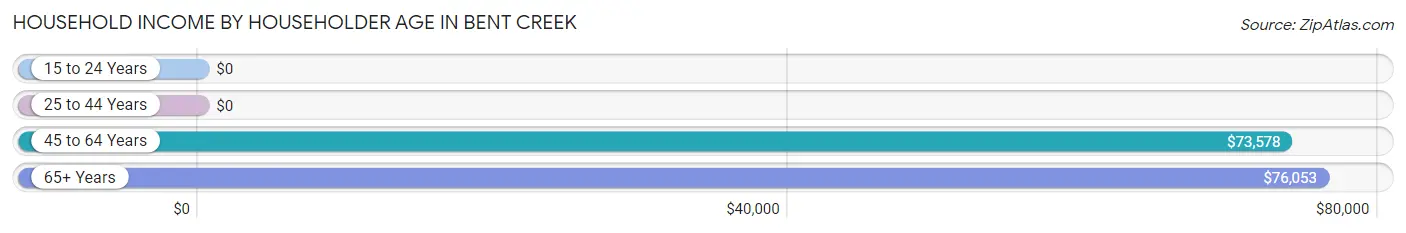
| Income Bracket | # Households | Median Income |
| 15 to 24 Years | 0 (0.0%) | $0 |
| 25 to 44 Years | 148 (29.7%) | $0 |
| 45 to 64 Years | 185 (37.1%) | $73,578 |
| 65+ Years | 166 (33.3%) | $76,053 |
| Total | 499 (100.0%) | $77,355 |
Poverty in Bent Creek
Income Below Poverty by Sex and Age in Bent Creek
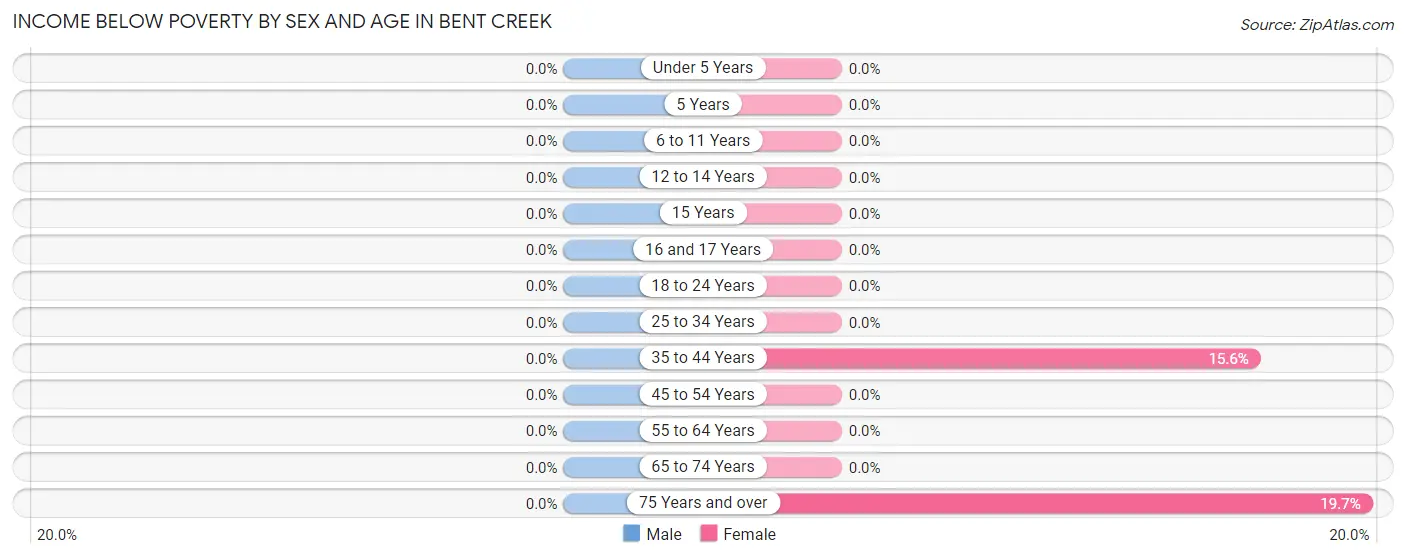
| Age Bracket | Male | Female |
| Under 5 Years | 0 (0.0%) | 0 (0.0%) |
| 5 Years | 0 (0.0%) | 0 (0.0%) |
| 6 to 11 Years | 0 (0.0%) | 0 (0.0%) |
| 12 to 14 Years | 0 (0.0%) | 0 (0.0%) |
| 15 Years | 0 (0.0%) | 0 (0.0%) |
| 16 and 17 Years | 0 (0.0%) | 0 (0.0%) |
| 18 to 24 Years | 0 (0.0%) | 0 (0.0%) |
| 25 to 34 Years | 0 (0.0%) | 0 (0.0%) |
| 35 to 44 Years | 0 (0.0%) | 44 (15.5%) |
| 45 to 54 Years | 0 (0.0%) | 0 (0.0%) |
| 55 to 64 Years | 0 (0.0%) | 0 (0.0%) |
| 65 to 74 Years | 0 (0.0%) | 0 (0.0%) |
| 75 Years and over | 0 (0.0%) | 13 (19.7%) |
| Total | 0 (0.0%) | 57 (7.0%) |
Income Above Poverty by Sex and Age in Bent Creek
According to the poverty statistics in Bent Creek, males aged under 5 years and females aged under 5 years are the age groups that are most secure financially, with 100.0% of males and 100.0% of females in these age groups living above the poverty line.
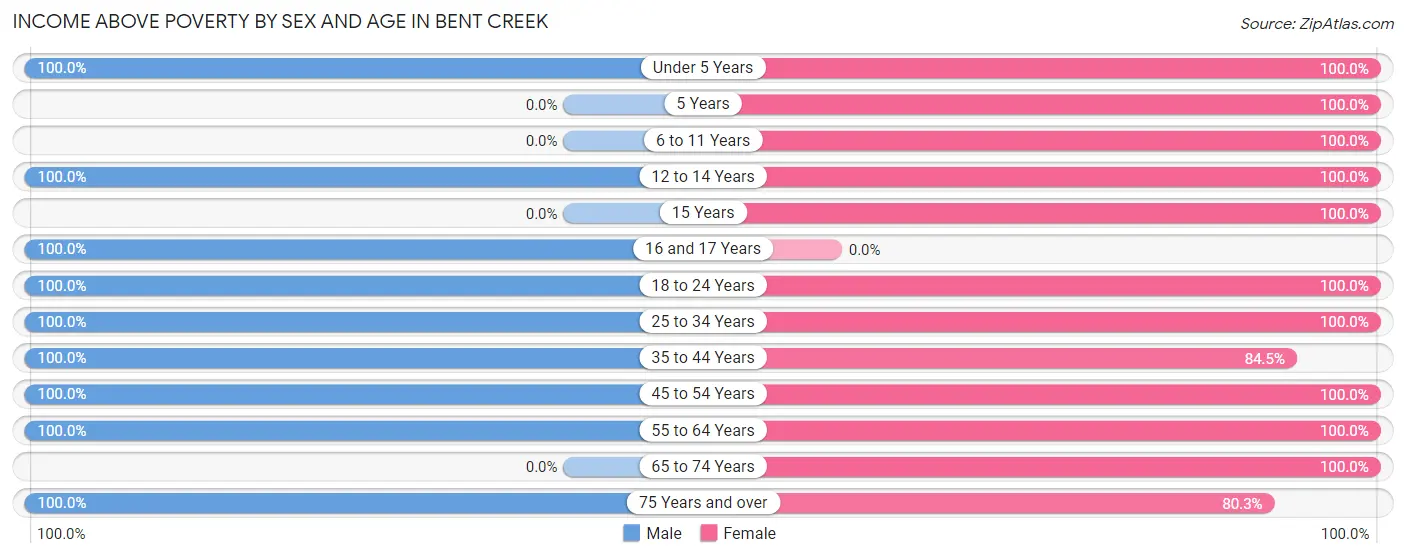
| Age Bracket | Male | Female |
| Under 5 Years | 123 (100.0%) | 10 (100.0%) |
| 5 Years | 0 (0.0%) | 49 (100.0%) |
| 6 to 11 Years | 0 (0.0%) | 129 (100.0%) |
| 12 to 14 Years | 10 (100.0%) | 28 (100.0%) |
| 15 Years | 0 (0.0%) | 17 (100.0%) |
| 16 and 17 Years | 43 (100.0%) | 0 (0.0%) |
| 18 to 24 Years | 77 (100.0%) | 33 (100.0%) |
| 25 to 34 Years | 7 (100.0%) | 30 (100.0%) |
| 35 to 44 Years | 126 (100.0%) | 239 (84.5%) |
| 45 to 54 Years | 224 (100.0%) | 58 (100.0%) |
| 55 to 64 Years | 53 (100.0%) | 23 (100.0%) |
| 65 to 74 Years | 0 (0.0%) | 86 (100.0%) |
| 75 Years and over | 57 (100.0%) | 53 (80.3%) |
| Total | 720 (100.0%) | 755 (93.0%) |
Income Below Poverty Among Married-Couple Families in Bent Creek
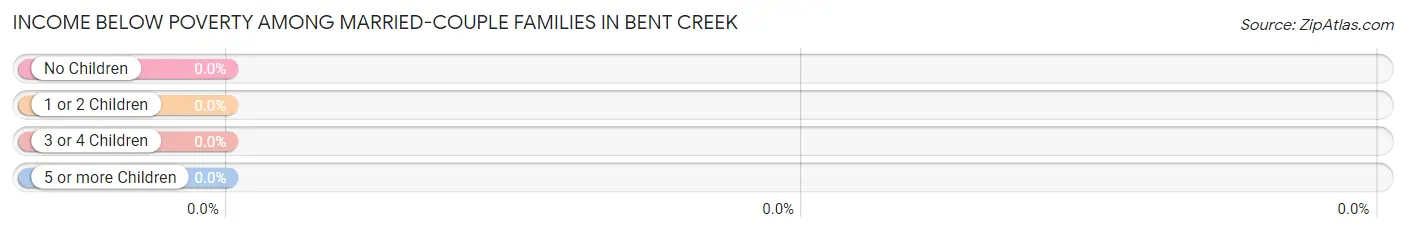
| Children | Above Poverty | Below Poverty |
| No Children | 74 (100.0%) | 0 (0.0%) |
| 1 or 2 Children | 159 (100.0%) | 0 (0.0%) |
| 3 or 4 Children | 0 (0.0%) | 0 (0.0%) |
| 5 or more Children | 0 (0.0%) | 0 (0.0%) |
| Total | 233 (100.0%) | 0 (0.0%) |
Income Below Poverty Among Single-Parent Households in Bent Creek
| Children | Single Father | Single Mother |
| No Children | 0 (0.0%) | 0 (0.0%) |
| 1 or 2 Children | 0 (0.0%) | 0 (0.0%) |
| 3 or 4 Children | 0 (0.0%) | 0 (0.0%) |
| 5 or more Children | 0 (0.0%) | 0 (0.0%) |
| Total | 0 (0.0%) | 0 (0.0%) |
Income Below Poverty Among Married-Couple vs Single-Parent Households in Bent Creek
| Children | Married-Couple Families | Single-Parent Households |
| No Children | 0 (0.0%) | 0 (0.0%) |
| 1 or 2 Children | 0 (0.0%) | 0 (0.0%) |
| 3 or 4 Children | 0 (0.0%) | 0 (0.0%) |
| 5 or more Children | 0 (0.0%) | 0 (0.0%) |
| Total | 0 (0.0%) | 0 (0.0%) |
Race in Bent Creek
The most populous races in Bent Creek are White / Caucasian (1,461 | 95.1%), Hispanic or Latino (69 | 4.5%), and Two or more Races (41 | 2.7%).
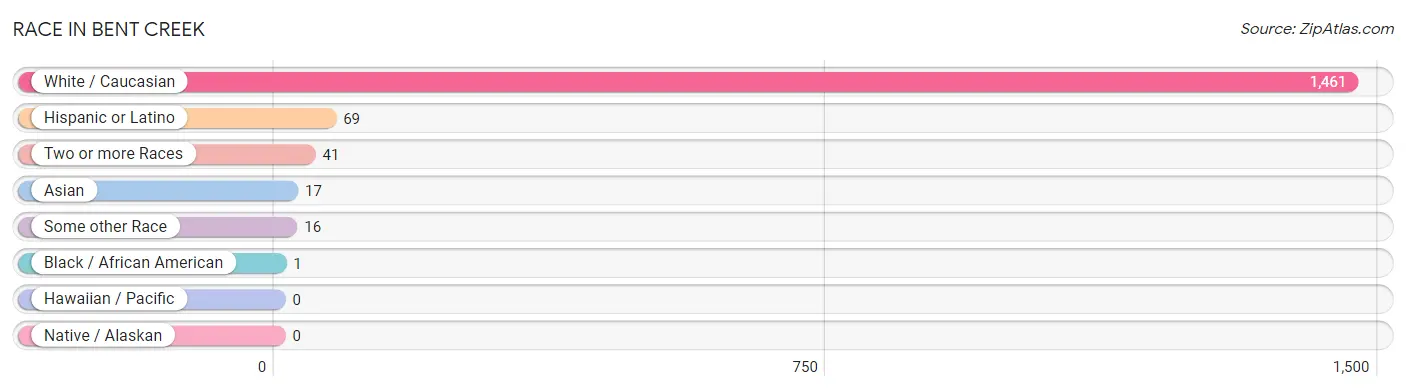
| Race | # Population | % Population |
| Asian | 17 | 1.1% |
| Black / African American | 1 | 0.1% |
| Hawaiian / Pacific | 0 | 0.0% |
| Hispanic or Latino | 69 | 4.5% |
| Native / Alaskan | 0 | 0.0% |
| White / Caucasian | 1,461 | 95.1% |
| Two or more Races | 41 | 2.7% |
| Some other Race | 16 | 1.0% |
| Total | 1,536 | 100.0% |
Ancestry in Bent Creek
The most populous ancestries reported in Bent Creek are English (513 | 33.4%), German (227 | 14.8%), Irish (225 | 14.6%), Greek (126 | 8.2%), and Italian (114 | 7.4%), together accounting for 78.4% of all Bent Creek residents.
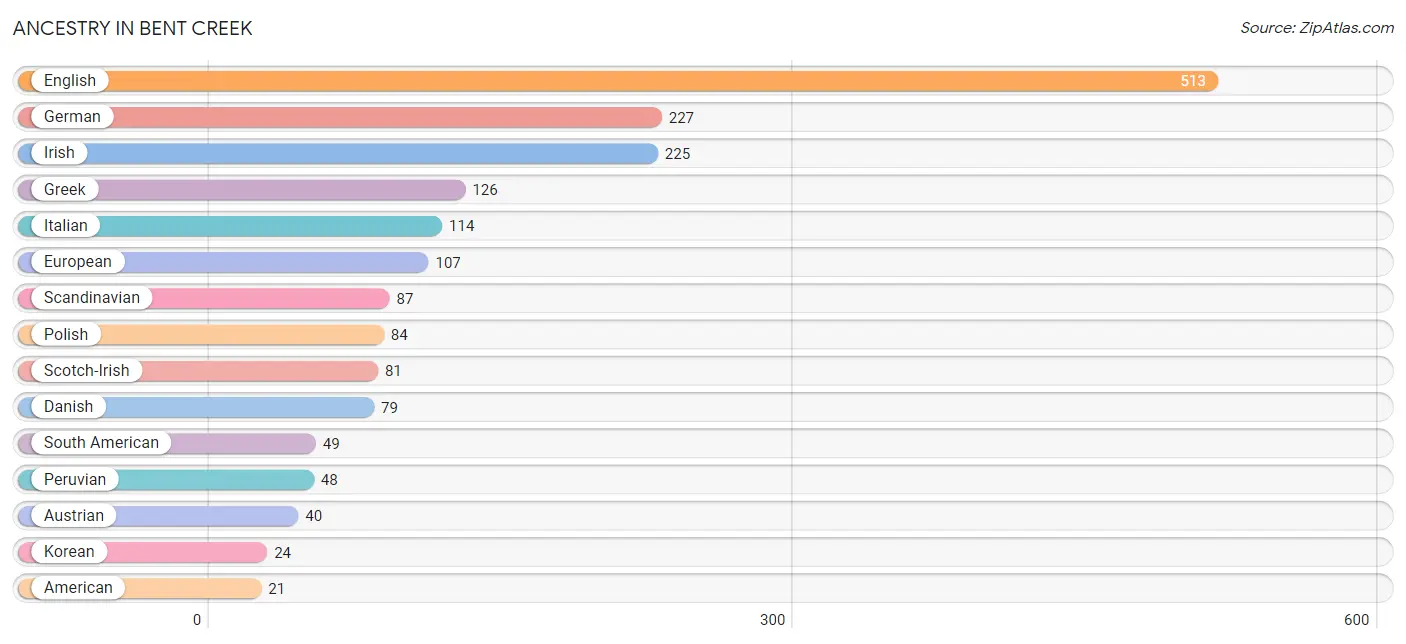
| Ancestry | # Population | % Population |
| American | 21 | 1.4% |
| Austrian | 40 | 2.6% |
| Colombian | 1 | 0.1% |
| Danish | 79 | 5.1% |
| English | 513 | 33.4% |
| European | 107 | 7.0% |
| French | 16 | 1.0% |
| German | 227 | 14.8% |
| Greek | 126 | 8.2% |
| Irish | 225 | 14.6% |
| Italian | 114 | 7.4% |
| Korean | 24 | 1.6% |
| Lithuanian | 12 | 0.8% |
| Peruvian | 48 | 3.1% |
| Polish | 84 | 5.5% |
| Puerto Rican | 20 | 1.3% |
| Scandinavian | 87 | 5.7% |
| Scotch-Irish | 81 | 5.3% |
| Scottish | 15 | 1.0% |
| South American | 49 | 3.2% | View All 20 Rows |
Immigrants in Bent Creek
The most numerous immigrant groups reported in Bent Creek came from Asia (17 | 1.1%), Eastern Europe (17 | 1.1%), Europe (17 | 1.1%), Philippines (17 | 1.1%), and Poland (17 | 1.1%), together accounting for 5.6% of all Bent Creek residents.
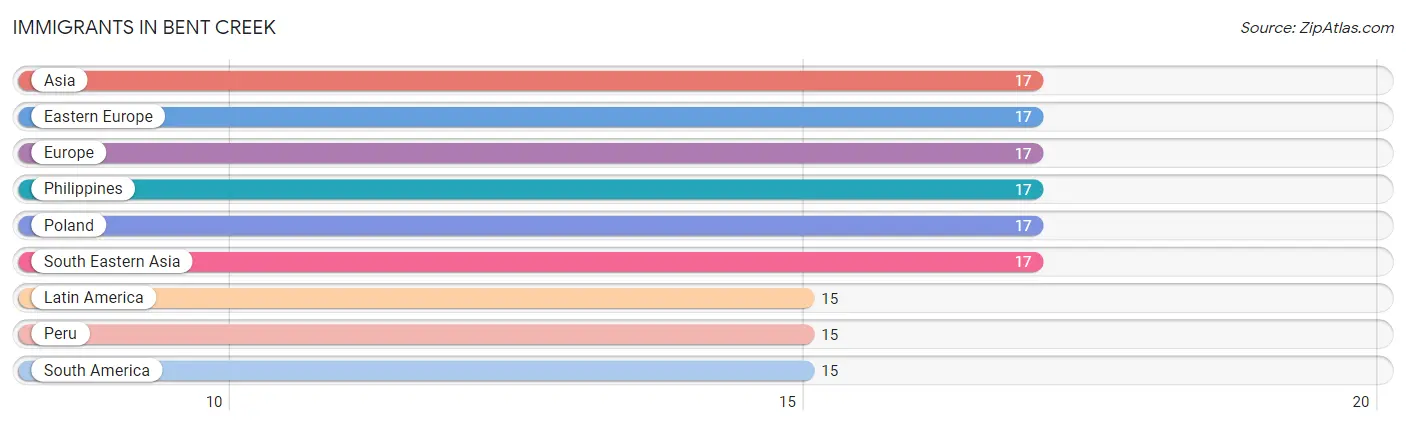
| Immigration Origin | # Population | % Population |
| Asia | 17 | 1.1% |
| Eastern Europe | 17 | 1.1% |
| Europe | 17 | 1.1% |
| Latin America | 15 | 1.0% |
| Peru | 15 | 1.0% |
| Philippines | 17 | 1.1% |
| Poland | 17 | 1.1% |
| South America | 15 | 1.0% |
| South Eastern Asia | 17 | 1.1% | View All 9 Rows |
Sex and Age in Bent Creek
Sex and Age in Bent Creek
The most populous age groups in Bent Creek are 45 to 49 Years (156 | 21.6%) for men and 40 to 44 Years (191 | 23.5%) for women.
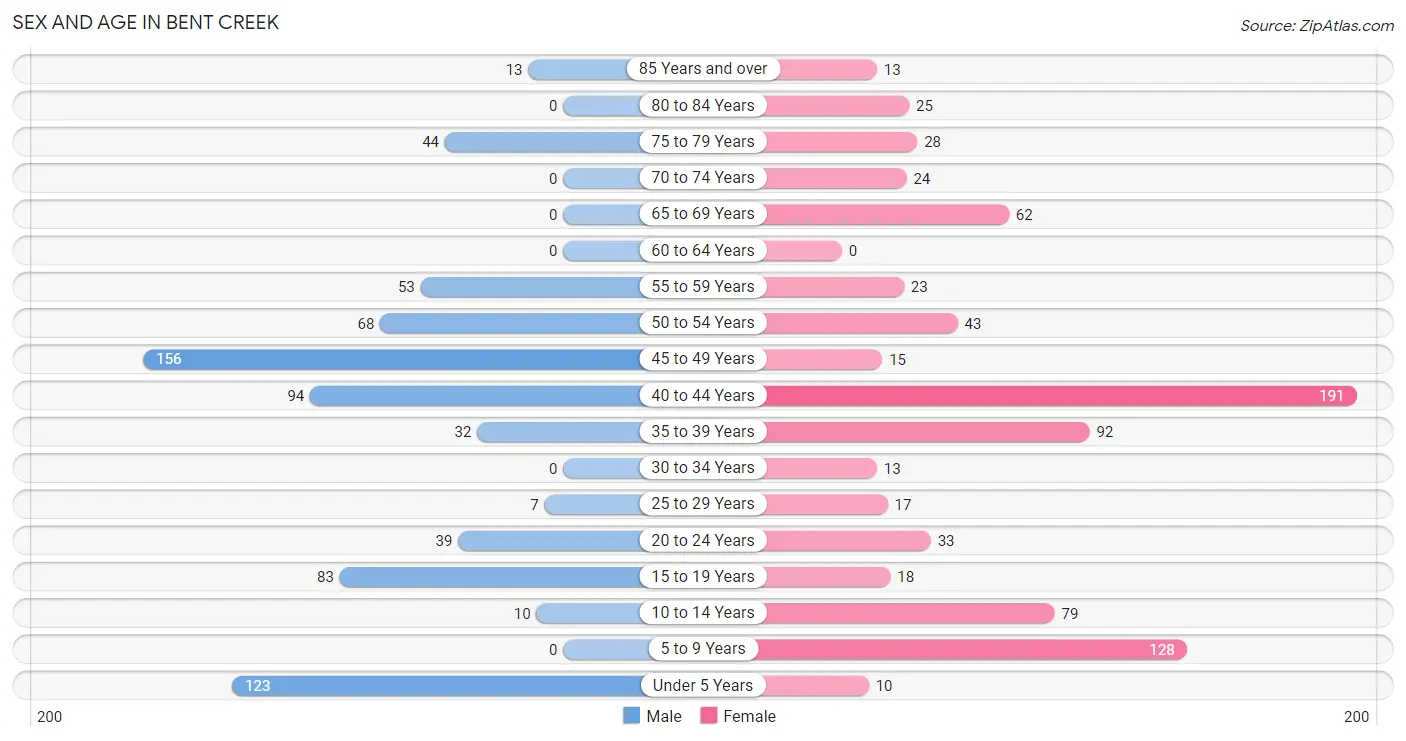
| Age Bracket | Male | Female |
| Under 5 Years | 123 (17.0%) | 10 (1.2%) |
| 5 to 9 Years | 0 (0.0%) | 128 (15.7%) |
| 10 to 14 Years | 10 (1.4%) | 79 (9.7%) |
| 15 to 19 Years | 83 (11.5%) | 18 (2.2%) |
| 20 to 24 Years | 39 (5.4%) | 33 (4.1%) |
| 25 to 29 Years | 7 (1.0%) | 17 (2.1%) |
| 30 to 34 Years | 0 (0.0%) | 13 (1.6%) |
| 35 to 39 Years | 32 (4.4%) | 92 (11.3%) |
| 40 to 44 Years | 94 (13.0%) | 191 (23.5%) |
| 45 to 49 Years | 156 (21.6%) | 15 (1.8%) |
| 50 to 54 Years | 68 (9.4%) | 43 (5.3%) |
| 55 to 59 Years | 53 (7.3%) | 23 (2.8%) |
| 60 to 64 Years | 0 (0.0%) | 0 (0.0%) |
| 65 to 69 Years | 0 (0.0%) | 62 (7.6%) |
| 70 to 74 Years | 0 (0.0%) | 24 (2.9%) |
| 75 to 79 Years | 44 (6.1%) | 28 (3.4%) |
| 80 to 84 Years | 0 (0.0%) | 25 (3.1%) |
| 85 Years and over | 13 (1.8%) | 13 (1.6%) |
| Total | 722 (100.0%) | 814 (100.0%) |
Families and Households in Bent Creek
Median Family Size in Bent Creek
The median family size in Bent Creek is 3.68 persons per family, with single male/father families (29 | 9.1%) accounting for the largest median family size of 4.34 persons per family. On the other hand, single female/mother families (56 | 17.6%) represent the smallest median family size with 3.13 persons per family.
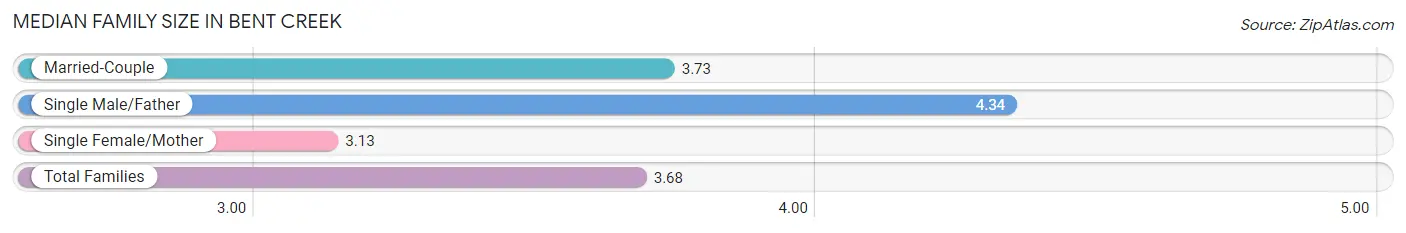
| Family Type | # Families | Family Size |
| Married-Couple | 233 (73.3%) | 3.73 |
| Single Male/Father | 29 (9.1%) | 4.34 |
| Single Female/Mother | 56 (17.6%) | 3.13 |
| Total Families | 318 (100.0%) | 3.68 |
Median Household Size in Bent Creek
The median household size in Bent Creek is 3.07 persons per household, with single male/father households (29 | 5.8%) accounting for the largest median household size of 5.86 persons per household. non-family households (181 | 36.3%) represent the smallest median household size with 1.64 persons per household.
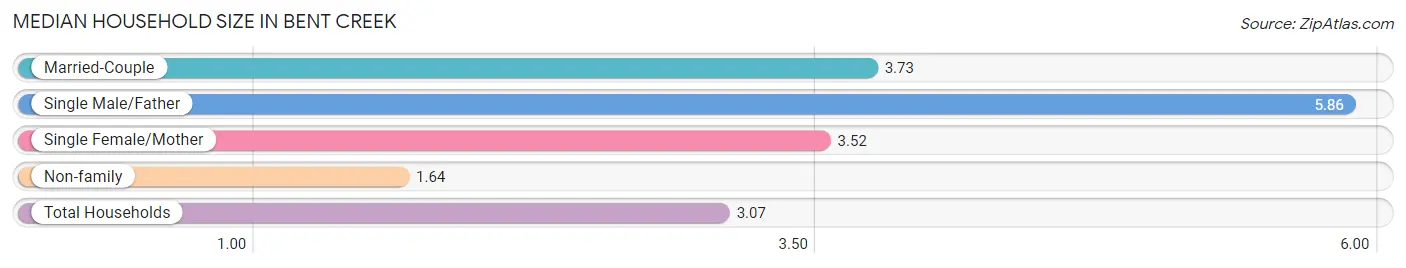
| Household Type | # Households | Household Size |
| Married-Couple | 233 (46.7%) | 3.73 |
| Single Male/Father | 29 (5.8%) | 5.86 |
| Single Female/Mother | 56 (11.2%) | 3.52 |
| Non-family | 181 (36.3%) | 1.64 |
| Total Households | 499 (100.0%) | 3.07 |
Household Size by Marriage Status in Bent Creek
Out of a total of 499 households in Bent Creek, 318 (63.7%) are family households, while 181 (36.3%) are nonfamily households. The most numerous type of family households are 4-person households, comprising 170, and the most common type of nonfamily households are 1-person households, comprising 127.
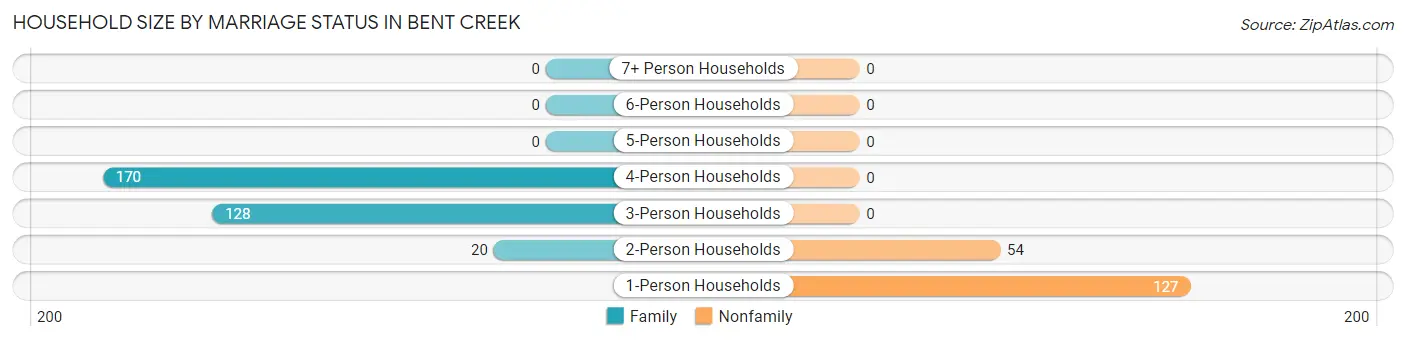
| Household Size | Family Households | Nonfamily Households |
| 1-Person Households | - | 127 (25.5%) |
| 2-Person Households | 20 (4.0%) | 54 (10.8%) |
| 3-Person Households | 128 (25.7%) | 0 (0.0%) |
| 4-Person Households | 170 (34.1%) | 0 (0.0%) |
| 5-Person Households | 0 (0.0%) | 0 (0.0%) |
| 6-Person Households | 0 (0.0%) | 0 (0.0%) |
| 7+ Person Households | 0 (0.0%) | 0 (0.0%) |
| Total | 318 (63.7%) | 181 (36.3%) |
Female Fertility in Bent Creek
Fertility by Age in Bent Creek
Average fertility rate in Bent Creek is 28.0 births per 1,000 women. Women in the age bracket of 35 to 50 years have the highest fertility rate with 35.0 births per 1,000 women. Women in the age bracket of 35 to 50 years acount for 100.0% of all women with births.
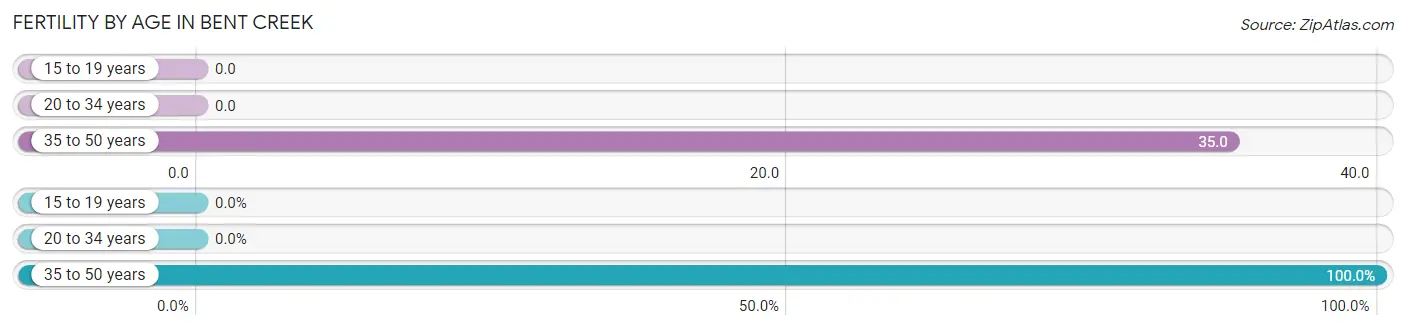
| Age Bracket | Women with Births | Births / 1,000 Women |
| 15 to 19 years | 0 (0.0%) | 0.0 |
| 20 to 34 years | 0 (0.0%) | 0.0 |
| 35 to 50 years | 12 (100.0%) | 35.0 |
| Total | 12 (100.0%) | 28.0 |
Fertility by Age by Marriage Status in Bent Creek
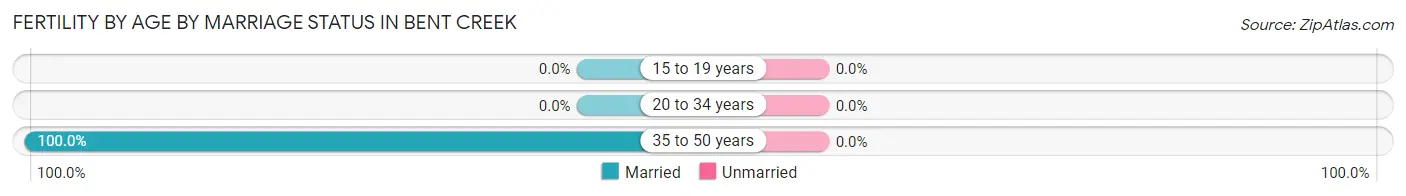
| Age Bracket | Married | Unmarried |
| 15 to 19 years | 0 (0.0%) | 0 (0.0%) |
| 20 to 34 years | 0 (0.0%) | 0 (0.0%) |
| 35 to 50 years | 12 (100.0%) | 0 (0.0%) |
| Total | 12 (100.0%) | 0 (0.0%) |
Fertility by Education in Bent Creek
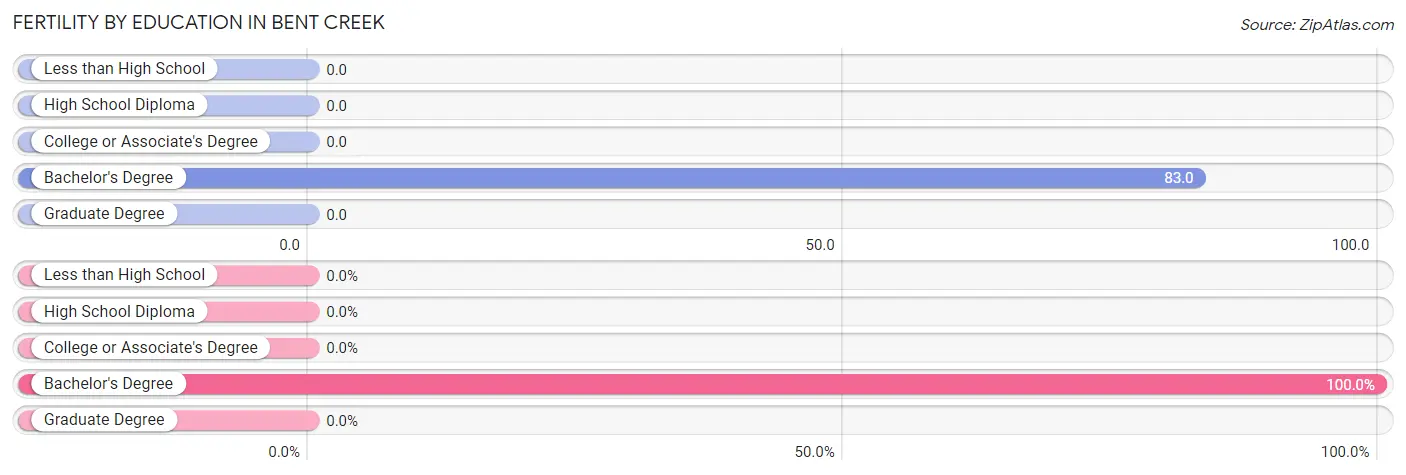
| Educational Attainment | Women with Births | Births / 1,000 Women |
| Less than High School | 0 (0.0%) | 0.0 |
| High School Diploma | 0 (0.0%) | 0.0 |
| College or Associate's Degree | 0 (0.0%) | 0.0 |
| Bachelor's Degree | 12 (100.0%) | 83.0 |
| Graduate Degree | 0 (0.0%) | 0.0 |
| Total | 12 (100.0%) | 28.0 |
Fertility by Education by Marriage Status in Bent Creek
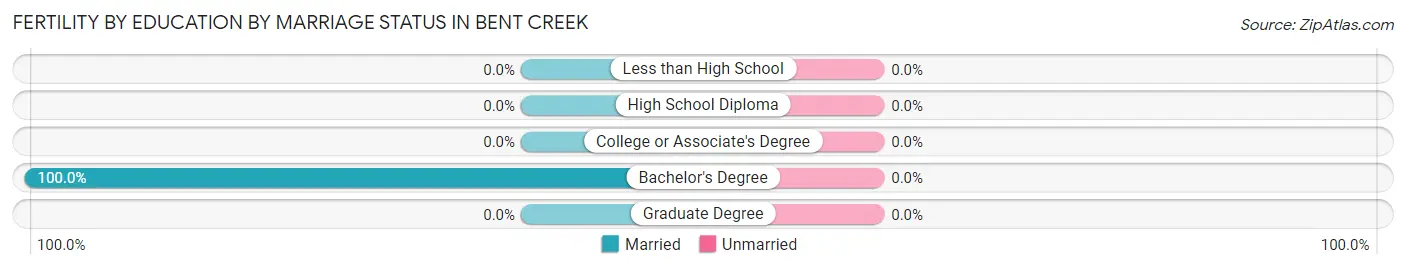
| Educational Attainment | Married | Unmarried |
| Less than High School | 0 (0.0%) | 0 (0.0%) |
| High School Diploma | 0 (0.0%) | 0 (0.0%) |
| College or Associate's Degree | 0 (0.0%) | 0 (0.0%) |
| Bachelor's Degree | 12 (100.0%) | 0 (0.0%) |
| Graduate Degree | 0 (0.0%) | 0 (0.0%) |
| Total | 12 (100.0%) | 0 (0.0%) |
Employment Characteristics in Bent Creek
Employment by Class of Employer in Bent Creek
Among the 778 employed individuals in Bent Creek, private company employees (561 | 72.1%), self-employed (incorporated) (89 | 11.4%), and not-for-profit organizations (52 | 6.7%) make up the most common classes of employment.
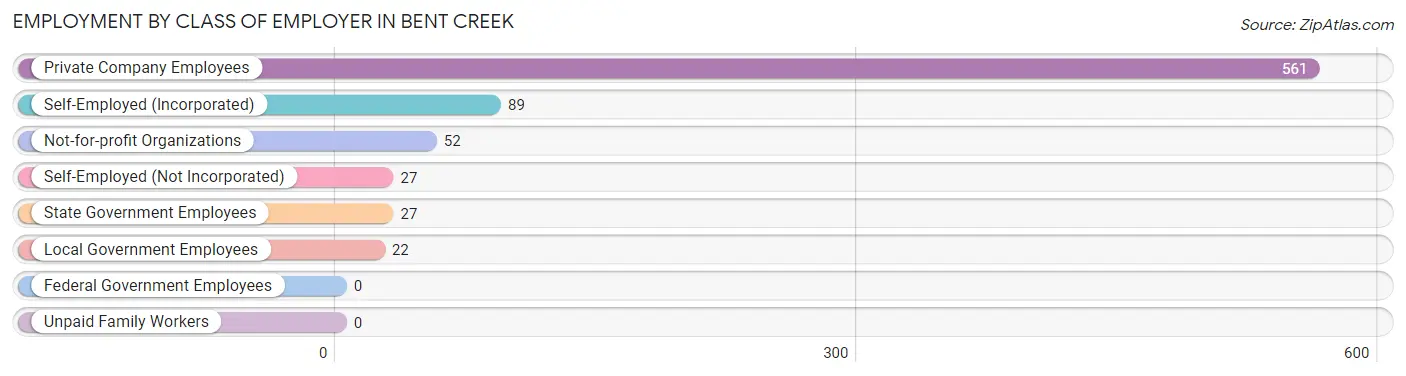
| Employer Class | # Employees | % Employees |
| Private Company Employees | 561 | 72.1% |
| Self-Employed (Incorporated) | 89 | 11.4% |
| Self-Employed (Not Incorporated) | 27 | 3.5% |
| Not-for-profit Organizations | 52 | 6.7% |
| Local Government Employees | 22 | 2.8% |
| State Government Employees | 27 | 3.5% |
| Federal Government Employees | 0 | 0.0% |
| Unpaid Family Workers | 0 | 0.0% |
| Total | 778 | 100.0% |
Employment Status by Age in Bent Creek
According to the labor force statistics for Bent Creek, out of the total population over 16 years of age (1,168), 77.2% or 902 individuals are in the labor force, with 13.7% or 124 of them unemployed. The age group with the highest labor force participation rate is 20 to 24 years, with 100.0% or 72 individuals in the labor force. Within the labor force, the 16 to 19 years age range has the highest percentage of unemployed individuals, with 100.0% or 22 of them being unemployed.
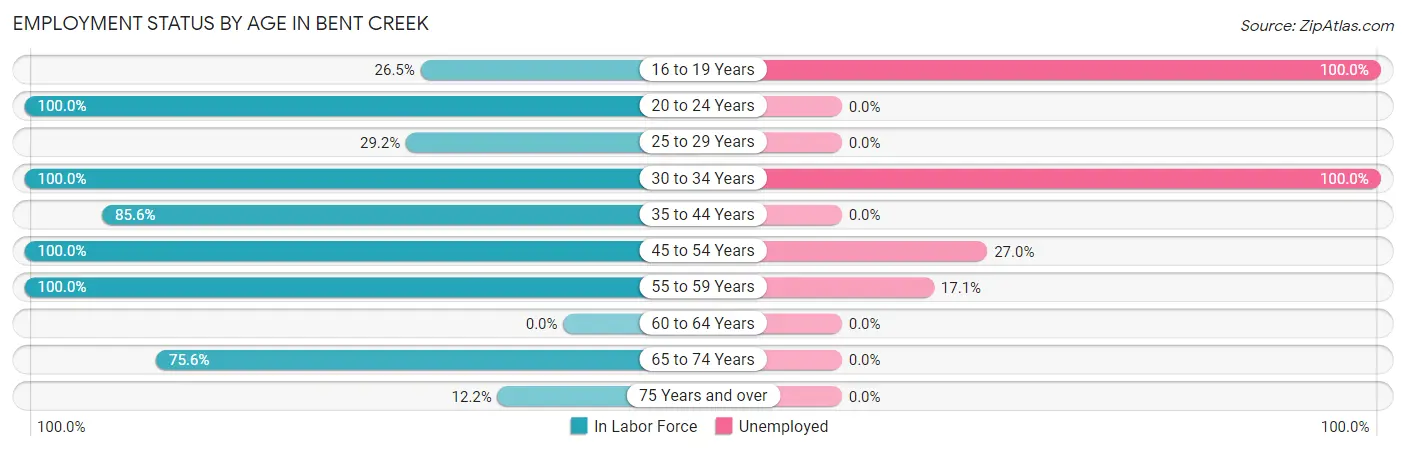
| Age Bracket | In Labor Force | Unemployed |
| 16 to 19 Years | 22 (26.5%) | 22 (100.0%) |
| 20 to 24 Years | 72 (100.0%) | 0 (0.0%) |
| 25 to 29 Years | 7 (29.2%) | 0 (0.0%) |
| 30 to 34 Years | 13 (100.0%) | 13 (100.0%) |
| 35 to 44 Years | 350 (85.6%) | 0 (0.0%) |
| 45 to 54 Years | 282 (100.0%) | 76 (27.0%) |
| 55 to 59 Years | 76 (100.0%) | 13 (17.1%) |
| 60 to 64 Years | 0 (0.0%) | 0 (0.0%) |
| 65 to 74 Years | 65 (75.6%) | 0 (0.0%) |
| 75 Years and over | 15 (12.2%) | 0 (0.0%) |
| Total | 902 (77.2%) | 124 (13.7%) |
Employment Status by Educational Attainment in Bent Creek
According to labor force statistics for Bent Creek, 90.5% of individuals (728) out of the total population between 25 and 64 years of age (804) are in the labor force, with 14.0% or 102 of them being unemployed. The group with the highest labor force participation rate are those with the educational attainment of less than high school, with 100.0% or 93 individuals in the labor force. Within the labor force, individuals with less than high school education have the highest percentage of unemployment, with 81.7% or 76 of them being unemployed.
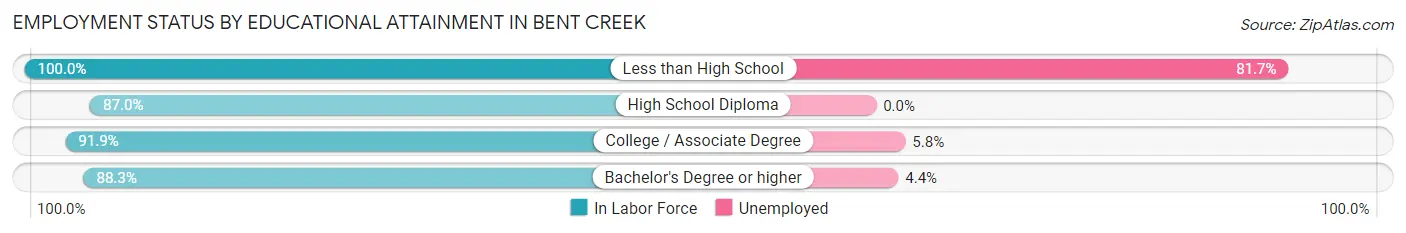
| Educational Attainment | In Labor Force | Unemployed |
| Less than High School | 93 (100.0%) | 76 (81.7%) |
| High School Diploma | 114 (87.0%) | 0 (0.0%) |
| College / Associate Degree | 226 (91.9%) | 14 (5.8%) |
| Bachelor's Degree or higher | 295 (88.3%) | 15 (4.4%) |
| Total | 728 (90.5%) | 113 (14.0%) |
Employment Occupations by Sex in Bent Creek
Management, Business, Science and Arts Occupations
The most common Management, Business, Science and Arts occupations in Bent Creek are Management (158 | 20.3%), Health Diagnosing & Treating (126 | 16.2%), Health Technologists (70 | 9.0%), Computers, Engineering & Science (68 | 8.7%), and Computers & Mathematics (68 | 8.7%).
Management, Business, Science and Arts Occupations by Sex
Within the Management, Business, Science and Arts occupations in Bent Creek, the most male-oriented occupations are Computers, Engineering & Science (100.0%), Computers & Mathematics (100.0%), and Legal Services & Support (100.0%), while the most female-oriented occupations are Business & Financial (100.0%), Education Instruction & Library (100.0%), and Community & Social Service (73.7%).
| Occupation | Male | Female |
| Management | 106 (67.1%) | 52 (32.9%) |
| Business & Financial | 0 (0.0%) | 44 (100.0%) |
| Computers, Engineering & Science | 68 (100.0%) | 0 (0.0%) |
| Computers & Mathematics | 68 (100.0%) | 0 (0.0%) |
| Architecture & Engineering | 0 (0.0%) | 0 (0.0%) |
| Life, Physical & Social Science | 0 (0.0%) | 0 (0.0%) |
| Community & Social Service | 15 (26.3%) | 42 (73.7%) |
| Education, Arts & Media | 0 (0.0%) | 0 (0.0%) |
| Legal Services & Support | 15 (100.0%) | 0 (0.0%) |
| Education Instruction & Library | 0 (0.0%) | 42 (100.0%) |
| Arts, Media & Entertainment | 0 (0.0%) | 0 (0.0%) |
| Health Diagnosing & Treating | 47 (37.3%) | 79 (62.7%) |
| Health Technologists | 31 (44.3%) | 39 (55.7%) |
| Total (Category) | 236 (52.1%) | 217 (47.9%) |
| Total (Overall) | 343 (44.1%) | 435 (55.9%) |
Services Occupations
The most common Services occupations in Bent Creek are Cleaning & Maintenance (20 | 2.6%), Security & Protection (7 | 0.9%), and Law Enforcement (7 | 0.9%).
Services Occupations by Sex
| Occupation | Male | Female |
| Healthcare Support | 0 (0.0%) | 0 (0.0%) |
| Security & Protection | 7 (100.0%) | 0 (0.0%) |
| Firefighting & Prevention | 0 (0.0%) | 0 (0.0%) |
| Law Enforcement | 7 (100.0%) | 0 (0.0%) |
| Food Preparation & Serving | 0 (0.0%) | 0 (0.0%) |
| Cleaning & Maintenance | 20 (100.0%) | 0 (0.0%) |
| Personal Care & Service | 0 (0.0%) | 0 (0.0%) |
| Total (Category) | 27 (100.0%) | 0 (0.0%) |
| Total (Overall) | 343 (44.1%) | 435 (55.9%) |
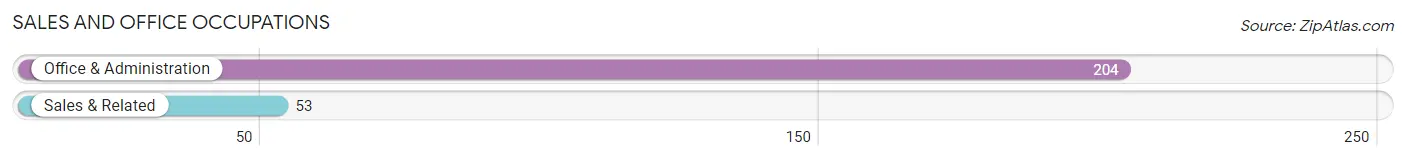
Sales and Office Occupations
The most common Sales and Office occupations in Bent Creek are Office & Administration (204 | 26.2%), and Sales & Related (53 | 6.8%).
Sales and Office Occupations by Sex
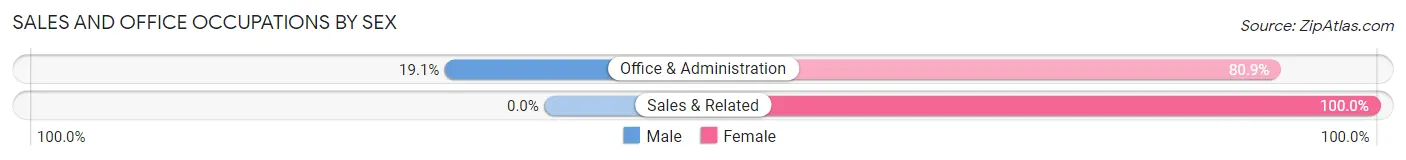
| Occupation | Male | Female |
| Sales & Related | 0 (0.0%) | 53 (100.0%) |
| Office & Administration | 39 (19.1%) | 165 (80.9%) |
| Total (Category) | 39 (15.2%) | 218 (84.8%) |
| Total (Overall) | 343 (44.1%) | 435 (55.9%) |
Natural Resources, Construction and Maintenance Occupations
Natural Resources, Construction and Maintenance Occupations by Sex
| Occupation | Male | Female |
| Farming, Fishing & Forestry | 0 (0.0%) | 0 (0.0%) |
| Construction & Extraction | 0 (0.0%) | 0 (0.0%) |
| Installation, Maintenance & Repair | 0 (0.0%) | 0 (0.0%) |
| Total (Category) | 0 (0.0%) | 0 (0.0%) |
| Total (Overall) | 343 (44.1%) | 435 (55.9%) |
Production, Transportation and Moving Occupations
The most common Production, Transportation and Moving occupations in Bent Creek are Production (24 | 3.1%), and Transportation (17 | 2.2%).
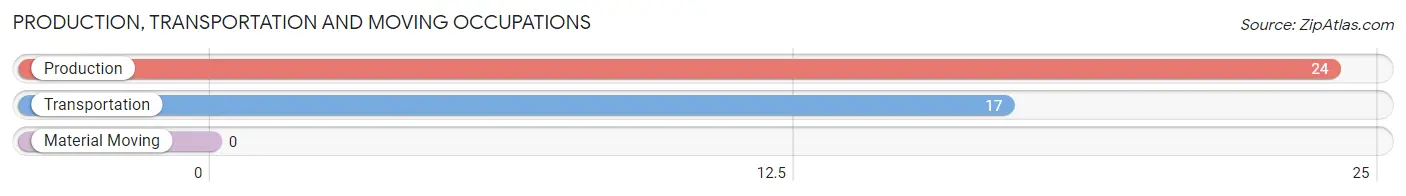
Production, Transportation and Moving Occupations by Sex
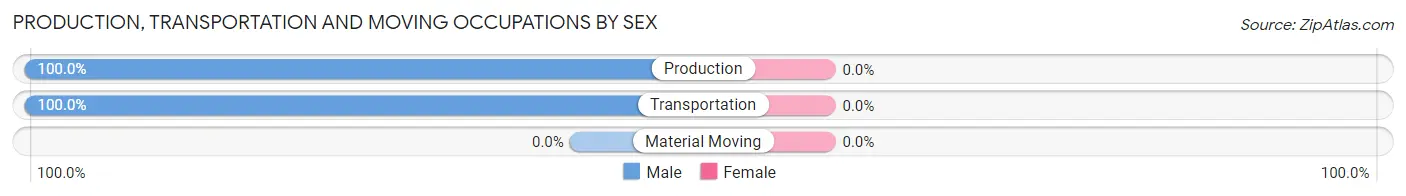
| Occupation | Male | Female |
| Production | 24 (100.0%) | 0 (0.0%) |
| Transportation | 17 (100.0%) | 0 (0.0%) |
| Material Moving | 0 (0.0%) | 0 (0.0%) |
| Total (Category) | 41 (100.0%) | 0 (0.0%) |
| Total (Overall) | 343 (44.1%) | 435 (55.9%) |
Employment Industries by Sex in Bent Creek
Employment Industries in Bent Creek
The major employment industries in Bent Creek include Health Care & Social Assistance (234 | 30.1%), Retail Trade (125 | 16.1%), Manufacturing (72 | 9.2%), Educational Services (64 | 8.2%), and Professional & Scientific (59 | 7.6%).
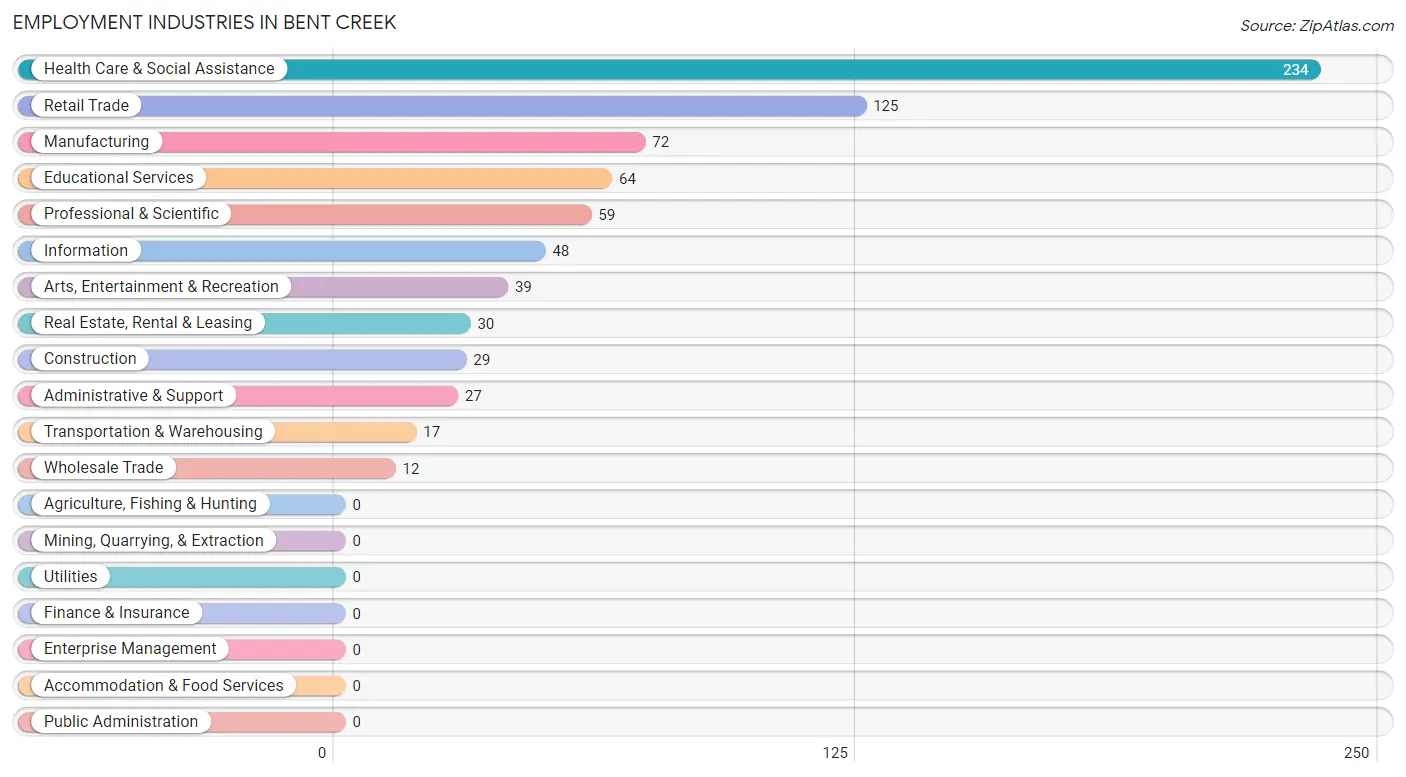
Employment Industries by Sex in Bent Creek
The Bent Creek industries that see more men than women are Construction (100.0%), Transportation & Warehousing (100.0%), and Administrative & Support (100.0%), whereas the industries that tend to have a higher number of women are Wholesale Trade (100.0%), Real Estate, Rental & Leasing (100.0%), and Educational Services (82.8%).
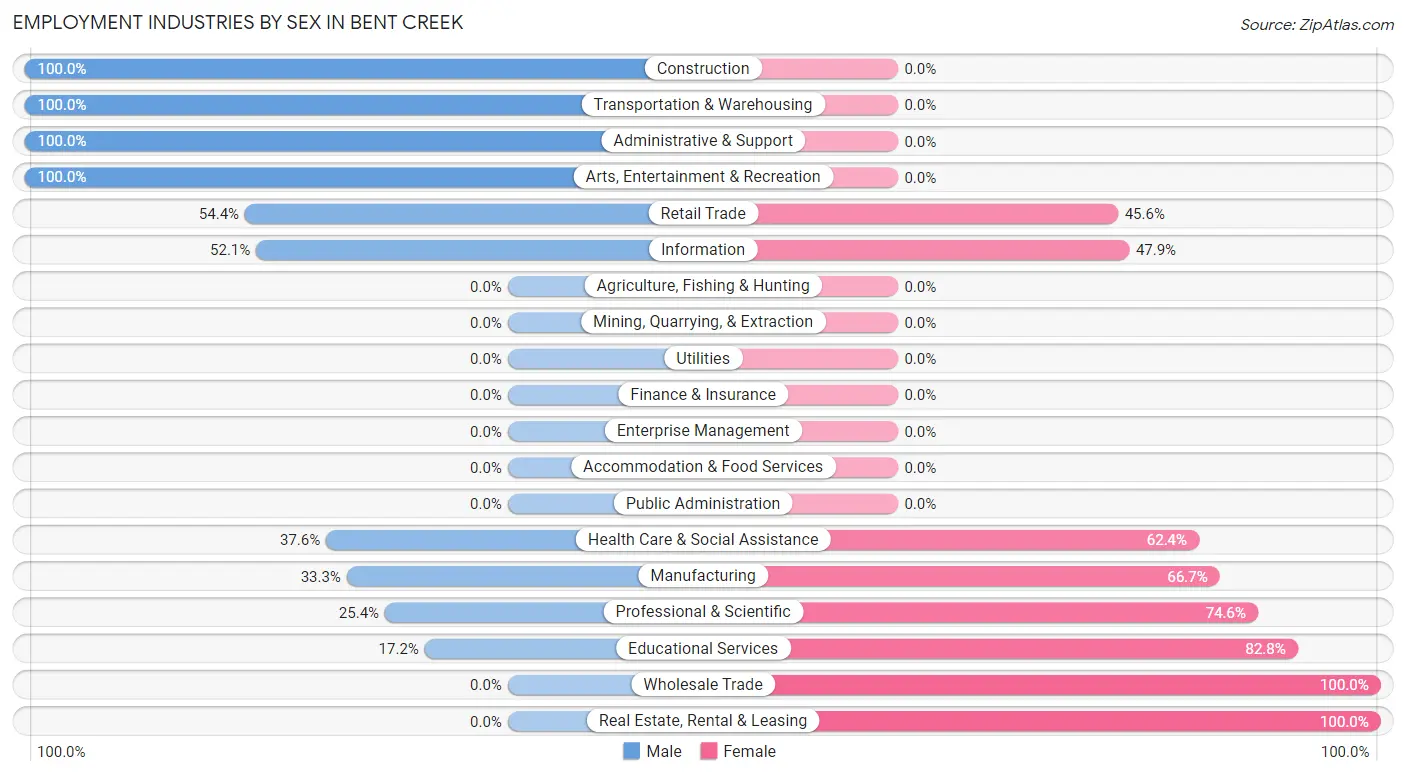
| Industry | Male | Female |
| Agriculture, Fishing & Hunting | 0 (0.0%) | 0 (0.0%) |
| Mining, Quarrying, & Extraction | 0 (0.0%) | 0 (0.0%) |
| Construction | 29 (100.0%) | 0 (0.0%) |
| Manufacturing | 24 (33.3%) | 48 (66.7%) |
| Wholesale Trade | 0 (0.0%) | 12 (100.0%) |
| Retail Trade | 68 (54.4%) | 57 (45.6%) |
| Transportation & Warehousing | 17 (100.0%) | 0 (0.0%) |
| Utilities | 0 (0.0%) | 0 (0.0%) |
| Information | 25 (52.1%) | 23 (47.9%) |
| Finance & Insurance | 0 (0.0%) | 0 (0.0%) |
| Real Estate, Rental & Leasing | 0 (0.0%) | 30 (100.0%) |
| Professional & Scientific | 15 (25.4%) | 44 (74.6%) |
| Enterprise Management | 0 (0.0%) | 0 (0.0%) |
| Administrative & Support | 27 (100.0%) | 0 (0.0%) |
| Educational Services | 11 (17.2%) | 53 (82.8%) |
| Health Care & Social Assistance | 88 (37.6%) | 146 (62.4%) |
| Arts, Entertainment & Recreation | 39 (100.0%) | 0 (0.0%) |
| Accommodation & Food Services | 0 (0.0%) | 0 (0.0%) |
| Public Administration | 0 (0.0%) | 0 (0.0%) |
| Total | 343 (44.1%) | 435 (55.9%) |
Education in Bent Creek
School Enrollment in Bent Creek
The most common levels of schooling among the 430 students in Bent Creek are high school (101 | 23.5%), nursery / preschool (94 | 21.9%), and elementary school (92 | 21.4%).
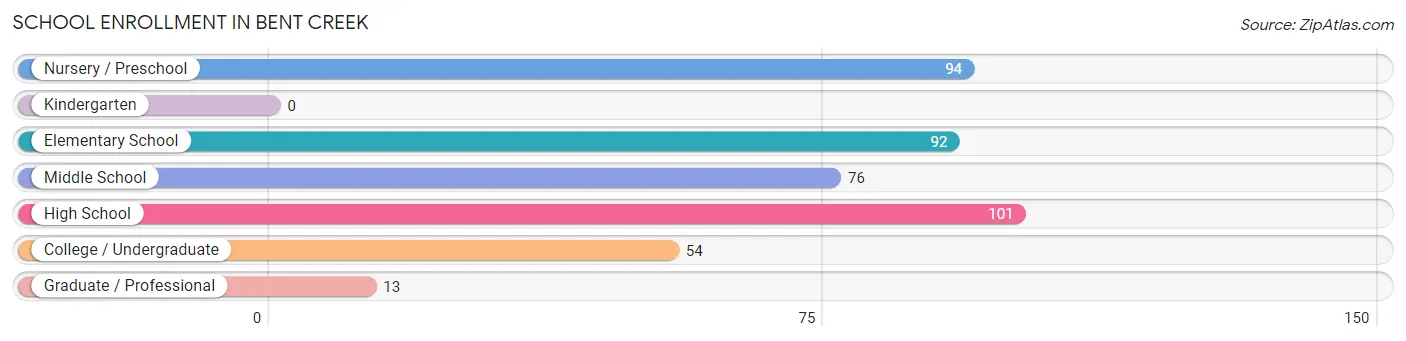
| School Level | # Students | % Students |
| Nursery / Preschool | 94 | 21.9% |
| Kindergarten | 0 | 0.0% |
| Elementary School | 92 | 21.4% |
| Middle School | 76 | 17.7% |
| High School | 101 | 23.5% |
| College / Undergraduate | 54 | 12.6% |
| Graduate / Professional | 13 | 3.0% |
| Total | 430 | 100.0% |
School Enrollment by Age by Funding Source in Bent Creek
Out of a total of 430 students who are enrolled in schools in Bent Creek, 203 (47.2%) attend a private institution, while the remaining 227 (52.8%) are enrolled in public schools. The age group of 20 to 24 year olds has the highest likelihood of being enrolled in private schools, with 39 (72.2% in the age bracket) enrolled. Conversely, the age group of 15 to 17 year olds has the lowest likelihood of being enrolled in a private school, with 63 (100.0% in the age bracket) attending a public institution.
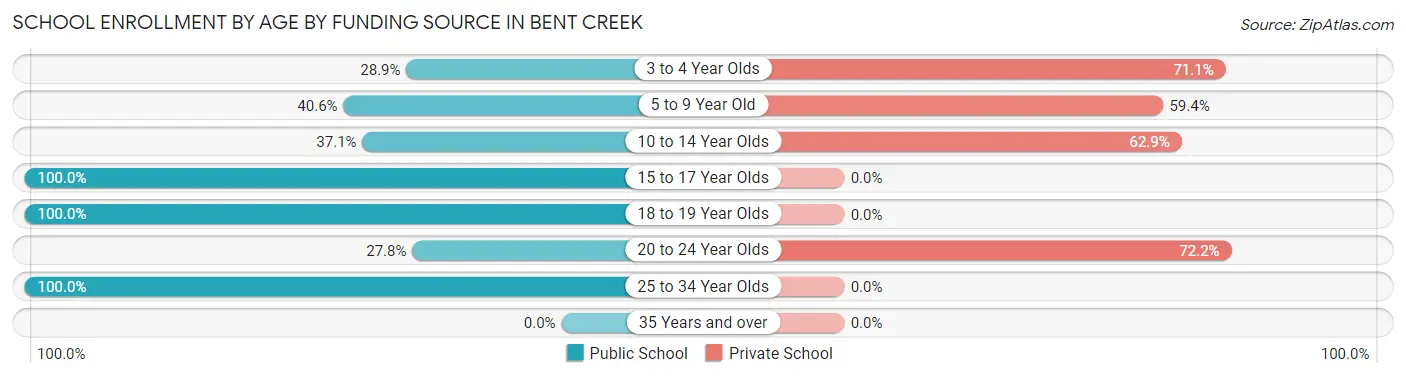
| Age Bracket | Public School | Private School |
| 3 to 4 Year Olds | 13 (28.9%) | 32 (71.1%) |
| 5 to 9 Year Old | 52 (40.6%) | 76 (59.4%) |
| 10 to 14 Year Olds | 33 (37.1%) | 56 (62.9%) |
| 15 to 17 Year Olds | 63 (100.0%) | 0 (0.0%) |
| 18 to 19 Year Olds | 38 (100.0%) | 0 (0.0%) |
| 20 to 24 Year Olds | 15 (27.8%) | 39 (72.2%) |
| 25 to 34 Year Olds | 13 (100.0%) | 0 (0.0%) |
| 35 Years and over | 0 (0.0%) | 0 (0.0%) |
| Total | 227 (52.8%) | 203 (47.2%) |
Educational Attainment by Field of Study in Bent Creek
Business (86 | 19.3%), arts & humanities (66 | 14.8%), psychology (60 | 13.5%), science & technology (56 | 12.6%), and visual & performing arts (51 | 11.4%) are the most common fields of study among 446 individuals in Bent Creek who have obtained a bachelor's degree or higher.
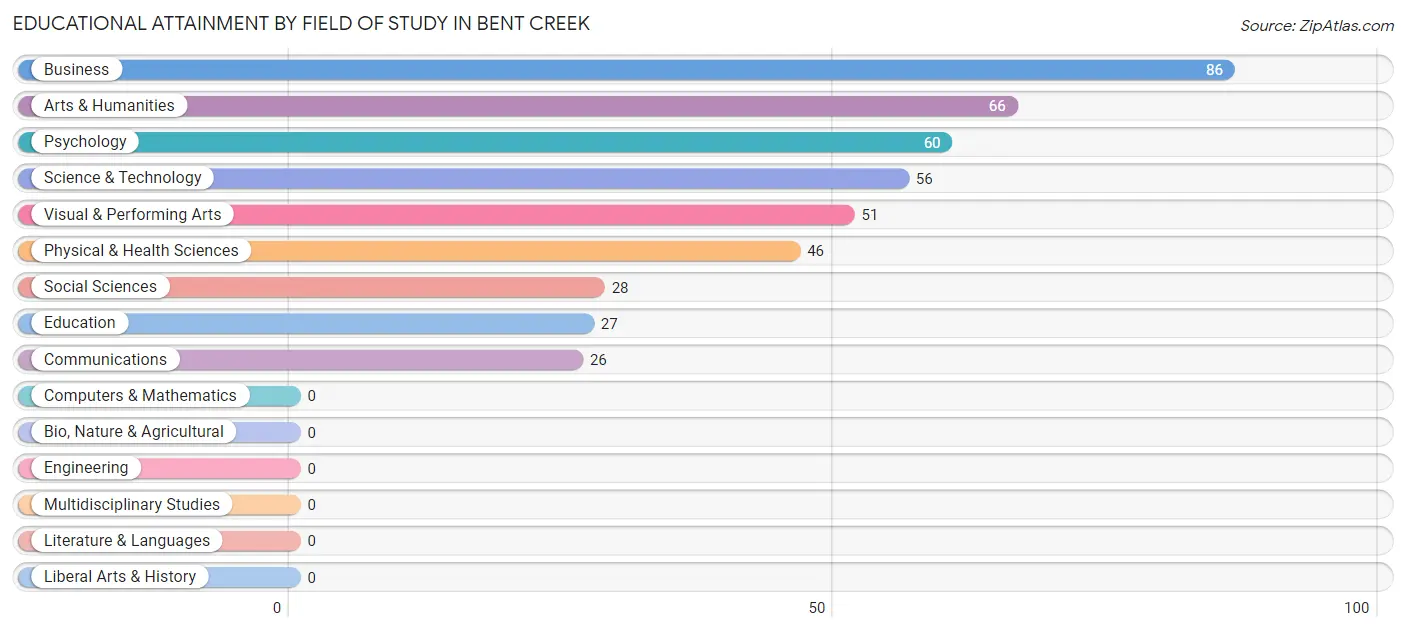
| Field of Study | # Graduates | % Graduates |
| Computers & Mathematics | 0 | 0.0% |
| Bio, Nature & Agricultural | 0 | 0.0% |
| Physical & Health Sciences | 46 | 10.3% |
| Psychology | 60 | 13.5% |
| Social Sciences | 28 | 6.3% |
| Engineering | 0 | 0.0% |
| Multidisciplinary Studies | 0 | 0.0% |
| Science & Technology | 56 | 12.6% |
| Business | 86 | 19.3% |
| Education | 27 | 6.0% |
| Literature & Languages | 0 | 0.0% |
| Liberal Arts & History | 0 | 0.0% |
| Visual & Performing Arts | 51 | 11.4% |
| Communications | 26 | 5.8% |
| Arts & Humanities | 66 | 14.8% |
| Total | 446 | 100.0% |
Transportation & Commute in Bent Creek
Vehicle Availability by Sex in Bent Creek
The most prevalent vehicle ownership categories in Bent Creek are males with 3 vehicles (226, accounting for 65.9%) and females with 3 vehicles (248, making up 51.9%).
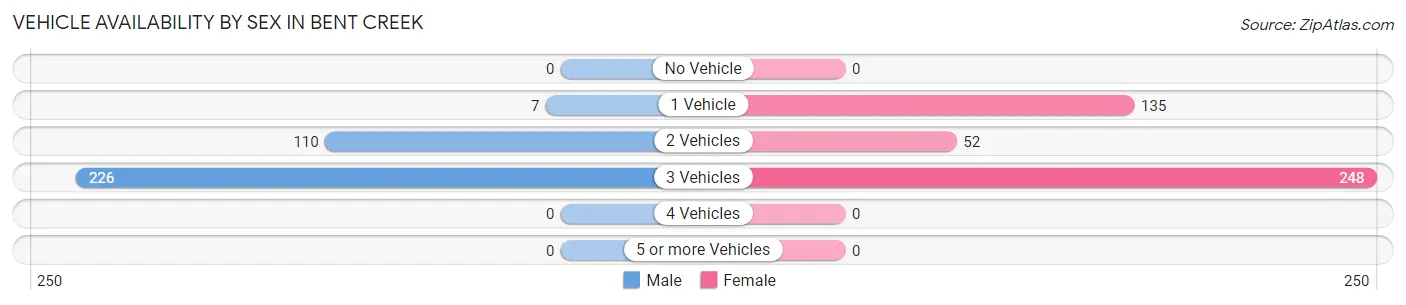
| Vehicles Available | Male | Female |
| No Vehicle | 0 (0.0%) | 0 (0.0%) |
| 1 Vehicle | 7 (2.0%) | 135 (31.0%) |
| 2 Vehicles | 110 (32.1%) | 52 (11.9%) |
| 3 Vehicles | 226 (65.9%) | 248 (57.0%) |
| 4 Vehicles | 0 (0.0%) | 0 (0.0%) |
| 5 or more Vehicles | 0 (0.0%) | 0 (0.0%) |
| Total | 343 (100.0%) | 435 (100.0%) |
Commute Time in Bent Creek
The most frequently occuring commute durations in Bent Creek are 15 to 19 minutes (162 commuters, 24.5%), 20 to 24 minutes (143 commuters, 21.6%), and 25 to 29 minutes (143 commuters, 21.6%).
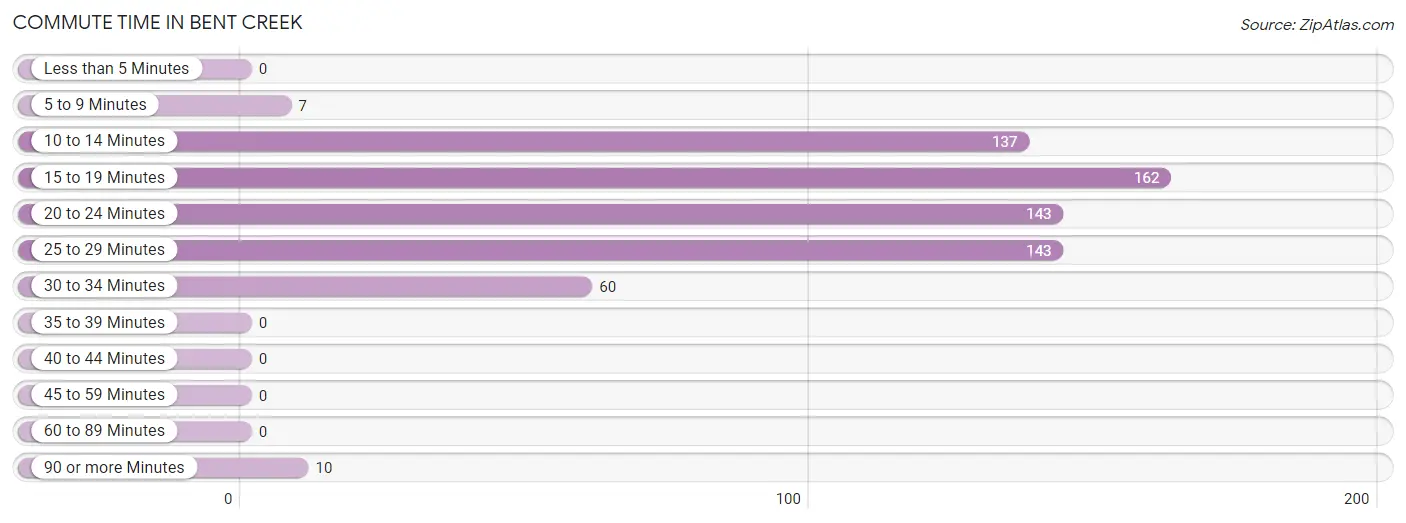
| Commute Time | # Commuters | % Commuters |
| Less than 5 Minutes | 0 | 0.0% |
| 5 to 9 Minutes | 7 | 1.1% |
| 10 to 14 Minutes | 137 | 20.7% |
| 15 to 19 Minutes | 162 | 24.5% |
| 20 to 24 Minutes | 143 | 21.6% |
| 25 to 29 Minutes | 143 | 21.6% |
| 30 to 34 Minutes | 60 | 9.1% |
| 35 to 39 Minutes | 0 | 0.0% |
| 40 to 44 Minutes | 0 | 0.0% |
| 45 to 59 Minutes | 0 | 0.0% |
| 60 to 89 Minutes | 0 | 0.0% |
| 90 or more Minutes | 10 | 1.5% |
Commute Time by Sex in Bent Creek
The most common commute times in Bent Creek are 15 to 19 minutes (106 commuters, 34.0%) for males and 25 to 29 minutes (126 commuters, 36.0%) for females.
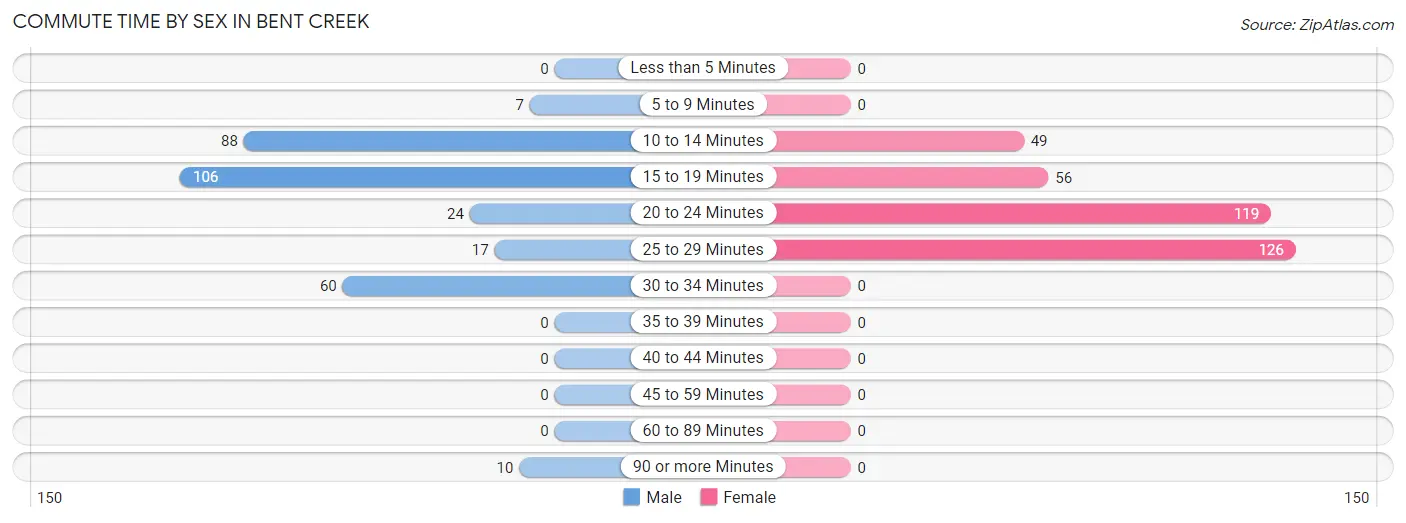
| Commute Time | Male | Female |
| Less than 5 Minutes | 0 (0.0%) | 0 (0.0%) |
| 5 to 9 Minutes | 7 (2.2%) | 0 (0.0%) |
| 10 to 14 Minutes | 88 (28.2%) | 49 (14.0%) |
| 15 to 19 Minutes | 106 (34.0%) | 56 (16.0%) |
| 20 to 24 Minutes | 24 (7.7%) | 119 (34.0%) |
| 25 to 29 Minutes | 17 (5.4%) | 126 (36.0%) |
| 30 to 34 Minutes | 60 (19.2%) | 0 (0.0%) |
| 35 to 39 Minutes | 0 (0.0%) | 0 (0.0%) |
| 40 to 44 Minutes | 0 (0.0%) | 0 (0.0%) |
| 45 to 59 Minutes | 0 (0.0%) | 0 (0.0%) |
| 60 to 89 Minutes | 0 (0.0%) | 0 (0.0%) |
| 90 or more Minutes | 10 (3.2%) | 0 (0.0%) |
Time of Departure to Work by Sex in Bent Creek
The most frequent times of departure to work in Bent Creek are 6:30 AM to 6:59 AM (88, 28.2%) for males and 9:00 AM to 9:59 AM (134, 38.3%) for females.
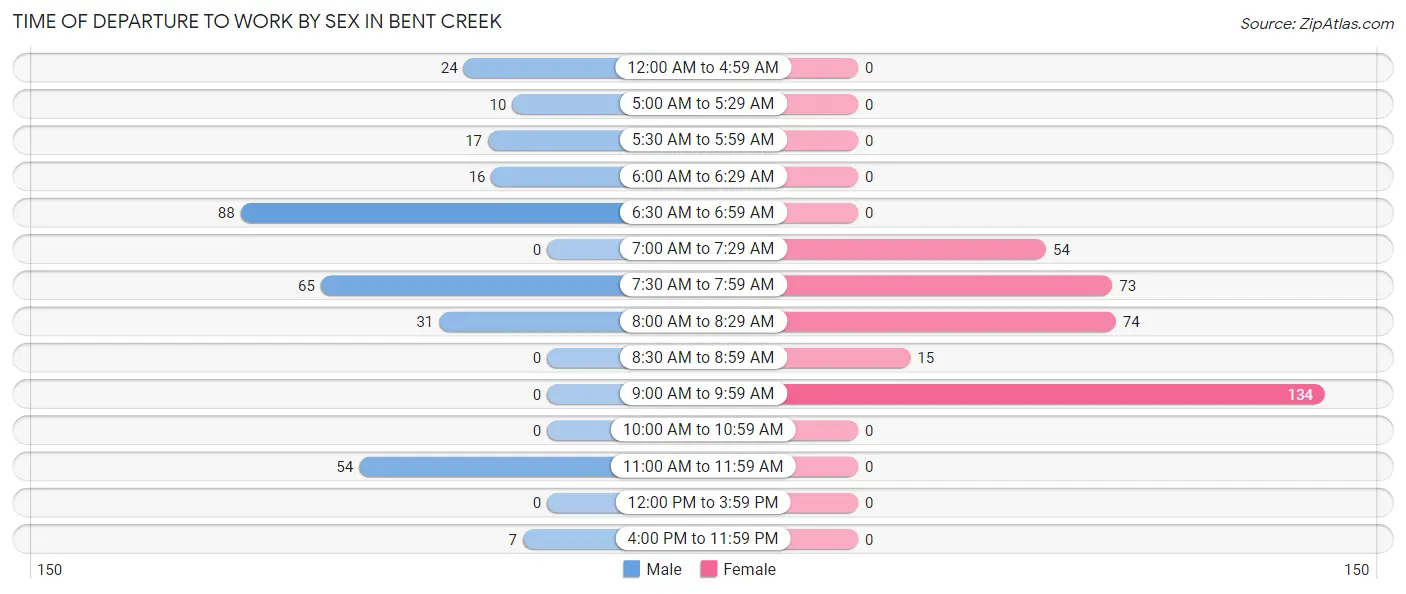
| Time of Departure | Male | Female |
| 12:00 AM to 4:59 AM | 24 (7.7%) | 0 (0.0%) |
| 5:00 AM to 5:29 AM | 10 (3.2%) | 0 (0.0%) |
| 5:30 AM to 5:59 AM | 17 (5.4%) | 0 (0.0%) |
| 6:00 AM to 6:29 AM | 16 (5.1%) | 0 (0.0%) |
| 6:30 AM to 6:59 AM | 88 (28.2%) | 0 (0.0%) |
| 7:00 AM to 7:29 AM | 0 (0.0%) | 54 (15.4%) |
| 7:30 AM to 7:59 AM | 65 (20.8%) | 73 (20.9%) |
| 8:00 AM to 8:29 AM | 31 (9.9%) | 74 (21.1%) |
| 8:30 AM to 8:59 AM | 0 (0.0%) | 15 (4.3%) |
| 9:00 AM to 9:59 AM | 0 (0.0%) | 134 (38.3%) |
| 10:00 AM to 10:59 AM | 0 (0.0%) | 0 (0.0%) |
| 11:00 AM to 11:59 AM | 54 (17.3%) | 0 (0.0%) |
| 12:00 PM to 3:59 PM | 0 (0.0%) | 0 (0.0%) |
| 4:00 PM to 11:59 PM | 7 (2.2%) | 0 (0.0%) |
| Total | 312 (100.0%) | 350 (100.0%) |
Housing Occupancy in Bent Creek
Occupancy by Ownership in Bent Creek
Of the total 499 dwellings in Bent Creek, owner-occupied units account for 461 (92.4%), while renter-occupied units make up 38 (7.6%).
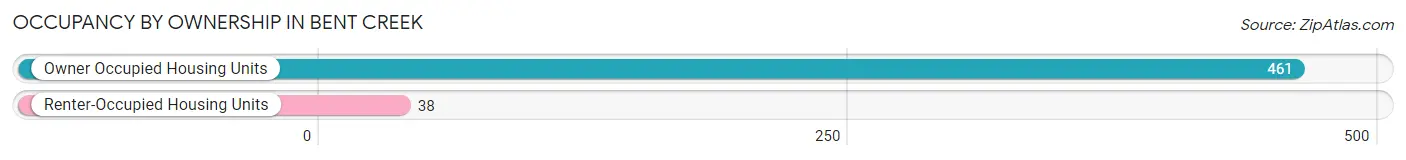
| Occupancy | # Housing Units | % Housing Units |
| Owner Occupied Housing Units | 461 | 92.4% |
| Renter-Occupied Housing Units | 38 | 7.6% |
| Total Occupied Housing Units | 499 | 100.0% |
Occupancy by Household Size in Bent Creek
| Household Size | # Housing Units | % Housing Units |
| 1-Person Household | 127 | 25.5% |
| 2-Person Household | 74 | 14.8% |
| 3-Person Household | 128 | 25.7% |
| 4+ Person Household | 170 | 34.1% |
| Total Housing Units | 499 | 100.0% |
Occupancy by Ownership by Household Size in Bent Creek
| Household Size | Owner-occupied | Renter-occupied |
| 1-Person Household | 127 (100.0%) | 0 (0.0%) |
| 2-Person Household | 67 (90.5%) | 7 (9.5%) |
| 3-Person Household | 128 (100.0%) | 0 (0.0%) |
| 4+ Person Household | 139 (81.8%) | 31 (18.2%) |
| Total Housing Units | 461 (92.4%) | 38 (7.6%) |
Occupancy by Educational Attainment in Bent Creek
| Household Size | Owner-occupied | Renter-occupied |
| Less than High School | 54 (100.0%) | 0 (0.0%) |
| High School Diploma | 152 (95.6%) | 7 (4.4%) |
| College/Associate Degree | 80 (100.0%) | 0 (0.0%) |
| Bachelor's Degree or higher | 175 (85.0%) | 31 (15.0%) |
Occupancy by Age of Householder in Bent Creek
| Age Bracket | # Households | % Households |
| Under 35 Years | 20 | 4.0% |
| 35 to 44 Years | 128 | 25.7% |
| 45 to 54 Years | 138 | 27.7% |
| 55 to 64 Years | 47 | 9.4% |
| 65 to 74 Years | 86 | 17.2% |
| 75 to 84 Years | 54 | 10.8% |
| 85 Years and Over | 26 | 5.2% |
| Total | 499 | 100.0% |
Housing Finances in Bent Creek
Median Income by Occupancy in Bent Creek
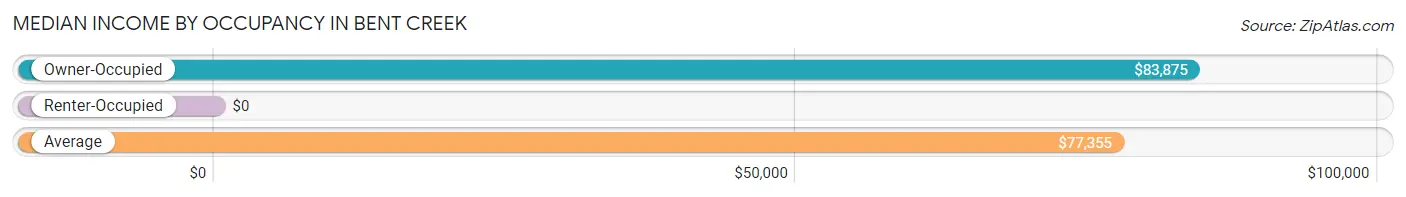
| Occupancy Type | # Households | Median Income |
| Owner-Occupied | 461 (92.4%) | $83,875 |
| Renter-Occupied | 38 (7.6%) | $0 |
| Average | 499 (100.0%) | $77,355 |
Occupancy by Householder Income Bracket in Bent Creek
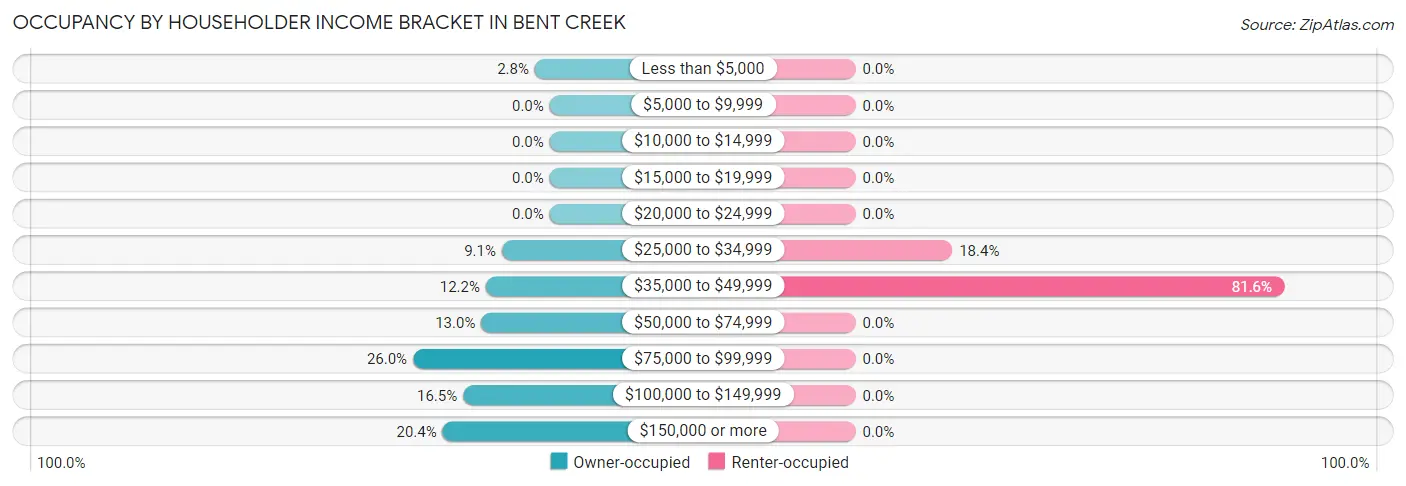
| Income Bracket | Owner-occupied | Renter-occupied |
| Less than $5,000 | 13 (2.8%) | 0 (0.0%) |
| $5,000 to $9,999 | 0 (0.0%) | 0 (0.0%) |
| $10,000 to $14,999 | 0 (0.0%) | 0 (0.0%) |
| $15,000 to $19,999 | 0 (0.0%) | 0 (0.0%) |
| $20,000 to $24,999 | 0 (0.0%) | 0 (0.0%) |
| $25,000 to $34,999 | 42 (9.1%) | 7 (18.4%) |
| $35,000 to $49,999 | 56 (12.1%) | 31 (81.6%) |
| $50,000 to $74,999 | 60 (13.0%) | 0 (0.0%) |
| $75,000 to $99,999 | 120 (26.0%) | 0 (0.0%) |
| $100,000 to $149,999 | 76 (16.5%) | 0 (0.0%) |
| $150,000 or more | 94 (20.4%) | 0 (0.0%) |
| Total | 461 (100.0%) | 38 (100.0%) |
Monthly Housing Cost Tiers in Bent Creek
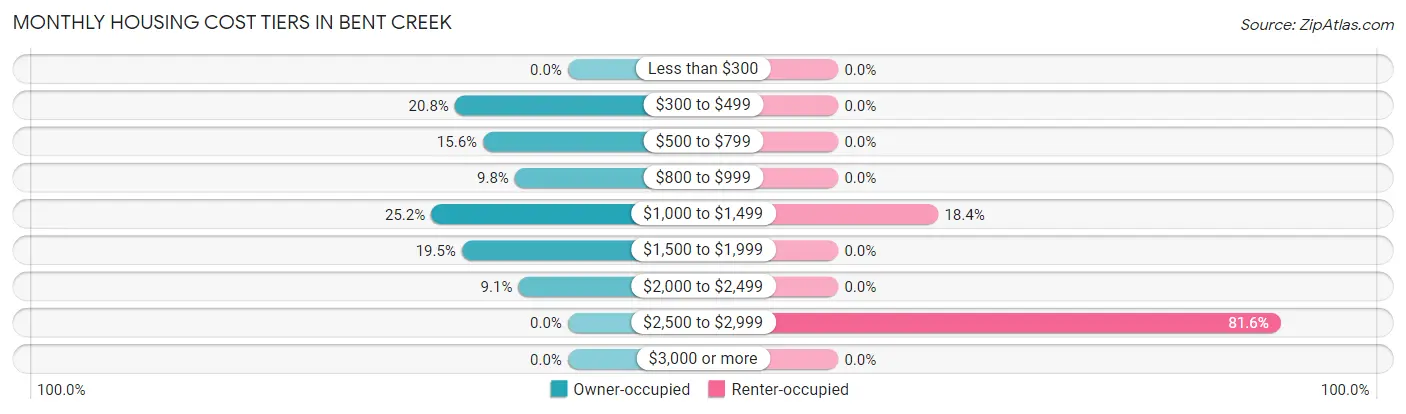
| Monthly Cost | Owner-occupied | Renter-occupied |
| Less than $300 | 0 (0.0%) | 0 (0.0%) |
| $300 to $499 | 96 (20.8%) | 0 (0.0%) |
| $500 to $799 | 72 (15.6%) | 0 (0.0%) |
| $800 to $999 | 45 (9.8%) | 0 (0.0%) |
| $1,000 to $1,499 | 116 (25.2%) | 7 (18.4%) |
| $1,500 to $1,999 | 90 (19.5%) | 0 (0.0%) |
| $2,000 to $2,499 | 42 (9.1%) | 0 (0.0%) |
| $2,500 to $2,999 | 0 (0.0%) | 31 (81.6%) |
| $3,000 or more | 0 (0.0%) | 0 (0.0%) |
| Total | 461 (100.0%) | 38 (100.0%) |
Physical Housing Characteristics in Bent Creek
Housing Structures in Bent Creek
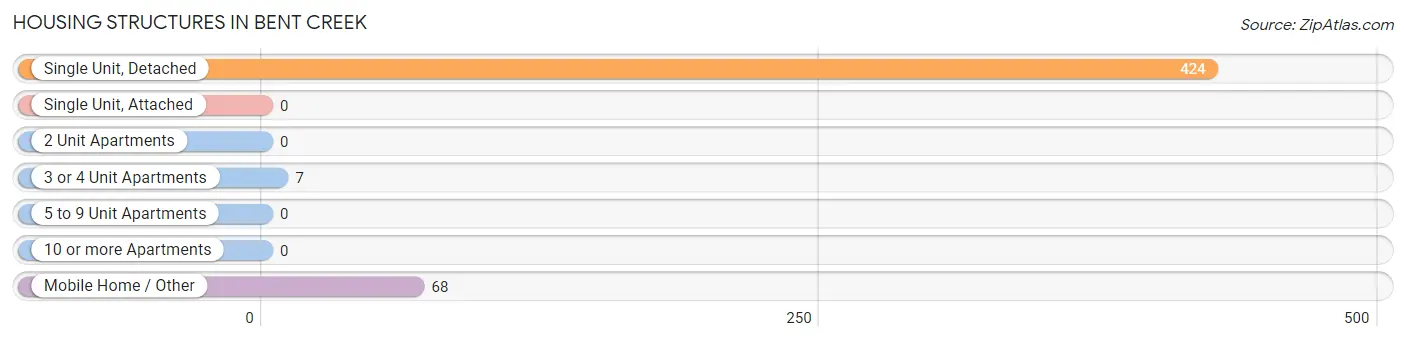
| Structure Type | # Housing Units | % Housing Units |
| Single Unit, Detached | 424 | 85.0% |
| Single Unit, Attached | 0 | 0.0% |
| 2 Unit Apartments | 0 | 0.0% |
| 3 or 4 Unit Apartments | 7 | 1.4% |
| 5 to 9 Unit Apartments | 0 | 0.0% |
| 10 or more Apartments | 0 | 0.0% |
| Mobile Home / Other | 68 | 13.6% |
| Total | 499 | 100.0% |
Housing Structures by Occupancy in Bent Creek
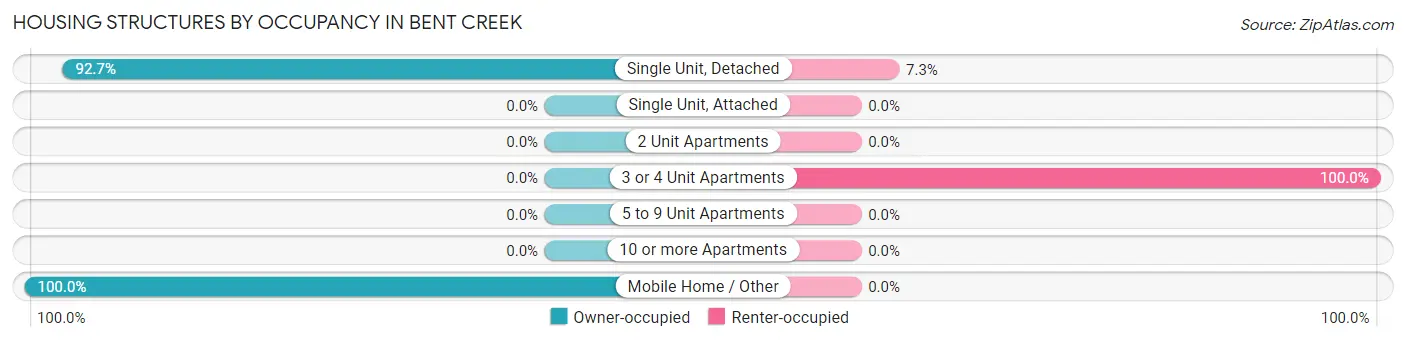
| Structure Type | Owner-occupied | Renter-occupied |
| Single Unit, Detached | 393 (92.7%) | 31 (7.3%) |
| Single Unit, Attached | 0 (0.0%) | 0 (0.0%) |
| 2 Unit Apartments | 0 (0.0%) | 0 (0.0%) |
| 3 or 4 Unit Apartments | 0 (0.0%) | 7 (100.0%) |
| 5 to 9 Unit Apartments | 0 (0.0%) | 0 (0.0%) |
| 10 or more Apartments | 0 (0.0%) | 0 (0.0%) |
| Mobile Home / Other | 68 (100.0%) | 0 (0.0%) |
| Total | 461 (92.4%) | 38 (7.6%) |
Housing Structures by Number of Rooms in Bent Creek
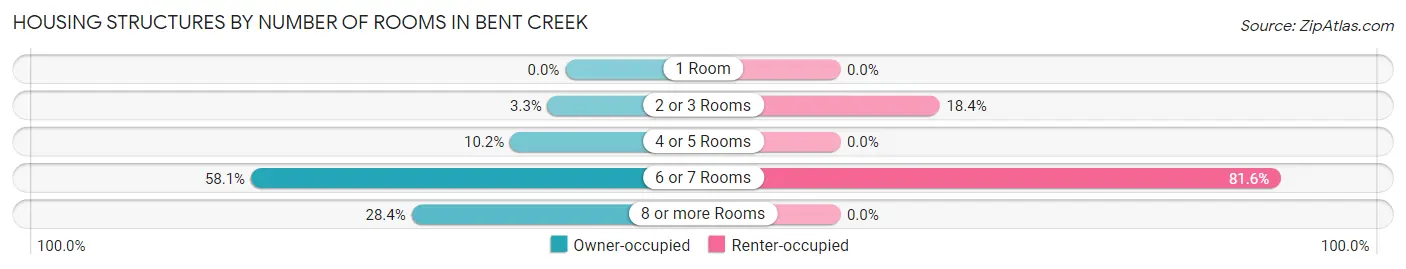
| Number of Rooms | Owner-occupied | Renter-occupied |
| 1 Room | 0 (0.0%) | 0 (0.0%) |
| 2 or 3 Rooms | 15 (3.3%) | 7 (18.4%) |
| 4 or 5 Rooms | 47 (10.2%) | 0 (0.0%) |
| 6 or 7 Rooms | 268 (58.1%) | 31 (81.6%) |
| 8 or more Rooms | 131 (28.4%) | 0 (0.0%) |
| Total | 461 (100.0%) | 38 (100.0%) |
Housing Structure by Heating Type in Bent Creek
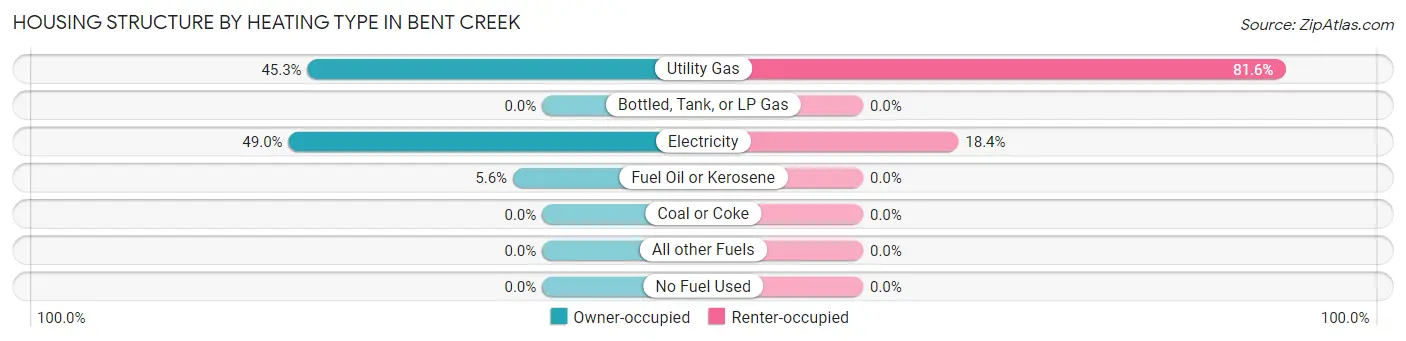
| Heating Type | Owner-occupied | Renter-occupied |
| Utility Gas | 209 (45.3%) | 31 (81.6%) |
| Bottled, Tank, or LP Gas | 0 (0.0%) | 0 (0.0%) |
| Electricity | 226 (49.0%) | 7 (18.4%) |
| Fuel Oil or Kerosene | 26 (5.6%) | 0 (0.0%) |
| Coal or Coke | 0 (0.0%) | 0 (0.0%) |
| All other Fuels | 0 (0.0%) | 0 (0.0%) |
| No Fuel Used | 0 (0.0%) | 0 (0.0%) |
| Total | 461 (100.0%) | 38 (100.0%) |
Household Vehicle Usage in Bent Creek
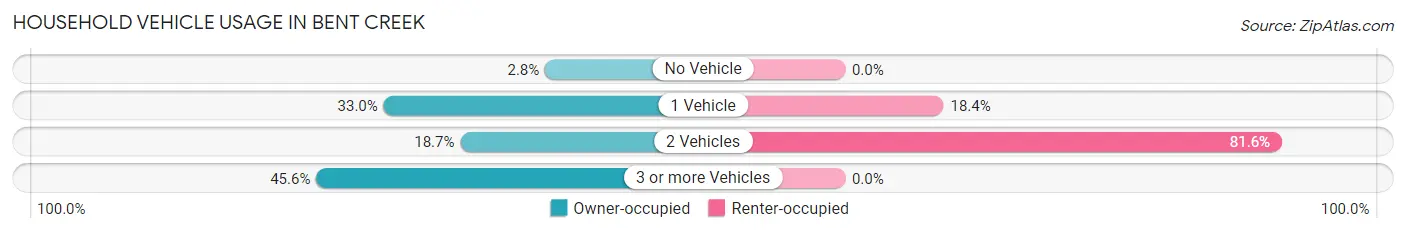
| Vehicles per Household | Owner-occupied | Renter-occupied |
| No Vehicle | 13 (2.8%) | 0 (0.0%) |
| 1 Vehicle | 152 (33.0%) | 7 (18.4%) |
| 2 Vehicles | 86 (18.7%) | 31 (81.6%) |
| 3 or more Vehicles | 210 (45.6%) | 0 (0.0%) |
| Total | 461 (100.0%) | 38 (100.0%) |
Real Estate & Mortgages in Bent Creek
Real Estate and Mortgage Overview in Bent Creek
| Characteristic | Without Mortgage | With Mortgage |
| Housing Units | 171 | 290 |
| Median Property Value | $386,900 | $312,100 |
| Median Household Income | - | - |
| Monthly Housing Costs | $496 | $0 |
| Real Estate Taxes | $1,468 | $0 |
Property Value by Mortgage Status in Bent Creek
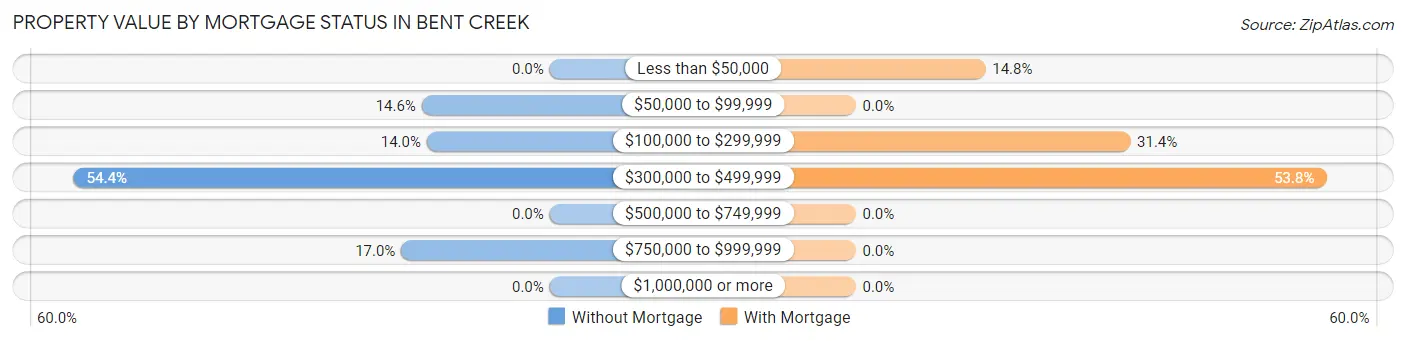
| Property Value | Without Mortgage | With Mortgage |
| Less than $50,000 | 0 (0.0%) | 43 (14.8%) |
| $50,000 to $99,999 | 25 (14.6%) | 0 (0.0%) |
| $100,000 to $299,999 | 24 (14.0%) | 91 (31.4%) |
| $300,000 to $499,999 | 93 (54.4%) | 156 (53.8%) |
| $500,000 to $749,999 | 0 (0.0%) | 0 (0.0%) |
| $750,000 to $999,999 | 29 (17.0%) | 0 (0.0%) |
| $1,000,000 or more | 0 (0.0%) | 0 (0.0%) |
| Total | 171 (100.0%) | 290 (100.0%) |
Household Income by Mortgage Status in Bent Creek
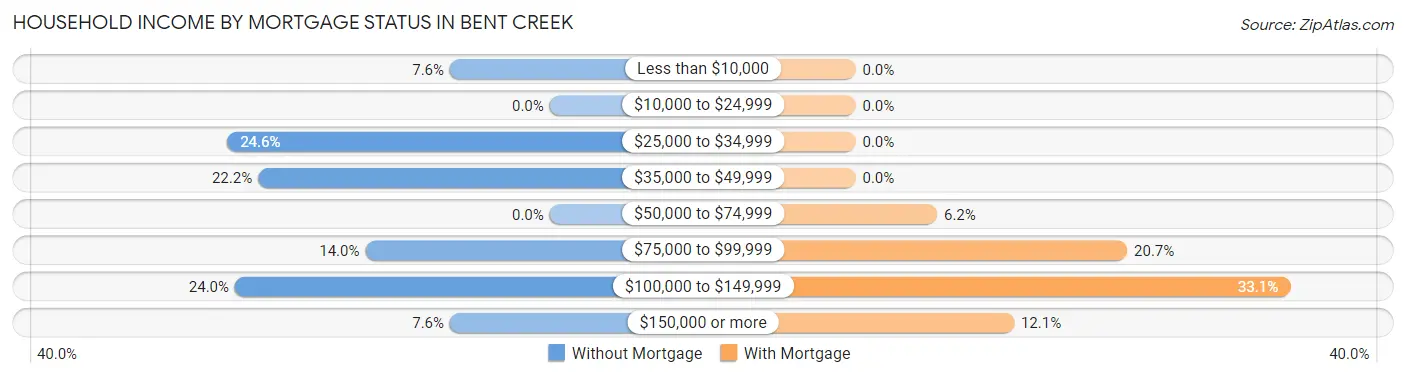
| Household Income | Without Mortgage | With Mortgage |
| Less than $10,000 | 13 (7.6%) | 0 (0.0%) |
| $10,000 to $24,999 | 0 (0.0%) | 0 (0.0%) |
| $25,000 to $34,999 | 42 (24.6%) | 0 (0.0%) |
| $35,000 to $49,999 | 38 (22.2%) | 0 (0.0%) |
| $50,000 to $74,999 | 0 (0.0%) | 18 (6.2%) |
| $75,000 to $99,999 | 24 (14.0%) | 60 (20.7%) |
| $100,000 to $149,999 | 41 (24.0%) | 96 (33.1%) |
| $150,000 or more | 13 (7.6%) | 35 (12.1%) |
| Total | 171 (100.0%) | 290 (100.0%) |
Property Value to Household Income Ratio in Bent Creek
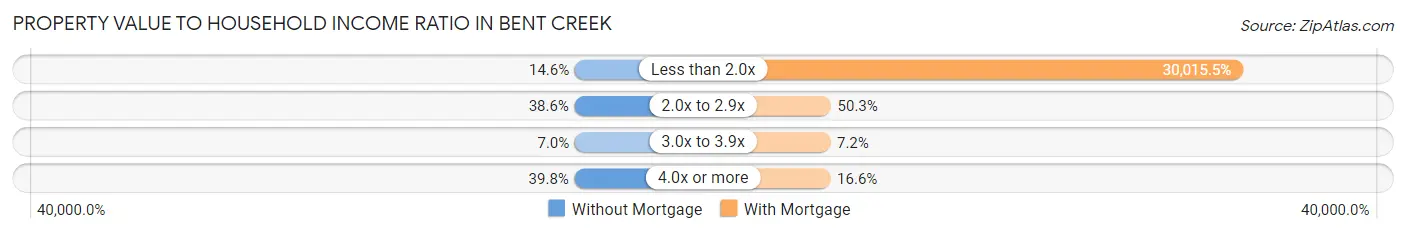
| Value-to-Income Ratio | Without Mortgage | With Mortgage |
| Less than 2.0x | 25 (14.6%) | 87,045 (30,015.5%) |
| 2.0x to 2.9x | 66 (38.6%) | 146 (50.3%) |
| 3.0x to 3.9x | 12 (7.0%) | 21 (7.2%) |
| 4.0x or more | 68 (39.8%) | 48 (16.6%) |
| Total | 171 (100.0%) | 290 (100.0%) |
Real Estate Taxes by Mortgage Status in Bent Creek
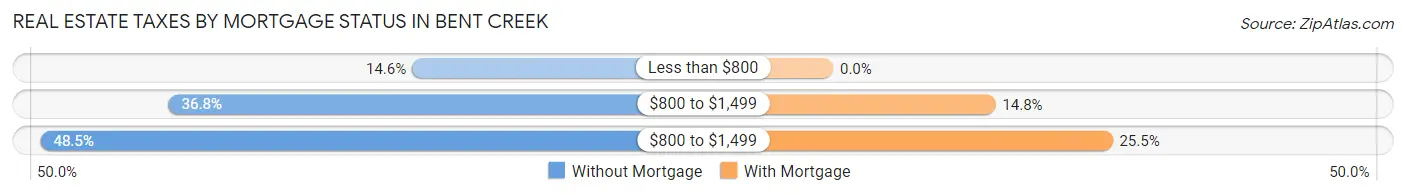
| Property Taxes | Without Mortgage | With Mortgage |
| Less than $800 | 25 (14.6%) | 0 (0.0%) |
| $800 to $1,499 | 63 (36.8%) | 43 (14.8%) |
| $800 to $1,499 | 83 (48.5%) | 74 (25.5%) |
| Total | 171 (100.0%) | 290 (100.0%) |
Health & Disability in Bent Creek
Health Insurance Coverage by Age in Bent Creek
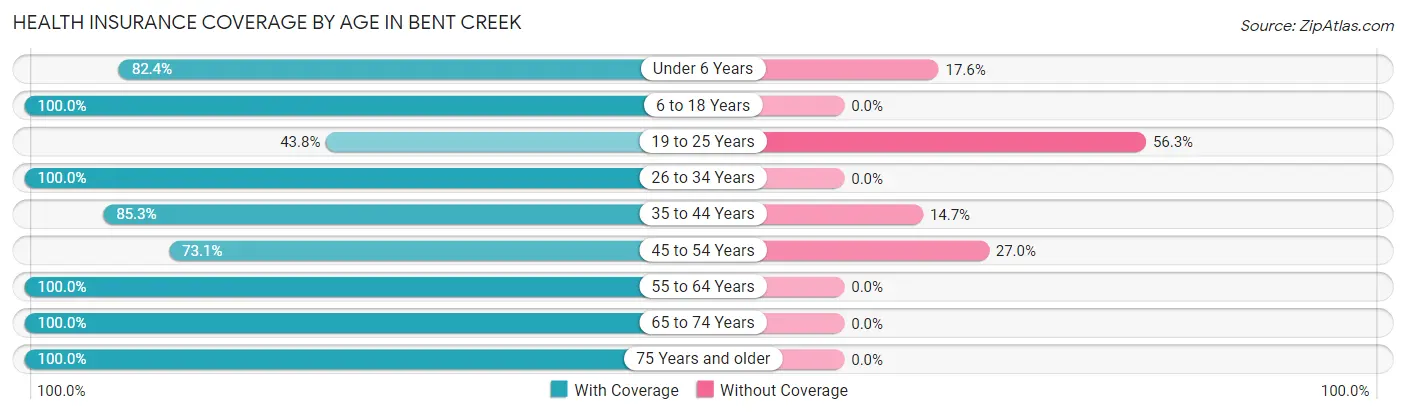
| Age Bracket | With Coverage | Without Coverage |
| Under 6 Years | 150 (82.4%) | 32 (17.6%) |
| 6 to 18 Years | 265 (100.0%) | 0 (0.0%) |
| 19 to 25 Years | 42 (43.8%) | 54 (56.2%) |
| 26 to 34 Years | 13 (100.0%) | 0 (0.0%) |
| 35 to 44 Years | 349 (85.3%) | 60 (14.7%) |
| 45 to 54 Years | 206 (73.1%) | 76 (27.0%) |
| 55 to 64 Years | 76 (100.0%) | 0 (0.0%) |
| 65 to 74 Years | 86 (100.0%) | 0 (0.0%) |
| 75 Years and older | 123 (100.0%) | 0 (0.0%) |
| Total | 1,310 (85.5%) | 222 (14.5%) |
Health Insurance Coverage by Citizenship Status in Bent Creek
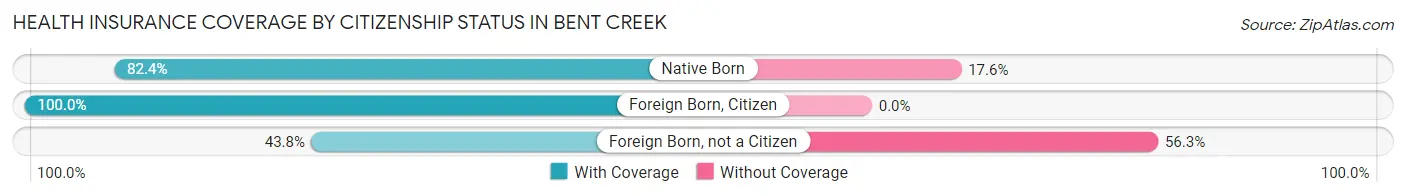
| Citizenship Status | With Coverage | Without Coverage |
| Native Born | 150 (82.4%) | 32 (17.6%) |
| Foreign Born, Citizen | 265 (100.0%) | 0 (0.0%) |
| Foreign Born, not a Citizen | 42 (43.8%) | 54 (56.2%) |
Health Insurance Coverage by Household Income in Bent Creek
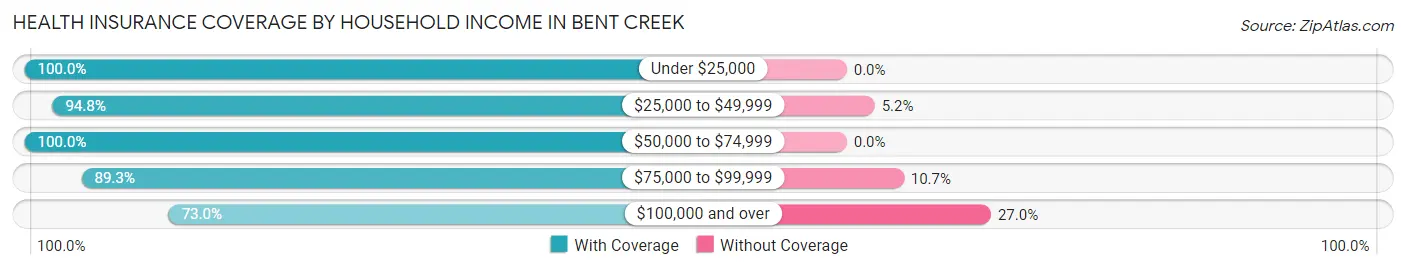
| Household Income | With Coverage | Without Coverage |
| Under $25,000 | 13 (100.0%) | 0 (0.0%) |
| $25,000 to $49,999 | 272 (94.8%) | 15 (5.2%) |
| $50,000 to $74,999 | 245 (100.0%) | 0 (0.0%) |
| $75,000 to $99,999 | 326 (89.3%) | 39 (10.7%) |
| $100,000 and over | 454 (73.0%) | 168 (27.0%) |
Public vs Private Health Insurance Coverage by Age in Bent Creek
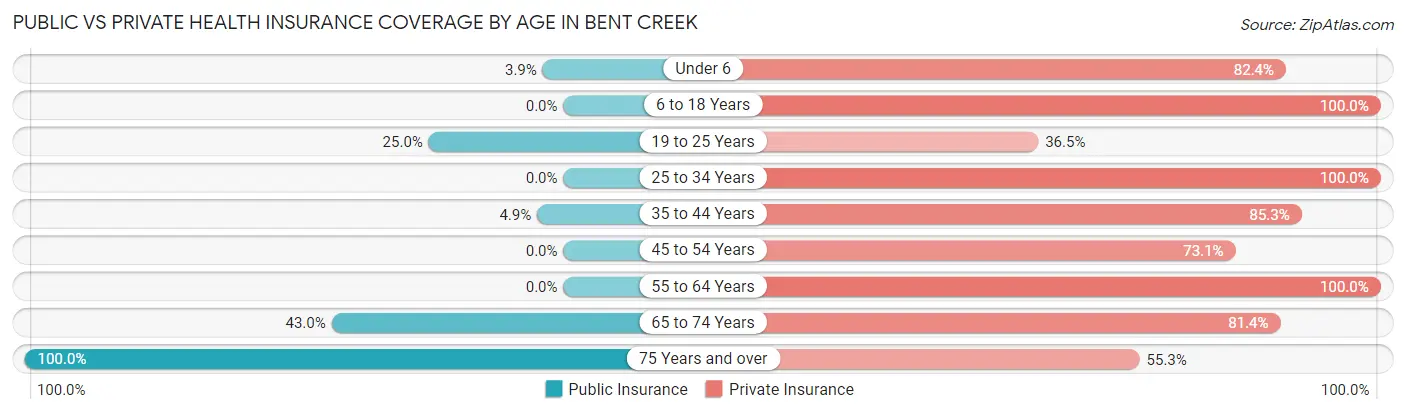
| Age Bracket | Public Insurance | Private Insurance |
| Under 6 | 7 (3.8%) | 150 (82.4%) |
| 6 to 18 Years | 0 (0.0%) | 265 (100.0%) |
| 19 to 25 Years | 24 (25.0%) | 35 (36.5%) |
| 25 to 34 Years | 0 (0.0%) | 13 (100.0%) |
| 35 to 44 Years | 20 (4.9%) | 349 (85.3%) |
| 45 to 54 Years | 0 (0.0%) | 206 (73.1%) |
| 55 to 64 Years | 0 (0.0%) | 76 (100.0%) |
| 65 to 74 Years | 37 (43.0%) | 70 (81.4%) |
| 75 Years and over | 123 (100.0%) | 68 (55.3%) |
| Total | 211 (13.8%) | 1,232 (80.4%) |
Disability Status by Sex by Age in Bent Creek
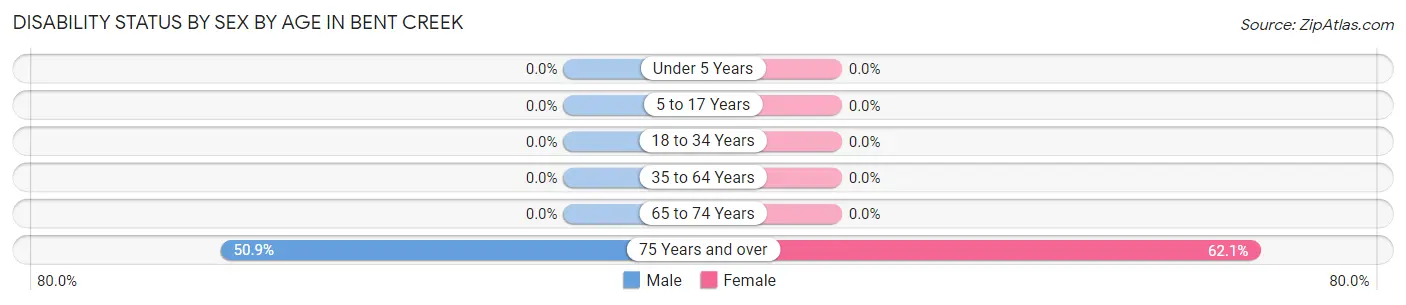
| Age Bracket | Male | Female |
| Under 5 Years | 0 (0.0%) | 0 (0.0%) |
| 5 to 17 Years | 0 (0.0%) | 0 (0.0%) |
| 18 to 34 Years | 0 (0.0%) | 0 (0.0%) |
| 35 to 64 Years | 0 (0.0%) | 0 (0.0%) |
| 65 to 74 Years | 0 (0.0%) | 0 (0.0%) |
| 75 Years and over | 29 (50.9%) | 41 (62.1%) |
Disability Class by Sex by Age in Bent Creek
Disability Class: Hearing Difficulty
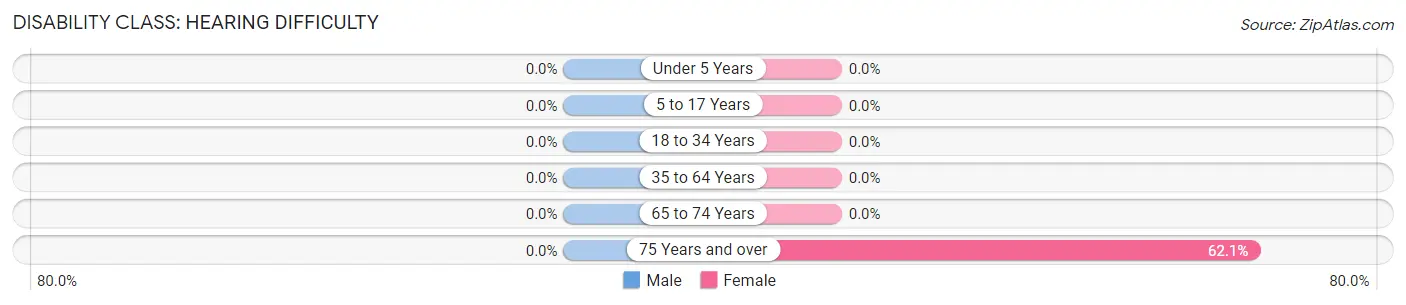
| Age Bracket | Male | Female |
| Under 5 Years | 0 (0.0%) | 0 (0.0%) |
| 5 to 17 Years | 0 (0.0%) | 0 (0.0%) |
| 18 to 34 Years | 0 (0.0%) | 0 (0.0%) |
| 35 to 64 Years | 0 (0.0%) | 0 (0.0%) |
| 65 to 74 Years | 0 (0.0%) | 0 (0.0%) |
| 75 Years and over | 0 (0.0%) | 41 (62.1%) |
Disability Class: Vision Difficulty
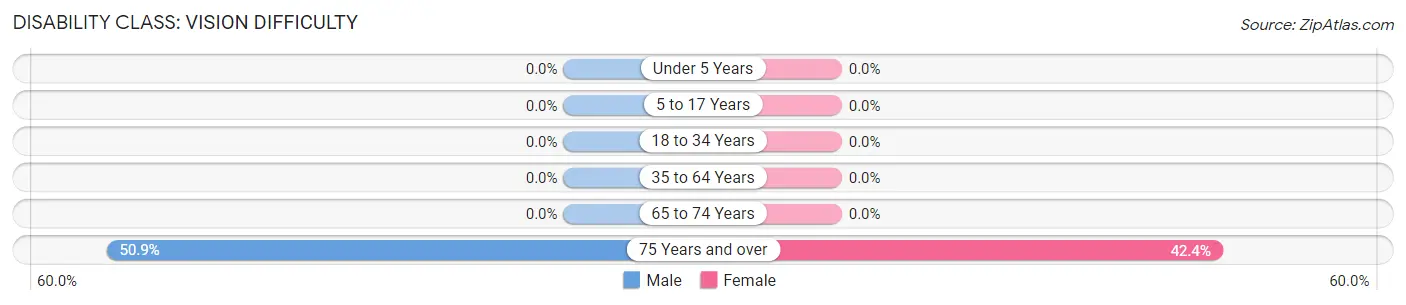
| Age Bracket | Male | Female |
| Under 5 Years | 0 (0.0%) | 0 (0.0%) |
| 5 to 17 Years | 0 (0.0%) | 0 (0.0%) |
| 18 to 34 Years | 0 (0.0%) | 0 (0.0%) |
| 35 to 64 Years | 0 (0.0%) | 0 (0.0%) |
| 65 to 74 Years | 0 (0.0%) | 0 (0.0%) |
| 75 Years and over | 29 (50.9%) | 28 (42.4%) |
Disability Class: Cognitive Difficulty

| Age Bracket | Male | Female |
| 5 to 17 Years | 0 (0.0%) | 0 (0.0%) |
| 18 to 34 Years | 0 (0.0%) | 0 (0.0%) |
| 35 to 64 Years | 0 (0.0%) | 0 (0.0%) |
| 65 to 74 Years | 0 (0.0%) | 0 (0.0%) |
| 75 Years and over | 29 (50.9%) | 0 (0.0%) |
Disability Class: Ambulatory Difficulty
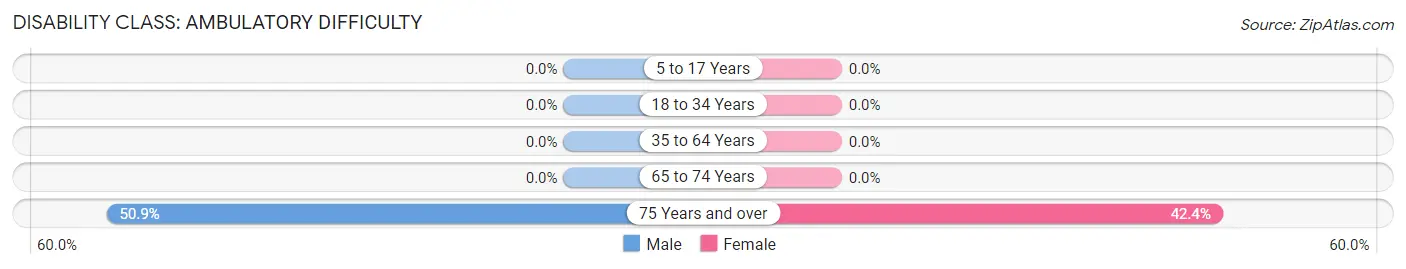
| Age Bracket | Male | Female |
| 5 to 17 Years | 0 (0.0%) | 0 (0.0%) |
| 18 to 34 Years | 0 (0.0%) | 0 (0.0%) |
| 35 to 64 Years | 0 (0.0%) | 0 (0.0%) |
| 65 to 74 Years | 0 (0.0%) | 0 (0.0%) |
| 75 Years and over | 29 (50.9%) | 28 (42.4%) |
Disability Class: Self-Care Difficulty
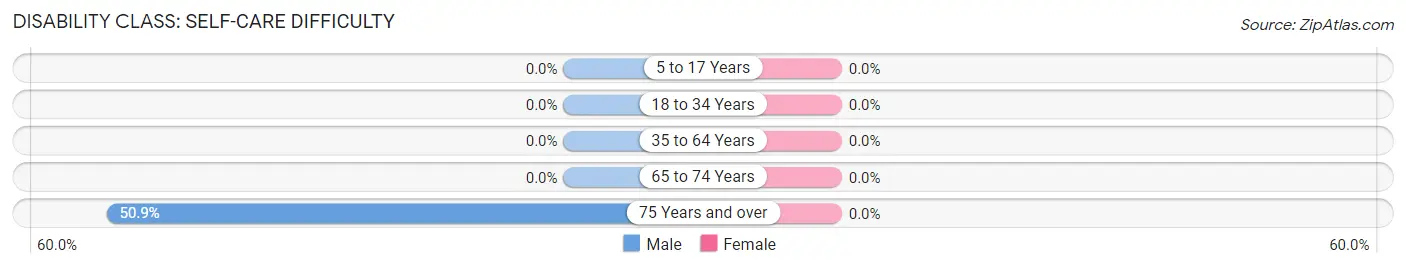
| Age Bracket | Male | Female |
| 5 to 17 Years | 0 (0.0%) | 0 (0.0%) |
| 18 to 34 Years | 0 (0.0%) | 0 (0.0%) |
| 35 to 64 Years | 0 (0.0%) | 0 (0.0%) |
| 65 to 74 Years | 0 (0.0%) | 0 (0.0%) |
| 75 Years and over | 29 (50.9%) | 0 (0.0%) |
Technology Access in Bent Creek
Computing Device Access in Bent Creek
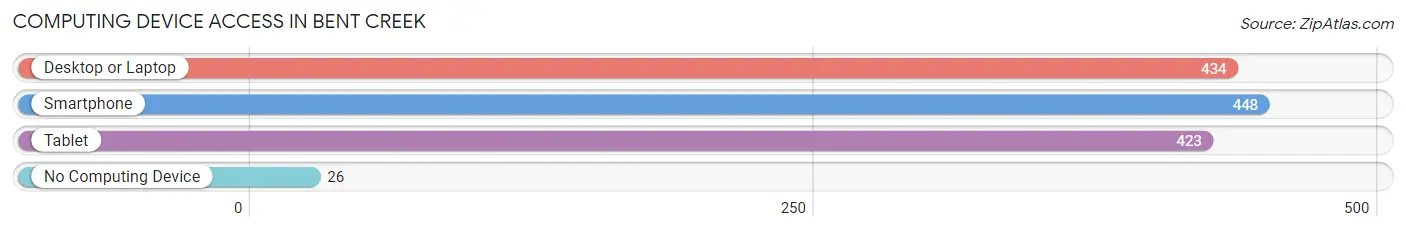
| Device Type | # Households | % Households |
| Desktop or Laptop | 434 | 87.0% |
| Smartphone | 448 | 89.8% |
| Tablet | 423 | 84.8% |
| No Computing Device | 26 | 5.2% |
| Total | 499 | 100.0% |
Internet Access in Bent Creek
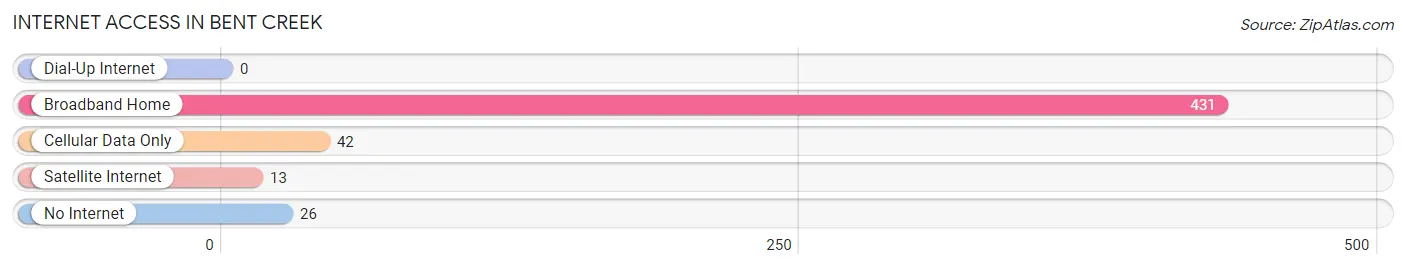
| Internet Type | # Households | % Households |
| Dial-Up Internet | 0 | 0.0% |
| Broadband Home | 431 | 86.4% |
| Cellular Data Only | 42 | 8.4% |
| Satellite Internet | 13 | 2.6% |
| No Internet | 26 | 5.2% |
| Total | 499 | 100.0% |
Bent Creek Summary
Bent Creek is a small unincorporated community located in Buncombe County, North Carolina. It is situated in the Blue Ridge Mountains, approximately 10 miles south of Asheville. The community is named after the nearby Bent Creek, a tributary of the French Broad River.
History
The area that is now Bent Creek was first settled in the late 1700s by European settlers. The first settlers were primarily of English and Scottish descent. The area was originally known as “Bent Creek Settlement” and was part of the Buncombe County. In 1808, the settlement was officially incorporated as the Town of Bent Creek.
The town was a small agricultural community, with the main crops being corn, wheat, and tobacco. The town also had a few small businesses, such as a general store, a blacksmith, and a gristmill. In the late 1800s, the town began to grow as a tourist destination, with the opening of several hotels and resorts.
In the early 1900s, the town began to decline as the railroad bypassed it and the tourist industry shifted to other areas. The town was eventually abandoned in the 1950s. In the 1970s, the area was rediscovered by hikers and outdoor enthusiasts, and the town began to experience a resurgence.
Geography
Bent Creek is located in the Blue Ridge Mountains of western North Carolina. The town is situated at an elevation of 2,400 feet, and is surrounded by the Pisgah National Forest. The town is located approximately 10 miles south of Asheville, and is accessible via US Highway 25.
The town is situated along the banks of Bent Creek, a tributary of the French Broad River. The creek is a popular destination for fishing, canoeing, and kayaking. The area is also home to a variety of wildlife, including black bears, deer, and wild turkeys.
Economy
The economy of Bent Creek is primarily based on tourism. The town is a popular destination for outdoor enthusiasts, with a variety of activities such as hiking, camping, fishing, and canoeing. The town is also home to several small businesses, such as restaurants, gift shops, and art galleries.
Demographics
As of the 2010 census, the population of Bent Creek was 1,092. The racial makeup of the town was 94.3% White, 2.2% African American, 0.7% Native American, 0.7% Asian, and 1.9% from other races. The median household income was $37,500, and the median age was 44.
Conclusion
Bent Creek is a small unincorporated community located in Buncombe County, North Carolina. It is situated in the Blue Ridge Mountains, approximately 10 miles south of Asheville. The town was originally settled in the late 1700s, and was a small agricultural community until the early 1900s. Today, the economy of Bent Creek is primarily based on tourism, and the town is a popular destination for outdoor enthusiasts. The population of Bent Creek was 1,092 as of the 2010 census.
Common Questions
What is Per Capita Income in Bent Creek?
Per Capita income in Bent Creek is $47,322.
What is the Median Family Income in Bent Creek?
Median Family Income in Bent Creek is $106,833.
What is the Median Household income in Bent Creek?
Median Household Income in Bent Creek is $77,355.
What is Income or Wage Gap in Bent Creek?
Income or Wage Gap in Bent Creek is 38.6%.
Women in Bent Creek earn 61.4 cents for every dollar earned by a man.
What is Inequality or Gini Index in Bent Creek?
Inequality or Gini Index in Bent Creek is 0.51.
What is the Total Population of Bent Creek?
Total Population of Bent Creek is 1,536.
What is the Total Male Population of Bent Creek?
Total Male Population of Bent Creek is 722.
What is the Total Female Population of Bent Creek?
Total Female Population of Bent Creek is 814.
What is the Ratio of Males per 100 Females in Bent Creek?
There are 88.70 Males per 100 Females in Bent Creek.
What is the Ratio of Females per 100 Males in Bent Creek?
There are 112.74 Females per 100 Males in Bent Creek.
What is the Median Population Age in Bent Creek?
Median Population Age in Bent Creek is 41.6 Years.
What is the Average Family Size in Bent Creek
Average Family Size in Bent Creek is 3.7 People.
What is the Average Household Size in Bent Creek
Average Household Size in Bent Creek is 3.1 People.
How Large is the Labor Force in Bent Creek?
There are 902 People in the Labor Forcein in Bent Creek.
What is the Percentage of People in the Labor Force in Bent Creek?
77.2% of People are in the Labor Force in Bent Creek.
What is the Unemployment Rate in Bent Creek?
Unemployment Rate in Bent Creek is 13.7%.