Erda, UT Map & Demographics
Erda Map
Erda Overview
$35,372
PER CAPITA INCOME
$147,541
AVG FAMILY INCOME
$143,125
AVG HOUSEHOLD INCOME
47.4%
WAGE / INCOME GAP [ % ]
52.6¢/ $1
WAGE / INCOME GAP [ $ ]
0.27
INEQUALITY / GINI INDEX
3,124
TOTAL POPULATION
1,589
MALE POPULATION
1,535
FEMALE POPULATION
103.52
MALES / 100 FEMALES
96.60
FEMALES / 100 MALES
29.0
MEDIAN AGE
4.0
AVG FAMILY SIZE
3.9
AVG HOUSEHOLD SIZE
1,882
LABOR FORCE [ PEOPLE ]
77.4%
PERCENT IN LABOR FORCE
14.0%
UNEMPLOYMENT RATE
Erda Area Codes
Income in Erda
Income Overview in Erda
Per Capita Income in Erda is $35,372, while median incomes of families and households are $147,541 and $143,125 respectively.
| Characteristic | Number | Measure |
| Per Capita Income | 3,124 | $35,372 |
| Median Family Income | 742 | $147,541 |
| Mean Family Income | 742 | $147,511 |
| Median Household Income | 789 | $143,125 |
| Mean Household Income | 789 | $140,197 |
| Income Deficit | 742 | $0 |
| Wage / Income Gap (%) | 3,124 | 47.36% |
| Wage / Income Gap ($) | 3,124 | 52.64¢ per $1 |
| Gini / Inequality Index | 3,124 | 0.27 |
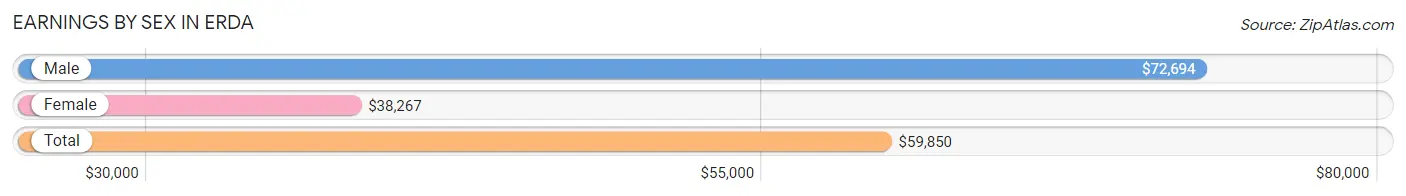
Earnings by Sex in Erda
Average Earnings in Erda are $59,850, $72,694 for men and $38,267 for women, a difference of 47.4%.
| Sex | Number | Average Earnings |
| Male | 899 (52.4%) | $72,694 |
| Female | 818 (47.6%) | $38,267 |
| Total | 1,717 (100.0%) | $59,850 |
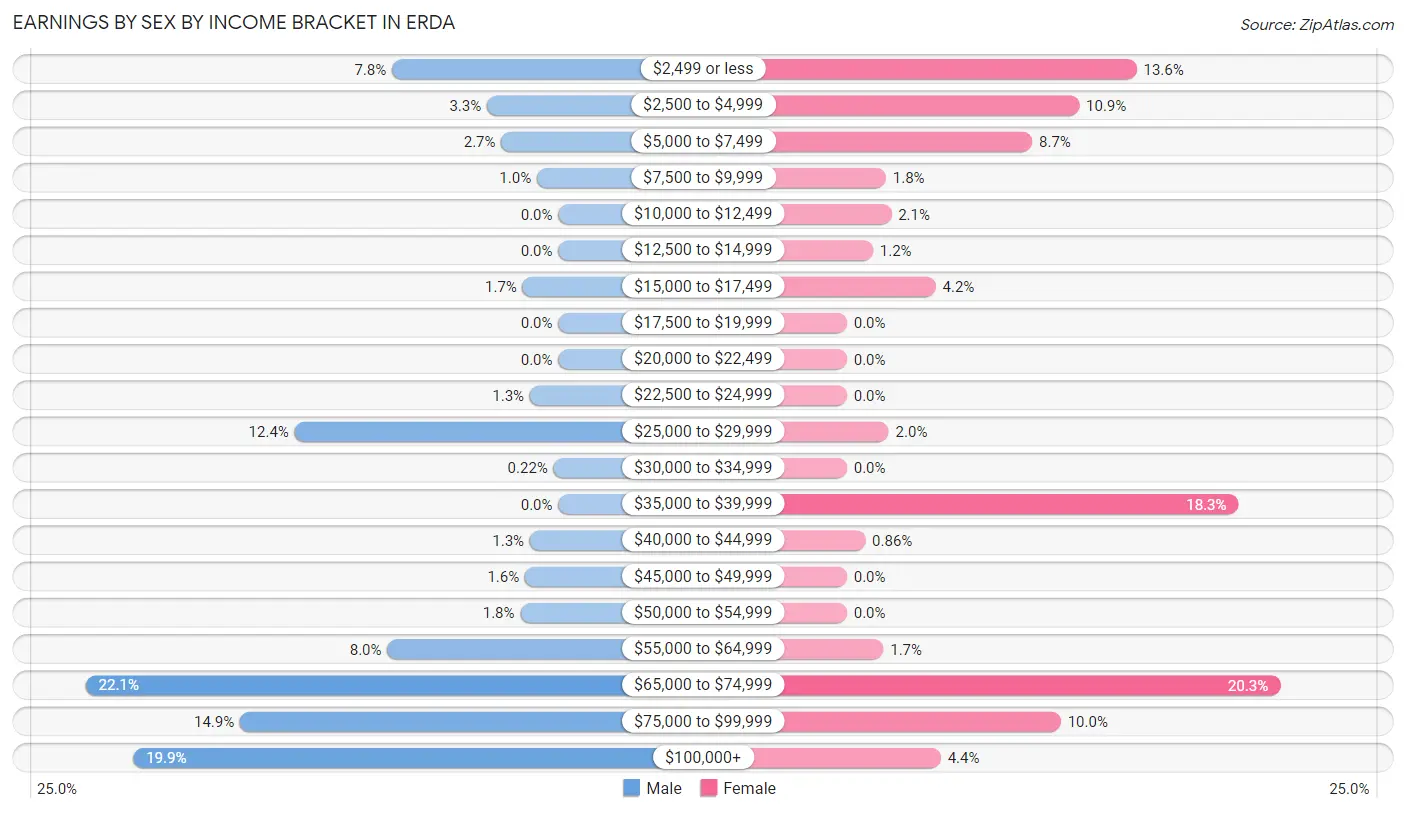
Earnings by Sex by Income Bracket in Erda
The most common earnings brackets in Erda are $65,000 to $74,999 for men (199 | 22.1%) and $65,000 to $74,999 for women (166 | 20.3%).
| Income | Male | Female |
| $2,499 or less | 70 (7.8%) | 111 (13.6%) |
| $2,500 to $4,999 | 30 (3.3%) | 89 (10.9%) |
| $5,000 to $7,499 | 24 (2.7%) | 71 (8.7%) |
| $7,500 to $9,999 | 9 (1.0%) | 15 (1.8%) |
| $10,000 to $12,499 | 0 (0.0%) | 17 (2.1%) |
| $12,500 to $14,999 | 0 (0.0%) | 10 (1.2%) |
| $15,000 to $17,499 | 15 (1.7%) | 34 (4.2%) |
| $17,500 to $19,999 | 0 (0.0%) | 0 (0.0%) |
| $20,000 to $22,499 | 0 (0.0%) | 0 (0.0%) |
| $22,500 to $24,999 | 12 (1.3%) | 0 (0.0%) |
| $25,000 to $29,999 | 111 (12.3%) | 16 (2.0%) |
| $30,000 to $34,999 | 2 (0.2%) | 0 (0.0%) |
| $35,000 to $39,999 | 0 (0.0%) | 150 (18.3%) |
| $40,000 to $44,999 | 12 (1.3%) | 7 (0.9%) |
| $45,000 to $49,999 | 14 (1.6%) | 0 (0.0%) |
| $50,000 to $54,999 | 16 (1.8%) | 0 (0.0%) |
| $55,000 to $64,999 | 72 (8.0%) | 14 (1.7%) |
| $65,000 to $74,999 | 199 (22.1%) | 166 (20.3%) |
| $75,000 to $99,999 | 134 (14.9%) | 82 (10.0%) |
| $100,000+ | 179 (19.9%) | 36 (4.4%) |
| Total | 899 (100.0%) | 818 (100.0%) |
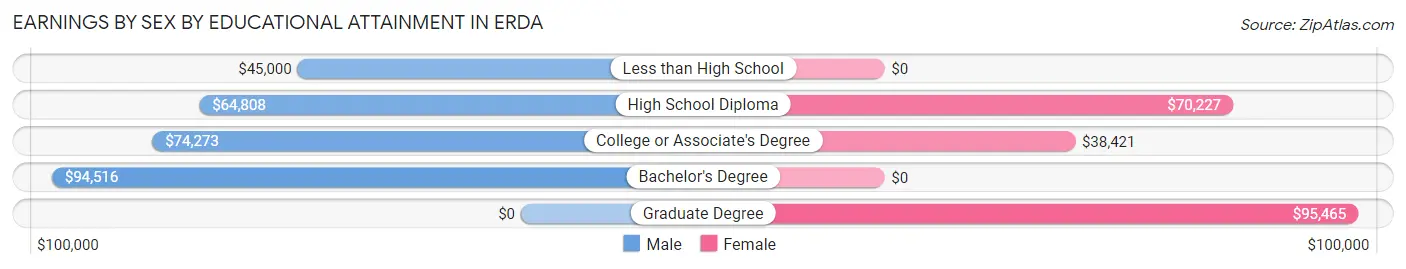
Earnings by Sex by Educational Attainment in Erda
| Educational Attainment | Male Income | Female Income |
| Less than High School | $45,000 | $0 |
| High School Diploma | $64,808 | $70,227 |
| College or Associate's Degree | $74,273 | $38,421 |
| Bachelor's Degree | $94,516 | $0 |
| Graduate Degree | - | - |
| Total | $74,856 | $0 |
Family Income in Erda
Family Income Brackets in Erda
According to the Erda family income data, there are 298 families falling into the $100,000 to $149,999 income range, which is the most common income bracket and makes up 40.2% of all families.
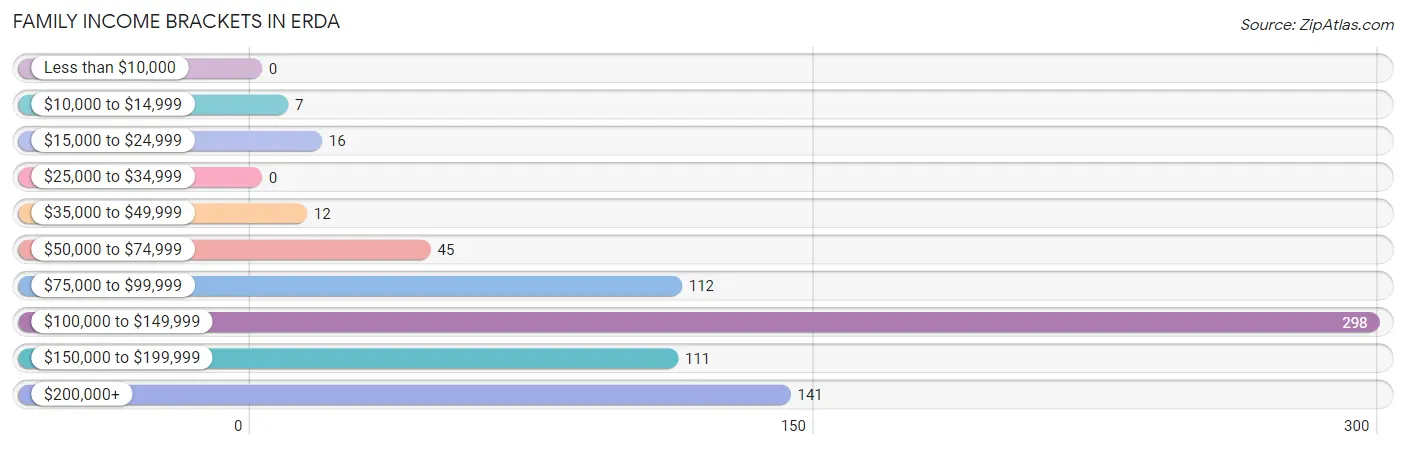
| Income Bracket | # Families | % Families |
| Less than $10,000 | 0 | 0.0% |
| $10,000 to $14,999 | 7 | 0.9% |
| $15,000 to $24,999 | 16 | 2.2% |
| $25,000 to $34,999 | 0 | 0.0% |
| $35,000 to $49,999 | 12 | 1.6% |
| $50,000 to $74,999 | 45 | 6.1% |
| $75,000 to $99,999 | 112 | 15.1% |
| $100,000 to $149,999 | 298 | 40.2% |
| $150,000 to $199,999 | 111 | 15.0% |
| $200,000+ | 141 | 19.0% |
Family Income by Famaliy Size in Erda
6-person families (95 | 12.8%) account for the highest median family income in Erda with $250,001 per family, while 3-person families (221 | 29.8%) have the highest median income of $49,645 per family member.
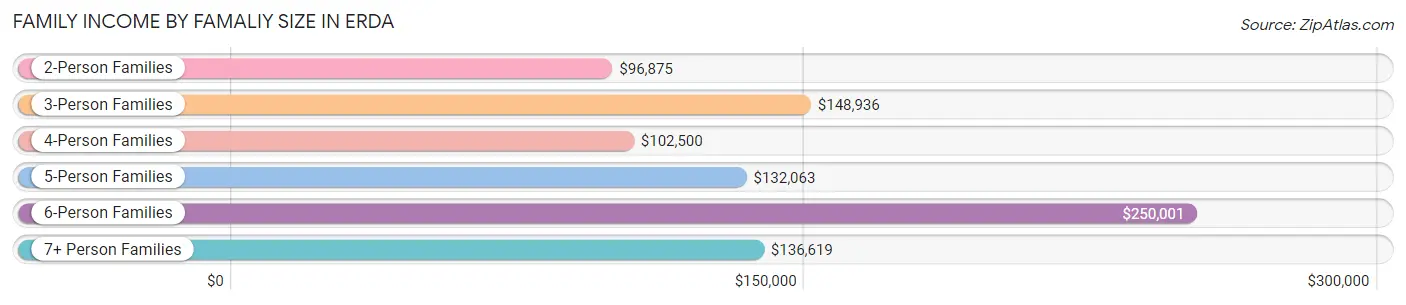
| Income Bracket | # Families | Median Income |
| 2-Person Families | 182 (24.5%) | $96,875 |
| 3-Person Families | 221 (29.8%) | $148,936 |
| 4-Person Families | 62 (8.4%) | $102,500 |
| 5-Person Families | 97 (13.1%) | $132,063 |
| 6-Person Families | 95 (12.8%) | $250,001 |
| 7+ Person Families | 85 (11.5%) | $136,619 |
| Total | 742 (100.0%) | $147,541 |
Family Income by Number of Earners in Erda
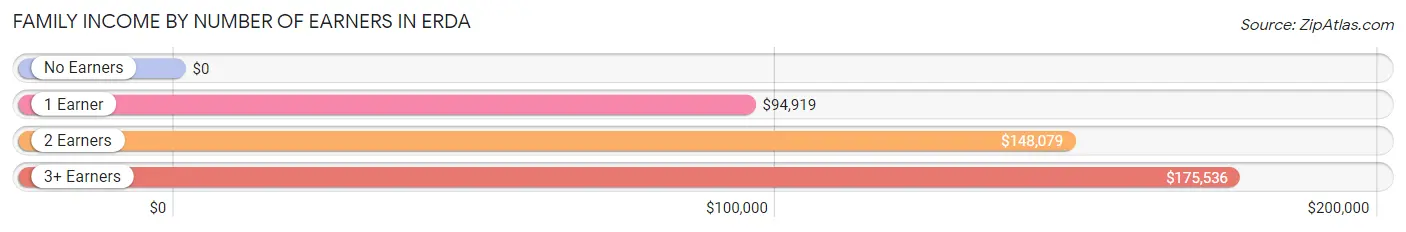
| Number of Earners | # Families | Median Income |
| No Earners | 34 (4.6%) | $0 |
| 1 Earner | 138 (18.6%) | $94,919 |
| 2 Earners | 340 (45.8%) | $148,079 |
| 3+ Earners | 230 (31.0%) | $175,536 |
| Total | 742 (100.0%) | $147,541 |
Household Income in Erda
Household Income Brackets in Erda
With 291 households falling in the category, the $100,000 to $149,999 income range is the most frequent in Erda, accounting for 36.9% of all households.
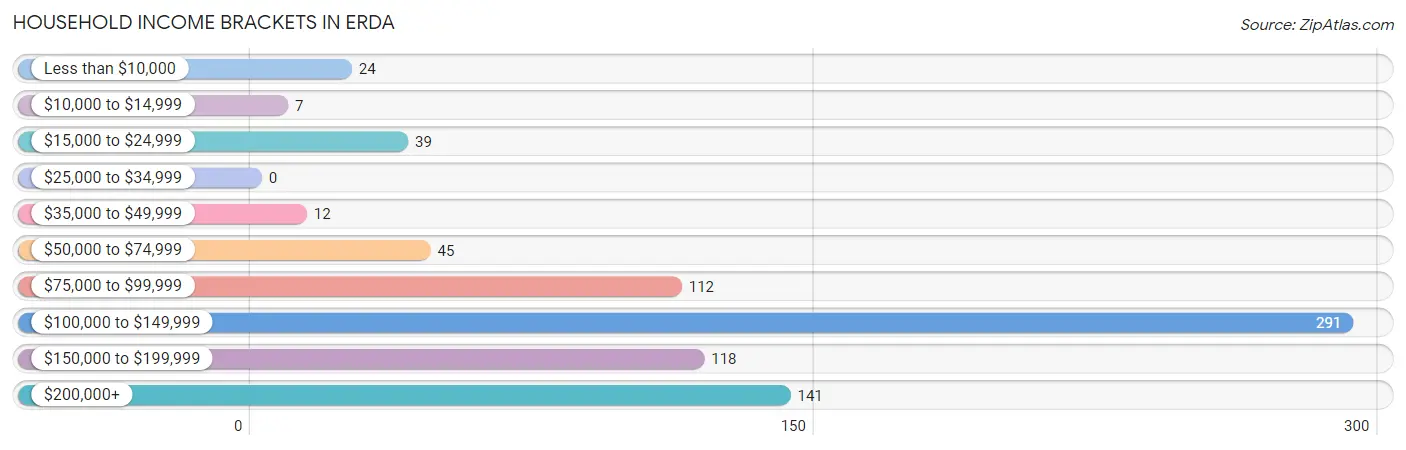
| Income Bracket | # Households | % Households |
| Less than $10,000 | 24 | 3.0% |
| $10,000 to $14,999 | 7 | 0.9% |
| $15,000 to $24,999 | 39 | 4.9% |
| $25,000 to $34,999 | 0 | 0.0% |
| $35,000 to $49,999 | 12 | 1.5% |
| $50,000 to $74,999 | 45 | 5.7% |
| $75,000 to $99,999 | 112 | 14.2% |
| $100,000 to $149,999 | 291 | 36.9% |
| $150,000 to $199,999 | 118 | 15.0% |
| $200,000+ | 141 | 17.9% |
Household Income by Householder Age in Erda
The median household income in Erda is $143,125, with the highest median household income of $149,680 found in the 45 to 64 years age bracket for the primary householder. A total of 413 households (52.3%) fall into this category.
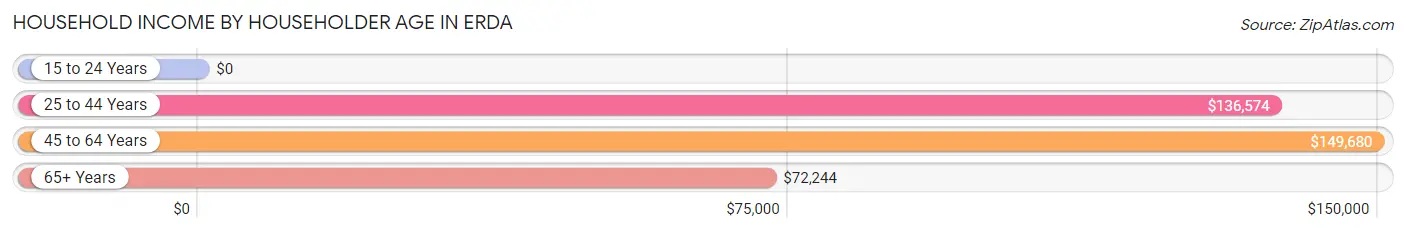
| Income Bracket | # Households | Median Income |
| 15 to 24 Years | 0 (0.0%) | $0 |
| 25 to 44 Years | 198 (25.1%) | $136,574 |
| 45 to 64 Years | 413 (52.3%) | $149,680 |
| 65+ Years | 178 (22.6%) | $72,244 |
| Total | 789 (100.0%) | $143,125 |
Poverty in Erda
Income Below Poverty by Sex and Age in Erda
With 2.3% poverty level for males and 4.4% for females among the residents of Erda, 16 and 17 year old males and 75 year old and over females are the most vulnerable to poverty, with 20 males (20.6%) and 32 females (60.4%) in their respective age groups living below the poverty level.
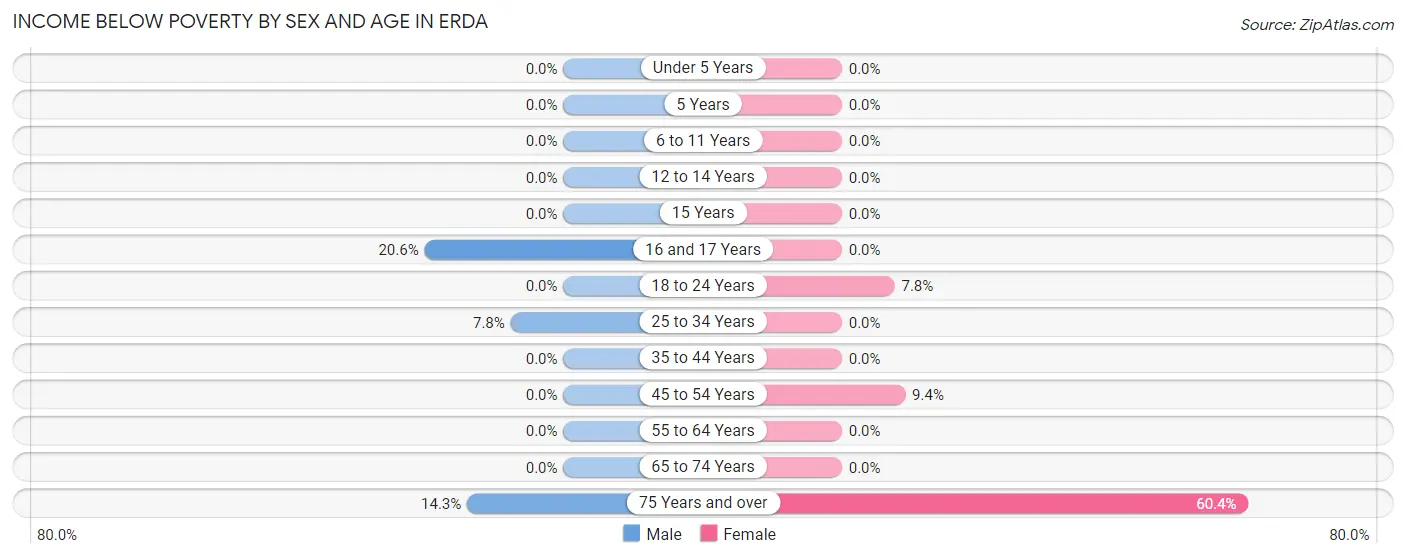
| Age Bracket | Male | Female |
| Under 5 Years | 0 (0.0%) | 0 (0.0%) |
| 5 Years | 0 (0.0%) | 0 (0.0%) |
| 6 to 11 Years | 0 (0.0%) | 0 (0.0%) |
| 12 to 14 Years | 0 (0.0%) | 0 (0.0%) |
| 15 Years | 0 (0.0%) | 0 (0.0%) |
| 16 and 17 Years | 20 (20.6%) | 0 (0.0%) |
| 18 to 24 Years | 0 (0.0%) | 18 (7.8%) |
| 25 to 34 Years | 9 (7.8%) | 0 (0.0%) |
| 35 to 44 Years | 0 (0.0%) | 0 (0.0%) |
| 45 to 54 Years | 0 (0.0%) | 16 (9.4%) |
| 55 to 64 Years | 0 (0.0%) | 0 (0.0%) |
| 65 to 74 Years | 0 (0.0%) | 0 (0.0%) |
| 75 Years and over | 7 (14.3%) | 32 (60.4%) |
| Total | 36 (2.3%) | 66 (4.4%) |
Income Above Poverty by Sex and Age in Erda
According to the poverty statistics in Erda, males aged under 5 years and females aged under 5 years are the age groups that are most secure financially, with 100.0% of males and 100.0% of females in these age groups living above the poverty line.
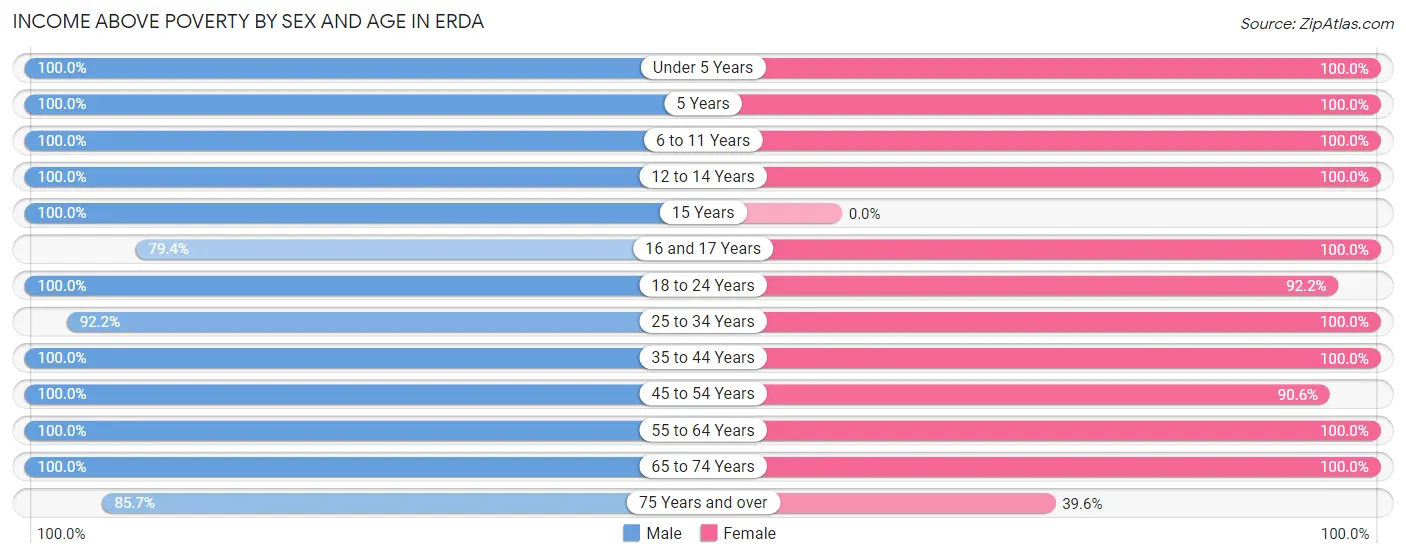
| Age Bracket | Male | Female |
| Under 5 Years | 196 (100.0%) | 42 (100.0%) |
| 5 Years | 25 (100.0%) | 13 (100.0%) |
| 6 to 11 Years | 166 (100.0%) | 82 (100.0%) |
| 12 to 14 Years | 97 (100.0%) | 51 (100.0%) |
| 15 Years | 20 (100.0%) | 0 (0.0%) |
| 16 and 17 Years | 77 (79.4%) | 195 (100.0%) |
| 18 to 24 Years | 199 (100.0%) | 212 (92.2%) |
| 25 to 34 Years | 106 (92.2%) | 107 (100.0%) |
| 35 to 44 Years | 129 (100.0%) | 200 (100.0%) |
| 45 to 54 Years | 153 (100.0%) | 154 (90.6%) |
| 55 to 64 Years | 238 (100.0%) | 231 (100.0%) |
| 65 to 74 Years | 97 (100.0%) | 115 (100.0%) |
| 75 Years and over | 42 (85.7%) | 21 (39.6%) |
| Total | 1,545 (97.7%) | 1,423 (95.6%) |
Income Below Poverty Among Married-Couple Families in Erda
The poverty statistics for married-couple families in Erda show that 1.0% or 7 of the total 707 families live below the poverty line. Families with no children have the highest poverty rate of 2.4%, comprising of 7 families. On the other hand, families with 1 or 2 children have the lowest poverty rate of 0.0%, which includes 0 families.
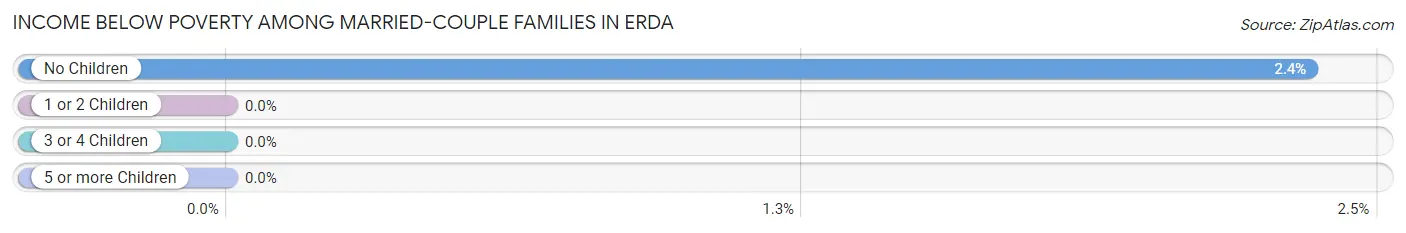
| Children | Above Poverty | Below Poverty |
| No Children | 291 (97.7%) | 7 (2.4%) |
| 1 or 2 Children | 268 (100.0%) | 0 (0.0%) |
| 3 or 4 Children | 88 (100.0%) | 0 (0.0%) |
| 5 or more Children | 53 (100.0%) | 0 (0.0%) |
| Total | 700 (99.0%) | 7 (1.0%) |
Income Below Poverty Among Single-Parent Households in Erda
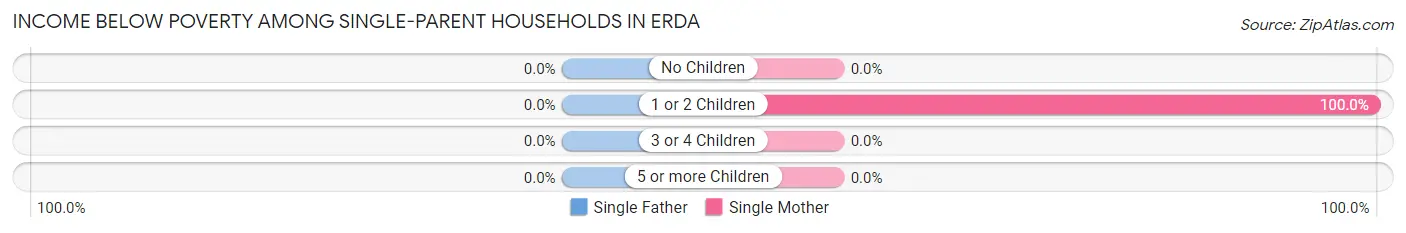
| Children | Single Father | Single Mother |
| No Children | 0 (0.0%) | 0 (0.0%) |
| 1 or 2 Children | 0 (0.0%) | 16 (100.0%) |
| 3 or 4 Children | 0 (0.0%) | 0 (0.0%) |
| 5 or more Children | 0 (0.0%) | 0 (0.0%) |
| Total | 0 (0.0%) | 16 (100.0%) |
Income Below Poverty Among Married-Couple vs Single-Parent Households in Erda
The poverty data for Erda shows that 7 of the married-couple family households (1.0%) and 16 of the single-parent households (45.7%) are living below the poverty level. Within the married-couple family households, those with no children have the highest poverty rate, with 7 households (2.4%) falling below the poverty line. Among the single-parent households, those with 1 or 2 children have the highest poverty rate, with 16 household (45.7%) living below poverty.
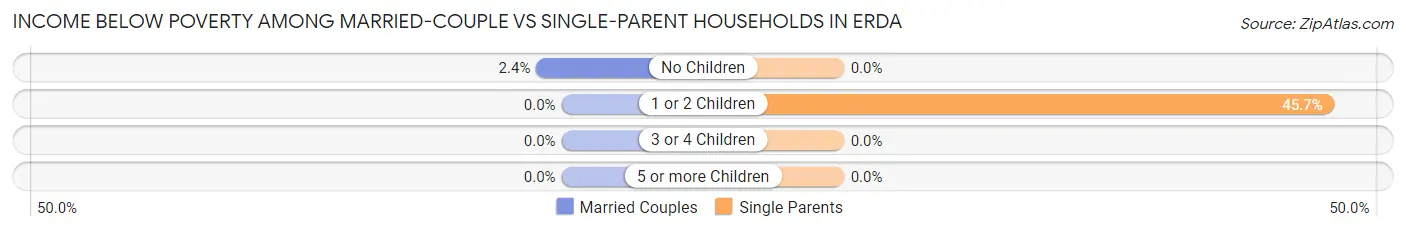
| Children | Married-Couple Families | Single-Parent Households |
| No Children | 7 (2.4%) | 0 (0.0%) |
| 1 or 2 Children | 0 (0.0%) | 16 (45.7%) |
| 3 or 4 Children | 0 (0.0%) | 0 (0.0%) |
| 5 or more Children | 0 (0.0%) | 0 (0.0%) |
| Total | 7 (1.0%) | 16 (45.7%) |
Race in Erda
The most populous races in Erda are White / Caucasian (2,582 | 82.7%), Two or more Races (331 | 10.6%), and Black / African American (175 | 5.6%).
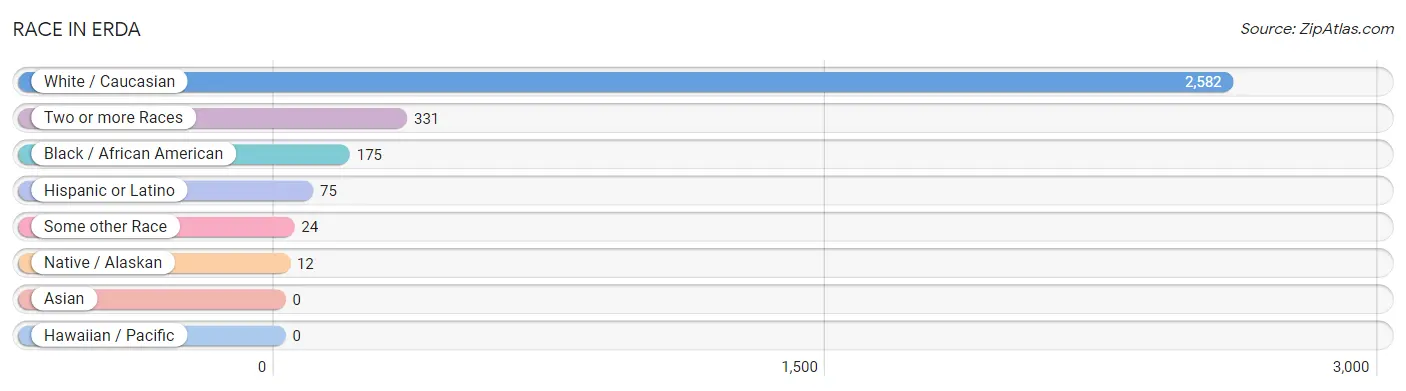
| Race | # Population | % Population |
| Asian | 0 | 0.0% |
| Black / African American | 175 | 5.6% |
| Hawaiian / Pacific | 0 | 0.0% |
| Hispanic or Latino | 75 | 2.4% |
| Native / Alaskan | 12 | 0.4% |
| White / Caucasian | 2,582 | 82.7% |
| Two or more Races | 331 | 10.6% |
| Some other Race | 24 | 0.8% |
| Total | 3,124 | 100.0% |
Ancestry in Erda
The most populous ancestries reported in Erda are English (721 | 23.1%), American (367 | 11.7%), Greek (302 | 9.7%), Italian (302 | 9.7%), and German (225 | 7.2%), together accounting for 61.4% of all Erda residents.
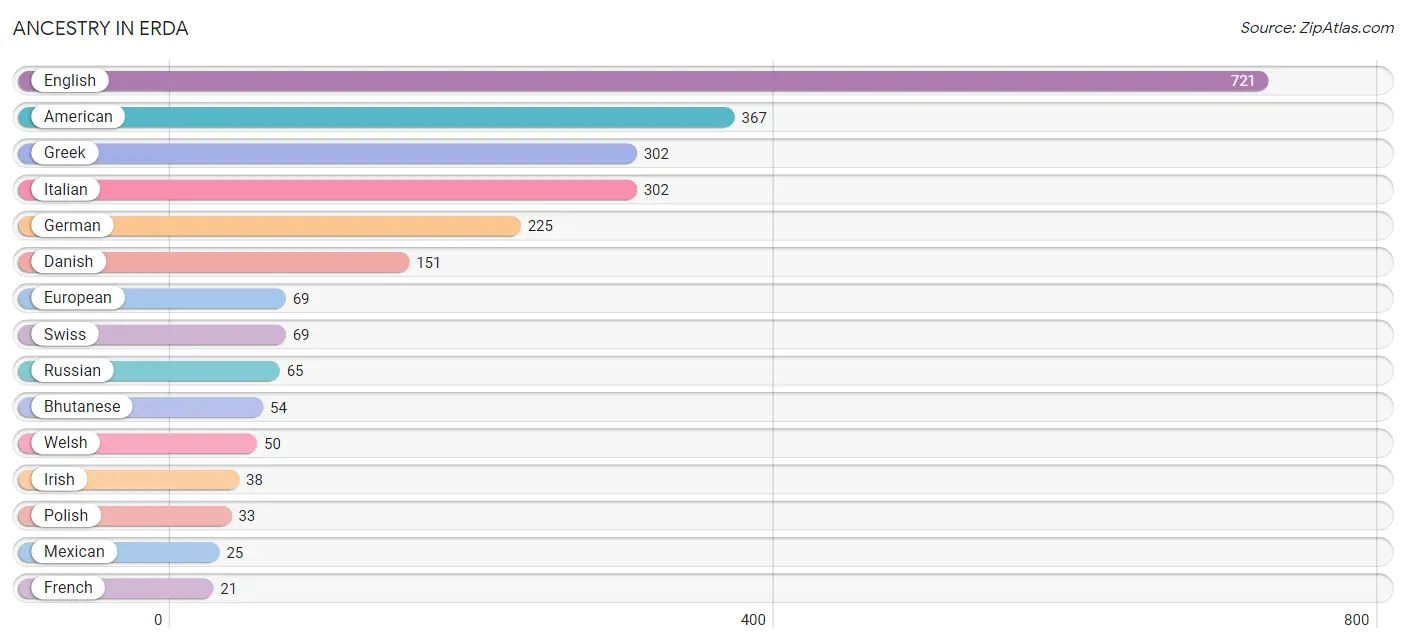
| Ancestry | # Population | % Population |
| American | 367 | 11.7% |
| Arab | 12 | 0.4% |
| Argentinean | 7 | 0.2% |
| Bhutanese | 54 | 1.7% |
| Central American | 10 | 0.3% |
| Danish | 151 | 4.8% |
| Dutch | 10 | 0.3% |
| English | 721 | 23.1% |
| European | 69 | 2.2% |
| French | 21 | 0.7% |
| German | 225 | 7.2% |
| Greek | 302 | 9.7% |
| Irish | 38 | 1.2% |
| Italian | 302 | 9.7% |
| Lebanese | 12 | 0.4% |
| Mexican | 25 | 0.8% |
| Peruvian | 9 | 0.3% |
| Polish | 33 | 1.1% |
| Pueblo | 3 | 0.1% |
| Russian | 65 | 2.1% |
| Salvadoran | 10 | 0.3% |
| Scandinavian | 15 | 0.5% |
| Scottish | 10 | 0.3% |
| South American | 16 | 0.5% |
| Spanish | 10 | 0.3% |
| Swedish | 6 | 0.2% |
| Swiss | 69 | 2.2% |
| Tongan | 17 | 0.5% |
| Ute | 3 | 0.1% |
| Welsh | 50 | 1.6% | View All 30 Rows |
Immigrants in Erda
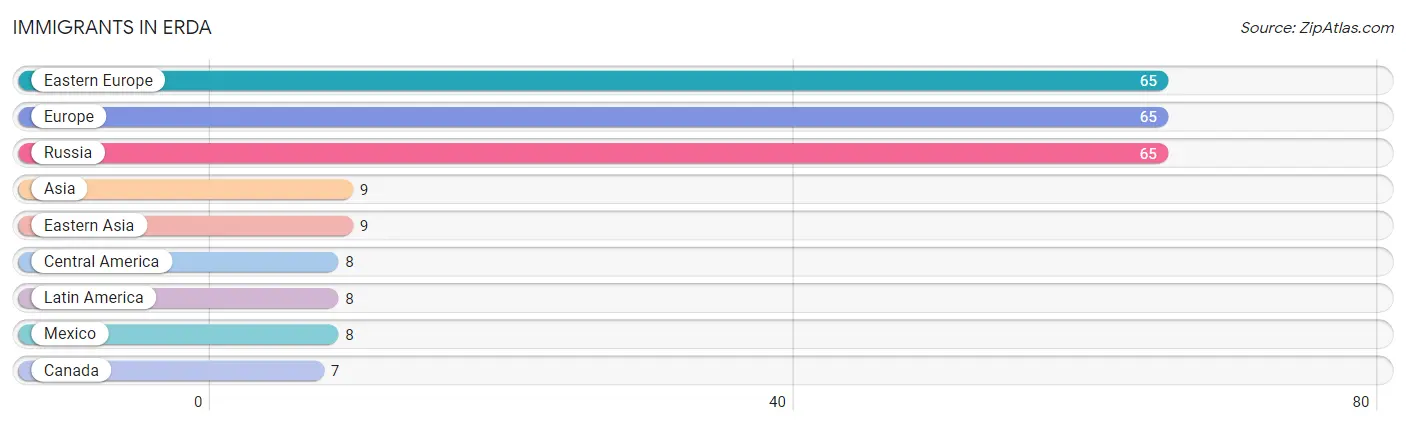
The most numerous immigrant groups reported in Erda came from Eastern Europe (65 | 2.1%), Europe (65 | 2.1%), Russia (65 | 2.1%), Asia (9 | 0.3%), and Eastern Asia (9 | 0.3%), together accounting for 6.8% of all Erda residents.
| Immigration Origin | # Population | % Population |
| Asia | 9 | 0.3% |
| Canada | 7 | 0.2% |
| Central America | 8 | 0.3% |
| Eastern Asia | 9 | 0.3% |
| Eastern Europe | 65 | 2.1% |
| Europe | 65 | 2.1% |
| Latin America | 8 | 0.3% |
| Mexico | 8 | 0.3% |
| Russia | 65 | 2.1% | View All 9 Rows |
Sex and Age in Erda
Sex and Age in Erda
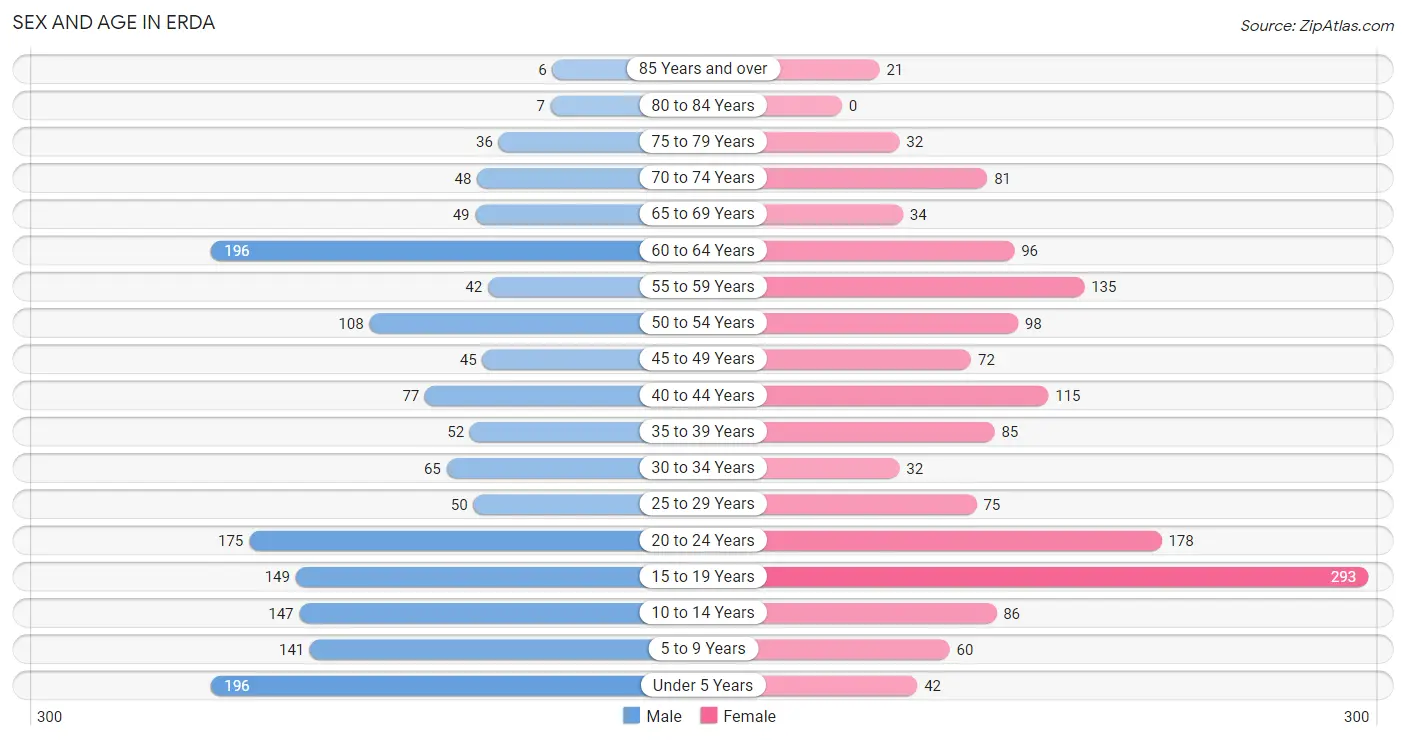
The most populous age groups in Erda are Under 5 Years (196 | 12.3%) for men and 15 to 19 Years (293 | 19.1%) for women.
| Age Bracket | Male | Female |
| Under 5 Years | 196 (12.3%) | 42 (2.7%) |
| 5 to 9 Years | 141 (8.9%) | 60 (3.9%) |
| 10 to 14 Years | 147 (9.2%) | 86 (5.6%) |
| 15 to 19 Years | 149 (9.4%) | 293 (19.1%) |
| 20 to 24 Years | 175 (11.0%) | 178 (11.6%) |
| 25 to 29 Years | 50 (3.2%) | 75 (4.9%) |
| 30 to 34 Years | 65 (4.1%) | 32 (2.1%) |
| 35 to 39 Years | 52 (3.3%) | 85 (5.5%) |
| 40 to 44 Years | 77 (4.9%) | 115 (7.5%) |
| 45 to 49 Years | 45 (2.8%) | 72 (4.7%) |
| 50 to 54 Years | 108 (6.8%) | 98 (6.4%) |
| 55 to 59 Years | 42 (2.6%) | 135 (8.8%) |
| 60 to 64 Years | 196 (12.3%) | 96 (6.2%) |
| 65 to 69 Years | 49 (3.1%) | 34 (2.2%) |
| 70 to 74 Years | 48 (3.0%) | 81 (5.3%) |
| 75 to 79 Years | 36 (2.3%) | 32 (2.1%) |
| 80 to 84 Years | 7 (0.4%) | 0 (0.0%) |
| 85 Years and over | 6 (0.4%) | 21 (1.4%) |
| Total | 1,589 (100.0%) | 1,535 (100.0%) |
Families and Households in Erda
Median Family Size in Erda
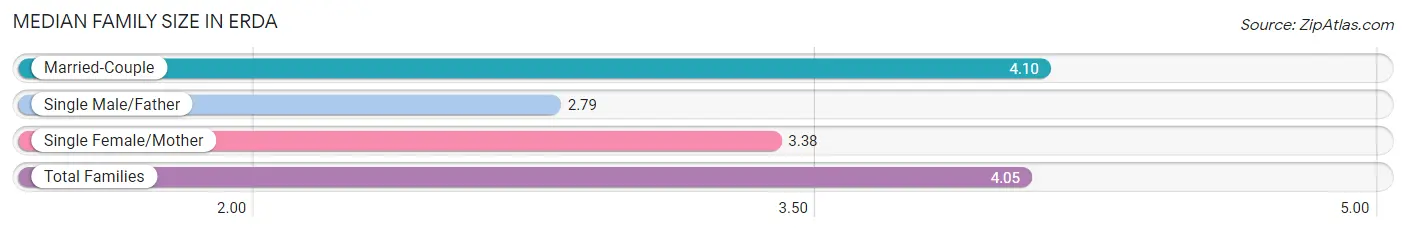
The median family size in Erda is 4.05 persons per family, with married-couple families (707 | 95.3%) accounting for the largest median family size of 4.1 persons per family. On the other hand, single male/father families (19 | 2.6%) represent the smallest median family size with 2.79 persons per family.
| Family Type | # Families | Family Size |
| Married-Couple | 707 (95.3%) | 4.10 |
| Single Male/Father | 19 (2.6%) | 2.79 |
| Single Female/Mother | 16 (2.2%) | 3.38 |
| Total Families | 742 (100.0%) | 4.05 |
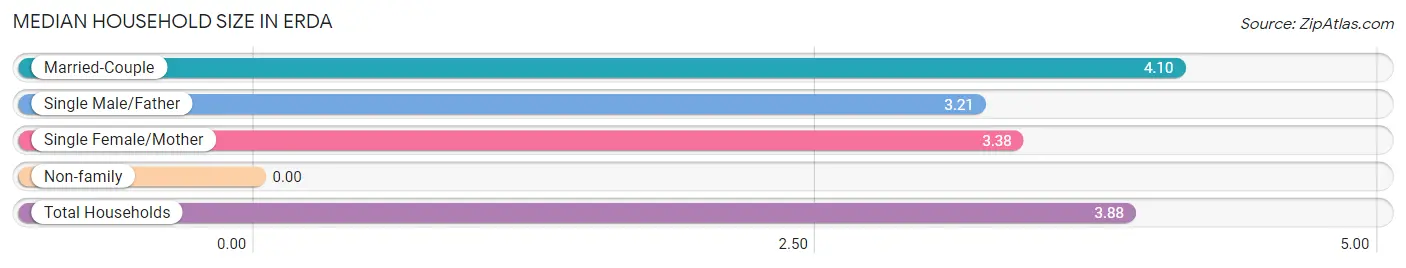
Median Household Size in Erda
| Household Type | # Households | Household Size |
| Married-Couple | 707 (89.6%) | 4.10 |
| Single Male/Father | 19 (2.4%) | 3.21 |
| Single Female/Mother | 16 (2.0%) | 3.38 |
| Non-family | 47 (6.0%) | - |
| Total Households | 789 (100.0%) | 3.88 |
Household Size by Marriage Status in Erda
Out of a total of 789 households in Erda, 742 (94.0%) are family households, while 47 (6.0%) are nonfamily households. The most numerous type of family households are 3-person households, comprising 228, and the most common type of nonfamily households are 1-person households, comprising 47.
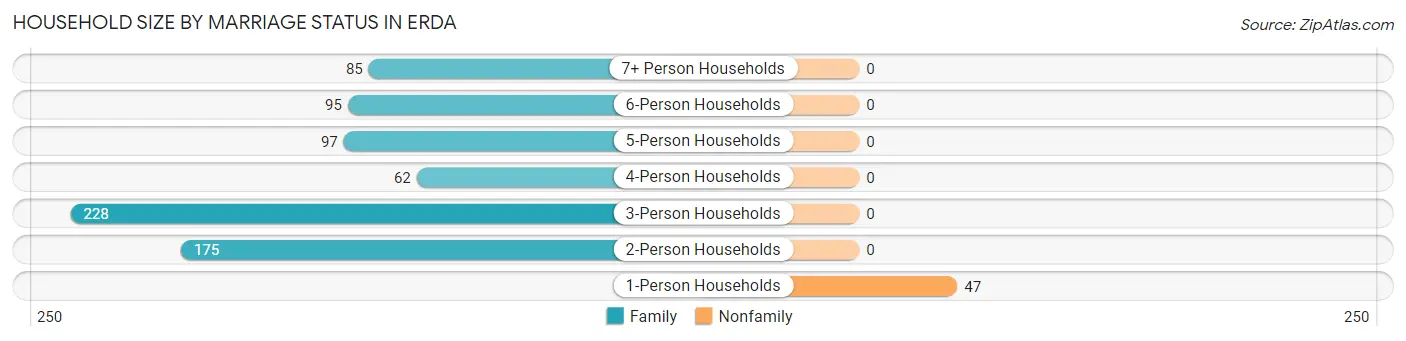
| Household Size | Family Households | Nonfamily Households |
| 1-Person Households | - | 47 (6.0%) |
| 2-Person Households | 175 (22.2%) | 0 (0.0%) |
| 3-Person Households | 228 (28.9%) | 0 (0.0%) |
| 4-Person Households | 62 (7.9%) | 0 (0.0%) |
| 5-Person Households | 97 (12.3%) | 0 (0.0%) |
| 6-Person Households | 95 (12.0%) | 0 (0.0%) |
| 7+ Person Households | 85 (10.8%) | 0 (0.0%) |
| Total | 742 (94.0%) | 47 (6.0%) |
Female Fertility in Erda
Fertility by Age in Erda
| Age Bracket | Women with Births | Births / 1,000 Women |
| 15 to 19 years | 0 (0.0%) | 0.0 |
| 20 to 34 years | 0 (0.0%) | 0.0 |
| 35 to 50 years | 0 (0.0%) | 0.0 |
| Total | 0 (0.0%) | 0.0 |
Fertility by Age by Marriage Status in Erda
| Age Bracket | Married | Unmarried |
| 15 to 19 years | 0 (0.0%) | 0 (0.0%) |
| 20 to 34 years | 0 (0.0%) | 0 (0.0%) |
| 35 to 50 years | 0 (0.0%) | 0 (0.0%) |
| Total | 0 (0.0%) | 0 (0.0%) |
Fertility by Education in Erda
| Educational Attainment | Women with Births | Births / 1,000 Women |
| Less than High School | 0 (0.0%) | 0.0 |
| High School Diploma | 0 (0.0%) | 0.0 |
| College or Associate's Degree | 0 (0.0%) | 0.0 |
| Bachelor's Degree | 0 (0.0%) | 0.0 |
| Graduate Degree | 0 (0.0%) | 0.0 |
| Total | 0 (0.0%) | 0.0 |
Fertility by Education by Marriage Status in Erda
| Educational Attainment | Married | Unmarried |
| Less than High School | 0 (0.0%) | 0 (0.0%) |
| High School Diploma | 0 (0.0%) | 0 (0.0%) |
| College or Associate's Degree | 0 (0.0%) | 0 (0.0%) |
| Bachelor's Degree | 0 (0.0%) | 0 (0.0%) |
| Graduate Degree | 0 (0.0%) | 0 (0.0%) |
| Total | 0 (0.0%) | 0 (0.0%) |
Employment Characteristics in Erda
Employment by Class of Employer in Erda
Among the 1,521 employed individuals in Erda, private company employees (996 | 65.5%), local government employees (174 | 11.4%), and self-employed (not incorporated) (141 | 9.3%) make up the most common classes of employment.
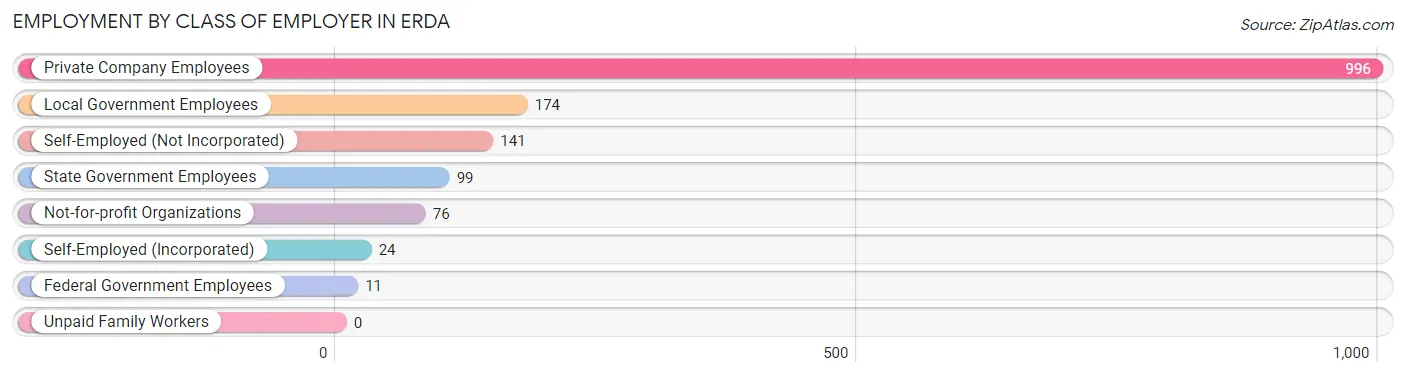
| Employer Class | # Employees | % Employees |
| Private Company Employees | 996 | 65.5% |
| Self-Employed (Incorporated) | 24 | 1.6% |
| Self-Employed (Not Incorporated) | 141 | 9.3% |
| Not-for-profit Organizations | 76 | 5.0% |
| Local Government Employees | 174 | 11.4% |
| State Government Employees | 99 | 6.5% |
| Federal Government Employees | 11 | 0.7% |
| Unpaid Family Workers | 0 | 0.0% |
| Total | 1,521 | 100.0% |
Employment Status by Age in Erda
According to the labor force statistics for Erda, out of the total population over 16 years of age (2,432), 77.4% or 1,882 individuals are in the labor force, with 14.0% or 263 of them unemployed. The age group with the highest labor force participation rate is 20 to 24 years, with 100.0% or 353 individuals in the labor force. Within the labor force, the 16 to 19 years age range has the highest percentage of unemployed individuals, with 70.2% or 181 of them being unemployed.
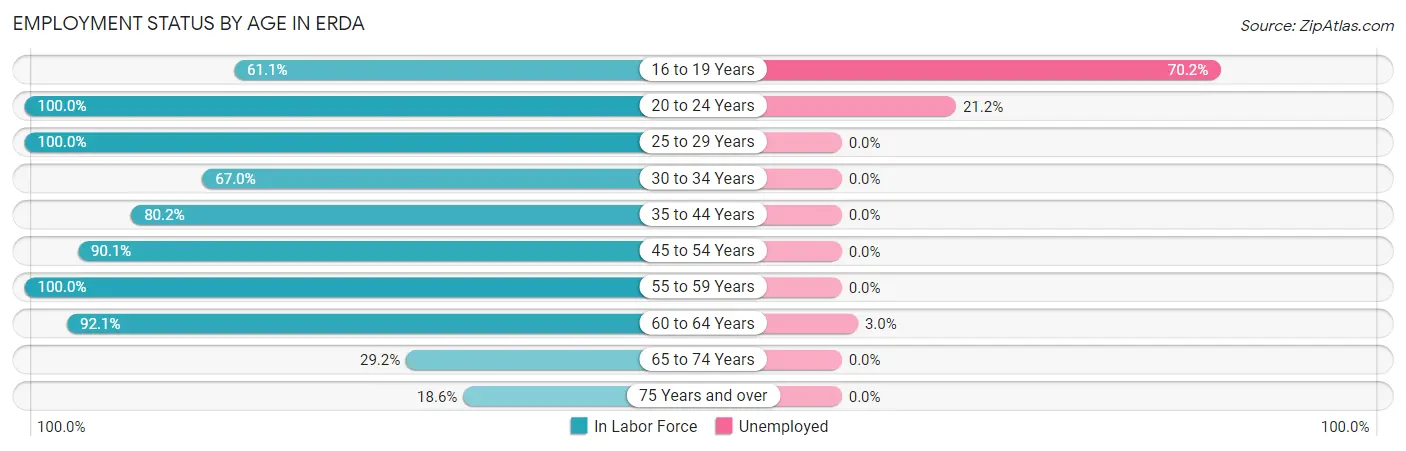
| Age Bracket | In Labor Force | Unemployed |
| 16 to 19 Years | 258 (61.1%) | 181 (70.2%) |
| 20 to 24 Years | 353 (100.0%) | 75 (21.2%) |
| 25 to 29 Years | 125 (100.0%) | 0 (0.0%) |
| 30 to 34 Years | 65 (67.0%) | 0 (0.0%) |
| 35 to 44 Years | 264 (80.2%) | 0 (0.0%) |
| 45 to 54 Years | 291 (90.1%) | 0 (0.0%) |
| 55 to 59 Years | 177 (100.0%) | 0 (0.0%) |
| 60 to 64 Years | 269 (92.1%) | 8 (3.0%) |
| 65 to 74 Years | 62 (29.2%) | 0 (0.0%) |
| 75 Years and over | 19 (18.6%) | 0 (0.0%) |
| Total | 1,882 (77.4%) | 263 (14.0%) |
Employment Status by Educational Attainment in Erda
According to labor force statistics for Erda, 88.7% of individuals (1,191) out of the total population between 25 and 64 years of age (1,343) are in the labor force, with 0.7% or 8 of them being unemployed. The group with the highest labor force participation rate are those with the educational attainment of less than high school, with 100.0% or 28 individuals in the labor force. Within the labor force, individuals with high school diploma education have the highest percentage of unemployment, with 4.7% or 8 of them being unemployed.
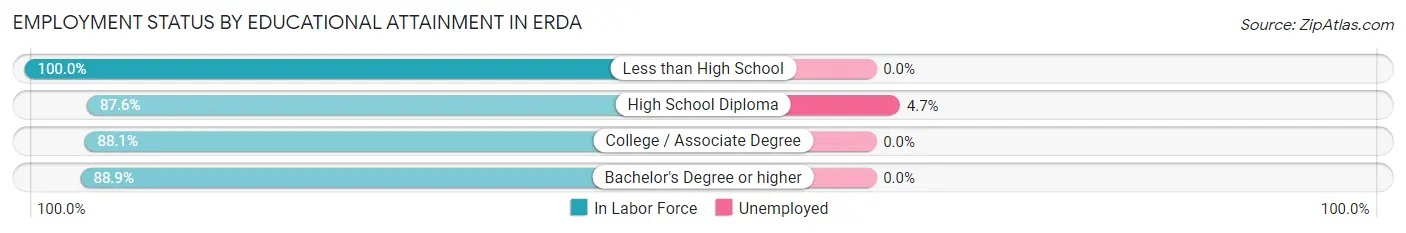
| Educational Attainment | In Labor Force | Unemployed |
| Less than High School | 28 (100.0%) | 0 (0.0%) |
| High School Diploma | 170 (87.6%) | 9 (4.7%) |
| College / Associate Degree | 446 (88.1%) | 0 (0.0%) |
| Bachelor's Degree or higher | 547 (88.9%) | 0 (0.0%) |
| Total | 1,191 (88.7%) | 9 (0.7%) |
Employment Occupations by Sex in Erda
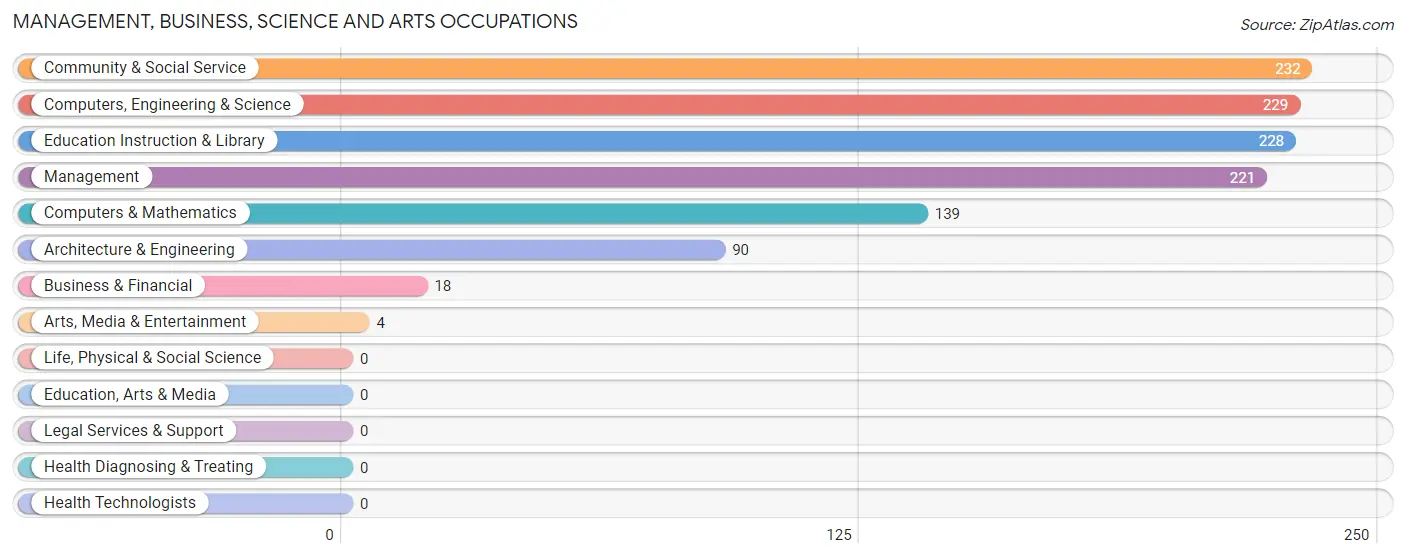
Management, Business, Science and Arts Occupations
The most common Management, Business, Science and Arts occupations in Erda are Community & Social Service (232 | 14.3%), Computers, Engineering & Science (229 | 14.1%), Education Instruction & Library (228 | 14.1%), Management (221 | 13.7%), and Computers & Mathematics (139 | 8.6%).
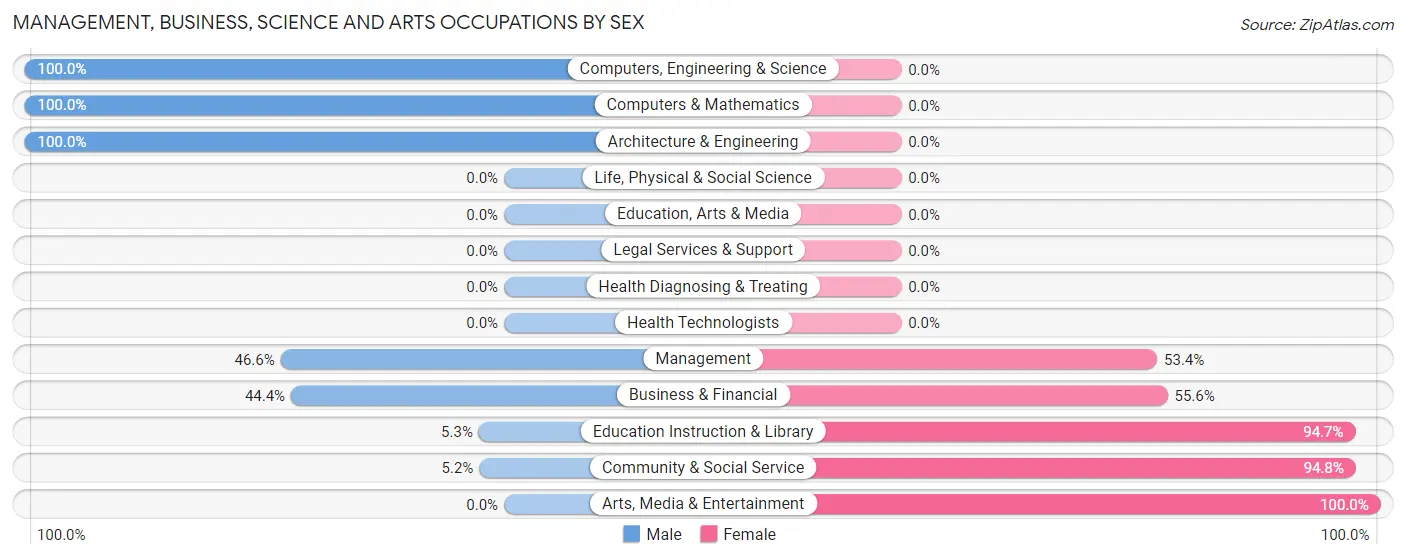
Management, Business, Science and Arts Occupations by Sex
Within the Management, Business, Science and Arts occupations in Erda, the most male-oriented occupations are Computers, Engineering & Science (100.0%), Computers & Mathematics (100.0%), and Architecture & Engineering (100.0%), while the most female-oriented occupations are Arts, Media & Entertainment (100.0%), Community & Social Service (94.8%), and Education Instruction & Library (94.7%).
| Occupation | Male | Female |
| Management | 103 (46.6%) | 118 (53.4%) |
| Business & Financial | 8 (44.4%) | 10 (55.6%) |
| Computers, Engineering & Science | 229 (100.0%) | 0 (0.0%) |
| Computers & Mathematics | 139 (100.0%) | 0 (0.0%) |
| Architecture & Engineering | 90 (100.0%) | 0 (0.0%) |
| Life, Physical & Social Science | 0 (0.0%) | 0 (0.0%) |
| Community & Social Service | 12 (5.2%) | 220 (94.8%) |
| Education, Arts & Media | 0 (0.0%) | 0 (0.0%) |
| Legal Services & Support | 0 (0.0%) | 0 (0.0%) |
| Education Instruction & Library | 12 (5.3%) | 216 (94.7%) |
| Arts, Media & Entertainment | 0 (0.0%) | 4 (100.0%) |
| Health Diagnosing & Treating | 0 (0.0%) | 0 (0.0%) |
| Health Technologists | 0 (0.0%) | 0 (0.0%) |
| Total (Category) | 352 (50.3%) | 348 (49.7%) |
| Total (Overall) | 862 (53.2%) | 757 (46.8%) |
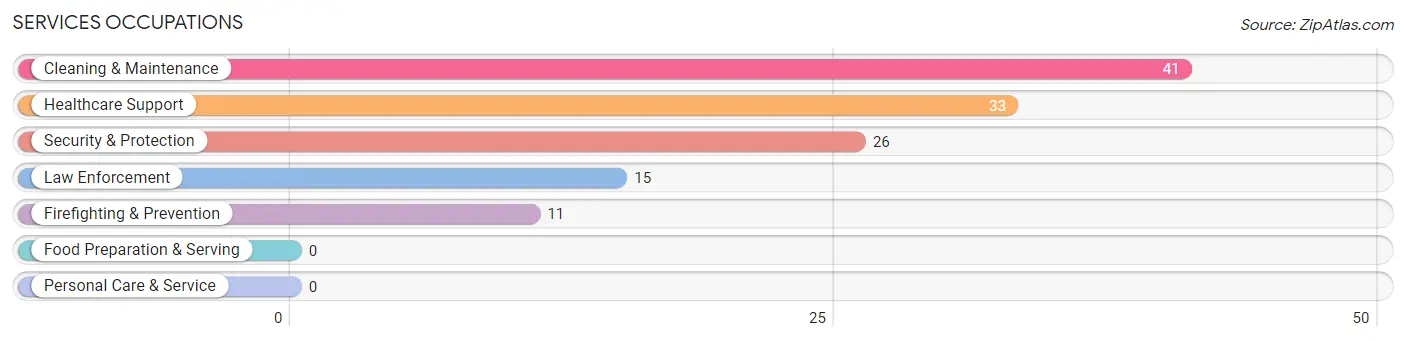
Services Occupations
The most common Services occupations in Erda are Cleaning & Maintenance (41 | 2.5%), Healthcare Support (33 | 2.0%), Security & Protection (26 | 1.6%), Law Enforcement (15 | 0.9%), and Firefighting & Prevention (11 | 0.7%).
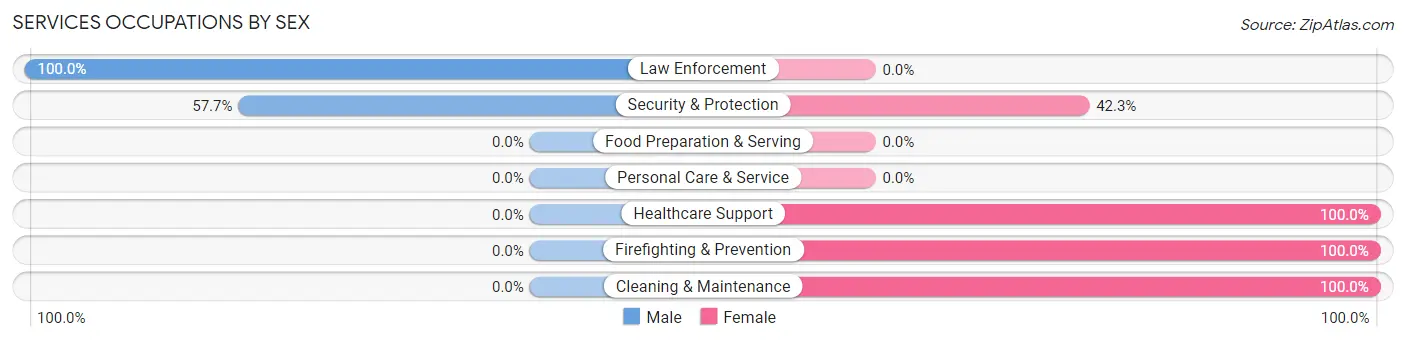
Services Occupations by Sex
Within the Services occupations in Erda, the most male-oriented occupations are Law Enforcement (100.0%), and Security & Protection (57.7%), while the most female-oriented occupations are Healthcare Support (100.0%), Firefighting & Prevention (100.0%), and Cleaning & Maintenance (100.0%).
| Occupation | Male | Female |
| Healthcare Support | 0 (0.0%) | 33 (100.0%) |
| Security & Protection | 15 (57.7%) | 11 (42.3%) |
| Firefighting & Prevention | 0 (0.0%) | 11 (100.0%) |
| Law Enforcement | 15 (100.0%) | 0 (0.0%) |
| Food Preparation & Serving | 0 (0.0%) | 0 (0.0%) |
| Cleaning & Maintenance | 0 (0.0%) | 41 (100.0%) |
| Personal Care & Service | 0 (0.0%) | 0 (0.0%) |
| Total (Category) | 15 (15.0%) | 85 (85.0%) |
| Total (Overall) | 862 (53.2%) | 757 (46.8%) |
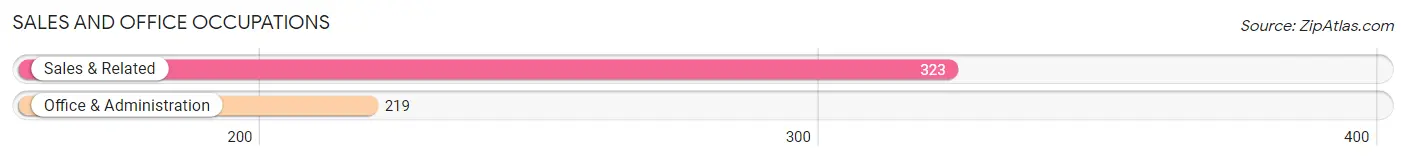
Sales and Office Occupations
The most common Sales and Office occupations in Erda are Sales & Related (323 | 20.0%), and Office & Administration (219 | 13.5%).
Sales and Office Occupations by Sex
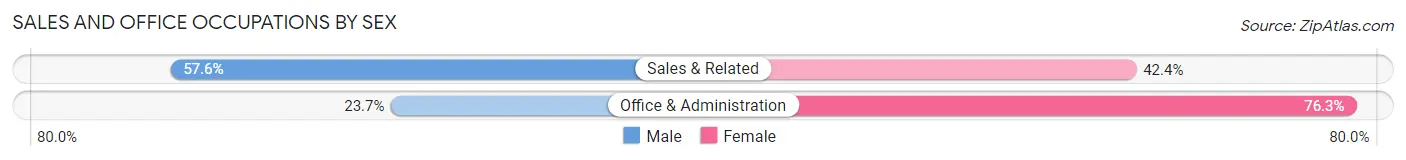
| Occupation | Male | Female |
| Sales & Related | 186 (57.6%) | 137 (42.4%) |
| Office & Administration | 52 (23.7%) | 167 (76.3%) |
| Total (Category) | 238 (43.9%) | 304 (56.1%) |
| Total (Overall) | 862 (53.2%) | 757 (46.8%) |
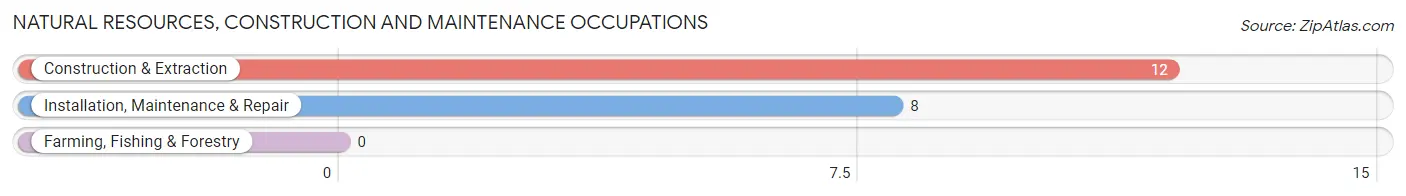
Natural Resources, Construction and Maintenance Occupations
The most common Natural Resources, Construction and Maintenance occupations in Erda are Construction & Extraction (12 | 0.7%), and Installation, Maintenance & Repair (8 | 0.5%).
Natural Resources, Construction and Maintenance Occupations by Sex
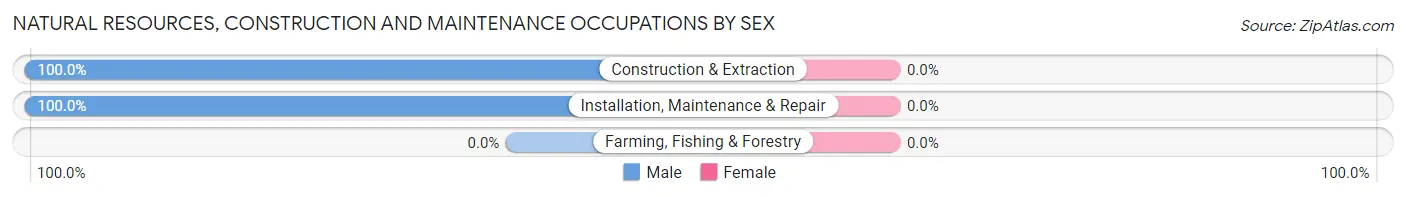
| Occupation | Male | Female |
| Farming, Fishing & Forestry | 0 (0.0%) | 0 (0.0%) |
| Construction & Extraction | 12 (100.0%) | 0 (0.0%) |
| Installation, Maintenance & Repair | 8 (100.0%) | 0 (0.0%) |
| Total (Category) | 20 (100.0%) | 0 (0.0%) |
| Total (Overall) | 862 (53.2%) | 757 (46.8%) |
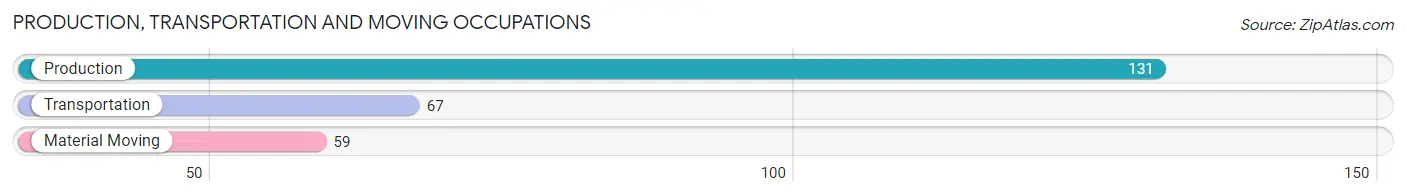
Production, Transportation and Moving Occupations
The most common Production, Transportation and Moving occupations in Erda are Production (131 | 8.1%), Transportation (67 | 4.1%), and Material Moving (59 | 3.6%).
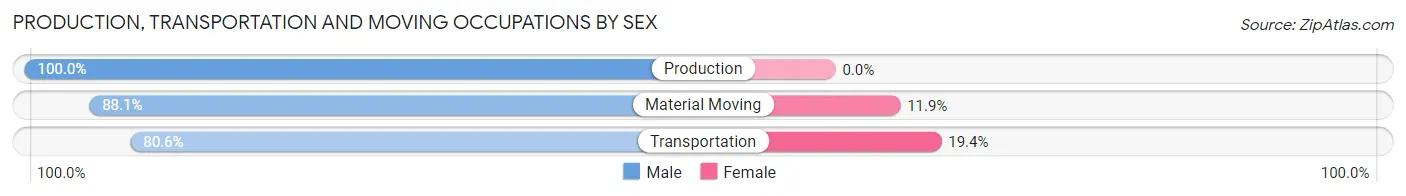
Production, Transportation and Moving Occupations by Sex
| Occupation | Male | Female |
| Production | 131 (100.0%) | 0 (0.0%) |
| Transportation | 54 (80.6%) | 13 (19.4%) |
| Material Moving | 52 (88.1%) | 7 (11.9%) |
| Total (Category) | 237 (92.2%) | 20 (7.8%) |
| Total (Overall) | 862 (53.2%) | 757 (46.8%) |
Employment Industries by Sex in Erda
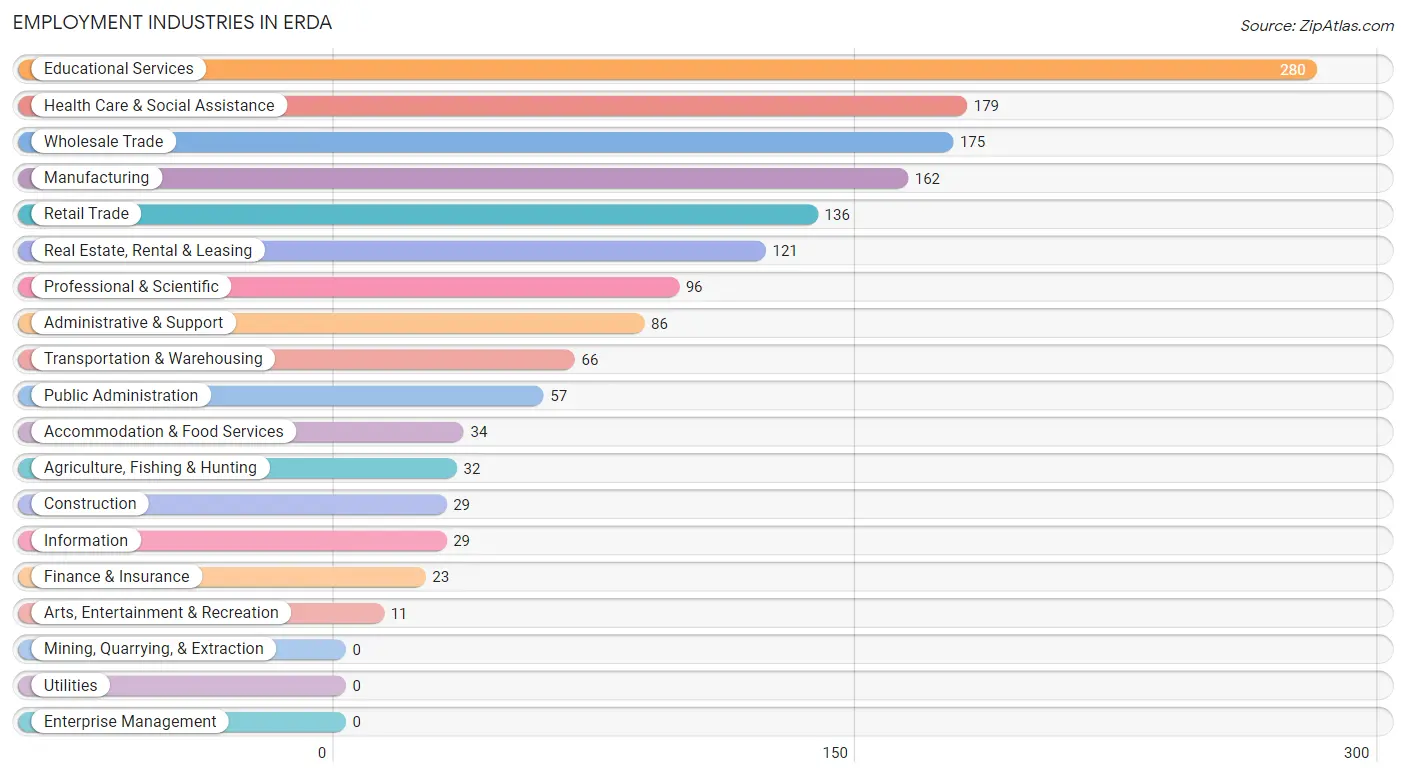
Employment Industries in Erda
The major employment industries in Erda include Educational Services (280 | 17.3%), Health Care & Social Assistance (179 | 11.1%), Wholesale Trade (175 | 10.8%), Manufacturing (162 | 10.0%), and Retail Trade (136 | 8.4%).
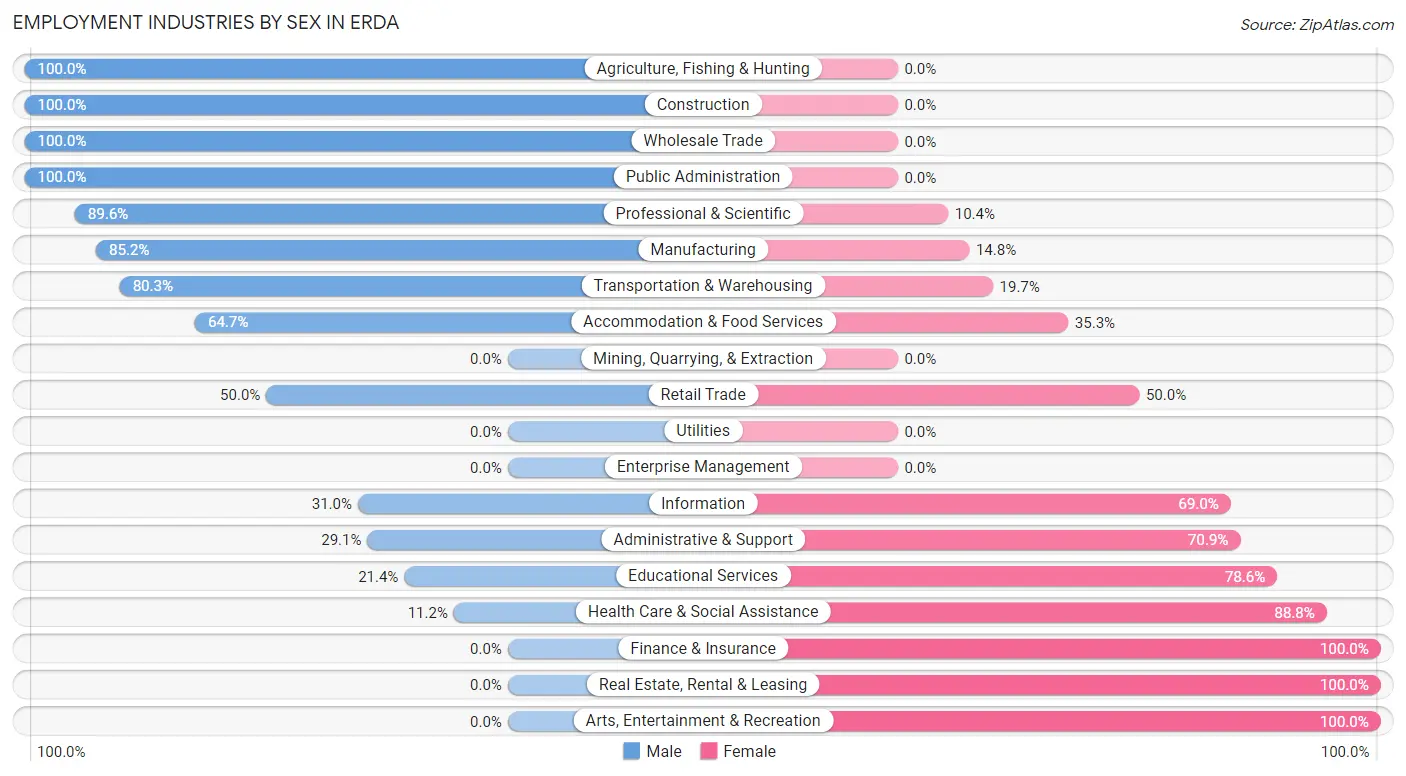
Employment Industries by Sex in Erda
The Erda industries that see more men than women are Agriculture, Fishing & Hunting (100.0%), Construction (100.0%), and Wholesale Trade (100.0%), whereas the industries that tend to have a higher number of women are Finance & Insurance (100.0%), Real Estate, Rental & Leasing (100.0%), and Arts, Entertainment & Recreation (100.0%).
| Industry | Male | Female |
| Agriculture, Fishing & Hunting | 32 (100.0%) | 0 (0.0%) |
| Mining, Quarrying, & Extraction | 0 (0.0%) | 0 (0.0%) |
| Construction | 29 (100.0%) | 0 (0.0%) |
| Manufacturing | 138 (85.2%) | 24 (14.8%) |
| Wholesale Trade | 175 (100.0%) | 0 (0.0%) |
| Retail Trade | 68 (50.0%) | 68 (50.0%) |
| Transportation & Warehousing | 53 (80.3%) | 13 (19.7%) |
| Utilities | 0 (0.0%) | 0 (0.0%) |
| Information | 9 (31.0%) | 20 (69.0%) |
| Finance & Insurance | 0 (0.0%) | 23 (100.0%) |
| Real Estate, Rental & Leasing | 0 (0.0%) | 121 (100.0%) |
| Professional & Scientific | 86 (89.6%) | 10 (10.4%) |
| Enterprise Management | 0 (0.0%) | 0 (0.0%) |
| Administrative & Support | 25 (29.1%) | 61 (70.9%) |
| Educational Services | 60 (21.4%) | 220 (78.6%) |
| Health Care & Social Assistance | 20 (11.2%) | 159 (88.8%) |
| Arts, Entertainment & Recreation | 0 (0.0%) | 11 (100.0%) |
| Accommodation & Food Services | 22 (64.7%) | 12 (35.3%) |
| Public Administration | 57 (100.0%) | 0 (0.0%) |
| Total | 862 (53.2%) | 757 (46.8%) |
Education in Erda
School Enrollment in Erda
The most common levels of schooling among the 953 students in Erda are high school (428 | 44.9%), elementary school (180 | 18.9%), and college / undergraduate (144 | 15.1%).
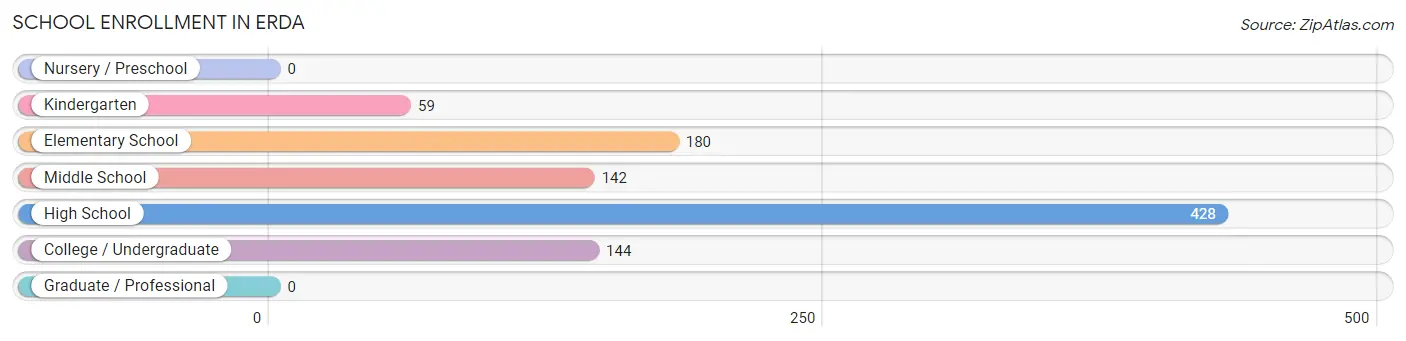
| School Level | # Students | % Students |
| Nursery / Preschool | 0 | 0.0% |
| Kindergarten | 59 | 6.2% |
| Elementary School | 180 | 18.9% |
| Middle School | 142 | 14.9% |
| High School | 428 | 44.9% |
| College / Undergraduate | 144 | 15.1% |
| Graduate / Professional | 0 | 0.0% |
| Total | 953 | 100.0% |
School Enrollment by Age by Funding Source in Erda
Out of a total of 953 students who are enrolled in schools in Erda, 206 (21.6%) attend a private institution, while the remaining 747 (78.4%) are enrolled in public schools. The age group of 20 to 24 year olds has the highest likelihood of being enrolled in private schools, with 44 (53.7% in the age bracket) enrolled. Conversely, the age group of 35 years and over has the lowest likelihood of being enrolled in a private school, with 24 (100.0% in the age bracket) attending a public institution.
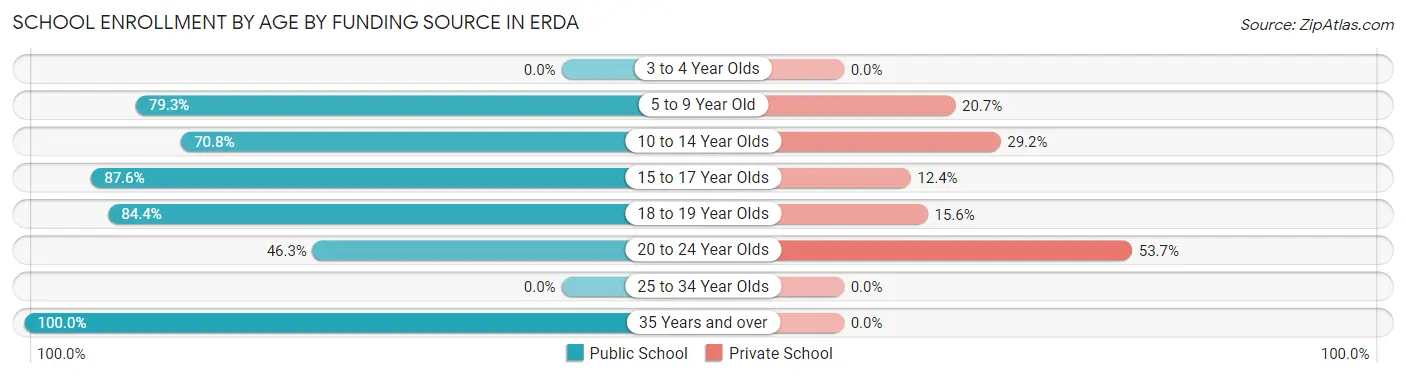
| Age Bracket | Public School | Private School |
| 3 to 4 Year Olds | 0 (0.0%) | 0 (0.0%) |
| 5 to 9 Year Old | 149 (79.3%) | 39 (20.7%) |
| 10 to 14 Year Olds | 165 (70.8%) | 68 (29.2%) |
| 15 to 17 Year Olds | 317 (87.6%) | 45 (12.4%) |
| 18 to 19 Year Olds | 54 (84.4%) | 10 (15.6%) |
| 20 to 24 Year Olds | 38 (46.3%) | 44 (53.7%) |
| 25 to 34 Year Olds | 0 (0.0%) | 0 (0.0%) |
| 35 Years and over | 24 (100.0%) | 0 (0.0%) |
| Total | 747 (78.4%) | 206 (21.6%) |
Educational Attainment by Field of Study in Erda
Education (218 | 26.6%), business (213 | 26.0%), science & technology (62 | 7.6%), communications (62 | 7.6%), and engineering (61 | 7.4%) are the most common fields of study among 820 individuals in Erda who have obtained a bachelor's degree or higher.
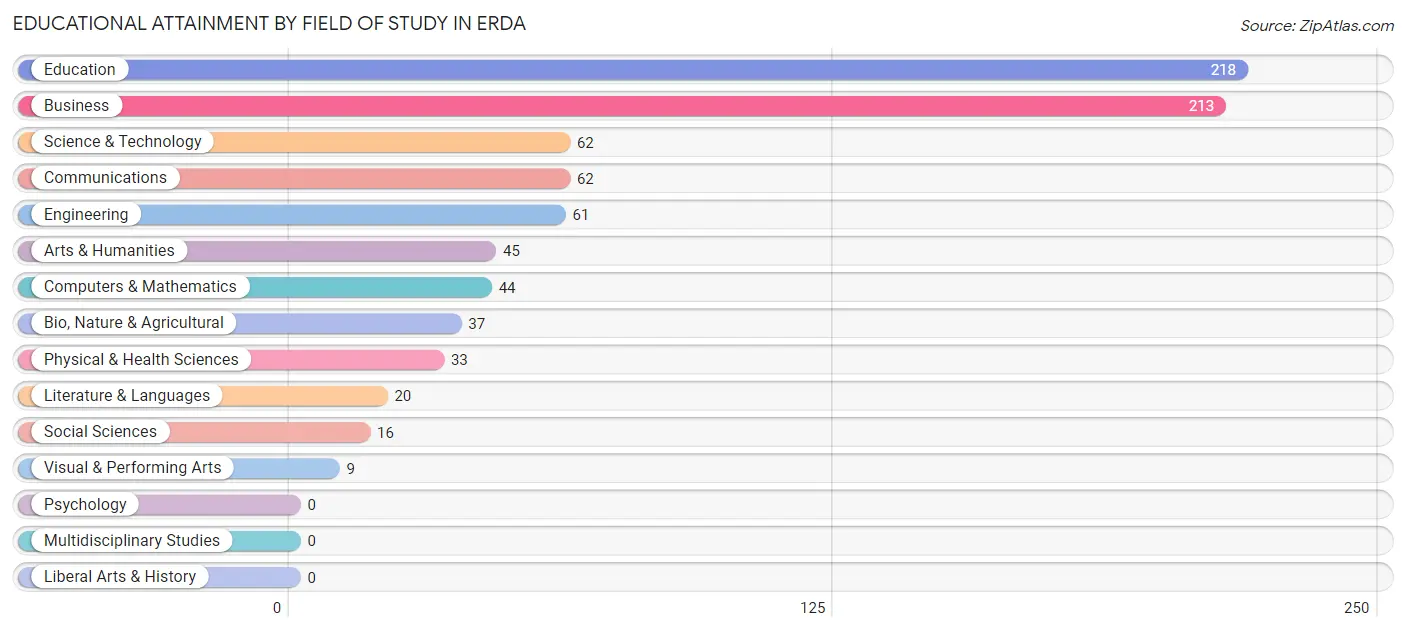
| Field of Study | # Graduates | % Graduates |
| Computers & Mathematics | 44 | 5.4% |
| Bio, Nature & Agricultural | 37 | 4.5% |
| Physical & Health Sciences | 33 | 4.0% |
| Psychology | 0 | 0.0% |
| Social Sciences | 16 | 1.9% |
| Engineering | 61 | 7.4% |
| Multidisciplinary Studies | 0 | 0.0% |
| Science & Technology | 62 | 7.6% |
| Business | 213 | 26.0% |
| Education | 218 | 26.6% |
| Literature & Languages | 20 | 2.4% |
| Liberal Arts & History | 0 | 0.0% |
| Visual & Performing Arts | 9 | 1.1% |
| Communications | 62 | 7.6% |
| Arts & Humanities | 45 | 5.5% |
| Total | 820 | 100.0% |
Transportation & Commute in Erda
Vehicle Availability by Sex in Erda
The most prevalent vehicle ownership categories in Erda are males with 5 or more vehicles (288, accounting for 37.3%) and females with 5 or more vehicles (245, making up 39.0%).
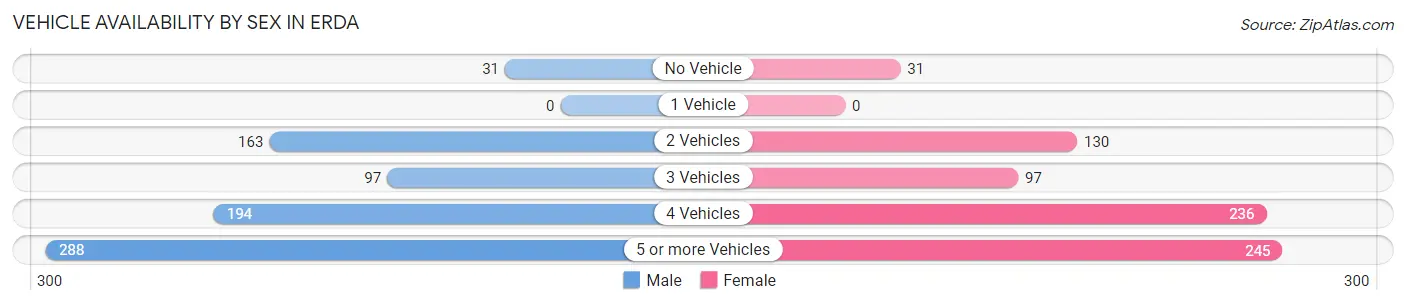
| Vehicles Available | Male | Female |
| No Vehicle | 31 (4.0%) | 31 (4.2%) |
| 1 Vehicle | 0 (0.0%) | 0 (0.0%) |
| 2 Vehicles | 163 (21.1%) | 130 (17.6%) |
| 3 Vehicles | 97 (12.6%) | 97 (13.1%) |
| 4 Vehicles | 194 (25.1%) | 236 (31.9%) |
| 5 or more Vehicles | 288 (37.3%) | 245 (33.2%) |
| Total | 773 (100.0%) | 739 (100.0%) |
Commute Time in Erda
The most frequently occuring commute durations in Erda are 30 to 34 minutes (304 commuters, 23.3%), 5 to 9 minutes (233 commuters, 17.8%), and 15 to 19 minutes (170 commuters, 13.0%).
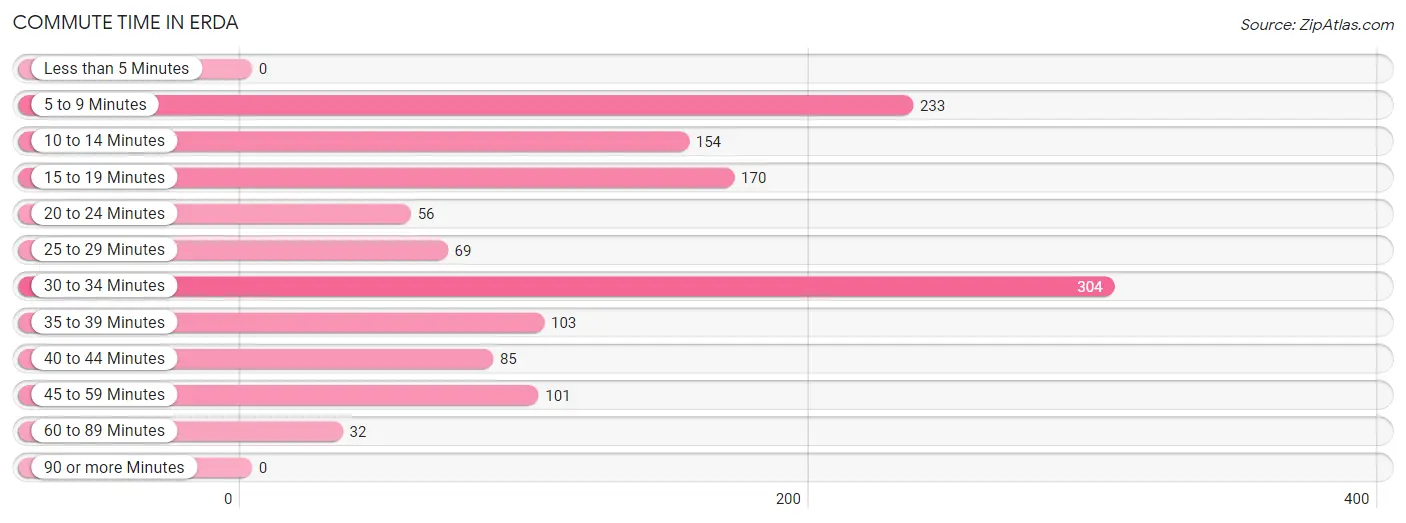
| Commute Time | # Commuters | % Commuters |
| Less than 5 Minutes | 0 | 0.0% |
| 5 to 9 Minutes | 233 | 17.8% |
| 10 to 14 Minutes | 154 | 11.8% |
| 15 to 19 Minutes | 170 | 13.0% |
| 20 to 24 Minutes | 56 | 4.3% |
| 25 to 29 Minutes | 69 | 5.3% |
| 30 to 34 Minutes | 304 | 23.3% |
| 35 to 39 Minutes | 103 | 7.9% |
| 40 to 44 Minutes | 85 | 6.5% |
| 45 to 59 Minutes | 101 | 7.7% |
| 60 to 89 Minutes | 32 | 2.5% |
| 90 or more Minutes | 0 | 0.0% |
Commute Time by Sex in Erda
The most common commute times in Erda are 30 to 34 minutes (169 commuters, 23.2%) for males and 10 to 14 minutes (139 commuters, 24.0%) for females.
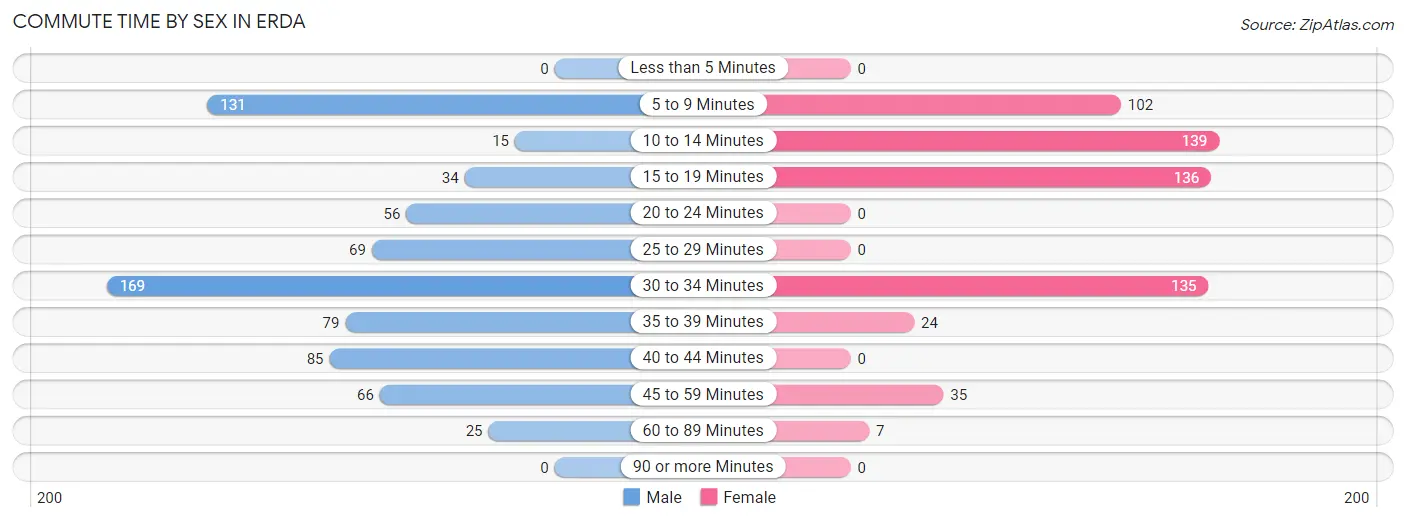
| Commute Time | Male | Female |
| Less than 5 Minutes | 0 (0.0%) | 0 (0.0%) |
| 5 to 9 Minutes | 131 (18.0%) | 102 (17.6%) |
| 10 to 14 Minutes | 15 (2.1%) | 139 (24.0%) |
| 15 to 19 Minutes | 34 (4.7%) | 136 (23.5%) |
| 20 to 24 Minutes | 56 (7.7%) | 0 (0.0%) |
| 25 to 29 Minutes | 69 (9.5%) | 0 (0.0%) |
| 30 to 34 Minutes | 169 (23.2%) | 135 (23.4%) |
| 35 to 39 Minutes | 79 (10.8%) | 24 (4.2%) |
| 40 to 44 Minutes | 85 (11.7%) | 0 (0.0%) |
| 45 to 59 Minutes | 66 (9.0%) | 35 (6.1%) |
| 60 to 89 Minutes | 25 (3.4%) | 7 (1.2%) |
| 90 or more Minutes | 0 (0.0%) | 0 (0.0%) |
Time of Departure to Work by Sex in Erda
The most frequent times of departure to work in Erda are 9:00 AM to 9:59 AM (174, 23.9%) for males and 9:00 AM to 9:59 AM (255, 44.1%) for females.
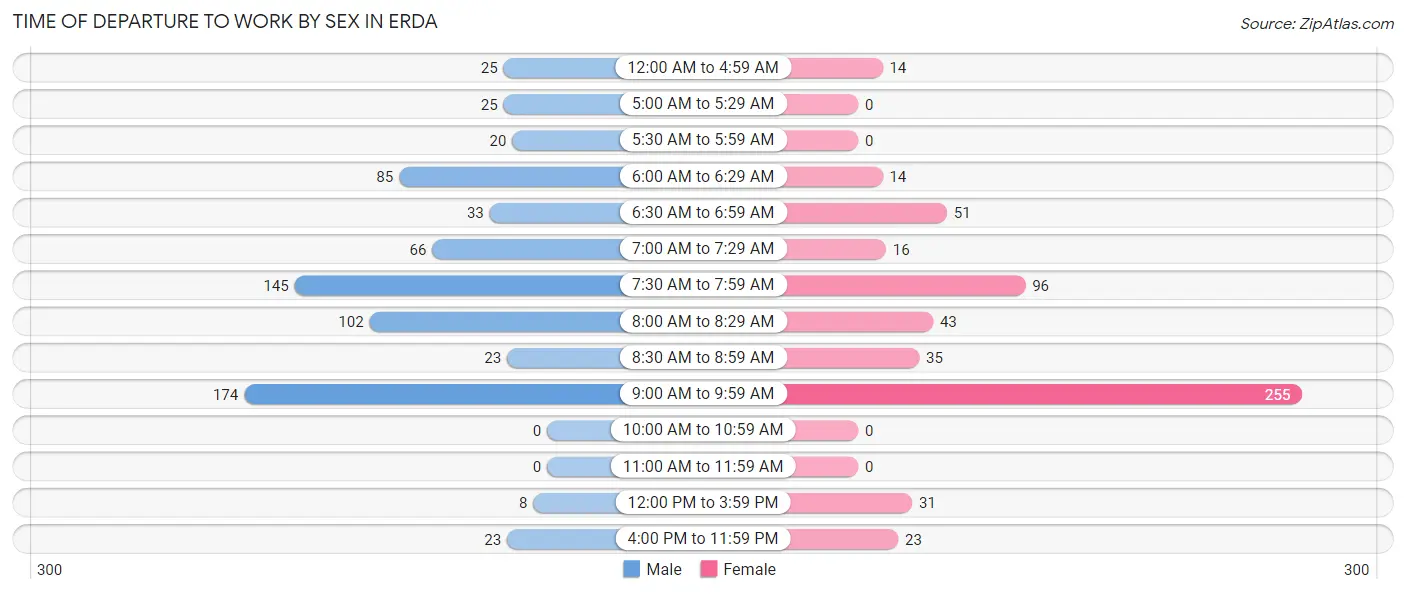
| Time of Departure | Male | Female |
| 12:00 AM to 4:59 AM | 25 (3.4%) | 14 (2.4%) |
| 5:00 AM to 5:29 AM | 25 (3.4%) | 0 (0.0%) |
| 5:30 AM to 5:59 AM | 20 (2.7%) | 0 (0.0%) |
| 6:00 AM to 6:29 AM | 85 (11.7%) | 14 (2.4%) |
| 6:30 AM to 6:59 AM | 33 (4.5%) | 51 (8.8%) |
| 7:00 AM to 7:29 AM | 66 (9.0%) | 16 (2.8%) |
| 7:30 AM to 7:59 AM | 145 (19.9%) | 96 (16.6%) |
| 8:00 AM to 8:29 AM | 102 (14.0%) | 43 (7.4%) |
| 8:30 AM to 8:59 AM | 23 (3.2%) | 35 (6.1%) |
| 9:00 AM to 9:59 AM | 174 (23.9%) | 255 (44.1%) |
| 10:00 AM to 10:59 AM | 0 (0.0%) | 0 (0.0%) |
| 11:00 AM to 11:59 AM | 0 (0.0%) | 0 (0.0%) |
| 12:00 PM to 3:59 PM | 8 (1.1%) | 31 (5.4%) |
| 4:00 PM to 11:59 PM | 23 (3.2%) | 23 (4.0%) |
| Total | 729 (100.0%) | 578 (100.0%) |
Housing Occupancy in Erda
Occupancy by Ownership in Erda
Of the total 789 dwellings in Erda, owner-occupied units account for 704 (89.2%), while renter-occupied units make up 85 (10.8%).
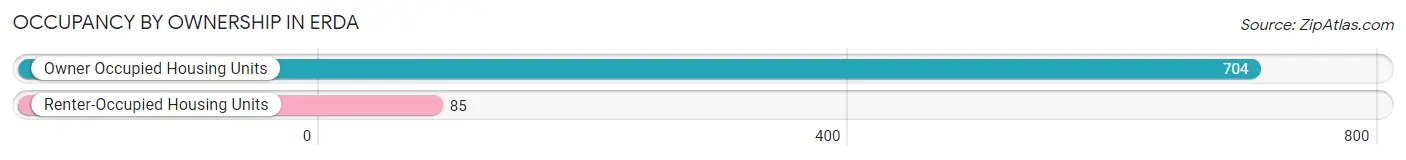
| Occupancy | # Housing Units | % Housing Units |
| Owner Occupied Housing Units | 704 | 89.2% |
| Renter-Occupied Housing Units | 85 | 10.8% |
| Total Occupied Housing Units | 789 | 100.0% |
Occupancy by Household Size in Erda
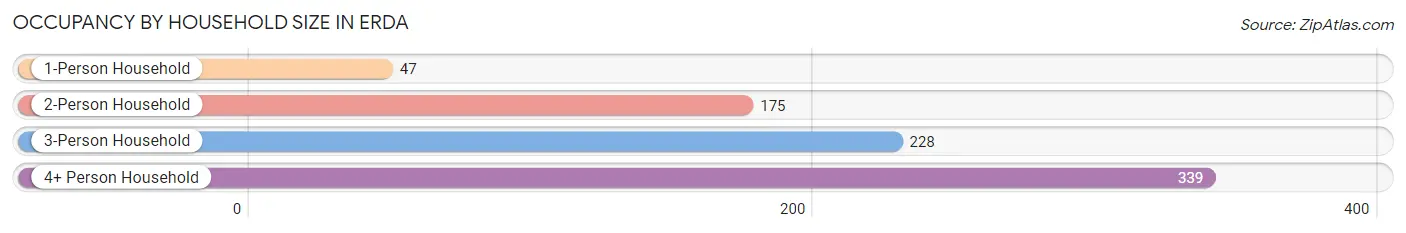
| Household Size | # Housing Units | % Housing Units |
| 1-Person Household | 47 | 6.0% |
| 2-Person Household | 175 | 22.2% |
| 3-Person Household | 228 | 28.9% |
| 4+ Person Household | 339 | 43.0% |
| Total Housing Units | 789 | 100.0% |
Occupancy by Ownership by Household Size in Erda
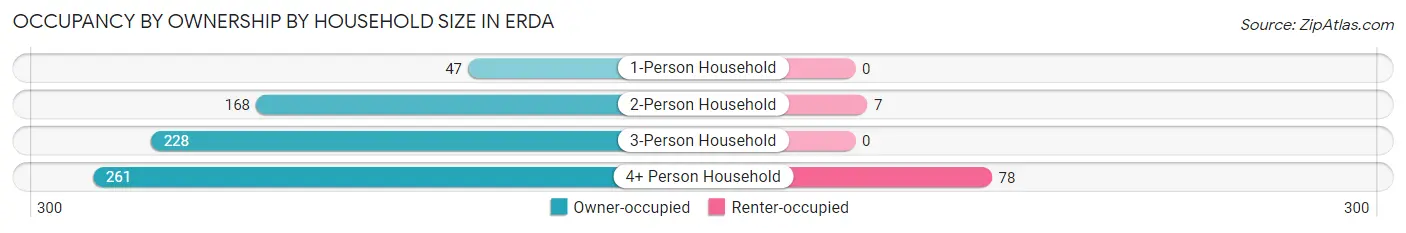
| Household Size | Owner-occupied | Renter-occupied |
| 1-Person Household | 47 (100.0%) | 0 (0.0%) |
| 2-Person Household | 168 (96.0%) | 7 (4.0%) |
| 3-Person Household | 228 (100.0%) | 0 (0.0%) |
| 4+ Person Household | 261 (77.0%) | 78 (23.0%) |
| Total Housing Units | 704 (89.2%) | 85 (10.8%) |
Occupancy by Educational Attainment in Erda
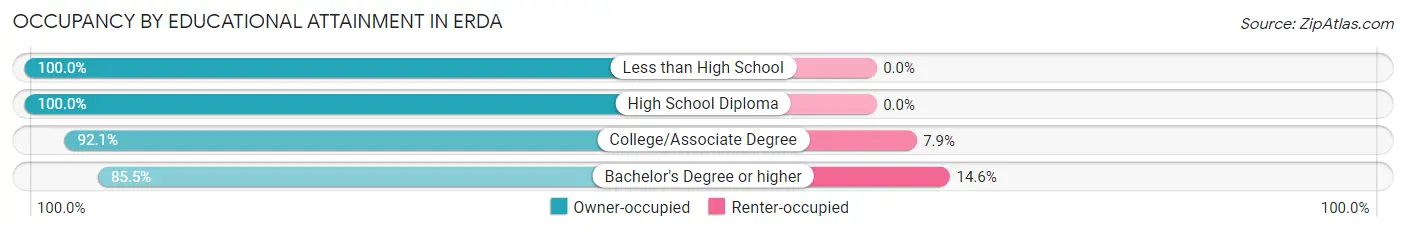
| Household Size | Owner-occupied | Renter-occupied |
| Less than High School | 14 (100.0%) | 0 (0.0%) |
| High School Diploma | 65 (100.0%) | 0 (0.0%) |
| College/Associate Degree | 255 (92.1%) | 22 (7.9%) |
| Bachelor's Degree or higher | 370 (85.5%) | 63 (14.5%) |
Occupancy by Age of Householder in Erda
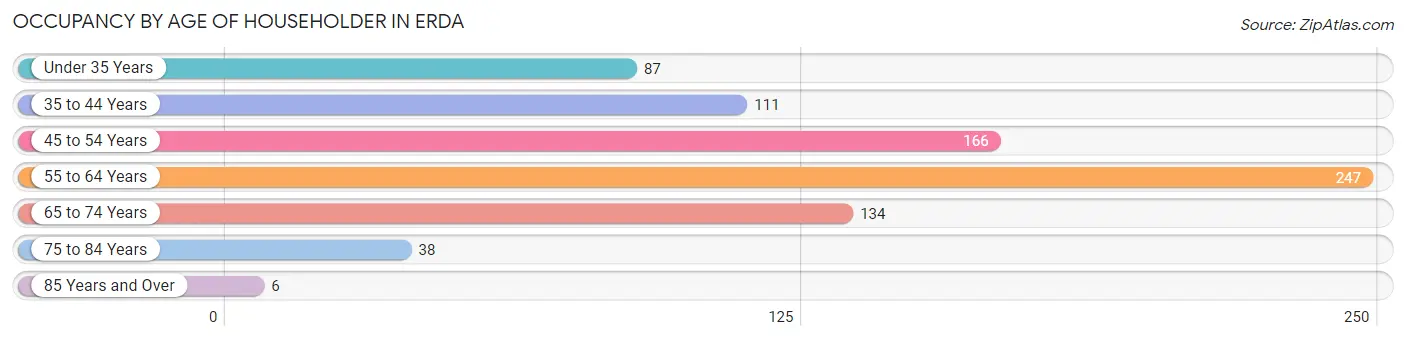
| Age Bracket | # Households | % Households |
| Under 35 Years | 87 | 11.0% |
| 35 to 44 Years | 111 | 14.1% |
| 45 to 54 Years | 166 | 21.0% |
| 55 to 64 Years | 247 | 31.3% |
| 65 to 74 Years | 134 | 17.0% |
| 75 to 84 Years | 38 | 4.8% |
| 85 Years and Over | 6 | 0.8% |
| Total | 789 | 100.0% |
Housing Finances in Erda
Median Income by Occupancy in Erda
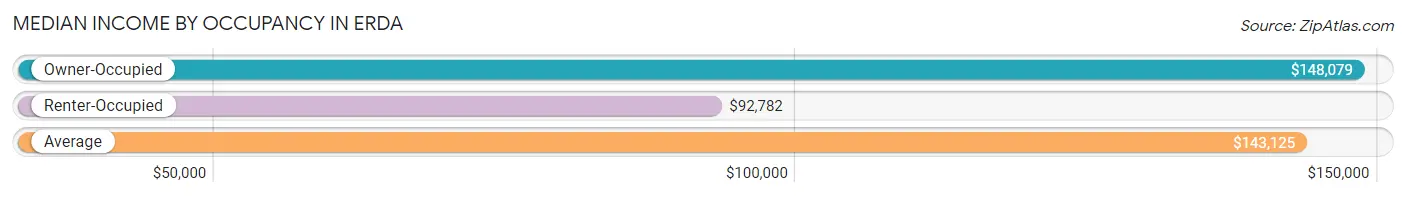
| Occupancy Type | # Households | Median Income |
| Owner-Occupied | 704 (89.2%) | $148,079 |
| Renter-Occupied | 85 (10.8%) | $92,782 |
| Average | 789 (100.0%) | $143,125 |
Occupancy by Householder Income Bracket in Erda
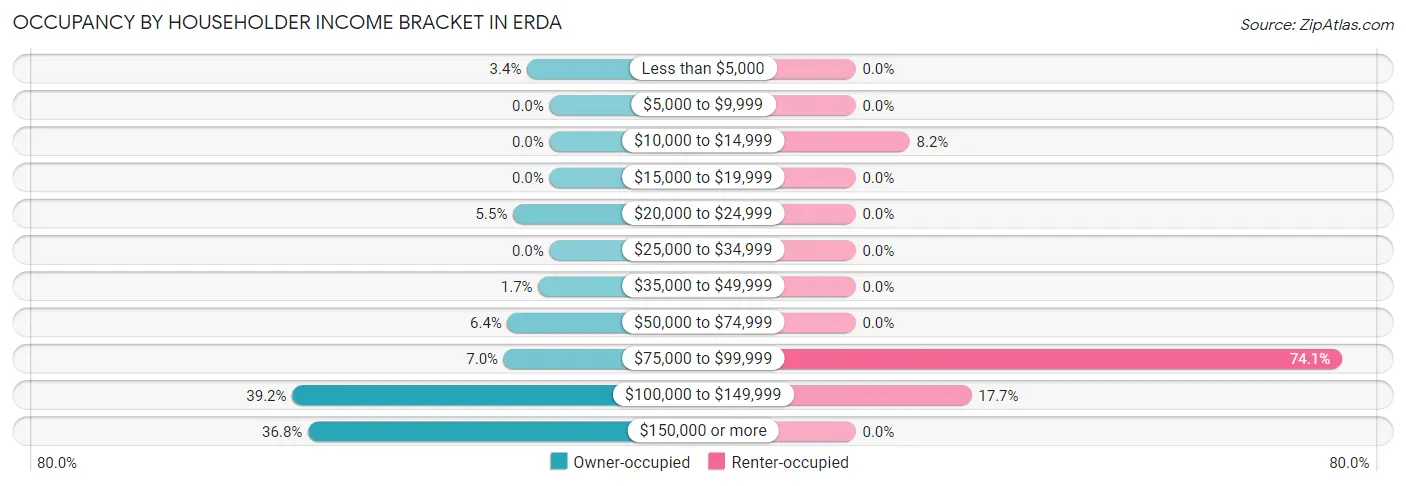
| Income Bracket | Owner-occupied | Renter-occupied |
| Less than $5,000 | 24 (3.4%) | 0 (0.0%) |
| $5,000 to $9,999 | 0 (0.0%) | 0 (0.0%) |
| $10,000 to $14,999 | 0 (0.0%) | 7 (8.2%) |
| $15,000 to $19,999 | 0 (0.0%) | 0 (0.0%) |
| $20,000 to $24,999 | 39 (5.5%) | 0 (0.0%) |
| $25,000 to $34,999 | 0 (0.0%) | 0 (0.0%) |
| $35,000 to $49,999 | 12 (1.7%) | 0 (0.0%) |
| $50,000 to $74,999 | 45 (6.4%) | 0 (0.0%) |
| $75,000 to $99,999 | 49 (7.0%) | 63 (74.1%) |
| $100,000 to $149,999 | 276 (39.2%) | 15 (17.6%) |
| $150,000 or more | 259 (36.8%) | 0 (0.0%) |
| Total | 704 (100.0%) | 85 (100.0%) |
Monthly Housing Cost Tiers in Erda
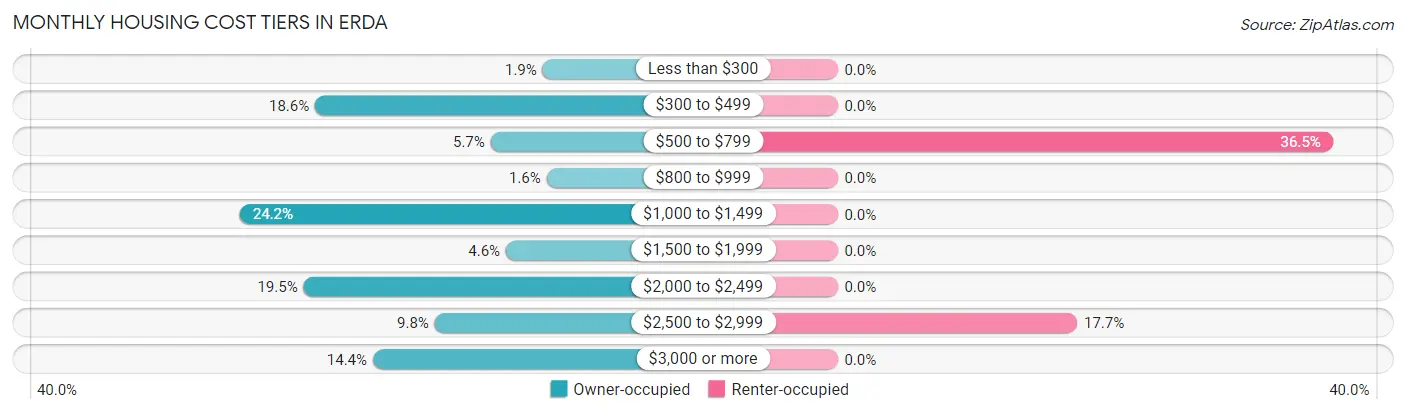
| Monthly Cost | Owner-occupied | Renter-occupied |
| Less than $300 | 13 (1.8%) | 0 (0.0%) |
| $300 to $499 | 131 (18.6%) | 0 (0.0%) |
| $500 to $799 | 40 (5.7%) | 31 (36.5%) |
| $800 to $999 | 11 (1.6%) | 0 (0.0%) |
| $1,000 to $1,499 | 170 (24.1%) | 0 (0.0%) |
| $1,500 to $1,999 | 32 (4.5%) | 0 (0.0%) |
| $2,000 to $2,499 | 137 (19.5%) | 0 (0.0%) |
| $2,500 to $2,999 | 69 (9.8%) | 15 (17.6%) |
| $3,000 or more | 101 (14.3%) | 0 (0.0%) |
| Total | 704 (100.0%) | 85 (100.0%) |
Physical Housing Characteristics in Erda
Housing Structures in Erda
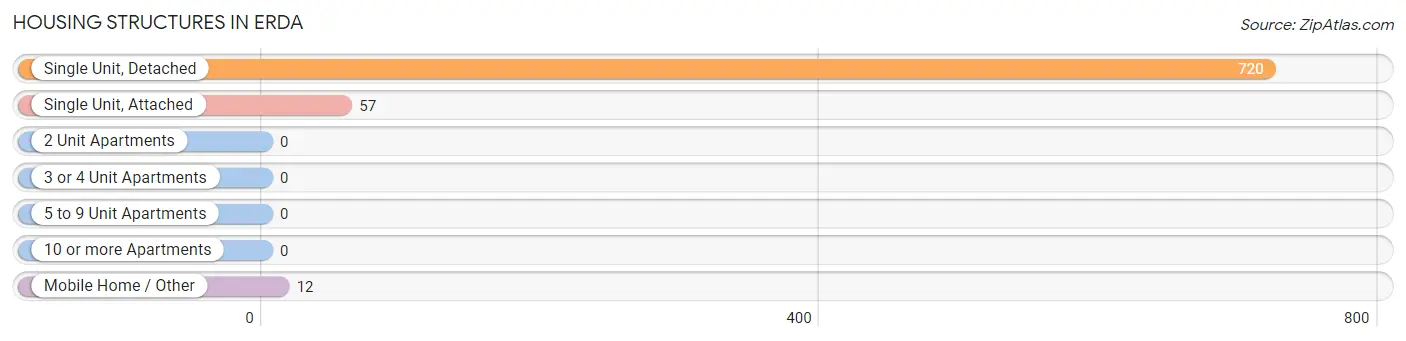
| Structure Type | # Housing Units | % Housing Units |
| Single Unit, Detached | 720 | 91.2% |
| Single Unit, Attached | 57 | 7.2% |
| 2 Unit Apartments | 0 | 0.0% |
| 3 or 4 Unit Apartments | 0 | 0.0% |
| 5 to 9 Unit Apartments | 0 | 0.0% |
| 10 or more Apartments | 0 | 0.0% |
| Mobile Home / Other | 12 | 1.5% |
| Total | 789 | 100.0% |
Housing Structures by Occupancy in Erda
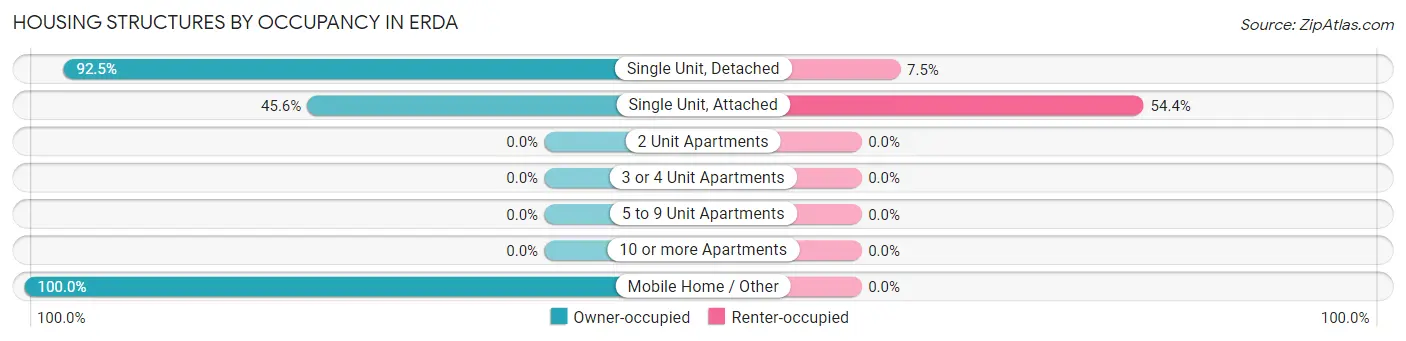
| Structure Type | Owner-occupied | Renter-occupied |
| Single Unit, Detached | 666 (92.5%) | 54 (7.5%) |
| Single Unit, Attached | 26 (45.6%) | 31 (54.4%) |
| 2 Unit Apartments | 0 (0.0%) | 0 (0.0%) |
| 3 or 4 Unit Apartments | 0 (0.0%) | 0 (0.0%) |
| 5 to 9 Unit Apartments | 0 (0.0%) | 0 (0.0%) |
| 10 or more Apartments | 0 (0.0%) | 0 (0.0%) |
| Mobile Home / Other | 12 (100.0%) | 0 (0.0%) |
| Total | 704 (89.2%) | 85 (10.8%) |
Housing Structures by Number of Rooms in Erda
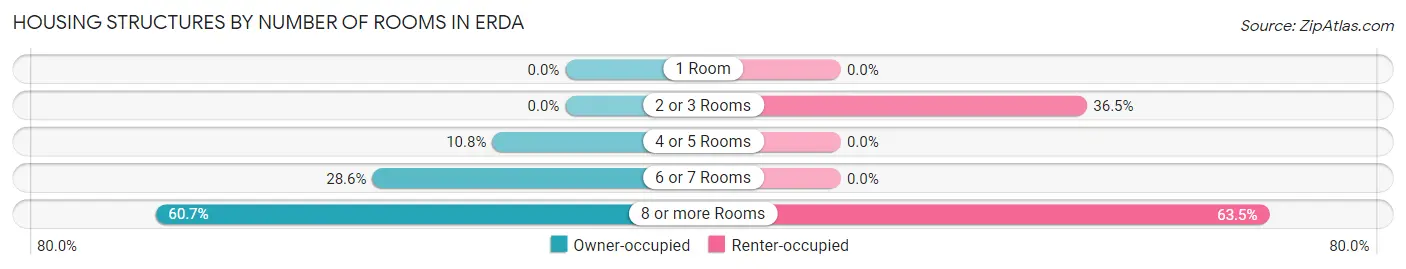
| Number of Rooms | Owner-occupied | Renter-occupied |
| 1 Room | 0 (0.0%) | 0 (0.0%) |
| 2 or 3 Rooms | 0 (0.0%) | 31 (36.5%) |
| 4 or 5 Rooms | 76 (10.8%) | 0 (0.0%) |
| 6 or 7 Rooms | 201 (28.5%) | 0 (0.0%) |
| 8 or more Rooms | 427 (60.7%) | 54 (63.5%) |
| Total | 704 (100.0%) | 85 (100.0%) |
Housing Structure by Heating Type in Erda
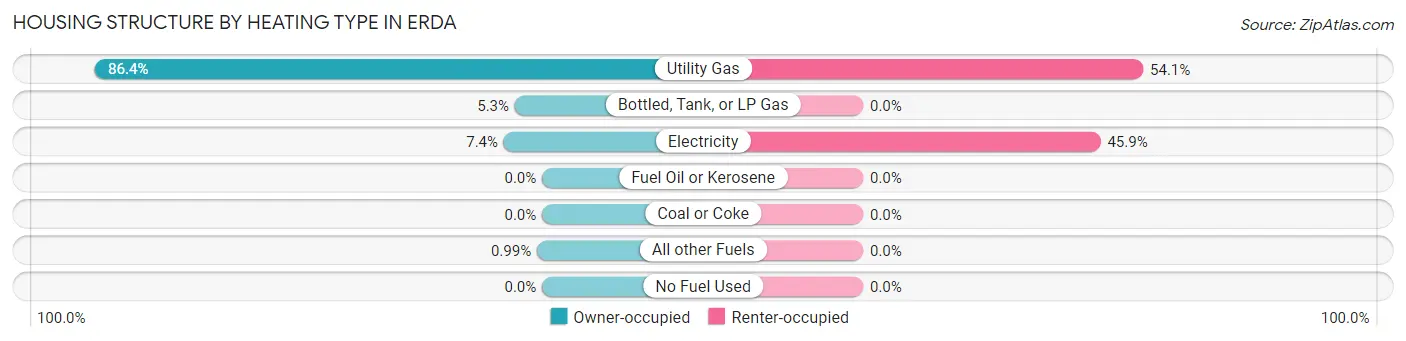
| Heating Type | Owner-occupied | Renter-occupied |
| Utility Gas | 608 (86.4%) | 46 (54.1%) |
| Bottled, Tank, or LP Gas | 37 (5.3%) | 0 (0.0%) |
| Electricity | 52 (7.4%) | 39 (45.9%) |
| Fuel Oil or Kerosene | 0 (0.0%) | 0 (0.0%) |
| Coal or Coke | 0 (0.0%) | 0 (0.0%) |
| All other Fuels | 7 (1.0%) | 0 (0.0%) |
| No Fuel Used | 0 (0.0%) | 0 (0.0%) |
| Total | 704 (100.0%) | 85 (100.0%) |
Household Vehicle Usage in Erda
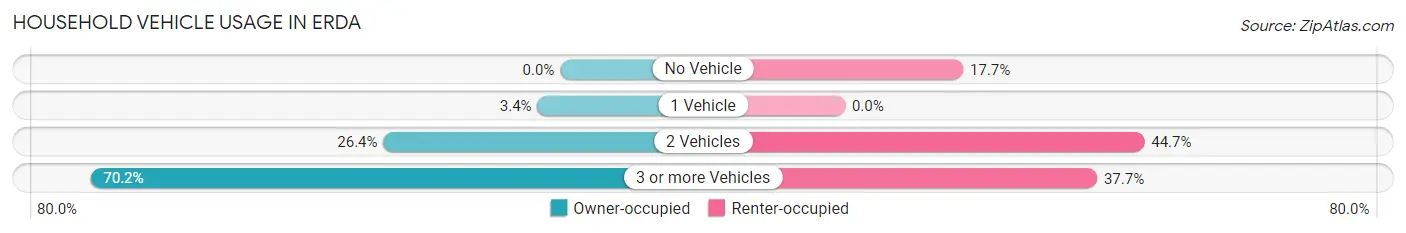
| Vehicles per Household | Owner-occupied | Renter-occupied |
| No Vehicle | 0 (0.0%) | 15 (17.6%) |
| 1 Vehicle | 24 (3.4%) | 0 (0.0%) |
| 2 Vehicles | 186 (26.4%) | 38 (44.7%) |
| 3 or more Vehicles | 494 (70.2%) | 32 (37.7%) |
| Total | 704 (100.0%) | 85 (100.0%) |
Real Estate & Mortgages in Erda
Real Estate and Mortgage Overview in Erda
| Characteristic | Without Mortgage | With Mortgage |
| Housing Units | 210 | 494 |
| Median Property Value | $461,900 | $594,700 |
| Median Household Income | $82,857 | $208 |
| Monthly Housing Costs | $464 | $101 |
| Real Estate Taxes | $3,241 | $6 |
Property Value by Mortgage Status in Erda
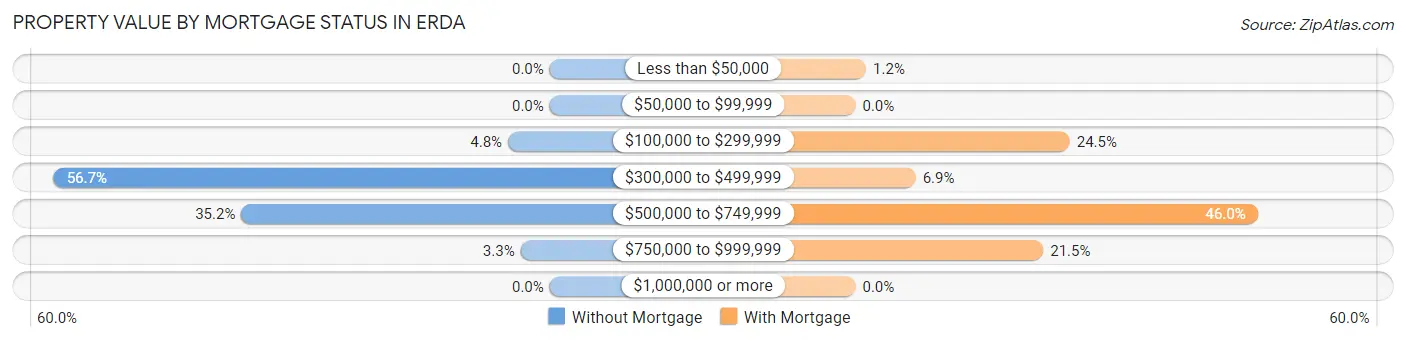
| Property Value | Without Mortgage | With Mortgage |
| Less than $50,000 | 0 (0.0%) | 6 (1.2%) |
| $50,000 to $99,999 | 0 (0.0%) | 0 (0.0%) |
| $100,000 to $299,999 | 10 (4.8%) | 121 (24.5%) |
| $300,000 to $499,999 | 119 (56.7%) | 34 (6.9%) |
| $500,000 to $749,999 | 74 (35.2%) | 227 (46.0%) |
| $750,000 to $999,999 | 7 (3.3%) | 106 (21.5%) |
| $1,000,000 or more | 0 (0.0%) | 0 (0.0%) |
| Total | 210 (100.0%) | 494 (100.0%) |
Household Income by Mortgage Status in Erda
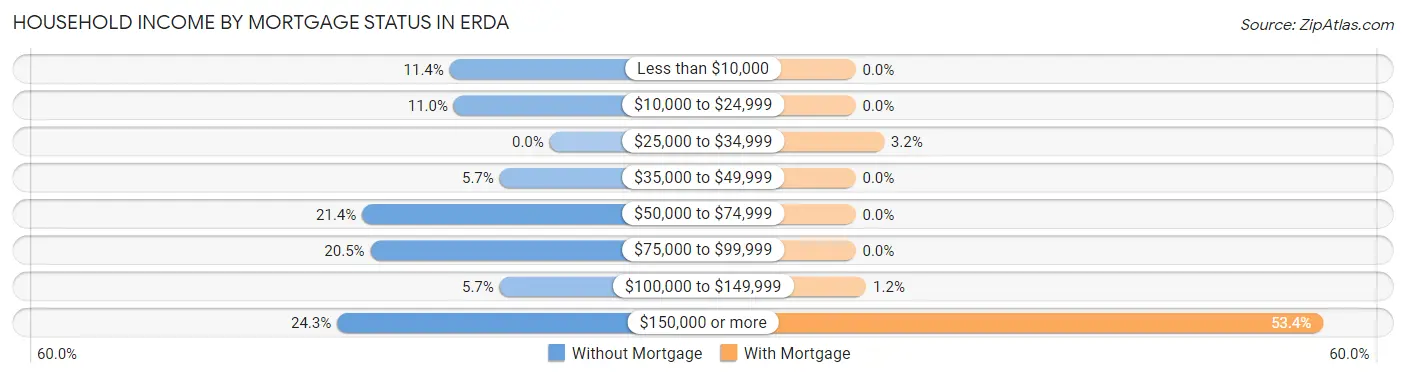
| Household Income | Without Mortgage | With Mortgage |
| Less than $10,000 | 24 (11.4%) | 0 (0.0%) |
| $10,000 to $24,999 | 23 (11.0%) | 0 (0.0%) |
| $25,000 to $34,999 | 0 (0.0%) | 16 (3.2%) |
| $35,000 to $49,999 | 12 (5.7%) | 0 (0.0%) |
| $50,000 to $74,999 | 45 (21.4%) | 0 (0.0%) |
| $75,000 to $99,999 | 43 (20.5%) | 0 (0.0%) |
| $100,000 to $149,999 | 12 (5.7%) | 6 (1.2%) |
| $150,000 or more | 51 (24.3%) | 264 (53.4%) |
| Total | 210 (100.0%) | 494 (100.0%) |
Property Value to Household Income Ratio in Erda
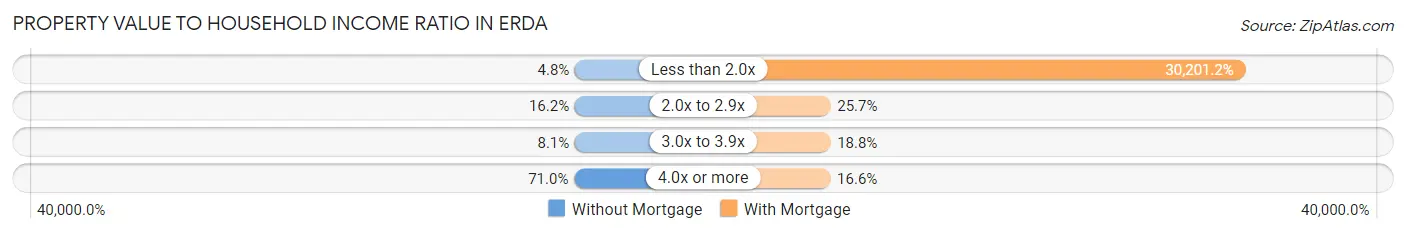
| Value-to-Income Ratio | Without Mortgage | With Mortgage |
| Less than 2.0x | 10 (4.8%) | 149,194 (30,201.2%) |
| 2.0x to 2.9x | 34 (16.2%) | 127 (25.7%) |
| 3.0x to 3.9x | 17 (8.1%) | 93 (18.8%) |
| 4.0x or more | 149 (71.0%) | 82 (16.6%) |
| Total | 210 (100.0%) | 494 (100.0%) |
Real Estate Taxes by Mortgage Status in Erda
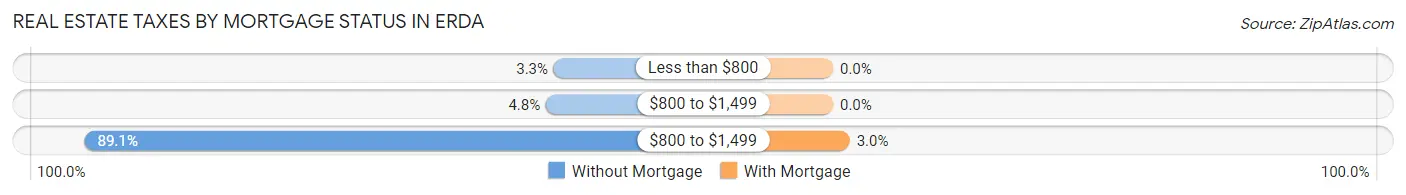
| Property Taxes | Without Mortgage | With Mortgage |
| Less than $800 | 7 (3.3%) | 0 (0.0%) |
| $800 to $1,499 | 10 (4.8%) | 0 (0.0%) |
| $800 to $1,499 | 187 (89.0%) | 15 (3.0%) |
| Total | 210 (100.0%) | 494 (100.0%) |
Health & Disability in Erda
Health Insurance Coverage by Age in Erda
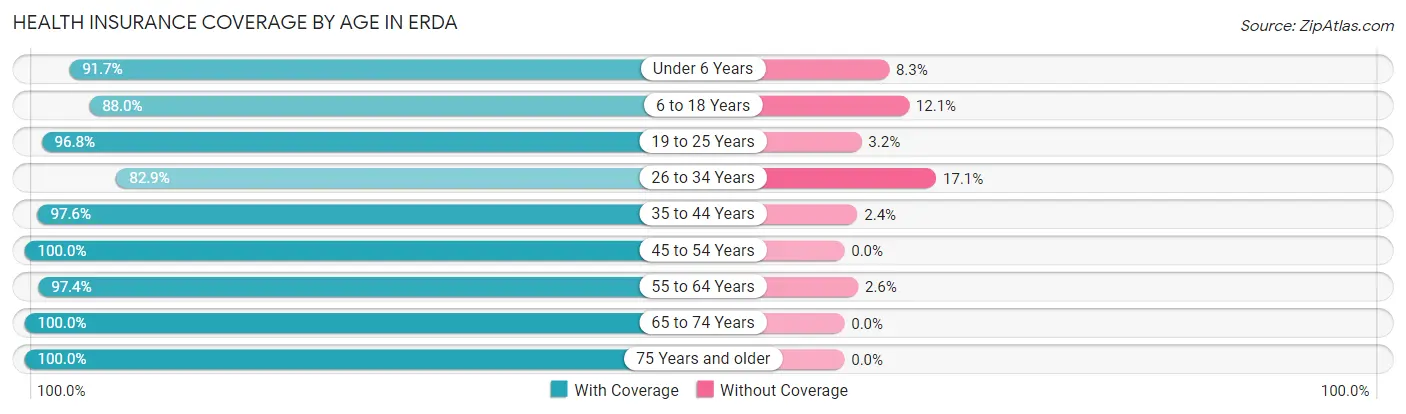
| Age Bracket | With Coverage | Without Coverage |
| Under 6 Years | 253 (91.7%) | 23 (8.3%) |
| 6 to 18 Years | 642 (87.9%) | 88 (12.0%) |
| 19 to 25 Years | 394 (96.8%) | 13 (3.2%) |
| 26 to 34 Years | 184 (82.9%) | 38 (17.1%) |
| 35 to 44 Years | 321 (97.6%) | 8 (2.4%) |
| 45 to 54 Years | 323 (100.0%) | 0 (0.0%) |
| 55 to 64 Years | 457 (97.4%) | 12 (2.6%) |
| 65 to 74 Years | 212 (100.0%) | 0 (0.0%) |
| 75 Years and older | 102 (100.0%) | 0 (0.0%) |
| Total | 2,888 (94.1%) | 182 (5.9%) |
Health Insurance Coverage by Citizenship Status in Erda
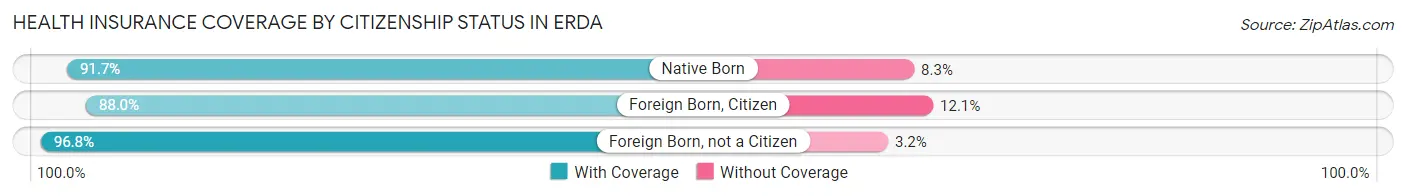
| Citizenship Status | With Coverage | Without Coverage |
| Native Born | 253 (91.7%) | 23 (8.3%) |
| Foreign Born, Citizen | 642 (87.9%) | 88 (12.0%) |
| Foreign Born, not a Citizen | 394 (96.8%) | 13 (3.2%) |
Health Insurance Coverage by Household Income in Erda
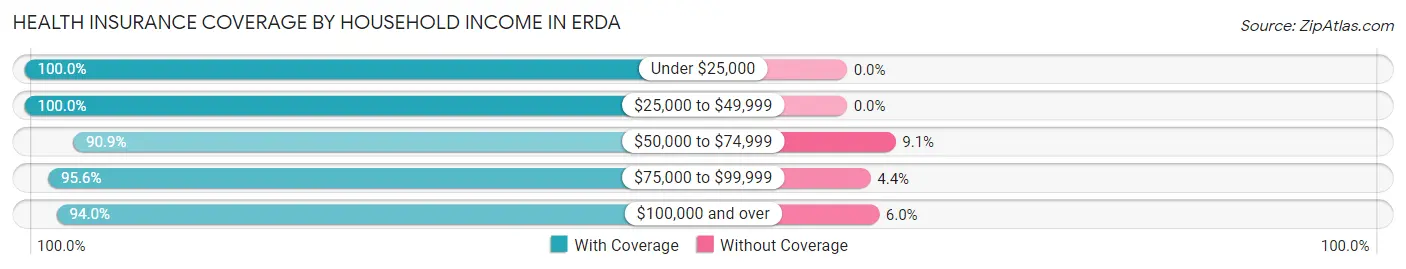
| Household Income | With Coverage | Without Coverage |
| Under $25,000 | 116 (100.0%) | 0 (0.0%) |
| $25,000 to $49,999 | 22 (100.0%) | 0 (0.0%) |
| $50,000 to $74,999 | 90 (90.9%) | 9 (9.1%) |
| $75,000 to $99,999 | 347 (95.6%) | 16 (4.4%) |
| $100,000 and over | 2,313 (94.0%) | 148 (6.0%) |
Public vs Private Health Insurance Coverage by Age in Erda
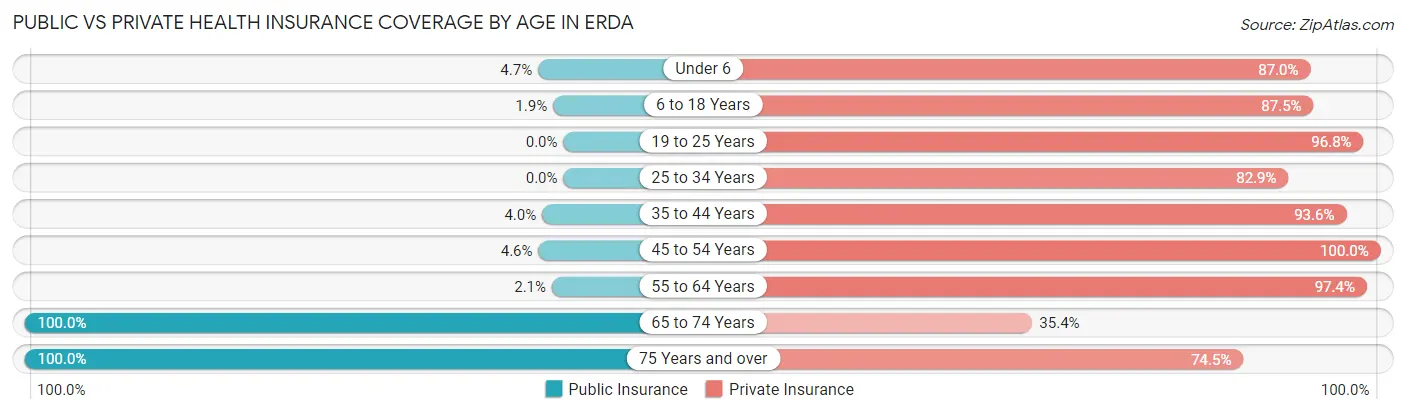
| Age Bracket | Public Insurance | Private Insurance |
| Under 6 | 13 (4.7%) | 240 (87.0%) |
| 6 to 18 Years | 14 (1.9%) | 639 (87.5%) |
| 19 to 25 Years | 0 (0.0%) | 394 (96.8%) |
| 25 to 34 Years | 0 (0.0%) | 184 (82.9%) |
| 35 to 44 Years | 13 (4.0%) | 308 (93.6%) |
| 45 to 54 Years | 15 (4.6%) | 323 (100.0%) |
| 55 to 64 Years | 10 (2.1%) | 457 (97.4%) |
| 65 to 74 Years | 212 (100.0%) | 75 (35.4%) |
| 75 Years and over | 102 (100.0%) | 76 (74.5%) |
| Total | 379 (12.3%) | 2,696 (87.8%) |
Disability Status by Sex by Age in Erda
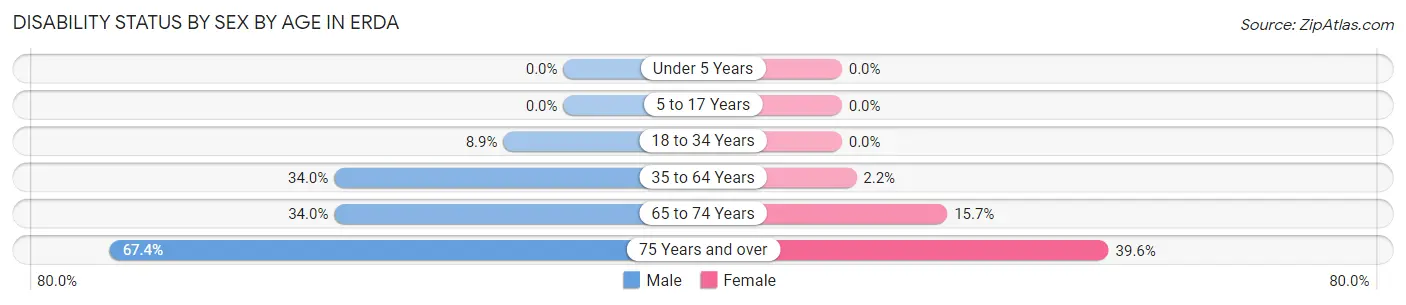
| Age Bracket | Male | Female |
| Under 5 Years | 0 (0.0%) | 0 (0.0%) |
| 5 to 17 Years | 0 (0.0%) | 0 (0.0%) |
| 18 to 34 Years | 28 (8.9%) | 0 (0.0%) |
| 35 to 64 Years | 177 (34.0%) | 13 (2.2%) |
| 65 to 74 Years | 33 (34.0%) | 18 (15.7%) |
| 75 Years and over | 33 (67.3%) | 21 (39.6%) |
Disability Class by Sex by Age in Erda
Disability Class: Hearing Difficulty
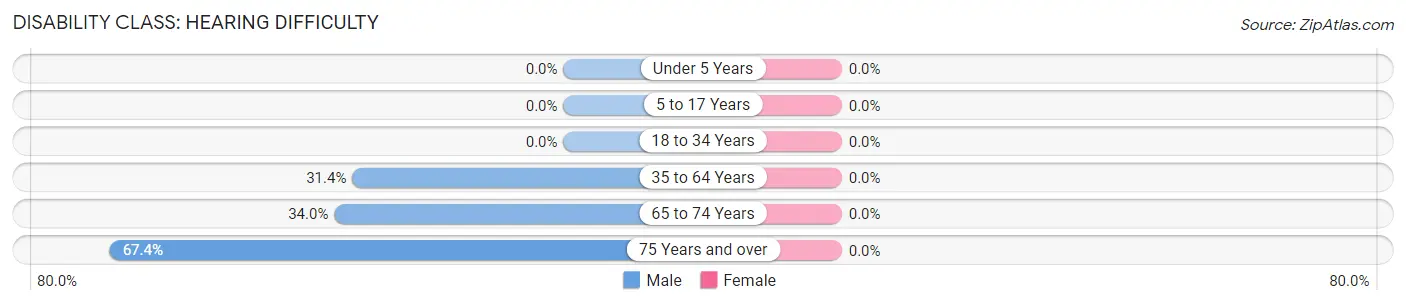
| Age Bracket | Male | Female |
| Under 5 Years | 0 (0.0%) | 0 (0.0%) |
| 5 to 17 Years | 0 (0.0%) | 0 (0.0%) |
| 18 to 34 Years | 0 (0.0%) | 0 (0.0%) |
| 35 to 64 Years | 163 (31.4%) | 0 (0.0%) |
| 65 to 74 Years | 33 (34.0%) | 0 (0.0%) |
| 75 Years and over | 33 (67.3%) | 0 (0.0%) |
Disability Class: Vision Difficulty
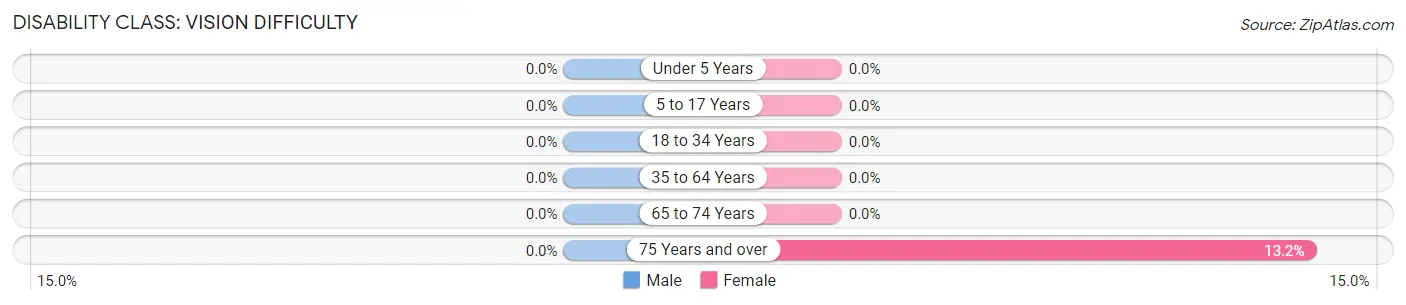
| Age Bracket | Male | Female |
| Under 5 Years | 0 (0.0%) | 0 (0.0%) |
| 5 to 17 Years | 0 (0.0%) | 0 (0.0%) |
| 18 to 34 Years | 0 (0.0%) | 0 (0.0%) |
| 35 to 64 Years | 0 (0.0%) | 0 (0.0%) |
| 65 to 74 Years | 0 (0.0%) | 0 (0.0%) |
| 75 Years and over | 0 (0.0%) | 7 (13.2%) |
Disability Class: Cognitive Difficulty
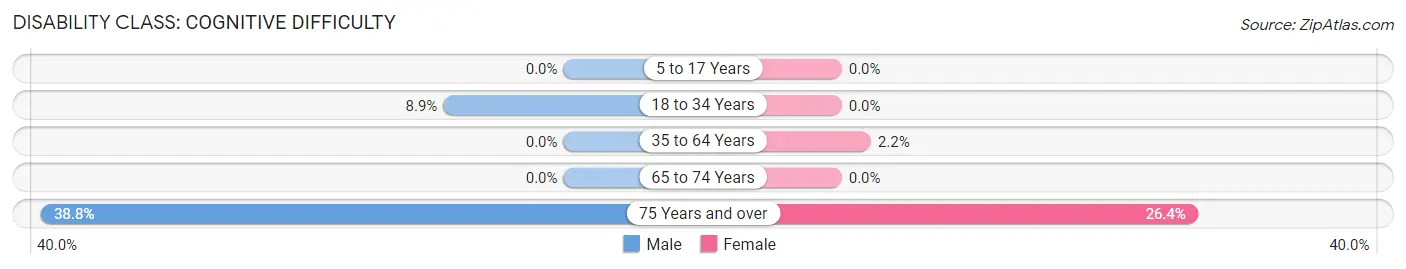
| Age Bracket | Male | Female |
| 5 to 17 Years | 0 (0.0%) | 0 (0.0%) |
| 18 to 34 Years | 28 (8.9%) | 0 (0.0%) |
| 35 to 64 Years | 0 (0.0%) | 13 (2.2%) |
| 65 to 74 Years | 0 (0.0%) | 0 (0.0%) |
| 75 Years and over | 19 (38.8%) | 14 (26.4%) |
Disability Class: Ambulatory Difficulty
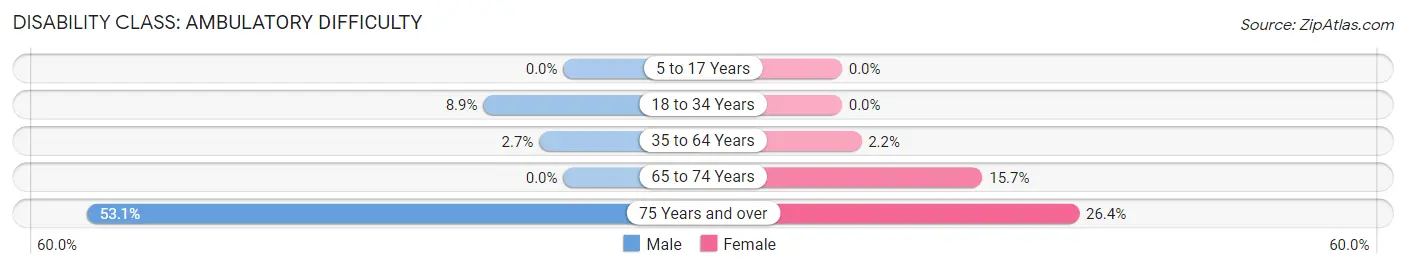
| Age Bracket | Male | Female |
| 5 to 17 Years | 0 (0.0%) | 0 (0.0%) |
| 18 to 34 Years | 28 (8.9%) | 0 (0.0%) |
| 35 to 64 Years | 14 (2.7%) | 13 (2.2%) |
| 65 to 74 Years | 0 (0.0%) | 18 (15.7%) |
| 75 Years and over | 26 (53.1%) | 14 (26.4%) |
Disability Class: Self-Care Difficulty
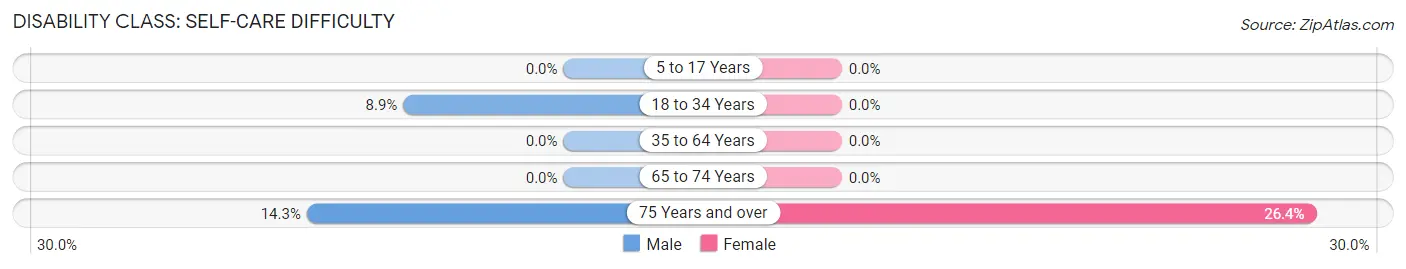
| Age Bracket | Male | Female |
| 5 to 17 Years | 0 (0.0%) | 0 (0.0%) |
| 18 to 34 Years | 28 (8.9%) | 0 (0.0%) |
| 35 to 64 Years | 0 (0.0%) | 0 (0.0%) |
| 65 to 74 Years | 0 (0.0%) | 0 (0.0%) |
| 75 Years and over | 7 (14.3%) | 14 (26.4%) |
Technology Access in Erda
Computing Device Access in Erda
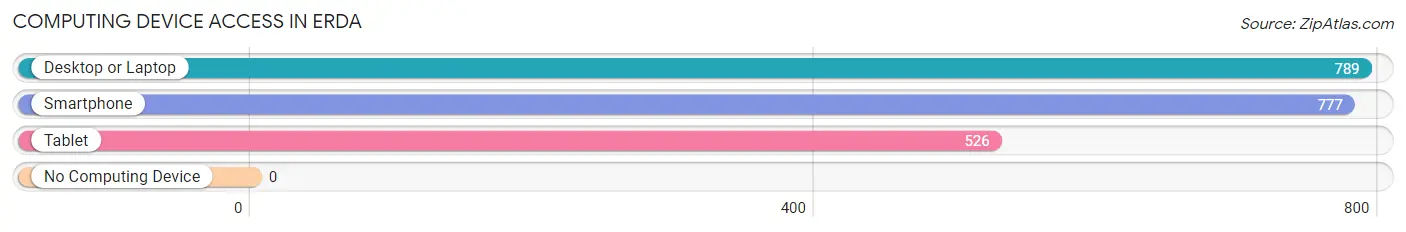
| Device Type | # Households | % Households |
| Desktop or Laptop | 789 | 100.0% |
| Smartphone | 777 | 98.5% |
| Tablet | 526 | 66.7% |
| No Computing Device | 0 | 0.0% |
| Total | 789 | 100.0% |
Internet Access in Erda
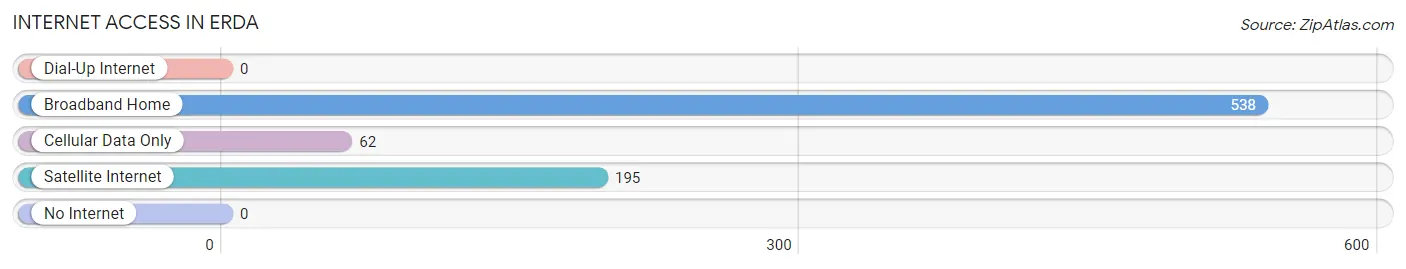
| Internet Type | # Households | % Households |
| Dial-Up Internet | 0 | 0.0% |
| Broadband Home | 538 | 68.2% |
| Cellular Data Only | 62 | 7.9% |
| Satellite Internet | 195 | 24.7% |
| No Internet | 0 | 0.0% |
| Total | 789 | 100.0% |
Erda Summary
Erda is a small unincorporated community located in Tooele County, Utah. It is situated in the western part of the state, approximately 25 miles west of Salt Lake City. The population of Erda was estimated to be 1,072 in 2019.
History
Erda was first settled in 1854 by a group of Mormon pioneers led by William H. Hooper. The settlement was originally known as Hooper’s Fort, but was later renamed Erda after the daughter of one of the settlers. The town was officially incorporated in 1891.
Geography
Erda is located in the western part of Tooele County, Utah. It is situated at an elevation of 4,845 feet above sea level. The town is located on the western edge of the Great Salt Lake Desert, and is surrounded by the Oquirrh Mountains to the east and the Stansbury Mountains to the west.
Climate
Erda has a semi-arid climate, with hot summers and cold winters. The average high temperature in July is 90°F, and the average low temperature in January is 18°F. The area receives an average of 11 inches of precipitation per year, with most of it falling in the form of snow during the winter months.
Economy
Erda’s economy is largely based on agriculture and mining. The town is home to several farms, which produce a variety of crops including hay, wheat, and corn. The area is also home to several mining operations, which extract minerals such as copper, gold, and silver.
Demographics
As of 2019, the population of Erda was estimated to be 1,072. The racial makeup of the town was 94.3% White, 0.9% African American, 0.7% Native American, 0.7% Asian, 0.2% Pacific Islander, and 2.2% from other races. The median household income in Erda was $50,938 in 2019.
Conclusion
Erda is a small unincorporated community located in Tooele County, Utah. It was first settled in 1854 by a group of Mormon pioneers, and was officially incorporated in 1891. The town is situated at an elevation of 4,845 feet above sea level, and has a semi-arid climate. The economy of Erda is largely based on agriculture and mining, and the population was estimated to be 1,072 in 2019.
Common Questions
What is Per Capita Income in Erda?
Per Capita income in Erda is $35,372.
What is the Median Family Income in Erda?
Median Family Income in Erda is $147,541.
What is the Median Household income in Erda?
Median Household Income in Erda is $143,125.
What is Income or Wage Gap in Erda?
Income or Wage Gap in Erda is 47.4%.
Women in Erda earn 52.6 cents for every dollar earned by a man.
What is Inequality or Gini Index in Erda?
Inequality or Gini Index in Erda is 0.27.
What is the Total Population of Erda?
Total Population of Erda is 3,124.
What is the Total Male Population of Erda?
Total Male Population of Erda is 1,589.
What is the Total Female Population of Erda?
Total Female Population of Erda is 1,535.
What is the Ratio of Males per 100 Females in Erda?
There are 103.52 Males per 100 Females in Erda.
What is the Ratio of Females per 100 Males in Erda?
There are 96.60 Females per 100 Males in Erda.
What is the Median Population Age in Erda?
Median Population Age in Erda is 29.0 Years.
What is the Average Family Size in Erda
Average Family Size in Erda is 4.0 People.
What is the Average Household Size in Erda
Average Household Size in Erda is 3.9 People.
How Large is the Labor Force in Erda?
There are 1,882 People in the Labor Forcein in Erda.
What is the Percentage of People in the Labor Force in Erda?
77.4% of People are in the Labor Force in Erda.
What is the Unemployment Rate in Erda?
Unemployment Rate in Erda is 14.0%.