St. Francis County, AR Map & Demographics
St. Francis County Map
St. Francis County Overview
$20,991
PER CAPITA INCOME
$47,612
AVG FAMILY INCOME
$39,822
AVG HOUSEHOLD INCOME
7.0%
WAGE / INCOME GAP [ % ]
93.0¢/ $1
WAGE / INCOME GAP [ $ ]
$8,530
FAMILY INCOME DEFICIT
0.50
INEQUALITY / GINI INDEX
23,138
TOTAL POPULATION
12,793
MALE POPULATION
10,345
FEMALE POPULATION
123.66
MALES / 100 FEMALES
80.86
FEMALES / 100 MALES
38.8
MEDIAN AGE
3.2
AVG FAMILY SIZE
2.5
AVG HOUSEHOLD SIZE
8,550
LABOR FORCE [ PEOPLE ]
45.7%
PERCENT IN LABOR FORCE
6.6%
UNEMPLOYMENT RATE
St. Francis County Area Codes
Income in St. Francis County
Income Overview in St. Francis County
Per Capita Income in St. Francis County is $20,991, while median incomes of families and households are $47,612 and $39,822 respectively.
| Characteristic | Number | Measure |
| Per Capita Income | 23,138 | $20,991 |
| Median Family Income | 5,054 | $47,612 |
| Mean Family Income | 5,054 | $60,976 |
| Median Household Income | 8,102 | $39,822 |
| Mean Household Income | 8,102 | $54,833 |
| Income Deficit | 5,054 | $8,530 |
| Wage / Income Gap (%) | 23,138 | 7.01% |
| Wage / Income Gap ($) | 23,138 | 92.99¢ per $1 |
| Gini / Inequality Index | 23,138 | 0.50 |
Earnings by Sex in St. Francis County
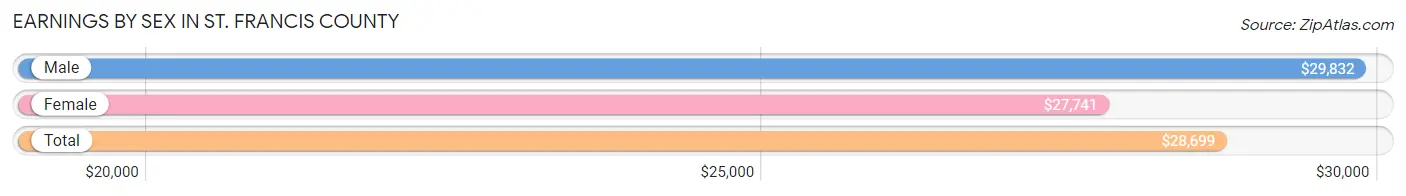
Average Earnings in St. Francis County are $28,699, $29,832 for men and $27,741 for women, a difference of 7.0%.
| Sex | Number | Average Earnings |
| Male | 5,360 (56.7%) | $29,832 |
| Female | 4,095 (43.3%) | $27,741 |
| Total | 9,455 (100.0%) | $28,699 |
Earnings by Sex by Income Bracket in St. Francis County
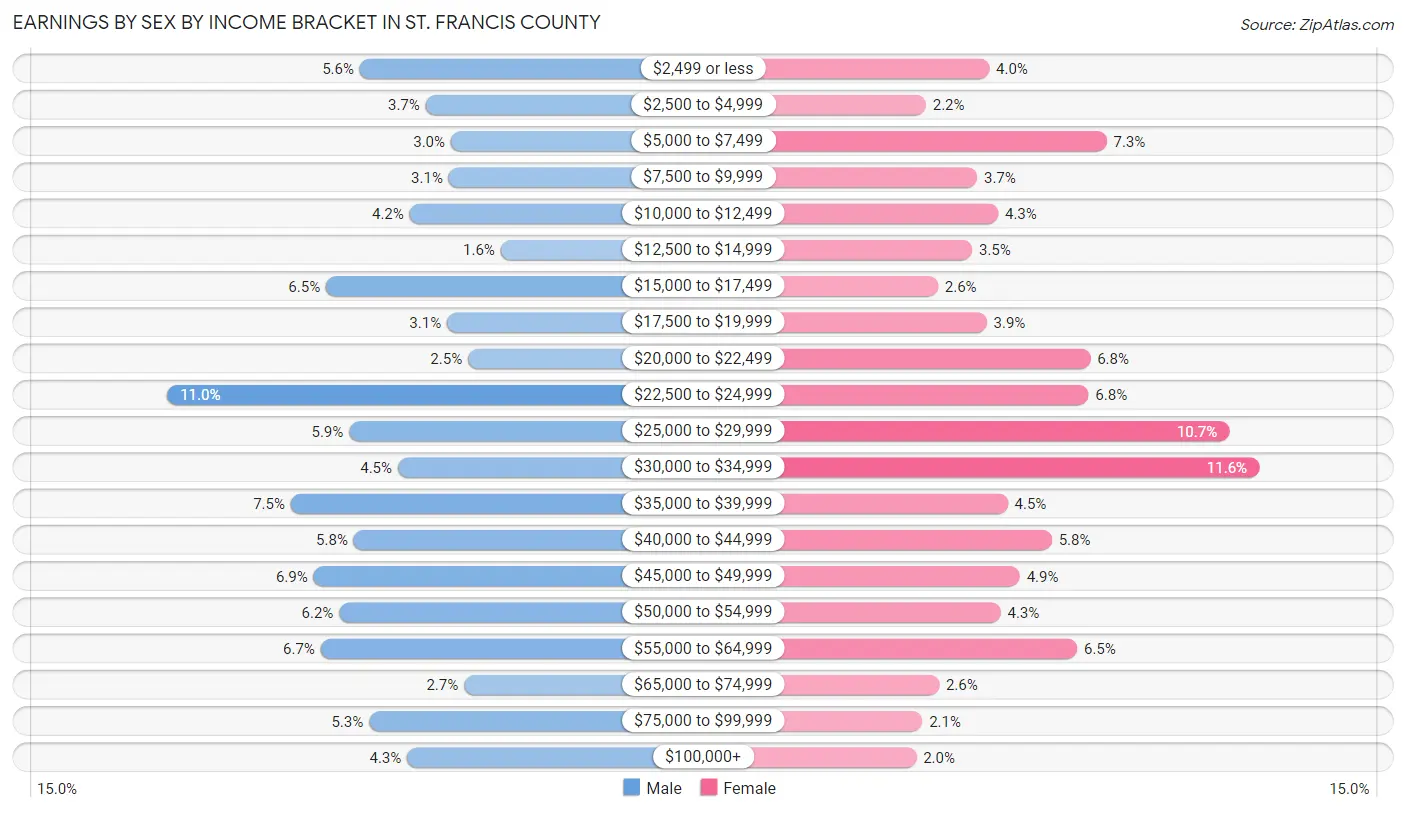
The most common earnings brackets in St. Francis County are $22,500 to $24,999 for men (589 | 11.0%) and $30,000 to $34,999 for women (474 | 11.6%).
| Income | Male | Female |
| $2,499 or less | 299 (5.6%) | 164 (4.0%) |
| $2,500 to $4,999 | 200 (3.7%) | 91 (2.2%) |
| $5,000 to $7,499 | 162 (3.0%) | 299 (7.3%) |
| $7,500 to $9,999 | 165 (3.1%) | 150 (3.7%) |
| $10,000 to $12,499 | 224 (4.2%) | 174 (4.3%) |
| $12,500 to $14,999 | 87 (1.6%) | 144 (3.5%) |
| $15,000 to $17,499 | 350 (6.5%) | 105 (2.6%) |
| $17,500 to $19,999 | 168 (3.1%) | 161 (3.9%) |
| $20,000 to $22,499 | 136 (2.5%) | 280 (6.8%) |
| $22,500 to $24,999 | 589 (11.0%) | 278 (6.8%) |
| $25,000 to $29,999 | 315 (5.9%) | 440 (10.7%) |
| $30,000 to $34,999 | 242 (4.5%) | 474 (11.6%) |
| $35,000 to $39,999 | 403 (7.5%) | 185 (4.5%) |
| $40,000 to $44,999 | 308 (5.8%) | 236 (5.8%) |
| $45,000 to $49,999 | 369 (6.9%) | 199 (4.9%) |
| $50,000 to $54,999 | 330 (6.2%) | 177 (4.3%) |
| $55,000 to $64,999 | 358 (6.7%) | 265 (6.5%) |
| $65,000 to $74,999 | 142 (2.6%) | 106 (2.6%) |
| $75,000 to $99,999 | 285 (5.3%) | 87 (2.1%) |
| $100,000+ | 228 (4.3%) | 80 (1.9%) |
| Total | 5,360 (100.0%) | 4,095 (100.0%) |
Earnings by Sex by Educational Attainment in St. Francis County
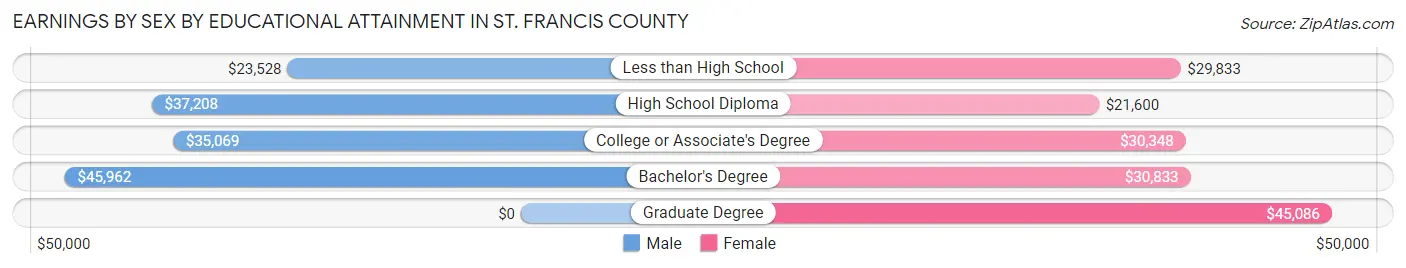
Average earnings in St. Francis County are $32,917 for men and $29,716 for women, a difference of 9.7%. Men with an educational attainment of bachelor's degree enjoy the highest average annual earnings of $45,962, while those with less than high school education earn the least with $23,528. Women with an educational attainment of graduate degree earn the most with the average annual earnings of $45,086, while those with high school diploma education have the smallest earnings of $21,600.
| Educational Attainment | Male Income | Female Income |
| Less than High School | $23,528 | $29,833 |
| High School Diploma | $37,208 | $21,600 |
| College or Associate's Degree | $35,069 | $30,348 |
| Bachelor's Degree | $45,962 | $30,833 |
| Graduate Degree | - | - |
| Total | $32,917 | $29,716 |
Family Income in St. Francis County
Family Income Brackets in St. Francis County
According to the St. Francis County family income data, there are 1,051 families falling into the $50,000 to $74,999 income range, which is the most common income bracket and makes up 20.8% of all families. Conversely, the $200,000+ income bracket is the least frequent group with only 96 families (1.9%) belonging to this category.
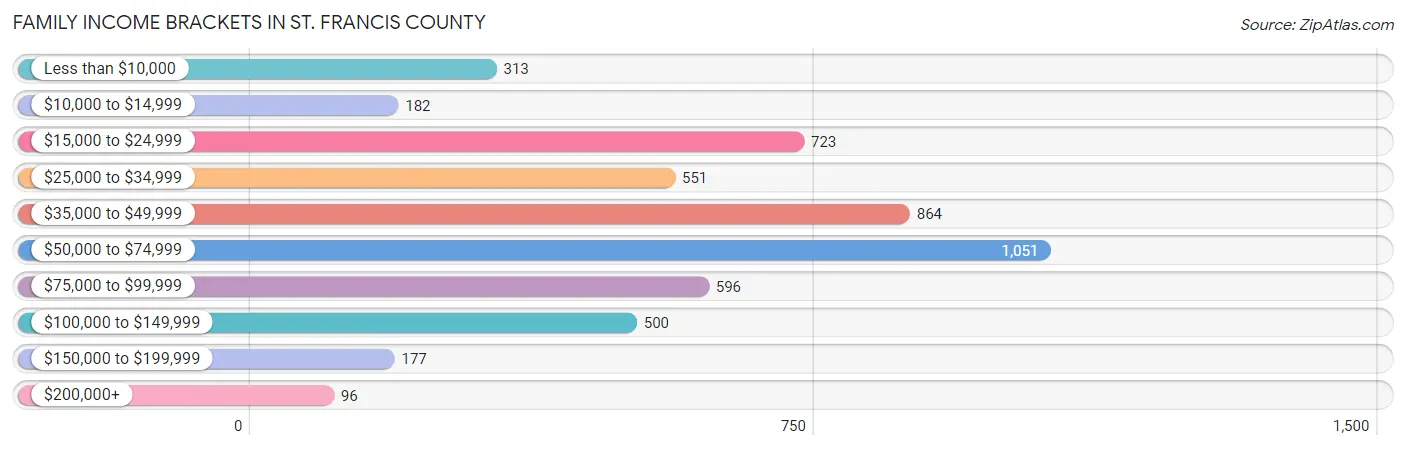
| Income Bracket | # Families | % Families |
| Less than $10,000 | 313 | 6.2% |
| $10,000 to $14,999 | 182 | 3.6% |
| $15,000 to $24,999 | 723 | 14.3% |
| $25,000 to $34,999 | 551 | 10.9% |
| $35,000 to $49,999 | 864 | 17.1% |
| $50,000 to $74,999 | 1,051 | 20.8% |
| $75,000 to $99,999 | 596 | 11.8% |
| $100,000 to $149,999 | 500 | 9.9% |
| $150,000 to $199,999 | 177 | 3.5% |
| $200,000+ | 96 | 1.9% |
Family Income by Famaliy Size in St. Francis County
6-person families (158 | 3.1%) account for the highest median family income in St. Francis County with $55,844 per family, while 2-person families (2,445 | 48.4%) have the highest median income of $24,849 per family member.
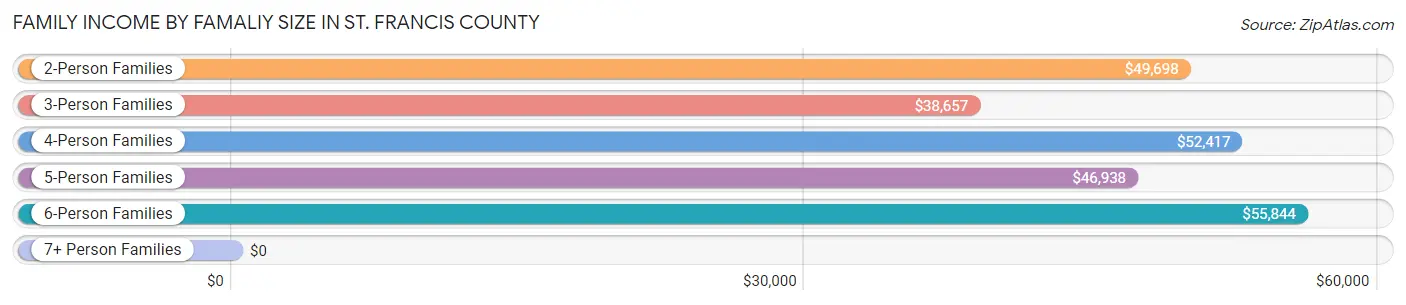
| Income Bracket | # Families | Median Income |
| 2-Person Families | 2,445 (48.4%) | $49,698 |
| 3-Person Families | 1,361 (26.9%) | $38,657 |
| 4-Person Families | 725 (14.3%) | $52,417 |
| 5-Person Families | 353 (7.0%) | $46,938 |
| 6-Person Families | 158 (3.1%) | $55,844 |
| 7+ Person Families | 12 (0.2%) | $0 |
| Total | 5,054 (100.0%) | $47,612 |
Family Income by Number of Earners in St. Francis County
The median family income in St. Francis County is $47,612, with families comprising 3+ earners (287) having the highest median family income of $103,375, while families with no earners (1,045) have the lowest median family income of $21,936, accounting for 5.7% and 20.7% of families, respectively.
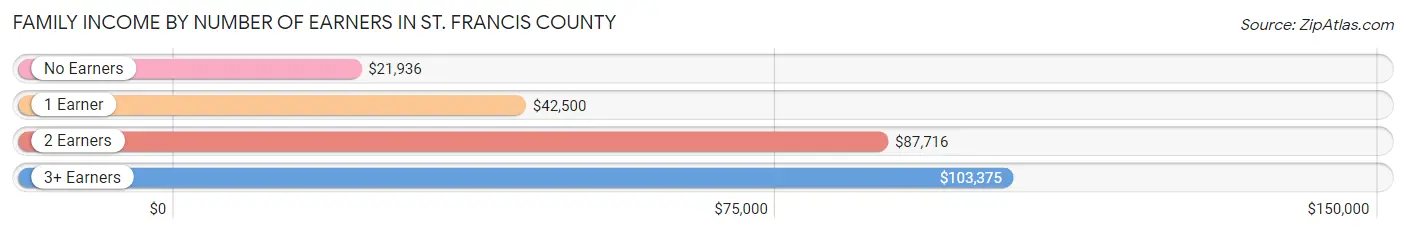
| Number of Earners | # Families | Median Income |
| No Earners | 1,045 (20.7%) | $21,936 |
| 1 Earner | 2,518 (49.8%) | $42,500 |
| 2 Earners | 1,204 (23.8%) | $87,716 |
| 3+ Earners | 287 (5.7%) | $103,375 |
| Total | 5,054 (100.0%) | $47,612 |
Household Income in St. Francis County
Household Income Brackets in St. Francis County
With 1,547 households falling in the category, the $35,000 to $49,999 income range is the most frequent in St. Francis County, accounting for 19.1% of all households. In contrast, only 138 households (1.7%) fall into the $200,000+ income bracket, making it the least populous group.

| Income Bracket | # Households | % Households |
| Less than $10,000 | 778 | 9.6% |
| $10,000 to $14,999 | 786 | 9.7% |
| $15,000 to $24,999 | 1,191 | 14.7% |
| $25,000 to $34,999 | 875 | 10.8% |
| $35,000 to $49,999 | 1,547 | 19.1% |
| $50,000 to $74,999 | 1,232 | 15.2% |
| $75,000 to $99,999 | 729 | 9.0% |
| $100,000 to $149,999 | 640 | 7.9% |
| $150,000 to $199,999 | 178 | 2.2% |
| $200,000+ | 138 | 1.7% |
Household Income by Householder Age in St. Francis County
The median household income in St. Francis County is $39,822, with the highest median household income of $46,531 found in the 25 to 44 years age bracket for the primary householder. A total of 2,706 households (33.4%) fall into this category. Meanwhile, the 15 to 24 years age bracket for the primary householder has the lowest median household income of $30,404, with 261 households (3.2%) in this group.
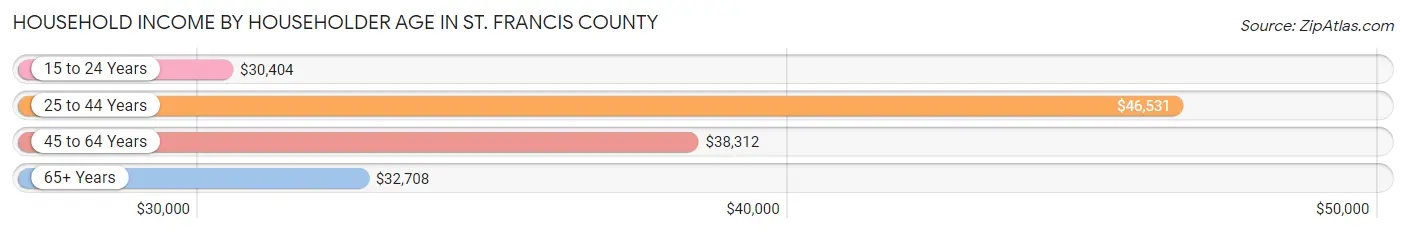
| Income Bracket | # Households | Median Income |
| 15 to 24 Years | 261 (3.2%) | $30,404 |
| 25 to 44 Years | 2,706 (33.4%) | $46,531 |
| 45 to 64 Years | 2,733 (33.7%) | $38,312 |
| 65+ Years | 2,402 (29.6%) | $32,708 |
| Total | 8,102 (100.0%) | $39,822 |
Poverty in St. Francis County
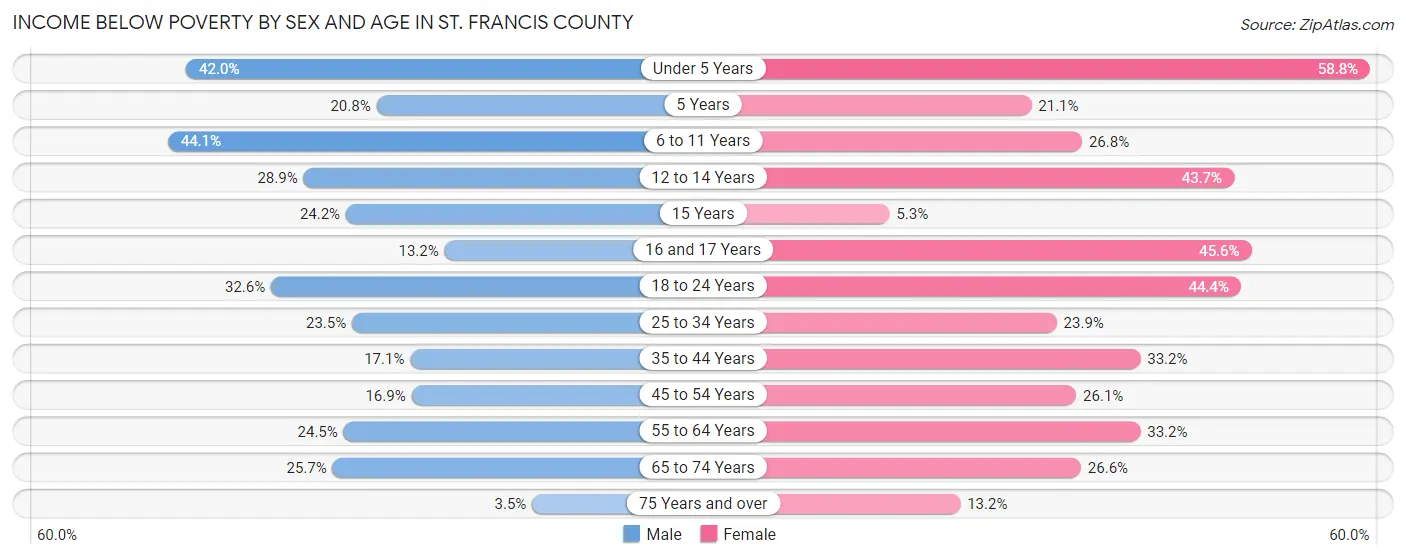
Income Below Poverty by Sex and Age in St. Francis County
With 25.1% poverty level for males and 31.0% for females among the residents of St. Francis County, 6 to 11 year old males and under 5 year old females are the most vulnerable to poverty, with 370 males (44.1%) and 394 females (58.8%) in their respective age groups living below the poverty level.
| Age Bracket | Male | Female |
| Under 5 Years | 292 (42.0%) | 394 (58.8%) |
| 5 Years | 36 (20.8%) | 19 (21.1%) |
| 6 to 11 Years | 370 (44.1%) | 222 (26.8%) |
| 12 to 14 Years | 101 (28.9%) | 148 (43.7%) |
| 15 Years | 46 (24.2%) | 6 (5.3%) |
| 16 and 17 Years | 41 (13.2%) | 78 (45.6%) |
| 18 to 24 Years | 303 (32.6%) | 399 (44.4%) |
| 25 to 34 Years | 388 (23.5%) | 286 (23.9%) |
| 35 to 44 Years | 202 (17.1%) | 359 (33.2%) |
| 45 to 54 Years | 129 (16.9%) | 314 (26.1%) |
| 55 to 64 Years | 275 (24.5%) | 483 (33.2%) |
| 65 to 74 Years | 277 (25.7%) | 356 (26.6%) |
| 75 Years and over | 21 (3.5%) | 114 (13.2%) |
| Total | 2,481 (25.1%) | 3,178 (31.0%) |
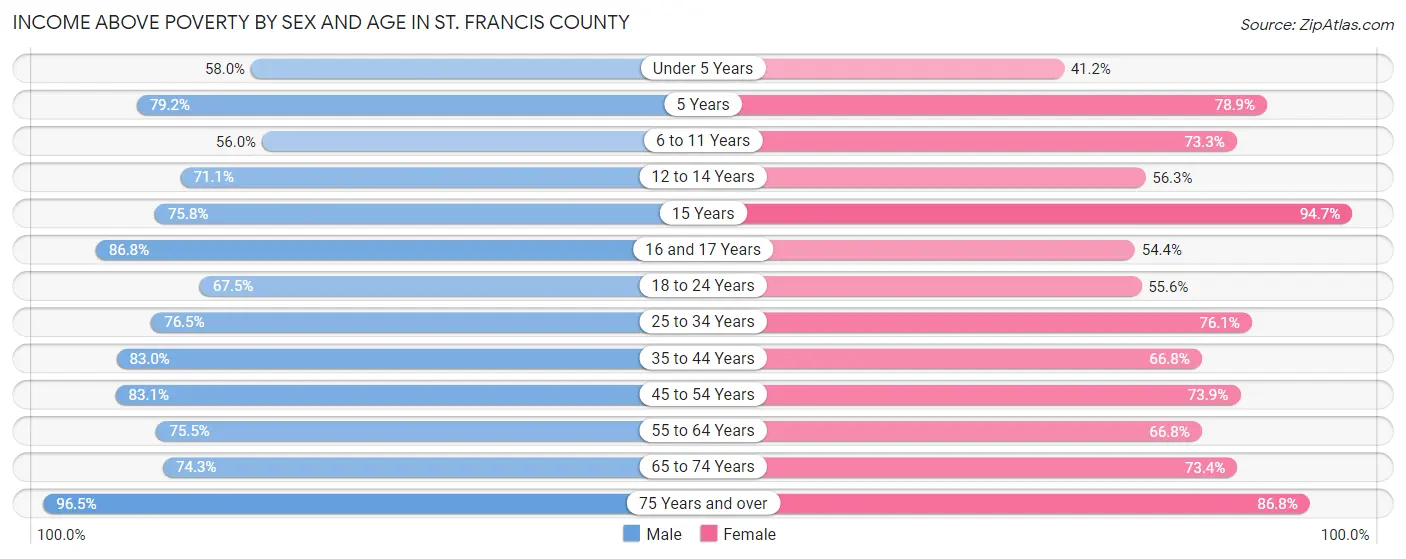
Income Above Poverty by Sex and Age in St. Francis County
According to the poverty statistics in St. Francis County, males aged 75 years and over and females aged 15 years are the age groups that are most secure financially, with 96.5% of males and 94.7% of females in these age groups living above the poverty line.
| Age Bracket | Male | Female |
| Under 5 Years | 403 (58.0%) | 276 (41.2%) |
| 5 Years | 137 (79.2%) | 71 (78.9%) |
| 6 to 11 Years | 470 (55.9%) | 608 (73.3%) |
| 12 to 14 Years | 248 (71.1%) | 191 (56.3%) |
| 15 Years | 144 (75.8%) | 107 (94.7%) |
| 16 and 17 Years | 269 (86.8%) | 93 (54.4%) |
| 18 to 24 Years | 628 (67.4%) | 499 (55.6%) |
| 25 to 34 Years | 1,261 (76.5%) | 909 (76.1%) |
| 35 to 44 Years | 983 (83.0%) | 721 (66.8%) |
| 45 to 54 Years | 634 (83.1%) | 889 (73.9%) |
| 55 to 64 Years | 849 (75.5%) | 970 (66.8%) |
| 65 to 74 Years | 801 (74.3%) | 981 (73.4%) |
| 75 Years and over | 585 (96.5%) | 750 (86.8%) |
| Total | 7,412 (74.9%) | 7,065 (69.0%) |
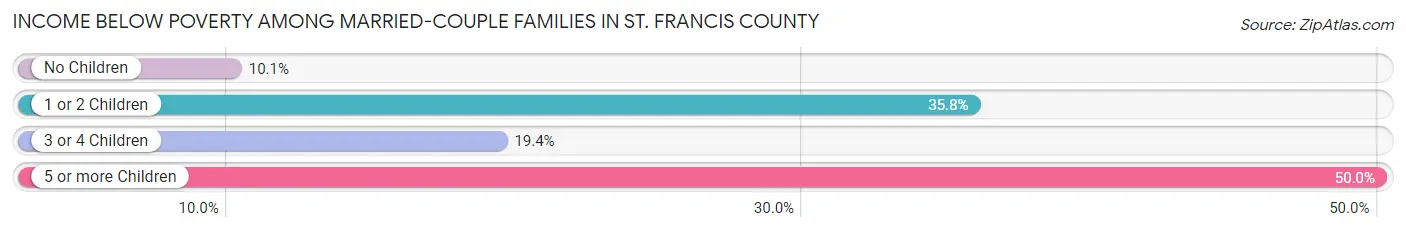
Income Below Poverty Among Married-Couple Families in St. Francis County
The poverty statistics for married-couple families in St. Francis County show that 18.3% or 551 of the total 3,004 families live below the poverty line. Families with 5 or more children have the highest poverty rate of 50.0%, comprising of 6 families. On the other hand, families with no children have the lowest poverty rate of 10.1%, which includes 189 families.
| Children | Above Poverty | Below Poverty |
| No Children | 1,677 (89.9%) | 189 (10.1%) |
| 1 or 2 Children | 537 (64.2%) | 300 (35.8%) |
| 3 or 4 Children | 233 (80.6%) | 56 (19.4%) |
| 5 or more Children | 6 (50.0%) | 6 (50.0%) |
| Total | 2,453 (81.7%) | 551 (18.3%) |
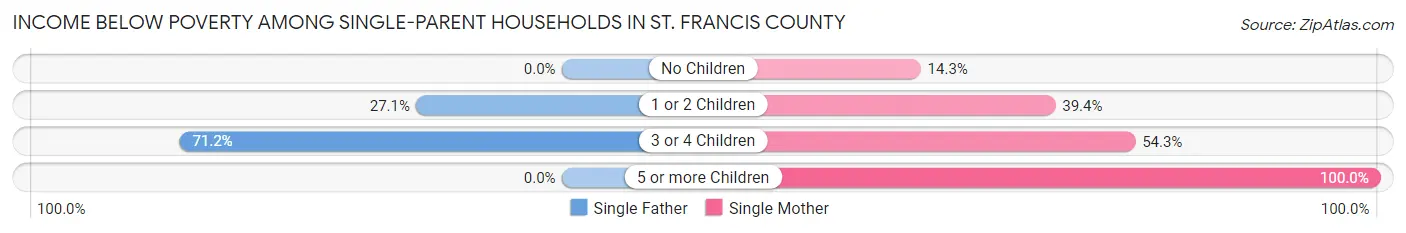
Income Below Poverty Among Single-Parent Households in St. Francis County
According to the poverty data in St. Francis County, 21.8% or 56 single-father households and 34.9% or 625 single-mother households are living below the poverty line. Among single-father households, those with 3 or 4 children have the highest poverty rate, with 37 households (71.2%) experiencing poverty. Likewise, among single-mother households, those with 5 or more children have the highest poverty rate, with 7 households (100.0%) falling below the poverty line.
| Children | Single Father | Single Mother |
| No Children | 0 (0.0%) | 71 (14.3%) |
| 1 or 2 Children | 19 (27.1%) | 408 (39.4%) |
| 3 or 4 Children | 37 (71.2%) | 139 (54.3%) |
| 5 or more Children | 0 (0.0%) | 7 (100.0%) |
| Total | 56 (21.8%) | 625 (34.9%) |
Income Below Poverty Among Married-Couple vs Single-Parent Households in St. Francis County
The poverty data for St. Francis County shows that 551 of the married-couple family households (18.3%) and 681 of the single-parent households (33.2%) are living below the poverty level. Within the married-couple family households, those with 5 or more children have the highest poverty rate, with 6 households (50.0%) falling below the poverty line. Among the single-parent households, those with 5 or more children have the highest poverty rate, with 7 household (100.0%) living below poverty.
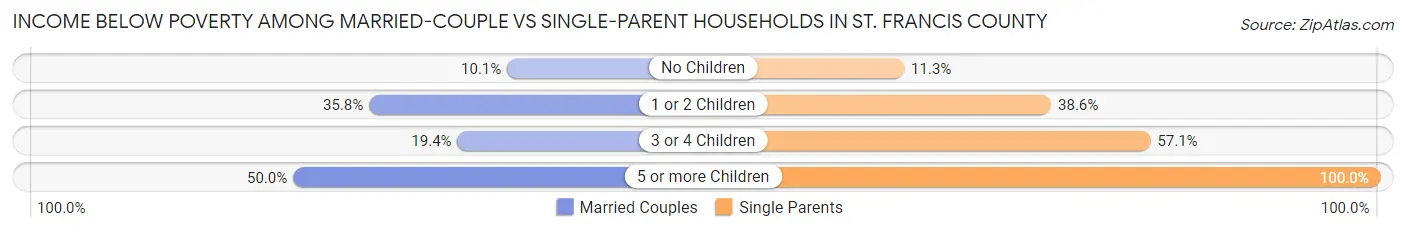
| Children | Married-Couple Families | Single-Parent Households |
| No Children | 189 (10.1%) | 71 (11.3%) |
| 1 or 2 Children | 300 (35.8%) | 427 (38.6%) |
| 3 or 4 Children | 56 (19.4%) | 176 (57.1%) |
| 5 or more Children | 6 (50.0%) | 7 (100.0%) |
| Total | 551 (18.3%) | 681 (33.2%) |
Race in St. Francis County
The most populous races in St. Francis County are Black / African American (12,369 | 53.5%), White / Caucasian (9,259 | 40.0%), and Hispanic or Latino (1,275 | 5.5%).
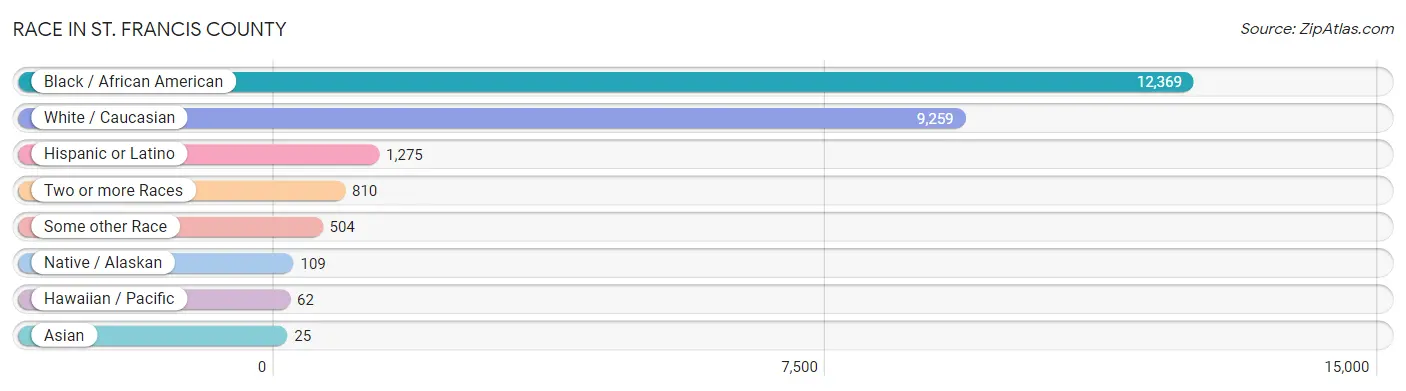
| Race | # Population | % Population |
| Asian | 25 | 0.1% |
| Black / African American | 12,369 | 53.5% |
| Hawaiian / Pacific | 62 | 0.3% |
| Hispanic or Latino | 1,275 | 5.5% |
| Native / Alaskan | 109 | 0.5% |
| White / Caucasian | 9,259 | 40.0% |
| Two or more Races | 810 | 3.5% |
| Some other Race | 504 | 2.2% |
| Total | 23,138 | 100.0% |
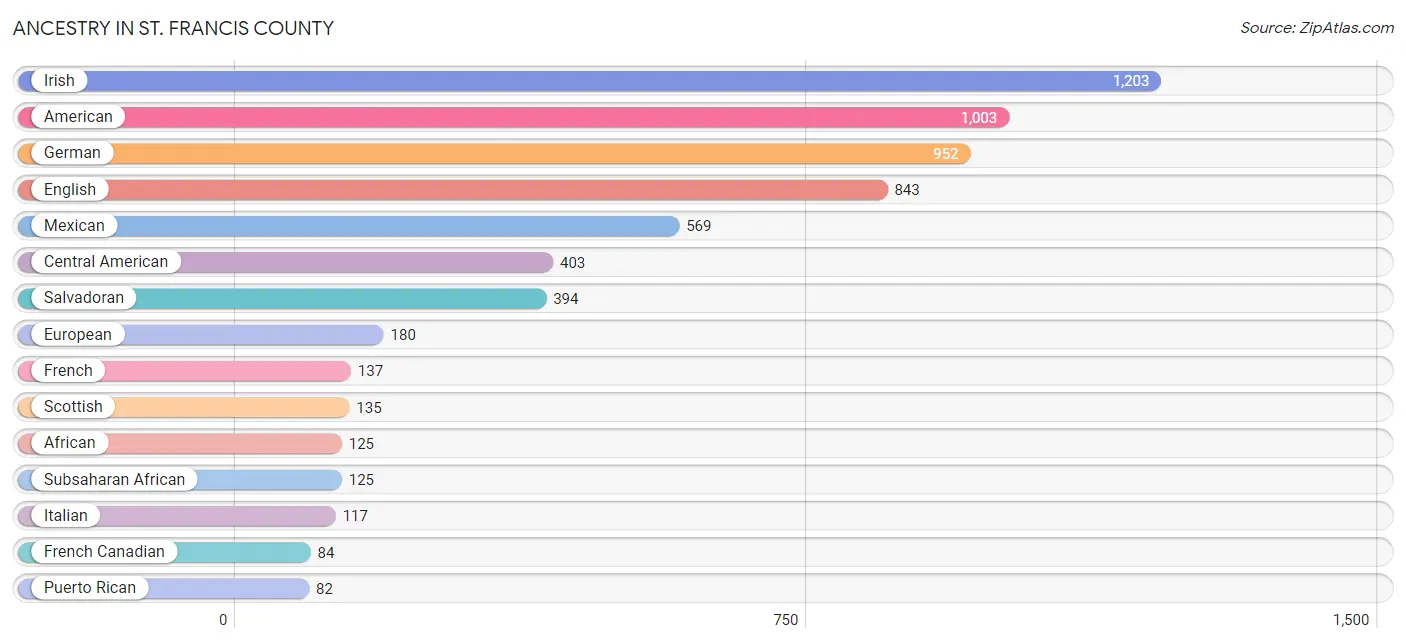
Ancestry in St. Francis County
The most populous ancestries reported in St. Francis County are Irish (1,203 | 5.2%), American (1,003 | 4.3%), German (952 | 4.1%), English (843 | 3.6%), and Mexican (569 | 2.5%), together accounting for 19.7% of all St. Francis County residents.
| Ancestry | # Population | % Population |
| African | 125 | 0.5% |
| American | 1,003 | 4.3% |
| Apache | 9 | 0.0% |
| Arab | 22 | 0.1% |
| British | 33 | 0.1% |
| Burmese | 9 | 0.0% |
| Cajun | 2 | 0.0% |
| Central American | 403 | 1.7% |
| Cherokee | 64 | 0.3% |
| Choctaw | 15 | 0.1% |
| Colville | 9 | 0.0% |
| Comanche | 8 | 0.0% |
| Creek | 2 | 0.0% |
| Czech | 15 | 0.1% |
| Danish | 9 | 0.0% |
| Dutch | 48 | 0.2% |
| English | 843 | 3.6% |
| European | 180 | 0.8% |
| Fijian | 62 | 0.3% |
| Finnish | 9 | 0.0% |
| French | 137 | 0.6% |
| French Canadian | 84 | 0.4% |
| German | 952 | 4.1% |
| Guatemalan | 9 | 0.0% |
| Iraqi | 10 | 0.0% |
| Irish | 1,203 | 5.2% |
| Italian | 117 | 0.5% |
| Mexican | 569 | 2.5% |
| Mexican American Indian | 9 | 0.0% |
| Moroccan | 9 | 0.0% |
| Norwegian | 14 | 0.1% |
| Polish | 19 | 0.1% |
| Puerto Rican | 82 | 0.4% |
| Salvadoran | 394 | 1.7% |
| Scandinavian | 9 | 0.0% |
| Scotch-Irish | 77 | 0.3% |
| Scottish | 135 | 0.6% |
| Slovak | 18 | 0.1% |
| Sri Lankan | 14 | 0.1% |
| Subsaharan African | 125 | 0.5% |
| Swedish | 18 | 0.1% |
| Swiss | 22 | 0.1% |
| Thai | 26 | 0.1% |
| Turkish | 14 | 0.1% |
| Welsh | 18 | 0.1% | View All 45 Rows |
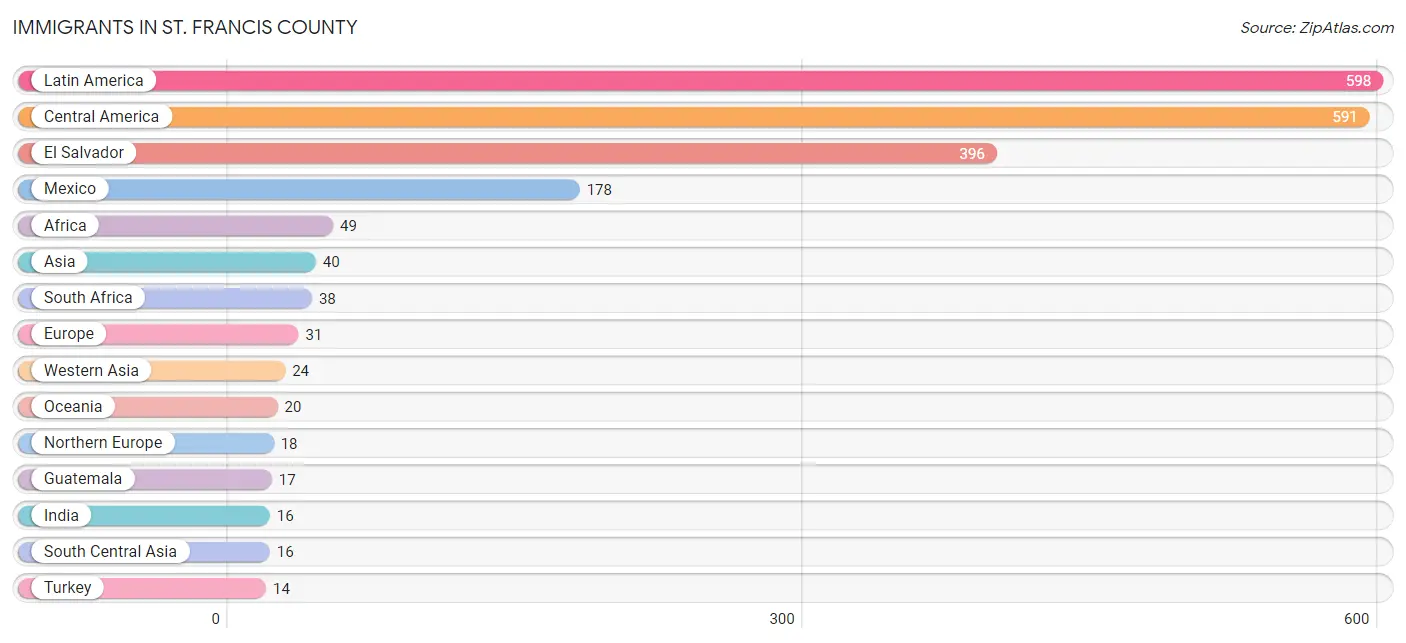
Immigrants in St. Francis County
The most numerous immigrant groups reported in St. Francis County came from Latin America (598 | 2.6%), Central America (591 | 2.5%), El Salvador (396 | 1.7%), Mexico (178 | 0.8%), and Africa (49 | 0.2%), together accounting for 7.8% of all St. Francis County residents.
| Immigration Origin | # Population | % Population |
| Africa | 49 | 0.2% |
| Asia | 40 | 0.2% |
| Canada | 2 | 0.0% |
| Caribbean | 7 | 0.0% |
| Central America | 591 | 2.5% |
| Dominican Republic | 7 | 0.0% |
| El Salvador | 396 | 1.7% |
| England | 9 | 0.0% |
| Europe | 31 | 0.1% |
| France | 6 | 0.0% |
| Germany | 7 | 0.0% |
| Guatemala | 17 | 0.1% |
| India | 16 | 0.1% |
| Iraq | 10 | 0.0% |
| Latin America | 598 | 2.6% |
| Mexico | 178 | 0.8% |
| Nigeria | 8 | 0.0% |
| Northern Africa | 3 | 0.0% |
| Northern Europe | 18 | 0.1% |
| Norway | 9 | 0.0% |
| Oceania | 20 | 0.1% |
| South Africa | 38 | 0.2% |
| South Central Asia | 16 | 0.1% |
| Turkey | 14 | 0.1% |
| Western Africa | 8 | 0.0% |
| Western Asia | 24 | 0.1% |
| Western Europe | 13 | 0.1% | View All 27 Rows |
Sex and Age in St. Francis County
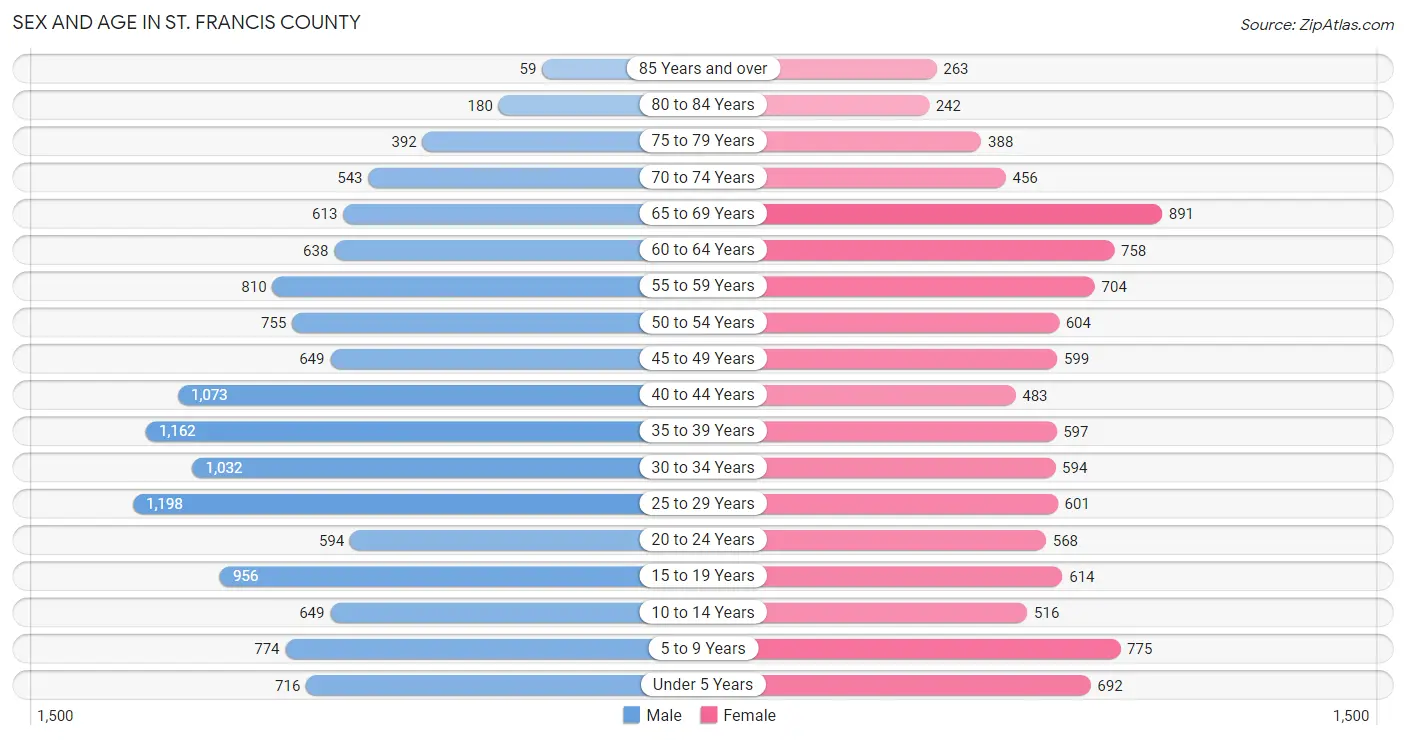
Sex and Age in St. Francis County
The most populous age groups in St. Francis County are 25 to 29 Years (1,198 | 9.4%) for men and 65 to 69 Years (891 | 8.6%) for women.
| Age Bracket | Male | Female |
| Under 5 Years | 716 (5.6%) | 692 (6.7%) |
| 5 to 9 Years | 774 (6.0%) | 775 (7.5%) |
| 10 to 14 Years | 649 (5.1%) | 516 (5.0%) |
| 15 to 19 Years | 956 (7.5%) | 614 (5.9%) |
| 20 to 24 Years | 594 (4.6%) | 568 (5.5%) |
| 25 to 29 Years | 1,198 (9.4%) | 601 (5.8%) |
| 30 to 34 Years | 1,032 (8.1%) | 594 (5.7%) |
| 35 to 39 Years | 1,162 (9.1%) | 597 (5.8%) |
| 40 to 44 Years | 1,073 (8.4%) | 483 (4.7%) |
| 45 to 49 Years | 649 (5.1%) | 599 (5.8%) |
| 50 to 54 Years | 755 (5.9%) | 604 (5.8%) |
| 55 to 59 Years | 810 (6.3%) | 704 (6.8%) |
| 60 to 64 Years | 638 (5.0%) | 758 (7.3%) |
| 65 to 69 Years | 613 (4.8%) | 891 (8.6%) |
| 70 to 74 Years | 543 (4.2%) | 456 (4.4%) |
| 75 to 79 Years | 392 (3.1%) | 388 (3.7%) |
| 80 to 84 Years | 180 (1.4%) | 242 (2.3%) |
| 85 Years and over | 59 (0.5%) | 263 (2.5%) |
| Total | 12,793 (100.0%) | 10,345 (100.0%) |
Families and Households in St. Francis County
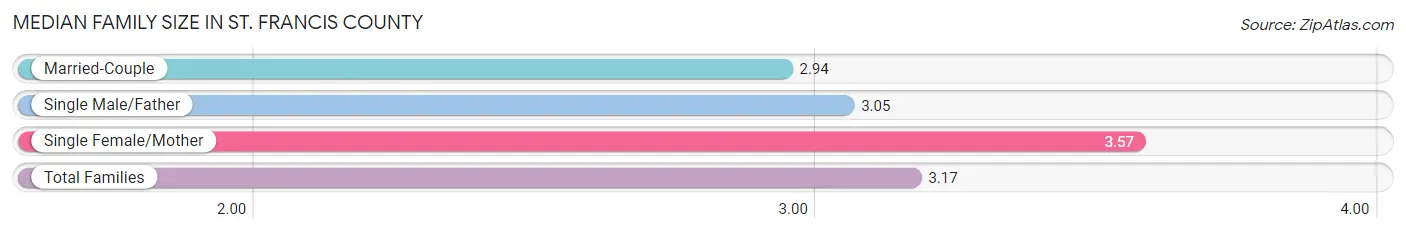
Median Family Size in St. Francis County
The median family size in St. Francis County is 3.17 persons per family, with single female/mother families (1,793 | 35.5%) accounting for the largest median family size of 3.57 persons per family. On the other hand, married-couple families (3,004 | 59.4%) represent the smallest median family size with 2.94 persons per family.
| Family Type | # Families | Family Size |
| Married-Couple | 3,004 (59.4%) | 2.94 |
| Single Male/Father | 257 (5.1%) | 3.05 |
| Single Female/Mother | 1,793 (35.5%) | 3.57 |
| Total Families | 5,054 (100.0%) | 3.17 |
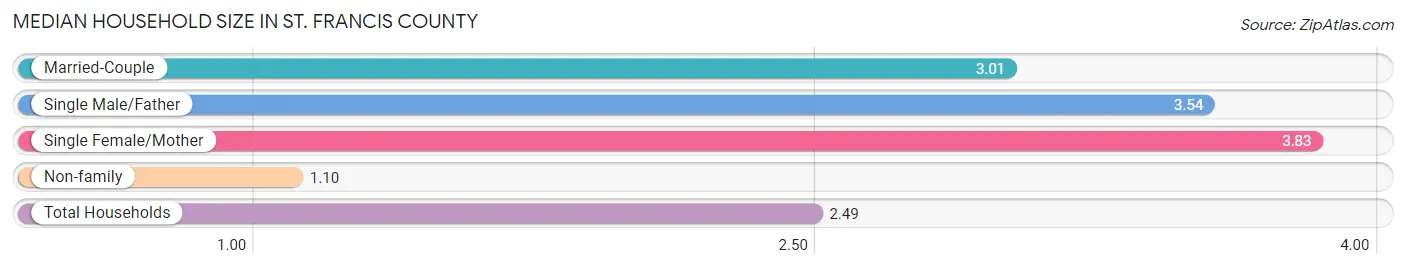
Median Household Size in St. Francis County
The median household size in St. Francis County is 2.49 persons per household, with single female/mother households (1,793 | 22.1%) accounting for the largest median household size of 3.83 persons per household. non-family households (3,048 | 37.6%) represent the smallest median household size with 1.10 persons per household.
| Household Type | # Households | Household Size |
| Married-Couple | 3,004 (37.1%) | 3.01 |
| Single Male/Father | 257 (3.2%) | 3.54 |
| Single Female/Mother | 1,793 (22.1%) | 3.83 |
| Non-family | 3,048 (37.6%) | 1.10 |
| Total Households | 8,102 (100.0%) | 2.49 |
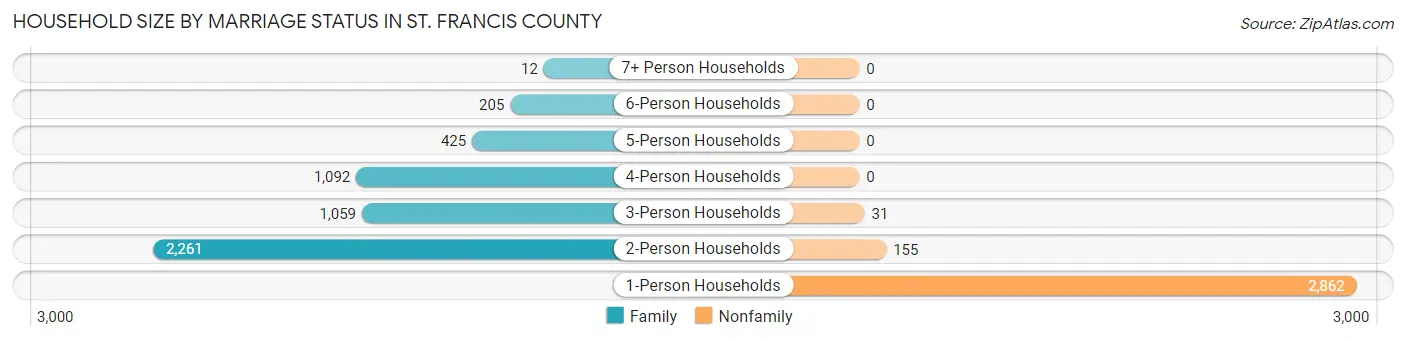
Household Size by Marriage Status in St. Francis County
Out of a total of 8,102 households in St. Francis County, 5,054 (62.4%) are family households, while 3,048 (37.6%) are nonfamily households. The most numerous type of family households are 2-person households, comprising 2,261, and the most common type of nonfamily households are 1-person households, comprising 2,862.
| Household Size | Family Households | Nonfamily Households |
| 1-Person Households | - | 2,862 (35.3%) |
| 2-Person Households | 2,261 (27.9%) | 155 (1.9%) |
| 3-Person Households | 1,059 (13.1%) | 31 (0.4%) |
| 4-Person Households | 1,092 (13.5%) | 0 (0.0%) |
| 5-Person Households | 425 (5.2%) | 0 (0.0%) |
| 6-Person Households | 205 (2.5%) | 0 (0.0%) |
| 7+ Person Households | 12 (0.2%) | 0 (0.0%) |
| Total | 5,054 (62.4%) | 3,048 (37.6%) |
Female Fertility in St. Francis County
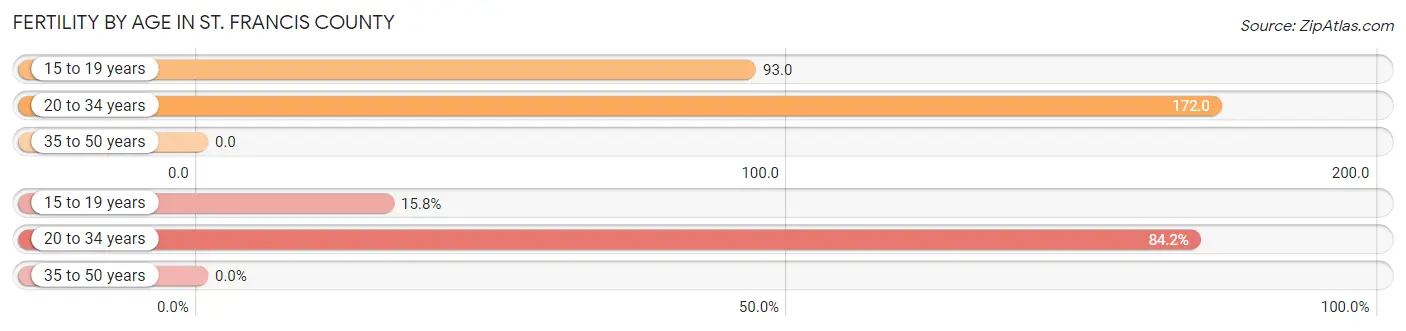
Fertility by Age in St. Francis County
Average fertility rate in St. Francis County is 87.0 births per 1,000 women. Women in the age bracket of 20 to 34 years have the highest fertility rate with 172.0 births per 1,000 women. Women in the age bracket of 20 to 34 years acount for 84.2% of all women with births.
| Age Bracket | Women with Births | Births / 1,000 Women |
| 15 to 19 years | 57 (15.8%) | 93.0 |
| 20 to 34 years | 304 (84.2%) | 172.0 |
| 35 to 50 years | 0 (0.0%) | 0.0 |
| Total | 361 (100.0%) | 87.0 |
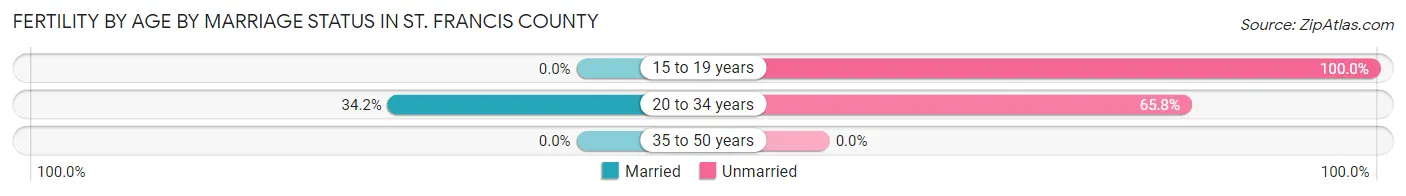
Fertility by Age by Marriage Status in St. Francis County
28.8% of women with births (361) in St. Francis County are married. The highest percentage of unmarried women with births falls into 15 to 19 years age bracket with 100.0% of them unmarried at the time of birth, while the lowest percentage of unmarried women with births belong to 20 to 34 years age bracket with 65.8% of them unmarried.
| Age Bracket | Married | Unmarried |
| 15 to 19 years | 0 (0.0%) | 57 (100.0%) |
| 20 to 34 years | 104 (34.2%) | 200 (65.8%) |
| 35 to 50 years | 0 (0.0%) | 0 (0.0%) |
| Total | 104 (28.8%) | 257 (71.2%) |
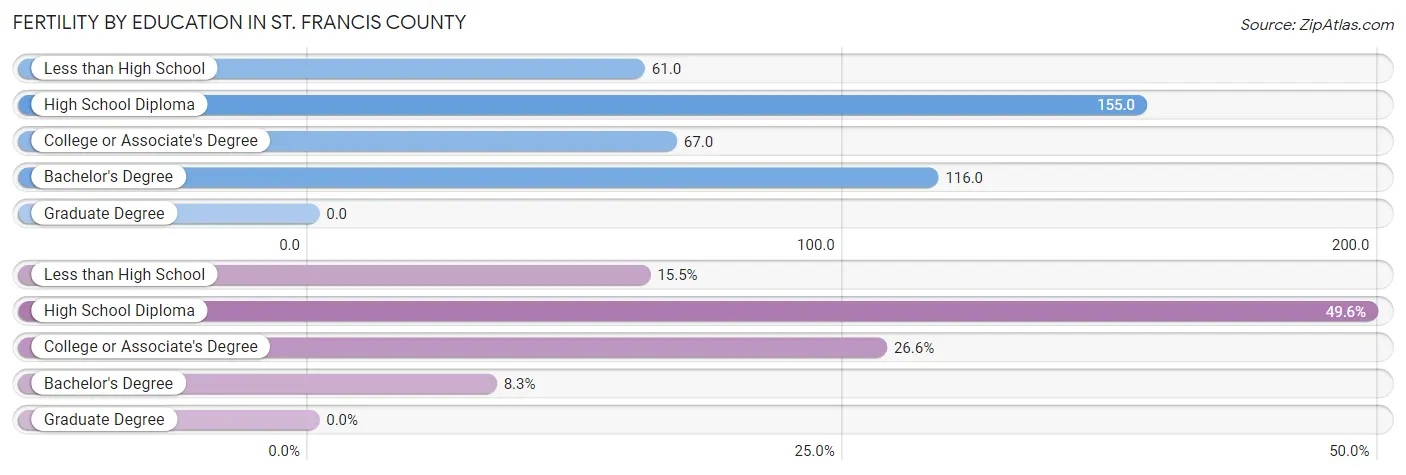
Fertility by Education in St. Francis County
| Educational Attainment | Women with Births | Births / 1,000 Women |
| Less than High School | 56 (15.5%) | 61.0 |
| High School Diploma | 179 (49.6%) | 155.0 |
| College or Associate's Degree | 96 (26.6%) | 67.0 |
| Bachelor's Degree | 30 (8.3%) | 116.0 |
| Graduate Degree | 0 (0.0%) | 0.0 |
| Total | 361 (100.0%) | 87.0 |
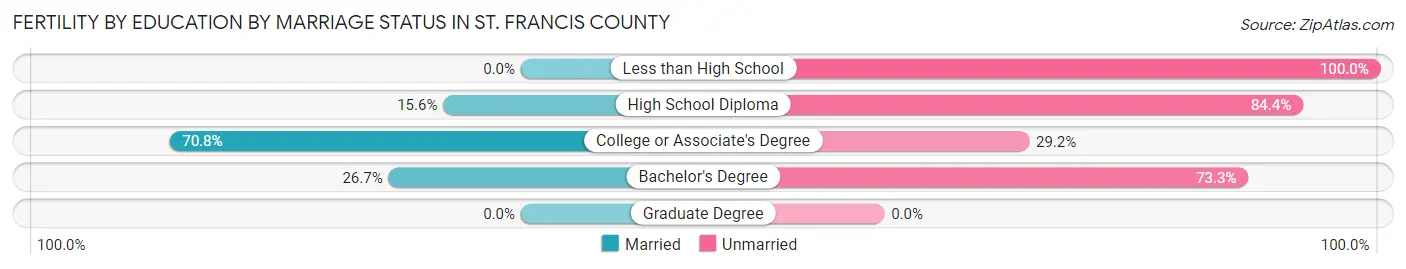
Fertility by Education by Marriage Status in St. Francis County
71.2% of women with births in St. Francis County are unmarried. Women with the educational attainment of college or associate's degree are most likely to be married with 70.8% of them married at childbirth, while women with the educational attainment of less than high school are least likely to be married with 100.0% of them unmarried at childbirth.
| Educational Attainment | Married | Unmarried |
| Less than High School | 0 (0.0%) | 56 (100.0%) |
| High School Diploma | 28 (15.6%) | 151 (84.4%) |
| College or Associate's Degree | 68 (70.8%) | 28 (29.2%) |
| Bachelor's Degree | 8 (26.7%) | 22 (73.3%) |
| Graduate Degree | 0 (0.0%) | 0 (0.0%) |
| Total | 104 (28.8%) | 257 (71.2%) |
Employment Characteristics in St. Francis County
Employment by Class of Employer in St. Francis County
Among the 7,810 employed individuals in St. Francis County, private company employees (4,973 | 63.7%), state government employees (720 | 9.2%), and local government employees (553 | 7.1%) make up the most common classes of employment.
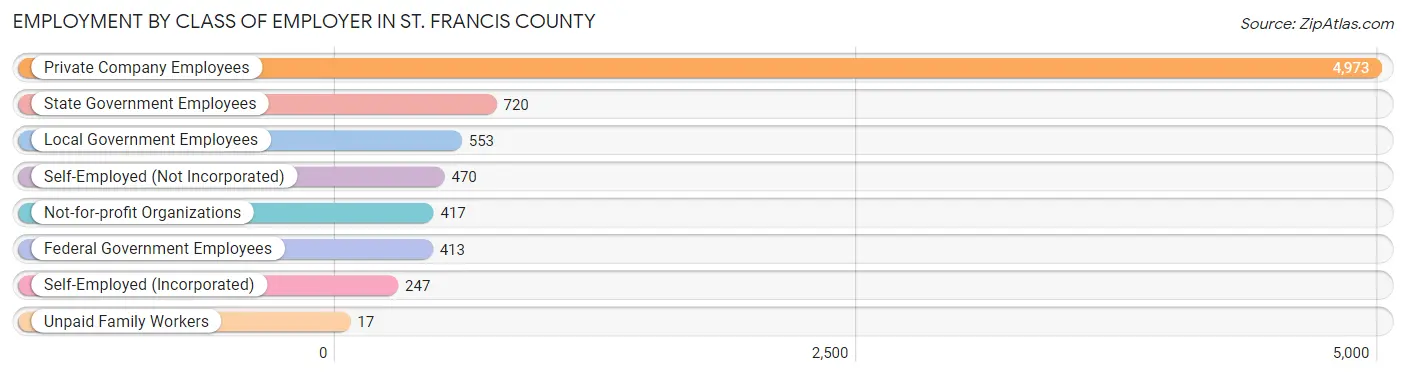
| Employer Class | # Employees | % Employees |
| Private Company Employees | 4,973 | 63.7% |
| Self-Employed (Incorporated) | 247 | 3.2% |
| Self-Employed (Not Incorporated) | 470 | 6.0% |
| Not-for-profit Organizations | 417 | 5.3% |
| Local Government Employees | 553 | 7.1% |
| State Government Employees | 720 | 9.2% |
| Federal Government Employees | 413 | 5.3% |
| Unpaid Family Workers | 17 | 0.2% |
| Total | 7,810 | 100.0% |
Employment Status by Age in St. Francis County
According to the labor force statistics for St. Francis County, out of the total population over 16 years of age (18,708), 45.7% or 8,550 individuals are in the labor force, with 6.6% or 564 of them unemployed. The age group with the highest labor force participation rate is 25 to 29 years, with 75.5% or 1,358 individuals in the labor force. Within the labor force, the 16 to 19 years age range has the highest percentage of unemployed individuals, with 28.2% or 151 of them being unemployed.
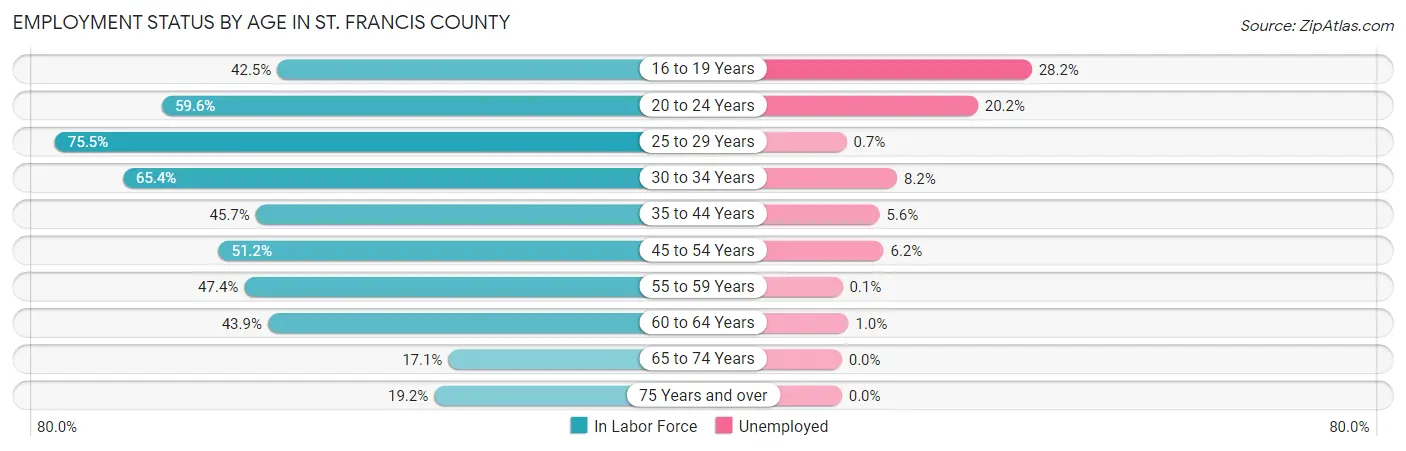
| Age Bracket | In Labor Force | Unemployed |
| 16 to 19 Years | 536 (42.5%) | 151 (28.2%) |
| 20 to 24 Years | 693 (59.6%) | 140 (20.2%) |
| 25 to 29 Years | 1,358 (75.5%) | 10 (0.7%) |
| 30 to 34 Years | 1,063 (65.4%) | 87 (8.2%) |
| 35 to 44 Years | 1,515 (45.7%) | 85 (5.6%) |
| 45 to 54 Years | 1,335 (51.2%) | 83 (6.2%) |
| 55 to 59 Years | 718 (47.4%) | 1 (0.1%) |
| 60 to 64 Years | 613 (43.9%) | 6 (1.0%) |
| 65 to 74 Years | 428 (17.1%) | 0 (0.0%) |
| 75 Years and over | 293 (19.2%) | 0 (0.0%) |
| Total | 8,550 (45.7%) | 564 (6.6%) |
Employment Status by Educational Attainment in St. Francis County
According to labor force statistics for St. Francis County, 53.9% of individuals (6,607) out of the total population between 25 and 64 years of age (12,257) are in the labor force, with 4.1% or 271 of them being unemployed. The group with the highest labor force participation rate are those with the educational attainment of bachelor's degree or higher, with 74.9% or 1,073 individuals in the labor force. Within the labor force, individuals with high school diploma education have the highest percentage of unemployment, with 5.5% or 144 of them being unemployed.
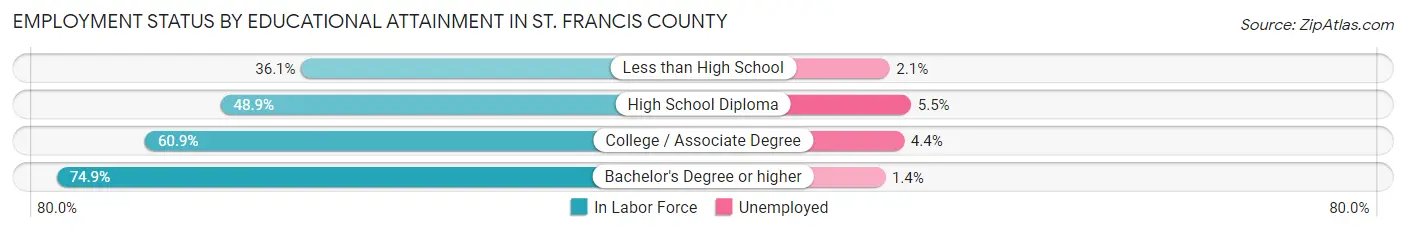
| Educational Attainment | In Labor Force | Unemployed |
| Less than High School | 616 (36.1%) | 36 (2.1%) |
| High School Diploma | 2,612 (48.9%) | 294 (5.5%) |
| College / Associate Degree | 2,300 (60.9%) | 166 (4.4%) |
| Bachelor's Degree or higher | 1,073 (74.9%) | 20 (1.4%) |
| Total | 6,607 (53.9%) | 503 (4.1%) |
Employment Occupations by Sex in St. Francis County
Management, Business, Science and Arts Occupations
The most common Management, Business, Science and Arts occupations in St. Francis County are Community & Social Service (786 | 9.9%), Management (653 | 8.2%), Education Instruction & Library (472 | 5.9%), Health Diagnosing & Treating (361 | 4.5%), and Education, Arts & Media (239 | 3.0%).
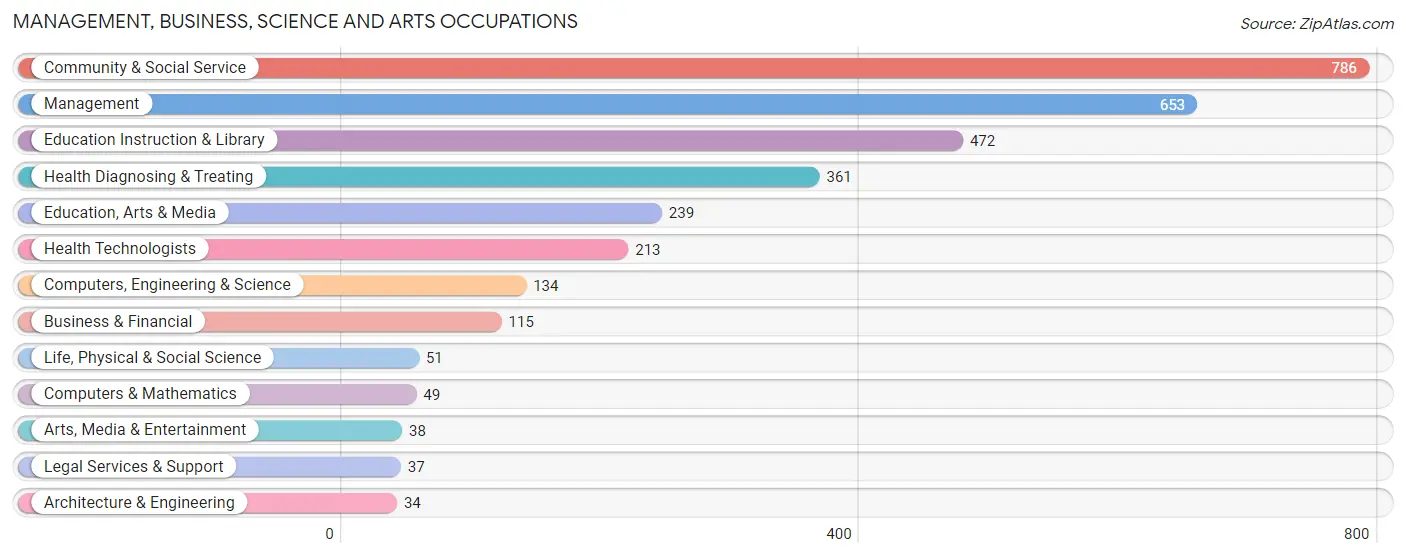
Management, Business, Science and Arts Occupations by Sex
Within the Management, Business, Science and Arts occupations in St. Francis County, the most male-oriented occupations are Life, Physical & Social Science (100.0%), Management (68.8%), and Computers, Engineering & Science (52.2%), while the most female-oriented occupations are Arts, Media & Entertainment (100.0%), Legal Services & Support (94.6%), and Education Instruction & Library (90.5%).
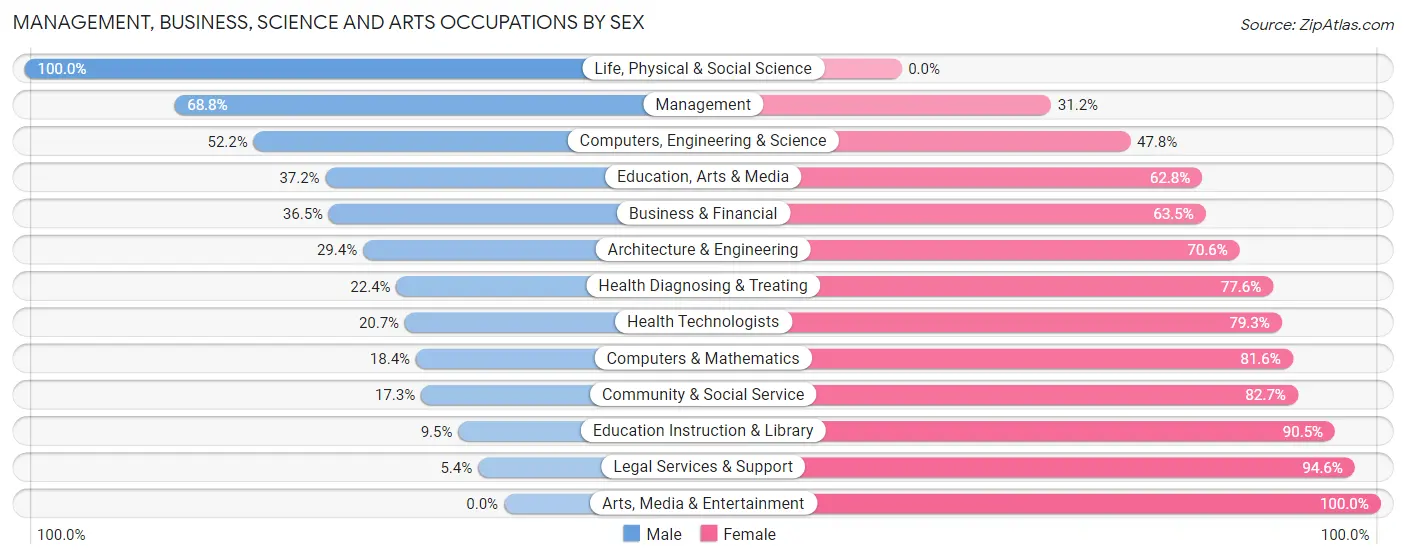
| Occupation | Male | Female |
| Management | 449 (68.8%) | 204 (31.2%) |
| Business & Financial | 42 (36.5%) | 73 (63.5%) |
| Computers, Engineering & Science | 70 (52.2%) | 64 (47.8%) |
| Computers & Mathematics | 9 (18.4%) | 40 (81.6%) |
| Architecture & Engineering | 10 (29.4%) | 24 (70.6%) |
| Life, Physical & Social Science | 51 (100.0%) | 0 (0.0%) |
| Community & Social Service | 136 (17.3%) | 650 (82.7%) |
| Education, Arts & Media | 89 (37.2%) | 150 (62.8%) |
| Legal Services & Support | 2 (5.4%) | 35 (94.6%) |
| Education Instruction & Library | 45 (9.5%) | 427 (90.5%) |
| Arts, Media & Entertainment | 0 (0.0%) | 38 (100.0%) |
| Health Diagnosing & Treating | 81 (22.4%) | 280 (77.6%) |
| Health Technologists | 44 (20.7%) | 169 (79.3%) |
| Total (Category) | 778 (38.0%) | 1,271 (62.0%) |
| Total (Overall) | 4,249 (53.5%) | 3,699 (46.5%) |
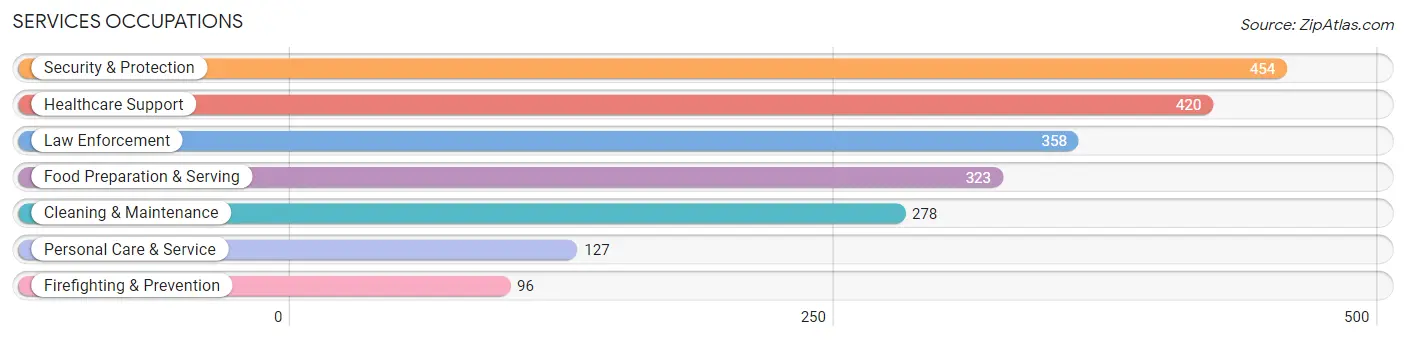
Services Occupations
The most common Services occupations in St. Francis County are Security & Protection (454 | 5.7%), Healthcare Support (420 | 5.3%), Law Enforcement (358 | 4.5%), Food Preparation & Serving (323 | 4.1%), and Cleaning & Maintenance (278 | 3.5%).
Services Occupations by Sex
Within the Services occupations in St. Francis County, the most male-oriented occupations are Firefighting & Prevention (95.8%), Security & Protection (90.1%), and Law Enforcement (88.5%), while the most female-oriented occupations are Healthcare Support (89.5%), Food Preparation & Serving (57.0%), and Personal Care & Service (55.1%).
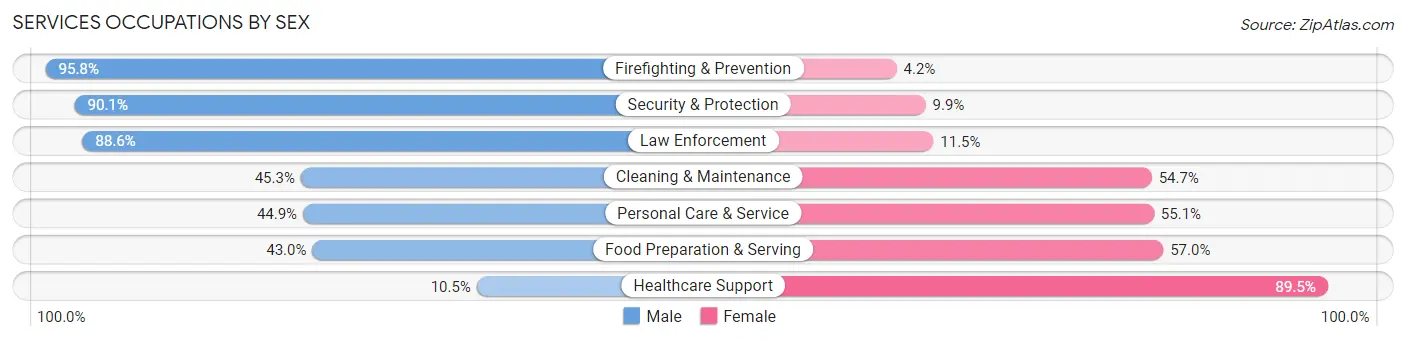
| Occupation | Male | Female |
| Healthcare Support | 44 (10.5%) | 376 (89.5%) |
| Security & Protection | 409 (90.1%) | 45 (9.9%) |
| Firefighting & Prevention | 92 (95.8%) | 4 (4.2%) |
| Law Enforcement | 317 (88.5%) | 41 (11.5%) |
| Food Preparation & Serving | 139 (43.0%) | 184 (57.0%) |
| Cleaning & Maintenance | 126 (45.3%) | 152 (54.7%) |
| Personal Care & Service | 57 (44.9%) | 70 (55.1%) |
| Total (Category) | 775 (48.4%) | 827 (51.6%) |
| Total (Overall) | 4,249 (53.5%) | 3,699 (46.5%) |
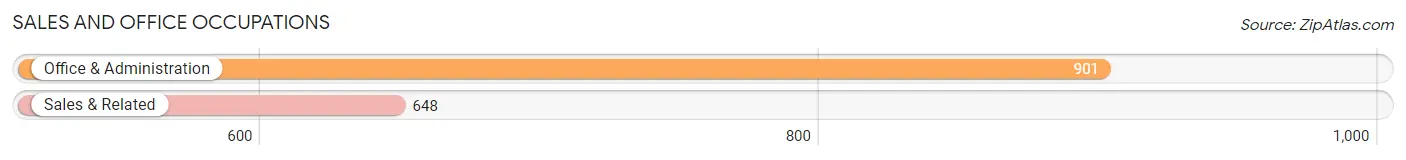
Sales and Office Occupations
The most common Sales and Office occupations in St. Francis County are Office & Administration (901 | 11.3%), and Sales & Related (648 | 8.2%).
Sales and Office Occupations by Sex
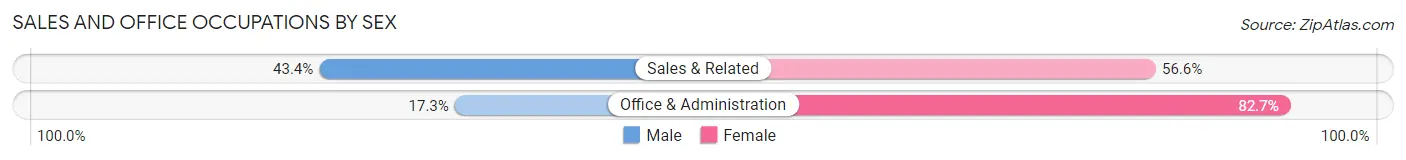
| Occupation | Male | Female |
| Sales & Related | 281 (43.4%) | 367 (56.6%) |
| Office & Administration | 156 (17.3%) | 745 (82.7%) |
| Total (Category) | 437 (28.2%) | 1,112 (71.8%) |
| Total (Overall) | 4,249 (53.5%) | 3,699 (46.5%) |
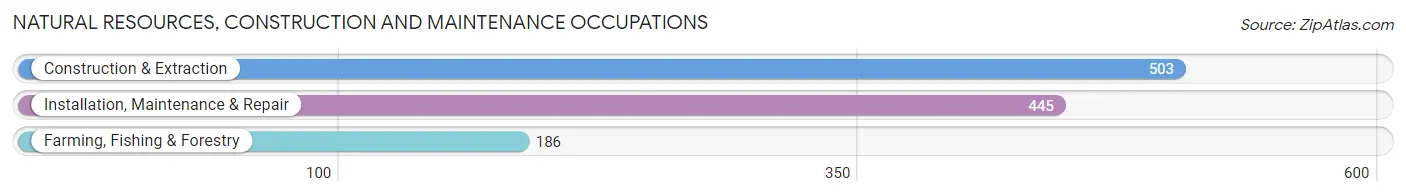
Natural Resources, Construction and Maintenance Occupations
The most common Natural Resources, Construction and Maintenance occupations in St. Francis County are Construction & Extraction (503 | 6.3%), Installation, Maintenance & Repair (445 | 5.6%), and Farming, Fishing & Forestry (186 | 2.3%).
Natural Resources, Construction and Maintenance Occupations by Sex
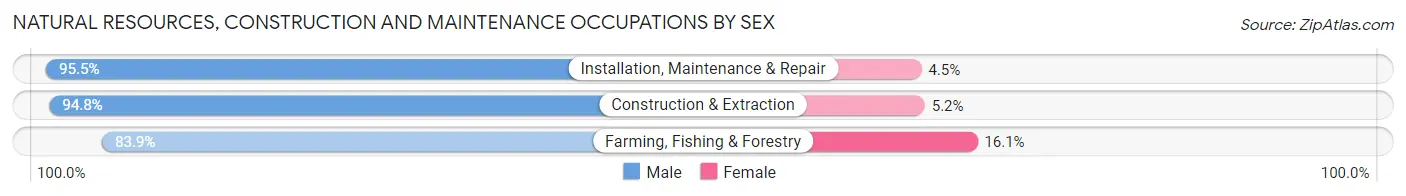
| Occupation | Male | Female |
| Farming, Fishing & Forestry | 156 (83.9%) | 30 (16.1%) |
| Construction & Extraction | 477 (94.8%) | 26 (5.2%) |
| Installation, Maintenance & Repair | 425 (95.5%) | 20 (4.5%) |
| Total (Category) | 1,058 (93.3%) | 76 (6.7%) |
| Total (Overall) | 4,249 (53.5%) | 3,699 (46.5%) |
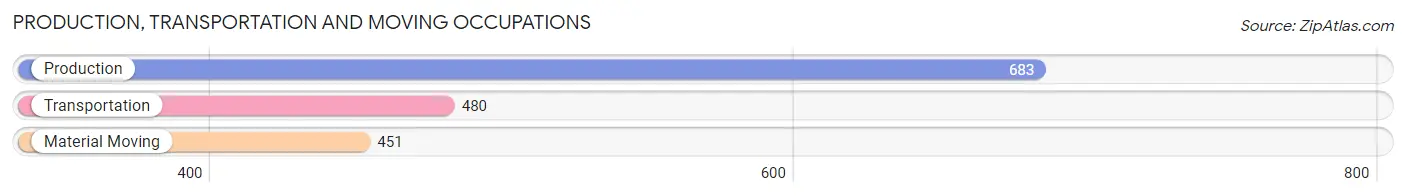
Production, Transportation and Moving Occupations
The most common Production, Transportation and Moving occupations in St. Francis County are Production (683 | 8.6%), Transportation (480 | 6.0%), and Material Moving (451 | 5.7%).
Production, Transportation and Moving Occupations by Sex
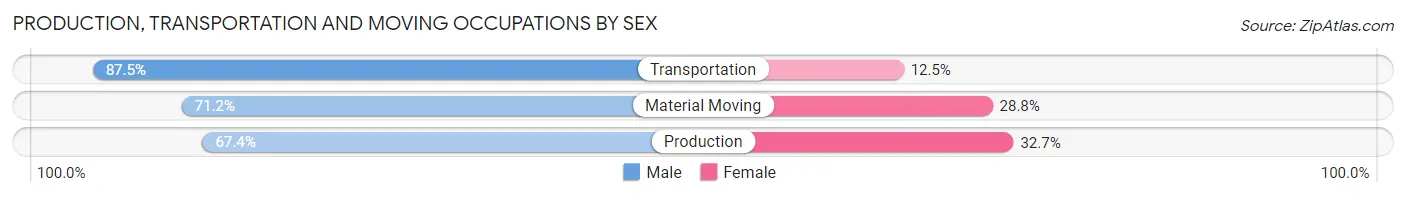
| Occupation | Male | Female |
| Production | 460 (67.3%) | 223 (32.7%) |
| Transportation | 420 (87.5%) | 60 (12.5%) |
| Material Moving | 321 (71.2%) | 130 (28.8%) |
| Total (Category) | 1,201 (74.4%) | 413 (25.6%) |
| Total (Overall) | 4,249 (53.5%) | 3,699 (46.5%) |
Employment Industries by Sex in St. Francis County
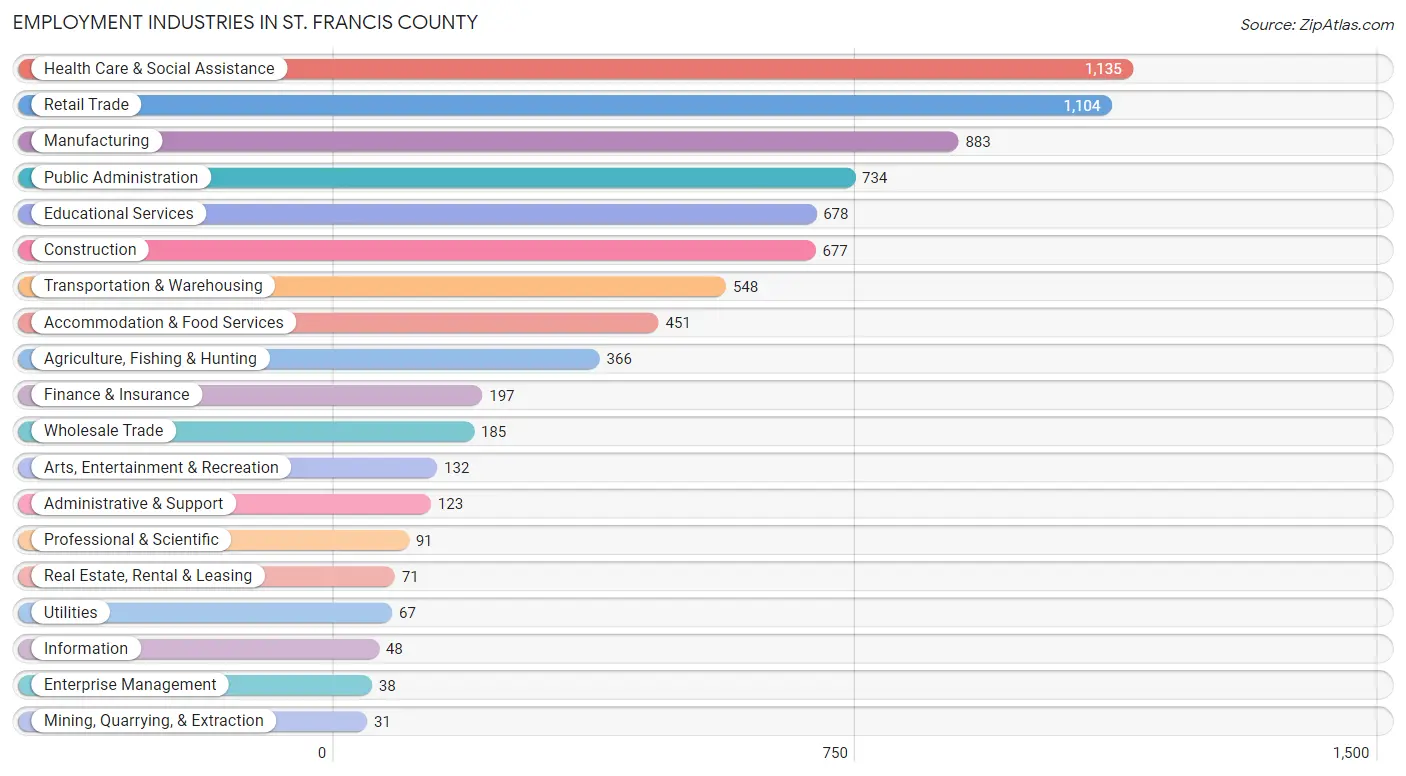
Employment Industries in St. Francis County
The major employment industries in St. Francis County include Health Care & Social Assistance (1,135 | 14.3%), Retail Trade (1,104 | 13.9%), Manufacturing (883 | 11.1%), Public Administration (734 | 9.2%), and Educational Services (678 | 8.5%).
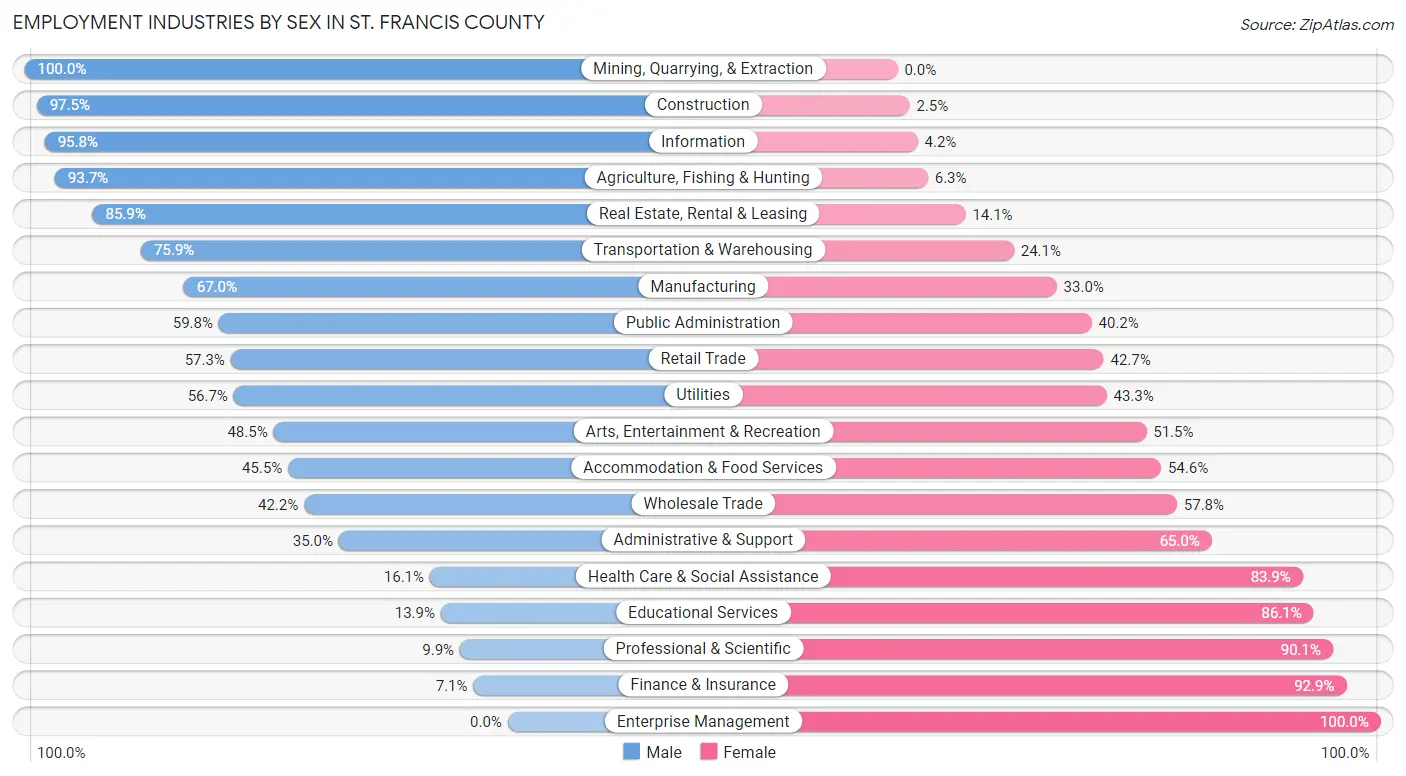
Employment Industries by Sex in St. Francis County
The St. Francis County industries that see more men than women are Mining, Quarrying, & Extraction (100.0%), Construction (97.5%), and Information (95.8%), whereas the industries that tend to have a higher number of women are Enterprise Management (100.0%), Finance & Insurance (92.9%), and Professional & Scientific (90.1%).
| Industry | Male | Female |
| Agriculture, Fishing & Hunting | 343 (93.7%) | 23 (6.3%) |
| Mining, Quarrying, & Extraction | 31 (100.0%) | 0 (0.0%) |
| Construction | 660 (97.5%) | 17 (2.5%) |
| Manufacturing | 592 (67.0%) | 291 (33.0%) |
| Wholesale Trade | 78 (42.2%) | 107 (57.8%) |
| Retail Trade | 633 (57.3%) | 471 (42.7%) |
| Transportation & Warehousing | 416 (75.9%) | 132 (24.1%) |
| Utilities | 38 (56.7%) | 29 (43.3%) |
| Information | 46 (95.8%) | 2 (4.2%) |
| Finance & Insurance | 14 (7.1%) | 183 (92.9%) |
| Real Estate, Rental & Leasing | 61 (85.9%) | 10 (14.1%) |
| Professional & Scientific | 9 (9.9%) | 82 (90.1%) |
| Enterprise Management | 0 (0.0%) | 38 (100.0%) |
| Administrative & Support | 43 (35.0%) | 80 (65.0%) |
| Educational Services | 94 (13.9%) | 584 (86.1%) |
| Health Care & Social Assistance | 183 (16.1%) | 952 (83.9%) |
| Arts, Entertainment & Recreation | 64 (48.5%) | 68 (51.5%) |
| Accommodation & Food Services | 205 (45.5%) | 246 (54.5%) |
| Public Administration | 439 (59.8%) | 295 (40.2%) |
| Total | 4,249 (53.5%) | 3,699 (46.5%) |
Education in St. Francis County
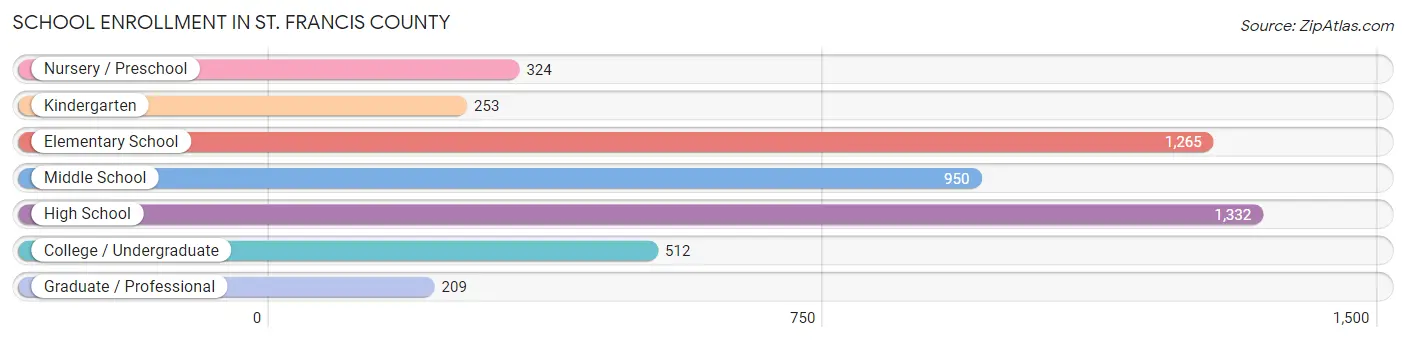
School Enrollment in St. Francis County
The most common levels of schooling among the 4,845 students in St. Francis County are high school (1,332 | 27.5%), elementary school (1,265 | 26.1%), and middle school (950 | 19.6%).
| School Level | # Students | % Students |
| Nursery / Preschool | 324 | 6.7% |
| Kindergarten | 253 | 5.2% |
| Elementary School | 1,265 | 26.1% |
| Middle School | 950 | 19.6% |
| High School | 1,332 | 27.5% |
| College / Undergraduate | 512 | 10.6% |
| Graduate / Professional | 209 | 4.3% |
| Total | 4,845 | 100.0% |
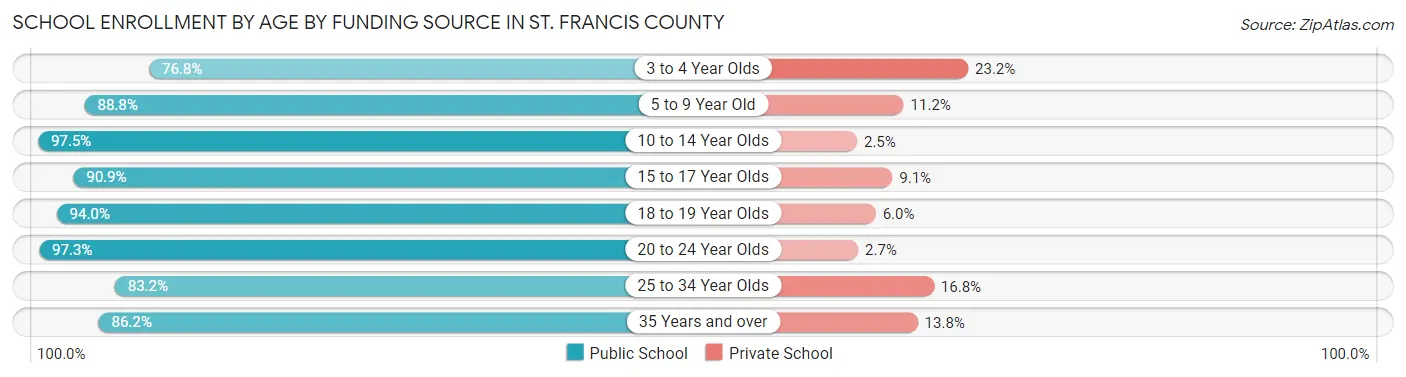
School Enrollment by Age by Funding Source in St. Francis County
Out of a total of 4,845 students who are enrolled in schools in St. Francis County, 426 (8.8%) attend a private institution, while the remaining 4,419 (91.2%) are enrolled in public schools. The age group of 3 to 4 year olds has the highest likelihood of being enrolled in private schools, with 54 (23.2% in the age bracket) enrolled. Conversely, the age group of 10 to 14 year olds has the lowest likelihood of being enrolled in a private school, with 1,136 (97.5% in the age bracket) attending a public institution.
| Age Bracket | Public School | Private School |
| 3 to 4 Year Olds | 179 (76.8%) | 54 (23.2%) |
| 5 to 9 Year Old | 1,336 (88.8%) | 168 (11.2%) |
| 10 to 14 Year Olds | 1,136 (97.5%) | 29 (2.5%) |
| 15 to 17 Year Olds | 722 (90.9%) | 72 (9.1%) |
| 18 to 19 Year Olds | 315 (94.0%) | 20 (6.0%) |
| 20 to 24 Year Olds | 325 (97.3%) | 9 (2.7%) |
| 25 to 34 Year Olds | 188 (83.2%) | 38 (16.8%) |
| 35 Years and over | 219 (86.2%) | 35 (13.8%) |
| Total | 4,419 (91.2%) | 426 (8.8%) |
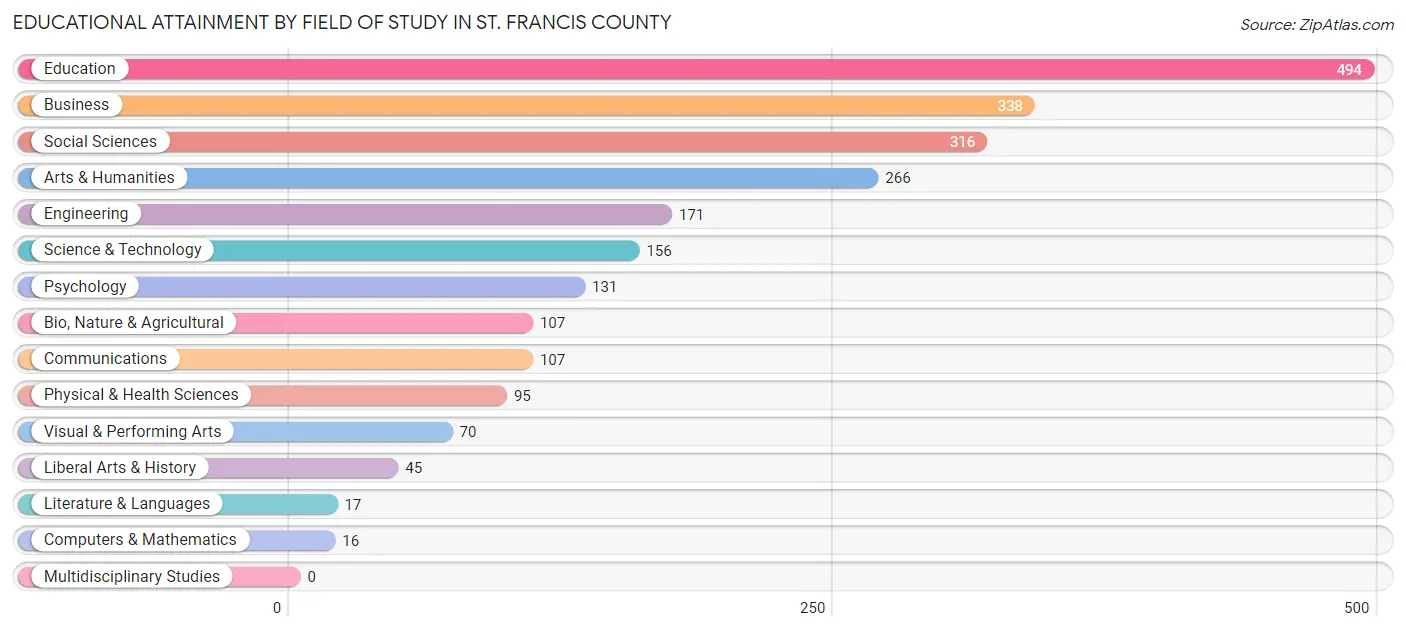
Educational Attainment by Field of Study in St. Francis County
Education (494 | 21.2%), business (338 | 14.5%), social sciences (316 | 13.6%), arts & humanities (266 | 11.4%), and engineering (171 | 7.3%) are the most common fields of study among 2,329 individuals in St. Francis County who have obtained a bachelor's degree or higher.
| Field of Study | # Graduates | % Graduates |
| Computers & Mathematics | 16 | 0.7% |
| Bio, Nature & Agricultural | 107 | 4.6% |
| Physical & Health Sciences | 95 | 4.1% |
| Psychology | 131 | 5.6% |
| Social Sciences | 316 | 13.6% |
| Engineering | 171 | 7.3% |
| Multidisciplinary Studies | 0 | 0.0% |
| Science & Technology | 156 | 6.7% |
| Business | 338 | 14.5% |
| Education | 494 | 21.2% |
| Literature & Languages | 17 | 0.7% |
| Liberal Arts & History | 45 | 1.9% |
| Visual & Performing Arts | 70 | 3.0% |
| Communications | 107 | 4.6% |
| Arts & Humanities | 266 | 11.4% |
| Total | 2,329 | 100.0% |
Transportation & Commute in St. Francis County
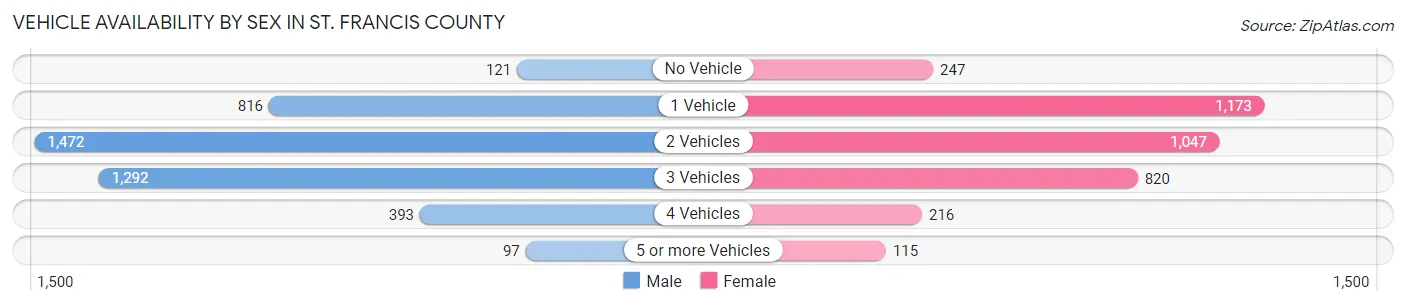
Vehicle Availability by Sex in St. Francis County
The most prevalent vehicle ownership categories in St. Francis County are males with 2 vehicles (1,472, accounting for 35.1%) and females with 2 vehicles (1,047, making up 40.7%).
| Vehicles Available | Male | Female |
| No Vehicle | 121 (2.9%) | 247 (6.8%) |
| 1 Vehicle | 816 (19.5%) | 1,173 (32.4%) |
| 2 Vehicles | 1,472 (35.1%) | 1,047 (28.9%) |
| 3 Vehicles | 1,292 (30.8%) | 820 (22.7%) |
| 4 Vehicles | 393 (9.4%) | 216 (6.0%) |
| 5 or more Vehicles | 97 (2.3%) | 115 (3.2%) |
| Total | 4,191 (100.0%) | 3,618 (100.0%) |
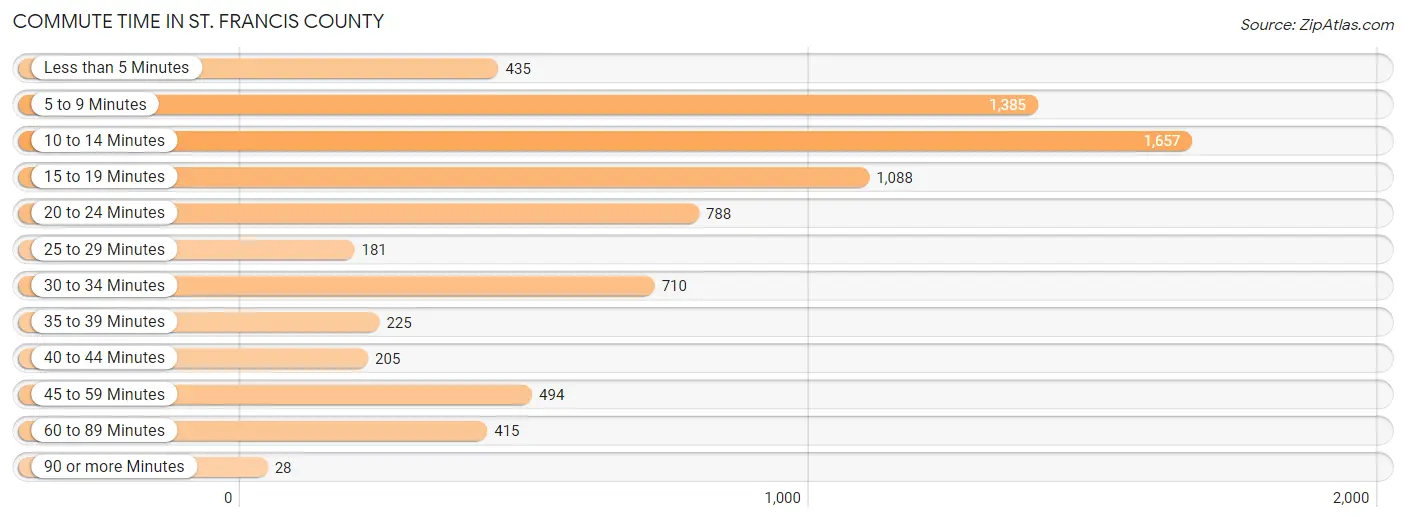
Commute Time in St. Francis County
The most frequently occuring commute durations in St. Francis County are 10 to 14 minutes (1,657 commuters, 21.8%), 5 to 9 minutes (1,385 commuters, 18.2%), and 15 to 19 minutes (1,088 commuters, 14.3%).
| Commute Time | # Commuters | % Commuters |
| Less than 5 Minutes | 435 | 5.7% |
| 5 to 9 Minutes | 1,385 | 18.2% |
| 10 to 14 Minutes | 1,657 | 21.8% |
| 15 to 19 Minutes | 1,088 | 14.3% |
| 20 to 24 Minutes | 788 | 10.3% |
| 25 to 29 Minutes | 181 | 2.4% |
| 30 to 34 Minutes | 710 | 9.3% |
| 35 to 39 Minutes | 225 | 3.0% |
| 40 to 44 Minutes | 205 | 2.7% |
| 45 to 59 Minutes | 494 | 6.5% |
| 60 to 89 Minutes | 415 | 5.4% |
| 90 or more Minutes | 28 | 0.4% |
Commute Time by Sex in St. Francis County
The most common commute times in St. Francis County are 10 to 14 minutes (934 commuters, 22.9%) for males and 10 to 14 minutes (723 commuters, 20.4%) for females.
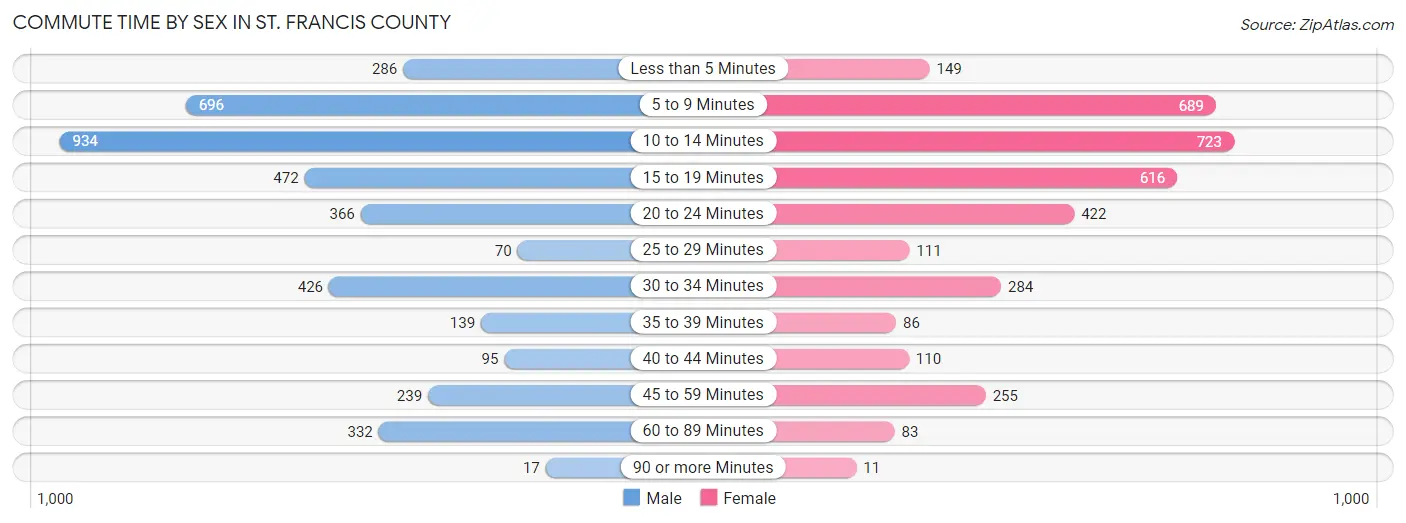
| Commute Time | Male | Female |
| Less than 5 Minutes | 286 (7.0%) | 149 (4.2%) |
| 5 to 9 Minutes | 696 (17.1%) | 689 (19.5%) |
| 10 to 14 Minutes | 934 (22.9%) | 723 (20.4%) |
| 15 to 19 Minutes | 472 (11.6%) | 616 (17.4%) |
| 20 to 24 Minutes | 366 (9.0%) | 422 (11.9%) |
| 25 to 29 Minutes | 70 (1.7%) | 111 (3.1%) |
| 30 to 34 Minutes | 426 (10.5%) | 284 (8.0%) |
| 35 to 39 Minutes | 139 (3.4%) | 86 (2.4%) |
| 40 to 44 Minutes | 95 (2.3%) | 110 (3.1%) |
| 45 to 59 Minutes | 239 (5.9%) | 255 (7.2%) |
| 60 to 89 Minutes | 332 (8.2%) | 83 (2.4%) |
| 90 or more Minutes | 17 (0.4%) | 11 (0.3%) |
Time of Departure to Work by Sex in St. Francis County
The most frequent times of departure to work in St. Francis County are 7:30 AM to 7:59 AM (534, 13.1%) for males and 7:30 AM to 7:59 AM (726, 20.5%) for females.
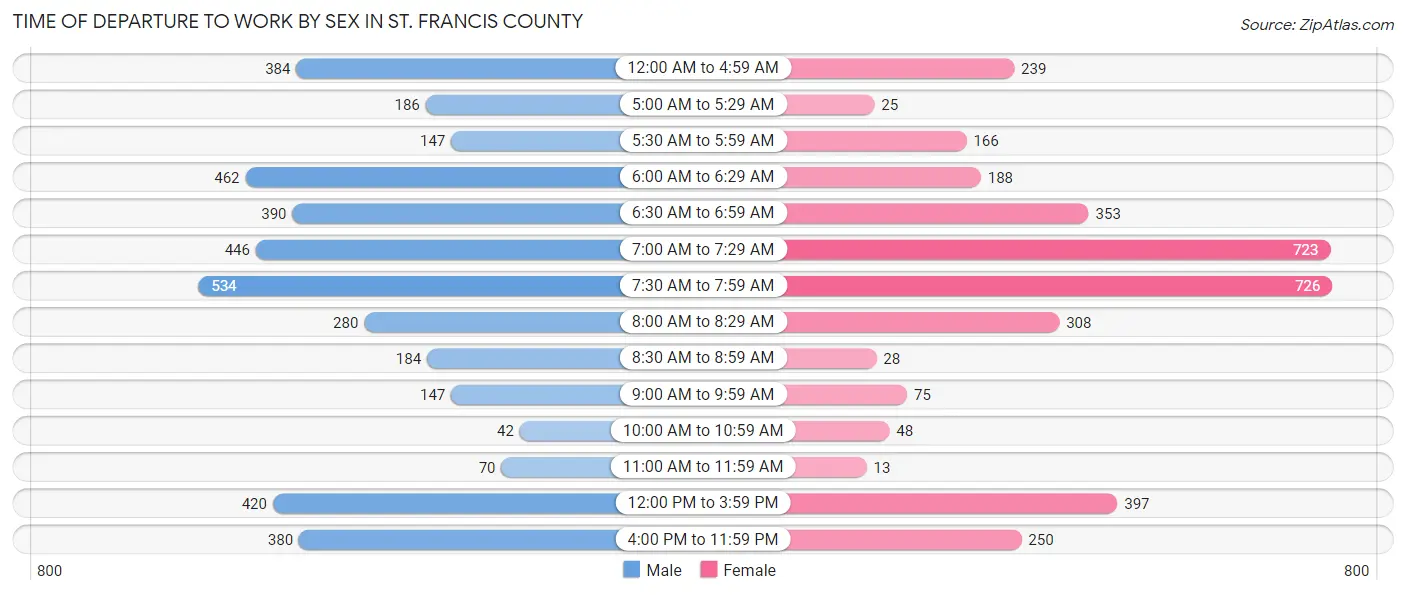
| Time of Departure | Male | Female |
| 12:00 AM to 4:59 AM | 384 (9.4%) | 239 (6.8%) |
| 5:00 AM to 5:29 AM | 186 (4.6%) | 25 (0.7%) |
| 5:30 AM to 5:59 AM | 147 (3.6%) | 166 (4.7%) |
| 6:00 AM to 6:29 AM | 462 (11.4%) | 188 (5.3%) |
| 6:30 AM to 6:59 AM | 390 (9.6%) | 353 (10.0%) |
| 7:00 AM to 7:29 AM | 446 (11.0%) | 723 (20.4%) |
| 7:30 AM to 7:59 AM | 534 (13.1%) | 726 (20.5%) |
| 8:00 AM to 8:29 AM | 280 (6.9%) | 308 (8.7%) |
| 8:30 AM to 8:59 AM | 184 (4.5%) | 28 (0.8%) |
| 9:00 AM to 9:59 AM | 147 (3.6%) | 75 (2.1%) |
| 10:00 AM to 10:59 AM | 42 (1.0%) | 48 (1.4%) |
| 11:00 AM to 11:59 AM | 70 (1.7%) | 13 (0.4%) |
| 12:00 PM to 3:59 PM | 420 (10.3%) | 397 (11.2%) |
| 4:00 PM to 11:59 PM | 380 (9.3%) | 250 (7.1%) |
| Total | 4,072 (100.0%) | 3,539 (100.0%) |
Housing Occupancy in St. Francis County
Occupancy by Ownership in St. Francis County
Of the total 8,102 dwellings in St. Francis County, owner-occupied units account for 4,395 (54.2%), while renter-occupied units make up 3,707 (45.8%).
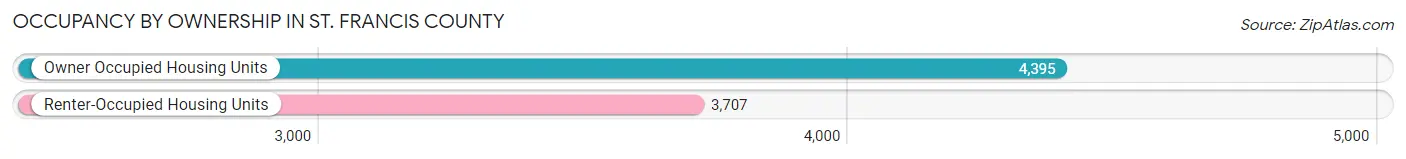
| Occupancy | # Housing Units | % Housing Units |
| Owner Occupied Housing Units | 4,395 | 54.2% |
| Renter-Occupied Housing Units | 3,707 | 45.8% |
| Total Occupied Housing Units | 8,102 | 100.0% |
Occupancy by Household Size in St. Francis County
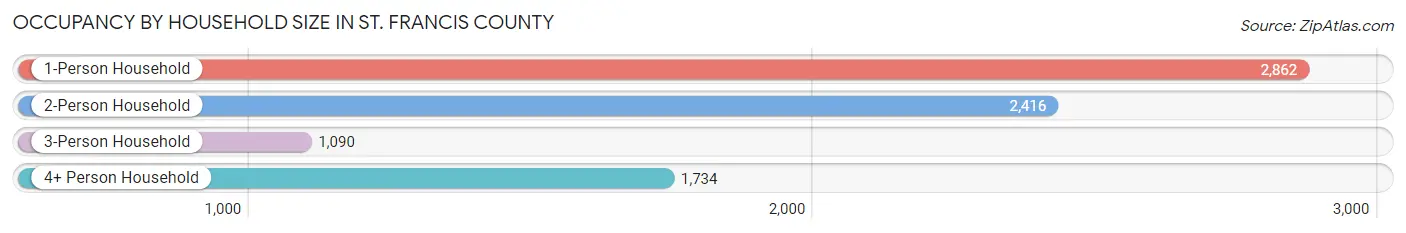
| Household Size | # Housing Units | % Housing Units |
| 1-Person Household | 2,862 | 35.3% |
| 2-Person Household | 2,416 | 29.8% |
| 3-Person Household | 1,090 | 13.5% |
| 4+ Person Household | 1,734 | 21.4% |
| Total Housing Units | 8,102 | 100.0% |
Occupancy by Ownership by Household Size in St. Francis County
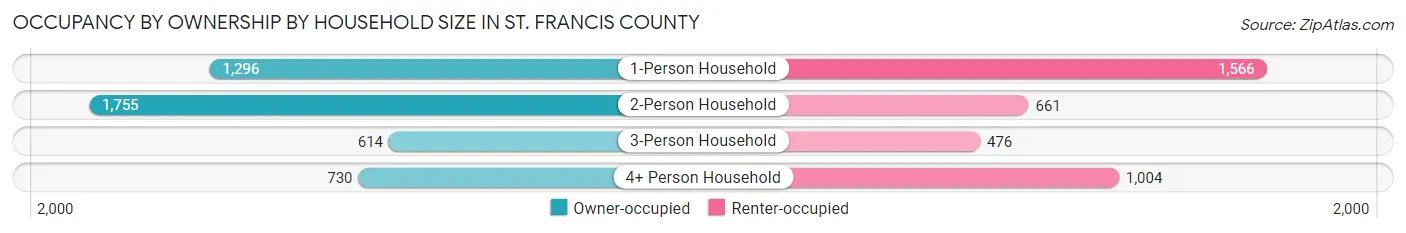
| Household Size | Owner-occupied | Renter-occupied |
| 1-Person Household | 1,296 (45.3%) | 1,566 (54.7%) |
| 2-Person Household | 1,755 (72.6%) | 661 (27.4%) |
| 3-Person Household | 614 (56.3%) | 476 (43.7%) |
| 4+ Person Household | 730 (42.1%) | 1,004 (57.9%) |
| Total Housing Units | 4,395 (54.2%) | 3,707 (45.8%) |
Occupancy by Educational Attainment in St. Francis County
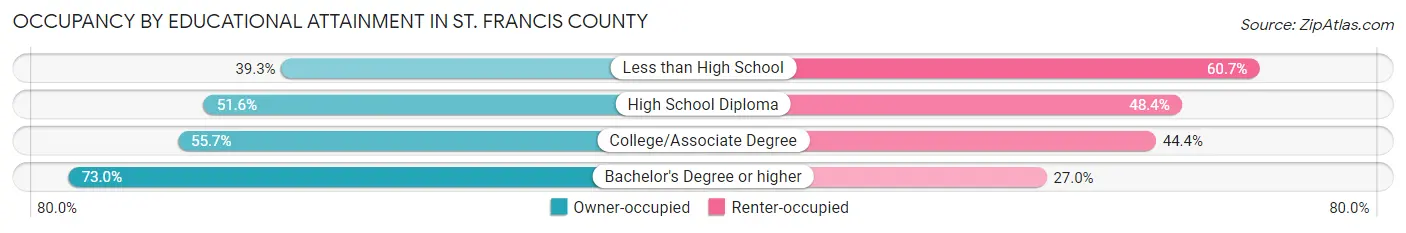
| Household Size | Owner-occupied | Renter-occupied |
| Less than High School | 552 (39.3%) | 854 (60.7%) |
| High School Diploma | 1,474 (51.6%) | 1,384 (48.4%) |
| College/Associate Degree | 1,388 (55.6%) | 1,106 (44.4%) |
| Bachelor's Degree or higher | 981 (73.0%) | 363 (27.0%) |
Occupancy by Age of Householder in St. Francis County
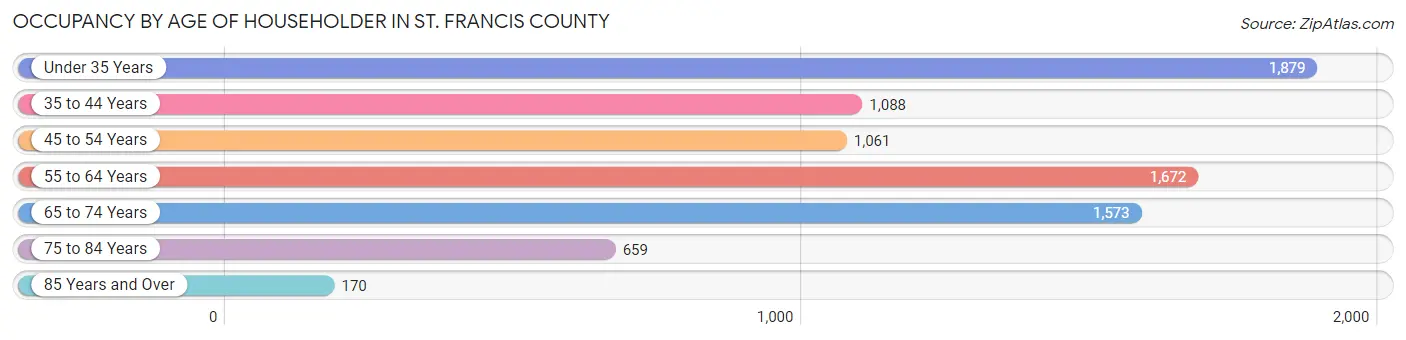
| Age Bracket | # Households | % Households |
| Under 35 Years | 1,879 | 23.2% |
| 35 to 44 Years | 1,088 | 13.4% |
| 45 to 54 Years | 1,061 | 13.1% |
| 55 to 64 Years | 1,672 | 20.6% |
| 65 to 74 Years | 1,573 | 19.4% |
| 75 to 84 Years | 659 | 8.1% |
| 85 Years and Over | 170 | 2.1% |
| Total | 8,102 | 100.0% |
Housing Finances in St. Francis County
Median Income by Occupancy in St. Francis County
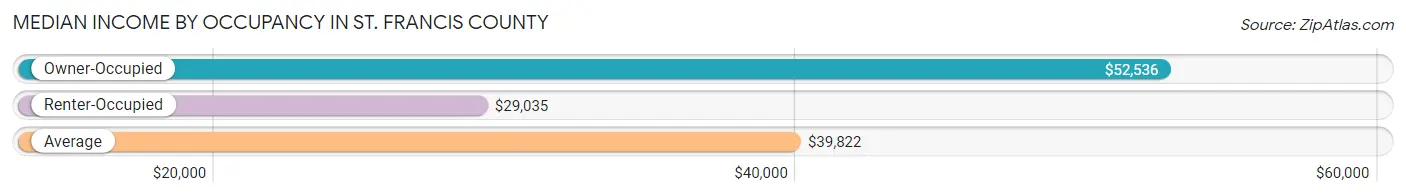
| Occupancy Type | # Households | Median Income |
| Owner-Occupied | 4,395 (54.2%) | $52,536 |
| Renter-Occupied | 3,707 (45.8%) | $29,035 |
| Average | 8,102 (100.0%) | $39,822 |
Occupancy by Householder Income Bracket in St. Francis County
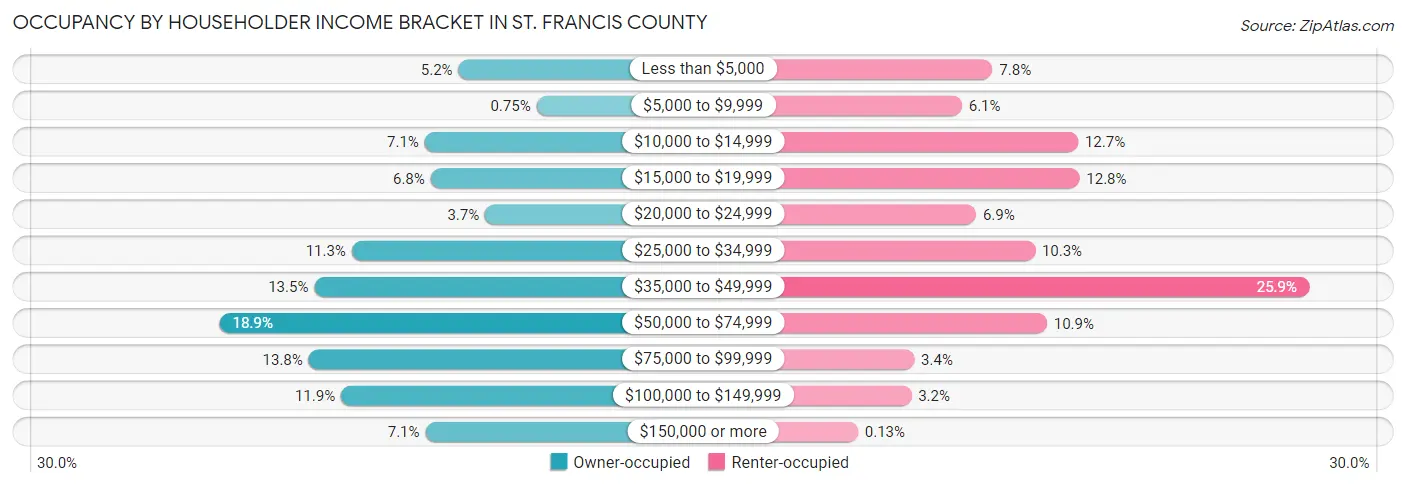
| Income Bracket | Owner-occupied | Renter-occupied |
| Less than $5,000 | 229 (5.2%) | 290 (7.8%) |
| $5,000 to $9,999 | 33 (0.7%) | 225 (6.1%) |
| $10,000 to $14,999 | 314 (7.1%) | 471 (12.7%) |
| $15,000 to $19,999 | 299 (6.8%) | 474 (12.8%) |
| $20,000 to $24,999 | 162 (3.7%) | 255 (6.9%) |
| $25,000 to $34,999 | 497 (11.3%) | 380 (10.2%) |
| $35,000 to $49,999 | 591 (13.5%) | 960 (25.9%) |
| $50,000 to $74,999 | 829 (18.9%) | 405 (10.9%) |
| $75,000 to $99,999 | 605 (13.8%) | 124 (3.4%) |
| $100,000 to $149,999 | 524 (11.9%) | 118 (3.2%) |
| $150,000 or more | 312 (7.1%) | 5 (0.1%) |
| Total | 4,395 (100.0%) | 3,707 (100.0%) |
Monthly Housing Cost Tiers in St. Francis County
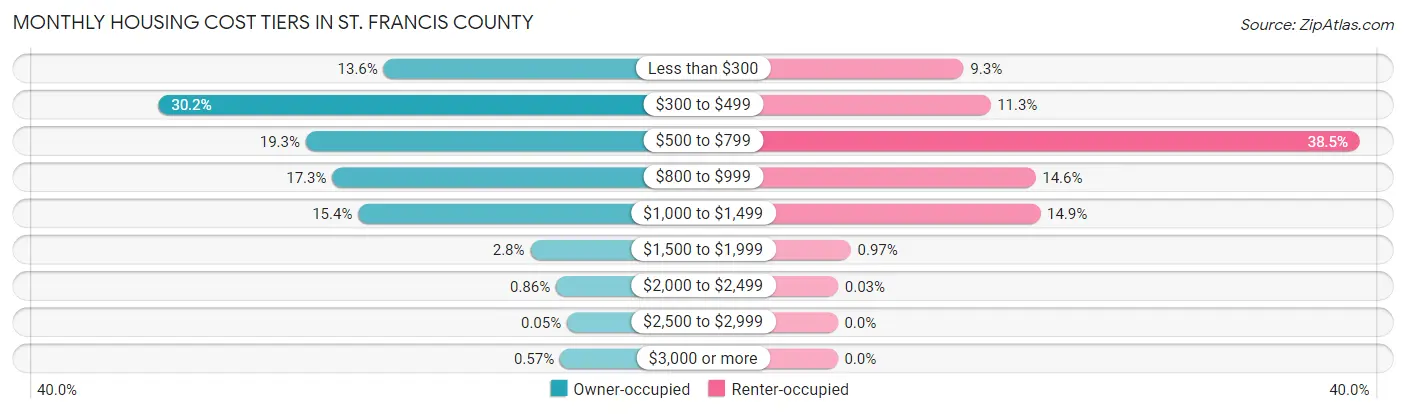
| Monthly Cost | Owner-occupied | Renter-occupied |
| Less than $300 | 596 (13.6%) | 344 (9.3%) |
| $300 to $499 | 1,325 (30.1%) | 417 (11.3%) |
| $500 to $799 | 848 (19.3%) | 1,426 (38.5%) |
| $800 to $999 | 762 (17.3%) | 540 (14.6%) |
| $1,000 to $1,499 | 678 (15.4%) | 553 (14.9%) |
| $1,500 to $1,999 | 121 (2.8%) | 36 (1.0%) |
| $2,000 to $2,499 | 38 (0.9%) | 1 (0.0%) |
| $2,500 to $2,999 | 2 (0.1%) | 0 (0.0%) |
| $3,000 or more | 25 (0.6%) | 0 (0.0%) |
| Total | 4,395 (100.0%) | 3,707 (100.0%) |
Physical Housing Characteristics in St. Francis County
Housing Structures in St. Francis County
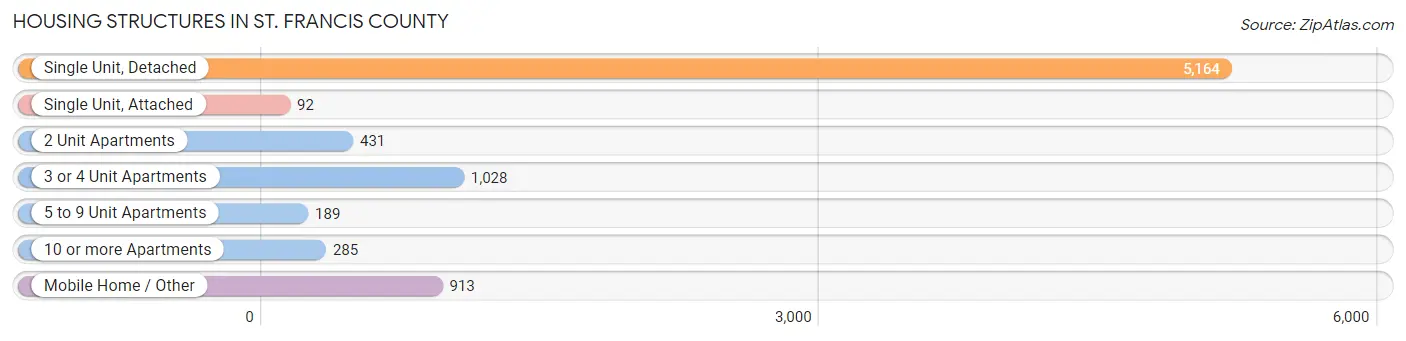
| Structure Type | # Housing Units | % Housing Units |
| Single Unit, Detached | 5,164 | 63.7% |
| Single Unit, Attached | 92 | 1.1% |
| 2 Unit Apartments | 431 | 5.3% |
| 3 or 4 Unit Apartments | 1,028 | 12.7% |
| 5 to 9 Unit Apartments | 189 | 2.3% |
| 10 or more Apartments | 285 | 3.5% |
| Mobile Home / Other | 913 | 11.3% |
| Total | 8,102 | 100.0% |
Housing Structures by Occupancy in St. Francis County
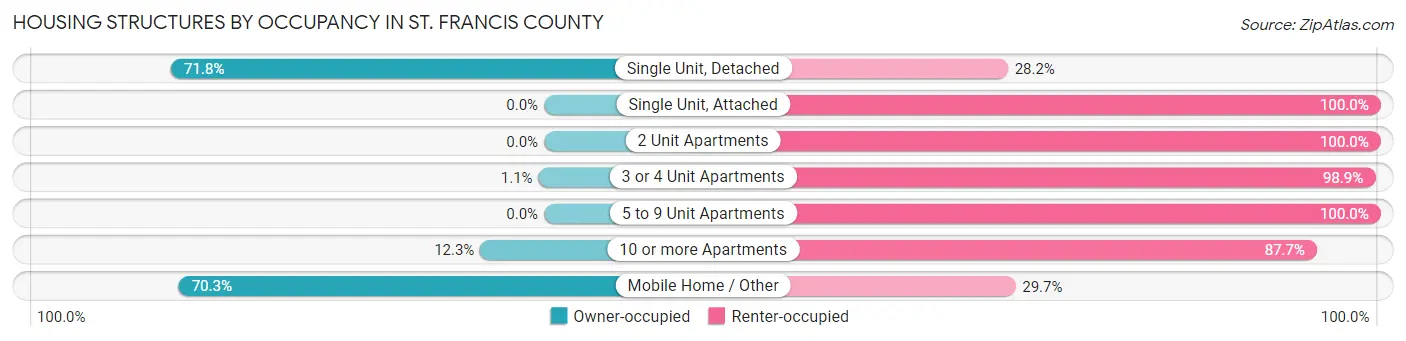
| Structure Type | Owner-occupied | Renter-occupied |
| Single Unit, Detached | 3,707 (71.8%) | 1,457 (28.2%) |
| Single Unit, Attached | 0 (0.0%) | 92 (100.0%) |
| 2 Unit Apartments | 0 (0.0%) | 431 (100.0%) |
| 3 or 4 Unit Apartments | 11 (1.1%) | 1,017 (98.9%) |
| 5 to 9 Unit Apartments | 0 (0.0%) | 189 (100.0%) |
| 10 or more Apartments | 35 (12.3%) | 250 (87.7%) |
| Mobile Home / Other | 642 (70.3%) | 271 (29.7%) |
| Total | 4,395 (54.2%) | 3,707 (45.8%) |
Housing Structures by Number of Rooms in St. Francis County
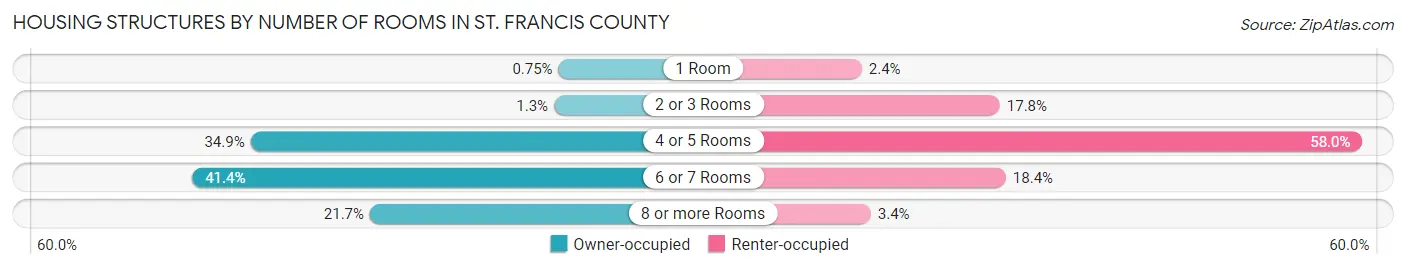
| Number of Rooms | Owner-occupied | Renter-occupied |
| 1 Room | 33 (0.7%) | 90 (2.4%) |
| 2 or 3 Rooms | 55 (1.3%) | 658 (17.7%) |
| 4 or 5 Rooms | 1,535 (34.9%) | 2,149 (58.0%) |
| 6 or 7 Rooms | 1,819 (41.4%) | 683 (18.4%) |
| 8 or more Rooms | 953 (21.7%) | 127 (3.4%) |
| Total | 4,395 (100.0%) | 3,707 (100.0%) |
Housing Structure by Heating Type in St. Francis County
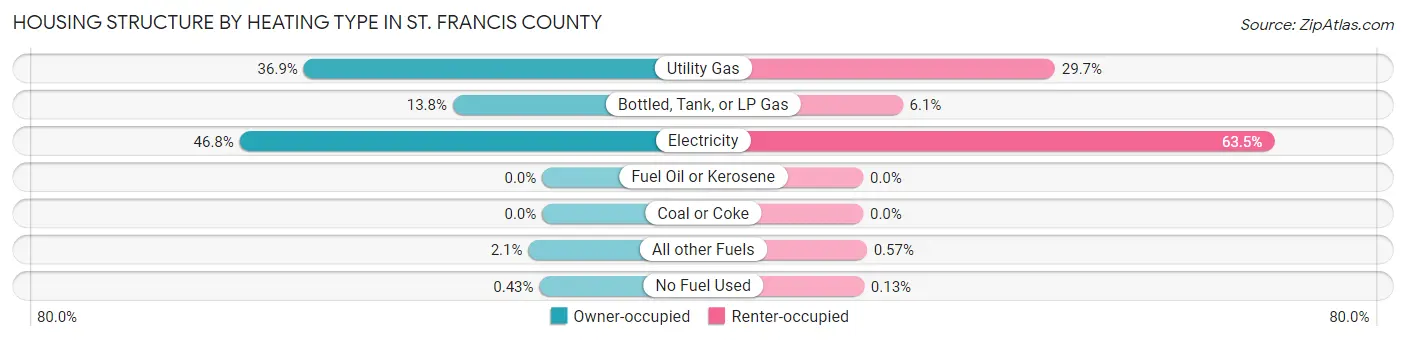
| Heating Type | Owner-occupied | Renter-occupied |
| Utility Gas | 1,620 (36.9%) | 1,099 (29.6%) |
| Bottled, Tank, or LP Gas | 607 (13.8%) | 227 (6.1%) |
| Electricity | 2,055 (46.8%) | 2,355 (63.5%) |
| Fuel Oil or Kerosene | 0 (0.0%) | 0 (0.0%) |
| Coal or Coke | 0 (0.0%) | 0 (0.0%) |
| All other Fuels | 94 (2.1%) | 21 (0.6%) |
| No Fuel Used | 19 (0.4%) | 5 (0.1%) |
| Total | 4,395 (100.0%) | 3,707 (100.0%) |
Household Vehicle Usage in St. Francis County
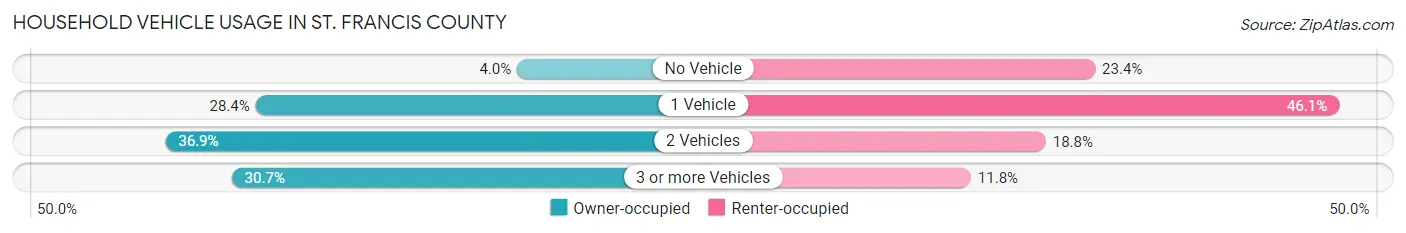
| Vehicles per Household | Owner-occupied | Renter-occupied |
| No Vehicle | 177 (4.0%) | 866 (23.4%) |
| 1 Vehicle | 1,250 (28.4%) | 1,710 (46.1%) |
| 2 Vehicles | 1,620 (36.9%) | 695 (18.8%) |
| 3 or more Vehicles | 1,348 (30.7%) | 436 (11.8%) |
| Total | 4,395 (100.0%) | 3,707 (100.0%) |
Real Estate & Mortgages in St. Francis County
Real Estate and Mortgage Overview in St. Francis County
| Characteristic | Without Mortgage | With Mortgage |
| Housing Units | 2,503 | 1,892 |
| Median Property Value | $75,900 | $92,700 |
| Median Household Income | $42,476 | $162 |
| Monthly Housing Costs | $397 | $25 |
| Real Estate Taxes | $433 | $335 |
Property Value by Mortgage Status in St. Francis County
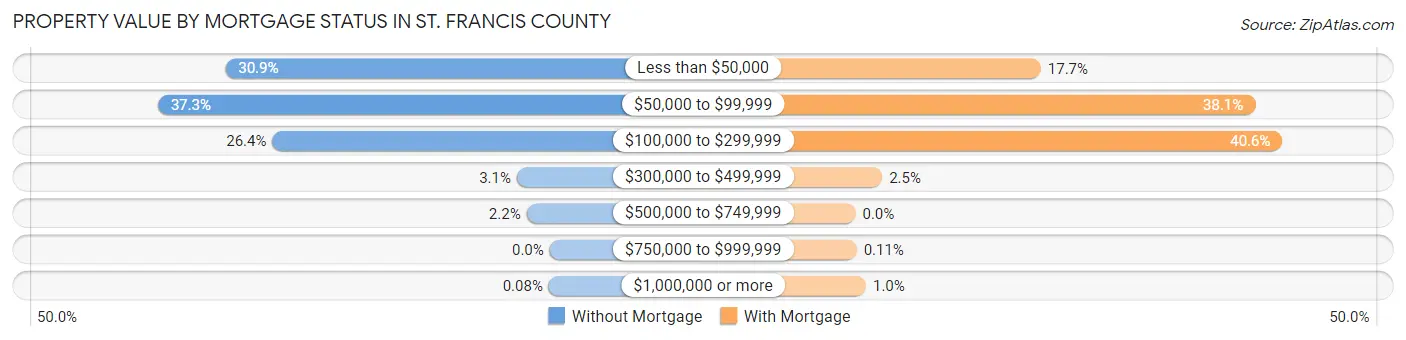
| Property Value | Without Mortgage | With Mortgage |
| Less than $50,000 | 773 (30.9%) | 334 (17.6%) |
| $50,000 to $99,999 | 934 (37.3%) | 720 (38.1%) |
| $100,000 to $299,999 | 661 (26.4%) | 769 (40.6%) |
| $300,000 to $499,999 | 78 (3.1%) | 48 (2.5%) |
| $500,000 to $749,999 | 55 (2.2%) | 0 (0.0%) |
| $750,000 to $999,999 | 0 (0.0%) | 2 (0.1%) |
| $1,000,000 or more | 2 (0.1%) | 19 (1.0%) |
| Total | 2,503 (100.0%) | 1,892 (100.0%) |
Household Income by Mortgage Status in St. Francis County
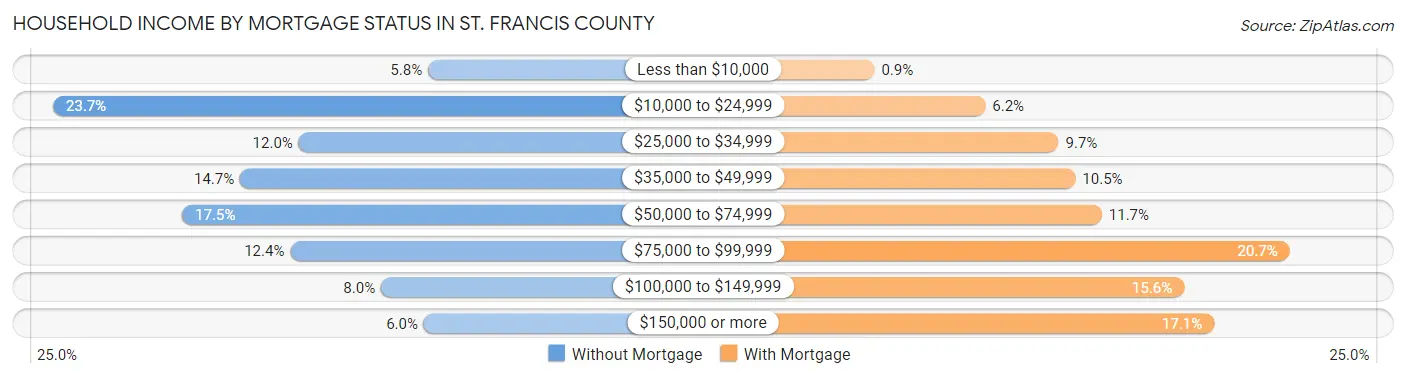
| Household Income | Without Mortgage | With Mortgage |
| Less than $10,000 | 145 (5.8%) | 17 (0.9%) |
| $10,000 to $24,999 | 592 (23.6%) | 117 (6.2%) |
| $25,000 to $34,999 | 299 (11.9%) | 183 (9.7%) |
| $35,000 to $49,999 | 369 (14.7%) | 198 (10.5%) |
| $50,000 to $74,999 | 438 (17.5%) | 222 (11.7%) |
| $75,000 to $99,999 | 309 (12.3%) | 391 (20.7%) |
| $100,000 to $149,999 | 201 (8.0%) | 296 (15.6%) |
| $150,000 or more | 150 (6.0%) | 323 (17.1%) |
| Total | 2,503 (100.0%) | 1,892 (100.0%) |
Property Value to Household Income Ratio in St. Francis County
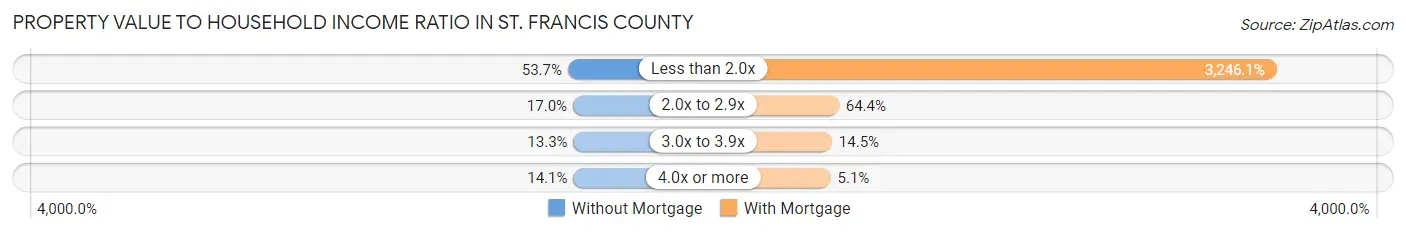
| Value-to-Income Ratio | Without Mortgage | With Mortgage |
| Less than 2.0x | 1,344 (53.7%) | 61,417 (3,246.1%) |
| 2.0x to 2.9x | 426 (17.0%) | 1,219 (64.4%) |
| 3.0x to 3.9x | 333 (13.3%) | 275 (14.5%) |
| 4.0x or more | 352 (14.1%) | 96 (5.1%) |
| Total | 2,503 (100.0%) | 1,892 (100.0%) |
Real Estate Taxes by Mortgage Status in St. Francis County
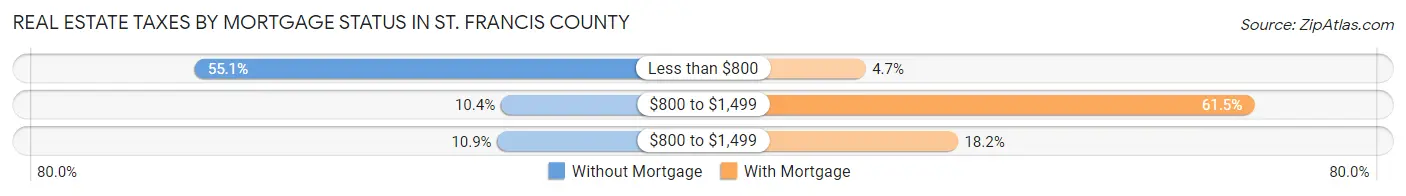
| Property Taxes | Without Mortgage | With Mortgage |
| Less than $800 | 1,380 (55.1%) | 89 (4.7%) |
| $800 to $1,499 | 260 (10.4%) | 1,164 (61.5%) |
| $800 to $1,499 | 273 (10.9%) | 344 (18.2%) |
| Total | 2,503 (100.0%) | 1,892 (100.0%) |
Health & Disability in St. Francis County
Health Insurance Coverage by Age in St. Francis County
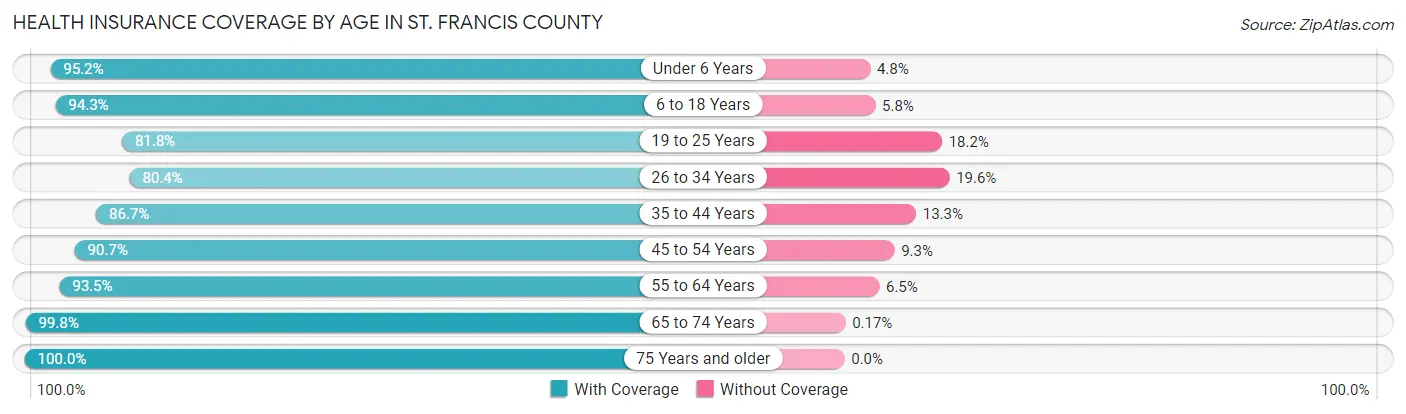
| Age Bracket | With Coverage | Without Coverage |
| Under 6 Years | 1,591 (95.2%) | 80 (4.8%) |
| 6 to 18 Years | 3,410 (94.3%) | 208 (5.8%) |
| 19 to 25 Years | 1,316 (81.8%) | 292 (18.2%) |
| 26 to 34 Years | 2,114 (80.4%) | 514 (19.6%) |
| 35 to 44 Years | 1,963 (86.7%) | 302 (13.3%) |
| 45 to 54 Years | 1,783 (90.7%) | 183 (9.3%) |
| 55 to 64 Years | 2,410 (93.5%) | 167 (6.5%) |
| 65 to 74 Years | 2,411 (99.8%) | 4 (0.2%) |
| 75 Years and older | 1,470 (100.0%) | 0 (0.0%) |
| Total | 18,468 (91.3%) | 1,750 (8.7%) |
Health Insurance Coverage by Citizenship Status in St. Francis County
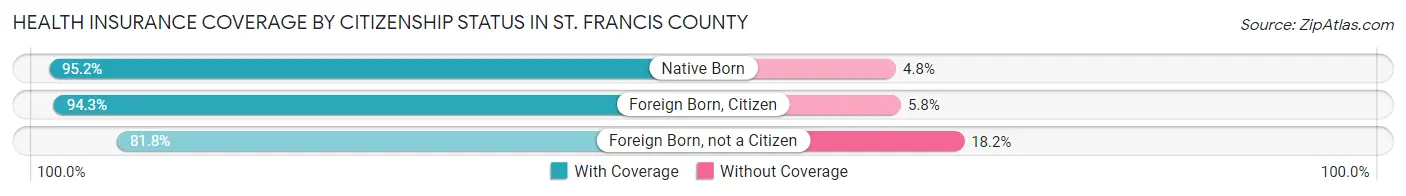
| Citizenship Status | With Coverage | Without Coverage |
| Native Born | 1,591 (95.2%) | 80 (4.8%) |
| Foreign Born, Citizen | 3,410 (94.3%) | 208 (5.8%) |
| Foreign Born, not a Citizen | 1,316 (81.8%) | 292 (18.2%) |
Health Insurance Coverage by Household Income in St. Francis County
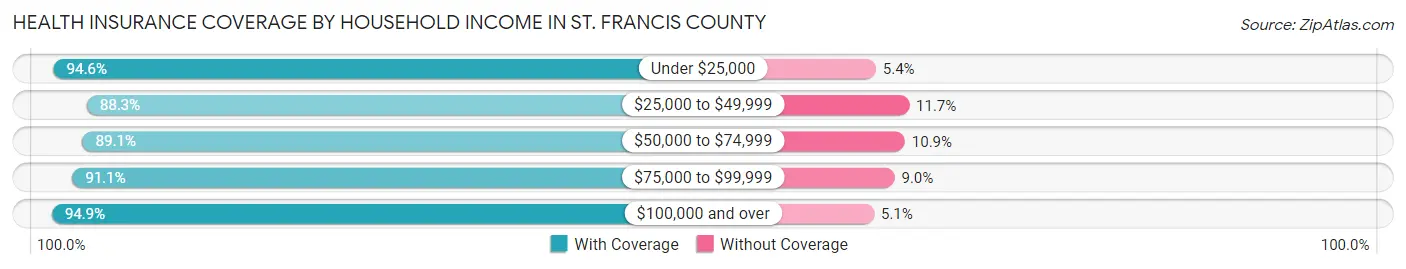
| Household Income | With Coverage | Without Coverage |
| Under $25,000 | 4,869 (94.6%) | 280 (5.4%) |
| $25,000 to $49,999 | 5,081 (88.3%) | 671 (11.7%) |
| $50,000 to $74,999 | 3,351 (89.1%) | 409 (10.9%) |
| $75,000 to $99,999 | 2,178 (91.0%) | 214 (8.9%) |
| $100,000 and over | 2,921 (94.9%) | 157 (5.1%) |
Public vs Private Health Insurance Coverage by Age in St. Francis County
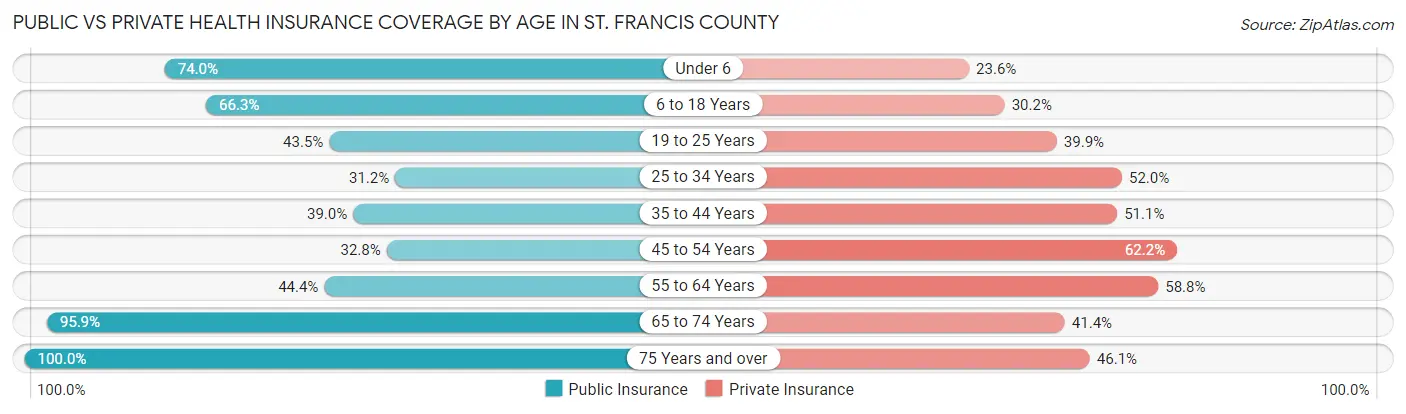
| Age Bracket | Public Insurance | Private Insurance |
| Under 6 | 1,236 (74.0%) | 395 (23.6%) |
| 6 to 18 Years | 2,399 (66.3%) | 1,094 (30.2%) |
| 19 to 25 Years | 699 (43.5%) | 642 (39.9%) |
| 25 to 34 Years | 821 (31.2%) | 1,367 (52.0%) |
| 35 to 44 Years | 884 (39.0%) | 1,158 (51.1%) |
| 45 to 54 Years | 645 (32.8%) | 1,223 (62.2%) |
| 55 to 64 Years | 1,144 (44.4%) | 1,514 (58.8%) |
| 65 to 74 Years | 2,315 (95.9%) | 1,000 (41.4%) |
| 75 Years and over | 1,470 (100.0%) | 677 (46.1%) |
| Total | 11,613 (57.4%) | 9,070 (44.9%) |
Disability Status by Sex by Age in St. Francis County
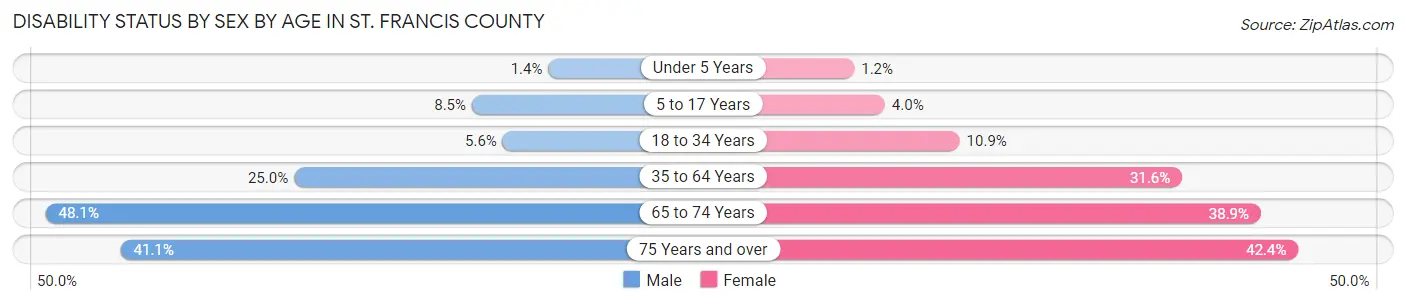
| Age Bracket | Male | Female |
| Under 5 Years | 10 (1.4%) | 8 (1.2%) |
| 5 to 17 Years | 162 (8.5%) | 63 (4.0%) |
| 18 to 34 Years | 143 (5.6%) | 229 (10.9%) |
| 35 to 64 Years | 768 (25.0%) | 1,180 (31.6%) |
| 65 to 74 Years | 518 (48.0%) | 520 (38.9%) |
| 75 Years and over | 249 (41.1%) | 366 (42.4%) |
Disability Class by Sex by Age in St. Francis County
Disability Class: Hearing Difficulty
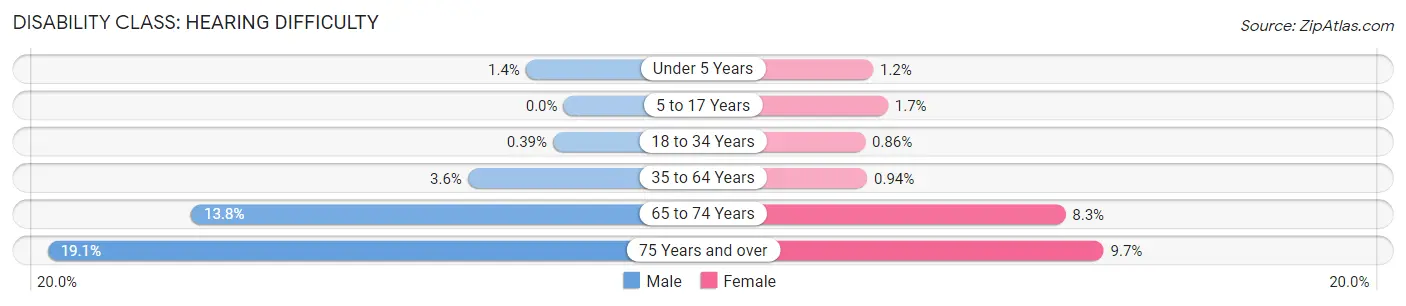
| Age Bracket | Male | Female |
| Under 5 Years | 10 (1.4%) | 8 (1.2%) |
| 5 to 17 Years | 0 (0.0%) | 27 (1.7%) |
| 18 to 34 Years | 10 (0.4%) | 18 (0.9%) |
| 35 to 64 Years | 109 (3.5%) | 35 (0.9%) |
| 65 to 74 Years | 149 (13.8%) | 111 (8.3%) |
| 75 Years and over | 116 (19.1%) | 84 (9.7%) |
Disability Class: Vision Difficulty
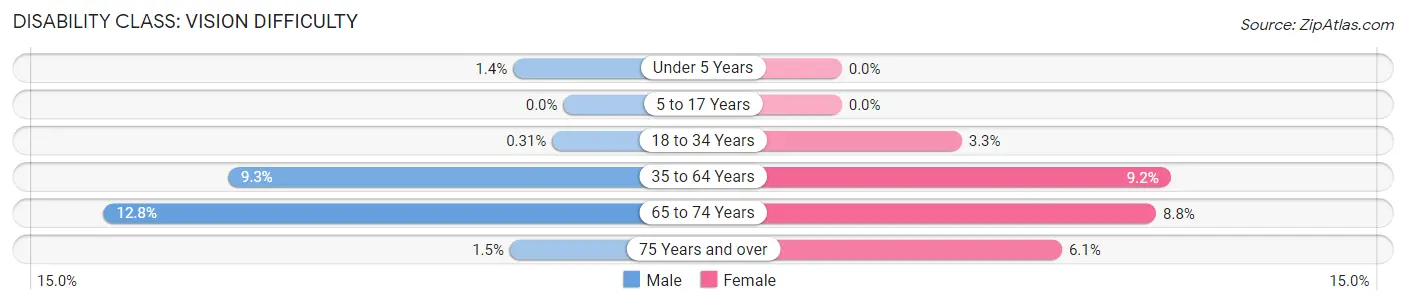
| Age Bracket | Male | Female |
| Under 5 Years | 10 (1.4%) | 0 (0.0%) |
| 5 to 17 Years | 0 (0.0%) | 0 (0.0%) |
| 18 to 34 Years | 8 (0.3%) | 70 (3.3%) |
| 35 to 64 Years | 287 (9.3%) | 342 (9.1%) |
| 65 to 74 Years | 138 (12.8%) | 117 (8.7%) |
| 75 Years and over | 9 (1.5%) | 53 (6.1%) |
Disability Class: Cognitive Difficulty
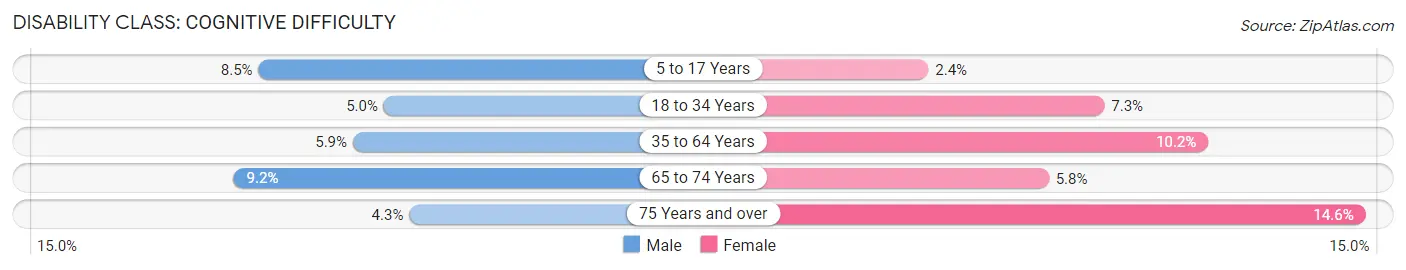
| Age Bracket | Male | Female |
| 5 to 17 Years | 162 (8.5%) | 38 (2.4%) |
| 18 to 34 Years | 127 (5.0%) | 153 (7.3%) |
| 35 to 64 Years | 180 (5.9%) | 381 (10.2%) |
| 65 to 74 Years | 99 (9.2%) | 77 (5.8%) |
| 75 Years and over | 26 (4.3%) | 126 (14.6%) |
Disability Class: Ambulatory Difficulty
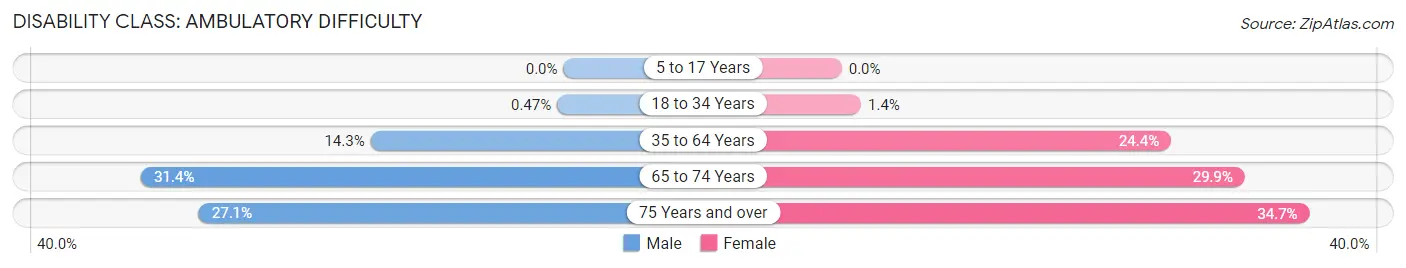
| Age Bracket | Male | Female |
| 5 to 17 Years | 0 (0.0%) | 0 (0.0%) |
| 18 to 34 Years | 12 (0.5%) | 30 (1.4%) |
| 35 to 64 Years | 440 (14.3%) | 913 (24.4%) |
| 65 to 74 Years | 338 (31.4%) | 400 (29.9%) |
| 75 Years and over | 164 (27.1%) | 300 (34.7%) |
Disability Class: Self-Care Difficulty
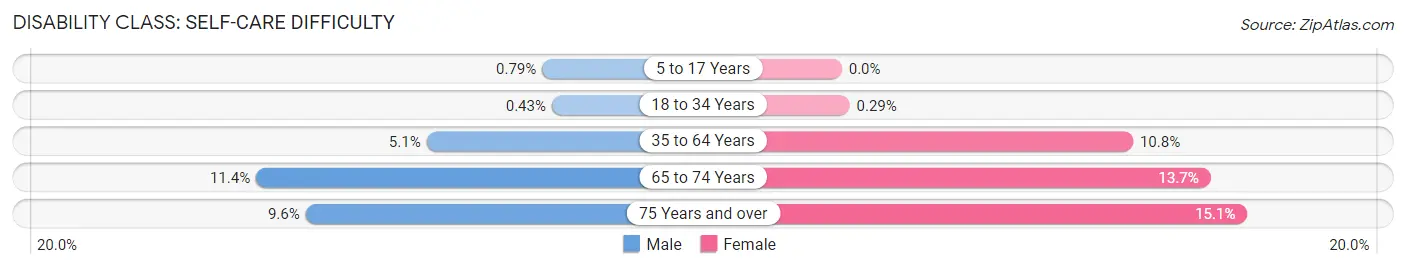
| Age Bracket | Male | Female |
| 5 to 17 Years | 15 (0.8%) | 0 (0.0%) |
| 18 to 34 Years | 11 (0.4%) | 6 (0.3%) |
| 35 to 64 Years | 156 (5.1%) | 404 (10.8%) |
| 65 to 74 Years | 123 (11.4%) | 183 (13.7%) |
| 75 Years and over | 58 (9.6%) | 130 (15.0%) |
Technology Access in St. Francis County
Computing Device Access in St. Francis County
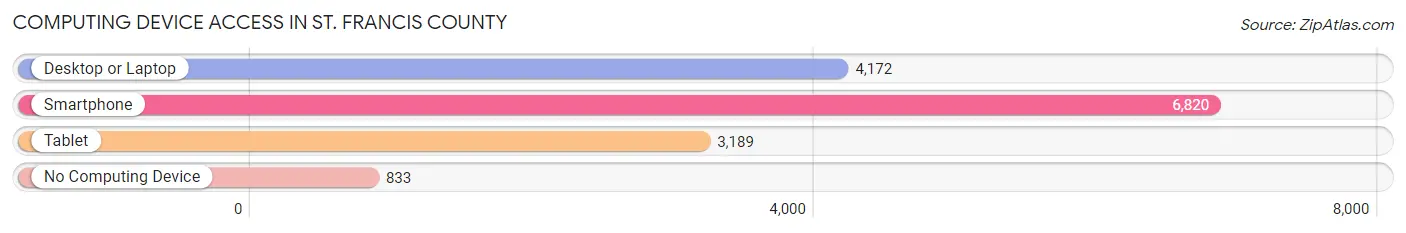
| Device Type | # Households | % Households |
| Desktop or Laptop | 4,172 | 51.5% |
| Smartphone | 6,820 | 84.2% |
| Tablet | 3,189 | 39.4% |
| No Computing Device | 833 | 10.3% |
| Total | 8,102 | 100.0% |
Internet Access in St. Francis County
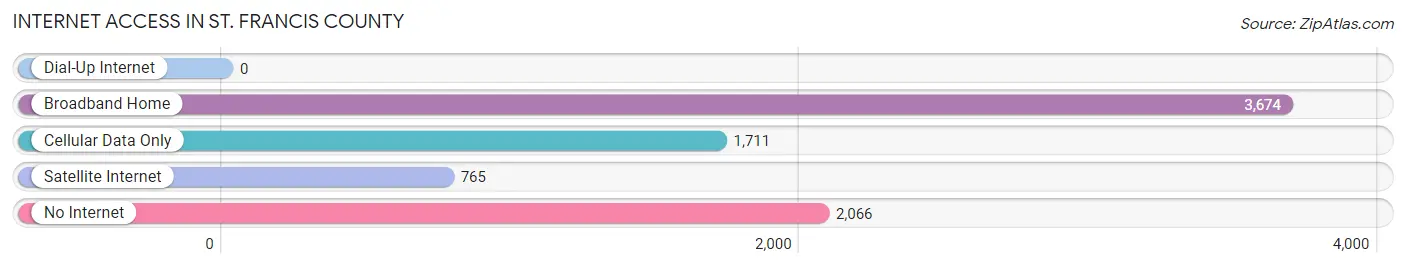
| Internet Type | # Households | % Households |
| Dial-Up Internet | 0 | 0.0% |
| Broadband Home | 3,674 | 45.4% |
| Cellular Data Only | 1,711 | 21.1% |
| Satellite Internet | 765 | 9.4% |
| No Internet | 2,066 | 25.5% |
| Total | 8,102 | 100.0% |
St. Francis County Summary
St. Francis County is located in the eastern part of Arkansas, in the Mississippi Delta region. It is bordered by Lee County to the north, Crittenden County to the east, Monroe County to the south, and Cross and Poinsett Counties to the west. The county seat is Forrest City, and the county has a total area of 602 square miles.
History
St. Francis County was established in 1827 and named after the St. Francis River. The county was originally part of Phillips County, but was split off in 1827. The county was home to several Native American tribes, including the Quapaw, Tunica, and Chickasaw. The first European settlers arrived in the area in the early 1800s, and the county was officially organized in 1827.
During the Civil War, St. Francis County was a major site of conflict. The Battle of Chalk Bluff was fought in the county in 1863, and the Battle of Helena was fought in the county in 1864. After the war, the county experienced a period of economic growth, with the development of the timber and cotton industries.
Geography
St. Francis County is located in the eastern part of Arkansas, in the Mississippi Delta region. It is bordered by Lee County to the north, Crittenden County to the east, Monroe County to the south, and Cross and Poinsett Counties to the west. The county has a total area of 602 square miles, and is mostly flat, with some rolling hills in the northern part of the county. The St. Francis River runs through the county, and there are several small lakes and ponds scattered throughout the county.
Economy
The economy of St. Francis County is largely based on agriculture. The county is home to several large farms, and the main crops grown in the county are cotton, soybeans, corn, and rice. The county also has a thriving timber industry, and there are several sawmills and lumber companies located in the county. In addition, the county is home to several manufacturing companies, including a furniture factory and a paper mill.
Demographics
As of the 2010 census, St. Francis County had a population of 28,258. The population was 53.2% White, 42.3% Black or African American, 0.4% Native American, 0.7% Asian, 0.1% Pacific Islander, 1.7% from other races, and 1.6% from two or more races. Hispanic or Latino of any race were 3.3% of the population.
The median household income in St. Francis County was $33,945, and the median family income was $41,945. The per capita income was $17,845. About 22.2% of the population was below the poverty line.
Common Questions
What is Per Capita Income in St. Francis County?
Per Capita income in St. Francis County is $20,991.
What is the Median Family Income in St. Francis County?
Median Family Income in St. Francis County is $47,612.
What is the Median Household income in St. Francis County?
Median Household Income in St. Francis County is $39,822.
What is Income or Wage Gap in St. Francis County?
Income or Wage Gap in St. Francis County is 7.0%.
Women in St. Francis County earn 93.0 cents for every dollar earned by a man.
What is Family Income Deficit in St. Francis County?
Family Income Deficit in St. Francis County is $8,530.
Families that are below poverty line in St. Francis County earn $8,530 less on average than the poverty threshold level.
What is Inequality or Gini Index in St. Francis County?
Inequality or Gini Index in St. Francis County is 0.50.
What is the Total Population of St. Francis County?
Total Population of St. Francis County is 23,138.
What is the Total Male Population of St. Francis County?
Total Male Population of St. Francis County is 12,793.
What is the Total Female Population of St. Francis County?
Total Female Population of St. Francis County is 10,345.
What is the Ratio of Males per 100 Females in St. Francis County?
There are 123.66 Males per 100 Females in St. Francis County.
What is the Ratio of Females per 100 Males in St. Francis County?
There are 80.86 Females per 100 Males in St. Francis County.
What is the Median Population Age in St. Francis County?
Median Population Age in St. Francis County is 38.8 Years.
What is the Average Family Size in St. Francis County
Average Family Size in St. Francis County is 3.2 People.
What is the Average Household Size in St. Francis County
Average Household Size in St. Francis County is 2.5 People.
How Large is the Labor Force in St. Francis County?
There are 8,550 People in the Labor Forcein in St. Francis County.
What is the Percentage of People in the Labor Force in St. Francis County?
45.7% of People are in the Labor Force in St. Francis County.
What is the Unemployment Rate in St. Francis County?
Unemployment Rate in St. Francis County is 6.6%.