Bryant, AR Map & Demographics
Bryant Map
Bryant Overview
$38,967
PER CAPITA INCOME
$96,221
AVG FAMILY INCOME
$76,282
AVG HOUSEHOLD INCOME
23.6%
WAGE / INCOME GAP [ % ]
76.4¢/ $1
WAGE / INCOME GAP [ $ ]
0.40
INEQUALITY / GINI INDEX
20,750
TOTAL POPULATION
9,490
MALE POPULATION
11,260
FEMALE POPULATION
84.28
MALES / 100 FEMALES
118.65
FEMALES / 100 MALES
36.7
MEDIAN AGE
3.0
AVG FAMILY SIZE
2.5
AVG HOUSEHOLD SIZE
11,097
LABOR FORCE [ PEOPLE ]
69.6%
PERCENT IN LABOR FORCE
3.6%
UNEMPLOYMENT RATE
Bryant Zip Codes
Bryant Area Codes
Income in Bryant
Income Overview in Bryant
Per Capita Income in Bryant is $38,967, while median incomes of families and households are $96,221 and $76,282 respectively.
| Characteristic | Number | Measure |
| Per Capita Income | 20,750 | $38,967 |
| Median Family Income | 5,540 | $96,221 |
| Mean Family Income | 5,540 | $111,071 |
| Median Household Income | 8,247 | $76,282 |
| Mean Household Income | 8,247 | $92,691 |
| Income Deficit | 5,540 | $0 |
| Wage / Income Gap (%) | 20,750 | 23.63% |
| Wage / Income Gap ($) | 20,750 | 76.37¢ per $1 |
| Gini / Inequality Index | 20,750 | 0.40 |
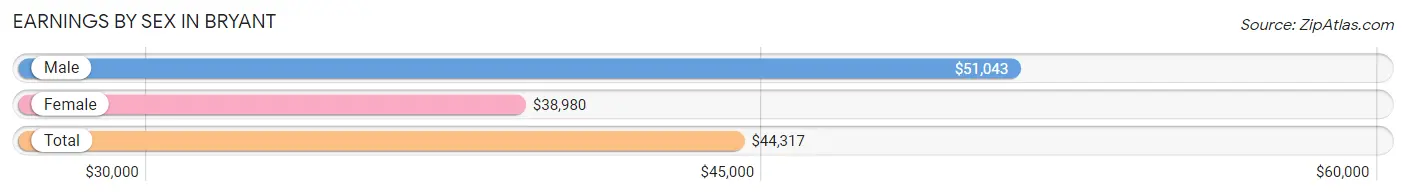
Earnings by Sex in Bryant
Average Earnings in Bryant are $44,317, $51,043 for men and $38,980 for women, a difference of 23.6%.
| Sex | Number | Average Earnings |
| Male | 5,580 (49.1%) | $51,043 |
| Female | 5,772 (50.8%) | $38,980 |
| Total | 11,352 (100.0%) | $44,317 |
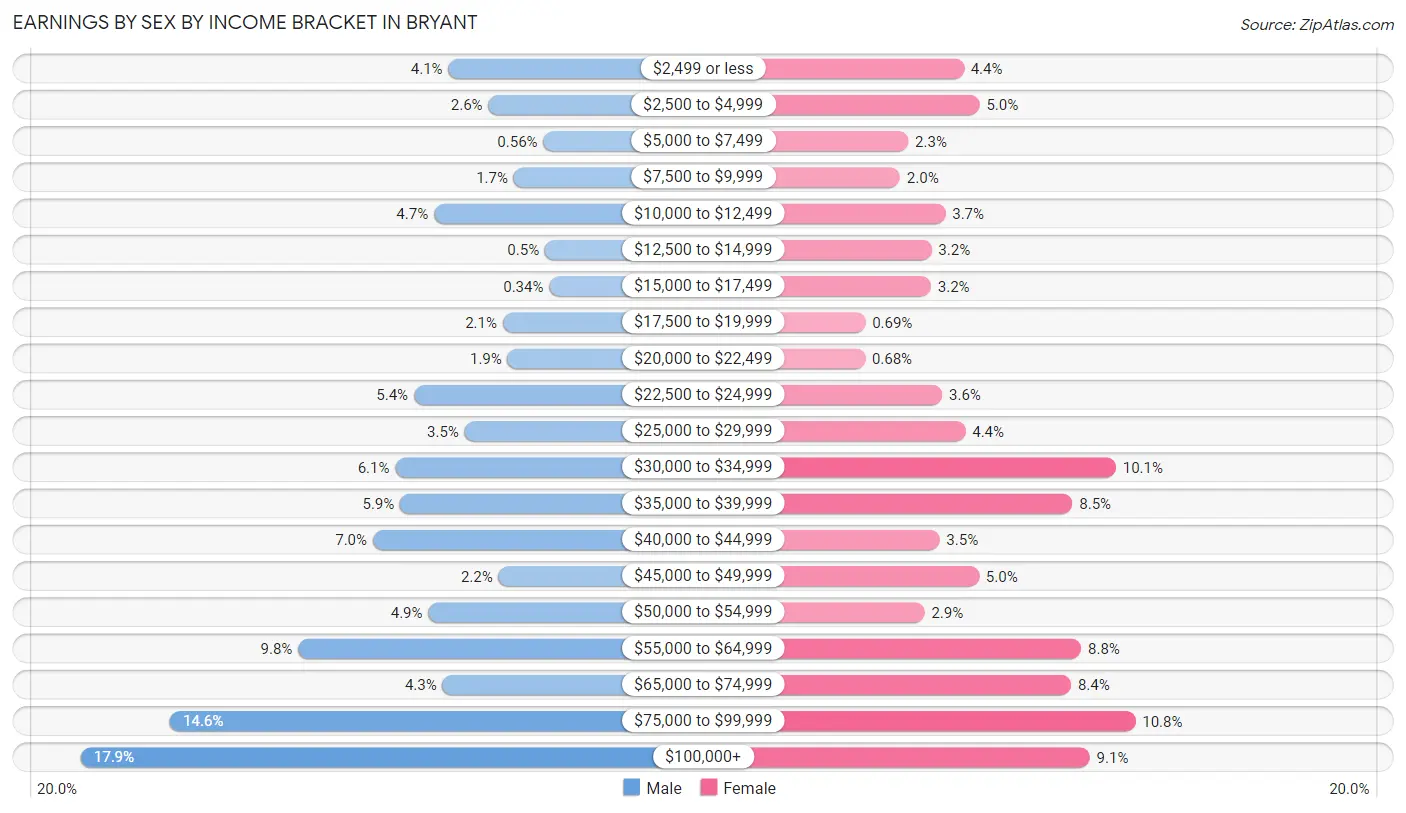
Earnings by Sex by Income Bracket in Bryant
The most common earnings brackets in Bryant are $100,000+ for men (998 | 17.9%) and $75,000 to $99,999 for women (624 | 10.8%).
| Income | Male | Female |
| $2,499 or less | 230 (4.1%) | 253 (4.4%) |
| $2,500 to $4,999 | 146 (2.6%) | 287 (5.0%) |
| $5,000 to $7,499 | 31 (0.6%) | 133 (2.3%) |
| $7,500 to $9,999 | 93 (1.7%) | 115 (2.0%) |
| $10,000 to $12,499 | 260 (4.7%) | 213 (3.7%) |
| $12,500 to $14,999 | 28 (0.5%) | 183 (3.2%) |
| $15,000 to $17,499 | 19 (0.3%) | 182 (3.2%) |
| $17,500 to $19,999 | 116 (2.1%) | 40 (0.7%) |
| $20,000 to $22,499 | 106 (1.9%) | 39 (0.7%) |
| $22,500 to $24,999 | 302 (5.4%) | 206 (3.6%) |
| $25,000 to $29,999 | 196 (3.5%) | 256 (4.4%) |
| $30,000 to $34,999 | 341 (6.1%) | 582 (10.1%) |
| $35,000 to $39,999 | 331 (5.9%) | 488 (8.5%) |
| $40,000 to $44,999 | 388 (7.0%) | 200 (3.5%) |
| $45,000 to $49,999 | 125 (2.2%) | 286 (5.0%) |
| $50,000 to $54,999 | 272 (4.9%) | 168 (2.9%) |
| $55,000 to $64,999 | 544 (9.8%) | 507 (8.8%) |
| $65,000 to $74,999 | 242 (4.3%) | 485 (8.4%) |
| $75,000 to $99,999 | 812 (14.5%) | 624 (10.8%) |
| $100,000+ | 998 (17.9%) | 525 (9.1%) |
| Total | 5,580 (100.0%) | 5,772 (100.0%) |
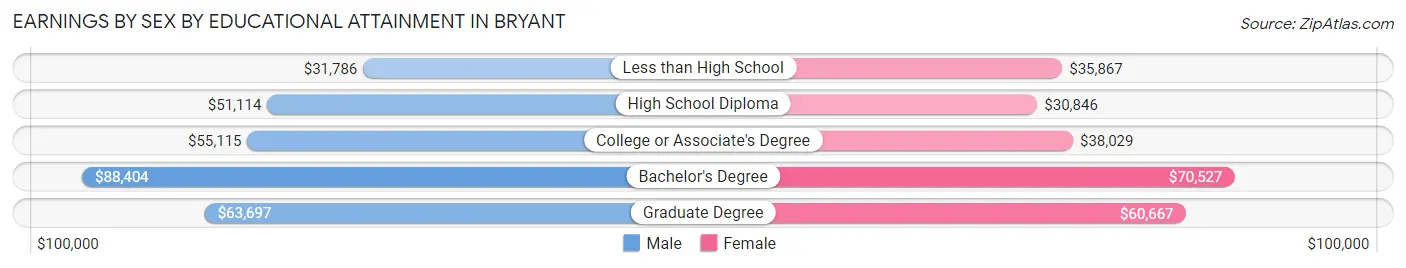
Earnings by Sex by Educational Attainment in Bryant
Average earnings in Bryant are $58,010 for men and $45,640 for women, a difference of 21.3%. Men with an educational attainment of bachelor's degree enjoy the highest average annual earnings of $88,404, while those with less than high school education earn the least with $31,786. Women with an educational attainment of bachelor's degree earn the most with the average annual earnings of $70,527, while those with high school diploma education have the smallest earnings of $30,846.
| Educational Attainment | Male Income | Female Income |
| Less than High School | $31,786 | $35,867 |
| High School Diploma | $51,114 | $30,846 |
| College or Associate's Degree | $55,115 | $38,029 |
| Bachelor's Degree | $88,404 | $70,527 |
| Graduate Degree | $63,697 | $60,667 |
| Total | $58,010 | $45,640 |
Family Income in Bryant
Family Income Brackets in Bryant
According to the Bryant family income data, there are 1,634 families falling into the $100,000 to $149,999 income range, which is the most common income bracket and makes up 29.5% of all families. Conversely, the less than $10,000 income bracket is the least frequent group with only 17 families (0.3%) belonging to this category.
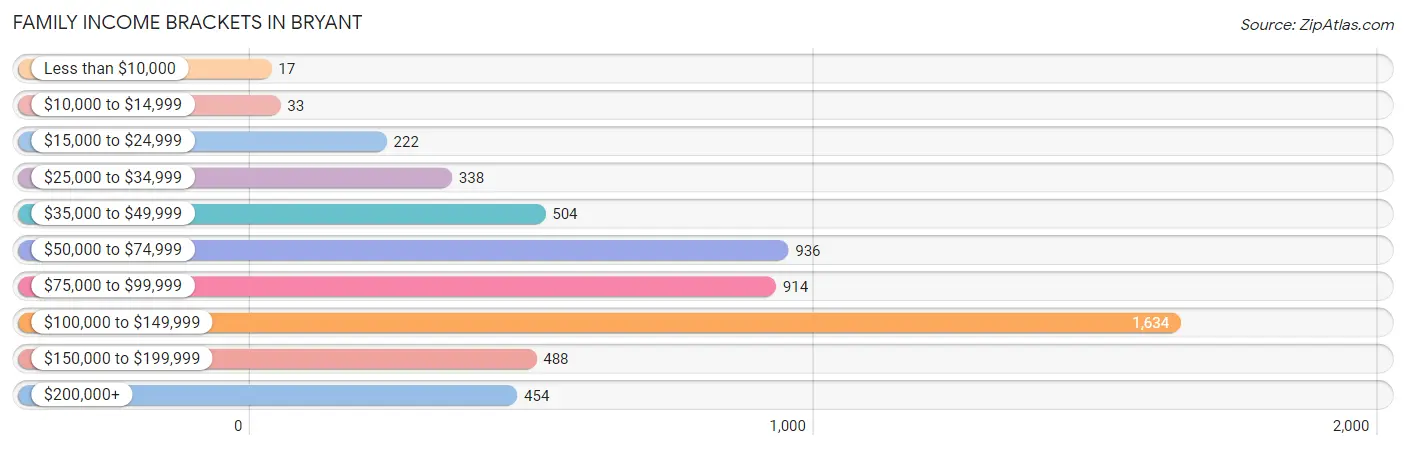
| Income Bracket | # Families | % Families |
| Less than $10,000 | 17 | 0.3% |
| $10,000 to $14,999 | 33 | 0.6% |
| $15,000 to $24,999 | 222 | 4.0% |
| $25,000 to $34,999 | 338 | 6.1% |
| $35,000 to $49,999 | 504 | 9.1% |
| $50,000 to $74,999 | 936 | 16.9% |
| $75,000 to $99,999 | 914 | 16.5% |
| $100,000 to $149,999 | 1,634 | 29.5% |
| $150,000 to $199,999 | 488 | 8.8% |
| $200,000+ | 454 | 8.2% |
Family Income by Famaliy Size in Bryant
5-person families (387 | 7.0%) account for the highest median family income in Bryant with $129,063 per family, while 2-person families (2,561 | 46.2%) have the highest median income of $41,802 per family member.
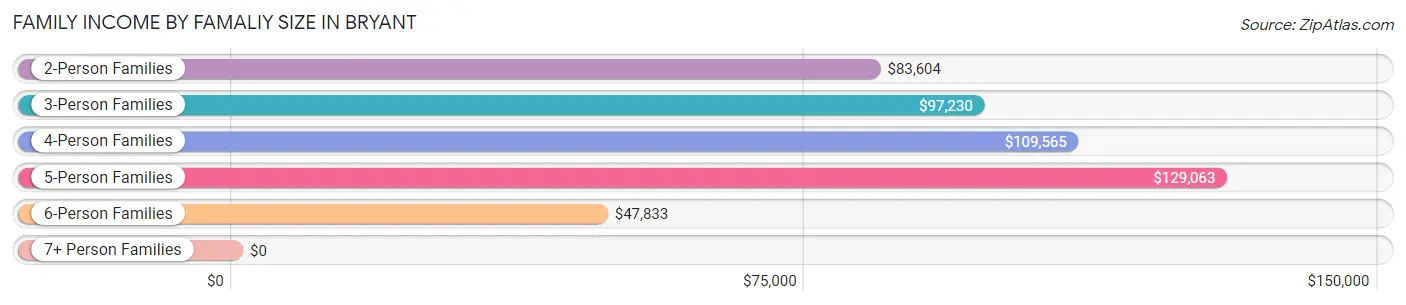
| Income Bracket | # Families | Median Income |
| 2-Person Families | 2,561 (46.2%) | $83,604 |
| 3-Person Families | 1,148 (20.7%) | $97,230 |
| 4-Person Families | 1,345 (24.3%) | $109,565 |
| 5-Person Families | 387 (7.0%) | $129,063 |
| 6-Person Families | 72 (1.3%) | $47,833 |
| 7+ Person Families | 27 (0.5%) | $0 |
| Total | 5,540 (100.0%) | $96,221 |
Family Income by Number of Earners in Bryant
The median family income in Bryant is $96,221, with families comprising 3+ earners (380) having the highest median family income of $138,036, while families with no earners (616) have the lowest median family income of $57,452, accounting for 6.9% and 11.1% of families, respectively.
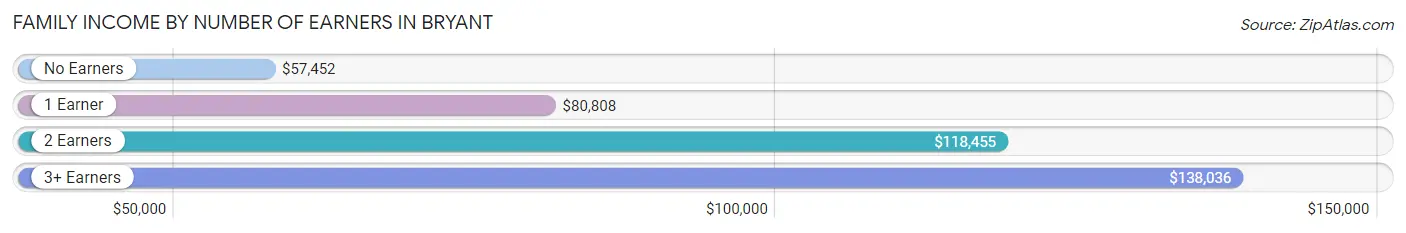
| Number of Earners | # Families | Median Income |
| No Earners | 616 (11.1%) | $57,452 |
| 1 Earner | 1,814 (32.7%) | $80,808 |
| 2 Earners | 2,730 (49.3%) | $118,455 |
| 3+ Earners | 380 (6.9%) | $138,036 |
| Total | 5,540 (100.0%) | $96,221 |
Household Income in Bryant
Household Income Brackets in Bryant
With 2,078 households falling in the category, the $100,000 to $149,999 income range is the most frequent in Bryant, accounting for 25.2% of all households. In contrast, only 157 households (1.9%) fall into the less than $10,000 income bracket, making it the least populous group.
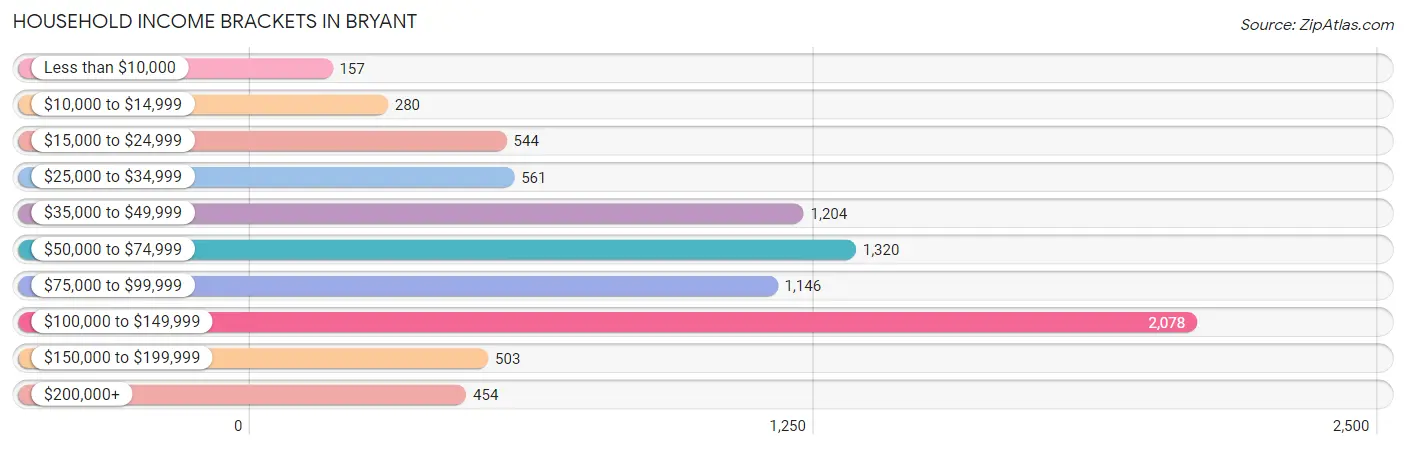
| Income Bracket | # Households | % Households |
| Less than $10,000 | 157 | 1.9% |
| $10,000 to $14,999 | 280 | 3.4% |
| $15,000 to $24,999 | 544 | 6.6% |
| $25,000 to $34,999 | 561 | 6.8% |
| $35,000 to $49,999 | 1,204 | 14.6% |
| $50,000 to $74,999 | 1,320 | 16.0% |
| $75,000 to $99,999 | 1,146 | 13.9% |
| $100,000 to $149,999 | 2,078 | 25.2% |
| $150,000 to $199,999 | 503 | 6.1% |
| $200,000+ | 454 | 5.5% |
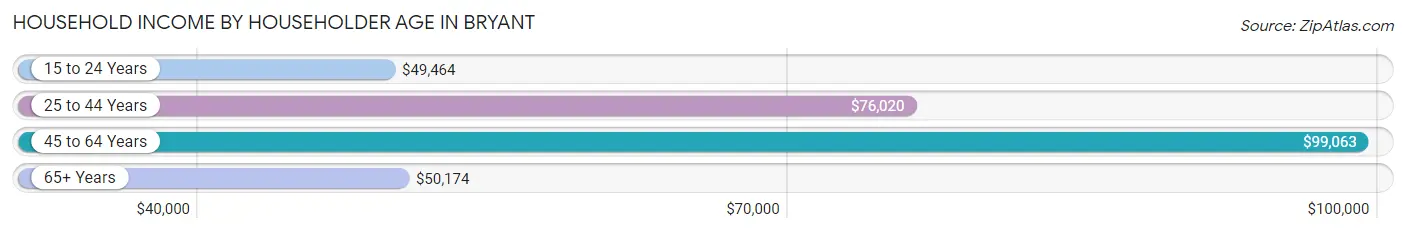
Household Income by Householder Age in Bryant
The median household income in Bryant is $76,282, with the highest median household income of $99,063 found in the 45 to 64 years age bracket for the primary householder. A total of 3,167 households (38.4%) fall into this category. Meanwhile, the 15 to 24 years age bracket for the primary householder has the lowest median household income of $49,464, with 196 households (2.4%) in this group.
| Income Bracket | # Households | Median Income |
| 15 to 24 Years | 196 (2.4%) | $49,464 |
| 25 to 44 Years | 3,135 (38.0%) | $76,020 |
| 45 to 64 Years | 3,167 (38.4%) | $99,063 |
| 65+ Years | 1,749 (21.2%) | $50,174 |
| Total | 8,247 (100.0%) | $76,282 |
Poverty in Bryant
Income Below Poverty by Sex and Age in Bryant
With 5.7% poverty level for males and 9.6% for females among the residents of Bryant, 6 to 11 year old males and 16 and 17 year old females are the most vulnerable to poverty, with 212 males (30.9%) and 84 females (22.6%) in their respective age groups living below the poverty level.
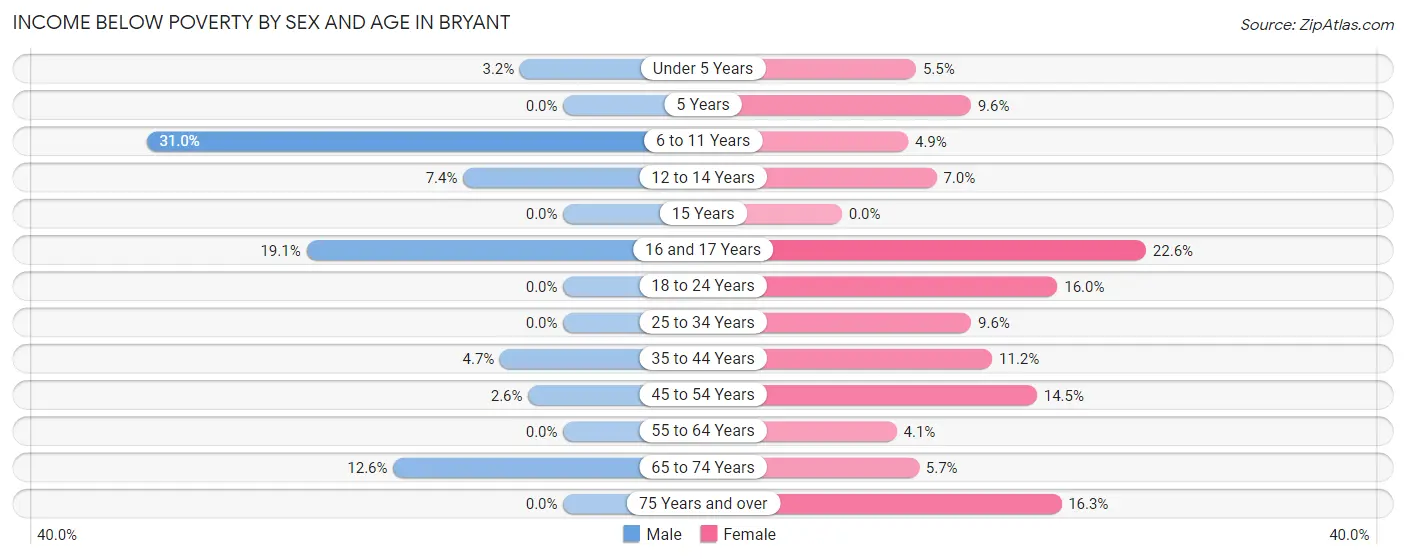
| Age Bracket | Male | Female |
| Under 5 Years | 20 (3.2%) | 45 (5.5%) |
| 5 Years | 0 (0.0%) | 9 (9.6%) |
| 6 to 11 Years | 212 (30.9%) | 35 (4.9%) |
| 12 to 14 Years | 24 (7.4%) | 54 (7.0%) |
| 15 Years | 0 (0.0%) | 0 (0.0%) |
| 16 and 17 Years | 74 (19.1%) | 84 (22.6%) |
| 18 to 24 Years | 0 (0.0%) | 76 (16.0%) |
| 25 to 34 Years | 0 (0.0%) | 172 (9.6%) |
| 35 to 44 Years | 77 (4.7%) | 192 (11.2%) |
| 45 to 54 Years | 23 (2.6%) | 188 (14.5%) |
| 55 to 64 Years | 0 (0.0%) | 55 (4.1%) |
| 65 to 74 Years | 102 (12.6%) | 48 (5.7%) |
| 75 Years and over | 0 (0.0%) | 109 (16.3%) |
| Total | 532 (5.7%) | 1,067 (9.6%) |
Income Above Poverty by Sex and Age in Bryant
According to the poverty statistics in Bryant, males aged 5 years and females aged 15 years are the age groups that are most secure financially, with 100.0% of males and 100.0% of females in these age groups living above the poverty line.
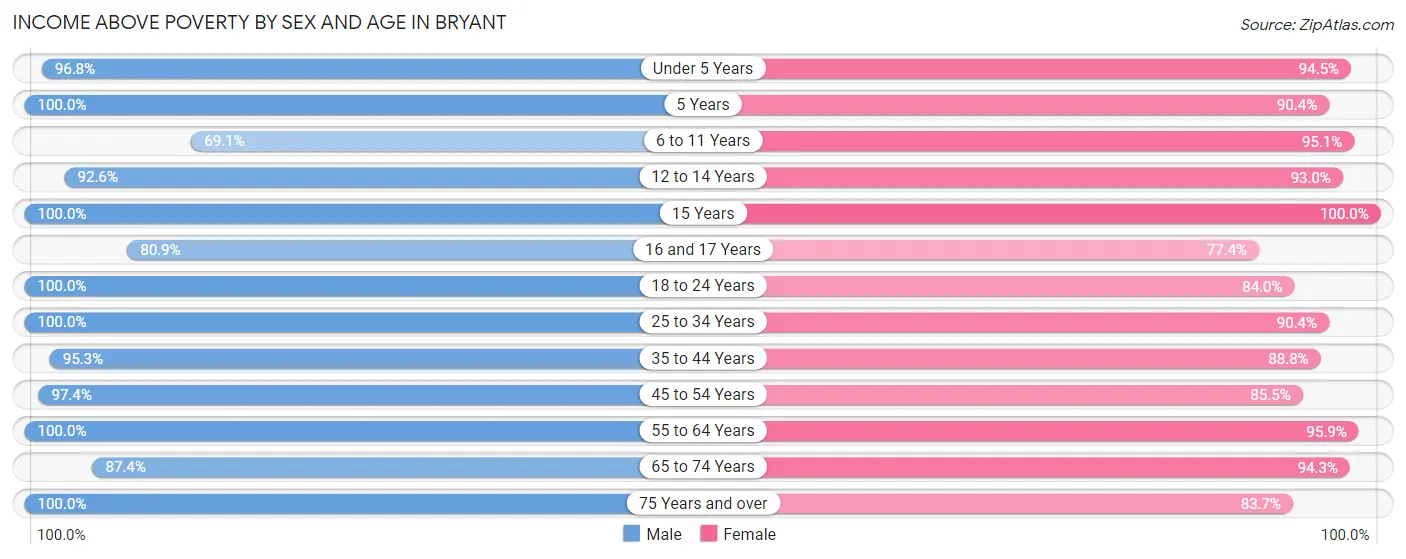
| Age Bracket | Male | Female |
| Under 5 Years | 604 (96.8%) | 772 (94.5%) |
| 5 Years | 218 (100.0%) | 85 (90.4%) |
| 6 to 11 Years | 473 (69.1%) | 677 (95.1%) |
| 12 to 14 Years | 299 (92.6%) | 714 (93.0%) |
| 15 Years | 246 (100.0%) | 183 (100.0%) |
| 16 and 17 Years | 314 (80.9%) | 288 (77.4%) |
| 18 to 24 Years | 551 (100.0%) | 399 (84.0%) |
| 25 to 34 Years | 1,064 (100.0%) | 1,620 (90.4%) |
| 35 to 44 Years | 1,565 (95.3%) | 1,528 (88.8%) |
| 45 to 54 Years | 862 (97.4%) | 1,110 (85.5%) |
| 55 to 64 Years | 1,451 (100.0%) | 1,295 (95.9%) |
| 65 to 74 Years | 706 (87.4%) | 791 (94.3%) |
| 75 Years and over | 494 (100.0%) | 560 (83.7%) |
| Total | 8,847 (94.3%) | 10,022 (90.4%) |
Income Below Poverty Among Married-Couple Families in Bryant
The poverty statistics for married-couple families in Bryant show that 2.4% or 97 of the total 4,040 families live below the poverty line. Families with 3 or 4 children have the highest poverty rate of 8.1%, comprising of 34 families. On the other hand, families with 5 or more children have the lowest poverty rate of 0.0%, which includes 0 families.
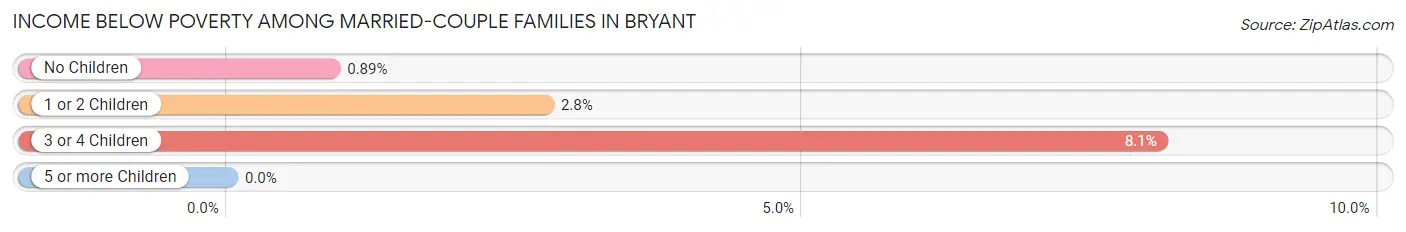
| Children | Above Poverty | Below Poverty |
| No Children | 1,903 (99.1%) | 17 (0.9%) |
| 1 or 2 Children | 1,627 (97.3%) | 46 (2.8%) |
| 3 or 4 Children | 386 (91.9%) | 34 (8.1%) |
| 5 or more Children | 27 (100.0%) | 0 (0.0%) |
| Total | 3,943 (97.6%) | 97 (2.4%) |
Income Below Poverty Among Single-Parent Households in Bryant
According to the poverty data in Bryant, 9.0% or 23 single-father households and 11.8% or 147 single-mother households are living below the poverty line. Among single-father households, those with 1 or 2 children have the highest poverty rate, with 23 households (16.0%) experiencing poverty. Likewise, among single-mother households, those with 1 or 2 children have the highest poverty rate, with 147 households (17.6%) falling below the poverty line.
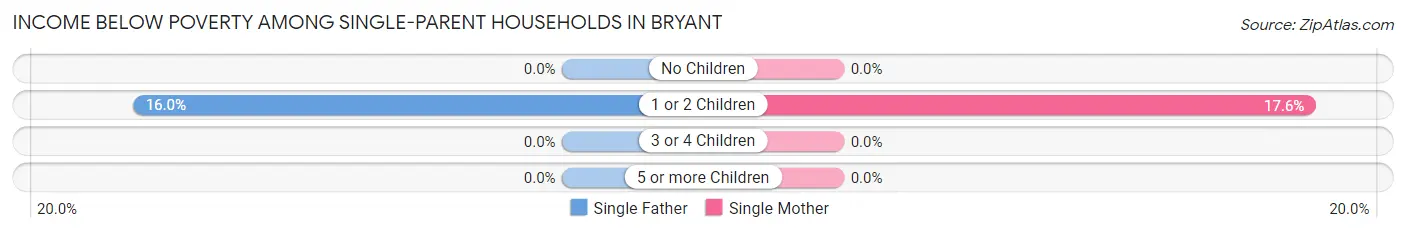
| Children | Single Father | Single Mother |
| No Children | 0 (0.0%) | 0 (0.0%) |
| 1 or 2 Children | 23 (16.0%) | 147 (17.6%) |
| 3 or 4 Children | 0 (0.0%) | 0 (0.0%) |
| 5 or more Children | 0 (0.0%) | 0 (0.0%) |
| Total | 23 (9.0%) | 147 (11.8%) |
Income Below Poverty Among Married-Couple vs Single-Parent Households in Bryant
The poverty data for Bryant shows that 97 of the married-couple family households (2.4%) and 170 of the single-parent households (11.3%) are living below the poverty level. Within the married-couple family households, those with 3 or 4 children have the highest poverty rate, with 34 households (8.1%) falling below the poverty line. Among the single-parent households, those with 1 or 2 children have the highest poverty rate, with 170 household (17.4%) living below poverty.
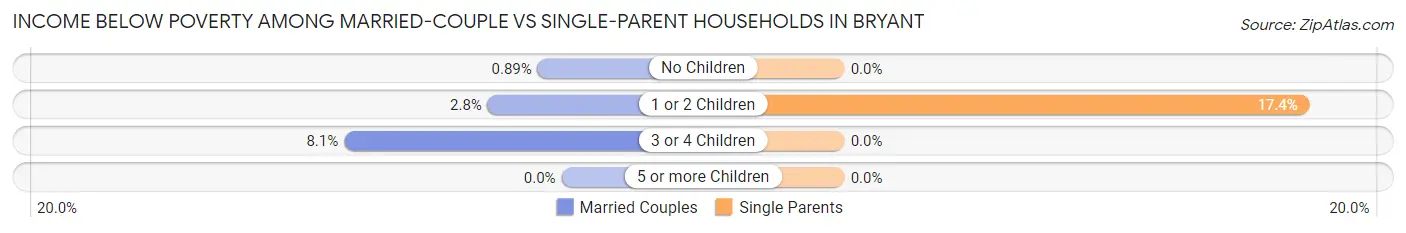
| Children | Married-Couple Families | Single-Parent Households |
| No Children | 17 (0.9%) | 0 (0.0%) |
| 1 or 2 Children | 46 (2.8%) | 170 (17.4%) |
| 3 or 4 Children | 34 (8.1%) | 0 (0.0%) |
| 5 or more Children | 0 (0.0%) | 0 (0.0%) |
| Total | 97 (2.4%) | 170 (11.3%) |
Race in Bryant
The most populous races in Bryant are White / Caucasian (15,870 | 76.5%), Black / African American (3,141 | 15.1%), and Hispanic or Latino (923 | 4.4%).
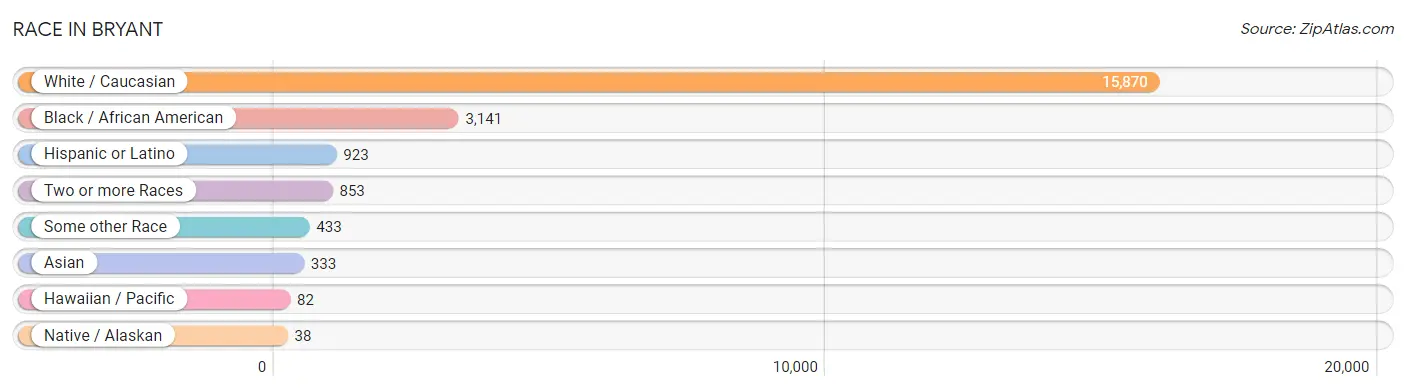
| Race | # Population | % Population |
| Asian | 333 | 1.6% |
| Black / African American | 3,141 | 15.1% |
| Hawaiian / Pacific | 82 | 0.4% |
| Hispanic or Latino | 923 | 4.4% |
| Native / Alaskan | 38 | 0.2% |
| White / Caucasian | 15,870 | 76.5% |
| Two or more Races | 853 | 4.1% |
| Some other Race | 433 | 2.1% |
| Total | 20,750 | 100.0% |
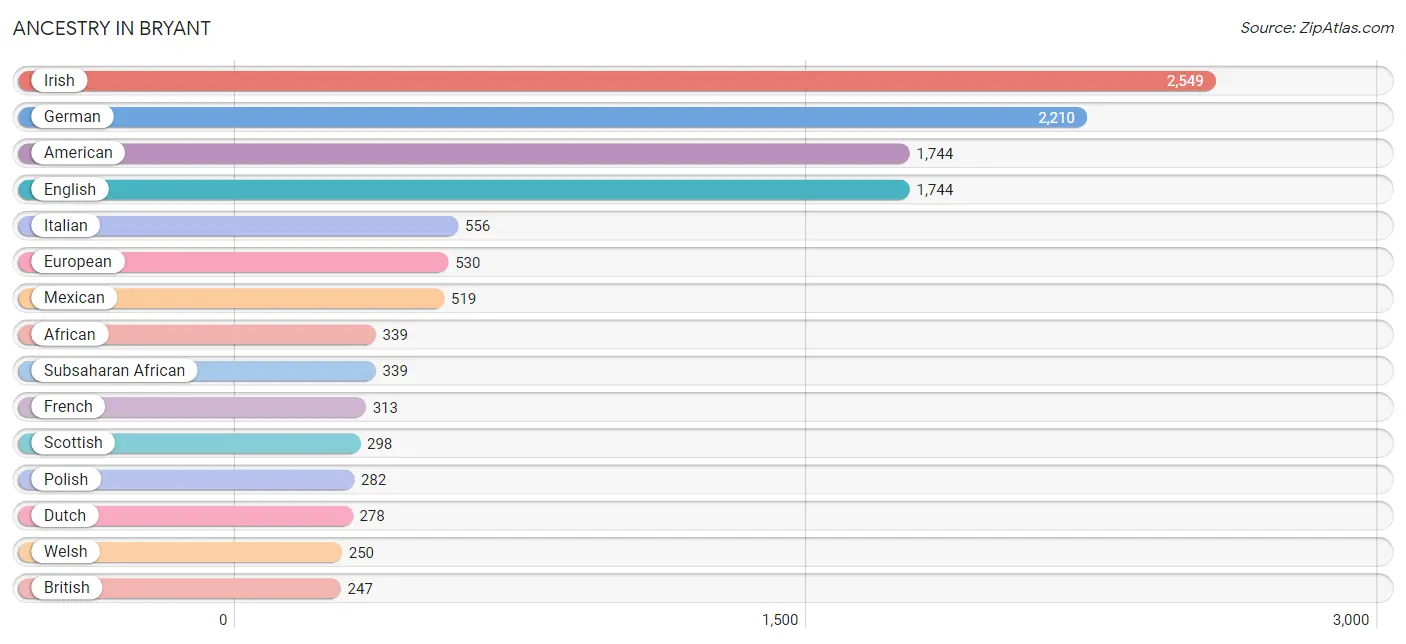
Ancestry in Bryant
The most populous ancestries reported in Bryant are Irish (2,549 | 12.3%), German (2,210 | 10.6%), American (1,744 | 8.4%), English (1,744 | 8.4%), and Italian (556 | 2.7%), together accounting for 42.4% of all Bryant residents.
| Ancestry | # Population | % Population |
| African | 339 | 1.6% |
| American | 1,744 | 8.4% |
| Arab | 80 | 0.4% |
| Austrian | 14 | 0.1% |
| Belgian | 30 | 0.1% |
| Blackfeet | 1 | 0.0% |
| British | 247 | 1.2% |
| Burmese | 99 | 0.5% |
| Canadian | 10 | 0.1% |
| Central American | 30 | 0.1% |
| Central American Indian | 24 | 0.1% |
| Cherokee | 54 | 0.3% |
| Choctaw | 32 | 0.2% |
| Cuban | 26 | 0.1% |
| Czech | 25 | 0.1% |
| Czechoslovakian | 125 | 0.6% |
| Danish | 34 | 0.2% |
| Dutch | 278 | 1.3% |
| Eastern European | 75 | 0.4% |
| Ecuadorian | 49 | 0.2% |
| English | 1,744 | 8.4% |
| European | 530 | 2.5% |
| French | 313 | 1.5% |
| French Canadian | 122 | 0.6% |
| German | 2,210 | 10.6% |
| Greek | 52 | 0.3% |
| Guatemalan | 30 | 0.1% |
| Iranian | 14 | 0.1% |
| Irish | 2,549 | 12.3% |
| Italian | 556 | 2.7% |
| Laotian | 44 | 0.2% |
| Lebanese | 80 | 0.4% |
| Mexican | 519 | 2.5% |
| Mexican American Indian | 25 | 0.1% |
| Native Hawaiian | 82 | 0.4% |
| Norwegian | 45 | 0.2% |
| Pakistani | 68 | 0.3% |
| Polish | 282 | 1.4% |
| Portuguese | 76 | 0.4% |
| Scotch-Irish | 220 | 1.1% |
| Scottish | 298 | 1.4% |
| South American | 64 | 0.3% |
| Spaniard | 25 | 0.1% |
| Spanish | 235 | 1.1% |
| Sri Lankan | 11 | 0.1% |
| Subsaharan African | 339 | 1.6% |
| Swedish | 13 | 0.1% |
| Swiss | 43 | 0.2% |
| Thai | 191 | 0.9% |
| Venezuelan | 15 | 0.1% |
| Welsh | 250 | 1.2% | View All 51 Rows |
Immigrants in Bryant
The most numerous immigrant groups reported in Bryant came from Asia (294 | 1.4%), Latin America (197 | 0.9%), Central America (189 | 0.9%), South Central Asia (153 | 0.7%), and Eastern Asia (99 | 0.5%), together accounting for 4.5% of all Bryant residents.
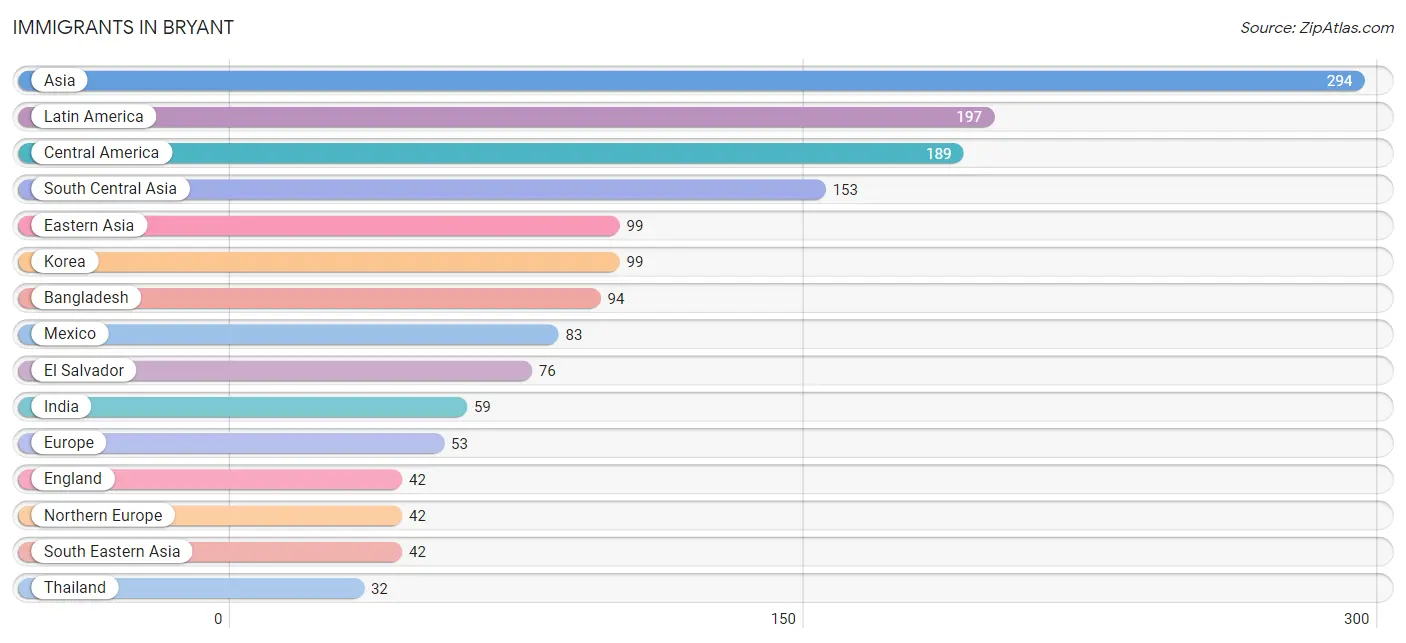
| Immigration Origin | # Population | % Population |
| Asia | 294 | 1.4% |
| Bangladesh | 94 | 0.4% |
| Central America | 189 | 0.9% |
| Eastern Asia | 99 | 0.5% |
| El Salvador | 76 | 0.4% |
| England | 42 | 0.2% |
| Europe | 53 | 0.3% |
| Germany | 11 | 0.1% |
| Guatemala | 30 | 0.1% |
| India | 59 | 0.3% |
| Korea | 99 | 0.5% |
| Latin America | 197 | 0.9% |
| Mexico | 83 | 0.4% |
| Northern Europe | 42 | 0.2% |
| South America | 8 | 0.0% |
| South Central Asia | 153 | 0.7% |
| South Eastern Asia | 42 | 0.2% |
| Thailand | 32 | 0.2% |
| Venezuela | 8 | 0.0% |
| Vietnam | 10 | 0.1% |
| Western Europe | 11 | 0.1% | View All 21 Rows |
Sex and Age in Bryant
Sex and Age in Bryant
The most populous age groups in Bryant are 35 to 39 Years (998 | 10.5%) for men and 10 to 14 Years (1,160 | 10.3%) for women.
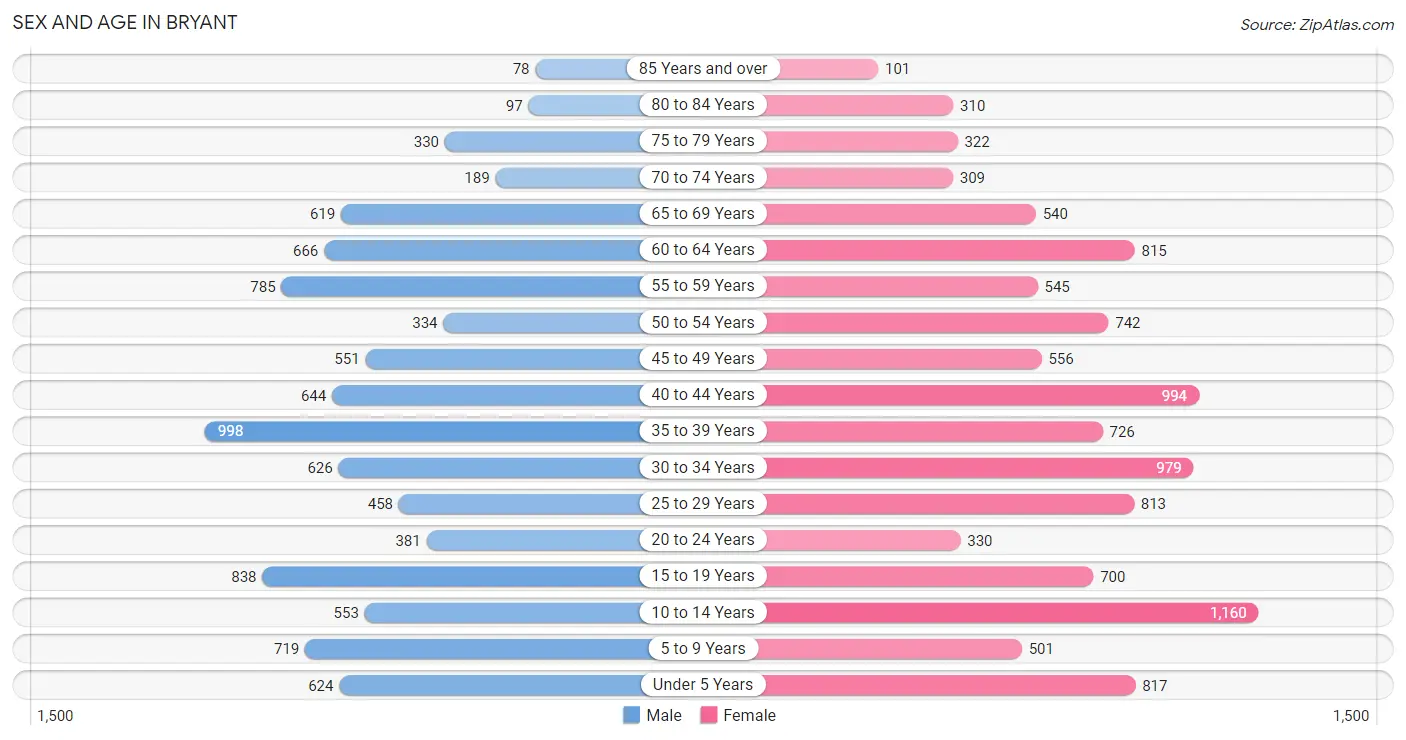
| Age Bracket | Male | Female |
| Under 5 Years | 624 (6.6%) | 817 (7.3%) |
| 5 to 9 Years | 719 (7.6%) | 501 (4.4%) |
| 10 to 14 Years | 553 (5.8%) | 1,160 (10.3%) |
| 15 to 19 Years | 838 (8.8%) | 700 (6.2%) |
| 20 to 24 Years | 381 (4.0%) | 330 (2.9%) |
| 25 to 29 Years | 458 (4.8%) | 813 (7.2%) |
| 30 to 34 Years | 626 (6.6%) | 979 (8.7%) |
| 35 to 39 Years | 998 (10.5%) | 726 (6.5%) |
| 40 to 44 Years | 644 (6.8%) | 994 (8.8%) |
| 45 to 49 Years | 551 (5.8%) | 556 (4.9%) |
| 50 to 54 Years | 334 (3.5%) | 742 (6.6%) |
| 55 to 59 Years | 785 (8.3%) | 545 (4.8%) |
| 60 to 64 Years | 666 (7.0%) | 815 (7.2%) |
| 65 to 69 Years | 619 (6.5%) | 540 (4.8%) |
| 70 to 74 Years | 189 (2.0%) | 309 (2.7%) |
| 75 to 79 Years | 330 (3.5%) | 322 (2.9%) |
| 80 to 84 Years | 97 (1.0%) | 310 (2.8%) |
| 85 Years and over | 78 (0.8%) | 101 (0.9%) |
| Total | 9,490 (100.0%) | 11,260 (100.0%) |
Families and Households in Bryant
Median Family Size in Bryant
The median family size in Bryant is 3.05 persons per family, with married-couple families (4,040 | 72.9%) accounting for the largest median family size of 3.18 persons per family. On the other hand, single male/father families (256 | 4.6%) represent the smallest median family size with 2.55 persons per family.
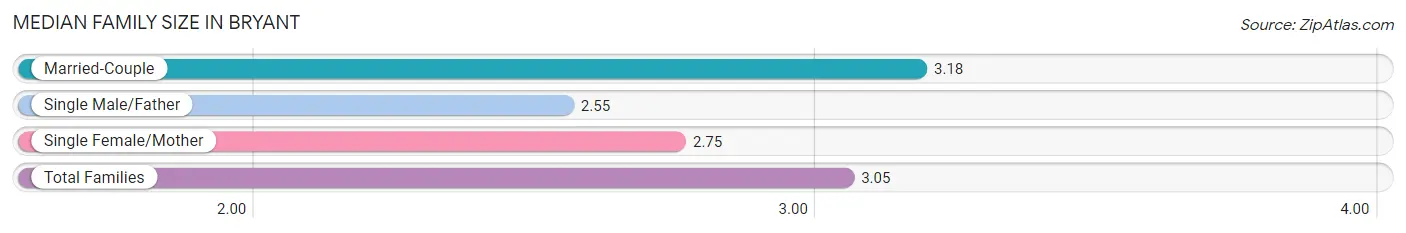
| Family Type | # Families | Family Size |
| Married-Couple | 4,040 (72.9%) | 3.18 |
| Single Male/Father | 256 (4.6%) | 2.55 |
| Single Female/Mother | 1,244 (22.5%) | 2.75 |
| Total Families | 5,540 (100.0%) | 3.05 |
Median Household Size in Bryant
The median household size in Bryant is 2.50 persons per household, with married-couple households (4,040 | 49.0%) accounting for the largest median household size of 3.2 persons per household. non-family households (2,707 | 32.8%) represent the smallest median household size with 1.25 persons per household.
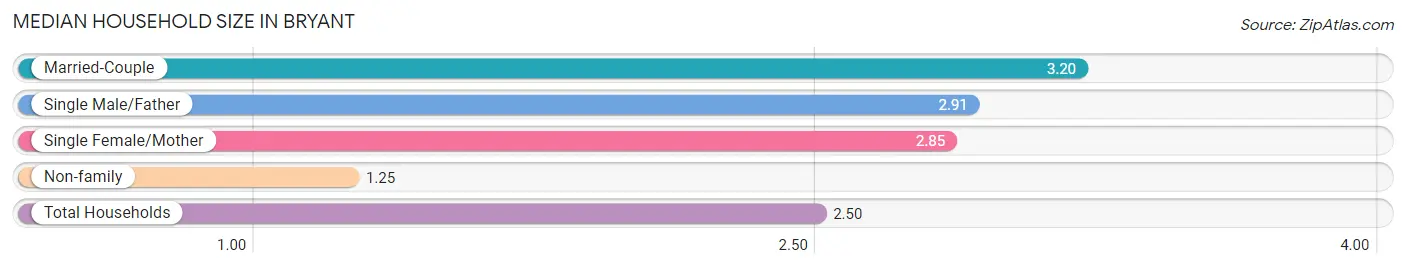
| Household Type | # Households | Household Size |
| Married-Couple | 4,040 (49.0%) | 3.20 |
| Single Male/Father | 256 (3.1%) | 2.91 |
| Single Female/Mother | 1,244 (15.1%) | 2.85 |
| Non-family | 2,707 (32.8%) | 1.25 |
| Total Households | 8,247 (100.0%) | 2.50 |
Household Size by Marriage Status in Bryant
Out of a total of 8,247 households in Bryant, 5,540 (67.2%) are family households, while 2,707 (32.8%) are nonfamily households. The most numerous type of family households are 2-person households, comprising 2,453, and the most common type of nonfamily households are 1-person households, comprising 2,230.
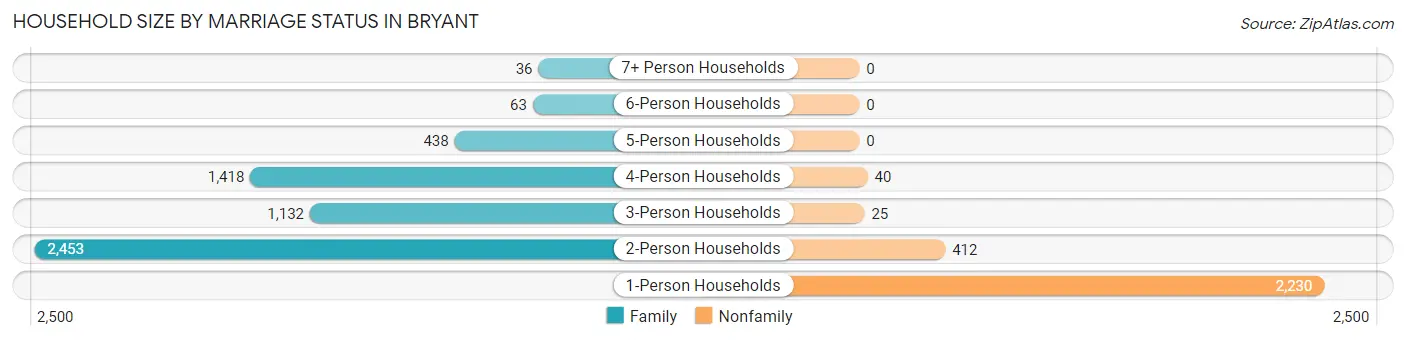
| Household Size | Family Households | Nonfamily Households |
| 1-Person Households | - | 2,230 (27.0%) |
| 2-Person Households | 2,453 (29.7%) | 412 (5.0%) |
| 3-Person Households | 1,132 (13.7%) | 25 (0.3%) |
| 4-Person Households | 1,418 (17.2%) | 40 (0.5%) |
| 5-Person Households | 438 (5.3%) | 0 (0.0%) |
| 6-Person Households | 63 (0.8%) | 0 (0.0%) |
| 7+ Person Households | 36 (0.4%) | 0 (0.0%) |
| Total | 5,540 (67.2%) | 2,707 (32.8%) |
Female Fertility in Bryant
Fertility by Age in Bryant
Average fertility rate in Bryant is 65.0 births per 1,000 women. Women in the age bracket of 20 to 34 years have the highest fertility rate with 142.0 births per 1,000 women. Women in the age bracket of 20 to 34 years acount for 87.3% of all women with births.
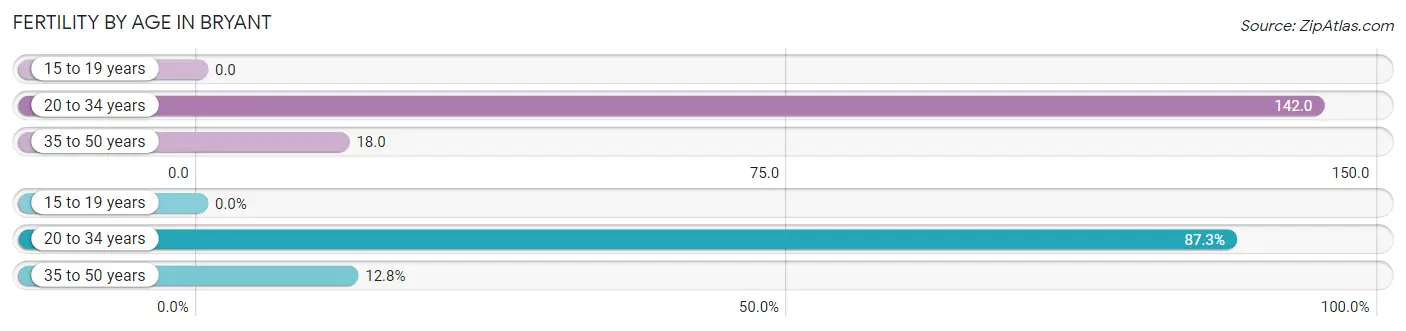
| Age Bracket | Women with Births | Births / 1,000 Women |
| 15 to 19 years | 0 (0.0%) | 0.0 |
| 20 to 34 years | 301 (87.3%) | 142.0 |
| 35 to 50 years | 44 (12.8%) | 18.0 |
| Total | 345 (100.0%) | 65.0 |
Fertility by Age by Marriage Status in Bryant
69.6% of women with births (345) in Bryant are married. The highest percentage of unmarried women with births falls into 20 to 34 years age bracket with 34.9% of them unmarried at the time of birth, while the lowest percentage of unmarried women with births belong to 35 to 50 years age bracket with 0.0% of them unmarried.
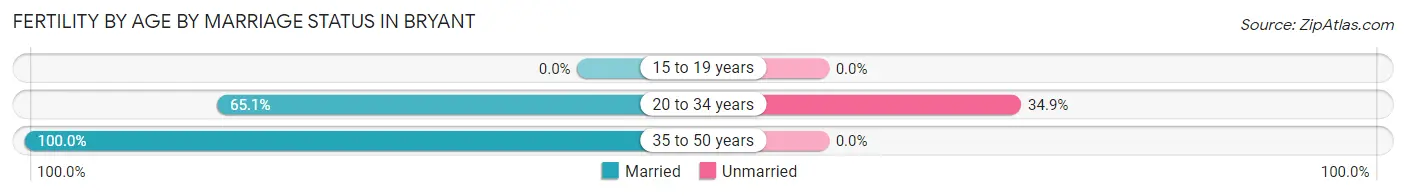
| Age Bracket | Married | Unmarried |
| 15 to 19 years | 0 (0.0%) | 0 (0.0%) |
| 20 to 34 years | 196 (65.1%) | 105 (34.9%) |
| 35 to 50 years | 44 (100.0%) | 0 (0.0%) |
| Total | 240 (69.6%) | 105 (30.4%) |
Fertility by Education in Bryant
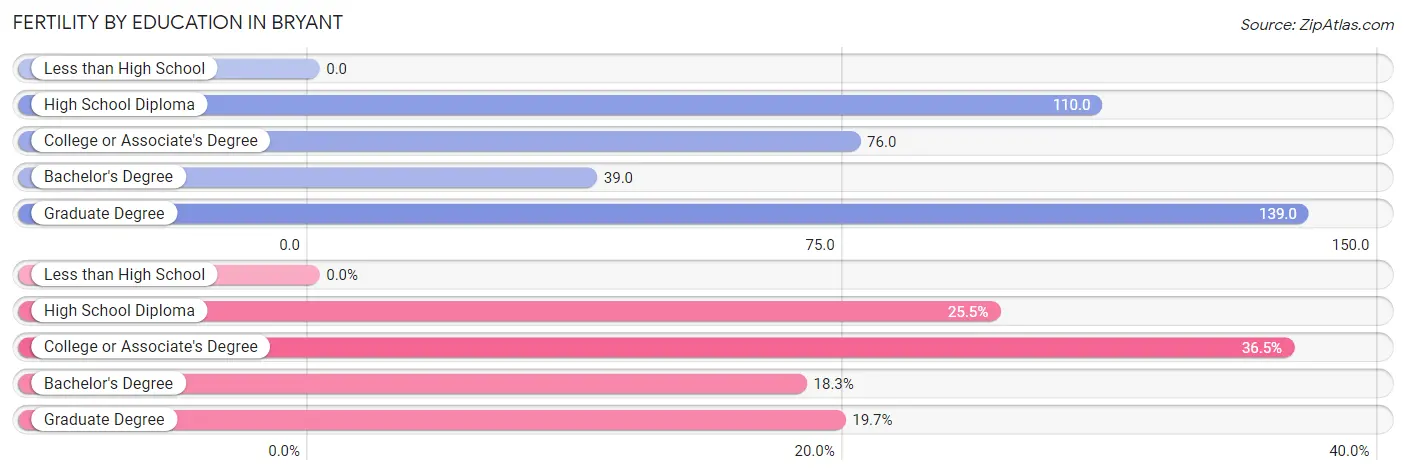
| Educational Attainment | Women with Births | Births / 1,000 Women |
| Less than High School | 0 (0.0%) | 0.0 |
| High School Diploma | 88 (25.5%) | 110.0 |
| College or Associate's Degree | 126 (36.5%) | 76.0 |
| Bachelor's Degree | 63 (18.3%) | 39.0 |
| Graduate Degree | 68 (19.7%) | 139.0 |
| Total | 345 (100.0%) | 65.0 |
Fertility by Education by Marriage Status in Bryant
30.4% of women with births in Bryant are unmarried. Women with the educational attainment of high school diploma are most likely to be married with 100.0% of them married at childbirth, while women with the educational attainment of college or associate's degree are least likely to be married with 83.3% of them unmarried at childbirth.
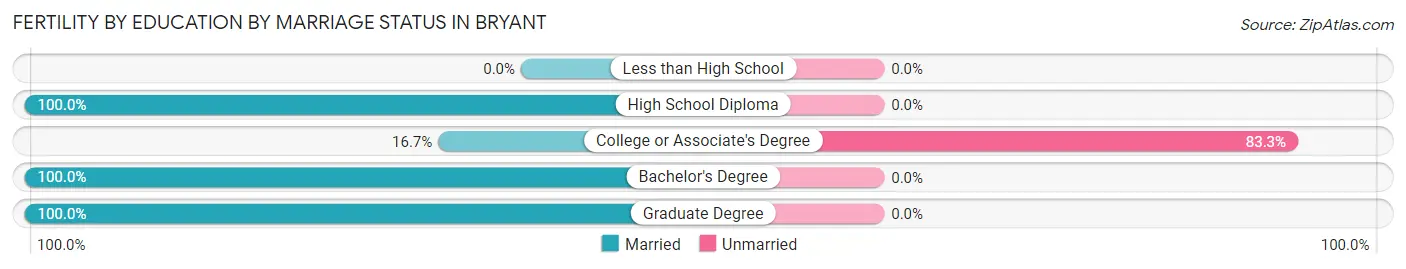
| Educational Attainment | Married | Unmarried |
| Less than High School | 0 (0.0%) | 0 (0.0%) |
| High School Diploma | 88 (100.0%) | 0 (0.0%) |
| College or Associate's Degree | 21 (16.7%) | 105 (83.3%) |
| Bachelor's Degree | 63 (100.0%) | 0 (0.0%) |
| Graduate Degree | 68 (100.0%) | 0 (0.0%) |
| Total | 240 (69.6%) | 105 (30.4%) |
Employment Characteristics in Bryant
Employment by Class of Employer in Bryant
Among the 10,524 employed individuals in Bryant, private company employees (6,861 | 65.2%), state government employees (947 | 9.0%), and not-for-profit organizations (913 | 8.7%) make up the most common classes of employment.
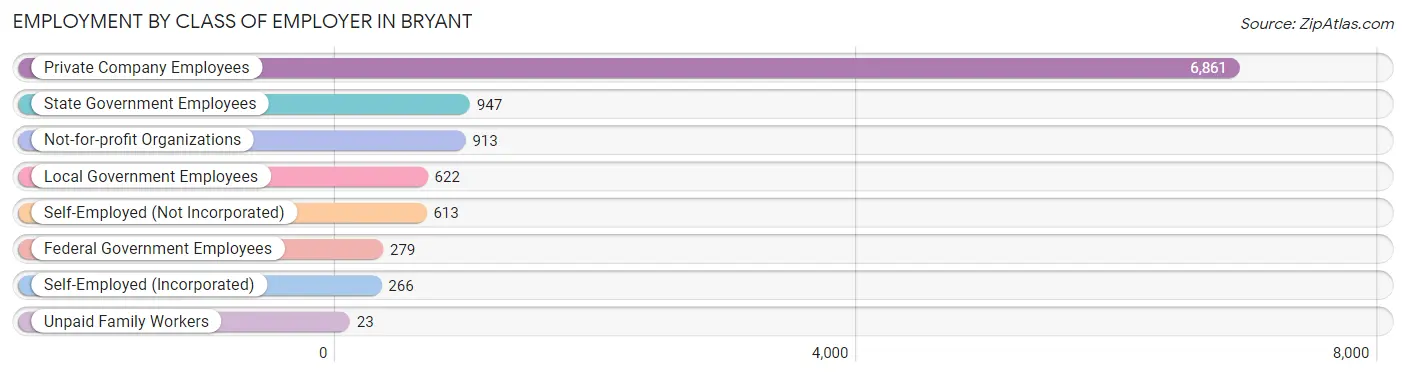
| Employer Class | # Employees | % Employees |
| Private Company Employees | 6,861 | 65.2% |
| Self-Employed (Incorporated) | 266 | 2.5% |
| Self-Employed (Not Incorporated) | 613 | 5.8% |
| Not-for-profit Organizations | 913 | 8.7% |
| Local Government Employees | 622 | 5.9% |
| State Government Employees | 947 | 9.0% |
| Federal Government Employees | 279 | 2.6% |
| Unpaid Family Workers | 23 | 0.2% |
| Total | 10,524 | 100.0% |
Employment Status by Age in Bryant
According to the labor force statistics for Bryant, out of the total population over 16 years of age (15,944), 69.6% or 11,097 individuals are in the labor force, with 3.6% or 399 of them unemployed. The age group with the highest labor force participation rate is 20 to 24 years, with 96.8% or 688 individuals in the labor force. Within the labor force, the 16 to 19 years age range has the highest percentage of unemployed individuals, with 6.7% or 41 of them being unemployed.
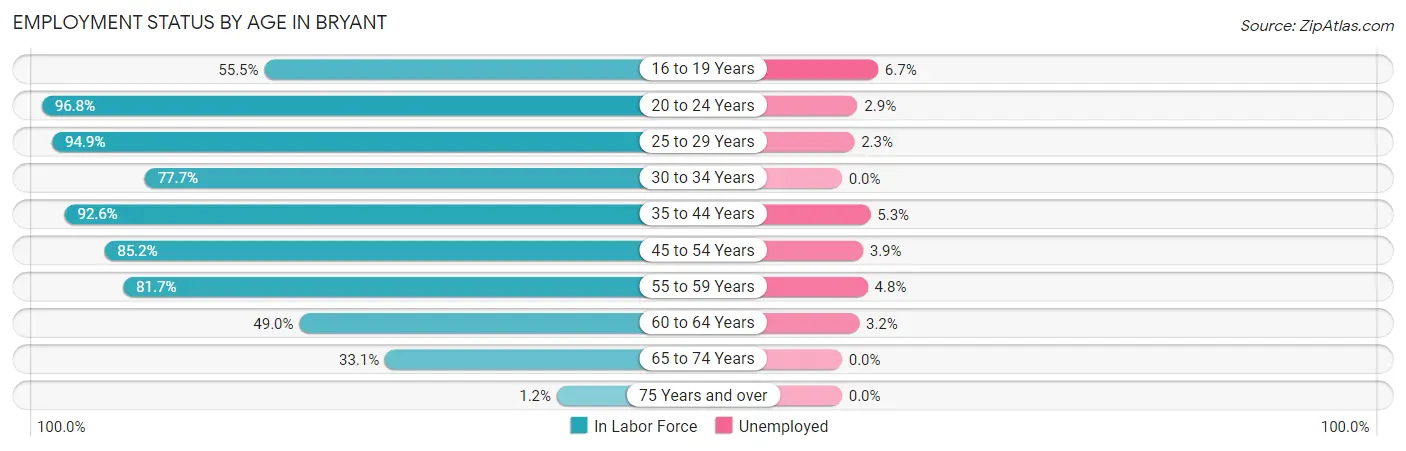
| Age Bracket | In Labor Force | Unemployed |
| 16 to 19 Years | 614 (55.5%) | 41 (6.7%) |
| 20 to 24 Years | 688 (96.8%) | 20 (2.9%) |
| 25 to 29 Years | 1,206 (94.9%) | 28 (2.3%) |
| 30 to 34 Years | 1,247 (77.7%) | 0 (0.0%) |
| 35 to 44 Years | 3,113 (92.6%) | 165 (5.3%) |
| 45 to 54 Years | 1,860 (85.2%) | 73 (3.9%) |
| 55 to 59 Years | 1,087 (81.7%) | 52 (4.8%) |
| 60 to 64 Years | 726 (49.0%) | 23 (3.2%) |
| 65 to 74 Years | 548 (33.1%) | 0 (0.0%) |
| 75 Years and over | 15 (1.2%) | 0 (0.0%) |
| Total | 11,097 (69.6%) | 399 (3.6%) |
Employment Status by Educational Attainment in Bryant
According to labor force statistics for Bryant, 82.2% of individuals (9,233) out of the total population between 25 and 64 years of age (11,232) are in the labor force, with 3.7% or 342 of them being unemployed. The group with the highest labor force participation rate are those with the educational attainment of bachelor's degree or higher, with 89.2% or 4,004 individuals in the labor force. Within the labor force, individuals with less than high school education have the highest percentage of unemployment, with 37.4% or 158 of them being unemployed.
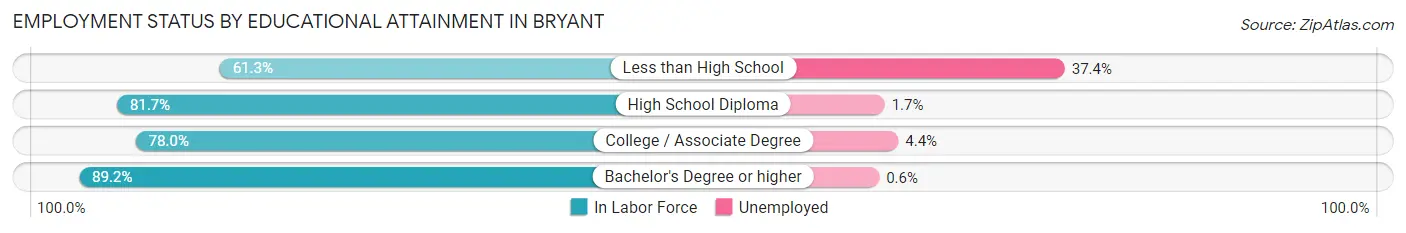
| Educational Attainment | In Labor Force | Unemployed |
| Less than High School | 422 (61.3%) | 257 (37.4%) |
| High School Diploma | 1,958 (81.7%) | 41 (1.7%) |
| College / Associate Degree | 2,853 (78.0%) | 161 (4.4%) |
| Bachelor's Degree or higher | 4,004 (89.2%) | 27 (0.6%) |
| Total | 9,233 (82.2%) | 416 (3.7%) |
Employment Occupations by Sex in Bryant
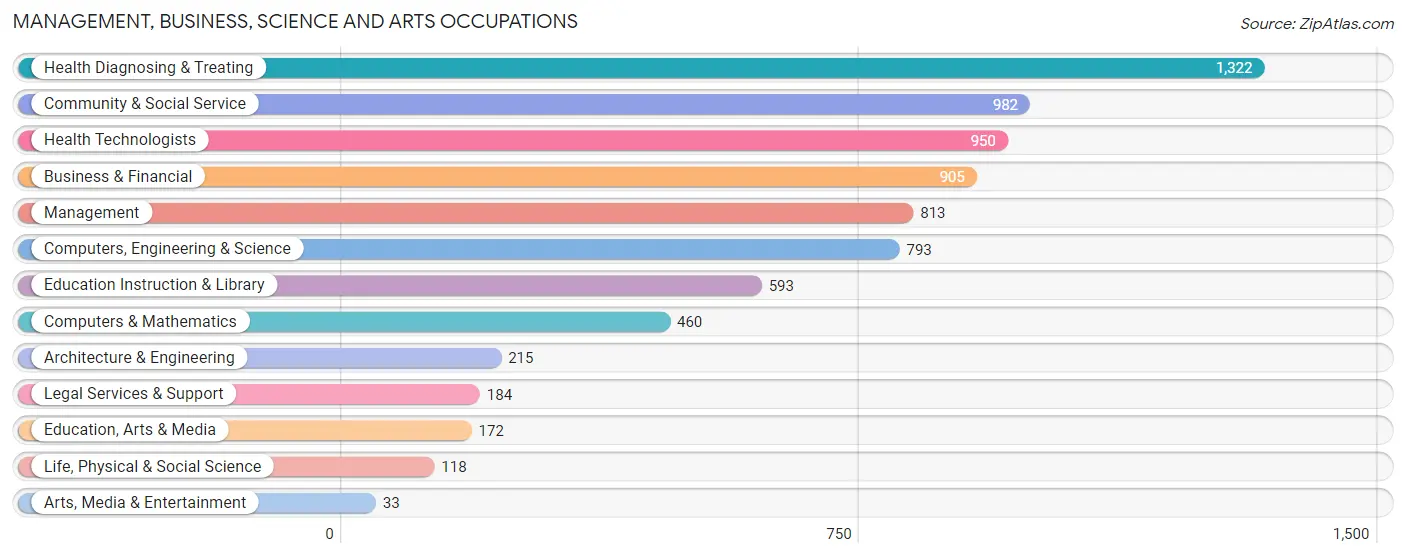
Management, Business, Science and Arts Occupations
The most common Management, Business, Science and Arts occupations in Bryant are Health Diagnosing & Treating (1,322 | 12.4%), Community & Social Service (982 | 9.2%), Health Technologists (950 | 8.9%), Business & Financial (905 | 8.5%), and Management (813 | 7.6%).
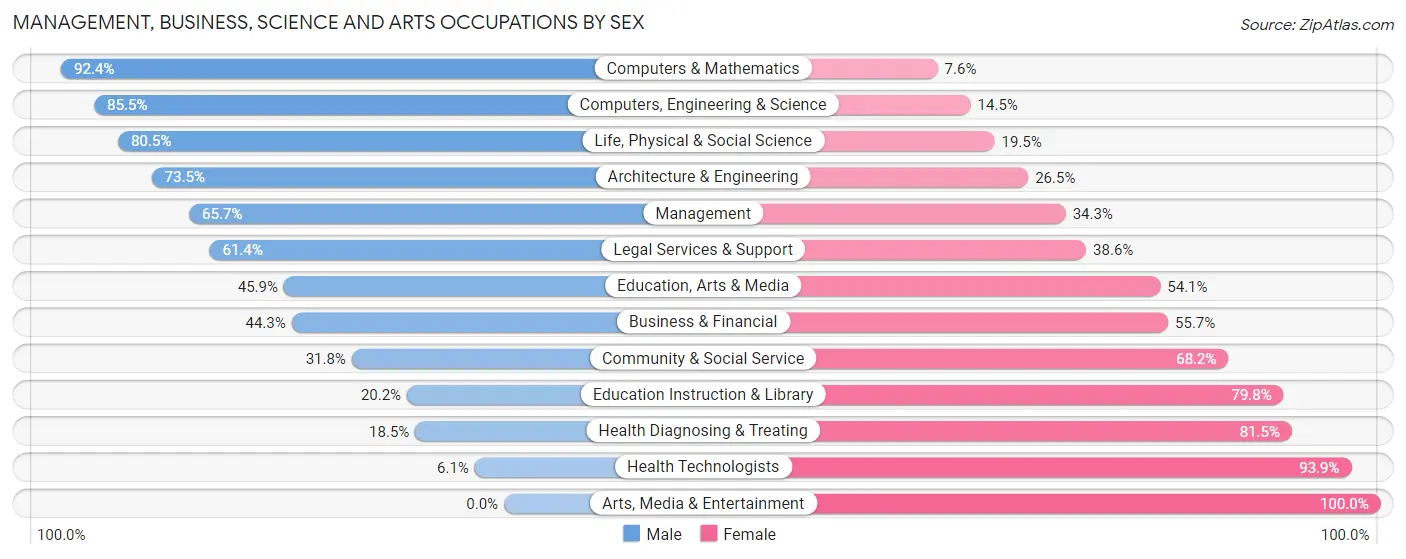
Management, Business, Science and Arts Occupations by Sex
Within the Management, Business, Science and Arts occupations in Bryant, the most male-oriented occupations are Computers & Mathematics (92.4%), Computers, Engineering & Science (85.5%), and Life, Physical & Social Science (80.5%), while the most female-oriented occupations are Arts, Media & Entertainment (100.0%), Health Technologists (93.9%), and Health Diagnosing & Treating (81.5%).
| Occupation | Male | Female |
| Management | 534 (65.7%) | 279 (34.3%) |
| Business & Financial | 401 (44.3%) | 504 (55.7%) |
| Computers, Engineering & Science | 678 (85.5%) | 115 (14.5%) |
| Computers & Mathematics | 425 (92.4%) | 35 (7.6%) |
| Architecture & Engineering | 158 (73.5%) | 57 (26.5%) |
| Life, Physical & Social Science | 95 (80.5%) | 23 (19.5%) |
| Community & Social Service | 312 (31.8%) | 670 (68.2%) |
| Education, Arts & Media | 79 (45.9%) | 93 (54.1%) |
| Legal Services & Support | 113 (61.4%) | 71 (38.6%) |
| Education Instruction & Library | 120 (20.2%) | 473 (79.8%) |
| Arts, Media & Entertainment | 0 (0.0%) | 33 (100.0%) |
| Health Diagnosing & Treating | 245 (18.5%) | 1,077 (81.5%) |
| Health Technologists | 58 (6.1%) | 892 (93.9%) |
| Total (Category) | 2,170 (45.1%) | 2,645 (54.9%) |
| Total (Overall) | 5,103 (47.7%) | 5,588 (52.3%) |
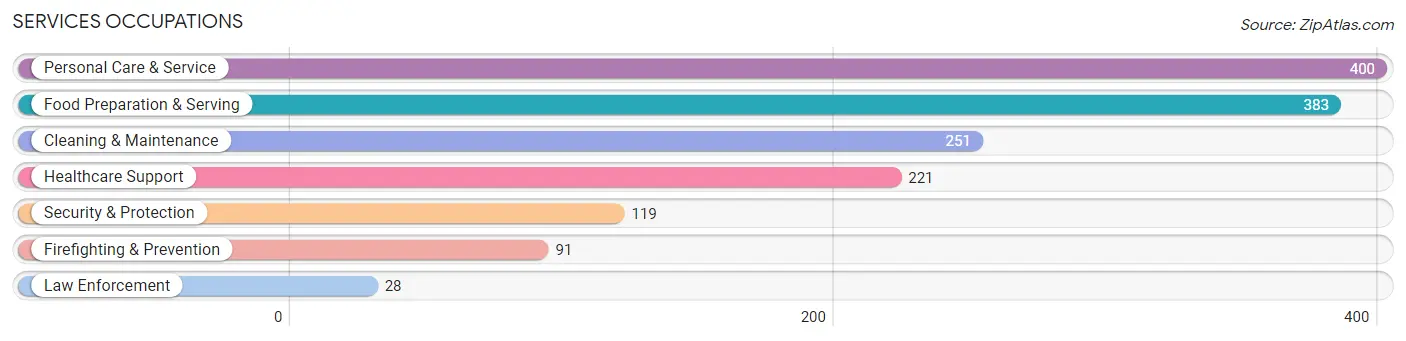
Services Occupations
The most common Services occupations in Bryant are Personal Care & Service (400 | 3.7%), Food Preparation & Serving (383 | 3.6%), Cleaning & Maintenance (251 | 2.4%), Healthcare Support (221 | 2.1%), and Security & Protection (119 | 1.1%).
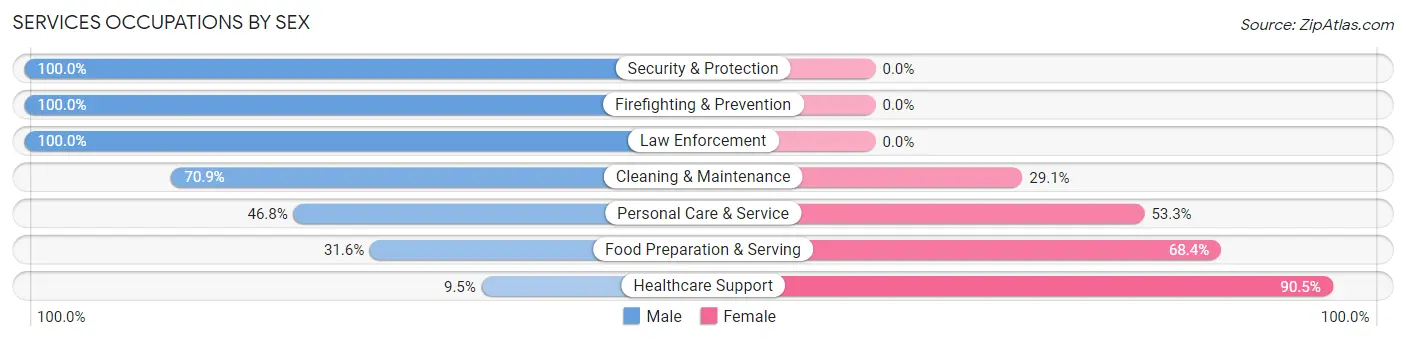
Services Occupations by Sex
Within the Services occupations in Bryant, the most male-oriented occupations are Security & Protection (100.0%), Firefighting & Prevention (100.0%), and Law Enforcement (100.0%), while the most female-oriented occupations are Healthcare Support (90.5%), Food Preparation & Serving (68.4%), and Personal Care & Service (53.2%).
| Occupation | Male | Female |
| Healthcare Support | 21 (9.5%) | 200 (90.5%) |
| Security & Protection | 119 (100.0%) | 0 (0.0%) |
| Firefighting & Prevention | 91 (100.0%) | 0 (0.0%) |
| Law Enforcement | 28 (100.0%) | 0 (0.0%) |
| Food Preparation & Serving | 121 (31.6%) | 262 (68.4%) |
| Cleaning & Maintenance | 178 (70.9%) | 73 (29.1%) |
| Personal Care & Service | 187 (46.8%) | 213 (53.2%) |
| Total (Category) | 626 (45.6%) | 748 (54.4%) |
| Total (Overall) | 5,103 (47.7%) | 5,588 (52.3%) |
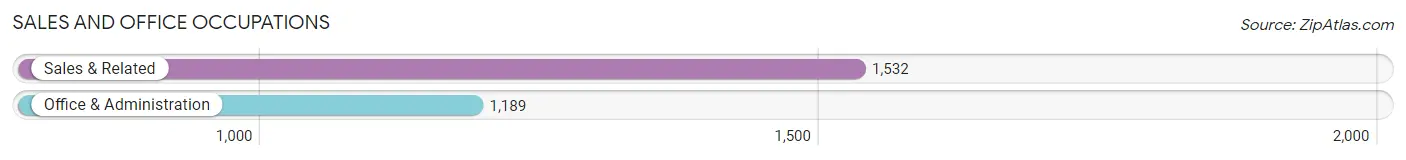
Sales and Office Occupations
The most common Sales and Office occupations in Bryant are Sales & Related (1,532 | 14.3%), and Office & Administration (1,189 | 11.1%).
Sales and Office Occupations by Sex
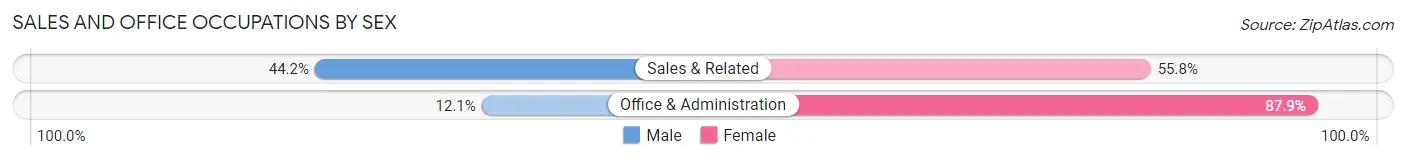
| Occupation | Male | Female |
| Sales & Related | 677 (44.2%) | 855 (55.8%) |
| Office & Administration | 144 (12.1%) | 1,045 (87.9%) |
| Total (Category) | 821 (30.2%) | 1,900 (69.8%) |
| Total (Overall) | 5,103 (47.7%) | 5,588 (52.3%) |
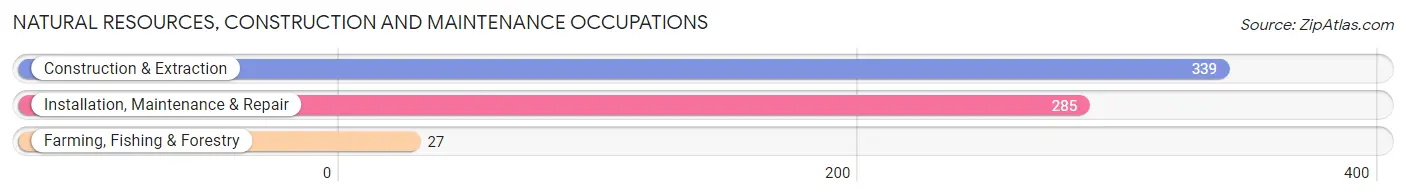
Natural Resources, Construction and Maintenance Occupations
The most common Natural Resources, Construction and Maintenance occupations in Bryant are Construction & Extraction (339 | 3.2%), Installation, Maintenance & Repair (285 | 2.7%), and Farming, Fishing & Forestry (27 | 0.3%).
Natural Resources, Construction and Maintenance Occupations by Sex
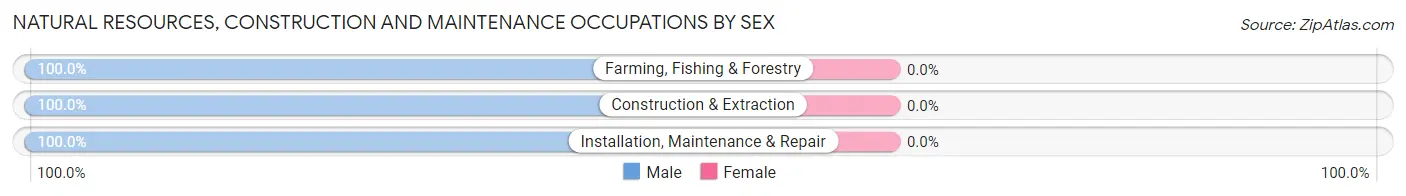
| Occupation | Male | Female |
| Farming, Fishing & Forestry | 27 (100.0%) | 0 (0.0%) |
| Construction & Extraction | 339 (100.0%) | 0 (0.0%) |
| Installation, Maintenance & Repair | 285 (100.0%) | 0 (0.0%) |
| Total (Category) | 651 (100.0%) | 0 (0.0%) |
| Total (Overall) | 5,103 (47.7%) | 5,588 (52.3%) |
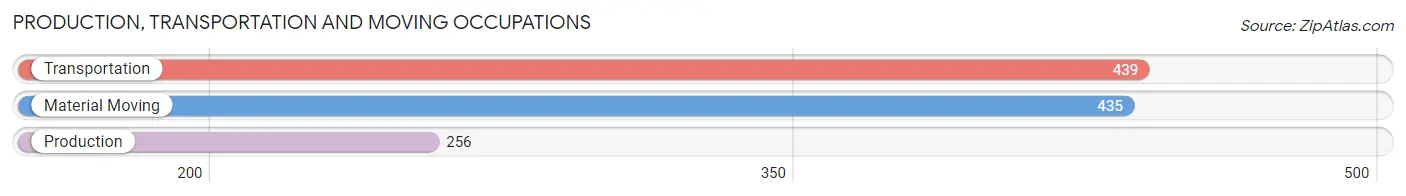
Production, Transportation and Moving Occupations
The most common Production, Transportation and Moving occupations in Bryant are Transportation (439 | 4.1%), Material Moving (435 | 4.1%), and Production (256 | 2.4%).
Production, Transportation and Moving Occupations by Sex
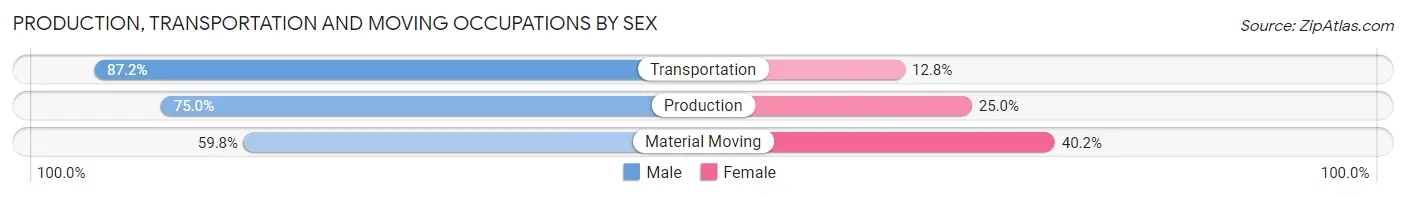
| Occupation | Male | Female |
| Production | 192 (75.0%) | 64 (25.0%) |
| Transportation | 383 (87.2%) | 56 (12.8%) |
| Material Moving | 260 (59.8%) | 175 (40.2%) |
| Total (Category) | 835 (73.9%) | 295 (26.1%) |
| Total (Overall) | 5,103 (47.7%) | 5,588 (52.3%) |
Employment Industries by Sex in Bryant
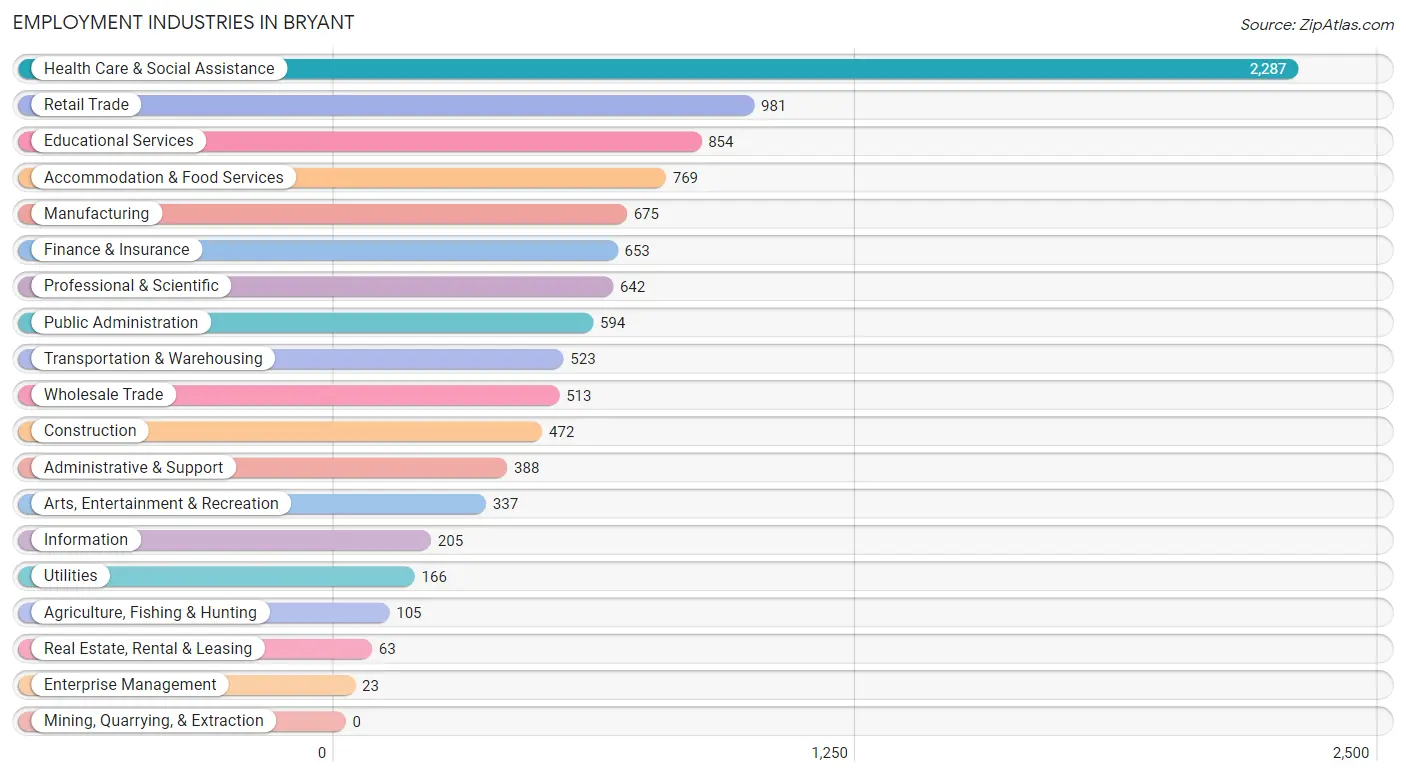
Employment Industries in Bryant
The major employment industries in Bryant include Health Care & Social Assistance (2,287 | 21.4%), Retail Trade (981 | 9.2%), Educational Services (854 | 8.0%), Accommodation & Food Services (769 | 7.2%), and Manufacturing (675 | 6.3%).
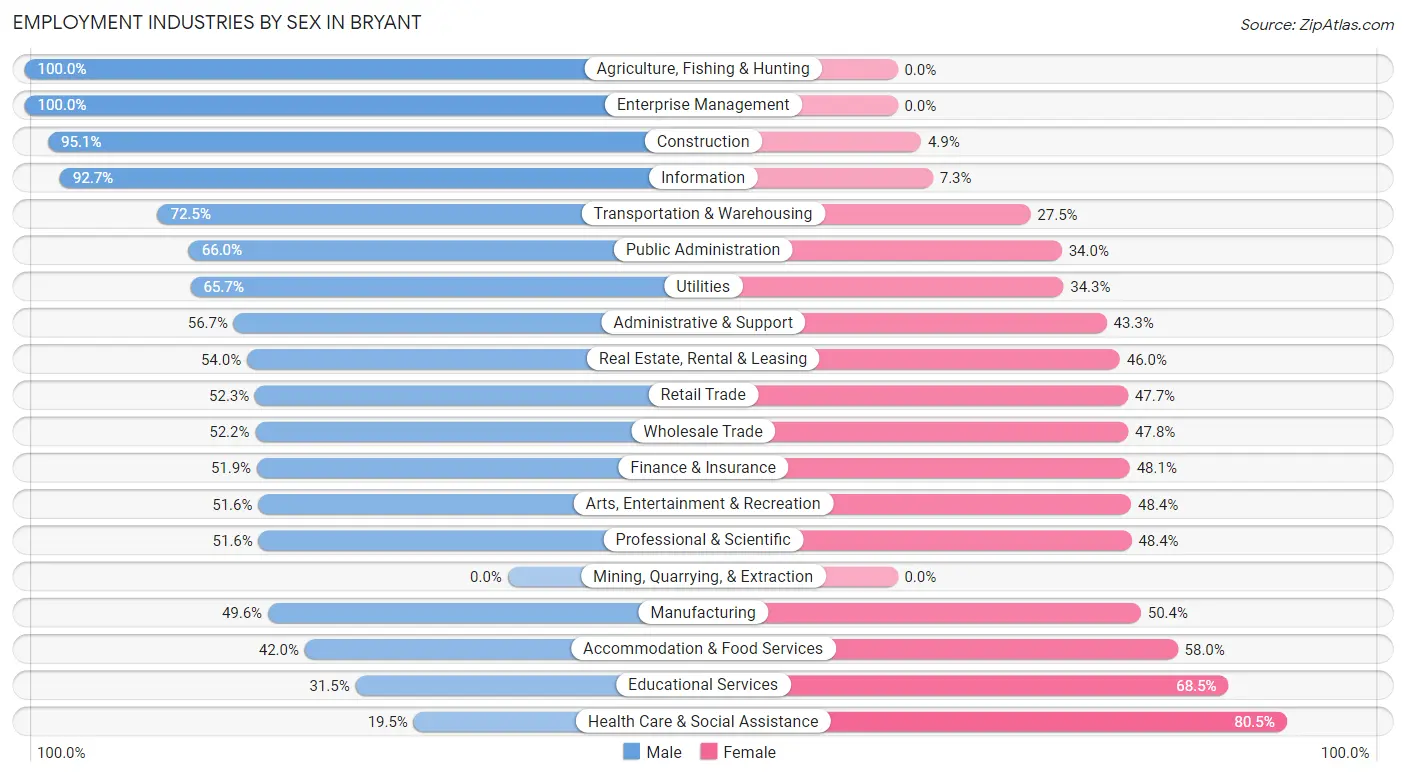
Employment Industries by Sex in Bryant
The Bryant industries that see more men than women are Agriculture, Fishing & Hunting (100.0%), Enterprise Management (100.0%), and Construction (95.1%), whereas the industries that tend to have a higher number of women are Health Care & Social Assistance (80.5%), Educational Services (68.5%), and Accommodation & Food Services (58.0%).
| Industry | Male | Female |
| Agriculture, Fishing & Hunting | 105 (100.0%) | 0 (0.0%) |
| Mining, Quarrying, & Extraction | 0 (0.0%) | 0 (0.0%) |
| Construction | 449 (95.1%) | 23 (4.9%) |
| Manufacturing | 335 (49.6%) | 340 (50.4%) |
| Wholesale Trade | 268 (52.2%) | 245 (47.8%) |
| Retail Trade | 513 (52.3%) | 468 (47.7%) |
| Transportation & Warehousing | 379 (72.5%) | 144 (27.5%) |
| Utilities | 109 (65.7%) | 57 (34.3%) |
| Information | 190 (92.7%) | 15 (7.3%) |
| Finance & Insurance | 339 (51.9%) | 314 (48.1%) |
| Real Estate, Rental & Leasing | 34 (54.0%) | 29 (46.0%) |
| Professional & Scientific | 331 (51.6%) | 311 (48.4%) |
| Enterprise Management | 23 (100.0%) | 0 (0.0%) |
| Administrative & Support | 220 (56.7%) | 168 (43.3%) |
| Educational Services | 269 (31.5%) | 585 (68.5%) |
| Health Care & Social Assistance | 445 (19.5%) | 1,842 (80.5%) |
| Arts, Entertainment & Recreation | 174 (51.6%) | 163 (48.4%) |
| Accommodation & Food Services | 323 (42.0%) | 446 (58.0%) |
| Public Administration | 392 (66.0%) | 202 (34.0%) |
| Total | 5,103 (47.7%) | 5,588 (52.3%) |
Education in Bryant
School Enrollment in Bryant
The most common levels of schooling among the 4,943 students in Bryant are middle school (1,526 | 30.9%), high school (1,421 | 28.7%), and elementary school (715 | 14.5%).
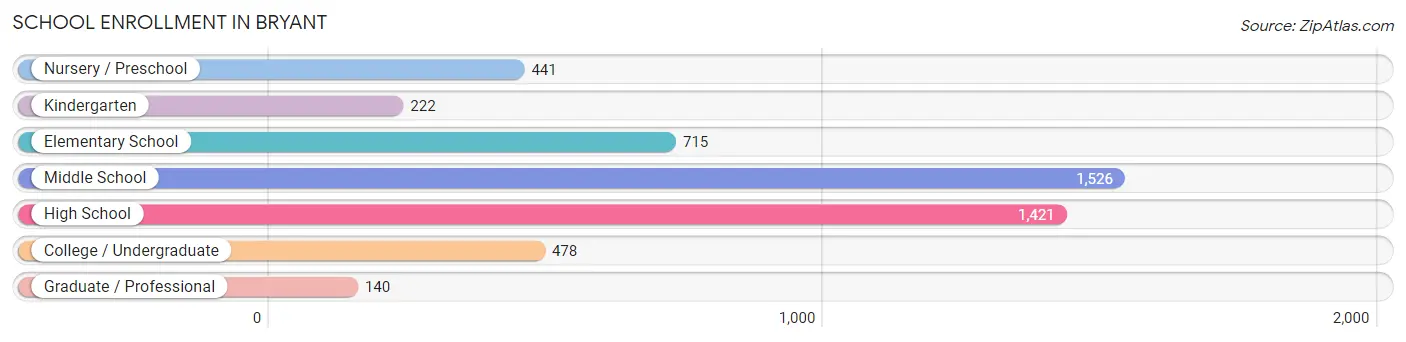
| School Level | # Students | % Students |
| Nursery / Preschool | 441 | 8.9% |
| Kindergarten | 222 | 4.5% |
| Elementary School | 715 | 14.5% |
| Middle School | 1,526 | 30.9% |
| High School | 1,421 | 28.7% |
| College / Undergraduate | 478 | 9.7% |
| Graduate / Professional | 140 | 2.8% |
| Total | 4,943 | 100.0% |
School Enrollment by Age by Funding Source in Bryant
Out of a total of 4,943 students who are enrolled in schools in Bryant, 489 (9.9%) attend a private institution, while the remaining 4,454 (90.1%) are enrolled in public schools. The age group of 3 to 4 year olds has the highest likelihood of being enrolled in private schools, with 180 (64.1% in the age bracket) enrolled. Conversely, the age group of 18 to 19 year olds has the lowest likelihood of being enrolled in a private school, with 147 (100.0% in the age bracket) attending a public institution.
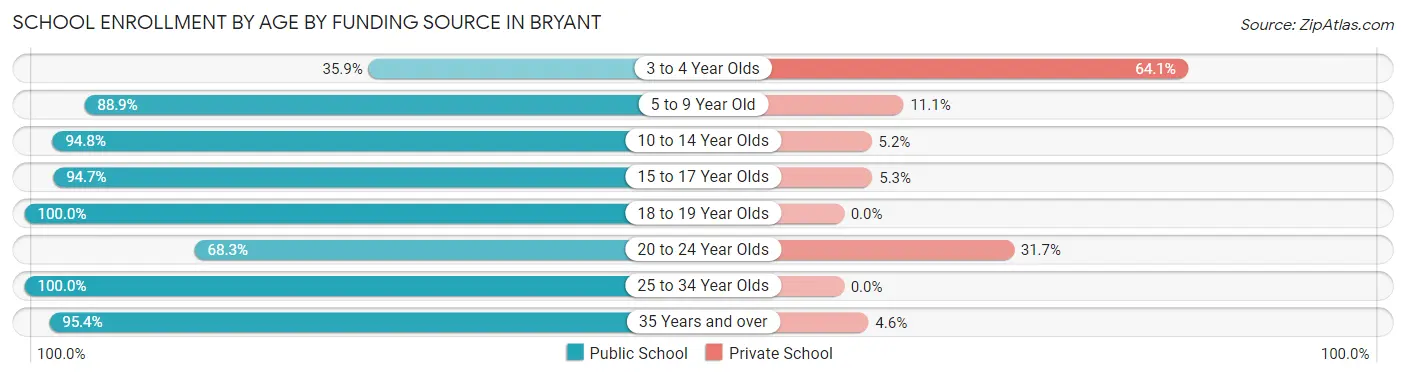
| Age Bracket | Public School | Private School |
| 3 to 4 Year Olds | 101 (35.9%) | 180 (64.1%) |
| 5 to 9 Year Old | 901 (88.9%) | 113 (11.1%) |
| 10 to 14 Year Olds | 1,624 (94.8%) | 89 (5.2%) |
| 15 to 17 Year Olds | 1,136 (94.7%) | 64 (5.3%) |
| 18 to 19 Year Olds | 147 (100.0%) | 0 (0.0%) |
| 20 to 24 Year Olds | 69 (68.3%) | 32 (31.7%) |
| 25 to 34 Year Olds | 205 (100.0%) | 0 (0.0%) |
| 35 Years and over | 269 (95.4%) | 13 (4.6%) |
| Total | 4,454 (90.1%) | 489 (9.9%) |
Educational Attainment by Field of Study in Bryant
Business (1,317 | 24.5%), science & technology (1,044 | 19.5%), education (668 | 12.4%), engineering (410 | 7.6%), and arts & humanities (383 | 7.1%) are the most common fields of study among 5,365 individuals in Bryant who have obtained a bachelor's degree or higher.
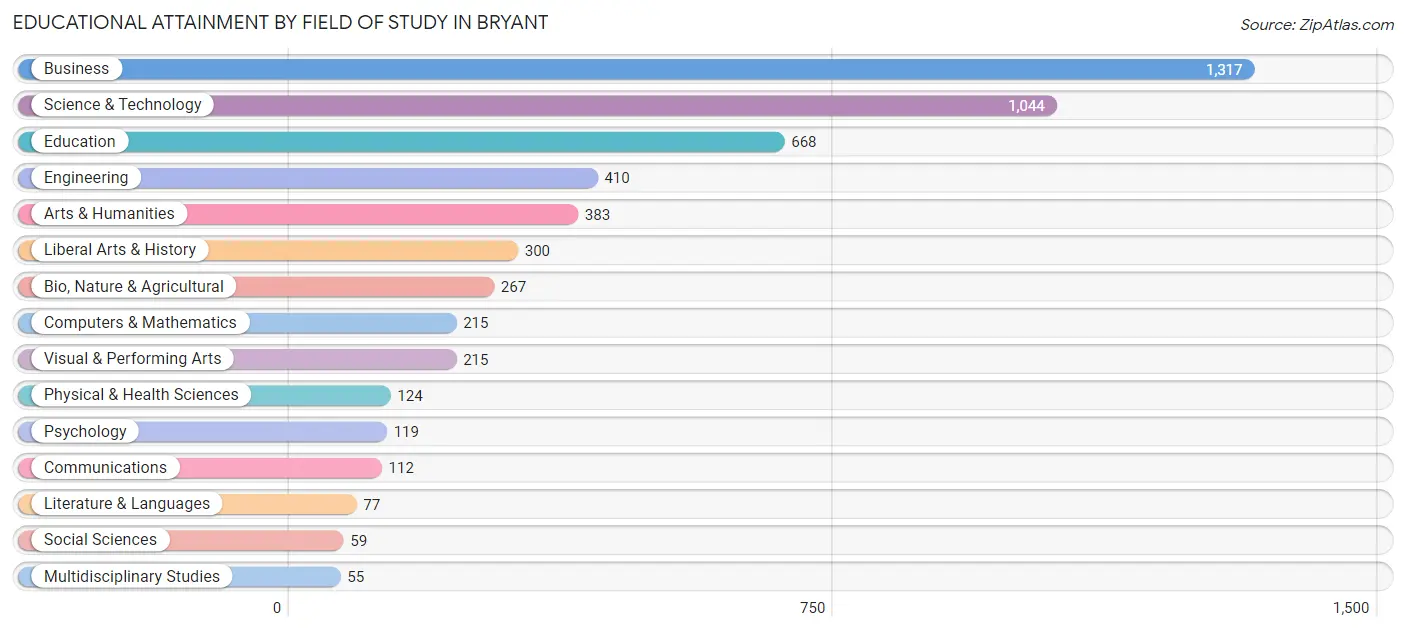
| Field of Study | # Graduates | % Graduates |
| Computers & Mathematics | 215 | 4.0% |
| Bio, Nature & Agricultural | 267 | 5.0% |
| Physical & Health Sciences | 124 | 2.3% |
| Psychology | 119 | 2.2% |
| Social Sciences | 59 | 1.1% |
| Engineering | 410 | 7.6% |
| Multidisciplinary Studies | 55 | 1.0% |
| Science & Technology | 1,044 | 19.5% |
| Business | 1,317 | 24.5% |
| Education | 668 | 12.4% |
| Literature & Languages | 77 | 1.4% |
| Liberal Arts & History | 300 | 5.6% |
| Visual & Performing Arts | 215 | 4.0% |
| Communications | 112 | 2.1% |
| Arts & Humanities | 383 | 7.1% |
| Total | 5,365 | 100.0% |
Transportation & Commute in Bryant
Vehicle Availability by Sex in Bryant
The most prevalent vehicle ownership categories in Bryant are males with 2 vehicles (2,653, accounting for 52.1%) and females with 2 vehicles (2,871, making up 48.9%).
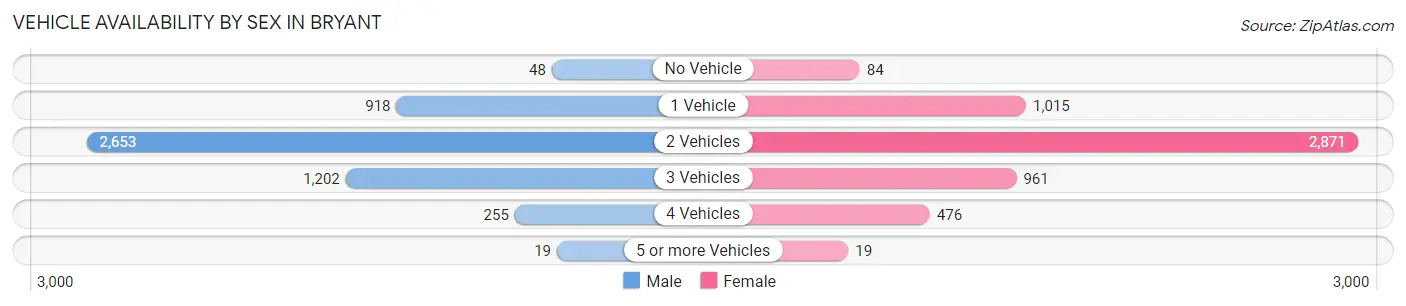
| Vehicles Available | Male | Female |
| No Vehicle | 48 (0.9%) | 84 (1.5%) |
| 1 Vehicle | 918 (18.0%) | 1,015 (18.7%) |
| 2 Vehicles | 2,653 (52.1%) | 2,871 (52.9%) |
| 3 Vehicles | 1,202 (23.6%) | 961 (17.7%) |
| 4 Vehicles | 255 (5.0%) | 476 (8.8%) |
| 5 or more Vehicles | 19 (0.4%) | 19 (0.4%) |
| Total | 5,095 (100.0%) | 5,426 (100.0%) |
Commute Time in Bryant
The most frequently occuring commute durations in Bryant are 20 to 24 minutes (1,961 commuters, 20.2%), 15 to 19 minutes (1,549 commuters, 16.0%), and 30 to 34 minutes (1,267 commuters, 13.1%).
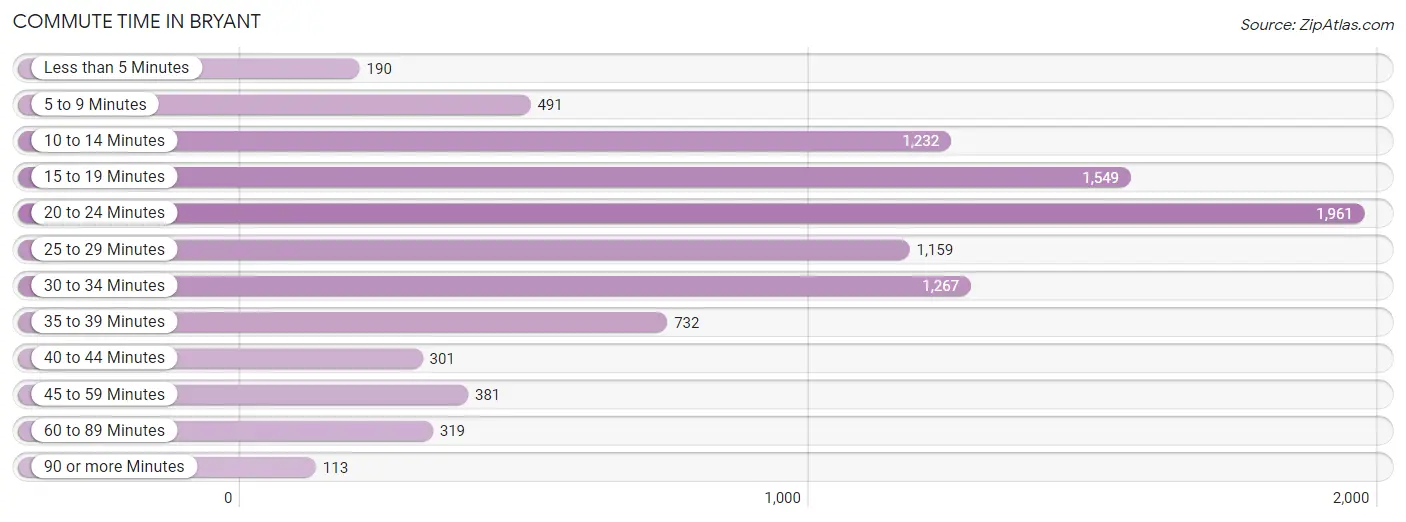
| Commute Time | # Commuters | % Commuters |
| Less than 5 Minutes | 190 | 2.0% |
| 5 to 9 Minutes | 491 | 5.1% |
| 10 to 14 Minutes | 1,232 | 12.7% |
| 15 to 19 Minutes | 1,549 | 16.0% |
| 20 to 24 Minutes | 1,961 | 20.2% |
| 25 to 29 Minutes | 1,159 | 11.9% |
| 30 to 34 Minutes | 1,267 | 13.1% |
| 35 to 39 Minutes | 732 | 7.5% |
| 40 to 44 Minutes | 301 | 3.1% |
| 45 to 59 Minutes | 381 | 3.9% |
| 60 to 89 Minutes | 319 | 3.3% |
| 90 or more Minutes | 113 | 1.2% |
Commute Time by Sex in Bryant
The most common commute times in Bryant are 20 to 24 minutes (966 commuters, 20.2%) for males and 20 to 24 minutes (995 commuters, 20.3%) for females.
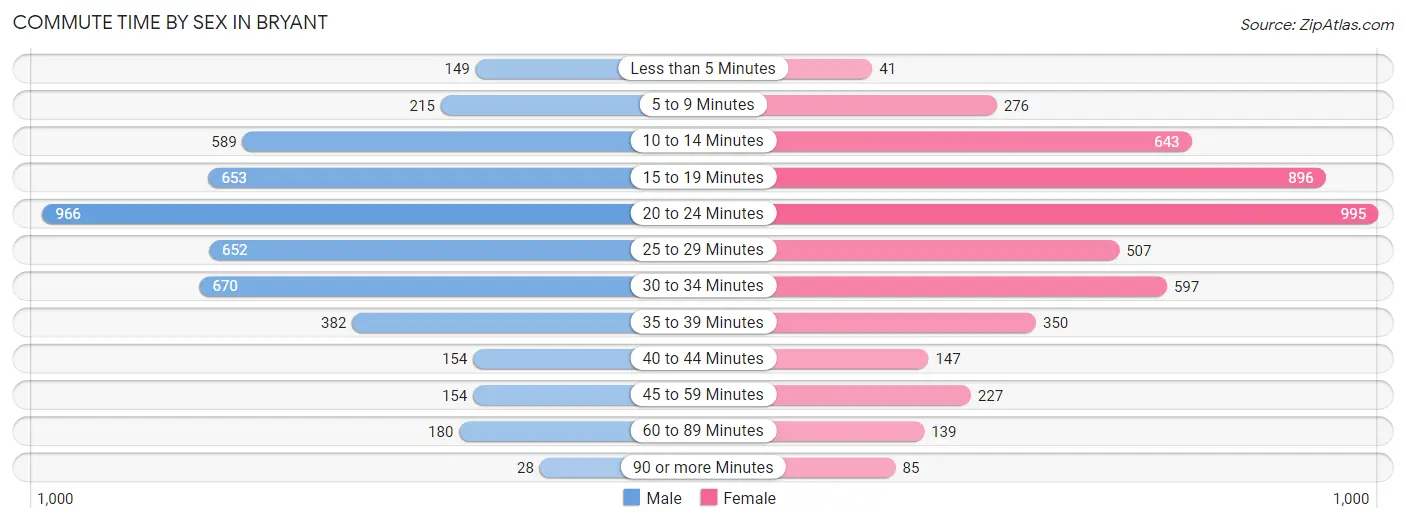
| Commute Time | Male | Female |
| Less than 5 Minutes | 149 (3.1%) | 41 (0.8%) |
| 5 to 9 Minutes | 215 (4.5%) | 276 (5.6%) |
| 10 to 14 Minutes | 589 (12.3%) | 643 (13.1%) |
| 15 to 19 Minutes | 653 (13.6%) | 896 (18.3%) |
| 20 to 24 Minutes | 966 (20.2%) | 995 (20.3%) |
| 25 to 29 Minutes | 652 (13.6%) | 507 (10.3%) |
| 30 to 34 Minutes | 670 (14.0%) | 597 (12.2%) |
| 35 to 39 Minutes | 382 (8.0%) | 350 (7.1%) |
| 40 to 44 Minutes | 154 (3.2%) | 147 (3.0%) |
| 45 to 59 Minutes | 154 (3.2%) | 227 (4.6%) |
| 60 to 89 Minutes | 180 (3.8%) | 139 (2.8%) |
| 90 or more Minutes | 28 (0.6%) | 85 (1.7%) |
Time of Departure to Work by Sex in Bryant
The most frequent times of departure to work in Bryant are 7:00 AM to 7:29 AM (753, 15.7%) for males and 7:00 AM to 7:29 AM (1,234, 25.2%) for females.
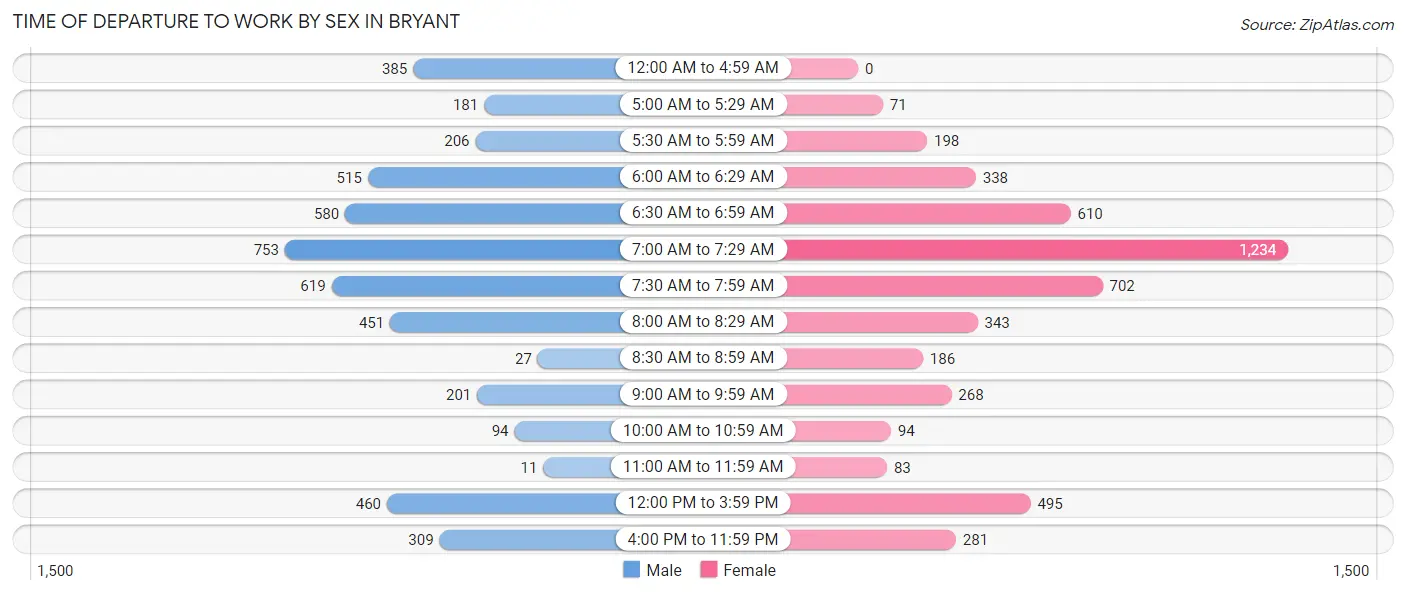
| Time of Departure | Male | Female |
| 12:00 AM to 4:59 AM | 385 (8.0%) | 0 (0.0%) |
| 5:00 AM to 5:29 AM | 181 (3.8%) | 71 (1.5%) |
| 5:30 AM to 5:59 AM | 206 (4.3%) | 198 (4.0%) |
| 6:00 AM to 6:29 AM | 515 (10.7%) | 338 (6.9%) |
| 6:30 AM to 6:59 AM | 580 (12.1%) | 610 (12.4%) |
| 7:00 AM to 7:29 AM | 753 (15.7%) | 1,234 (25.2%) |
| 7:30 AM to 7:59 AM | 619 (12.9%) | 702 (14.3%) |
| 8:00 AM to 8:29 AM | 451 (9.4%) | 343 (7.0%) |
| 8:30 AM to 8:59 AM | 27 (0.6%) | 186 (3.8%) |
| 9:00 AM to 9:59 AM | 201 (4.2%) | 268 (5.5%) |
| 10:00 AM to 10:59 AM | 94 (2.0%) | 94 (1.9%) |
| 11:00 AM to 11:59 AM | 11 (0.2%) | 83 (1.7%) |
| 12:00 PM to 3:59 PM | 460 (9.6%) | 495 (10.1%) |
| 4:00 PM to 11:59 PM | 309 (6.5%) | 281 (5.7%) |
| Total | 4,792 (100.0%) | 4,903 (100.0%) |
Housing Occupancy in Bryant
Occupancy by Ownership in Bryant
Of the total 8,247 dwellings in Bryant, owner-occupied units account for 5,731 (69.5%), while renter-occupied units make up 2,516 (30.5%).
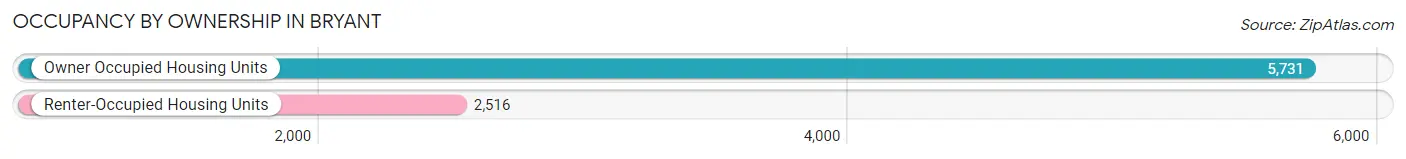
| Occupancy | # Housing Units | % Housing Units |
| Owner Occupied Housing Units | 5,731 | 69.5% |
| Renter-Occupied Housing Units | 2,516 | 30.5% |
| Total Occupied Housing Units | 8,247 | 100.0% |
Occupancy by Household Size in Bryant
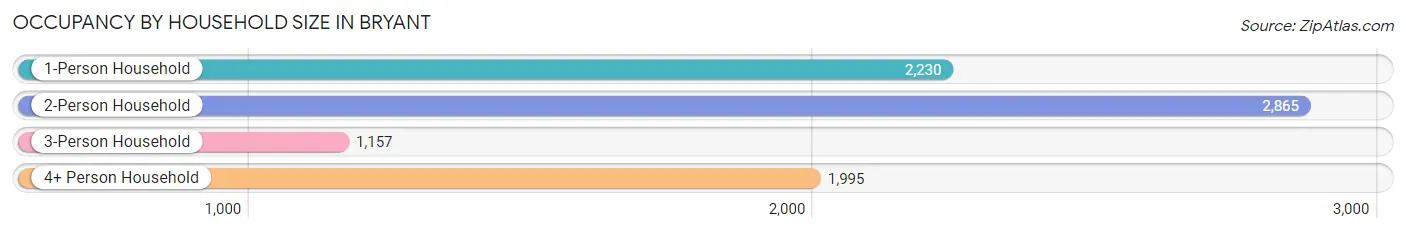
| Household Size | # Housing Units | % Housing Units |
| 1-Person Household | 2,230 | 27.0% |
| 2-Person Household | 2,865 | 34.7% |
| 3-Person Household | 1,157 | 14.0% |
| 4+ Person Household | 1,995 | 24.2% |
| Total Housing Units | 8,247 | 100.0% |
Occupancy by Ownership by Household Size in Bryant
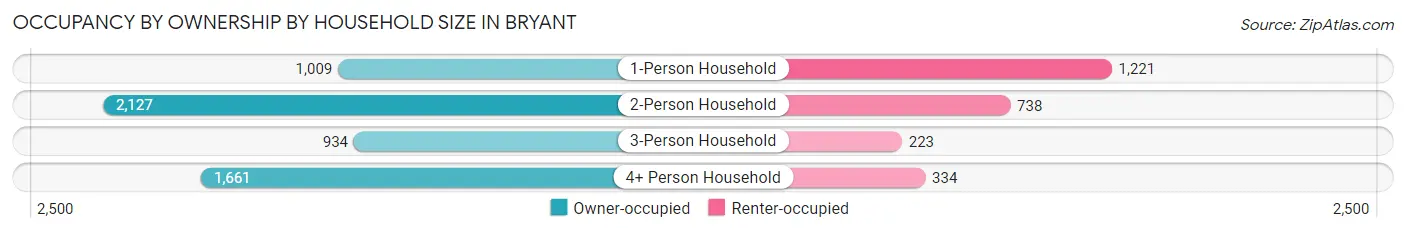
| Household Size | Owner-occupied | Renter-occupied |
| 1-Person Household | 1,009 (45.3%) | 1,221 (54.7%) |
| 2-Person Household | 2,127 (74.2%) | 738 (25.8%) |
| 3-Person Household | 934 (80.7%) | 223 (19.3%) |
| 4+ Person Household | 1,661 (83.3%) | 334 (16.7%) |
| Total Housing Units | 5,731 (69.5%) | 2,516 (30.5%) |
Occupancy by Educational Attainment in Bryant
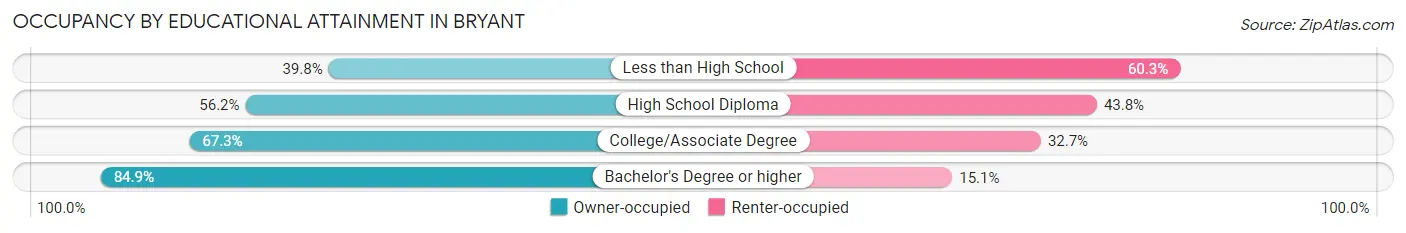
| Household Size | Owner-occupied | Renter-occupied |
| Less than High School | 227 (39.8%) | 344 (60.3%) |
| High School Diploma | 1,052 (56.2%) | 819 (43.8%) |
| College/Associate Degree | 1,826 (67.3%) | 886 (32.7%) |
| Bachelor's Degree or higher | 2,626 (84.9%) | 467 (15.1%) |
Occupancy by Age of Householder in Bryant
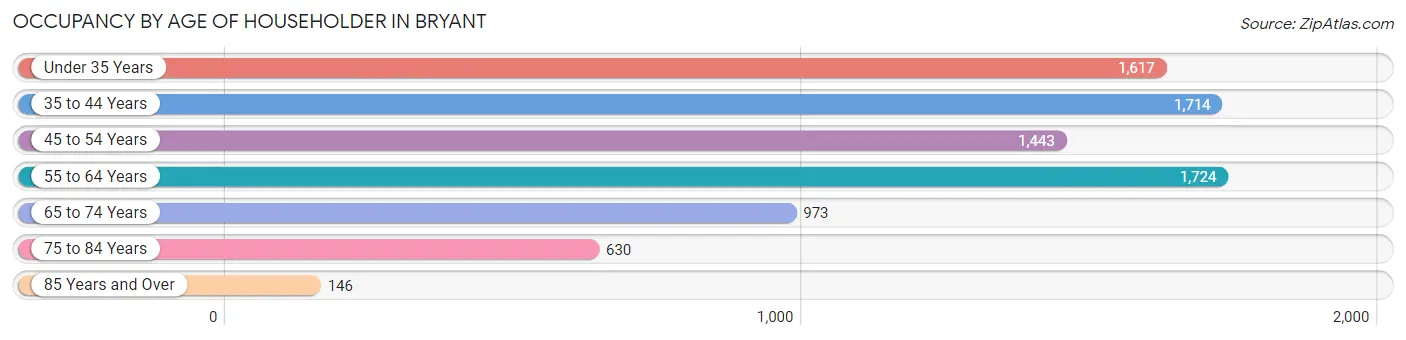
| Age Bracket | # Households | % Households |
| Under 35 Years | 1,617 | 19.6% |
| 35 to 44 Years | 1,714 | 20.8% |
| 45 to 54 Years | 1,443 | 17.5% |
| 55 to 64 Years | 1,724 | 20.9% |
| 65 to 74 Years | 973 | 11.8% |
| 75 to 84 Years | 630 | 7.6% |
| 85 Years and Over | 146 | 1.8% |
| Total | 8,247 | 100.0% |
Housing Finances in Bryant
Median Income by Occupancy in Bryant
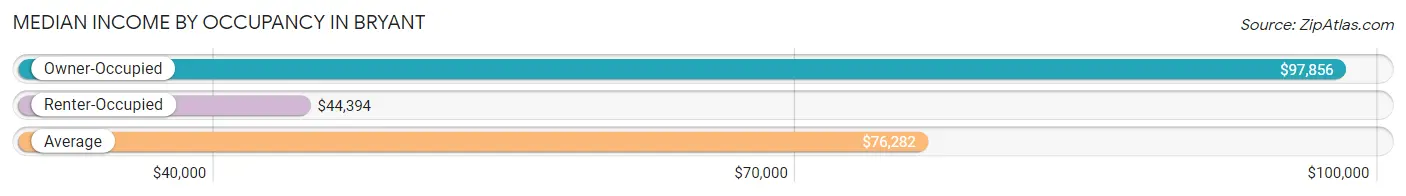
| Occupancy Type | # Households | Median Income |
| Owner-Occupied | 5,731 (69.5%) | $97,856 |
| Renter-Occupied | 2,516 (30.5%) | $44,394 |
| Average | 8,247 (100.0%) | $76,282 |
Occupancy by Householder Income Bracket in Bryant
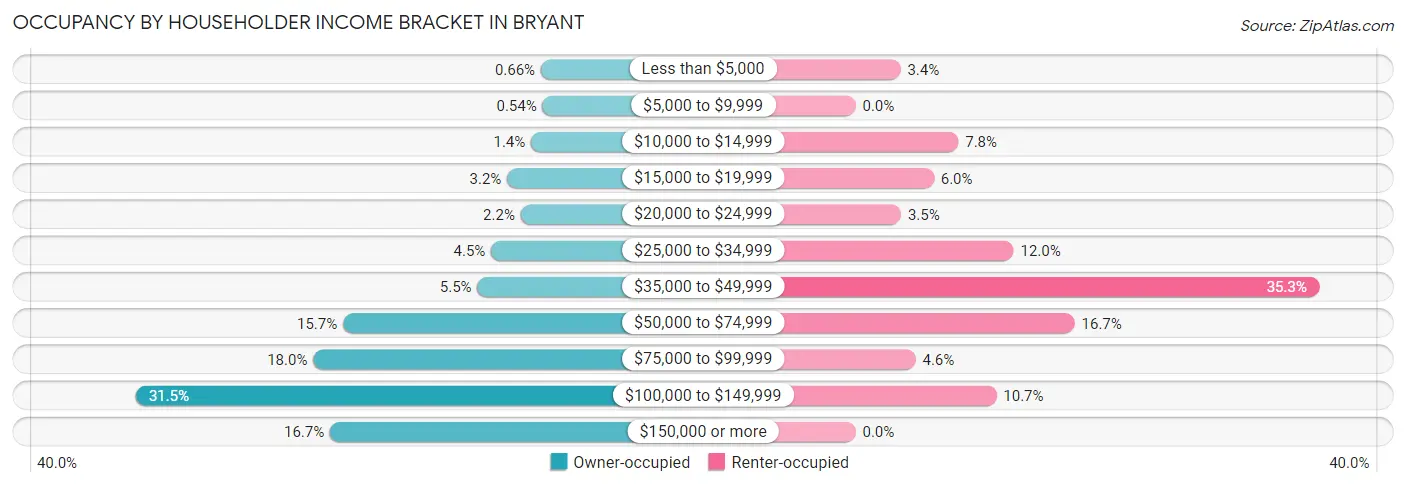
| Income Bracket | Owner-occupied | Renter-occupied |
| Less than $5,000 | 38 (0.7%) | 86 (3.4%) |
| $5,000 to $9,999 | 31 (0.5%) | 0 (0.0%) |
| $10,000 to $14,999 | 81 (1.4%) | 197 (7.8%) |
| $15,000 to $19,999 | 185 (3.2%) | 150 (6.0%) |
| $20,000 to $24,999 | 126 (2.2%) | 87 (3.5%) |
| $25,000 to $34,999 | 255 (4.4%) | 303 (12.0%) |
| $35,000 to $49,999 | 315 (5.5%) | 888 (35.3%) |
| $50,000 to $74,999 | 902 (15.7%) | 420 (16.7%) |
| $75,000 to $99,999 | 1,032 (18.0%) | 115 (4.6%) |
| $100,000 to $149,999 | 1,807 (31.5%) | 270 (10.7%) |
| $150,000 or more | 959 (16.7%) | 0 (0.0%) |
| Total | 5,731 (100.0%) | 2,516 (100.0%) |
Monthly Housing Cost Tiers in Bryant
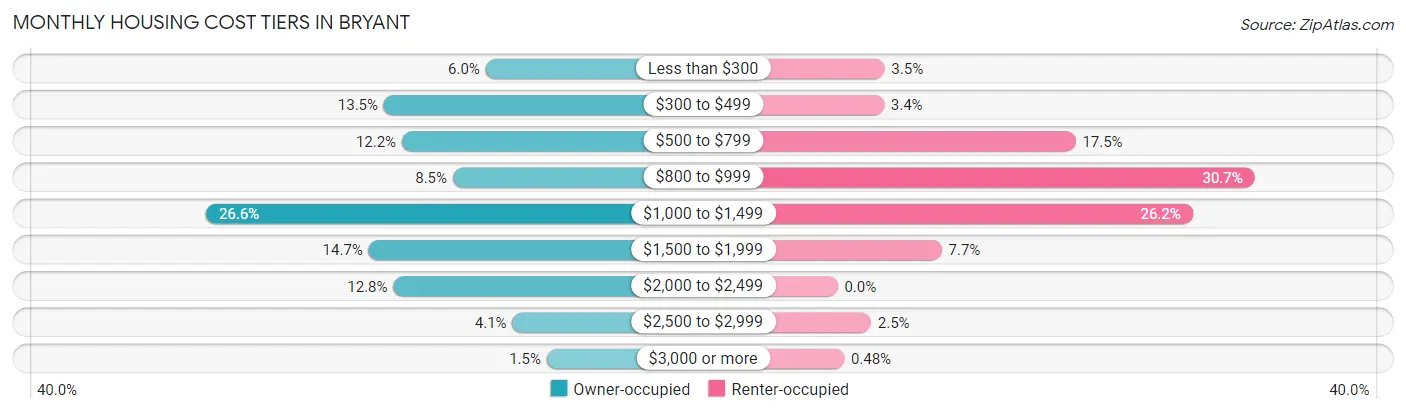
| Monthly Cost | Owner-occupied | Renter-occupied |
| Less than $300 | 346 (6.0%) | 87 (3.5%) |
| $300 to $499 | 776 (13.5%) | 86 (3.4%) |
| $500 to $799 | 700 (12.2%) | 441 (17.5%) |
| $800 to $999 | 485 (8.5%) | 773 (30.7%) |
| $1,000 to $1,499 | 1,527 (26.6%) | 658 (26.2%) |
| $1,500 to $1,999 | 840 (14.7%) | 193 (7.7%) |
| $2,000 to $2,499 | 736 (12.8%) | 0 (0.0%) |
| $2,500 to $2,999 | 233 (4.1%) | 62 (2.5%) |
| $3,000 or more | 88 (1.5%) | 12 (0.5%) |
| Total | 5,731 (100.0%) | 2,516 (100.0%) |
Physical Housing Characteristics in Bryant
Housing Structures in Bryant
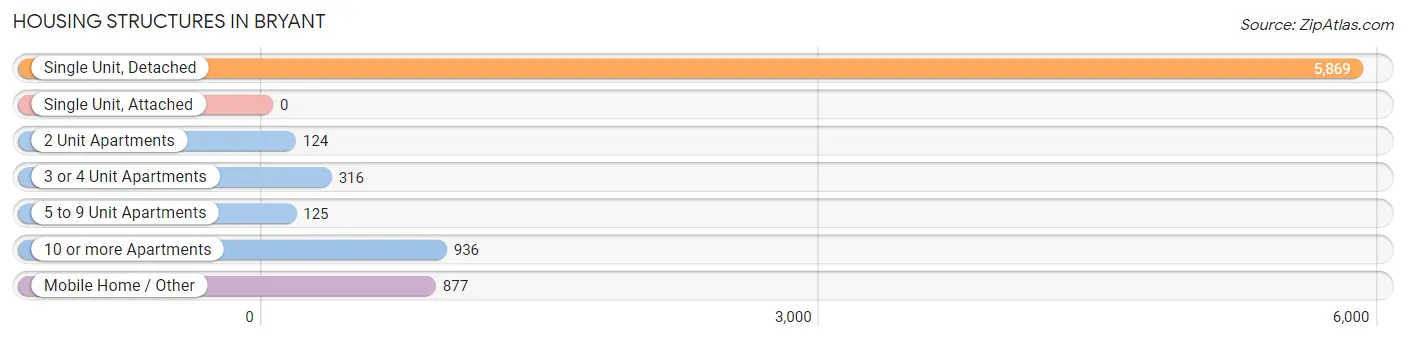
| Structure Type | # Housing Units | % Housing Units |
| Single Unit, Detached | 5,869 | 71.2% |
| Single Unit, Attached | 0 | 0.0% |
| 2 Unit Apartments | 124 | 1.5% |
| 3 or 4 Unit Apartments | 316 | 3.8% |
| 5 to 9 Unit Apartments | 125 | 1.5% |
| 10 or more Apartments | 936 | 11.4% |
| Mobile Home / Other | 877 | 10.6% |
| Total | 8,247 | 100.0% |
Housing Structures by Occupancy in Bryant
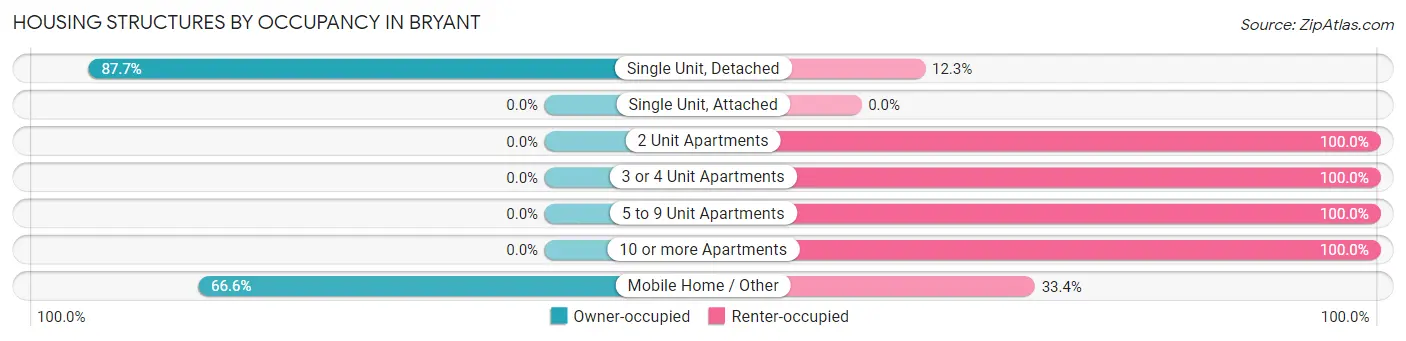
| Structure Type | Owner-occupied | Renter-occupied |
| Single Unit, Detached | 5,147 (87.7%) | 722 (12.3%) |
| Single Unit, Attached | 0 (0.0%) | 0 (0.0%) |
| 2 Unit Apartments | 0 (0.0%) | 124 (100.0%) |
| 3 or 4 Unit Apartments | 0 (0.0%) | 316 (100.0%) |
| 5 to 9 Unit Apartments | 0 (0.0%) | 125 (100.0%) |
| 10 or more Apartments | 0 (0.0%) | 936 (100.0%) |
| Mobile Home / Other | 584 (66.6%) | 293 (33.4%) |
| Total | 5,731 (69.5%) | 2,516 (30.5%) |
Housing Structures by Number of Rooms in Bryant
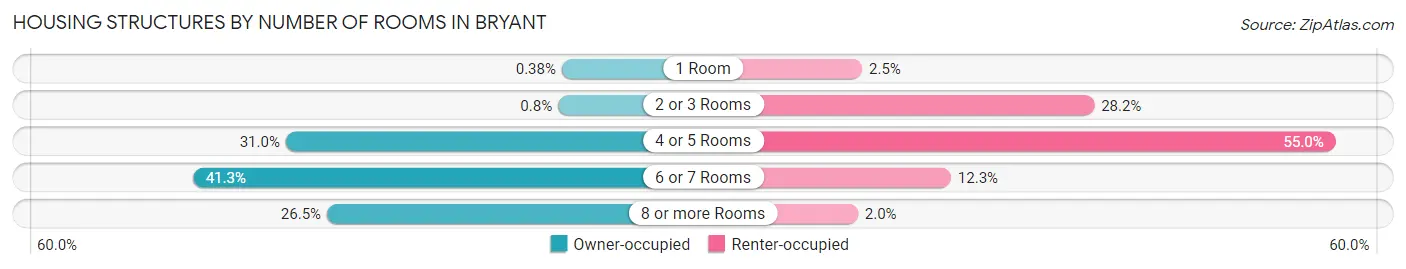
| Number of Rooms | Owner-occupied | Renter-occupied |
| 1 Room | 22 (0.4%) | 62 (2.5%) |
| 2 or 3 Rooms | 46 (0.8%) | 710 (28.2%) |
| 4 or 5 Rooms | 1,778 (31.0%) | 1,384 (55.0%) |
| 6 or 7 Rooms | 2,369 (41.3%) | 310 (12.3%) |
| 8 or more Rooms | 1,516 (26.5%) | 50 (2.0%) |
| Total | 5,731 (100.0%) | 2,516 (100.0%) |
Housing Structure by Heating Type in Bryant
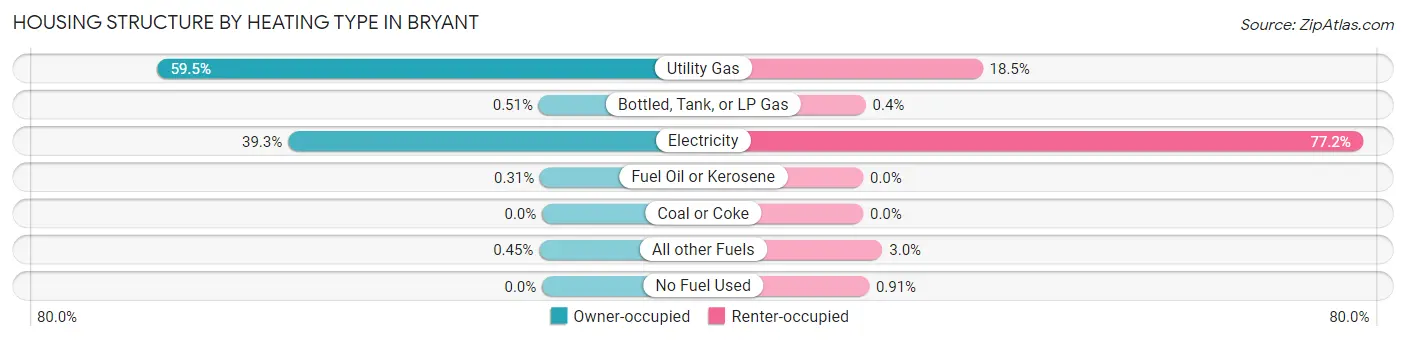
| Heating Type | Owner-occupied | Renter-occupied |
| Utility Gas | 3,407 (59.5%) | 465 (18.5%) |
| Bottled, Tank, or LP Gas | 29 (0.5%) | 10 (0.4%) |
| Electricity | 2,251 (39.3%) | 1,943 (77.2%) |
| Fuel Oil or Kerosene | 18 (0.3%) | 0 (0.0%) |
| Coal or Coke | 0 (0.0%) | 0 (0.0%) |
| All other Fuels | 26 (0.4%) | 75 (3.0%) |
| No Fuel Used | 0 (0.0%) | 23 (0.9%) |
| Total | 5,731 (100.0%) | 2,516 (100.0%) |
Household Vehicle Usage in Bryant
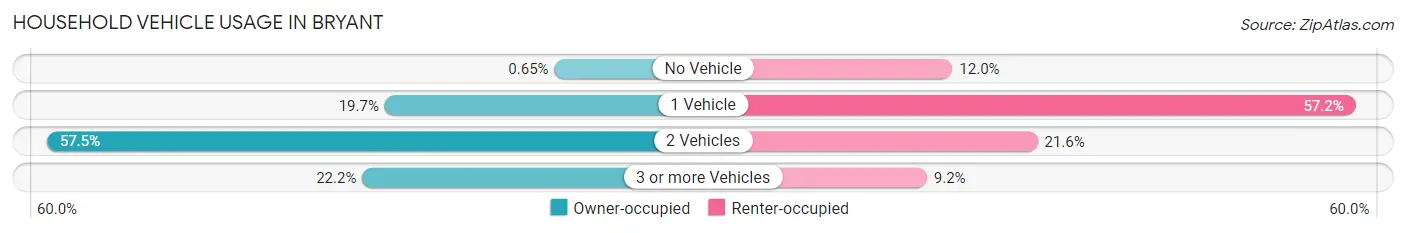
| Vehicles per Household | Owner-occupied | Renter-occupied |
| No Vehicle | 37 (0.6%) | 303 (12.0%) |
| 1 Vehicle | 1,127 (19.7%) | 1,439 (57.2%) |
| 2 Vehicles | 3,296 (57.5%) | 543 (21.6%) |
| 3 or more Vehicles | 1,271 (22.2%) | 231 (9.2%) |
| Total | 5,731 (100.0%) | 2,516 (100.0%) |
Real Estate & Mortgages in Bryant
Real Estate and Mortgage Overview in Bryant
| Characteristic | Without Mortgage | With Mortgage |
| Housing Units | 1,748 | 3,983 |
| Median Property Value | $161,400 | $226,000 |
| Median Household Income | $76,724 | $759 |
| Monthly Housing Costs | $429 | $88 |
| Real Estate Taxes | $1,155 | $25 |
Property Value by Mortgage Status in Bryant
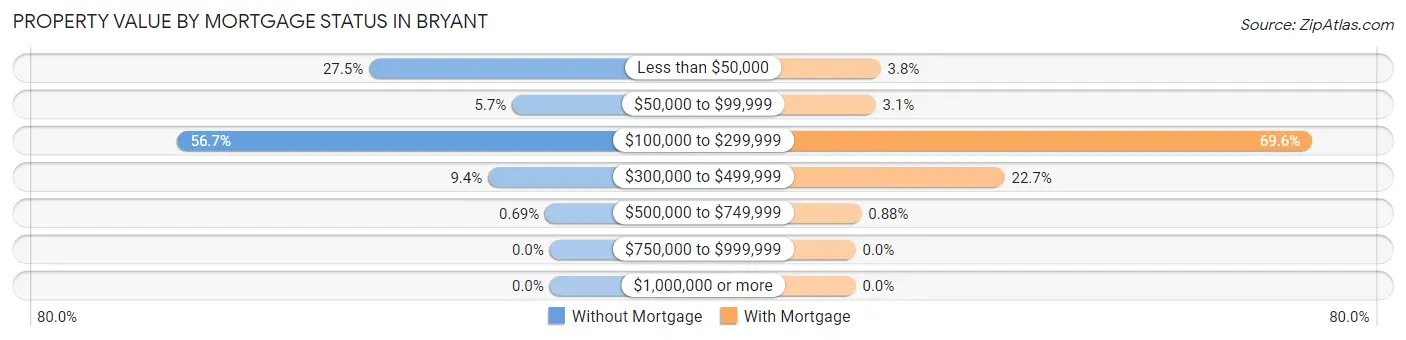
| Property Value | Without Mortgage | With Mortgage |
| Less than $50,000 | 481 (27.5%) | 152 (3.8%) |
| $50,000 to $99,999 | 100 (5.7%) | 122 (3.1%) |
| $100,000 to $299,999 | 991 (56.7%) | 2,770 (69.6%) |
| $300,000 to $499,999 | 164 (9.4%) | 904 (22.7%) |
| $500,000 to $749,999 | 12 (0.7%) | 35 (0.9%) |
| $750,000 to $999,999 | 0 (0.0%) | 0 (0.0%) |
| $1,000,000 or more | 0 (0.0%) | 0 (0.0%) |
| Total | 1,748 (100.0%) | 3,983 (100.0%) |
Household Income by Mortgage Status in Bryant
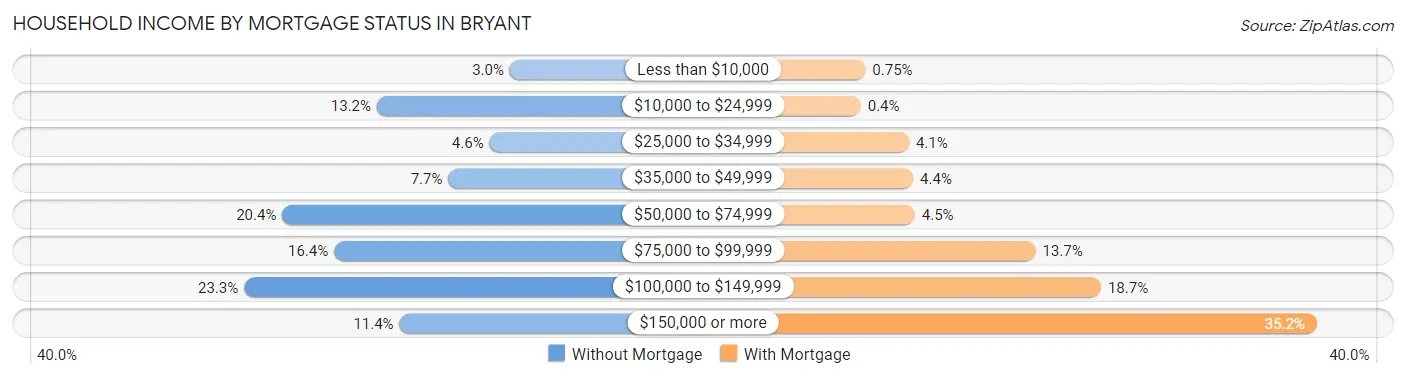
| Household Income | Without Mortgage | With Mortgage |
| Less than $10,000 | 53 (3.0%) | 30 (0.7%) |
| $10,000 to $24,999 | 230 (13.2%) | 16 (0.4%) |
| $25,000 to $34,999 | 80 (4.6%) | 162 (4.1%) |
| $35,000 to $49,999 | 135 (7.7%) | 175 (4.4%) |
| $50,000 to $74,999 | 356 (20.4%) | 180 (4.5%) |
| $75,000 to $99,999 | 287 (16.4%) | 546 (13.7%) |
| $100,000 to $149,999 | 407 (23.3%) | 745 (18.7%) |
| $150,000 or more | 200 (11.4%) | 1,400 (35.1%) |
| Total | 1,748 (100.0%) | 3,983 (100.0%) |
Property Value to Household Income Ratio in Bryant
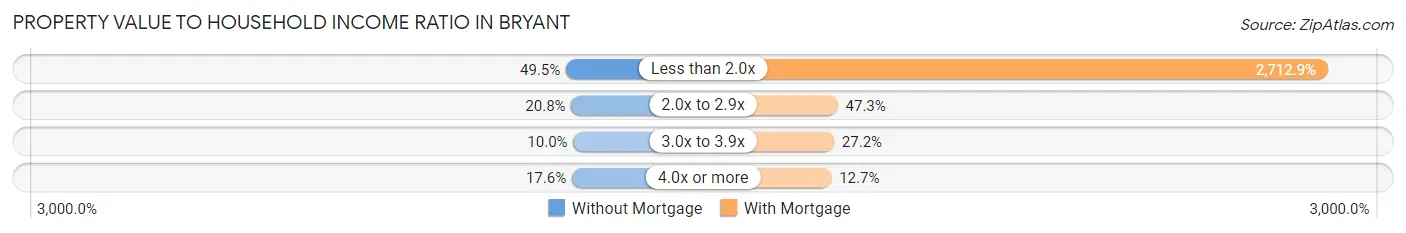
| Value-to-Income Ratio | Without Mortgage | With Mortgage |
| Less than 2.0x | 865 (49.5%) | 108,055 (2,712.9%) |
| 2.0x to 2.9x | 363 (20.8%) | 1,883 (47.3%) |
| 3.0x to 3.9x | 174 (10.0%) | 1,084 (27.2%) |
| 4.0x or more | 308 (17.6%) | 505 (12.7%) |
| Total | 1,748 (100.0%) | 3,983 (100.0%) |
Real Estate Taxes by Mortgage Status in Bryant
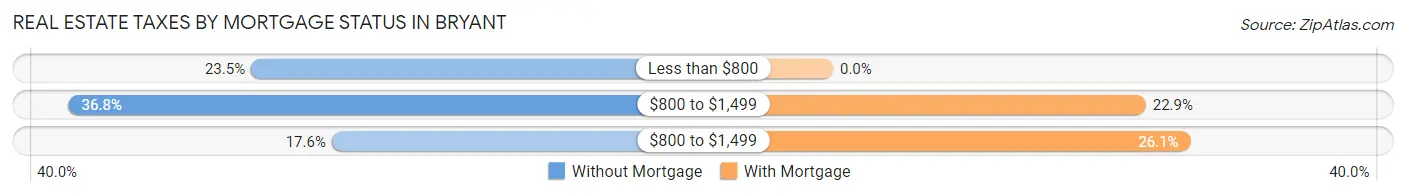
| Property Taxes | Without Mortgage | With Mortgage |
| Less than $800 | 410 (23.5%) | 0 (0.0%) |
| $800 to $1,499 | 643 (36.8%) | 910 (22.9%) |
| $800 to $1,499 | 307 (17.6%) | 1,040 (26.1%) |
| Total | 1,748 (100.0%) | 3,983 (100.0%) |
Health & Disability in Bryant
Health Insurance Coverage by Age in Bryant
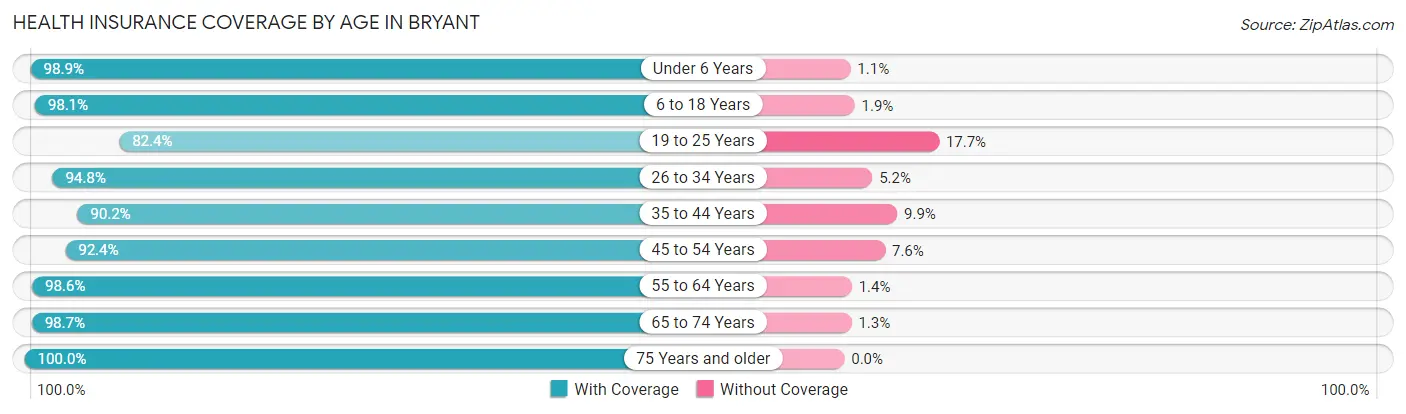
| Age Bracket | With Coverage | Without Coverage |
| Under 6 Years | 1,733 (98.9%) | 20 (1.1%) |
| 6 to 18 Years | 3,888 (98.1%) | 76 (1.9%) |
| 19 to 25 Years | 877 (82.4%) | 188 (17.6%) |
| 26 to 34 Years | 2,512 (94.8%) | 138 (5.2%) |
| 35 to 44 Years | 3,031 (90.1%) | 331 (9.9%) |
| 45 to 54 Years | 2,017 (92.4%) | 166 (7.6%) |
| 55 to 64 Years | 2,762 (98.6%) | 39 (1.4%) |
| 65 to 74 Years | 1,625 (98.7%) | 22 (1.3%) |
| 75 Years and older | 1,163 (100.0%) | 0 (0.0%) |
| Total | 19,608 (95.2%) | 980 (4.8%) |
Health Insurance Coverage by Citizenship Status in Bryant
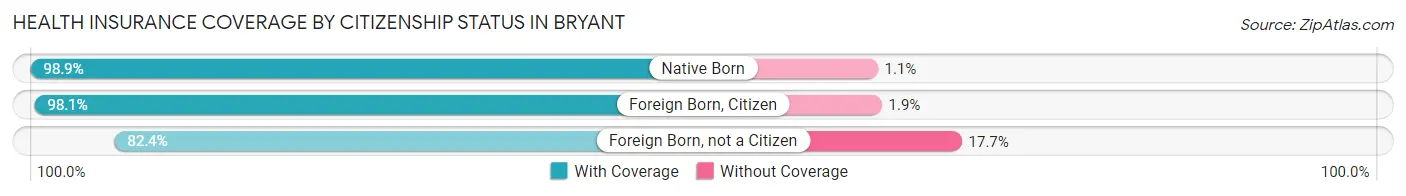
| Citizenship Status | With Coverage | Without Coverage |
| Native Born | 1,733 (98.9%) | 20 (1.1%) |
| Foreign Born, Citizen | 3,888 (98.1%) | 76 (1.9%) |
| Foreign Born, not a Citizen | 877 (82.4%) | 188 (17.6%) |
Health Insurance Coverage by Household Income in Bryant
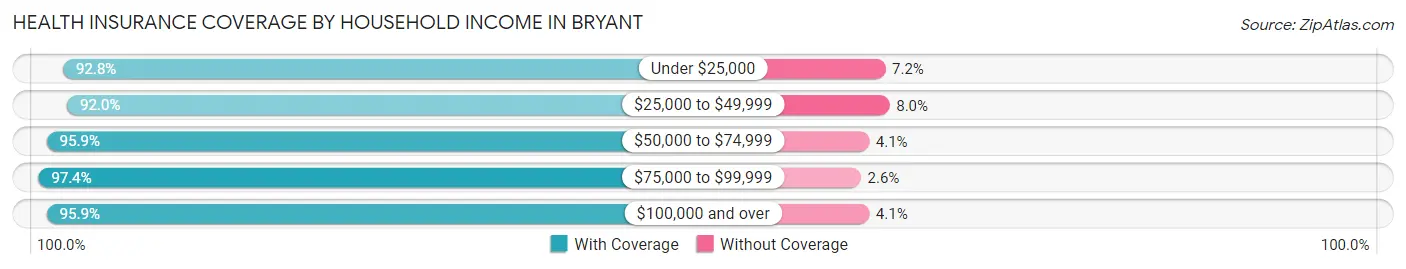
| Household Income | With Coverage | Without Coverage |
| Under $25,000 | 1,460 (92.8%) | 113 (7.2%) |
| $25,000 to $49,999 | 3,086 (92.0%) | 267 (8.0%) |
| $50,000 to $74,999 | 3,230 (95.9%) | 139 (4.1%) |
| $75,000 to $99,999 | 2,968 (97.4%) | 79 (2.6%) |
| $100,000 and over | 8,845 (95.9%) | 382 (4.1%) |
Public vs Private Health Insurance Coverage by Age in Bryant
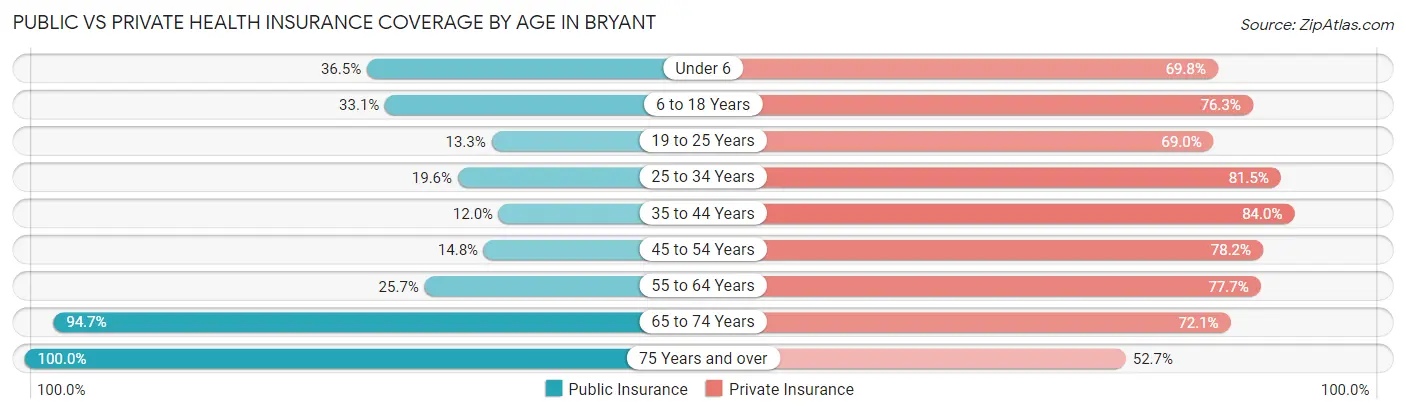
| Age Bracket | Public Insurance | Private Insurance |
| Under 6 | 639 (36.4%) | 1,223 (69.8%) |
| 6 to 18 Years | 1,311 (33.1%) | 3,023 (76.3%) |
| 19 to 25 Years | 142 (13.3%) | 735 (69.0%) |
| 25 to 34 Years | 519 (19.6%) | 2,159 (81.5%) |
| 35 to 44 Years | 402 (12.0%) | 2,823 (84.0%) |
| 45 to 54 Years | 322 (14.7%) | 1,706 (78.1%) |
| 55 to 64 Years | 721 (25.7%) | 2,177 (77.7%) |
| 65 to 74 Years | 1,559 (94.7%) | 1,188 (72.1%) |
| 75 Years and over | 1,163 (100.0%) | 613 (52.7%) |
| Total | 6,778 (32.9%) | 15,647 (76.0%) |
Disability Status by Sex by Age in Bryant
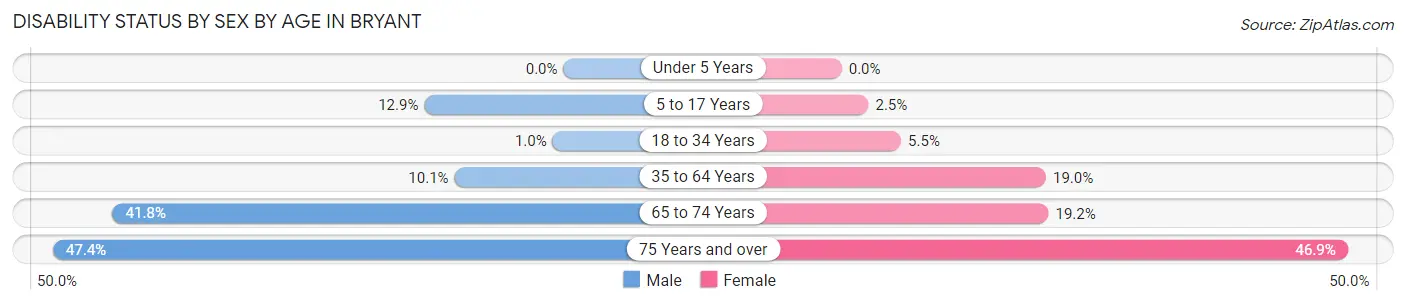
| Age Bracket | Male | Female |
| Under 5 Years | 0 (0.0%) | 0 (0.0%) |
| 5 to 17 Years | 246 (12.9%) | 55 (2.5%) |
| 18 to 34 Years | 16 (1.0%) | 125 (5.5%) |
| 35 to 64 Years | 402 (10.1%) | 828 (19.0%) |
| 65 to 74 Years | 338 (41.8%) | 161 (19.2%) |
| 75 Years and over | 234 (47.4%) | 314 (46.9%) |
Disability Class by Sex by Age in Bryant
Disability Class: Hearing Difficulty
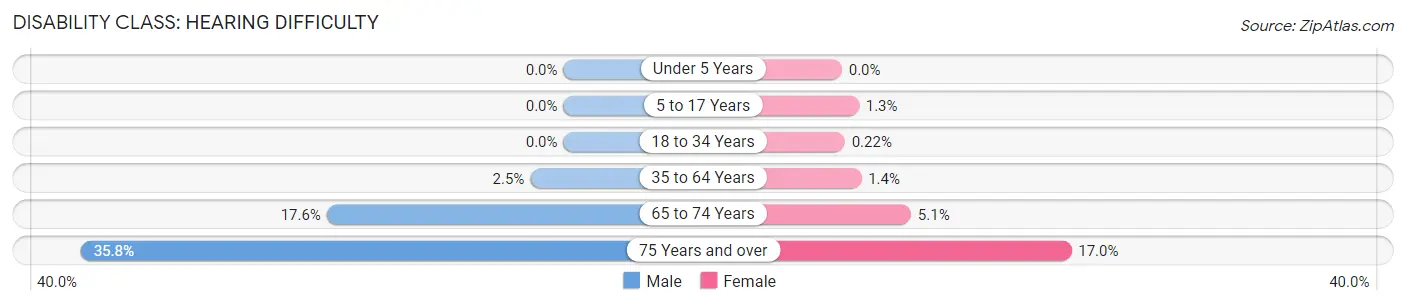
| Age Bracket | Male | Female |
| Under 5 Years | 0 (0.0%) | 0 (0.0%) |
| 5 to 17 Years | 0 (0.0%) | 28 (1.3%) |
| 18 to 34 Years | 0 (0.0%) | 5 (0.2%) |
| 35 to 64 Years | 98 (2.5%) | 63 (1.4%) |
| 65 to 74 Years | 142 (17.6%) | 43 (5.1%) |
| 75 Years and over | 177 (35.8%) | 114 (17.0%) |
Disability Class: Vision Difficulty
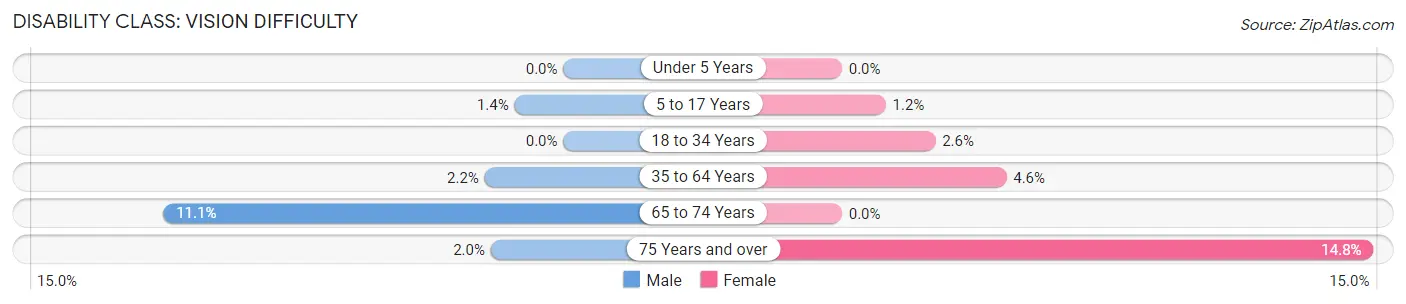
| Age Bracket | Male | Female |
| Under 5 Years | 0 (0.0%) | 0 (0.0%) |
| 5 to 17 Years | 26 (1.4%) | 27 (1.2%) |
| 18 to 34 Years | 0 (0.0%) | 59 (2.6%) |
| 35 to 64 Years | 87 (2.2%) | 200 (4.6%) |
| 65 to 74 Years | 90 (11.1%) | 0 (0.0%) |
| 75 Years and over | 10 (2.0%) | 99 (14.8%) |
Disability Class: Cognitive Difficulty
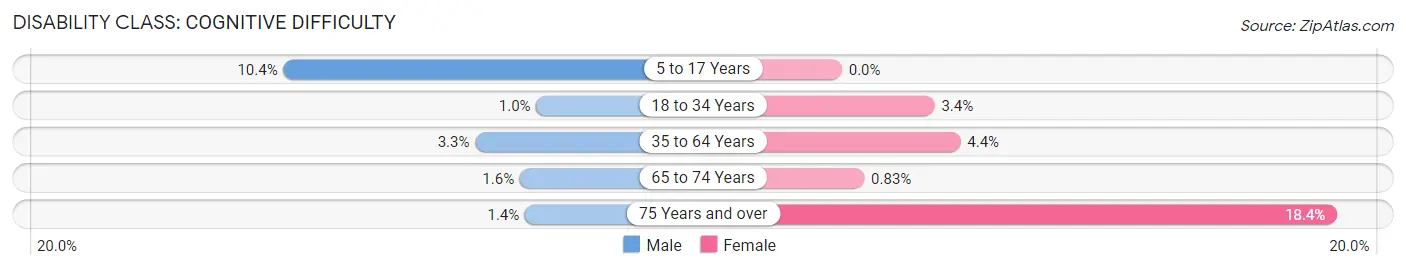
| Age Bracket | Male | Female |
| 5 to 17 Years | 198 (10.4%) | 0 (0.0%) |
| 18 to 34 Years | 16 (1.0%) | 78 (3.4%) |
| 35 to 64 Years | 130 (3.3%) | 192 (4.4%) |
| 65 to 74 Years | 13 (1.6%) | 7 (0.8%) |
| 75 Years and over | 7 (1.4%) | 123 (18.4%) |
Disability Class: Ambulatory Difficulty
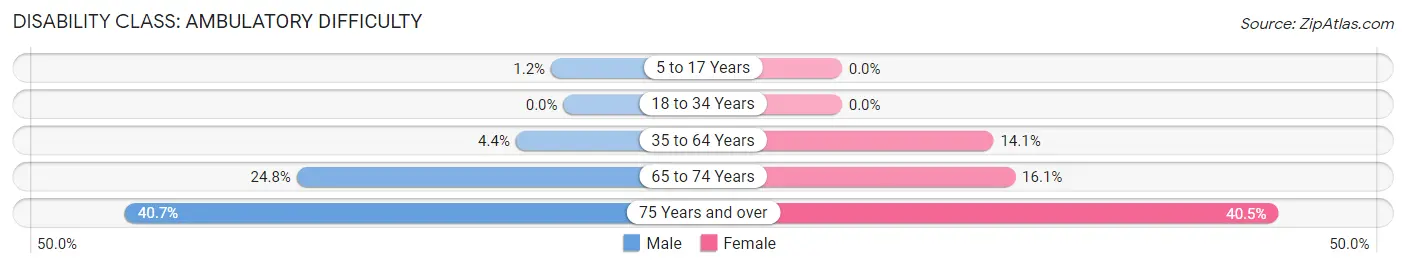
| Age Bracket | Male | Female |
| 5 to 17 Years | 22 (1.1%) | 0 (0.0%) |
| 18 to 34 Years | 0 (0.0%) | 0 (0.0%) |
| 35 to 64 Years | 176 (4.4%) | 615 (14.1%) |
| 65 to 74 Years | 200 (24.7%) | 135 (16.1%) |
| 75 Years and over | 201 (40.7%) | 271 (40.5%) |
Disability Class: Self-Care Difficulty
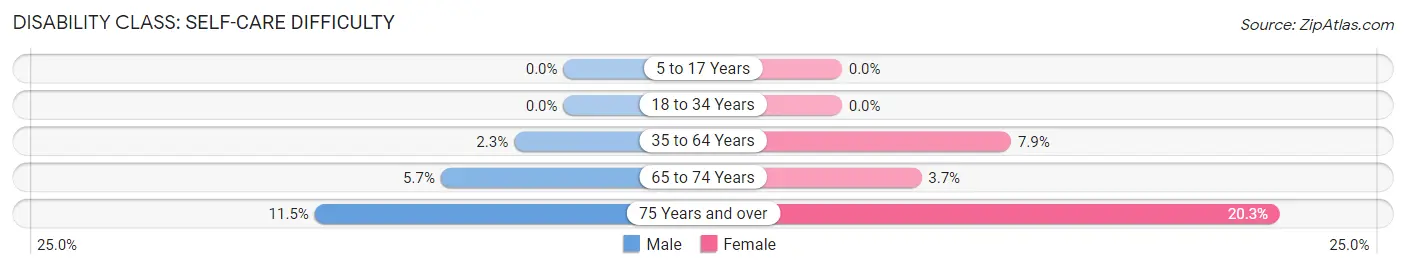
| Age Bracket | Male | Female |
| 5 to 17 Years | 0 (0.0%) | 0 (0.0%) |
| 18 to 34 Years | 0 (0.0%) | 0 (0.0%) |
| 35 to 64 Years | 91 (2.3%) | 343 (7.9%) |
| 65 to 74 Years | 46 (5.7%) | 31 (3.7%) |
| 75 Years and over | 57 (11.5%) | 136 (20.3%) |
Technology Access in Bryant
Computing Device Access in Bryant
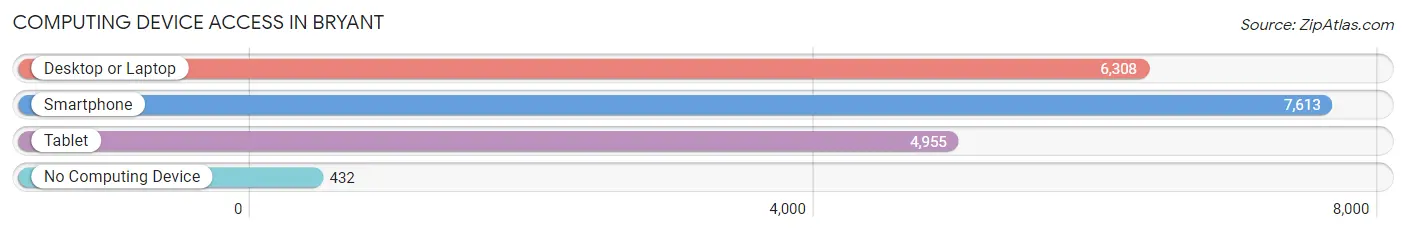
| Device Type | # Households | % Households |
| Desktop or Laptop | 6,308 | 76.5% |
| Smartphone | 7,613 | 92.3% |
| Tablet | 4,955 | 60.1% |
| No Computing Device | 432 | 5.2% |
| Total | 8,247 | 100.0% |
Internet Access in Bryant
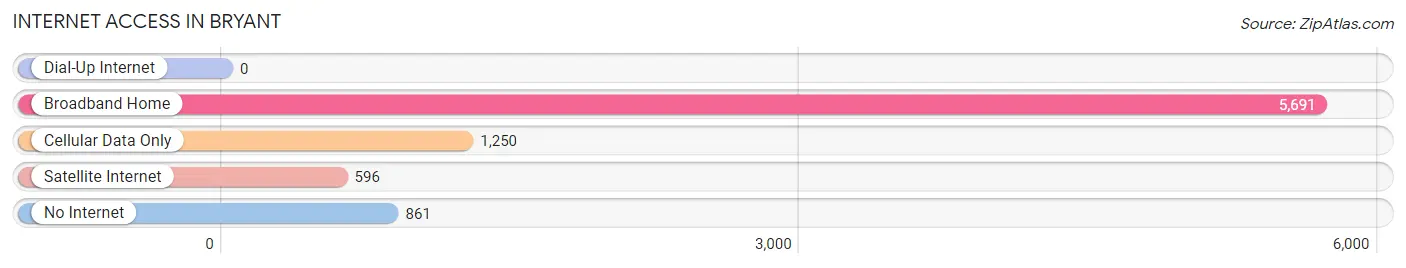
| Internet Type | # Households | % Households |
| Dial-Up Internet | 0 | 0.0% |
| Broadband Home | 5,691 | 69.0% |
| Cellular Data Only | 1,250 | 15.2% |
| Satellite Internet | 596 | 7.2% |
| No Internet | 861 | 10.4% |
| Total | 8,247 | 100.0% |
Bryant Summary
Bryant, Arkansas is a city located in Saline County, Arkansas. It is part of the Little Rock-North Little Rock-Conway Metropolitan Statistical Area. The city was founded in 1873 and has a population of approximately 23,000 people.
Geography
Bryant is located in the Central Arkansas region of the state. It is situated in the Arkansas River Valley, which is part of the larger Mississippi River Valley. The city is located at the intersection of Interstate 30 and Interstate 430, which makes it a convenient location for commuters. The city is also located near the Little Rock Air Force Base, which is a major employer in the area.
The city has a total area of 16.2 square miles, of which 16.1 square miles is land and 0.1 square miles is water. The city is located at an elevation of 441 feet above sea level. The climate in Bryant is humid subtropical, with hot, humid summers and mild winters.
Economy
Bryant has a diverse economy, with a variety of industries represented. The city is home to several large employers, including the Little Rock Air Force Base, the Arkansas Department of Human Services, and the Arkansas Department of Education. The city also has a number of small businesses, including retail stores, restaurants, and professional services.
The city is also home to a number of manufacturing companies, including the Bryant Manufacturing Company, which produces a variety of products, including furniture, cabinets, and other wood products. The city is also home to the Bryant Electric Company, which produces electrical components and supplies.
Demographics
As of the 2010 census, the population of Bryant was 23,448. The racial makeup of the city was 79.3% White, 15.2% African American, 0.4% Native American, 1.2% Asian, 0.1% Pacific Islander, 1.7% from other races, and 2.1% from two or more races. Hispanic or Latino of any race were 4.2% of the population.
The median income for a household in the city was $50,945, and the median income for a family was $60,945. The per capita income for the city was $24,945. About 8.3% of families and 10.2% of the population were below the poverty line, including 14.2% of those under age 18 and 8.2% of those age 65 or over.
Conclusion
Bryant, Arkansas is a city located in Saline County, Arkansas. It is part of the Little Rock-North Little Rock-Conway Metropolitan Statistical Area. The city was founded in 1873 and has a population of approximately 23,000 people. The city has a diverse economy, with a variety of industries represented. The city is also home to a number of manufacturing companies, including the Bryant Manufacturing Company and the Bryant Electric Company. As of the 2010 census, the population of Bryant was 23,448. The median income for a household in the city was $50,945, and the median income for a family was $60,945. The city is a great place to live and work, with a variety of job opportunities and a strong economy.
Common Questions
What is Per Capita Income in Bryant?
Per Capita income in Bryant is $38,967.
What is the Median Family Income in Bryant?
Median Family Income in Bryant is $96,221.
What is the Median Household income in Bryant?
Median Household Income in Bryant is $76,282.
What is Income or Wage Gap in Bryant?
Income or Wage Gap in Bryant is 23.6%.
Women in Bryant earn 76.4 cents for every dollar earned by a man.
What is Inequality or Gini Index in Bryant?
Inequality or Gini Index in Bryant is 0.40.
What is the Total Population of Bryant?
Total Population of Bryant is 20,750.
What is the Total Male Population of Bryant?
Total Male Population of Bryant is 9,490.
What is the Total Female Population of Bryant?
Total Female Population of Bryant is 11,260.
What is the Ratio of Males per 100 Females in Bryant?
There are 84.28 Males per 100 Females in Bryant.
What is the Ratio of Females per 100 Males in Bryant?
There are 118.65 Females per 100 Males in Bryant.
What is the Median Population Age in Bryant?
Median Population Age in Bryant is 36.7 Years.
What is the Average Family Size in Bryant
Average Family Size in Bryant is 3.0 People.
What is the Average Household Size in Bryant
Average Household Size in Bryant is 2.5 People.
How Large is the Labor Force in Bryant?
There are 11,097 People in the Labor Forcein in Bryant.
What is the Percentage of People in the Labor Force in Bryant?
69.6% of People are in the Labor Force in Bryant.
What is the Unemployment Rate in Bryant?
Unemployment Rate in Bryant is 3.6%.