Saline County, AR Map & Demographics
Saline County Map
Saline County Overview
$36,151
PER CAPITA INCOME
$89,404
AVG FAMILY INCOME
$73,236
AVG HOUSEHOLD INCOME
22.2%
WAGE / INCOME GAP [ % ]
77.8¢/ $1
WAGE / INCOME GAP [ $ ]
$11,026
FAMILY INCOME DEFICIT
0.41
INEQUALITY / GINI INDEX
123,988
TOTAL POPULATION
60,702
MALE POPULATION
63,286
FEMALE POPULATION
95.92
MALES / 100 FEMALES
104.26
FEMALES / 100 MALES
40.3
MEDIAN AGE
3.0
AVG FAMILY SIZE
2.5
AVG HOUSEHOLD SIZE
61,690
LABOR FORCE [ PEOPLE ]
62.5%
PERCENT IN LABOR FORCE
3.8%
UNEMPLOYMENT RATE
Saline County Area Codes
Income in Saline County
Income Overview in Saline County
Per Capita Income in Saline County is $36,151, while median incomes of families and households are $89,404 and $73,236 respectively.
| Characteristic | Number | Measure |
| Per Capita Income | 123,988 | $36,151 |
| Median Family Income | 34,575 | $89,404 |
| Mean Family Income | 34,575 | $103,100 |
| Median Household Income | 48,465 | $73,236 |
| Mean Household Income | 48,465 | $89,502 |
| Income Deficit | 34,575 | $11,026 |
| Wage / Income Gap (%) | 123,988 | 22.20% |
| Wage / Income Gap ($) | 123,988 | 77.80¢ per $1 |
| Gini / Inequality Index | 123,988 | 0.41 |
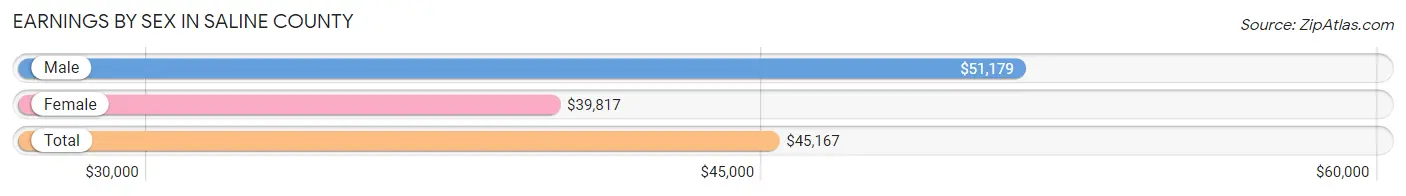
Earnings by Sex in Saline County
Average Earnings in Saline County are $45,167, $51,179 for men and $39,817 for women, a difference of 22.2%.
| Sex | Number | Average Earnings |
| Male | 32,877 (52.2%) | $51,179 |
| Female | 30,125 (47.8%) | $39,817 |
| Total | 63,002 (100.0%) | $45,167 |
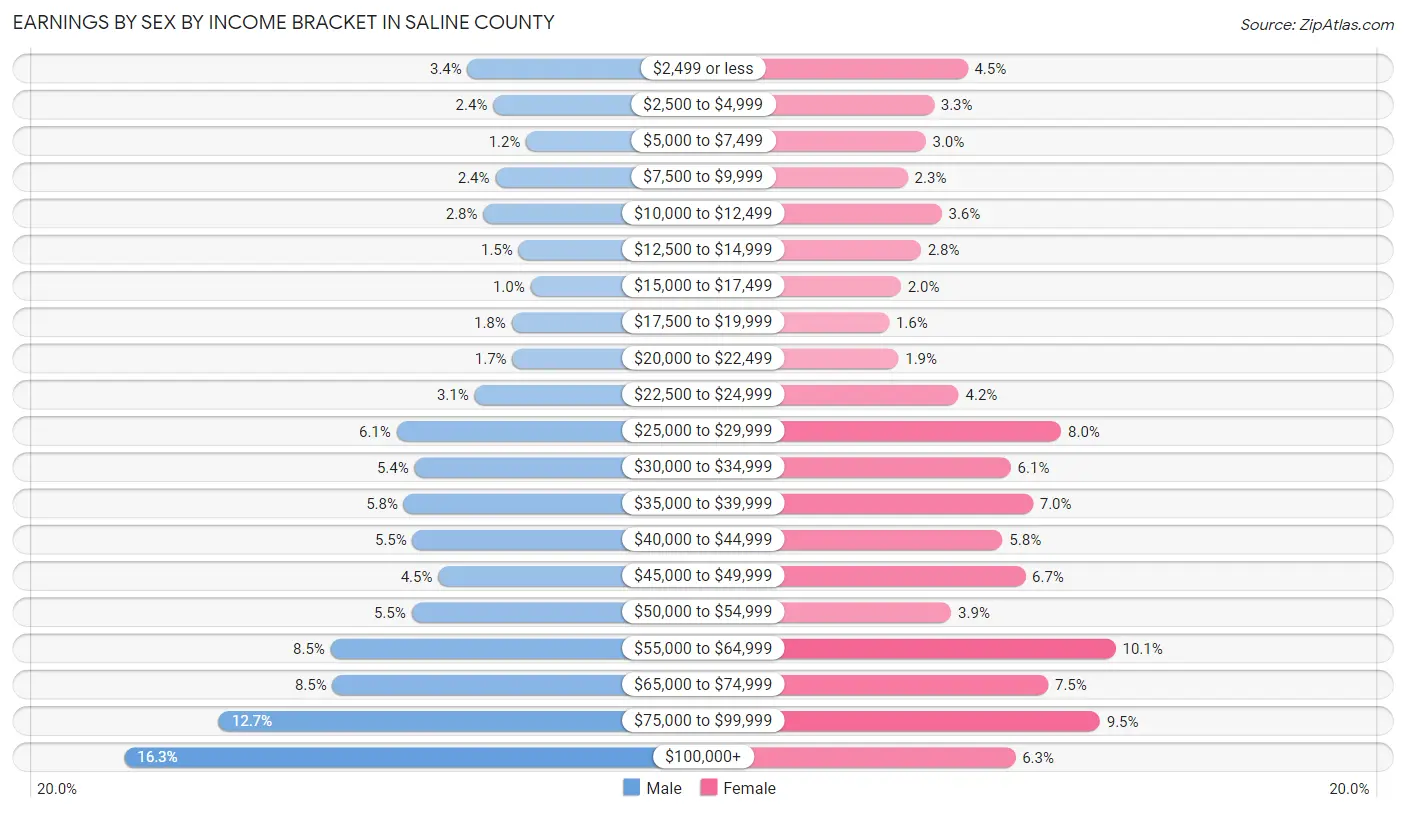
Earnings by Sex by Income Bracket in Saline County
The most common earnings brackets in Saline County are $100,000+ for men (5,346 | 16.3%) and $55,000 to $64,999 for women (3,035 | 10.1%).
| Income | Male | Female |
| $2,499 or less | 1,117 (3.4%) | 1,363 (4.5%) |
| $2,500 to $4,999 | 803 (2.4%) | 981 (3.3%) |
| $5,000 to $7,499 | 394 (1.2%) | 890 (2.9%) |
| $7,500 to $9,999 | 776 (2.4%) | 686 (2.3%) |
| $10,000 to $12,499 | 924 (2.8%) | 1,069 (3.5%) |
| $12,500 to $14,999 | 489 (1.5%) | 835 (2.8%) |
| $15,000 to $17,499 | 341 (1.0%) | 608 (2.0%) |
| $17,500 to $19,999 | 574 (1.8%) | 477 (1.6%) |
| $20,000 to $22,499 | 566 (1.7%) | 581 (1.9%) |
| $22,500 to $24,999 | 1,032 (3.1%) | 1,262 (4.2%) |
| $25,000 to $29,999 | 1,991 (6.1%) | 2,419 (8.0%) |
| $30,000 to $34,999 | 1,771 (5.4%) | 1,850 (6.1%) |
| $35,000 to $39,999 | 1,904 (5.8%) | 2,100 (7.0%) |
| $40,000 to $44,999 | 1,794 (5.5%) | 1,756 (5.8%) |
| $45,000 to $49,999 | 1,478 (4.5%) | 2,011 (6.7%) |
| $50,000 to $54,999 | 1,808 (5.5%) | 1,177 (3.9%) |
| $55,000 to $64,999 | 2,806 (8.5%) | 3,035 (10.1%) |
| $65,000 to $74,999 | 2,780 (8.5%) | 2,270 (7.5%) |
| $75,000 to $99,999 | 4,183 (12.7%) | 2,855 (9.5%) |
| $100,000+ | 5,346 (16.3%) | 1,900 (6.3%) |
| Total | 32,877 (100.0%) | 30,125 (100.0%) |
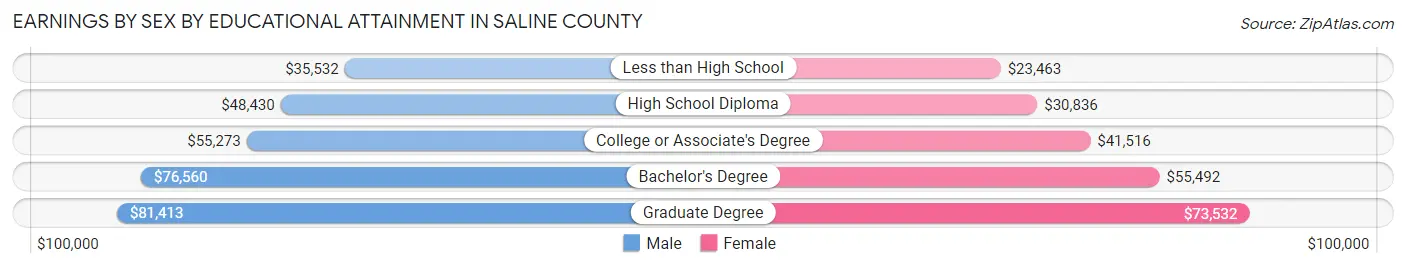
Earnings by Sex by Educational Attainment in Saline County
Average earnings in Saline County are $56,412 for men and $45,175 for women, a difference of 19.9%. Men with an educational attainment of graduate degree enjoy the highest average annual earnings of $81,413, while those with less than high school education earn the least with $35,532. Women with an educational attainment of graduate degree earn the most with the average annual earnings of $73,532, while those with less than high school education have the smallest earnings of $23,463.
| Educational Attainment | Male Income | Female Income |
| Less than High School | $35,532 | $23,463 |
| High School Diploma | $48,430 | $30,836 |
| College or Associate's Degree | $55,273 | $41,516 |
| Bachelor's Degree | $76,560 | $55,492 |
| Graduate Degree | $81,413 | $73,532 |
| Total | $56,412 | $45,175 |
Family Income in Saline County
Family Income Brackets in Saline County
According to the Saline County family income data, there are 8,678 families falling into the $100,000 to $149,999 income range, which is the most common income bracket and makes up 25.1% of all families. Conversely, the $10,000 to $14,999 income bracket is the least frequent group with only 415 families (1.2%) belonging to this category.
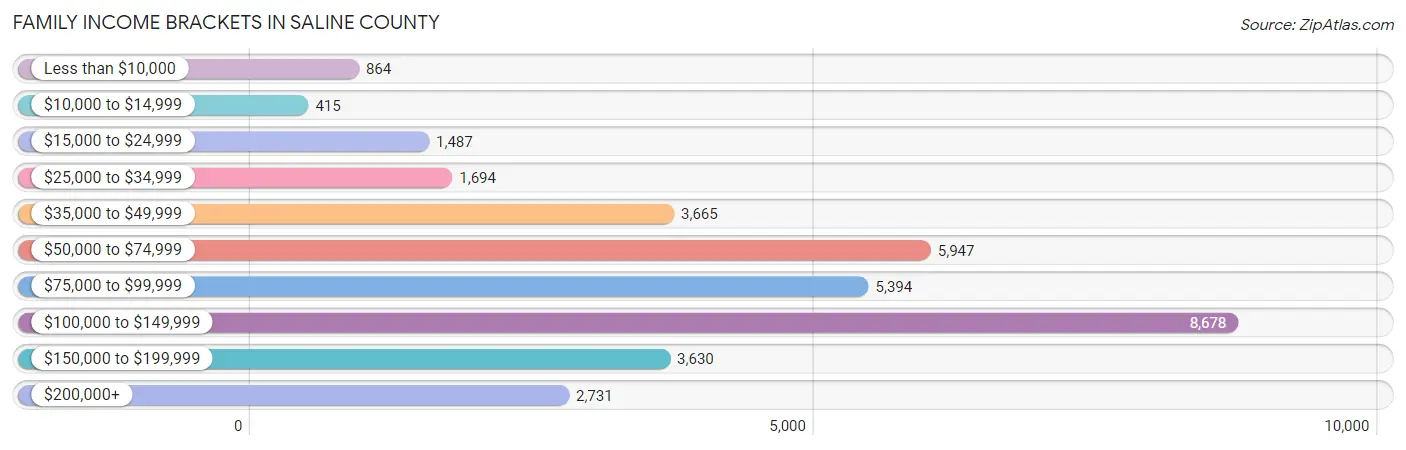
| Income Bracket | # Families | % Families |
| Less than $10,000 | 864 | 2.5% |
| $10,000 to $14,999 | 415 | 1.2% |
| $15,000 to $24,999 | 1,487 | 4.3% |
| $25,000 to $34,999 | 1,694 | 4.9% |
| $35,000 to $49,999 | 3,665 | 10.6% |
| $50,000 to $74,999 | 5,947 | 17.2% |
| $75,000 to $99,999 | 5,394 | 15.6% |
| $100,000 to $149,999 | 8,678 | 25.1% |
| $150,000 to $199,999 | 3,630 | 10.5% |
| $200,000+ | 2,731 | 7.9% |
Family Income by Famaliy Size in Saline County
4-person families (5,588 | 16.2%) account for the highest median family income in Saline County with $109,416 per family, while 2-person families (17,563 | 50.8%) have the highest median income of $39,739 per family member.
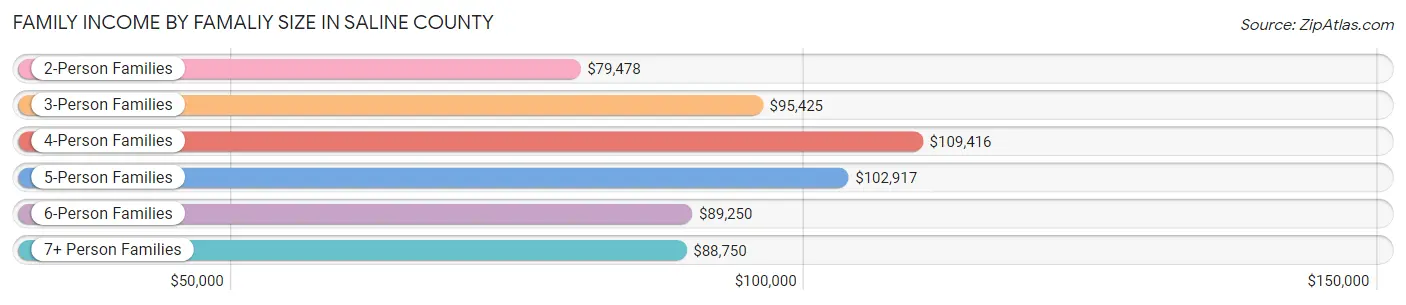
| Income Bracket | # Families | Median Income |
| 2-Person Families | 17,563 (50.8%) | $79,478 |
| 3-Person Families | 7,754 (22.4%) | $95,425 |
| 4-Person Families | 5,588 (16.2%) | $109,416 |
| 5-Person Families | 2,721 (7.9%) | $102,917 |
| 6-Person Families | 686 (2.0%) | $89,250 |
| 7+ Person Families | 263 (0.8%) | $88,750 |
| Total | 34,575 (100.0%) | $89,404 |
Family Income by Number of Earners in Saline County
The median family income in Saline County is $89,404, with families comprising 3+ earners (2,440) having the highest median family income of $128,603, while families with no earners (6,235) have the lowest median family income of $56,542, accounting for 7.1% and 18.0% of families, respectively.
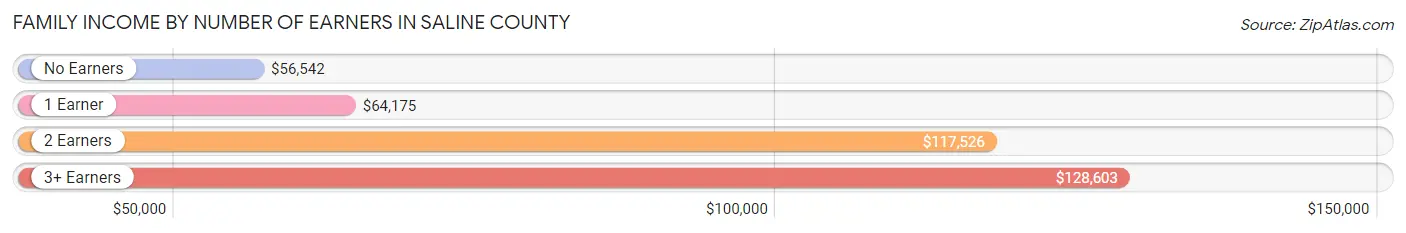
| Number of Earners | # Families | Median Income |
| No Earners | 6,235 (18.0%) | $56,542 |
| 1 Earner | 11,002 (31.8%) | $64,175 |
| 2 Earners | 14,898 (43.1%) | $117,526 |
| 3+ Earners | 2,440 (7.1%) | $128,603 |
| Total | 34,575 (100.0%) | $89,404 |
Household Income in Saline County
Household Income Brackets in Saline County
With 10,032 households falling in the category, the $100,000 to $149,999 income range is the most frequent in Saline County, accounting for 20.7% of all households. In contrast, only 1,357 households (2.8%) fall into the $10,000 to $14,999 income bracket, making it the least populous group.
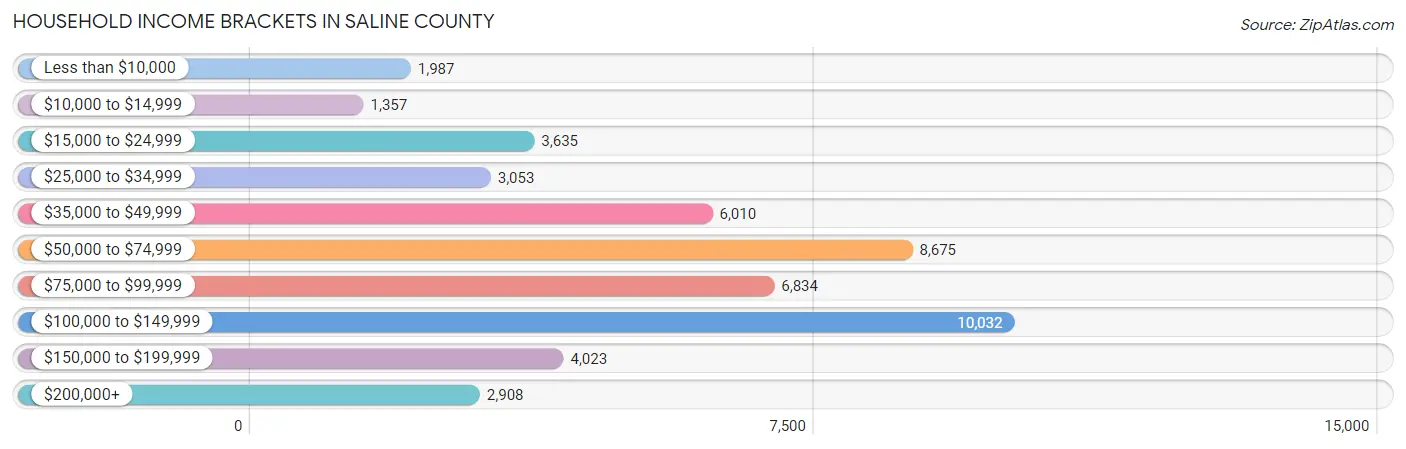
| Income Bracket | # Households | % Households |
| Less than $10,000 | 1,987 | 4.1% |
| $10,000 to $14,999 | 1,357 | 2.8% |
| $15,000 to $24,999 | 3,635 | 7.5% |
| $25,000 to $34,999 | 3,053 | 6.3% |
| $35,000 to $49,999 | 6,010 | 12.4% |
| $50,000 to $74,999 | 8,675 | 17.9% |
| $75,000 to $99,999 | 6,834 | 14.1% |
| $100,000 to $149,999 | 10,032 | 20.7% |
| $150,000 to $199,999 | 4,023 | 8.3% |
| $200,000+ | 2,908 | 6.0% |
Household Income by Householder Age in Saline County
The median household income in Saline County is $73,236, with the highest median household income of $84,597 found in the 25 to 44 years age bracket for the primary householder. A total of 16,070 households (33.2%) fall into this category. Meanwhile, the 15 to 24 years age bracket for the primary householder has the lowest median household income of $38,400, with 1,630 households (3.4%) in this group.
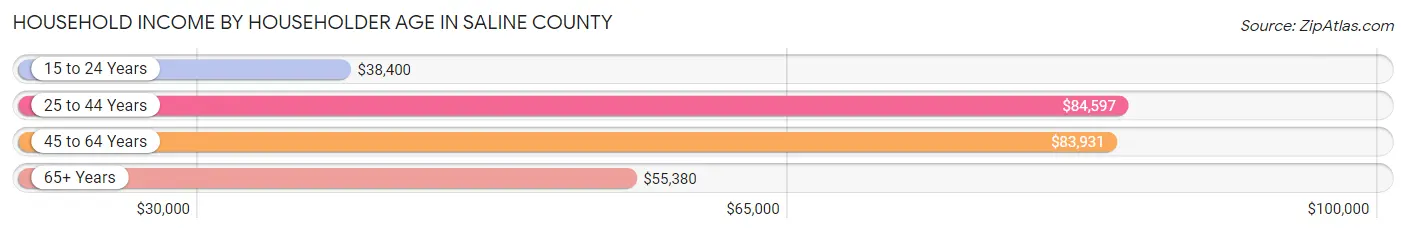
| Income Bracket | # Households | Median Income |
| 15 to 24 Years | 1,630 (3.4%) | $38,400 |
| 25 to 44 Years | 16,070 (33.2%) | $84,597 |
| 45 to 64 Years | 17,150 (35.4%) | $83,931 |
| 65+ Years | 13,615 (28.1%) | $55,380 |
| Total | 48,465 (100.0%) | $73,236 |
Poverty in Saline County
Income Below Poverty by Sex and Age in Saline County
With 8.7% poverty level for males and 10.3% for females among the residents of Saline County, under 5 year old males and 16 and 17 year old females are the most vulnerable to poverty, with 600 males (17.7%) and 271 females (16.4%) in their respective age groups living below the poverty level.
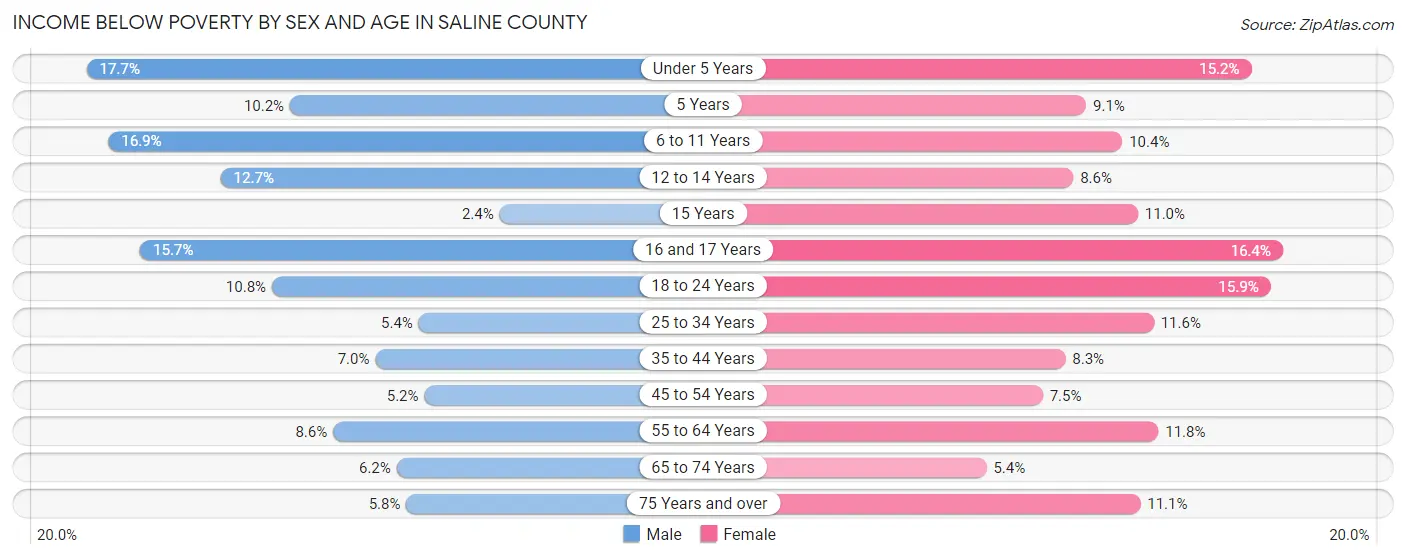
| Age Bracket | Male | Female |
| Under 5 Years | 600 (17.7%) | 523 (15.2%) |
| 5 Years | 81 (10.2%) | 69 (9.1%) |
| 6 to 11 Years | 826 (16.9%) | 442 (10.4%) |
| 12 to 14 Years | 322 (12.7%) | 241 (8.6%) |
| 15 Years | 22 (2.4%) | 111 (11.0%) |
| 16 and 17 Years | 247 (15.7%) | 271 (16.4%) |
| 18 to 24 Years | 500 (10.8%) | 735 (15.9%) |
| 25 to 34 Years | 393 (5.4%) | 925 (11.6%) |
| 35 to 44 Years | 571 (7.0%) | 712 (8.3%) |
| 45 to 54 Years | 401 (5.2%) | 572 (7.5%) |
| 55 to 64 Years | 650 (8.6%) | 912 (11.7%) |
| 65 to 74 Years | 371 (6.2%) | 371 (5.4%) |
| 75 Years and over | 240 (5.8%) | 580 (11.1%) |
| Total | 5,224 (8.7%) | 6,464 (10.3%) |
Income Above Poverty by Sex and Age in Saline County
According to the poverty statistics in Saline County, males aged 15 years and females aged 65 to 74 years are the age groups that are most secure financially, with 97.6% of males and 94.6% of females in these age groups living above the poverty line.
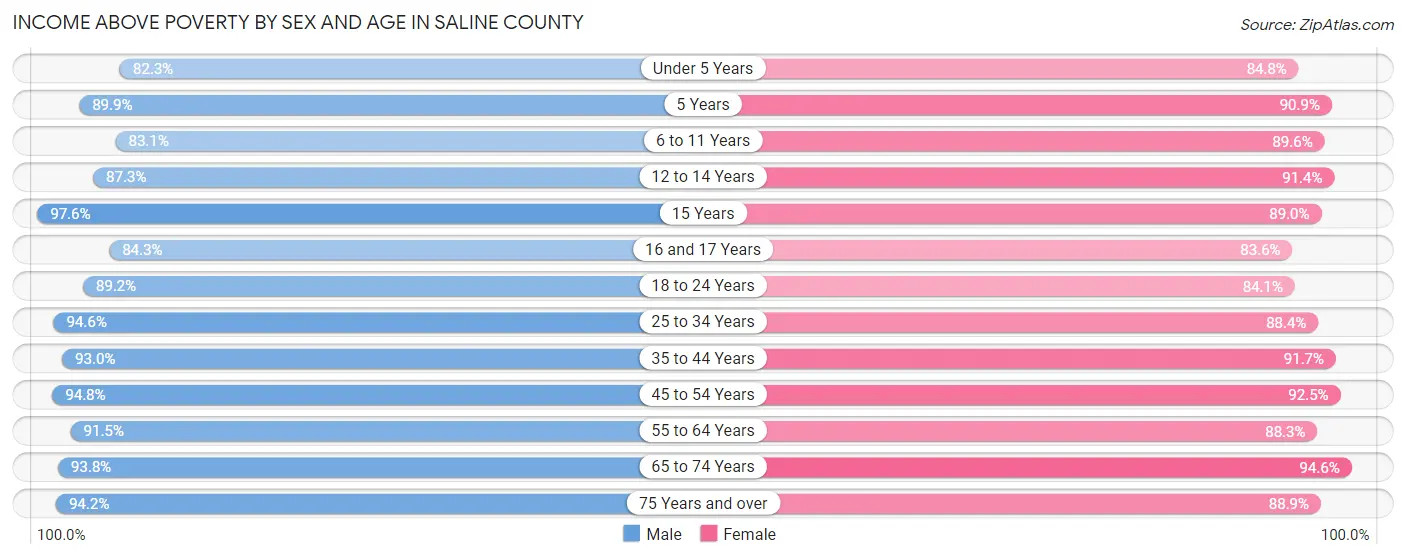
| Age Bracket | Male | Female |
| Under 5 Years | 2,790 (82.3%) | 2,917 (84.8%) |
| 5 Years | 717 (89.8%) | 692 (90.9%) |
| 6 to 11 Years | 4,064 (83.1%) | 3,804 (89.6%) |
| 12 to 14 Years | 2,209 (87.3%) | 2,565 (91.4%) |
| 15 Years | 908 (97.6%) | 899 (89.0%) |
| 16 and 17 Years | 1,325 (84.3%) | 1,384 (83.6%) |
| 18 to 24 Years | 4,119 (89.2%) | 3,881 (84.1%) |
| 25 to 34 Years | 6,930 (94.6%) | 7,063 (88.4%) |
| 35 to 44 Years | 7,606 (93.0%) | 7,868 (91.7%) |
| 45 to 54 Years | 7,377 (94.8%) | 7,097 (92.5%) |
| 55 to 64 Years | 6,948 (91.4%) | 6,851 (88.2%) |
| 65 to 74 Years | 5,622 (93.8%) | 6,536 (94.6%) |
| 75 Years and over | 3,879 (94.2%) | 4,653 (88.9%) |
| Total | 54,494 (91.2%) | 56,210 (89.7%) |
Income Below Poverty Among Married-Couple Families in Saline County
The poverty statistics for married-couple families in Saline County show that 4.0% or 1,101 of the total 27,261 families live below the poverty line. Families with 3 or 4 children have the highest poverty rate of 10.4%, comprising of 236 families. On the other hand, families with no children have the lowest poverty rate of 3.4%, which includes 540 families.
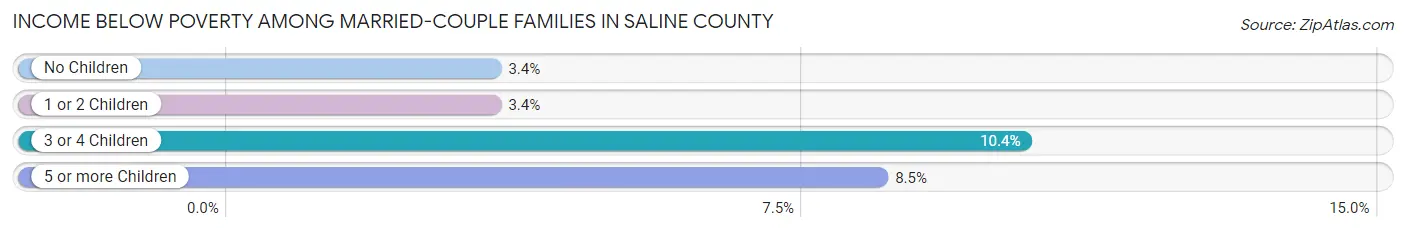
| Children | Above Poverty | Below Poverty |
| No Children | 15,146 (96.6%) | 540 (3.4%) |
| 1 or 2 Children | 8,878 (96.6%) | 316 (3.4%) |
| 3 or 4 Children | 2,039 (89.6%) | 236 (10.4%) |
| 5 or more Children | 97 (91.5%) | 9 (8.5%) |
| Total | 26,160 (96.0%) | 1,101 (4.0%) |
Income Below Poverty Among Single-Parent Households in Saline County
According to the poverty data in Saline County, 19.1% or 366 single-father households and 16.6% or 898 single-mother households are living below the poverty line. Among single-father households, those with 5 or more children have the highest poverty rate, with 56 households (100.0%) experiencing poverty. Likewise, among single-mother households, those with 5 or more children have the highest poverty rate, with 11 households (68.8%) falling below the poverty line.
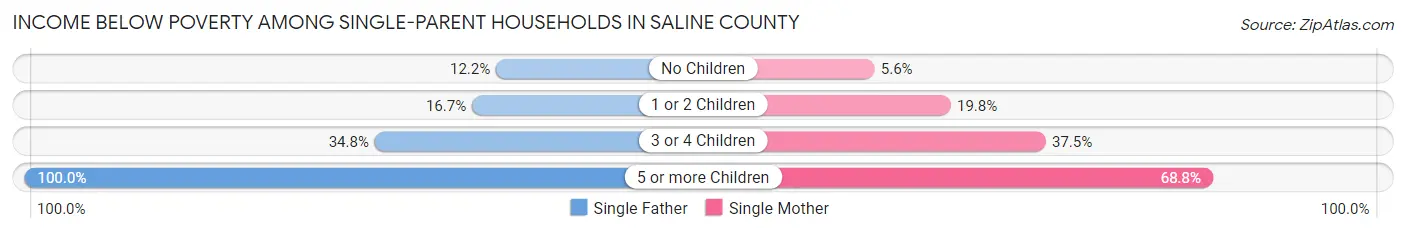
| Children | Single Father | Single Mother |
| No Children | 89 (12.2%) | 97 (5.6%) |
| 1 or 2 Children | 157 (16.7%) | 652 (19.8%) |
| 3 or 4 Children | 64 (34.8%) | 138 (37.5%) |
| 5 or more Children | 56 (100.0%) | 11 (68.8%) |
| Total | 366 (19.1%) | 898 (16.6%) |
Income Below Poverty Among Married-Couple vs Single-Parent Households in Saline County
The poverty data for Saline County shows that 1,101 of the married-couple family households (4.0%) and 1,264 of the single-parent households (17.3%) are living below the poverty level. Within the married-couple family households, those with 3 or 4 children have the highest poverty rate, with 236 households (10.4%) falling below the poverty line. Among the single-parent households, those with 5 or more children have the highest poverty rate, with 67 household (93.1%) living below poverty.
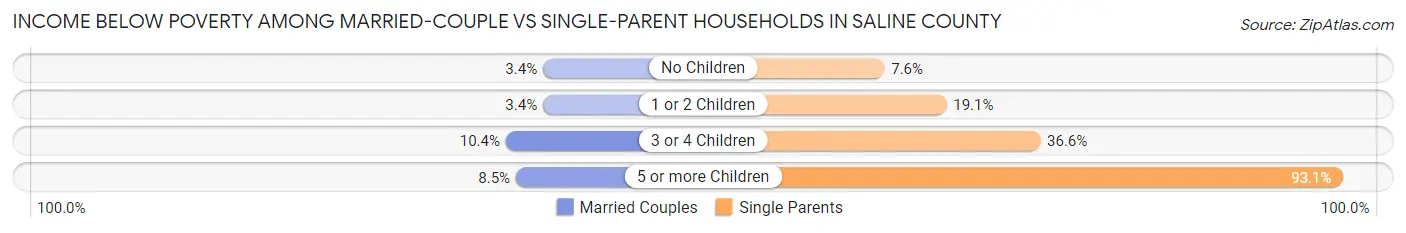
| Children | Married-Couple Families | Single-Parent Households |
| No Children | 540 (3.4%) | 186 (7.6%) |
| 1 or 2 Children | 316 (3.4%) | 809 (19.1%) |
| 3 or 4 Children | 236 (10.4%) | 202 (36.6%) |
| 5 or more Children | 9 (8.5%) | 67 (93.1%) |
| Total | 1,101 (4.0%) | 1,264 (17.3%) |
Race in Saline County
The most populous races in Saline County are White / Caucasian (104,854 | 84.6%), Black / African American (10,443 | 8.4%), and Hispanic or Latino (6,733 | 5.4%).
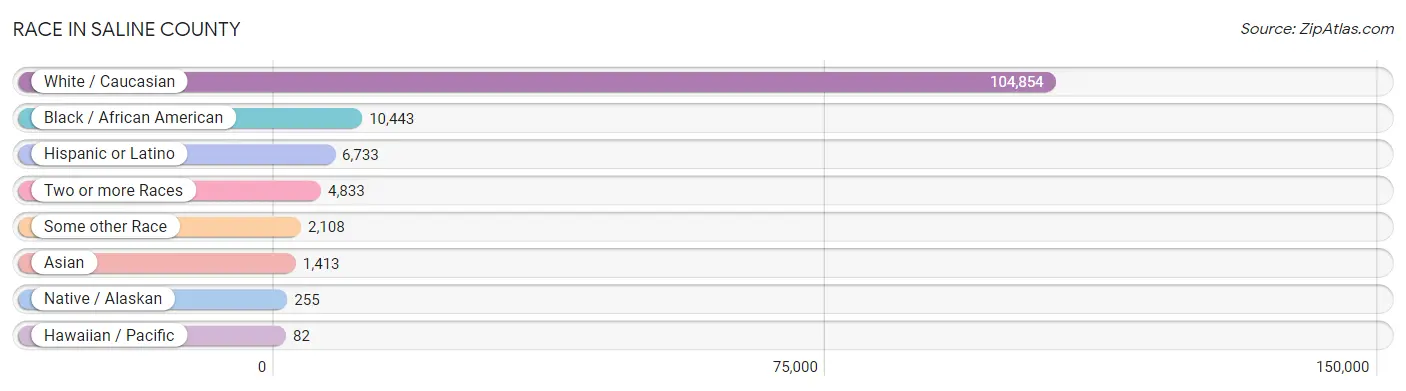
| Race | # Population | % Population |
| Asian | 1,413 | 1.1% |
| Black / African American | 10,443 | 8.4% |
| Hawaiian / Pacific | 82 | 0.1% |
| Hispanic or Latino | 6,733 | 5.4% |
| Native / Alaskan | 255 | 0.2% |
| White / Caucasian | 104,854 | 84.6% |
| Two or more Races | 4,833 | 3.9% |
| Some other Race | 2,108 | 1.7% |
| Total | 123,988 | 100.0% |
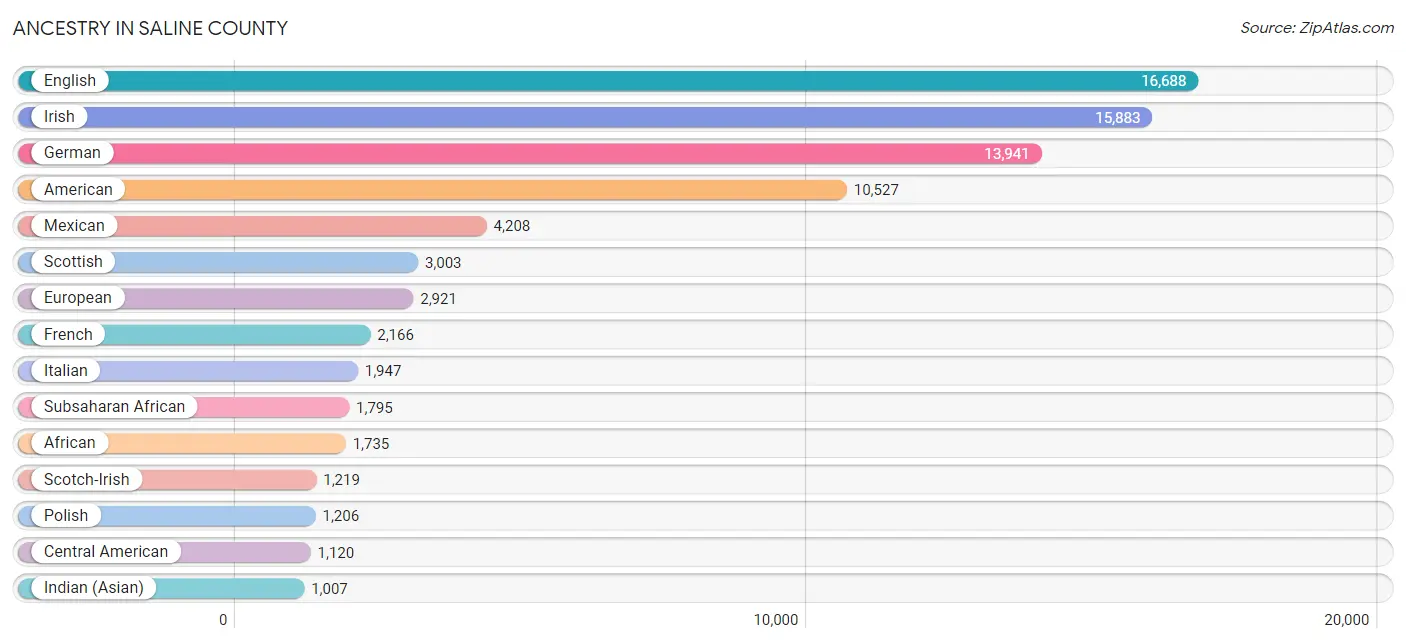
Ancestry in Saline County
The most populous ancestries reported in Saline County are English (16,688 | 13.5%), Irish (15,883 | 12.8%), German (13,941 | 11.2%), American (10,527 | 8.5%), and Mexican (4,208 | 3.4%), together accounting for 49.4% of all Saline County residents.
| Ancestry | # Population | % Population |
| African | 1,735 | 1.4% |
| Albanian | 38 | 0.0% |
| American | 10,527 | 8.5% |
| Apache | 13 | 0.0% |
| Arab | 146 | 0.1% |
| Armenian | 53 | 0.0% |
| Assyrian / Chaldean / Syriac | 12 | 0.0% |
| Australian | 8 | 0.0% |
| Austrian | 105 | 0.1% |
| Belgian | 57 | 0.1% |
| Bhutanese | 20 | 0.0% |
| Blackfeet | 10 | 0.0% |
| British | 831 | 0.7% |
| Burmese | 297 | 0.2% |
| Cajun | 85 | 0.1% |
| Canadian | 60 | 0.1% |
| Celtic | 30 | 0.0% |
| Central American | 1,120 | 0.9% |
| Central American Indian | 24 | 0.0% |
| Cherokee | 771 | 0.6% |
| Chickasaw | 8 | 0.0% |
| Chippewa | 23 | 0.0% |
| Choctaw | 79 | 0.1% |
| Comanche | 6 | 0.0% |
| Costa Rican | 108 | 0.1% |
| Creek | 12 | 0.0% |
| Croatian | 42 | 0.0% |
| Cuban | 55 | 0.0% |
| Czech | 170 | 0.1% |
| Czechoslovakian | 145 | 0.1% |
| Danish | 270 | 0.2% |
| Dutch | 848 | 0.7% |
| Dutch West Indian | 13 | 0.0% |
| Eastern European | 194 | 0.2% |
| Ecuadorian | 49 | 0.0% |
| English | 16,688 | 13.5% |
| European | 2,921 | 2.4% |
| Finnish | 69 | 0.1% |
| French | 2,166 | 1.8% |
| French American Indian | 119 | 0.1% |
| French Canadian | 303 | 0.2% |
| German | 13,941 | 11.2% |
| Greek | 234 | 0.2% |
| Guatemalan | 531 | 0.4% |
| Haitian | 65 | 0.1% |
| Honduran | 307 | 0.3% |
| Hungarian | 72 | 0.1% |
| Indian (Asian) | 1,007 | 0.8% |
| Iranian | 32 | 0.0% |
| Iraqi | 23 | 0.0% |
| Irish | 15,883 | 12.8% |
| Italian | 1,947 | 1.6% |
| Jamaican | 14 | 0.0% |
| Korean | 256 | 0.2% |
| Laotian | 44 | 0.0% |
| Lebanese | 102 | 0.1% |
| Lithuanian | 55 | 0.0% |
| Malaysian | 66 | 0.1% |
| Mexican | 4,208 | 3.4% |
| Mexican American Indian | 25 | 0.0% |
| Native Hawaiian | 183 | 0.2% |
| Navajo | 73 | 0.1% |
| Nicaraguan | 29 | 0.0% |
| Northern European | 102 | 0.1% |
| Norwegian | 404 | 0.3% |
| Pakistani | 145 | 0.1% |
| Panamanian | 87 | 0.1% |
| Pennsylvania German | 56 | 0.1% |
| Peruvian | 36 | 0.0% |
| Polish | 1,206 | 1.0% |
| Portuguese | 112 | 0.1% |
| Puerto Rican | 230 | 0.2% |
| Romanian | 52 | 0.0% |
| Russian | 113 | 0.1% |
| Salvadoran | 58 | 0.1% |
| Scandinavian | 290 | 0.2% |
| Scotch-Irish | 1,219 | 1.0% |
| Scottish | 3,003 | 2.4% |
| Serbian | 10 | 0.0% |
| Sioux | 32 | 0.0% |
| Slovak | 38 | 0.0% |
| South African | 12 | 0.0% |
| South American | 340 | 0.3% |
| South American Indian | 36 | 0.0% |
| Spaniard | 81 | 0.1% |
| Spanish | 317 | 0.3% |
| Sri Lankan | 274 | 0.2% |
| Subsaharan African | 1,795 | 1.5% |
| Swedish | 560 | 0.4% |
| Swiss | 261 | 0.2% |
| Thai | 402 | 0.3% |
| Ukrainian | 31 | 0.0% |
| Venezuelan | 97 | 0.1% |
| Welsh | 857 | 0.7% | View All 94 Rows |
Immigrants in Saline County
The most numerous immigrant groups reported in Saline County came from Latin America (2,350 | 1.9%), Central America (2,211 | 1.8%), Mexico (1,457 | 1.2%), Asia (1,095 | 0.9%), and Eastern Asia (498 | 0.4%), together accounting for 6.1% of all Saline County residents.
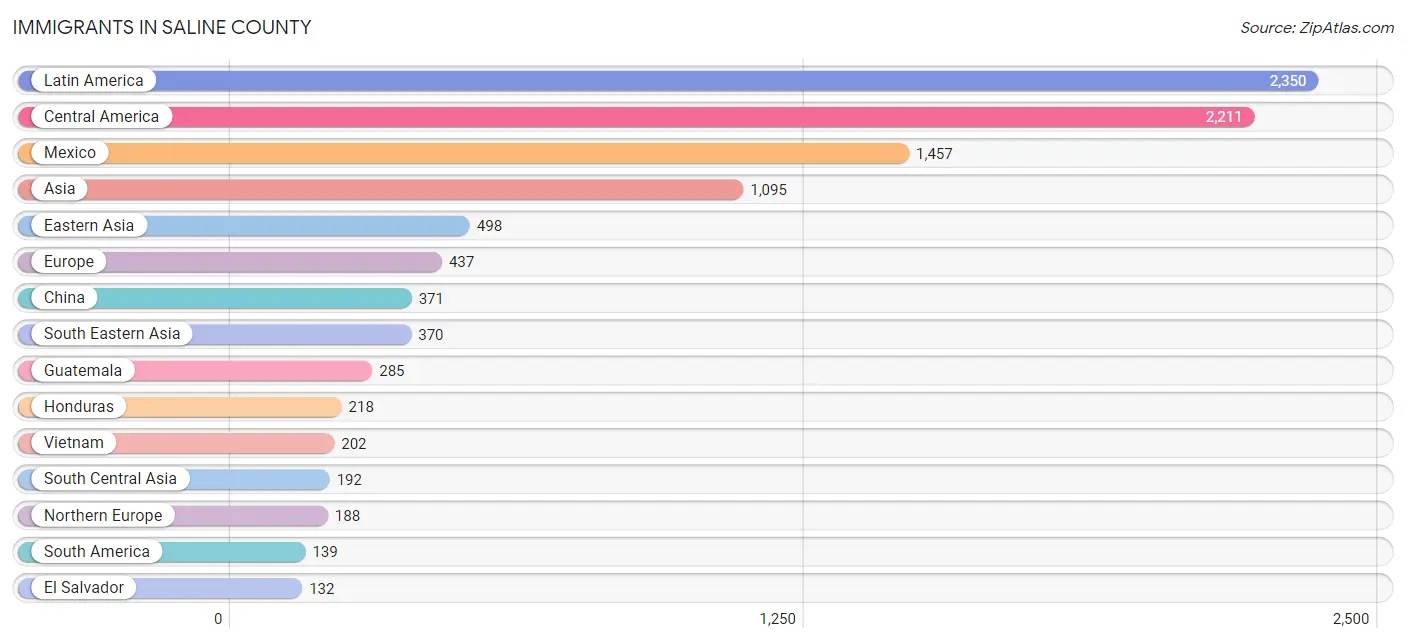
| Immigration Origin | # Population | % Population |
| Africa | 85 | 0.1% |
| Albania | 14 | 0.0% |
| Asia | 1,095 | 0.9% |
| Bangladesh | 94 | 0.1% |
| Belize | 15 | 0.0% |
| Bolivia | 58 | 0.1% |
| Brazil | 10 | 0.0% |
| Canada | 25 | 0.0% |
| Central America | 2,211 | 1.8% |
| China | 371 | 0.3% |
| Eastern Asia | 498 | 0.4% |
| Eastern Europe | 103 | 0.1% |
| Egypt | 10 | 0.0% |
| El Salvador | 132 | 0.1% |
| England | 63 | 0.1% |
| Europe | 437 | 0.4% |
| Germany | 132 | 0.1% |
| Guatemala | 285 | 0.2% |
| Honduras | 218 | 0.2% |
| India | 81 | 0.1% |
| Iraq | 23 | 0.0% |
| Ireland | 31 | 0.0% |
| Korea | 127 | 0.1% |
| Laos | 33 | 0.0% |
| Latin America | 2,350 | 1.9% |
| Lebanon | 12 | 0.0% |
| Liberia | 48 | 0.0% |
| Mexico | 1,457 | 1.2% |
| Morocco | 15 | 0.0% |
| Northern Africa | 25 | 0.0% |
| Northern Europe | 188 | 0.2% |
| Panama | 104 | 0.1% |
| Peru | 7 | 0.0% |
| Philippines | 70 | 0.1% |
| Poland | 36 | 0.0% |
| Portugal | 14 | 0.0% |
| Romania | 19 | 0.0% |
| Russia | 28 | 0.0% |
| Singapore | 33 | 0.0% |
| South Africa | 12 | 0.0% |
| South America | 139 | 0.1% |
| South Central Asia | 192 | 0.2% |
| South Eastern Asia | 370 | 0.3% |
| Southern Europe | 14 | 0.0% |
| Sri Lanka | 17 | 0.0% |
| Taiwan | 68 | 0.1% |
| Thailand | 32 | 0.0% |
| Ukraine | 6 | 0.0% |
| Venezuela | 64 | 0.1% |
| Vietnam | 202 | 0.2% |
| Western Africa | 48 | 0.0% |
| Western Asia | 35 | 0.0% |
| Western Europe | 132 | 0.1% | View All 53 Rows |
Sex and Age in Saline County
Sex and Age in Saline County
The most populous age groups in Saline County are 5 to 9 Years (4,319 | 7.1%) for men and 40 to 44 Years (4,624 | 7.3%) for women.
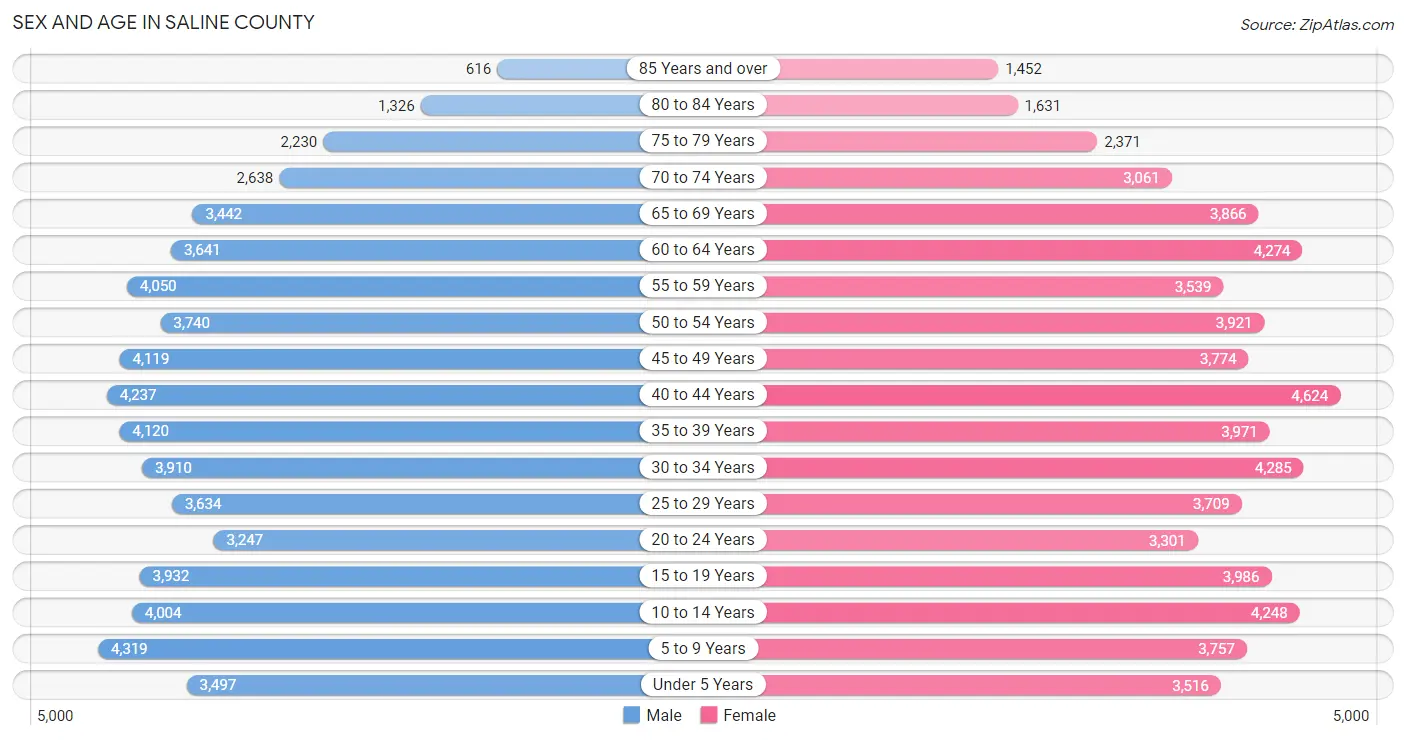
| Age Bracket | Male | Female |
| Under 5 Years | 3,497 (5.8%) | 3,516 (5.6%) |
| 5 to 9 Years | 4,319 (7.1%) | 3,757 (5.9%) |
| 10 to 14 Years | 4,004 (6.6%) | 4,248 (6.7%) |
| 15 to 19 Years | 3,932 (6.5%) | 3,986 (6.3%) |
| 20 to 24 Years | 3,247 (5.3%) | 3,301 (5.2%) |
| 25 to 29 Years | 3,634 (6.0%) | 3,709 (5.9%) |
| 30 to 34 Years | 3,910 (6.4%) | 4,285 (6.8%) |
| 35 to 39 Years | 4,120 (6.8%) | 3,971 (6.3%) |
| 40 to 44 Years | 4,237 (7.0%) | 4,624 (7.3%) |
| 45 to 49 Years | 4,119 (6.8%) | 3,774 (6.0%) |
| 50 to 54 Years | 3,740 (6.2%) | 3,921 (6.2%) |
| 55 to 59 Years | 4,050 (6.7%) | 3,539 (5.6%) |
| 60 to 64 Years | 3,641 (6.0%) | 4,274 (6.8%) |
| 65 to 69 Years | 3,442 (5.7%) | 3,866 (6.1%) |
| 70 to 74 Years | 2,638 (4.3%) | 3,061 (4.8%) |
| 75 to 79 Years | 2,230 (3.7%) | 2,371 (3.7%) |
| 80 to 84 Years | 1,326 (2.2%) | 1,631 (2.6%) |
| 85 Years and over | 616 (1.0%) | 1,452 (2.3%) |
| Total | 60,702 (100.0%) | 63,286 (100.0%) |
Families and Households in Saline County
Median Family Size in Saline County
The median family size in Saline County is 3.00 persons per family, with married-couple families (27,261 | 78.8%) accounting for the largest median family size of 3.02 persons per family. On the other hand, single female/mother families (5,402 | 15.6%) represent the smallest median family size with 2.91 persons per family.
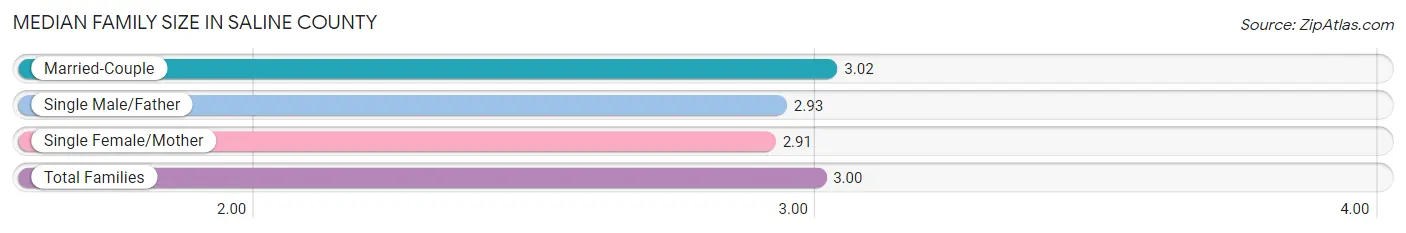
| Family Type | # Families | Family Size |
| Married-Couple | 27,261 (78.8%) | 3.02 |
| Single Male/Father | 1,912 (5.5%) | 2.93 |
| Single Female/Mother | 5,402 (15.6%) | 2.91 |
| Total Families | 34,575 (100.0%) | 3.00 |
Median Household Size in Saline County
The median household size in Saline County is 2.53 persons per household, with single male/father households (1,912 | 4.0%) accounting for the largest median household size of 3.37 persons per household. non-family households (13,890 | 28.7%) represent the smallest median household size with 1.21 persons per household.
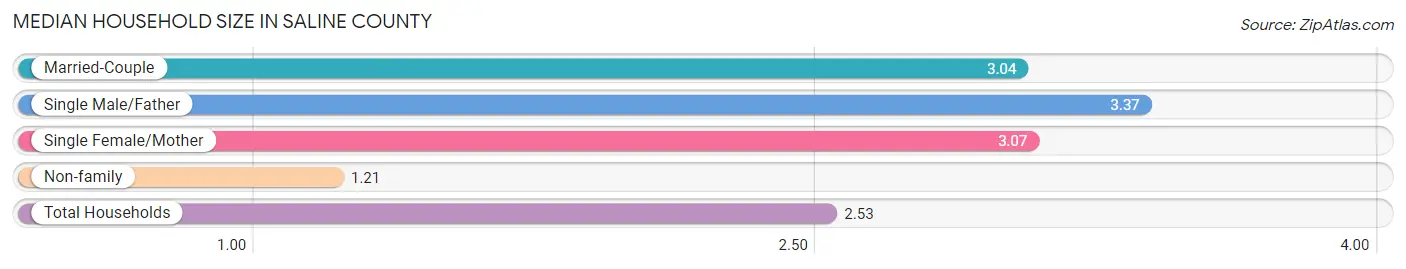
| Household Type | # Households | Household Size |
| Married-Couple | 27,261 (56.2%) | 3.04 |
| Single Male/Father | 1,912 (4.0%) | 3.37 |
| Single Female/Mother | 5,402 (11.2%) | 3.07 |
| Non-family | 13,890 (28.7%) | 1.21 |
| Total Households | 48,465 (100.0%) | 2.53 |
Household Size by Marriage Status in Saline County
Out of a total of 48,465 households in Saline County, 34,575 (71.3%) are family households, while 13,890 (28.7%) are nonfamily households. The most numerous type of family households are 2-person households, comprising 16,745, and the most common type of nonfamily households are 1-person households, comprising 11,598.
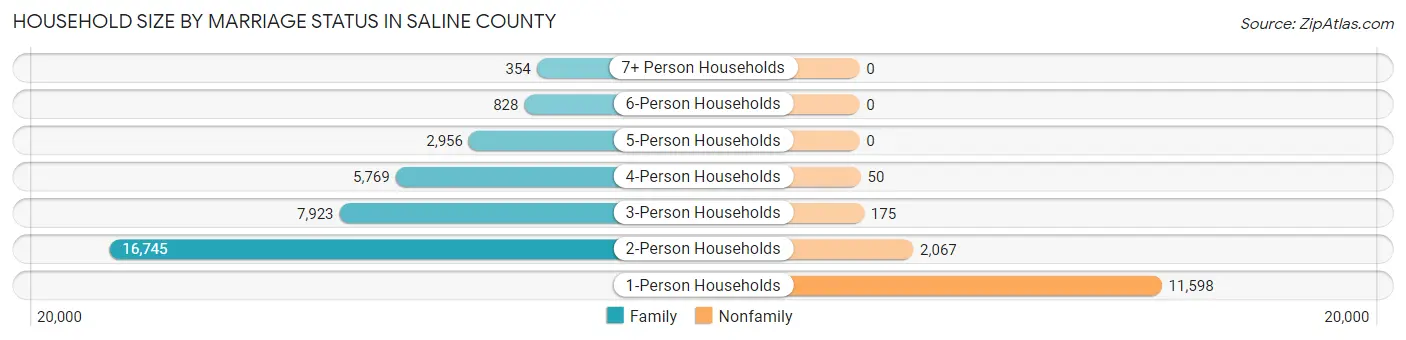
| Household Size | Family Households | Nonfamily Households |
| 1-Person Households | - | 11,598 (23.9%) |
| 2-Person Households | 16,745 (34.5%) | 2,067 (4.3%) |
| 3-Person Households | 7,923 (16.4%) | 175 (0.4%) |
| 4-Person Households | 5,769 (11.9%) | 50 (0.1%) |
| 5-Person Households | 2,956 (6.1%) | 0 (0.0%) |
| 6-Person Households | 828 (1.7%) | 0 (0.0%) |
| 7+ Person Households | 354 (0.7%) | 0 (0.0%) |
| Total | 34,575 (71.3%) | 13,890 (28.7%) |
Female Fertility in Saline County
Fertility by Age in Saline County
Average fertility rate in Saline County is 64.0 births per 1,000 women. Women in the age bracket of 20 to 34 years have the highest fertility rate with 149.0 births per 1,000 women. Women in the age bracket of 20 to 34 years acount for 91.0% of all women with births.
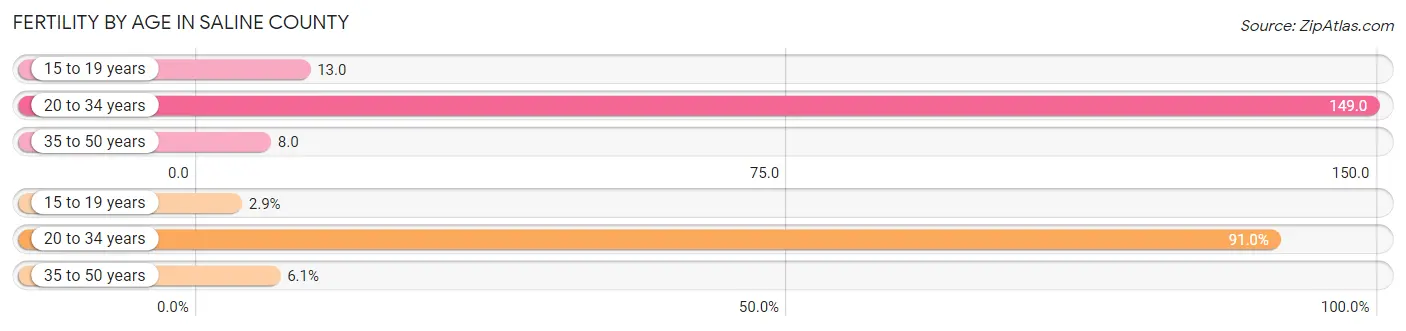
| Age Bracket | Women with Births | Births / 1,000 Women |
| 15 to 19 years | 53 (2.9%) | 13.0 |
| 20 to 34 years | 1,680 (91.0%) | 149.0 |
| 35 to 50 years | 113 (6.1%) | 8.0 |
| Total | 1,846 (100.0%) | 64.0 |
Fertility by Age by Marriage Status in Saline County
71.6% of women with births (1,846) in Saline County are married. The highest percentage of unmarried women with births falls into 15 to 19 years age bracket with 43.4% of them unmarried at the time of birth, while the lowest percentage of unmarried women with births belong to 35 to 50 years age bracket with 8.0% of them unmarried.
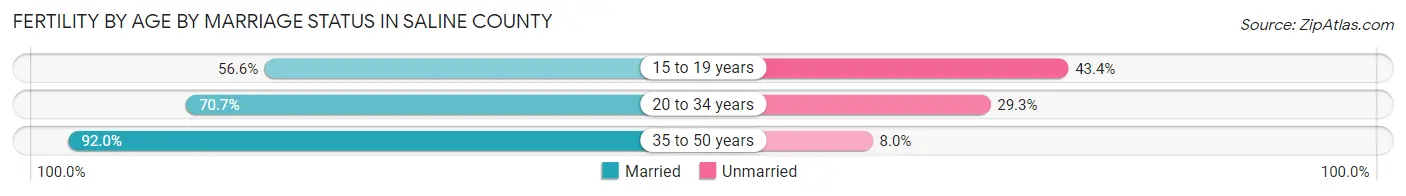
| Age Bracket | Married | Unmarried |
| 15 to 19 years | 30 (56.6%) | 23 (43.4%) |
| 20 to 34 years | 1,188 (70.7%) | 492 (29.3%) |
| 35 to 50 years | 104 (92.0%) | 9 (8.0%) |
| Total | 1,322 (71.6%) | 524 (28.4%) |
Fertility by Education in Saline County
Average fertility rate in Saline County is 64.0 births per 1,000 women. Women with the education attainment of college or associate's degree have the highest fertility rate of 75.0 births per 1,000 women, while women with the education attainment of less than high school have the lowest fertility at 48.0 births per 1,000 women. Women with the education attainment of college or associate's degree represent 39.2% of all women with births.
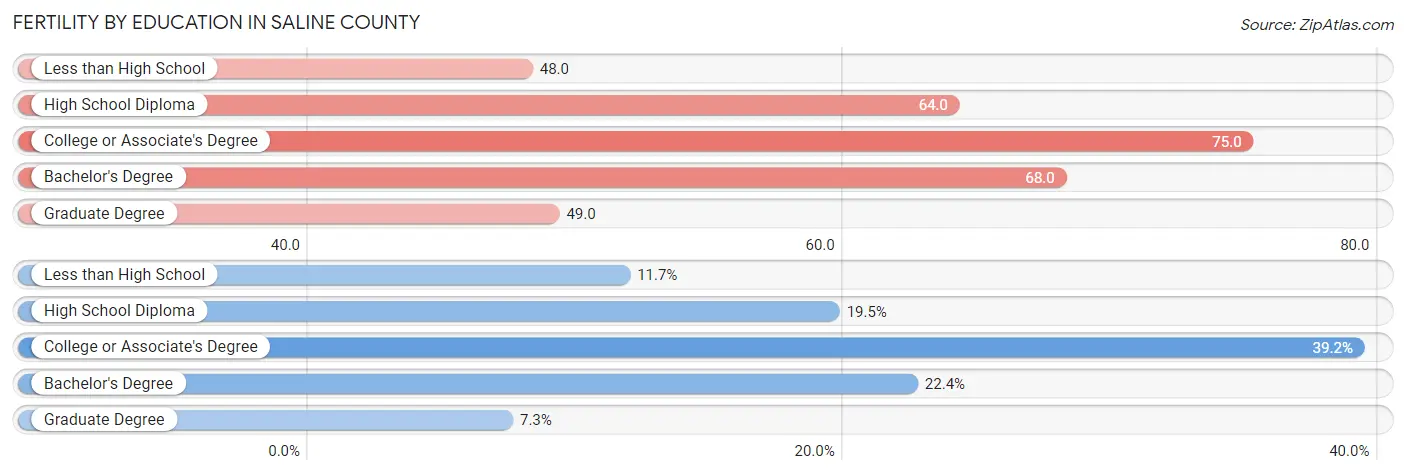
| Educational Attainment | Women with Births | Births / 1,000 Women |
| Less than High School | 215 (11.7%) | 48.0 |
| High School Diploma | 360 (19.5%) | 64.0 |
| College or Associate's Degree | 723 (39.2%) | 75.0 |
| Bachelor's Degree | 414 (22.4%) | 68.0 |
| Graduate Degree | 134 (7.3%) | 49.0 |
| Total | 1,846 (100.0%) | 64.0 |
Fertility by Education by Marriage Status in Saline County
28.4% of women with births in Saline County are unmarried. Women with the educational attainment of graduate degree are most likely to be married with 100.0% of them married at childbirth, while women with the educational attainment of college or associate's degree are least likely to be married with 50.6% of them unmarried at childbirth.
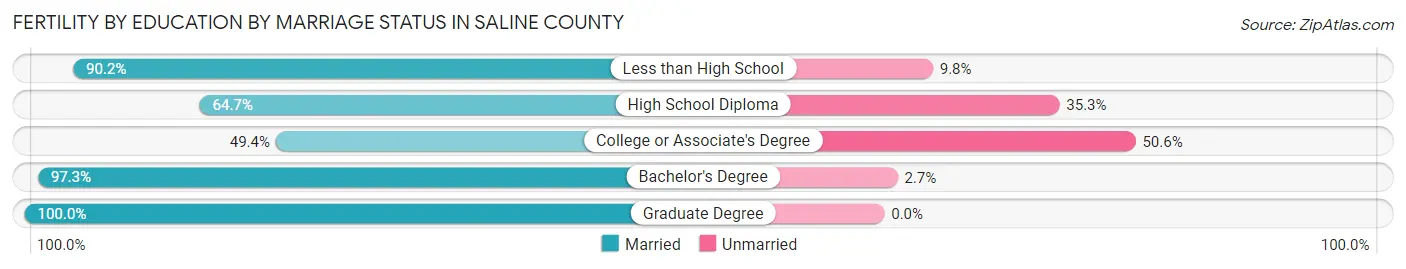
| Educational Attainment | Married | Unmarried |
| Less than High School | 194 (90.2%) | 21 (9.8%) |
| High School Diploma | 233 (64.7%) | 127 (35.3%) |
| College or Associate's Degree | 357 (49.4%) | 366 (50.6%) |
| Bachelor's Degree | 403 (97.3%) | 11 (2.7%) |
| Graduate Degree | 134 (100.0%) | 0 (0.0%) |
| Total | 1,322 (71.6%) | 524 (28.4%) |
Employment Characteristics in Saline County
Employment by Class of Employer in Saline County
Among the 58,391 employed individuals in Saline County, private company employees (37,909 | 64.9%), state government employees (4,978 | 8.5%), and not-for-profit organizations (4,679 | 8.0%) make up the most common classes of employment.
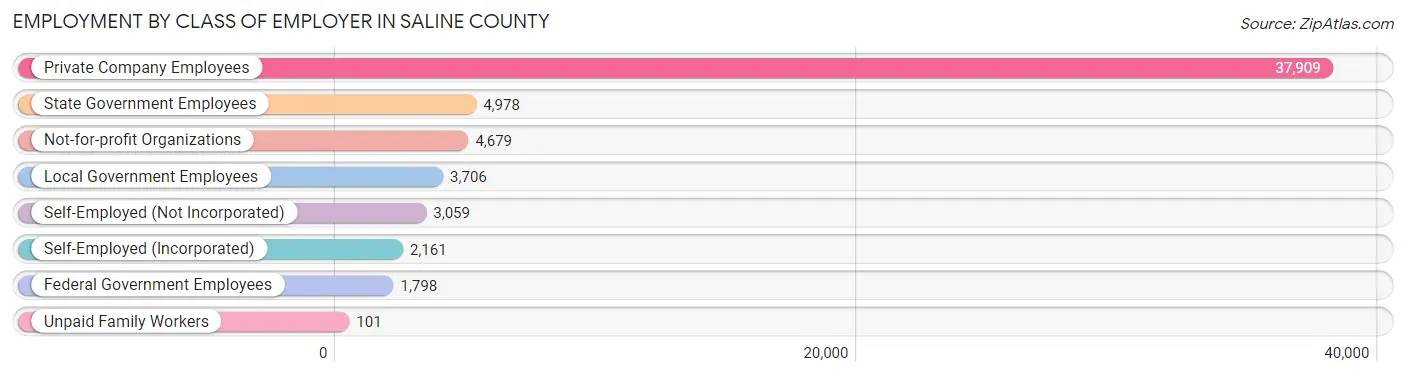
| Employer Class | # Employees | % Employees |
| Private Company Employees | 37,909 | 64.9% |
| Self-Employed (Incorporated) | 2,161 | 3.7% |
| Self-Employed (Not Incorporated) | 3,059 | 5.2% |
| Not-for-profit Organizations | 4,679 | 8.0% |
| Local Government Employees | 3,706 | 6.4% |
| State Government Employees | 4,978 | 8.5% |
| Federal Government Employees | 1,798 | 3.1% |
| Unpaid Family Workers | 101 | 0.2% |
| Total | 58,391 | 100.0% |
Employment Status by Age in Saline County
According to the labor force statistics for Saline County, out of the total population over 16 years of age (98,704), 62.5% or 61,690 individuals are in the labor force, with 3.8% or 2,344 of them unemployed. The age group with the highest labor force participation rate is 25 to 29 years, with 86.7% or 6,366 individuals in the labor force. Within the labor force, the 16 to 19 years age range has the highest percentage of unemployed individuals, with 11.8% or 291 of them being unemployed.
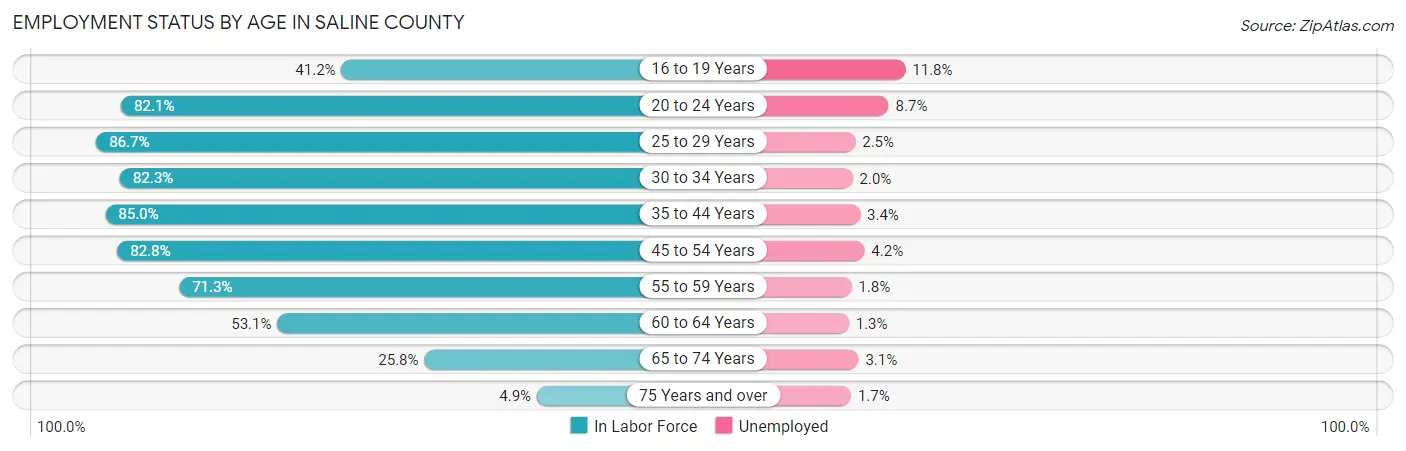
| Age Bracket | In Labor Force | Unemployed |
| 16 to 19 Years | 2,462 (41.2%) | 291 (11.8%) |
| 20 to 24 Years | 5,376 (82.1%) | 468 (8.7%) |
| 25 to 29 Years | 6,366 (86.7%) | 159 (2.5%) |
| 30 to 34 Years | 6,744 (82.3%) | 135 (2.0%) |
| 35 to 44 Years | 14,409 (85.0%) | 490 (3.4%) |
| 45 to 54 Years | 12,879 (82.8%) | 541 (4.2%) |
| 55 to 59 Years | 5,411 (71.3%) | 97 (1.8%) |
| 60 to 64 Years | 4,203 (53.1%) | 55 (1.3%) |
| 65 to 74 Years | 3,356 (25.8%) | 104 (3.1%) |
| 75 Years and over | 472 (4.9%) | 8 (1.7%) |
| Total | 61,690 (62.5%) | 2,344 (3.8%) |
Employment Status by Educational Attainment in Saline County
According to labor force statistics for Saline County, 78.7% of individuals (50,012) out of the total population between 25 and 64 years of age (63,548) are in the labor force, with 2.9% or 1,450 of them being unemployed. The group with the highest labor force participation rate are those with the educational attainment of bachelor's degree or higher, with 88.9% or 17,015 individuals in the labor force. Within the labor force, individuals with less than high school education have the highest percentage of unemployment, with 11.5% or 366 of them being unemployed.
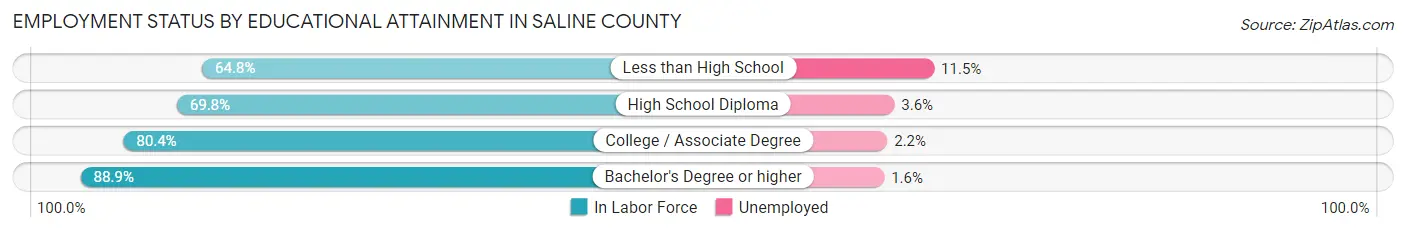
| Educational Attainment | In Labor Force | Unemployed |
| Less than High School | 3,180 (64.8%) | 564 (11.5%) |
| High School Diploma | 12,813 (69.8%) | 661 (3.6%) |
| College / Associate Degree | 17,001 (80.4%) | 465 (2.2%) |
| Bachelor's Degree or higher | 17,015 (88.9%) | 306 (1.6%) |
| Total | 50,012 (78.7%) | 1,843 (2.9%) |
Employment Occupations by Sex in Saline County
Management, Business, Science and Arts Occupations
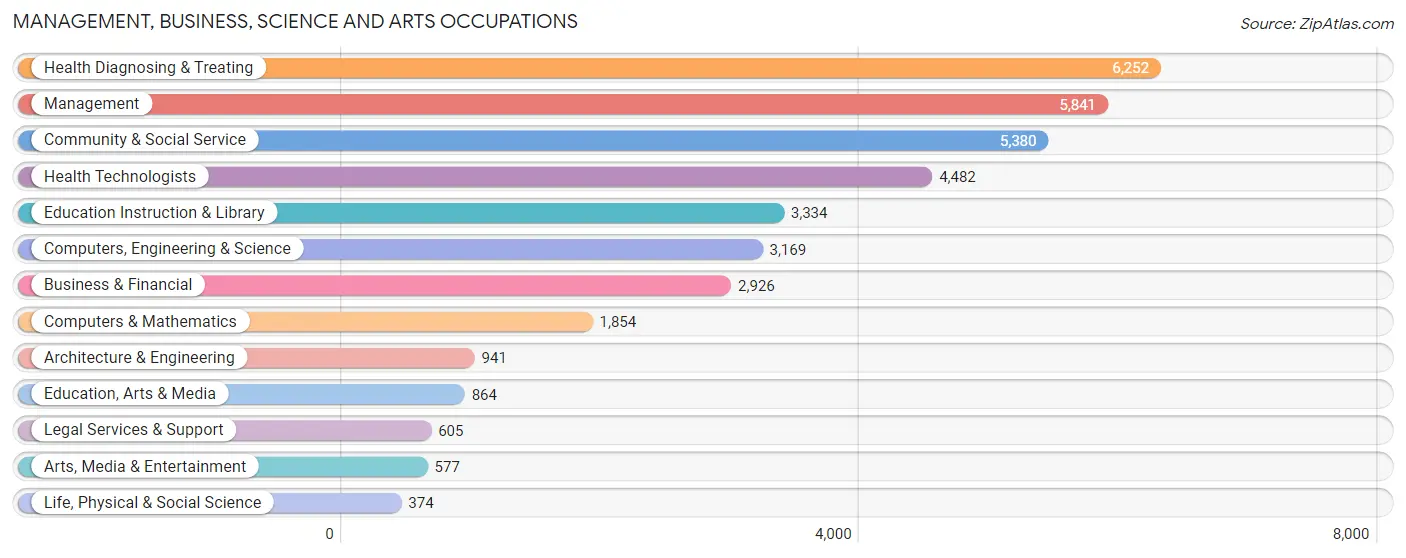
The most common Management, Business, Science and Arts occupations in Saline County are Health Diagnosing & Treating (6,252 | 10.6%), Management (5,841 | 9.9%), Community & Social Service (5,380 | 9.1%), Health Technologists (4,482 | 7.6%), and Education Instruction & Library (3,334 | 5.6%).
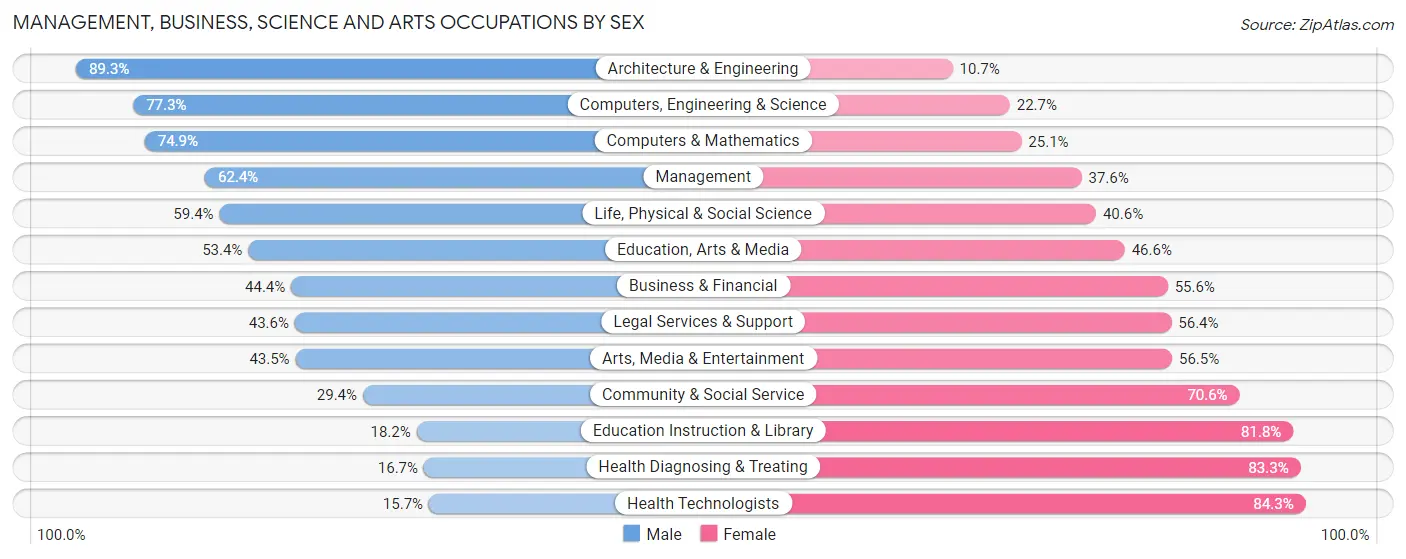
Management, Business, Science and Arts Occupations by Sex
Within the Management, Business, Science and Arts occupations in Saline County, the most male-oriented occupations are Architecture & Engineering (89.3%), Computers, Engineering & Science (77.3%), and Computers & Mathematics (74.9%), while the most female-oriented occupations are Health Technologists (84.3%), Health Diagnosing & Treating (83.3%), and Education Instruction & Library (81.8%).
| Occupation | Male | Female |
| Management | 3,643 (62.4%) | 2,198 (37.6%) |
| Business & Financial | 1,299 (44.4%) | 1,627 (55.6%) |
| Computers, Engineering & Science | 2,451 (77.3%) | 718 (22.7%) |
| Computers & Mathematics | 1,389 (74.9%) | 465 (25.1%) |
| Architecture & Engineering | 840 (89.3%) | 101 (10.7%) |
| Life, Physical & Social Science | 222 (59.4%) | 152 (40.6%) |
| Community & Social Service | 1,584 (29.4%) | 3,796 (70.6%) |
| Education, Arts & Media | 461 (53.4%) | 403 (46.6%) |
| Legal Services & Support | 264 (43.6%) | 341 (56.4%) |
| Education Instruction & Library | 608 (18.2%) | 2,726 (81.8%) |
| Arts, Media & Entertainment | 251 (43.5%) | 326 (56.5%) |
| Health Diagnosing & Treating | 1,045 (16.7%) | 5,207 (83.3%) |
| Health Technologists | 702 (15.7%) | 3,780 (84.3%) |
| Total (Category) | 10,022 (42.5%) | 13,546 (57.5%) |
| Total (Overall) | 30,537 (51.6%) | 28,599 (48.4%) |
Services Occupations
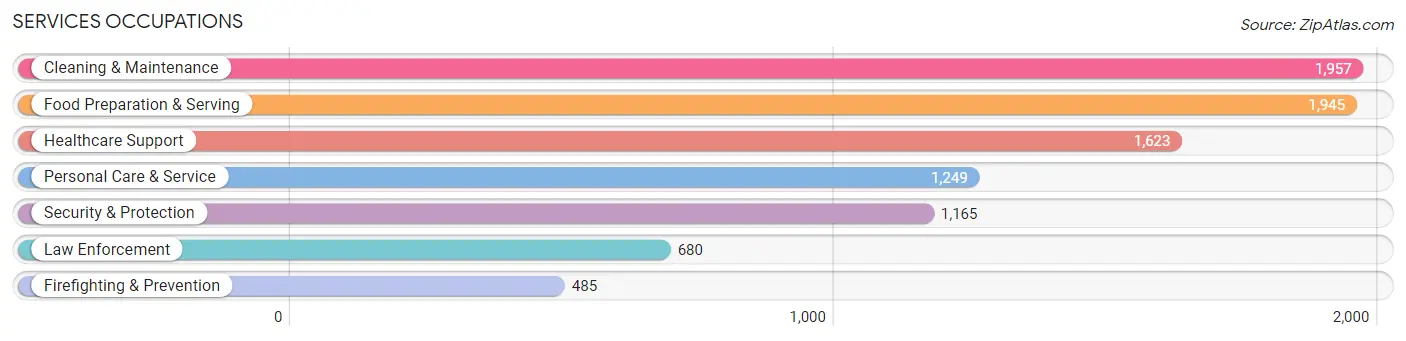
The most common Services occupations in Saline County are Cleaning & Maintenance (1,957 | 3.3%), Food Preparation & Serving (1,945 | 3.3%), Healthcare Support (1,623 | 2.7%), Personal Care & Service (1,249 | 2.1%), and Security & Protection (1,165 | 2.0%).
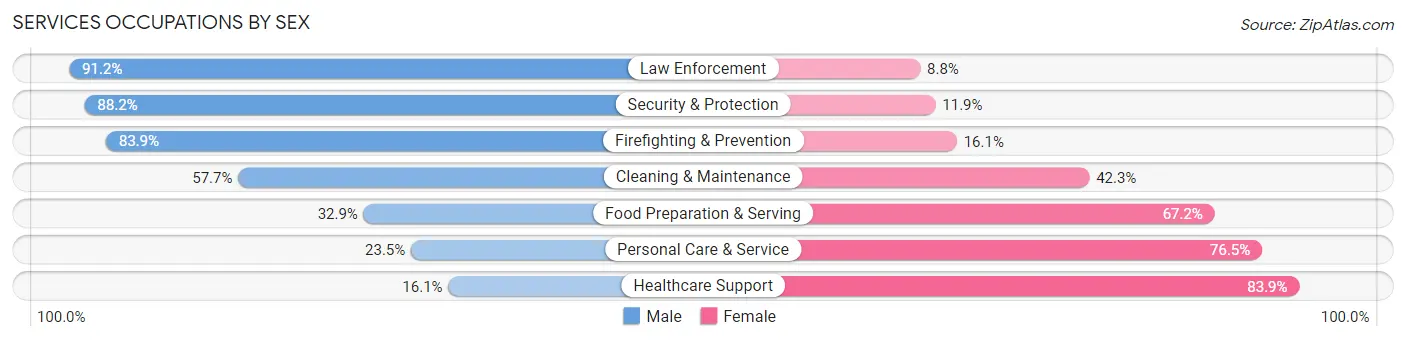
Services Occupations by Sex
Within the Services occupations in Saline County, the most male-oriented occupations are Law Enforcement (91.2%), Security & Protection (88.1%), and Firefighting & Prevention (83.9%), while the most female-oriented occupations are Healthcare Support (83.9%), Personal Care & Service (76.5%), and Food Preparation & Serving (67.1%).
| Occupation | Male | Female |
| Healthcare Support | 261 (16.1%) | 1,362 (83.9%) |
| Security & Protection | 1,027 (88.1%) | 138 (11.8%) |
| Firefighting & Prevention | 407 (83.9%) | 78 (16.1%) |
| Law Enforcement | 620 (91.2%) | 60 (8.8%) |
| Food Preparation & Serving | 639 (32.9%) | 1,306 (67.1%) |
| Cleaning & Maintenance | 1,129 (57.7%) | 828 (42.3%) |
| Personal Care & Service | 293 (23.5%) | 956 (76.5%) |
| Total (Category) | 3,349 (42.2%) | 4,590 (57.8%) |
| Total (Overall) | 30,537 (51.6%) | 28,599 (48.4%) |
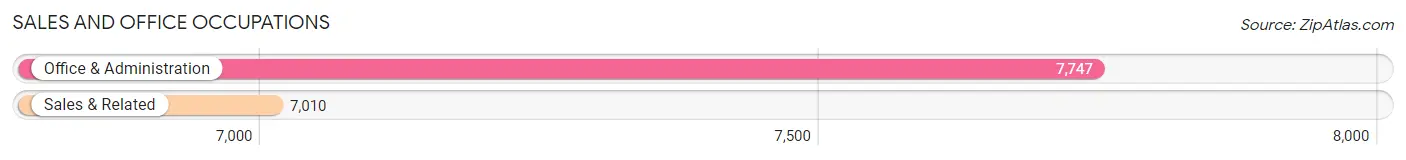
Sales and Office Occupations
The most common Sales and Office occupations in Saline County are Office & Administration (7,747 | 13.1%), and Sales & Related (7,010 | 11.8%).
Sales and Office Occupations by Sex
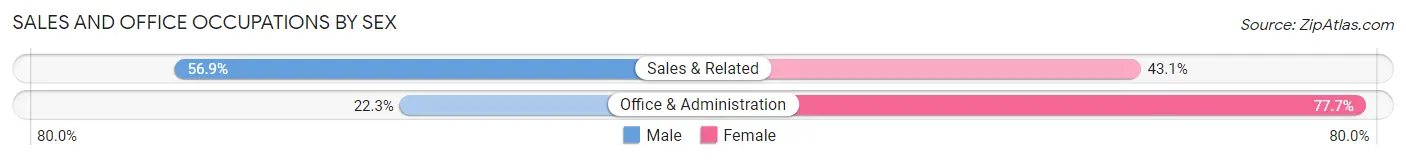
| Occupation | Male | Female |
| Sales & Related | 3,990 (56.9%) | 3,020 (43.1%) |
| Office & Administration | 1,727 (22.3%) | 6,020 (77.7%) |
| Total (Category) | 5,717 (38.7%) | 9,040 (61.3%) |
| Total (Overall) | 30,537 (51.6%) | 28,599 (48.4%) |
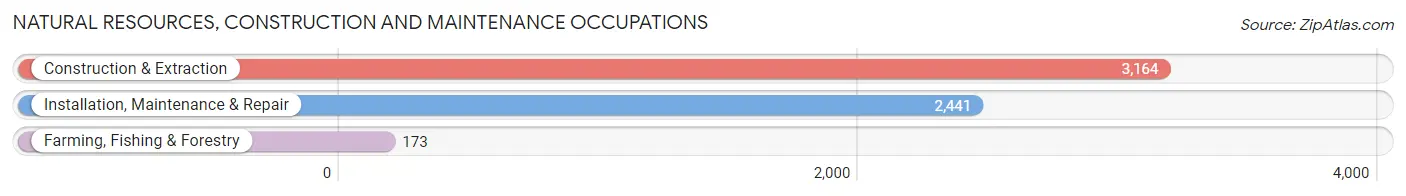
Natural Resources, Construction and Maintenance Occupations
The most common Natural Resources, Construction and Maintenance occupations in Saline County are Construction & Extraction (3,164 | 5.3%), Installation, Maintenance & Repair (2,441 | 4.1%), and Farming, Fishing & Forestry (173 | 0.3%).
Natural Resources, Construction and Maintenance Occupations by Sex
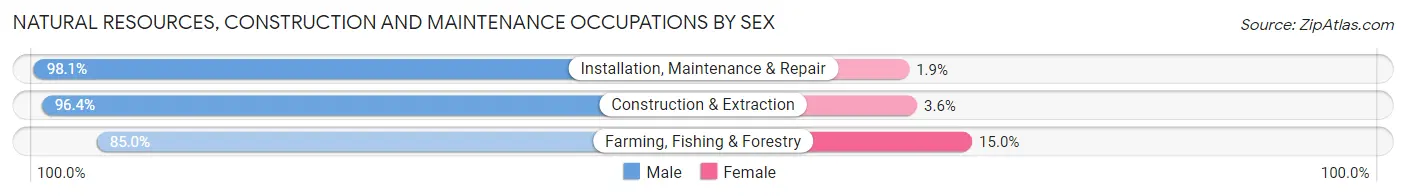
| Occupation | Male | Female |
| Farming, Fishing & Forestry | 147 (85.0%) | 26 (15.0%) |
| Construction & Extraction | 3,051 (96.4%) | 113 (3.6%) |
| Installation, Maintenance & Repair | 2,394 (98.1%) | 47 (1.9%) |
| Total (Category) | 5,592 (96.8%) | 186 (3.2%) |
| Total (Overall) | 30,537 (51.6%) | 28,599 (48.4%) |
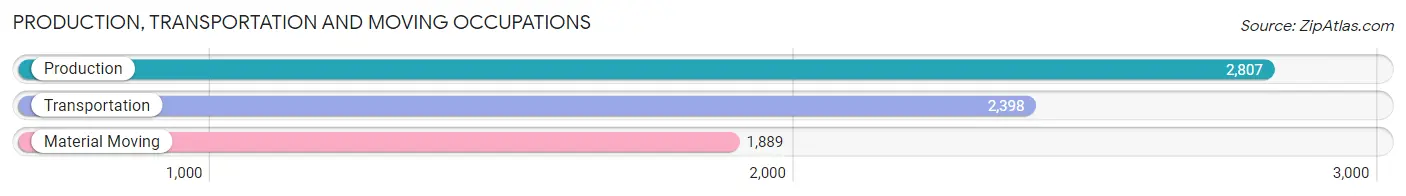
Production, Transportation and Moving Occupations
The most common Production, Transportation and Moving occupations in Saline County are Production (2,807 | 4.8%), Transportation (2,398 | 4.1%), and Material Moving (1,889 | 3.2%).
Production, Transportation and Moving Occupations by Sex
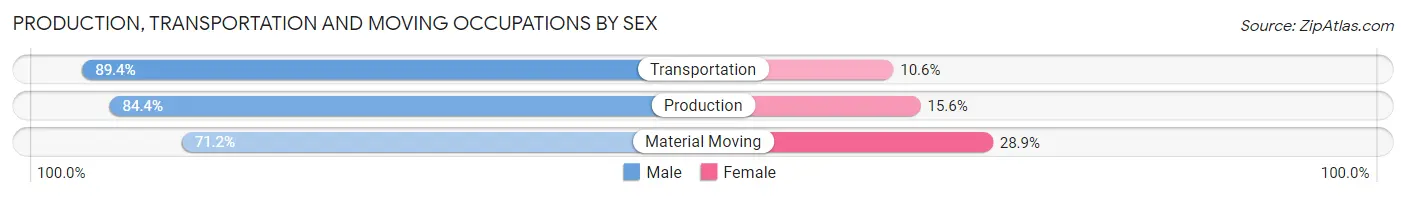
| Occupation | Male | Female |
| Production | 2,369 (84.4%) | 438 (15.6%) |
| Transportation | 2,144 (89.4%) | 254 (10.6%) |
| Material Moving | 1,344 (71.2%) | 545 (28.8%) |
| Total (Category) | 5,857 (82.6%) | 1,237 (17.4%) |
| Total (Overall) | 30,537 (51.6%) | 28,599 (48.4%) |
Employment Industries by Sex in Saline County
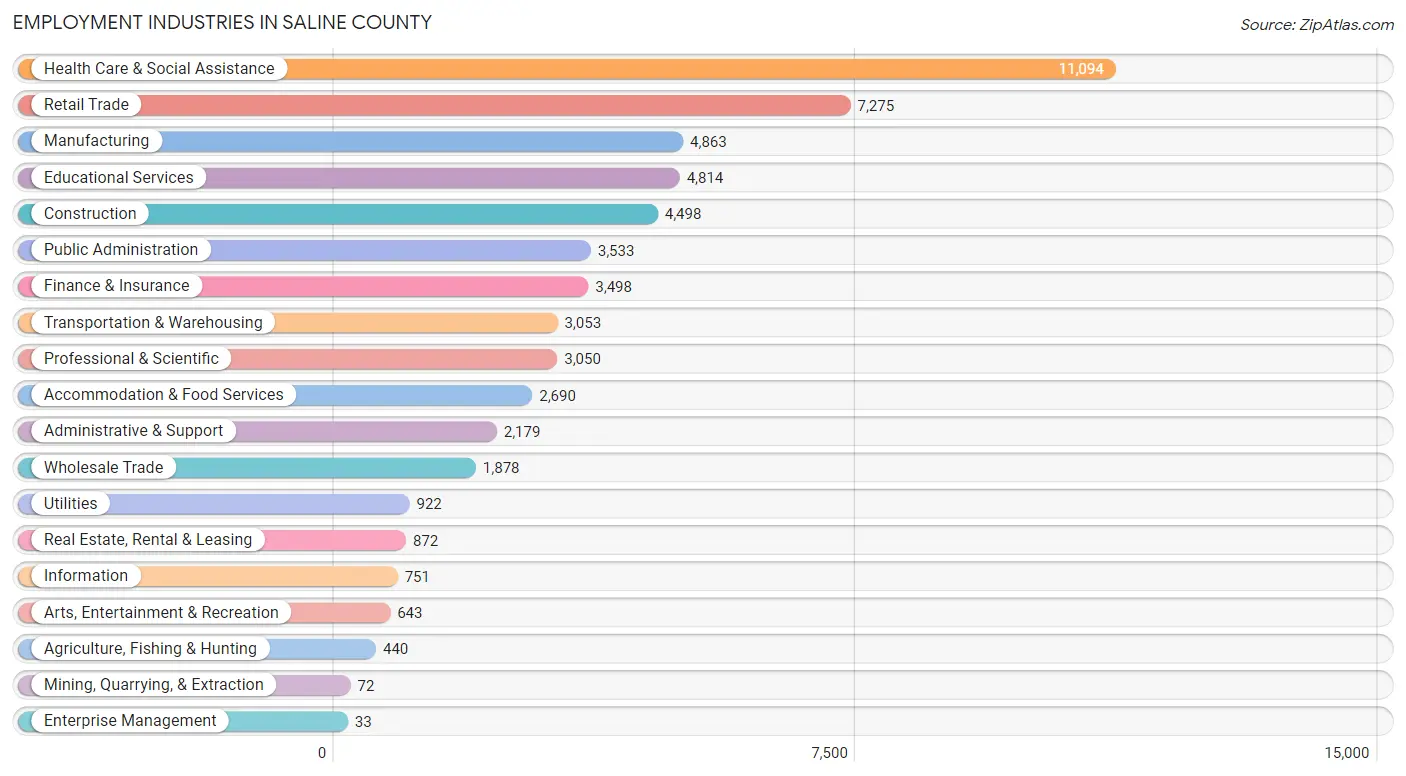
Employment Industries in Saline County
The major employment industries in Saline County include Health Care & Social Assistance (11,094 | 18.8%), Retail Trade (7,275 | 12.3%), Manufacturing (4,863 | 8.2%), Educational Services (4,814 | 8.1%), and Construction (4,498 | 7.6%).
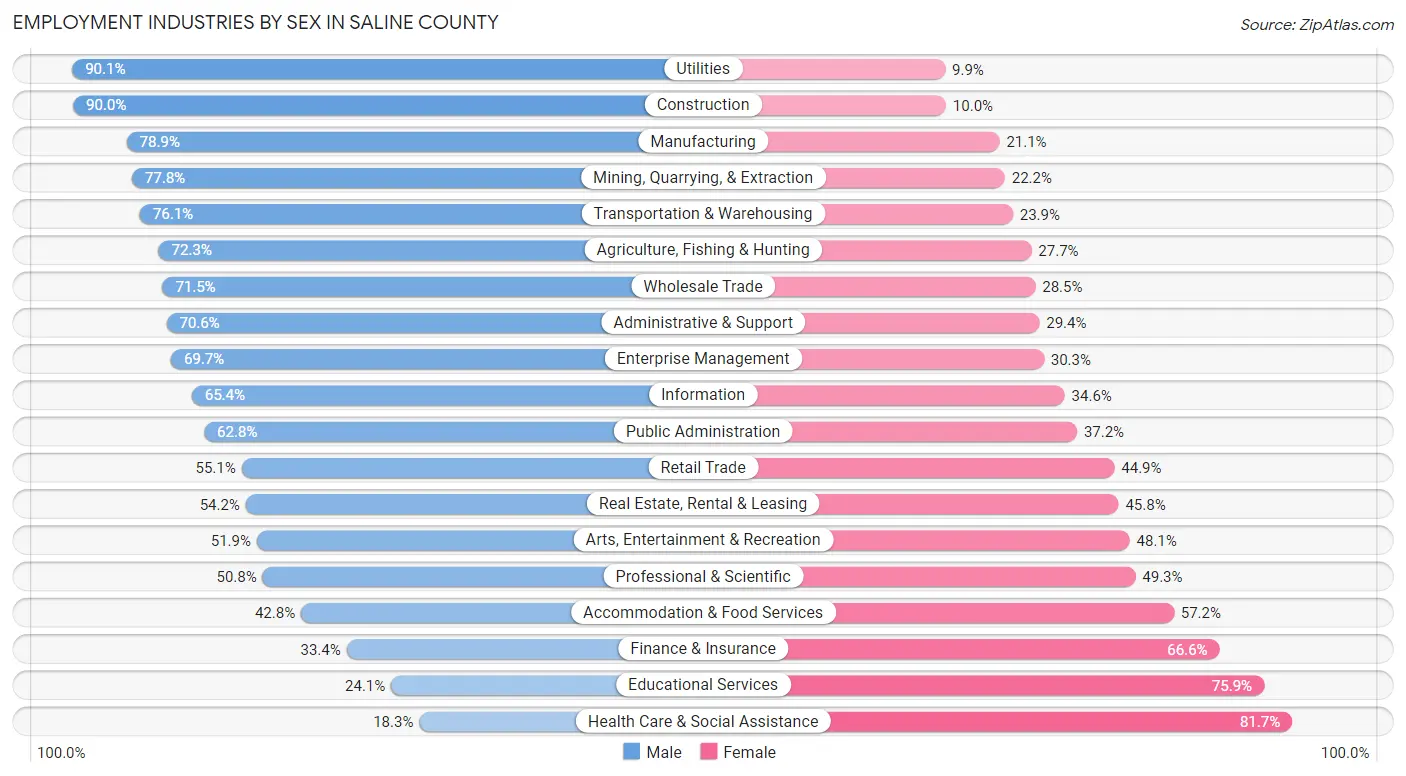
Employment Industries by Sex in Saline County
The Saline County industries that see more men than women are Utilities (90.1%), Construction (90.0%), and Manufacturing (78.9%), whereas the industries that tend to have a higher number of women are Health Care & Social Assistance (81.7%), Educational Services (75.9%), and Finance & Insurance (66.6%).
| Industry | Male | Female |
| Agriculture, Fishing & Hunting | 318 (72.3%) | 122 (27.7%) |
| Mining, Quarrying, & Extraction | 56 (77.8%) | 16 (22.2%) |
| Construction | 4,047 (90.0%) | 451 (10.0%) |
| Manufacturing | 3,836 (78.9%) | 1,027 (21.1%) |
| Wholesale Trade | 1,342 (71.5%) | 536 (28.5%) |
| Retail Trade | 4,008 (55.1%) | 3,267 (44.9%) |
| Transportation & Warehousing | 2,324 (76.1%) | 729 (23.9%) |
| Utilities | 831 (90.1%) | 91 (9.9%) |
| Information | 491 (65.4%) | 260 (34.6%) |
| Finance & Insurance | 1,167 (33.4%) | 2,331 (66.6%) |
| Real Estate, Rental & Leasing | 473 (54.2%) | 399 (45.8%) |
| Professional & Scientific | 1,548 (50.7%) | 1,502 (49.2%) |
| Enterprise Management | 23 (69.7%) | 10 (30.3%) |
| Administrative & Support | 1,539 (70.6%) | 640 (29.4%) |
| Educational Services | 1,162 (24.1%) | 3,652 (75.9%) |
| Health Care & Social Assistance | 2,032 (18.3%) | 9,062 (81.7%) |
| Arts, Entertainment & Recreation | 334 (51.9%) | 309 (48.1%) |
| Accommodation & Food Services | 1,151 (42.8%) | 1,539 (57.2%) |
| Public Administration | 2,220 (62.8%) | 1,313 (37.2%) |
| Total | 30,537 (51.6%) | 28,599 (48.4%) |
Education in Saline County
School Enrollment in Saline County
The most common levels of schooling among the 26,765 students in Saline County are middle school (6,783 | 25.3%), high school (6,489 | 24.2%), and elementary school (5,923 | 22.1%).
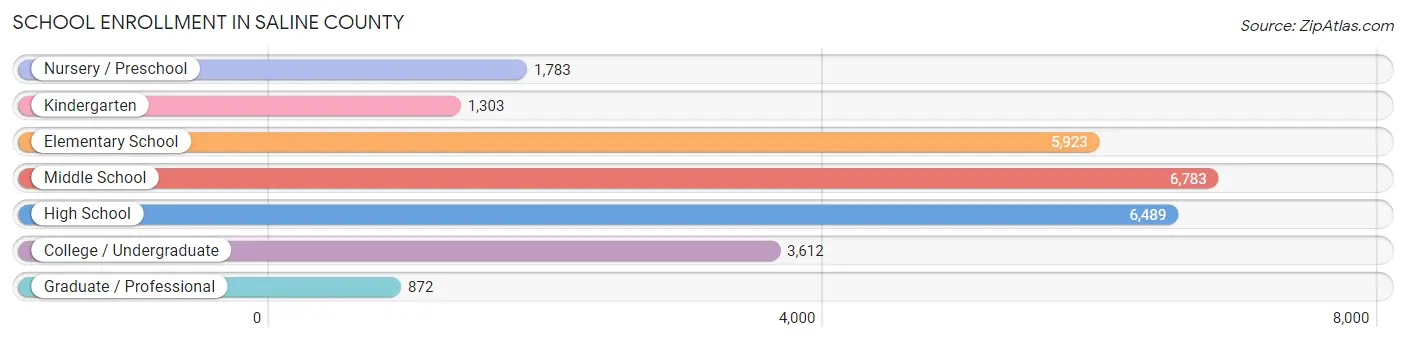
| School Level | # Students | % Students |
| Nursery / Preschool | 1,783 | 6.7% |
| Kindergarten | 1,303 | 4.9% |
| Elementary School | 5,923 | 22.1% |
| Middle School | 6,783 | 25.3% |
| High School | 6,489 | 24.2% |
| College / Undergraduate | 3,612 | 13.5% |
| Graduate / Professional | 872 | 3.3% |
| Total | 26,765 | 100.0% |
School Enrollment by Age by Funding Source in Saline County
Out of a total of 26,765 students who are enrolled in schools in Saline County, 2,650 (9.9%) attend a private institution, while the remaining 24,115 (90.1%) are enrolled in public schools. The age group of 3 to 4 year olds has the highest likelihood of being enrolled in private schools, with 560 (49.7% in the age bracket) enrolled. Conversely, the age group of 10 to 14 year olds has the lowest likelihood of being enrolled in a private school, with 7,556 (95.2% in the age bracket) attending a public institution.
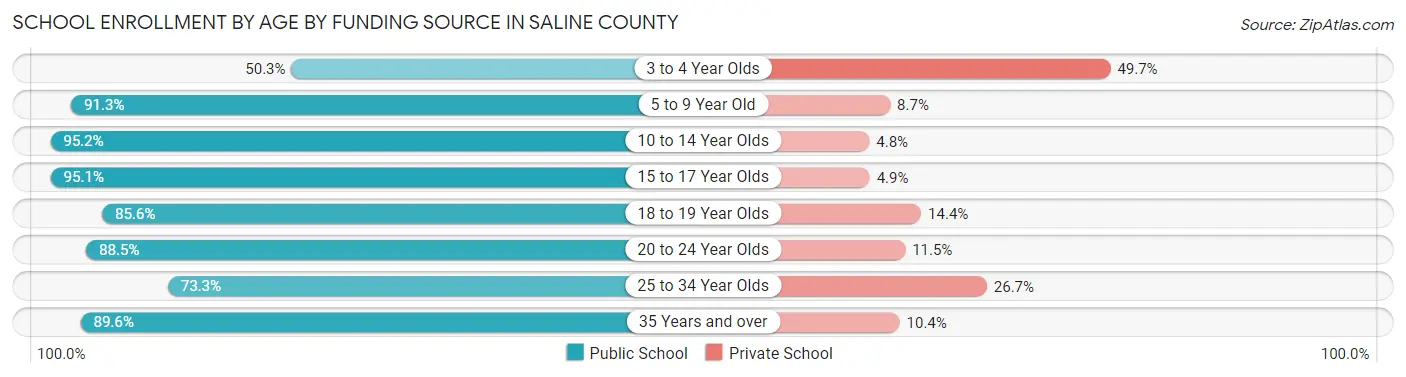
| Age Bracket | Public School | Private School |
| 3 to 4 Year Olds | 567 (50.3%) | 560 (49.7%) |
| 5 to 9 Year Old | 6,539 (91.3%) | 620 (8.7%) |
| 10 to 14 Year Olds | 7,556 (95.2%) | 380 (4.8%) |
| 15 to 17 Year Olds | 4,876 (95.1%) | 249 (4.9%) |
| 18 to 19 Year Olds | 1,162 (85.6%) | 196 (14.4%) |
| 20 to 24 Year Olds | 1,398 (88.5%) | 181 (11.5%) |
| 25 to 34 Year Olds | 968 (73.3%) | 352 (26.7%) |
| 35 Years and over | 1,040 (89.6%) | 121 (10.4%) |
| Total | 24,115 (90.1%) | 2,650 (9.9%) |
Educational Attainment by Field of Study in Saline County
Business (6,013 | 23.1%), science & technology (4,156 | 15.9%), education (3,885 | 14.9%), arts & humanities (1,875 | 7.2%), and bio, nature & agricultural (1,569 | 6.0%) are the most common fields of study among 26,073 individuals in Saline County who have obtained a bachelor's degree or higher.
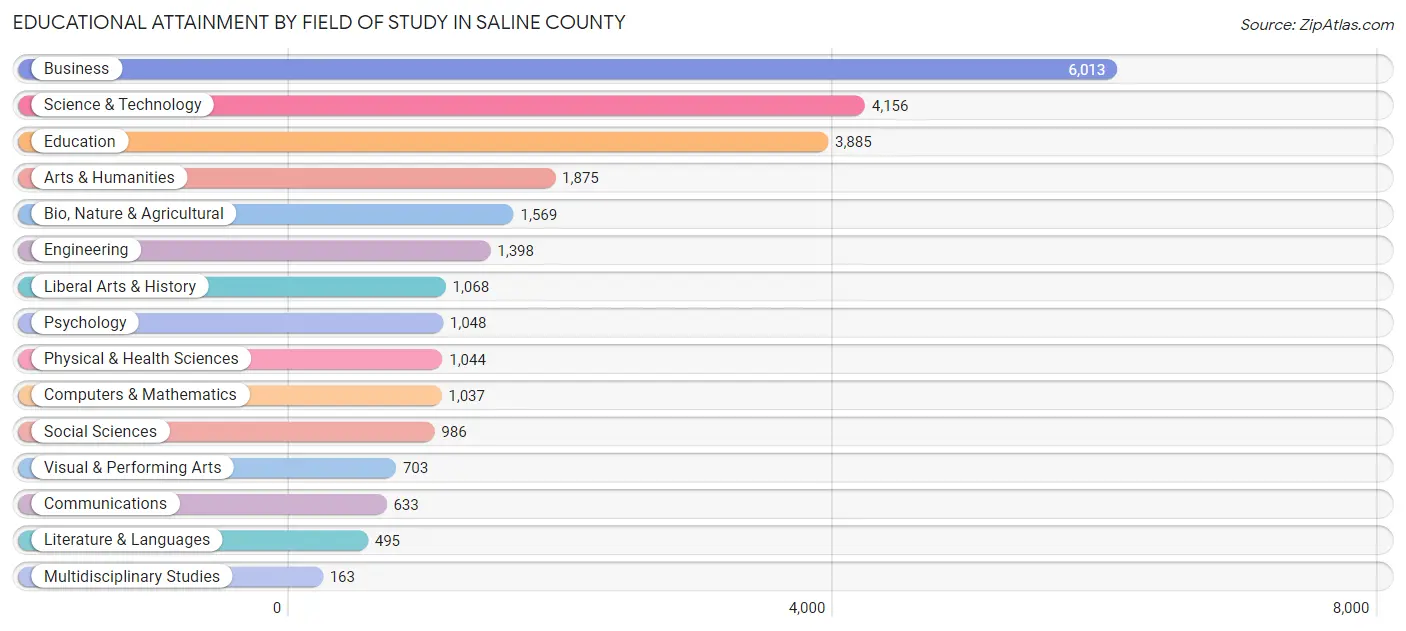
| Field of Study | # Graduates | % Graduates |
| Computers & Mathematics | 1,037 | 4.0% |
| Bio, Nature & Agricultural | 1,569 | 6.0% |
| Physical & Health Sciences | 1,044 | 4.0% |
| Psychology | 1,048 | 4.0% |
| Social Sciences | 986 | 3.8% |
| Engineering | 1,398 | 5.4% |
| Multidisciplinary Studies | 163 | 0.6% |
| Science & Technology | 4,156 | 15.9% |
| Business | 6,013 | 23.1% |
| Education | 3,885 | 14.9% |
| Literature & Languages | 495 | 1.9% |
| Liberal Arts & History | 1,068 | 4.1% |
| Visual & Performing Arts | 703 | 2.7% |
| Communications | 633 | 2.4% |
| Arts & Humanities | 1,875 | 7.2% |
| Total | 26,073 | 100.0% |
Transportation & Commute in Saline County
Vehicle Availability by Sex in Saline County
The most prevalent vehicle ownership categories in Saline County are males with 2 vehicles (15,014, accounting for 49.3%) and females with 2 vehicles (13,081, making up 53.7%).
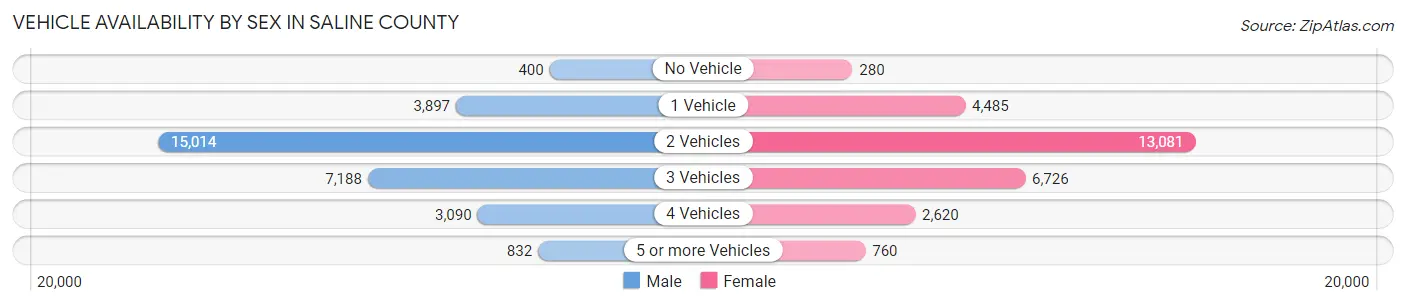
| Vehicles Available | Male | Female |
| No Vehicle | 400 (1.3%) | 280 (1.0%) |
| 1 Vehicle | 3,897 (12.8%) | 4,485 (16.1%) |
| 2 Vehicles | 15,014 (49.3%) | 13,081 (46.8%) |
| 3 Vehicles | 7,188 (23.6%) | 6,726 (24.1%) |
| 4 Vehicles | 3,090 (10.2%) | 2,620 (9.4%) |
| 5 or more Vehicles | 832 (2.7%) | 760 (2.7%) |
| Total | 30,421 (100.0%) | 27,952 (100.0%) |
Commute Time in Saline County
The most frequently occuring commute durations in Saline County are 30 to 34 minutes (10,846 commuters, 20.0%), 20 to 24 minutes (8,576 commuters, 15.8%), and 15 to 19 minutes (6,486 commuters, 11.9%).
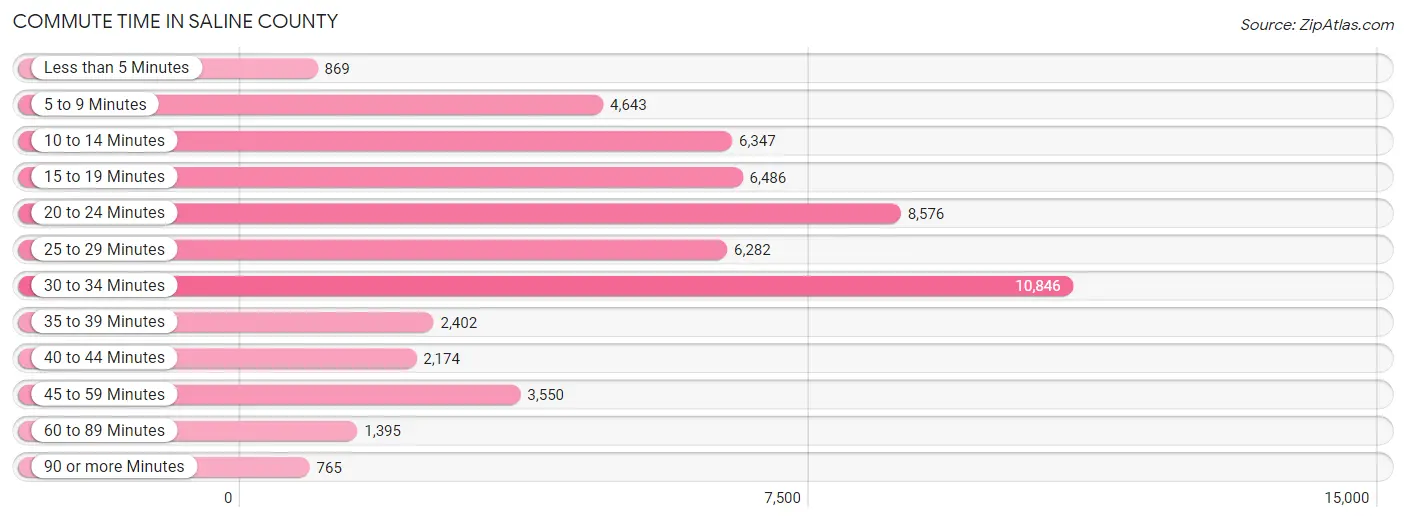
| Commute Time | # Commuters | % Commuters |
| Less than 5 Minutes | 869 | 1.6% |
| 5 to 9 Minutes | 4,643 | 8.6% |
| 10 to 14 Minutes | 6,347 | 11.7% |
| 15 to 19 Minutes | 6,486 | 11.9% |
| 20 to 24 Minutes | 8,576 | 15.8% |
| 25 to 29 Minutes | 6,282 | 11.6% |
| 30 to 34 Minutes | 10,846 | 20.0% |
| 35 to 39 Minutes | 2,402 | 4.4% |
| 40 to 44 Minutes | 2,174 | 4.0% |
| 45 to 59 Minutes | 3,550 | 6.5% |
| 60 to 89 Minutes | 1,395 | 2.6% |
| 90 or more Minutes | 765 | 1.4% |
Commute Time by Sex in Saline County
The most common commute times in Saline County are 30 to 34 minutes (6,140 commuters, 21.3%) for males and 30 to 34 minutes (4,706 commuters, 18.4%) for females.
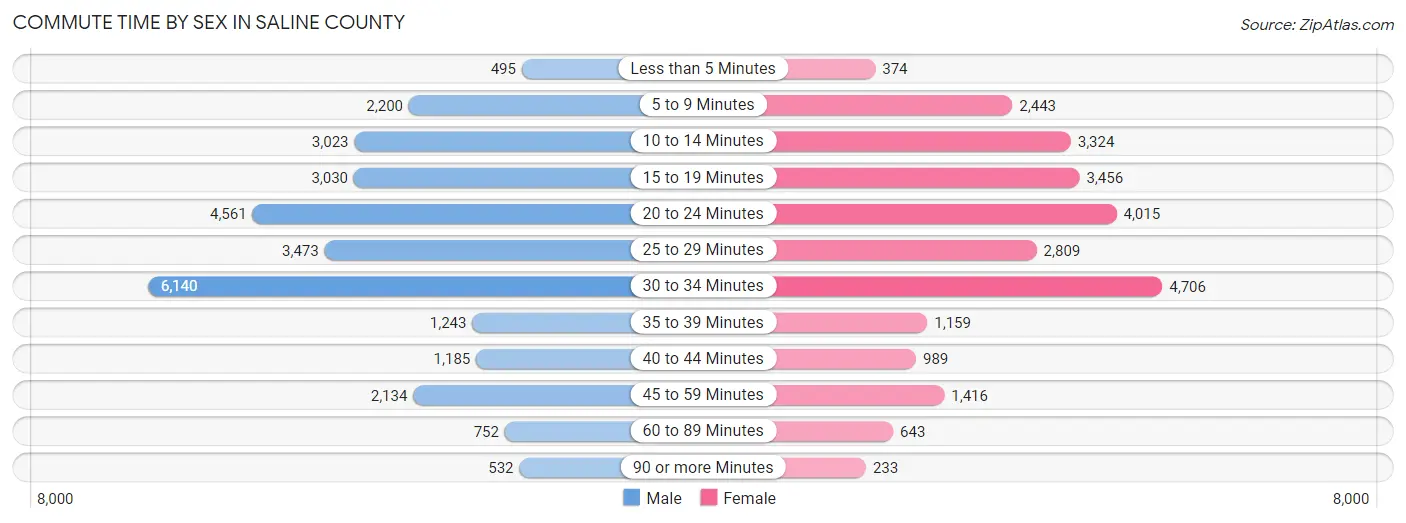
| Commute Time | Male | Female |
| Less than 5 Minutes | 495 (1.7%) | 374 (1.5%) |
| 5 to 9 Minutes | 2,200 (7.6%) | 2,443 (9.6%) |
| 10 to 14 Minutes | 3,023 (10.5%) | 3,324 (13.0%) |
| 15 to 19 Minutes | 3,030 (10.5%) | 3,456 (13.5%) |
| 20 to 24 Minutes | 4,561 (15.9%) | 4,015 (15.7%) |
| 25 to 29 Minutes | 3,473 (12.1%) | 2,809 (11.0%) |
| 30 to 34 Minutes | 6,140 (21.3%) | 4,706 (18.4%) |
| 35 to 39 Minutes | 1,243 (4.3%) | 1,159 (4.5%) |
| 40 to 44 Minutes | 1,185 (4.1%) | 989 (3.9%) |
| 45 to 59 Minutes | 2,134 (7.4%) | 1,416 (5.5%) |
| 60 to 89 Minutes | 752 (2.6%) | 643 (2.5%) |
| 90 or more Minutes | 532 (1.8%) | 233 (0.9%) |
Time of Departure to Work by Sex in Saline County
The most frequent times of departure to work in Saline County are 7:00 AM to 7:29 AM (5,120, 17.8%) for males and 7:00 AM to 7:29 AM (5,582, 21.8%) for females.
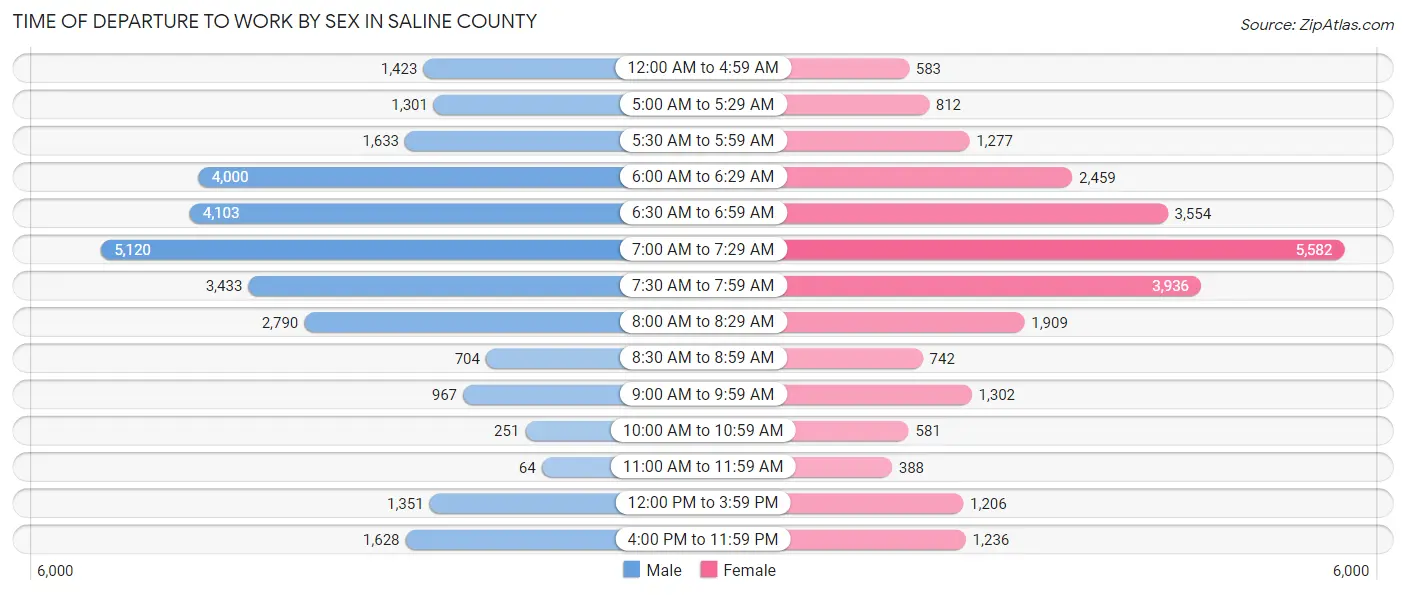
| Time of Departure | Male | Female |
| 12:00 AM to 4:59 AM | 1,423 (5.0%) | 583 (2.3%) |
| 5:00 AM to 5:29 AM | 1,301 (4.5%) | 812 (3.2%) |
| 5:30 AM to 5:59 AM | 1,633 (5.7%) | 1,277 (5.0%) |
| 6:00 AM to 6:29 AM | 4,000 (13.9%) | 2,459 (9.6%) |
| 6:30 AM to 6:59 AM | 4,103 (14.3%) | 3,554 (13.9%) |
| 7:00 AM to 7:29 AM | 5,120 (17.8%) | 5,582 (21.8%) |
| 7:30 AM to 7:59 AM | 3,433 (11.9%) | 3,936 (15.4%) |
| 8:00 AM to 8:29 AM | 2,790 (9.7%) | 1,909 (7.5%) |
| 8:30 AM to 8:59 AM | 704 (2.5%) | 742 (2.9%) |
| 9:00 AM to 9:59 AM | 967 (3.4%) | 1,302 (5.1%) |
| 10:00 AM to 10:59 AM | 251 (0.9%) | 581 (2.3%) |
| 11:00 AM to 11:59 AM | 64 (0.2%) | 388 (1.5%) |
| 12:00 PM to 3:59 PM | 1,351 (4.7%) | 1,206 (4.7%) |
| 4:00 PM to 11:59 PM | 1,628 (5.7%) | 1,236 (4.8%) |
| Total | 28,768 (100.0%) | 25,567 (100.0%) |
Housing Occupancy in Saline County
Occupancy by Ownership in Saline County
Of the total 48,465 dwellings in Saline County, owner-occupied units account for 37,911 (78.2%), while renter-occupied units make up 10,554 (21.8%).
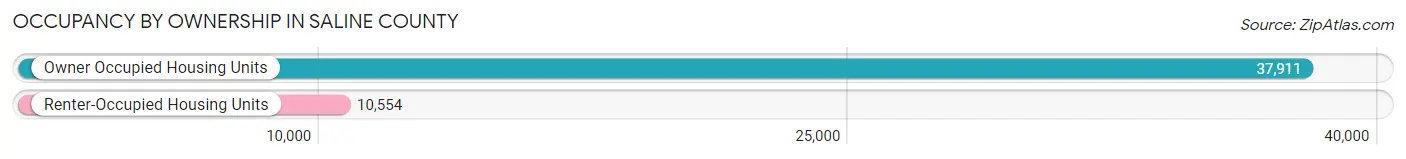
| Occupancy | # Housing Units | % Housing Units |
| Owner Occupied Housing Units | 37,911 | 78.2% |
| Renter-Occupied Housing Units | 10,554 | 21.8% |
| Total Occupied Housing Units | 48,465 | 100.0% |
Occupancy by Household Size in Saline County
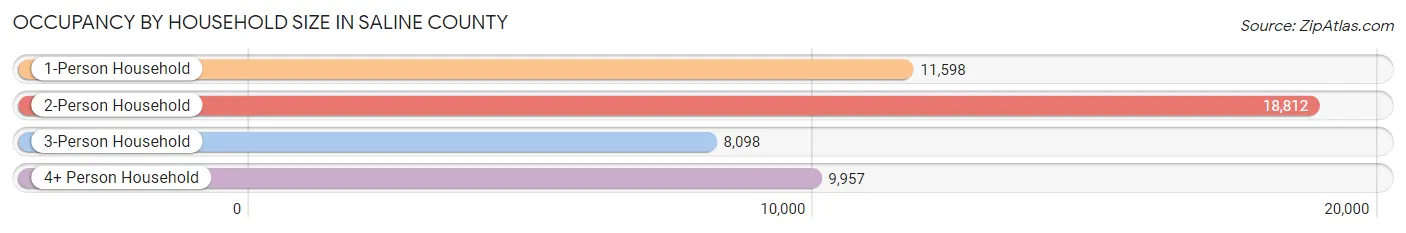
| Household Size | # Housing Units | % Housing Units |
| 1-Person Household | 11,598 | 23.9% |
| 2-Person Household | 18,812 | 38.8% |
| 3-Person Household | 8,098 | 16.7% |
| 4+ Person Household | 9,957 | 20.5% |
| Total Housing Units | 48,465 | 100.0% |
Occupancy by Ownership by Household Size in Saline County
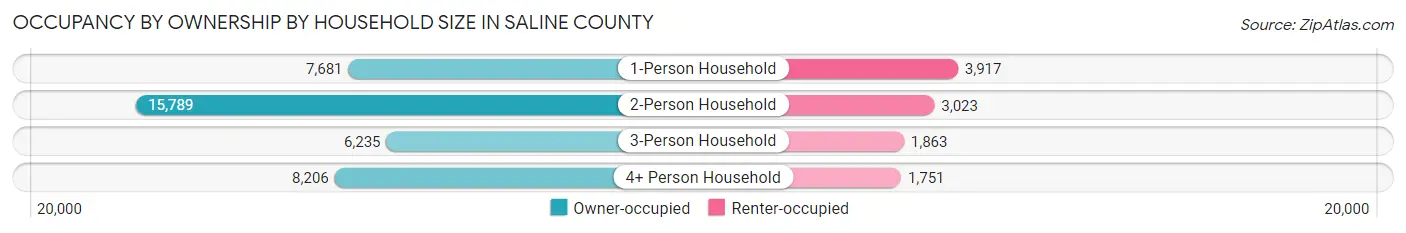
| Household Size | Owner-occupied | Renter-occupied |
| 1-Person Household | 7,681 (66.2%) | 3,917 (33.8%) |
| 2-Person Household | 15,789 (83.9%) | 3,023 (16.1%) |
| 3-Person Household | 6,235 (77.0%) | 1,863 (23.0%) |
| 4+ Person Household | 8,206 (82.4%) | 1,751 (17.6%) |
| Total Housing Units | 37,911 (78.2%) | 10,554 (21.8%) |
Occupancy by Educational Attainment in Saline County
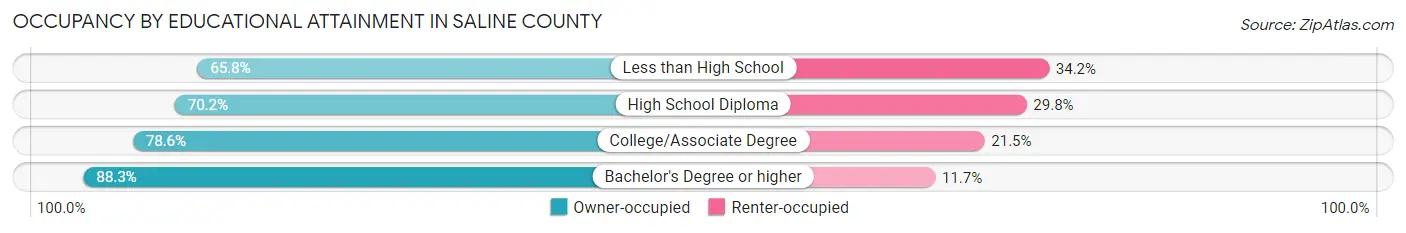
| Household Size | Owner-occupied | Renter-occupied |
| Less than High School | 2,437 (65.8%) | 1,269 (34.2%) |
| High School Diploma | 9,131 (70.2%) | 3,875 (29.8%) |
| College/Associate Degree | 13,683 (78.5%) | 3,737 (21.4%) |
| Bachelor's Degree or higher | 12,660 (88.3%) | 1,673 (11.7%) |
Occupancy by Age of Householder in Saline County
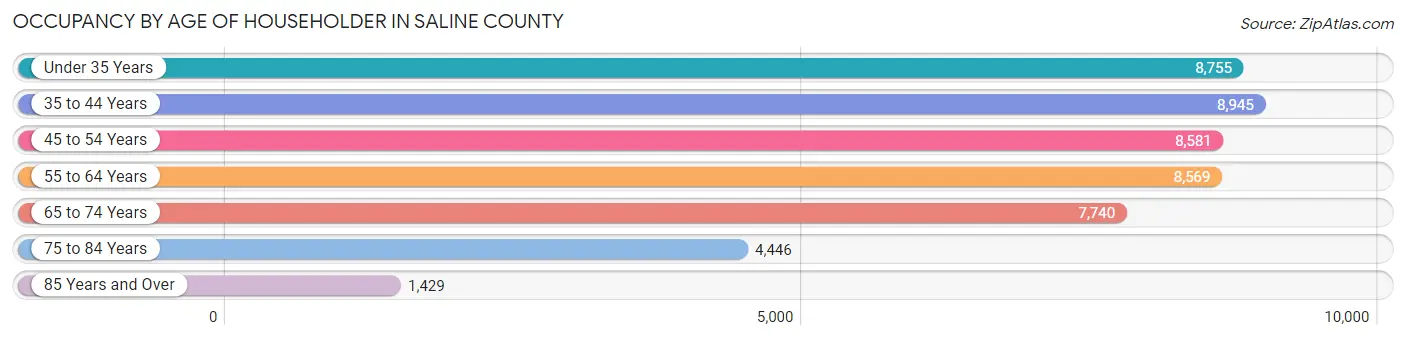
| Age Bracket | # Households | % Households |
| Under 35 Years | 8,755 | 18.1% |
| 35 to 44 Years | 8,945 | 18.5% |
| 45 to 54 Years | 8,581 | 17.7% |
| 55 to 64 Years | 8,569 | 17.7% |
| 65 to 74 Years | 7,740 | 16.0% |
| 75 to 84 Years | 4,446 | 9.2% |
| 85 Years and Over | 1,429 | 2.9% |
| Total | 48,465 | 100.0% |
Housing Finances in Saline County
Median Income by Occupancy in Saline County
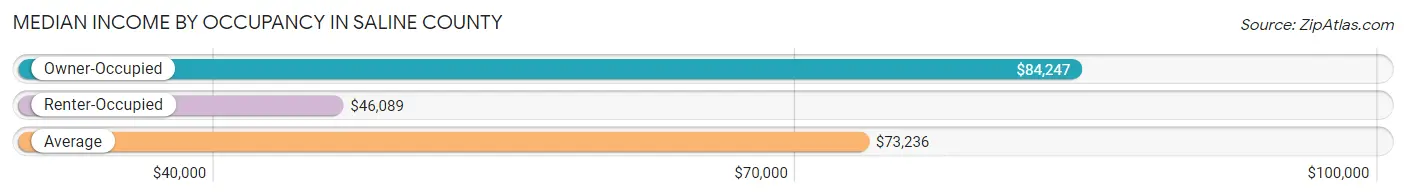
| Occupancy Type | # Households | Median Income |
| Owner-Occupied | 37,911 (78.2%) | $84,247 |
| Renter-Occupied | 10,554 (21.8%) | $46,089 |
| Average | 48,465 (100.0%) | $73,236 |
Occupancy by Householder Income Bracket in Saline County
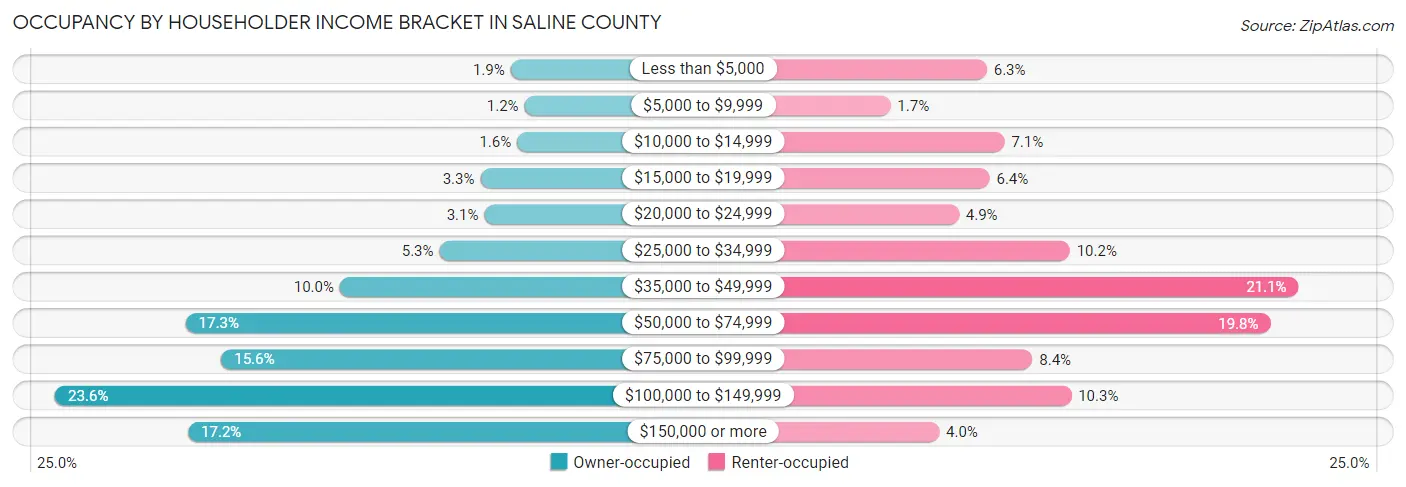
| Income Bracket | Owner-occupied | Renter-occupied |
| Less than $5,000 | 707 (1.9%) | 660 (6.2%) |
| $5,000 to $9,999 | 454 (1.2%) | 175 (1.7%) |
| $10,000 to $14,999 | 588 (1.5%) | 748 (7.1%) |
| $15,000 to $19,999 | 1,252 (3.3%) | 673 (6.4%) |
| $20,000 to $24,999 | 1,179 (3.1%) | 519 (4.9%) |
| $25,000 to $34,999 | 1,991 (5.2%) | 1,076 (10.2%) |
| $35,000 to $49,999 | 3,787 (10.0%) | 2,226 (21.1%) |
| $50,000 to $74,999 | 6,570 (17.3%) | 2,084 (19.8%) |
| $75,000 to $99,999 | 5,927 (15.6%) | 889 (8.4%) |
| $100,000 to $149,999 | 8,929 (23.5%) | 1,084 (10.3%) |
| $150,000 or more | 6,527 (17.2%) | 420 (4.0%) |
| Total | 37,911 (100.0%) | 10,554 (100.0%) |
Monthly Housing Cost Tiers in Saline County
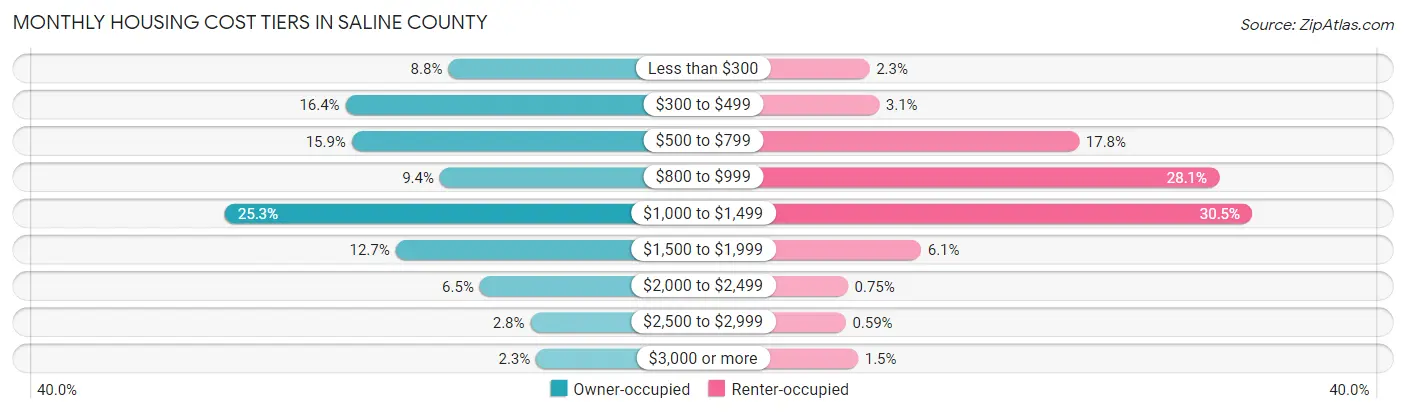
| Monthly Cost | Owner-occupied | Renter-occupied |
| Less than $300 | 3,336 (8.8%) | 247 (2.3%) |
| $300 to $499 | 6,207 (16.4%) | 322 (3.0%) |
| $500 to $799 | 6,032 (15.9%) | 1,877 (17.8%) |
| $800 to $999 | 3,573 (9.4%) | 2,965 (28.1%) |
| $1,000 to $1,499 | 9,573 (25.3%) | 3,221 (30.5%) |
| $1,500 to $1,999 | 4,808 (12.7%) | 648 (6.1%) |
| $2,000 to $2,499 | 2,457 (6.5%) | 79 (0.7%) |
| $2,500 to $2,999 | 1,043 (2.8%) | 62 (0.6%) |
| $3,000 or more | 882 (2.3%) | 158 (1.5%) |
| Total | 37,911 (100.0%) | 10,554 (100.0%) |
Physical Housing Characteristics in Saline County
Housing Structures in Saline County
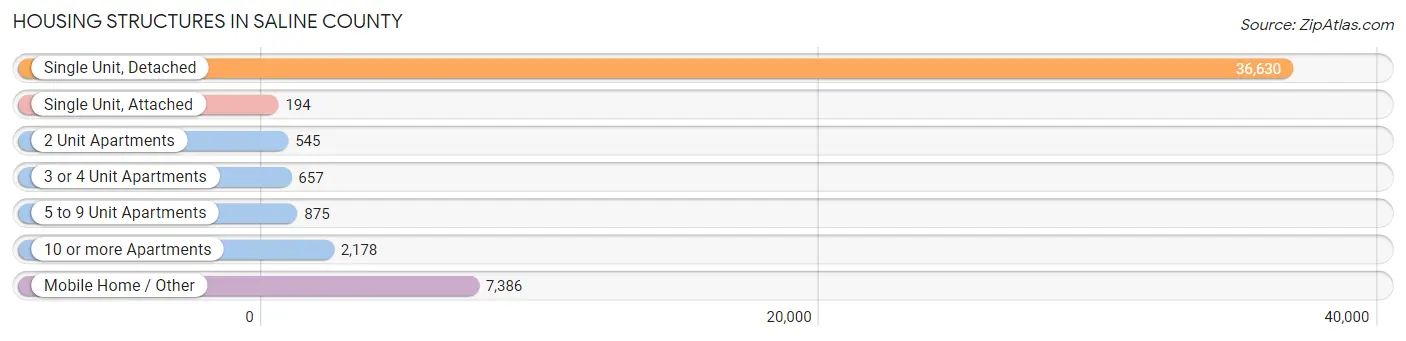
| Structure Type | # Housing Units | % Housing Units |
| Single Unit, Detached | 36,630 | 75.6% |
| Single Unit, Attached | 194 | 0.4% |
| 2 Unit Apartments | 545 | 1.1% |
| 3 or 4 Unit Apartments | 657 | 1.4% |
| 5 to 9 Unit Apartments | 875 | 1.8% |
| 10 or more Apartments | 2,178 | 4.5% |
| Mobile Home / Other | 7,386 | 15.2% |
| Total | 48,465 | 100.0% |
Housing Structures by Occupancy in Saline County
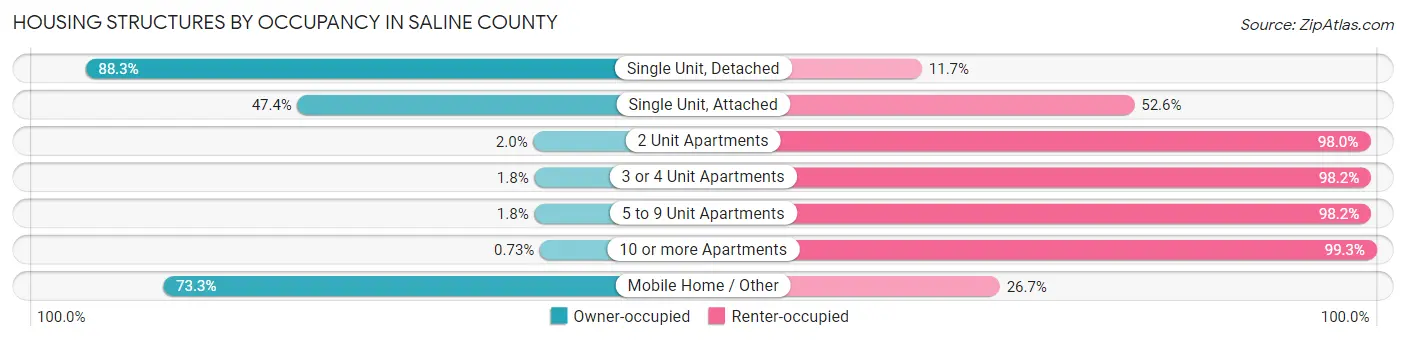
| Structure Type | Owner-occupied | Renter-occupied |
| Single Unit, Detached | 32,348 (88.3%) | 4,282 (11.7%) |
| Single Unit, Attached | 92 (47.4%) | 102 (52.6%) |
| 2 Unit Apartments | 11 (2.0%) | 534 (98.0%) |
| 3 or 4 Unit Apartments | 12 (1.8%) | 645 (98.2%) |
| 5 to 9 Unit Apartments | 16 (1.8%) | 859 (98.2%) |
| 10 or more Apartments | 16 (0.7%) | 2,162 (99.3%) |
| Mobile Home / Other | 5,416 (73.3%) | 1,970 (26.7%) |
| Total | 37,911 (78.2%) | 10,554 (21.8%) |
Housing Structures by Number of Rooms in Saline County
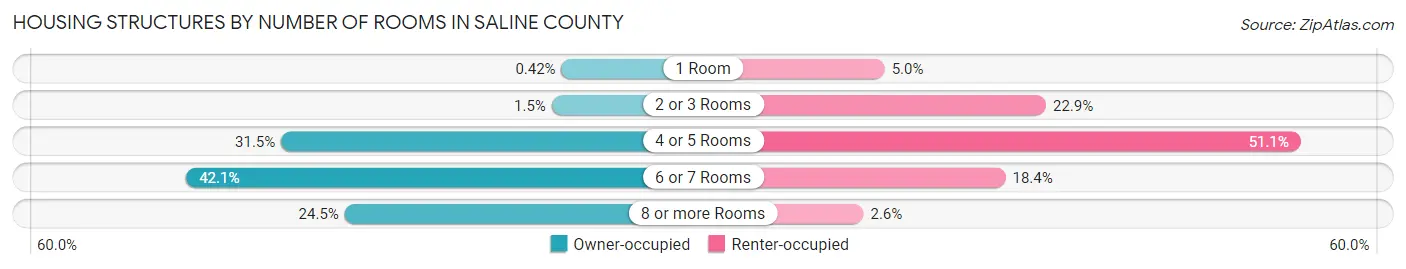
| Number of Rooms | Owner-occupied | Renter-occupied |
| 1 Room | 159 (0.4%) | 525 (5.0%) |
| 2 or 3 Rooms | 570 (1.5%) | 2,415 (22.9%) |
| 4 or 5 Rooms | 11,953 (31.5%) | 5,397 (51.1%) |
| 6 or 7 Rooms | 15,947 (42.1%) | 1,940 (18.4%) |
| 8 or more Rooms | 9,282 (24.5%) | 277 (2.6%) |
| Total | 37,911 (100.0%) | 10,554 (100.0%) |
Housing Structure by Heating Type in Saline County
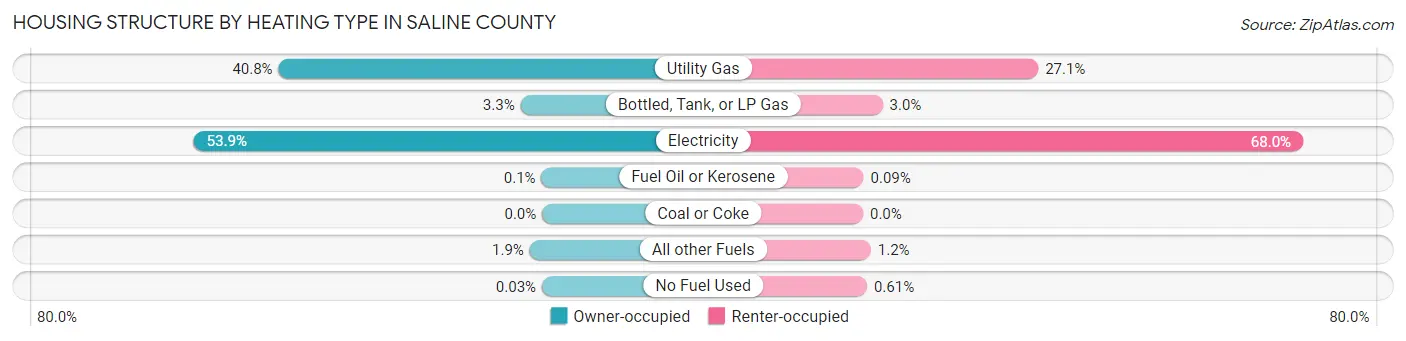
| Heating Type | Owner-occupied | Renter-occupied |
| Utility Gas | 15,454 (40.8%) | 2,858 (27.1%) |
| Bottled, Tank, or LP Gas | 1,266 (3.3%) | 319 (3.0%) |
| Electricity | 20,417 (53.9%) | 7,176 (68.0%) |
| Fuel Oil or Kerosene | 37 (0.1%) | 9 (0.1%) |
| Coal or Coke | 0 (0.0%) | 0 (0.0%) |
| All other Fuels | 726 (1.9%) | 128 (1.2%) |
| No Fuel Used | 11 (0.0%) | 64 (0.6%) |
| Total | 37,911 (100.0%) | 10,554 (100.0%) |
Household Vehicle Usage in Saline County
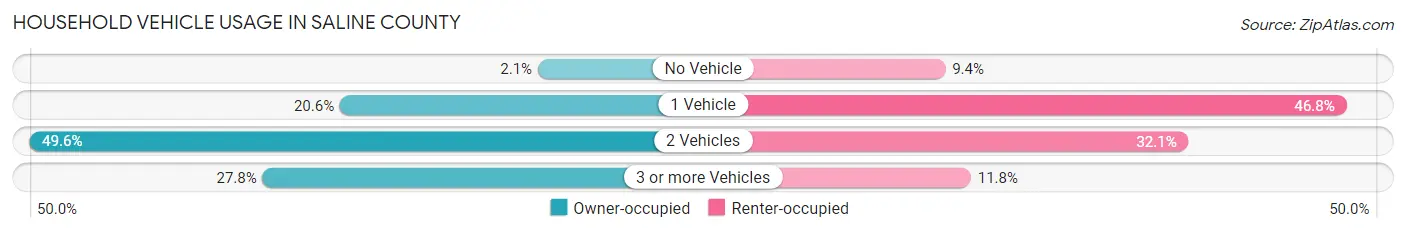
| Vehicles per Household | Owner-occupied | Renter-occupied |
| No Vehicle | 787 (2.1%) | 988 (9.4%) |
| 1 Vehicle | 7,796 (20.6%) | 4,941 (46.8%) |
| 2 Vehicles | 18,792 (49.6%) | 3,385 (32.1%) |
| 3 or more Vehicles | 10,536 (27.8%) | 1,240 (11.7%) |
| Total | 37,911 (100.0%) | 10,554 (100.0%) |
Real Estate & Mortgages in Saline County
Real Estate and Mortgage Overview in Saline County
| Characteristic | Without Mortgage | With Mortgage |
| Housing Units | 14,842 | 23,069 |
| Median Property Value | $180,000 | $203,800 |
| Median Household Income | $66,517 | $4,826 |
| Monthly Housing Costs | $435 | $759 |
| Real Estate Taxes | $1,146 | $888 |
Property Value by Mortgage Status in Saline County
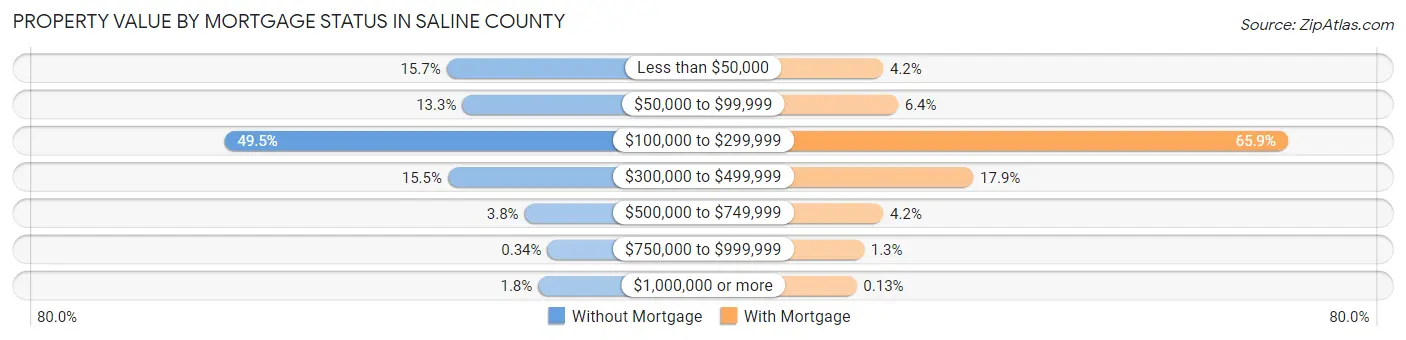
| Property Value | Without Mortgage | With Mortgage |
| Less than $50,000 | 2,332 (15.7%) | 967 (4.2%) |
| $50,000 to $99,999 | 1,975 (13.3%) | 1,486 (6.4%) |
| $100,000 to $299,999 | 7,353 (49.5%) | 15,195 (65.9%) |
| $300,000 to $499,999 | 2,302 (15.5%) | 4,133 (17.9%) |
| $500,000 to $749,999 | 570 (3.8%) | 971 (4.2%) |
| $750,000 to $999,999 | 51 (0.3%) | 288 (1.3%) |
| $1,000,000 or more | 259 (1.8%) | 29 (0.1%) |
| Total | 14,842 (100.0%) | 23,069 (100.0%) |
Household Income by Mortgage Status in Saline County
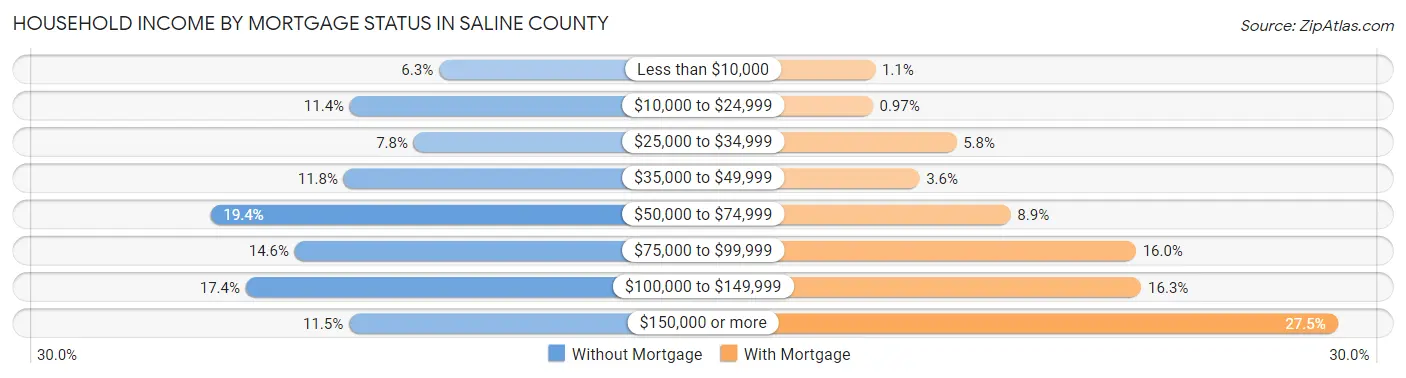
| Household Income | Without Mortgage | With Mortgage |
| Less than $10,000 | 938 (6.3%) | 256 (1.1%) |
| $10,000 to $24,999 | 1,693 (11.4%) | 223 (1.0%) |
| $25,000 to $34,999 | 1,152 (7.8%) | 1,326 (5.8%) |
| $35,000 to $49,999 | 1,745 (11.8%) | 839 (3.6%) |
| $50,000 to $74,999 | 2,876 (19.4%) | 2,042 (8.8%) |
| $75,000 to $99,999 | 2,161 (14.6%) | 3,694 (16.0%) |
| $100,000 to $149,999 | 2,576 (17.4%) | 3,766 (16.3%) |
| $150,000 or more | 1,701 (11.5%) | 6,353 (27.5%) |
| Total | 14,842 (100.0%) | 23,069 (100.0%) |
Property Value to Household Income Ratio in Saline County
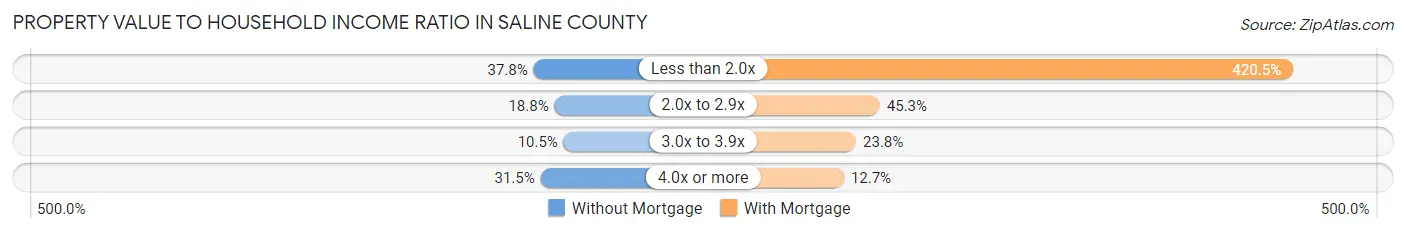
| Value-to-Income Ratio | Without Mortgage | With Mortgage |
| Less than 2.0x | 5,615 (37.8%) | 97,014 (420.5%) |
| 2.0x to 2.9x | 2,795 (18.8%) | 10,449 (45.3%) |
| 3.0x to 3.9x | 1,554 (10.5%) | 5,491 (23.8%) |
| 4.0x or more | 4,680 (31.5%) | 2,938 (12.7%) |
| Total | 14,842 (100.0%) | 23,069 (100.0%) |
Real Estate Taxes by Mortgage Status in Saline County
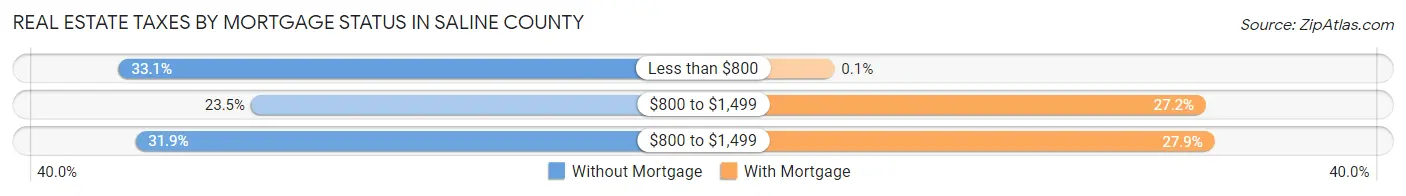
| Property Taxes | Without Mortgage | With Mortgage |
| Less than $800 | 4,917 (33.1%) | 24 (0.1%) |
| $800 to $1,499 | 3,483 (23.5%) | 6,285 (27.2%) |
| $800 to $1,499 | 4,736 (31.9%) | 6,429 (27.9%) |
| Total | 14,842 (100.0%) | 23,069 (100.0%) |
Health & Disability in Saline County
Health Insurance Coverage by Age in Saline County
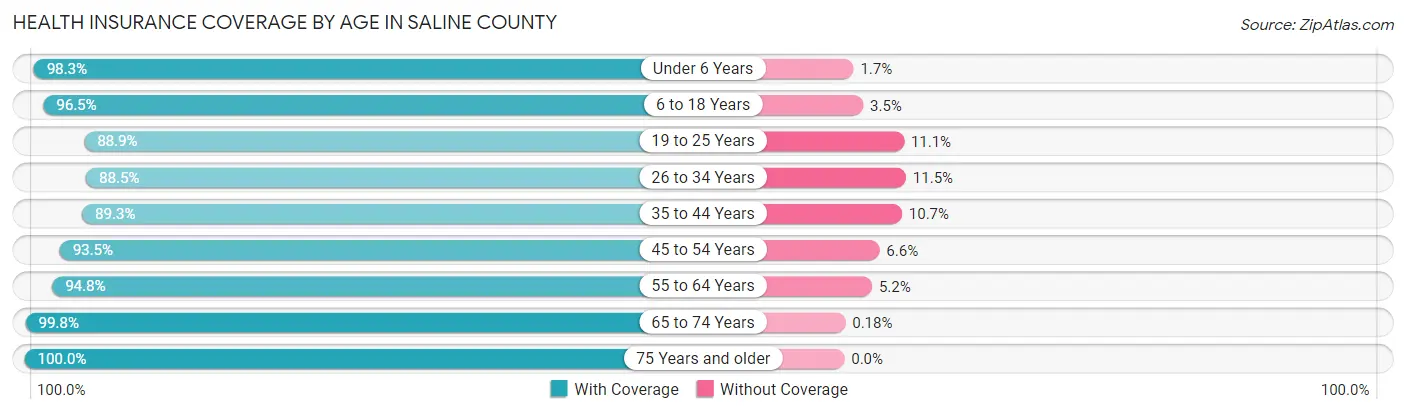
| Age Bracket | With Coverage | Without Coverage |
| Under 6 Years | 8,425 (98.3%) | 147 (1.7%) |
| 6 to 18 Years | 20,804 (96.5%) | 756 (3.5%) |
| 19 to 25 Years | 7,842 (88.9%) | 981 (11.1%) |
| 26 to 34 Years | 12,459 (88.5%) | 1,617 (11.5%) |
| 35 to 44 Years | 14,817 (89.3%) | 1,781 (10.7%) |
| 45 to 54 Years | 14,435 (93.4%) | 1,012 (6.6%) |
| 55 to 64 Years | 14,568 (94.8%) | 793 (5.2%) |
| 65 to 74 Years | 12,877 (99.8%) | 23 (0.2%) |
| 75 Years and older | 9,352 (100.0%) | 0 (0.0%) |
| Total | 115,579 (94.2%) | 7,110 (5.8%) |
Health Insurance Coverage by Citizenship Status in Saline County
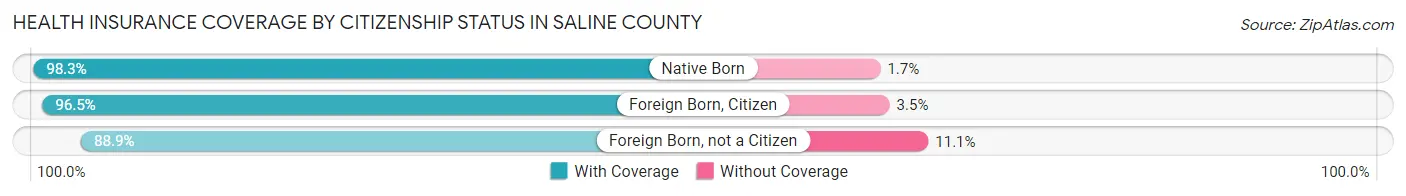
| Citizenship Status | With Coverage | Without Coverage |
| Native Born | 8,425 (98.3%) | 147 (1.7%) |
| Foreign Born, Citizen | 20,804 (96.5%) | 756 (3.5%) |
| Foreign Born, not a Citizen | 7,842 (88.9%) | 981 (11.1%) |
Health Insurance Coverage by Household Income in Saline County
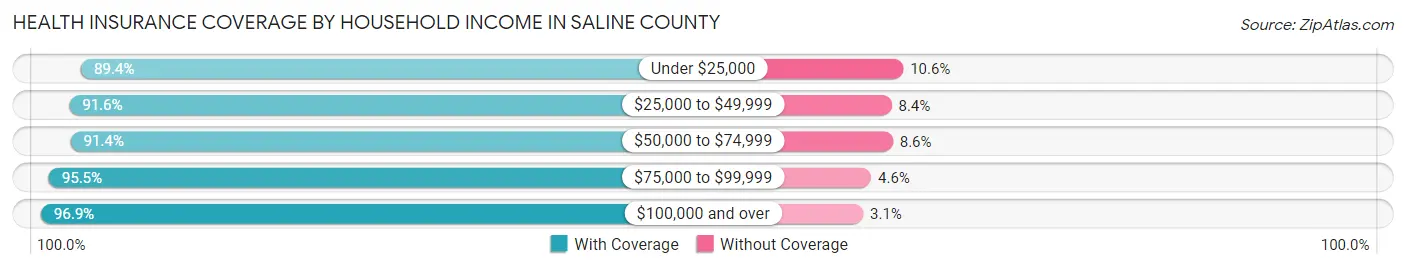
| Household Income | With Coverage | Without Coverage |
| Under $25,000 | 10,555 (89.4%) | 1,248 (10.6%) |
| $25,000 to $49,999 | 17,362 (91.6%) | 1,589 (8.4%) |
| $50,000 to $74,999 | 19,217 (91.4%) | 1,812 (8.6%) |
| $75,000 to $99,999 | 18,309 (95.5%) | 873 (4.5%) |
| $100,000 and over | 49,989 (96.9%) | 1,580 (3.1%) |
Public vs Private Health Insurance Coverage by Age in Saline County
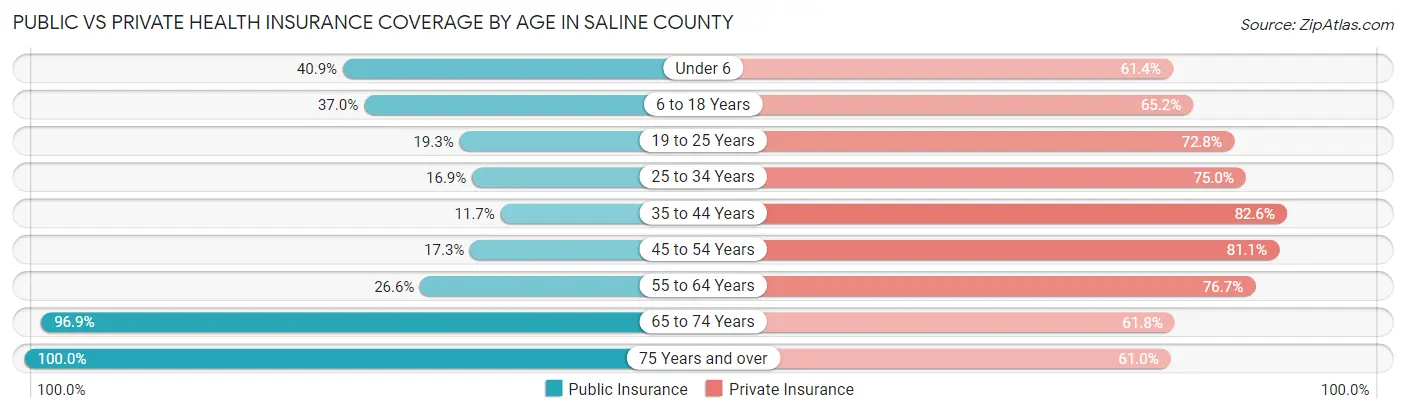
| Age Bracket | Public Insurance | Private Insurance |
| Under 6 | 3,508 (40.9%) | 5,266 (61.4%) |
| 6 to 18 Years | 7,980 (37.0%) | 14,053 (65.2%) |
| 19 to 25 Years | 1,701 (19.3%) | 6,420 (72.8%) |
| 25 to 34 Years | 2,385 (16.9%) | 10,553 (75.0%) |
| 35 to 44 Years | 1,934 (11.7%) | 13,706 (82.6%) |
| 45 to 54 Years | 2,673 (17.3%) | 12,529 (81.1%) |
| 55 to 64 Years | 4,082 (26.6%) | 11,781 (76.7%) |
| 65 to 74 Years | 12,502 (96.9%) | 7,970 (61.8%) |
| 75 Years and over | 9,352 (100.0%) | 5,706 (61.0%) |
| Total | 46,117 (37.6%) | 87,984 (71.7%) |
Disability Status by Sex by Age in Saline County
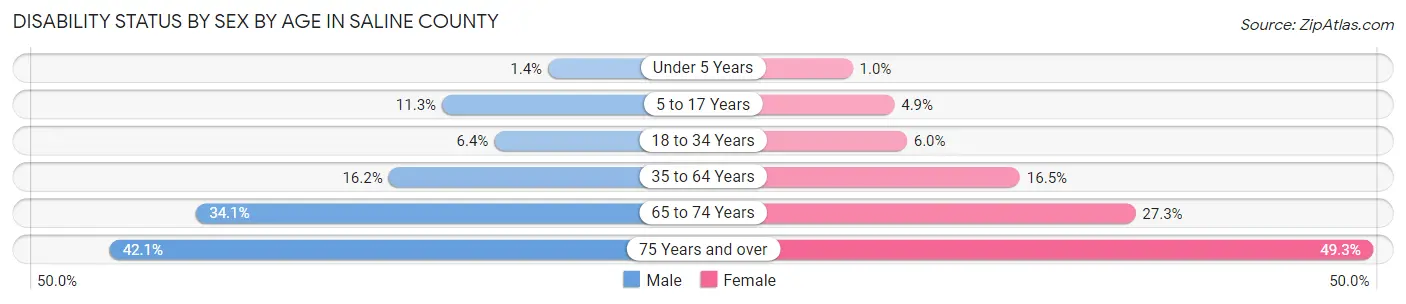
| Age Bracket | Male | Female |
| Under 5 Years | 50 (1.4%) | 35 (1.0%) |
| 5 to 17 Years | 1,220 (11.3%) | 520 (4.9%) |
| 18 to 34 Years | 765 (6.4%) | 760 (6.0%) |
| 35 to 64 Years | 3,796 (16.2%) | 3,970 (16.5%) |
| 65 to 74 Years | 2,041 (34.1%) | 1,882 (27.3%) |
| 75 Years and over | 1,734 (42.1%) | 2,577 (49.2%) |
Disability Class by Sex by Age in Saline County
Disability Class: Hearing Difficulty
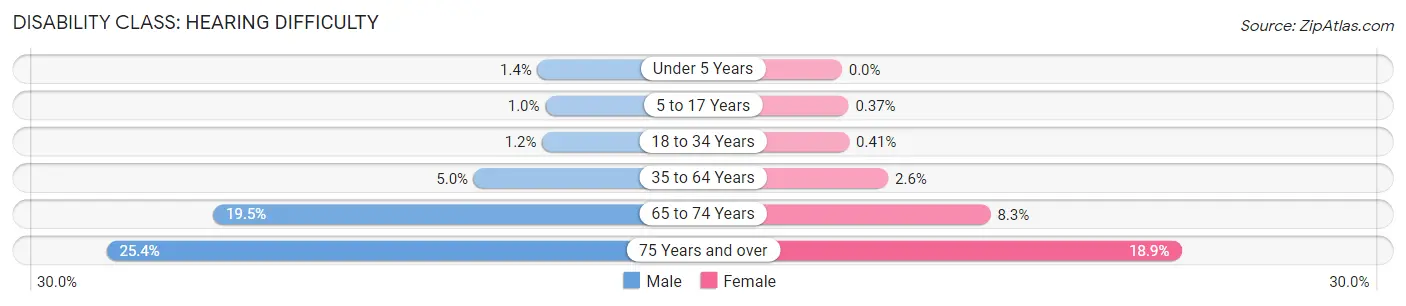
| Age Bracket | Male | Female |
| Under 5 Years | 50 (1.4%) | 0 (0.0%) |
| 5 to 17 Years | 108 (1.0%) | 39 (0.4%) |
| 18 to 34 Years | 139 (1.2%) | 52 (0.4%) |
| 35 to 64 Years | 1,164 (5.0%) | 619 (2.6%) |
| 65 to 74 Years | 1,169 (19.5%) | 572 (8.3%) |
| 75 Years and over | 1,048 (25.4%) | 989 (18.9%) |
Disability Class: Vision Difficulty
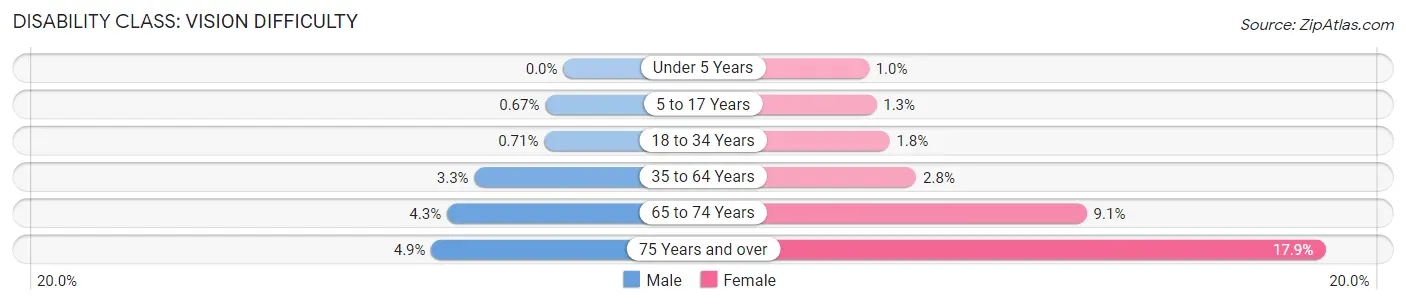
| Age Bracket | Male | Female |
| Under 5 Years | 0 (0.0%) | 35 (1.0%) |
| 5 to 17 Years | 72 (0.7%) | 137 (1.3%) |
| 18 to 34 Years | 84 (0.7%) | 223 (1.8%) |
| 35 to 64 Years | 772 (3.3%) | 663 (2.8%) |
| 65 to 74 Years | 259 (4.3%) | 628 (9.1%) |
| 75 Years and over | 202 (4.9%) | 939 (17.9%) |
Disability Class: Cognitive Difficulty
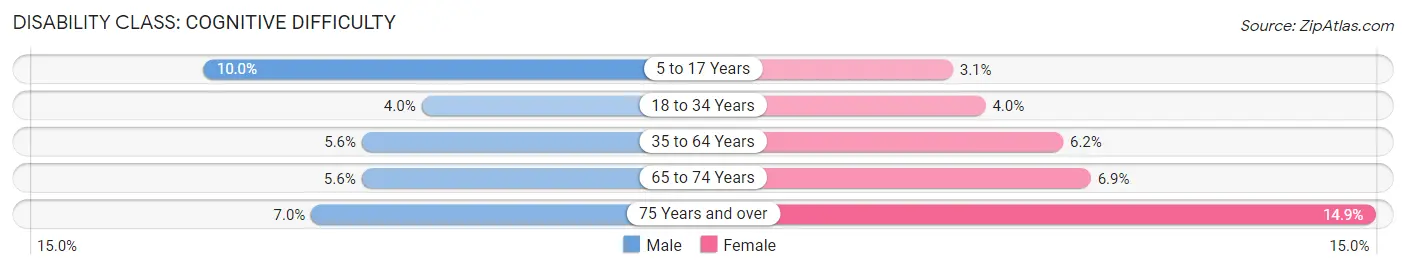
| Age Bracket | Male | Female |
| 5 to 17 Years | 1,084 (10.0%) | 330 (3.1%) |
| 18 to 34 Years | 471 (4.0%) | 505 (4.0%) |
| 35 to 64 Years | 1,312 (5.6%) | 1,478 (6.2%) |
| 65 to 74 Years | 337 (5.6%) | 479 (6.9%) |
| 75 Years and over | 289 (7.0%) | 777 (14.8%) |
Disability Class: Ambulatory Difficulty
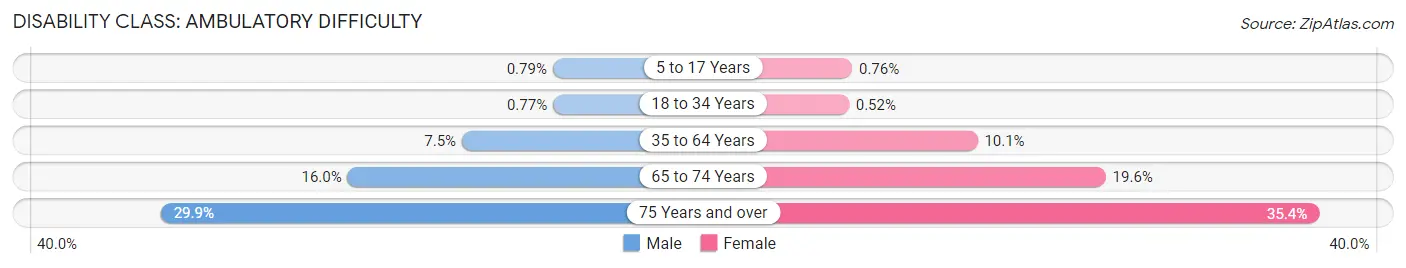
| Age Bracket | Male | Female |
| 5 to 17 Years | 85 (0.8%) | 81 (0.8%) |
| 18 to 34 Years | 92 (0.8%) | 65 (0.5%) |
| 35 to 64 Years | 1,761 (7.5%) | 2,417 (10.1%) |
| 65 to 74 Years | 960 (16.0%) | 1,353 (19.6%) |
| 75 Years and over | 1,231 (29.9%) | 1,854 (35.4%) |
Disability Class: Self-Care Difficulty
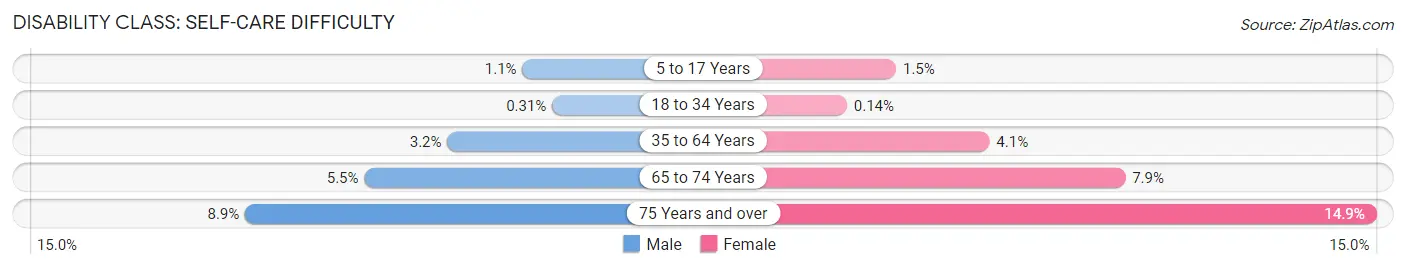
| Age Bracket | Male | Female |
| 5 to 17 Years | 123 (1.1%) | 161 (1.5%) |
| 18 to 34 Years | 37 (0.3%) | 18 (0.1%) |
| 35 to 64 Years | 756 (3.2%) | 988 (4.1%) |
| 65 to 74 Years | 332 (5.5%) | 545 (7.9%) |
| 75 Years and over | 365 (8.9%) | 779 (14.9%) |
Technology Access in Saline County
Computing Device Access in Saline County
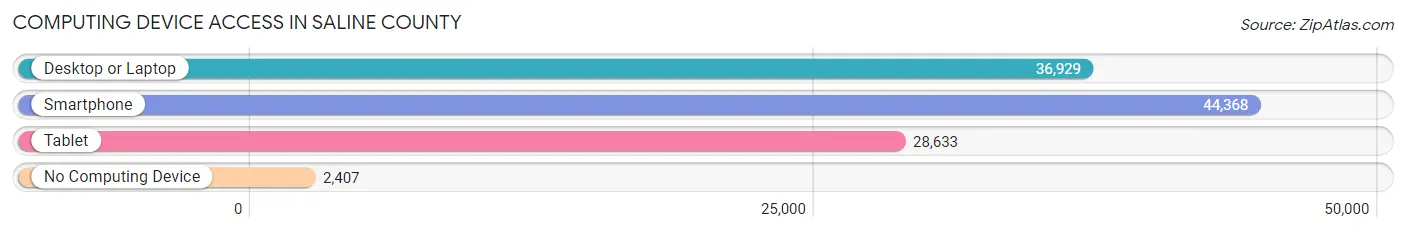
| Device Type | # Households | % Households |
| Desktop or Laptop | 36,929 | 76.2% |
| Smartphone | 44,368 | 91.5% |
| Tablet | 28,633 | 59.1% |
| No Computing Device | 2,407 | 5.0% |
| Total | 48,465 | 100.0% |
Internet Access in Saline County
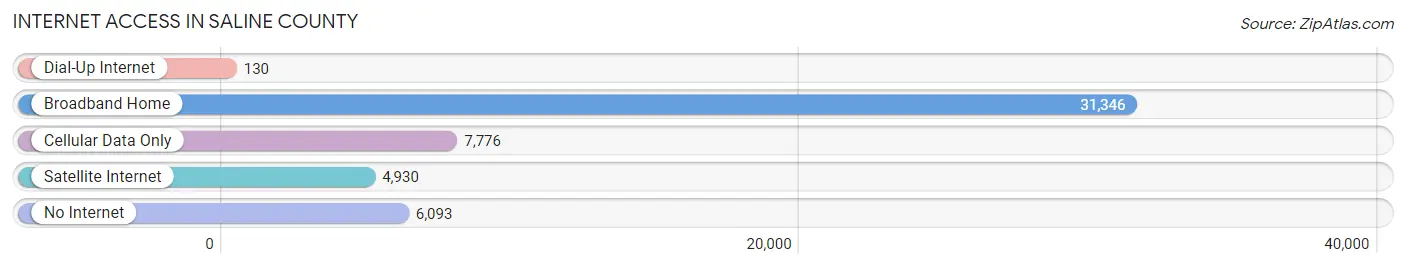
| Internet Type | # Households | % Households |
| Dial-Up Internet | 130 | 0.3% |
| Broadband Home | 31,346 | 64.7% |
| Cellular Data Only | 7,776 | 16.0% |
| Satellite Internet | 4,930 | 10.2% |
| No Internet | 6,093 | 12.6% |
| Total | 48,465 | 100.0% |
Saline County Summary
Saline County is located in the central part of Arkansas, and is part of the Little Rock-North Little Rock-Conway Metropolitan Statistical Area. The county is bordered by Pulaski County to the north, Grant County to the east, Hot Spring County to the south, and Garland County to the west. The county seat is Benton, and the largest city is Bryant.
History
Saline County was established in 1835, and was named for the salt springs that were located in the area. The county was originally part of Pulaski County, and was later divided into Saline and Pulaski counties. The first settlers in the area were Native Americans, who were followed by French and Spanish explorers. The first permanent settlers in the area were the Quapaw Indians, who were later joined by other tribes, including the Caddo, Osage, and Cherokee.
The county was an important part of the Civil War, as it was the site of the Battle of Jenkins Ferry in April 1864. The battle was a Confederate victory, and resulted in the Union forces retreating from the area.
Geography
Saline County is located in the Ouachita Mountains region of Arkansas, and is part of the Arkansas River Valley. The county is mostly flat, with some rolling hills in the northern and western parts of the county. The county is drained by the Saline River, which flows through the county from north to south. The county is also home to several lakes, including Lake Winona, Lake Norrell, and Lake Hamilton.
The county has a total area of 602 square miles, of which 599 square miles is land and 3 square miles is water. The county is located in the Central Time Zone, and the elevation ranges from 200 to 500 feet above sea level.
Economy
The economy of Saline County is largely based on agriculture, with the main crops being cotton, soybeans, corn, and wheat. The county is also home to several manufacturing companies, including Tyson Foods, which is the largest employer in the county. Other major employers in the county include Walmart, the University of Arkansas at Little Rock, and the Arkansas Department of Corrections.
The median household income in Saline County is $45,845, and the median home value is $133,400. The unemployment rate in the county is 4.2%, which is lower than the national average.
Demographics
As of the 2010 census, there were 107,118 people, 40,845 households, and 28,845 families living in Saline County. The population density was 178.3 people per square mile. The racial makeup of the county was 79.2% White, 15.3% Black or African American, 0.5% Native American, 1.3% Asian, 0.1% Pacific Islander, 1.7% from other races, and 2.0% from two or more races. Hispanic or Latino of any race were 4.2% of the population.
The median age in the county was 37.3 years, with 25.2% of the population under the age of 18, 8.3% between the ages of 18 and 24, 28.2% between the ages of 25 and 44, 24.7% between the ages of 45 and 64, and 13.6% who were 65 years of age or older. The gender makeup of the county was 48.7% male and 51.3% female.
The median income for a household in the county was $45,845, and the median income for a family was $54,845. The per capita income for the county was $22,845. About 11.2% of the population was below the poverty line.
Common Questions
What is Per Capita Income in Saline County?
Per Capita income in Saline County is $36,151.
What is the Median Family Income in Saline County?
Median Family Income in Saline County is $89,404.
What is the Median Household income in Saline County?
Median Household Income in Saline County is $73,236.
What is Income or Wage Gap in Saline County?
Income or Wage Gap in Saline County is 22.2%.
Women in Saline County earn 77.8 cents for every dollar earned by a man.
What is Family Income Deficit in Saline County?
Family Income Deficit in Saline County is $11,026.
Families that are below poverty line in Saline County earn $11,026 less on average than the poverty threshold level.
What is Inequality or Gini Index in Saline County?
Inequality or Gini Index in Saline County is 0.41.
What is the Total Population of Saline County?
Total Population of Saline County is 123,988.
What is the Total Male Population of Saline County?
Total Male Population of Saline County is 60,702.
What is the Total Female Population of Saline County?
Total Female Population of Saline County is 63,286.
What is the Ratio of Males per 100 Females in Saline County?
There are 95.92 Males per 100 Females in Saline County.
What is the Ratio of Females per 100 Males in Saline County?
There are 104.26 Females per 100 Males in Saline County.
What is the Median Population Age in Saline County?
Median Population Age in Saline County is 40.3 Years.
What is the Average Family Size in Saline County
Average Family Size in Saline County is 3.0 People.
What is the Average Household Size in Saline County
Average Household Size in Saline County is 2.5 People.
How Large is the Labor Force in Saline County?
There are 61,690 People in the Labor Forcein in Saline County.
What is the Percentage of People in the Labor Force in Saline County?
62.5% of People are in the Labor Force in Saline County.
What is the Unemployment Rate in Saline County?
Unemployment Rate in Saline County is 3.8%.