Faulkner County, AR Map & Demographics
Faulkner County Map
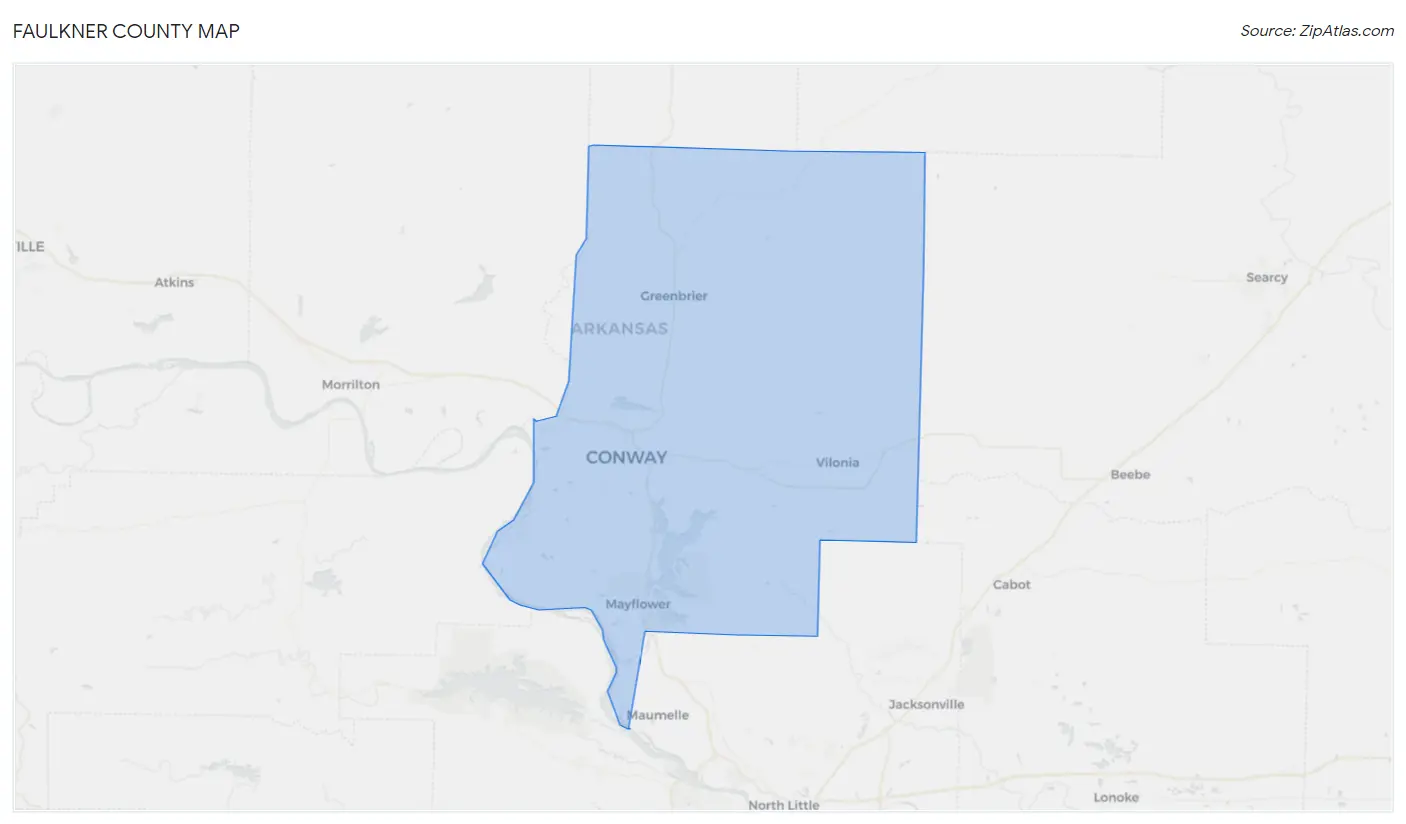
Faulkner County Overview
$31,301
PER CAPITA INCOME
$79,614
AVG FAMILY INCOME
$61,273
AVG HOUSEHOLD INCOME
26.7%
WAGE / INCOME GAP [ % ]
73.3¢/ $1
WAGE / INCOME GAP [ $ ]
$10,226
FAMILY INCOME DEFICIT
0.46
INEQUALITY / GINI INDEX
124,611
TOTAL POPULATION
60,844
MALE POPULATION
63,767
FEMALE POPULATION
95.42
MALES / 100 FEMALES
104.80
FEMALES / 100 MALES
33.8
MEDIAN AGE
3.1
AVG FAMILY SIZE
2.5
AVG HOUSEHOLD SIZE
60,792
LABOR FORCE [ PEOPLE ]
61.1%
PERCENT IN LABOR FORCE
3.3%
UNEMPLOYMENT RATE
Faulkner County Area Codes
Income in Faulkner County
Income Overview in Faulkner County
Per Capita Income in Faulkner County is $31,301, while median incomes of families and households are $79,614 and $61,273 respectively.
| Characteristic | Number | Measure |
| Per Capita Income | 124,611 | $31,301 |
| Median Family Income | 30,760 | $79,614 |
| Mean Family Income | 30,760 | $99,352 |
| Median Household Income | 47,396 | $61,273 |
| Mean Household Income | 47,396 | $80,941 |
| Income Deficit | 30,760 | $10,226 |
| Wage / Income Gap (%) | 124,611 | 26.71% |
| Wage / Income Gap ($) | 124,611 | 73.29¢ per $1 |
| Gini / Inequality Index | 124,611 | 0.46 |
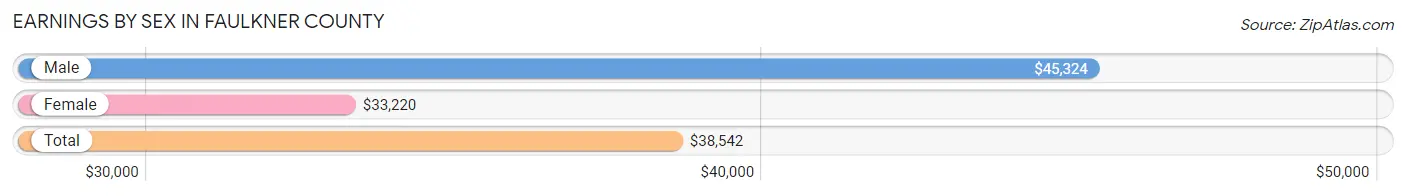
Earnings by Sex in Faulkner County
Average Earnings in Faulkner County are $38,542, $45,324 for men and $33,220 for women, a difference of 26.7%.
| Sex | Number | Average Earnings |
| Male | 33,099 (51.9%) | $45,324 |
| Female | 30,620 (48.0%) | $33,220 |
| Total | 63,719 (100.0%) | $38,542 |
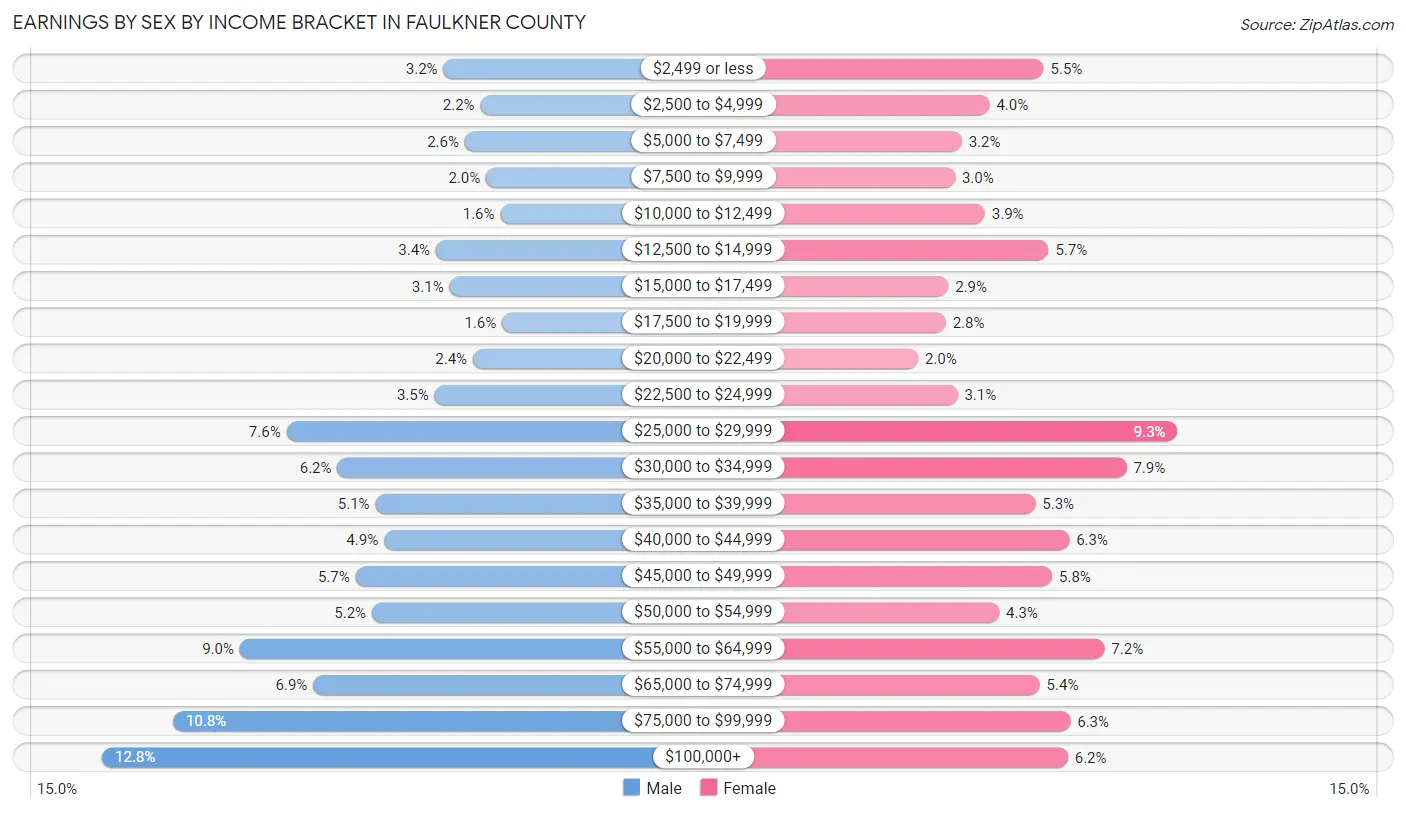
Earnings by Sex by Income Bracket in Faulkner County
The most common earnings brackets in Faulkner County are $100,000+ for men (4,242 | 12.8%) and $25,000 to $29,999 for women (2,846 | 9.3%).
| Income | Male | Female |
| $2,499 or less | 1,068 (3.2%) | 1,692 (5.5%) |
| $2,500 to $4,999 | 726 (2.2%) | 1,228 (4.0%) |
| $5,000 to $7,499 | 869 (2.6%) | 990 (3.2%) |
| $7,500 to $9,999 | 673 (2.0%) | 930 (3.0%) |
| $10,000 to $12,499 | 540 (1.6%) | 1,187 (3.9%) |
| $12,500 to $14,999 | 1,139 (3.4%) | 1,737 (5.7%) |
| $15,000 to $17,499 | 1,012 (3.1%) | 873 (2.9%) |
| $17,500 to $19,999 | 523 (1.6%) | 852 (2.8%) |
| $20,000 to $22,499 | 796 (2.4%) | 611 (2.0%) |
| $22,500 to $24,999 | 1,151 (3.5%) | 951 (3.1%) |
| $25,000 to $29,999 | 2,530 (7.6%) | 2,846 (9.3%) |
| $30,000 to $34,999 | 2,057 (6.2%) | 2,407 (7.9%) |
| $35,000 to $39,999 | 1,702 (5.1%) | 1,624 (5.3%) |
| $40,000 to $44,999 | 1,621 (4.9%) | 1,913 (6.2%) |
| $45,000 to $49,999 | 1,885 (5.7%) | 1,768 (5.8%) |
| $50,000 to $54,999 | 1,736 (5.2%) | 1,311 (4.3%) |
| $55,000 to $64,999 | 2,962 (8.9%) | 2,216 (7.2%) |
| $65,000 to $74,999 | 2,281 (6.9%) | 1,661 (5.4%) |
| $75,000 to $99,999 | 3,586 (10.8%) | 1,923 (6.3%) |
| $100,000+ | 4,242 (12.8%) | 1,900 (6.2%) |
| Total | 33,099 (100.0%) | 30,620 (100.0%) |
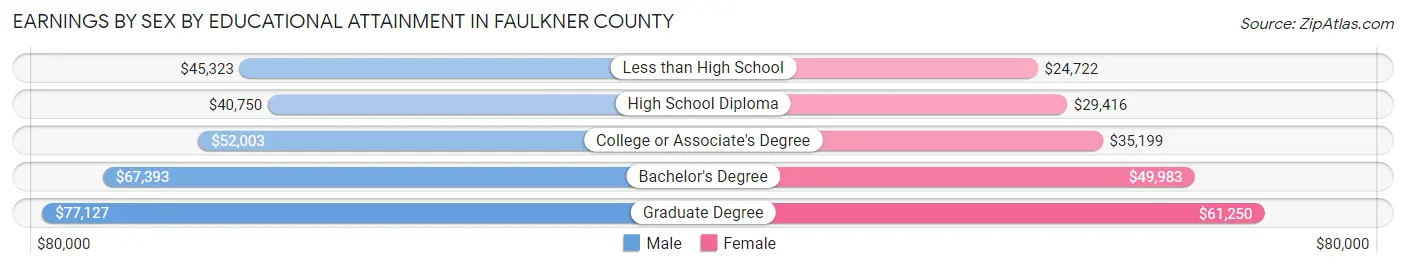
Earnings by Sex by Educational Attainment in Faulkner County
Average earnings in Faulkner County are $53,037 for men and $40,149 for women, a difference of 24.3%. Men with an educational attainment of graduate degree enjoy the highest average annual earnings of $77,127, while those with high school diploma education earn the least with $40,750. Women with an educational attainment of graduate degree earn the most with the average annual earnings of $61,250, while those with less than high school education have the smallest earnings of $24,722.
| Educational Attainment | Male Income | Female Income |
| Less than High School | $45,323 | $24,722 |
| High School Diploma | $40,750 | $29,416 |
| College or Associate's Degree | $52,003 | $35,199 |
| Bachelor's Degree | $67,393 | $49,983 |
| Graduate Degree | $77,127 | $61,250 |
| Total | $53,037 | $40,149 |
Family Income in Faulkner County
Family Income Brackets in Faulkner County
According to the Faulkner County family income data, there are 6,398 families falling into the $100,000 to $149,999 income range, which is the most common income bracket and makes up 20.8% of all families. Conversely, the $10,000 to $14,999 income bracket is the least frequent group with only 800 families (2.6%) belonging to this category.
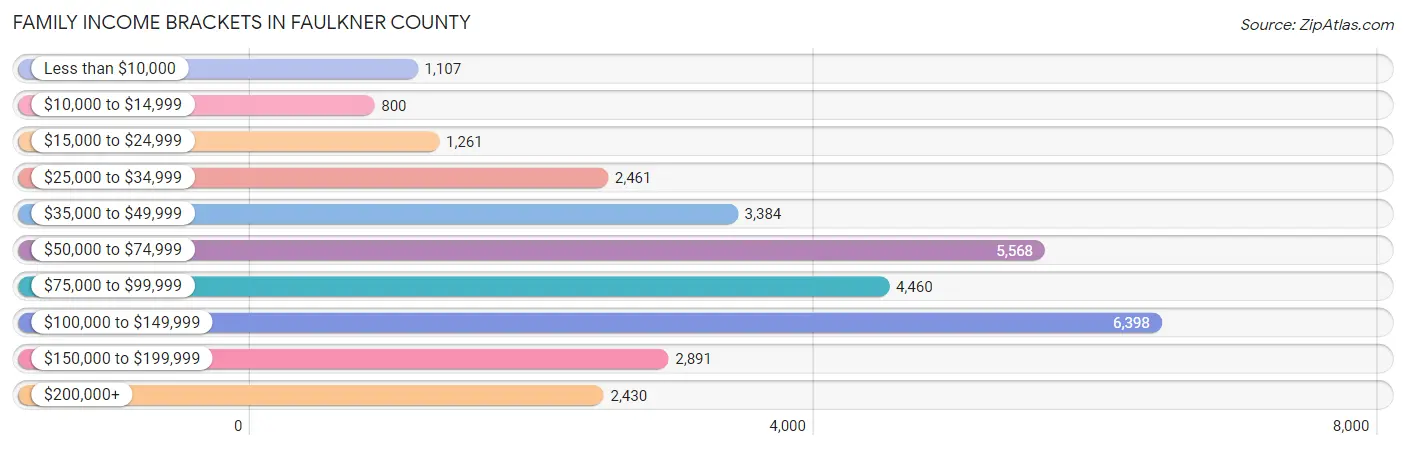
| Income Bracket | # Families | % Families |
| Less than $10,000 | 1,107 | 3.6% |
| $10,000 to $14,999 | 800 | 2.6% |
| $15,000 to $24,999 | 1,261 | 4.1% |
| $25,000 to $34,999 | 2,461 | 8.0% |
| $35,000 to $49,999 | 3,384 | 11.0% |
| $50,000 to $74,999 | 5,568 | 18.1% |
| $75,000 to $99,999 | 4,460 | 14.5% |
| $100,000 to $149,999 | 6,398 | 20.8% |
| $150,000 to $199,999 | 2,891 | 9.4% |
| $200,000+ | 2,430 | 7.9% |
Family Income by Famaliy Size in Faulkner County
7+ person families (371 | 1.2%) account for the highest median family income in Faulkner County with $104,650 per family, while 2-person families (14,785 | 48.1%) have the highest median income of $33,886 per family member.
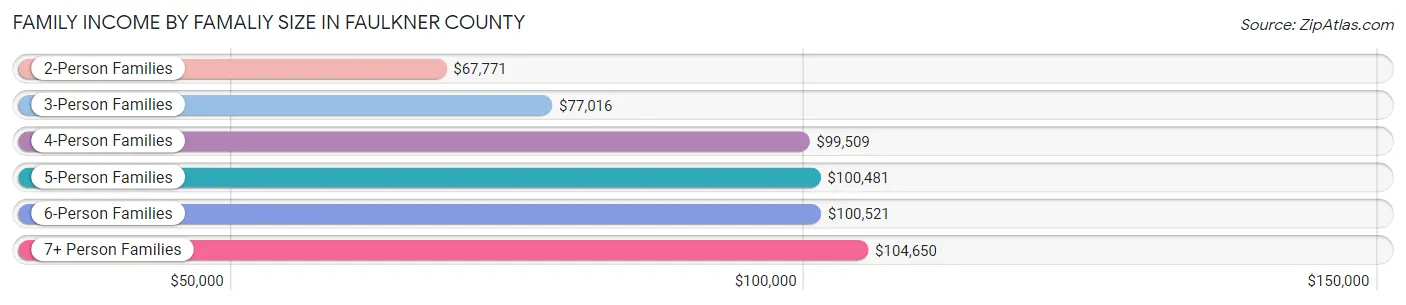
| Income Bracket | # Families | Median Income |
| 2-Person Families | 14,785 (48.1%) | $67,771 |
| 3-Person Families | 5,944 (19.3%) | $77,016 |
| 4-Person Families | 6,242 (20.3%) | $99,509 |
| 5-Person Families | 2,533 (8.2%) | $100,481 |
| 6-Person Families | 885 (2.9%) | $100,521 |
| 7+ Person Families | 371 (1.2%) | $104,650 |
| Total | 30,760 (100.0%) | $79,614 |
Family Income by Number of Earners in Faulkner County
The median family income in Faulkner County is $79,614, with families comprising 3+ earners (2,309) having the highest median family income of $133,062, while families with no earners (4,708) have the lowest median family income of $37,991, accounting for 7.5% and 15.3% of families, respectively.
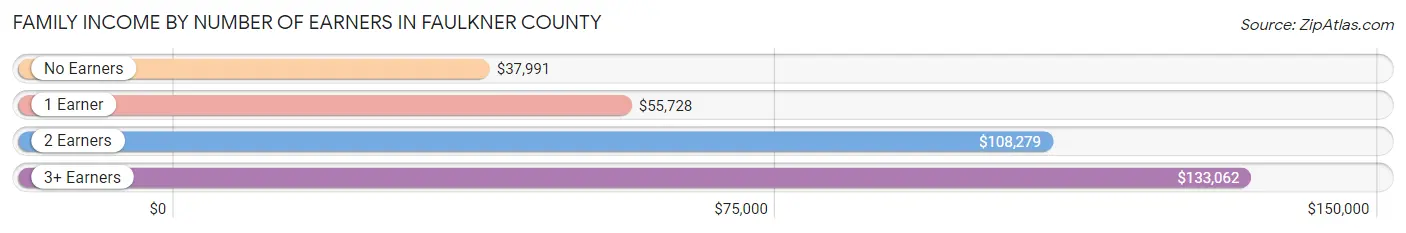
| Number of Earners | # Families | Median Income |
| No Earners | 4,708 (15.3%) | $37,991 |
| 1 Earner | 10,244 (33.3%) | $55,728 |
| 2 Earners | 13,499 (43.9%) | $108,279 |
| 3+ Earners | 2,309 (7.5%) | $133,062 |
| Total | 30,760 (100.0%) | $79,614 |
Household Income in Faulkner County
Household Income Brackets in Faulkner County
With 8,247 households falling in the category, the $50,000 to $74,999 income range is the most frequent in Faulkner County, accounting for 17.4% of all households. In contrast, only 1,801 households (3.8%) fall into the $10,000 to $14,999 income bracket, making it the least populous group.
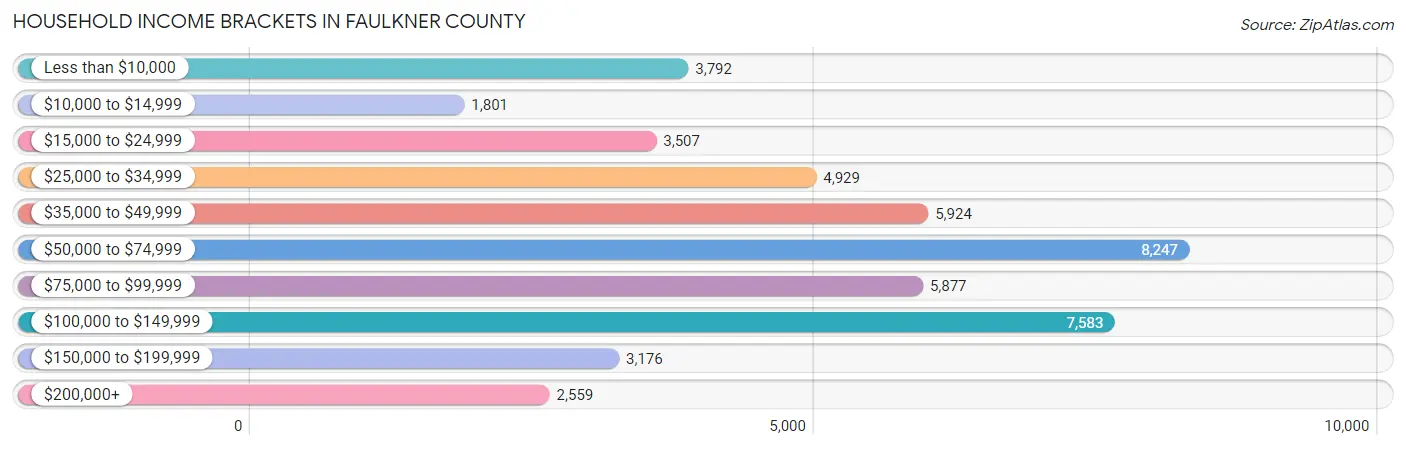
| Income Bracket | # Households | % Households |
| Less than $10,000 | 3,792 | 8.0% |
| $10,000 to $14,999 | 1,801 | 3.8% |
| $15,000 to $24,999 | 3,507 | 7.4% |
| $25,000 to $34,999 | 4,929 | 10.4% |
| $35,000 to $49,999 | 5,924 | 12.5% |
| $50,000 to $74,999 | 8,247 | 17.4% |
| $75,000 to $99,999 | 5,877 | 12.4% |
| $100,000 to $149,999 | 7,583 | 16.0% |
| $150,000 to $199,999 | 3,176 | 6.7% |
| $200,000+ | 2,559 | 5.4% |
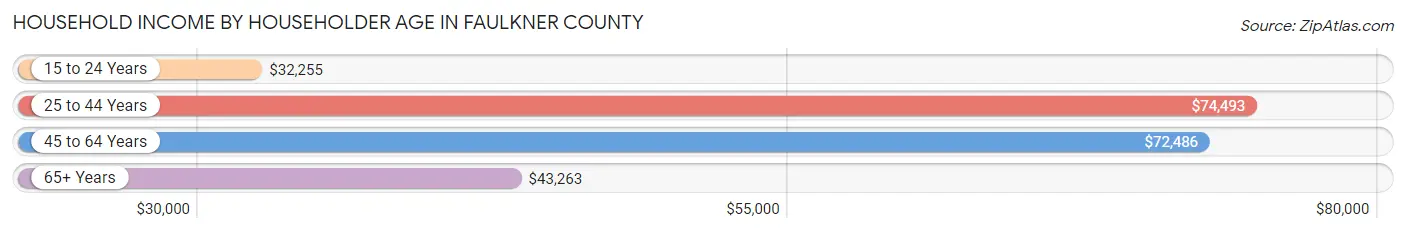
Household Income by Householder Age in Faulkner County
The median household income in Faulkner County is $61,273, with the highest median household income of $74,493 found in the 25 to 44 years age bracket for the primary householder. A total of 16,769 households (35.4%) fall into this category. Meanwhile, the 15 to 24 years age bracket for the primary householder has the lowest median household income of $32,255, with 5,066 households (10.7%) in this group.
| Income Bracket | # Households | Median Income |
| 15 to 24 Years | 5,066 (10.7%) | $32,255 |
| 25 to 44 Years | 16,769 (35.4%) | $74,493 |
| 45 to 64 Years | 15,510 (32.7%) | $72,486 |
| 65+ Years | 10,051 (21.2%) | $43,263 |
| Total | 47,396 (100.0%) | $61,273 |
Poverty in Faulkner County
Income Below Poverty by Sex and Age in Faulkner County
With 13.3% poverty level for males and 17.7% for females among the residents of Faulkner County, 18 to 24 year old males and 18 to 24 year old females are the most vulnerable to poverty, with 2,275 males (30.4%) and 2,846 females (35.6%) in their respective age groups living below the poverty level.
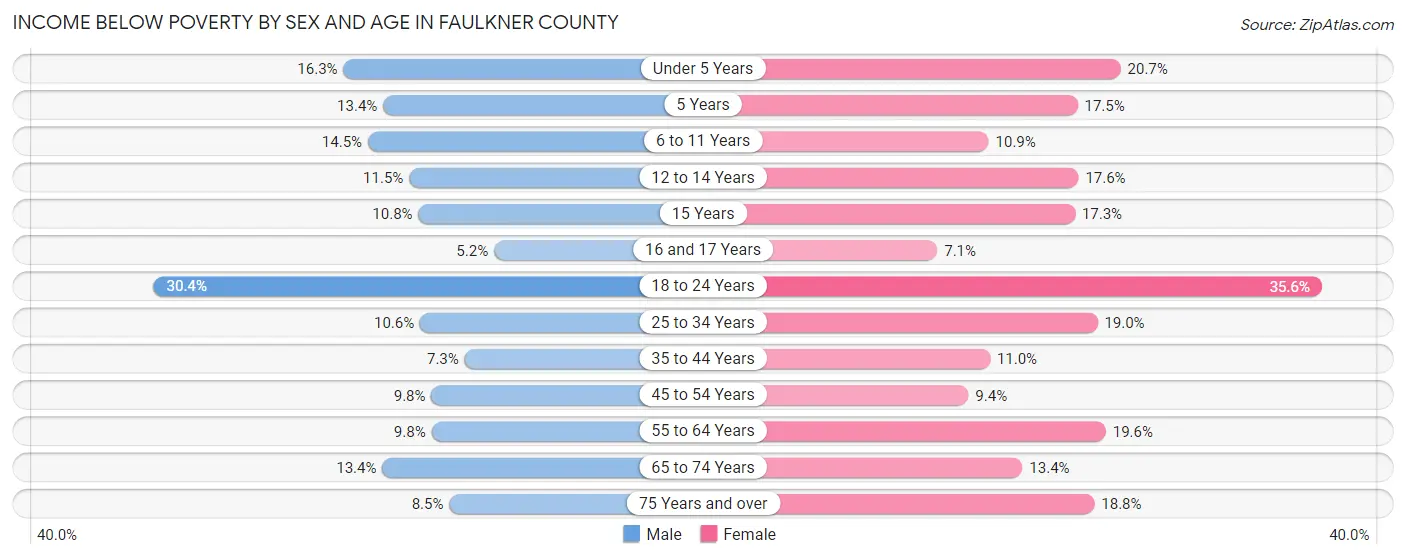
| Age Bracket | Male | Female |
| Under 5 Years | 604 (16.3%) | 704 (20.7%) |
| 5 Years | 123 (13.4%) | 109 (17.5%) |
| 6 to 11 Years | 637 (14.5%) | 548 (10.9%) |
| 12 to 14 Years | 309 (11.5%) | 335 (17.6%) |
| 15 Years | 110 (10.8%) | 167 (17.3%) |
| 16 and 17 Years | 74 (5.1%) | 112 (7.1%) |
| 18 to 24 Years | 2,275 (30.4%) | 2,846 (35.6%) |
| 25 to 34 Years | 883 (10.6%) | 1,637 (19.0%) |
| 35 to 44 Years | 580 (7.3%) | 853 (11.0%) |
| 45 to 54 Years | 666 (9.8%) | 652 (9.4%) |
| 55 to 64 Years | 641 (9.8%) | 1,372 (19.6%) |
| 65 to 74 Years | 602 (13.4%) | 696 (13.4%) |
| 75 Years and over | 226 (8.5%) | 717 (18.8%) |
| Total | 7,730 (13.3%) | 10,748 (17.7%) |
Income Above Poverty by Sex and Age in Faulkner County
According to the poverty statistics in Faulkner County, males aged 16 and 17 years and females aged 16 and 17 years are the age groups that are most secure financially, with 94.9% of males and 92.9% of females in these age groups living above the poverty line.
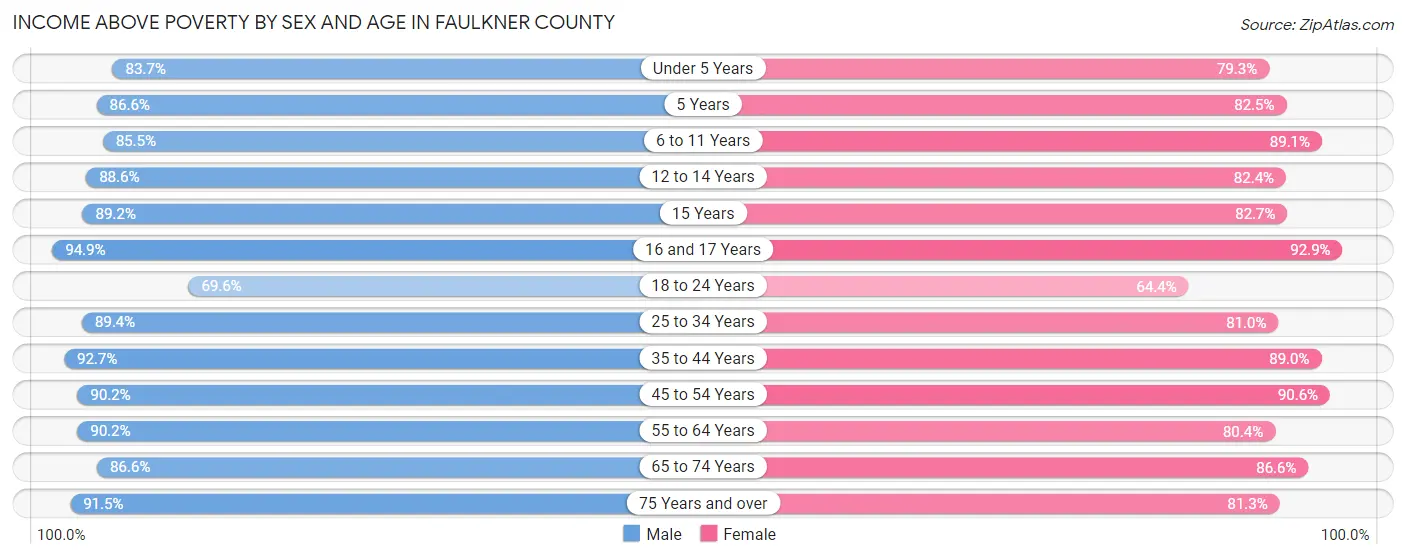
| Age Bracket | Male | Female |
| Under 5 Years | 3,094 (83.7%) | 2,697 (79.3%) |
| 5 Years | 796 (86.6%) | 514 (82.5%) |
| 6 to 11 Years | 3,754 (85.5%) | 4,478 (89.1%) |
| 12 to 14 Years | 2,389 (88.5%) | 1,572 (82.4%) |
| 15 Years | 912 (89.2%) | 798 (82.7%) |
| 16 and 17 Years | 1,362 (94.9%) | 1,467 (92.9%) |
| 18 to 24 Years | 5,203 (69.6%) | 5,141 (64.4%) |
| 25 to 34 Years | 7,418 (89.4%) | 6,987 (81.0%) |
| 35 to 44 Years | 7,332 (92.7%) | 6,903 (89.0%) |
| 45 to 54 Years | 6,131 (90.2%) | 6,283 (90.6%) |
| 55 to 64 Years | 5,909 (90.2%) | 5,627 (80.4%) |
| 65 to 74 Years | 3,876 (86.6%) | 4,496 (86.6%) |
| 75 Years and over | 2,442 (91.5%) | 3,107 (81.2%) |
| Total | 50,618 (86.8%) | 50,070 (82.3%) |
Income Below Poverty Among Married-Couple Families in Faulkner County
The poverty statistics for married-couple families in Faulkner County show that 5.4% or 1,283 of the total 23,760 families live below the poverty line. Families with 3 or 4 children have the highest poverty rate of 8.8%, comprising of 200 families. On the other hand, families with 5 or more children have the lowest poverty rate of 3.6%, which includes 7 families.
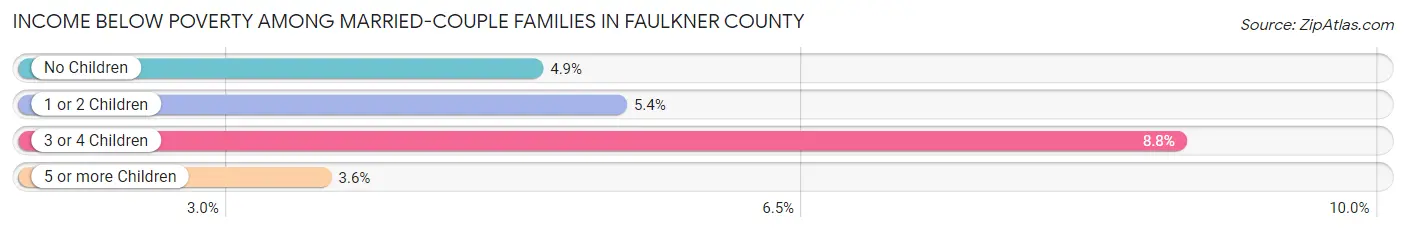
| Children | Above Poverty | Below Poverty |
| No Children | 12,561 (95.1%) | 642 (4.9%) |
| 1 or 2 Children | 7,650 (94.6%) | 434 (5.4%) |
| 3 or 4 Children | 2,077 (91.2%) | 200 (8.8%) |
| 5 or more Children | 189 (96.4%) | 7 (3.6%) |
| Total | 22,477 (94.6%) | 1,283 (5.4%) |
Income Below Poverty Among Single-Parent Households in Faulkner County
According to the poverty data in Faulkner County, 9.9% or 210 single-father households and 33.0% or 1,607 single-mother households are living below the poverty line. Among single-father households, those with 3 or 4 children have the highest poverty rate, with 39 households (33.9%) experiencing poverty. Likewise, among single-mother households, those with 5 or more children have the highest poverty rate, with 9 households (100.0%) falling below the poverty line.
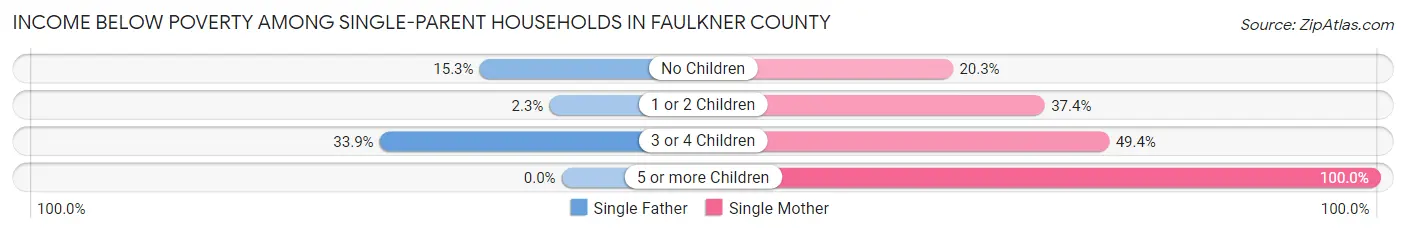
| Children | Single Father | Single Mother |
| No Children | 147 (15.3%) | 327 (20.3%) |
| 1 or 2 Children | 24 (2.3%) | 1,039 (37.4%) |
| 3 or 4 Children | 39 (33.9%) | 232 (49.4%) |
| 5 or more Children | 0 (0.0%) | 9 (100.0%) |
| Total | 210 (9.9%) | 1,607 (33.0%) |
Income Below Poverty Among Married-Couple vs Single-Parent Households in Faulkner County
The poverty data for Faulkner County shows that 1,283 of the married-couple family households (5.4%) and 1,817 of the single-parent households (26.0%) are living below the poverty level. Within the married-couple family households, those with 3 or 4 children have the highest poverty rate, with 200 households (8.8%) falling below the poverty line. Among the single-parent households, those with 5 or more children have the highest poverty rate, with 9 household (75.0%) living below poverty.
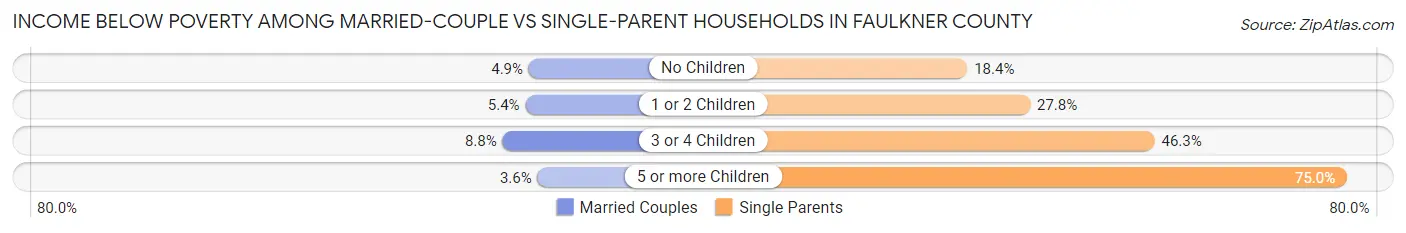
| Children | Married-Couple Families | Single-Parent Households |
| No Children | 642 (4.9%) | 474 (18.4%) |
| 1 or 2 Children | 434 (5.4%) | 1,063 (27.8%) |
| 3 or 4 Children | 200 (8.8%) | 271 (46.3%) |
| 5 or more Children | 7 (3.6%) | 9 (75.0%) |
| Total | 1,283 (5.4%) | 1,817 (26.0%) |
Race in Faulkner County
The most populous races in Faulkner County are White / Caucasian (100,955 | 81.0%), Black / African American (14,230 | 11.4%), and Hispanic or Latino (5,488 | 4.4%).
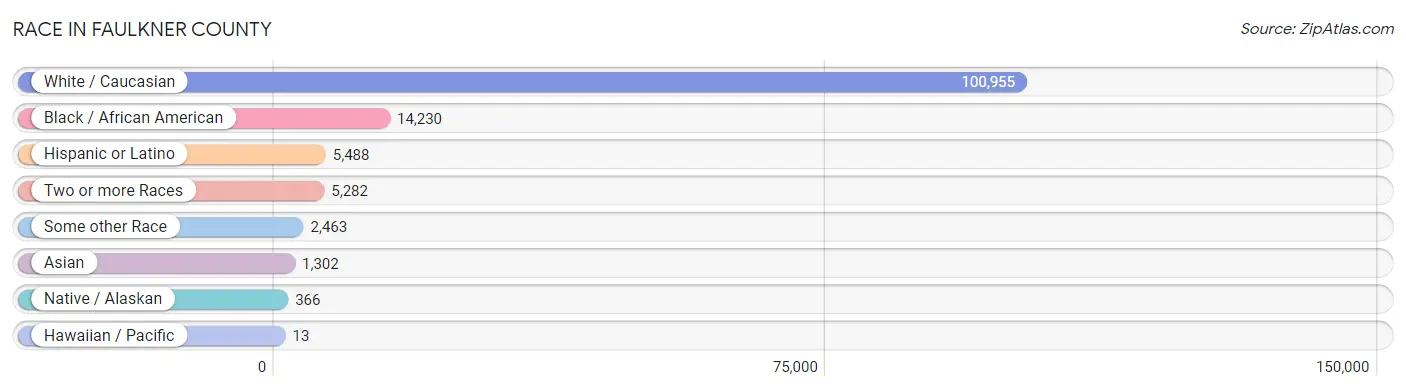
| Race | # Population | % Population |
| Asian | 1,302 | 1.0% |
| Black / African American | 14,230 | 11.4% |
| Hawaiian / Pacific | 13 | 0.0% |
| Hispanic or Latino | 5,488 | 4.4% |
| Native / Alaskan | 366 | 0.3% |
| White / Caucasian | 100,955 | 81.0% |
| Two or more Races | 5,282 | 4.2% |
| Some other Race | 2,463 | 2.0% |
| Total | 124,611 | 100.0% |
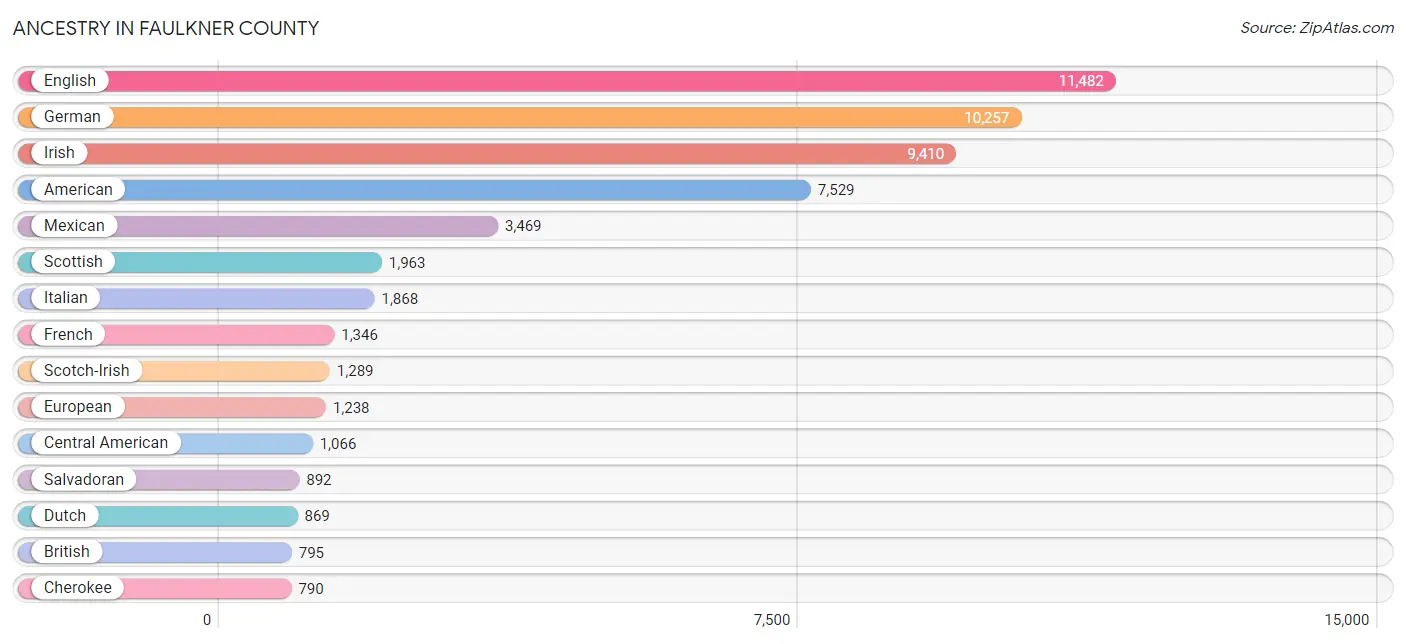
Ancestry in Faulkner County
The most populous ancestries reported in Faulkner County are English (11,482 | 9.2%), German (10,257 | 8.2%), Irish (9,410 | 7.5%), American (7,529 | 6.0%), and Mexican (3,469 | 2.8%), together accounting for 33.8% of all Faulkner County residents.
| Ancestry | # Population | % Population |
| African | 218 | 0.2% |
| Alaskan Athabascan | 6 | 0.0% |
| American | 7,529 | 6.0% |
| Arab | 130 | 0.1% |
| Argentinean | 38 | 0.0% |
| Austrian | 81 | 0.1% |
| Bahamian | 23 | 0.0% |
| Belgian | 15 | 0.0% |
| Bhutanese | 90 | 0.1% |
| Blackfeet | 79 | 0.1% |
| Bolivian | 5 | 0.0% |
| Brazilian | 9 | 0.0% |
| British | 795 | 0.6% |
| Burmese | 549 | 0.4% |
| Cajun | 108 | 0.1% |
| Canadian | 168 | 0.1% |
| Central American | 1,066 | 0.9% |
| Cherokee | 790 | 0.6% |
| Chickasaw | 57 | 0.1% |
| Chilean | 86 | 0.1% |
| Choctaw | 94 | 0.1% |
| Colombian | 26 | 0.0% |
| Costa Rican | 15 | 0.0% |
| Creek | 3 | 0.0% |
| Cuban | 58 | 0.1% |
| Czech | 218 | 0.2% |
| Czechoslovakian | 38 | 0.0% |
| Danish | 62 | 0.1% |
| Dominican | 16 | 0.0% |
| Dutch | 869 | 0.7% |
| Eastern European | 239 | 0.2% |
| Egyptian | 25 | 0.0% |
| English | 11,482 | 9.2% |
| Ethiopian | 25 | 0.0% |
| European | 1,238 | 1.0% |
| Finnish | 61 | 0.1% |
| French | 1,346 | 1.1% |
| French American Indian | 11 | 0.0% |
| French Canadian | 327 | 0.3% |
| German | 10,257 | 8.2% |
| Ghanaian | 42 | 0.0% |
| Greek | 194 | 0.2% |
| Guamanian / Chamorro | 12 | 0.0% |
| Guatemalan | 62 | 0.1% |
| Honduran | 10 | 0.0% |
| Hopi | 2 | 0.0% |
| Hungarian | 86 | 0.1% |
| Indian (Asian) | 318 | 0.3% |
| Iranian | 51 | 0.0% |
| Irish | 9,410 | 7.5% |
| Iroquois | 32 | 0.0% |
| Italian | 1,868 | 1.5% |
| Japanese | 148 | 0.1% |
| Korean | 360 | 0.3% |
| Lebanese | 89 | 0.1% |
| Lithuanian | 160 | 0.1% |
| Luxembourger | 11 | 0.0% |
| Malaysian | 27 | 0.0% |
| Mexican | 3,469 | 2.8% |
| Native Hawaiian | 329 | 0.3% |
| Nicaraguan | 4 | 0.0% |
| Nigerian | 23 | 0.0% |
| Northern European | 48 | 0.0% |
| Norwegian | 361 | 0.3% |
| Osage | 2 | 0.0% |
| Pakistani | 38 | 0.0% |
| Panamanian | 10 | 0.0% |
| Pennsylvania German | 57 | 0.1% |
| Polish | 748 | 0.6% |
| Portuguese | 121 | 0.1% |
| Puerto Rican | 176 | 0.1% |
| Romanian | 8 | 0.0% |
| Russian | 332 | 0.3% |
| Salvadoran | 892 | 0.7% |
| Scandinavian | 283 | 0.2% |
| Scotch-Irish | 1,289 | 1.0% |
| Scottish | 1,963 | 1.6% |
| Serbian | 16 | 0.0% |
| Shoshone | 12 | 0.0% |
| Sioux | 9 | 0.0% |
| Slavic | 9 | 0.0% |
| Slovak | 64 | 0.1% |
| Slovene | 30 | 0.0% |
| South African | 39 | 0.0% |
| South American | 157 | 0.1% |
| Spaniard | 97 | 0.1% |
| Spanish | 167 | 0.1% |
| Sri Lankan | 98 | 0.1% |
| Subsaharan African | 369 | 0.3% |
| Swedish | 402 | 0.3% |
| Swiss | 240 | 0.2% |
| Thai | 417 | 0.3% |
| Ukrainian | 28 | 0.0% |
| Venezuelan | 2 | 0.0% |
| Welsh | 485 | 0.4% |
| Yup'ik | 25 | 0.0% | View All 96 Rows |
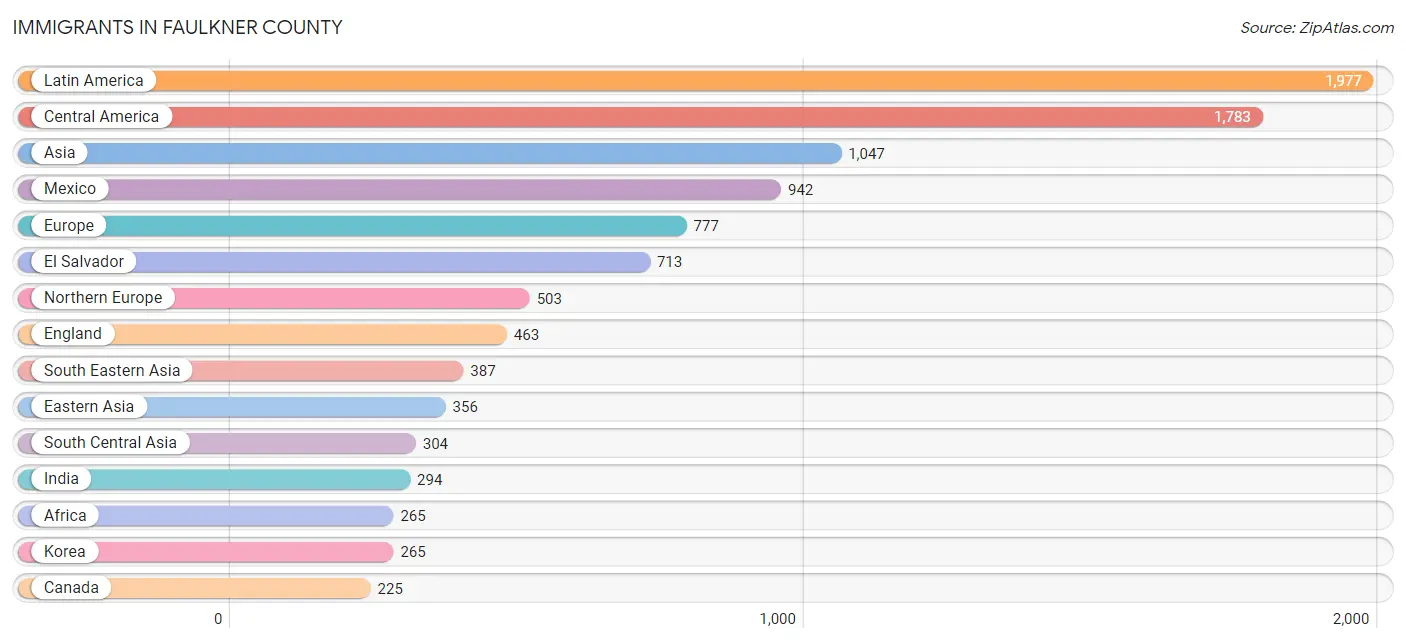
Immigrants in Faulkner County
The most numerous immigrant groups reported in Faulkner County came from Latin America (1,977 | 1.6%), Central America (1,783 | 1.4%), Asia (1,047 | 0.8%), Mexico (942 | 0.8%), and Europe (777 | 0.6%), together accounting for 5.2% of all Faulkner County residents.
| Immigration Origin | # Population | % Population |
| Africa | 265 | 0.2% |
| Asia | 1,047 | 0.8% |
| Australia | 31 | 0.0% |
| Bahamas | 29 | 0.0% |
| Bolivia | 14 | 0.0% |
| Brazil | 9 | 0.0% |
| Cambodia | 82 | 0.1% |
| Canada | 225 | 0.2% |
| Caribbean | 91 | 0.1% |
| Central America | 1,783 | 1.4% |
| Chile | 38 | 0.0% |
| China | 83 | 0.1% |
| Colombia | 31 | 0.0% |
| Costa Rica | 4 | 0.0% |
| Cuba | 46 | 0.0% |
| Dominican Republic | 16 | 0.0% |
| Eastern Africa | 31 | 0.0% |
| Eastern Asia | 356 | 0.3% |
| Eastern Europe | 87 | 0.1% |
| El Salvador | 713 | 0.6% |
| England | 463 | 0.4% |
| Ethiopia | 25 | 0.0% |
| Europe | 777 | 0.6% |
| Germany | 132 | 0.1% |
| Ghana | 62 | 0.1% |
| Greece | 3 | 0.0% |
| Guatemala | 58 | 0.1% |
| Honduras | 62 | 0.1% |
| India | 294 | 0.2% |
| Italy | 13 | 0.0% |
| Japan | 8 | 0.0% |
| Korea | 265 | 0.2% |
| Latin America | 1,977 | 1.6% |
| Mexico | 942 | 0.8% |
| Middle Africa | 17 | 0.0% |
| Netherlands | 17 | 0.0% |
| Nicaragua | 4 | 0.0% |
| Nigeria | 36 | 0.0% |
| Northern Europe | 503 | 0.4% |
| Oceania | 45 | 0.0% |
| Pakistan | 10 | 0.0% |
| Philippines | 177 | 0.1% |
| Poland | 4 | 0.0% |
| Russia | 67 | 0.1% |
| Serbia | 16 | 0.0% |
| South Africa | 53 | 0.0% |
| South America | 103 | 0.1% |
| South Central Asia | 304 | 0.2% |
| South Eastern Asia | 387 | 0.3% |
| Southern Europe | 38 | 0.0% |
| Spain | 22 | 0.0% |
| Thailand | 38 | 0.0% |
| Venezuela | 11 | 0.0% |
| Vietnam | 90 | 0.1% |
| Western Africa | 98 | 0.1% |
| Western Europe | 149 | 0.1% |
| Zaire | 17 | 0.0% | View All 57 Rows |
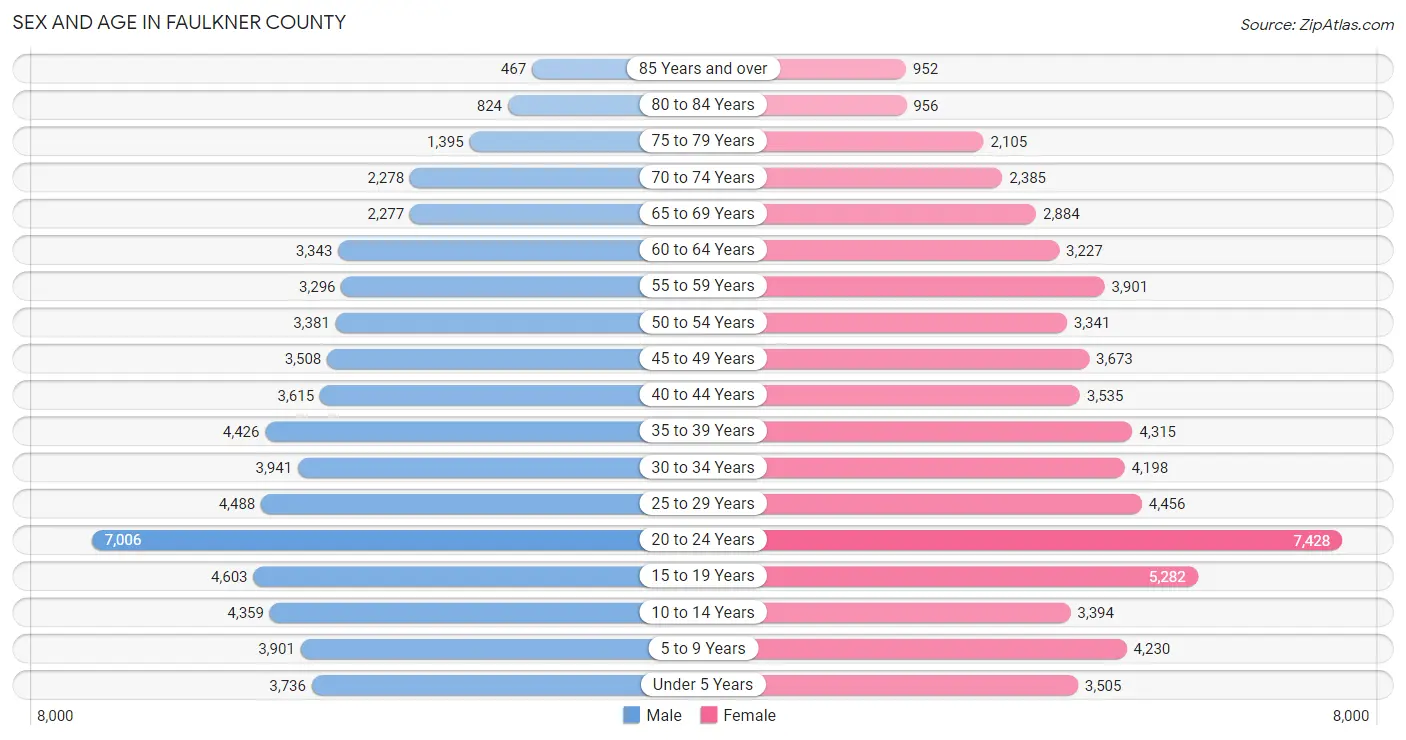
Sex and Age in Faulkner County
Sex and Age in Faulkner County
The most populous age groups in Faulkner County are 20 to 24 Years (7,006 | 11.5%) for men and 20 to 24 Years (7,428 | 11.7%) for women.
| Age Bracket | Male | Female |
| Under 5 Years | 3,736 (6.1%) | 3,505 (5.5%) |
| 5 to 9 Years | 3,901 (6.4%) | 4,230 (6.6%) |
| 10 to 14 Years | 4,359 (7.2%) | 3,394 (5.3%) |
| 15 to 19 Years | 4,603 (7.6%) | 5,282 (8.3%) |
| 20 to 24 Years | 7,006 (11.5%) | 7,428 (11.7%) |
| 25 to 29 Years | 4,488 (7.4%) | 4,456 (7.0%) |
| 30 to 34 Years | 3,941 (6.5%) | 4,198 (6.6%) |
| 35 to 39 Years | 4,426 (7.3%) | 4,315 (6.8%) |
| 40 to 44 Years | 3,615 (5.9%) | 3,535 (5.5%) |
| 45 to 49 Years | 3,508 (5.8%) | 3,673 (5.8%) |
| 50 to 54 Years | 3,381 (5.6%) | 3,341 (5.2%) |
| 55 to 59 Years | 3,296 (5.4%) | 3,901 (6.1%) |
| 60 to 64 Years | 3,343 (5.5%) | 3,227 (5.1%) |
| 65 to 69 Years | 2,277 (3.7%) | 2,884 (4.5%) |
| 70 to 74 Years | 2,278 (3.7%) | 2,385 (3.7%) |
| 75 to 79 Years | 1,395 (2.3%) | 2,105 (3.3%) |
| 80 to 84 Years | 824 (1.3%) | 956 (1.5%) |
| 85 Years and over | 467 (0.8%) | 952 (1.5%) |
| Total | 60,844 (100.0%) | 63,767 (100.0%) |
Families and Households in Faulkner County
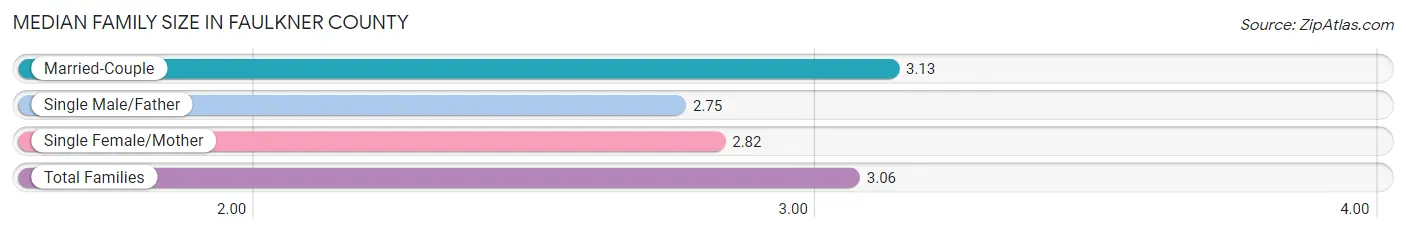
Median Family Size in Faulkner County
The median family size in Faulkner County is 3.06 persons per family, with married-couple families (23,760 | 77.2%) accounting for the largest median family size of 3.13 persons per family. On the other hand, single male/father families (2,126 | 6.9%) represent the smallest median family size with 2.75 persons per family.
| Family Type | # Families | Family Size |
| Married-Couple | 23,760 (77.2%) | 3.13 |
| Single Male/Father | 2,126 (6.9%) | 2.75 |
| Single Female/Mother | 4,874 (15.9%) | 2.82 |
| Total Families | 30,760 (100.0%) | 3.06 |
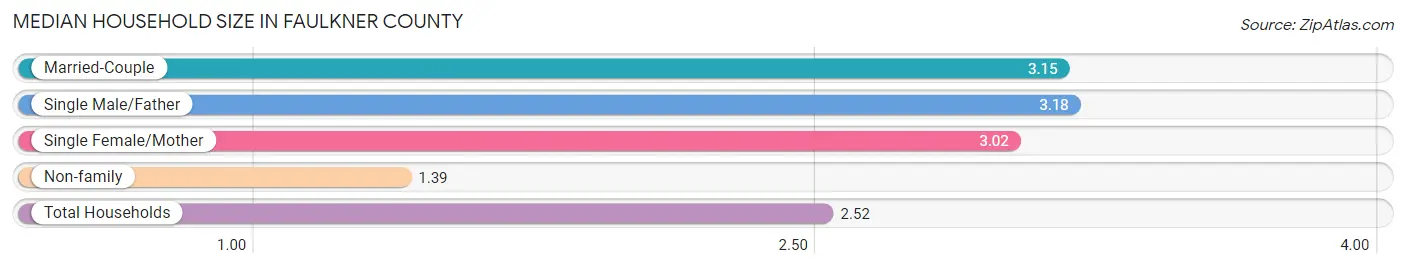
Median Household Size in Faulkner County
The median household size in Faulkner County is 2.52 persons per household, with single male/father households (2,126 | 4.5%) accounting for the largest median household size of 3.18 persons per household. non-family households (16,636 | 35.1%) represent the smallest median household size with 1.39 persons per household.
| Household Type | # Households | Household Size |
| Married-Couple | 23,760 (50.1%) | 3.15 |
| Single Male/Father | 2,126 (4.5%) | 3.18 |
| Single Female/Mother | 4,874 (10.3%) | 3.02 |
| Non-family | 16,636 (35.1%) | 1.39 |
| Total Households | 47,396 (100.0%) | 2.52 |
Household Size by Marriage Status in Faulkner County
Out of a total of 47,396 households in Faulkner County, 30,760 (64.9%) are family households, while 16,636 (35.1%) are nonfamily households. The most numerous type of family households are 2-person households, comprising 13,914, and the most common type of nonfamily households are 1-person households, comprising 11,645.
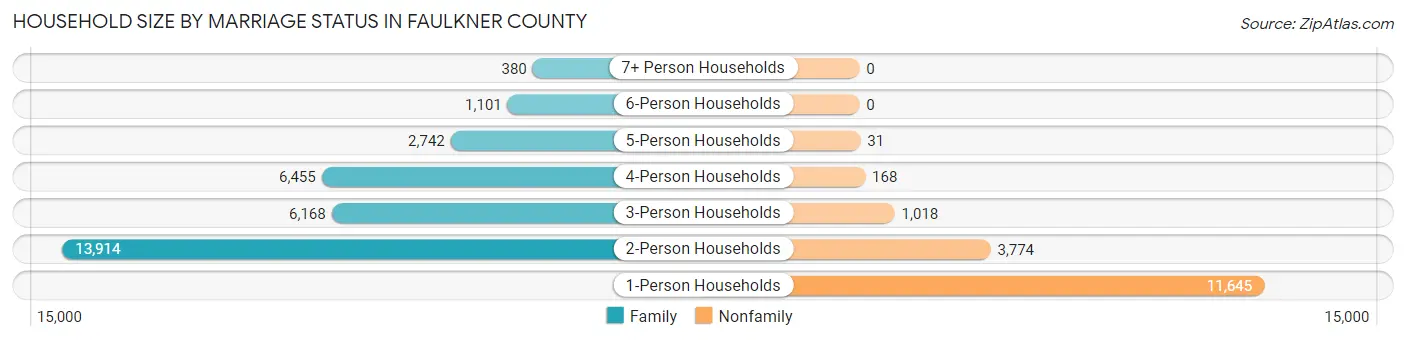
| Household Size | Family Households | Nonfamily Households |
| 1-Person Households | - | 11,645 (24.6%) |
| 2-Person Households | 13,914 (29.4%) | 3,774 (8.0%) |
| 3-Person Households | 6,168 (13.0%) | 1,018 (2.1%) |
| 4-Person Households | 6,455 (13.6%) | 168 (0.4%) |
| 5-Person Households | 2,742 (5.8%) | 31 (0.1%) |
| 6-Person Households | 1,101 (2.3%) | 0 (0.0%) |
| 7+ Person Households | 380 (0.8%) | 0 (0.0%) |
| Total | 30,760 (64.9%) | 16,636 (35.1%) |
Female Fertility in Faulkner County
Fertility by Age in Faulkner County
Average fertility rate in Faulkner County is 45.0 births per 1,000 women. Women in the age bracket of 20 to 34 years have the highest fertility rate with 76.0 births per 1,000 women. Women in the age bracket of 20 to 34 years acount for 80.2% of all women with births.
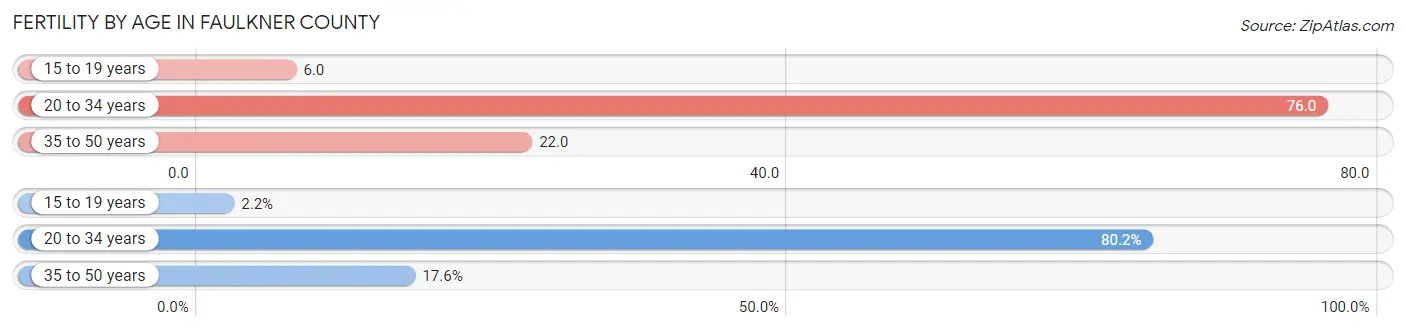
| Age Bracket | Women with Births | Births / 1,000 Women |
| 15 to 19 years | 34 (2.2%) | 6.0 |
| 20 to 34 years | 1,221 (80.2%) | 76.0 |
| 35 to 50 years | 268 (17.6%) | 22.0 |
| Total | 1,523 (100.0%) | 45.0 |
Fertility by Age by Marriage Status in Faulkner County
68.8% of women with births (1,523) in Faulkner County are married. The highest percentage of unmarried women with births falls into 15 to 19 years age bracket with 41.2% of them unmarried at the time of birth, while the lowest percentage of unmarried women with births belong to 35 to 50 years age bracket with 10.5% of them unmarried.
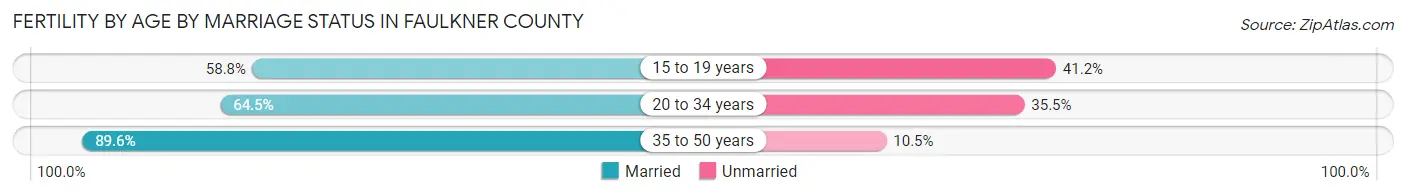
| Age Bracket | Married | Unmarried |
| 15 to 19 years | 20 (58.8%) | 14 (41.2%) |
| 20 to 34 years | 788 (64.5%) | 433 (35.5%) |
| 35 to 50 years | 240 (89.5%) | 28 (10.4%) |
| Total | 1,048 (68.8%) | 475 (31.2%) |
Fertility by Education in Faulkner County
Average fertility rate in Faulkner County is 45.0 births per 1,000 women. Women with the education attainment of high school diploma have the highest fertility rate of 69.0 births per 1,000 women, while women with the education attainment of less than high school have the lowest fertility at 16.0 births per 1,000 women. Women with the education attainment of college or associate's degree represent 33.6% of all women with births.
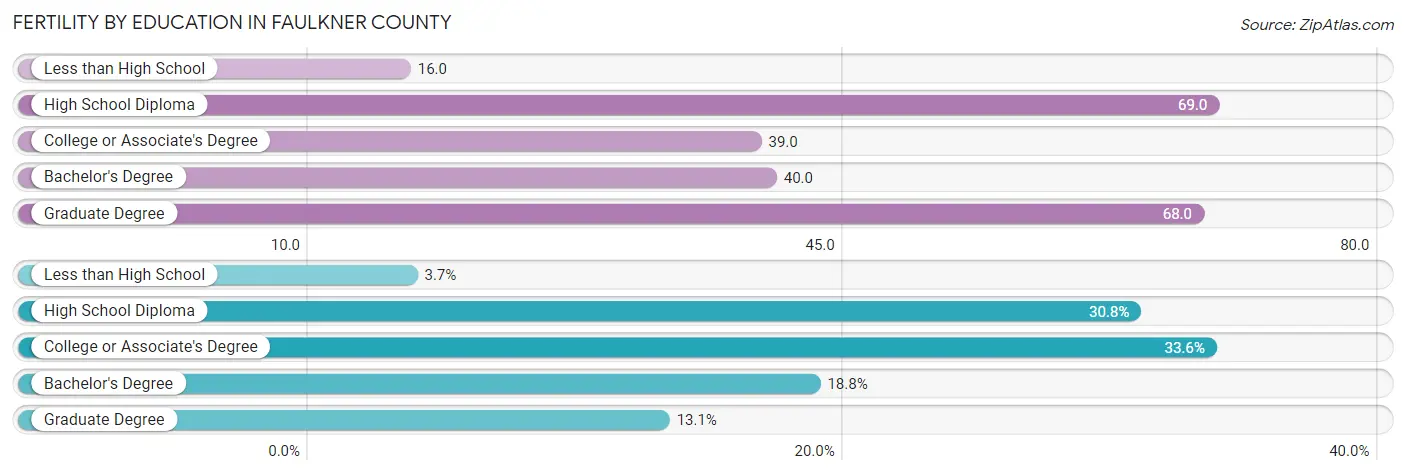
| Educational Attainment | Women with Births | Births / 1,000 Women |
| Less than High School | 56 (3.7%) | 16.0 |
| High School Diploma | 469 (30.8%) | 69.0 |
| College or Associate's Degree | 512 (33.6%) | 39.0 |
| Bachelor's Degree | 286 (18.8%) | 40.0 |
| Graduate Degree | 200 (13.1%) | 68.0 |
| Total | 1,523 (100.0%) | 45.0 |
Fertility by Education by Marriage Status in Faulkner County
31.2% of women with births in Faulkner County are unmarried. Women with the educational attainment of graduate degree are most likely to be married with 94.0% of them married at childbirth, while women with the educational attainment of high school diploma are least likely to be married with 44.1% of them unmarried at childbirth.

| Educational Attainment | Married | Unmarried |
| Less than High School | 36 (64.3%) | 20 (35.7%) |
| High School Diploma | 262 (55.9%) | 207 (44.1%) |
| College or Associate's Degree | 294 (57.4%) | 218 (42.6%) |
| Bachelor's Degree | 268 (93.7%) | 18 (6.3%) |
| Graduate Degree | 188 (94.0%) | 12 (6.0%) |
| Total | 1,048 (68.8%) | 475 (31.2%) |
Employment Characteristics in Faulkner County
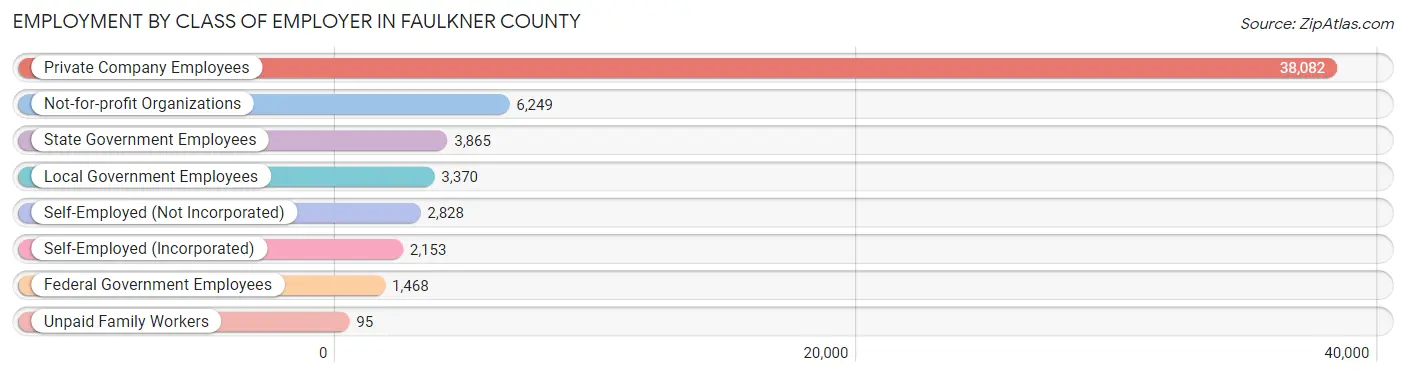
Employment by Class of Employer in Faulkner County
Among the 58,110 employed individuals in Faulkner County, private company employees (38,082 | 65.5%), not-for-profit organizations (6,249 | 10.7%), and state government employees (3,865 | 6.7%) make up the most common classes of employment.
| Employer Class | # Employees | % Employees |
| Private Company Employees | 38,082 | 65.5% |
| Self-Employed (Incorporated) | 2,153 | 3.7% |
| Self-Employed (Not Incorporated) | 2,828 | 4.9% |
| Not-for-profit Organizations | 6,249 | 10.7% |
| Local Government Employees | 3,370 | 5.8% |
| State Government Employees | 3,865 | 6.7% |
| Federal Government Employees | 1,468 | 2.5% |
| Unpaid Family Workers | 95 | 0.2% |
| Total | 58,110 | 100.0% |
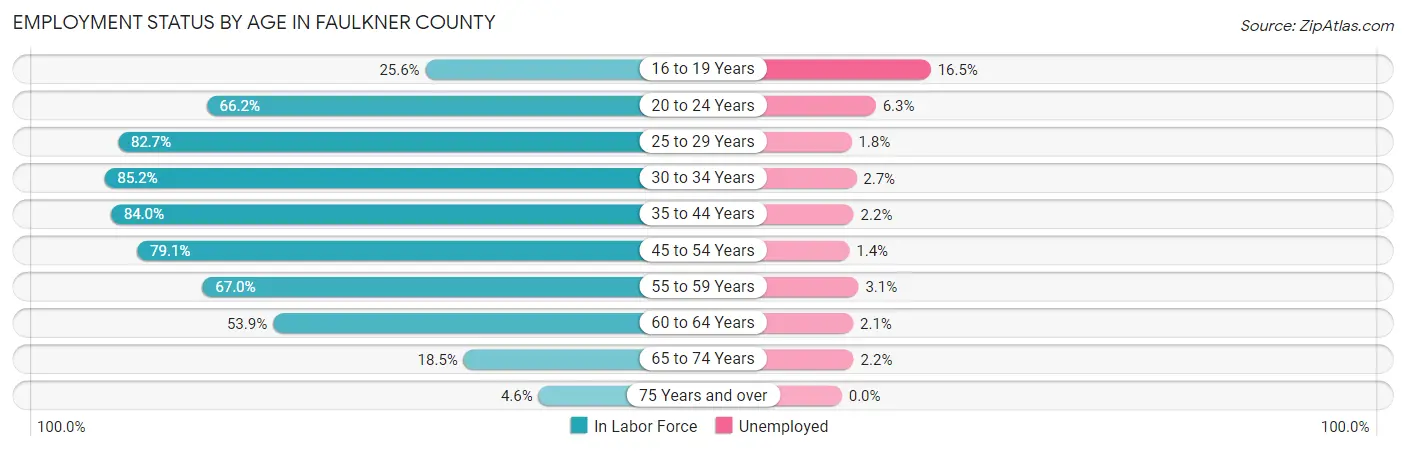
Employment Status by Age in Faulkner County
According to the labor force statistics for Faulkner County, out of the total population over 16 years of age (99,496), 61.1% or 60,792 individuals are in the labor force, with 3.3% or 2,006 of them unemployed. The age group with the highest labor force participation rate is 30 to 34 years, with 85.2% or 6,934 individuals in the labor force. Within the labor force, the 16 to 19 years age range has the highest percentage of unemployed individuals, with 16.5% or 333 of them being unemployed.
| Age Bracket | In Labor Force | Unemployed |
| 16 to 19 Years | 2,021 (25.6%) | 333 (16.5%) |
| 20 to 24 Years | 9,555 (66.2%) | 602 (6.3%) |
| 25 to 29 Years | 7,397 (82.7%) | 133 (1.8%) |
| 30 to 34 Years | 6,934 (85.2%) | 187 (2.7%) |
| 35 to 44 Years | 13,348 (84.0%) | 294 (2.2%) |
| 45 to 54 Years | 10,997 (79.1%) | 154 (1.4%) |
| 55 to 59 Years | 4,822 (67.0%) | 149 (3.1%) |
| 60 to 64 Years | 3,541 (53.9%) | 74 (2.1%) |
| 65 to 74 Years | 1,817 (18.5%) | 40 (2.2%) |
| 75 Years and over | 308 (4.6%) | 0 (0.0%) |
| Total | 60,792 (61.1%) | 2,006 (3.3%) |
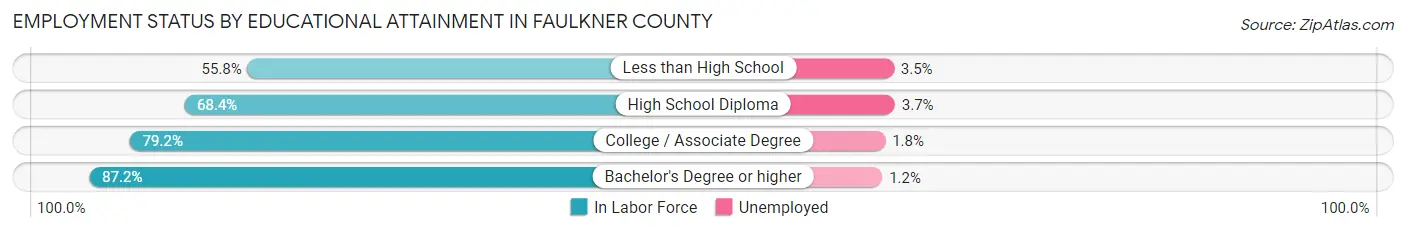
Employment Status by Educational Attainment in Faulkner County
According to labor force statistics for Faulkner County, 77.6% of individuals (47,060) out of the total population between 25 and 64 years of age (60,644) are in the labor force, with 2.1% or 988 of them being unemployed. The group with the highest labor force participation rate are those with the educational attainment of bachelor's degree or higher, with 87.2% or 17,873 individuals in the labor force. Within the labor force, individuals with high school diploma education have the highest percentage of unemployment, with 3.7% or 439 of them being unemployed.
| Educational Attainment | In Labor Force | Unemployed |
| Less than High School | 1,798 (55.8%) | 113 (3.5%) |
| High School Diploma | 11,859 (68.4%) | 641 (3.7%) |
| College / Associate Degree | 15,514 (79.2%) | 353 (1.8%) |
| Bachelor's Degree or higher | 17,873 (87.2%) | 246 (1.2%) |
| Total | 47,060 (77.6%) | 1,274 (2.1%) |
Employment Occupations by Sex in Faulkner County
Management, Business, Science and Arts Occupations
The most common Management, Business, Science and Arts occupations in Faulkner County are Management (6,663 | 11.4%), Community & Social Service (6,499 | 11.2%), Health Diagnosing & Treating (5,204 | 8.9%), Education Instruction & Library (4,252 | 7.3%), and Health Technologists (3,390 | 5.8%).
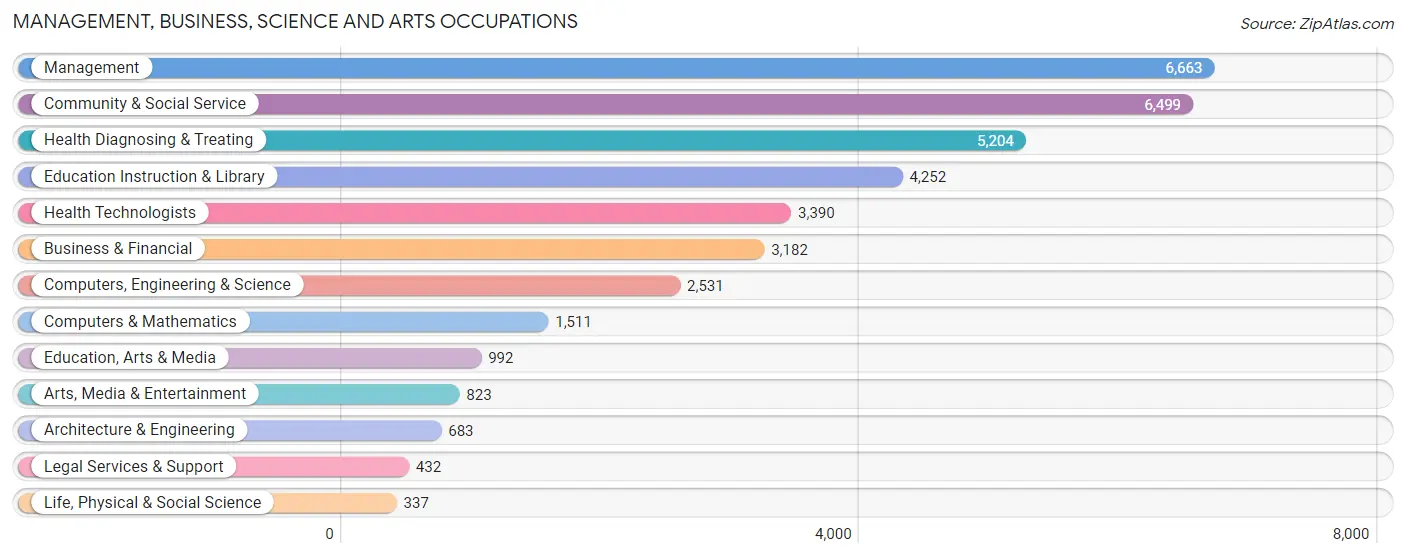
Management, Business, Science and Arts Occupations by Sex
Within the Management, Business, Science and Arts occupations in Faulkner County, the most male-oriented occupations are Architecture & Engineering (85.8%), Computers, Engineering & Science (70.9%), and Computers & Mathematics (65.4%), while the most female-oriented occupations are Education Instruction & Library (75.2%), Health Technologists (71.9%), and Health Diagnosing & Treating (69.3%).
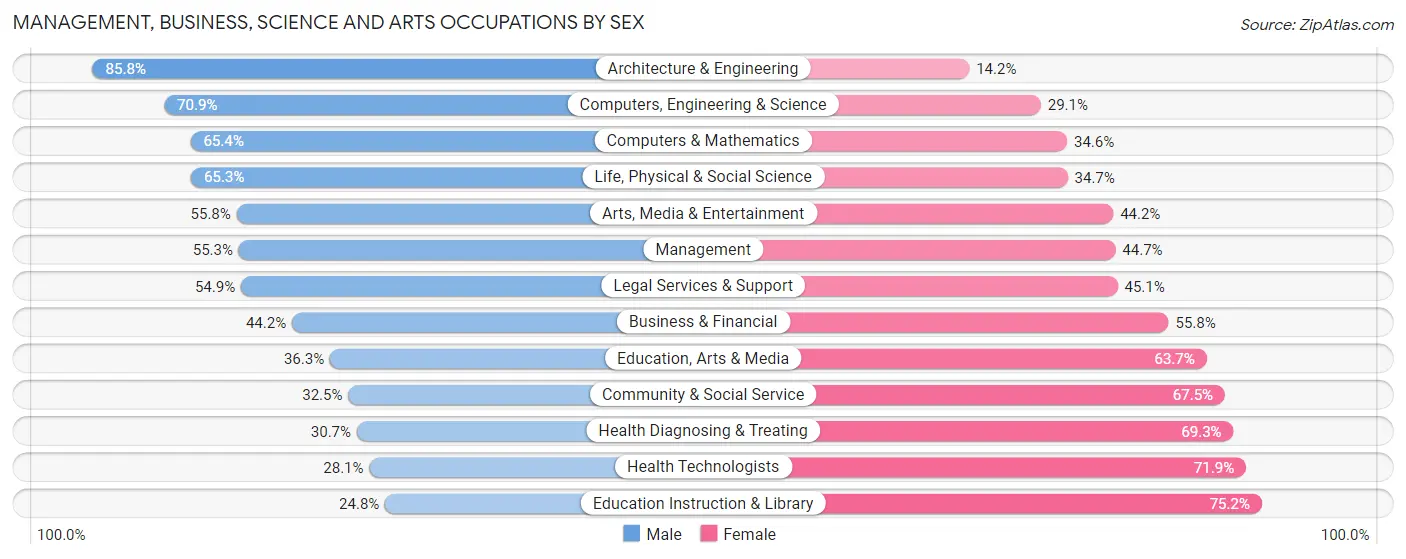
| Occupation | Male | Female |
| Management | 3,685 (55.3%) | 2,978 (44.7%) |
| Business & Financial | 1,407 (44.2%) | 1,775 (55.8%) |
| Computers, Engineering & Science | 1,794 (70.9%) | 737 (29.1%) |
| Computers & Mathematics | 988 (65.4%) | 523 (34.6%) |
| Architecture & Engineering | 586 (85.8%) | 97 (14.2%) |
| Life, Physical & Social Science | 220 (65.3%) | 117 (34.7%) |
| Community & Social Service | 2,110 (32.5%) | 4,389 (67.5%) |
| Education, Arts & Media | 360 (36.3%) | 632 (63.7%) |
| Legal Services & Support | 237 (54.9%) | 195 (45.1%) |
| Education Instruction & Library | 1,054 (24.8%) | 3,198 (75.2%) |
| Arts, Media & Entertainment | 459 (55.8%) | 364 (44.2%) |
| Health Diagnosing & Treating | 1,597 (30.7%) | 3,607 (69.3%) |
| Health Technologists | 952 (28.1%) | 2,438 (71.9%) |
| Total (Category) | 10,593 (44.0%) | 13,486 (56.0%) |
| Total (Overall) | 30,427 (52.2%) | 27,851 (47.8%) |
Services Occupations
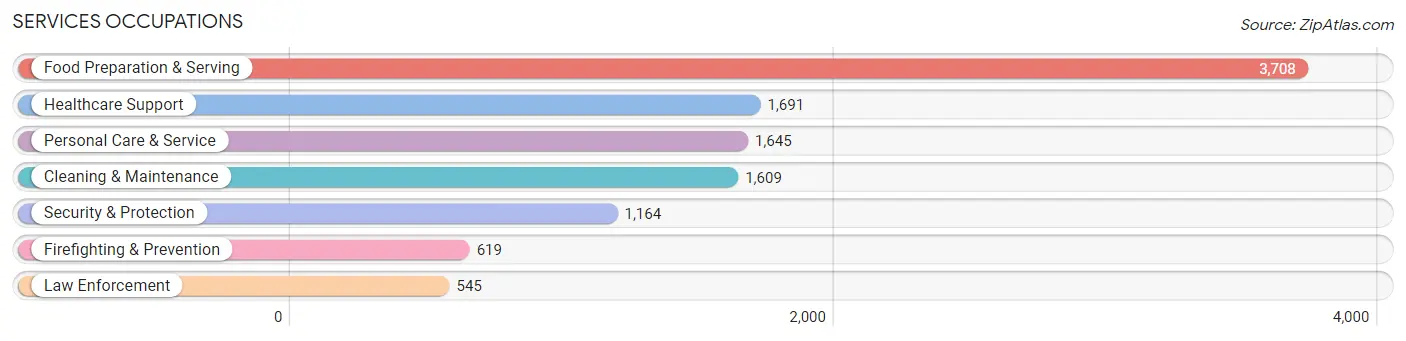
The most common Services occupations in Faulkner County are Food Preparation & Serving (3,708 | 6.4%), Healthcare Support (1,691 | 2.9%), Personal Care & Service (1,645 | 2.8%), Cleaning & Maintenance (1,609 | 2.8%), and Security & Protection (1,164 | 2.0%).
Services Occupations by Sex
Within the Services occupations in Faulkner County, the most male-oriented occupations are Firefighting & Prevention (81.3%), Security & Protection (80.2%), and Law Enforcement (79.1%), while the most female-oriented occupations are Healthcare Support (79.1%), Personal Care & Service (72.4%), and Food Preparation & Serving (56.1%).
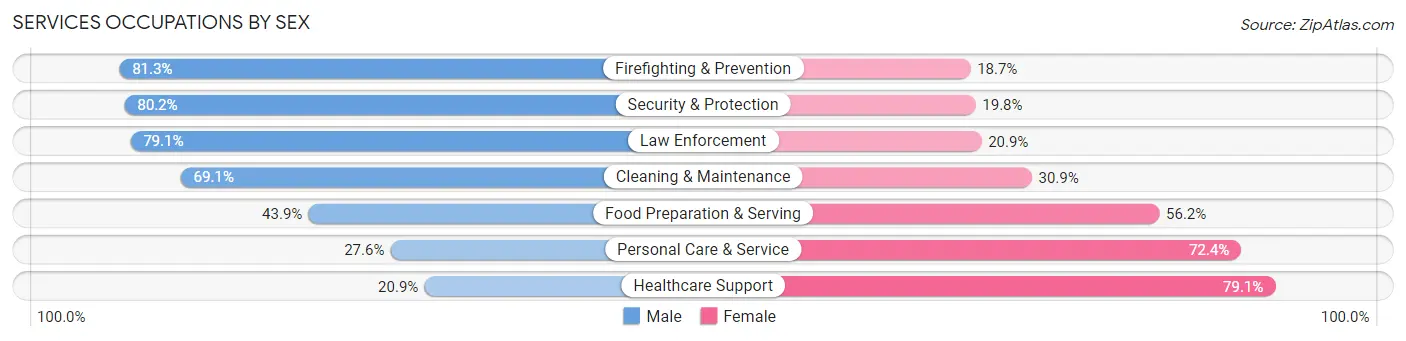
| Occupation | Male | Female |
| Healthcare Support | 353 (20.9%) | 1,338 (79.1%) |
| Security & Protection | 934 (80.2%) | 230 (19.8%) |
| Firefighting & Prevention | 503 (81.3%) | 116 (18.7%) |
| Law Enforcement | 431 (79.1%) | 114 (20.9%) |
| Food Preparation & Serving | 1,626 (43.9%) | 2,082 (56.1%) |
| Cleaning & Maintenance | 1,112 (69.1%) | 497 (30.9%) |
| Personal Care & Service | 454 (27.6%) | 1,191 (72.4%) |
| Total (Category) | 4,479 (45.6%) | 5,338 (54.4%) |
| Total (Overall) | 30,427 (52.2%) | 27,851 (47.8%) |
Sales and Office Occupations
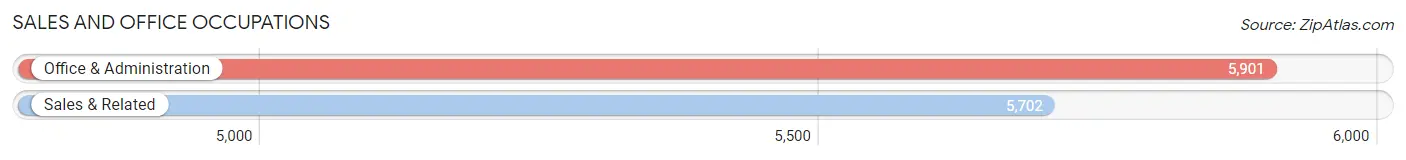
The most common Sales and Office occupations in Faulkner County are Office & Administration (5,901 | 10.1%), and Sales & Related (5,702 | 9.8%).
Sales and Office Occupations by Sex
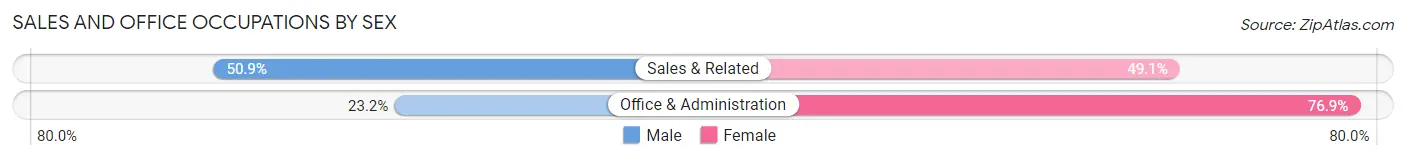
| Occupation | Male | Female |
| Sales & Related | 2,904 (50.9%) | 2,798 (49.1%) |
| Office & Administration | 1,366 (23.2%) | 4,535 (76.8%) |
| Total (Category) | 4,270 (36.8%) | 7,333 (63.2%) |
| Total (Overall) | 30,427 (52.2%) | 27,851 (47.8%) |
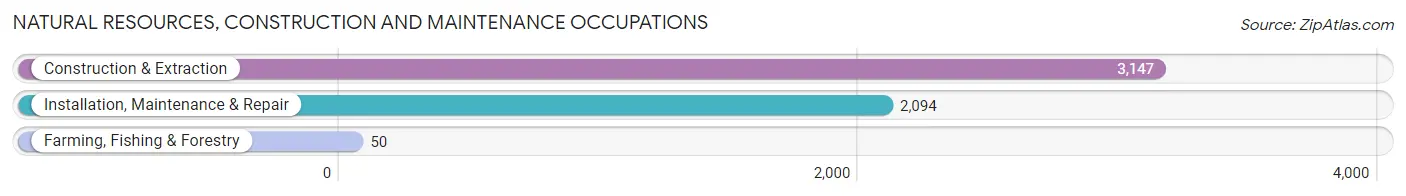
Natural Resources, Construction and Maintenance Occupations
The most common Natural Resources, Construction and Maintenance occupations in Faulkner County are Construction & Extraction (3,147 | 5.4%), Installation, Maintenance & Repair (2,094 | 3.6%), and Farming, Fishing & Forestry (50 | 0.1%).
Natural Resources, Construction and Maintenance Occupations by Sex
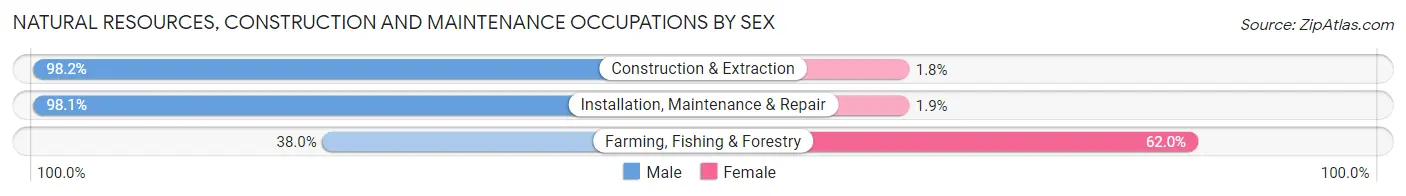
| Occupation | Male | Female |
| Farming, Fishing & Forestry | 19 (38.0%) | 31 (62.0%) |
| Construction & Extraction | 3,089 (98.2%) | 58 (1.8%) |
| Installation, Maintenance & Repair | 2,055 (98.1%) | 39 (1.9%) |
| Total (Category) | 5,163 (97.6%) | 128 (2.4%) |
| Total (Overall) | 30,427 (52.2%) | 27,851 (47.8%) |
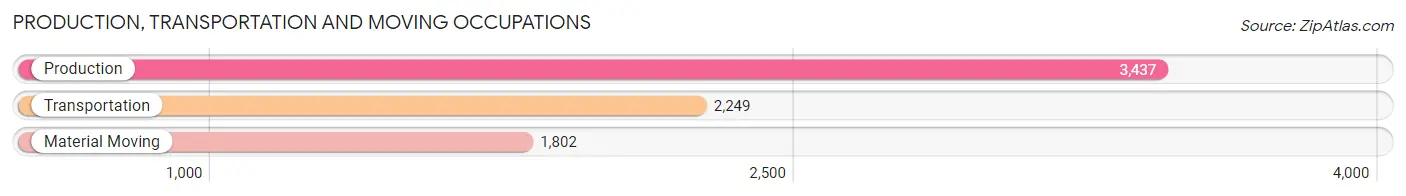
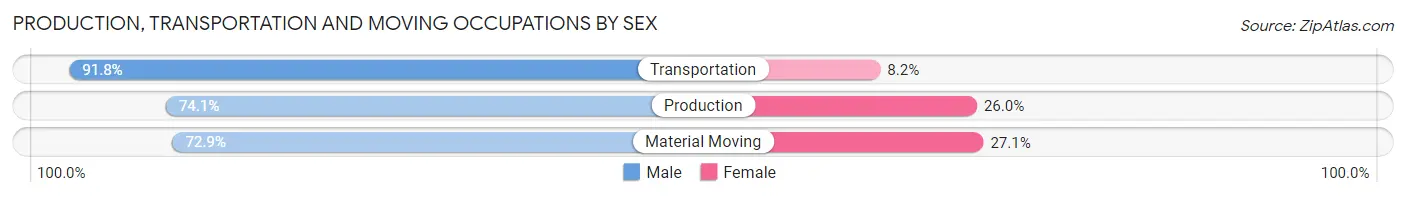
Production, Transportation and Moving Occupations
The most common Production, Transportation and Moving occupations in Faulkner County are Production (3,437 | 5.9%), Transportation (2,249 | 3.9%), and Material Moving (1,802 | 3.1%).
Production, Transportation and Moving Occupations by Sex
| Occupation | Male | Female |
| Production | 2,545 (74.1%) | 892 (26.0%) |
| Transportation | 2,064 (91.8%) | 185 (8.2%) |
| Material Moving | 1,313 (72.9%) | 489 (27.1%) |
| Total (Category) | 5,922 (79.1%) | 1,566 (20.9%) |
| Total (Overall) | 30,427 (52.2%) | 27,851 (47.8%) |
Employment Industries by Sex in Faulkner County
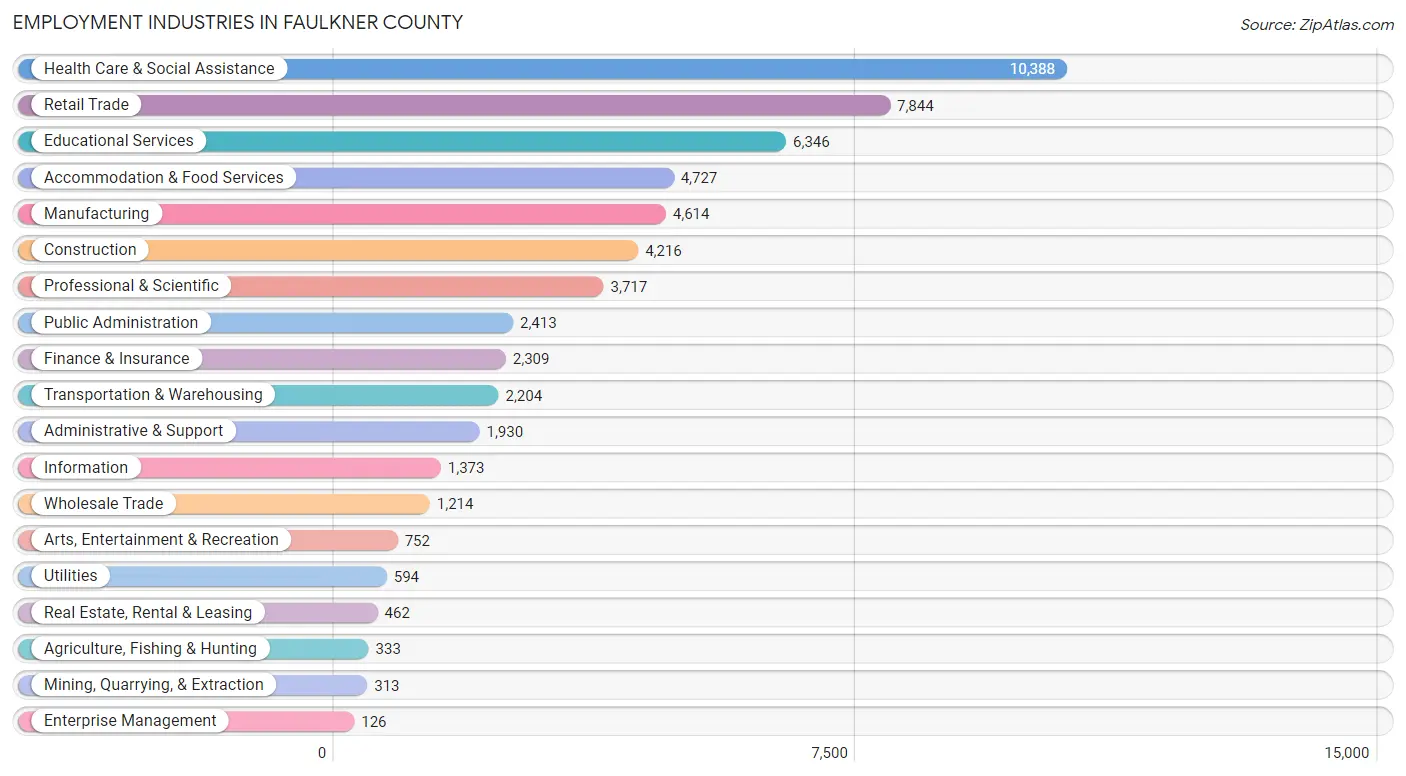
Employment Industries in Faulkner County
The major employment industries in Faulkner County include Health Care & Social Assistance (10,388 | 17.8%), Retail Trade (7,844 | 13.5%), Educational Services (6,346 | 10.9%), Accommodation & Food Services (4,727 | 8.1%), and Manufacturing (4,614 | 7.9%).
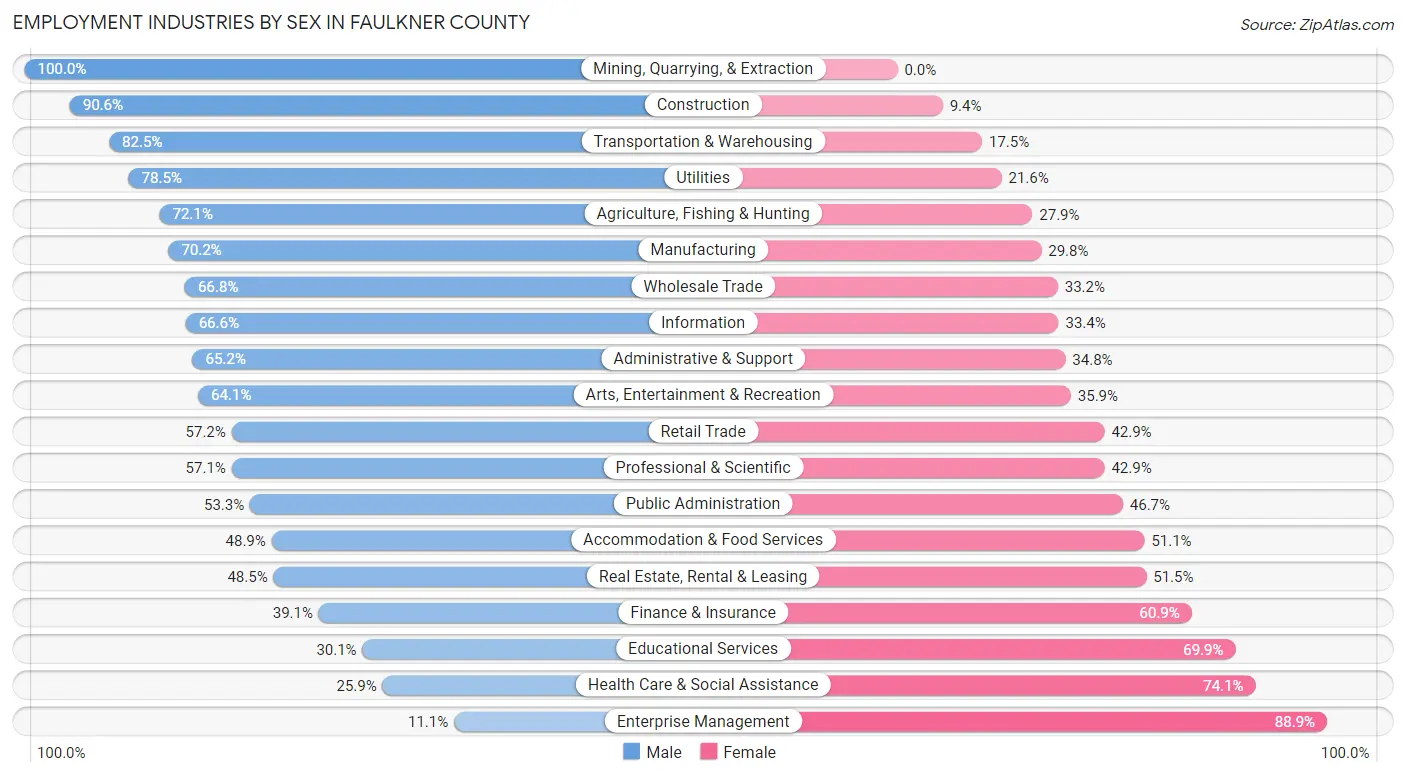
Employment Industries by Sex in Faulkner County
The Faulkner County industries that see more men than women are Mining, Quarrying, & Extraction (100.0%), Construction (90.6%), and Transportation & Warehousing (82.5%), whereas the industries that tend to have a higher number of women are Enterprise Management (88.9%), Health Care & Social Assistance (74.1%), and Educational Services (69.9%).
| Industry | Male | Female |
| Agriculture, Fishing & Hunting | 240 (72.1%) | 93 (27.9%) |
| Mining, Quarrying, & Extraction | 313 (100.0%) | 0 (0.0%) |
| Construction | 3,821 (90.6%) | 395 (9.4%) |
| Manufacturing | 3,240 (70.2%) | 1,374 (29.8%) |
| Wholesale Trade | 811 (66.8%) | 403 (33.2%) |
| Retail Trade | 4,483 (57.2%) | 3,361 (42.8%) |
| Transportation & Warehousing | 1,818 (82.5%) | 386 (17.5%) |
| Utilities | 466 (78.4%) | 128 (21.5%) |
| Information | 915 (66.6%) | 458 (33.4%) |
| Finance & Insurance | 903 (39.1%) | 1,406 (60.9%) |
| Real Estate, Rental & Leasing | 224 (48.5%) | 238 (51.5%) |
| Professional & Scientific | 2,124 (57.1%) | 1,593 (42.9%) |
| Enterprise Management | 14 (11.1%) | 112 (88.9%) |
| Administrative & Support | 1,259 (65.2%) | 671 (34.8%) |
| Educational Services | 1,908 (30.1%) | 4,438 (69.9%) |
| Health Care & Social Assistance | 2,692 (25.9%) | 7,696 (74.1%) |
| Arts, Entertainment & Recreation | 482 (64.1%) | 270 (35.9%) |
| Accommodation & Food Services | 2,310 (48.9%) | 2,417 (51.1%) |
| Public Administration | 1,287 (53.3%) | 1,126 (46.7%) |
| Total | 30,427 (52.2%) | 27,851 (47.8%) |
Education in Faulkner County
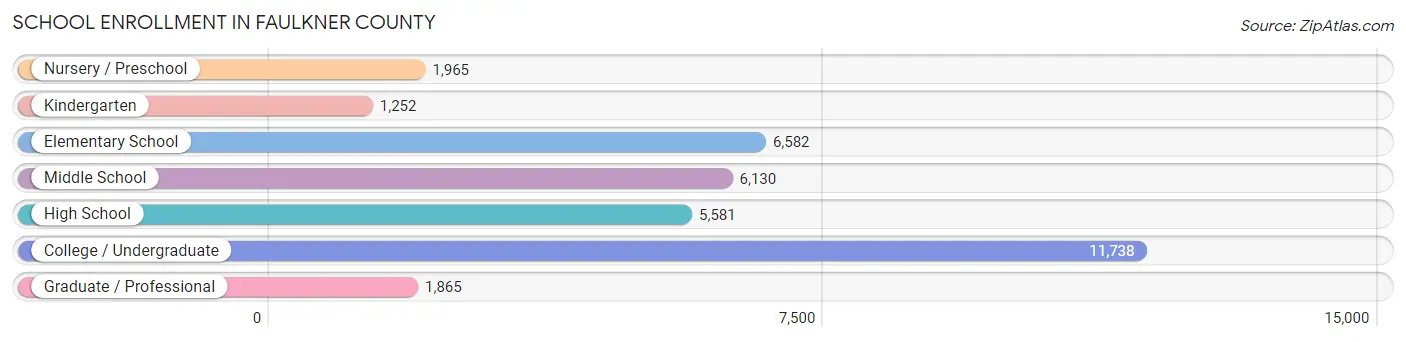
School Enrollment in Faulkner County
The most common levels of schooling among the 35,113 students in Faulkner County are college / undergraduate (11,738 | 33.4%), elementary school (6,582 | 18.8%), and middle school (6,130 | 17.5%).
| School Level | # Students | % Students |
| Nursery / Preschool | 1,965 | 5.6% |
| Kindergarten | 1,252 | 3.6% |
| Elementary School | 6,582 | 18.8% |
| Middle School | 6,130 | 17.5% |
| High School | 5,581 | 15.9% |
| College / Undergraduate | 11,738 | 33.4% |
| Graduate / Professional | 1,865 | 5.3% |
| Total | 35,113 | 100.0% |
School Enrollment by Age by Funding Source in Faulkner County
Out of a total of 35,113 students who are enrolled in schools in Faulkner County, 5,021 (14.3%) attend a private institution, while the remaining 30,092 (85.7%) are enrolled in public schools. The age group of 18 to 19 year olds has the highest likelihood of being enrolled in private schools, with 1,505 (38.1% in the age bracket) enrolled. Conversely, the age group of 15 to 17 year olds has the lowest likelihood of being enrolled in a private school, with 4,584 (93.6% in the age bracket) attending a public institution.
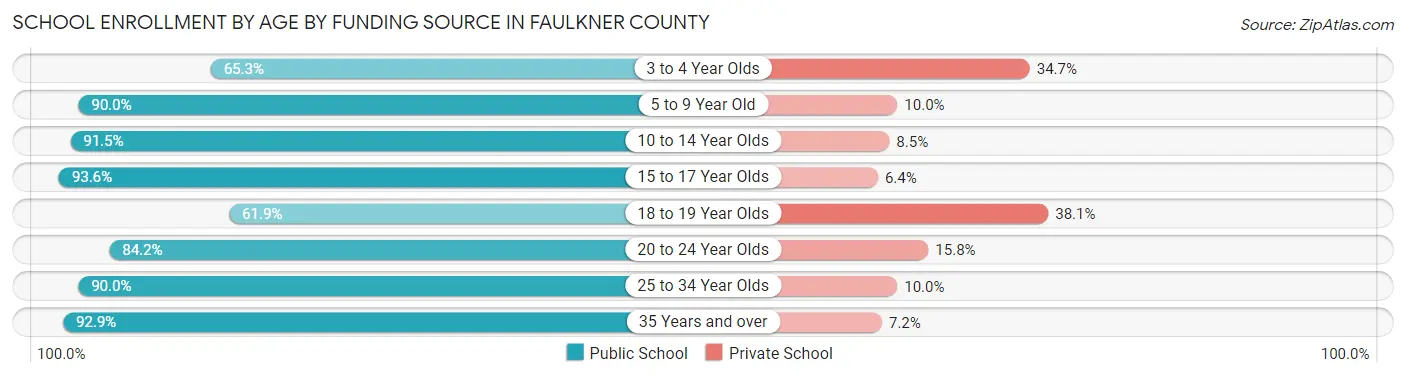
| Age Bracket | Public School | Private School |
| 3 to 4 Year Olds | 814 (65.3%) | 432 (34.7%) |
| 5 to 9 Year Old | 6,763 (90.0%) | 752 (10.0%) |
| 10 to 14 Year Olds | 6,718 (91.5%) | 626 (8.5%) |
| 15 to 17 Year Olds | 4,584 (93.6%) | 313 (6.4%) |
| 18 to 19 Year Olds | 2,444 (61.9%) | 1,505 (38.1%) |
| 20 to 24 Year Olds | 6,140 (84.2%) | 1,150 (15.8%) |
| 25 to 34 Year Olds | 1,415 (90.0%) | 157 (10.0%) |
| 35 Years and over | 1,207 (92.8%) | 93 (7.1%) |
| Total | 30,092 (85.7%) | 5,021 (14.3%) |
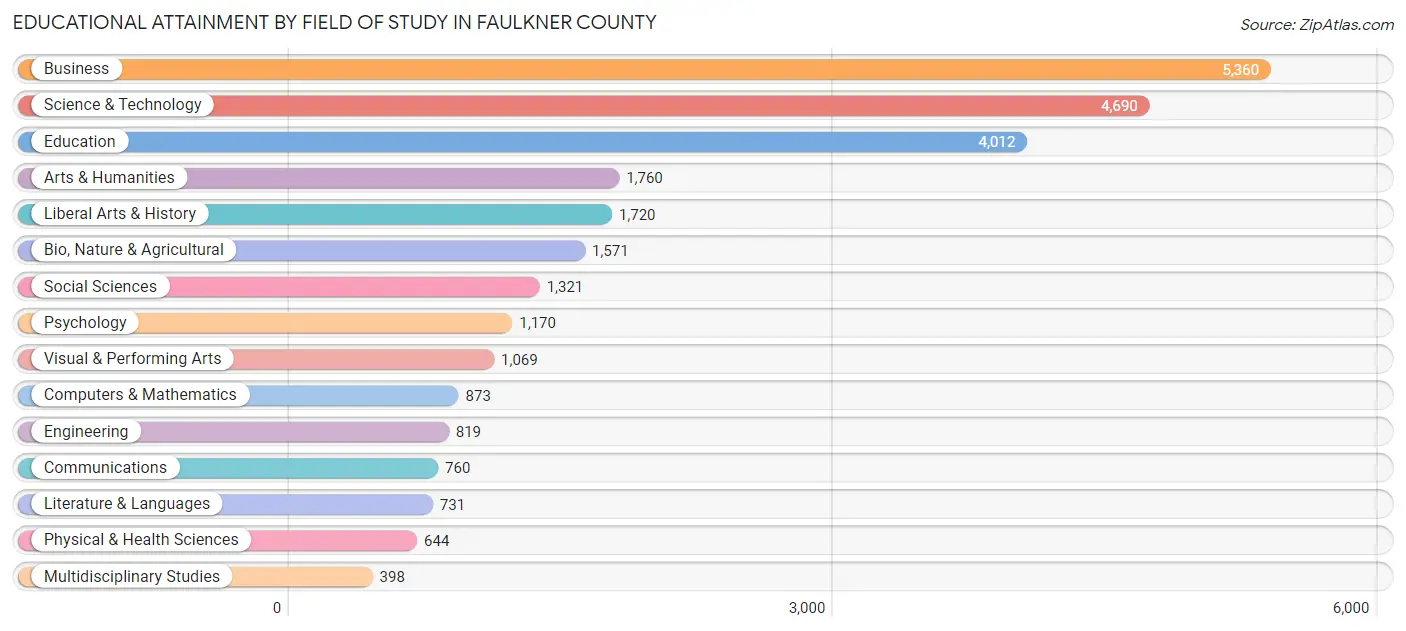
Educational Attainment by Field of Study in Faulkner County
Business (5,360 | 19.9%), science & technology (4,690 | 17.4%), education (4,012 | 14.9%), arts & humanities (1,760 | 6.5%), and liberal arts & history (1,720 | 6.4%) are the most common fields of study among 26,898 individuals in Faulkner County who have obtained a bachelor's degree or higher.
| Field of Study | # Graduates | % Graduates |
| Computers & Mathematics | 873 | 3.3% |
| Bio, Nature & Agricultural | 1,571 | 5.8% |
| Physical & Health Sciences | 644 | 2.4% |
| Psychology | 1,170 | 4.3% |
| Social Sciences | 1,321 | 4.9% |
| Engineering | 819 | 3.0% |
| Multidisciplinary Studies | 398 | 1.5% |
| Science & Technology | 4,690 | 17.4% |
| Business | 5,360 | 19.9% |
| Education | 4,012 | 14.9% |
| Literature & Languages | 731 | 2.7% |
| Liberal Arts & History | 1,720 | 6.4% |
| Visual & Performing Arts | 1,069 | 4.0% |
| Communications | 760 | 2.8% |
| Arts & Humanities | 1,760 | 6.5% |
| Total | 26,898 | 100.0% |
Transportation & Commute in Faulkner County
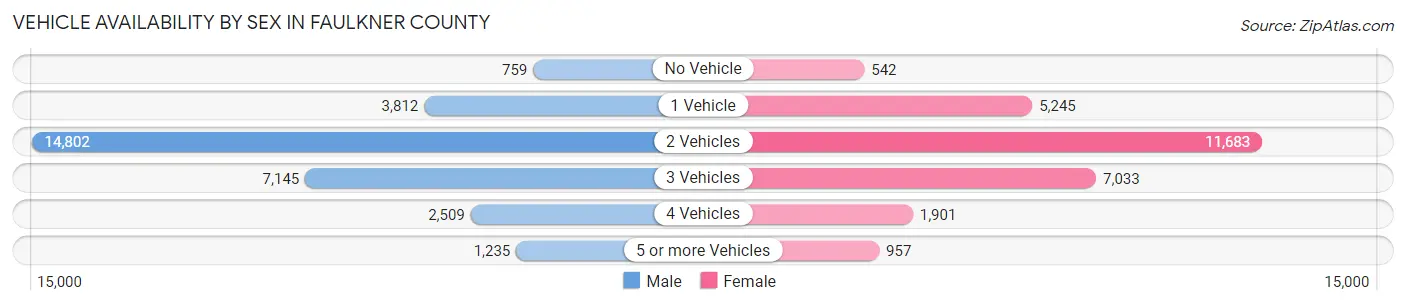
Vehicle Availability by Sex in Faulkner County
The most prevalent vehicle ownership categories in Faulkner County are males with 2 vehicles (14,802, accounting for 48.9%) and females with 2 vehicles (11,683, making up 54.1%).
| Vehicles Available | Male | Female |
| No Vehicle | 759 (2.5%) | 542 (2.0%) |
| 1 Vehicle | 3,812 (12.6%) | 5,245 (19.2%) |
| 2 Vehicles | 14,802 (48.9%) | 11,683 (42.7%) |
| 3 Vehicles | 7,145 (23.6%) | 7,033 (25.7%) |
| 4 Vehicles | 2,509 (8.3%) | 1,901 (7.0%) |
| 5 or more Vehicles | 1,235 (4.1%) | 957 (3.5%) |
| Total | 30,262 (100.0%) | 27,361 (100.0%) |
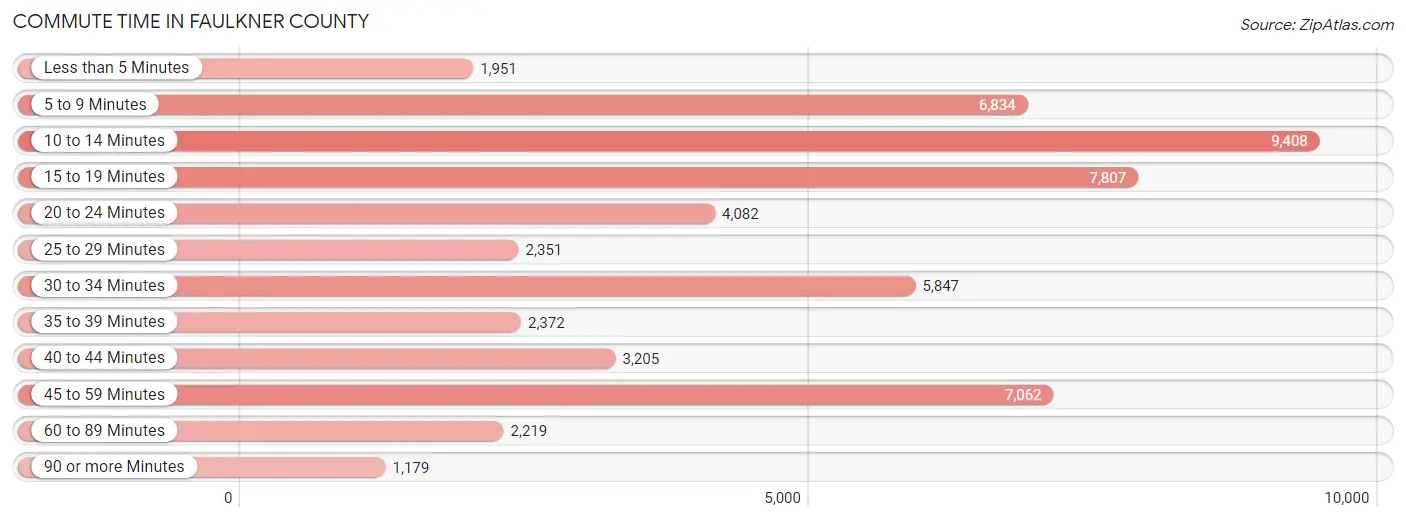
Commute Time in Faulkner County
The most frequently occuring commute durations in Faulkner County are 10 to 14 minutes (9,408 commuters, 17.3%), 15 to 19 minutes (7,807 commuters, 14.4%), and 45 to 59 minutes (7,062 commuters, 13.0%).
| Commute Time | # Commuters | % Commuters |
| Less than 5 Minutes | 1,951 | 3.6% |
| 5 to 9 Minutes | 6,834 | 12.6% |
| 10 to 14 Minutes | 9,408 | 17.3% |
| 15 to 19 Minutes | 7,807 | 14.4% |
| 20 to 24 Minutes | 4,082 | 7.5% |
| 25 to 29 Minutes | 2,351 | 4.3% |
| 30 to 34 Minutes | 5,847 | 10.8% |
| 35 to 39 Minutes | 2,372 | 4.4% |
| 40 to 44 Minutes | 3,205 | 5.9% |
| 45 to 59 Minutes | 7,062 | 13.0% |
| 60 to 89 Minutes | 2,219 | 4.1% |
| 90 or more Minutes | 1,179 | 2.2% |
Commute Time by Sex in Faulkner County
The most common commute times in Faulkner County are 10 to 14 minutes (5,327 commuters, 18.6%) for males and 5 to 9 minutes (4,294 commuters, 16.7%) for females.
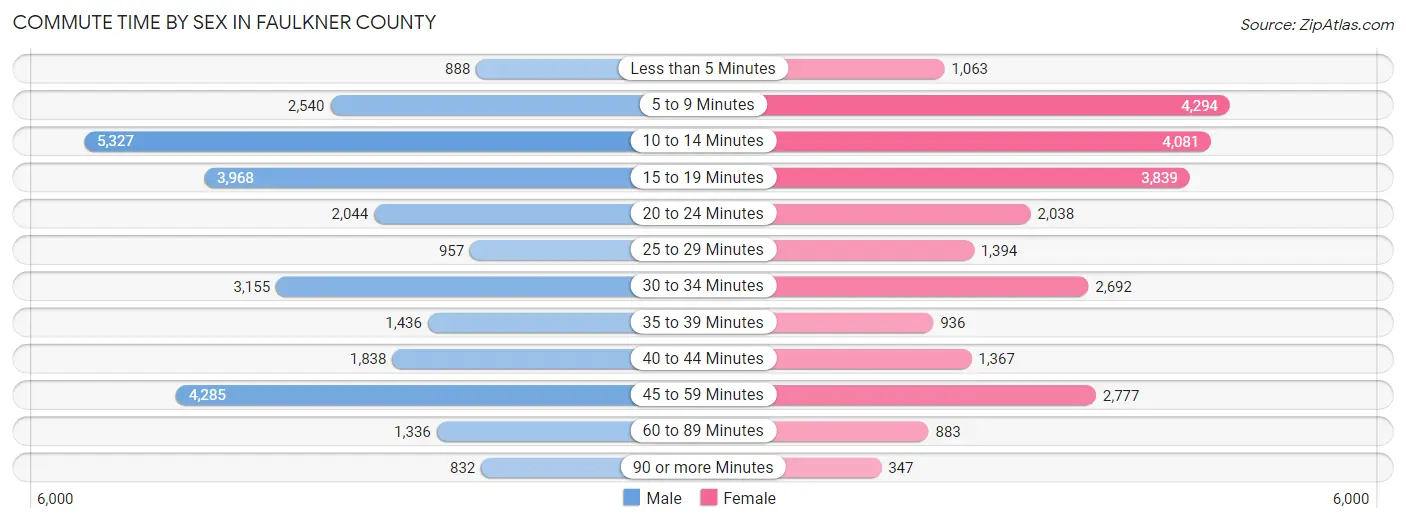
| Commute Time | Male | Female |
| Less than 5 Minutes | 888 (3.1%) | 1,063 (4.1%) |
| 5 to 9 Minutes | 2,540 (8.9%) | 4,294 (16.7%) |
| 10 to 14 Minutes | 5,327 (18.6%) | 4,081 (15.9%) |
| 15 to 19 Minutes | 3,968 (13.9%) | 3,839 (14.9%) |
| 20 to 24 Minutes | 2,044 (7.1%) | 2,038 (7.9%) |
| 25 to 29 Minutes | 957 (3.4%) | 1,394 (5.4%) |
| 30 to 34 Minutes | 3,155 (11.0%) | 2,692 (10.5%) |
| 35 to 39 Minutes | 1,436 (5.0%) | 936 (3.6%) |
| 40 to 44 Minutes | 1,838 (6.4%) | 1,367 (5.3%) |
| 45 to 59 Minutes | 4,285 (15.0%) | 2,777 (10.8%) |
| 60 to 89 Minutes | 1,336 (4.7%) | 883 (3.4%) |
| 90 or more Minutes | 832 (2.9%) | 347 (1.3%) |
Time of Departure to Work by Sex in Faulkner County
The most frequent times of departure to work in Faulkner County are 7:00 AM to 7:29 AM (4,076, 14.2%) for males and 7:00 AM to 7:29 AM (5,343, 20.8%) for females.
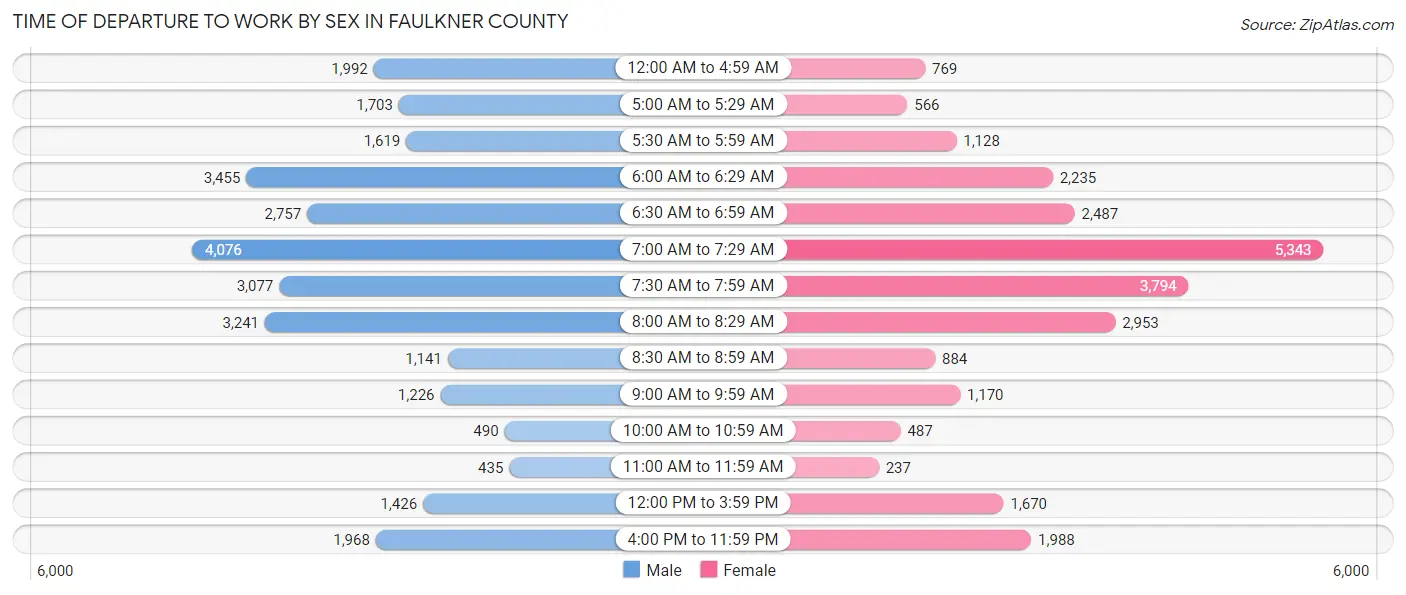
| Time of Departure | Male | Female |
| 12:00 AM to 4:59 AM | 1,992 (7.0%) | 769 (3.0%) |
| 5:00 AM to 5:29 AM | 1,703 (5.9%) | 566 (2.2%) |
| 5:30 AM to 5:59 AM | 1,619 (5.7%) | 1,128 (4.4%) |
| 6:00 AM to 6:29 AM | 3,455 (12.1%) | 2,235 (8.7%) |
| 6:30 AM to 6:59 AM | 2,757 (9.6%) | 2,487 (9.7%) |
| 7:00 AM to 7:29 AM | 4,076 (14.2%) | 5,343 (20.8%) |
| 7:30 AM to 7:59 AM | 3,077 (10.8%) | 3,794 (14.8%) |
| 8:00 AM to 8:29 AM | 3,241 (11.3%) | 2,953 (11.5%) |
| 8:30 AM to 8:59 AM | 1,141 (4.0%) | 884 (3.4%) |
| 9:00 AM to 9:59 AM | 1,226 (4.3%) | 1,170 (4.5%) |
| 10:00 AM to 10:59 AM | 490 (1.7%) | 487 (1.9%) |
| 11:00 AM to 11:59 AM | 435 (1.5%) | 237 (0.9%) |
| 12:00 PM to 3:59 PM | 1,426 (5.0%) | 1,670 (6.5%) |
| 4:00 PM to 11:59 PM | 1,968 (6.9%) | 1,988 (7.7%) |
| Total | 28,606 (100.0%) | 25,711 (100.0%) |
Housing Occupancy in Faulkner County
Occupancy by Ownership in Faulkner County
Of the total 47,396 dwellings in Faulkner County, owner-occupied units account for 29,531 (62.3%), while renter-occupied units make up 17,865 (37.7%).
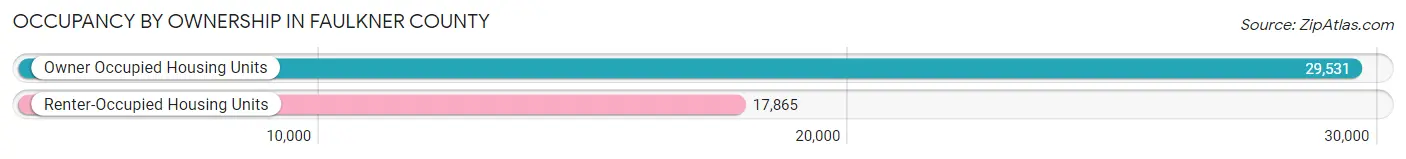
| Occupancy | # Housing Units | % Housing Units |
| Owner Occupied Housing Units | 29,531 | 62.3% |
| Renter-Occupied Housing Units | 17,865 | 37.7% |
| Total Occupied Housing Units | 47,396 | 100.0% |
Occupancy by Household Size in Faulkner County
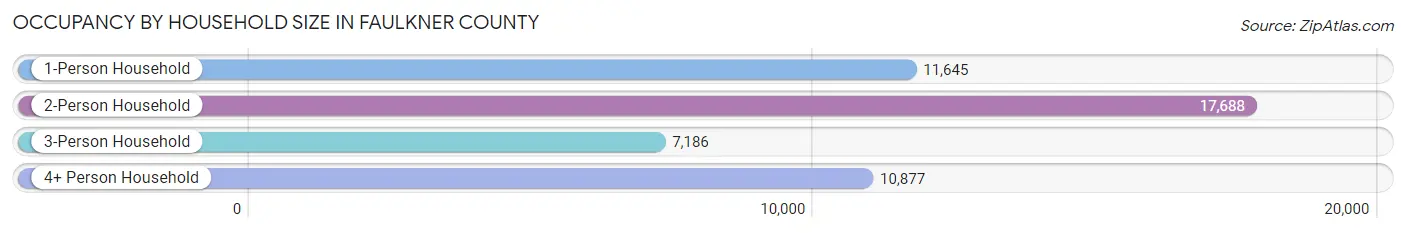
| Household Size | # Housing Units | % Housing Units |
| 1-Person Household | 11,645 | 24.6% |
| 2-Person Household | 17,688 | 37.3% |
| 3-Person Household | 7,186 | 15.2% |
| 4+ Person Household | 10,877 | 23.0% |
| Total Housing Units | 47,396 | 100.0% |
Occupancy by Ownership by Household Size in Faulkner County
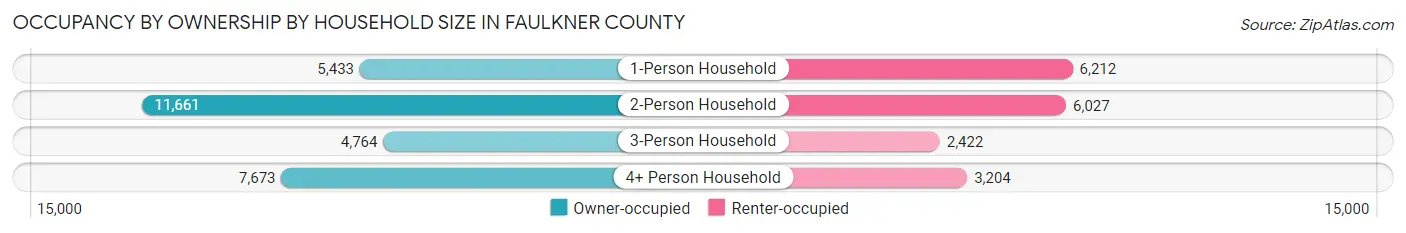
| Household Size | Owner-occupied | Renter-occupied |
| 1-Person Household | 5,433 (46.7%) | 6,212 (53.3%) |
| 2-Person Household | 11,661 (65.9%) | 6,027 (34.1%) |
| 3-Person Household | 4,764 (66.3%) | 2,422 (33.7%) |
| 4+ Person Household | 7,673 (70.5%) | 3,204 (29.5%) |
| Total Housing Units | 29,531 (62.3%) | 17,865 (37.7%) |
Occupancy by Educational Attainment in Faulkner County
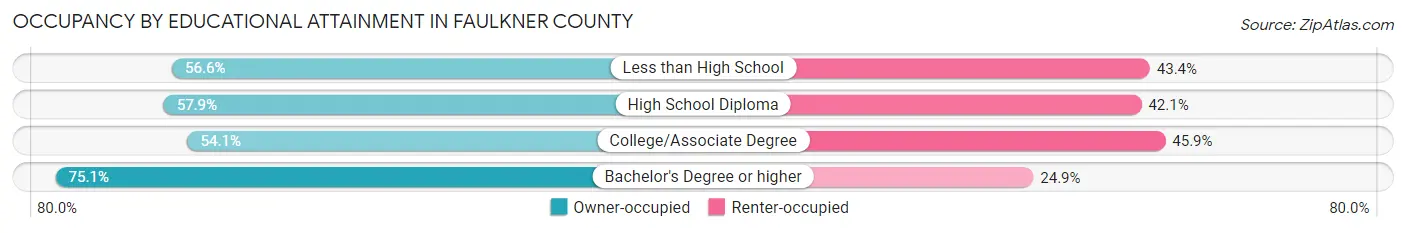
| Household Size | Owner-occupied | Renter-occupied |
| Less than High School | 1,459 (56.6%) | 1,119 (43.4%) |
| High School Diploma | 7,167 (57.9%) | 5,207 (42.1%) |
| College/Associate Degree | 8,917 (54.1%) | 7,557 (45.9%) |
| Bachelor's Degree or higher | 11,988 (75.1%) | 3,982 (24.9%) |
Occupancy by Age of Householder in Faulkner County
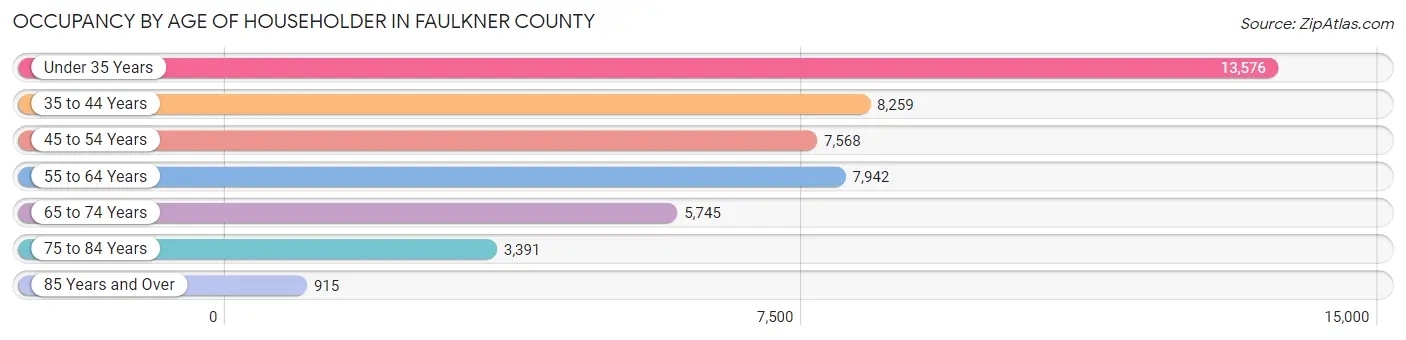
| Age Bracket | # Households | % Households |
| Under 35 Years | 13,576 | 28.6% |
| 35 to 44 Years | 8,259 | 17.4% |
| 45 to 54 Years | 7,568 | 16.0% |
| 55 to 64 Years | 7,942 | 16.8% |
| 65 to 74 Years | 5,745 | 12.1% |
| 75 to 84 Years | 3,391 | 7.1% |
| 85 Years and Over | 915 | 1.9% |
| Total | 47,396 | 100.0% |
Housing Finances in Faulkner County
Median Income by Occupancy in Faulkner County
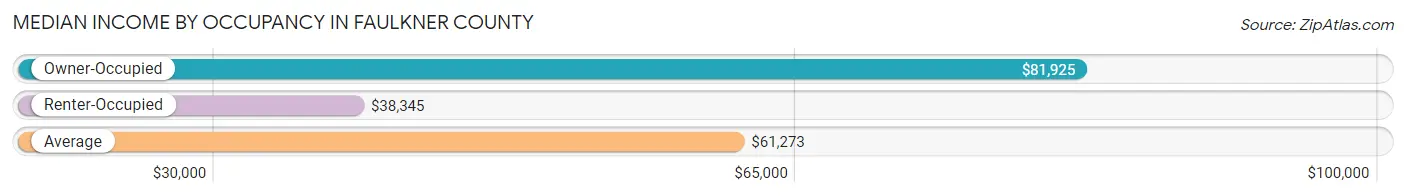
| Occupancy Type | # Households | Median Income |
| Owner-Occupied | 29,531 (62.3%) | $81,925 |
| Renter-Occupied | 17,865 (37.7%) | $38,345 |
| Average | 47,396 (100.0%) | $61,273 |
Occupancy by Householder Income Bracket in Faulkner County
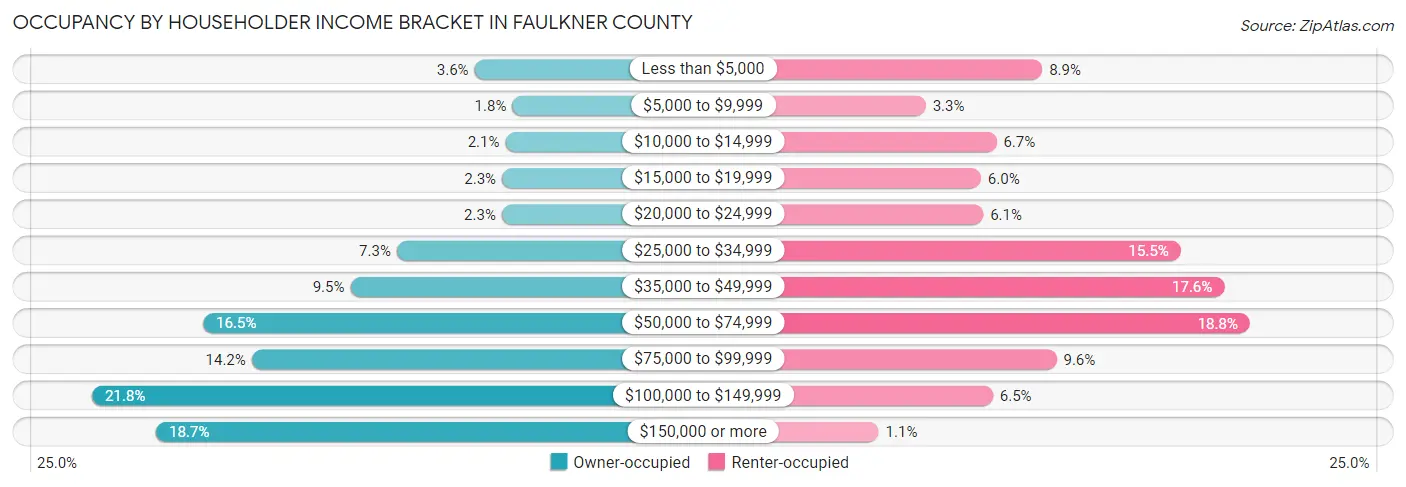
| Income Bracket | Owner-occupied | Renter-occupied |
| Less than $5,000 | 1,056 (3.6%) | 1,589 (8.9%) |
| $5,000 to $9,999 | 527 (1.8%) | 597 (3.3%) |
| $10,000 to $14,999 | 622 (2.1%) | 1,198 (6.7%) |
| $15,000 to $19,999 | 669 (2.3%) | 1,066 (6.0%) |
| $20,000 to $24,999 | 674 (2.3%) | 1,087 (6.1%) |
| $25,000 to $34,999 | 2,150 (7.3%) | 2,765 (15.5%) |
| $35,000 to $49,999 | 2,802 (9.5%) | 3,135 (17.5%) |
| $50,000 to $74,999 | 4,873 (16.5%) | 3,353 (18.8%) |
| $75,000 to $99,999 | 4,190 (14.2%) | 1,710 (9.6%) |
| $100,000 to $149,999 | 6,434 (21.8%) | 1,168 (6.5%) |
| $150,000 or more | 5,534 (18.7%) | 197 (1.1%) |
| Total | 29,531 (100.0%) | 17,865 (100.0%) |
Monthly Housing Cost Tiers in Faulkner County
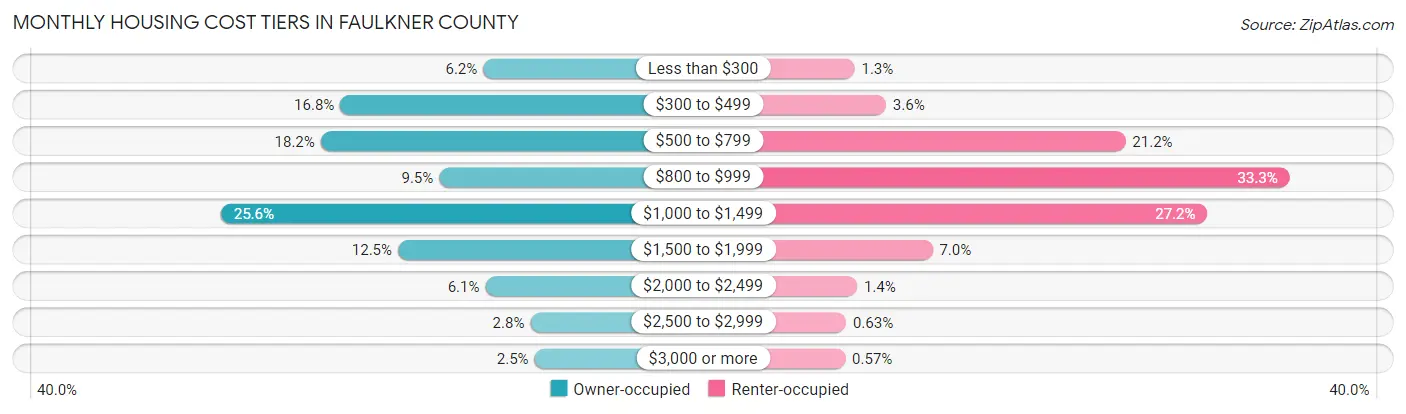
| Monthly Cost | Owner-occupied | Renter-occupied |
| Less than $300 | 1,840 (6.2%) | 225 (1.3%) |
| $300 to $499 | 4,948 (16.8%) | 638 (3.6%) |
| $500 to $799 | 5,376 (18.2%) | 3,789 (21.2%) |
| $800 to $999 | 2,797 (9.5%) | 5,949 (33.3%) |
| $1,000 to $1,499 | 7,546 (25.6%) | 4,866 (27.2%) |
| $1,500 to $1,999 | 3,693 (12.5%) | 1,251 (7.0%) |
| $2,000 to $2,499 | 1,794 (6.1%) | 258 (1.4%) |
| $2,500 to $2,999 | 814 (2.8%) | 112 (0.6%) |
| $3,000 or more | 723 (2.5%) | 102 (0.6%) |
| Total | 29,531 (100.0%) | 17,865 (100.0%) |
Physical Housing Characteristics in Faulkner County
Housing Structures in Faulkner County
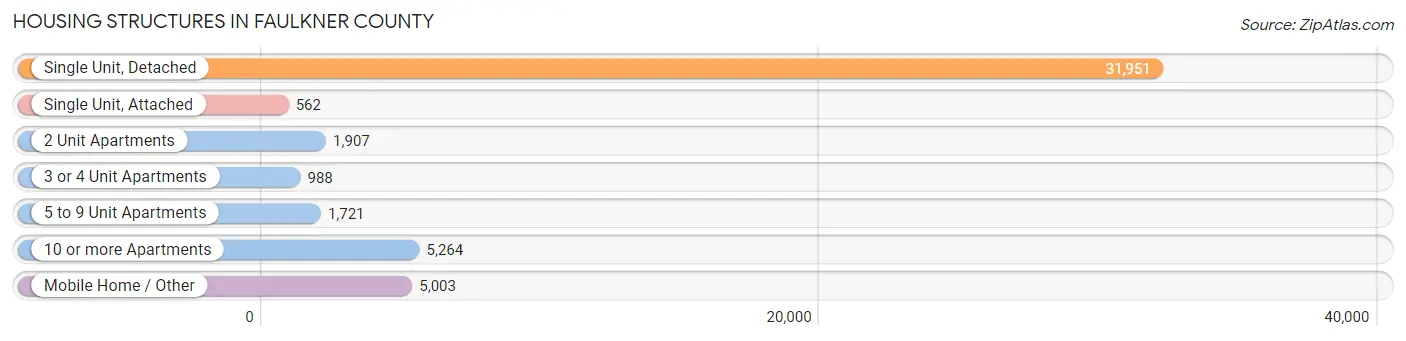
| Structure Type | # Housing Units | % Housing Units |
| Single Unit, Detached | 31,951 | 67.4% |
| Single Unit, Attached | 562 | 1.2% |
| 2 Unit Apartments | 1,907 | 4.0% |
| 3 or 4 Unit Apartments | 988 | 2.1% |
| 5 to 9 Unit Apartments | 1,721 | 3.6% |
| 10 or more Apartments | 5,264 | 11.1% |
| Mobile Home / Other | 5,003 | 10.6% |
| Total | 47,396 | 100.0% |
Housing Structures by Occupancy in Faulkner County
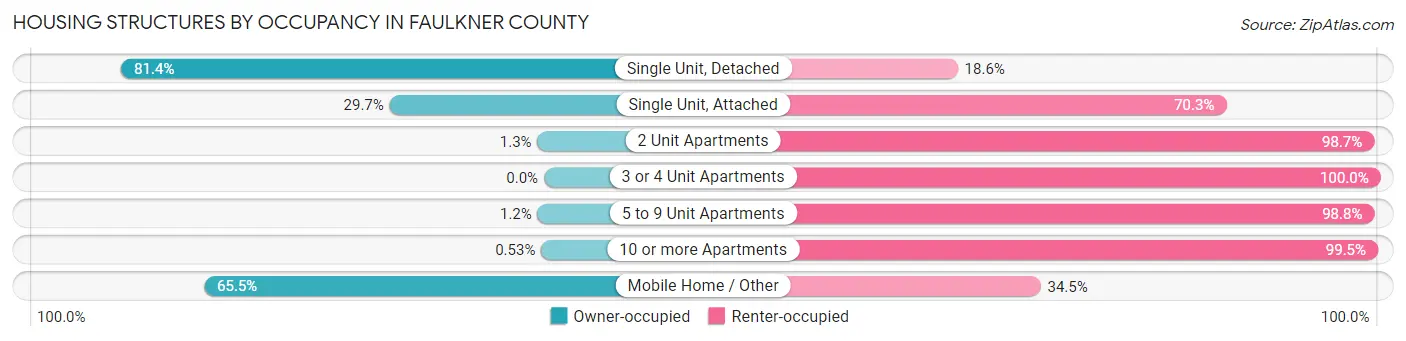
| Structure Type | Owner-occupied | Renter-occupied |
| Single Unit, Detached | 26,016 (81.4%) | 5,935 (18.6%) |
| Single Unit, Attached | 167 (29.7%) | 395 (70.3%) |
| 2 Unit Apartments | 24 (1.3%) | 1,883 (98.7%) |
| 3 or 4 Unit Apartments | 0 (0.0%) | 988 (100.0%) |
| 5 to 9 Unit Apartments | 21 (1.2%) | 1,700 (98.8%) |
| 10 or more Apartments | 28 (0.5%) | 5,236 (99.5%) |
| Mobile Home / Other | 3,275 (65.5%) | 1,728 (34.5%) |
| Total | 29,531 (62.3%) | 17,865 (37.7%) |
Housing Structures by Number of Rooms in Faulkner County
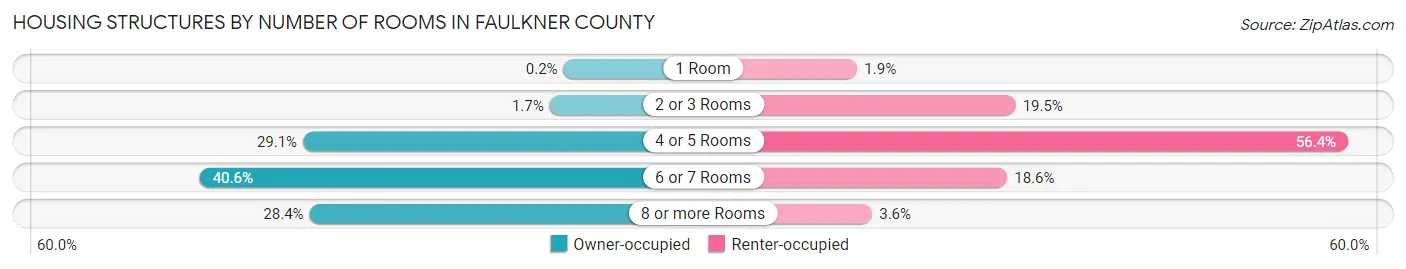
| Number of Rooms | Owner-occupied | Renter-occupied |
| 1 Room | 60 (0.2%) | 346 (1.9%) |
| 2 or 3 Rooms | 514 (1.7%) | 3,485 (19.5%) |
| 4 or 5 Rooms | 8,596 (29.1%) | 10,073 (56.4%) |
| 6 or 7 Rooms | 11,977 (40.6%) | 3,320 (18.6%) |
| 8 or more Rooms | 8,384 (28.4%) | 641 (3.6%) |
| Total | 29,531 (100.0%) | 17,865 (100.0%) |
Housing Structure by Heating Type in Faulkner County
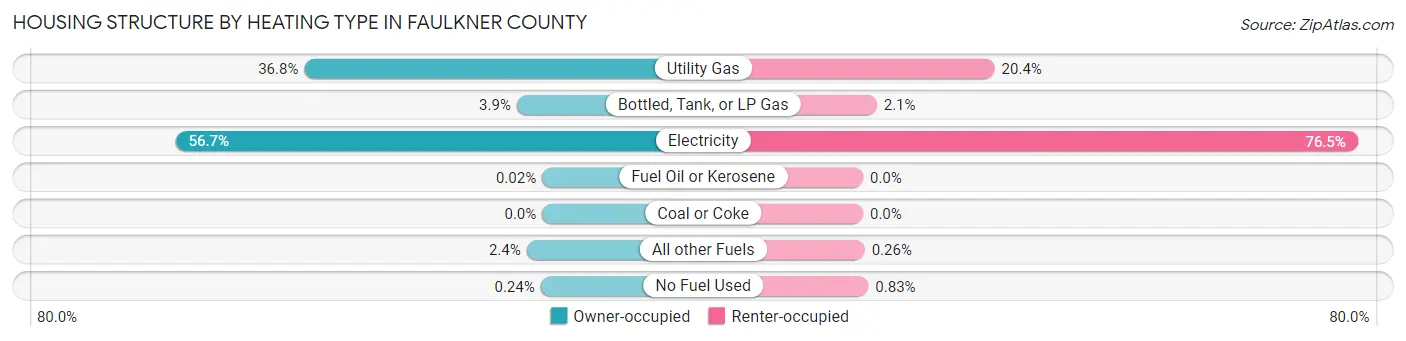
| Heating Type | Owner-occupied | Renter-occupied |
| Utility Gas | 10,859 (36.8%) | 3,635 (20.3%) |
| Bottled, Tank, or LP Gas | 1,157 (3.9%) | 379 (2.1%) |
| Electricity | 16,730 (56.7%) | 13,657 (76.4%) |
| Fuel Oil or Kerosene | 5 (0.0%) | 0 (0.0%) |
| Coal or Coke | 0 (0.0%) | 0 (0.0%) |
| All other Fuels | 710 (2.4%) | 46 (0.3%) |
| No Fuel Used | 70 (0.2%) | 148 (0.8%) |
| Total | 29,531 (100.0%) | 17,865 (100.0%) |
Household Vehicle Usage in Faulkner County
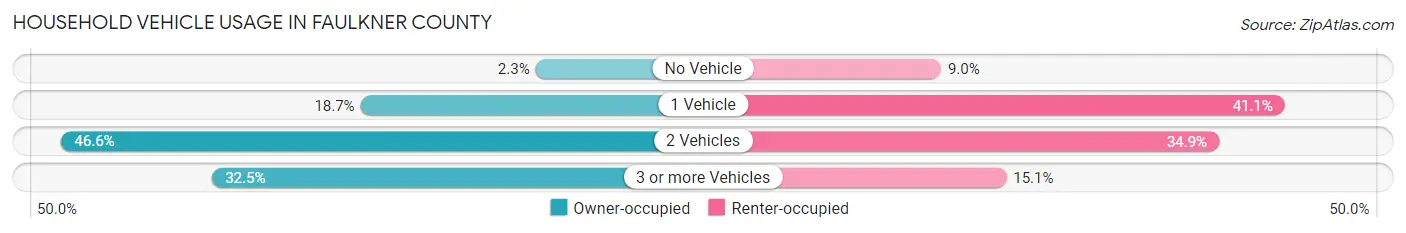
| Vehicles per Household | Owner-occupied | Renter-occupied |
| No Vehicle | 681 (2.3%) | 1,602 (9.0%) |
| 1 Vehicle | 5,508 (18.6%) | 7,335 (41.1%) |
| 2 Vehicles | 13,750 (46.6%) | 6,237 (34.9%) |
| 3 or more Vehicles | 9,592 (32.5%) | 2,691 (15.1%) |
| Total | 29,531 (100.0%) | 17,865 (100.0%) |
Real Estate & Mortgages in Faulkner County
Real Estate and Mortgage Overview in Faulkner County
| Characteristic | Without Mortgage | With Mortgage |
| Housing Units | 11,102 | 18,429 |
| Median Property Value | $181,300 | $202,600 |
| Median Household Income | $60,596 | $4,199 |
| Monthly Housing Costs | $464 | $712 |
| Real Estate Taxes | $1,042 | $638 |
Property Value by Mortgage Status in Faulkner County
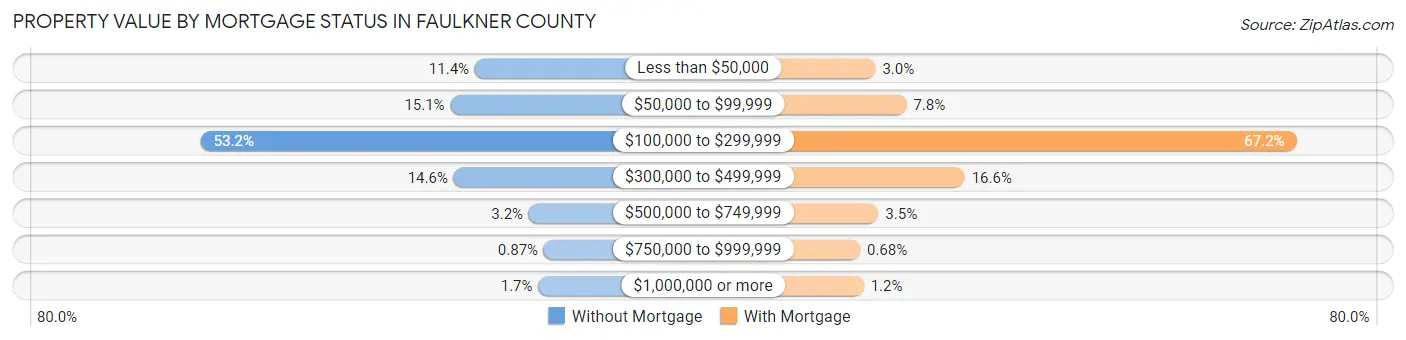
| Property Value | Without Mortgage | With Mortgage |
| Less than $50,000 | 1,263 (11.4%) | 560 (3.0%) |
| $50,000 to $99,999 | 1,677 (15.1%) | 1,430 (7.8%) |
| $100,000 to $299,999 | 5,903 (53.2%) | 12,379 (67.2%) |
| $300,000 to $499,999 | 1,622 (14.6%) | 3,066 (16.6%) |
| $500,000 to $749,999 | 350 (3.2%) | 641 (3.5%) |
| $750,000 to $999,999 | 97 (0.9%) | 125 (0.7%) |
| $1,000,000 or more | 190 (1.7%) | 228 (1.2%) |
| Total | 11,102 (100.0%) | 18,429 (100.0%) |
Household Income by Mortgage Status in Faulkner County
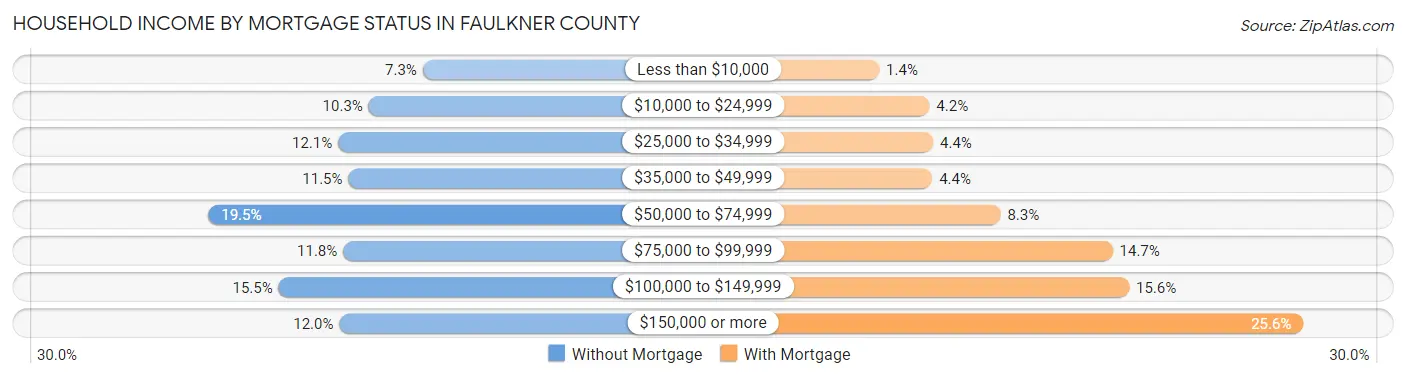
| Household Income | Without Mortgage | With Mortgage |
| Less than $10,000 | 805 (7.2%) | 248 (1.3%) |
| $10,000 to $24,999 | 1,148 (10.3%) | 778 (4.2%) |
| $25,000 to $34,999 | 1,342 (12.1%) | 817 (4.4%) |
| $35,000 to $49,999 | 1,277 (11.5%) | 808 (4.4%) |
| $50,000 to $74,999 | 2,165 (19.5%) | 1,525 (8.3%) |
| $75,000 to $99,999 | 1,310 (11.8%) | 2,708 (14.7%) |
| $100,000 to $149,999 | 1,720 (15.5%) | 2,880 (15.6%) |
| $150,000 or more | 1,335 (12.0%) | 4,714 (25.6%) |
| Total | 11,102 (100.0%) | 18,429 (100.0%) |
Property Value to Household Income Ratio in Faulkner County
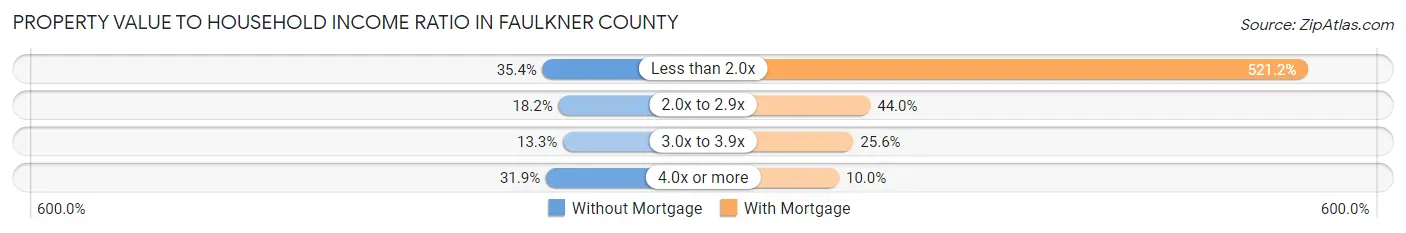
| Value-to-Income Ratio | Without Mortgage | With Mortgage |
| Less than 2.0x | 3,934 (35.4%) | 96,045 (521.2%) |
| 2.0x to 2.9x | 2,023 (18.2%) | 8,099 (44.0%) |
| 3.0x to 3.9x | 1,478 (13.3%) | 4,714 (25.6%) |
| 4.0x or more | 3,538 (31.9%) | 1,838 (10.0%) |
| Total | 11,102 (100.0%) | 18,429 (100.0%) |
Real Estate Taxes by Mortgage Status in Faulkner County
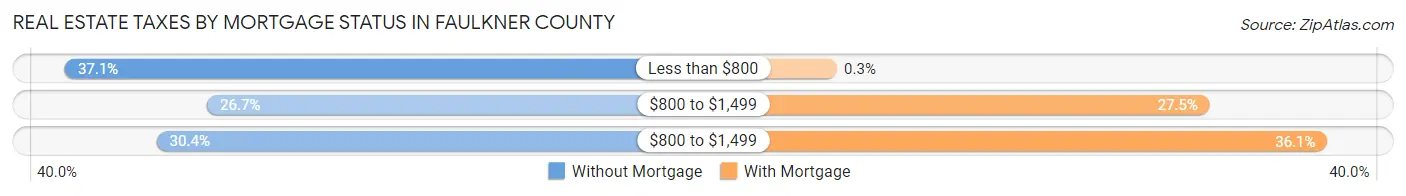
| Property Taxes | Without Mortgage | With Mortgage |
| Less than $800 | 4,113 (37.0%) | 55 (0.3%) |
| $800 to $1,499 | 2,960 (26.7%) | 5,071 (27.5%) |
| $800 to $1,499 | 3,369 (30.3%) | 6,655 (36.1%) |
| Total | 11,102 (100.0%) | 18,429 (100.0%) |
Health & Disability in Faulkner County
Health Insurance Coverage by Age in Faulkner County
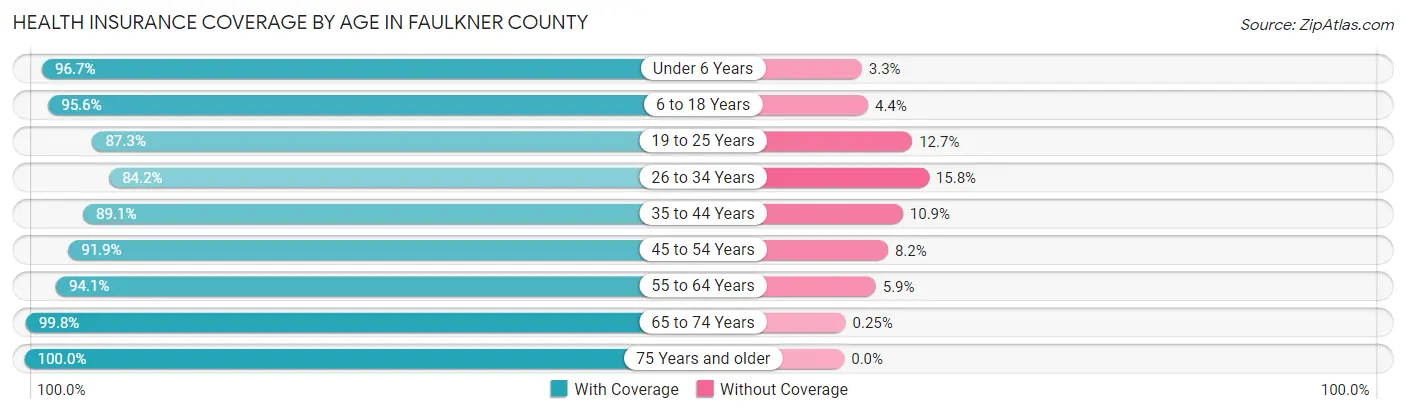
| Age Bracket | With Coverage | Without Coverage |
| Under 6 Years | 8,519 (96.7%) | 288 (3.3%) |
| 6 to 18 Years | 20,876 (95.6%) | 968 (4.4%) |
| 19 to 25 Years | 15,915 (87.3%) | 2,308 (12.7%) |
| 26 to 34 Years | 12,705 (84.2%) | 2,380 (15.8%) |
| 35 to 44 Years | 13,851 (89.1%) | 1,698 (10.9%) |
| 45 to 54 Years | 12,498 (91.8%) | 1,109 (8.2%) |
| 55 to 64 Years | 12,754 (94.1%) | 795 (5.9%) |
| 65 to 74 Years | 9,646 (99.8%) | 24 (0.3%) |
| 75 Years and older | 6,492 (100.0%) | 0 (0.0%) |
| Total | 113,256 (92.2%) | 9,570 (7.8%) |
Health Insurance Coverage by Citizenship Status in Faulkner County
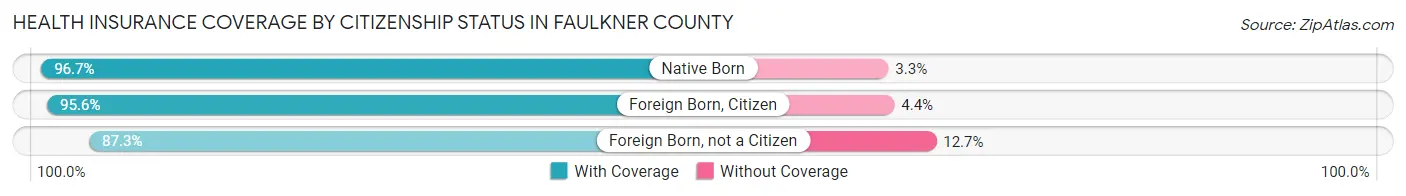
| Citizenship Status | With Coverage | Without Coverage |
| Native Born | 8,519 (96.7%) | 288 (3.3%) |
| Foreign Born, Citizen | 20,876 (95.6%) | 968 (4.4%) |
| Foreign Born, not a Citizen | 15,915 (87.3%) | 2,308 (12.7%) |
Health Insurance Coverage by Household Income in Faulkner County
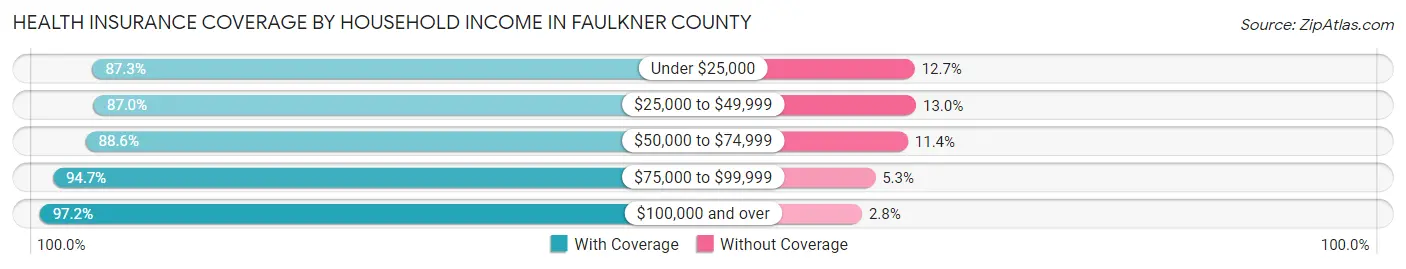
| Household Income | With Coverage | Without Coverage |
| Under $25,000 | 13,534 (87.3%) | 1,972 (12.7%) |
| $25,000 to $49,999 | 20,421 (87.0%) | 3,047 (13.0%) |
| $50,000 to $74,999 | 18,130 (88.6%) | 2,342 (11.4%) |
| $75,000 to $99,999 | 15,326 (94.7%) | 862 (5.3%) |
| $100,000 and over | 42,076 (97.2%) | 1,229 (2.8%) |
Public vs Private Health Insurance Coverage by Age in Faulkner County
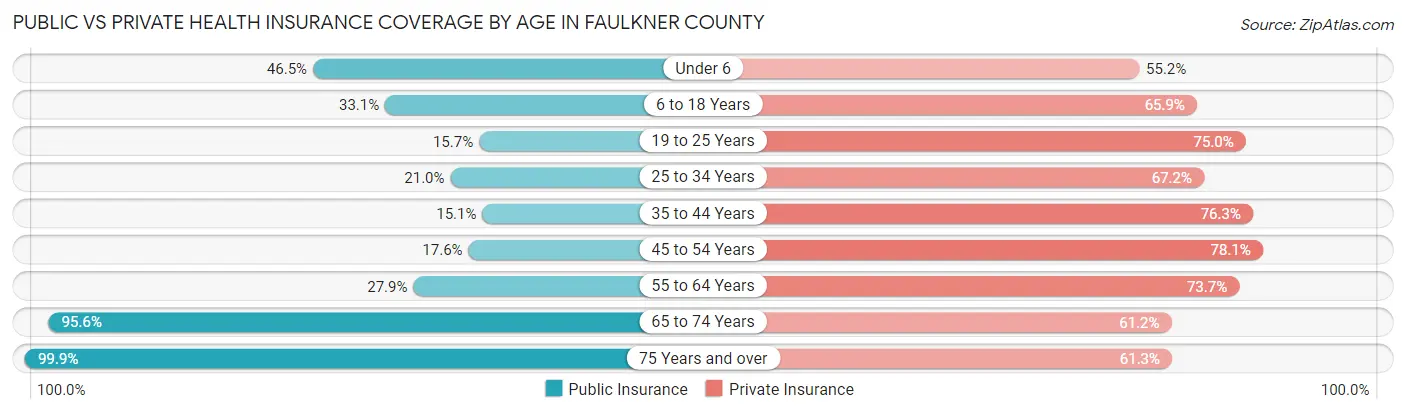
| Age Bracket | Public Insurance | Private Insurance |
| Under 6 | 4,094 (46.5%) | 4,861 (55.2%) |
| 6 to 18 Years | 7,229 (33.1%) | 14,389 (65.9%) |
| 19 to 25 Years | 2,853 (15.7%) | 13,658 (75.0%) |
| 25 to 34 Years | 3,164 (21.0%) | 10,135 (67.2%) |
| 35 to 44 Years | 2,340 (15.0%) | 11,859 (76.3%) |
| 45 to 54 Years | 2,398 (17.6%) | 10,629 (78.1%) |
| 55 to 64 Years | 3,773 (27.9%) | 9,988 (73.7%) |
| 65 to 74 Years | 9,241 (95.6%) | 5,913 (61.2%) |
| 75 Years and over | 6,487 (99.9%) | 3,977 (61.3%) |
| Total | 41,579 (33.9%) | 85,409 (69.5%) |
Disability Status by Sex by Age in Faulkner County
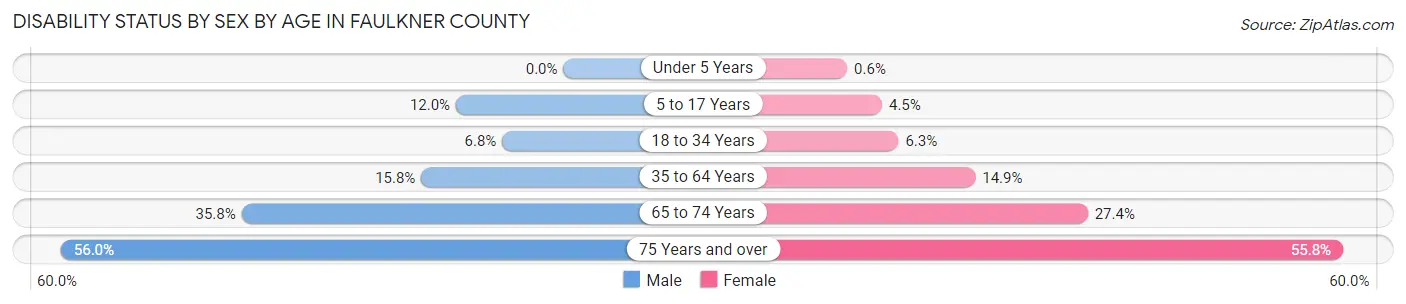
| Age Bracket | Male | Female |
| Under 5 Years | 0 (0.0%) | 21 (0.6%) |
| 5 to 17 Years | 1,282 (12.0%) | 455 (4.5%) |
| 18 to 34 Years | 1,170 (6.8%) | 1,177 (6.3%) |
| 35 to 64 Years | 3,326 (15.8%) | 3,225 (14.9%) |
| 65 to 74 Years | 1,605 (35.8%) | 1,422 (27.4%) |
| 75 Years and over | 1,493 (56.0%) | 2,134 (55.8%) |
Disability Class by Sex by Age in Faulkner County
Disability Class: Hearing Difficulty
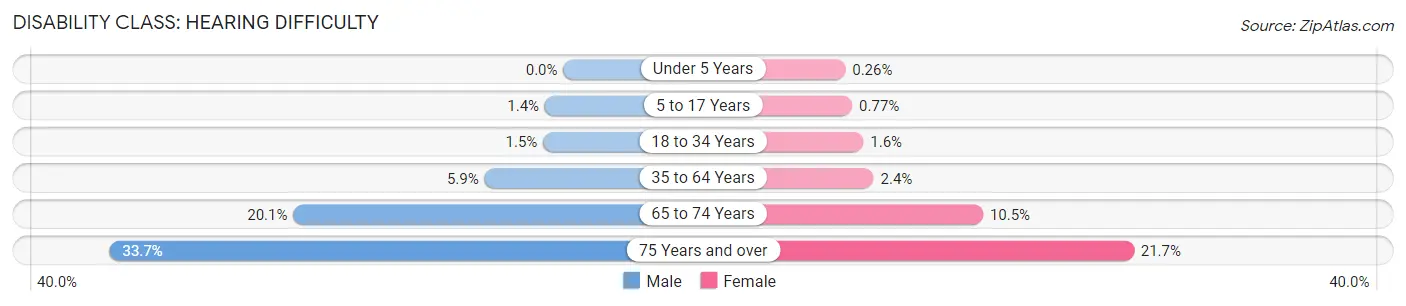
| Age Bracket | Male | Female |
| Under 5 Years | 0 (0.0%) | 9 (0.3%) |
| 5 to 17 Years | 147 (1.4%) | 78 (0.8%) |
| 18 to 34 Years | 257 (1.5%) | 298 (1.6%) |
| 35 to 64 Years | 1,230 (5.9%) | 512 (2.4%) |
| 65 to 74 Years | 898 (20.1%) | 544 (10.5%) |
| 75 Years and over | 899 (33.7%) | 829 (21.7%) |
Disability Class: Vision Difficulty
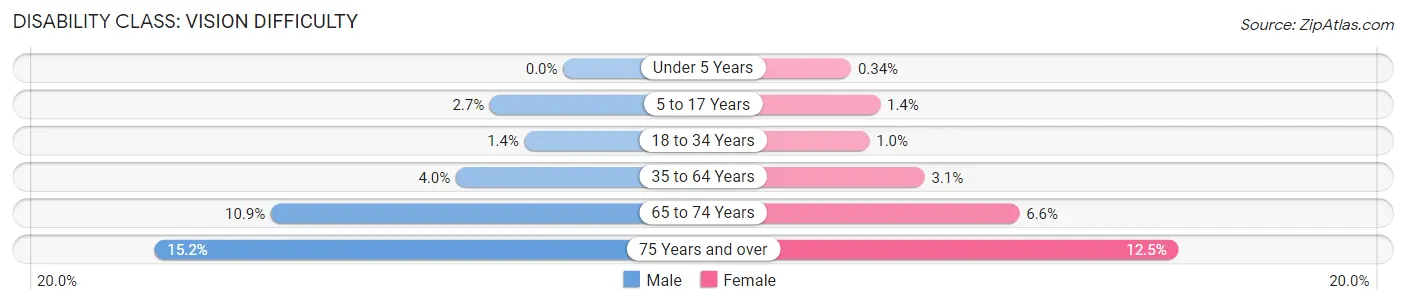
| Age Bracket | Male | Female |
| Under 5 Years | 0 (0.0%) | 12 (0.3%) |
| 5 to 17 Years | 291 (2.7%) | 144 (1.4%) |
| 18 to 34 Years | 245 (1.4%) | 191 (1.0%) |
| 35 to 64 Years | 837 (4.0%) | 665 (3.1%) |
| 65 to 74 Years | 486 (10.8%) | 342 (6.6%) |
| 75 Years and over | 405 (15.2%) | 478 (12.5%) |
Disability Class: Cognitive Difficulty
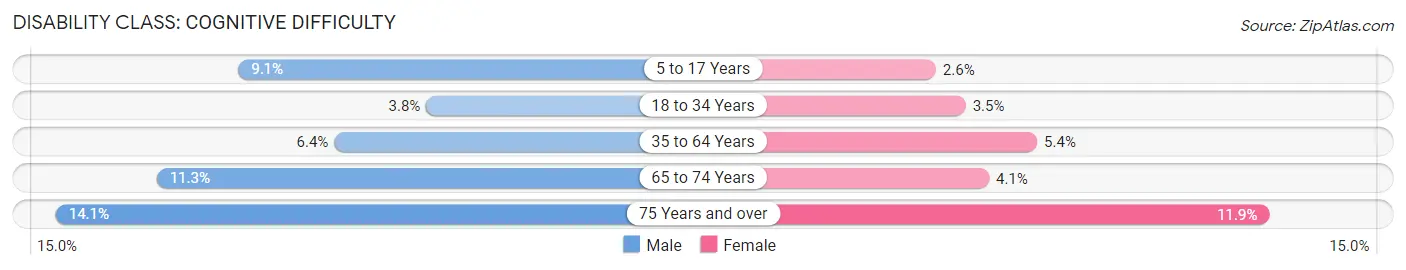
| Age Bracket | Male | Female |
| 5 to 17 Years | 970 (9.0%) | 266 (2.6%) |
| 18 to 34 Years | 656 (3.8%) | 643 (3.5%) |
| 35 to 64 Years | 1,340 (6.4%) | 1,179 (5.4%) |
| 65 to 74 Years | 507 (11.3%) | 213 (4.1%) |
| 75 Years and over | 377 (14.1%) | 455 (11.9%) |
Disability Class: Ambulatory Difficulty
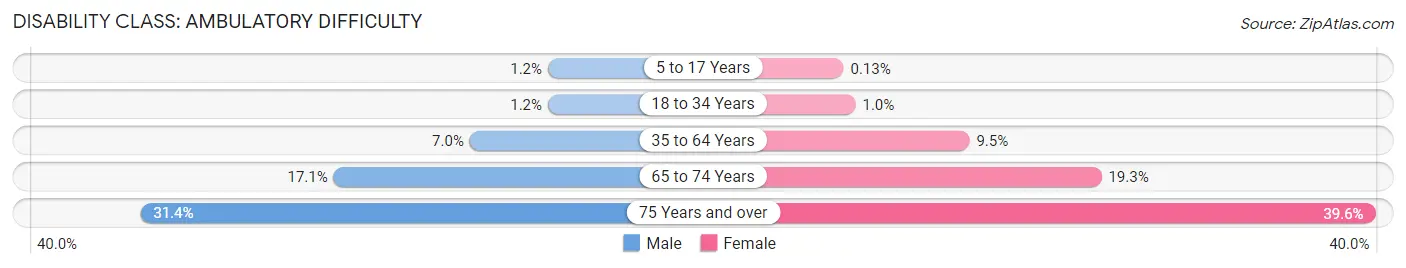
| Age Bracket | Male | Female |
| 5 to 17 Years | 123 (1.1%) | 13 (0.1%) |
| 18 to 34 Years | 198 (1.1%) | 191 (1.0%) |
| 35 to 64 Years | 1,460 (7.0%) | 2,057 (9.5%) |
| 65 to 74 Years | 764 (17.1%) | 1,001 (19.3%) |
| 75 Years and over | 838 (31.4%) | 1,515 (39.6%) |
Disability Class: Self-Care Difficulty
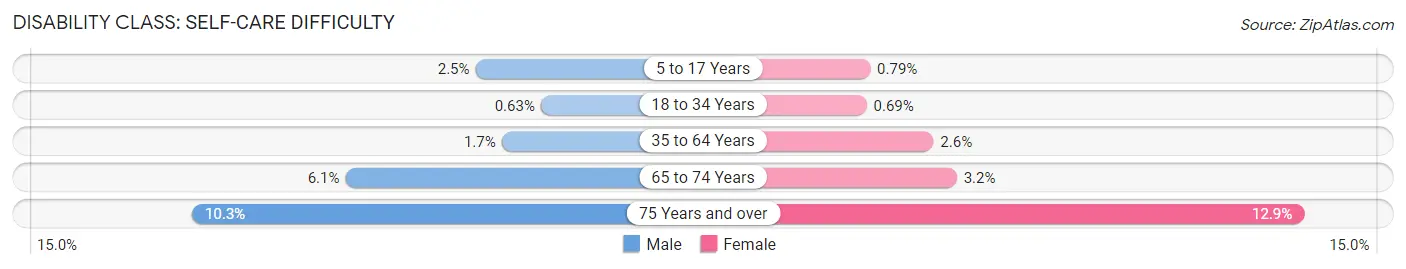
| Age Bracket | Male | Female |
| 5 to 17 Years | 263 (2.5%) | 80 (0.8%) |
| 18 to 34 Years | 109 (0.6%) | 129 (0.7%) |
| 35 to 64 Years | 362 (1.7%) | 554 (2.5%) |
| 65 to 74 Years | 272 (6.1%) | 166 (3.2%) |
| 75 Years and over | 276 (10.3%) | 492 (12.9%) |
Technology Access in Faulkner County
Computing Device Access in Faulkner County
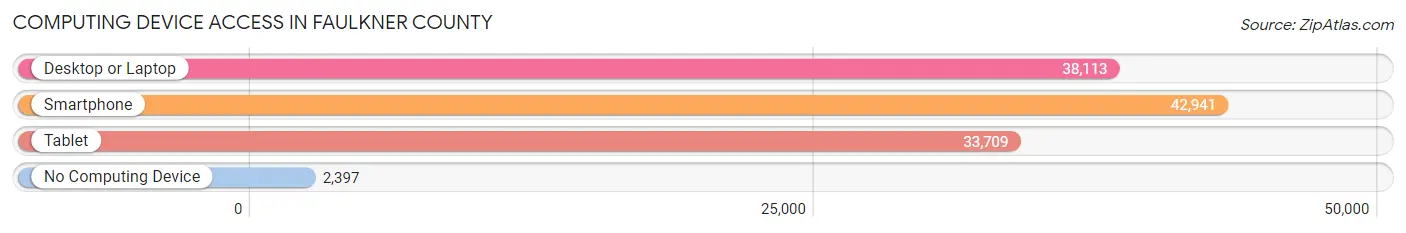
| Device Type | # Households | % Households |
| Desktop or Laptop | 38,113 | 80.4% |
| Smartphone | 42,941 | 90.6% |
| Tablet | 33,709 | 71.1% |
| No Computing Device | 2,397 | 5.1% |
| Total | 47,396 | 100.0% |
Internet Access in Faulkner County
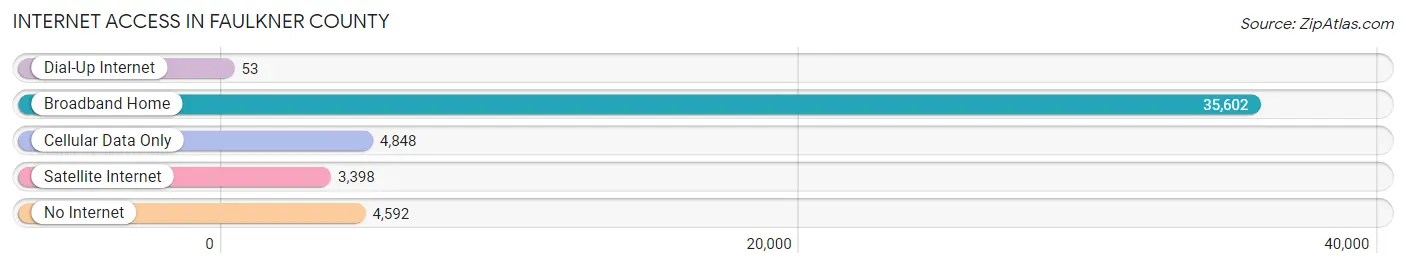
| Internet Type | # Households | % Households |
| Dial-Up Internet | 53 | 0.1% |
| Broadband Home | 35,602 | 75.1% |
| Cellular Data Only | 4,848 | 10.2% |
| Satellite Internet | 3,398 | 7.2% |
| No Internet | 4,592 | 9.7% |
| Total | 47,396 | 100.0% |
Faulkner County Summary
Faulkner County is located in the central part of Arkansas, and is part of the Little Rock-North Little Rock-Conway Metropolitan Statistical Area. It is bordered by Conway County to the north, Van Buren County to the west, Cleburne County to the east, and White County to the south. The county seat is Conway, and the largest city is Conway. The county was named after Arkansas politician and Confederate States of America officer Stephen Adams Faulkner.
Geography
Faulkner County is located in the Arkansas River Valley, and is part of the Ouachita Mountains region. The county is mostly flat, with some rolling hills in the northern and western parts. The highest point in the county is located in the northwest corner, at an elevation of 1,039 feet (316 m). The county has a total area of 645 square miles (1,670 km2), of which 643 square miles (1,664 km2) is land and 2.2 square miles (5.7 km2) (0.3%) is water.
The county is drained by the Arkansas River, which forms the northern boundary of the county. The river is impounded by the Murray Lock and Dam, located in the northern part of the county. Other major waterways in the county include Cadron Creek, Dutch Creek, and the Cadron and Dutch Creek Reservoirs.
Demographics
As of the 2010 United States Census, there were 113,237 people, 43,945 households, and 30,945 families residing in the county. The population density was 176.7 inhabitants per square mile (68.2/km2). There were 48,845 housing units at an average density of 75.9 per square mile (29.3/km2). The racial makeup of the county was 87.2% white, 8.2% black or African American, 0.7% Asian, 0.4% American Indian, 1.3% from other races, and 2.2% from two or more races. Those of Hispanic or Latino origin made up 3.3% of the population.
In terms of ancestry, 18.2% were American, 11.7% were Irish, 11.3% were English, and 8.7% were German. Of the 43,945 households, 34.7% had children under the age of 18 living with them, 53.2% were married couples living together, 11.9% had a female householder with no husband present, 30.3% were non-families, and 24.3% of all households were made up of individuals. The average household size was 2.50 and the average family size was 2.95.
The median age in the county was 36.7 years. 24.2% of residents were under the age of 18; 8.7% were between the ages of 18 and 24; 25.7% were from 25 to 44; 26.2% were from 45 to 64; and 15.2% were 65 years of age or older. The gender makeup of the county was 48.3% male and 51.7% female.
Economy
Faulkner County has a diverse economy, with a mix of manufacturing, retail, and service industries. The county is home to several large employers, including the University of Central Arkansas, Conway Regional Medical Center, and Acxiom Corporation. The county is also home to several smaller businesses, including several wineries, a craft brewery, and a distillery.
Agriculture is also an important part of the county's economy. The county is home to several large farms, and is a major producer of poultry, beef, and dairy products. The county is also home to several farmers' markets, where local farmers sell their produce.
The county is served by two major highways, Interstate 40 and U.S. Route 65. The county is also served by several smaller highways, including Arkansas Highway 365, Arkansas Highway 25, and Arkansas Highway 286. The county is served by the Conway Airport, which offers daily flights to Little Rock and Dallas.
Conclusion
Faulkner County is a diverse county located in the central part of Arkansas. It is home to a mix of manufacturing, retail, and service industries, as well as several large farms. The county is served by two major highways, Interstate 40 and U.S. Route 65, and is served by the Conway Airport. The county has a population of 113,237, and is part of the Little Rock-North Little Rock-Conway Metropolitan Statistical Area.
Common Questions
What is Per Capita Income in Faulkner County?
Per Capita income in Faulkner County is $31,301.
What is the Median Family Income in Faulkner County?
Median Family Income in Faulkner County is $79,614.
What is the Median Household income in Faulkner County?
Median Household Income in Faulkner County is $61,273.
What is Income or Wage Gap in Faulkner County?
Income or Wage Gap in Faulkner County is 26.7%.
Women in Faulkner County earn 73.3 cents for every dollar earned by a man.
What is Family Income Deficit in Faulkner County?
Family Income Deficit in Faulkner County is $10,226.
Families that are below poverty line in Faulkner County earn $10,226 less on average than the poverty threshold level.
What is Inequality or Gini Index in Faulkner County?
Inequality or Gini Index in Faulkner County is 0.46.
What is the Total Population of Faulkner County?
Total Population of Faulkner County is 124,611.
What is the Total Male Population of Faulkner County?
Total Male Population of Faulkner County is 60,844.
What is the Total Female Population of Faulkner County?
Total Female Population of Faulkner County is 63,767.
What is the Ratio of Males per 100 Females in Faulkner County?
There are 95.42 Males per 100 Females in Faulkner County.
What is the Ratio of Females per 100 Males in Faulkner County?
There are 104.80 Females per 100 Males in Faulkner County.
What is the Median Population Age in Faulkner County?
Median Population Age in Faulkner County is 33.8 Years.
What is the Average Family Size in Faulkner County
Average Family Size in Faulkner County is 3.1 People.
What is the Average Household Size in Faulkner County
Average Household Size in Faulkner County is 2.5 People.
How Large is the Labor Force in Faulkner County?
There are 60,792 People in the Labor Forcein in Faulkner County.
What is the Percentage of People in the Labor Force in Faulkner County?
61.1% of People are in the Labor Force in Faulkner County.
What is the Unemployment Rate in Faulkner County?
Unemployment Rate in Faulkner County is 3.3%.