Craighead County, AR Map & Demographics
Craighead County Map
Craighead County Overview
$31,298
PER CAPITA INCOME
$72,208
AVG FAMILY INCOME
$55,169
AVG HOUSEHOLD INCOME
23.9%
WAGE / INCOME GAP [ % ]
76.1¢/ $1
WAGE / INCOME GAP [ $ ]
$11,505
FAMILY INCOME DEFICIT
0.49
INEQUALITY / GINI INDEX
111,038
TOTAL POPULATION
54,232
MALE POPULATION
56,806
FEMALE POPULATION
95.47
MALES / 100 FEMALES
104.75
FEMALES / 100 MALES
34.4
MEDIAN AGE
3.1
AVG FAMILY SIZE
2.5
AVG HOUSEHOLD SIZE
54,815
LABOR FORCE [ PEOPLE ]
63.5%
PERCENT IN LABOR FORCE
5.9%
UNEMPLOYMENT RATE
Craighead County Area Codes
Income in Craighead County
Income Overview in Craighead County
Per Capita Income in Craighead County is $31,298, while median incomes of families and households are $72,208 and $55,169 respectively.
| Characteristic | Number | Measure |
| Per Capita Income | 111,038 | $31,298 |
| Median Family Income | 28,047 | $72,208 |
| Mean Family Income | 28,047 | $96,786 |
| Median Household Income | 42,351 | $55,169 |
| Mean Household Income | 42,351 | $80,561 |
| Income Deficit | 28,047 | $11,505 |
| Wage / Income Gap (%) | 111,038 | 23.87% |
| Wage / Income Gap ($) | 111,038 | 76.13¢ per $1 |
| Gini / Inequality Index | 111,038 | 0.49 |
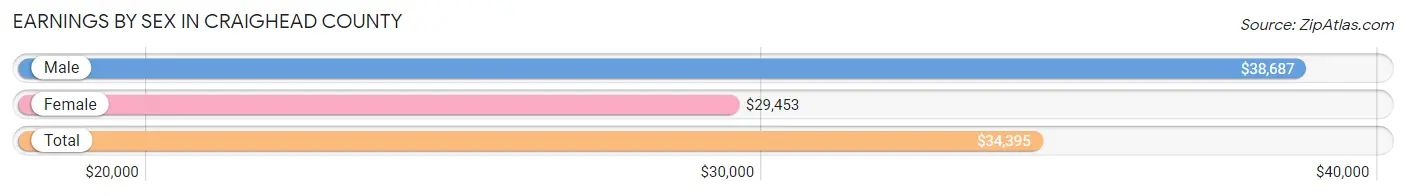
Earnings by Sex in Craighead County
Average Earnings in Craighead County are $34,395, $38,687 for men and $29,453 for women, a difference of 23.9%.
| Sex | Number | Average Earnings |
| Male | 29,100 (50.9%) | $38,687 |
| Female | 28,109 (49.1%) | $29,453 |
| Total | 57,209 (100.0%) | $34,395 |
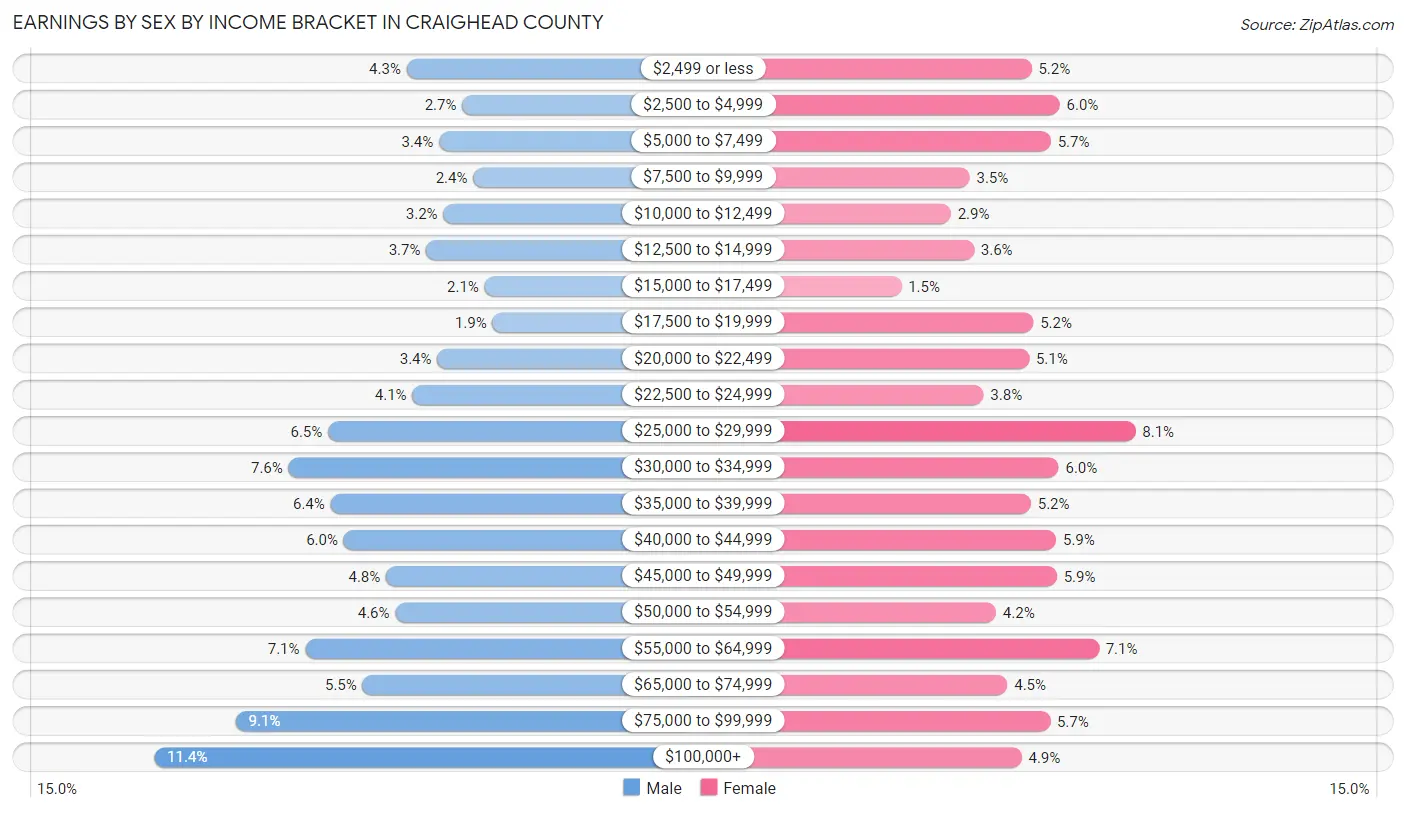
Earnings by Sex by Income Bracket in Craighead County
The most common earnings brackets in Craighead County are $100,000+ for men (3,307 | 11.4%) and $25,000 to $29,999 for women (2,280 | 8.1%).
| Income | Male | Female |
| $2,499 or less | 1,241 (4.3%) | 1,460 (5.2%) |
| $2,500 to $4,999 | 785 (2.7%) | 1,680 (6.0%) |
| $5,000 to $7,499 | 976 (3.4%) | 1,610 (5.7%) |
| $7,500 to $9,999 | 696 (2.4%) | 971 (3.5%) |
| $10,000 to $12,499 | 940 (3.2%) | 822 (2.9%) |
| $12,500 to $14,999 | 1,079 (3.7%) | 1,003 (3.6%) |
| $15,000 to $17,499 | 602 (2.1%) | 431 (1.5%) |
| $17,500 to $19,999 | 538 (1.8%) | 1,474 (5.2%) |
| $20,000 to $22,499 | 989 (3.4%) | 1,439 (5.1%) |
| $22,500 to $24,999 | 1,192 (4.1%) | 1,079 (3.8%) |
| $25,000 to $29,999 | 1,882 (6.5%) | 2,280 (8.1%) |
| $30,000 to $34,999 | 2,205 (7.6%) | 1,672 (5.9%) |
| $35,000 to $39,999 | 1,861 (6.4%) | 1,454 (5.2%) |
| $40,000 to $44,999 | 1,754 (6.0%) | 1,654 (5.9%) |
| $45,000 to $49,999 | 1,409 (4.8%) | 1,658 (5.9%) |
| $50,000 to $54,999 | 1,334 (4.6%) | 1,177 (4.2%) |
| $55,000 to $64,999 | 2,070 (7.1%) | 1,991 (7.1%) |
| $65,000 to $74,999 | 1,601 (5.5%) | 1,267 (4.5%) |
| $75,000 to $99,999 | 2,639 (9.1%) | 1,606 (5.7%) |
| $100,000+ | 3,307 (11.4%) | 1,381 (4.9%) |
| Total | 29,100 (100.0%) | 28,109 (100.0%) |
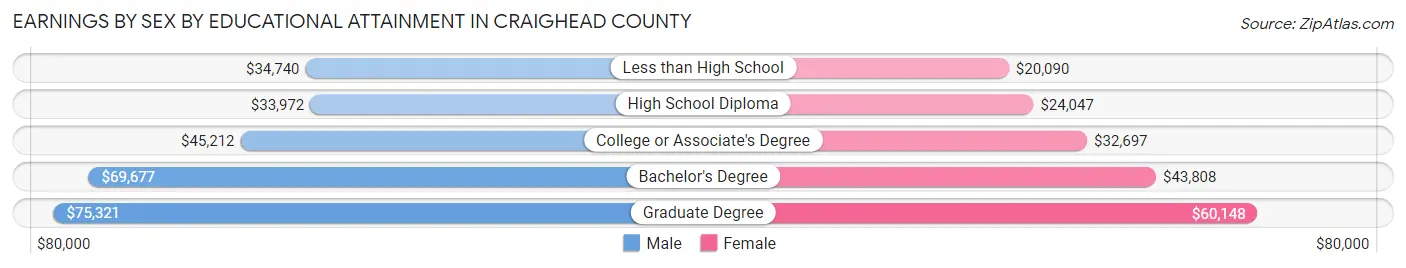
Earnings by Sex by Educational Attainment in Craighead County
Average earnings in Craighead County are $44,403 for men and $35,607 for women, a difference of 19.8%. Men with an educational attainment of graduate degree enjoy the highest average annual earnings of $75,321, while those with high school diploma education earn the least with $33,972. Women with an educational attainment of graduate degree earn the most with the average annual earnings of $60,148, while those with less than high school education have the smallest earnings of $20,090.
| Educational Attainment | Male Income | Female Income |
| Less than High School | $34,740 | $20,090 |
| High School Diploma | $33,972 | $24,047 |
| College or Associate's Degree | $45,212 | $32,697 |
| Bachelor's Degree | $69,677 | $43,808 |
| Graduate Degree | $75,321 | $60,148 |
| Total | $44,403 | $35,607 |
Family Income in Craighead County
Family Income Brackets in Craighead County
According to the Craighead County family income data, there are 5,722 families falling into the $100,000 to $149,999 income range, which is the most common income bracket and makes up 20.4% of all families. Conversely, the $10,000 to $14,999 income bracket is the least frequent group with only 898 families (3.2%) belonging to this category.
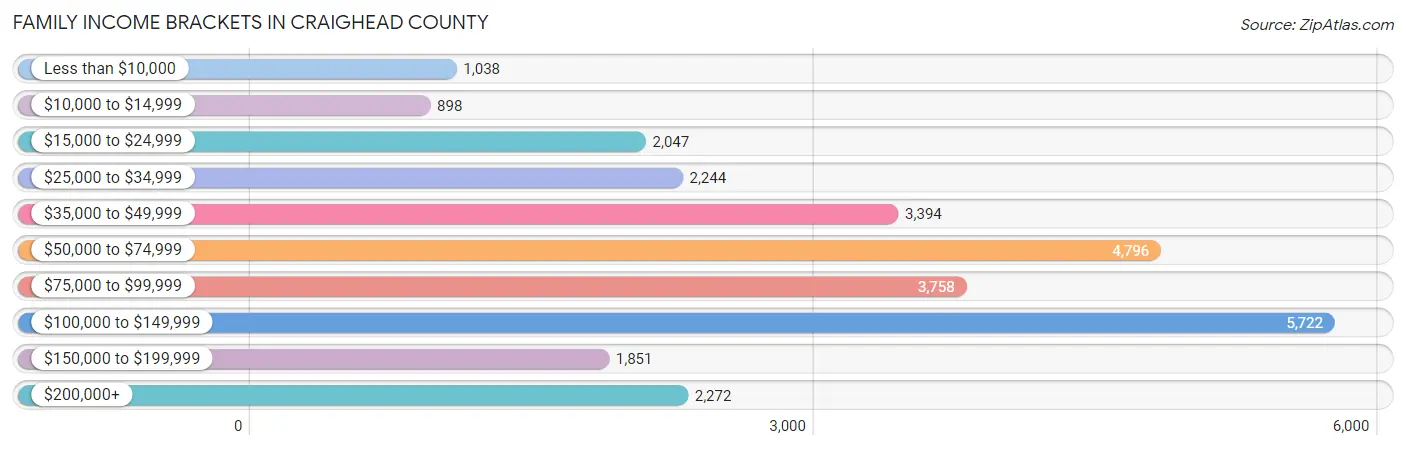
| Income Bracket | # Families | % Families |
| Less than $10,000 | 1,038 | 3.7% |
| $10,000 to $14,999 | 898 | 3.2% |
| $15,000 to $24,999 | 2,047 | 7.3% |
| $25,000 to $34,999 | 2,244 | 8.0% |
| $35,000 to $49,999 | 3,394 | 12.1% |
| $50,000 to $74,999 | 4,796 | 17.1% |
| $75,000 to $99,999 | 3,758 | 13.4% |
| $100,000 to $149,999 | 5,722 | 20.4% |
| $150,000 to $199,999 | 1,851 | 6.6% |
| $200,000+ | 2,272 | 8.1% |
Family Income by Famaliy Size in Craighead County
4-person families (5,638 | 20.1%) account for the highest median family income in Craighead County with $96,202 per family, while 2-person families (12,744 | 45.4%) have the highest median income of $31,570 per family member.
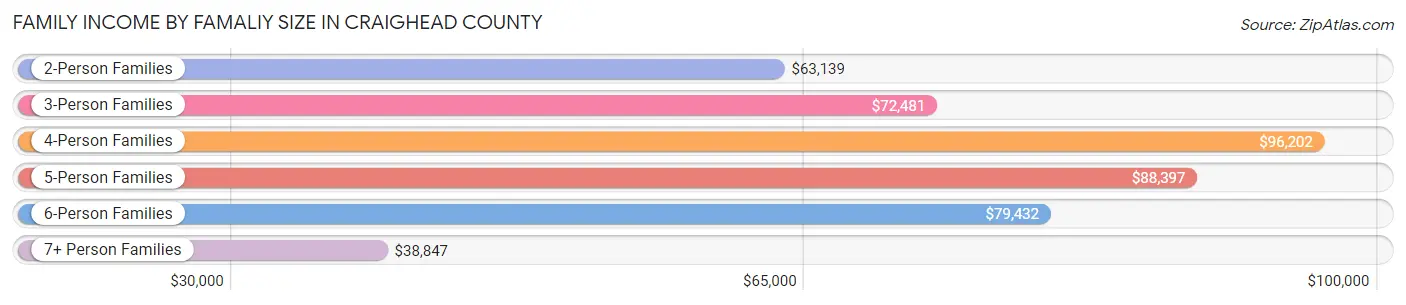
| Income Bracket | # Families | Median Income |
| 2-Person Families | 12,744 (45.4%) | $63,139 |
| 3-Person Families | 6,186 (22.1%) | $72,481 |
| 4-Person Families | 5,638 (20.1%) | $96,202 |
| 5-Person Families | 2,220 (7.9%) | $88,397 |
| 6-Person Families | 862 (3.1%) | $79,432 |
| 7+ Person Families | 397 (1.4%) | $38,847 |
| Total | 28,047 (100.0%) | $72,208 |
Family Income by Number of Earners in Craighead County
The median family income in Craighead County is $72,208, with families comprising 3+ earners (2,822) having the highest median family income of $130,938, while families with no earners (4,344) have the lowest median family income of $38,100, accounting for 10.1% and 15.5% of families, respectively.
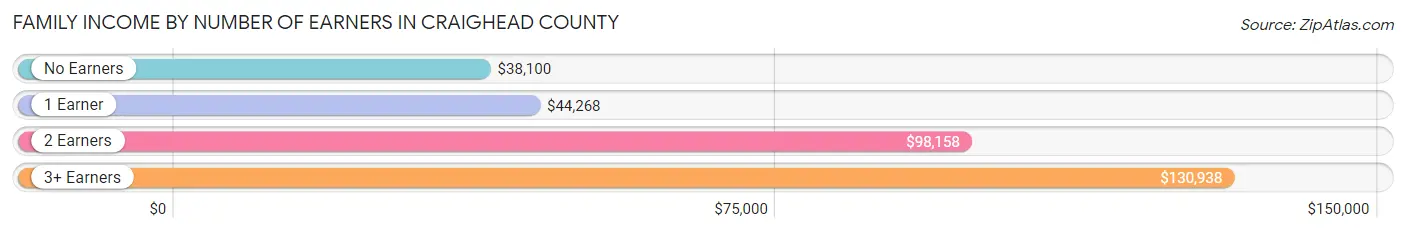
| Number of Earners | # Families | Median Income |
| No Earners | 4,344 (15.5%) | $38,100 |
| 1 Earner | 8,946 (31.9%) | $44,268 |
| 2 Earners | 11,935 (42.5%) | $98,158 |
| 3+ Earners | 2,822 (10.1%) | $130,938 |
| Total | 28,047 (100.0%) | $72,208 |
Household Income in Craighead County
Household Income Brackets in Craighead County
With 6,903 households falling in the category, the $50,000 to $74,999 income range is the most frequent in Craighead County, accounting for 16.3% of all households. In contrast, only 2,033 households (4.8%) fall into the $150,000 to $199,999 income bracket, making it the least populous group.
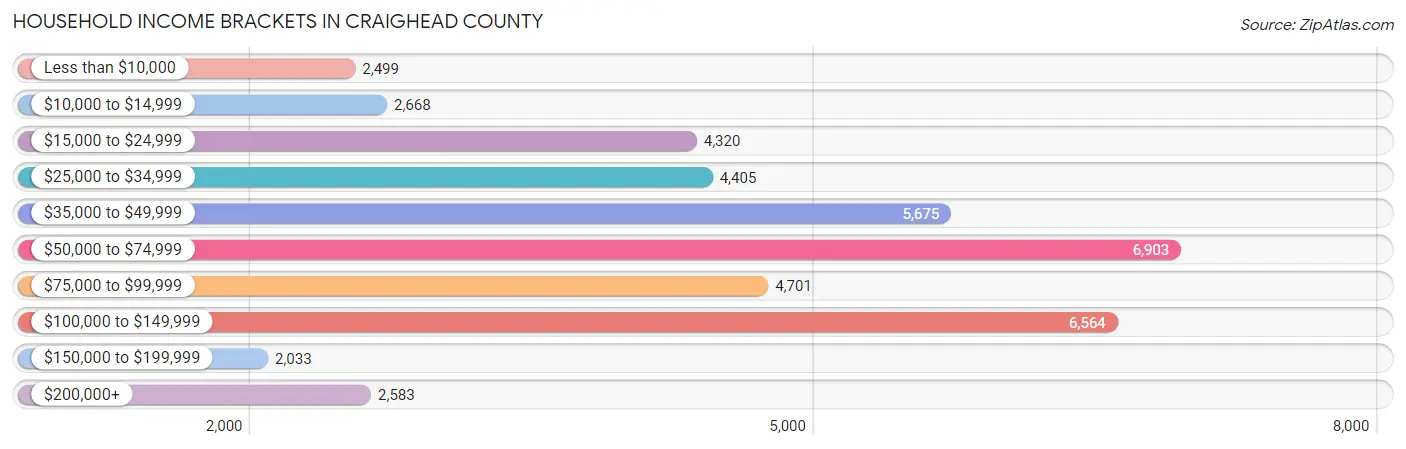
| Income Bracket | # Households | % Households |
| Less than $10,000 | 2,499 | 5.9% |
| $10,000 to $14,999 | 2,668 | 6.3% |
| $15,000 to $24,999 | 4,320 | 10.2% |
| $25,000 to $34,999 | 4,405 | 10.4% |
| $35,000 to $49,999 | 5,675 | 13.4% |
| $50,000 to $74,999 | 6,903 | 16.3% |
| $75,000 to $99,999 | 4,701 | 11.1% |
| $100,000 to $149,999 | 6,564 | 15.5% |
| $150,000 to $199,999 | 2,033 | 4.8% |
| $200,000+ | 2,583 | 6.1% |
Household Income by Householder Age in Craighead County
The median household income in Craighead County is $55,169, with the highest median household income of $68,250 found in the 45 to 64 years age bracket for the primary householder. A total of 14,164 households (33.4%) fall into this category. Meanwhile, the 15 to 24 years age bracket for the primary householder has the lowest median household income of $33,457, with 2,523 households (6.0%) in this group.
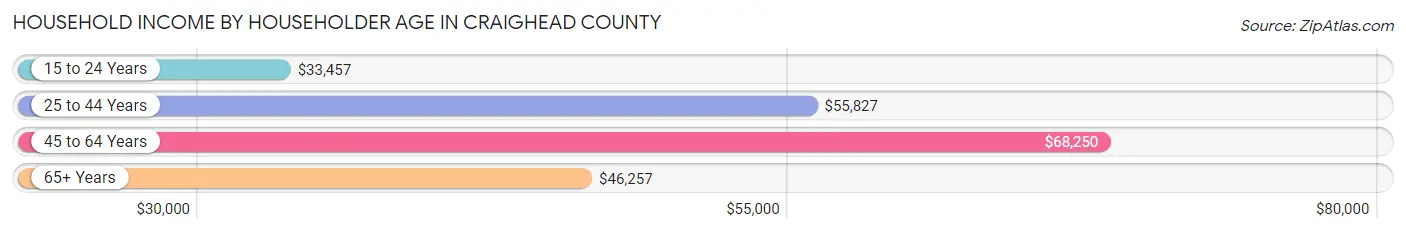
| Income Bracket | # Households | Median Income |
| 15 to 24 Years | 2,523 (6.0%) | $33,457 |
| 25 to 44 Years | 16,071 (38.0%) | $55,827 |
| 45 to 64 Years | 14,164 (33.4%) | $68,250 |
| 65+ Years | 9,593 (22.7%) | $46,257 |
| Total | 42,351 (100.0%) | $55,169 |
Poverty in Craighead County
Income Below Poverty by Sex and Age in Craighead County
With 15.9% poverty level for males and 22.2% for females among the residents of Craighead County, under 5 year old males and under 5 year old females are the most vulnerable to poverty, with 1,074 males (29.4%) and 1,575 females (44.2%) in their respective age groups living below the poverty level.
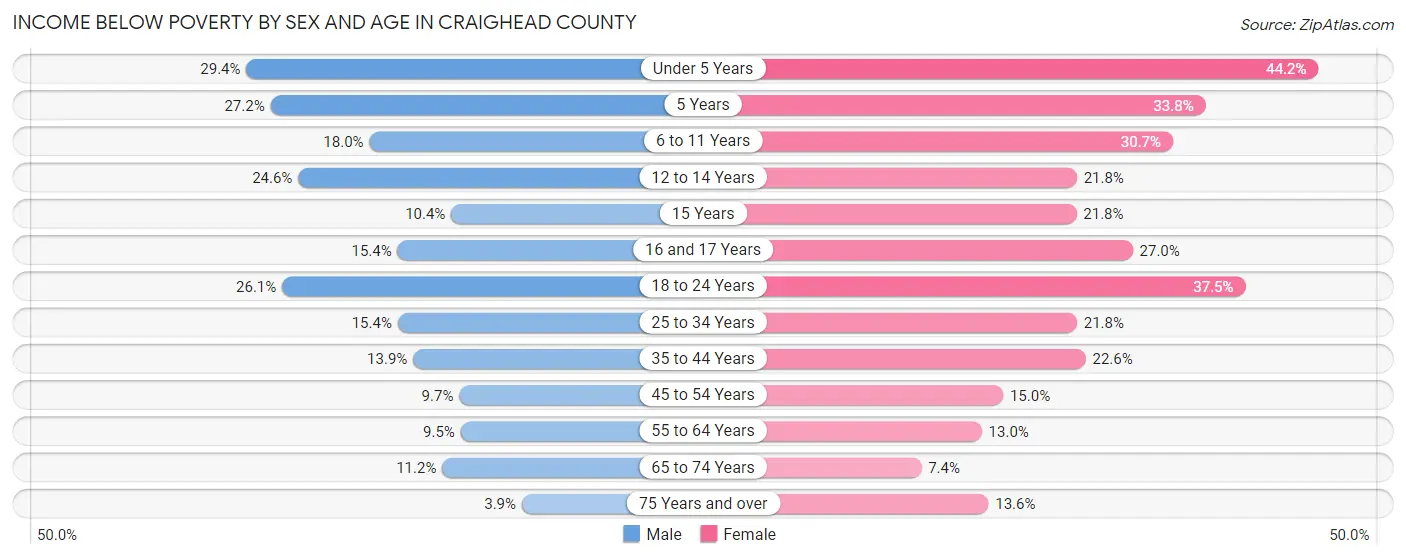
| Age Bracket | Male | Female |
| Under 5 Years | 1,074 (29.4%) | 1,575 (44.2%) |
| 5 Years | 253 (27.2%) | 216 (33.8%) |
| 6 to 11 Years | 791 (18.0%) | 1,443 (30.7%) |
| 12 to 14 Years | 616 (24.6%) | 457 (21.8%) |
| 15 Years | 93 (10.4%) | 167 (21.8%) |
| 16 and 17 Years | 249 (15.4%) | 363 (27.0%) |
| 18 to 24 Years | 1,343 (26.1%) | 1,876 (37.4%) |
| 25 to 34 Years | 1,232 (15.4%) | 1,840 (21.8%) |
| 35 to 44 Years | 978 (13.9%) | 1,669 (22.6%) |
| 45 to 54 Years | 595 (9.7%) | 938 (15.0%) |
| 55 to 64 Years | 562 (9.5%) | 834 (13.0%) |
| 65 to 74 Years | 431 (11.2%) | 358 (7.4%) |
| 75 Years and over | 89 (3.8%) | 469 (13.6%) |
| Total | 8,306 (15.9%) | 12,205 (22.2%) |
Income Above Poverty by Sex and Age in Craighead County
According to the poverty statistics in Craighead County, males aged 75 years and over and females aged 65 to 74 years are the age groups that are most secure financially, with 96.2% of males and 92.6% of females in these age groups living above the poverty line.
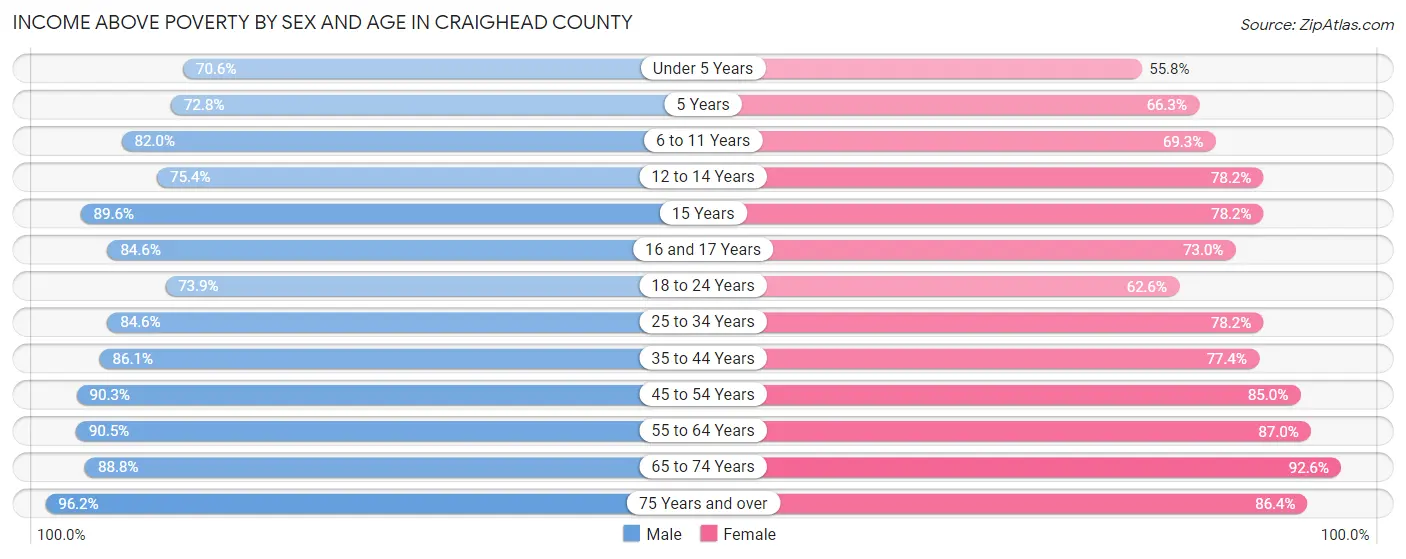
| Age Bracket | Male | Female |
| Under 5 Years | 2,577 (70.6%) | 1,987 (55.8%) |
| 5 Years | 678 (72.8%) | 424 (66.2%) |
| 6 to 11 Years | 3,603 (82.0%) | 3,255 (69.3%) |
| 12 to 14 Years | 1,887 (75.4%) | 1,639 (78.2%) |
| 15 Years | 800 (89.6%) | 600 (78.2%) |
| 16 and 17 Years | 1,369 (84.6%) | 982 (73.0%) |
| 18 to 24 Years | 3,803 (73.9%) | 3,133 (62.5%) |
| 25 to 34 Years | 6,784 (84.6%) | 6,596 (78.2%) |
| 35 to 44 Years | 6,036 (86.1%) | 5,711 (77.4%) |
| 45 to 54 Years | 5,562 (90.3%) | 5,334 (85.0%) |
| 55 to 64 Years | 5,333 (90.5%) | 5,591 (87.0%) |
| 65 to 74 Years | 3,402 (88.8%) | 4,501 (92.6%) |
| 75 Years and over | 2,221 (96.2%) | 2,980 (86.4%) |
| Total | 44,055 (84.1%) | 42,733 (77.8%) |
Income Below Poverty Among Married-Couple Families in Craighead County
The poverty statistics for married-couple families in Craighead County show that 5.7% or 1,117 of the total 19,678 families live below the poverty line. Families with 5 or more children have the highest poverty rate of 81.5%, comprising of 123 families. On the other hand, families with no children have the lowest poverty rate of 2.9%, which includes 310 families.
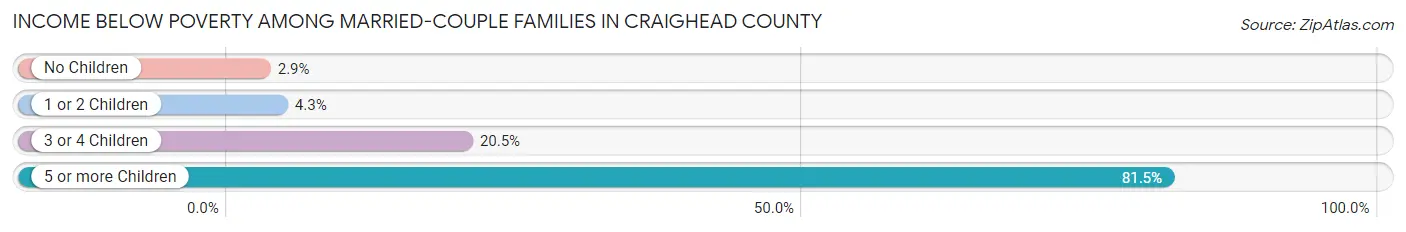
| Children | Above Poverty | Below Poverty |
| No Children | 10,560 (97.2%) | 310 (2.9%) |
| 1 or 2 Children | 6,452 (95.7%) | 293 (4.3%) |
| 3 or 4 Children | 1,521 (79.5%) | 391 (20.4%) |
| 5 or more Children | 28 (18.5%) | 123 (81.5%) |
| Total | 18,561 (94.3%) | 1,117 (5.7%) |
Income Below Poverty Among Single-Parent Households in Craighead County
According to the poverty data in Craighead County, 15.1% or 300 single-father households and 35.7% or 2,282 single-mother households are living below the poverty line. Among single-father households, those with 5 or more children have the highest poverty rate, with 23 households (100.0%) experiencing poverty. Likewise, among single-mother households, those with 5 or more children have the highest poverty rate, with 99 households (76.7%) falling below the poverty line.
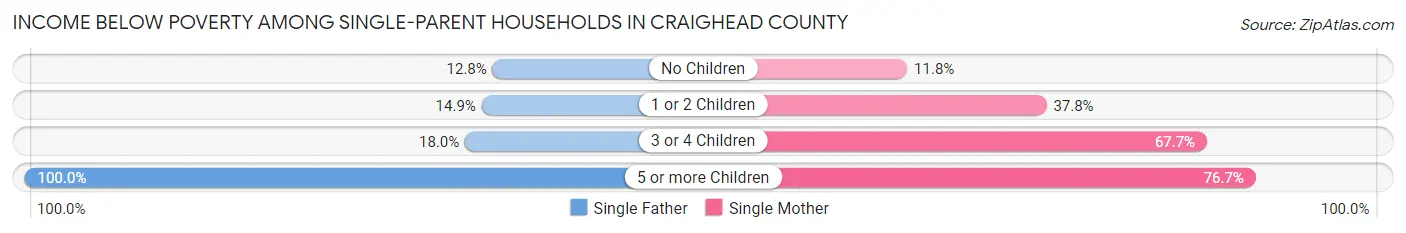
| Children | Single Father | Single Mother |
| No Children | 115 (12.8%) | 228 (11.8%) |
| 1 or 2 Children | 141 (14.9%) | 1,229 (37.8%) |
| 3 or 4 Children | 21 (17.9%) | 726 (67.7%) |
| 5 or more Children | 23 (100.0%) | 99 (76.7%) |
| Total | 300 (15.1%) | 2,282 (35.7%) |
Income Below Poverty Among Married-Couple vs Single-Parent Households in Craighead County
The poverty data for Craighead County shows that 1,117 of the married-couple family households (5.7%) and 2,582 of the single-parent households (30.8%) are living below the poverty level. Within the married-couple family households, those with 5 or more children have the highest poverty rate, with 123 households (81.5%) falling below the poverty line. Among the single-parent households, those with 5 or more children have the highest poverty rate, with 122 household (80.3%) living below poverty.
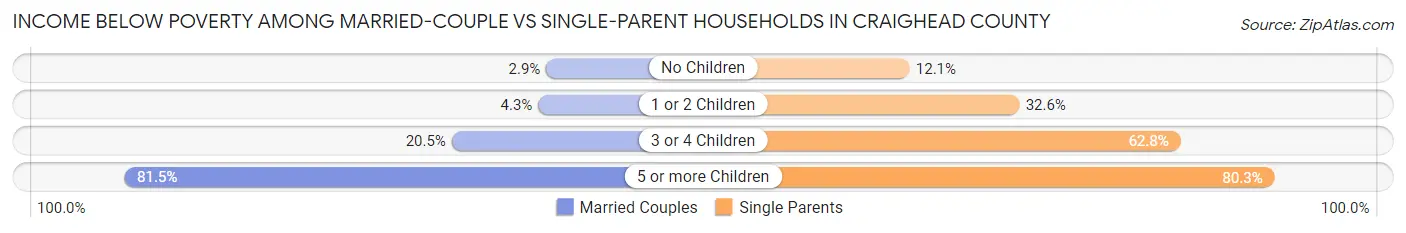
| Children | Married-Couple Families | Single-Parent Households |
| No Children | 310 (2.9%) | 343 (12.1%) |
| 1 or 2 Children | 293 (4.3%) | 1,370 (32.6%) |
| 3 or 4 Children | 391 (20.4%) | 747 (62.8%) |
| 5 or more Children | 123 (81.5%) | 122 (80.3%) |
| Total | 1,117 (5.7%) | 2,582 (30.8%) |
Race in Craighead County
The most populous races in Craighead County are White / Caucasian (83,513 | 75.2%), Black / African American (18,035 | 16.2%), and Hispanic or Latino (6,074 | 5.5%).
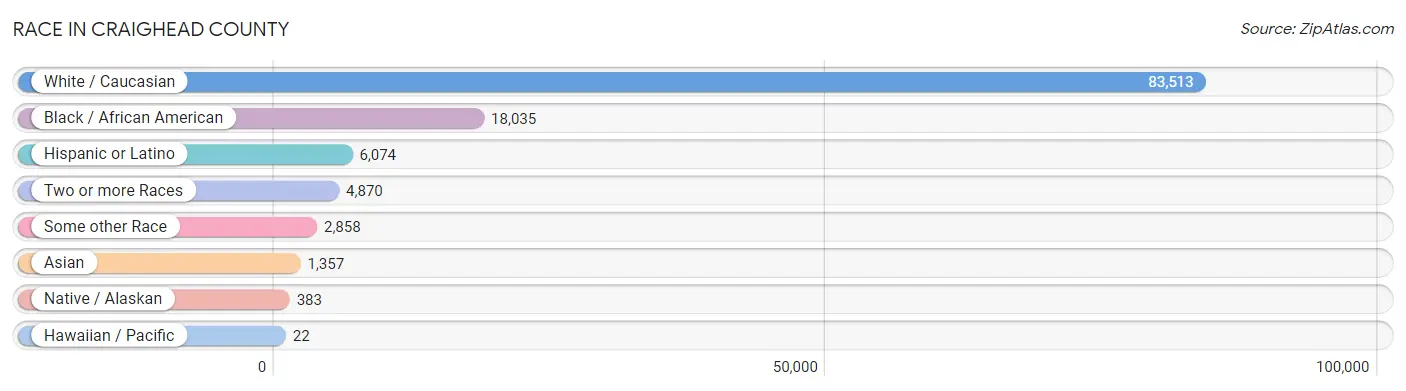
| Race | # Population | % Population |
| Asian | 1,357 | 1.2% |
| Black / African American | 18,035 | 16.2% |
| Hawaiian / Pacific | 22 | 0.0% |
| Hispanic or Latino | 6,074 | 5.5% |
| Native / Alaskan | 383 | 0.3% |
| White / Caucasian | 83,513 | 75.2% |
| Two or more Races | 4,870 | 4.4% |
| Some other Race | 2,858 | 2.6% |
| Total | 111,038 | 100.0% |
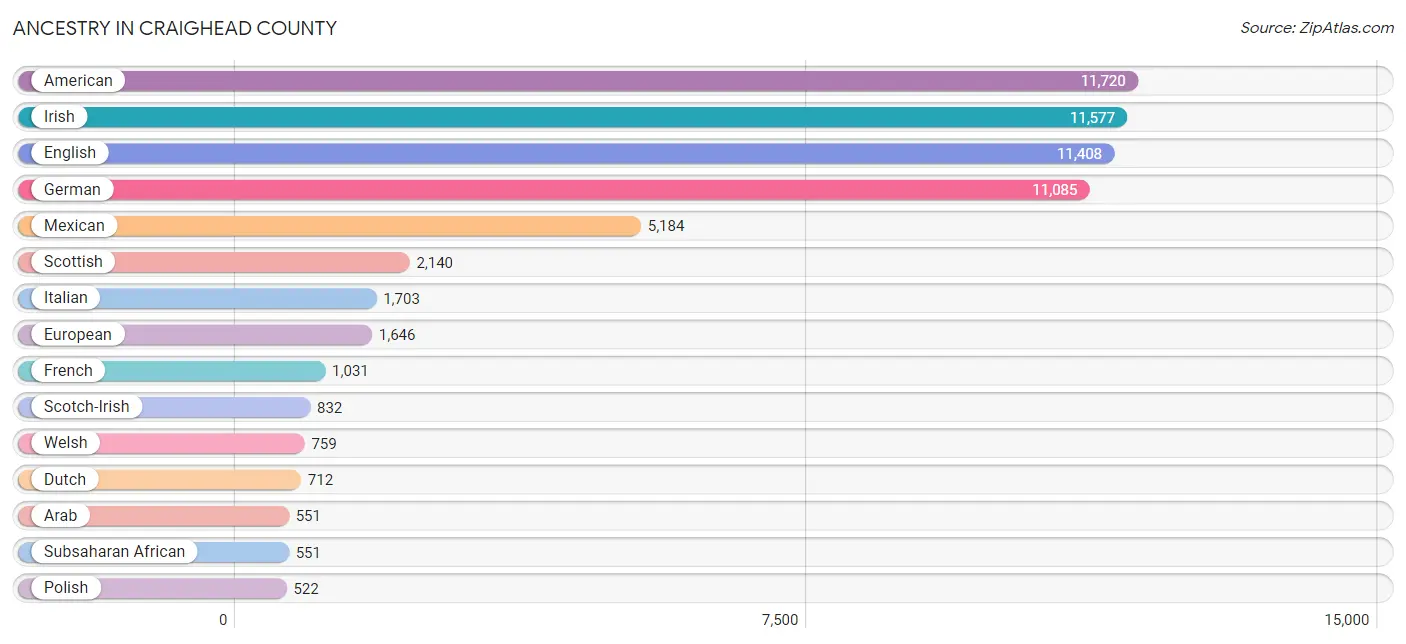
Ancestry in Craighead County
The most populous ancestries reported in Craighead County are American (11,720 | 10.5%), Irish (11,577 | 10.4%), English (11,408 | 10.3%), German (11,085 | 10.0%), and Mexican (5,184 | 4.7%), together accounting for 45.9% of all Craighead County residents.
| Ancestry | # Population | % Population |
| African | 370 | 0.3% |
| Alaska Native | 10 | 0.0% |
| Alaskan Athabascan | 28 | 0.0% |
| Albanian | 21 | 0.0% |
| American | 11,720 | 10.5% |
| Apache | 28 | 0.0% |
| Arab | 551 | 0.5% |
| Austrian | 91 | 0.1% |
| Basque | 15 | 0.0% |
| Bhutanese | 55 | 0.1% |
| Blackfeet | 100 | 0.1% |
| British | 442 | 0.4% |
| British West Indian | 26 | 0.0% |
| Bulgarian | 7 | 0.0% |
| Burmese | 116 | 0.1% |
| Canadian | 23 | 0.0% |
| Central American | 230 | 0.2% |
| Central American Indian | 25 | 0.0% |
| Cherokee | 469 | 0.4% |
| Chickasaw | 7 | 0.0% |
| Choctaw | 84 | 0.1% |
| Creek | 6 | 0.0% |
| Croatian | 70 | 0.1% |
| Crow | 21 | 0.0% |
| Czech | 98 | 0.1% |
| Czechoslovakian | 13 | 0.0% |
| Dutch | 712 | 0.6% |
| Dutch West Indian | 11 | 0.0% |
| Eastern European | 148 | 0.1% |
| Ecuadorian | 2 | 0.0% |
| English | 11,408 | 10.3% |
| European | 1,646 | 1.5% |
| Fijian | 22 | 0.0% |
| Finnish | 2 | 0.0% |
| French | 1,031 | 0.9% |
| French American Indian | 16 | 0.0% |
| French Canadian | 99 | 0.1% |
| German | 11,085 | 10.0% |
| German Russian | 14 | 0.0% |
| Greek | 31 | 0.0% |
| Guatemalan | 105 | 0.1% |
| Honduran | 22 | 0.0% |
| Hungarian | 33 | 0.0% |
| Indian (Asian) | 509 | 0.5% |
| Iranian | 6 | 0.0% |
| Irish | 11,577 | 10.4% |
| Italian | 1,703 | 1.5% |
| Korean | 334 | 0.3% |
| Laotian | 5 | 0.0% |
| Lebanese | 44 | 0.0% |
| Lithuanian | 10 | 0.0% |
| Malaysian | 156 | 0.1% |
| Mexican | 5,184 | 4.7% |
| Moroccan | 36 | 0.0% |
| Navajo | 34 | 0.0% |
| Nicaraguan | 24 | 0.0% |
| Nigerian | 117 | 0.1% |
| Northern European | 102 | 0.1% |
| Norwegian | 250 | 0.2% |
| Osage | 26 | 0.0% |
| Palestinian | 101 | 0.1% |
| Panamanian | 2 | 0.0% |
| Peruvian | 7 | 0.0% |
| Polish | 522 | 0.5% |
| Portuguese | 67 | 0.1% |
| Potawatomi | 8 | 0.0% |
| Puerto Rican | 253 | 0.2% |
| Russian | 173 | 0.2% |
| Salvadoran | 77 | 0.1% |
| Scandinavian | 123 | 0.1% |
| Scotch-Irish | 832 | 0.7% |
| Scottish | 2,140 | 1.9% |
| Sioux | 10 | 0.0% |
| Slovak | 19 | 0.0% |
| Slovene | 3 | 0.0% |
| South African | 32 | 0.0% |
| South American | 16 | 0.0% |
| Spaniard | 183 | 0.2% |
| Spanish | 96 | 0.1% |
| Sri Lankan | 335 | 0.3% |
| Subsaharan African | 551 | 0.5% |
| Swedish | 212 | 0.2% |
| Swiss | 50 | 0.1% |
| Syrian | 38 | 0.0% |
| Thai | 139 | 0.1% |
| Ukrainian | 52 | 0.1% |
| Venezuelan | 7 | 0.0% |
| Vietnamese | 17 | 0.0% |
| Welsh | 759 | 0.7% | View All 89 Rows |
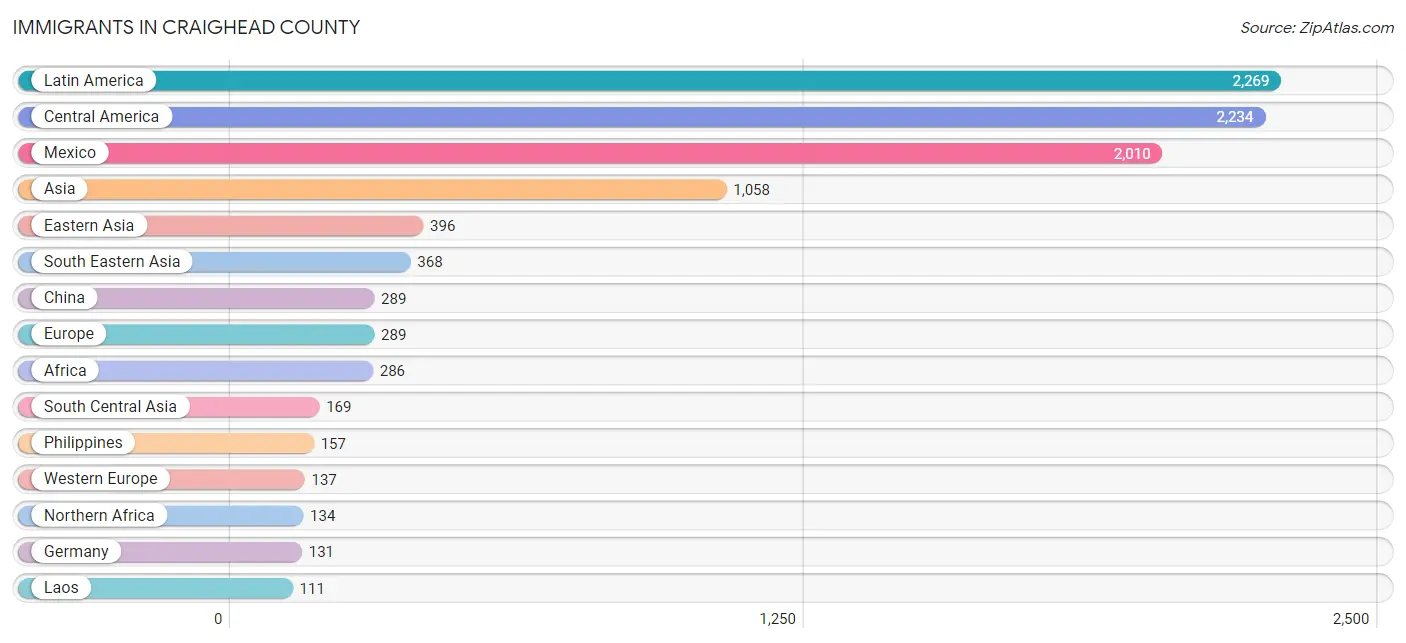
Immigrants in Craighead County
The most numerous immigrant groups reported in Craighead County came from Latin America (2,269 | 2.0%), Central America (2,234 | 2.0%), Mexico (2,010 | 1.8%), Asia (1,058 | 0.9%), and Eastern Asia (396 | 0.4%), together accounting for 7.2% of all Craighead County residents.
| Immigration Origin | # Population | % Population |
| Africa | 286 | 0.3% |
| Asia | 1,058 | 0.9% |
| Bangladesh | 49 | 0.0% |
| Canada | 30 | 0.0% |
| Caribbean | 26 | 0.0% |
| Central America | 2,234 | 2.0% |
| China | 289 | 0.3% |
| Eastern Asia | 396 | 0.4% |
| Eastern Europe | 69 | 0.1% |
| Ecuador | 2 | 0.0% |
| El Salvador | 35 | 0.0% |
| England | 49 | 0.0% |
| Europe | 289 | 0.3% |
| France | 6 | 0.0% |
| Germany | 131 | 0.1% |
| Guatemala | 74 | 0.1% |
| Honduras | 22 | 0.0% |
| India | 47 | 0.0% |
| Indonesia | 5 | 0.0% |
| Japan | 16 | 0.0% |
| Korea | 91 | 0.1% |
| Laos | 111 | 0.1% |
| Latin America | 2,269 | 2.0% |
| Lebanon | 38 | 0.0% |
| Mexico | 2,010 | 1.8% |
| Northern Africa | 134 | 0.1% |
| Northern Europe | 83 | 0.1% |
| Oceania | 55 | 0.1% |
| Pakistan | 66 | 0.1% |
| Panama | 93 | 0.1% |
| Peru | 7 | 0.0% |
| Philippines | 157 | 0.1% |
| Russia | 59 | 0.1% |
| Saudi Arabia | 15 | 0.0% |
| South Africa | 74 | 0.1% |
| South America | 9 | 0.0% |
| South Central Asia | 169 | 0.2% |
| South Eastern Asia | 368 | 0.3% |
| Sweden | 10 | 0.0% |
| Taiwan | 8 | 0.0% |
| Turkey | 18 | 0.0% |
| Ukraine | 7 | 0.0% |
| Vietnam | 95 | 0.1% |
| Western Africa | 32 | 0.0% |
| Western Asia | 104 | 0.1% |
| Western Europe | 137 | 0.1% |
| Yemen | 33 | 0.0% | View All 47 Rows |
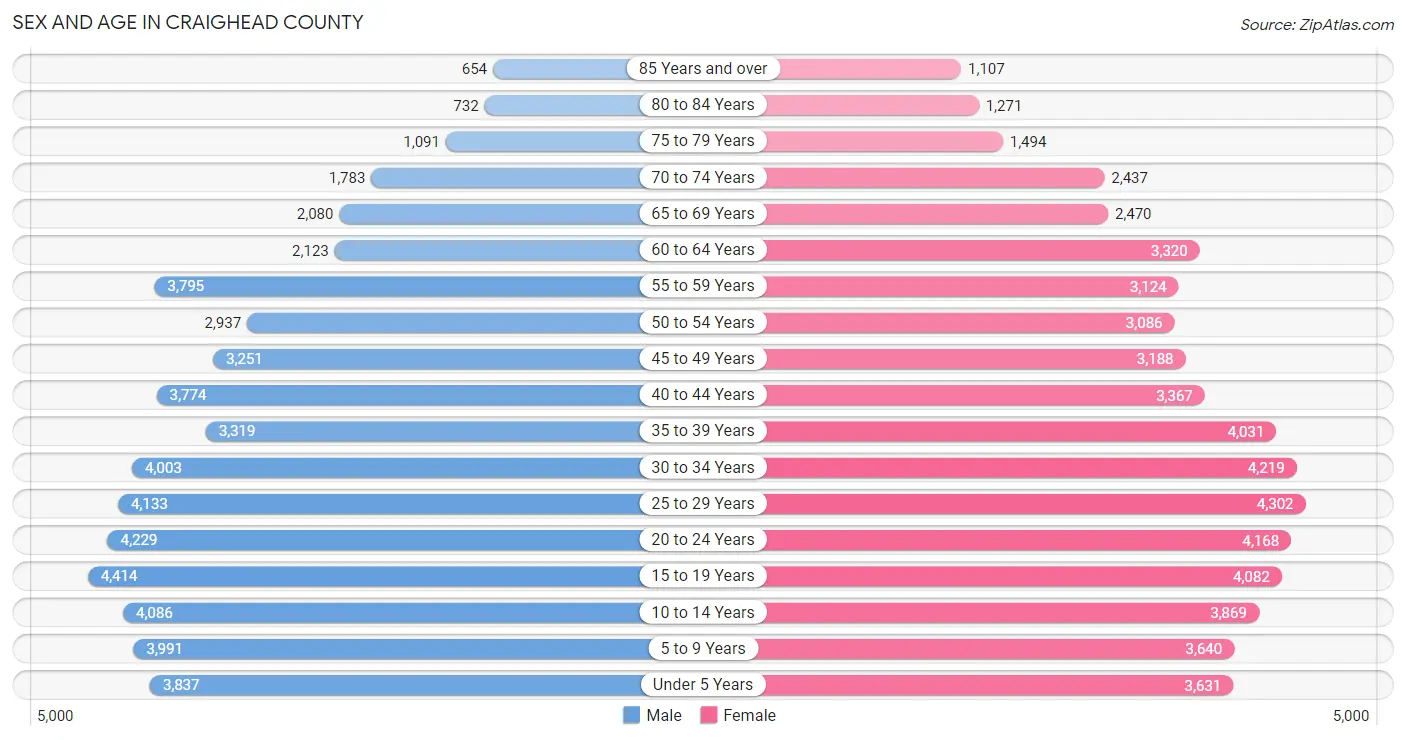
Sex and Age in Craighead County
Sex and Age in Craighead County
The most populous age groups in Craighead County are 15 to 19 Years (4,414 | 8.1%) for men and 25 to 29 Years (4,302 | 7.6%) for women.
| Age Bracket | Male | Female |
| Under 5 Years | 3,837 (7.1%) | 3,631 (6.4%) |
| 5 to 9 Years | 3,991 (7.4%) | 3,640 (6.4%) |
| 10 to 14 Years | 4,086 (7.5%) | 3,869 (6.8%) |
| 15 to 19 Years | 4,414 (8.1%) | 4,082 (7.2%) |
| 20 to 24 Years | 4,229 (7.8%) | 4,168 (7.3%) |
| 25 to 29 Years | 4,133 (7.6%) | 4,302 (7.6%) |
| 30 to 34 Years | 4,003 (7.4%) | 4,219 (7.4%) |
| 35 to 39 Years | 3,319 (6.1%) | 4,031 (7.1%) |
| 40 to 44 Years | 3,774 (7.0%) | 3,367 (5.9%) |
| 45 to 49 Years | 3,251 (6.0%) | 3,188 (5.6%) |
| 50 to 54 Years | 2,937 (5.4%) | 3,086 (5.4%) |
| 55 to 59 Years | 3,795 (7.0%) | 3,124 (5.5%) |
| 60 to 64 Years | 2,123 (3.9%) | 3,320 (5.8%) |
| 65 to 69 Years | 2,080 (3.8%) | 2,470 (4.3%) |
| 70 to 74 Years | 1,783 (3.3%) | 2,437 (4.3%) |
| 75 to 79 Years | 1,091 (2.0%) | 1,494 (2.6%) |
| 80 to 84 Years | 732 (1.3%) | 1,271 (2.2%) |
| 85 Years and over | 654 (1.2%) | 1,107 (1.9%) |
| Total | 54,232 (100.0%) | 56,806 (100.0%) |
Families and Households in Craighead County
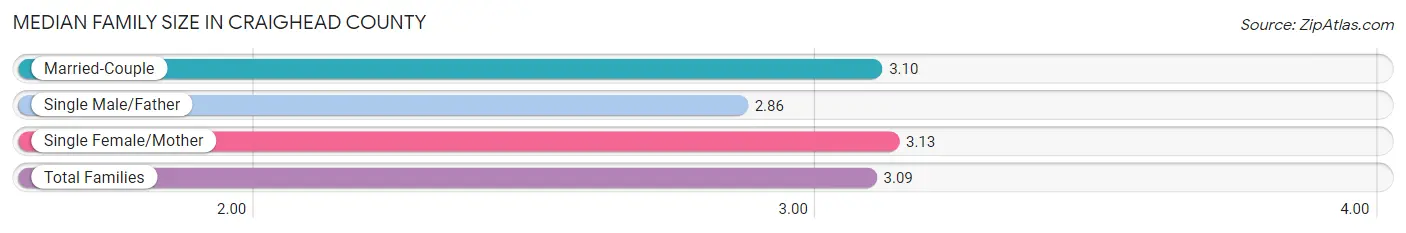
Median Family Size in Craighead County
The median family size in Craighead County is 3.09 persons per family, with single female/mother families (6,385 | 22.8%) accounting for the largest median family size of 3.13 persons per family. On the other hand, single male/father families (1,984 | 7.1%) represent the smallest median family size with 2.86 persons per family.
| Family Type | # Families | Family Size |
| Married-Couple | 19,678 (70.2%) | 3.10 |
| Single Male/Father | 1,984 (7.1%) | 2.86 |
| Single Female/Mother | 6,385 (22.8%) | 3.13 |
| Total Families | 28,047 (100.0%) | 3.09 |
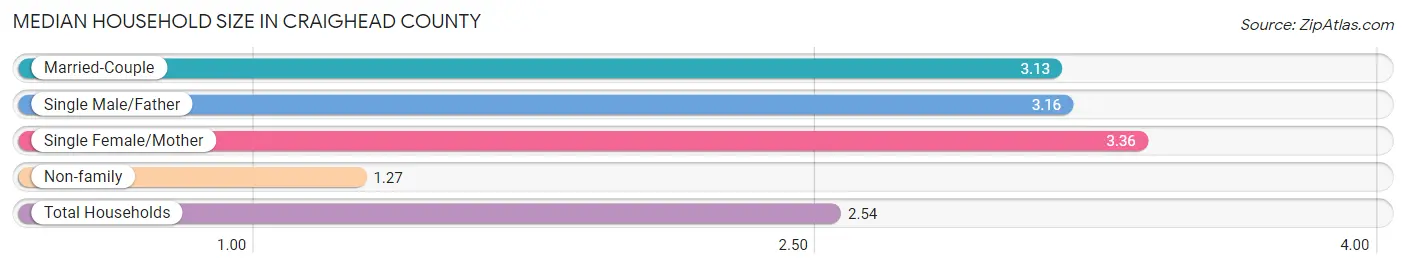
Median Household Size in Craighead County
The median household size in Craighead County is 2.54 persons per household, with single female/mother households (6,385 | 15.1%) accounting for the largest median household size of 3.36 persons per household. non-family households (14,304 | 33.8%) represent the smallest median household size with 1.27 persons per household.
| Household Type | # Households | Household Size |
| Married-Couple | 19,678 (46.5%) | 3.13 |
| Single Male/Father | 1,984 (4.7%) | 3.16 |
| Single Female/Mother | 6,385 (15.1%) | 3.36 |
| Non-family | 14,304 (33.8%) | 1.27 |
| Total Households | 42,351 (100.0%) | 2.54 |
Household Size by Marriage Status in Craighead County
Out of a total of 42,351 households in Craighead County, 28,047 (66.2%) are family households, while 14,304 (33.8%) are nonfamily households. The most numerous type of family households are 2-person households, comprising 11,999, and the most common type of nonfamily households are 1-person households, comprising 11,440.
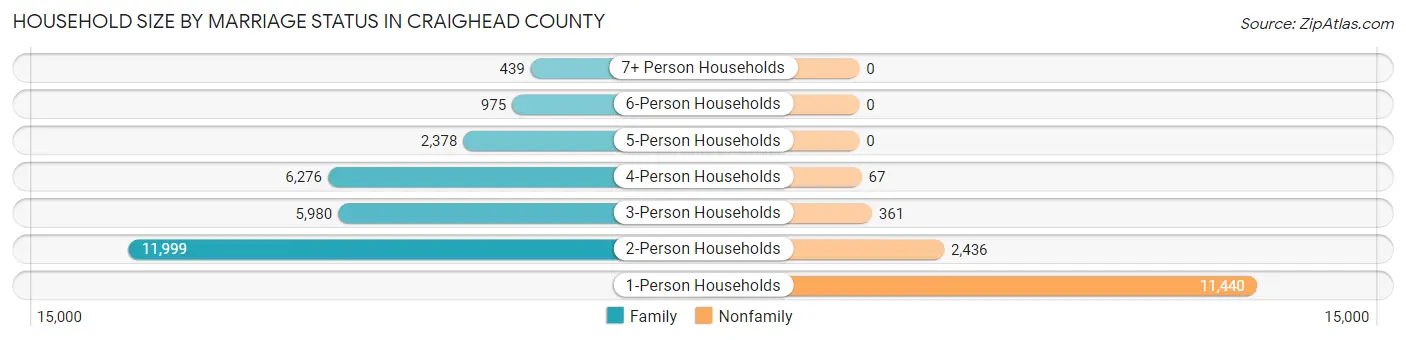
| Household Size | Family Households | Nonfamily Households |
| 1-Person Households | - | 11,440 (27.0%) |
| 2-Person Households | 11,999 (28.3%) | 2,436 (5.8%) |
| 3-Person Households | 5,980 (14.1%) | 361 (0.9%) |
| 4-Person Households | 6,276 (14.8%) | 67 (0.2%) |
| 5-Person Households | 2,378 (5.6%) | 0 (0.0%) |
| 6-Person Households | 975 (2.3%) | 0 (0.0%) |
| 7+ Person Households | 439 (1.0%) | 0 (0.0%) |
| Total | 28,047 (66.2%) | 14,304 (33.8%) |
Female Fertility in Craighead County
Fertility by Age in Craighead County
Average fertility rate in Craighead County is 42.0 births per 1,000 women. Women in the age bracket of 20 to 34 years have the highest fertility rate with 81.0 births per 1,000 women. Women in the age bracket of 20 to 34 years acount for 86.6% of all women with births.
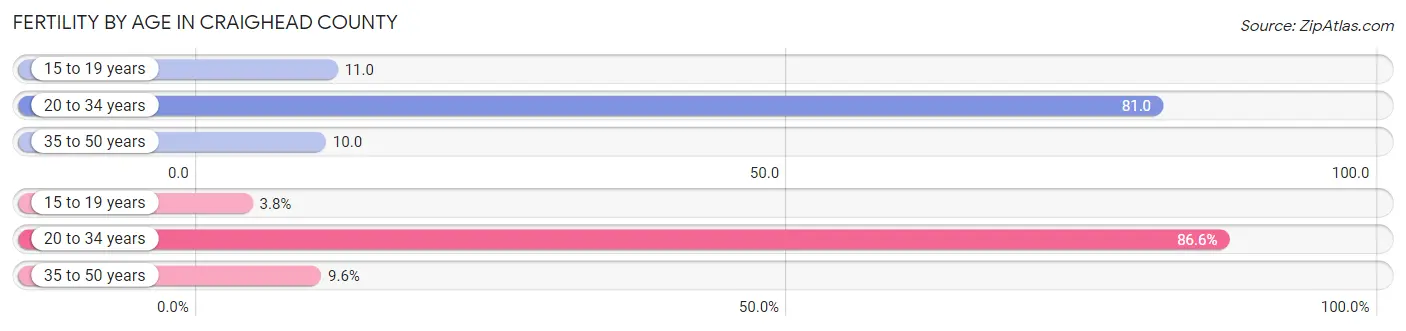
| Age Bracket | Women with Births | Births / 1,000 Women |
| 15 to 19 years | 45 (3.8%) | 11.0 |
| 20 to 34 years | 1,030 (86.6%) | 81.0 |
| 35 to 50 years | 114 (9.6%) | 10.0 |
| Total | 1,189 (100.0%) | 42.0 |
Fertility by Age by Marriage Status in Craighead County
59.7% of women with births (1,189) in Craighead County are married. The highest percentage of unmarried women with births falls into 15 to 19 years age bracket with 75.6% of them unmarried at the time of birth, while the lowest percentage of unmarried women with births belong to 35 to 50 years age bracket with 3.5% of them unmarried.
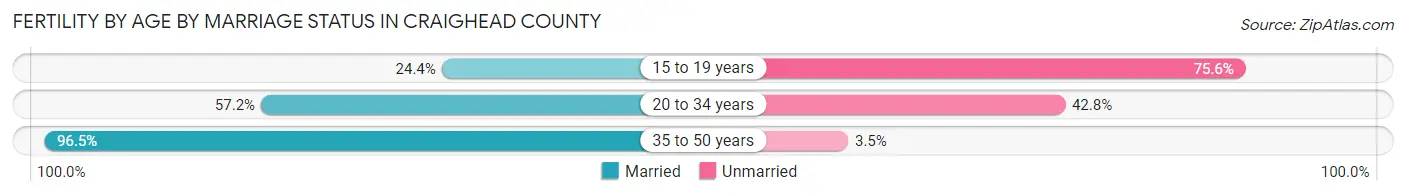
| Age Bracket | Married | Unmarried |
| 15 to 19 years | 11 (24.4%) | 34 (75.6%) |
| 20 to 34 years | 589 (57.2%) | 441 (42.8%) |
| 35 to 50 years | 110 (96.5%) | 4 (3.5%) |
| Total | 710 (59.7%) | 479 (40.3%) |
Fertility by Education in Craighead County
Average fertility rate in Craighead County is 42.0 births per 1,000 women. Women with the education attainment of high school diploma have the highest fertility rate of 70.0 births per 1,000 women, while women with the education attainment of bachelor's degree have the lowest fertility at 26.0 births per 1,000 women. Women with the education attainment of high school diploma represent 39.1% of all women with births.
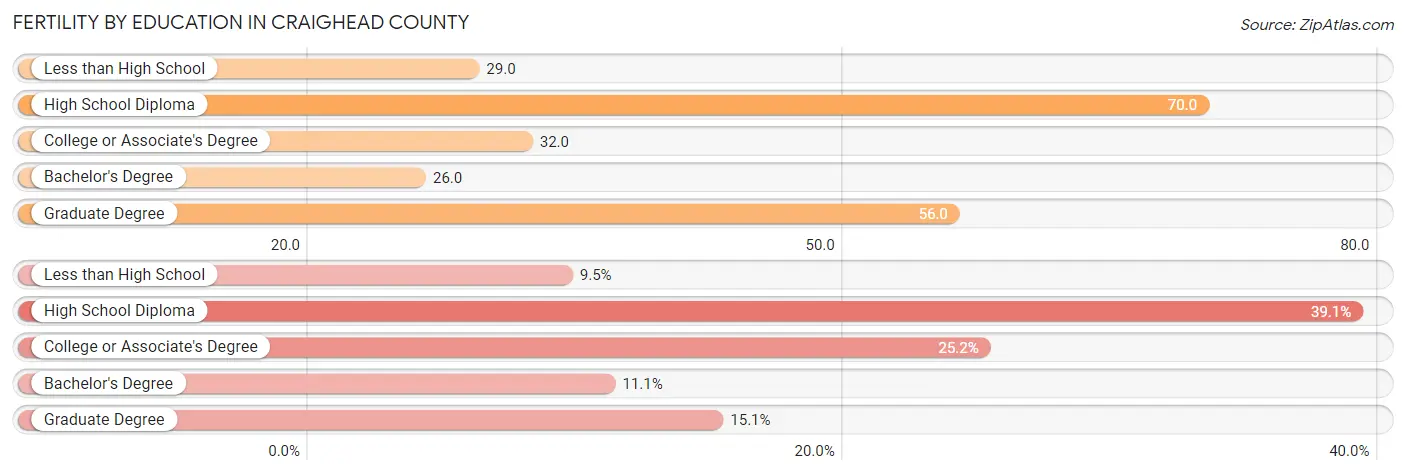
| Educational Attainment | Women with Births | Births / 1,000 Women |
| Less than High School | 113 (9.5%) | 29.0 |
| High School Diploma | 465 (39.1%) | 70.0 |
| College or Associate's Degree | 299 (25.2%) | 32.0 |
| Bachelor's Degree | 132 (11.1%) | 26.0 |
| Graduate Degree | 180 (15.1%) | 56.0 |
| Total | 1,189 (100.0%) | 42.0 |
Fertility by Education by Marriage Status in Craighead County
40.3% of women with births in Craighead County are unmarried. Women with the educational attainment of bachelor's degree are most likely to be married with 97.0% of them married at childbirth, while women with the educational attainment of less than high school are least likely to be married with 83.2% of them unmarried at childbirth.
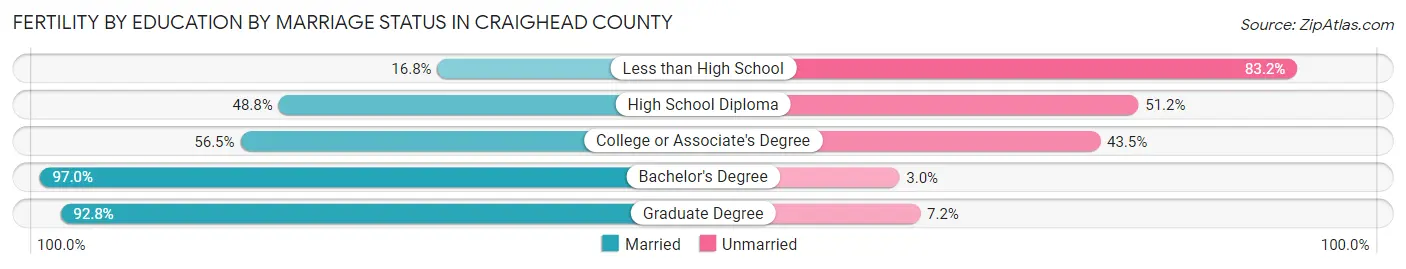
| Educational Attainment | Married | Unmarried |
| Less than High School | 19 (16.8%) | 94 (83.2%) |
| High School Diploma | 227 (48.8%) | 238 (51.2%) |
| College or Associate's Degree | 169 (56.5%) | 130 (43.5%) |
| Bachelor's Degree | 128 (97.0%) | 4 (3.0%) |
| Graduate Degree | 167 (92.8%) | 13 (7.2%) |
| Total | 710 (59.7%) | 479 (40.3%) |
Employment Characteristics in Craighead County
Employment by Class of Employer in Craighead County
Among the 50,201 employed individuals in Craighead County, private company employees (32,177 | 64.1%), not-for-profit organizations (4,971 | 9.9%), and self-employed (not incorporated) (3,528 | 7.0%) make up the most common classes of employment.
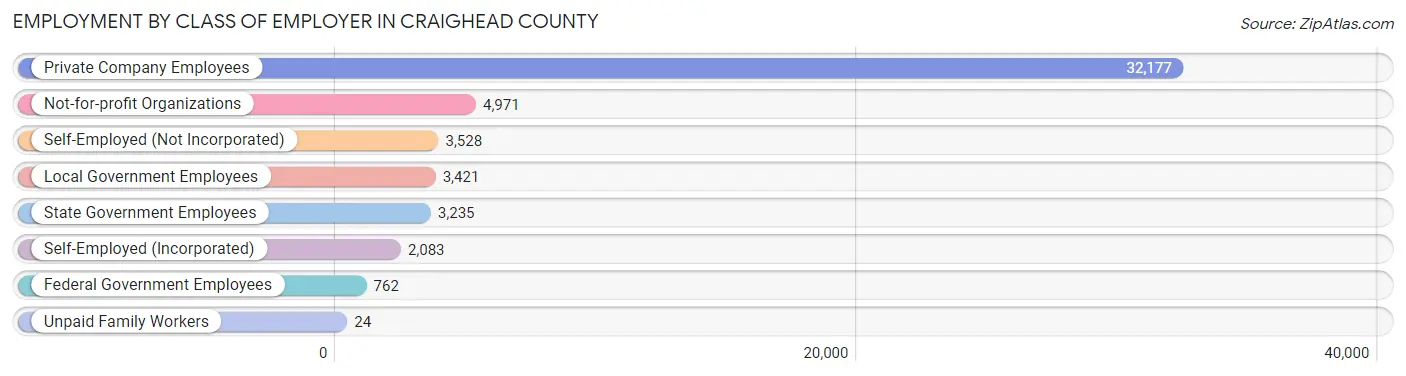
| Employer Class | # Employees | % Employees |
| Private Company Employees | 32,177 | 64.1% |
| Self-Employed (Incorporated) | 2,083 | 4.2% |
| Self-Employed (Not Incorporated) | 3,528 | 7.0% |
| Not-for-profit Organizations | 4,971 | 9.9% |
| Local Government Employees | 3,421 | 6.8% |
| State Government Employees | 3,235 | 6.4% |
| Federal Government Employees | 762 | 1.5% |
| Unpaid Family Workers | 24 | 0.1% |
| Total | 50,201 | 100.0% |
Employment Status by Age in Craighead County
According to the labor force statistics for Craighead County, out of the total population over 16 years of age (86,323), 63.5% or 54,815 individuals are in the labor force, with 5.9% or 3,234 of them unemployed. The age group with the highest labor force participation rate is 30 to 34 years, with 83.9% or 6,898 individuals in the labor force. Within the labor force, the 16 to 19 years age range has the highest percentage of unemployed individuals, with 20.1% or 532 of them being unemployed.
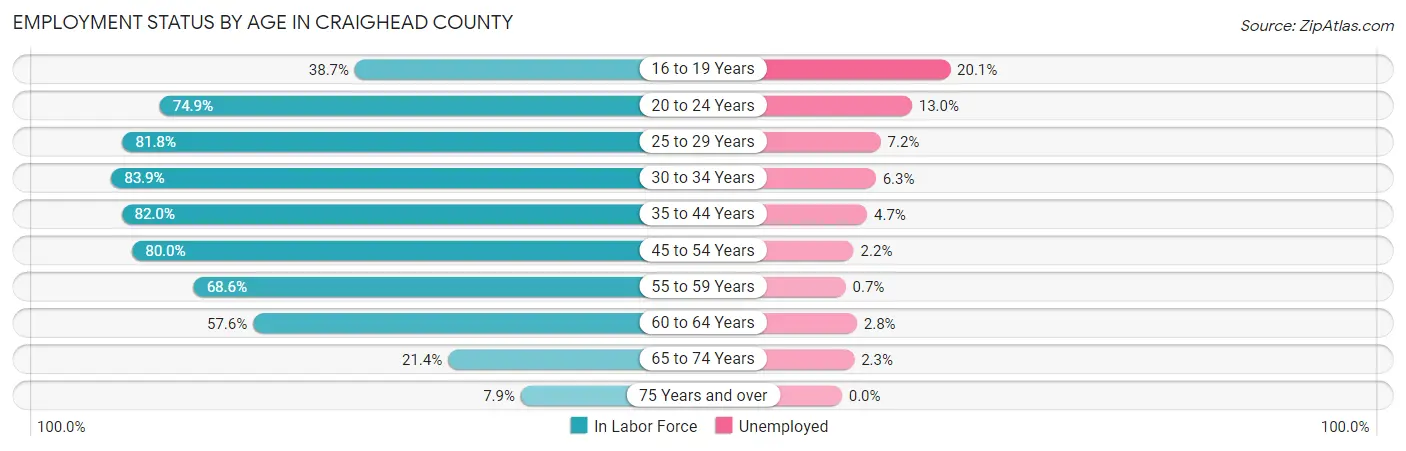
| Age Bracket | In Labor Force | Unemployed |
| 16 to 19 Years | 2,645 (38.7%) | 532 (20.1%) |
| 20 to 24 Years | 6,289 (74.9%) | 818 (13.0%) |
| 25 to 29 Years | 6,900 (81.8%) | 497 (7.2%) |
| 30 to 34 Years | 6,898 (83.9%) | 435 (6.3%) |
| 35 to 44 Years | 11,883 (82.0%) | 559 (4.7%) |
| 45 to 54 Years | 9,970 (80.0%) | 219 (2.2%) |
| 55 to 59 Years | 4,746 (68.6%) | 33 (0.7%) |
| 60 to 64 Years | 3,135 (57.6%) | 88 (2.8%) |
| 65 to 74 Years | 1,877 (21.4%) | 43 (2.3%) |
| 75 Years and over | 502 (7.9%) | 0 (0.0%) |
| Total | 54,815 (63.5%) | 3,234 (5.9%) |
Employment Status by Educational Attainment in Craighead County
According to labor force statistics for Craighead County, 77.8% of individuals (43,546) out of the total population between 25 and 64 years of age (55,972) are in the labor force, with 4.2% or 1,829 of them being unemployed. The group with the highest labor force participation rate are those with the educational attainment of bachelor's degree or higher, with 88.9% or 14,796 individuals in the labor force. Within the labor force, individuals with less than high school education have the highest percentage of unemployment, with 8.6% or 235 of them being unemployed.
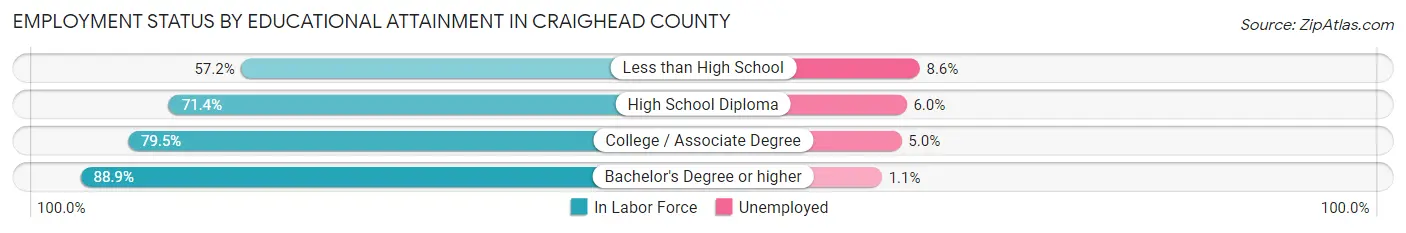
| Educational Attainment | In Labor Force | Unemployed |
| Less than High School | 2,727 (57.2%) | 410 (8.6%) |
| High School Diploma | 12,891 (71.4%) | 1,083 (6.0%) |
| College / Associate Degree | 13,124 (79.5%) | 825 (5.0%) |
| Bachelor's Degree or higher | 14,796 (88.9%) | 183 (1.1%) |
| Total | 43,546 (77.8%) | 2,351 (4.2%) |
Employment Occupations by Sex in Craighead County
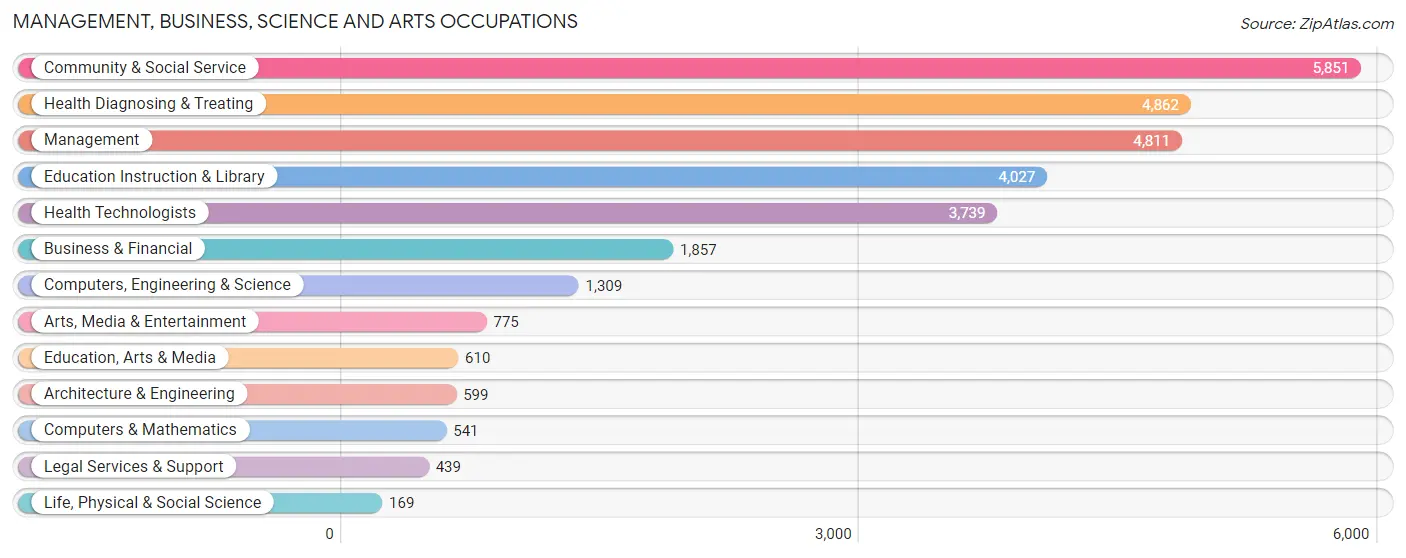
Management, Business, Science and Arts Occupations
The most common Management, Business, Science and Arts occupations in Craighead County are Community & Social Service (5,851 | 11.4%), Health Diagnosing & Treating (4,862 | 9.4%), Management (4,811 | 9.3%), Education Instruction & Library (4,027 | 7.8%), and Health Technologists (3,739 | 7.3%).
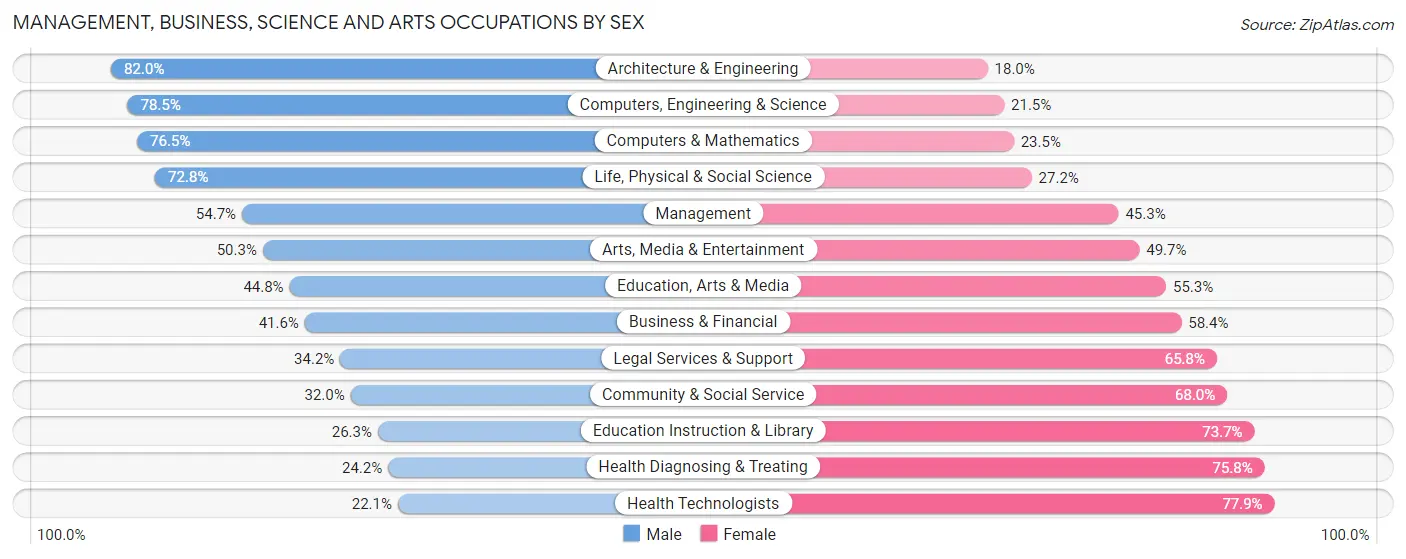
Management, Business, Science and Arts Occupations by Sex
Within the Management, Business, Science and Arts occupations in Craighead County, the most male-oriented occupations are Architecture & Engineering (82.0%), Computers, Engineering & Science (78.5%), and Computers & Mathematics (76.5%), while the most female-oriented occupations are Health Technologists (77.9%), Health Diagnosing & Treating (75.8%), and Education Instruction & Library (73.7%).
| Occupation | Male | Female |
| Management | 2,630 (54.7%) | 2,181 (45.3%) |
| Business & Financial | 772 (41.6%) | 1,085 (58.4%) |
| Computers, Engineering & Science | 1,028 (78.5%) | 281 (21.5%) |
| Computers & Mathematics | 414 (76.5%) | 127 (23.5%) |
| Architecture & Engineering | 491 (82.0%) | 108 (18.0%) |
| Life, Physical & Social Science | 123 (72.8%) | 46 (27.2%) |
| Community & Social Service | 1,873 (32.0%) | 3,978 (68.0%) |
| Education, Arts & Media | 273 (44.8%) | 337 (55.2%) |
| Legal Services & Support | 150 (34.2%) | 289 (65.8%) |
| Education Instruction & Library | 1,060 (26.3%) | 2,967 (73.7%) |
| Arts, Media & Entertainment | 390 (50.3%) | 385 (49.7%) |
| Health Diagnosing & Treating | 1,176 (24.2%) | 3,686 (75.8%) |
| Health Technologists | 828 (22.1%) | 2,911 (77.9%) |
| Total (Category) | 7,479 (40.0%) | 11,211 (60.0%) |
| Total (Overall) | 26,539 (51.5%) | 24,955 (48.5%) |
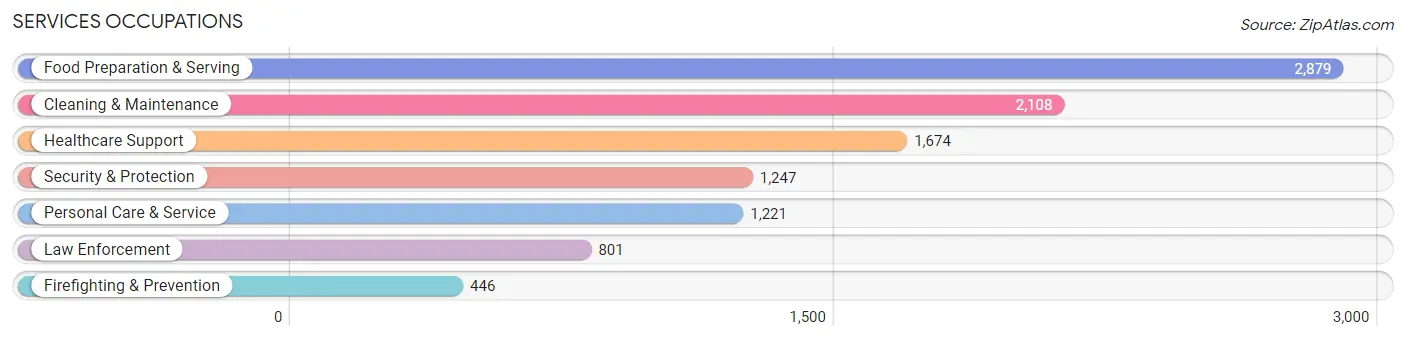
Services Occupations
The most common Services occupations in Craighead County are Food Preparation & Serving (2,879 | 5.6%), Cleaning & Maintenance (2,108 | 4.1%), Healthcare Support (1,674 | 3.3%), Security & Protection (1,247 | 2.4%), and Personal Care & Service (1,221 | 2.4%).
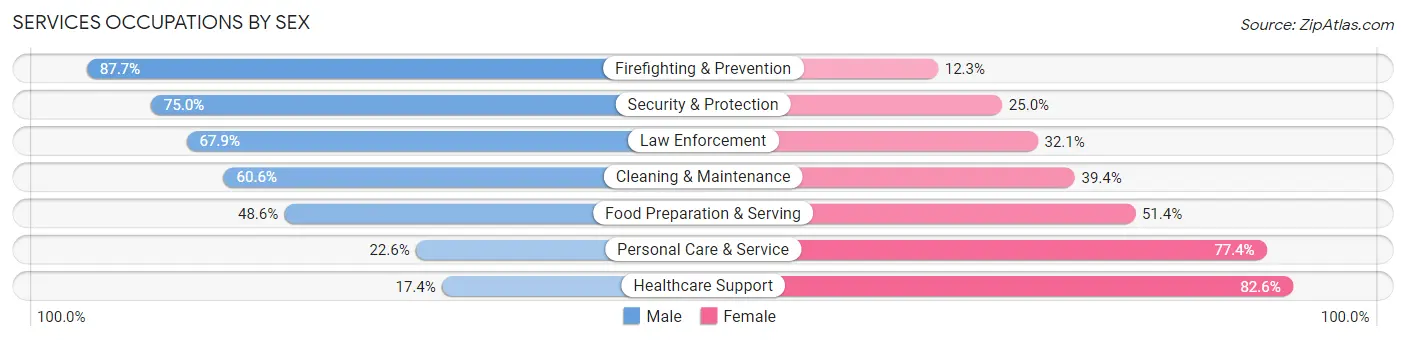
Services Occupations by Sex
Within the Services occupations in Craighead County, the most male-oriented occupations are Firefighting & Prevention (87.7%), Security & Protection (75.0%), and Law Enforcement (67.9%), while the most female-oriented occupations are Healthcare Support (82.6%), Personal Care & Service (77.4%), and Food Preparation & Serving (51.4%).
| Occupation | Male | Female |
| Healthcare Support | 292 (17.4%) | 1,382 (82.6%) |
| Security & Protection | 935 (75.0%) | 312 (25.0%) |
| Firefighting & Prevention | 391 (87.7%) | 55 (12.3%) |
| Law Enforcement | 544 (67.9%) | 257 (32.1%) |
| Food Preparation & Serving | 1,400 (48.6%) | 1,479 (51.4%) |
| Cleaning & Maintenance | 1,277 (60.6%) | 831 (39.4%) |
| Personal Care & Service | 276 (22.6%) | 945 (77.4%) |
| Total (Category) | 4,180 (45.8%) | 4,949 (54.2%) |
| Total (Overall) | 26,539 (51.5%) | 24,955 (48.5%) |
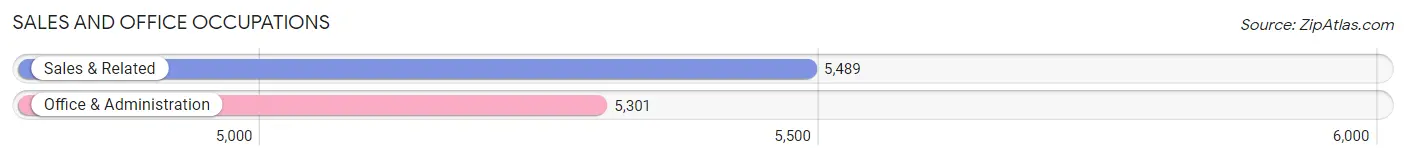
Sales and Office Occupations
The most common Sales and Office occupations in Craighead County are Sales & Related (5,489 | 10.7%), and Office & Administration (5,301 | 10.3%).
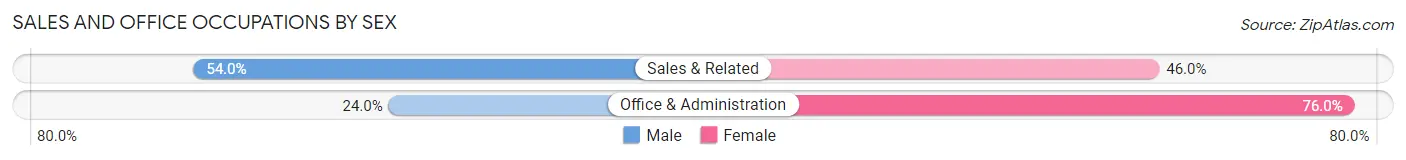
Sales and Office Occupations by Sex
| Occupation | Male | Female |
| Sales & Related | 2,966 (54.0%) | 2,523 (46.0%) |
| Office & Administration | 1,273 (24.0%) | 4,028 (76.0%) |
| Total (Category) | 4,239 (39.3%) | 6,551 (60.7%) |
| Total (Overall) | 26,539 (51.5%) | 24,955 (48.5%) |
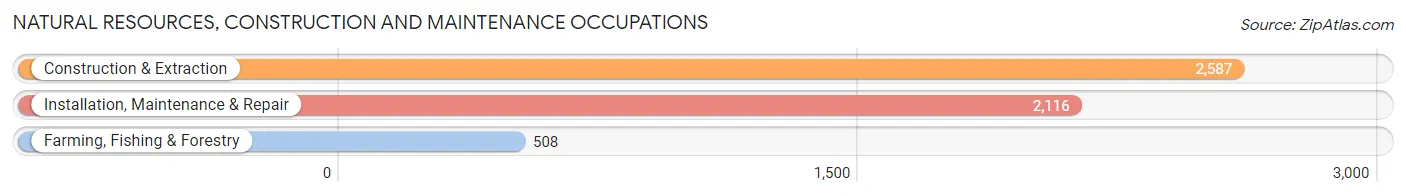
Natural Resources, Construction and Maintenance Occupations
The most common Natural Resources, Construction and Maintenance occupations in Craighead County are Construction & Extraction (2,587 | 5.0%), Installation, Maintenance & Repair (2,116 | 4.1%), and Farming, Fishing & Forestry (508 | 1.0%).
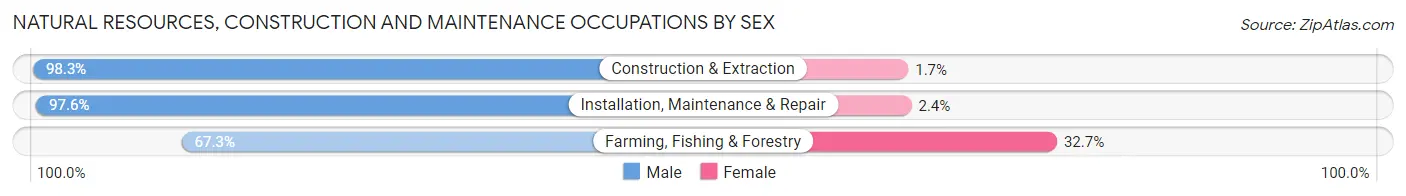
Natural Resources, Construction and Maintenance Occupations by Sex
| Occupation | Male | Female |
| Farming, Fishing & Forestry | 342 (67.3%) | 166 (32.7%) |
| Construction & Extraction | 2,542 (98.3%) | 45 (1.7%) |
| Installation, Maintenance & Repair | 2,065 (97.6%) | 51 (2.4%) |
| Total (Category) | 4,949 (95.0%) | 262 (5.0%) |
| Total (Overall) | 26,539 (51.5%) | 24,955 (48.5%) |
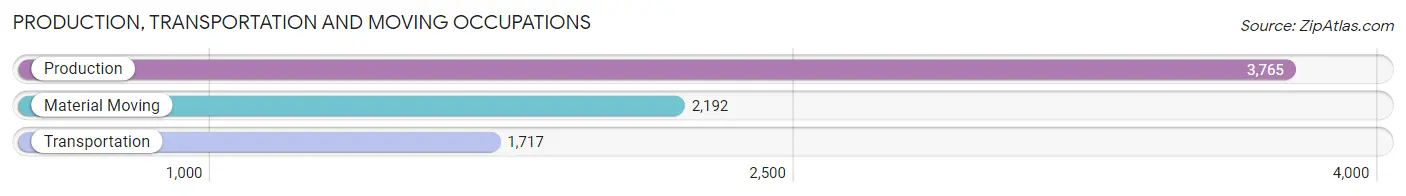
Production, Transportation and Moving Occupations
The most common Production, Transportation and Moving occupations in Craighead County are Production (3,765 | 7.3%), Material Moving (2,192 | 4.3%), and Transportation (1,717 | 3.3%).
Production, Transportation and Moving Occupations by Sex
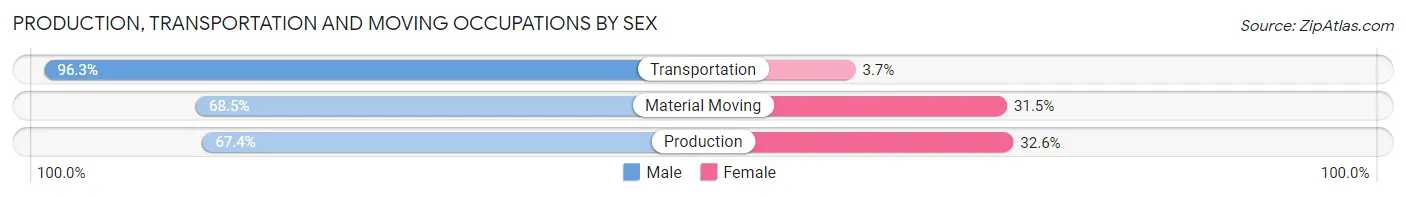
| Occupation | Male | Female |
| Production | 2,536 (67.4%) | 1,229 (32.6%) |
| Transportation | 1,654 (96.3%) | 63 (3.7%) |
| Material Moving | 1,502 (68.5%) | 690 (31.5%) |
| Total (Category) | 5,692 (74.2%) | 1,982 (25.8%) |
| Total (Overall) | 26,539 (51.5%) | 24,955 (48.5%) |
Employment Industries by Sex in Craighead County
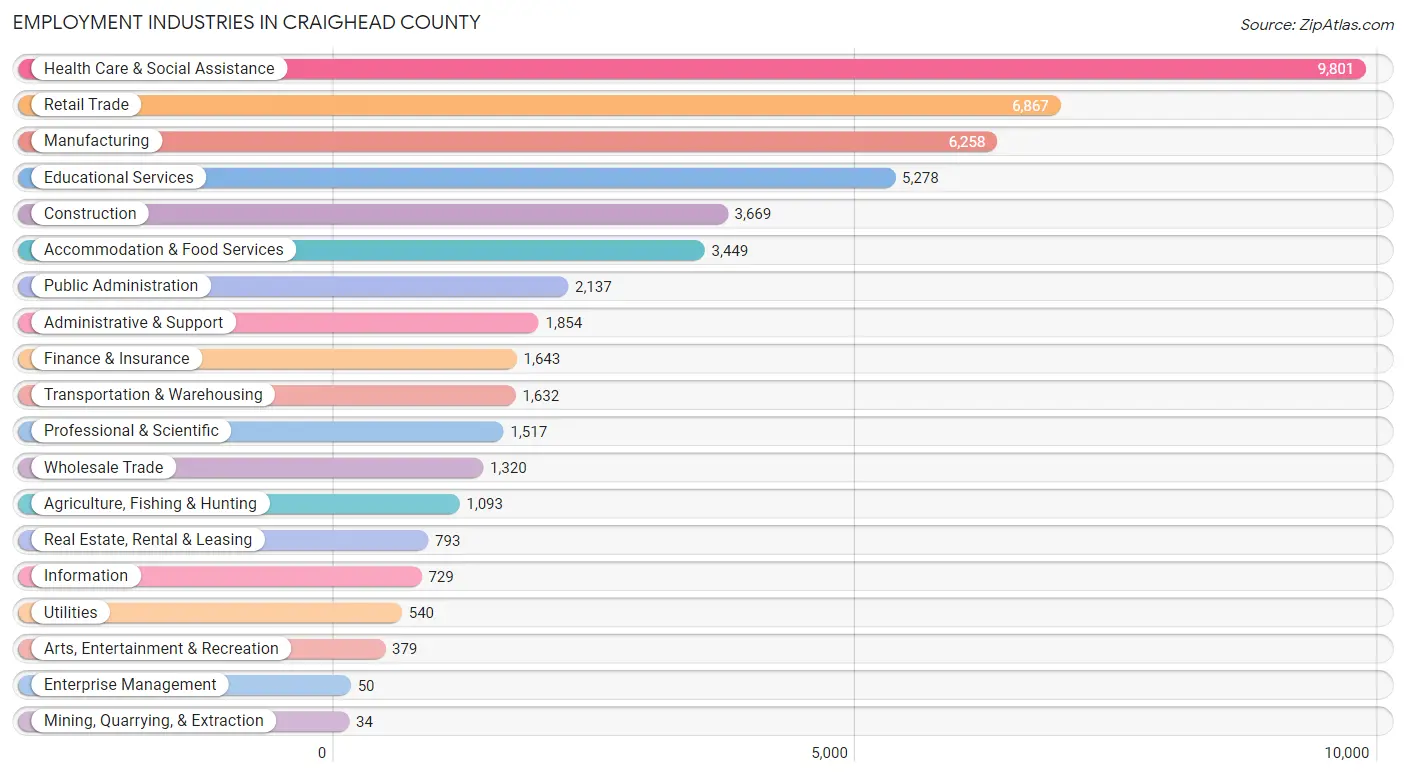
Employment Industries in Craighead County
The major employment industries in Craighead County include Health Care & Social Assistance (9,801 | 19.0%), Retail Trade (6,867 | 13.3%), Manufacturing (6,258 | 12.1%), Educational Services (5,278 | 10.2%), and Construction (3,669 | 7.1%).
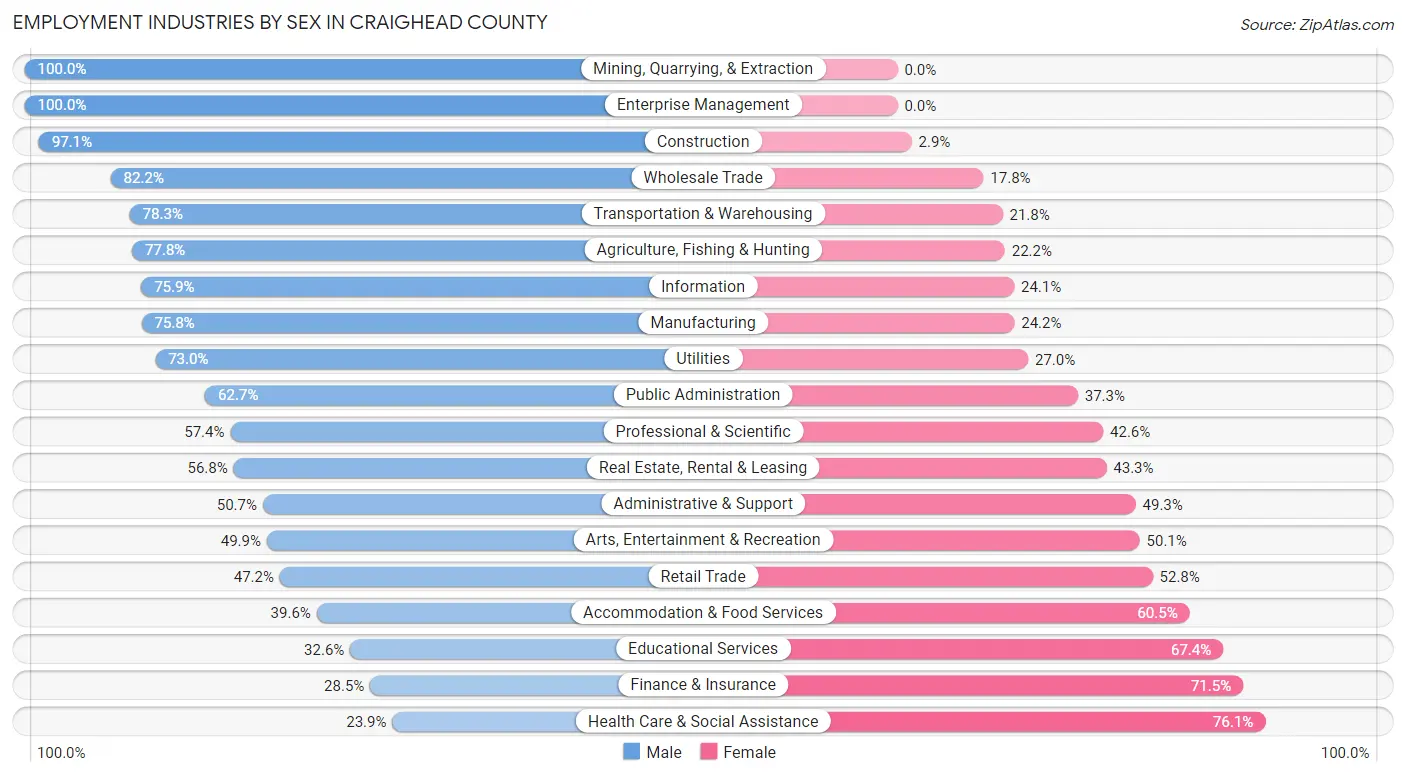
Employment Industries by Sex in Craighead County
The Craighead County industries that see more men than women are Mining, Quarrying, & Extraction (100.0%), Enterprise Management (100.0%), and Construction (97.1%), whereas the industries that tend to have a higher number of women are Health Care & Social Assistance (76.1%), Finance & Insurance (71.5%), and Educational Services (67.4%).
| Industry | Male | Female |
| Agriculture, Fishing & Hunting | 850 (77.8%) | 243 (22.2%) |
| Mining, Quarrying, & Extraction | 34 (100.0%) | 0 (0.0%) |
| Construction | 3,561 (97.1%) | 108 (2.9%) |
| Manufacturing | 4,744 (75.8%) | 1,514 (24.2%) |
| Wholesale Trade | 1,085 (82.2%) | 235 (17.8%) |
| Retail Trade | 3,240 (47.2%) | 3,627 (52.8%) |
| Transportation & Warehousing | 1,277 (78.2%) | 355 (21.7%) |
| Utilities | 394 (73.0%) | 146 (27.0%) |
| Information | 553 (75.9%) | 176 (24.1%) |
| Finance & Insurance | 468 (28.5%) | 1,175 (71.5%) |
| Real Estate, Rental & Leasing | 450 (56.8%) | 343 (43.2%) |
| Professional & Scientific | 871 (57.4%) | 646 (42.6%) |
| Enterprise Management | 50 (100.0%) | 0 (0.0%) |
| Administrative & Support | 940 (50.7%) | 914 (49.3%) |
| Educational Services | 1,721 (32.6%) | 3,557 (67.4%) |
| Health Care & Social Assistance | 2,341 (23.9%) | 7,460 (76.1%) |
| Arts, Entertainment & Recreation | 189 (49.9%) | 190 (50.1%) |
| Accommodation & Food Services | 1,364 (39.6%) | 2,085 (60.5%) |
| Public Administration | 1,339 (62.7%) | 798 (37.3%) |
| Total | 26,539 (51.5%) | 24,955 (48.5%) |
Education in Craighead County
School Enrollment in Craighead County
The most common levels of schooling among the 30,708 students in Craighead County are college / undergraduate (6,581 | 21.4%), high school (6,249 | 20.3%), and elementary school (6,062 | 19.7%).
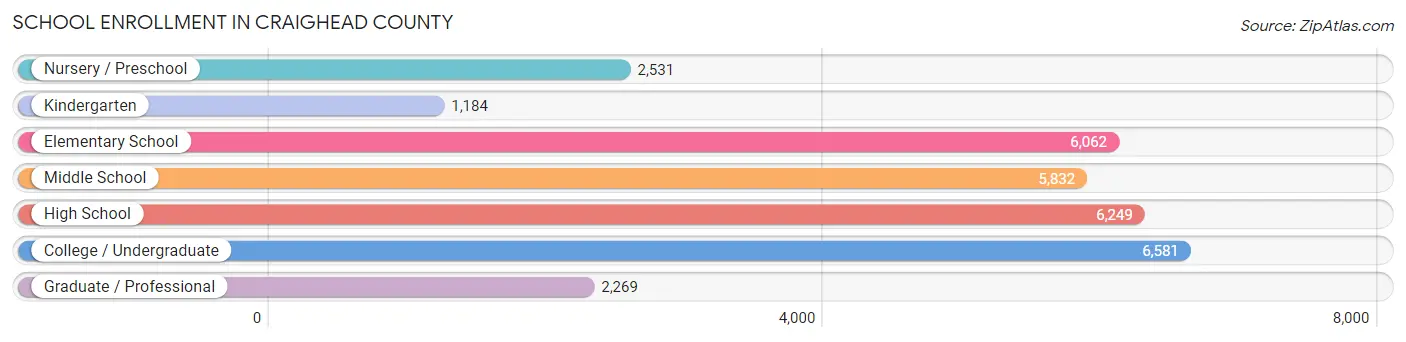
| School Level | # Students | % Students |
| Nursery / Preschool | 2,531 | 8.2% |
| Kindergarten | 1,184 | 3.9% |
| Elementary School | 6,062 | 19.7% |
| Middle School | 5,832 | 19.0% |
| High School | 6,249 | 20.3% |
| College / Undergraduate | 6,581 | 21.4% |
| Graduate / Professional | 2,269 | 7.4% |
| Total | 30,708 | 100.0% |
School Enrollment by Age by Funding Source in Craighead County
Out of a total of 30,708 students who are enrolled in schools in Craighead County, 2,395 (7.8%) attend a private institution, while the remaining 28,313 (92.2%) are enrolled in public schools. The age group of 3 to 4 year olds has the highest likelihood of being enrolled in private schools, with 475 (26.0% in the age bracket) enrolled. Conversely, the age group of 10 to 14 year olds has the lowest likelihood of being enrolled in a private school, with 7,338 (96.0% in the age bracket) attending a public institution.
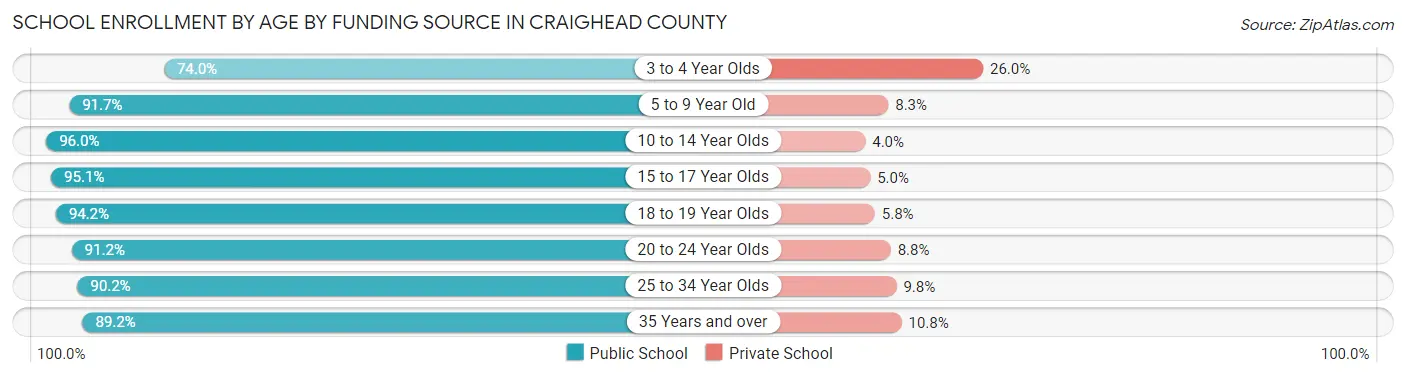
| Age Bracket | Public School | Private School |
| 3 to 4 Year Olds | 1,355 (74.0%) | 475 (26.0%) |
| 5 to 9 Year Old | 6,324 (91.7%) | 573 (8.3%) |
| 10 to 14 Year Olds | 7,338 (96.0%) | 308 (4.0%) |
| 15 to 17 Year Olds | 4,183 (95.1%) | 218 (5.0%) |
| 18 to 19 Year Olds | 2,725 (94.2%) | 168 (5.8%) |
| 20 to 24 Year Olds | 3,549 (91.2%) | 341 (8.8%) |
| 25 to 34 Year Olds | 1,879 (90.2%) | 205 (9.8%) |
| 35 Years and over | 952 (89.2%) | 115 (10.8%) |
| Total | 28,313 (92.2%) | 2,395 (7.8%) |
Educational Attainment by Field of Study in Craighead County
Business (4,251 | 20.2%), science & technology (3,419 | 16.3%), education (3,360 | 16.0%), bio, nature & agricultural (1,628 | 7.7%), and arts & humanities (1,593 | 7.6%) are the most common fields of study among 21,023 individuals in Craighead County who have obtained a bachelor's degree or higher.
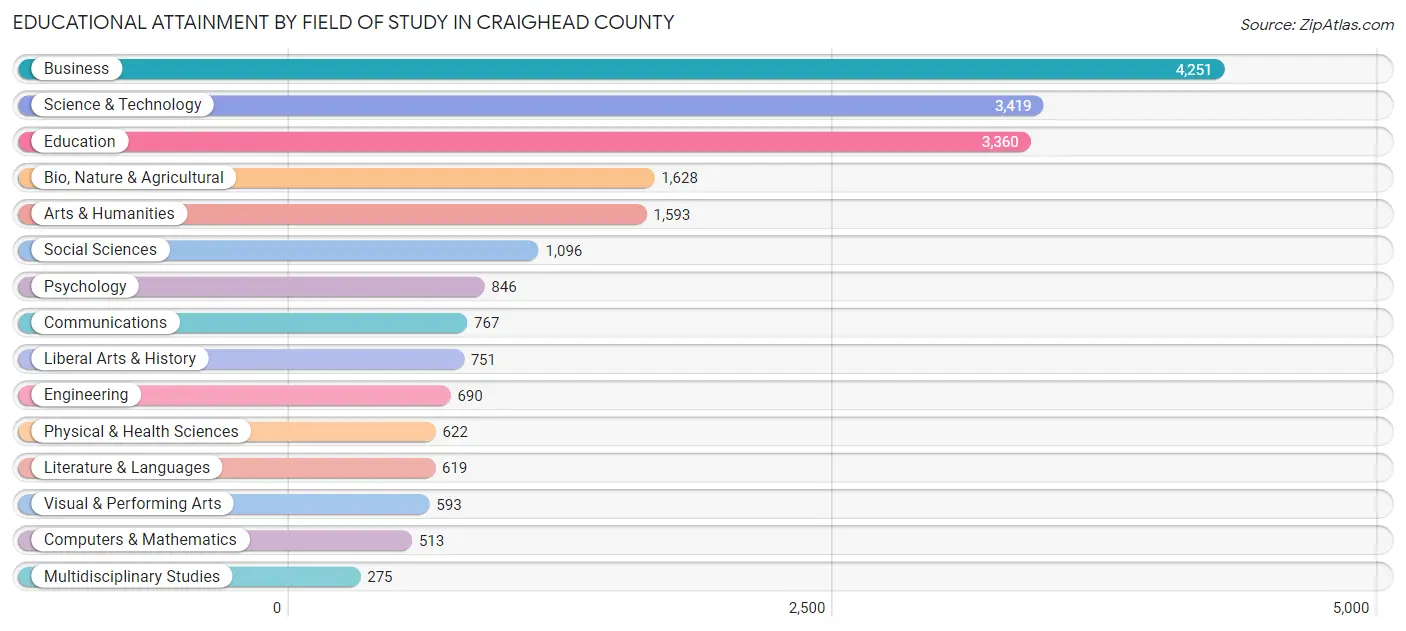
| Field of Study | # Graduates | % Graduates |
| Computers & Mathematics | 513 | 2.4% |
| Bio, Nature & Agricultural | 1,628 | 7.7% |
| Physical & Health Sciences | 622 | 3.0% |
| Psychology | 846 | 4.0% |
| Social Sciences | 1,096 | 5.2% |
| Engineering | 690 | 3.3% |
| Multidisciplinary Studies | 275 | 1.3% |
| Science & Technology | 3,419 | 16.3% |
| Business | 4,251 | 20.2% |
| Education | 3,360 | 16.0% |
| Literature & Languages | 619 | 2.9% |
| Liberal Arts & History | 751 | 3.6% |
| Visual & Performing Arts | 593 | 2.8% |
| Communications | 767 | 3.6% |
| Arts & Humanities | 1,593 | 7.6% |
| Total | 21,023 | 100.0% |
Transportation & Commute in Craighead County
Vehicle Availability by Sex in Craighead County
The most prevalent vehicle ownership categories in Craighead County are males with 2 vehicles (11,610, accounting for 45.2%) and females with 2 vehicles (10,506, making up 49.0%).
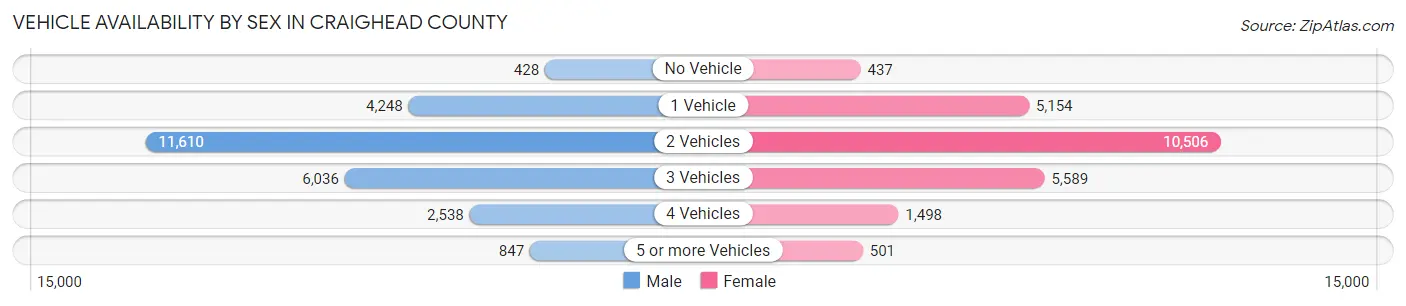
| Vehicles Available | Male | Female |
| No Vehicle | 428 (1.7%) | 437 (1.8%) |
| 1 Vehicle | 4,248 (16.5%) | 5,154 (21.8%) |
| 2 Vehicles | 11,610 (45.2%) | 10,506 (44.4%) |
| 3 Vehicles | 6,036 (23.5%) | 5,589 (23.6%) |
| 4 Vehicles | 2,538 (9.9%) | 1,498 (6.3%) |
| 5 or more Vehicles | 847 (3.3%) | 501 (2.1%) |
| Total | 25,707 (100.0%) | 23,685 (100.0%) |
Commute Time in Craighead County
The most frequently occuring commute durations in Craighead County are 15 to 19 minutes (11,735 commuters, 24.4%), 10 to 14 minutes (10,861 commuters, 22.6%), and 20 to 24 minutes (7,723 commuters, 16.1%).
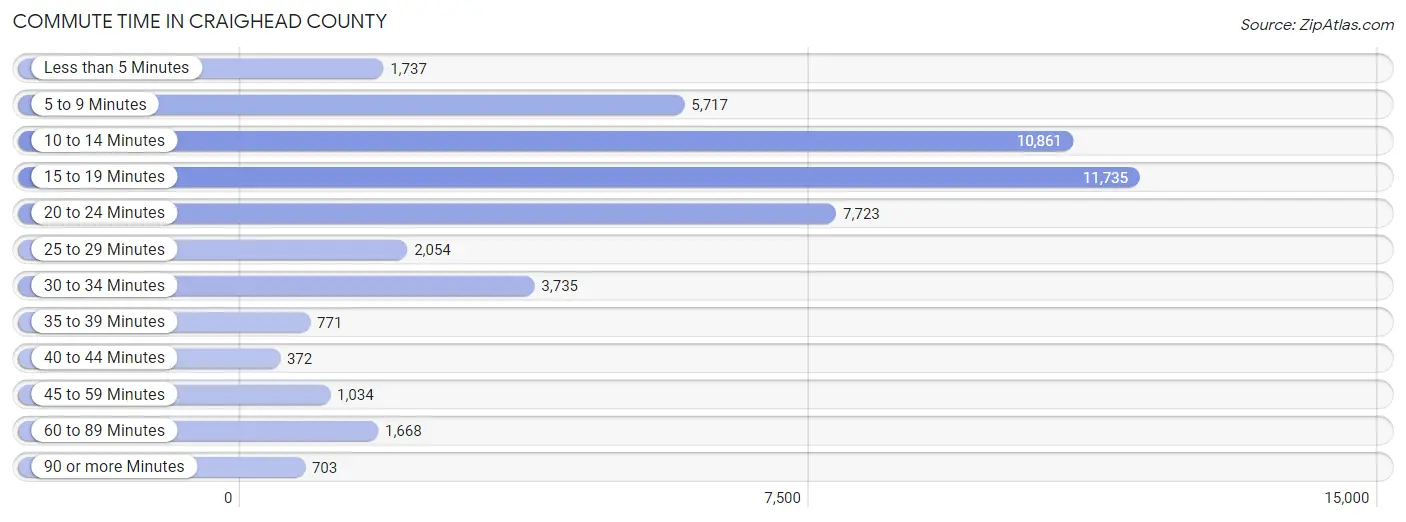
| Commute Time | # Commuters | % Commuters |
| Less than 5 Minutes | 1,737 | 3.6% |
| 5 to 9 Minutes | 5,717 | 11.9% |
| 10 to 14 Minutes | 10,861 | 22.6% |
| 15 to 19 Minutes | 11,735 | 24.4% |
| 20 to 24 Minutes | 7,723 | 16.1% |
| 25 to 29 Minutes | 2,054 | 4.3% |
| 30 to 34 Minutes | 3,735 | 7.8% |
| 35 to 39 Minutes | 771 | 1.6% |
| 40 to 44 Minutes | 372 | 0.8% |
| 45 to 59 Minutes | 1,034 | 2.1% |
| 60 to 89 Minutes | 1,668 | 3.5% |
| 90 or more Minutes | 703 | 1.5% |
Commute Time by Sex in Craighead County
The most common commute times in Craighead County are 15 to 19 minutes (6,255 commuters, 24.9%) for males and 10 to 14 minutes (5,770 commuters, 25.1%) for females.
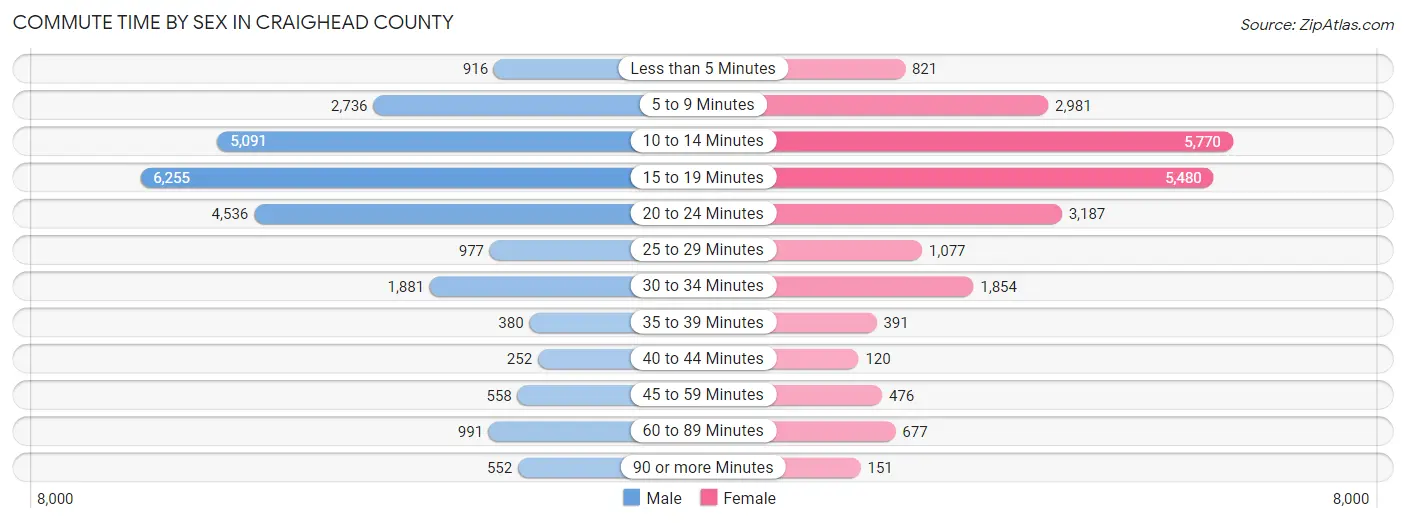
| Commute Time | Male | Female |
| Less than 5 Minutes | 916 (3.6%) | 821 (3.6%) |
| 5 to 9 Minutes | 2,736 (10.9%) | 2,981 (13.0%) |
| 10 to 14 Minutes | 5,091 (20.3%) | 5,770 (25.1%) |
| 15 to 19 Minutes | 6,255 (24.9%) | 5,480 (23.8%) |
| 20 to 24 Minutes | 4,536 (18.0%) | 3,187 (13.9%) |
| 25 to 29 Minutes | 977 (3.9%) | 1,077 (4.7%) |
| 30 to 34 Minutes | 1,881 (7.5%) | 1,854 (8.1%) |
| 35 to 39 Minutes | 380 (1.5%) | 391 (1.7%) |
| 40 to 44 Minutes | 252 (1.0%) | 120 (0.5%) |
| 45 to 59 Minutes | 558 (2.2%) | 476 (2.1%) |
| 60 to 89 Minutes | 991 (3.9%) | 677 (2.9%) |
| 90 or more Minutes | 552 (2.2%) | 151 (0.7%) |
Time of Departure to Work by Sex in Craighead County
The most frequent times of departure to work in Craighead County are 7:00 AM to 7:29 AM (3,595, 14.3%) for males and 7:00 AM to 7:29 AM (4,469, 19.4%) for females.
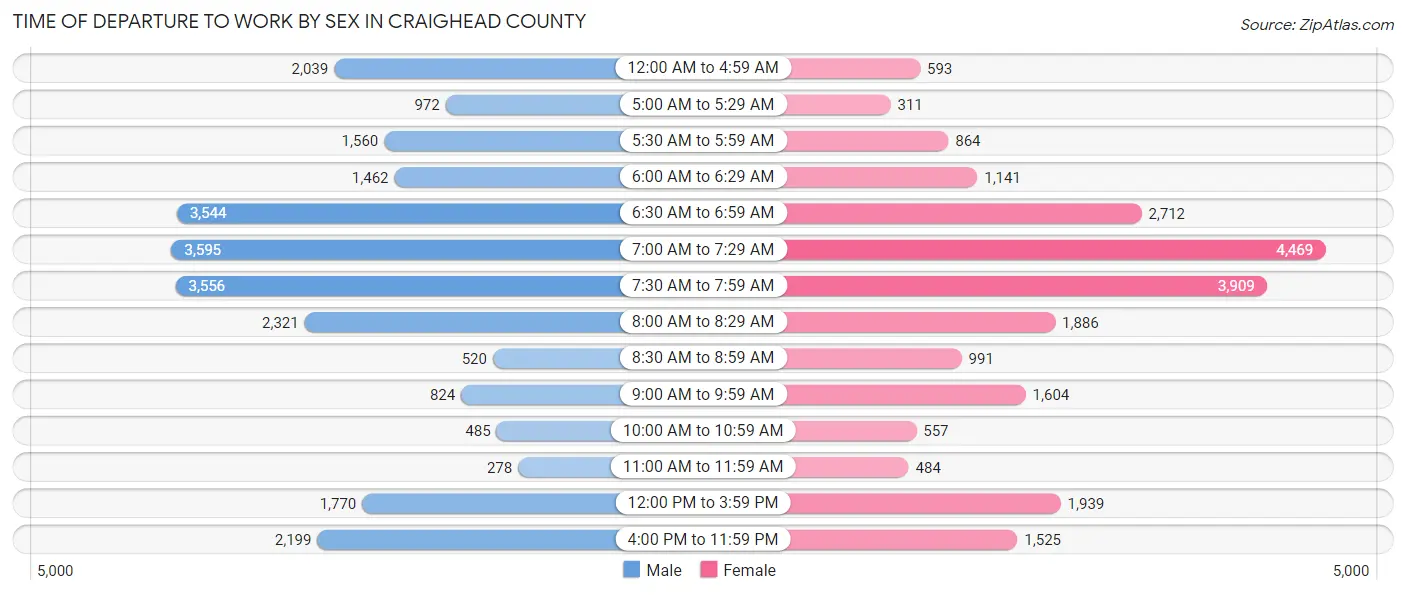
| Time of Departure | Male | Female |
| 12:00 AM to 4:59 AM | 2,039 (8.1%) | 593 (2.6%) |
| 5:00 AM to 5:29 AM | 972 (3.9%) | 311 (1.3%) |
| 5:30 AM to 5:59 AM | 1,560 (6.2%) | 864 (3.8%) |
| 6:00 AM to 6:29 AM | 1,462 (5.8%) | 1,141 (5.0%) |
| 6:30 AM to 6:59 AM | 3,544 (14.1%) | 2,712 (11.8%) |
| 7:00 AM to 7:29 AM | 3,595 (14.3%) | 4,469 (19.4%) |
| 7:30 AM to 7:59 AM | 3,556 (14.1%) | 3,909 (17.0%) |
| 8:00 AM to 8:29 AM | 2,321 (9.2%) | 1,886 (8.2%) |
| 8:30 AM to 8:59 AM | 520 (2.1%) | 991 (4.3%) |
| 9:00 AM to 9:59 AM | 824 (3.3%) | 1,604 (7.0%) |
| 10:00 AM to 10:59 AM | 485 (1.9%) | 557 (2.4%) |
| 11:00 AM to 11:59 AM | 278 (1.1%) | 484 (2.1%) |
| 12:00 PM to 3:59 PM | 1,770 (7.0%) | 1,939 (8.4%) |
| 4:00 PM to 11:59 PM | 2,199 (8.7%) | 1,525 (6.6%) |
| Total | 25,125 (100.0%) | 22,985 (100.0%) |
Housing Occupancy in Craighead County
Occupancy by Ownership in Craighead County
Of the total 42,351 dwellings in Craighead County, owner-occupied units account for 25,279 (59.7%), while renter-occupied units make up 17,072 (40.3%).
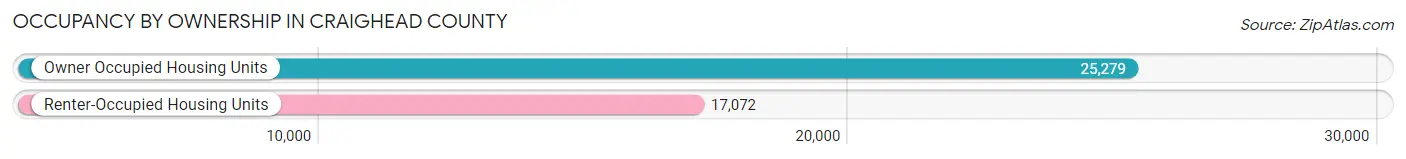
| Occupancy | # Housing Units | % Housing Units |
| Owner Occupied Housing Units | 25,279 | 59.7% |
| Renter-Occupied Housing Units | 17,072 | 40.3% |
| Total Occupied Housing Units | 42,351 | 100.0% |
Occupancy by Household Size in Craighead County
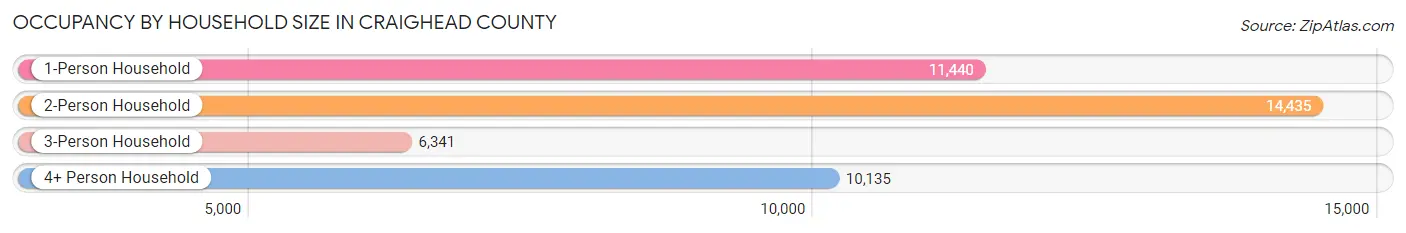
| Household Size | # Housing Units | % Housing Units |
| 1-Person Household | 11,440 | 27.0% |
| 2-Person Household | 14,435 | 34.1% |
| 3-Person Household | 6,341 | 15.0% |
| 4+ Person Household | 10,135 | 23.9% |
| Total Housing Units | 42,351 | 100.0% |
Occupancy by Ownership by Household Size in Craighead County
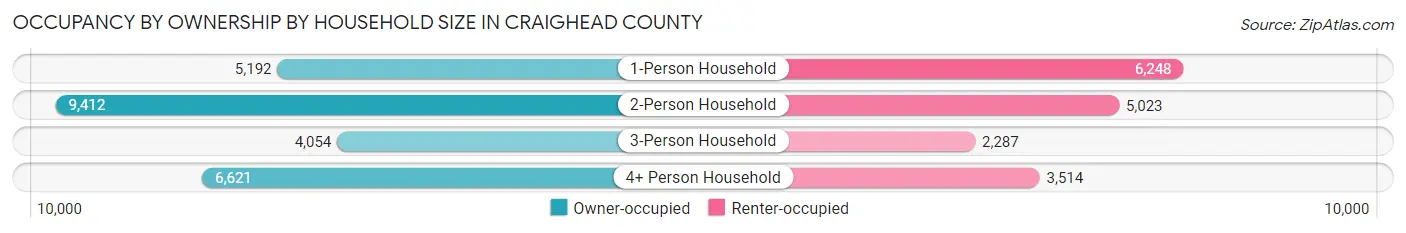
| Household Size | Owner-occupied | Renter-occupied |
| 1-Person Household | 5,192 (45.4%) | 6,248 (54.6%) |
| 2-Person Household | 9,412 (65.2%) | 5,023 (34.8%) |
| 3-Person Household | 4,054 (63.9%) | 2,287 (36.1%) |
| 4+ Person Household | 6,621 (65.3%) | 3,514 (34.7%) |
| Total Housing Units | 25,279 (59.7%) | 17,072 (40.3%) |
Occupancy by Educational Attainment in Craighead County
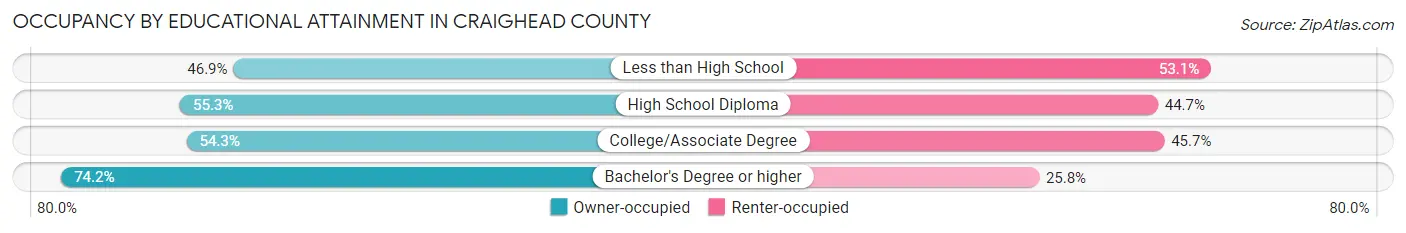
| Household Size | Owner-occupied | Renter-occupied |
| Less than High School | 1,985 (46.9%) | 2,248 (53.1%) |
| High School Diploma | 6,862 (55.3%) | 5,541 (44.7%) |
| College/Associate Degree | 7,223 (54.3%) | 6,077 (45.7%) |
| Bachelor's Degree or higher | 9,209 (74.2%) | 3,206 (25.8%) |
Occupancy by Age of Householder in Craighead County
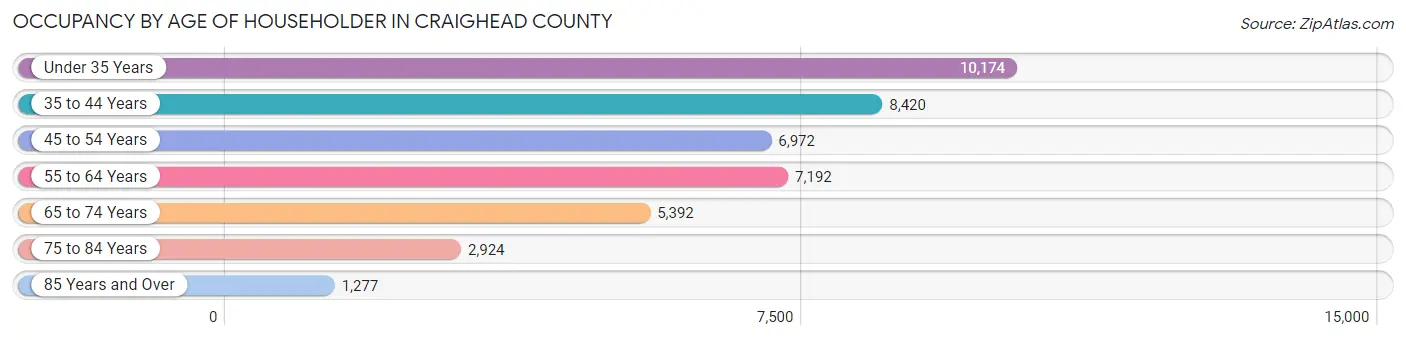
| Age Bracket | # Households | % Households |
| Under 35 Years | 10,174 | 24.0% |
| 35 to 44 Years | 8,420 | 19.9% |
| 45 to 54 Years | 6,972 | 16.5% |
| 55 to 64 Years | 7,192 | 17.0% |
| 65 to 74 Years | 5,392 | 12.7% |
| 75 to 84 Years | 2,924 | 6.9% |
| 85 Years and Over | 1,277 | 3.0% |
| Total | 42,351 | 100.0% |
Housing Finances in Craighead County
Median Income by Occupancy in Craighead County

| Occupancy Type | # Households | Median Income |
| Owner-Occupied | 25,279 (59.7%) | $78,349 |
| Renter-Occupied | 17,072 (40.3%) | $33,146 |
| Average | 42,351 (100.0%) | $55,169 |
Occupancy by Householder Income Bracket in Craighead County

| Income Bracket | Owner-occupied | Renter-occupied |
| Less than $5,000 | 500 (2.0%) | 1,150 (6.7%) |
| $5,000 to $9,999 | 192 (0.8%) | 652 (3.8%) |
| $10,000 to $14,999 | 544 (2.1%) | 2,133 (12.5%) |
| $15,000 to $19,999 | 639 (2.5%) | 1,409 (8.3%) |
| $20,000 to $24,999 | 940 (3.7%) | 1,337 (7.8%) |
| $25,000 to $34,999 | 1,885 (7.5%) | 2,510 (14.7%) |
| $35,000 to $49,999 | 3,032 (12.0%) | 2,654 (15.5%) |
| $50,000 to $74,999 | 4,415 (17.5%) | 2,491 (14.6%) |
| $75,000 to $99,999 | 3,416 (13.5%) | 1,292 (7.6%) |
| $100,000 to $149,999 | 5,497 (21.7%) | 1,050 (6.1%) |
| $150,000 or more | 4,219 (16.7%) | 394 (2.3%) |
| Total | 25,279 (100.0%) | 17,072 (100.0%) |
Monthly Housing Cost Tiers in Craighead County
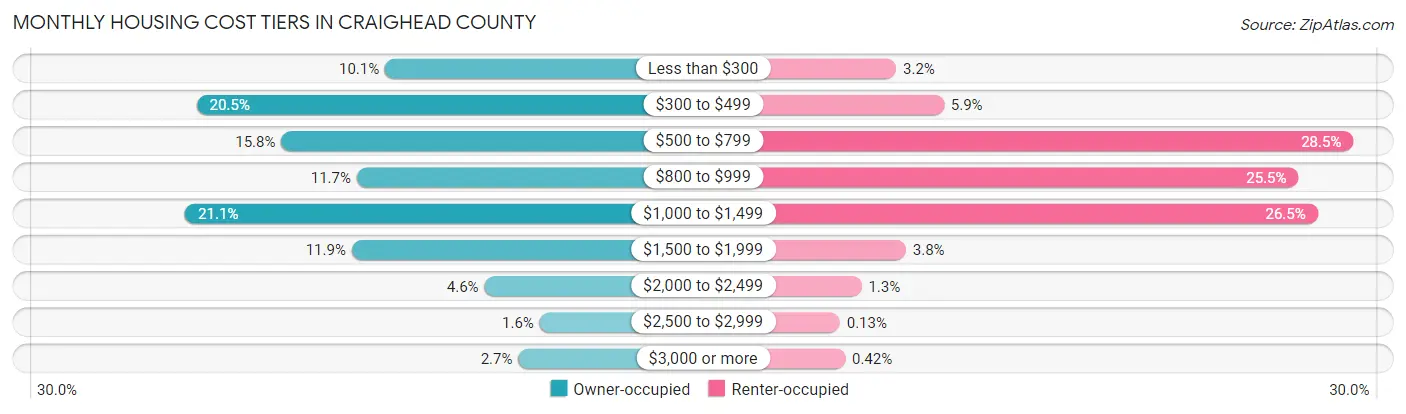
| Monthly Cost | Owner-occupied | Renter-occupied |
| Less than $300 | 2,550 (10.1%) | 553 (3.2%) |
| $300 to $499 | 5,183 (20.5%) | 1,003 (5.9%) |
| $500 to $799 | 3,999 (15.8%) | 4,864 (28.5%) |
| $800 to $999 | 2,944 (11.7%) | 4,347 (25.5%) |
| $1,000 to $1,499 | 5,341 (21.1%) | 4,527 (26.5%) |
| $1,500 to $1,999 | 3,017 (11.9%) | 646 (3.8%) |
| $2,000 to $2,499 | 1,164 (4.6%) | 227 (1.3%) |
| $2,500 to $2,999 | 392 (1.5%) | 23 (0.1%) |
| $3,000 or more | 689 (2.7%) | 71 (0.4%) |
| Total | 25,279 (100.0%) | 17,072 (100.0%) |
Physical Housing Characteristics in Craighead County
Housing Structures in Craighead County
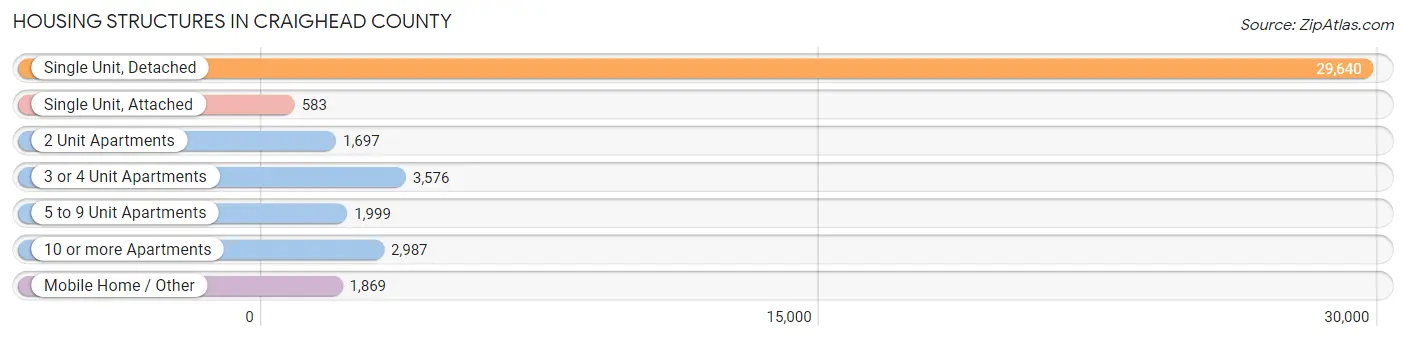
| Structure Type | # Housing Units | % Housing Units |
| Single Unit, Detached | 29,640 | 70.0% |
| Single Unit, Attached | 583 | 1.4% |
| 2 Unit Apartments | 1,697 | 4.0% |
| 3 or 4 Unit Apartments | 3,576 | 8.4% |
| 5 to 9 Unit Apartments | 1,999 | 4.7% |
| 10 or more Apartments | 2,987 | 7.0% |
| Mobile Home / Other | 1,869 | 4.4% |
| Total | 42,351 | 100.0% |
Housing Structures by Occupancy in Craighead County
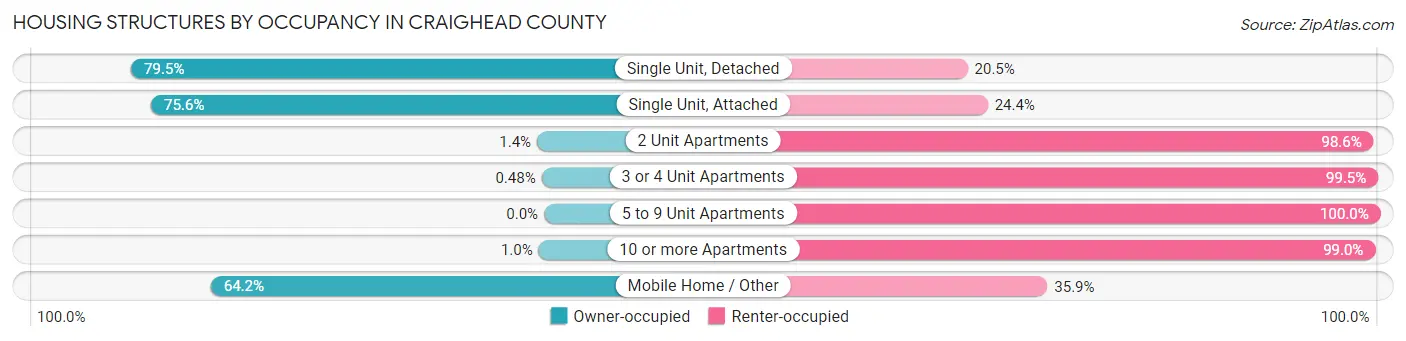
| Structure Type | Owner-occupied | Renter-occupied |
| Single Unit, Detached | 23,568 (79.5%) | 6,072 (20.5%) |
| Single Unit, Attached | 441 (75.6%) | 142 (24.4%) |
| 2 Unit Apartments | 23 (1.4%) | 1,674 (98.6%) |
| 3 or 4 Unit Apartments | 17 (0.5%) | 3,559 (99.5%) |
| 5 to 9 Unit Apartments | 0 (0.0%) | 1,999 (100.0%) |
| 10 or more Apartments | 31 (1.0%) | 2,956 (99.0%) |
| Mobile Home / Other | 1,199 (64.1%) | 670 (35.8%) |
| Total | 25,279 (59.7%) | 17,072 (40.3%) |
Housing Structures by Number of Rooms in Craighead County
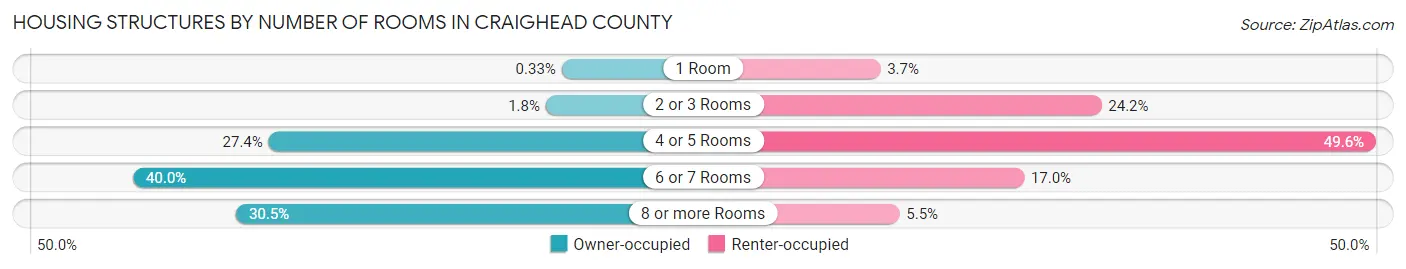
| Number of Rooms | Owner-occupied | Renter-occupied |
| 1 Room | 83 (0.3%) | 637 (3.7%) |
| 2 or 3 Rooms | 456 (1.8%) | 4,128 (24.2%) |
| 4 or 5 Rooms | 6,935 (27.4%) | 8,462 (49.6%) |
| 6 or 7 Rooms | 10,107 (40.0%) | 2,906 (17.0%) |
| 8 or more Rooms | 7,698 (30.4%) | 939 (5.5%) |
| Total | 25,279 (100.0%) | 17,072 (100.0%) |
Housing Structure by Heating Type in Craighead County
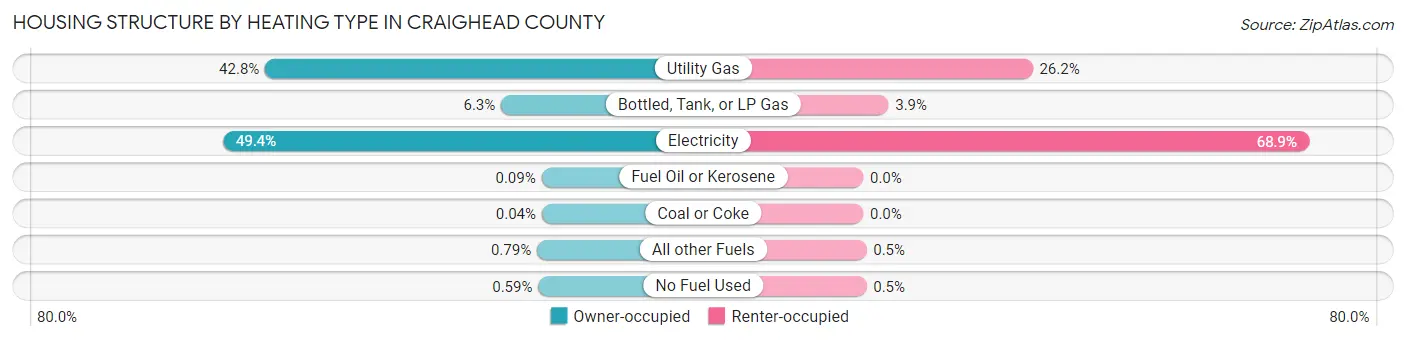
| Heating Type | Owner-occupied | Renter-occupied |
| Utility Gas | 10,821 (42.8%) | 4,472 (26.2%) |
| Bottled, Tank, or LP Gas | 1,603 (6.3%) | 666 (3.9%) |
| Electricity | 12,474 (49.3%) | 11,762 (68.9%) |
| Fuel Oil or Kerosene | 24 (0.1%) | 0 (0.0%) |
| Coal or Coke | 9 (0.0%) | 0 (0.0%) |
| All other Fuels | 200 (0.8%) | 86 (0.5%) |
| No Fuel Used | 148 (0.6%) | 86 (0.5%) |
| Total | 25,279 (100.0%) | 17,072 (100.0%) |
Household Vehicle Usage in Craighead County
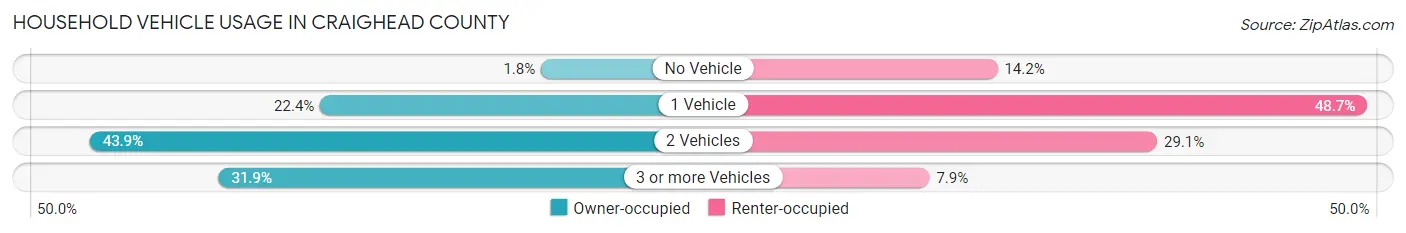
| Vehicles per Household | Owner-occupied | Renter-occupied |
| No Vehicle | 453 (1.8%) | 2,431 (14.2%) |
| 1 Vehicle | 5,664 (22.4%) | 8,320 (48.7%) |
| 2 Vehicles | 11,100 (43.9%) | 4,974 (29.1%) |
| 3 or more Vehicles | 8,062 (31.9%) | 1,347 (7.9%) |
| Total | 25,279 (100.0%) | 17,072 (100.0%) |
Real Estate & Mortgages in Craighead County
Real Estate and Mortgage Overview in Craighead County
| Characteristic | Without Mortgage | With Mortgage |
| Housing Units | 10,630 | 14,649 |
| Median Property Value | $163,800 | $194,100 |
| Median Household Income | $55,908 | $3,009 |
| Monthly Housing Costs | $411 | $689 |
| Real Estate Taxes | $842 | $1,055 |
Property Value by Mortgage Status in Craighead County
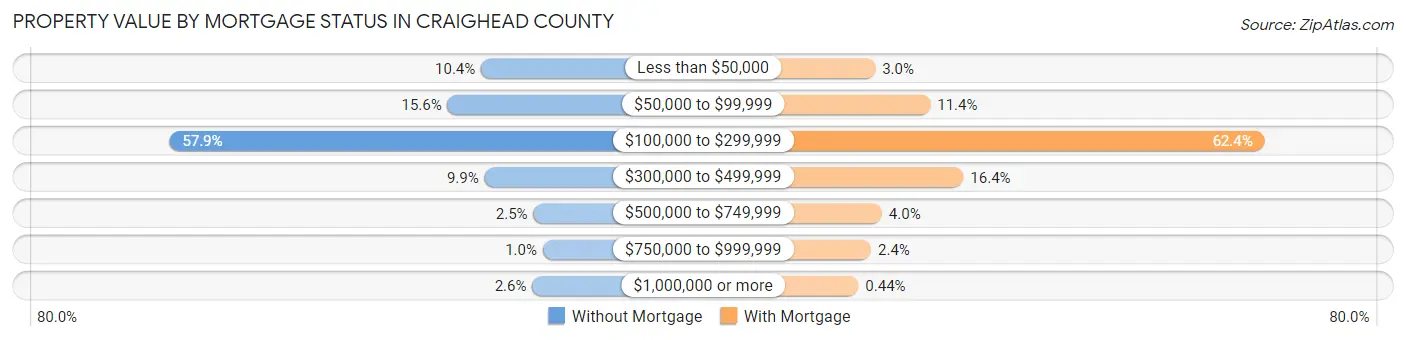
| Property Value | Without Mortgage | With Mortgage |
| Less than $50,000 | 1,110 (10.4%) | 439 (3.0%) |
| $50,000 to $99,999 | 1,653 (15.5%) | 1,669 (11.4%) |
| $100,000 to $299,999 | 6,159 (57.9%) | 9,133 (62.4%) |
| $300,000 to $499,999 | 1,053 (9.9%) | 2,408 (16.4%) |
| $500,000 to $749,999 | 263 (2.5%) | 589 (4.0%) |
| $750,000 to $999,999 | 111 (1.0%) | 347 (2.4%) |
| $1,000,000 or more | 281 (2.6%) | 64 (0.4%) |
| Total | 10,630 (100.0%) | 14,649 (100.0%) |
Household Income by Mortgage Status in Craighead County
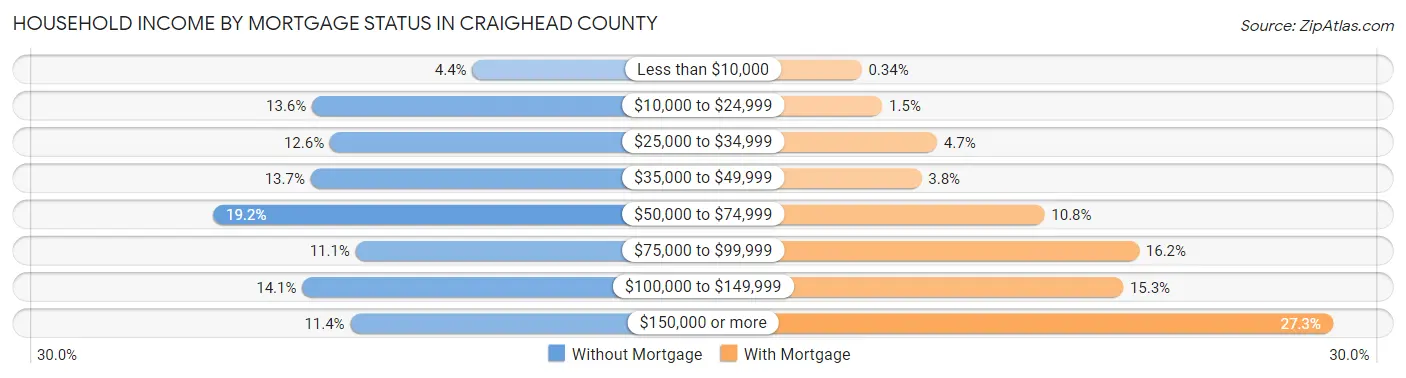
| Household Income | Without Mortgage | With Mortgage |
| Less than $10,000 | 469 (4.4%) | 50 (0.3%) |
| $10,000 to $24,999 | 1,442 (13.6%) | 223 (1.5%) |
| $25,000 to $34,999 | 1,334 (12.6%) | 681 (4.6%) |
| $35,000 to $49,999 | 1,451 (13.7%) | 551 (3.8%) |
| $50,000 to $74,999 | 2,044 (19.2%) | 1,581 (10.8%) |
| $75,000 to $99,999 | 1,178 (11.1%) | 2,371 (16.2%) |
| $100,000 to $149,999 | 1,502 (14.1%) | 2,238 (15.3%) |
| $150,000 or more | 1,210 (11.4%) | 3,995 (27.3%) |
| Total | 10,630 (100.0%) | 14,649 (100.0%) |
Property Value to Household Income Ratio in Craighead County
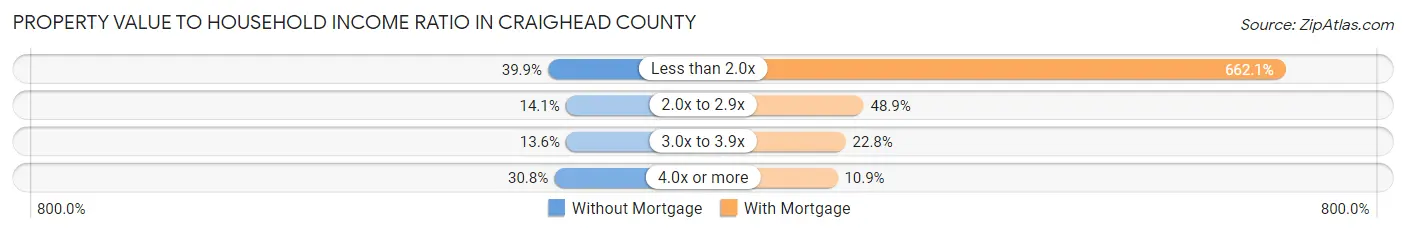
| Value-to-Income Ratio | Without Mortgage | With Mortgage |
| Less than 2.0x | 4,236 (39.9%) | 96,985 (662.1%) |
| 2.0x to 2.9x | 1,496 (14.1%) | 7,165 (48.9%) |
| 3.0x to 3.9x | 1,443 (13.6%) | 3,342 (22.8%) |
| 4.0x or more | 3,273 (30.8%) | 1,597 (10.9%) |
| Total | 10,630 (100.0%) | 14,649 (100.0%) |
Real Estate Taxes by Mortgage Status in Craighead County
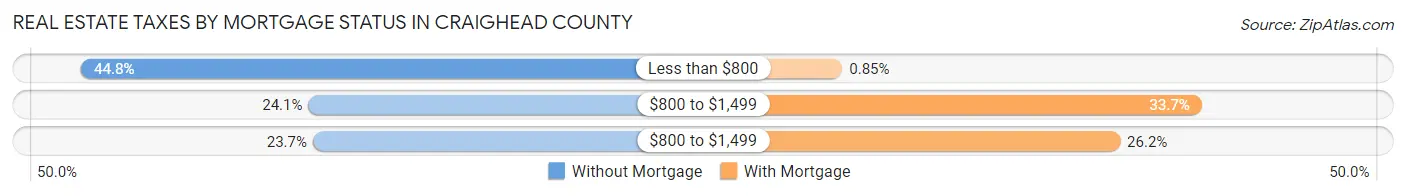
| Property Taxes | Without Mortgage | With Mortgage |
| Less than $800 | 4,765 (44.8%) | 124 (0.9%) |
| $800 to $1,499 | 2,561 (24.1%) | 4,931 (33.7%) |
| $800 to $1,499 | 2,517 (23.7%) | 3,841 (26.2%) |
| Total | 10,630 (100.0%) | 14,649 (100.0%) |
Health & Disability in Craighead County
Health Insurance Coverage by Age in Craighead County
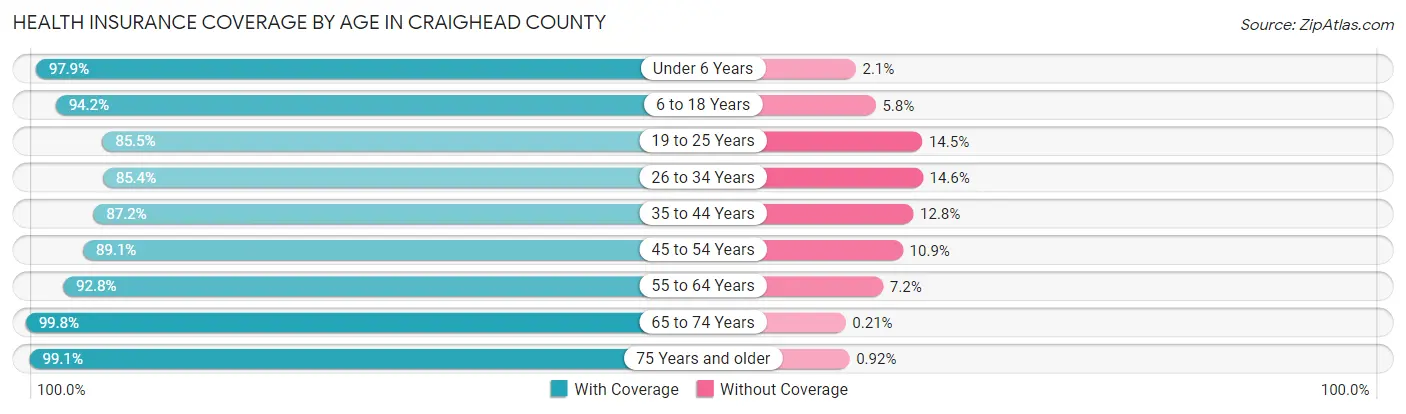
| Age Bracket | With Coverage | Without Coverage |
| Under 6 Years | 8,883 (97.9%) | 191 (2.1%) |
| 6 to 18 Years | 19,393 (94.2%) | 1,196 (5.8%) |
| 19 to 25 Years | 10,097 (85.5%) | 1,711 (14.5%) |
| 26 to 34 Years | 12,779 (85.4%) | 2,183 (14.6%) |
| 35 to 44 Years | 12,544 (87.2%) | 1,846 (12.8%) |
| 45 to 54 Years | 11,073 (89.1%) | 1,352 (10.9%) |
| 55 to 64 Years | 11,377 (92.8%) | 883 (7.2%) |
| 65 to 74 Years | 8,674 (99.8%) | 18 (0.2%) |
| 75 Years and older | 5,706 (99.1%) | 53 (0.9%) |
| Total | 100,526 (91.4%) | 9,433 (8.6%) |
Health Insurance Coverage by Citizenship Status in Craighead County
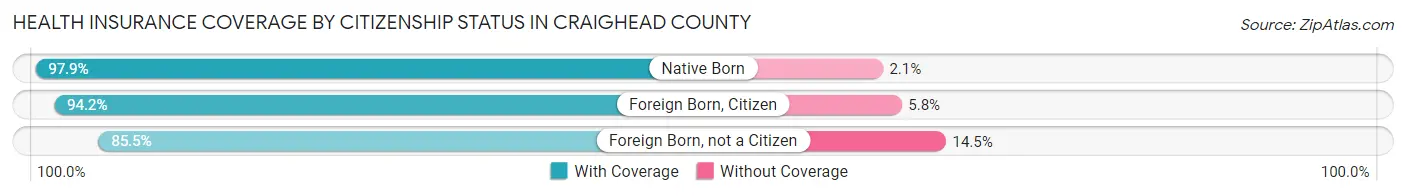
| Citizenship Status | With Coverage | Without Coverage |
| Native Born | 8,883 (97.9%) | 191 (2.1%) |
| Foreign Born, Citizen | 19,393 (94.2%) | 1,196 (5.8%) |
| Foreign Born, not a Citizen | 10,097 (85.5%) | 1,711 (14.5%) |
Health Insurance Coverage by Household Income in Craighead County
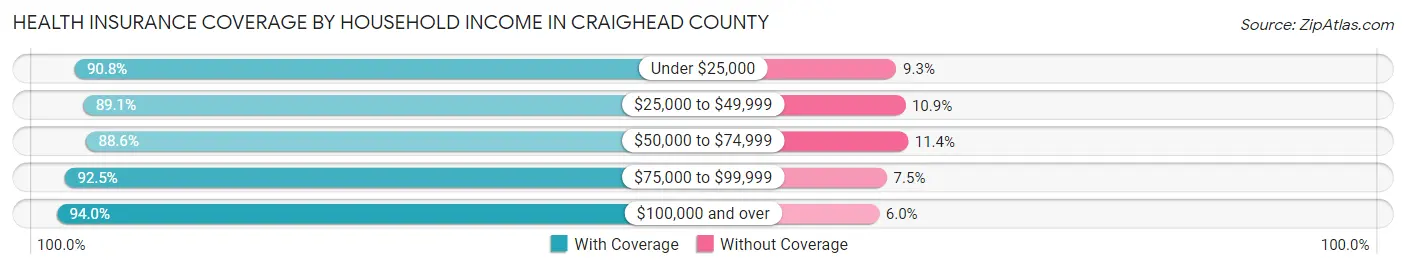
| Household Income | With Coverage | Without Coverage |
| Under $25,000 | 16,122 (90.7%) | 1,643 (9.2%) |
| $25,000 to $49,999 | 20,860 (89.1%) | 2,552 (10.9%) |
| $50,000 to $74,999 | 15,640 (88.6%) | 2,019 (11.4%) |
| $75,000 to $99,999 | 12,008 (92.5%) | 969 (7.5%) |
| $100,000 and over | 33,493 (94.0%) | 2,138 (6.0%) |
Public vs Private Health Insurance Coverage by Age in Craighead County
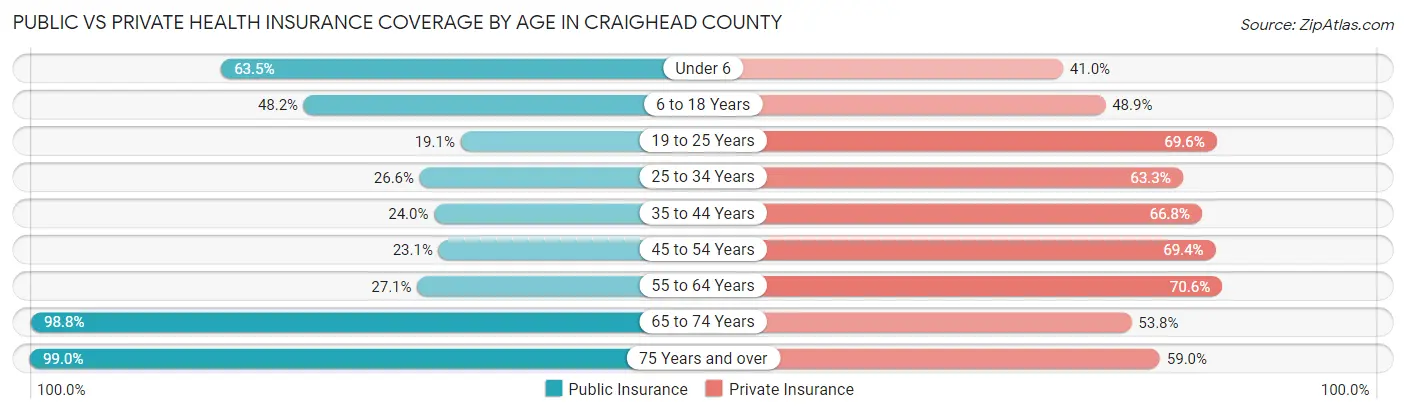
| Age Bracket | Public Insurance | Private Insurance |
| Under 6 | 5,762 (63.5%) | 3,724 (41.0%) |
| 6 to 18 Years | 9,913 (48.1%) | 10,068 (48.9%) |
| 19 to 25 Years | 2,249 (19.1%) | 8,213 (69.6%) |
| 25 to 34 Years | 3,984 (26.6%) | 9,464 (63.2%) |
| 35 to 44 Years | 3,446 (23.9%) | 9,614 (66.8%) |
| 45 to 54 Years | 2,874 (23.1%) | 8,617 (69.4%) |
| 55 to 64 Years | 3,322 (27.1%) | 8,652 (70.6%) |
| 65 to 74 Years | 8,587 (98.8%) | 4,672 (53.7%) |
| 75 Years and over | 5,701 (99.0%) | 3,400 (59.0%) |
| Total | 45,838 (41.7%) | 66,424 (60.4%) |
Disability Status by Sex by Age in Craighead County
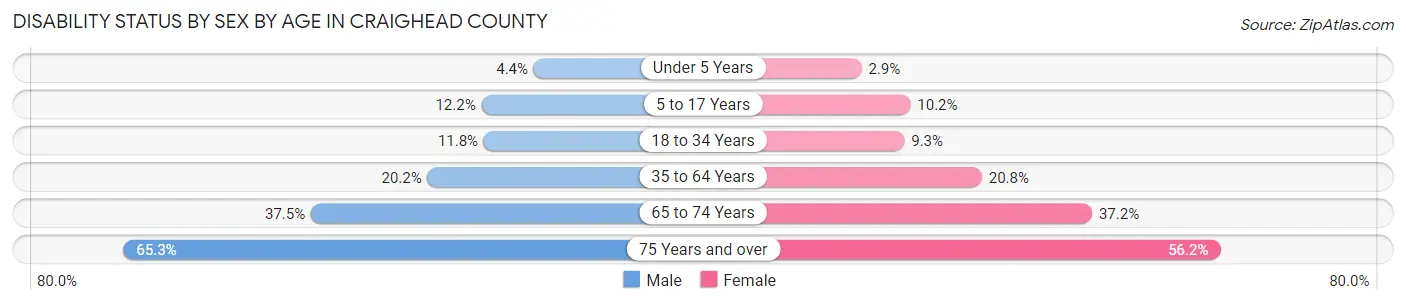
| Age Bracket | Male | Female |
| Under 5 Years | 168 (4.4%) | 106 (2.9%) |
| 5 to 17 Years | 1,287 (12.2%) | 981 (10.2%) |
| 18 to 34 Years | 1,665 (11.8%) | 1,357 (9.3%) |
| 35 to 64 Years | 3,832 (20.2%) | 4,174 (20.8%) |
| 65 to 74 Years | 1,436 (37.5%) | 1,805 (37.1%) |
| 75 Years and over | 1,509 (65.3%) | 1,938 (56.2%) |
Disability Class by Sex by Age in Craighead County
Disability Class: Hearing Difficulty
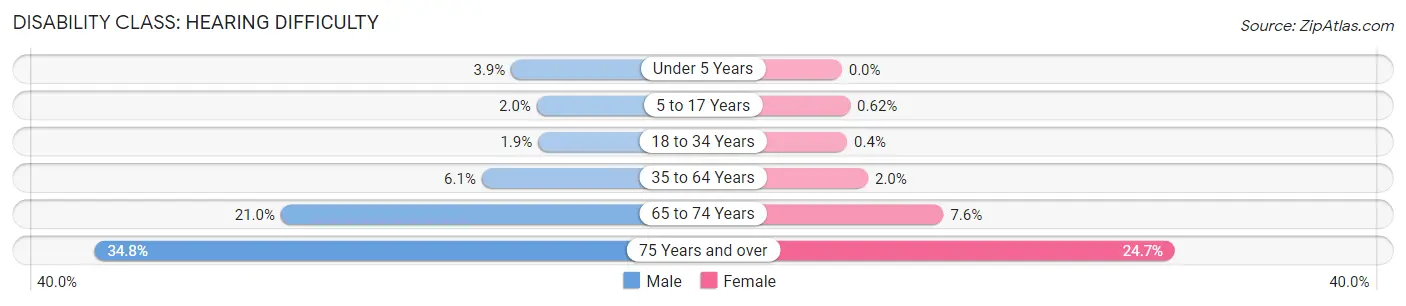
| Age Bracket | Male | Female |
| Under 5 Years | 149 (3.9%) | 0 (0.0%) |
| 5 to 17 Years | 209 (2.0%) | 60 (0.6%) |
| 18 to 34 Years | 266 (1.9%) | 58 (0.4%) |
| 35 to 64 Years | 1,152 (6.1%) | 391 (1.9%) |
| 65 to 74 Years | 804 (21.0%) | 367 (7.5%) |
| 75 Years and over | 804 (34.8%) | 853 (24.7%) |
Disability Class: Vision Difficulty
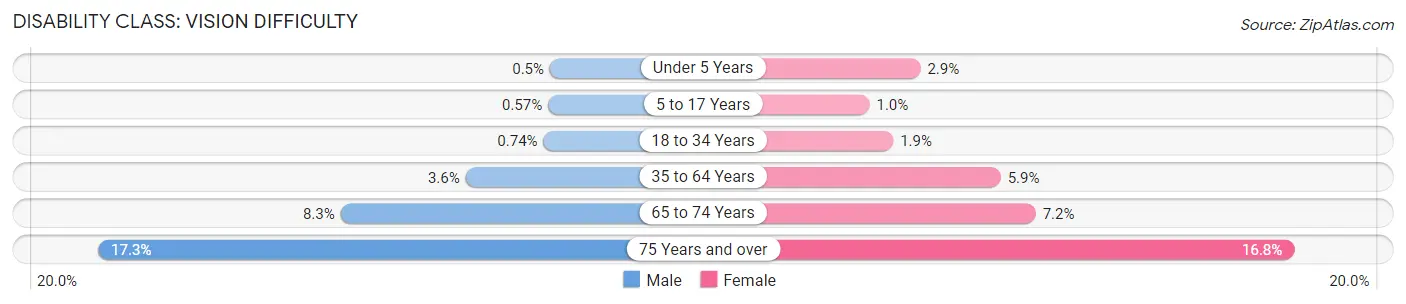
| Age Bracket | Male | Female |
| Under 5 Years | 19 (0.5%) | 106 (2.9%) |
| 5 to 17 Years | 60 (0.6%) | 99 (1.0%) |
| 18 to 34 Years | 105 (0.7%) | 280 (1.9%) |
| 35 to 64 Years | 690 (3.6%) | 1,185 (5.9%) |
| 65 to 74 Years | 317 (8.3%) | 350 (7.2%) |
| 75 Years and over | 399 (17.3%) | 579 (16.8%) |
Disability Class: Cognitive Difficulty
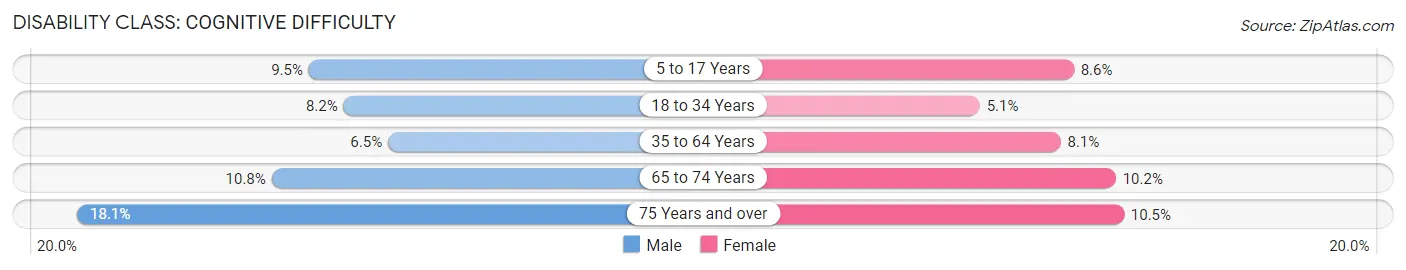
| Age Bracket | Male | Female |
| 5 to 17 Years | 1,000 (9.5%) | 829 (8.6%) |
| 18 to 34 Years | 1,153 (8.2%) | 749 (5.1%) |
| 35 to 64 Years | 1,236 (6.5%) | 1,630 (8.1%) |
| 65 to 74 Years | 415 (10.8%) | 494 (10.2%) |
| 75 Years and over | 417 (18.0%) | 361 (10.5%) |
Disability Class: Ambulatory Difficulty
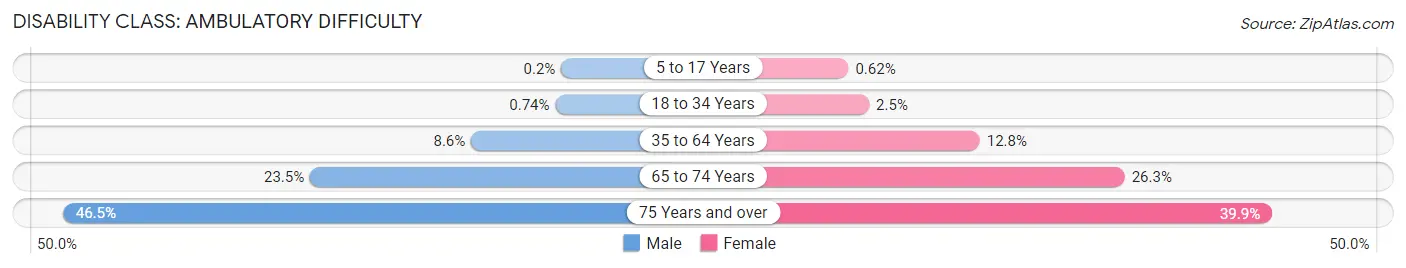
| Age Bracket | Male | Female |
| 5 to 17 Years | 21 (0.2%) | 60 (0.6%) |
| 18 to 34 Years | 104 (0.7%) | 372 (2.5%) |
| 35 to 64 Years | 1,627 (8.6%) | 2,572 (12.8%) |
| 65 to 74 Years | 901 (23.5%) | 1,276 (26.3%) |
| 75 Years and over | 1,073 (46.5%) | 1,377 (39.9%) |
Disability Class: Self-Care Difficulty
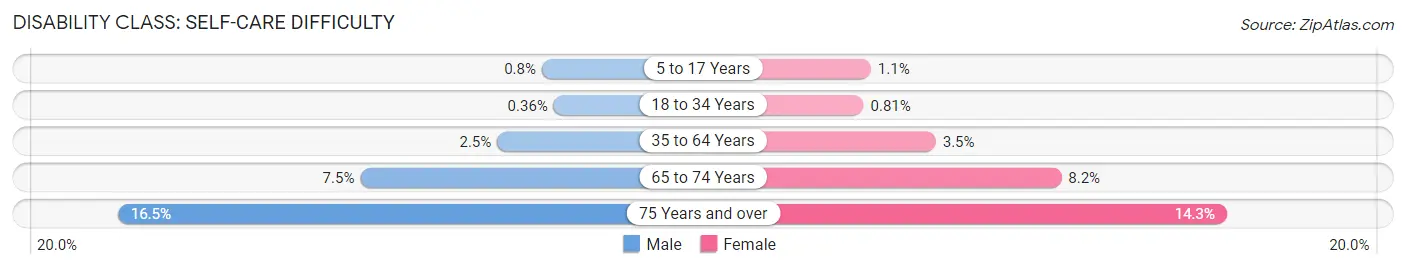
| Age Bracket | Male | Female |
| 5 to 17 Years | 85 (0.8%) | 104 (1.1%) |
| 18 to 34 Years | 51 (0.4%) | 119 (0.8%) |
| 35 to 64 Years | 467 (2.5%) | 701 (3.5%) |
| 65 to 74 Years | 289 (7.5%) | 396 (8.2%) |
| 75 Years and over | 382 (16.5%) | 493 (14.3%) |
Technology Access in Craighead County
Computing Device Access in Craighead County
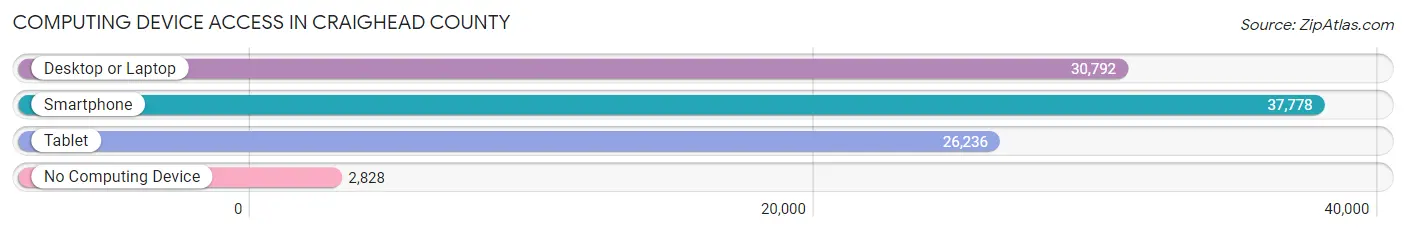
| Device Type | # Households | % Households |
| Desktop or Laptop | 30,792 | 72.7% |
| Smartphone | 37,778 | 89.2% |
| Tablet | 26,236 | 62.0% |
| No Computing Device | 2,828 | 6.7% |
| Total | 42,351 | 100.0% |
Internet Access in Craighead County
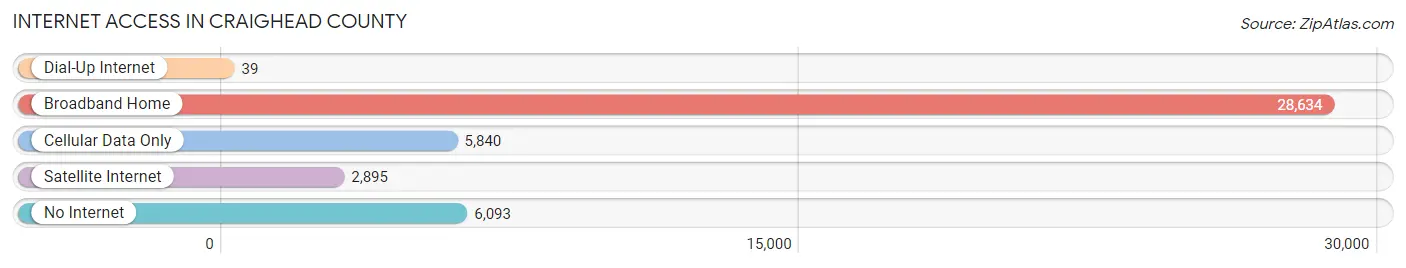
| Internet Type | # Households | % Households |
| Dial-Up Internet | 39 | 0.1% |
| Broadband Home | 28,634 | 67.6% |
| Cellular Data Only | 5,840 | 13.8% |
| Satellite Internet | 2,895 | 6.8% |
| No Internet | 6,093 | 14.4% |
| Total | 42,351 | 100.0% |
Craighead County Summary
Head County, Arkansas is located in the northeastern corner of the state and is part of the Jonesboro Metropolitan Statistical Area. It is bordered by Greene County to the north, Poinsett County to the east, Mississippi County to the south, and Clay County to the west. The county seat is Jonesboro, which is also the largest city in the county.
History
Head County was established in 1859 and named after Thomas Jefferson Head, a prominent Arkansas politician. The county was originally part of Greene County, but was split off in 1859. The county was largely rural until the late 19th century, when the railroad was built through the area. This led to the development of several small towns, including Jonesboro, which became the county seat in 1883.
Geography
Head County covers an area of 545 square miles and is located in the northeastern corner of the state. The county is mostly flat, with some rolling hills in the western part of the county. The St. Francis River runs through the county, and there are several small lakes and ponds scattered throughout the area. The county is mostly rural, with the majority of the population living in the city of Jonesboro.
Economy
Head County has a diverse economy, with agriculture, manufacturing, and services being the main industries. Agriculture is the largest sector, with soybeans, cotton, and rice being the main crops. Manufacturing is also important, with several factories located in the county. The service sector is also important, with healthcare, education, and retail being the main industries.
Demographics
As of the 2010 census, Head County had a population of 52,973. The population was 53.2% White, 40.3% Black or African American, 0.7% Native American, 1.7% Asian, 0.1% Pacific Islander, and 2.9% from two or more races. The median household income was $37,945, and the median family income was $45,945. The per capita income was $20,845.
Head County is a diverse and vibrant community, with a strong economy and a rich history. The county is home to a variety of industries, and the population is growing steadily. With its close proximity to Jonesboro, Head County is an ideal place to live and work.
Common Questions
What is Per Capita Income in Craighead County?
Per Capita income in Craighead County is $31,298.
What is the Median Family Income in Craighead County?
Median Family Income in Craighead County is $72,208.
What is the Median Household income in Craighead County?
Median Household Income in Craighead County is $55,169.
What is Income or Wage Gap in Craighead County?
Income or Wage Gap in Craighead County is 23.9%.
Women in Craighead County earn 76.1 cents for every dollar earned by a man.
What is Family Income Deficit in Craighead County?
Family Income Deficit in Craighead County is $11,505.
Families that are below poverty line in Craighead County earn $11,505 less on average than the poverty threshold level.
What is Inequality or Gini Index in Craighead County?
Inequality or Gini Index in Craighead County is 0.49.
What is the Total Population of Craighead County?
Total Population of Craighead County is 111,038.
What is the Total Male Population of Craighead County?
Total Male Population of Craighead County is 54,232.
What is the Total Female Population of Craighead County?
Total Female Population of Craighead County is 56,806.
What is the Ratio of Males per 100 Females in Craighead County?
There are 95.47 Males per 100 Females in Craighead County.
What is the Ratio of Females per 100 Males in Craighead County?
There are 104.75 Females per 100 Males in Craighead County.
What is the Median Population Age in Craighead County?
Median Population Age in Craighead County is 34.4 Years.
What is the Average Family Size in Craighead County
Average Family Size in Craighead County is 3.1 People.
What is the Average Household Size in Craighead County
Average Household Size in Craighead County is 2.5 People.
How Large is the Labor Force in Craighead County?
There are 54,815 People in the Labor Forcein in Craighead County.
What is the Percentage of People in the Labor Force in Craighead County?
63.5% of People are in the Labor Force in Craighead County.
What is the Unemployment Rate in Craighead County?
Unemployment Rate in Craighead County is 5.9%.